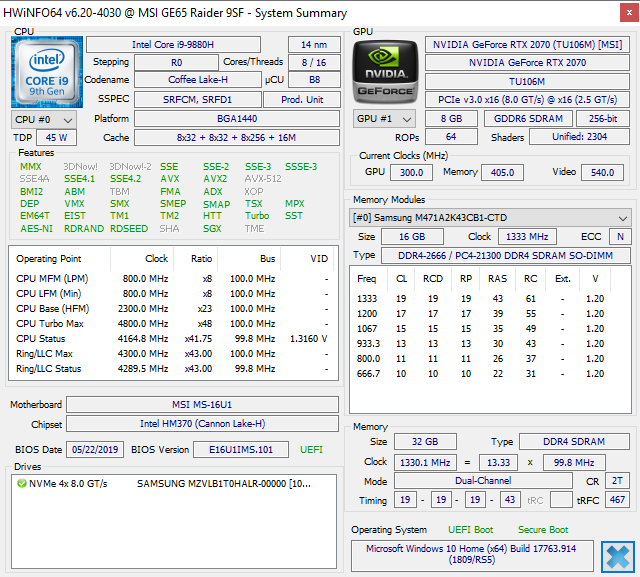
Test: MSI GE65 Raider 9SF - Stora förbättringar jämfört med GE63 (Sammanfattning)
Gradering | Datum | Modell | Vikt | Höjd | Storlek | Upplösning | Pris |
|---|---|---|---|---|---|---|---|
| 84.7 % v7 (old) | 12/2019 | MSI GE65 Raider 9SF-049US i9-9880H, GeForce RTX 2070 Mobile | 2.3 kg | 26.9 mm | 15.60" | 1920x1080 | |
| 84.8 % v7 (old) | Lenovo Legion Y740-15ICHg i7-9750H, GeForce RTX 2070 Max-Q | 2.3 kg | 25 mm | 15.60" | 1920x1080 | ||
| 83 % v7 (old) | 09/2019 | Alienware m15 R2 P87F i7-9750H, GeForce RTX 2080 Max-Q | 2.2 kg | 18.3 mm | 15.60" | 1920x1080 | |
| 81.1 % v7 (old) | Maingear Vector 15 i7-9750H, GeForce GTX 1660 Ti Mobile | 1.9 kg | 19.8 mm | 15.60" | 1920x1080 | ||
| 84.4 % v7 (old) | 08/2019 | Asus Strix GL531GV-PB74 i7-9750H, GeForce RTX 2060 Mobile | 2.4 kg | 25.9 mm | 15.60" | 1920x1080 |
| SD Card Reader | |
| average JPG Copy Test (av. of 3 runs) | |
| Dell XPS 15 7590 9980HK GTX 1650 (Toshiba Exceria Pro SDXC 64 GB UHS-II) | |
| MSI GS73 Stealth 8RF-011 (Toshiba Exceria Pro SDXC 64 GB UHS-II) | |
| HP Omen 15-dc1303ng (Toshiba Exceria Pro SDXC 64 GB UHS-II) | |
| MSI GE63 Raider 8SG (Toshiba Exceria Pro SDXC 64 GB UHS-II) | |
| MSI GE65 Raider 9SF-049US (Toshiba Exceria Pro SDXC 64 GB UHS-II) | |
| maximum AS SSD Seq Read Test (1GB) | |
| MSI GS73 Stealth 8RF-011 (Toshiba Exceria Pro SDXC 64 GB UHS-II) | |
| Dell XPS 15 7590 9980HK GTX 1650 (Toshiba Exceria Pro SDXC 64 GB UHS-II) | |
| HP Omen 15-dc1303ng (Toshiba Exceria Pro SDXC 64 GB UHS-II) | |
| MSI GE63 Raider 8SG (Toshiba Exceria Pro SDXC 64 GB UHS-II) | |
| MSI GE65 Raider 9SF-049US (Toshiba Exceria Pro SDXC 64 GB UHS-II) | |
| Networking | |
| iperf3 transmit AX12 | |
| MSI Prestige 15 A10SC | |
| Lenovo Legion Y740-15ICHg | |
| Asus Strix GL531GV-PB74 | |
| Alienware m15 R2 P87F | |
| iperf3 receive AX12 | |
| MSI Prestige 15 A10SC | |
| Asus Strix GL531GV-PB74 | |
| Alienware m15 R2 P87F | |
| Lenovo Legion Y740-15ICHg | |
| |||||||||||||||||||||||||
Distribution av ljusstyrkan: 90 %
Mitt på batteriet: 277.4 cd/m²
Kontrast: 1156:1 (Svärta: 0.24 cd/m²)
ΔE ColorChecker Calman: 1.51 | ∀{0.5-29.43 Ø4.73}
calibrated: 1.77
ΔE Greyscale Calman: 3.7 | ∀{0.09-98 Ø4.97}
99.1% sRGB (Argyll 1.6.3 3D)
65.1% AdobeRGB 1998 (Argyll 1.6.3 3D)
70.7% AdobeRGB 1998 (Argyll 3D)
98.9% sRGB (Argyll 3D)
69.3% Display P3 (Argyll 3D)
Gamma: 2.23
CCT: 7061 K
| MSI GE65 Raider 9SF-049US Sharp LQ156M1JW03, IPS, 15.6", 1920x1080 | MSI GE63 Raider 8SG AU Optronics B156HAN07.1, IPS, 15.6", 1920x1080 | Lenovo Legion Y740-15ICHg BOE NV156FHM-N4J, IPS, 15.6", 1920x1080 | Alienware m15 R2 P87F Sharp LQ156M1, IPS, 15.6", 1920x1080 | Asus Strix GL531GV-PB74 Panda LM156LF-GL02, IPS, 15.6", 1920x1080 | Razer Blade 15 GTX 1660 Ti BOE NV156FHM-N4K, IPS, 15.6", 1920x1080 | |
|---|---|---|---|---|---|---|
| Display | -7% | -5% | -6% | -41% | -6% | |
| Display P3 Coverage (%) | 69.3 | 65.1 -6% | 67.7 -2% | 65.3 -6% | 40.13 -42% | 65.3 -6% |
| sRGB Coverage (%) | 98.9 | 91.7 -7% | 91.6 -7% | 95.1 -4% | 60.3 -39% | 91.8 -7% |
| AdobeRGB 1998 Coverage (%) | 70.7 | 65.9 -7% | 67.1 -5% | 65.9 -7% | 41.48 -41% | 66.5 -6% |
| Response Times | 17% | -17% | -2% | -113% | 4% | |
| Response Time Grey 50% / Grey 80% * (ms) | 13.2 ? | 8.8 ? 33% | 19 ? -44% | 16.4 ? -24% | 26 ? -97% | 13.6 ? -3% |
| Response Time Black / White * (ms) | 11.2 ? | 11.2 ? -0% | 10 ? 11% | 8.8 ? 21% | 25.6 ? -129% | 10 ? 11% |
| PWM Frequency (Hz) | 23150 ? | 23810 ? | 200 ? | |||
| Screen | -7% | 2% | -51% | -84% | -29% | |
| Brightness middle (cd/m²) | 277.4 | 268.3 -3% | 477 72% | 324.2 17% | 290.1 5% | 312.7 13% |
| Brightness (cd/m²) | 264 | 261 -1% | 431 63% | 304 15% | 274 4% | 305 16% |
| Brightness Distribution (%) | 90 | 84 -7% | 84 -7% | 90 0% | 86 -4% | 90 0% |
| Black Level * (cd/m²) | 0.24 | 0.2 17% | 0.175 27% | 0.38 -58% | 0.54 -125% | 0.27 -13% |
| Contrast (:1) | 1156 | 1342 16% | 2726 136% | 853 -26% | 537 -54% | 1158 0% |
| Colorchecker dE 2000 * | 1.51 | 2.65 -75% | 4.17 -176% | 5.01 -232% | 5.16 -242% | 4.57 -203% |
| Colorchecker dE 2000 max. * | 4.93 | 4.67 5% | 6.97 -41% | 12.7 -158% | 18.09 -267% | 6.81 -38% |
| Colorchecker dE 2000 calibrated * | 1.77 | 2.76 -56% | 2.51 -42% | 1.64 7% | 4.35 -146% | 2.91 -64% |
| Greyscale dE 2000 * | 3.7 | 2.2 41% | 3.49 6% | 7.9 -114% | 4.4 -19% | 4.3 -16% |
| Gamma | 2.23 99% | 2.33 94% | 2.5 88% | 2.35 94% | 2.1 105% | 2.29 96% |
| CCT | 7061 92% | 6862 95% | 7076 92% | 8455 77% | 7362 88% | 7098 92% |
| Color Space (Percent of AdobeRGB 1998) (%) | 65.1 | 59.3 -9% | 60 -8% | 60.8 -7% | 38.1 -41% | 59.4 -9% |
| Color Space (Percent of sRGB) (%) | 99.1 | 93.3 -6% | 91 -8% | 95.5 -4% | 60 -39% | 91.3 -8% |
| Totalt genomsnitt (program/inställningar) | 1% /
-4% | -7% /
-2% | -20% /
-36% | -79% /
-80% | -10% /
-21% |
* ... mindre är bättre
Visa svarstider
| ↔ Svarstid svart till vitt | ||
|---|---|---|
| 11.2 ms ... stiga ↗ och falla ↘ kombinerat | ↗ 6 ms stiga | 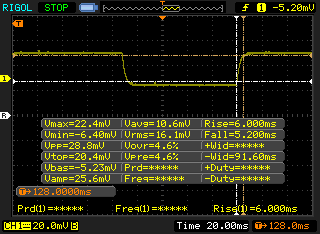 |
| ↘ 5.2 ms hösten | ||
| Skärmen visar bra svarsfrekvens i våra tester, men kan vara för långsam för konkurrenskraftiga spelare. I jämförelse sträcker sig alla testade enheter från 0.1 (minst) till 240 (maximalt) ms. » 30 % av alla enheter är bättre. Det betyder att den uppmätta svarstiden är bättre än genomsnittet av alla testade enheter (19.9 ms). | ||
| ↔ Svarstid 50 % grått till 80 % grått | ||
| 13.2 ms ... stiga ↗ och falla ↘ kombinerat | ↗ 7.2 ms stiga | 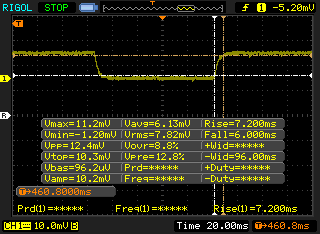 |
| ↘ 6 ms hösten | ||
| Skärmen visar bra svarsfrekvens i våra tester, men kan vara för långsam för konkurrenskraftiga spelare. I jämförelse sträcker sig alla testade enheter från 0.165 (minst) till 636 (maximalt) ms. » 27 % av alla enheter är bättre. Det betyder att den uppmätta svarstiden är bättre än genomsnittet av alla testade enheter (31.1 ms). | ||
Skärmflimmer / PWM (Puls-Width Modulation)
| Skärmflimmer / PWM upptäckt | 23150 Hz | ≤ 19 % ljusstyrka inställning | 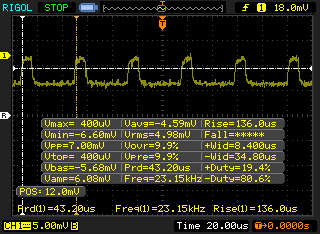 |
Displayens bakgrundsbelysning flimrar vid 23150 Hz (i värsta fall, t.ex. med PWM) Flimrande upptäckt vid en ljusstyrkeinställning på 19 % och lägre. Det ska inte finnas något flimmer eller PWM över denna ljusstyrkeinställning. Frekvensen för 23150 Hz är ganska hög, så de flesta användare som är känsliga för PWM bör inte märka något flimmer. Som jämförelse: 52 % av alla testade enheter använder inte PWM för att dämpa skärmen. Om PWM upptäcktes mättes ett medelvärde av 7801 (minst: 5 - maximum: 343500) Hz. | |||
| Cinebench R20 | |
| CPU (Single Core) | |
| AMD Radeon RX Vega 64 | |
| Eurocom Sky X4C i9-9900KS | |
| Medion Erazer X15805 | |
| Eurocom Nightsky RX15 | |
| MSI GE65 Raider 9SF-049US | |
| MSI Prestige 15 A10SC | |
| Genomsnitt Intel Core i9-9880H (441 - 474, n=7) | |
| Lenovo Yoga C940-15IRH | |
| Dell G3 3590 | |
| Schenker Key 16 | |
| Razer Blade Stealth i7-1065G7 Iris Plus | |
| Asus Zephyrus GX501 | |
| CPU (Multi Core) | |
| AMD Radeon RX Vega 64 | |
| Eurocom Sky X4C i9-9900KS | |
| Eurocom Nightsky RX15 | |
| MSI GE65 Raider 9SF-049US | |
| Genomsnitt Intel Core i9-9880H (2953 - 3712, n=7) | |
| Medion Erazer X15805 | |
| Lenovo Yoga C940-15IRH | |
| MSI Prestige 15 A10SC | |
| Schenker Key 16 | |
| Dell G3 3590 | |
| Asus Zephyrus GX501 | |
| Razer Blade Stealth i7-1065G7 Iris Plus | |
| Cinebench R15 | |
| CPU Single 64Bit | |
| Eurocom Sky X4C i9-9900KS | |
| AMD Radeon RX Vega 64 | |
| Medion Erazer X15805 | |
| Eurocom Nightsky RX15 | |
| MSI GE65 Raider 9SF-049US | |
| MSI Prestige 15 A10SC | |
| Genomsnitt Intel Core i9-9880H (181 - 198, n=11) | |
| Lenovo Yoga C940-15IRH | |
| Dell G3 3590 | |
| Schenker Key 16 | |
| Asus Zephyrus GX501 | |
| Razer Blade Stealth i7-1065G7 Iris Plus | |
| CPU Multi 64Bit | |
| AMD Radeon RX Vega 64 | |
| Eurocom Sky X4C i9-9900KS | |
| Eurocom Nightsky RX15 | |
| MSI GE65 Raider 9SF-049US | |
| Genomsnitt Intel Core i9-9880H (1317 - 1721, n=11) | |
| Lenovo Yoga C940-15IRH | |
| Medion Erazer X15805 | |
| Schenker Key 16 | |
| MSI Prestige 15 A10SC | |
| Dell G3 3590 | |
| Asus Zephyrus GX501 | |
| Razer Blade Stealth i7-1065G7 Iris Plus | |
| PCMark 10 | |
| Score | |
| MSI GE65 Raider 9SF-049US | |
| Eurocom Nightsky RX15 | |
| Genomsnitt Intel Core i9-9880H, NVIDIA GeForce RTX 2070 Mobile (5826 - 6452, n=2) | |
| Lenovo Legion Y740-15ICHg | |
| Alienware m15 R2 P87F | |
| MSI GE63 Raider 8SG | |
| Essentials | |
| MSI GE65 Raider 9SF-049US | |
| Eurocom Nightsky RX15 | |
| Genomsnitt Intel Core i9-9880H, NVIDIA GeForce RTX 2070 Mobile (9146 - 9752, n=2) | |
| Lenovo Legion Y740-15ICHg | |
| MSI GE63 Raider 8SG | |
| Alienware m15 R2 P87F | |
| Productivity | |
| MSI GE65 Raider 9SF-049US | |
| Eurocom Nightsky RX15 | |
| Genomsnitt Intel Core i9-9880H, NVIDIA GeForce RTX 2070 Mobile (8025 - 8273, n=2) | |
| Lenovo Legion Y740-15ICHg | |
| Alienware m15 R2 P87F | |
| MSI GE63 Raider 8SG | |
| Digital Content Creation | |
| MSI GE65 Raider 9SF-049US | |
| Eurocom Nightsky RX15 | |
| Lenovo Legion Y740-15ICHg | |
| Genomsnitt Intel Core i9-9880H, NVIDIA GeForce RTX 2070 Mobile (7311 - 9034, n=2) | |
| Alienware m15 R2 P87F | |
| MSI GE63 Raider 8SG | |
| PCMark 8 | |
| Home Score Accelerated v2 | |
| Lenovo Legion Y740-15ICHg | |
| MSI GE65 Raider 9SF-049US | |
| Genomsnitt Intel Core i9-9880H, NVIDIA GeForce RTX 2070 Mobile (4578 - 4679, n=2) | |
| Alienware m15 R2 P87F | |
| MSI GE63 Raider 8SG | |
| Eurocom Nightsky RX15 | |
| Work Score Accelerated v2 | |
| MSI GE65 Raider 9SF-049US | |
| Genomsnitt Intel Core i9-9880H, NVIDIA GeForce RTX 2070 Mobile (5919 - 6095, n=2) | |
| Lenovo Legion Y740-15ICHg | |
| Alienware m15 R2 P87F | |
| MSI GE63 Raider 8SG | |
| Eurocom Nightsky RX15 | |
| PCMark 8 Home Score Accelerated v2 | 4679 poäng | |
| PCMark 8 Work Score Accelerated v2 | 6095 poäng | |
| PCMark 10 Score | 6452 poäng | |
Hjälp | ||
| MSI GE65 Raider 9SF-049US Samsung SSD PM981 MZVLB1T0HALR | MSI GE63 Raider 8SG WDC PC SN520 SDAPNUW-512G | Lenovo Legion Y740-15ICHg WDC PC SN520 SDAPMUW-128G | Alienware m15 R2 P87F 2x Toshiba XG6 KXG60ZNV512G (RAID 0) | Asus Strix GL531GV-PB74 Intel SSD 660p SSDPEKNW512G8 | MSI GE75 9SG Samsung SSD PM981 MZVLB1T0HALR | |
|---|---|---|---|---|---|---|
| AS SSD | -31% | -39% | -1% | -19% | 2% | |
| Seq Read (MB/s) | 1211 | 904 -25% | 1372 13% | 1925 59% | 1280 6% | 1358 12% |
| Seq Write (MB/s) | 2420 | 1344 -44% | 746 -69% | 2371 -2% | 905 -63% | 2381 -2% |
| 4K Read (MB/s) | 27.11 | 24.99 -8% | 35.42 31% | 37.2 37% | 48.73 80% | 27.02 0% |
| 4K Write (MB/s) | 88.9 | 107.4 21% | 99.9 12% | 108.9 22% | 107 20% | 89.2 0% |
| 4K-64 Read (MB/s) | 1665 | 631 -62% | 302.1 -82% | 1177 -29% | 321.1 -81% | 1642 -1% |
| 4K-64 Write (MB/s) | 1831 | 731 -60% | 191.4 -90% | 1135 -38% | 761 -58% | 1799 -2% |
| Access Time Read * (ms) | 0.089 | 0.131 -47% | 0.132 -48% | 0.065 27% | 0.058 35% | 0.067 25% |
| Access Time Write * (ms) | 0.208 | 0.099 52% | 0.037 82% | 0.108 48% | 0.046 78% | 0.05 76% |
| Score Read (Points) | 1813 | 746 -59% | 475 -74% | 1407 -22% | 498 -73% | 1805 0% |
| Score Write (Points) | 2162 | 973 -55% | 366 -83% | 1481 -31% | 958 -56% | 2127 -2% |
| Score Total (Points) | 4956 | 2126 -57% | 1065 -79% | 3633 -27% | 1711 -65% | 4899 -1% |
| Copy ISO MB/s (MB/s) | 2483 | 1187 -52% | 1062 -57% | 2073 -17% | 1519 -39% | 3193 29% |
| Copy Program MB/s (MB/s) | 776 | 673 -13% | 426 -45% | 576 -26% | 749 -3% | 198.2 -74% |
| Copy Game MB/s (MB/s) | 1621 | 1295 -20% | 650 -60% | 1426 -12% | 943 -42% | 1054 -35% |
* ... mindre är bättre

| 3DMark 11 | |
| 1280x720 Performance GPU | |
| MSI RTX 2080 Ti Gaming X Trio | |
| Asus ROG Strix RTX 2080 OC | |
| Eurocom Sky X4C i9-9900KS | |
| Asus ROG Strix RTX 2070 OC | |
| Asus ROG Zephyrus S GX701GXR | |
| MSI GE65 Raider 9SF-049US | |
| Genomsnitt NVIDIA GeForce RTX 2070 Mobile (23335 - 27298, n=21) | |
| Walmart EVOO Gaming 17 | |
| Alienware 17 R5 | |
| Schenker XMG Neo 15 XNE15M19 | |
| Maingear Vector 15 | |
| Lenovo IdeaPad L340-15IRH 81LK00BMGE | |
| Asus Zephyrus S GX531GM | |
| 1280x720 Performance Combined | |
| Eurocom Sky X4C i9-9900KS | |
| MSI RTX 2080 Ti Gaming X Trio | |
| MSI GE65 Raider 9SF-049US | |
| Asus ROG Strix RTX 2070 OC | |
| Asus ROG Strix RTX 2080 OC | |
| Genomsnitt NVIDIA GeForce RTX 2070 Mobile (8716 - 16364, n=21) | |
| Walmart EVOO Gaming 17 | |
| Maingear Vector 15 | |
| Schenker XMG Neo 15 XNE15M19 | |
| Alienware 17 R5 | |
| Asus ROG Zephyrus S GX701GXR | |
| Lenovo IdeaPad L340-15IRH 81LK00BMGE | |
| Asus Zephyrus S GX531GM | |
| 3DMark 11 Performance | 22592 poäng | |
| 3DMark Cloud Gate Standard Score | 48855 poäng | |
| 3DMark Fire Strike Score | 18601 poäng | |
| 3DMark Time Spy Score | 8110 poäng | |
Hjälp | ||
| Shadow of the Tomb Raider - 1920x1080 Highest Preset AA:T | |
| Corsair One i160 | |
| Eurocom Sky X4C i9-9900KS | |
| Razer Blade Pro 17 4K UHD 120 Hz | |
| MSI GE65 Raider 9SF-049US | |
| Genomsnitt NVIDIA GeForce RTX 2070 Mobile (74.2 - 97, n=11) | |
| Schenker XMG Ultra 17 Coffee Lake Refresh | |
| Walmart EVOO Gaming 17 | |
| Razer Blade 15 GTX 1660 Ti | |
| Lenovo Yoga C940-15IRH | |
| Asus Zephyrus S GX531GM | |
| The Witcher 3 - 1920x1080 Ultra Graphics & Postprocessing (HBAO+) | |
| Corsair One i160 | |
| Eurocom Sky X4C i9-9900KS | |
| Razer Blade Pro 17 4K UHD 120 Hz | |
| MSI GE65 Raider 9SF-049US | |
| Genomsnitt NVIDIA GeForce RTX 2070 Mobile (64 - 82.1, n=21) | |
| Walmart EVOO Gaming 17 | |
| Schenker XMG Ultra 17 Coffee Lake Refresh | |
| Razer Blade 15 GTX 1660 Ti | |
| Asus Zephyrus S GX531GM | |
| Lenovo Yoga C940-15IRH | |
| låg | med. | hög | ultra | |
|---|---|---|---|---|
| BioShock Infinite (2013) | 325 | 309.3 | 292.5 | 170 |
| The Witcher 3 (2015) | 290.1 | 241.3 | 152.3 | 78.4 |
| Shadow of the Tomb Raider (2018) | 143 | 107 | 101 | 95 |
| MSI GE65 Raider 9SF-049US GeForce RTX 2070 Mobile, i9-9880H, Samsung SSD PM981 MZVLB1T0HALR | MSI GE63 Raider 8SG GeForce RTX 2080 Mobile, i7-8750H, WDC PC SN520 SDAPNUW-512G | Lenovo Legion Y740-15ICHg GeForce RTX 2070 Max-Q, i7-9750H, WDC PC SN520 SDAPMUW-128G | Asus Strix GL531GV-PB74 GeForce RTX 2060 Mobile, i7-9750H, Intel SSD 660p SSDPEKNW512G8 | Eurocom Nightsky RX15 GeForce RTX 2070 Mobile, i9-9980HK, Samsung SSD 970 Pro 512GB | Razer Blade 15 RTX 2080 Max-Q GeForce RTX 2080 Max-Q, i7-9750H, Samsung SSD PM981 MZVLB512HAJQ | |
|---|---|---|---|---|---|---|
| Noise | -3% | 6% | 2% | 0% | 13% | |
| av / miljö * (dB) | 28.8 | 28.5 1% | 30 -4% | 28.2 2% | 28.2 2% | 28.3 2% |
| Idle Minimum * (dB) | 33 | 33.9 -3% | 31.3 5% | 28.8 13% | 28.2 15% | 28.8 13% |
| Idle Average * (dB) | 33 | 33.9 -3% | 31.3 5% | 31.4 5% | 28.2 15% | 28.8 13% |
| Idle Maximum * (dB) | 33.1 | 34.3 -4% | 31.3 5% | 33.3 -1% | 31.7 4% | 29 12% |
| Load Average * (dB) | 38 | 39.5 -4% | 42 -11% | 46.2 -22% | 53.7 -41% | 33.5 12% |
| Witcher 3 ultra * (dB) | 52.9 | 56.2 -6% | 42.1 20% | 50.5 5% | 53.7 -2% | 45 15% |
| Load Maximum * (dB) | 57.8 | 57.2 1% | 46.5 20% | 51.3 11% | 53.7 7% | 45.2 22% |
* ... mindre är bättre
Ljudnivå
| Låg belastning |
| 33 / 33 / 33.1 dB(A) |
| Hög belastning |
| 38 / 57.8 dB(A) |
 | ||
30 dB tyst 40 dB(A) hörbar 50 dB(A) högt ljud |
||
min: | ||
(±) Den maximala temperaturen på ovansidan är 45 °C / 113 F, jämfört med genomsnittet av 40.4 °C / 105 F , allt från 21.2 till 68.8 °C för klassen Gaming.
(-) Botten värms upp till maximalt 53 °C / 127 F, jämfört med genomsnittet av 43.2 °C / 110 F
(+) Vid tomgångsbruk är medeltemperaturen för ovansidan 25.8 °C / 78 F, jämfört med enhetsgenomsnittet på 33.9 °C / ### class_avg_f### F.
(±) När du spelar The Witcher 3 är medeltemperaturen för ovansidan 33.4 °C / 92 F, jämfört med enhetsgenomsnittet på 33.9 °C / ## #class_avg_f### F.
(+) Handledsstöden och pekplattan är kallare än hudtemperaturen med maximalt 29 °C / 84.2 F och är därför svala att ta på.
(±) Medeltemperaturen för handledsstödsområdet på liknande enheter var 28.8 °C / 83.8 F (-0.2 °C / -0.4 F).
MSI GE65 Raider 9SF-049US ljudanalys
(+) | högtalare kan spela relativt högt (93 dB)
Bas 100 - 315 Hz
(-) | nästan ingen bas - i genomsnitt 20.5% lägre än medianen
(±) | linjäriteten för basen är genomsnittlig (8.8% delta till föregående frekvens)
Mellan 400 - 2000 Hz
(+) | balanserad mellan - endast 3.3% från medianen
(+) | mids är linjära (4.6% delta till föregående frekvens)
Högsta 2 - 16 kHz
(+) | balanserade toppar - endast 1.4% från medianen
(+) | toppar är linjära (5% delta till föregående frekvens)
Totalt 100 - 16 000 Hz
(±) | linjäriteten för det totala ljudet är genomsnittlig (15.6% skillnad mot median)
Jämfört med samma klass
» 36% av alla testade enheter i den här klassen var bättre, 6% liknande, 58% sämre
» Den bästa hade ett delta på 6%, genomsnittet var 18%, sämst var 132%
Jämfört med alla testade enheter
» 23% av alla testade enheter var bättre, 5% liknande, 72% sämre
» Den bästa hade ett delta på 4%, genomsnittet var 24%, sämst var 134%
Apple MacBook 12 (Early 2016) 1.1 GHz ljudanalys
(+) | högtalare kan spela relativt högt (83.6 dB)
Bas 100 - 315 Hz
(±) | reducerad bas - i genomsnitt 11.3% lägre än medianen
(±) | linjäriteten för basen är genomsnittlig (14.2% delta till föregående frekvens)
Mellan 400 - 2000 Hz
(+) | balanserad mellan - endast 2.4% från medianen
(+) | mids är linjära (5.5% delta till föregående frekvens)
Högsta 2 - 16 kHz
(+) | balanserade toppar - endast 2% från medianen
(+) | toppar är linjära (4.5% delta till föregående frekvens)
Totalt 100 - 16 000 Hz
(+) | det totala ljudet är linjärt (10.2% skillnad mot median)
Jämfört med samma klass
» 7% av alla testade enheter i den här klassen var bättre, 2% liknande, 91% sämre
» Den bästa hade ett delta på 5%, genomsnittet var 18%, sämst var 53%
Jämfört med alla testade enheter
» 5% av alla testade enheter var bättre, 1% liknande, 94% sämre
» Den bästa hade ett delta på 4%, genomsnittet var 24%, sämst var 134%
| Av/Standby | |
| Låg belastning | |
| Hög belastning |
|
Förklaring:
min: | |
| MSI GE65 Raider 9SF-049US i9-9880H, GeForce RTX 2070 Mobile, Samsung SSD PM981 MZVLB1T0HALR, IPS, 1920x1080, 15.6" | Eurocom Nightsky RX15 i9-9980HK, GeForce RTX 2070 Mobile, Samsung SSD 970 Pro 512GB, OLED, 3840x2160, 15.6" | Maingear Vector 15 i7-9750H, GeForce GTX 1660 Ti Mobile, , IPS, 1920x1080, 15.6" | Razer Blade 15 RTX 2080 Max-Q i7-9750H, GeForce RTX 2080 Max-Q, Samsung SSD PM981 MZVLB512HAJQ, IPS, 1920x1080, 15.6" | MSI P65 Creator 9SF-657 i9-9880H, GeForce RTX 2070 Max-Q, 2x Samsung SSD PM981 MZVLB512HAJQ (RAID 0), IPS, 3840x2160, 15.6" | MSI GE63 Raider RGB 8RF-008 i7-8750H, GeForce GTX 1070 Mobile, Samsung SSD PM871a MZNLN256HMHQ, TN, 1920x1080, 15.6" | |
|---|---|---|---|---|---|---|
| Power Consumption | -13% | 2% | 14% | 14% | 17% | |
| Idle Minimum * (Watt) | 15 | 12.6 16% | 16.2 -8% | 12.5 17% | 9.4 37% | 9 40% |
| Idle Average * (Watt) | 18.5 | 21.4 -16% | 21.1 -14% | 15.3 17% | 17.4 6% | 14 24% |
| Idle Maximum * (Watt) | 20.2 | 34.4 -70% | 26.4 -31% | 20.7 -2% | 19.6 3% | 19 6% |
| Load Average * (Watt) | 110.9 | 123.2 -11% | 85.1 23% | 90.2 19% | 103 7% | 91 18% |
| Witcher 3 ultra * (Watt) | 187.3 | 192.4 -3% | 158.2 16% | 162 14% | 182 3% | |
| Load Maximum * (Watt) | 260 | 246.6 5% | 188 28% | 209.3 19% | 216 17% | 238 8% |
* ... mindre är bättre
| MSI GE65 Raider 9SF-049US i9-9880H, GeForce RTX 2070 Mobile, 51 Wh | MSI GE63 Raider 8SG i7-8750H, GeForce RTX 2080 Mobile, 51 Wh | Razer Blade 15 RTX 2080 Max-Q i7-9750H, GeForce RTX 2080 Max-Q, 80 Wh | Walmart EVOO Gaming 17 i7-9750H, GeForce RTX 2060 Mobile, 46 Wh | Maingear Vector 15 i7-9750H, GeForce GTX 1660 Ti Mobile, 62 Wh | HP Omen 15-dc1303ng i7-8750H, GeForce RTX 2070 Max-Q, 70 Wh | |
|---|---|---|---|---|---|---|
| Batteridrifttid | 15% | 141% | 17% | 67% | 24% | |
| Reader / Idle (h) | 6.2 | 6.2 0% | 15.9 156% | 5 -19% | ||
| WiFi v1.3 (h) | 3.6 | 4 11% | 6.6 83% | 4.2 17% | 6 67% | 3.3 -8% |
| Load (h) | 0.6 | 0.8 33% | 1.7 183% | 1.2 100% |
För
Emot
Läs den fullständiga versionen av den här recensionen på engelska här.
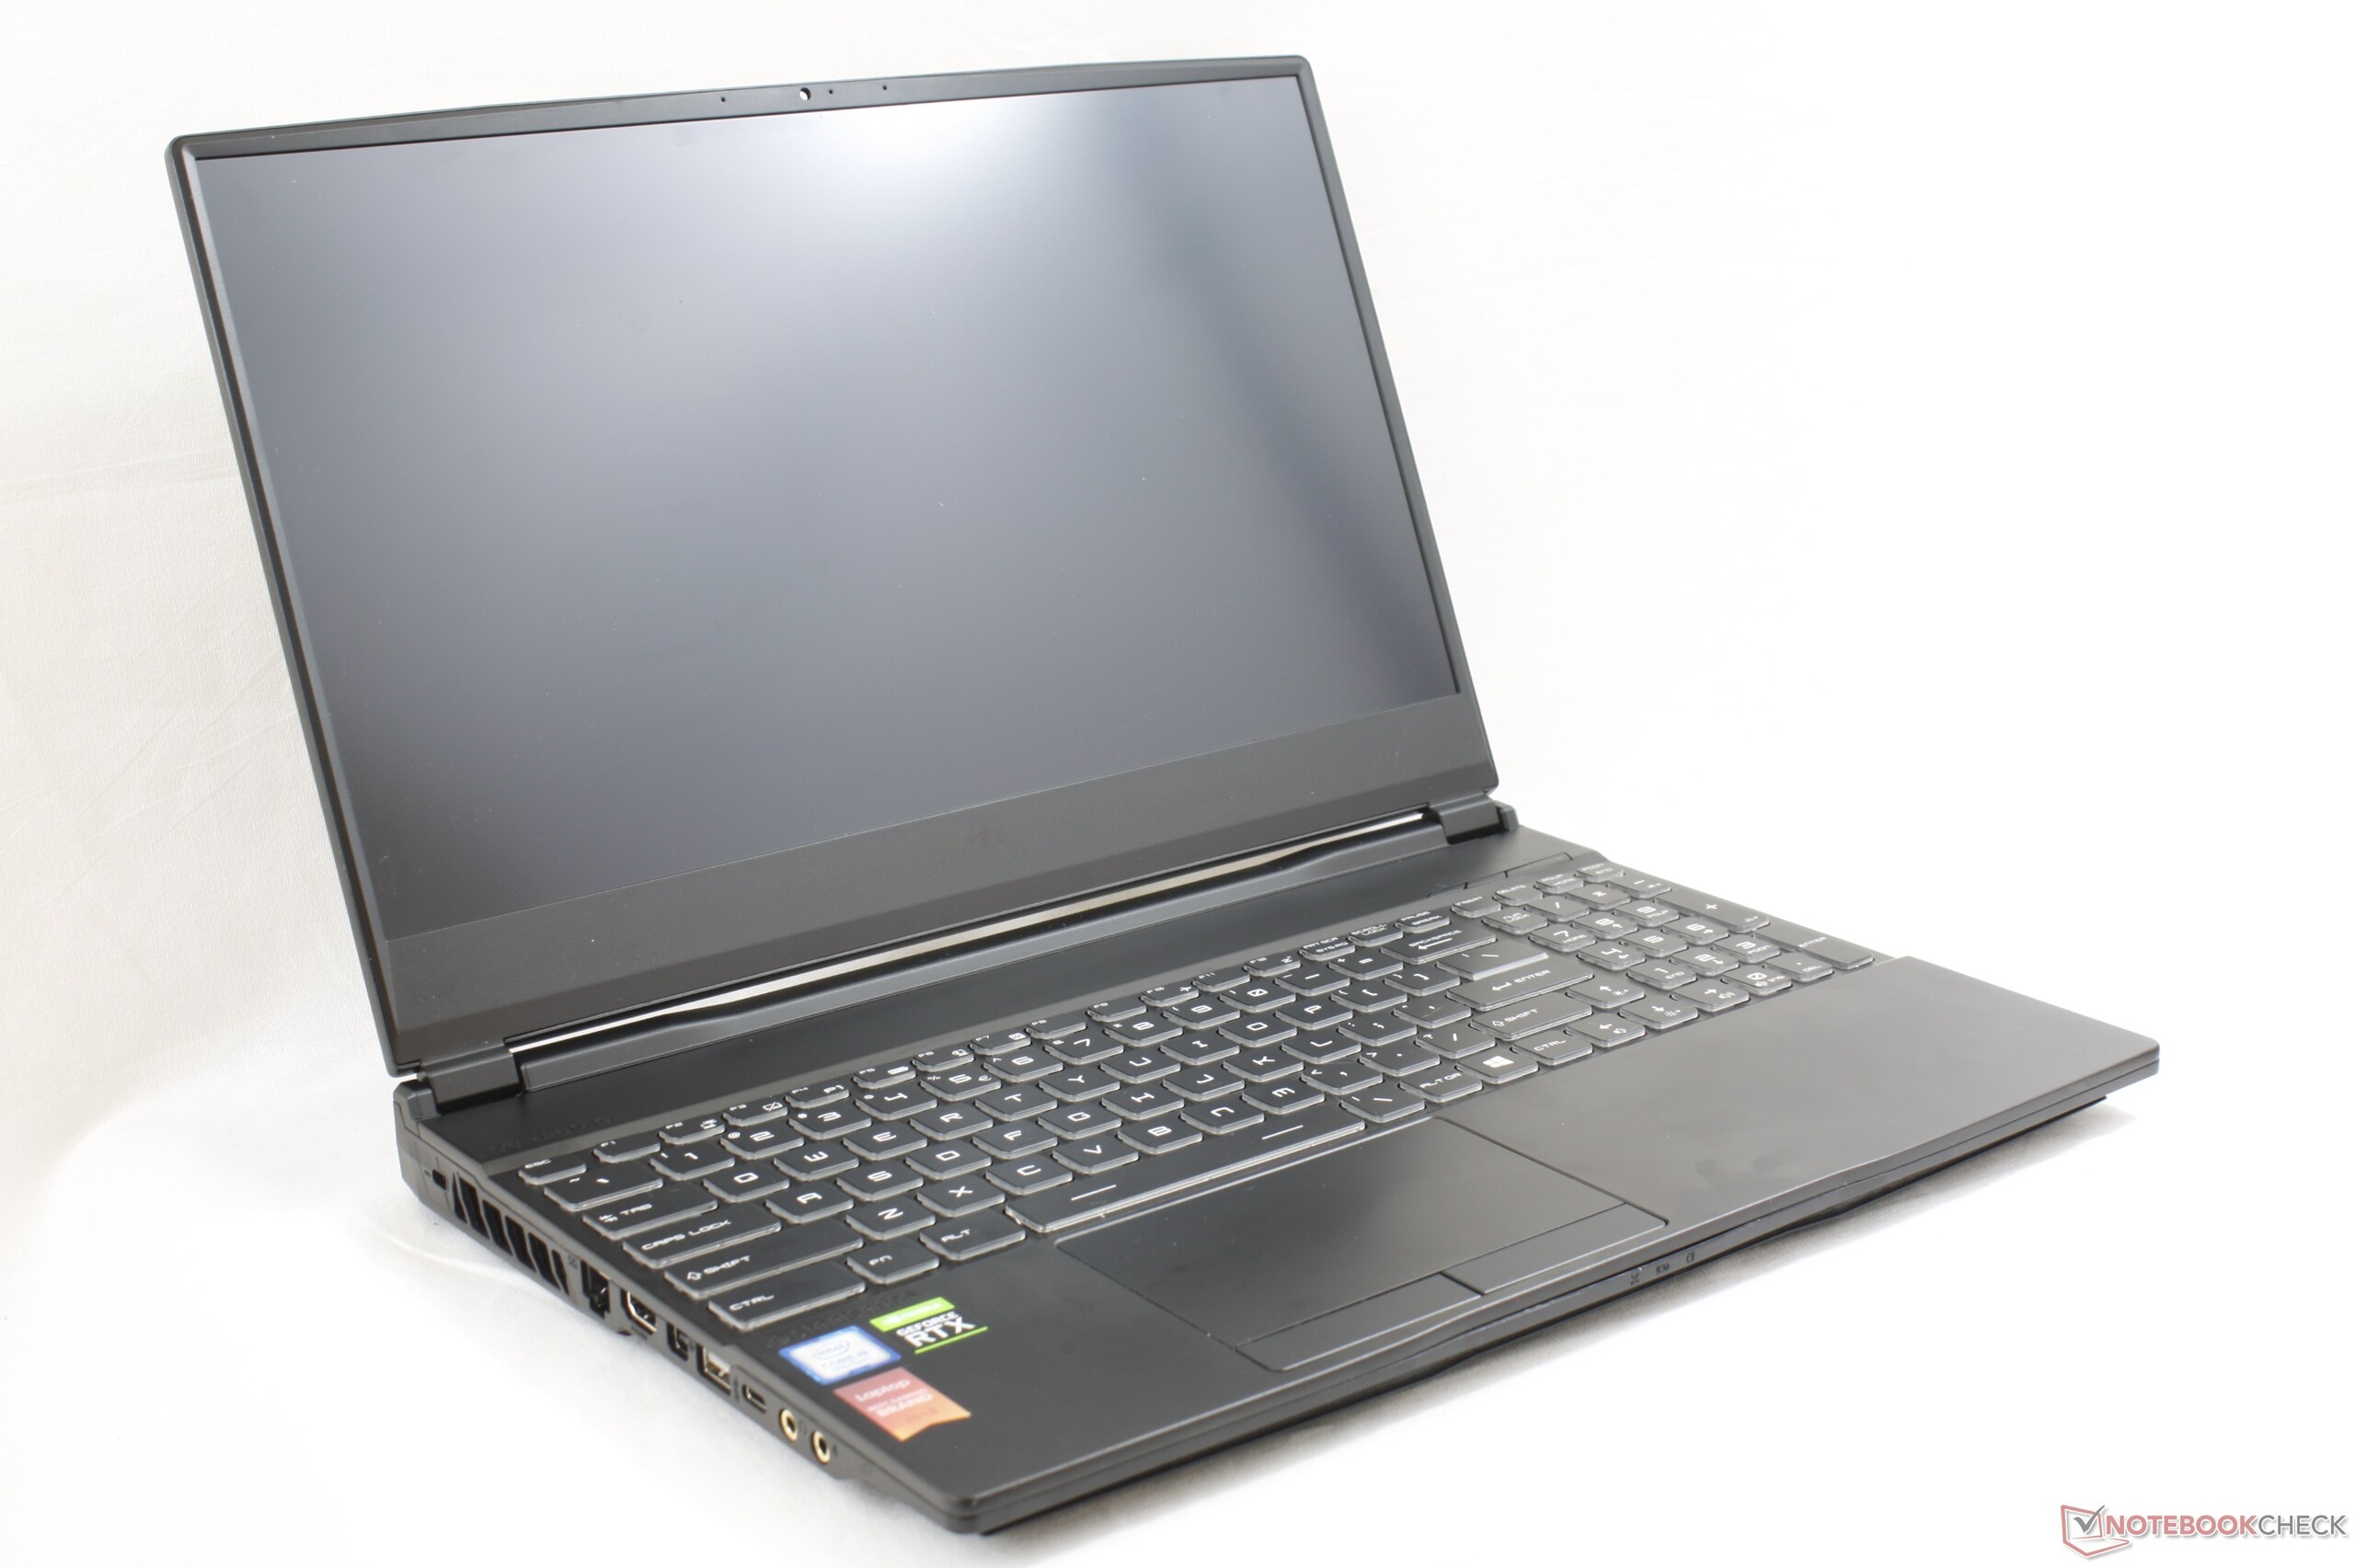
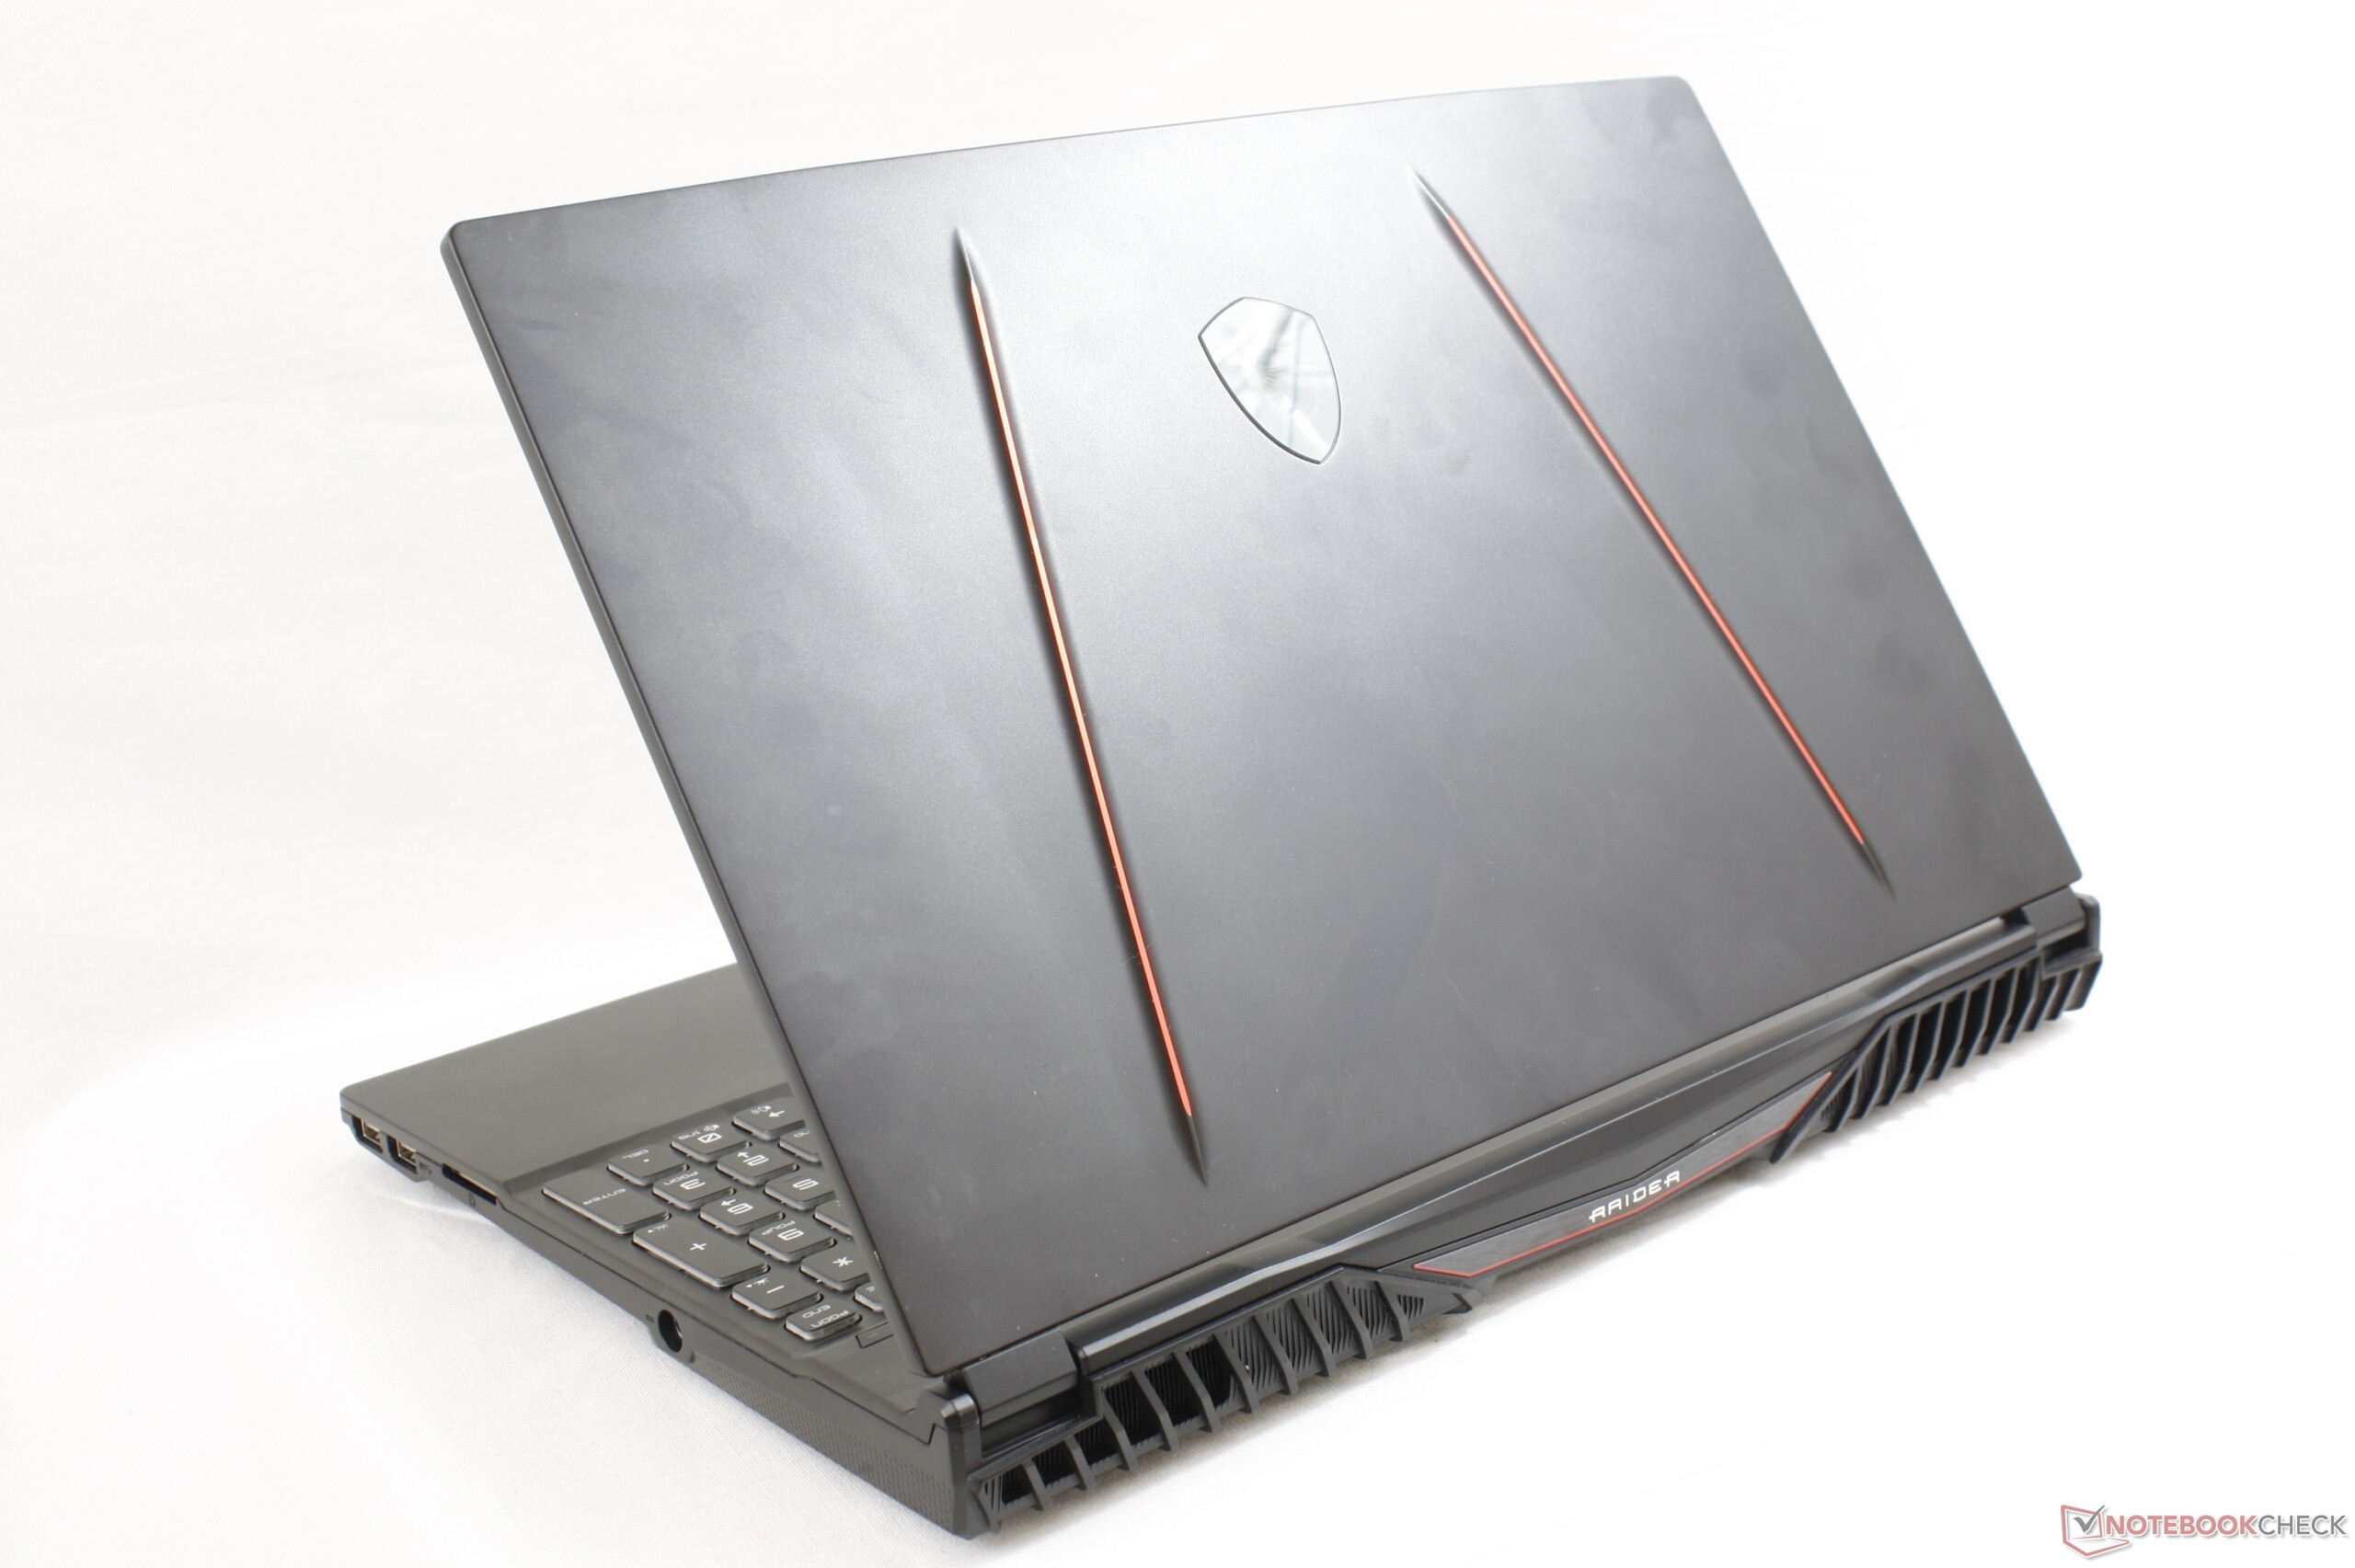
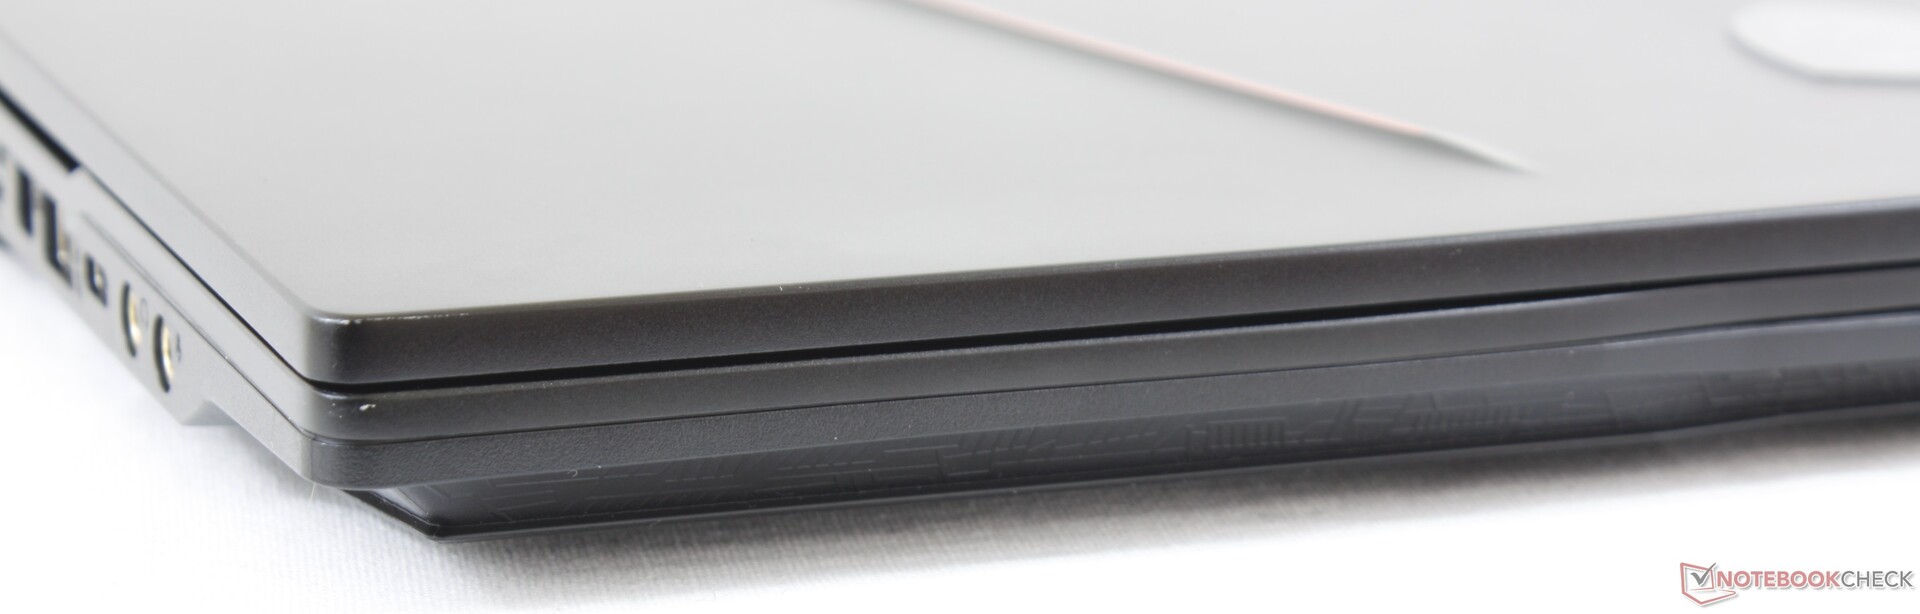
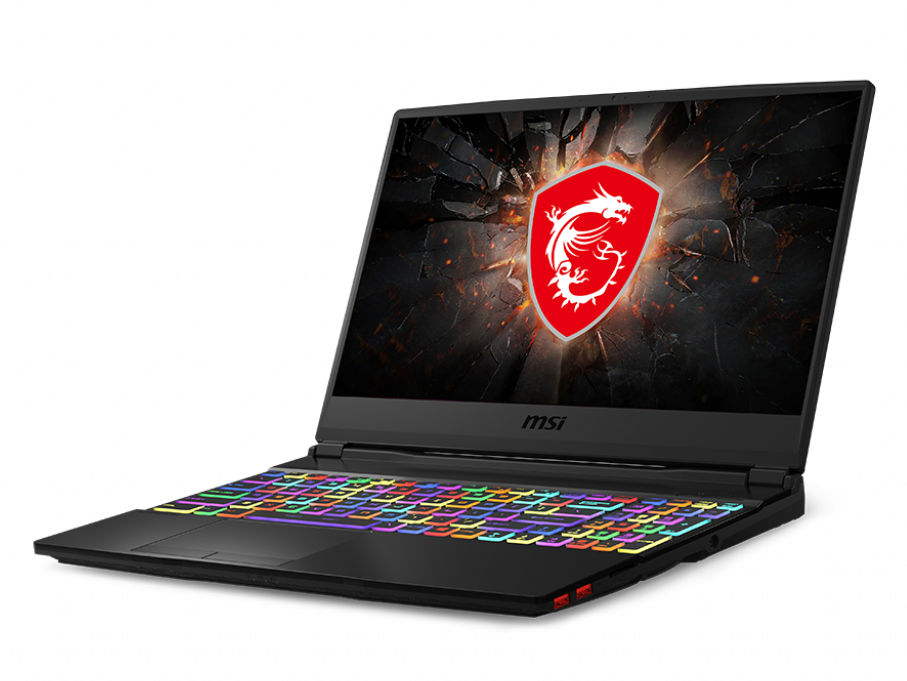
Ta GE63, skär av lite från kanterna och du får GE65. MSI:s senaste mittenskiktsmaskin behåller allt vi gillade med GE63 samtidigt som den uppdaterar en del aspekter som vi inte gillade. I huvudsak handlar detta om att serien nu är betydligt kompaktare och resevänlig än innan utan att därmed låta mer eller bli varmare.
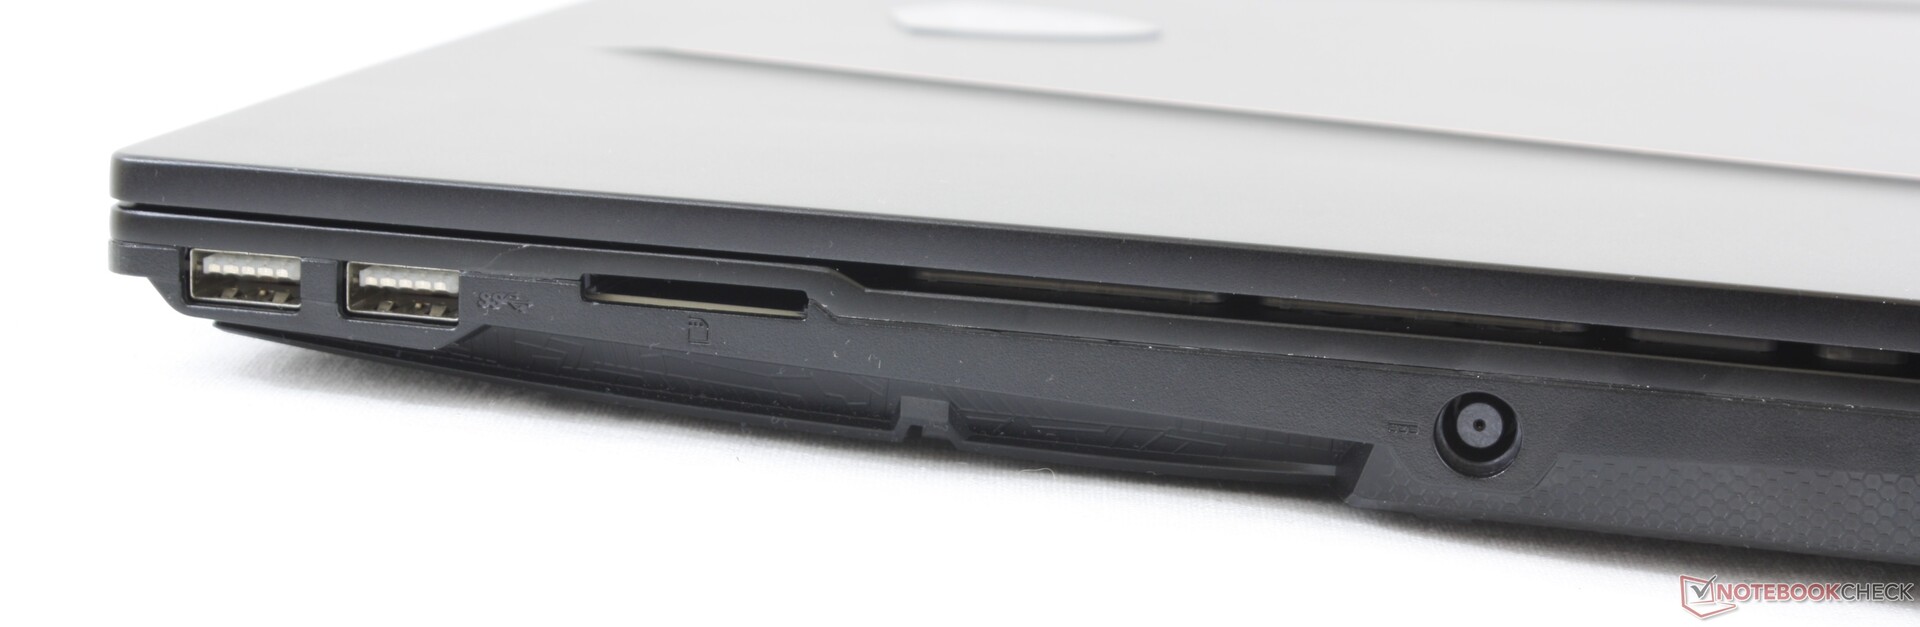
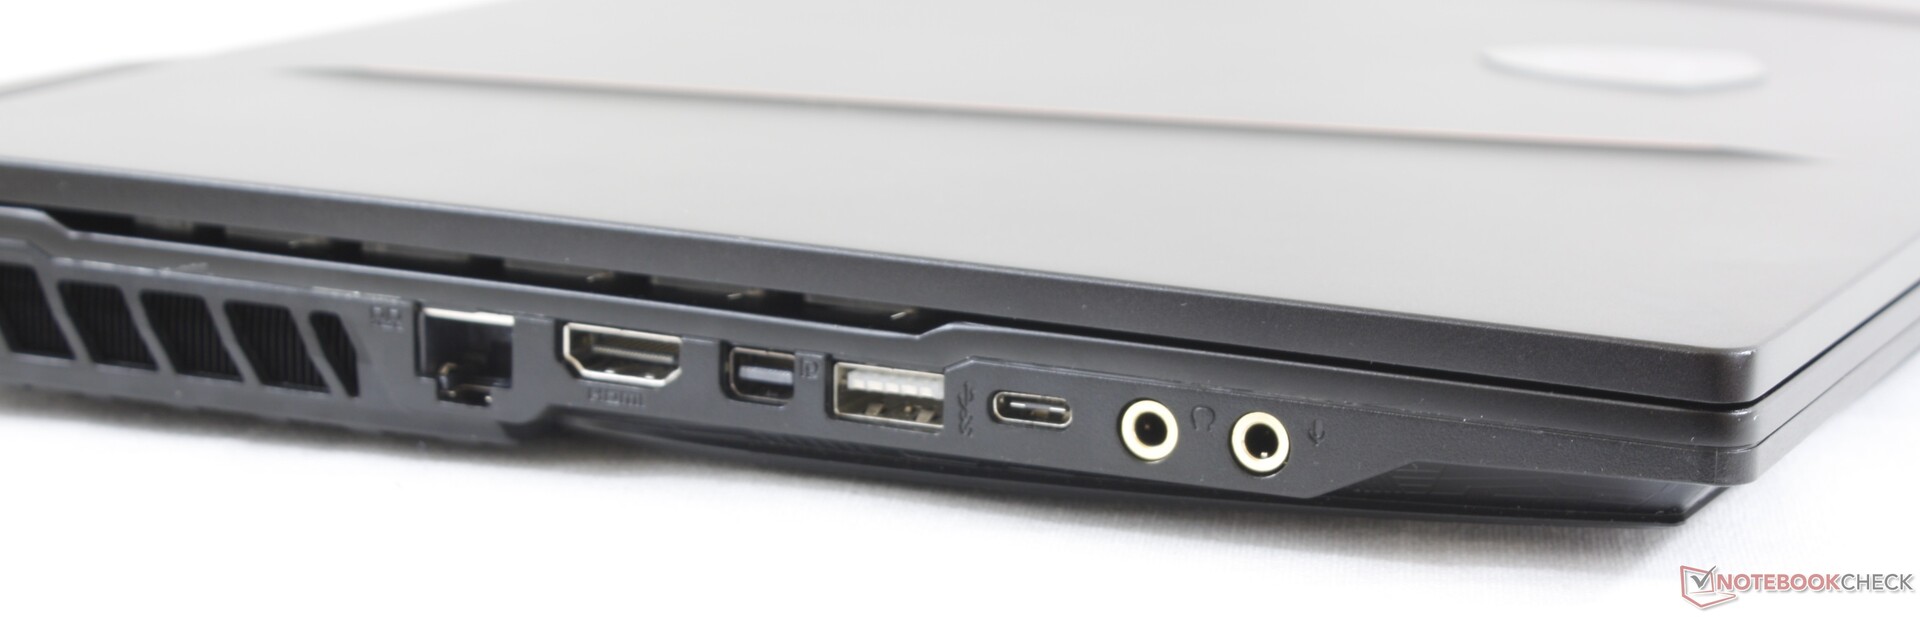
Å andra sidan har en del oönskade egenskaper inte förbättrats alls mellan generationerna. Skärmens ljusstyrka, portarna, batteritiden, chassits stabilitet och ljudnivån är i princip likadana som på GE63. Därmed är det i huvudsak ett ytligt beslut att välja GE65 framför GE63.
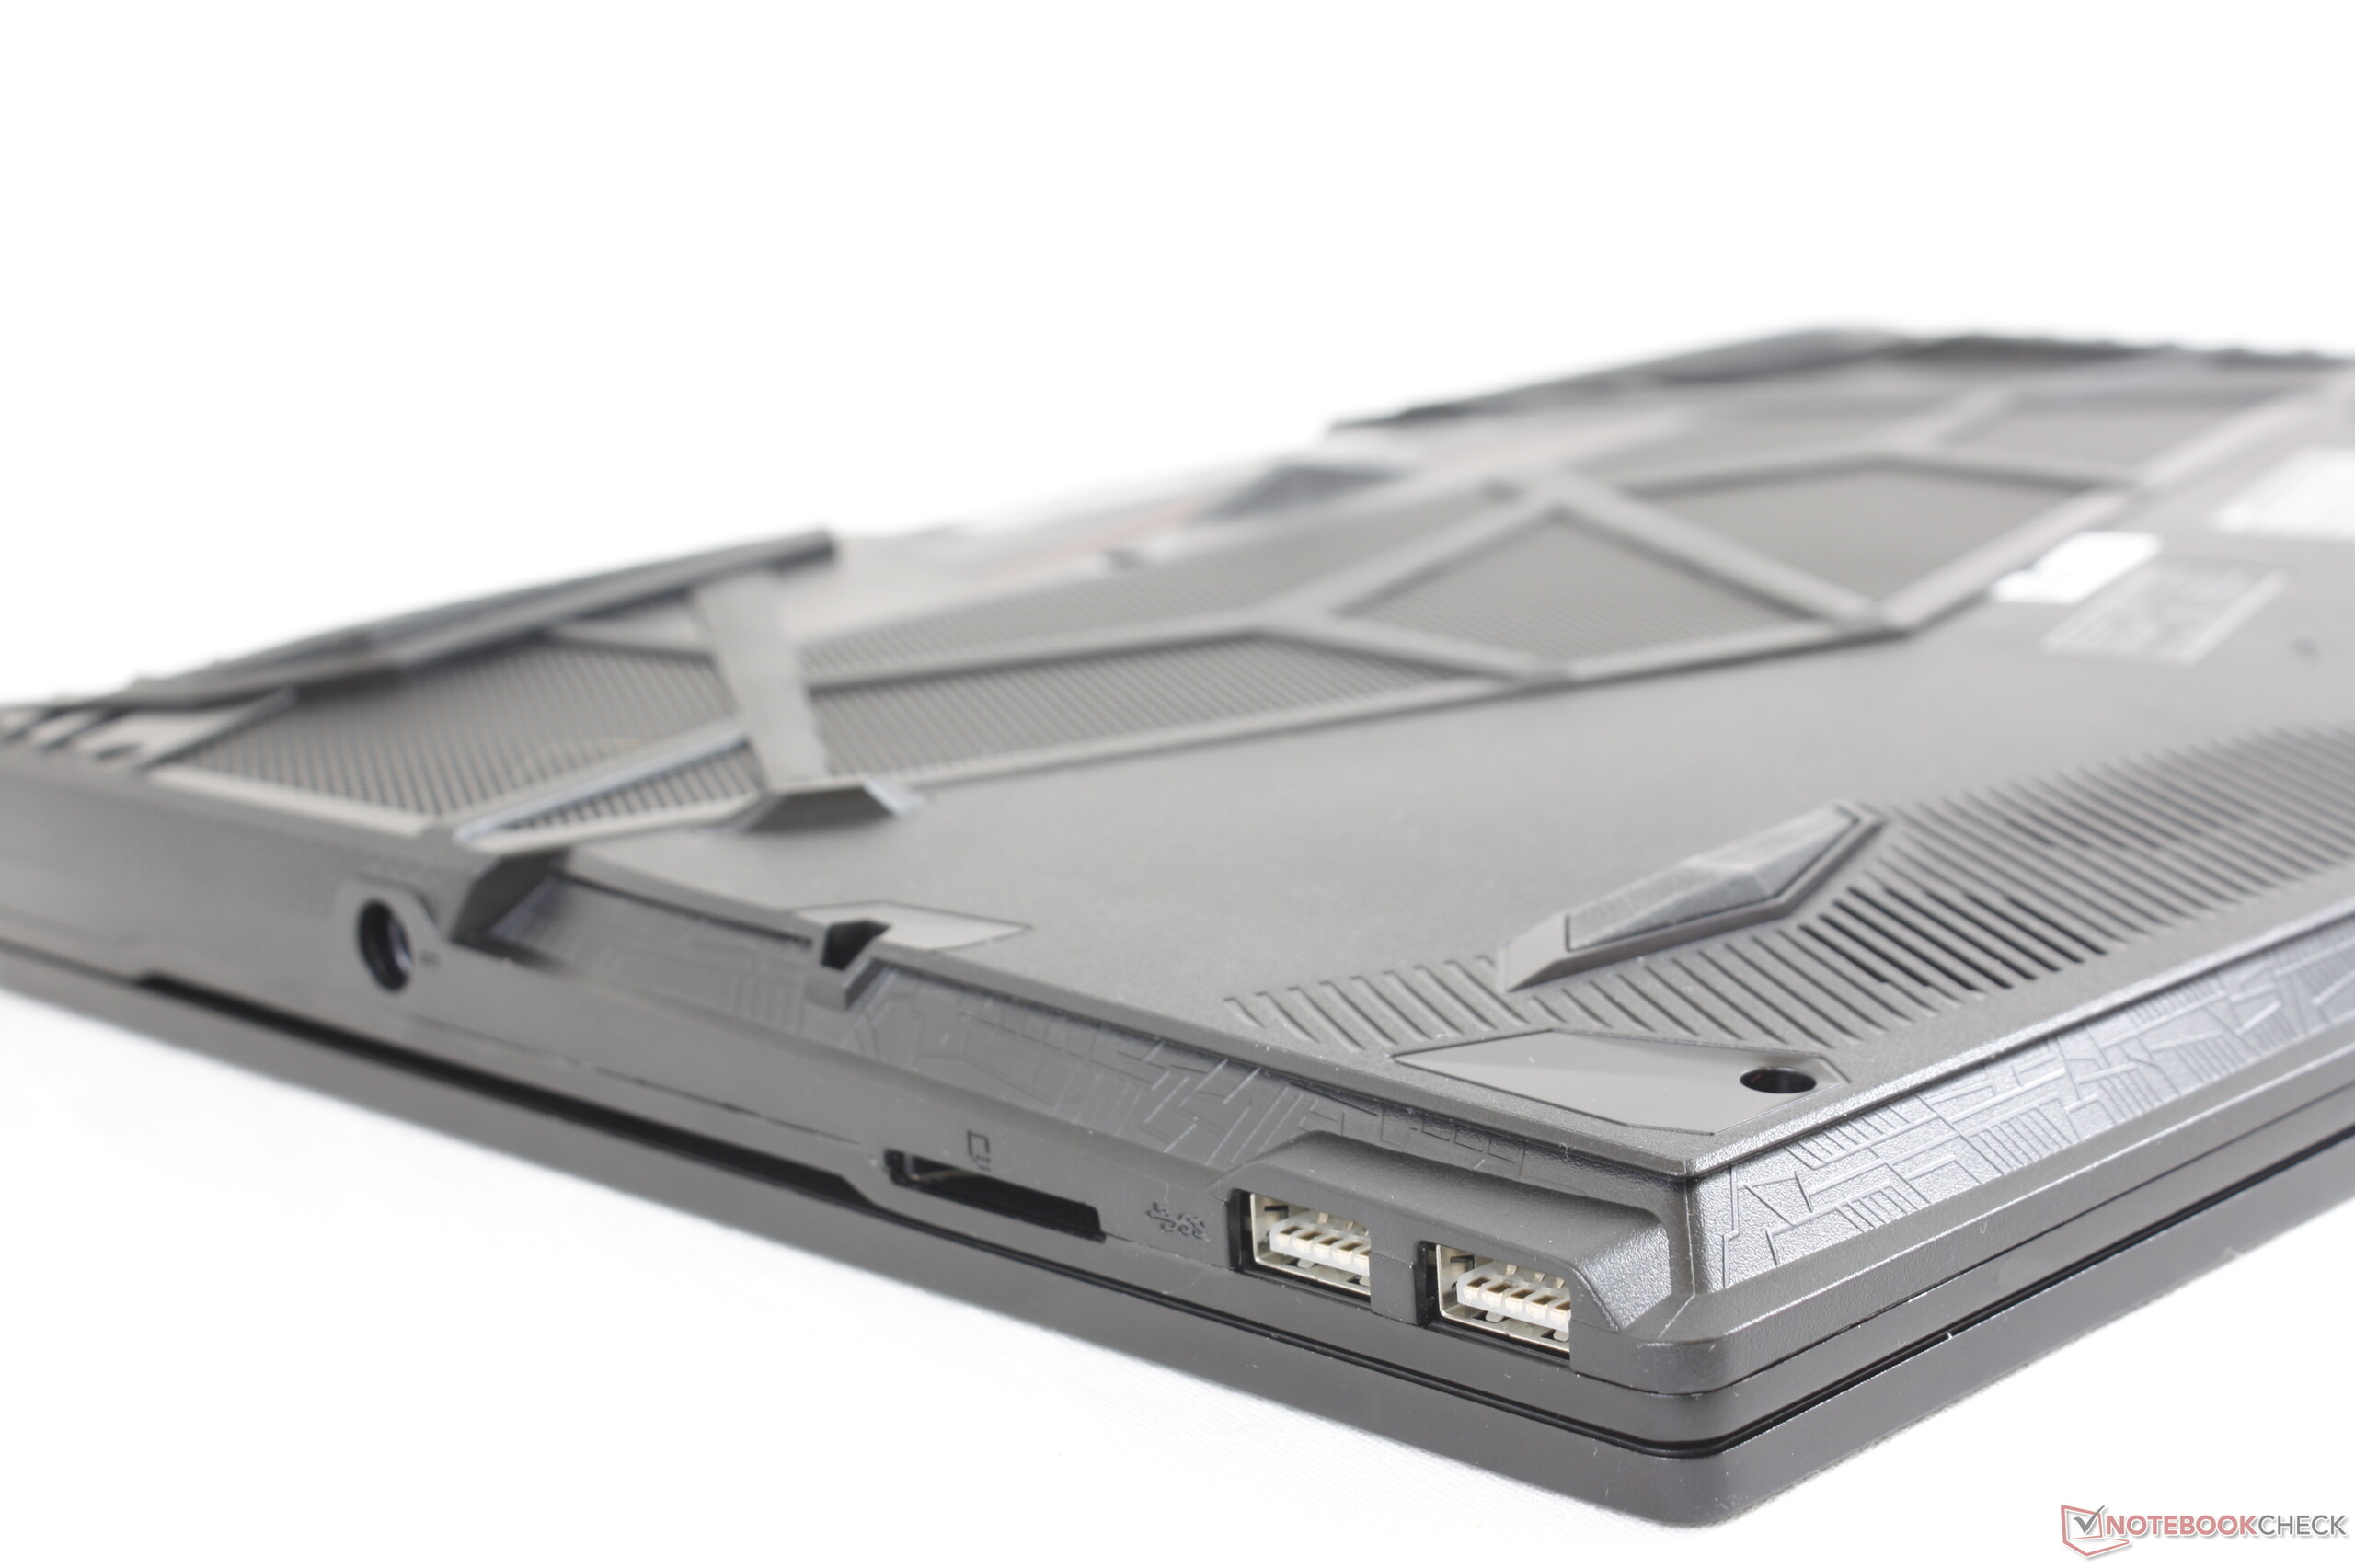
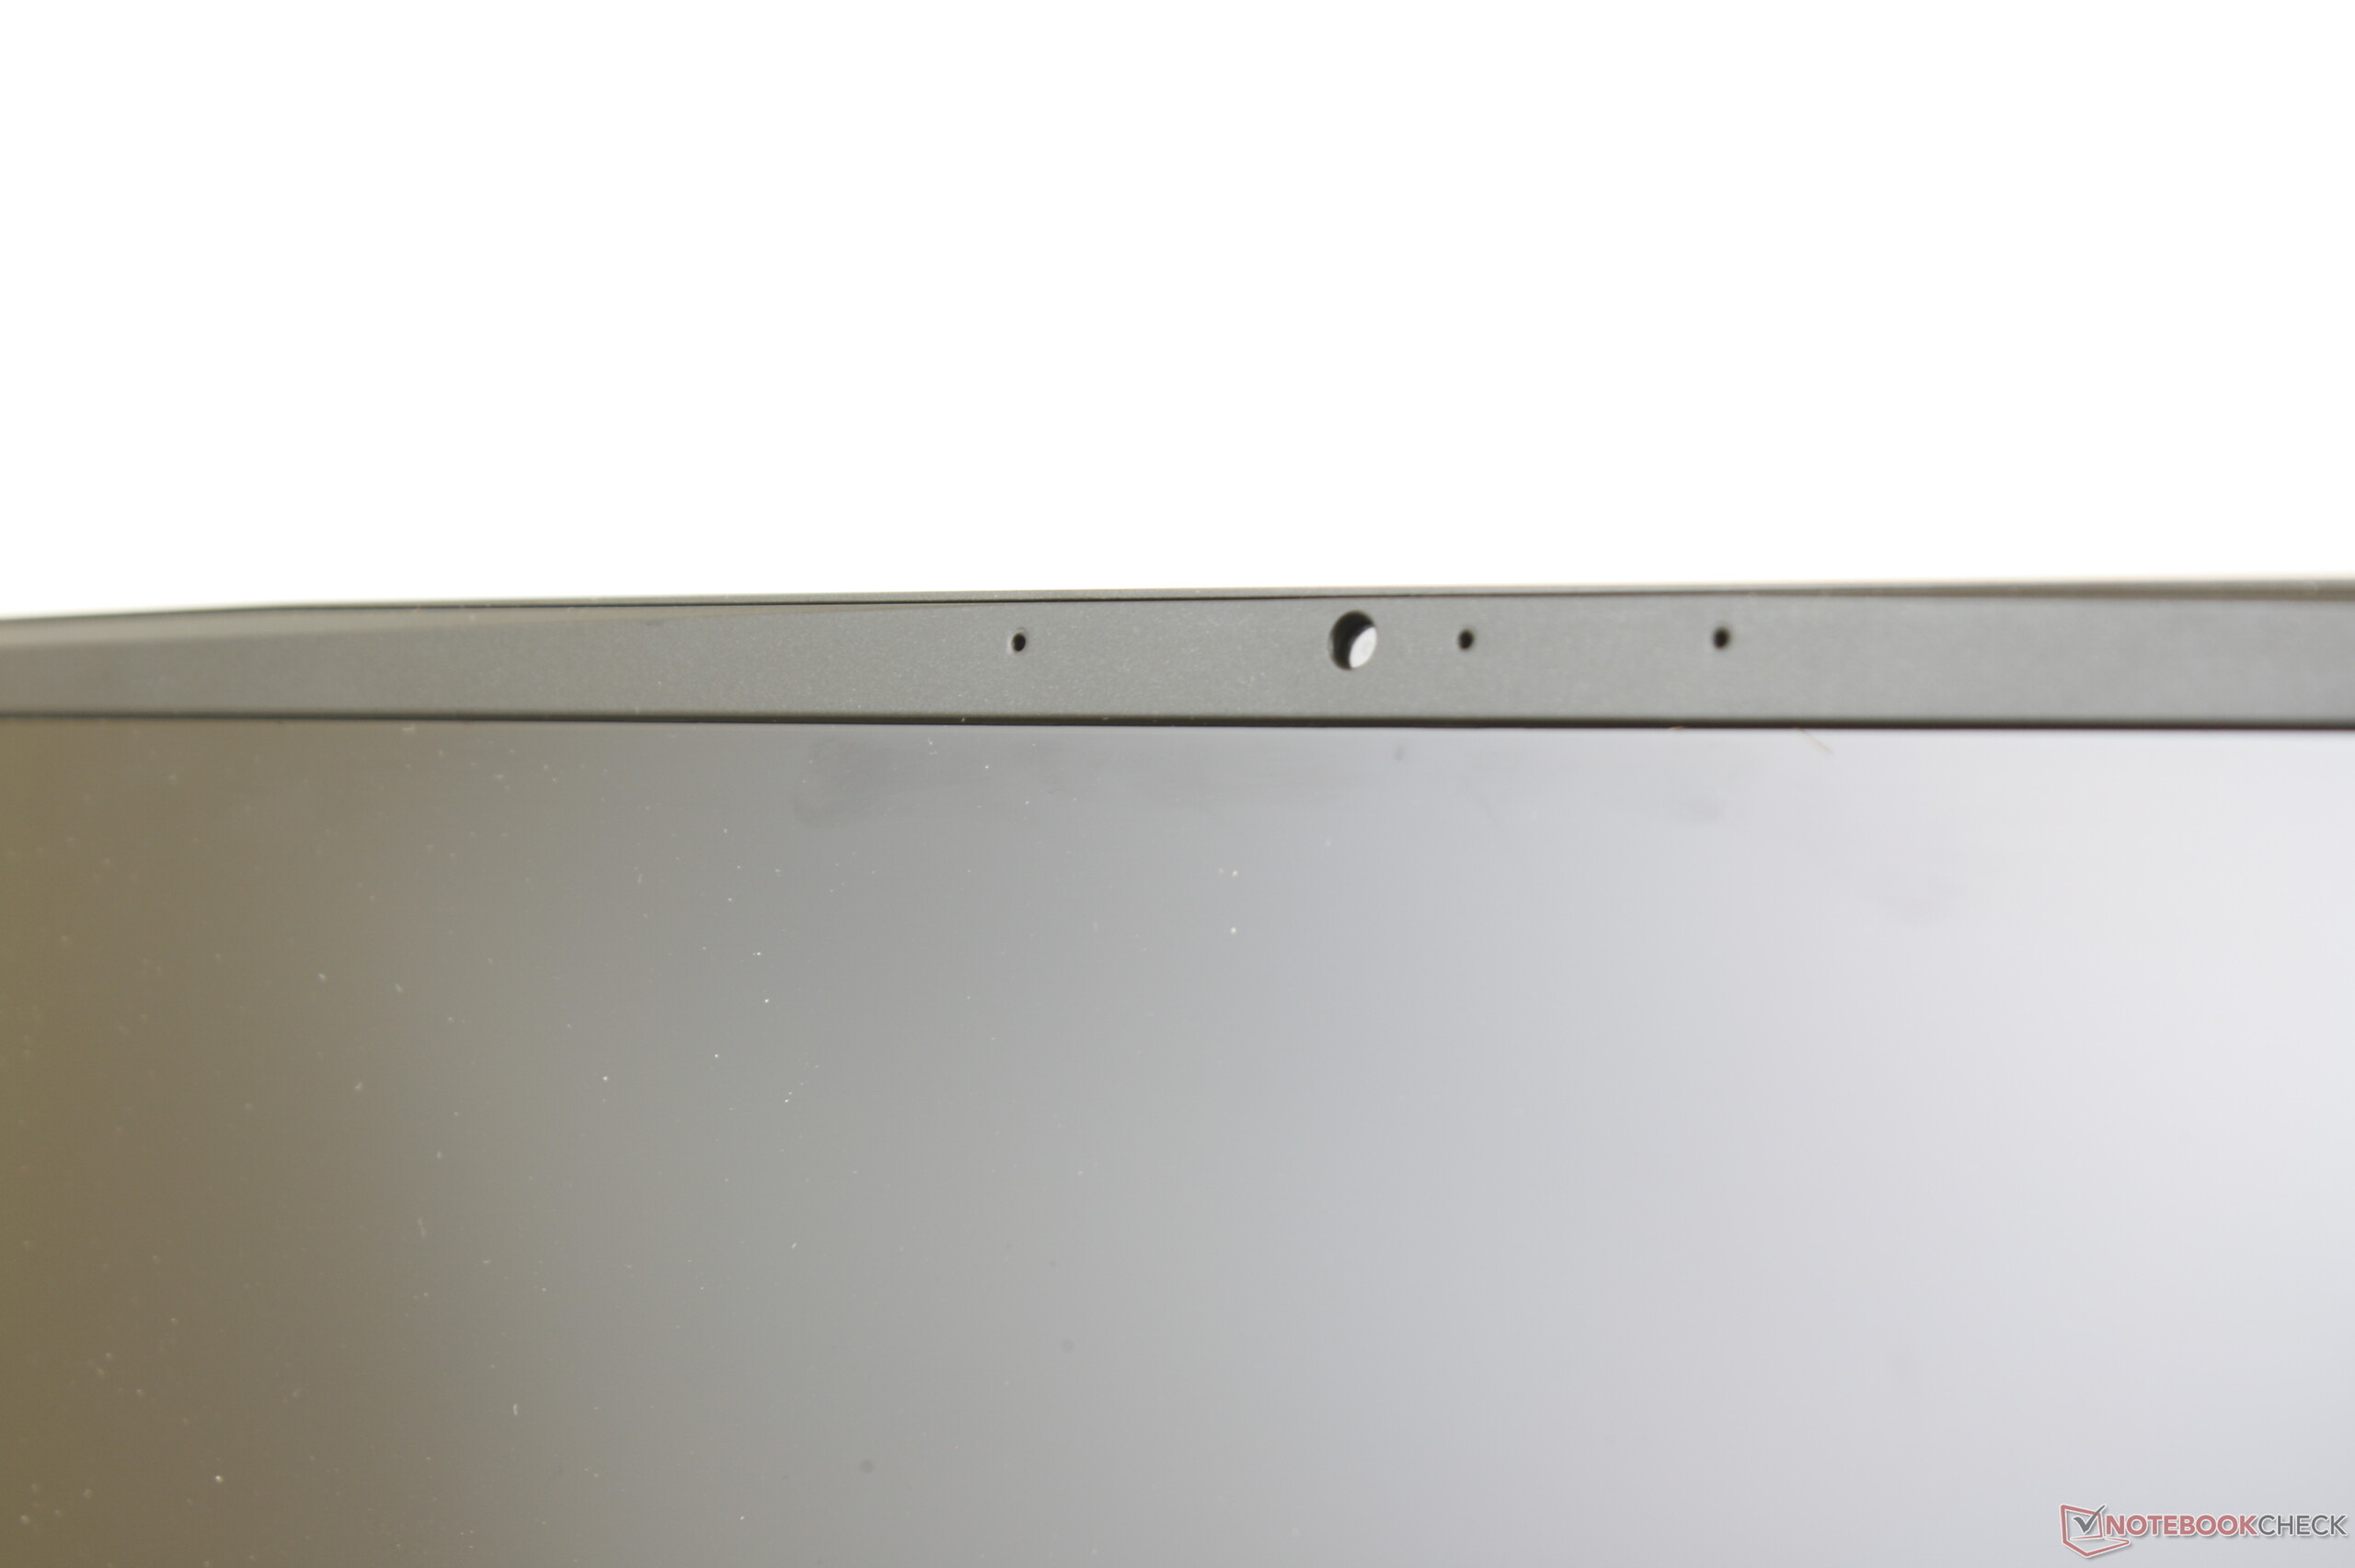
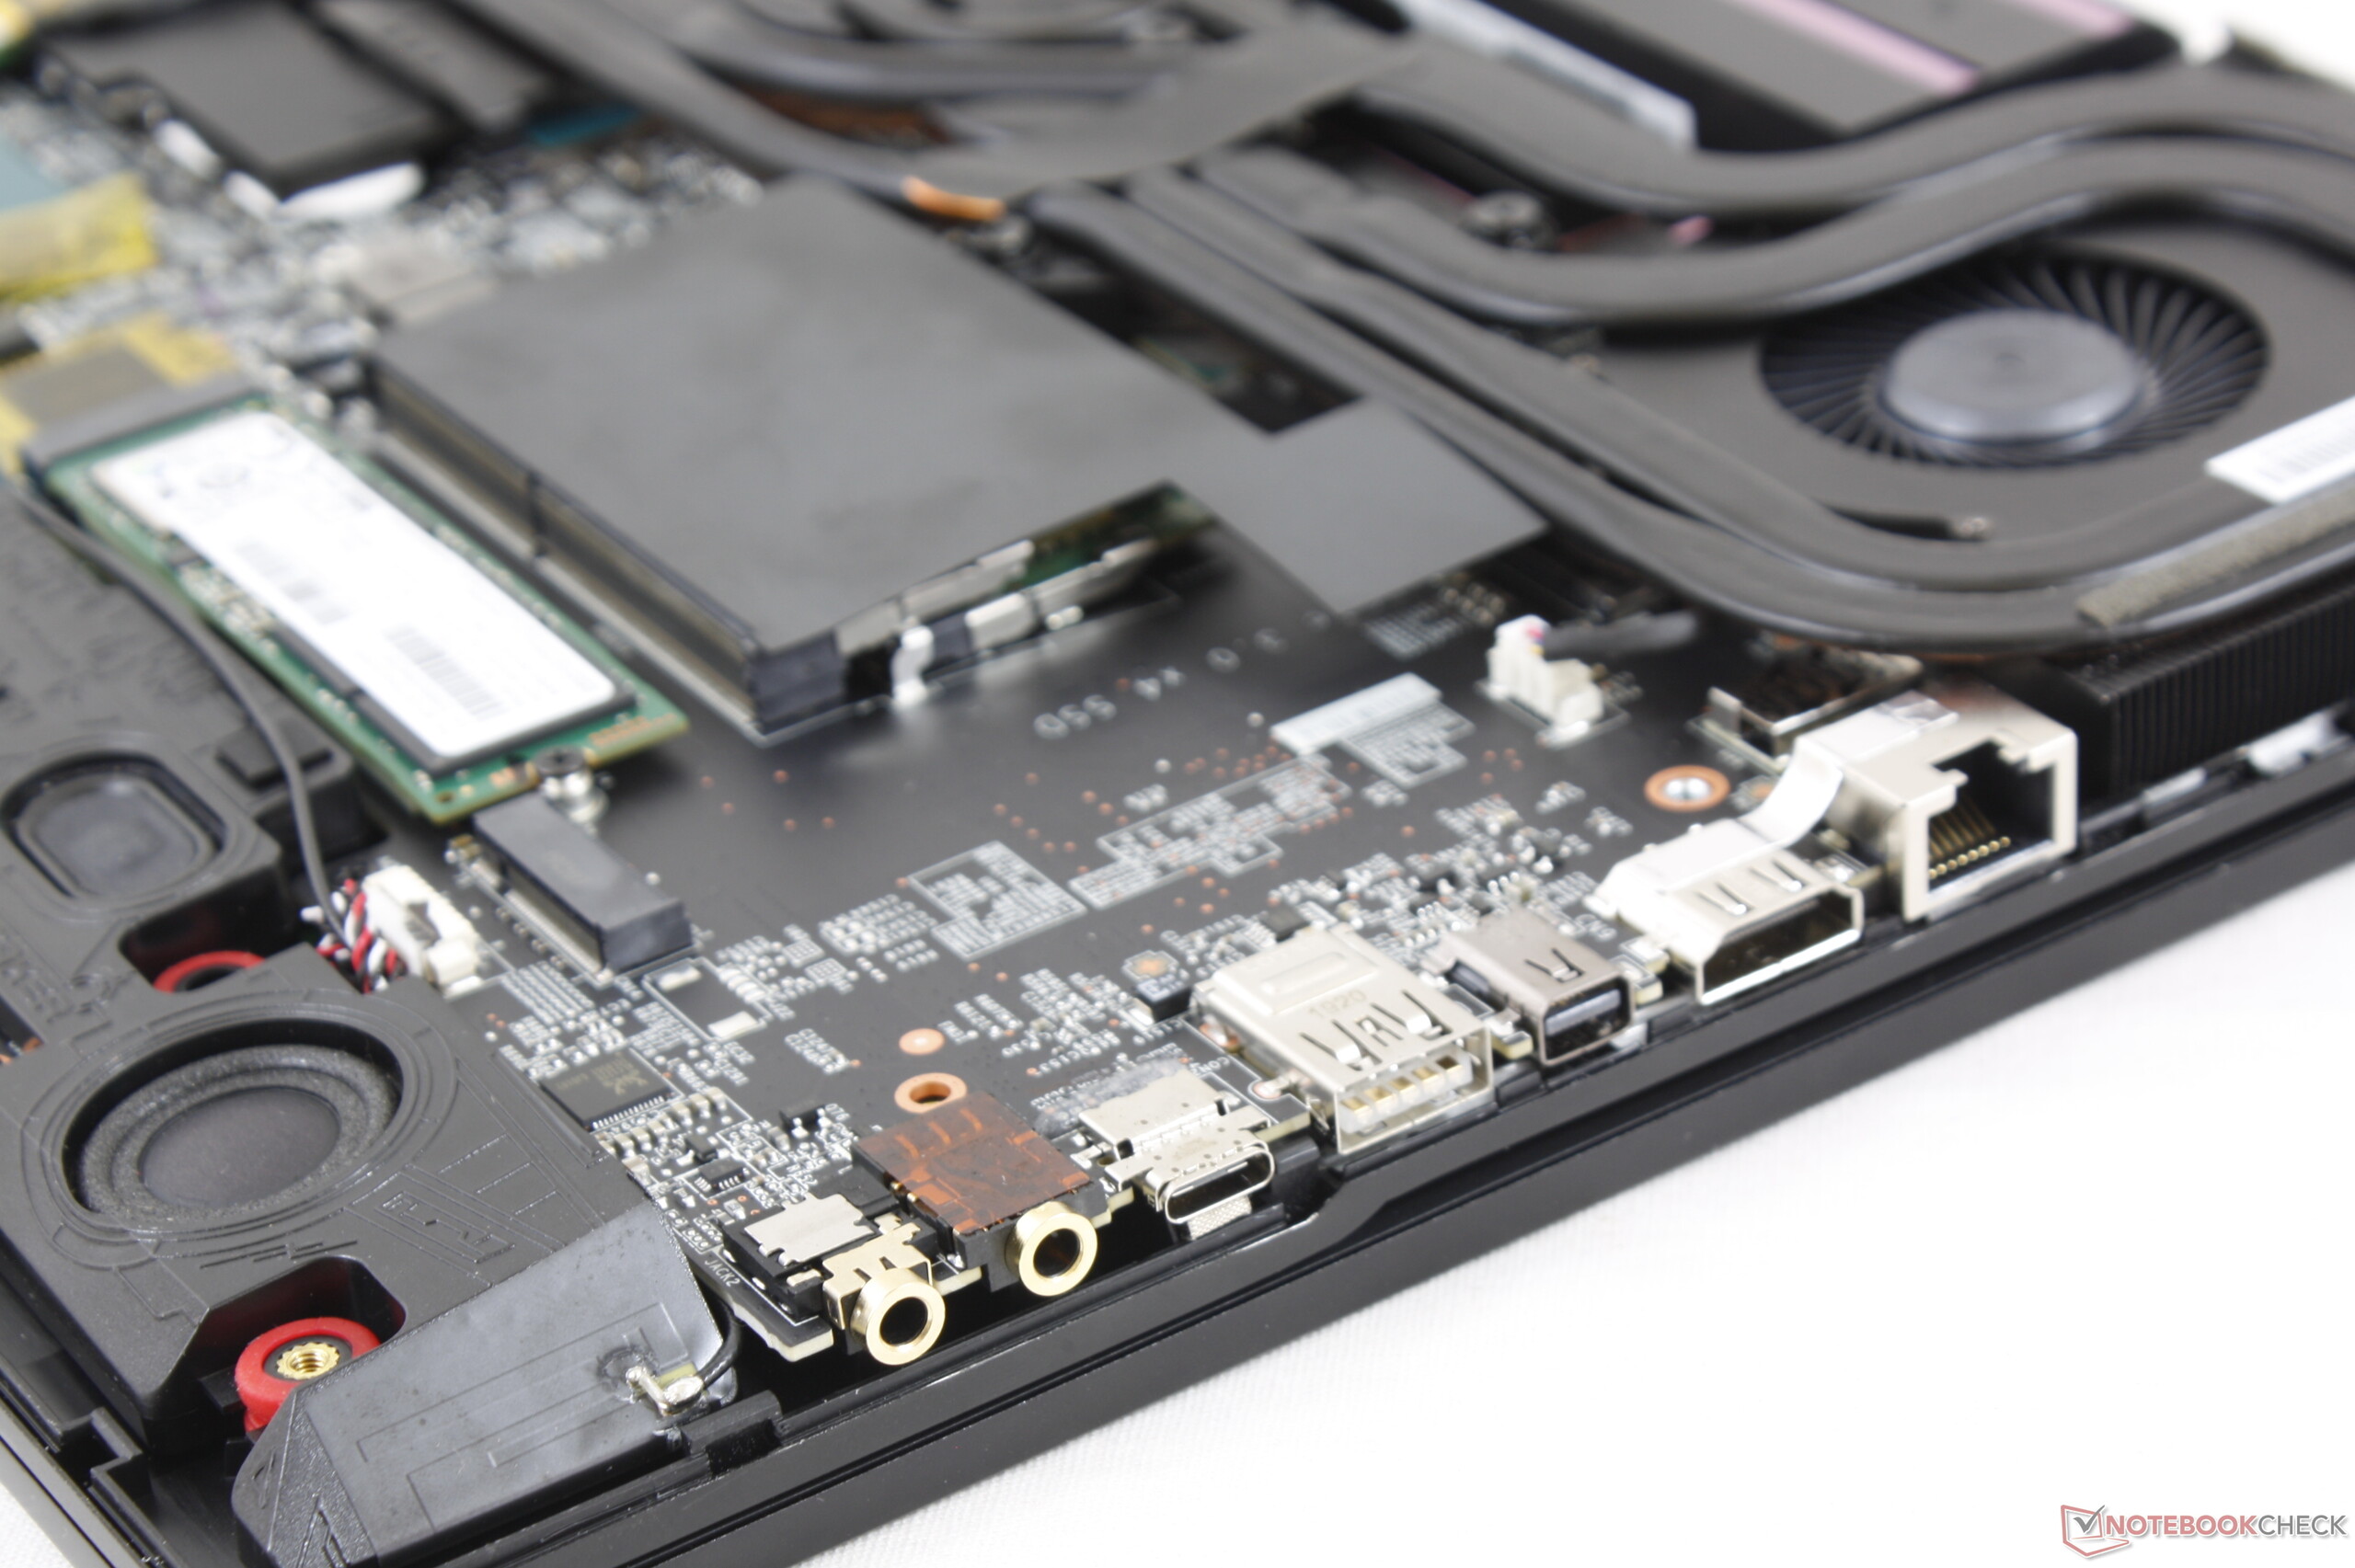
Intresserade köpare kan tänkas vilja jämföra MSI GE65 med Asus ROG Strix Scar III G531GW eftersom båda har samma Core i9 CPU och RTX 2070 GPU. Efter att ha testat båda systemen har MSI:s lösning en fördel då den är lättare att serva med fler lagringsalternativ, har fler portar, ett bättre tangentbord, en faktisk webbkamera och generellt tystare fläktar vid belastning. Asus system har istället ett starkare chassi och en mer ljusstark skärm.
För 26.000 kronor kan vår i9-konfiguration vara svårsåld för en mittenskiktslaptop. Vi rekommenderar att du istället väljer Core i7-varianten och sen själv uppgraderar lagringen för att spara in på kostnaden då servicen är så mycket enklare att utföra jämfört med GS65. Det är svårt att gå tillbaka till en 60 Hz-skärm efter att ha vant sig vid modeller med 144 eller 240 Hz.
MSI GE65 Raider 9SF-049US
- 12/23/2019 v7 (old)
Allen Ngo
Price comparison
