Test: MSI GS66 Stealth 10SE - Tjusig spellaptop med en 240 Hz-skärm (Sammanfattning)
Gradering | Datum | Modell | Vikt | Höjd | Storlek | Upplösning | Pris |
|---|---|---|---|---|---|---|---|
| 82.5 % v7 (old) | 08/2020 | MSI GS66 Stealth 10SE-045 i7-10750H, GeForce RTX 2060 Mobile | 2.2 kg | 19.8 mm | 15.60" | 1920x1080 | |
| 84.2 % v7 (old) | 10/2019 | Razer Blade 15 GTX 1660 Ti i7-9750H, GeForce GTX 1660 Ti Mobile | 2.1 kg | 19.9 mm | 15.60" | 1920x1080 | |
| 83.7 % v7 (old) | 06/2020 | Dell G5 15 SE 5505 P89F R7 4800H, Radeon RX 5600M | 2.4 kg | 21.6 mm | 15.60" | 1920x1080 | |
| 83.3 % v7 (old) | 07/2020 | Lenovo Legion 5 15IMH05H i5-10300H, GeForce RTX 2060 Mobile | 2.5 kg | 26.1 mm | 15.60" | 1920x1080 | |
| 82.7 % v7 (old) | Asus TUF Gaming A15 FA506IV-HN172 R7 4800H, GeForce RTX 2060 Mobile | 2.2 kg | 24.9 mm | 15.60" | 1920x1080 | ||
| 81.3 % v7 (old) | 02/2020 | Schenker XMG Core 15 GK5CP6V i7-9750H, GeForce GTX 1660 Ti Mobile | 2 kg | 26 mm | 15.60" | 1920x1080 |


| |||||||||||||||||||||||||
Distribution av ljusstyrkan: 91 %
Mitt på batteriet: 272 cd/m²
Kontrast: 1007:1 (Svärta: 0.27 cd/m²)
ΔE ColorChecker Calman: 2.42 | ∀{0.5-29.43 Ø4.72}
calibrated: 0.88
ΔE Greyscale Calman: 4.5 | ∀{0.09-98 Ø4.97}
91% sRGB (Argyll 1.6.3 3D)
69% AdobeRGB 1998 (Argyll 1.6.3 3D)
68.9% AdobeRGB 1998 (Argyll 3D)
98.3% sRGB (Argyll 3D)
67.5% Display P3 (Argyll 3D)
Gamma: 2.188
CCT: 7369 K
| MSI GS66 Stealth 10SE-045 Sharp LQ156M1JW03, IPS, 1920x1080, 15.6" | MSI GS66 Stealth 10SFS AUO B156HAN12.0 (AUO328E), IPS, 1920x1080, 15.6" | Razer Blade 15 GTX 1660 Ti BOE NV156FHM-N4K, IPS, 1920x1080, 15.6" | Dell G5 15 SE 5505 P89F BOE NV156FH, WVA, 1920x1080, 15.6" | Lenovo Legion 5 15IMH05H BOE CQ NV156FHM-NX1, IPS, 1920x1080, 15.6" | Asus TUF Gaming A15 FA506IV-HN172 LM156LF-2F01, IPS, 1920x1080, 15.6" | Schenker XMG Core 15 GK5CP6V BOEhydis NV156FHM-N4G (BOE084D), IPS, 1920x1080, 15.6" | |
|---|---|---|---|---|---|---|---|
| Display | 2% | -4% | -7% | -42% | -41% | -6% | |
| Display P3 Coverage (%) | 67.5 | 69.5 3% | 65.3 -3% | 63 -7% | 38.8 -43% | 38.92 -42% | 63.3 -6% |
| sRGB Coverage (%) | 98.3 | 99.6 1% | 91.8 -7% | 90.1 -8% | 57.8 -41% | 58.5 -40% | 91.2 -7% |
| AdobeRGB 1998 Coverage (%) | 68.9 | 70.8 3% | 66.5 -3% | 64.1 -7% | 40.09 -42% | 40.22 -42% | 65 -6% |
| Response Times | -5% | -5% | -37% | -90% | -157% | 14% | |
| Response Time Grey 50% / Grey 80% * (ms) | 12 ? | 14 ? -17% | 13.6 ? -13% | 20.4 ? -70% | 26 ? -117% | 34 ? -183% | 8.8 ? 27% |
| Response Time Black / White * (ms) | 10.4 ? | 9.6 ? 8% | 10 ? 4% | 10.8 ? -4% | 17 ? -63% | 24 ? -131% | 10.4 ? -0% |
| PWM Frequency (Hz) | 23580 ? | 200 ? | 198.4 ? | ||||
| Screen | 6% | -26% | -25% | -58% | -64% | -8% | |
| Brightness middle (cd/m²) | 272 | 316 16% | 312.7 15% | 292 7% | 301 11% | 280 3% | 324 19% |
| Brightness (cd/m²) | 259 | 311 20% | 305 18% | 290 12% | 277 7% | 254 -2% | 296 14% |
| Brightness Distribution (%) | 91 | 92 1% | 90 -1% | 77 -15% | 77 -15% | 88 -3% | 88 -3% |
| Black Level * (cd/m²) | 0.27 | 0.21 22% | 0.27 -0% | 0.27 -0% | 0.26 4% | 0.15 44% | 0.27 -0% |
| Contrast (:1) | 1007 | 1505 49% | 1158 15% | 1081 7% | 1158 15% | 1867 85% | 1200 19% |
| Colorchecker dE 2000 * | 2.42 | 3.03 -25% | 4.57 -89% | 3.99 -65% | 5.12 -112% | 5.89 -143% | 4.07 -68% |
| Colorchecker dE 2000 max. * | 6.93 | 7.32 -6% | 6.81 2% | 6.11 12% | 8.86 -28% | 19 -174% | 6.39 8% |
| Colorchecker dE 2000 calibrated * | 0.88 | 1.1 -25% | 2.91 -231% | 3.02 -243% | 4.88 -455% | 4.79 -444% | 1.49 -69% |
| Greyscale dE 2000 * | 4.5 | 3.9 13% | 4.3 4% | 3.3 27% | 3.47 23% | 4.08 9% | 4.01 11% |
| Gamma | 2.188 101% | 2.42 91% | 2.29 96% | 2.25 98% | 2.37 93% | 2.33 94% | 2.6 85% |
| CCT | 7369 88% | 7439 87% | 7098 92% | 7047 92% | 7062 92% | 7303 89% | 7350 88% |
| Color Space (Percent of AdobeRGB 1998) (%) | 69 | 65 -6% | 59.4 -14% | 58.1 -16% | 37 -46% | 37 -46% | 59 -14% |
| Color Space (Percent of sRGB) (%) | 91 | 100 10% | 91.3 0% | 89.7 -1% | 57 -37% | 58 -36% | 91 0% |
| Totalt genomsnitt (program/inställningar) | 1% /
4% | -12% /
-19% | -23% /
-23% | -63% /
-59% | -87% /
-72% | 0% /
-5% |
* ... mindre är bättre
Visa svarstider
| ↔ Svarstid svart till vitt | ||
|---|---|---|
| 10.4 ms ... stiga ↗ och falla ↘ kombinerat | ↗ 6 ms stiga | 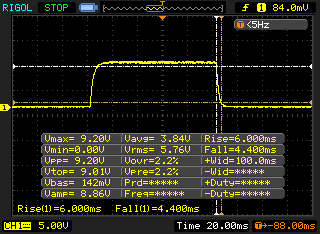 |
| ↘ 4.4 ms hösten | ||
| Skärmen visar bra svarsfrekvens i våra tester, men kan vara för långsam för konkurrenskraftiga spelare. I jämförelse sträcker sig alla testade enheter från 0.1 (minst) till 240 (maximalt) ms. » 28 % av alla enheter är bättre. Det betyder att den uppmätta svarstiden är bättre än genomsnittet av alla testade enheter (19.8 ms). | ||
| ↔ Svarstid 50 % grått till 80 % grått | ||
| 12 ms ... stiga ↗ och falla ↘ kombinerat | ↗ 7.6 ms stiga | 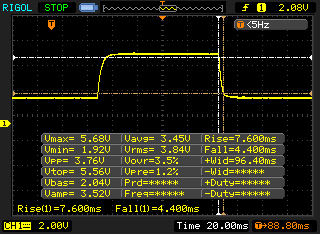 |
| ↘ 4.4 ms hösten | ||
| Skärmen visar bra svarsfrekvens i våra tester, men kan vara för långsam för konkurrenskraftiga spelare. I jämförelse sträcker sig alla testade enheter från 0.165 (minst) till 636 (maximalt) ms. » 25 % av alla enheter är bättre. Det betyder att den uppmätta svarstiden är bättre än genomsnittet av alla testade enheter (31 ms). | ||
Skärmflimmer / PWM (Puls-Width Modulation)
| Skärmflimmer / PWM upptäckt | 23580 Hz | ≤ 19 % ljusstyrka inställning | 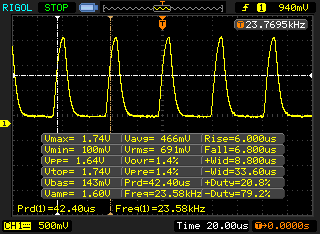 |
Displayens bakgrundsbelysning flimrar vid 23580 Hz (i värsta fall, t.ex. med PWM) Flimrande upptäckt vid en ljusstyrkeinställning på 19 % och lägre. Det ska inte finnas något flimmer eller PWM över denna ljusstyrkeinställning. Frekvensen för 23580 Hz är ganska hög, så de flesta användare som är känsliga för PWM bör inte märka något flimmer. Som jämförelse: 52 % av alla testade enheter använder inte PWM för att dämpa skärmen. Om PWM upptäcktes mättes ett medelvärde av 7763 (minst: 5 - maximum: 343500) Hz. | |||
| HWBOT x265 Benchmark v2.2 - 4k Preset | |
| Genomsnitt av klass Gaming (11.5 - 44.3, n=108, senaste 2 åren) | |
| Gigabyte Aero 15 OLED XB-8DE51B0SP | |
| Dell G5 15 SE 5505 P89F | |
| MSI GS66 Stealth 10SFS | |
| Asus TUF Gaming A15 FA506IV-HN172 | |
| MSI GS66 10SGS | |
| MSI GS66 Stealth 10SE-045 | |
| Razer Blade 15 RZ09-0328 | |
| Schenker XMG Core 15 GK5CP6V | |
| Lenovo Legion 5 15IMH05H | |
| LibreOffice - 20 Documents To PDF | |
| Dell G5 15 SE 5505 P89F | |
| MSI GS66 Stealth 10SE-045 | |
| MSI GS66 10SGS | |
| Razer Blade 15 RZ09-0328 | |
| Lenovo Legion 5 15IMH05H | |
| MSI GS66 Stealth 10SFS | |
| Gigabyte Aero 15 OLED XB-8DE51B0SP | |
| Genomsnitt av klass Gaming (19 - 88.8, n=108, senaste 2 åren) | |
| Asus TUF Gaming A15 FA506IV-HN172 | |
| R Benchmark 2.5 - Overall mean | |
| MSI GS66 Stealth 10SE-045 | |
| Schenker XMG Core 15 GK5CP6V | |
| Lenovo Legion 5 15IMH05H | |
| MSI GS66 10SGS | |
| Asus TUF Gaming A15 FA506IV-HN172 | |
| MSI GS66 Stealth 10SFS | |
| Dell G5 15 SE 5505 P89F | |
| Gigabyte Aero 15 OLED XB-8DE51B0SP | |
| Genomsnitt av klass Gaming (0.3439 - 0.759, n=109, senaste 2 åren) | |
* ... mindre är bättre
| PCMark 8 Home Score Accelerated v2 | 4539 poäng | |
| PCMark 8 Creative Score Accelerated v2 | 4314 poäng | |
| PCMark 8 Work Score Accelerated v2 | 5908 poäng | |
| PCMark 10 Score | 4984 poäng | |
Hjälp | ||
| PCMark 8 | |
| Home Score Accelerated v2 | |
| Genomsnitt av klass Gaming (n=1senaste 2 åren) | |
| Dell G5 15 SE 5505 P89F | |
| Asus TUF Gaming A15 FA506IV-HN172 | |
| MSI GS66 10SGS | |
| MSI GS66 Stealth 10SE-045 | |
| Razer Blade 15 GTX 1660 Ti | |
| Lenovo Legion 5 15IMH05H | |
| Razer Blade 15 RZ09-0328 | |
| Work Score Accelerated v2 | |
| MSI GS66 10SGS | |
| MSI GS66 Stealth 10SE-045 | |
| Asus TUF Gaming A15 FA506IV-HN172 | |
| Razer Blade 15 GTX 1660 Ti | |
| Dell G5 15 SE 5505 P89F | |
| Lenovo Legion 5 15IMH05H | |
| Razer Blade 15 RZ09-0328 | |
| Genomsnitt av klass Gaming (n=1senaste 2 åren) | |
| DPC Latencies / LatencyMon - interrupt to process latency (max), Web, Youtube, Prime95 | |
| Dell G5 15 SE 5505 P89F | |
| MSI GS66 Stealth 10SFS | |
| Gigabyte Aero 15 OLED XB-8DE51B0SP | |
| MSI GS66 10SGS | |
| MSI GS66 Stealth 10SE-045 | |
| Razer Blade 15 RZ09-0328 | |
| Asus TUF Gaming A15 FA506IV-HN172 | |
| Lenovo Legion 5 15IMH05H | |
* ... mindre är bättre
| MSI GS66 Stealth 10SE-045 Samsung SSD PM981 MZVLB1T0HALR | Dell G5 15 SE 5505 P89F Samsung PM991 MZ9LQ512HALU | Lenovo Legion 5 15IMH05H Samsung PM991 MZALQ512HALU | Asus TUF Gaming A15 FA506IV-HN172 Kingston OM8PCP3512F-AB | Schenker XMG Core 15 GK5CP6V Samsung SSD 970 EVO Plus 500GB | MSI GS66 Stealth 10SFS Samsung SSD PM981 MZVLB1T0HALR | Razer Blade 15 GTX 1660 Ti Samsung SSD PM981 MZVLB256HAHQ | |
|---|---|---|---|---|---|---|---|
| CrystalDiskMark 5.2 / 6 | -20% | -21% | -18% | -14% | -4% | -14% | |
| Write 4K (MB/s) | 156.3 | 142.1 -9% | 145.4 -7% | 219.8 41% | 102 -35% | 131.3 -16% | 135 -14% |
| Read 4K (MB/s) | 47.65 | 46.43 -3% | 51.6 8% | 50.2 5% | 41.39 -13% | 45.84 -4% | 41.1 -14% |
| Write Seq (MB/s) | 2374 | 1108 -53% | 1007 -58% | 979 -59% | 1649 -31% | 2370 0% | 1427 -40% |
| Read Seq (MB/s) | 2045 | 1622 -21% | 1145 -44% | 1990 -3% | 1367 -33% | 1509 -26% | 1494 -27% |
| Write 4K Q32T1 (MB/s) | 431.3 | 467 8% | 468.4 9% | 516 20% | 379 -12% | 481.5 12% | 494.9 15% |
| Read 4K Q32T1 (MB/s) | 509 | 525 3% | 528 4% | 298.3 -41% | 401.2 -21% | 560 10% | 578 14% |
| Write Seq Q32T1 (MB/s) | 2385 | 1203 -50% | 1381 -42% | 982 -59% | 3276 37% | 2392 0% | 1417 -41% |
| Read Seq Q32T1 (MB/s) | 3505 | 2288 -35% | 2291 -35% | 1907 -46% | 3417 -3% | 3232 -8% | 3251 -7% |
| Write 4K Q8T8 (MB/s) | 981 | ||||||
| Read 4K Q8T8 (MB/s) | 300.9 | ||||||
| AS SSD | -61% | -48% | -45% | -7% | -17% | -48% | |
| Seq Read (MB/s) | 2612 | 1386 -47% | 2012 -23% | 1682 -36% | 2261 -13% | 1065 -59% | 1829 -30% |
| Seq Write (MB/s) | 2368 | 1234 -48% | 1261 -47% | 904 -62% | 2393 1% | 2360 0% | 1315 -44% |
| 4K Read (MB/s) | 51.1 | 41.32 -19% | 43.66 -15% | 60.2 18% | 54.6 7% | 48.09 -6% | 51.3 0% |
| 4K Write (MB/s) | 135.9 | 128 -6% | 109.3 -20% | 164.8 21% | 118.4 -13% | 110.7 -19% | 106 -22% |
| 4K-64 Read (MB/s) | 1635 | 854 -48% | 851 -48% | 472.5 -71% | 1376 -16% | 1635 0% | 917 -44% |
| 4K-64 Write (MB/s) | 1831 | 721 -61% | 780 -57% | 845 -54% | 2299 26% | 1829 0% | 1212 -34% |
| Access Time Read * (ms) | 0.042 | 0.098 -133% | 0.117 -179% | 0.087 -107% | 0.07 -67% | 0.071 -69% | 0.063 -50% |
| Access Time Write * (ms) | 0.028 | 0.095 -239% | 0.036 -29% | 0.02 29% | 0.031 -11% | 0.034 -21% | 0.104 -271% |
| Score Read (Points) | 1947 | 1034 -47% | 1096 -44% | 701 -64% | 1657 -15% | 1790 -8% | 1152 -41% |
| Score Write (Points) | 2204 | 973 -56% | 1016 -54% | 1101 -50% | 2657 21% | 2176 -1% | 1450 -34% |
| Score Total (Points) | 5138 | 2536 -51% | 2643 -49% | 2143 -58% | 5175 1% | 4950 -4% | 3177 -38% |
| Copy ISO MB/s (MB/s) | 2334 | 1284 -45% | 1481 -37% | 675 -71% | 1539 -34% | ||
| Copy Program MB/s (MB/s) | 569 | 401.9 -29% | 467.5 -18% | 248.4 -56% | 513 -10% | ||
| Copy Game MB/s (MB/s) | 1401 | 1013 -28% | 734 -48% | 535 -62% | 1150 -18% | ||
| Totalt genomsnitt (program/inställningar) | -41% /
-46% | -35% /
-38% | -32% /
-35% | -11% /
-10% | -11% /
-12% | -31% /
-36% |
* ... mindre är bättre

Kontinuerlig inläsning: DiskSpd Read Loop, Queue Depth 8
| 3DMark 11 Performance | 18163 poäng | |
| 3DMark Cloud Gate Standard Score | 36138 poäng | |
| 3DMark Fire Strike Score | 14290 poäng | |
| 3DMark Time Spy Score | 6038 poäng | |
Hjälp | ||
| 3DMark 11 - 1280x720 Performance GPU | |
| Genomsnitt av klass Gaming (21841 - 80022, n=106, senaste 2 åren) | |
| Gigabyte Aero 15 OLED XB-8DE51B0SP | |
| MSI GS66 10SGS | |
| Dell G5 15 SE 5505 P89F | |
| MSI GS66 Stealth 10SFS | |
| Razer Blade 15 RZ09-0328 | |
| Lenovo Legion 5 15IMH05H | |
| Asus TUF Gaming A15 FA506IV-HN172 | |
| MSI GS66 Stealth 10SE-045 | |
| Schenker XMG Core 15 GK5CP6V | |
| Razer Blade 15 GTX 1660 Ti | |
| The Witcher 3 - 1920x1080 Ultra Graphics & Postprocessing (HBAO+) | |
| Genomsnitt av klass Gaming (95 - 240, n=7, senaste 2 åren) | |
| Gigabyte Aero 15 OLED XB-8DE51B0SP | |
| MSI GS66 10SGS | |
| MSI GS66 Stealth 10SFS | |
| Lenovo Legion 5 15IMH05H | |
| Dell G5 15 SE 5505 P89F | |
| MSI GS66 Stealth 10SE-045 | |
| Razer Blade 15 RZ09-0328 | |
| Asus TUF Gaming A15 FA506IV-HN172 | |
| Schenker XMG Core 15 GK5CP6V | |
| Razer Blade 15 GTX 1660 Ti | |
| BioShock Infinite - 1920x1080 Ultra Preset, DX11 (DDOF) | |
| Lenovo Legion 5 15IMH05H | |
| MSI GS66 Stealth 10SE-045 | |
| Razer Blade 15 GTX 1660 Ti | |
| Asus TUF Gaming A15 FA506IV-HN172 | |
| Metro Exodus - 1920x1080 Ultra Quality AF:16x | |
| Gigabyte Aero 15 OLED XB-8DE51B0SP | |
| MSI GS66 10SGS | |
| Dell G5 15 SE 5505 P89F | |
| MSI GS66 Stealth 10SE-045 | |
| Far Cry 5 - 1920x1080 Ultra Preset AA:T | |
| Genomsnitt av klass Gaming (70 - 151, n=8, senaste 2 åren) | |
| MSI GS66 Stealth 10SE-045 | |
| Lenovo Legion 5 15IMH05H | |
| Call of Duty Modern Warfare 2019 - 1920x1080 Maximum Settings AA:T2X Filmic SM | |
| Schenker XMG Core 15 GK5CP6V | |
| MSI GS66 Stealth 10SE-045 | |
| Red Dead Redemption 2 - 1920x1080 High Settings | |
| Gigabyte Aero 15 OLED XB-8DE51B0SP | |
| Lenovo Legion 5 15IMH05H | |
| MSI GS66 Stealth 10SE-045 | |
| Schenker XMG Core 15 GK5CP6V | |
| låg | med. | hög | ultra | |
|---|---|---|---|---|
| BioShock Infinite (2013) | 336 | 290 | 268.3 | 135.8 |
| The Witcher 3 (2015) | 280.6 | 196.7 | 117.7 | 63.4 |
| Far Cry 5 (2018) | 128 | 96 | 90 | 86 |
| Shadow of the Tomb Raider (2018) | 114 | 93 | 86 | 77 |
| Metro Exodus (2019) | 140.9 | 69.9 | 53.4 | 42.2 |
| Call of Duty Modern Warfare 2019 (2019) | 143.9 | 97.3 | 80.8 | 70.7 |
| Red Dead Redemption 2 (2019) | 118.5 | 81.9 | 54.9 | 35.1 |
| Doom Eternal (2020) | 209.2 | 136.9 | 124.6 | 121.9 |
| Gears Tactics (2020) | 243.5 | 144.4 | 95.9 | 62.8 |
| F1 2020 (2020) | 230 | 150 | 131 | 93 |
| Death Stranding (2020) | 146.6 | 102 | 93.1 | 91 |
Ljudnivå
| Låg belastning |
| 29 / 30 / 40 dB(A) |
| Hög belastning |
| 51 / 54 dB(A) |
 | ||
30 dB tyst 40 dB(A) hörbar 50 dB(A) högt ljud |
||
min: | ||
| MSI GS66 Stealth 10SE-045 i7-10750H, GeForce RTX 2060 Mobile | MSI GS66 Stealth 10SFS i9-10980HK, GeForce RTX 2070 Super Max-Q | Razer Blade 15 GTX 1660 Ti i7-9750H, GeForce GTX 1660 Ti Mobile | Dell G5 15 SE 5505 P89F R7 4800H, Radeon RX 5600M | Lenovo Legion 5 15IMH05H i5-10300H, GeForce RTX 2060 Mobile | Asus TUF Gaming A15 FA506IV-HN172 R7 4800H, GeForce RTX 2060 Mobile | Schenker XMG Core 15 GK5CP6V i7-9750H, GeForce GTX 1660 Ti Mobile | Genomsnitt av klass Gaming | |
|---|---|---|---|---|---|---|---|---|
| Noise | -6% | 4% | 11% | 4% | 4% | -0% | 11% | |
| av / miljö * (dB) | 25 | 30 -20% | 28.5 -14% | 28 -12% | 30.7 -23% | 30.2 -21% | 30 -20% | 24.1 ? 4% |
| Idle Minimum * (dB) | 29 | 32 -10% | 30.3 -4% | 28 3% | 30.7 -6% | 30.2 -4% | 30 -3% | 25.9 ? 11% |
| Idle Average * (dB) | 30 | 34 -13% | 30.5 -2% | 28 7% | 30.7 -2% | 30.2 -1% | 31 -3% | 27.5 ? 8% |
| Idle Maximum * (dB) | 40 | 39 2% | 30.5 24% | 28 30% | 30.7 23% | 30.2 24% | 33 17% | 30 ? 25% |
| Load Average * (dB) | 51 | 53 -4% | 41 20% | 28 45% | 36.6 28% | 40 22% | 48 6% | 43 ? 16% |
| Witcher 3 ultra * (dB) | 48 | 48 -0% | 48 -0% | 50.6 -5% | 47 2% | 49 -2% | 51 -6% | |
| Load Maximum * (dB) | 54 | 53 2% | 51.9 4% | 50.6 6% | 50.9 6% | 49 9% | 51 6% | 54.2 ? -0% |
* ... mindre är bättre
(-) Den maximala temperaturen på ovansidan är 53 °C / 127 F, jämfört med genomsnittet av 40.4 °C / 105 F , allt från 21.2 till 68.8 °C för klassen Gaming.
(-) Botten värms upp till maximalt 53 °C / 127 F, jämfört med genomsnittet av 43.2 °C / 110 F
(+) Vid tomgångsbruk är medeltemperaturen för ovansidan 27.4 °C / 81 F, jämfört med enhetsgenomsnittet på 33.9 °C / ### class_avg_f### F.
(-) När du spelar The Witcher 3 är medeltemperaturen för ovansidan 42.6 °C / 109 F, jämfört med enhetsgenomsnittet på 33.9 °C / ## #class_avg_f### F.
(+) Handledsstöden och pekplattan når maximal hudtemperatur (35 °C / 95 F) och är därför inte varma.
(-) Medeltemperaturen för handledsstödsområdet på liknande enheter var 28.8 °C / 83.8 F (-6.2 °C / -11.2 F).
| MSI GS66 Stealth 10SE-045 i7-10750H, GeForce RTX 2060 Mobile | MSI GS66 Stealth 10SFS i9-10980HK, GeForce RTX 2070 Super Max-Q | Razer Blade 15 GTX 1660 Ti i7-9750H, GeForce GTX 1660 Ti Mobile | Dell G5 15 SE 5505 P89F R7 4800H, Radeon RX 5600M | Lenovo Legion 5 15IMH05H i5-10300H, GeForce RTX 2060 Mobile | Asus TUF Gaming A15 FA506IV-HN172 R7 4800H, GeForce RTX 2060 Mobile | Schenker XMG Core 15 GK5CP6V i7-9750H, GeForce GTX 1660 Ti Mobile | Genomsnitt av klass Gaming | |
|---|---|---|---|---|---|---|---|---|
| Heat | -0% | -17% | -3% | 8% | 9% | 2% | -1% | |
| Maximum Upper Side * (°C) | 53 | 53 -0% | 52 2% | 53 -0% | 46.3 13% | 42.9 19% | 48 9% | 45.2 ? 15% |
| Maximum Bottom * (°C) | 53 | 55 -4% | 52.2 2% | 57.6 -9% | 44.4 16% | 49.9 6% | 59 -11% | 48.1 ? 9% |
| Idle Upper Side * (°C) | 29 | 28 3% | 38 -31% | 27.4 6% | 28.1 3% | 27.8 4% | 27 7% | 31 ? -7% |
| Idle Bottom * (°C) | 29 | 29 -0% | 40.4 -39% | 31 -7% | 29.4 -1% | 27 7% | 28 3% | 34.4 ? -19% |
* ... mindre är bättre
MSI GS66 Stealth 10SE-045 ljudanalys
(+) | högtalare kan spela relativt högt (86 dB)
Bas 100 - 315 Hz
(-) | nästan ingen bas - i genomsnitt 30.3% lägre än medianen
(±) | linjäriteten för basen är genomsnittlig (8.1% delta till föregående frekvens)
Mellan 400 - 2000 Hz
(±) | högre mellan - i genomsnitt 7.7% högre än median
(±) | linjäriteten för mids är genomsnittlig (7.3% delta till föregående frekvens)
Högsta 2 - 16 kHz
(+) | balanserade toppar - endast 3.3% från medianen
(+) | toppar är linjära (6% delta till föregående frekvens)
Totalt 100 - 16 000 Hz
(±) | linjäriteten för det totala ljudet är genomsnittlig (24% skillnad mot median)
Jämfört med samma klass
» 86% av alla testade enheter i den här klassen var bättre, 4% liknande, 9% sämre
» Den bästa hade ett delta på 6%, genomsnittet var 18%, sämst var 132%
Jämfört med alla testade enheter
» 72% av alla testade enheter var bättre, 6% liknande, 22% sämre
» Den bästa hade ett delta på 4%, genomsnittet var 24%, sämst var 134%
| Av/Standby | |
| Låg belastning | |
| Hög belastning |
|
Förklaring:
min: | |
| MSI GS66 Stealth 10SE-045 i7-10750H, GeForce RTX 2060 Mobile | MSI GS66 Stealth 10SFS i9-10980HK, GeForce RTX 2070 Super Max-Q | Razer Blade 15 GTX 1660 Ti i7-9750H, GeForce GTX 1660 Ti Mobile | Dell G5 15 SE 5505 P89F R7 4800H, Radeon RX 5600M | Lenovo Legion 5 15IMH05H i5-10300H, GeForce RTX 2060 Mobile | Asus TUF Gaming A15 FA506IV-HN172 R7 4800H, GeForce RTX 2060 Mobile | Schenker XMG Core 15 GK5CP6V i7-9750H, GeForce GTX 1660 Ti Mobile | Genomsnitt av klass Gaming | |
|---|---|---|---|---|---|---|---|---|
| Power Consumption | -16% | -41% | 22% | 33% | 22% | 15% | -22% | |
| Idle Minimum * (Watt) | 7 | 13 -86% | 18.7 -167% | 6.5 7% | 3.2 54% | 5.4 23% | 9 -29% | 13.1 ? -87% |
| Idle Average * (Watt) | 18 | 16 11% | 30.7 -71% | 10.6 41% | 8.3 54% | 10 44% | 12 33% | 18.8 ? -4% |
| Idle Maximum * (Watt) | 31 | 27 13% | 33.9 -9% | 11 65% | 8.7 72% | 10.5 66% | 18 42% | 24.4 ? 21% |
| Load Average * (Watt) | 107 | 109 -2% | 93.4 13% | 84.1 21% | 82 23% | 135 -26% | 86 20% | 108.6 ? -1% |
| Witcher 3 ultra * (Watt) | 146 | 155 -6% | 158.9 -9% | 152.9 -5% | 151 -3% | 144 1% | 126 14% | |
| Load Maximum * (Watt) | 186 | 236 -27% | 195.3 -5% | 180.4 3% | 195 -5% | 147 21% | 173 7% | 255 ? -37% |
* ... mindre är bättre
| MSI GS66 Stealth 10SE-045 i7-10750H, GeForce RTX 2060 Mobile, 99.9 Wh | Dell G5 15 SE 5505 P89F R7 4800H, Radeon RX 5600M, 51 Wh | Lenovo Legion 5 15IMH05H i5-10300H, GeForce RTX 2060 Mobile, 60 Wh | Asus TUF Gaming A15 FA506IV-HN172 R7 4800H, GeForce RTX 2060 Mobile, 48 Wh | Schenker XMG Core 15 GK5CP6V i7-9750H, GeForce GTX 1660 Ti Mobile, 46 Wh | MSI GS66 10SGS i7-10750H, GeForce RTX 2080 Super Max-Q, 99.99 Wh | MSI GS66 Stealth 10SFS i9-10980HK, GeForce RTX 2070 Super Max-Q, 99.99 Wh | Razer Blade 15 GTX 1660 Ti i7-9750H, GeForce GTX 1660 Ti Mobile, 65 Wh | Genomsnitt av klass Gaming | |
|---|---|---|---|---|---|---|---|---|---|
| Batteridrifttid | 15% | 32% | 12% | -39% | 18% | 10% | -14% | 17% | |
| Reader / Idle (h) | 9 | 11.2 24% | 14.1 57% | 9.8 9% | 6.1 -32% | 10.2 13% | 8.4 -7% | 8.71 ? -3% | |
| H.264 (h) | 6.6 | 9.2 39% | 5.4 -18% | 8.9 ? 35% | |||||
| WiFi v1.3 (h) | 6.4 | 6.2 -3% | 7.2 13% | 6.2 -3% | 3.6 -44% | 6.9 8% | 6.1 -5% | 5.5 -14% | 6.98 ? 9% |
| Load (h) | 1.2 | 1.5 25% | 1.4 17% | 1.9 58% | 0.7 -42% | 1.6 33% | 1.7 42% | 1.51 ? 26% |
För
Emot
Läs den fullständiga versionen av den här recensionen på engelska här.
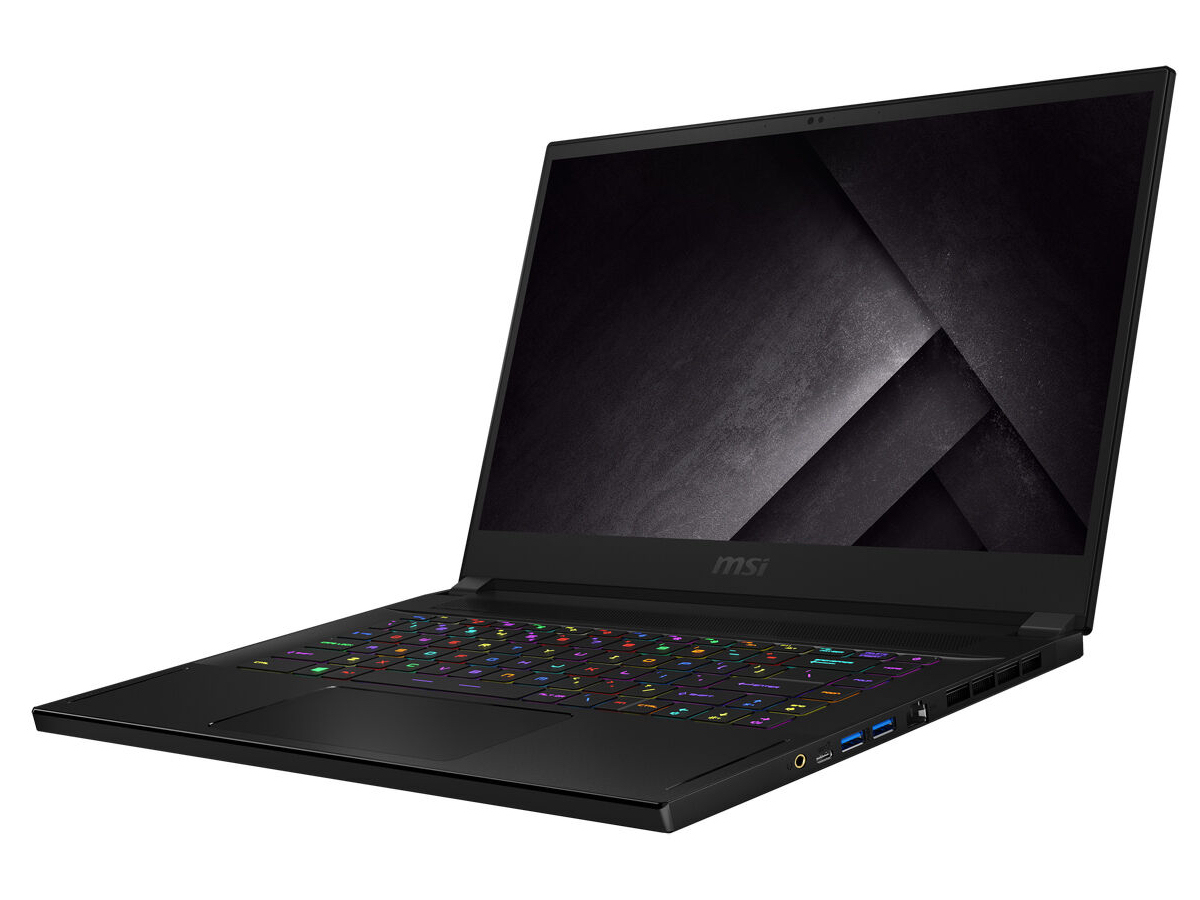
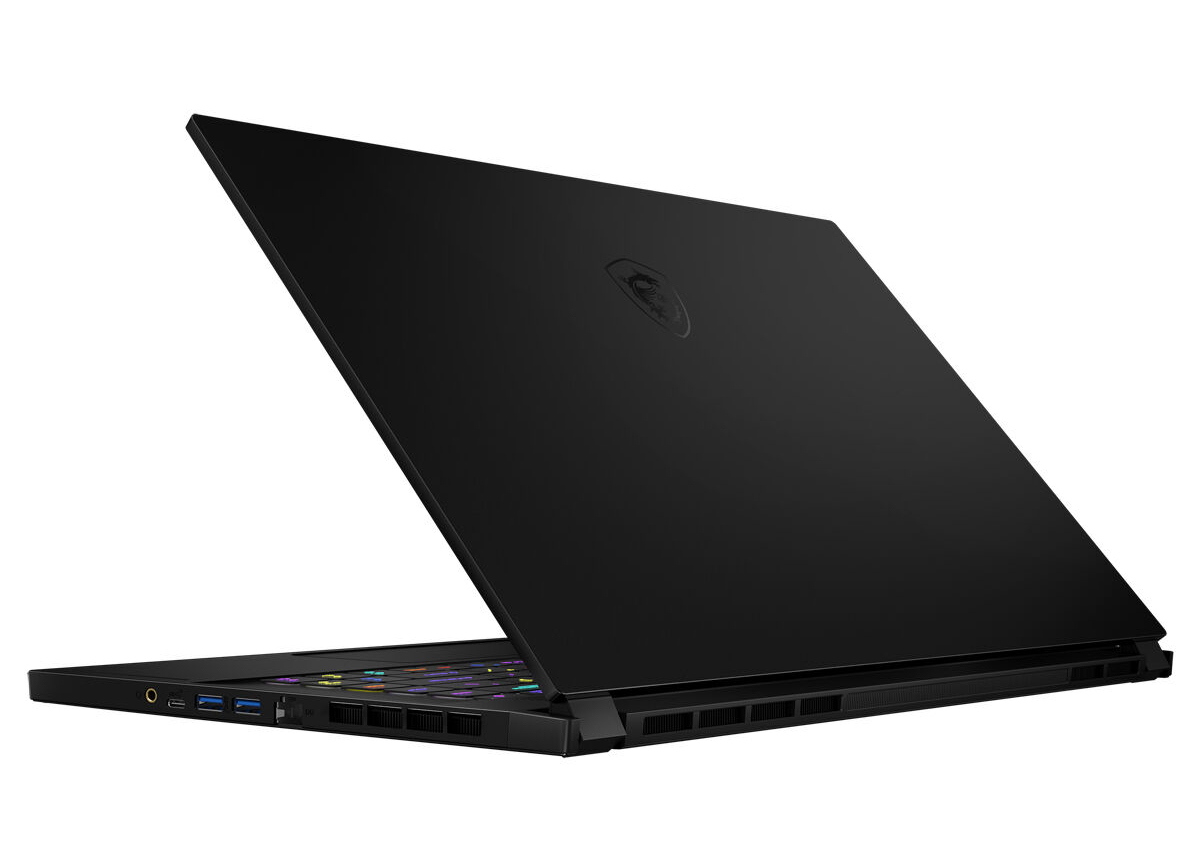
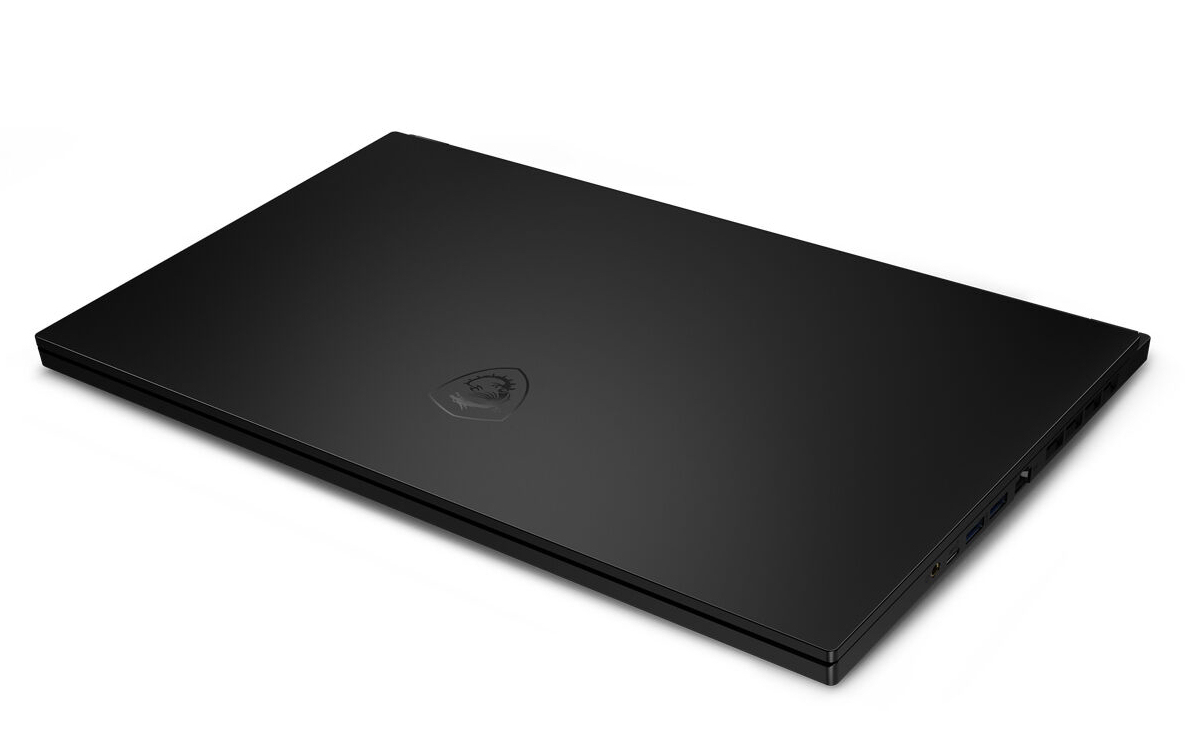
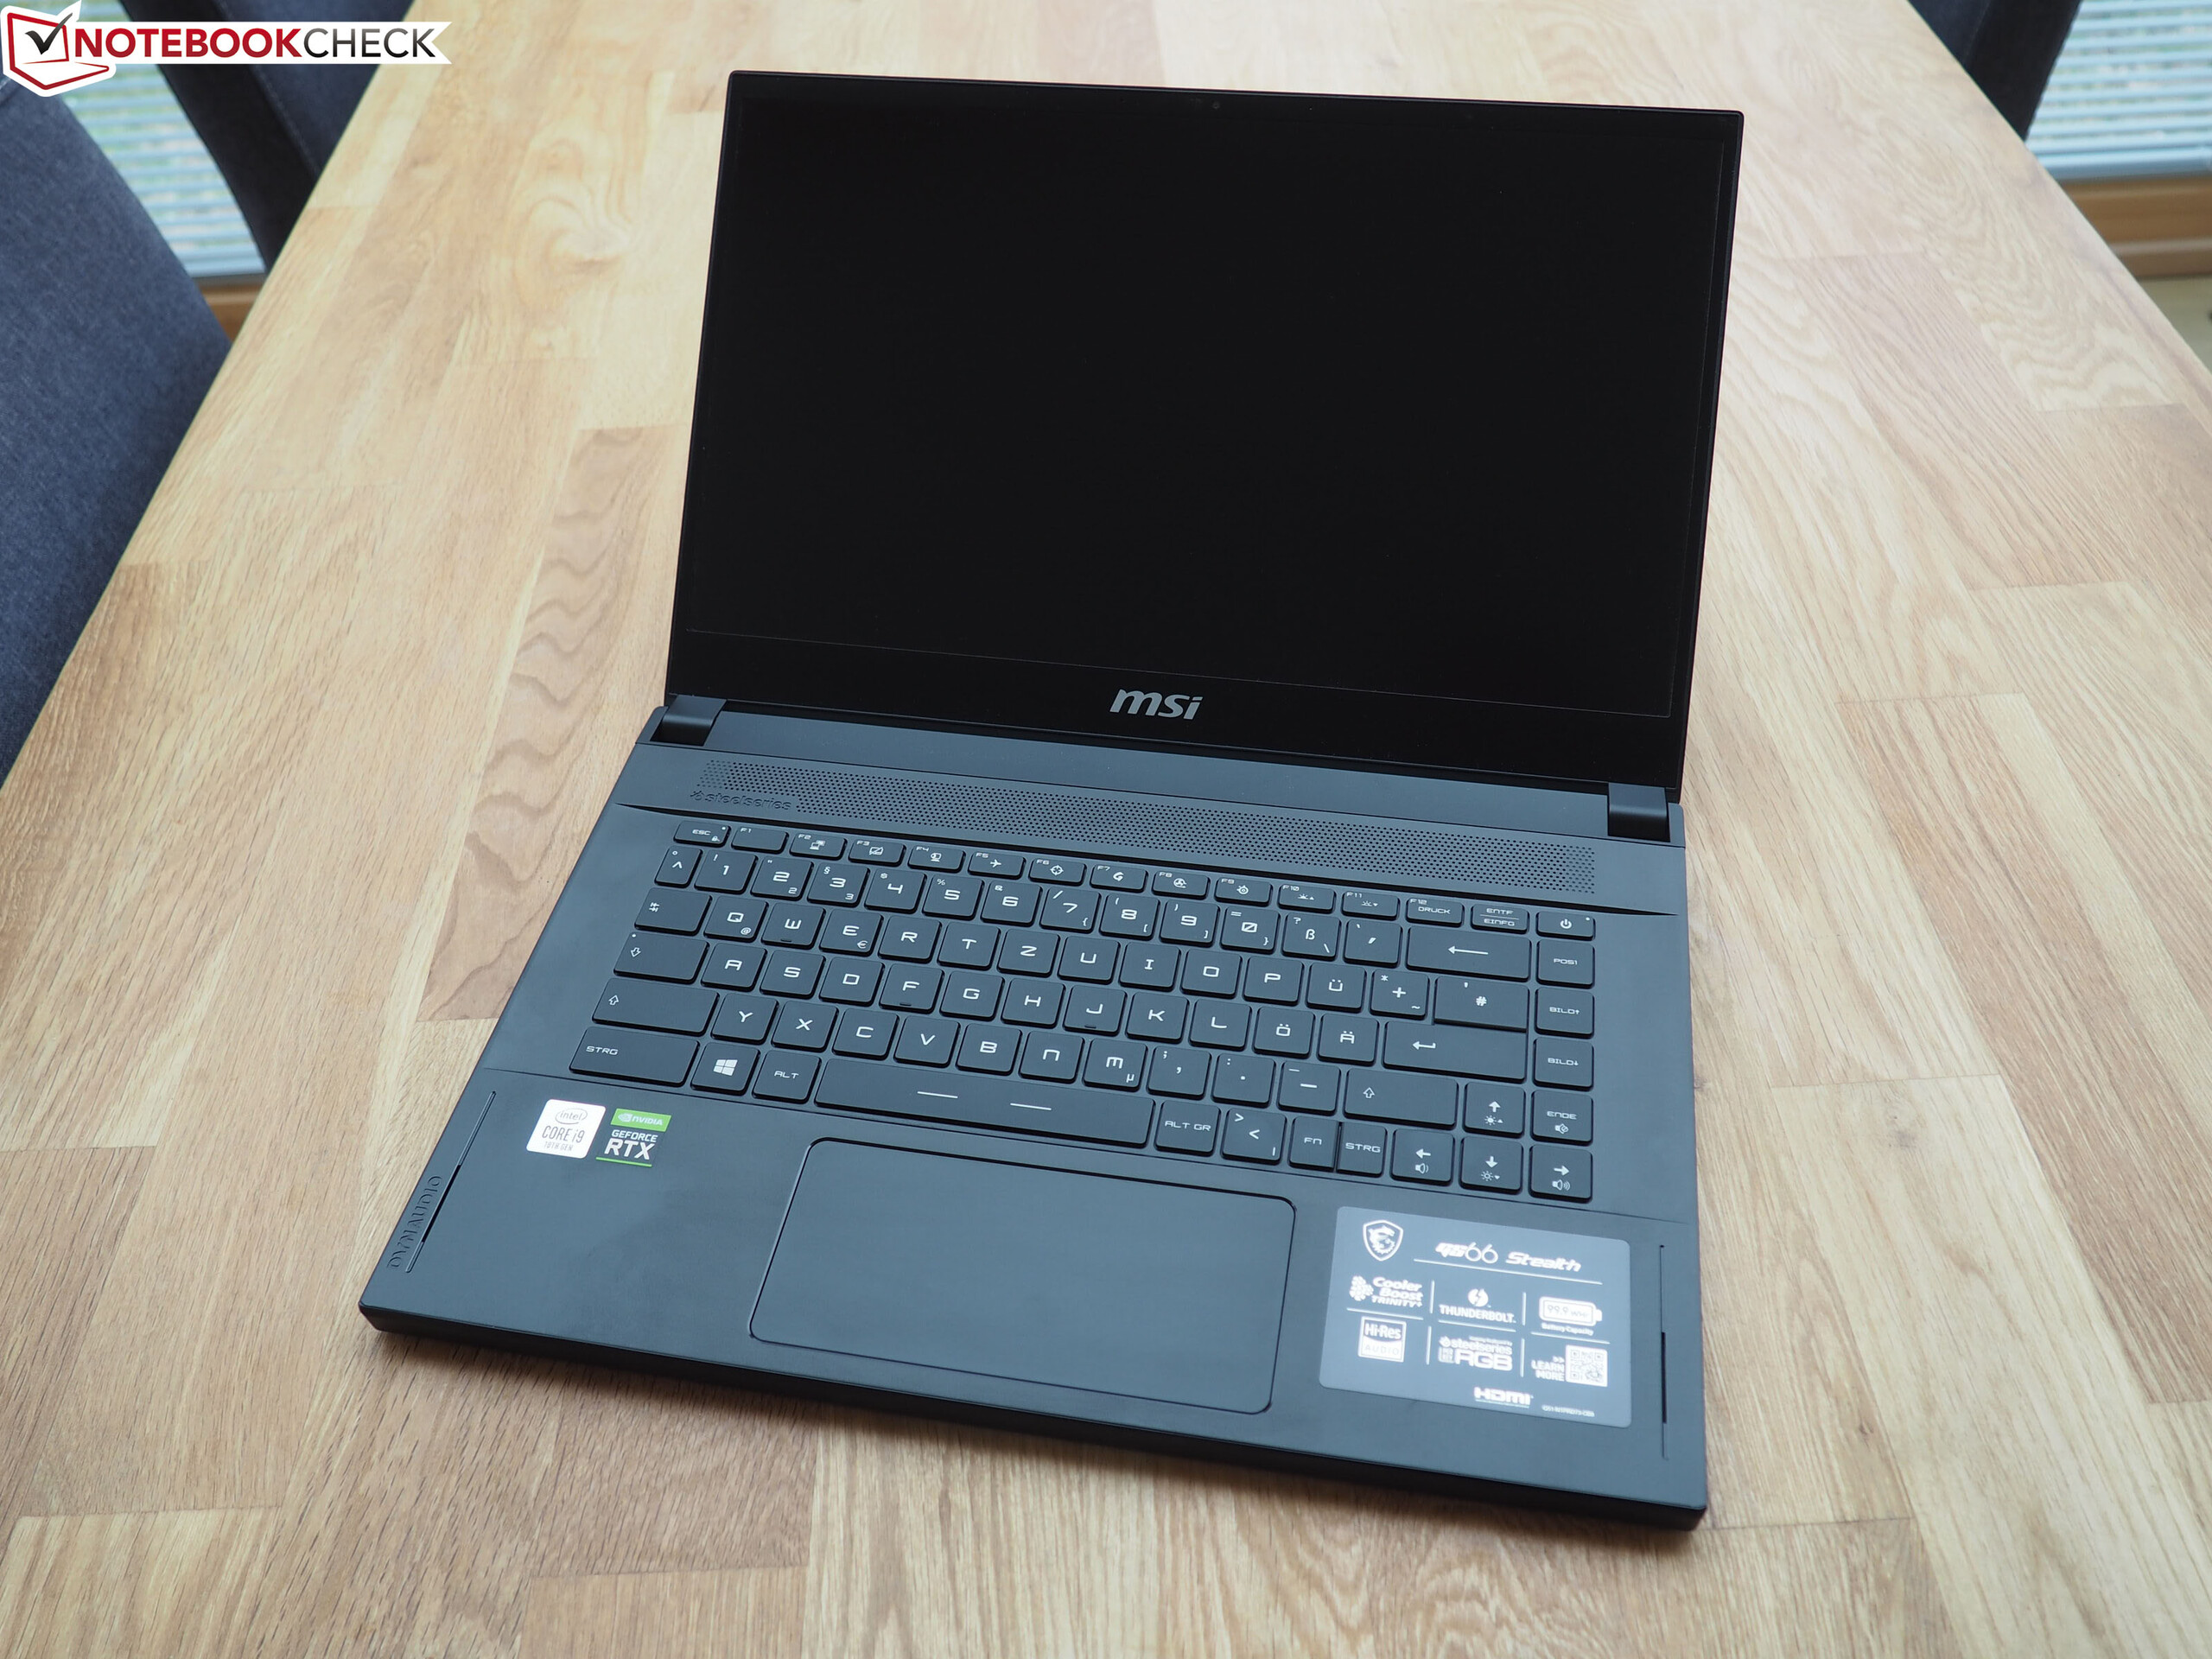
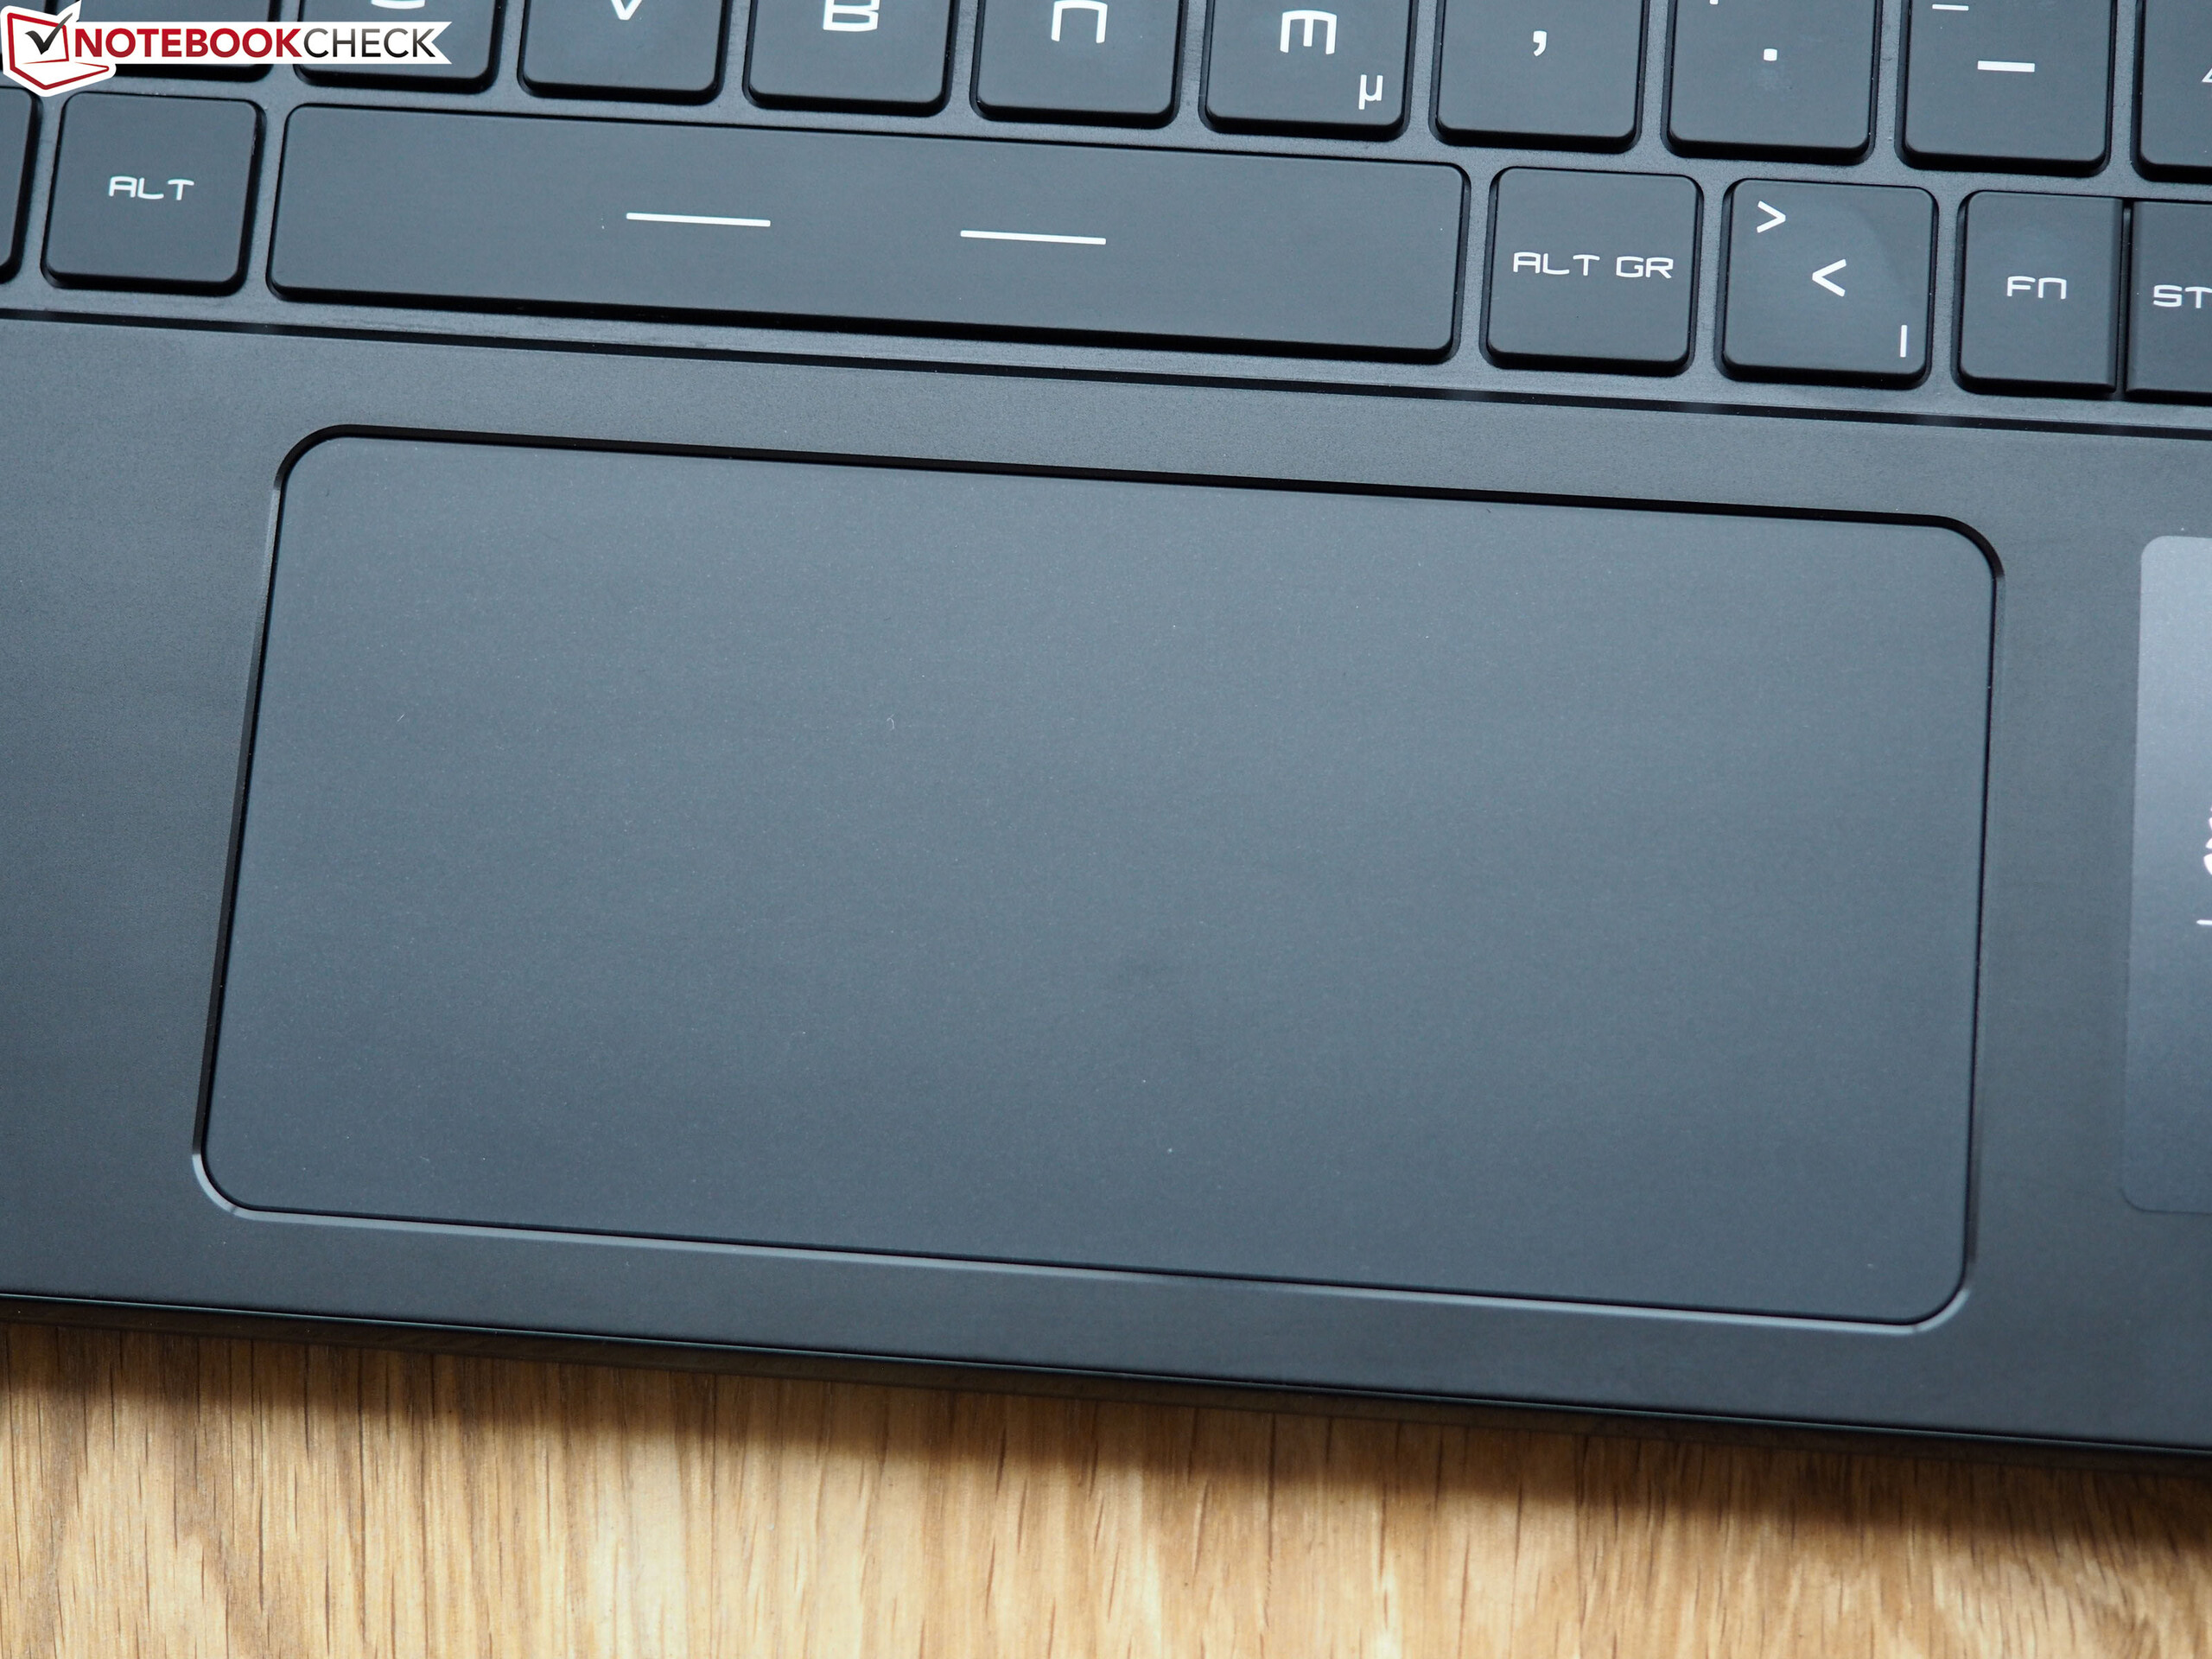
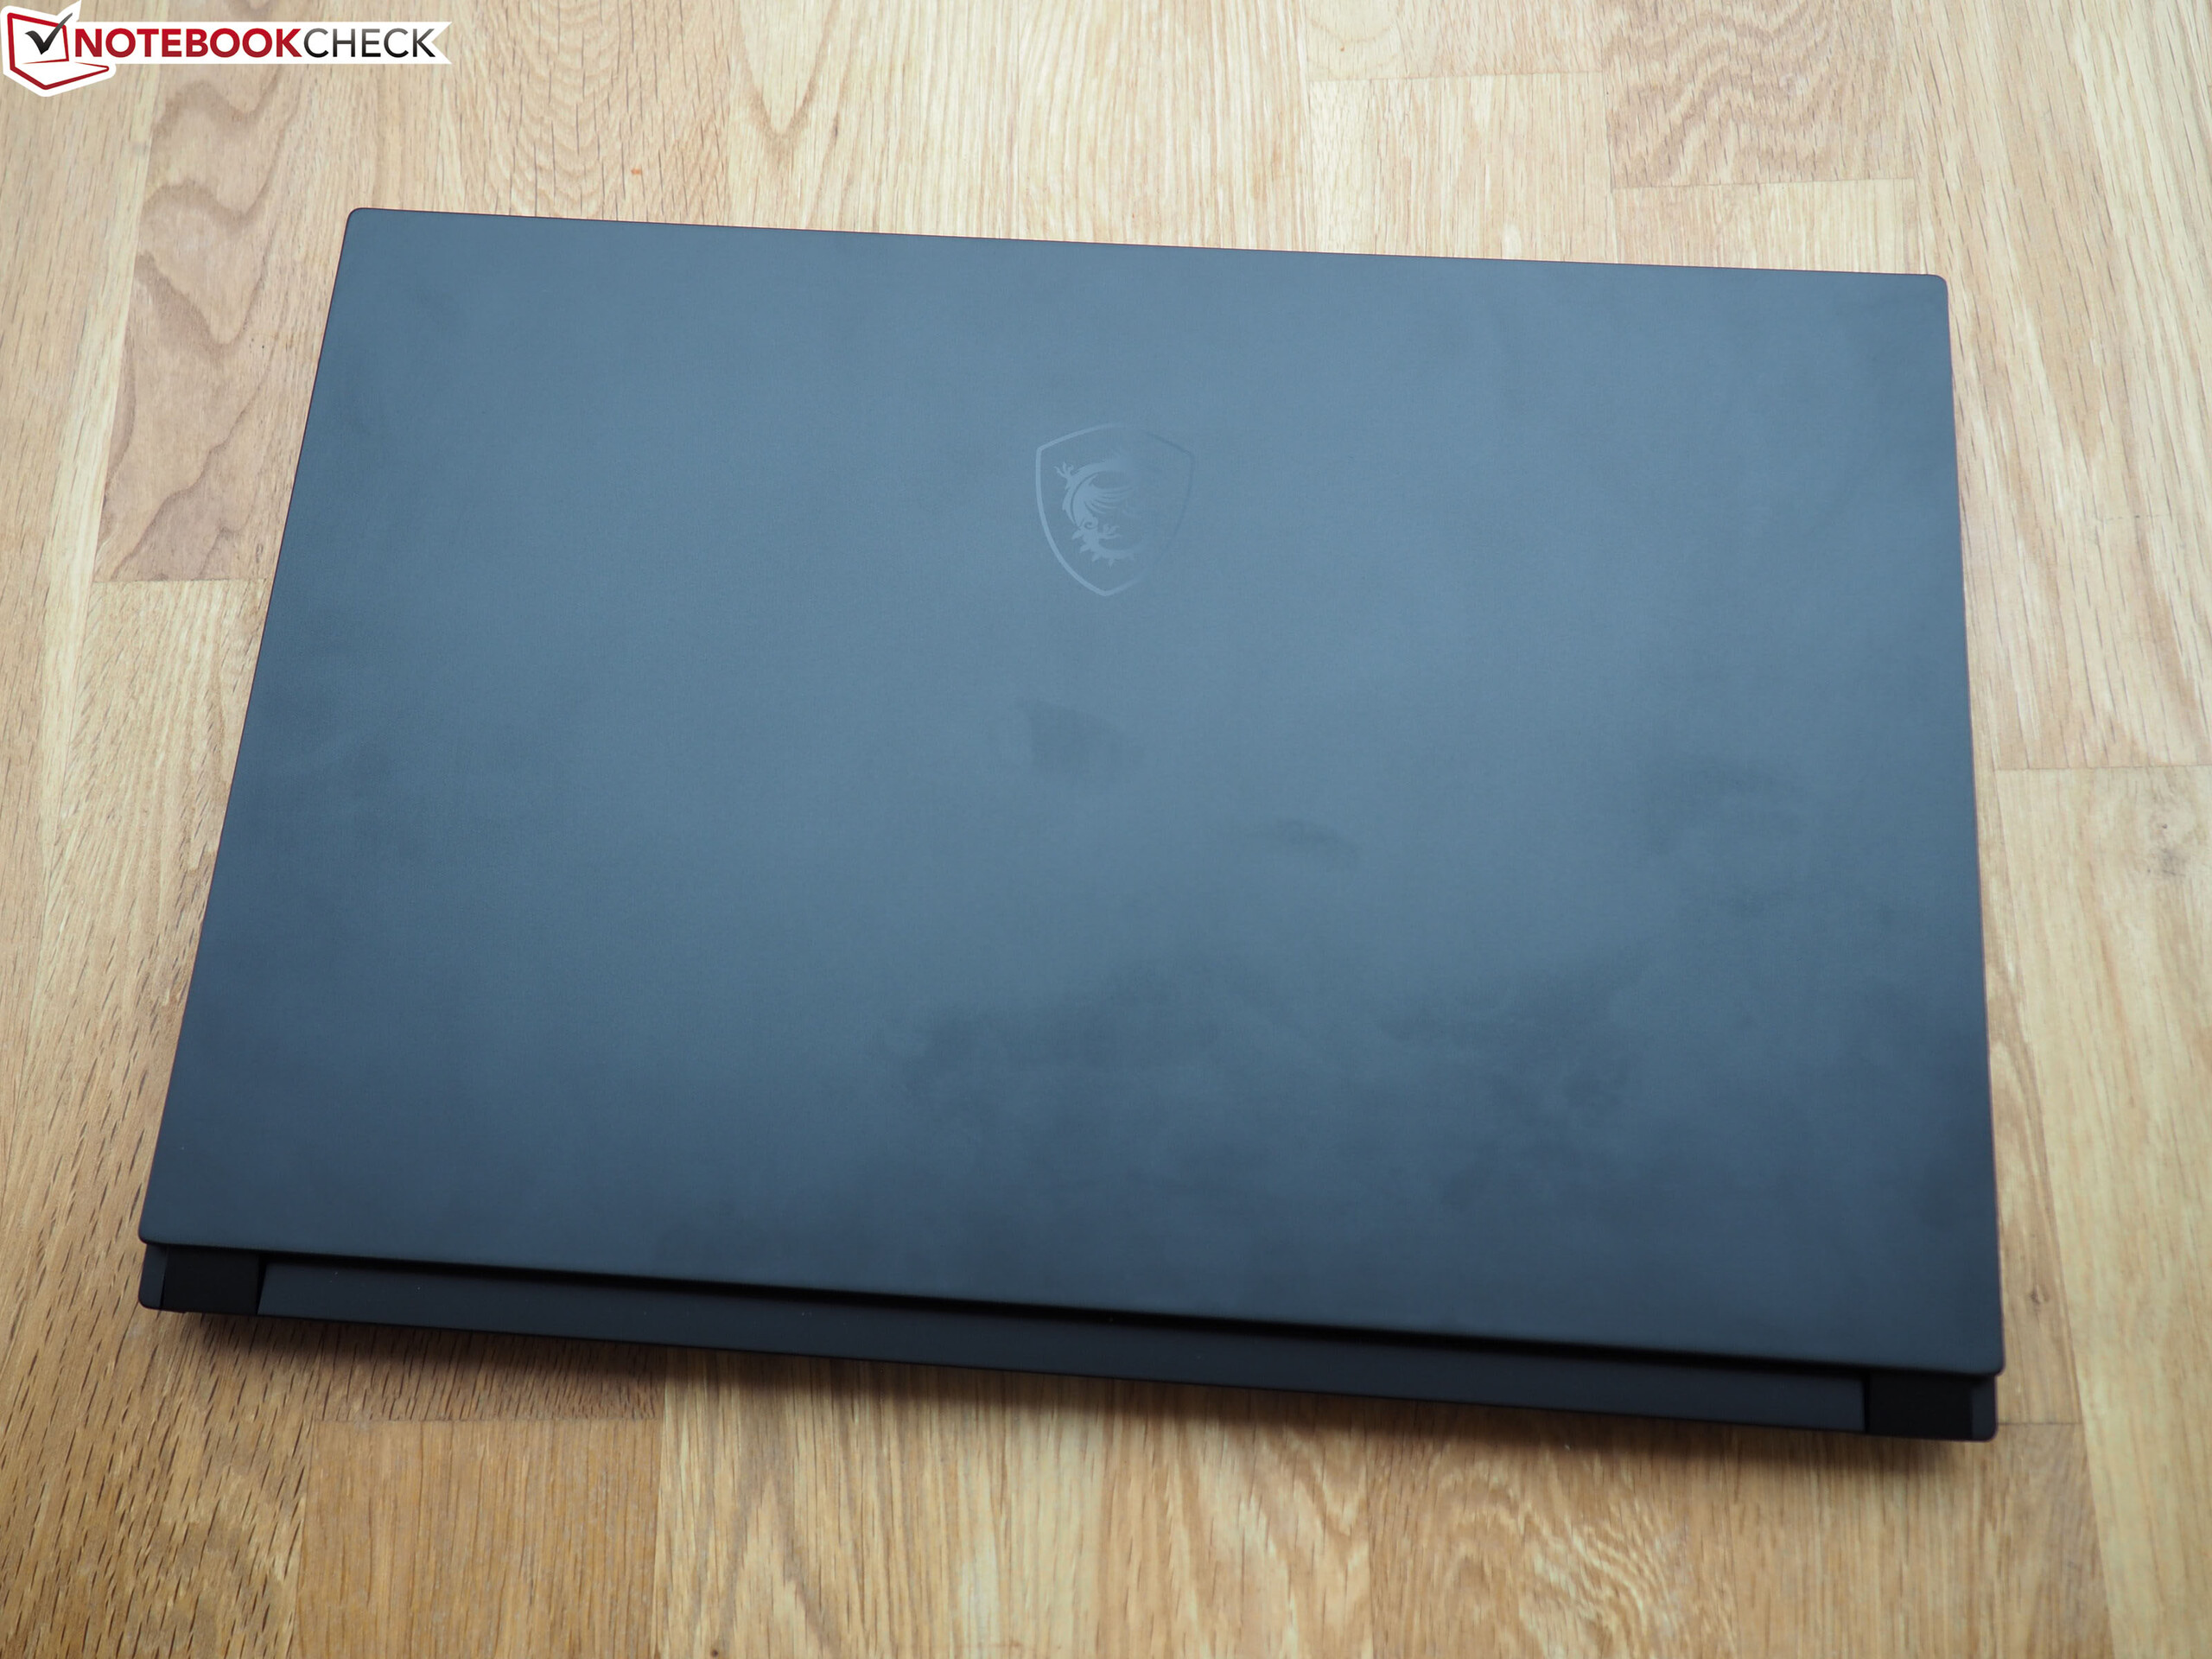
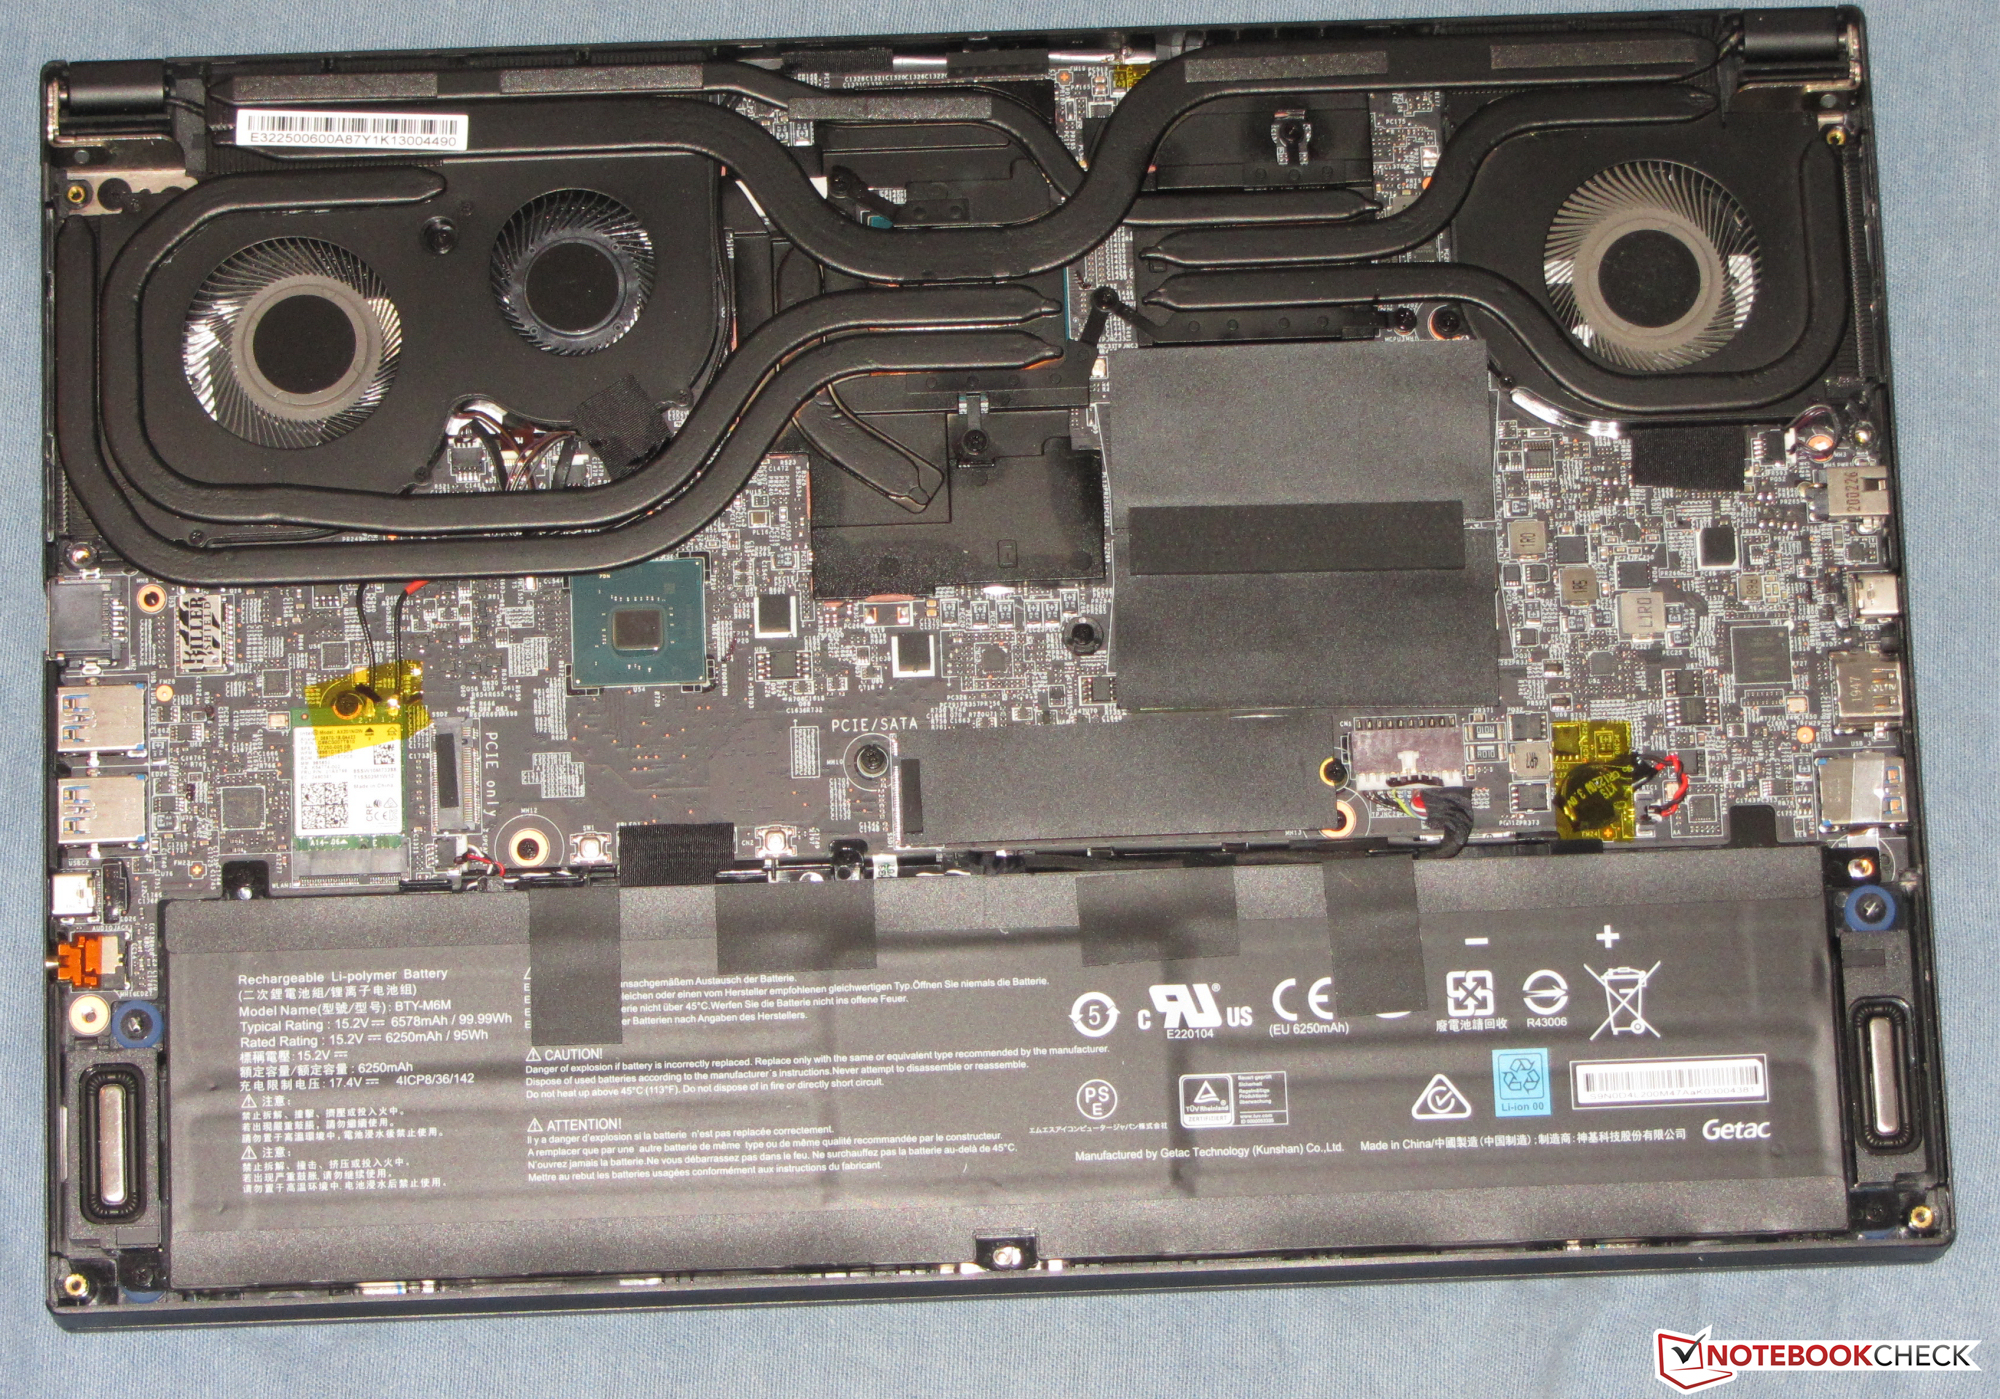
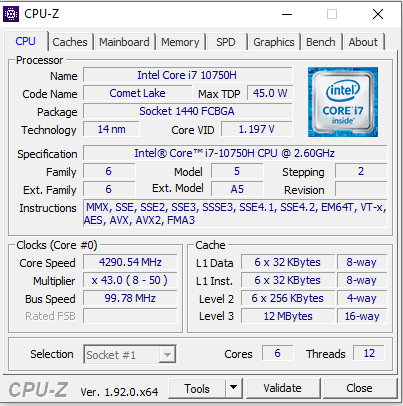
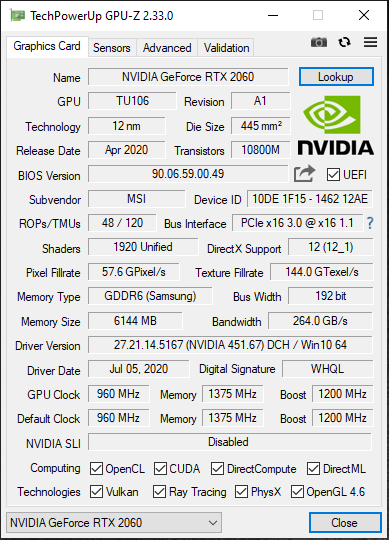
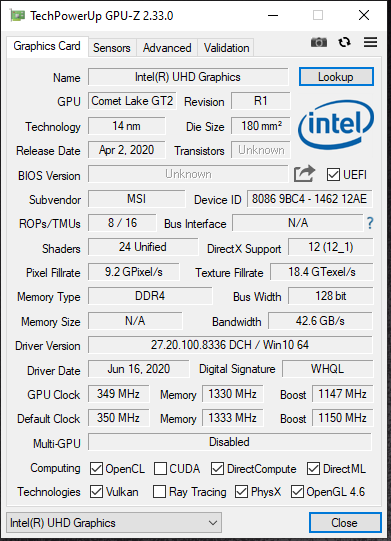
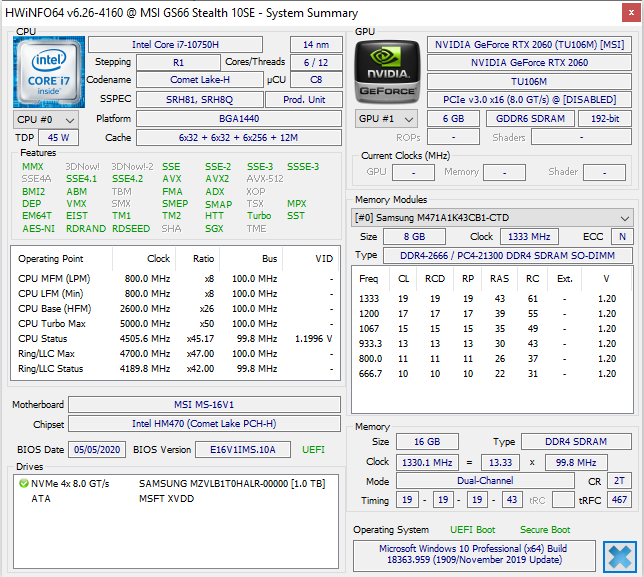
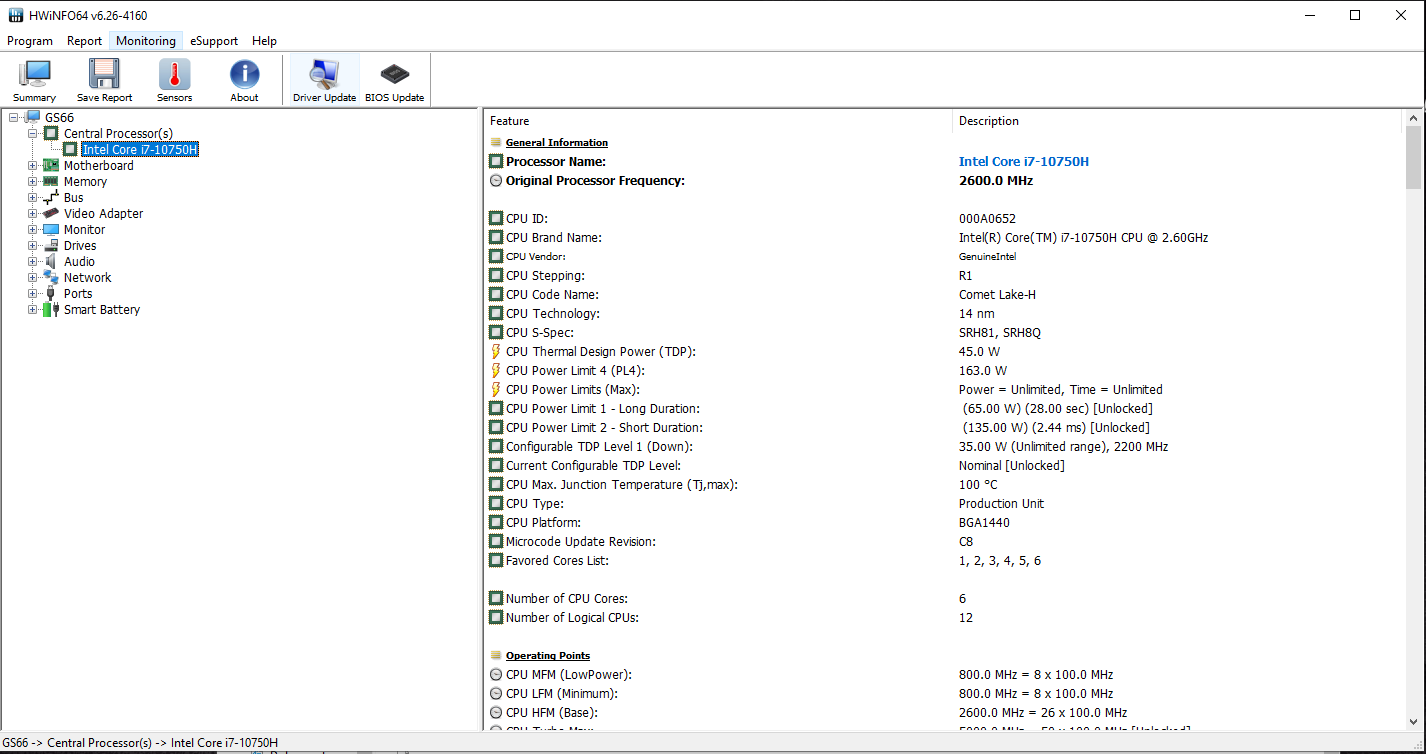
MSI GS66 har ett tjusigt och kompakt metallhölje som visade sig högst mottagligt för fingeravtryck. I chassit sitter en Core i7-10750H CPU och en GeForce RTX 2060 GPU som tillsammans kan visa alla moderna datorspel smidigt på den matta Full HD-skärmen. Det går alltid att välja höga eller maximala grafikinställningar.
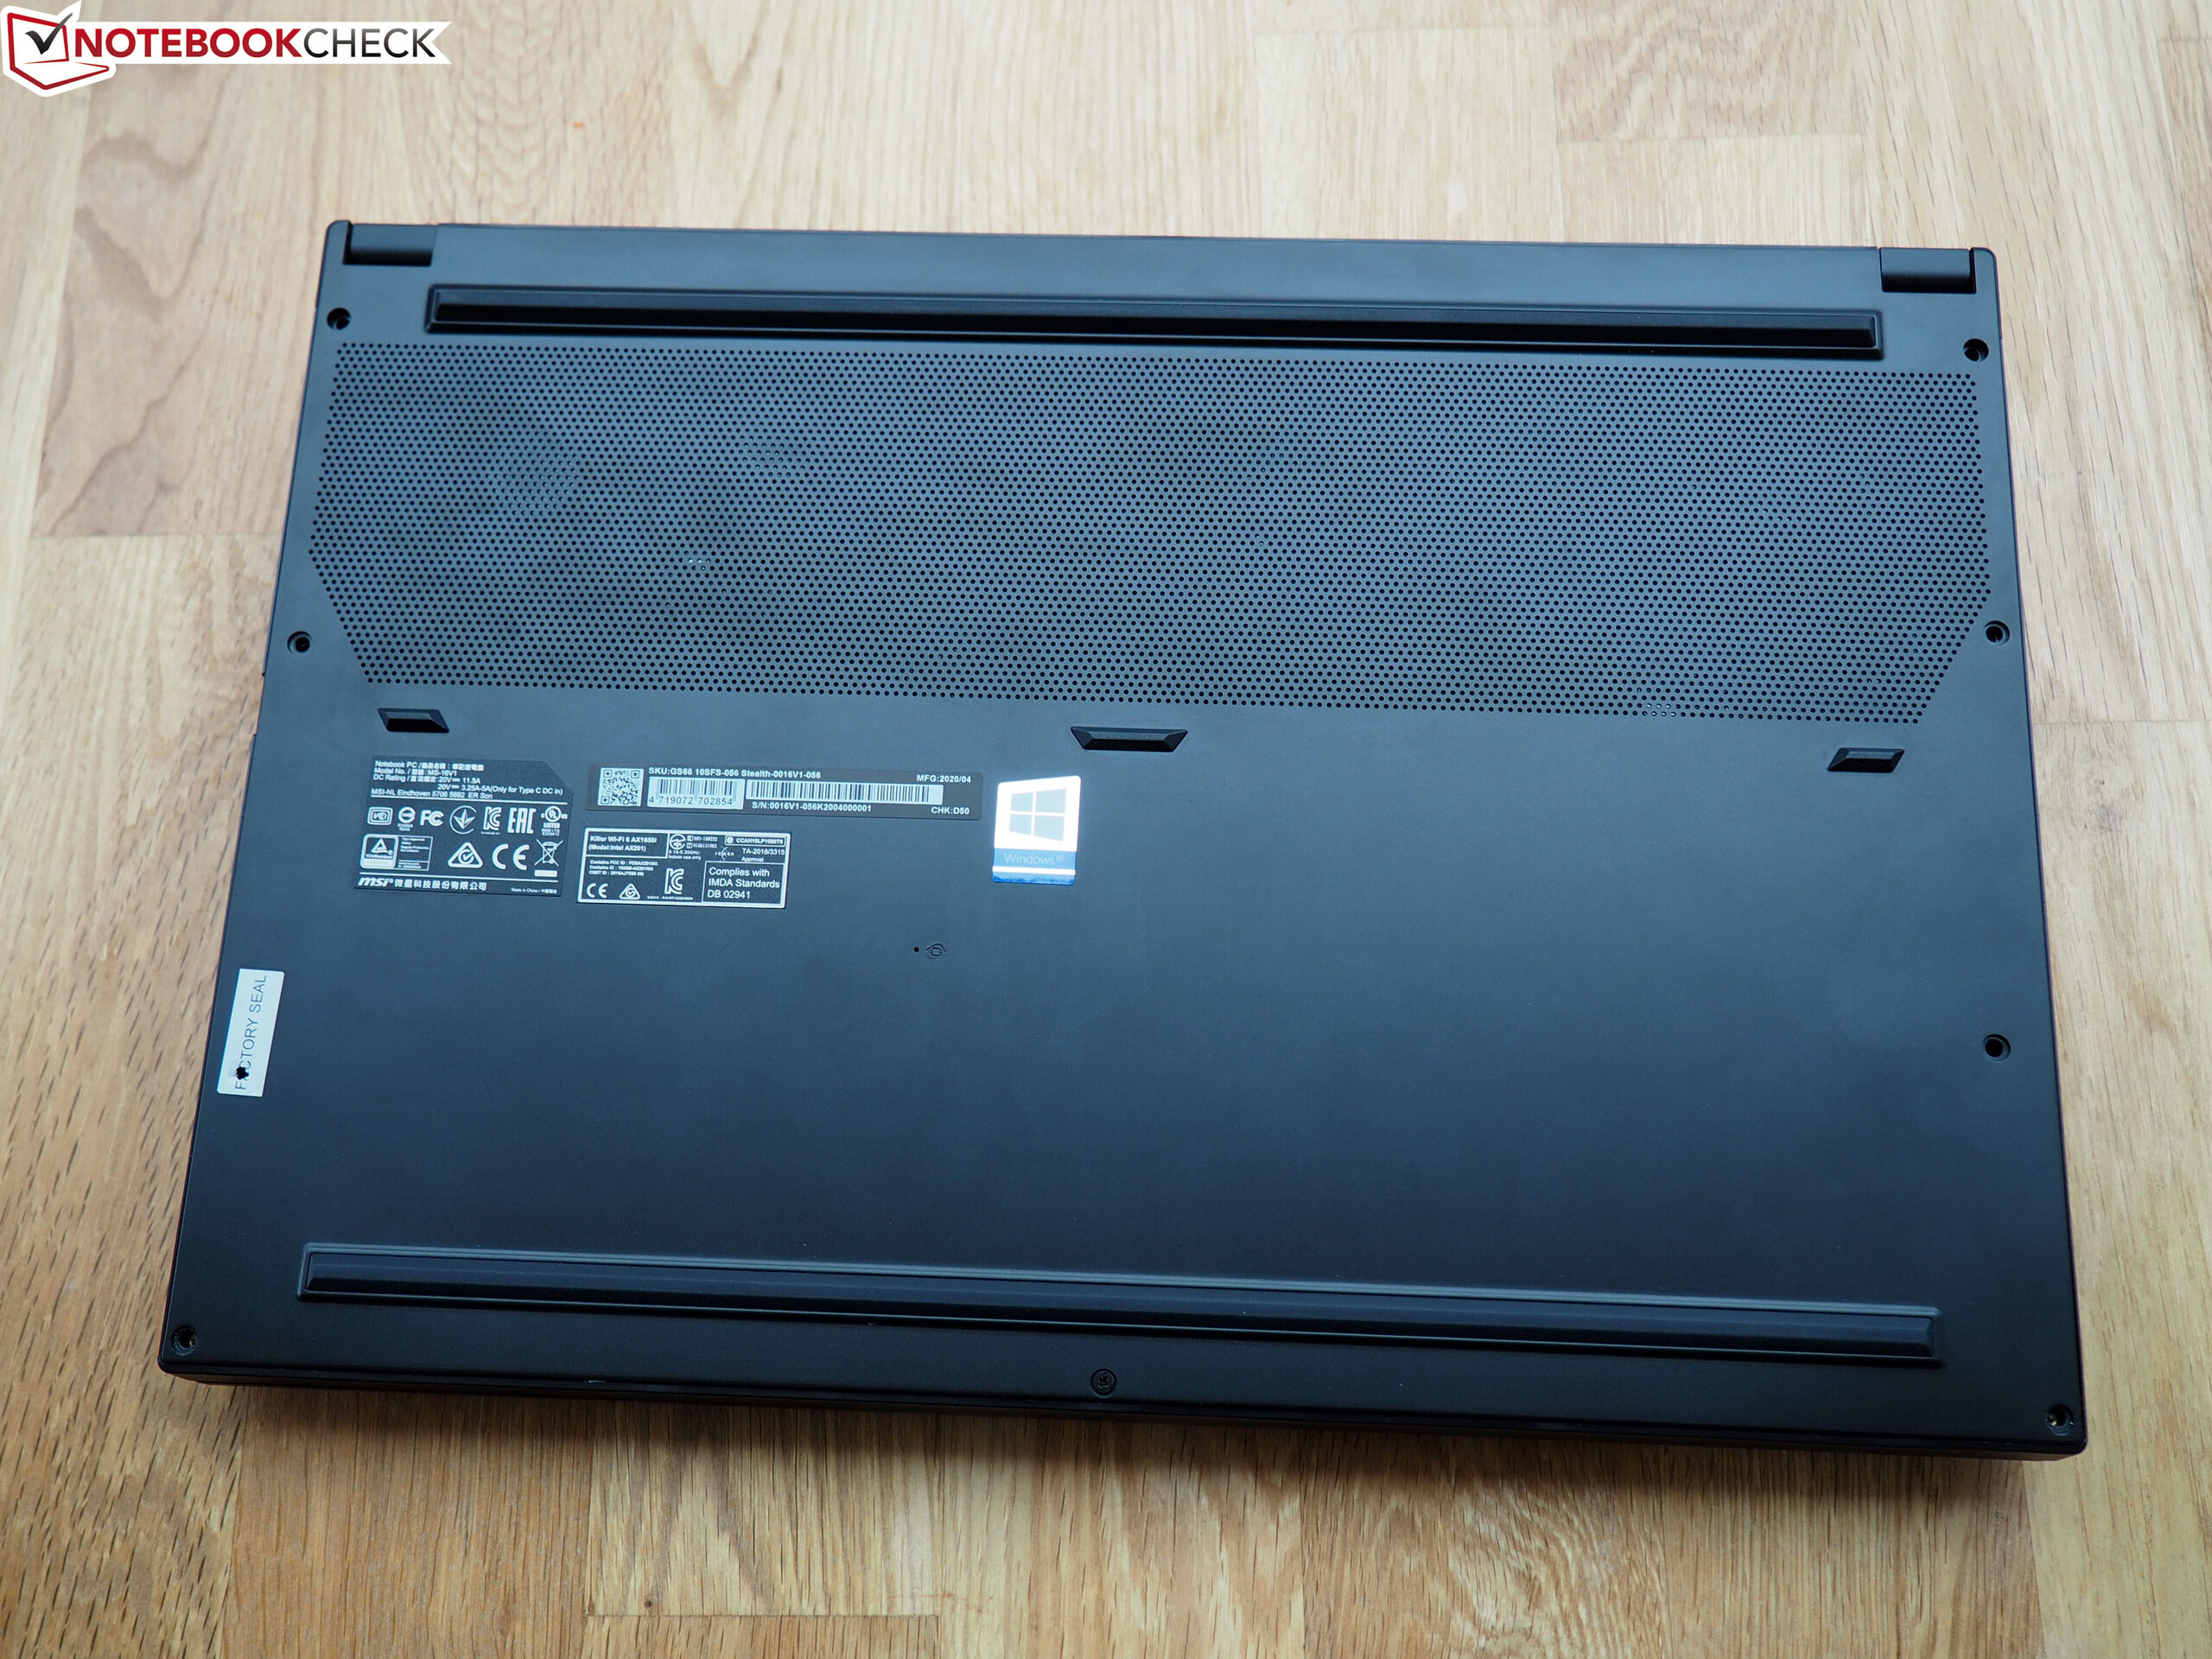
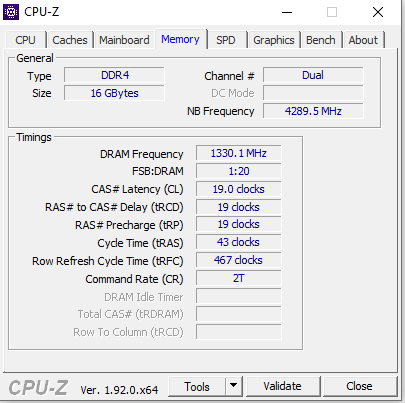
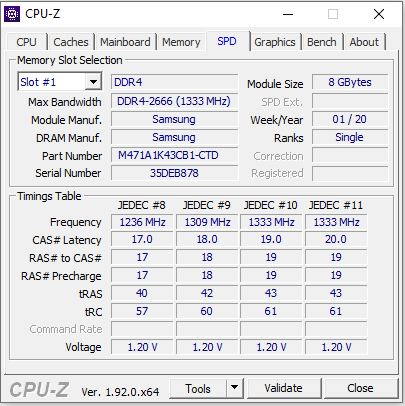
Hårdvaran har tillgång till 16 GB RAM (med dubbla kanaler). Det är möjligt att uppgradera till 64 GB. En snabb NVMe SSD-enhet på 1 TB ger tillräckligt med lagringsutrymme. Skulle lagringen ta slut går det att utöka datorn med en andra NVMe SSD. Service eller uppgraderingar kräver dock att höljets undersida avlägsnas.
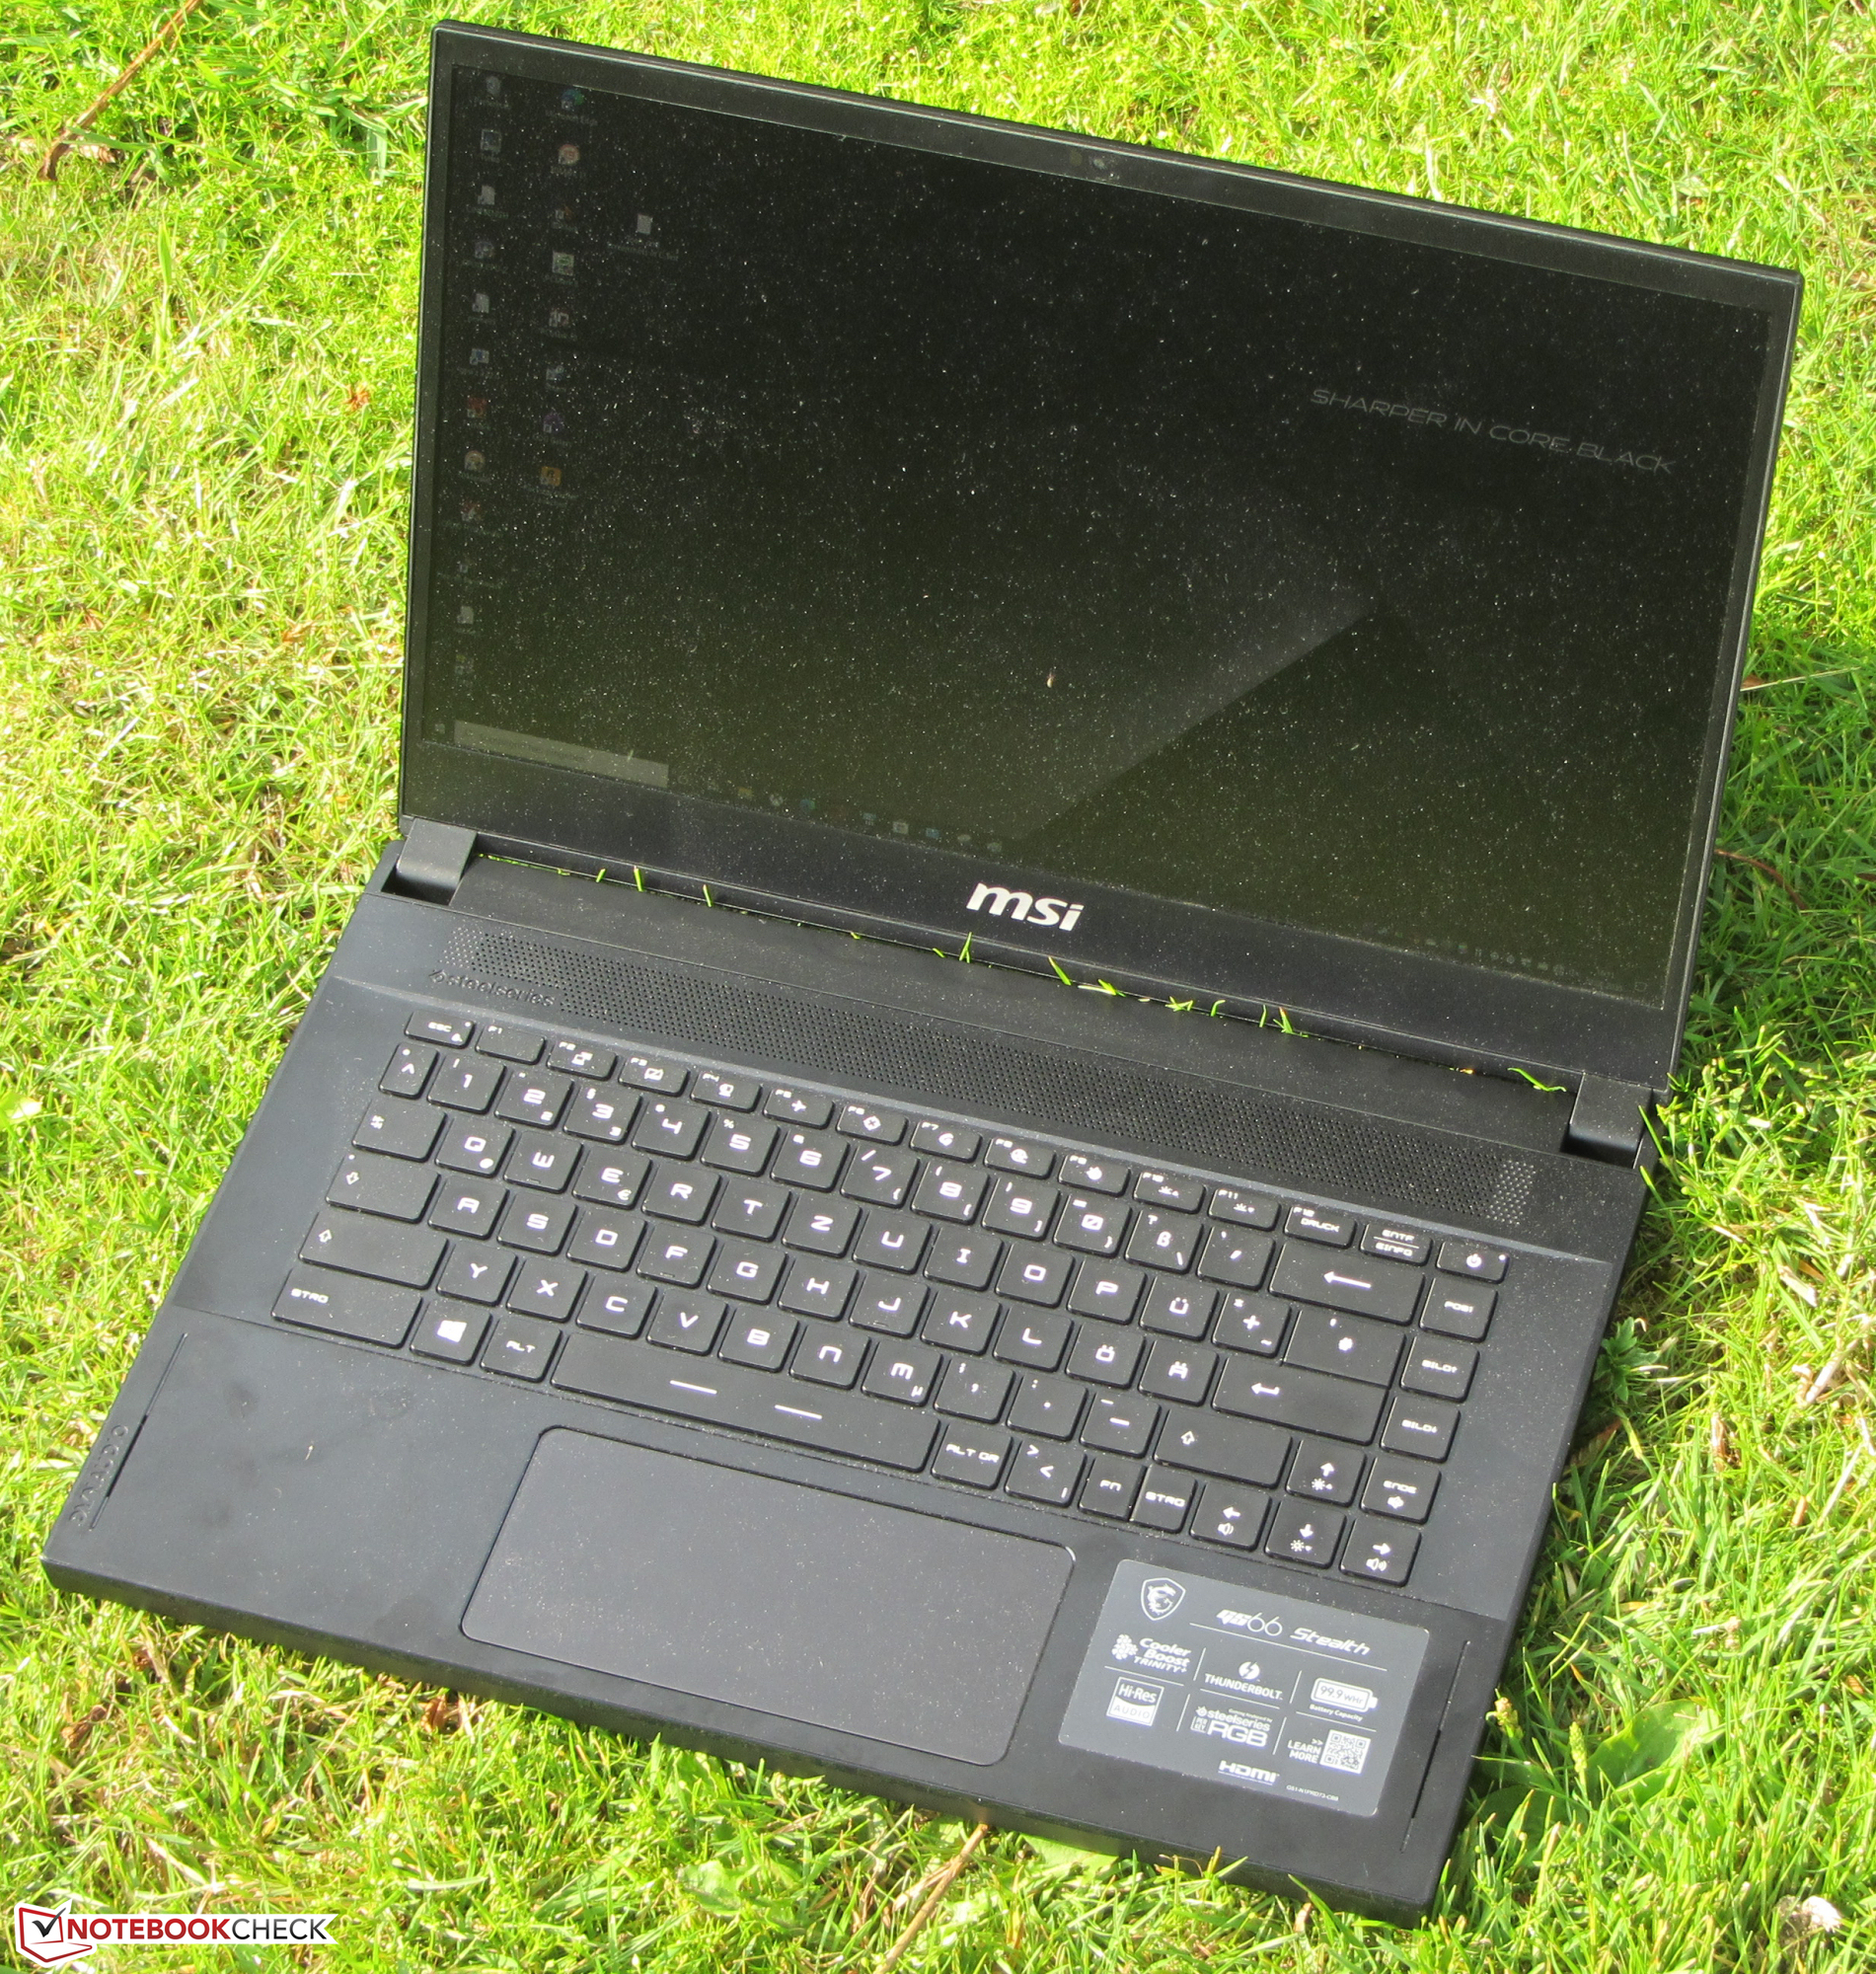
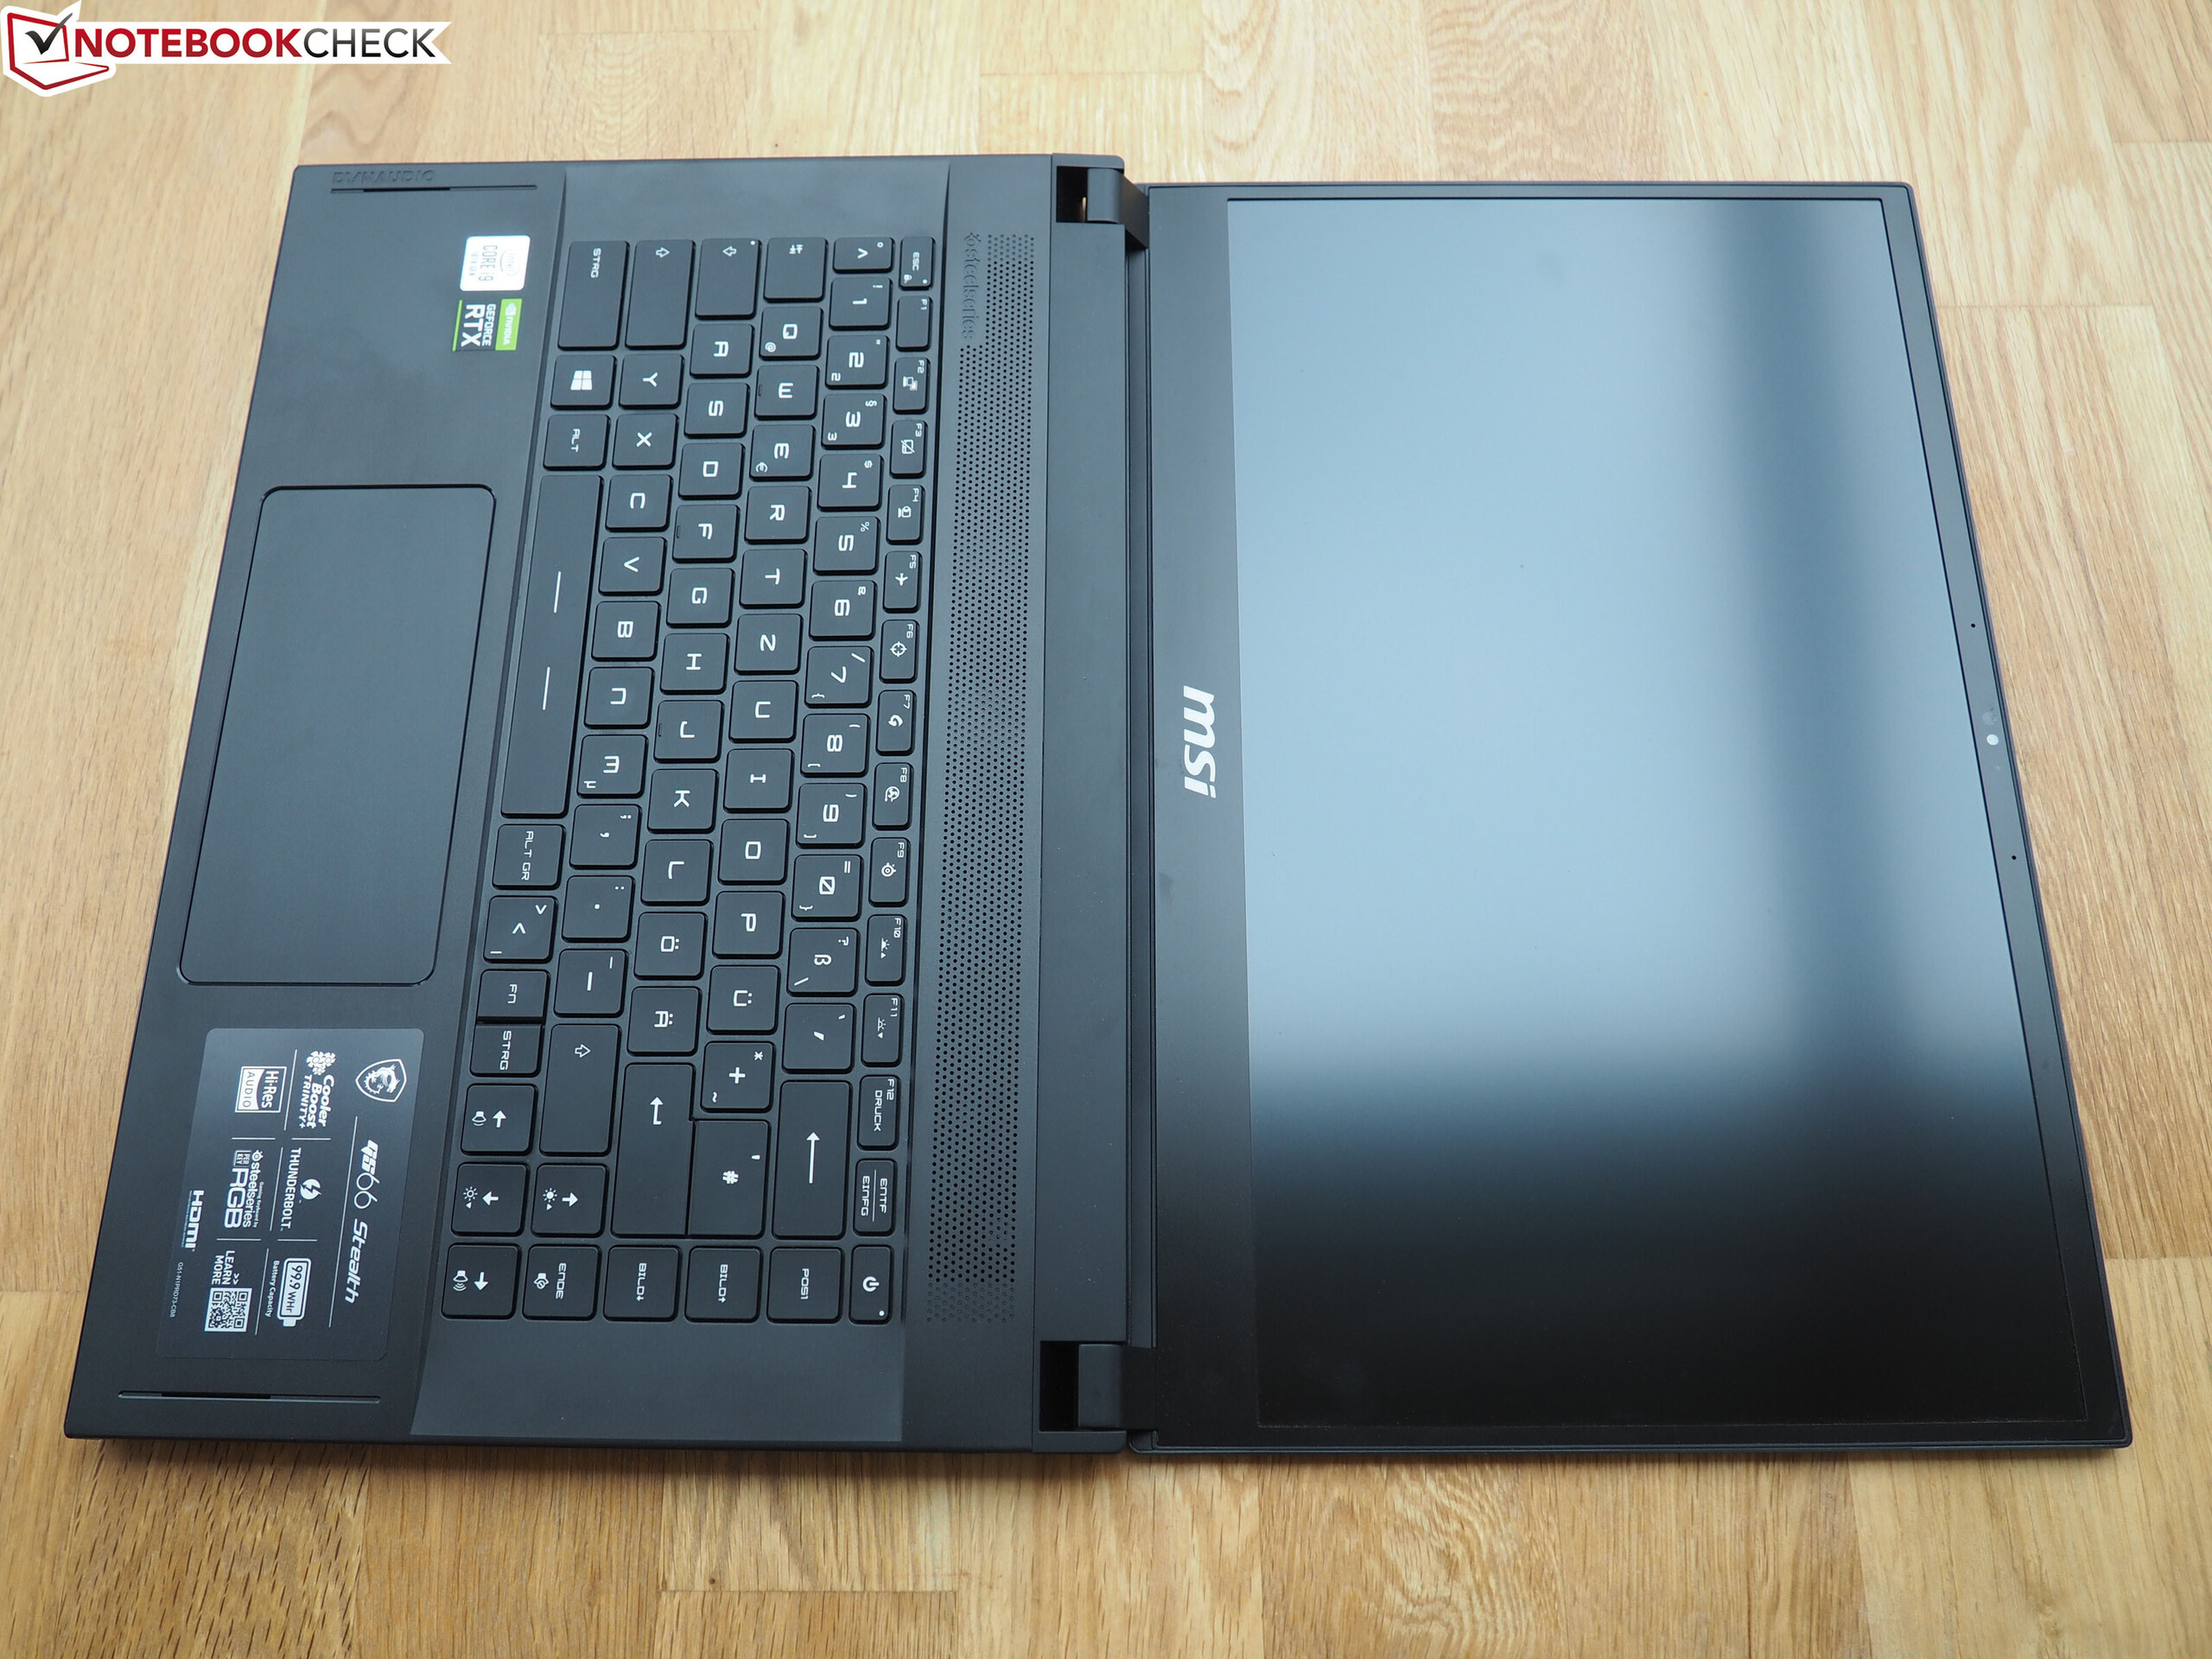
Datorns höjdpunkt är IPS-skärmen som har 240 Hz bilduppdatering.
Skärmen får poäng för snabba responstider, stabila betraktningsvinklar, hög kontrast och bra färgåtergivning. Däremot är den maximala ljusstyrkan låg. En laptop från det här prisskiktet borde erbjuda mer på den punkten.
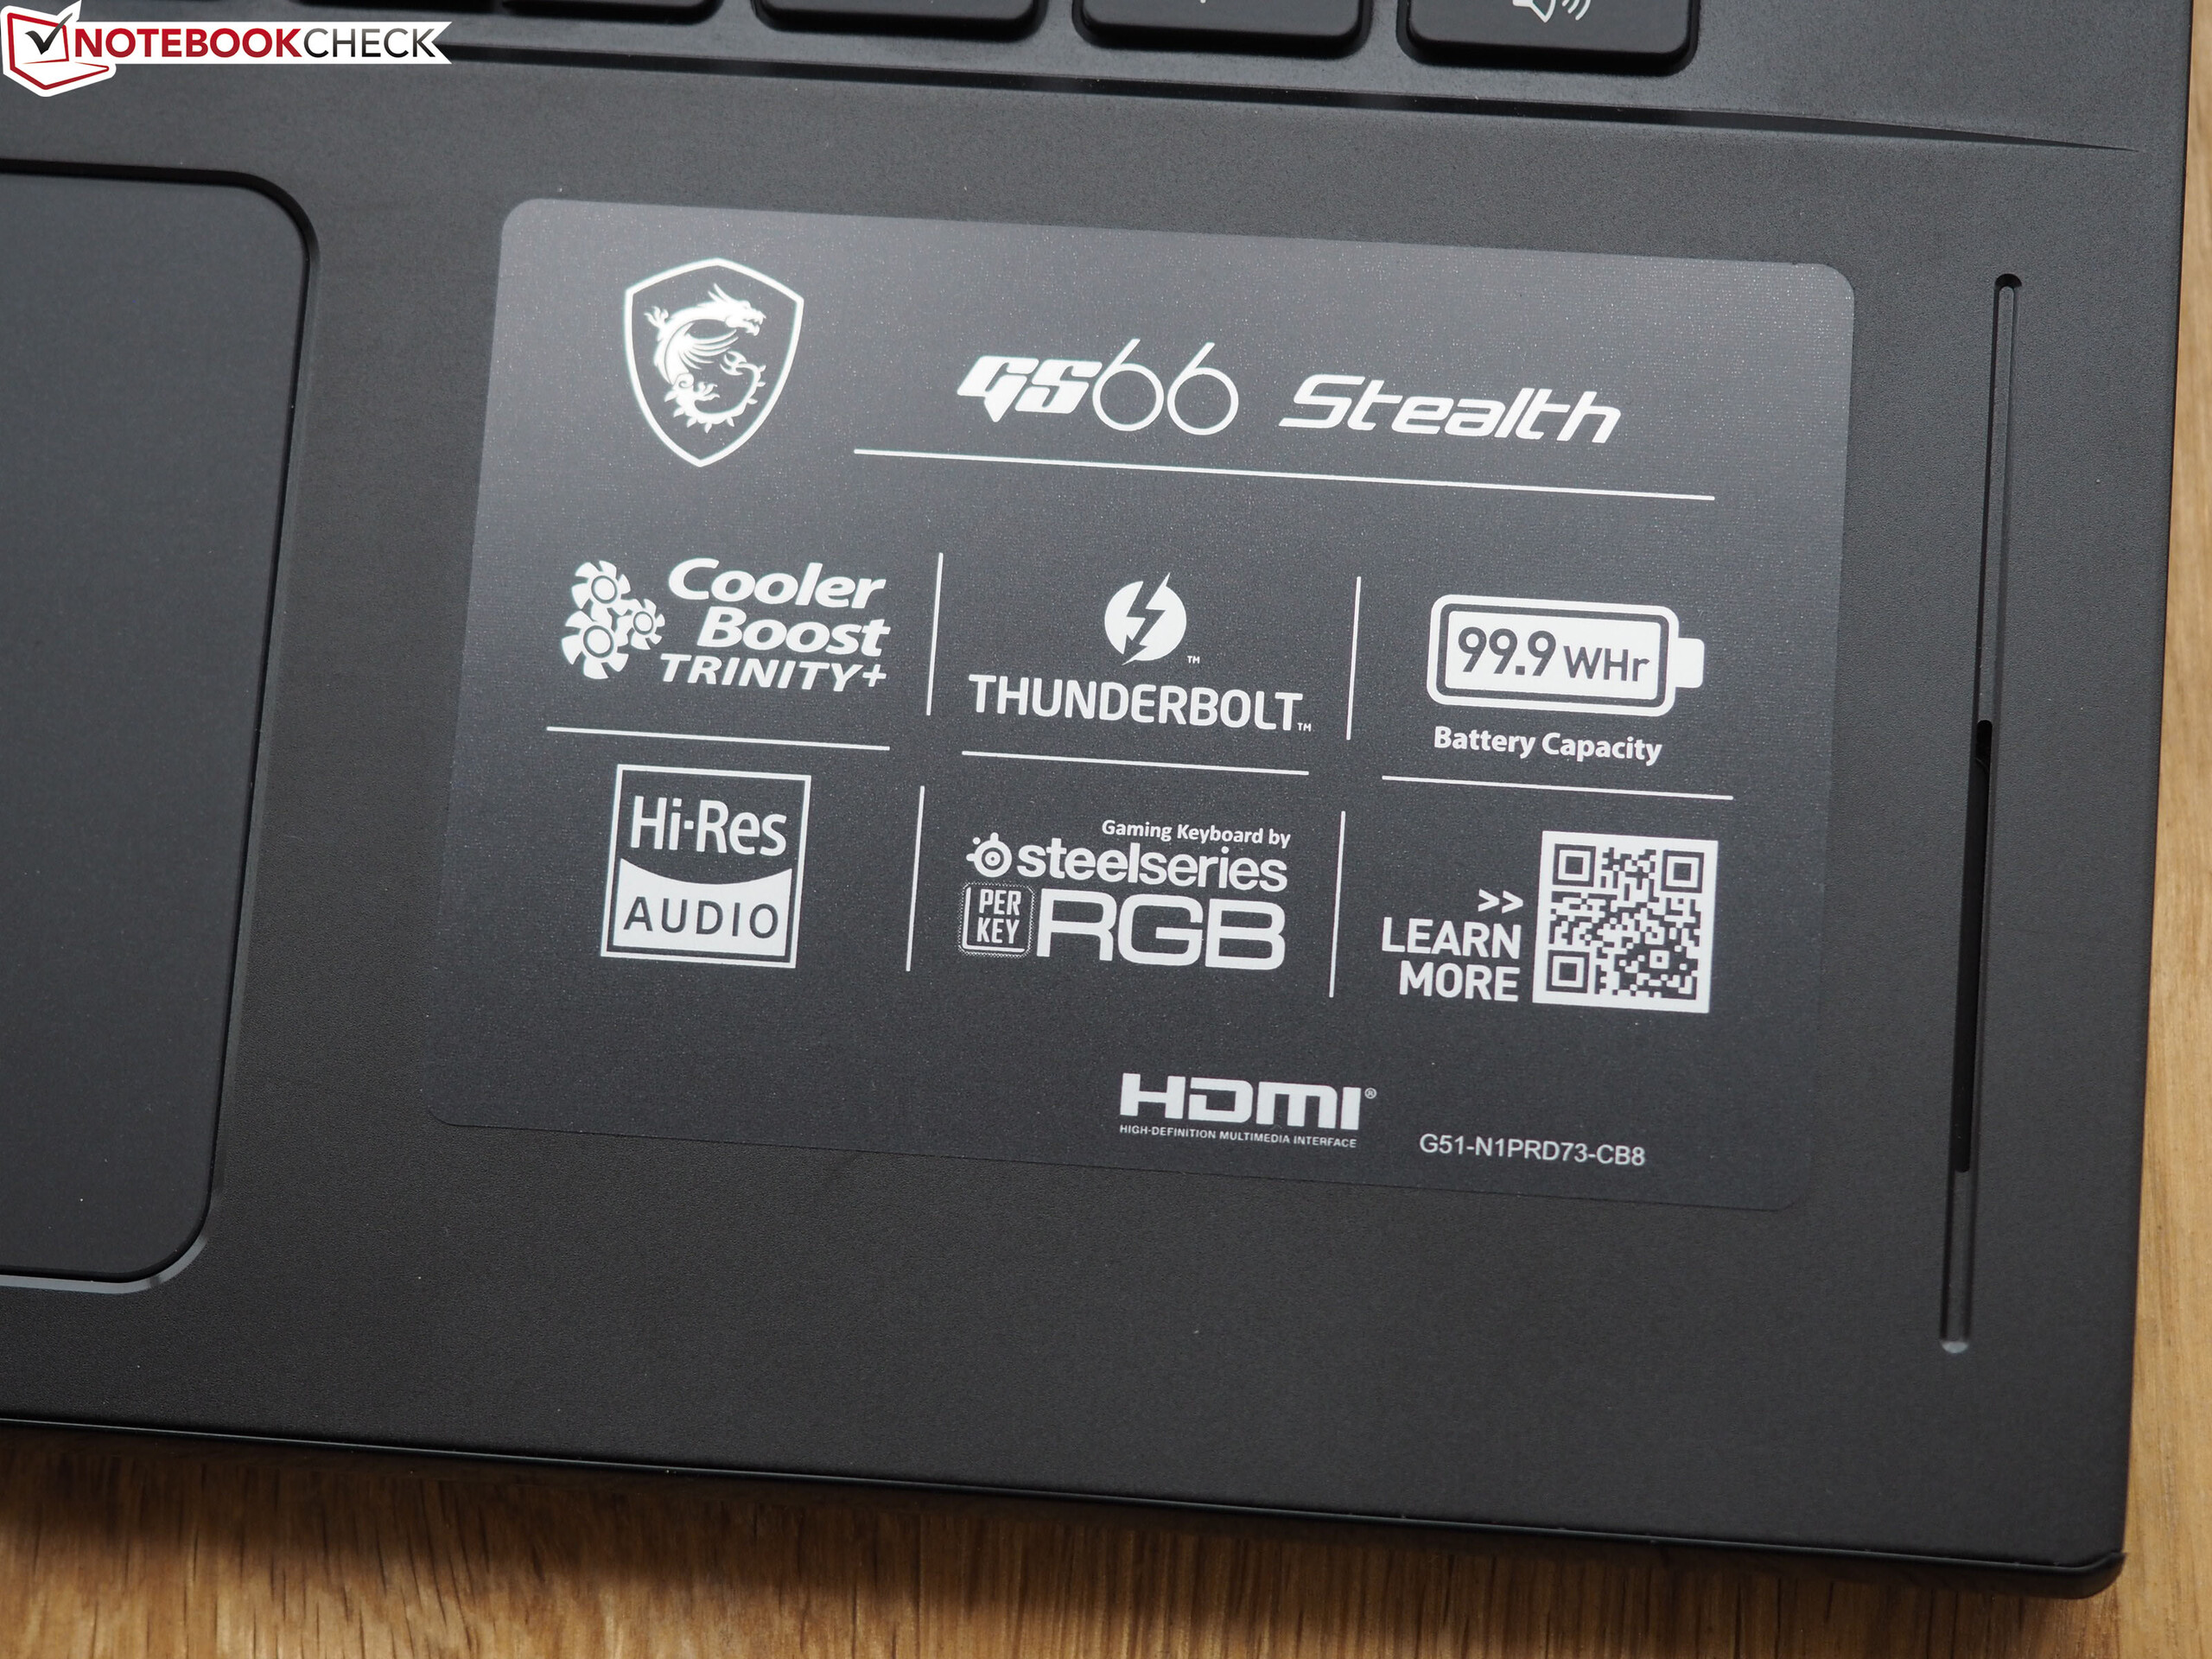
I princip är batteritiden mer än tillräcklig för en spellaptop. Men om du ser på den i förhållande till batteriets kapacitet (99.9 Wh) ser saker annorlunda ut. Konkurrenterna får likvärdiga eller delvis bättre batteritid från batterier som bara har hälften så hög kapacitet. Här märks det att datorn har hög energiförbrukning vid tomgång eller låg belastning.
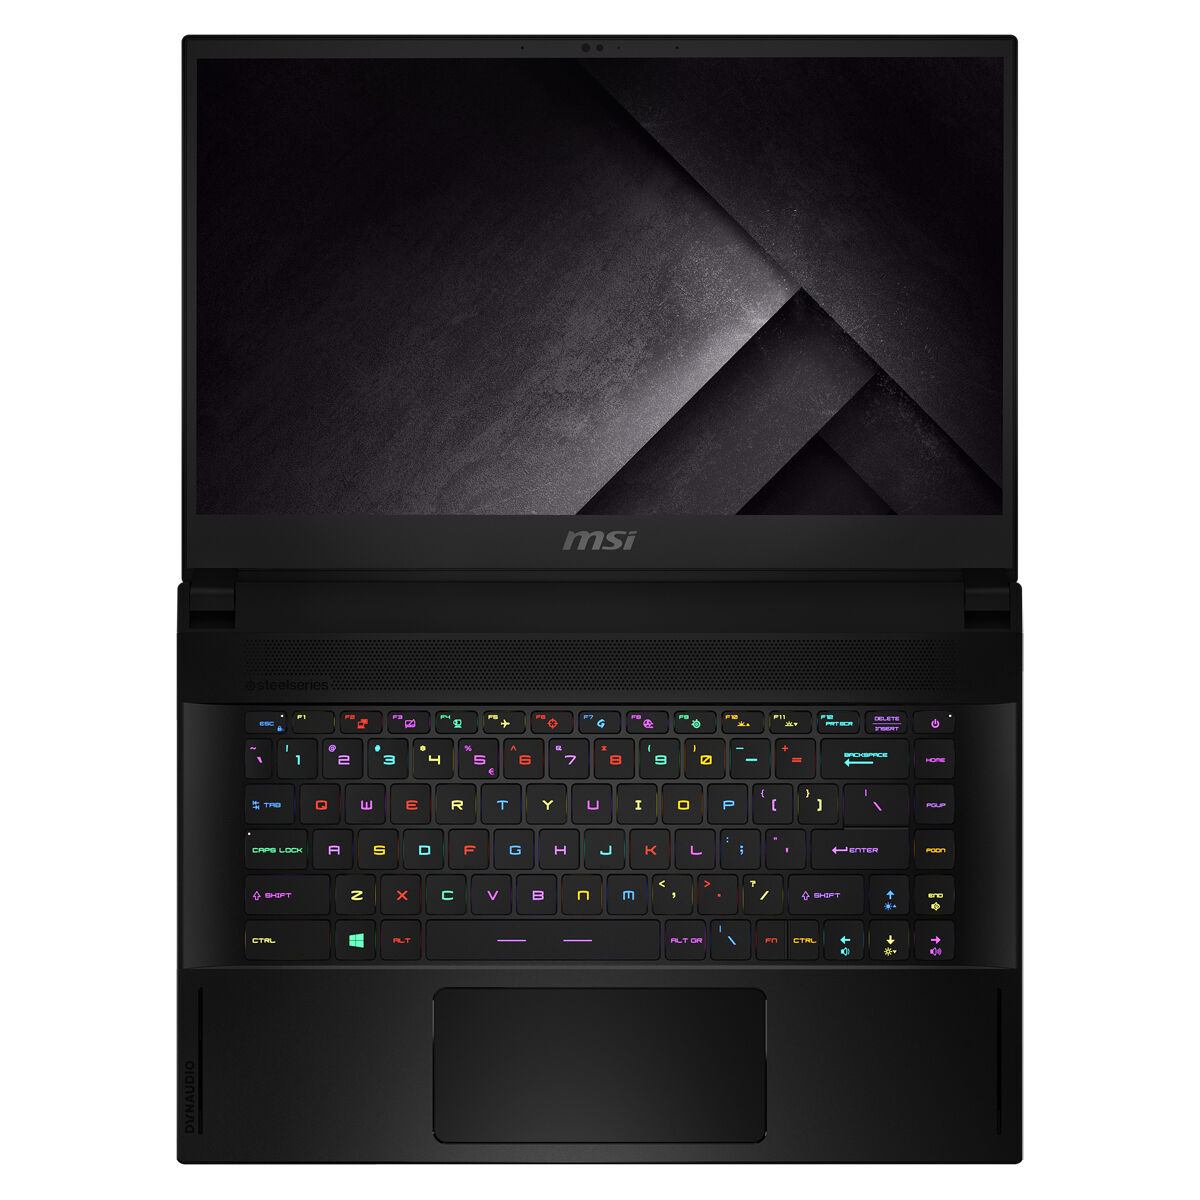
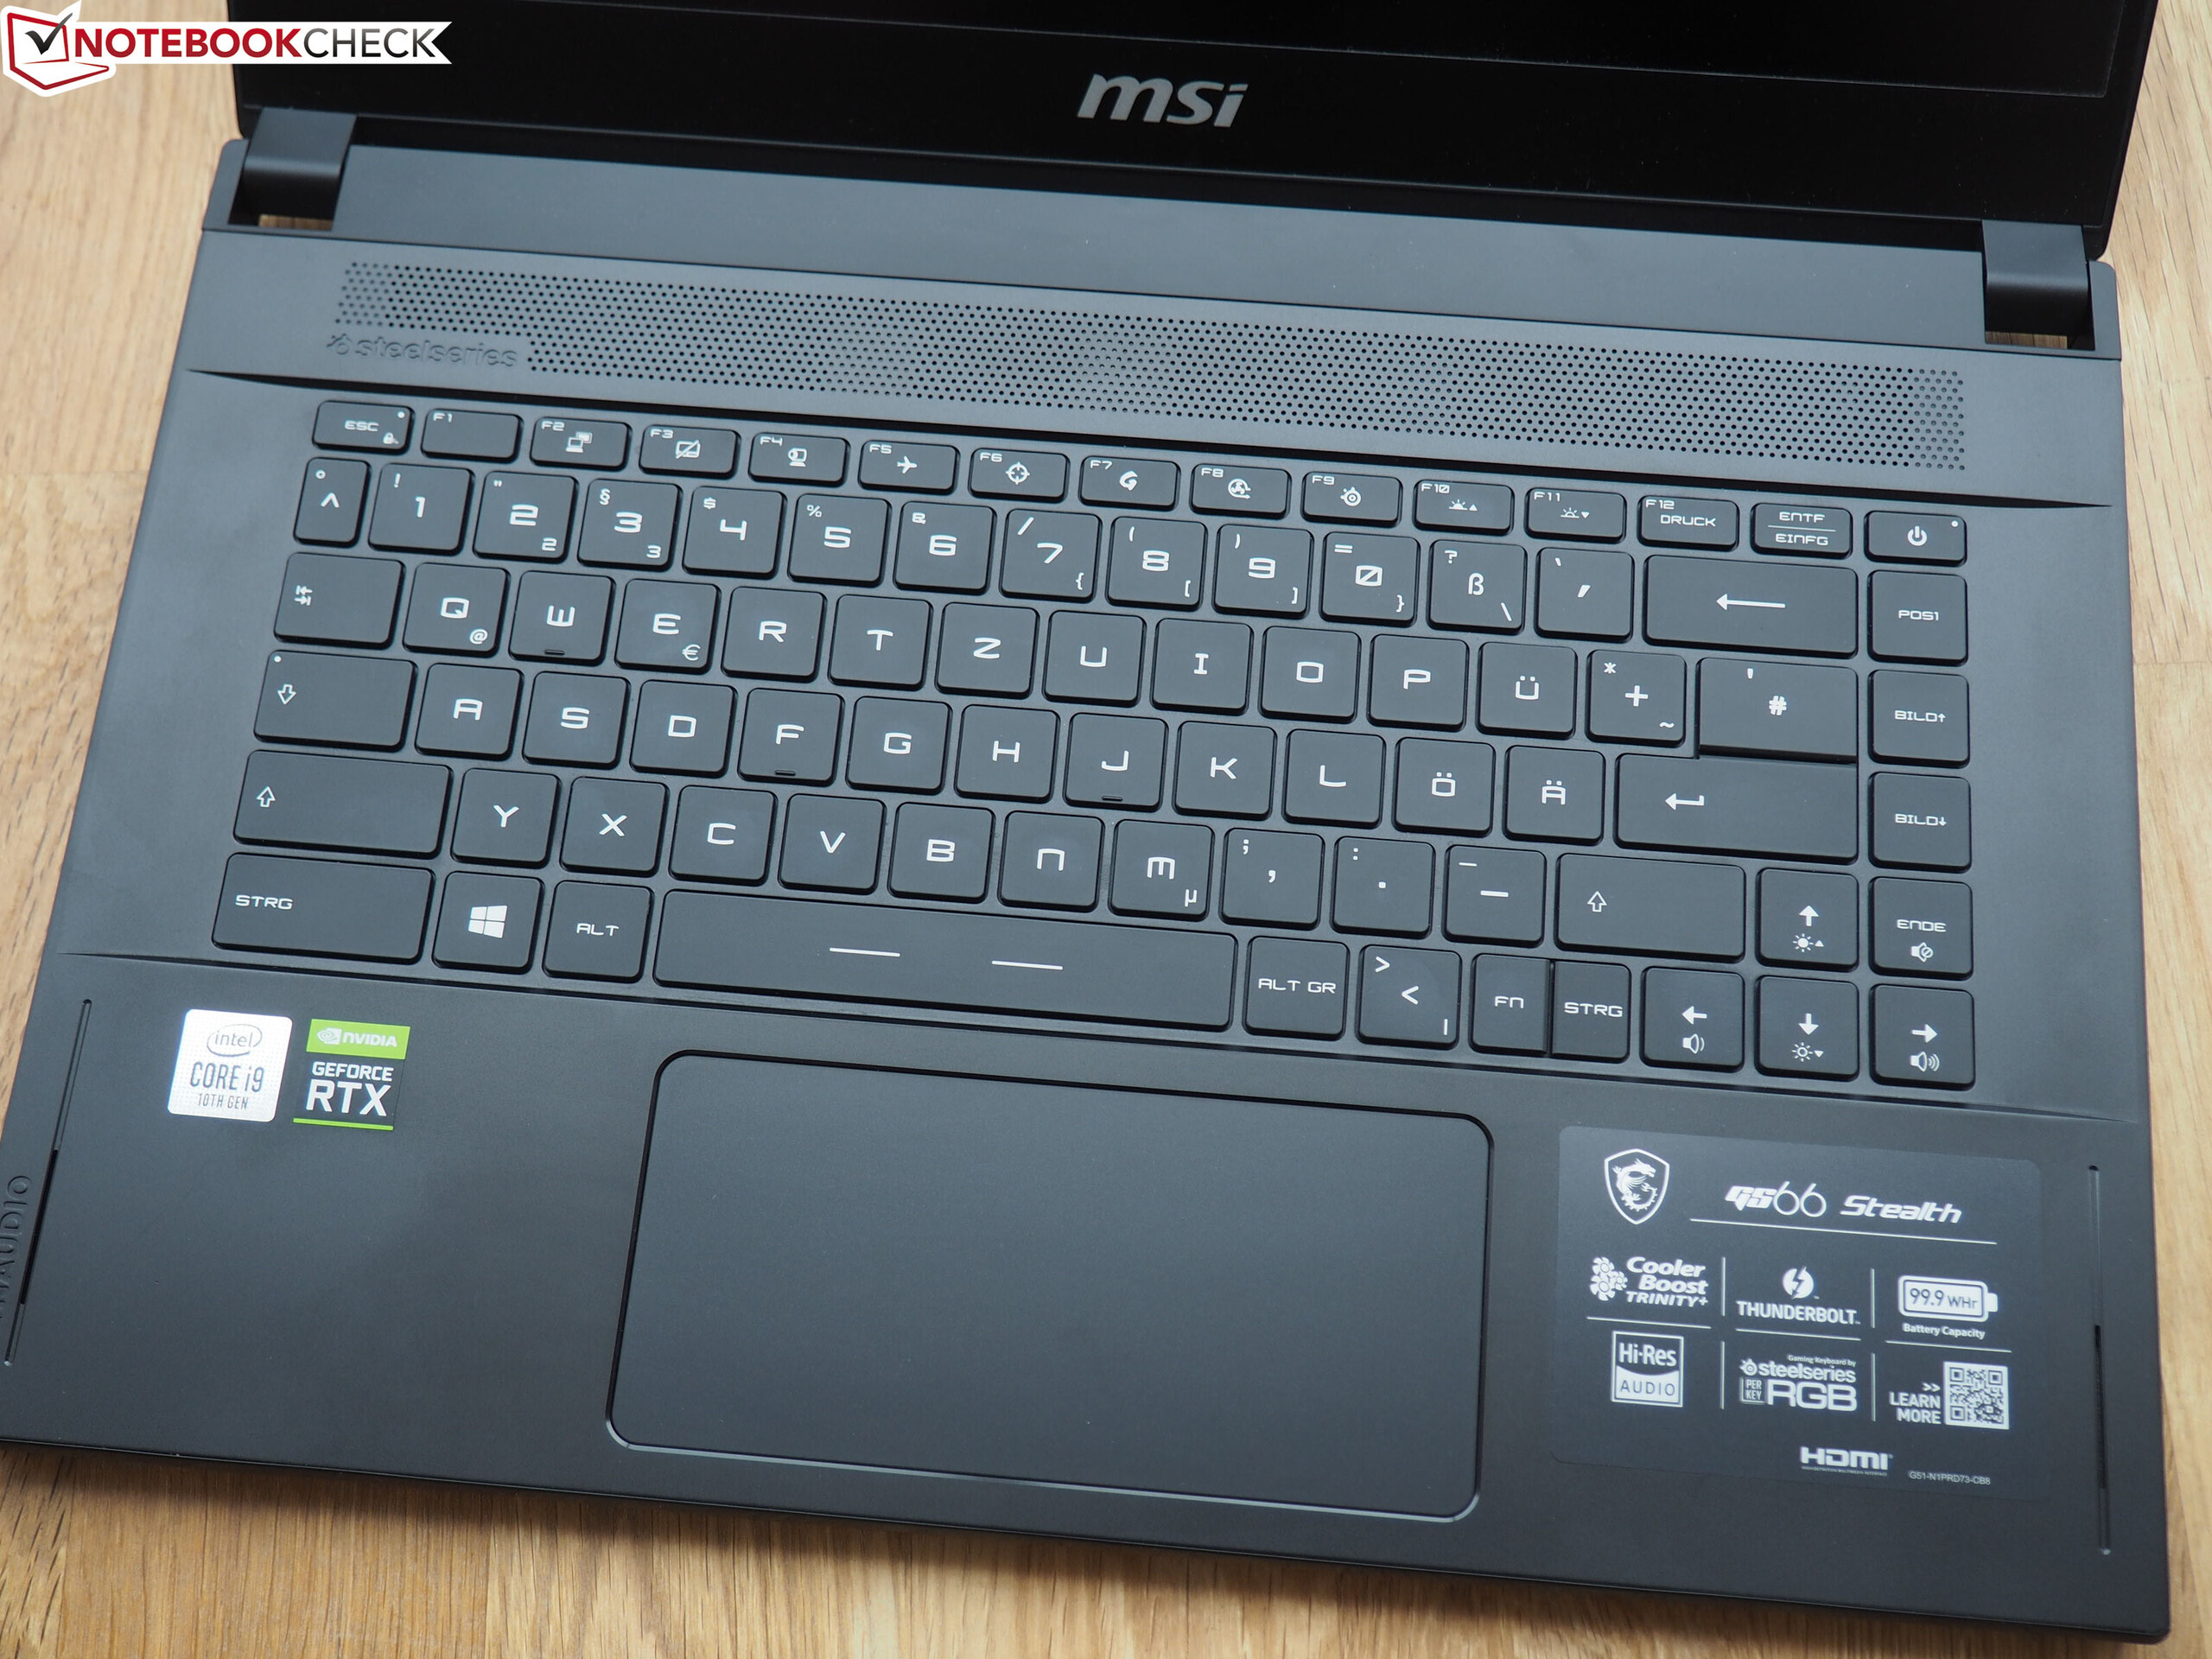
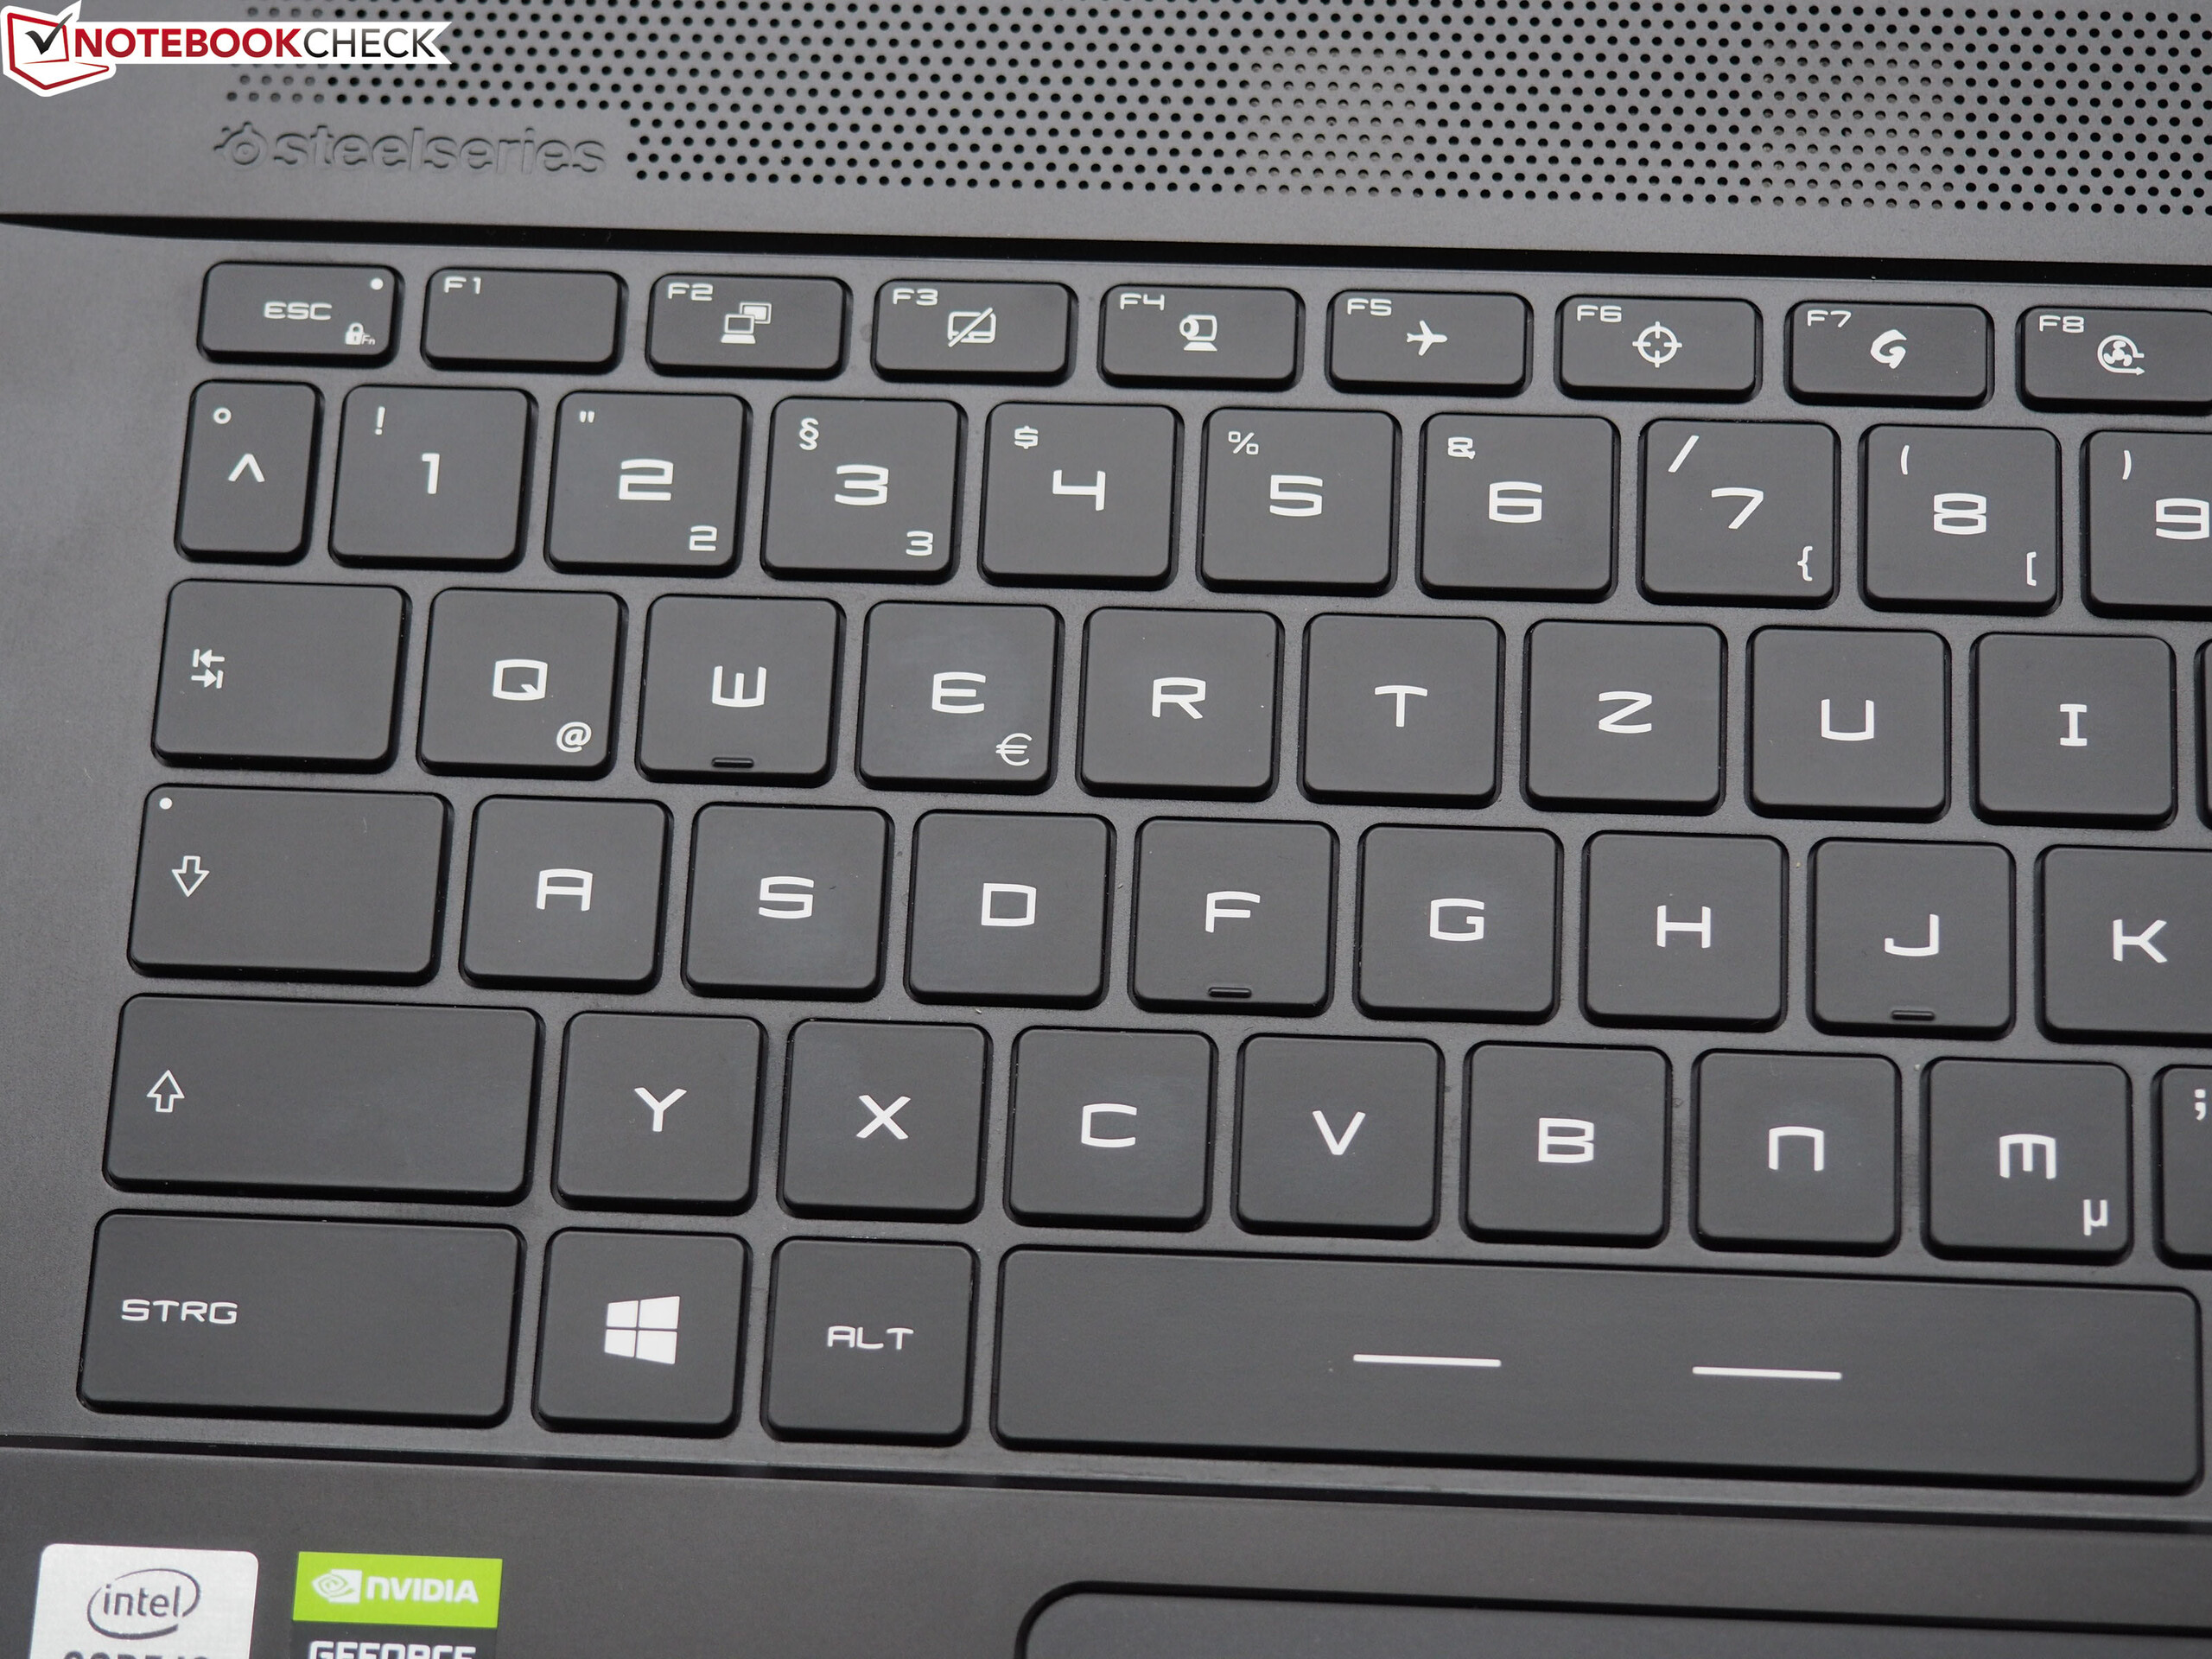
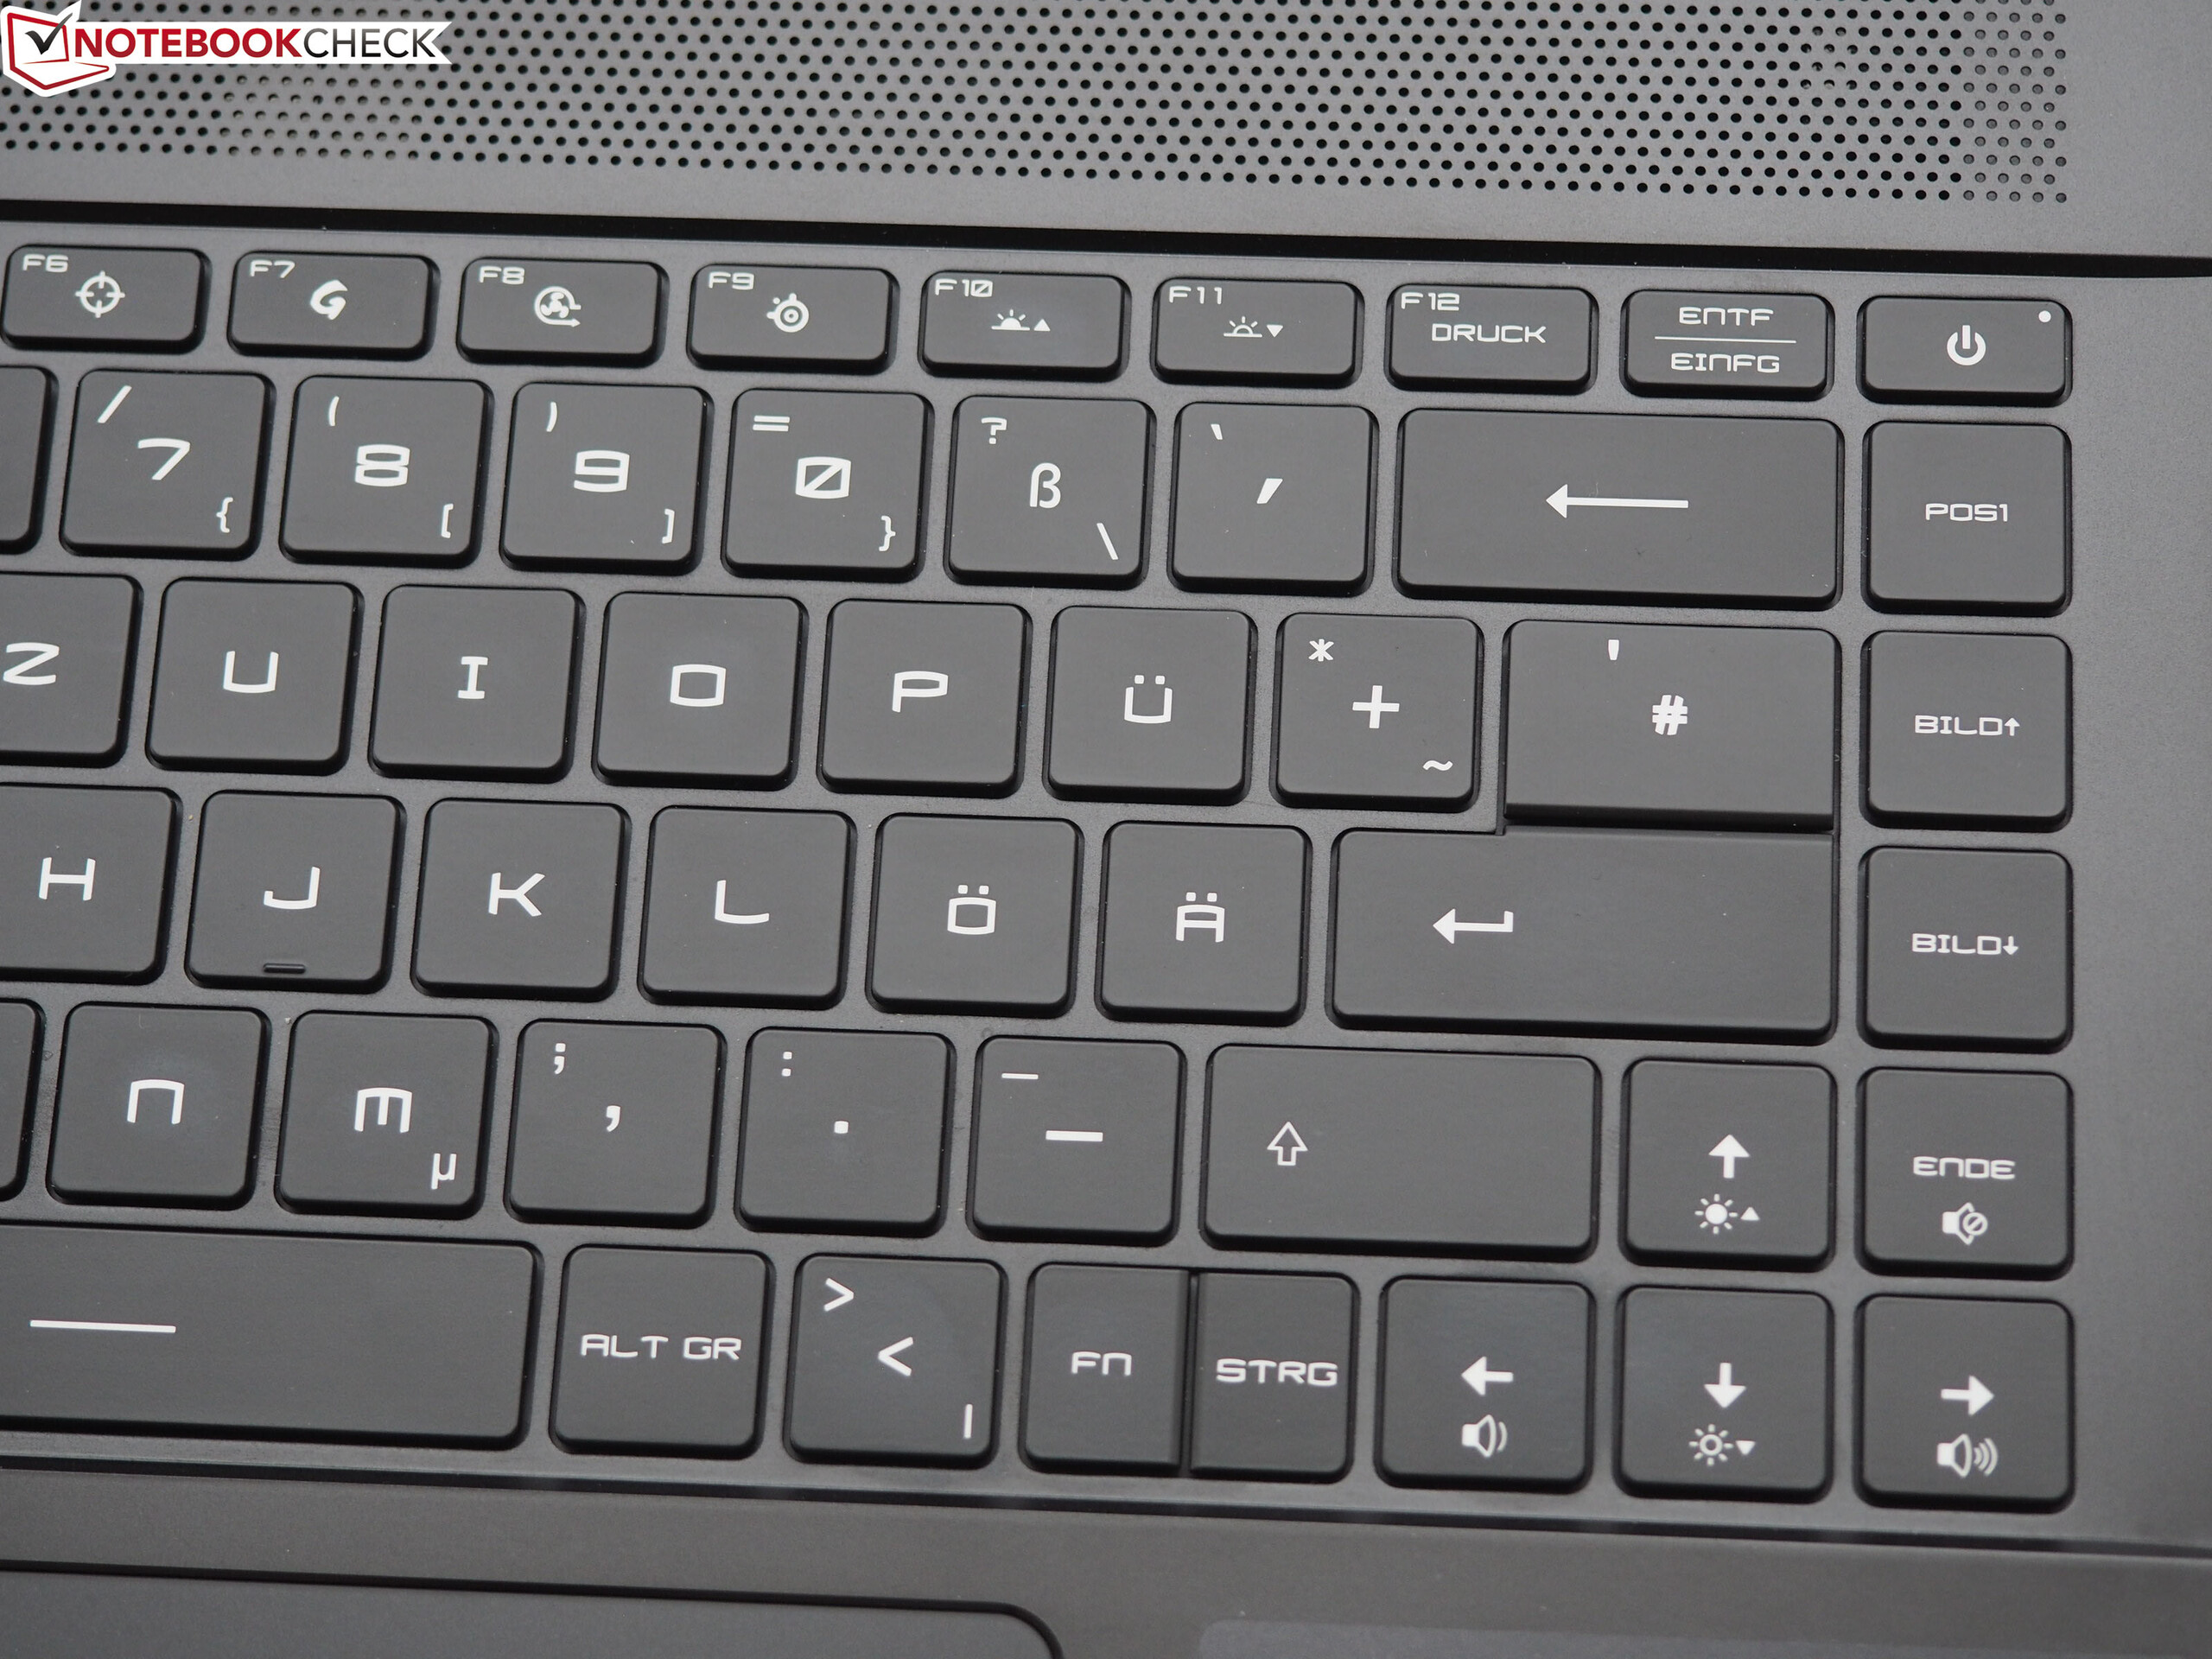
Chiclet-tangentbordet (med RGB-belysning) visade sig lämpligt för daglig användning. Vidare inkluderar det välavrundade portutbudet bland annat en Thunderbolt 3-port som gör det möjligt att ansluta avancerade dockningslösningar eller en extern GPU. Batteriet går inte att ladda genom Thunderbolt 3- eller USB Typ C 3.2 Gen 2-portarna. Vi kopplade i en sådan nätadapter på 45 Watt men lyckades inte få datorn att ladda.
MSI GS66 Stealth 10SE-045
- 08/05/2020 v7 (old)
Sascha Mölck
Price comparison
