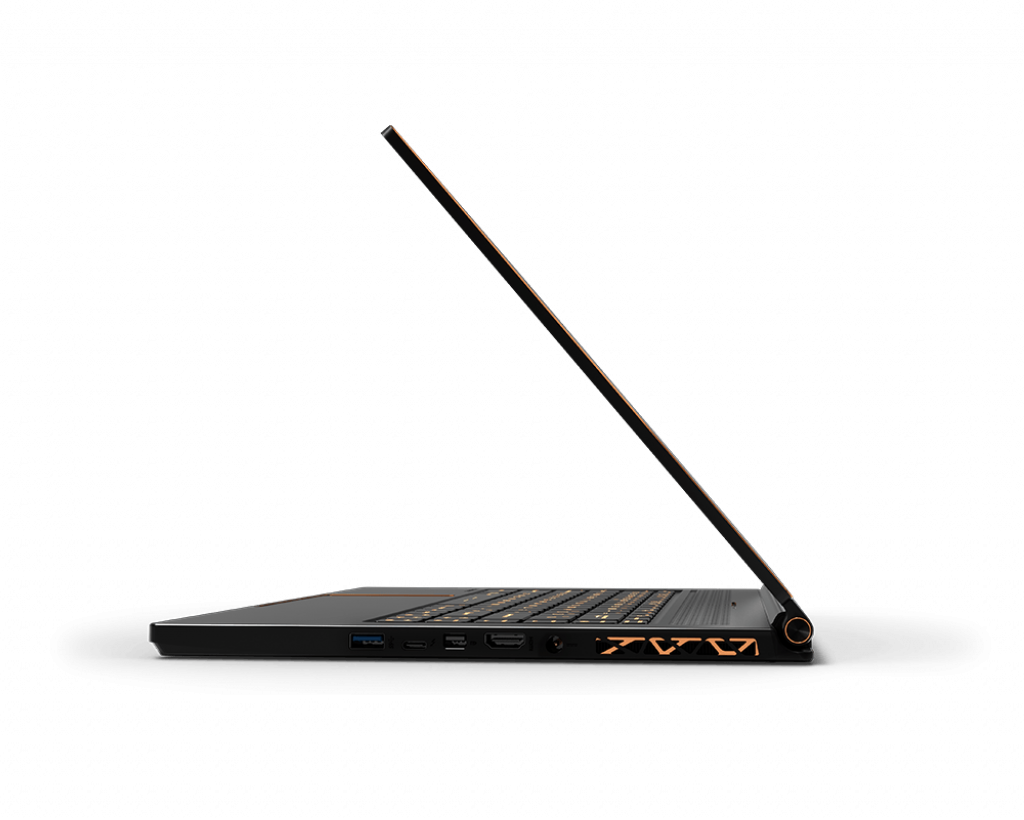
Test: MSI GS65 Stealth 9SG (i7-9750H, RTX 2080 Max-Q) Laptop (Sammanfattning)
| |||||||||||||||||||||||||
Distribution av ljusstyrkan: 90 %
Mitt på batteriet: 282.3 cd/m²
Kontrast: 882:1 (Svärta: 0.32 cd/m²)
ΔE ColorChecker Calman: 1.17 | ∀{0.5-29.43 Ø4.73}
calibrated: 1.06
ΔE Greyscale Calman: 1.3 | ∀{0.09-98 Ø4.97}
97.5% sRGB (Argyll 1.6.3 3D)
63.8% AdobeRGB 1998 (Argyll 1.6.3 3D)
68.9% AdobeRGB 1998 (Argyll 3D)
97.5% sRGB (Argyll 3D)
67.6% Display P3 (Argyll 3D)
Gamma: 2.2
CCT: 6643 K
| MSI GS65 Stealth 9SG Sharp LQ156M1JW03 (SHP14C5), IPS, 15.6", 1920x1080 | Razer Blade 15 RTX 2080 Max-Q Sharp LQ156M1JW03 (SHP14C5), IPS, 15.6", 1920x1080 | Lenovo Legion Y740-15ICHg LP156WFG-SPB2, IPS, 15.6", 1920x1080 | Asus Zephyrus S GX531GX AU Optronics B156HAN08.2, IPS, 15.6", 1920x1080 | Gigabyte Aero 15 Classic-XA Sharp LQ156M1JW03 (SHP14C5), IGZO, 15.6", 1920x1080 | MSI GS65 8RF-019DE Stealth Thin AU Optronics B156HAN08.0 (AUO80ED), IPS, 15.6", 1920x1080 | |
|---|---|---|---|---|---|---|
| Display | -0% | -6% | -4% | -3% | -3% | |
| Display P3 Coverage (%) | 67.6 | 66.9 -1% | 63.5 -6% | 65.6 -3% | 65.3 -3% | 66.2 -2% |
| sRGB Coverage (%) | 97.5 | 98.1 1% | 92.4 -5% | 92.2 -5% | 95.5 -2% | 92.1 -6% |
| AdobeRGB 1998 Coverage (%) | 68.9 | 68.5 -1% | 64.7 -6% | 66.9 -3% | 66.5 -3% | 67.2 -2% |
| Response Times | 10% | -24% | 35% | -3% | -18% | |
| Response Time Grey 50% / Grey 80% * (ms) | 13.6 ? | 12.8 ? 6% | 18.8 ? -38% | 7 ? 49% | 15.2 ? -12% | 17.6 ? -29% |
| Response Time Black / White * (ms) | 12 ? | 10.4 ? 13% | 13.2 ? -10% | 9.6 ? 20% | 11.2 ? 7% | 12.8 ? -7% |
| PWM Frequency (Hz) | 23260 ? | 23810 ? | 23580 ? | |||
| Screen | -10% | -53% | -44% | -36% | -19% | |
| Brightness middle (cd/m²) | 282.3 | 293 4% | 320.4 13% | 323.6 15% | 266 -6% | 254 -10% |
| Brightness (cd/m²) | 269 | 270 0% | 298 11% | 315 17% | 248 -8% | 262 -3% |
| Brightness Distribution (%) | 90 | 87 -3% | 85 -6% | 91 1% | 89 -1% | 89 -1% |
| Black Level * (cd/m²) | 0.32 | 0.29 9% | 0.42 -31% | 0.29 9% | 0.31 3% | 0.22 31% |
| Contrast (:1) | 882 | 1010 15% | 763 -13% | 1116 27% | 858 -3% | 1155 31% |
| Colorchecker dE 2000 * | 1.17 | 1.69 -44% | 3.21 -174% | 3.31 -183% | 2.78 -138% | 2.37 -103% |
| Colorchecker dE 2000 max. * | 3.29 | 3.37 -2% | 5.54 -68% | 5.74 -74% | 5.96 -81% | 4.71 -43% |
| Colorchecker dE 2000 calibrated * | 1.06 | 1.24 -17% | 2.36 -123% | 2.73 -158% | 0.91 14% | 1.84 -74% |
| Greyscale dE 2000 * | 1.3 | 2.3 -77% | 3.6 -177% | 2.9 -123% | 3.58 -175% | 1.58 -22% |
| Gamma | 2.2 100% | 2.3 96% | 2.27 97% | 2.29 96% | 2.46 89% | 2.48 89% |
| CCT | 6643 98% | 6758 96% | 6503 100% | 6765 96% | 7186 90% | 6785 96% |
| Color Space (Percent of AdobeRGB 1998) (%) | 63.8 | 63 -1% | 59 -8% | 59.7 -6% | 62 -3% | 60 -6% |
| Color Space (Percent of sRGB) (%) | 97.5 | 98.5 1% | 92 -6% | 91.8 -6% | 96 -2% | 92 -6% |
| Totalt genomsnitt (program/inställningar) | 0% /
-6% | -28% /
-40% | -4% /
-26% | -14% /
-26% | -13% /
-16% |
* ... mindre är bättre
Visa svarstider
| ↔ Svarstid svart till vitt | ||
|---|---|---|
| 12 ms ... stiga ↗ och falla ↘ kombinerat | ↗ 7.6 ms stiga | 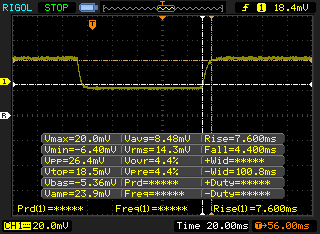 |
| ↘ 4.4 ms hösten | ||
| Skärmen visar bra svarsfrekvens i våra tester, men kan vara för långsam för konkurrenskraftiga spelare. I jämförelse sträcker sig alla testade enheter från 0.1 (minst) till 240 (maximalt) ms. » 31 % av alla enheter är bättre. Det betyder att den uppmätta svarstiden är bättre än genomsnittet av alla testade enheter (19.9 ms). | ||
| ↔ Svarstid 50 % grått till 80 % grått | ||
| 13.6 ms ... stiga ↗ och falla ↘ kombinerat | ↗ 8 ms stiga | 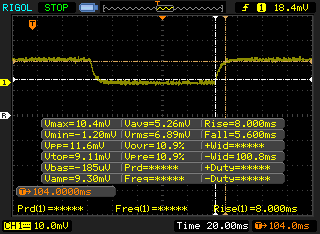 |
| ↘ 5.6 ms hösten | ||
| Skärmen visar bra svarsfrekvens i våra tester, men kan vara för långsam för konkurrenskraftiga spelare. I jämförelse sträcker sig alla testade enheter från 0.165 (minst) till 636 (maximalt) ms. » 27 % av alla enheter är bättre. Det betyder att den uppmätta svarstiden är bättre än genomsnittet av alla testade enheter (31.1 ms). | ||
Skärmflimmer / PWM (Puls-Width Modulation)
| Skärmflimmer / PWM upptäckt | 23260 Hz | ≤ 19 % ljusstyrka inställning | 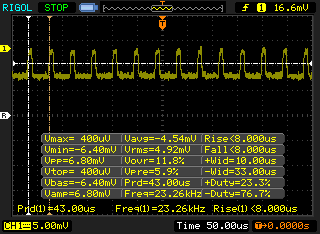 |
Displayens bakgrundsbelysning flimrar vid 23260 Hz (i värsta fall, t.ex. med PWM) Flimrande upptäckt vid en ljusstyrkeinställning på 19 % och lägre. Det ska inte finnas något flimmer eller PWM över denna ljusstyrkeinställning. Frekvensen för 23260 Hz är ganska hög, så de flesta användare som är känsliga för PWM bör inte märka något flimmer. Som jämförelse: 52 % av alla testade enheter använder inte PWM för att dämpa skärmen. Om PWM upptäcktes mättes ett medelvärde av 7798 (minst: 5 - maximum: 343500) Hz. | |||
| Cinebench R10 | |
| Rendering Multiple CPUs 32Bit | |
| MSI GE75 9SG | |
| Genomsnitt Intel Core i7-9750H (28251 - 36304, n=13) | |
| MSI GF62VR 7RF-877 | |
| Asus ROG Zephyrus G15 GA502DU | |
| Rendering Single 32Bit | |
| MSI GE75 9SG | |
| Genomsnitt Intel Core i7-9750H (6659 - 7214, n=13) | |
| MSI GF62VR 7RF-877 | |
| Asus ROG Zephyrus G15 GA502DU | |
| wPrime 2.10 - 1024m | |
| MSI GF63 8RC-040XPL | |
| MSI GF62VR 7RF-877 | |
| Asus ROG Zephyrus G15 GA502DU | |
| Genomsnitt Intel Core i7-9750H (n=1) | |
| MSI GE75 9SG | |
* ... mindre är bättre
| PCMark 8 Home Score Accelerated v2 | 4454 poäng | |
| PCMark 8 Work Score Accelerated v2 | 5751 poäng | |
| PCMark 10 Score | 5725 poäng | |
Hjälp | ||
| MSI GS65 Stealth 9SG Samsung SSD PM981 MZVLB512HAJQ | Razer Blade 15 RTX 2080 Max-Q Samsung SSD PM981 MZVLB512HAJQ | Lenovo Legion Y740-15ICHg Samsung SSD PM981 MZVLB256HAHQ | Asus Zephyrus S GX531GX Intel SSD 660p SSDPEKNW512G8 | MSI GS65 8RF-019DE Stealth Thin Samsung SSD PM981 MZVLB512HAJQ | Gigabyte Aero 15 Classic-XA Intel SSD 760p SSDPEKKW512G8 | |
|---|---|---|---|---|---|---|
| AS SSD | -5% | -23% | -42% | -6% | -21% | |
| Seq Read (MB/s) | 2005 | 1832 -9% | 1953 -3% | 1239 -38% | 1266 -37% | 2517 26% |
| Seq Write (MB/s) | 1580 | 1864 18% | 1629 3% | 920 -42% | 1834 16% | 924 -42% |
| 4K Read (MB/s) | 49.33 | 52.1 6% | 33.2 -33% | 45.74 -7% | 48.94 -1% | 59.1 20% |
| 4K Write (MB/s) | 103.8 | 108.3 4% | 88.1 -15% | 95.7 -8% | 107.2 3% | 126.5 22% |
| 4K-64 Read (MB/s) | 1241 | 1159 -7% | 757 -39% | 322 -74% | 1170 -6% | 876 -29% |
| 4K-64 Write (MB/s) | 1730 | 1807 4% | 1501 -13% | 722 -58% | 1760 2% | 922 -47% |
| Access Time Read * (ms) | 0.054 | 0.05 7% | 0.077 -43% | 0.073 -35% | 0.073 -35% | 0.042 22% |
| Access Time Write * (ms) | 0.036 | 0.034 6% | 0.043 -19% | 0.047 -31% | 0.035 3% | 0.065 -81% |
| Score Read (Points) | 1490 | 1394 -6% | 985 -34% | 492 -67% | 1346 -10% | 1186 -20% |
| Score Write (Points) | 1991 | 2102 6% | 1752 -12% | 910 -54% | 2051 3% | 1141 -43% |
| Score Total (Points) | 4230 | 4221 0% | 3230 -24% | 1654 -61% | 4122 -3% | 2870 -32% |
| Copy ISO MB/s (MB/s) | 3025 | 2083 -31% | 1872 -38% | 1236 -59% | 2086 -31% | |
| Copy Program MB/s (MB/s) | 713 | 496.5 -30% | 478.2 -33% | 703 -1% | 454.2 -36% | |
| Copy Game MB/s (MB/s) | 1554 | 977 -37% | 1165 -25% | 812 -48% | 1141 -27% |
* ... mindre är bättre

| 3DMark 11 Performance | 20209 poäng | |
| 3DMark Cloud Gate Standard Score | 37220 poäng | |
| 3DMark Fire Strike Score | 16598 poäng | |
| 3DMark Time Spy Score | 7099 poäng | |
Hjälp | ||
| Shadow of the Tomb Raider - 1920x1080 Highest Preset AA:T | |
| MSI RTX 2080 Gaming X Trio | |
| MSI GE75 9SG | |
| Genomsnitt NVIDIA GeForce RTX 2080 Max-Q (71 - 105, n=8) | |
| MSI GS65 Stealth 9SG | |
| Asus Zephyrus S GX502GW | |
| Acer Nitro 5 AN515-42-R6V0 | |
| låg | med. | hög | ultra | |
|---|---|---|---|---|
| BioShock Infinite (2013) | 306.4 | 273 | 254.1 | 156.9 |
| The Witcher 3 (2015) | 279 | 216 | 125.5 | 66.9 |
| Rise of the Tomb Raider (2016) | 223.3 | 176.7 | 139.8 | 108.6 |
| Shadow of the Tomb Raider (2018) | 133 | 102 | 97 | 84 |
| MSI GS65 Stealth 9SG GeForce RTX 2080 Max-Q, i7-9750H | Razer Blade 15 RTX 2080 Max-Q GeForce RTX 2080 Max-Q, i7-9750H | MSI GS65 8RF-019DE Stealth Thin GeForce GTX 1070 Max-Q, i7-8750H | Asus Zephyrus S GX531GX GeForce RTX 2080 Max-Q, i7-8750H | Gigabyte Aero 15 Classic-XA GeForce RTX 2070 Max-Q, i7-9750H | MSI GE75 9SG GeForce RTX 2080 Mobile, i9-9880H | |
|---|---|---|---|---|---|---|
| Noise | 7% | -0% | -8% | -12% | -4% | |
| av / miljö * (dB) | 28.3 | 28.3 -0% | 30 -6% | 28.7 -1% | 30 -6% | 28.2 -0% |
| Idle Minimum * (dB) | 30.4 | 28.8 5% | 30 1% | 29.8 2% | 31 -2% | 30.4 -0% |
| Idle Average * (dB) | 30.5 | 28.8 6% | 31 -2% | 32.4 -6% | 34 -11% | 30.4 -0% |
| Idle Maximum * (dB) | 30.6 | 29 5% | 34 -11% | 38 -24% | 39 -27% | 33.4 -9% |
| Load Average * (dB) | 37.6 | 33.5 11% | 43 -14% | 38.2 -2% | 46 -22% | 37.1 1% |
| Witcher 3 ultra * (dB) | 46 | 45 2% | 42 9% | 56.6 -23% | 53 -15% | 54.2 -18% |
| Load Maximum * (dB) | 55.1 | 45.2 18% | 44 20% | 56.6 -3% | 55 -0% | 56.4 -2% |
* ... mindre är bättre
Ljudnivå
| Låg belastning |
| 30.4 / 30.5 / 30.6 dB(A) |
| Hög belastning |
| 37.6 / 55.1 dB(A) |
 | ||
30 dB tyst 40 dB(A) hörbar 50 dB(A) högt ljud |
||
min: | ||
(-) Den maximala temperaturen på ovansidan är 45.6 °C / 114 F, jämfört med genomsnittet av 40.4 °C / 105 F , allt från 21.2 till 68.8 °C för klassen Gaming.
(-) Botten värms upp till maximalt 53.8 °C / 129 F, jämfört med genomsnittet av 43.2 °C / 110 F
(+) Vid tomgångsbruk är medeltemperaturen för ovansidan 27.1 °C / 81 F, jämfört med enhetsgenomsnittet på 33.9 °C / ### class_avg_f### F.
(±) När du spelar The Witcher 3 är medeltemperaturen för ovansidan 35.2 °C / 95 F, jämfört med enhetsgenomsnittet på 33.9 °C / ## #class_avg_f### F.
(+) Handledsstöden och pekplattan är kallare än hudtemperaturen med maximalt 29 °C / 84.2 F och är därför svala att ta på.
(±) Medeltemperaturen för handledsstödsområdet på liknande enheter var 28.8 °C / 83.8 F (-0.2 °C / -0.4 F).
MSI GS65 Stealth 9SG ljudanalys
(+) | högtalare kan spela relativt högt (89.4 dB)
Bas 100 - 315 Hz
(-) | nästan ingen bas - i genomsnitt 22.7% lägre än medianen
(±) | linjäriteten för basen är genomsnittlig (9% delta till föregående frekvens)
Mellan 400 - 2000 Hz
(±) | högre mellan - i genomsnitt 7% högre än median
(+) | mids är linjära (6.4% delta till föregående frekvens)
Högsta 2 - 16 kHz
(+) | balanserade toppar - endast 2.7% från medianen
(±) | linjäriteten för toppar är genomsnittlig (10.6% delta till föregående frekvens)
Totalt 100 - 16 000 Hz
(±) | linjäriteten för det totala ljudet är genomsnittlig (23.1% skillnad mot median)
Jämfört med samma klass
» 84% av alla testade enheter i den här klassen var bättre, 5% liknande, 12% sämre
» Den bästa hade ett delta på 6%, genomsnittet var 18%, sämst var 132%
Jämfört med alla testade enheter
» 69% av alla testade enheter var bättre, 5% liknande, 26% sämre
» Den bästa hade ett delta på 4%, genomsnittet var 24%, sämst var 134%
Apple MacBook 12 (Early 2016) 1.1 GHz ljudanalys
(+) | högtalare kan spela relativt högt (83.6 dB)
Bas 100 - 315 Hz
(±) | reducerad bas - i genomsnitt 11.3% lägre än medianen
(±) | linjäriteten för basen är genomsnittlig (14.2% delta till föregående frekvens)
Mellan 400 - 2000 Hz
(+) | balanserad mellan - endast 2.4% från medianen
(+) | mids är linjära (5.5% delta till föregående frekvens)
Högsta 2 - 16 kHz
(+) | balanserade toppar - endast 2% från medianen
(+) | toppar är linjära (4.5% delta till föregående frekvens)
Totalt 100 - 16 000 Hz
(+) | det totala ljudet är linjärt (10.2% skillnad mot median)
Jämfört med samma klass
» 7% av alla testade enheter i den här klassen var bättre, 2% liknande, 91% sämre
» Den bästa hade ett delta på 5%, genomsnittet var 18%, sämst var 53%
Jämfört med alla testade enheter
» 5% av alla testade enheter var bättre, 1% liknande, 94% sämre
» Den bästa hade ett delta på 4%, genomsnittet var 24%, sämst var 134%
| Av/Standby | |
| Låg belastning | |
| Hög belastning |
|
Förklaring:
min: | |
| MSI GS65 Stealth 9SG i7-9750H, GeForce RTX 2080 Max-Q, Samsung SSD PM981 MZVLB512HAJQ, IPS, 1920x1080, 15.6" | Razer Blade 15 RTX 2080 Max-Q i7-9750H, GeForce RTX 2080 Max-Q, Samsung SSD PM981 MZVLB512HAJQ, IPS, 1920x1080, 15.6" | MSI GS65 8RF-019DE Stealth Thin i7-8750H, GeForce GTX 1070 Max-Q, Samsung SSD PM981 MZVLB512HAJQ, IPS, 1920x1080, 15.6" | Lenovo Legion Y740-15ICHg i7-8750H, GeForce RTX 2070 Max-Q, Samsung SSD PM981 MZVLB256HAHQ, IPS, 1920x1080, 15.6" | Aorus 15 W9 i7-8750H, GeForce RTX 2060 Mobile, Intel SSD 760p SSDPEKKW512G8, IPS, 1920x1080, 15.6" | MSI GE75 9SG i9-9880H, GeForce RTX 2080 Mobile, Samsung SSD PM981 MZVLB1T0HALR, AHVA, 1920x1080, 17.3" | |
|---|---|---|---|---|---|---|
| Power Consumption | 14% | 27% | -2% | 7% | -10% | |
| Idle Minimum * (Watt) | 18.3 | 12.5 32% | 7 62% | 22.9 -25% | 18 2% | 13.9 24% |
| Idle Average * (Watt) | 22 | 15.3 30% | 11 50% | 27.2 -24% | 20 9% | 18.8 15% |
| Idle Maximum * (Watt) | 28.8 | 20.7 28% | 20 31% | 27.5 5% | 28 3% | 23.1 20% |
| Load Average * (Watt) | 93 | 90.2 3% | 98 -5% | 83.4 10% | 87 6% | 112.3 -21% |
| Witcher 3 ultra * (Watt) | 142.6 | 162 -14% | 132 7% | 143.6 -1% | 135 5% | 231 -62% |
| Load Maximum * (Watt) | 215.9 | 209.3 3% | 182 16% | 160.5 26% | 175 19% | 291.5 -35% |
* ... mindre är bättre
| MSI GS65 Stealth 9SG i7-9750H, GeForce RTX 2080 Max-Q, 82 Wh | Razer Blade 15 RTX 2080 Max-Q i7-9750H, GeForce RTX 2080 Max-Q, 80 Wh | Lenovo Legion Y740-15ICHg i7-8750H, GeForce RTX 2070 Max-Q, 57 Wh | Alienware m15 GTX 1070 Max-Q i7-8750H, GeForce GTX 1070 Max-Q, 90 Wh | MSI GS65 8RF-019DE Stealth Thin i7-8750H, GeForce GTX 1070 Max-Q, 82 Wh | Asus Zephyrus S GX531GX i7-8750H, GeForce RTX 2080 Max-Q, 50 Wh | |
|---|---|---|---|---|---|---|
| Batteridrifttid | 10% | -53% | 28% | 0% | -50% | |
| WiFi v1.3 (h) | 6 | 6.6 10% | 2.8 -53% | 7.7 28% | 6 0% | 3 -50% |
| Reader / Idle (h) | 15.9 | 3.9 | 10.5 | 8.5 | ||
| Load (h) | 1.7 | 0.8 | 1.7 | 1.4 |
För
Emot

Läs den fullständiga versionen av den här recensionen på engelska här.
Om du vill få ut bästa möjliga spelupplevelse från GS65 är det ingen tvekan om att varianten med en 240 Hz-skärm och RTX 2080 Max-Q grafik kommer att leverera. Allt vi berömt och kritiserad GS65 för tidigare gäller också den senaste modellen från 2019, vilket inkluderar en lätt design, krånglig service, respektabel batteritid och medioker stabilitet.
Om du vill få ut så mycket som möjligt ur varje krona är eventuellt inte en 240 Hz-skärm och en RTX 2080 Max-Q GPU inte det bästa alternativet. Skillnaden mellan 144 Hz-skärmen som ingår och den snabbare 240 Hz-skärmen är svår att ens märka av samtidigt som RTX 2080 Max-Q bara är 8 procent snabbare än RTX 2070 Max-Q. Du sparar nästan 9.000 kronor genom att välja varianten med 144 Hz, RTX 2070 Max-Q och i7-8750H istället för den med 240 Hz, RTX 2080 Max-Q och i7-9750H utan att behöva offra särskilt mycket spelprestanda.
RTX 2080 Max-Q är mindre än 10 procent snabbare än RTX 2070 Max-Q men kostar ändå 5.000 kronor mer. Det är ett högt pris att betala för att få bästa möjliga GPU-prestanda från GS65-serien.
MSI GS65 Stealth 9SG
- 09/20/2019 v7 (old)
Allen Ngo
Price comparison
