Test: Schenker XMG Pro 15 (Clevo PB51RF-G) - Lek och spel (Sammanfattning)
Gradering | Datum | Modell | Vikt | Höjd | Storlek | Upplösning | Pris |
|---|---|---|---|---|---|---|---|
| 83.3 % v7 (old) | 02/2020 | Schenker XMG Pro 15 i7-9750H, GeForce RTX 2070 Mobile | 2.5 kg | 30 mm | 15.60" | 1920x1080 | |
| 82.1 % v7 (old) | Asus Strix Scar III G531GW-AZ062T i7-9750H, GeForce RTX 2070 Mobile | 2.4 kg | 25 mm | 15.60" | 1920x1080 | ||
| 81.3 % v7 (old) | 05/2019 | Asus Zephyrus S GX502GW i7-9750H, GeForce RTX 2070 Mobile | 2.1 kg | 19 mm | 15.60" | 1920x1080 | |
| 84.7 % v7 (old) | 12/2019 | MSI GE65 Raider 9SF-049US i9-9880H, GeForce RTX 2070 Mobile | 2.3 kg | 26.9 mm | 15.60" | 1920x1080 | |
| 87 % v6 (old) | 03/2019 | Schenker XMG Ultra 15 Turing i7-9700K, GeForce RTX 2070 Mobile | 3.5 kg | 38 mm | 15.60" | 1920x1080 |
| SD Card Reader | |
| average JPG Copy Test (av. of 3 runs) | |
| Schenker XMG Pro 15 (Toshiba Exceria Pro SDXC 64 GB UHS-II) | |
| Schenker XMG Ultra 15 Turing (Toshiba Exceria Pro SDXC 64 GB UHS-II) | |
| Genomsnitt av klass Gaming (20.9 - 210, n=54, senaste 2 åren) | |
| MSI GE65 Raider 9SF-049US (Toshiba Exceria Pro SDXC 64 GB UHS-II) | |
| maximum AS SSD Seq Read Test (1GB) | |
| Schenker XMG Pro 15 (Toshiba Exceria Pro SDXC 64 GB UHS-II) | |
| Schenker XMG Ultra 15 Turing (Toshiba Exceria Pro SDXC 64 GB UHS-II) | |
| Genomsnitt av klass Gaming (25.5 - 261, n=51, senaste 2 åren) | |
| MSI GE65 Raider 9SF-049US (Toshiba Exceria Pro SDXC 64 GB UHS-II) | |
| Networking | |
| iperf3 transmit AX12 | |
| Schenker XMG Pro 15 | |
| Asus Zephyrus S GX502GW | |
| Schenker XMG Ultra 15 Turing | |
| Asus Strix Scar III G531GW-AZ062T | |
| iperf3 receive AX12 | |
| Schenker XMG Pro 15 | |
| Schenker XMG Ultra 15 Turing | |
| Asus Zephyrus S GX502GW | |
| Asus Strix Scar III G531GW-AZ062T | |

| |||||||||||||||||||||||||
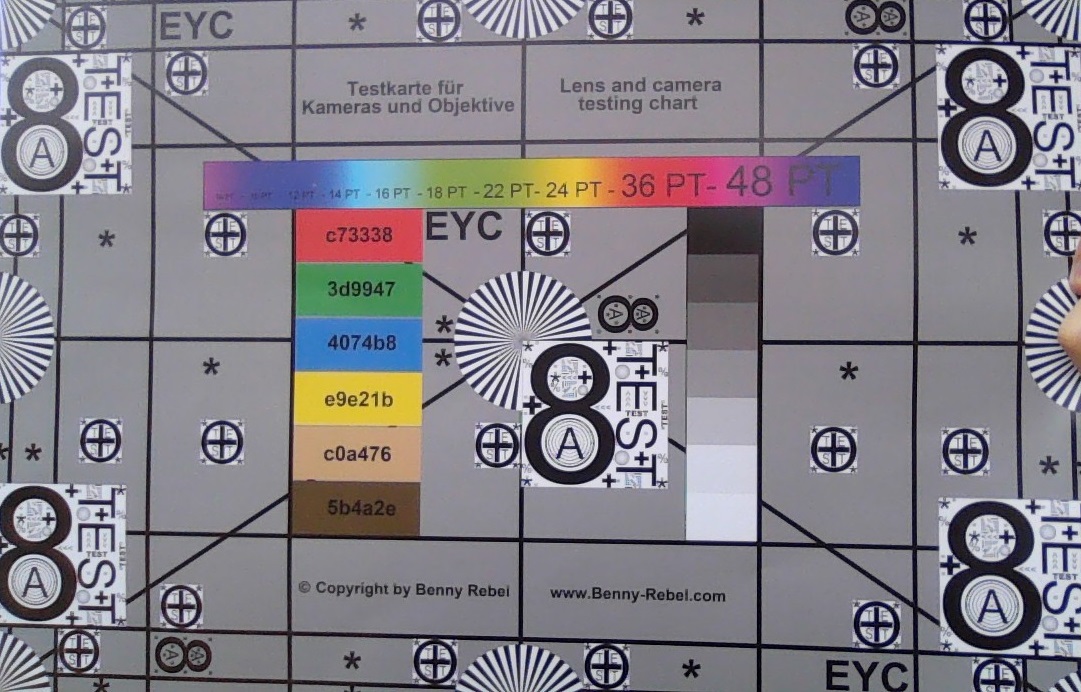
Distribution av ljusstyrkan: 89 %
Mitt på batteriet: 346 cd/m²
Kontrast: 1236:1 (Svärta: 0.28 cd/m²)
ΔE ColorChecker Calman: 4.62 | ∀{0.5-29.43 Ø4.72}
calibrated: 1.58
ΔE Greyscale Calman: 4.95 | ∀{0.09-98 Ø4.97}
94% sRGB (Argyll 1.6.3 3D)
61% AdobeRGB 1998 (Argyll 1.6.3 3D)
68.1% AdobeRGB 1998 (Argyll 3D)
94.4% sRGB (Argyll 3D)
66.7% Display P3 (Argyll 3D)
Gamma: 2.36
CCT: 7733 K
| Schenker XMG Pro 15 AU Optronics B156HAN (AUO80ED), IPS, 1920x1080, 15.6" | Asus Strix Scar III G531GW-AZ062T Sharp LQ156M1JW09 (SHP14D3), IPS, 1920x1080, 15.6" | Asus Zephyrus S GX502GW AU Optronics B156HAN08.2 (AUO82ED), IPS, 1920x1080, 15.6" | MSI GE65 Raider 9SF-049US Sharp LQ156M1JW03, IPS, 1920x1080, 15.6" | Schenker XMG Ultra 15 Turing AU Optronics B156HAN07.0 (AUO70ED), IPS, 1920x1080, 15.6" | |
|---|---|---|---|---|---|
| Display | 0% | -3% | 4% | -1% | |
| Display P3 Coverage (%) | 66.7 | 66.2 -1% | 64.9 -3% | 69.3 4% | 66.1 -1% |
| sRGB Coverage (%) | 94.4 | 97.1 3% | 91 -4% | 98.9 5% | 92.6 -2% |
| AdobeRGB 1998 Coverage (%) | 68.1 | 67.6 -1% | 65.9 -3% | 70.7 4% | 67.1 -1% |
| Response Times | 17% | 40% | 12% | -8% | |
| Response Time Grey 50% / Grey 80% * (ms) | 17.2 ? | 15 ? 13% | 7.2 ? 58% | 13.2 ? 23% | 17.6 ? -2% |
| Response Time Black / White * (ms) | 11.2 ? | 9 ? 20% | 8.8 ? 21% | 11.2 ? -0% | 12.8 ? -14% |
| PWM Frequency (Hz) | 250 ? | 23150 ? | |||
| Screen | -7% | 0% | 9% | 1% | |
| Brightness middle (cd/m²) | 346 | 309 -11% | 286 -17% | 277.4 -20% | 263 -24% |
| Brightness (cd/m²) | 346 | 284 -18% | 275 -21% | 264 -24% | 264 -24% |
| Brightness Distribution (%) | 89 | 88 -1% | 90 1% | 90 1% | 89 0% |
| Black Level * (cd/m²) | 0.28 | 0.42 -50% | 0.37 -32% | 0.24 14% | 0.17 39% |
| Contrast (:1) | 1236 | 736 -40% | 773 -37% | 1156 -6% | 1547 25% |
| Colorchecker dE 2000 * | 4.62 | 3.99 14% | 2.19 53% | 1.51 67% | 4.45 4% |
| Colorchecker dE 2000 max. * | 8.93 | 8.3 7% | 4.4 51% | 4.93 45% | 8.33 7% |
| Colorchecker dE 2000 calibrated * | 1.58 | 1.12 29% | 2.27 -44% | 1.77 -12% | 1.93 -22% |
| Greyscale dE 2000 * | 4.95 | 5.43 -10% | 2.2 56% | 3.7 25% | 4.77 4% |
| Gamma | 2.36 93% | 2.57 86% | 2.41 91% | 2.23 99% | 2.52 87% |
| CCT | 7733 84% | 7767 84% | 6405 101% | 7061 92% | 7767 84% |
| Color Space (Percent of AdobeRGB 1998) (%) | 61 | 63 3% | 59 -3% | 65.1 7% | 60 -2% |
| Color Space (Percent of sRGB) (%) | 94 | 97 3% | 91 -3% | 99.1 5% | 93 -1% |
| Totalt genomsnitt (program/inställningar) | 3% /
-3% | 12% /
5% | 8% /
9% | -3% /
-1% |
* ... mindre är bättre
Visa svarstider
| ↔ Svarstid svart till vitt | ||
|---|---|---|
| 11.2 ms ... stiga ↗ och falla ↘ kombinerat | ↗ 6 ms stiga | 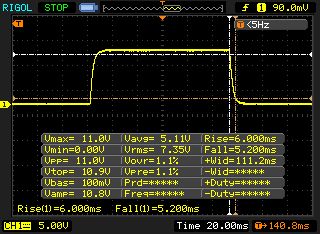 |
| ↘ 5.2 ms hösten | ||
| Skärmen visar bra svarsfrekvens i våra tester, men kan vara för långsam för konkurrenskraftiga spelare. I jämförelse sträcker sig alla testade enheter från 0.1 (minst) till 240 (maximalt) ms. » 30 % av alla enheter är bättre. Det betyder att den uppmätta svarstiden är bättre än genomsnittet av alla testade enheter (19.9 ms). | ||
| ↔ Svarstid 50 % grått till 80 % grått | ||
| 17.2 ms ... stiga ↗ och falla ↘ kombinerat | ↗ 8 ms stiga | 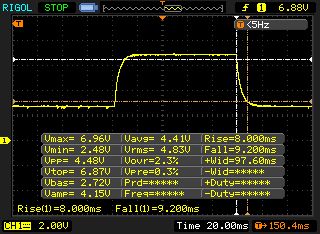 |
| ↘ 9.2 ms hösten | ||
| Skärmen visar bra svarsfrekvens i våra tester, men kan vara för långsam för konkurrenskraftiga spelare. I jämförelse sträcker sig alla testade enheter från 0.165 (minst) till 636 (maximalt) ms. » 31 % av alla enheter är bättre. Det betyder att den uppmätta svarstiden är bättre än genomsnittet av alla testade enheter (31.1 ms). | ||
Skärmflimmer / PWM (Puls-Width Modulation)
| Skärmflimmer / PWM upptäcktes inte | 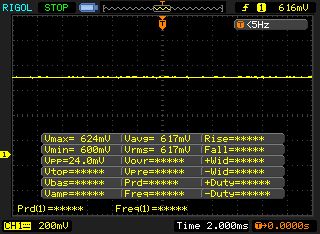 | ||
Som jämförelse: 52 % av alla testade enheter använder inte PWM för att dämpa skärmen. Om PWM upptäcktes mättes ett medelvärde av 7784 (minst: 5 - maximum: 343500) Hz. | |||
| Cinebench R15 | |
| CPU Single 64Bit | |
| Genomsnitt av klass Gaming (188.8 - 343, n=109, senaste 2 åren) | |
| Schenker XMG Ultra 15 Turing | |
| MSI GE65 Raider 9SF-049US | |
| Asus Strix Scar III G531GW-AZ062T | |
| Asus Zephyrus S GX502GW | |
| Schenker XMG Pro 15 | |
| CPU Multi 64Bit | |
| Genomsnitt av klass Gaming (1578 - 6271, n=109, senaste 2 åren) | |
| MSI GE65 Raider 9SF-049US | |
| Schenker XMG Ultra 15 Turing | |
| Asus Strix Scar III G531GW-AZ062T | |
| Asus Zephyrus S GX502GW | |
| Schenker XMG Pro 15 | |
| Cinebench R20 | |
| CPU (Single Core) | |
| Genomsnitt av klass Gaming (442 - 895, n=109, senaste 2 åren) | |
| MSI GE65 Raider 9SF-049US | |
| Asus Zephyrus S GX502GW | |
| Asus Strix Scar III G531GW-AZ062T | |
| Schenker XMG Pro 15 | |
| CPU (Multi Core) | |
| Genomsnitt av klass Gaming (4029 - 16108, n=109, senaste 2 åren) | |
| MSI GE65 Raider 9SF-049US | |
| Asus Strix Scar III G531GW-AZ062T | |
| Asus Zephyrus S GX502GW | |
| Schenker XMG Pro 15 | |
| PCMark 10 - Score | |
| Genomsnitt av klass Gaming (5828 - 11574, n=94, senaste 2 åren) | |
| Schenker XMG Ultra 15 Turing | |
| MSI GE65 Raider 9SF-049US | |
| Asus Zephyrus S GX502GW | |
| Asus Strix Scar III G531GW-AZ062T | |
| Schenker XMG Pro 15 | |
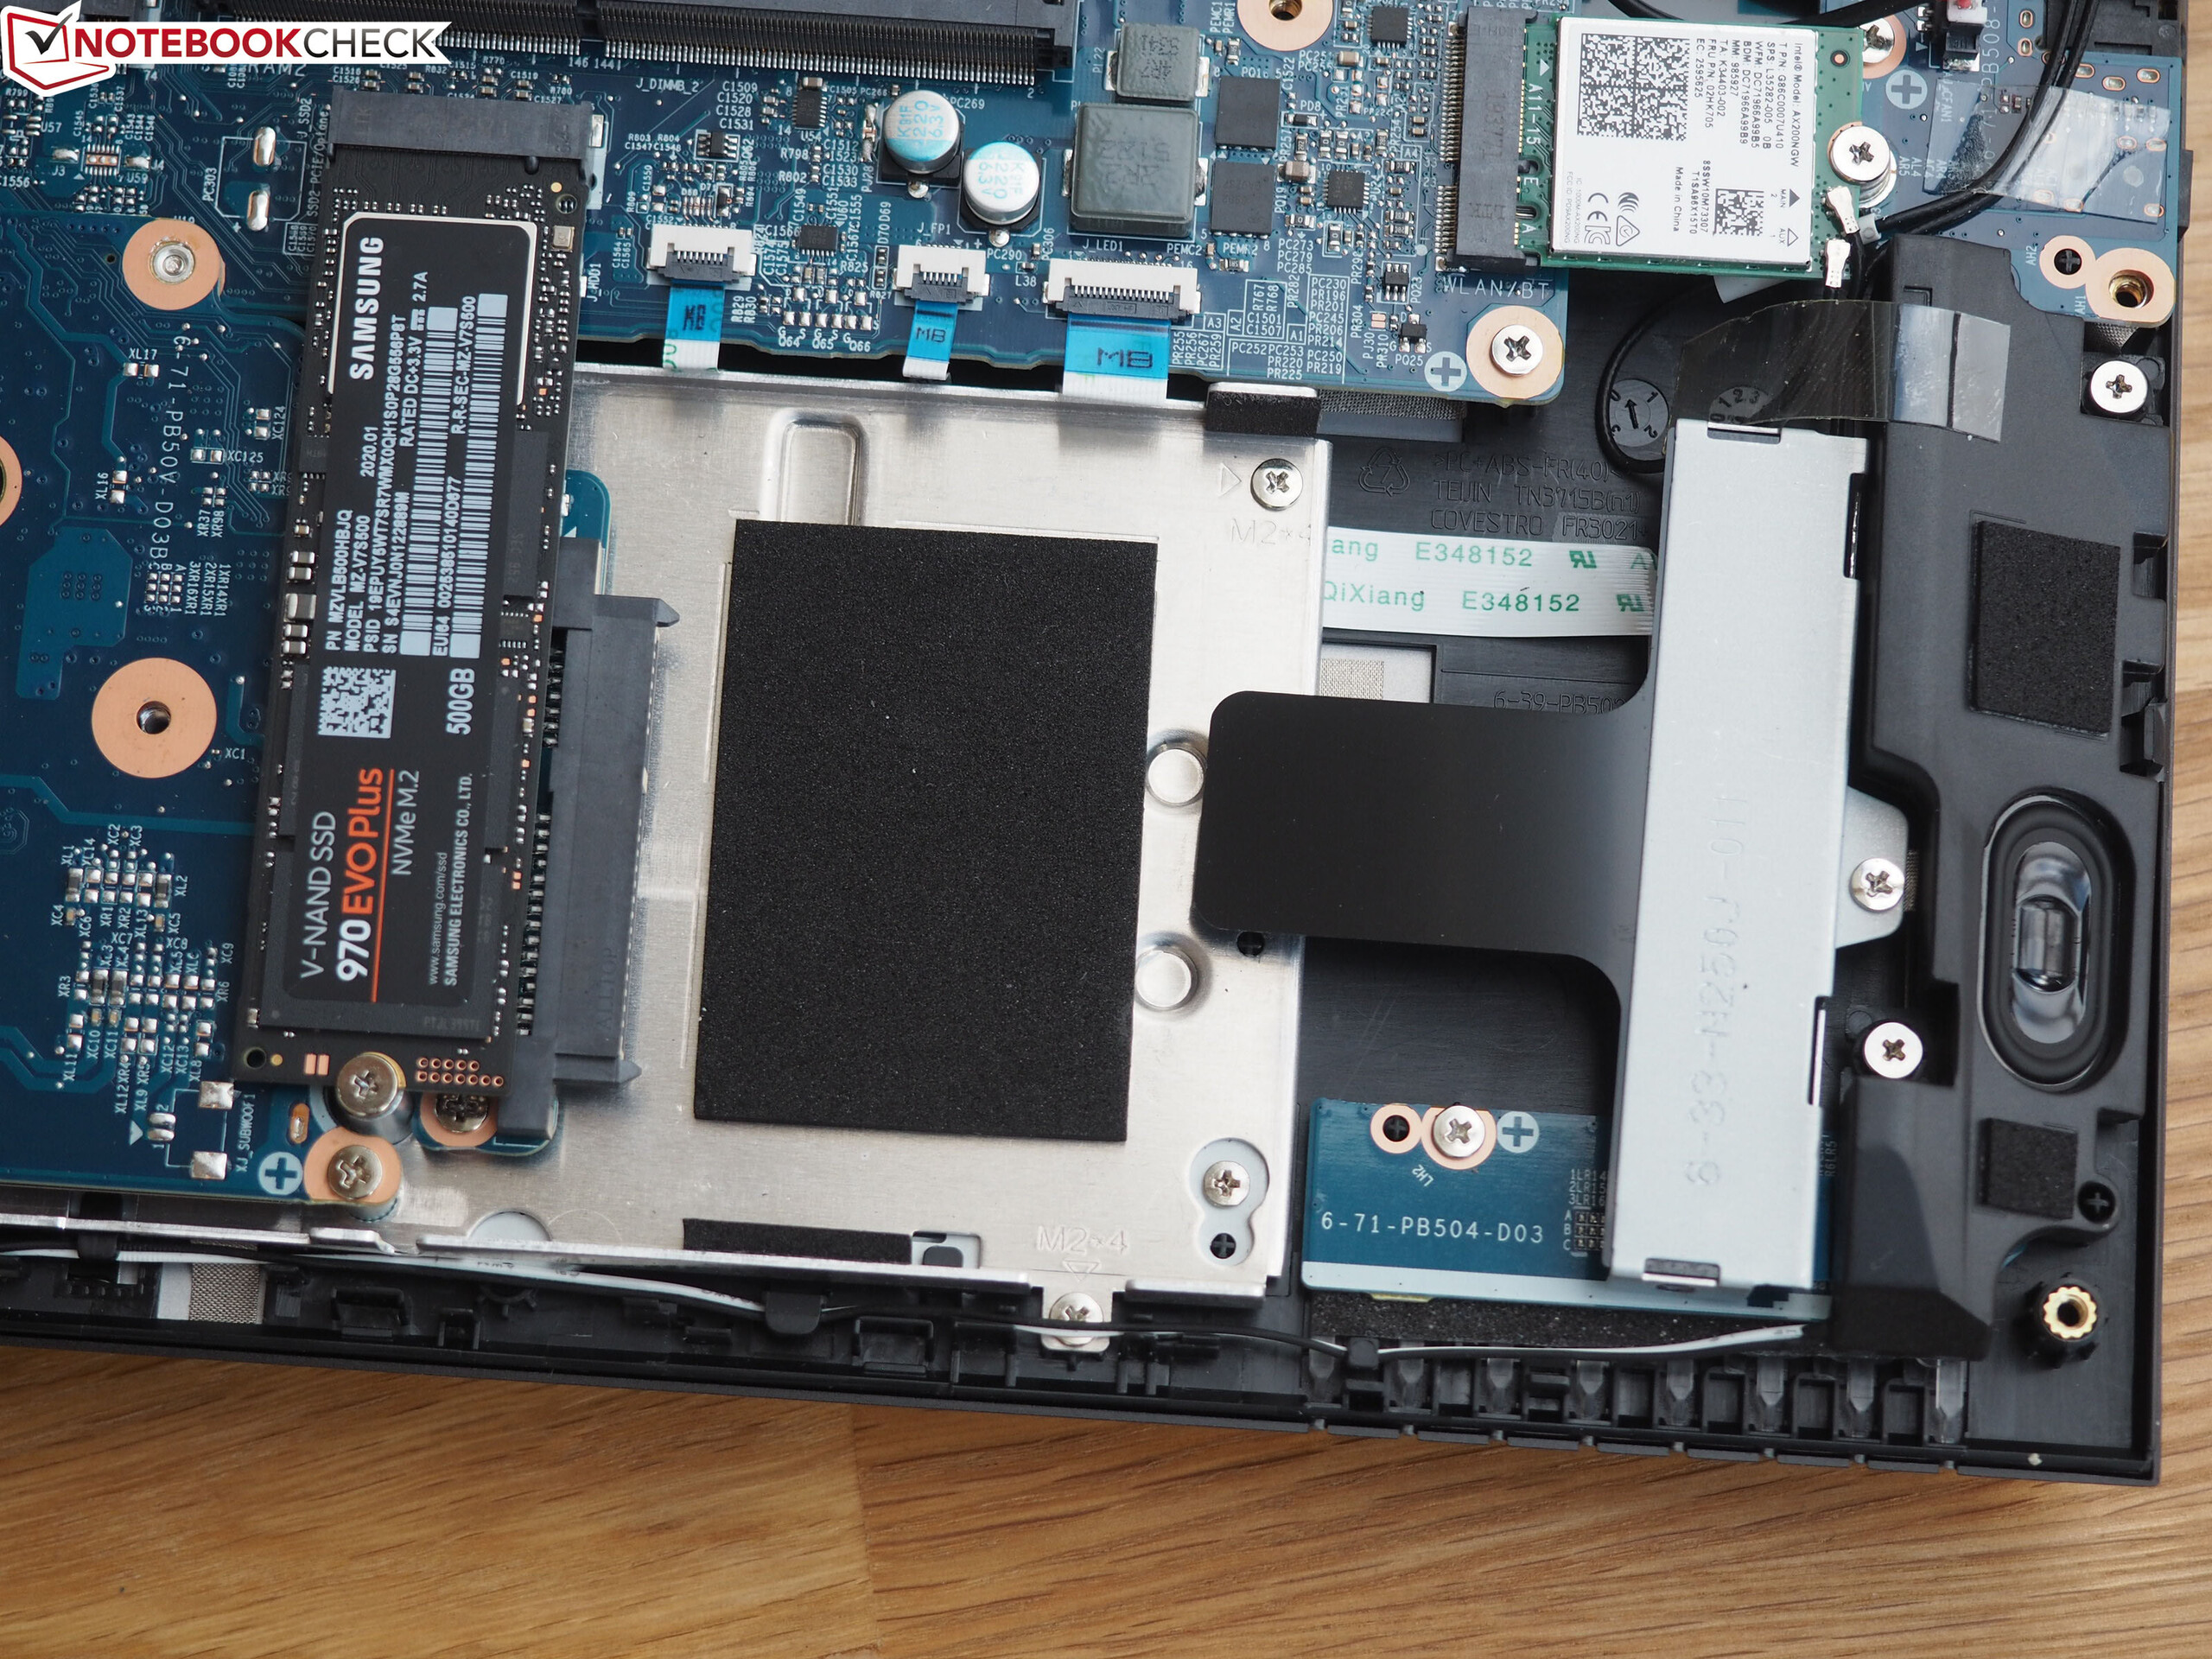
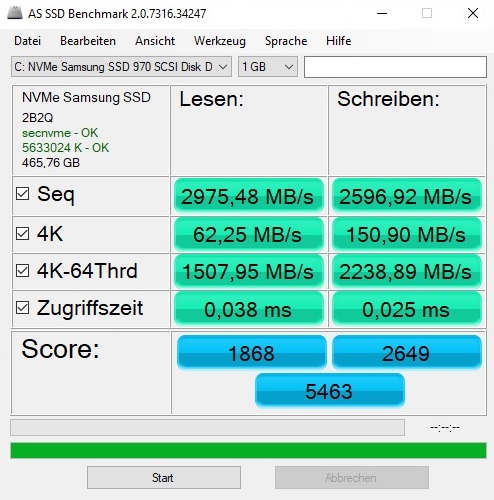
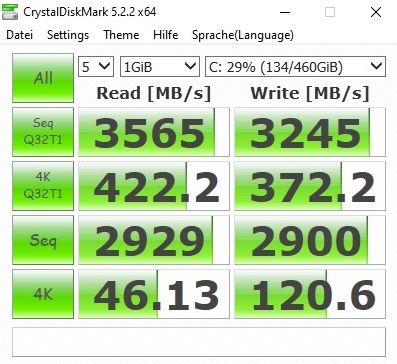
| Schenker XMG Pro 15 Samsung SSD 970 EVO Plus 500GB | Asus Strix Scar III G531GW-AZ062T Intel SSD 660p SSDPEKNW512G8 | Asus Zephyrus S GX502GW 2x Intel SSD 660p SSDPEKNW512G8 (RAID 0) | MSI GE65 Raider 9SF-049US Samsung SSD PM981 MZVLB1T0HALR | Schenker XMG Ultra 15 Turing Samsung SSD 970 EVO Plus 1TB | |
|---|---|---|---|---|---|
| CrystalDiskMark 5.2 / 6 | -32% | -19% | -6% | -12% | |
| Write 4K (MB/s) | 120.6 | 133.3 11% | 97 -20% | 125.7 4% | 129.9 8% |
| Read 4K (MB/s) | 46.13 | 55.3 20% | 49.58 7% | 45.04 -2% | 47.15 2% |
| Write Seq (MB/s) | 2900 | 980 -66% | 1838 -37% | 2361 -19% | 1840 -37% |
| Read Seq (MB/s) | 2929 | 1406 -52% | 2421 -17% | 1987 -32% | 1775 -39% |
| Write 4K Q32T1 (MB/s) | 372.2 | 286.3 -23% | 326.9 -12% | 407.1 9% | 294.5 -21% |
| Read 4K Q32T1 (MB/s) | 422.2 | 331.5 -21% | 372.9 -12% | 537 27% | 373.6 -12% |
| Write Seq Q32T1 (MB/s) | 3245 | 976 -70% | 1894 -42% | 2398 -26% | 3295 2% |
| Read Seq Q32T1 (MB/s) | 3565 | 1520 -57% | 2828 -21% | 3309 -7% | 3535 -1% |

| 3DMark 11 Performance | 20935 poäng | |
| 3DMark Cloud Gate Standard Score | 37846 poäng | |
| 3DMark Fire Strike Score | 17762 poäng | |
| 3DMark Time Spy Score | 7508 poäng | |
Hjälp | ||
| 3DMark | |
| 1920x1080 Fire Strike Graphics | |
| Genomsnitt av klass Gaming (12242 - 62849, n=118, senaste 2 åren) | |
| MSI GE65 Raider 9SF-049US | |
| Schenker XMG Pro 15 | |
| Schenker XMG Ultra 15 Turing | |
| Asus Strix Scar III G531GW-AZ062T | |
| Asus Zephyrus S GX502GW | |
| 2560x1440 Port Royal Graphics | |
| Genomsnitt av klass Gaming (4395 - 17286, n=70, senaste 2 åren) | |
| Schenker XMG Pro 15 | |
| Asus Strix Scar III G531GW-AZ062T | |
| MSI GE65 Raider 9SF-049US | |
| Schenker XMG Ultra 15 Turing | |
| Asus Zephyrus S GX502GW | |
| 3DMark 11 - 1280x720 Performance GPU | |
| Genomsnitt av klass Gaming (21841 - 80022, n=106, senaste 2 åren) | |
| Schenker XMG Ultra 15 Turing | |
| Schenker XMG Pro 15 | |
| MSI GE65 Raider 9SF-049US | |
| Asus Strix Scar III G531GW-AZ062T | |
| Asus Zephyrus S GX502GW | |
| The Witcher 3 - 1920x1080 Ultra Graphics & Postprocessing (HBAO+) | |
| Genomsnitt av klass Gaming (95 - 240, n=8, senaste 2 åren) | |
| MSI GE65 Raider 9SF-049US | |
| Schenker XMG Pro 15 | |
| Schenker XMG Ultra 15 Turing | |
| Asus Strix Scar III G531GW-AZ062T | |
| Asus Zephyrus S GX502GW | |
| låg | med. | hög | ultra | |
|---|---|---|---|---|
| The Witcher 3 (2015) | 142 | 74.4 | ||
| Dota 2 Reborn (2015) | 153 | 140 | 130 | 122 |
| X-Plane 11.11 (2018) | 110 | 95.5 | 81.1 | |
| Anno 1800 (2019) | 68.5 | 41.1 | ||
| Rage 2 (2019) | 103 | 100 | ||
| FIFA 20 (2019) | 190 | 189 | ||
| Ghost Recon Breakpoint (2019) | 89 | 67 | ||
| GRID 2019 (2019) | 104 | 75.4 | ||
| Call of Duty Modern Warfare 2019 (2019) | 113 | 92.9 | ||
| Need for Speed Heat (2019) | 83.5 | 78.1 | ||
| Star Wars Jedi Fallen Order (2019) | 92.2 | 90.7 | ||
| Red Dead Redemption 2 (2019) | 66.8 | 42.4 |
Ljudnivå
| Låg belastning |
| 30 / 32 / 40 dB(A) |
| Hög belastning |
| 56 / 56 dB(A) |
 | ||
30 dB tyst 40 dB(A) hörbar 50 dB(A) högt ljud |
||
min: | ||
| Schenker XMG Pro 15 i7-9750H, GeForce RTX 2070 Mobile | Asus Strix Scar III G531GW-AZ062T i7-9750H, GeForce RTX 2070 Mobile | Asus Zephyrus S GX502GW i7-9750H, GeForce RTX 2070 Mobile | MSI GE65 Raider 9SF-049US i9-9880H, GeForce RTX 2070 Mobile | Schenker XMG Ultra 15 Turing i7-9700K, GeForce RTX 2070 Mobile | Genomsnitt av klass Gaming | |
|---|---|---|---|---|---|---|
| Noise | 9% | 2% | 6% | -1% | 17% | |
| av / miljö * (dB) | 30 | 30 -0% | 30 -0% | 28.8 4% | 30 -0% | 24.1 ? 20% |
| Idle Minimum * (dB) | 30 | 30.6 -2% | 31 -3% | 33 -10% | 32 -7% | 25.8 ? 14% |
| Idle Average * (dB) | 32 | 30.6 4% | 33 -3% | 33 -3% | 33 -3% | 27.4 ? 14% |
| Idle Maximum * (dB) | 40 | 37.7 6% | 38 5% | 33.1 17% | 36 10% | 29.9 ? 25% |
| Load Average * (dB) | 56 | 36.5 35% | 50 11% | 38 32% | 55 2% | 43 ? 23% |
| Witcher 3 ultra * (dB) | 55 | 52.1 5% | 53 4% | 52.9 4% | 57 -4% | |
| Load Maximum * (dB) | 56 | 48.1 14% | 56 -0% | 57.8 -3% | 59 -5% | 54 ? 4% |
* ... mindre är bättre
(±) Den maximala temperaturen på ovansidan är 43 °C / 109 F, jämfört med genomsnittet av 40.4 °C / 105 F , allt från 21.2 till 68.8 °C för klassen Gaming.
(±) Botten värms upp till maximalt 43 °C / 109 F, jämfört med genomsnittet av 43.2 °C / 110 F
(+) Vid tomgångsbruk är medeltemperaturen för ovansidan 26.4 °C / 80 F, jämfört med enhetsgenomsnittet på 33.9 °C / ### class_avg_f### F.
(±) När du spelar The Witcher 3 är medeltemperaturen för ovansidan 36.3 °C / 97 F, jämfört med enhetsgenomsnittet på 33.9 °C / ## #class_avg_f### F.
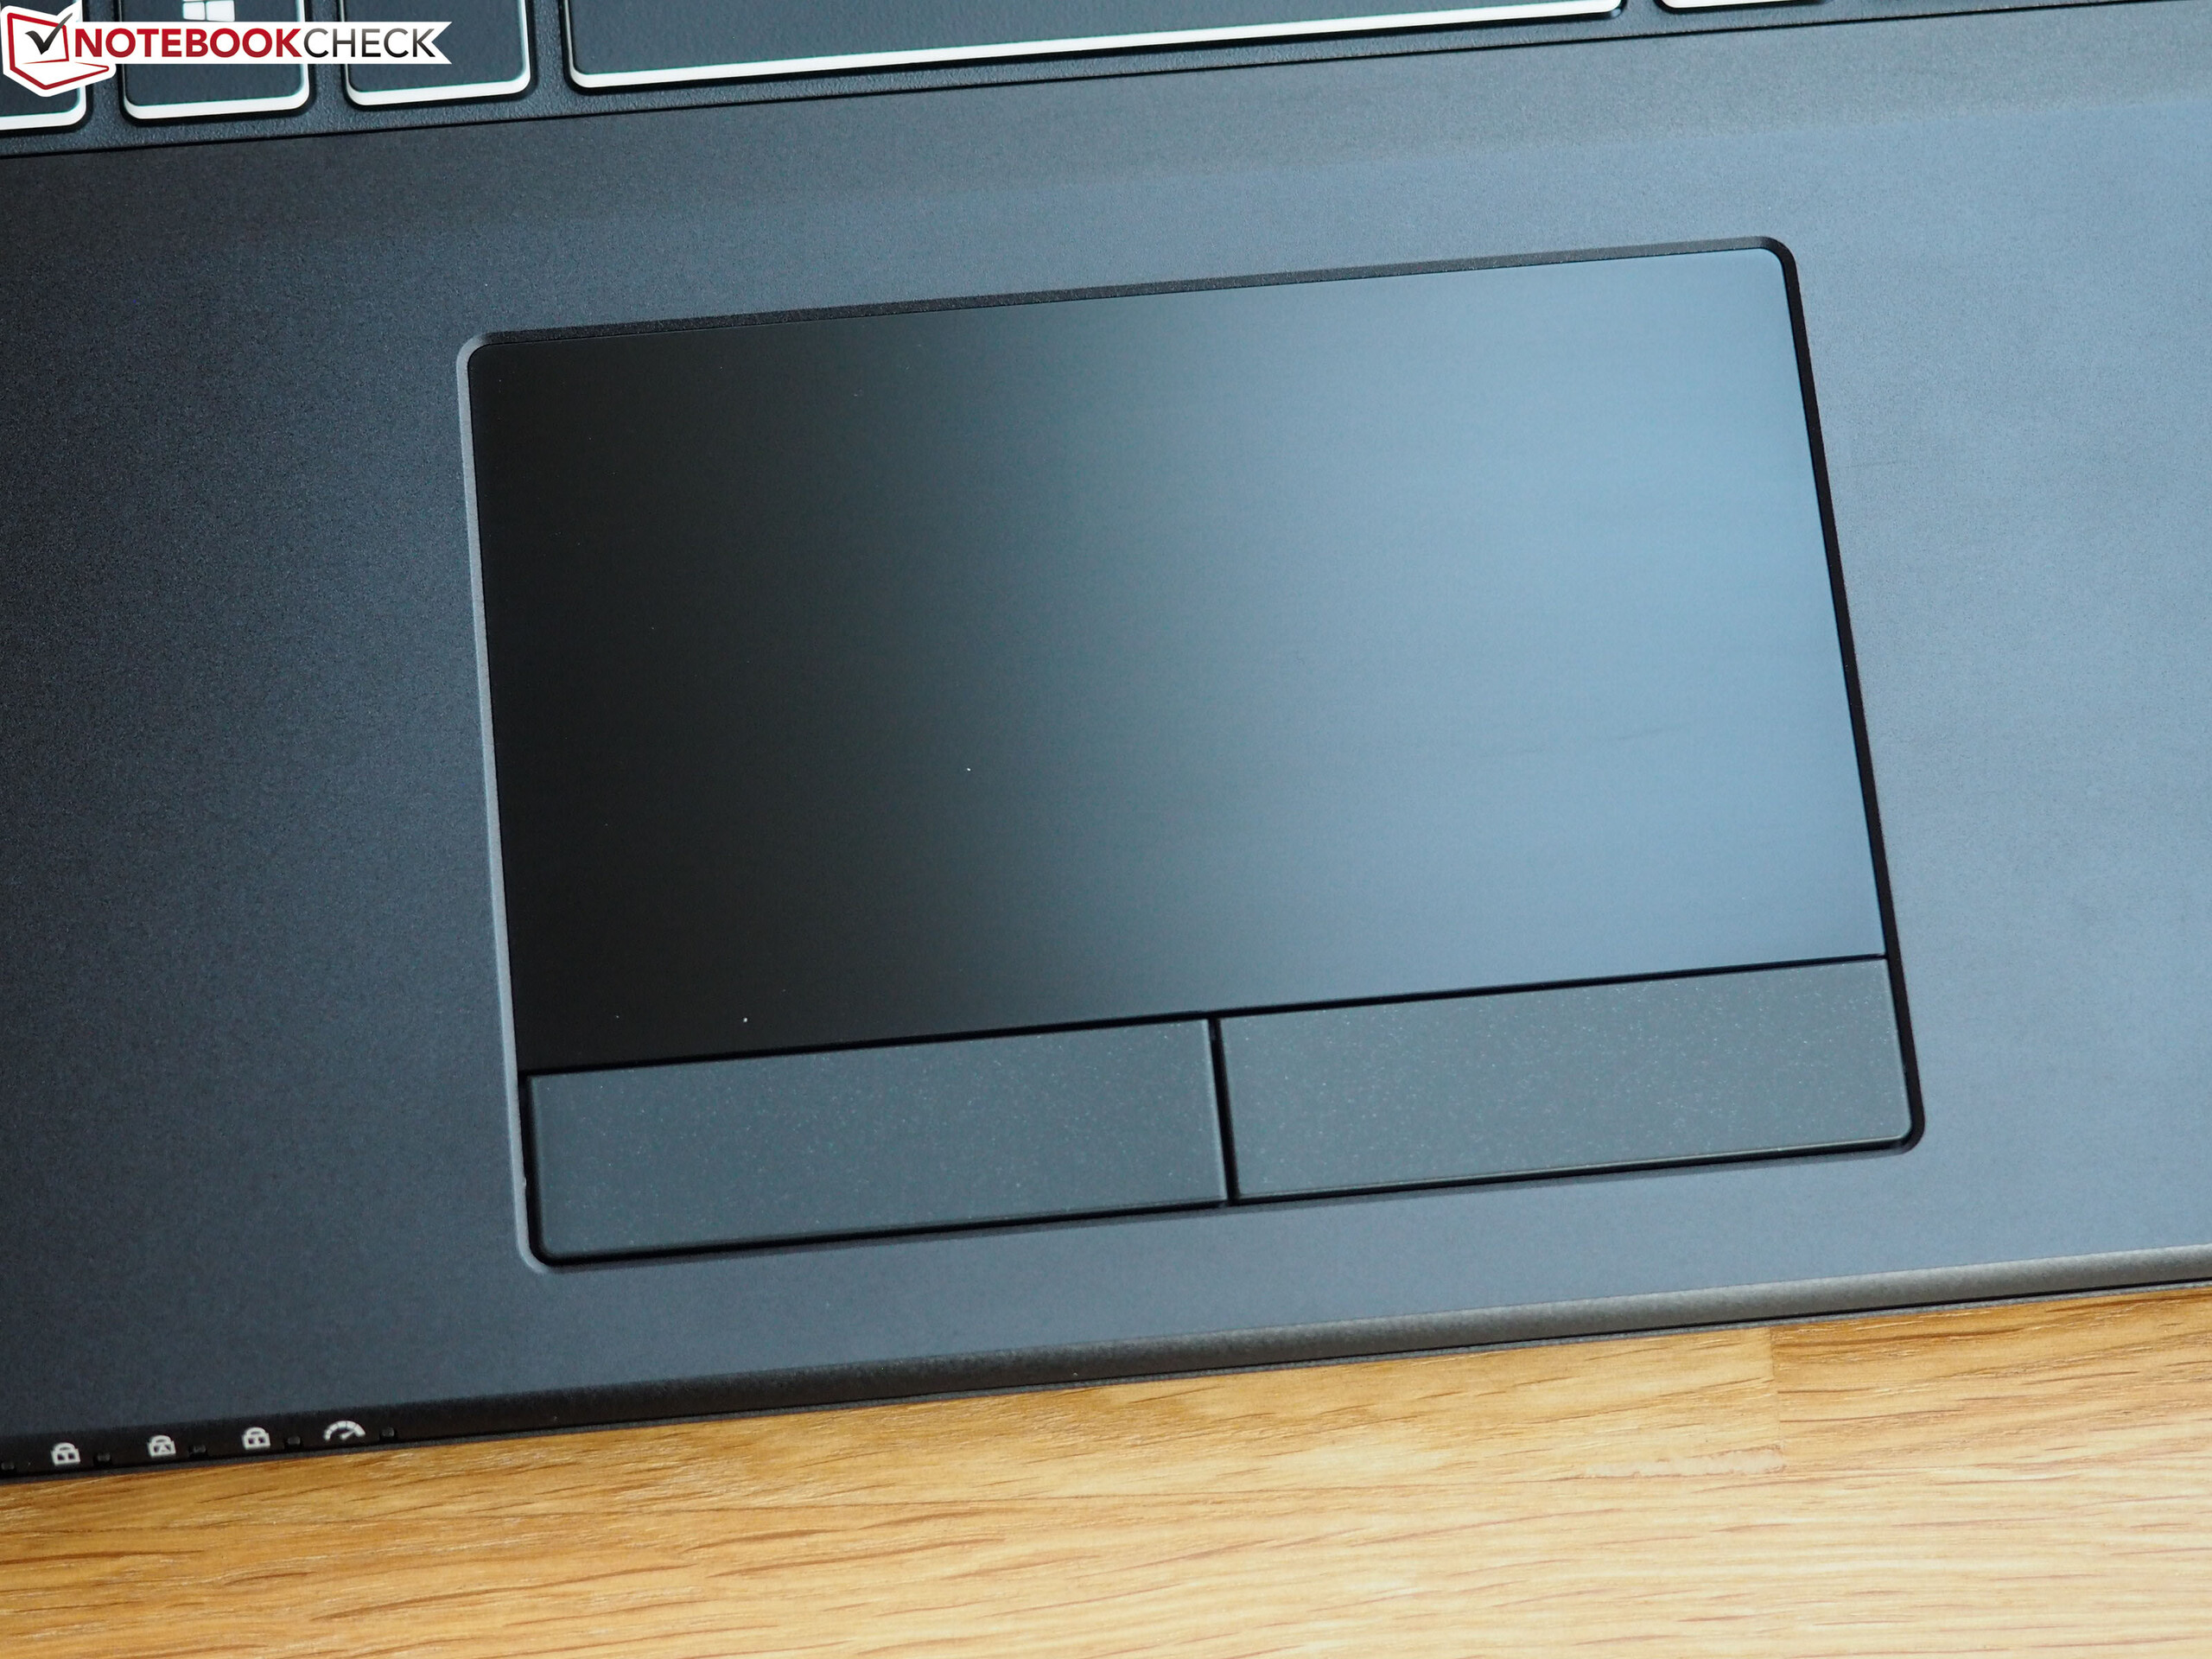
(+) Handledsstöden och pekplattan är kallare än hudtemperaturen med maximalt 31 °C / 87.8 F och är därför svala att ta på.
(-) Medeltemperaturen för handledsstödsområdet på liknande enheter var 28.8 °C / 83.8 F (-2.2 °C / -4 F).
| Schenker XMG Pro 15 i7-9750H, GeForce RTX 2070 Mobile | Asus Strix Scar III G531GW-AZ062T i7-9750H, GeForce RTX 2070 Mobile | Asus Zephyrus S GX502GW i7-9750H, GeForce RTX 2070 Mobile | MSI GE65 Raider 9SF-049US i9-9880H, GeForce RTX 2070 Mobile | Schenker XMG Ultra 15 Turing i7-9700K, GeForce RTX 2070 Mobile | Genomsnitt av klass Gaming | |
|---|---|---|---|---|---|---|
| Heat | -14% | -16% | -17% | -5% | -9% | |
| Maximum Upper Side * (°C) | 43 | 45.6 -6% | 54 -26% | 45 -5% | 45 -5% | 45.2 ? -5% |
| Maximum Bottom * (°C) | 43 | 55.5 -29% | 47 -9% | 53 -23% | 48 -12% | 47.9 ? -11% |
| Idle Upper Side * (°C) | 29 | 31.8 -10% | 33 -14% | 31.2 -8% | 30 -3% | 31.1 ? -7% |
| Idle Bottom * (°C) | 30 | 33.3 -11% | 34 -13% | 39 -30% | 30 -0% | 34.2 ? -14% |
* ... mindre är bättre
Schenker XMG Pro 15 ljudanalys
(+) | högtalare kan spela relativt högt (86 dB)
Bas 100 - 315 Hz
(-) | nästan ingen bas - i genomsnitt 30.4% lägre än medianen
(±) | linjäriteten för basen är genomsnittlig (11.3% delta till föregående frekvens)
Mellan 400 - 2000 Hz
(+) | balanserad mellan - endast 3.7% från medianen
(+) | mids är linjära (6.3% delta till föregående frekvens)
Högsta 2 - 16 kHz
(+) | balanserade toppar - endast 2.1% från medianen
(+) | toppar är linjära (4.3% delta till föregående frekvens)
Totalt 100 - 16 000 Hz
(±) | linjäriteten för det totala ljudet är genomsnittlig (20.2% skillnad mot median)
Jämfört med samma klass
» 71% av alla testade enheter i den här klassen var bättre, 6% liknande, 23% sämre
» Den bästa hade ett delta på 6%, genomsnittet var 18%, sämst var 132%
Jämfört med alla testade enheter
» 52% av alla testade enheter var bättre, 8% liknande, 39% sämre
» Den bästa hade ett delta på 4%, genomsnittet var 24%, sämst var 134%
Schenker XMG Ultra 15 Turing ljudanalys
(±) | högtalarljudstyrkan är genomsnittlig men bra (77 dB)
Bas 100 - 315 Hz
(±) | reducerad bas - i genomsnitt 11.1% lägre än medianen
(±) | linjäriteten för basen är genomsnittlig (12.7% delta till föregående frekvens)
Mellan 400 - 2000 Hz
(+) | balanserad mellan - endast 1.9% från medianen
(+) | mids är linjära (4.3% delta till föregående frekvens)
Högsta 2 - 16 kHz
(+) | balanserade toppar - endast 3.6% från medianen
(+) | toppar är linjära (3.3% delta till föregående frekvens)
Totalt 100 - 16 000 Hz
(+) | det totala ljudet är linjärt (14.5% skillnad mot median)
Jämfört med samma klass
» 27% av alla testade enheter i den här klassen var bättre, 7% liknande, 66% sämre
» Den bästa hade ett delta på 6%, genomsnittet var 18%, sämst var 132%
Jämfört med alla testade enheter
» 18% av alla testade enheter var bättre, 4% liknande, 78% sämre
» Den bästa hade ett delta på 4%, genomsnittet var 24%, sämst var 134%
| Av/Standby | |
| Låg belastning | |
| Hög belastning |
|
Förklaring:
min: | |
| Schenker XMG Pro 15 i7-9750H, GeForce RTX 2070 Mobile | Asus Strix Scar III G531GW-AZ062T i7-9750H, GeForce RTX 2070 Mobile | Asus Zephyrus S GX502GW i7-9750H, GeForce RTX 2070 Mobile | MSI GE65 Raider 9SF-049US i9-9880H, GeForce RTX 2070 Mobile | Schenker XMG Ultra 15 Turing i7-9700K, GeForce RTX 2070 Mobile | Genomsnitt av klass Gaming | |
|---|---|---|---|---|---|---|
| Power Consumption | 13% | -24% | 1% | -61% | 2% | |
| Idle Minimum * (Watt) | 15 | 11.4 24% | 24 -60% | 15 -0% | 35 -133% | 13.2 ? 12% |
| Idle Average * (Watt) | 19 | 13.5 29% | 27 -42% | 18.5 3% | 39 -105% | 18.9 ? 1% |
| Idle Maximum * (Watt) | 26 | 21.6 17% | 33 -27% | 20.2 22% | 47 -81% | 24.3 ? 7% |
| Load Average * (Watt) | 101 | 106 -5% | 129 -28% | 110.9 -10% | 117 -16% | 108.3 ? -7% |
| Witcher 3 ultra * (Watt) | 177 | 186 -5% | 176 1% | 187.3 -6% | 196 -11% | |
| Load Maximum * (Watt) | 245 | 196 20% | 216 12% | 260 -6% | 299 -22% | 254 ? -4% |
* ... mindre är bättre
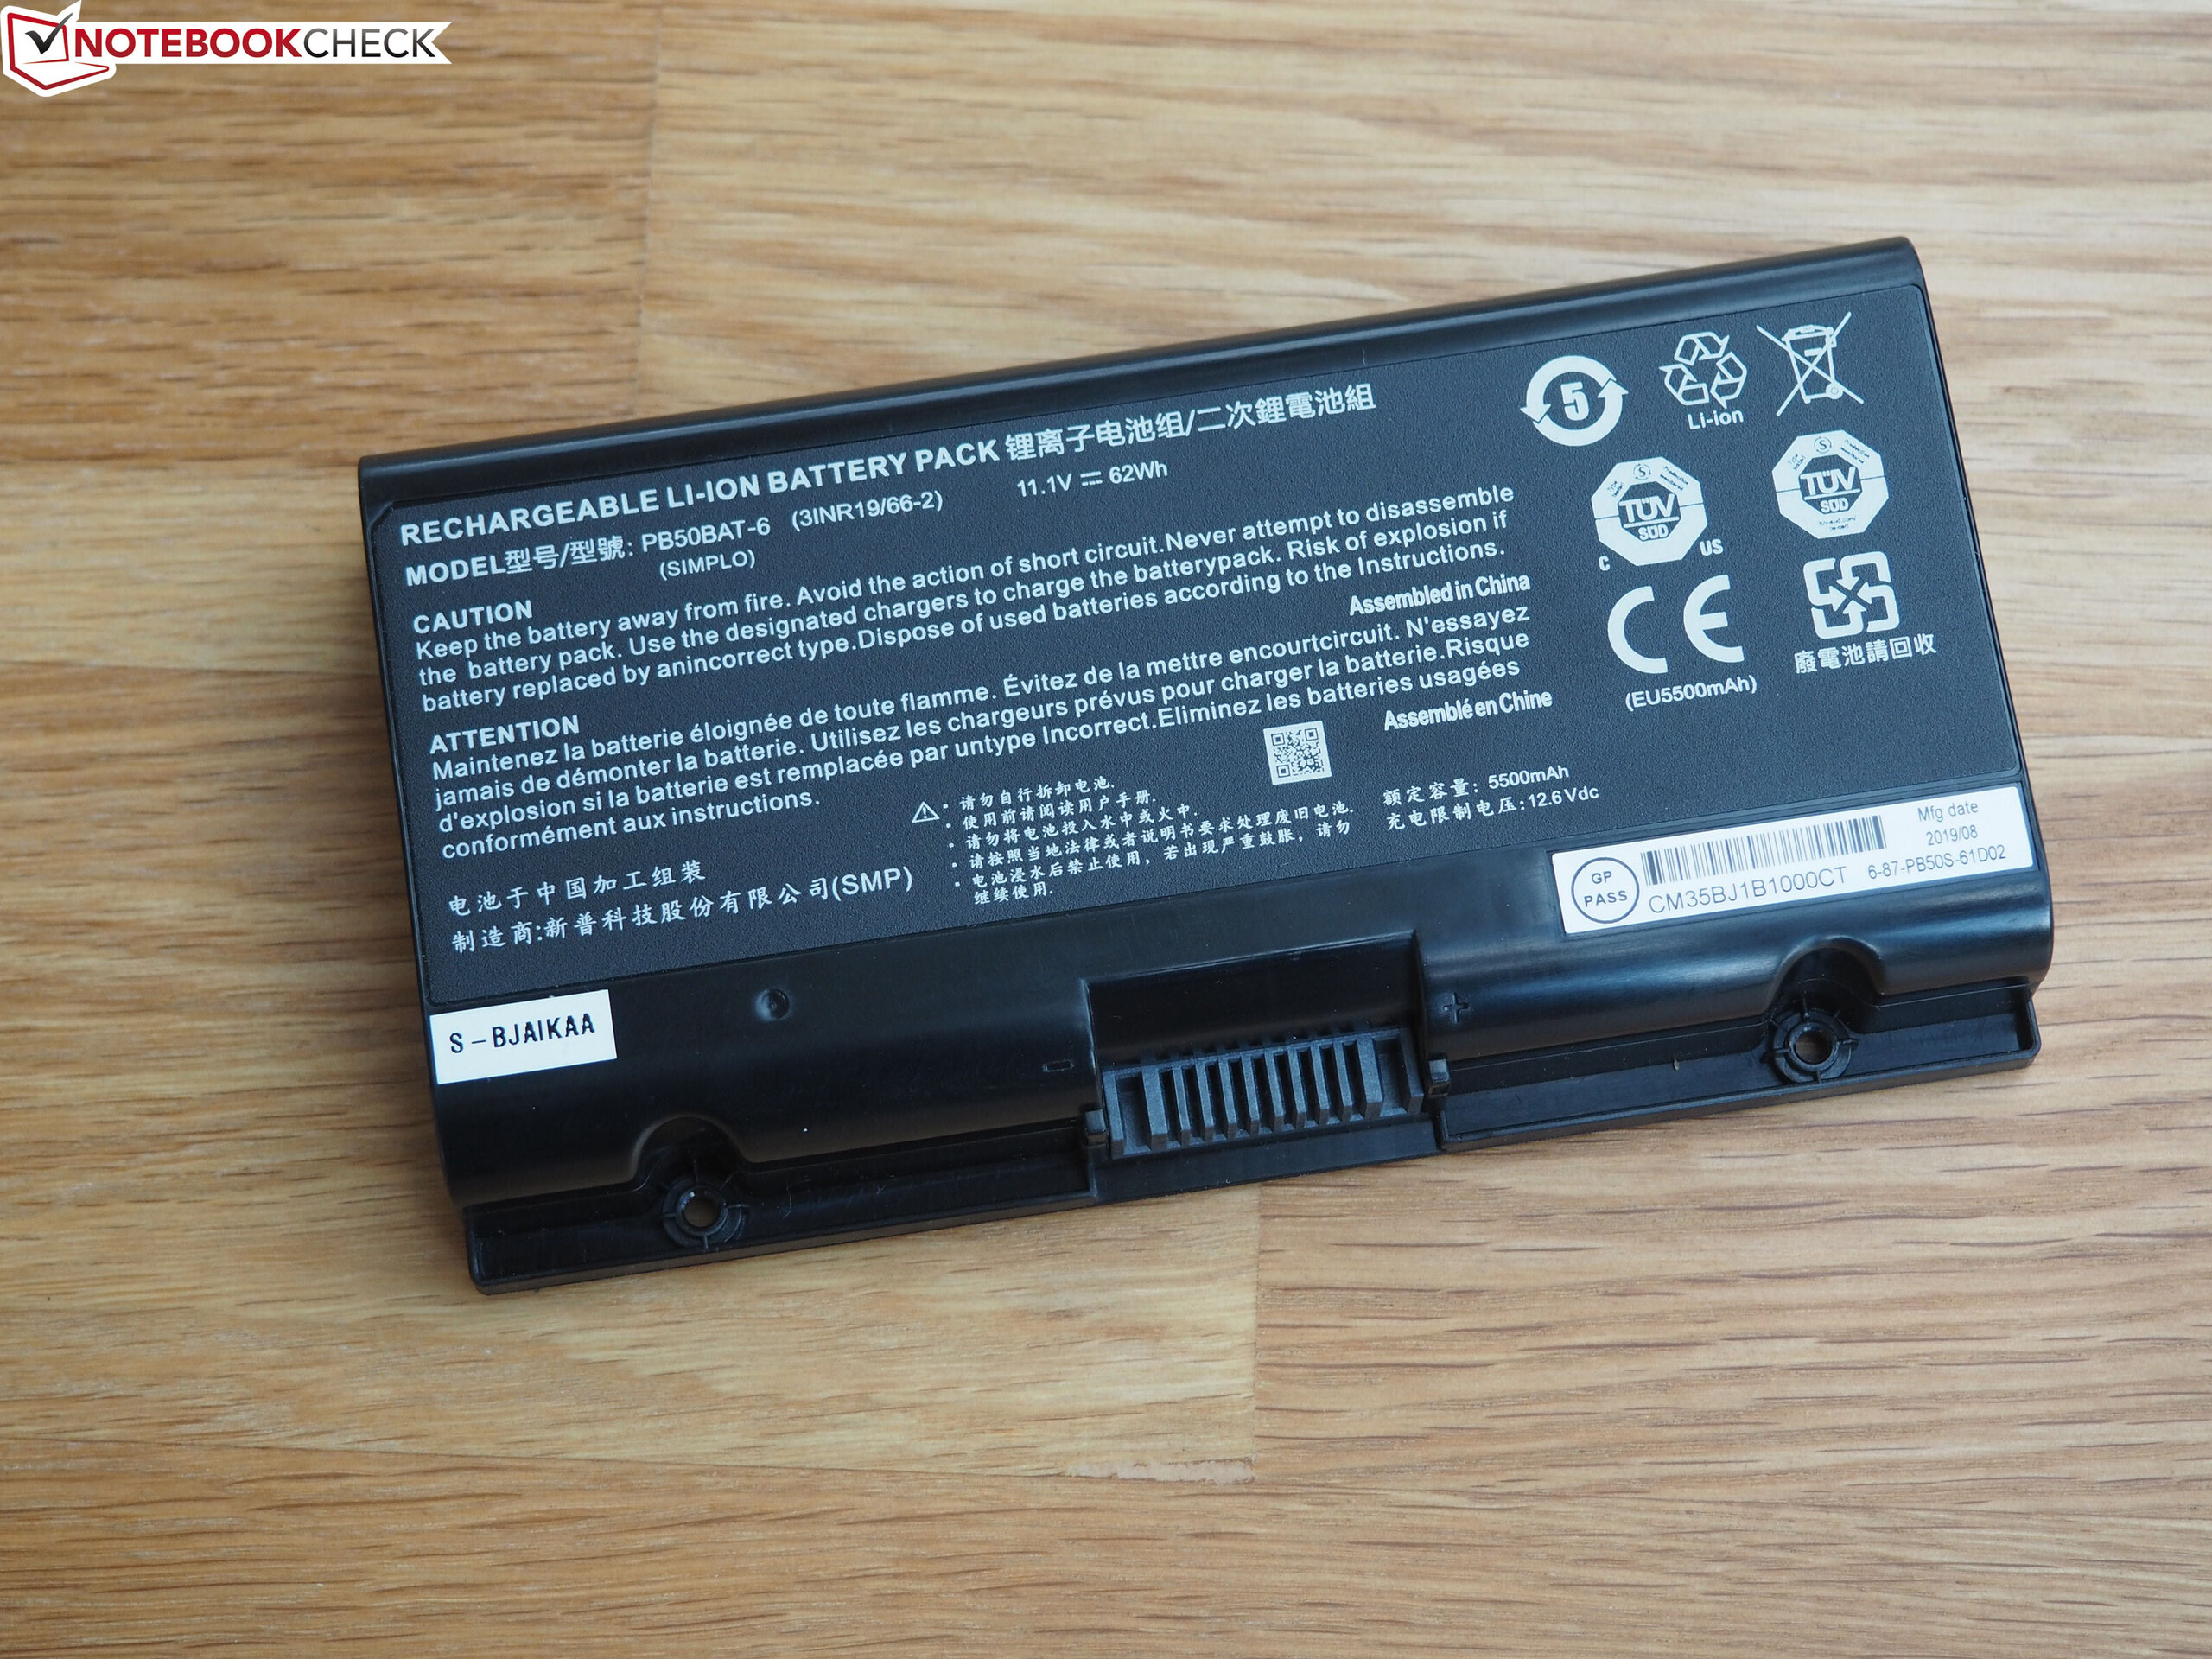
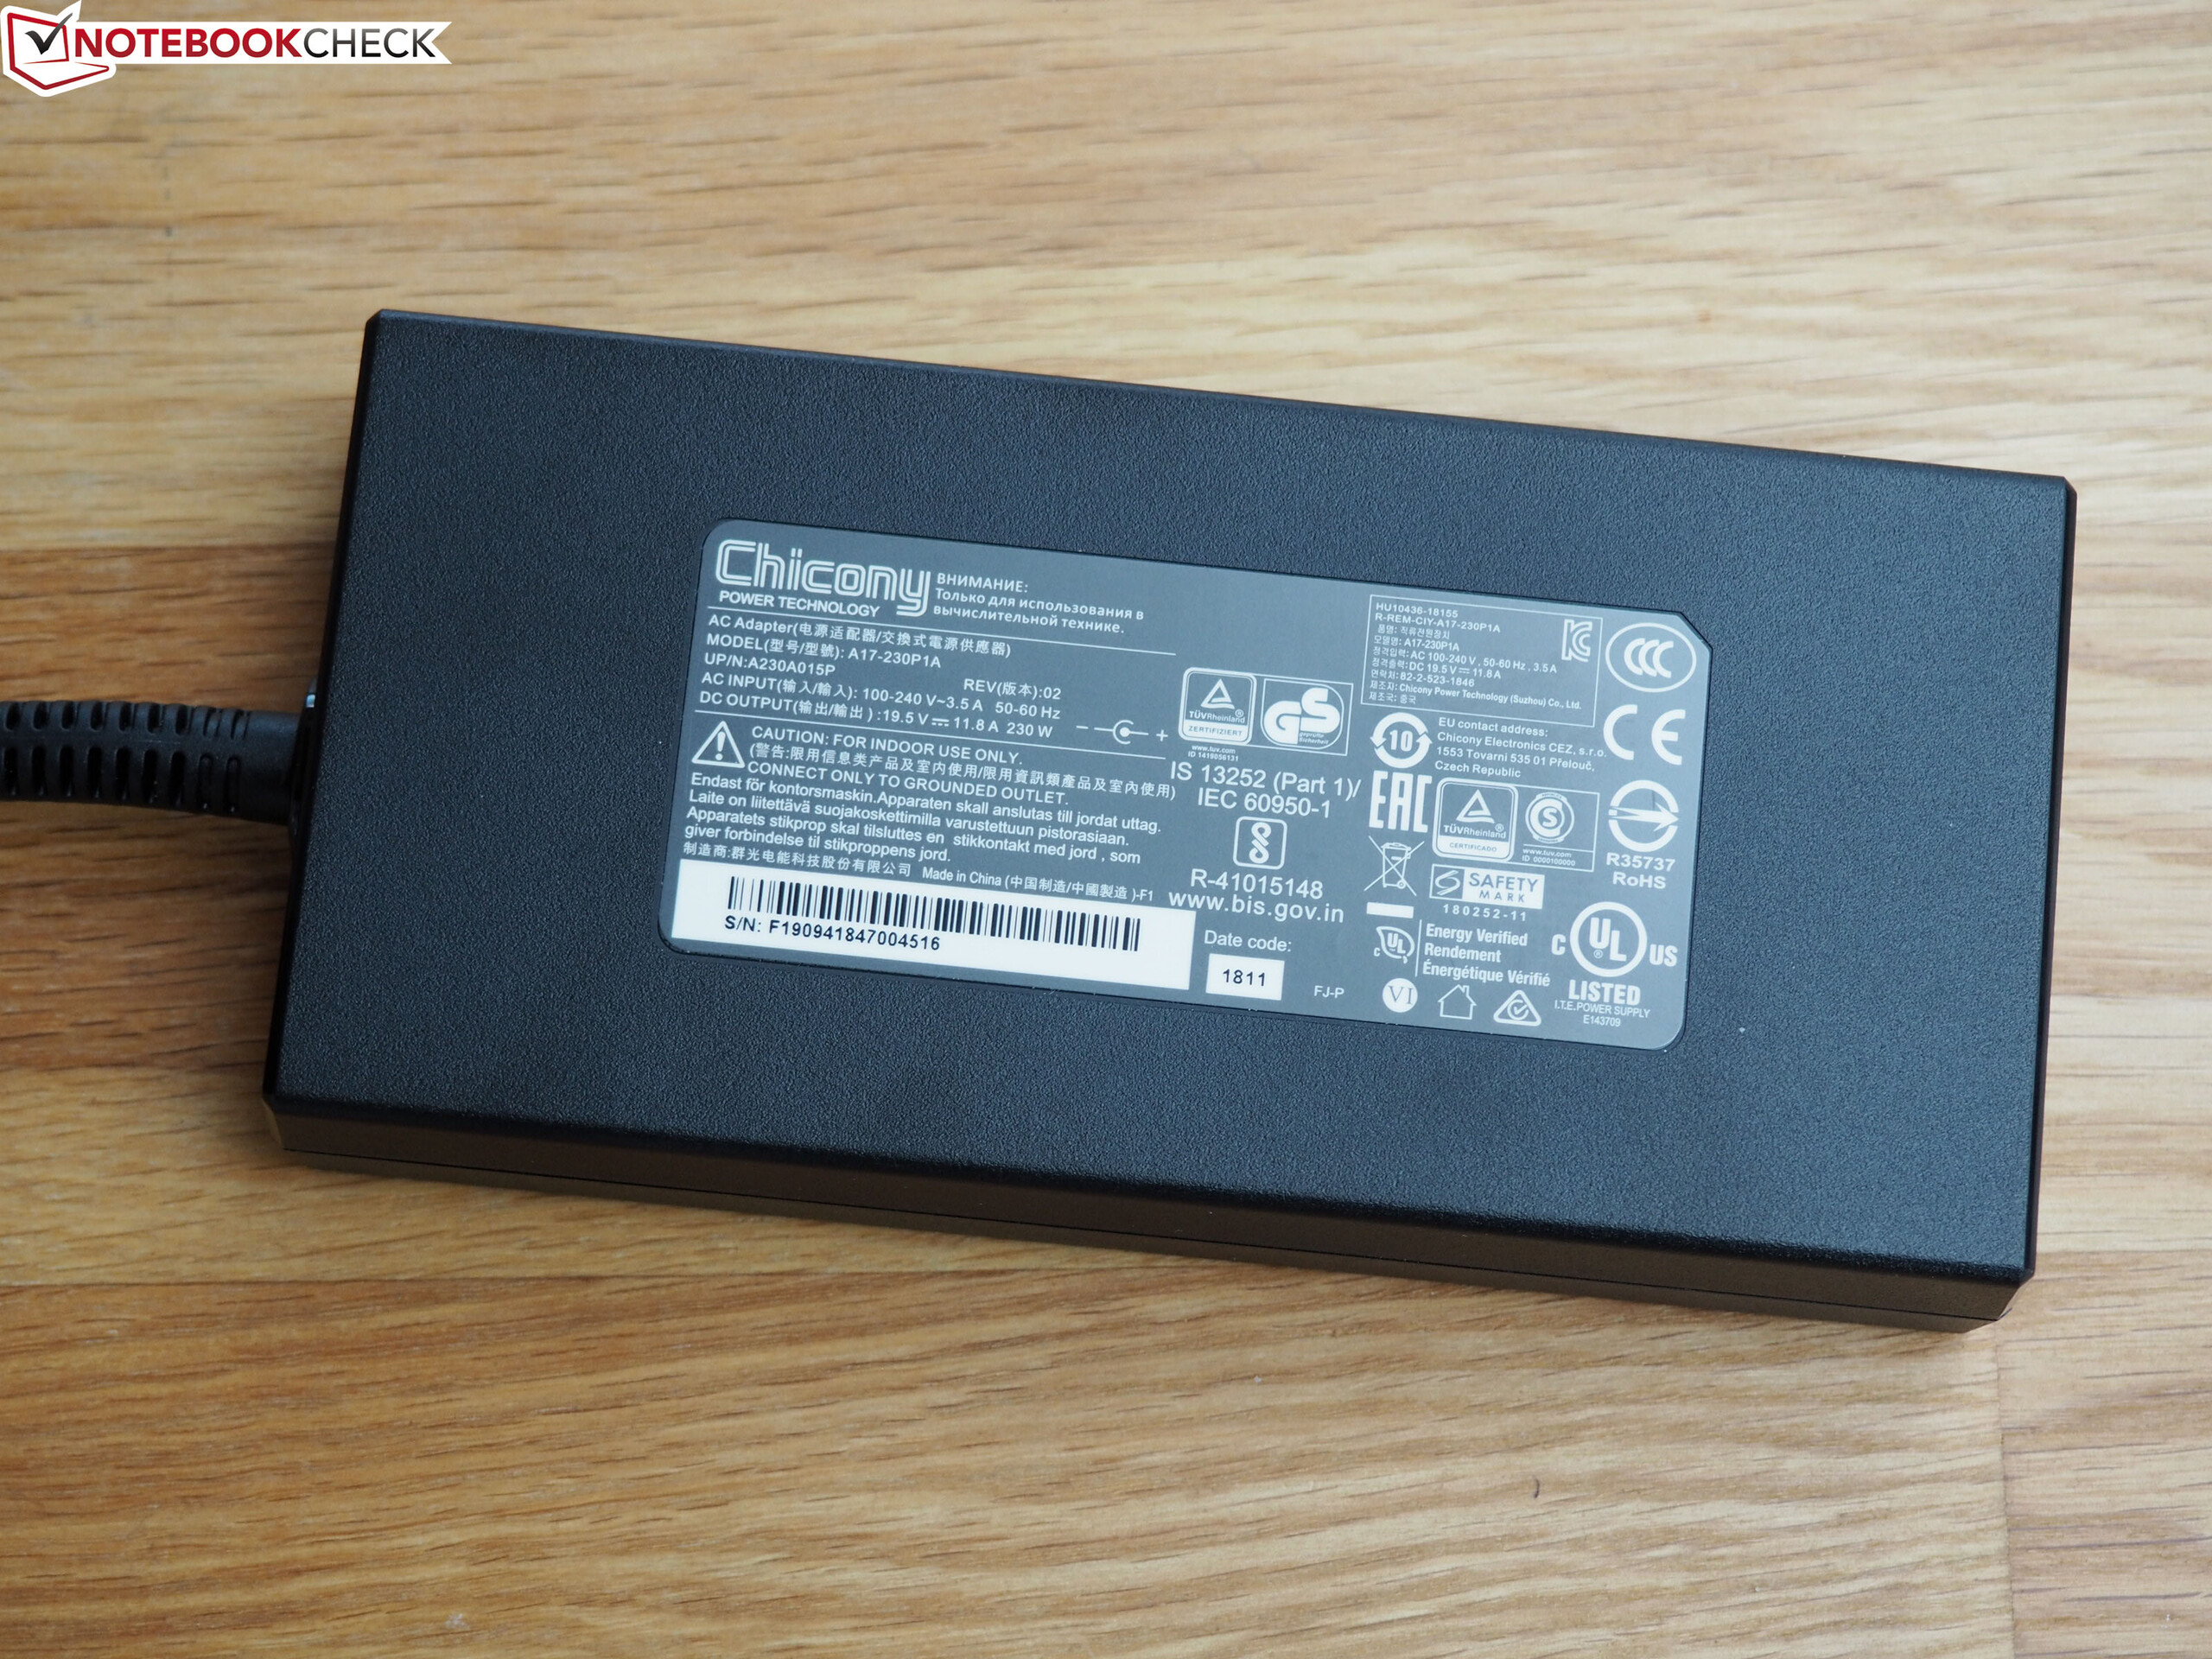
| Schenker XMG Pro 15 i7-9750H, GeForce RTX 2070 Mobile, 62 Wh | Asus Strix Scar III G531GW-AZ062T i7-9750H, GeForce RTX 2070 Mobile, 66 Wh | Asus Zephyrus S GX502GW i7-9750H, GeForce RTX 2070 Mobile, 76 Wh | MSI GE65 Raider 9SF-049US i9-9880H, GeForce RTX 2070 Mobile, 51 Wh | Schenker XMG Ultra 15 Turing i7-9700K, GeForce RTX 2070 Mobile, 82 Wh | Genomsnitt av klass Gaming | |
|---|---|---|---|---|---|---|
| Batteridrifttid | 60% | 1% | -9% | -16% | 64% | |
| Reader / Idle (h) | 5.2 | 5.9 13% | 6.2 19% | 3.2 -38% | 8.71 ? 68% | |
| WiFi v1.3 (h) | 3.5 | 5.6 60% | 3.7 6% | 3.6 3% | 2.6 -26% | 7.04 ? 101% |
| Load (h) | 1.2 | 1 -17% | 0.6 -50% | 1.4 17% | 1.47 ? 23% | |
| H.264 (h) | 2.6 | 8.26 ? |
För
Emot
Läs den fullständiga versionen av den här recensionen på engelska här.
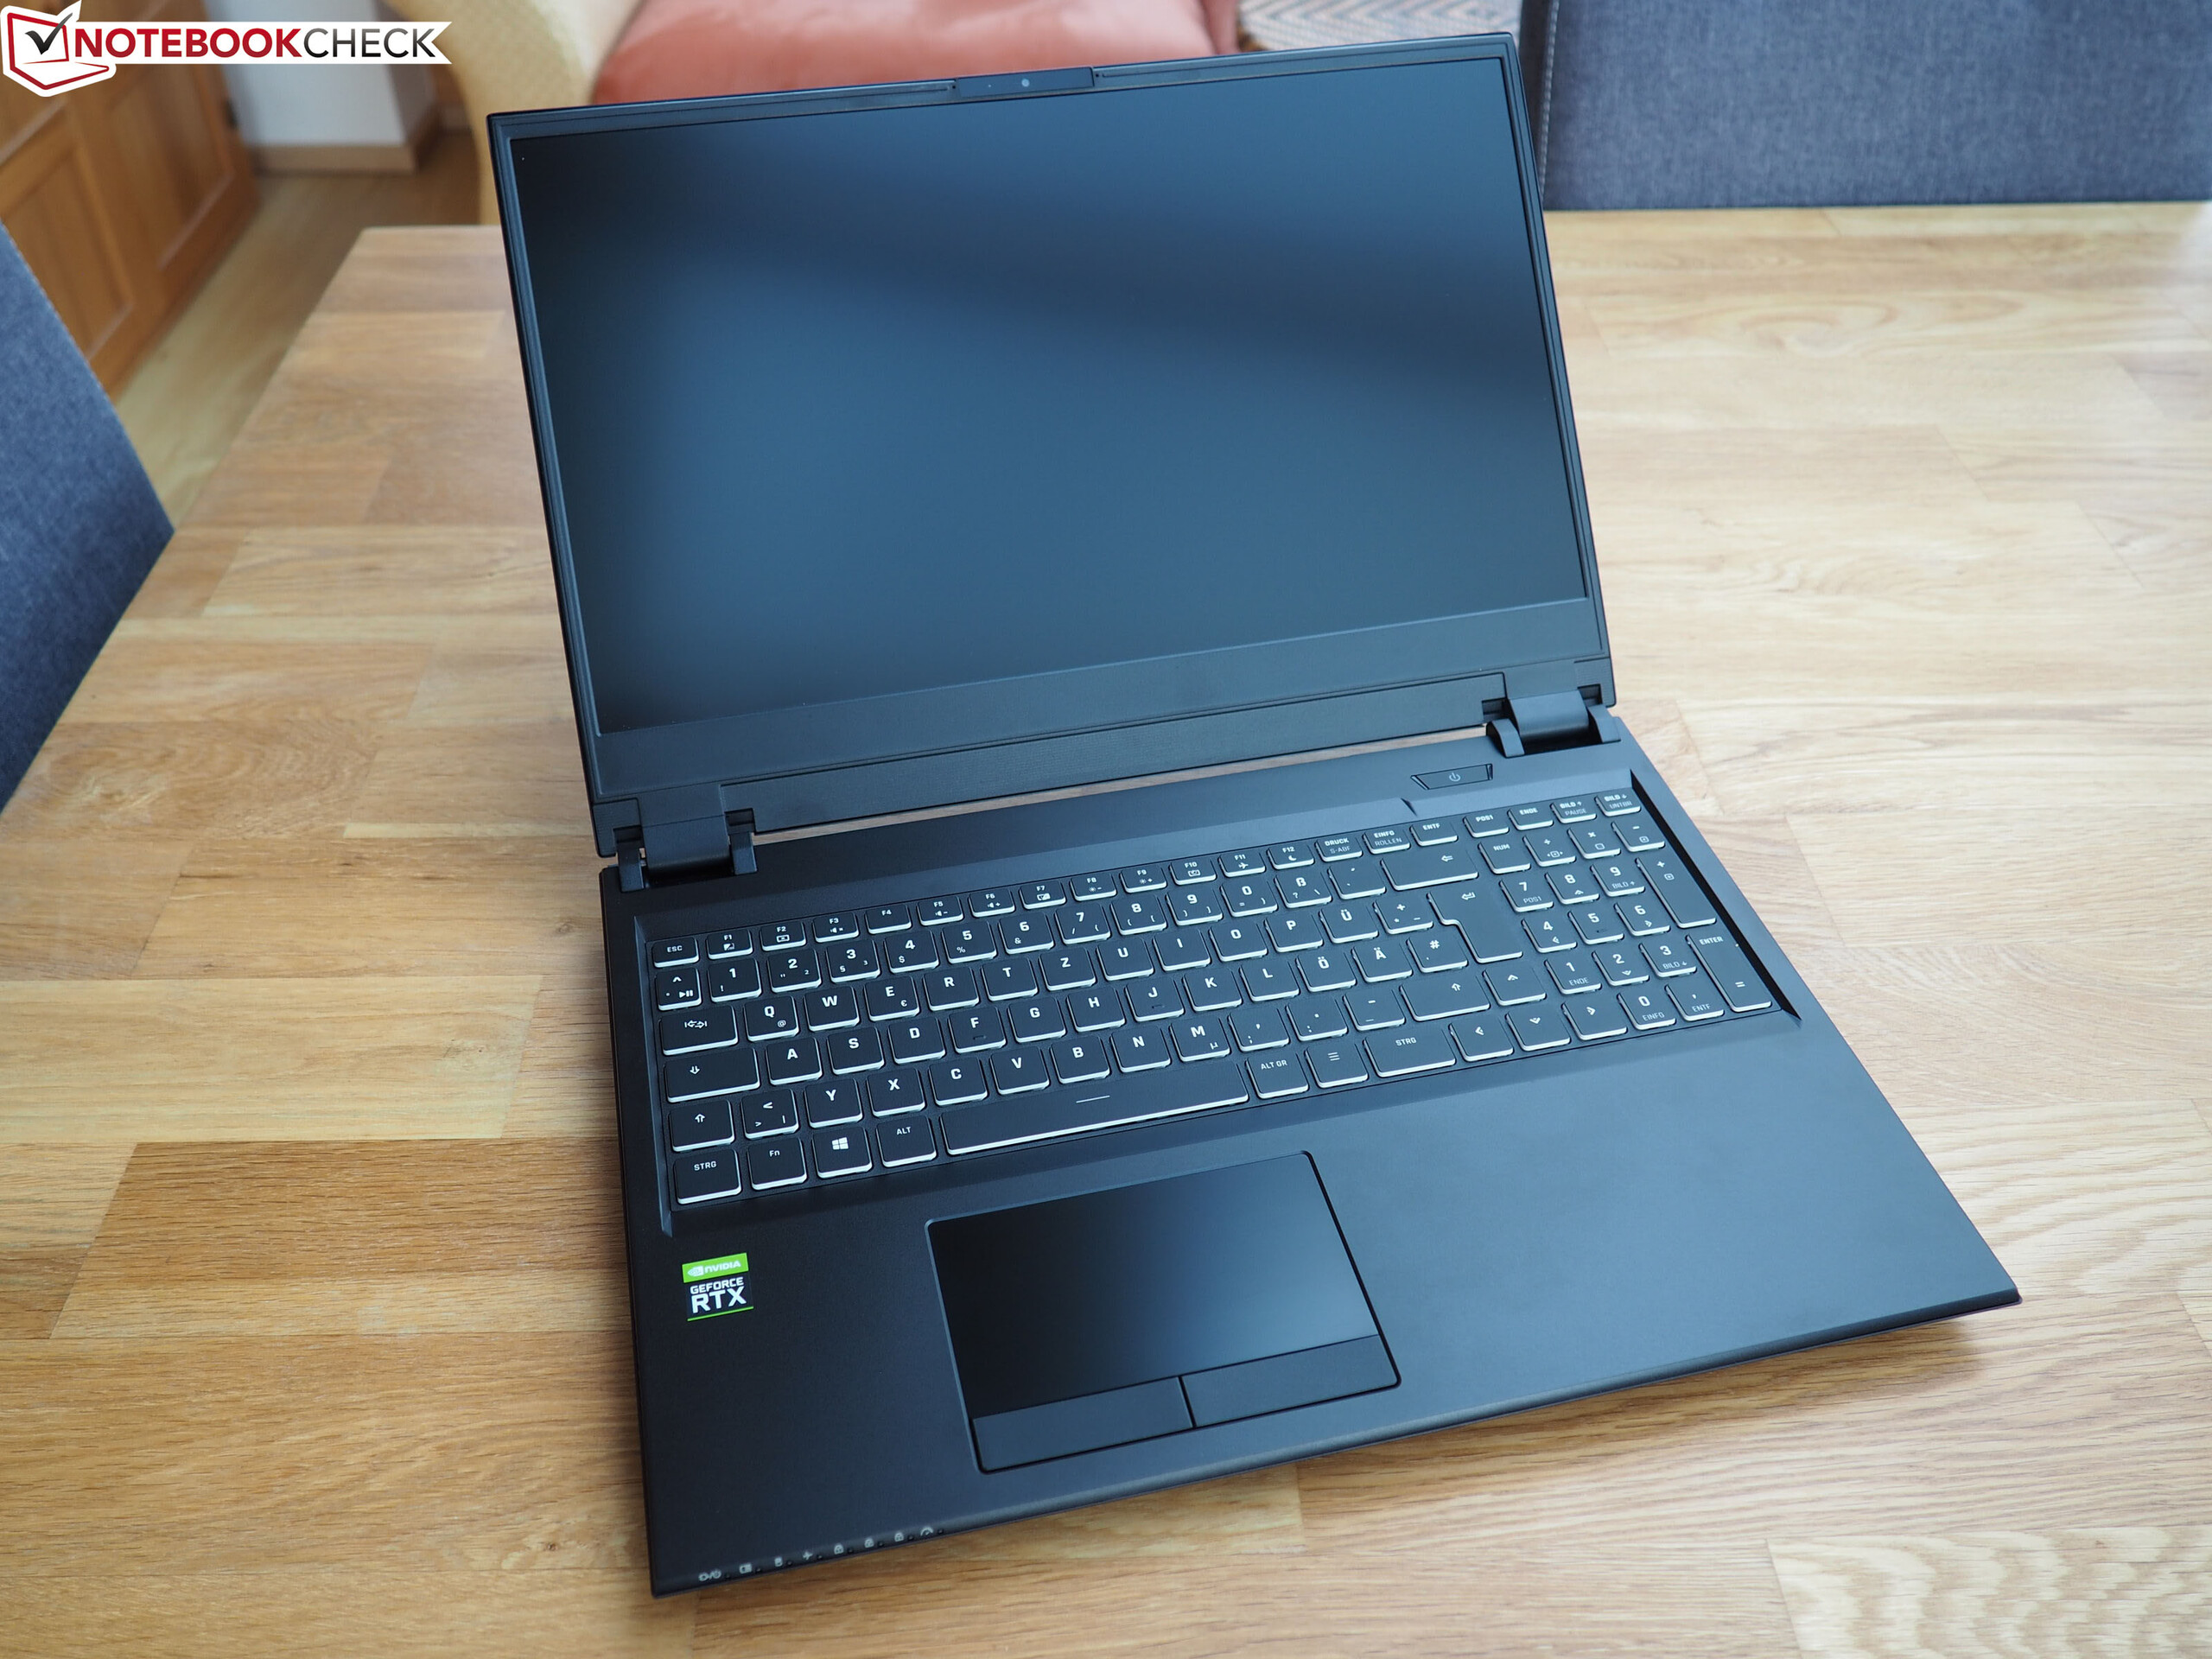
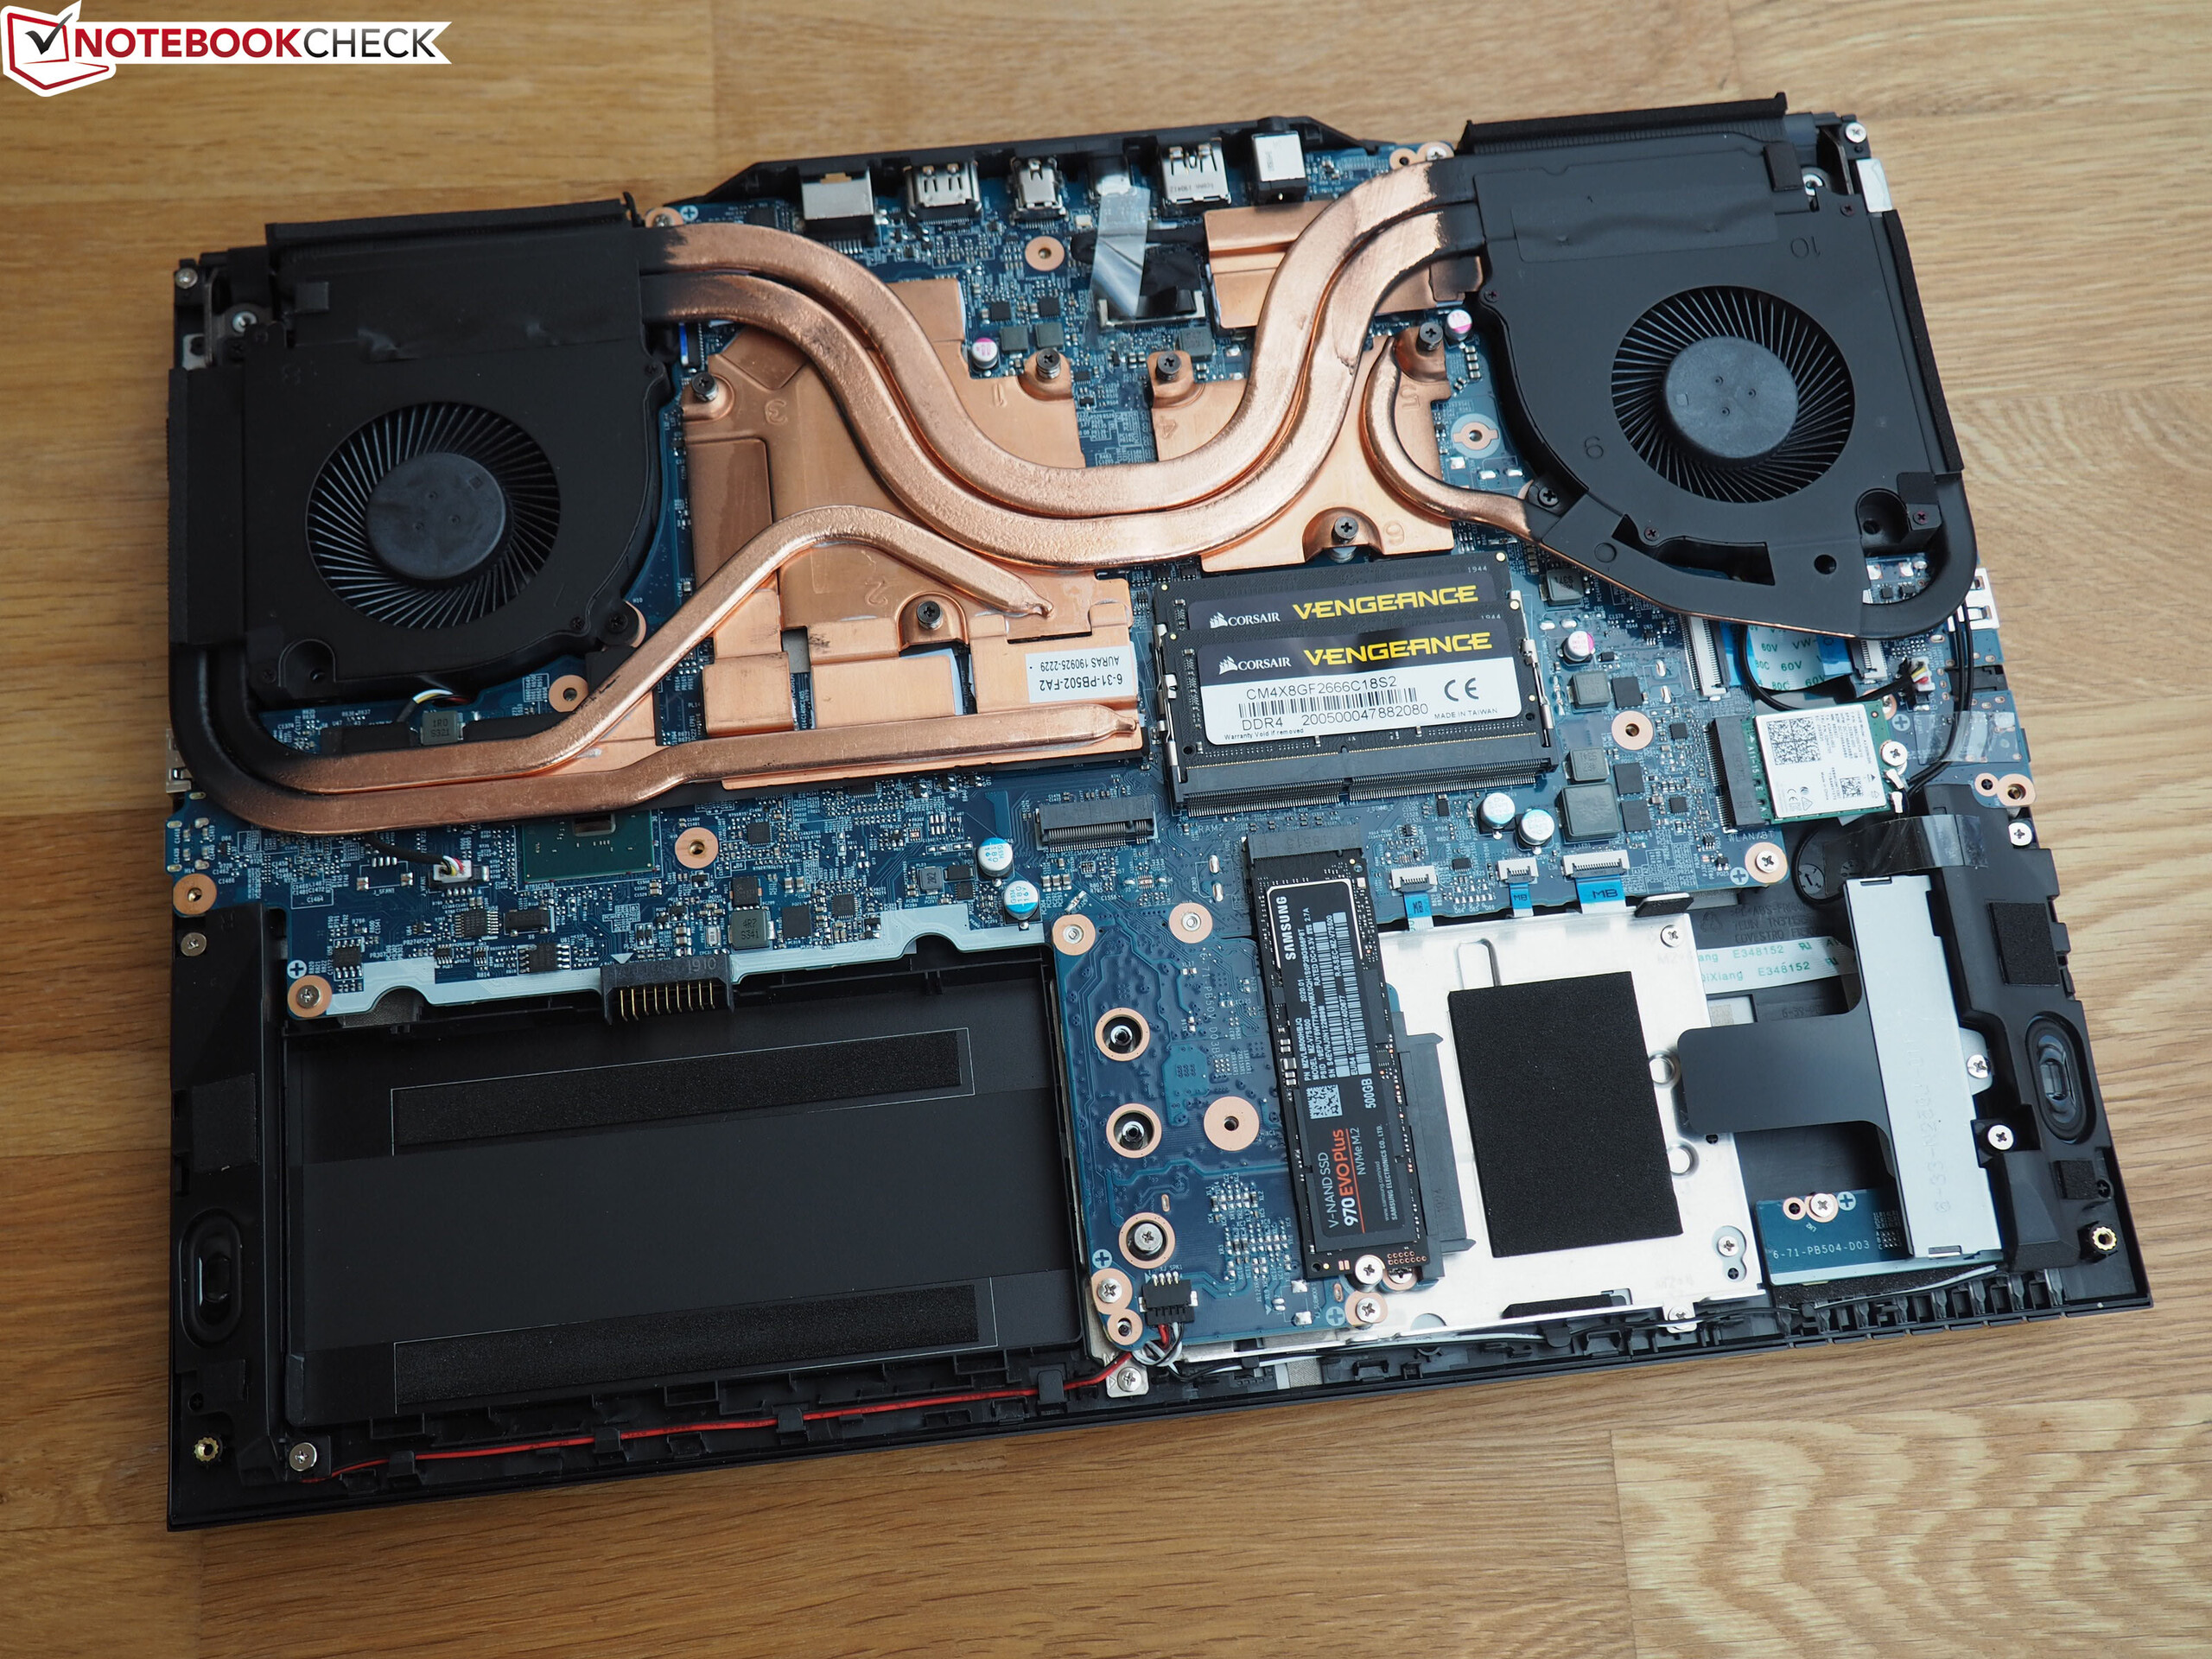
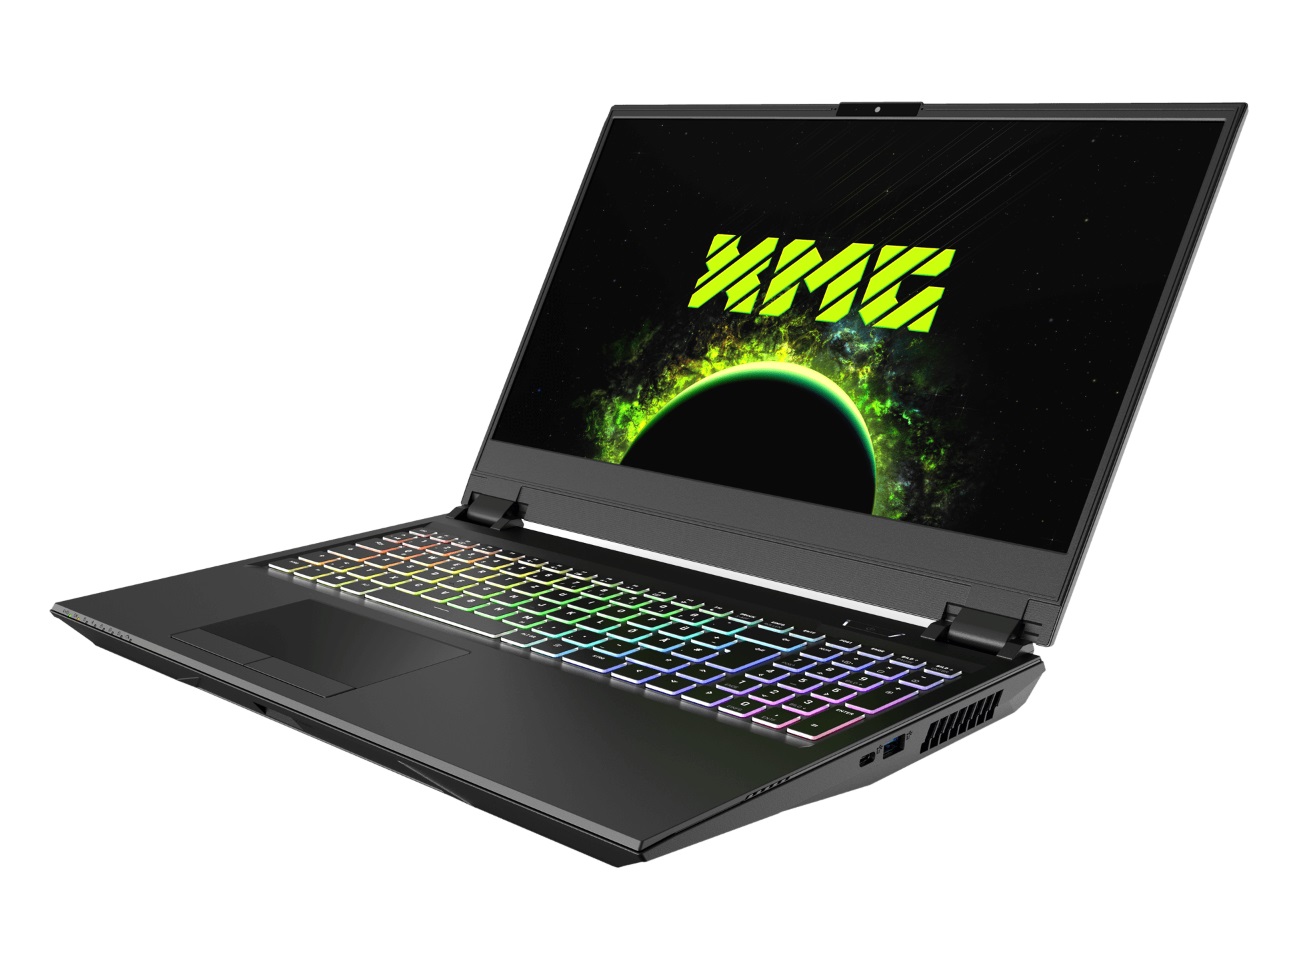
XMG Pro 15 fyller utmärkt gapet mellan utbudet av tunna och lätta modeller och klassiska desktop-ersättningar. Den som föredrar ett kompakt hölje men inte vill vara utan hög prestanda har hittat rätt.
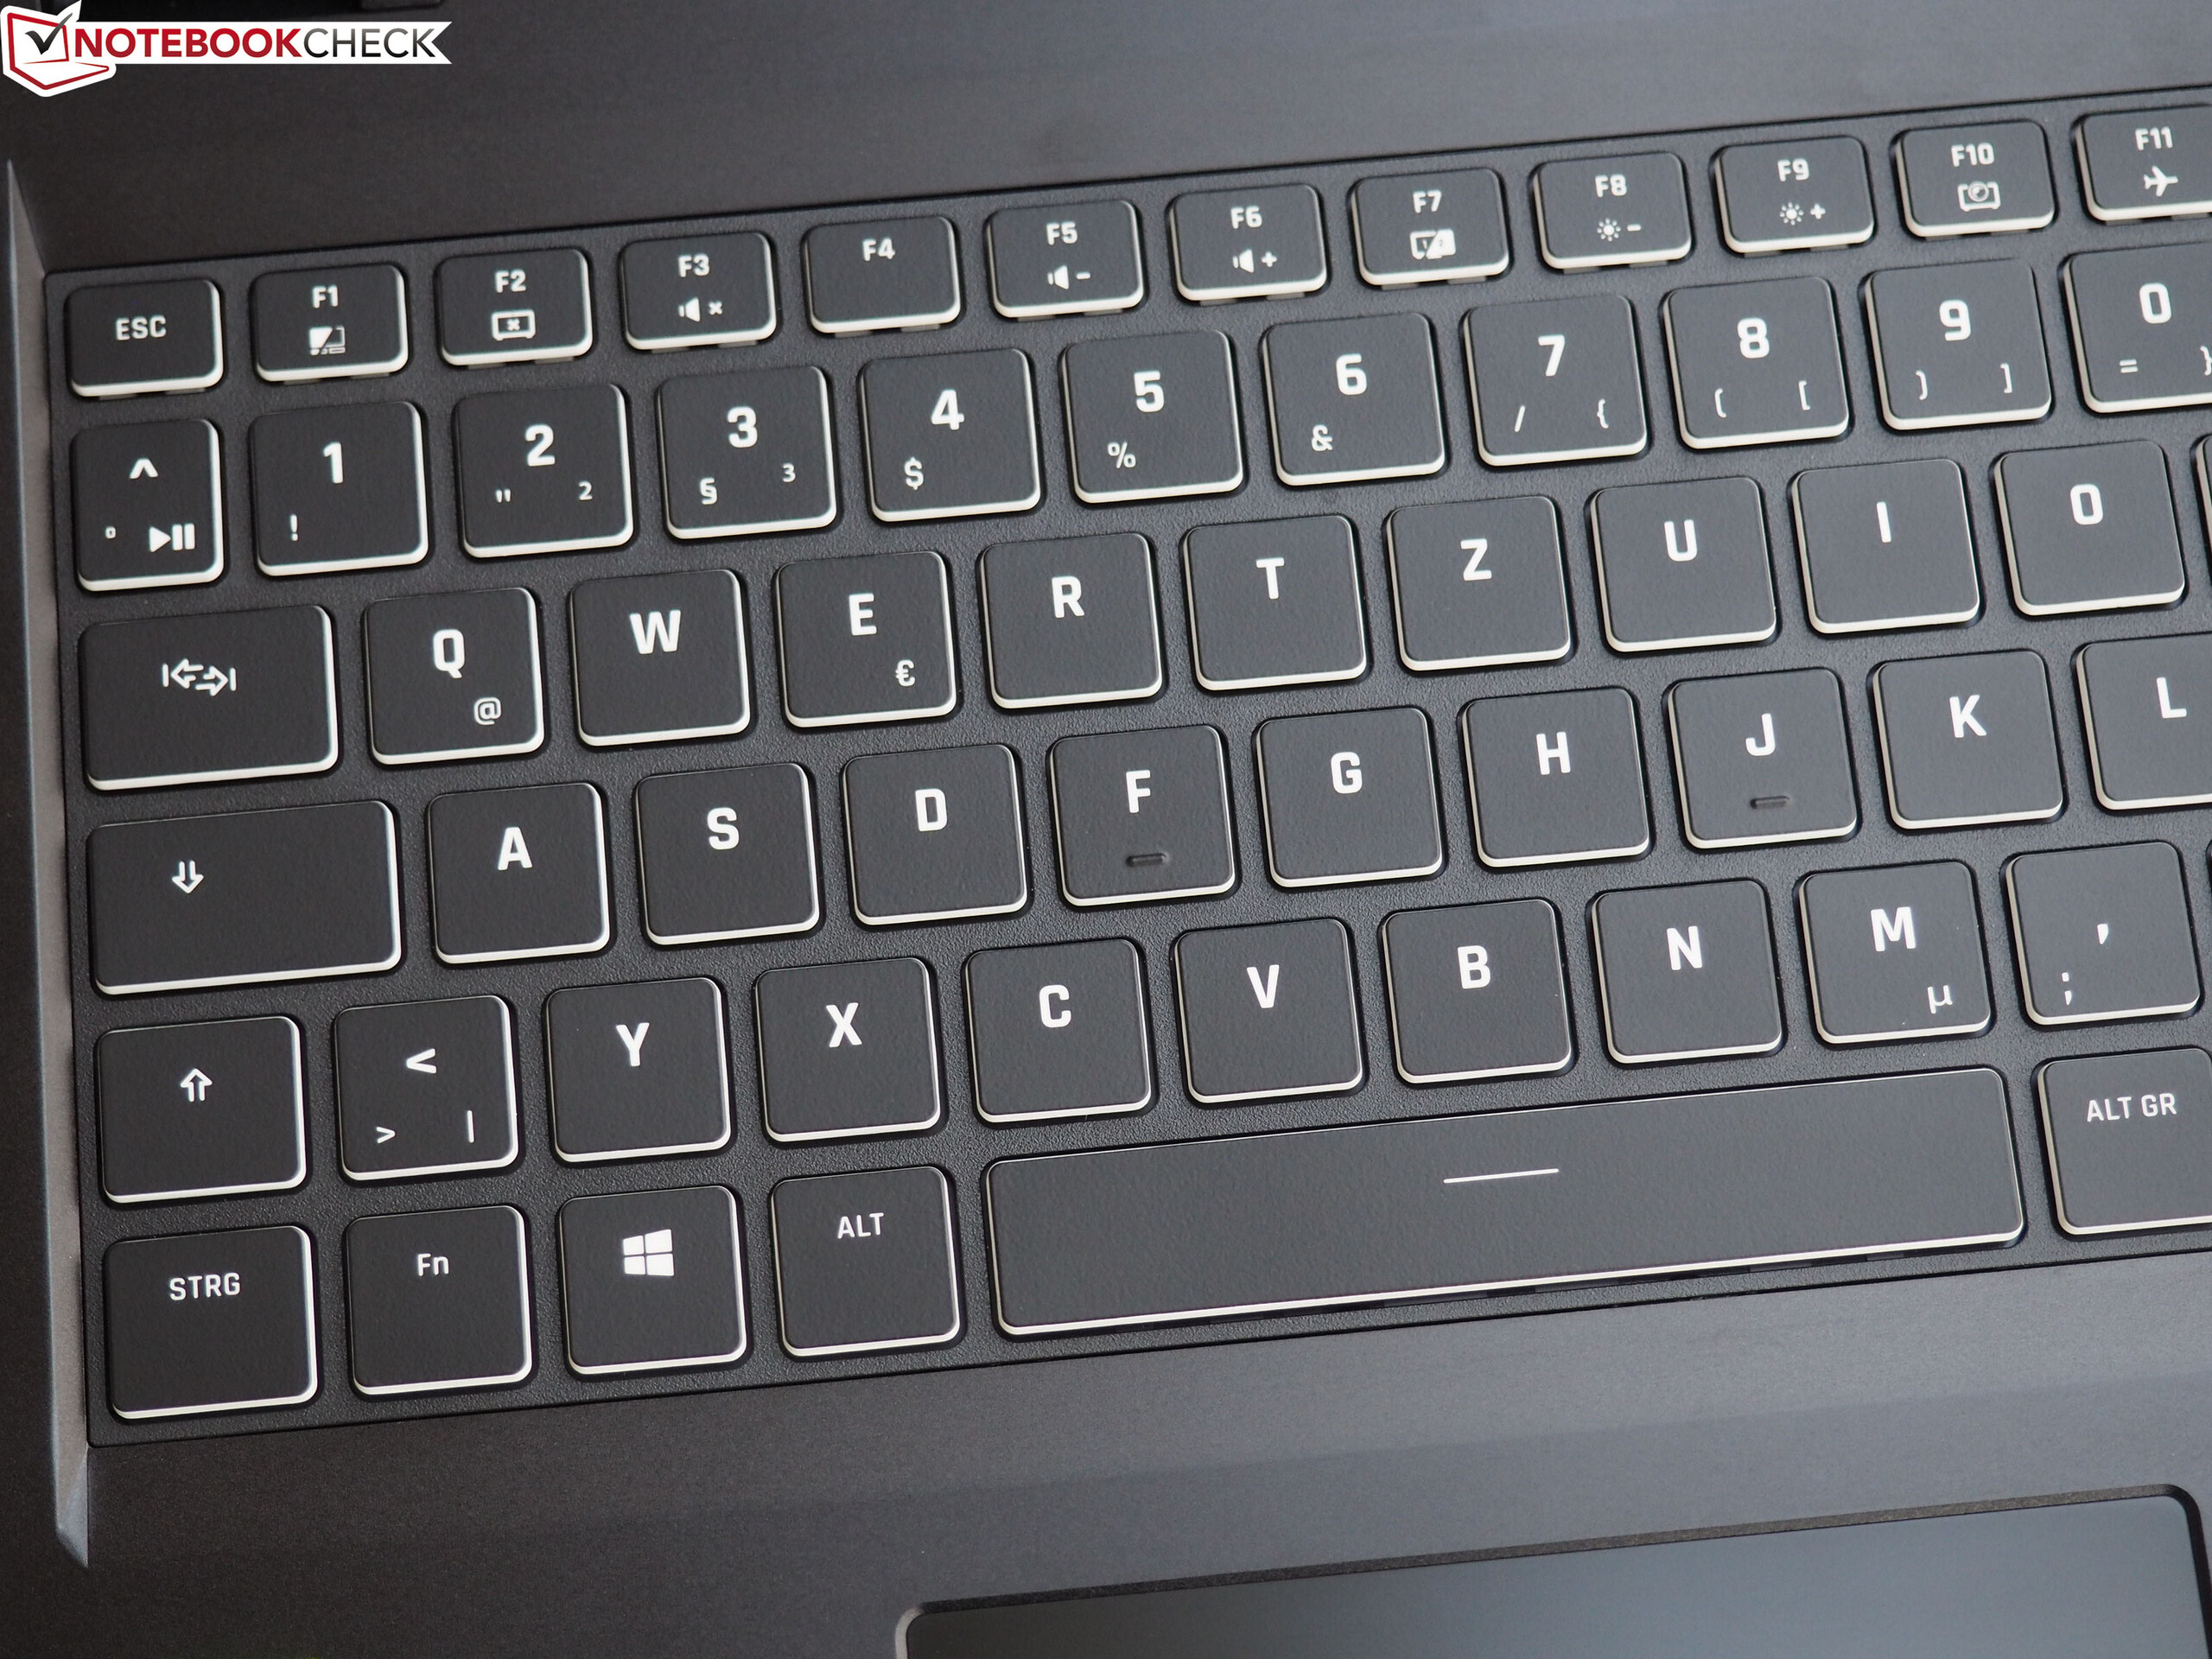
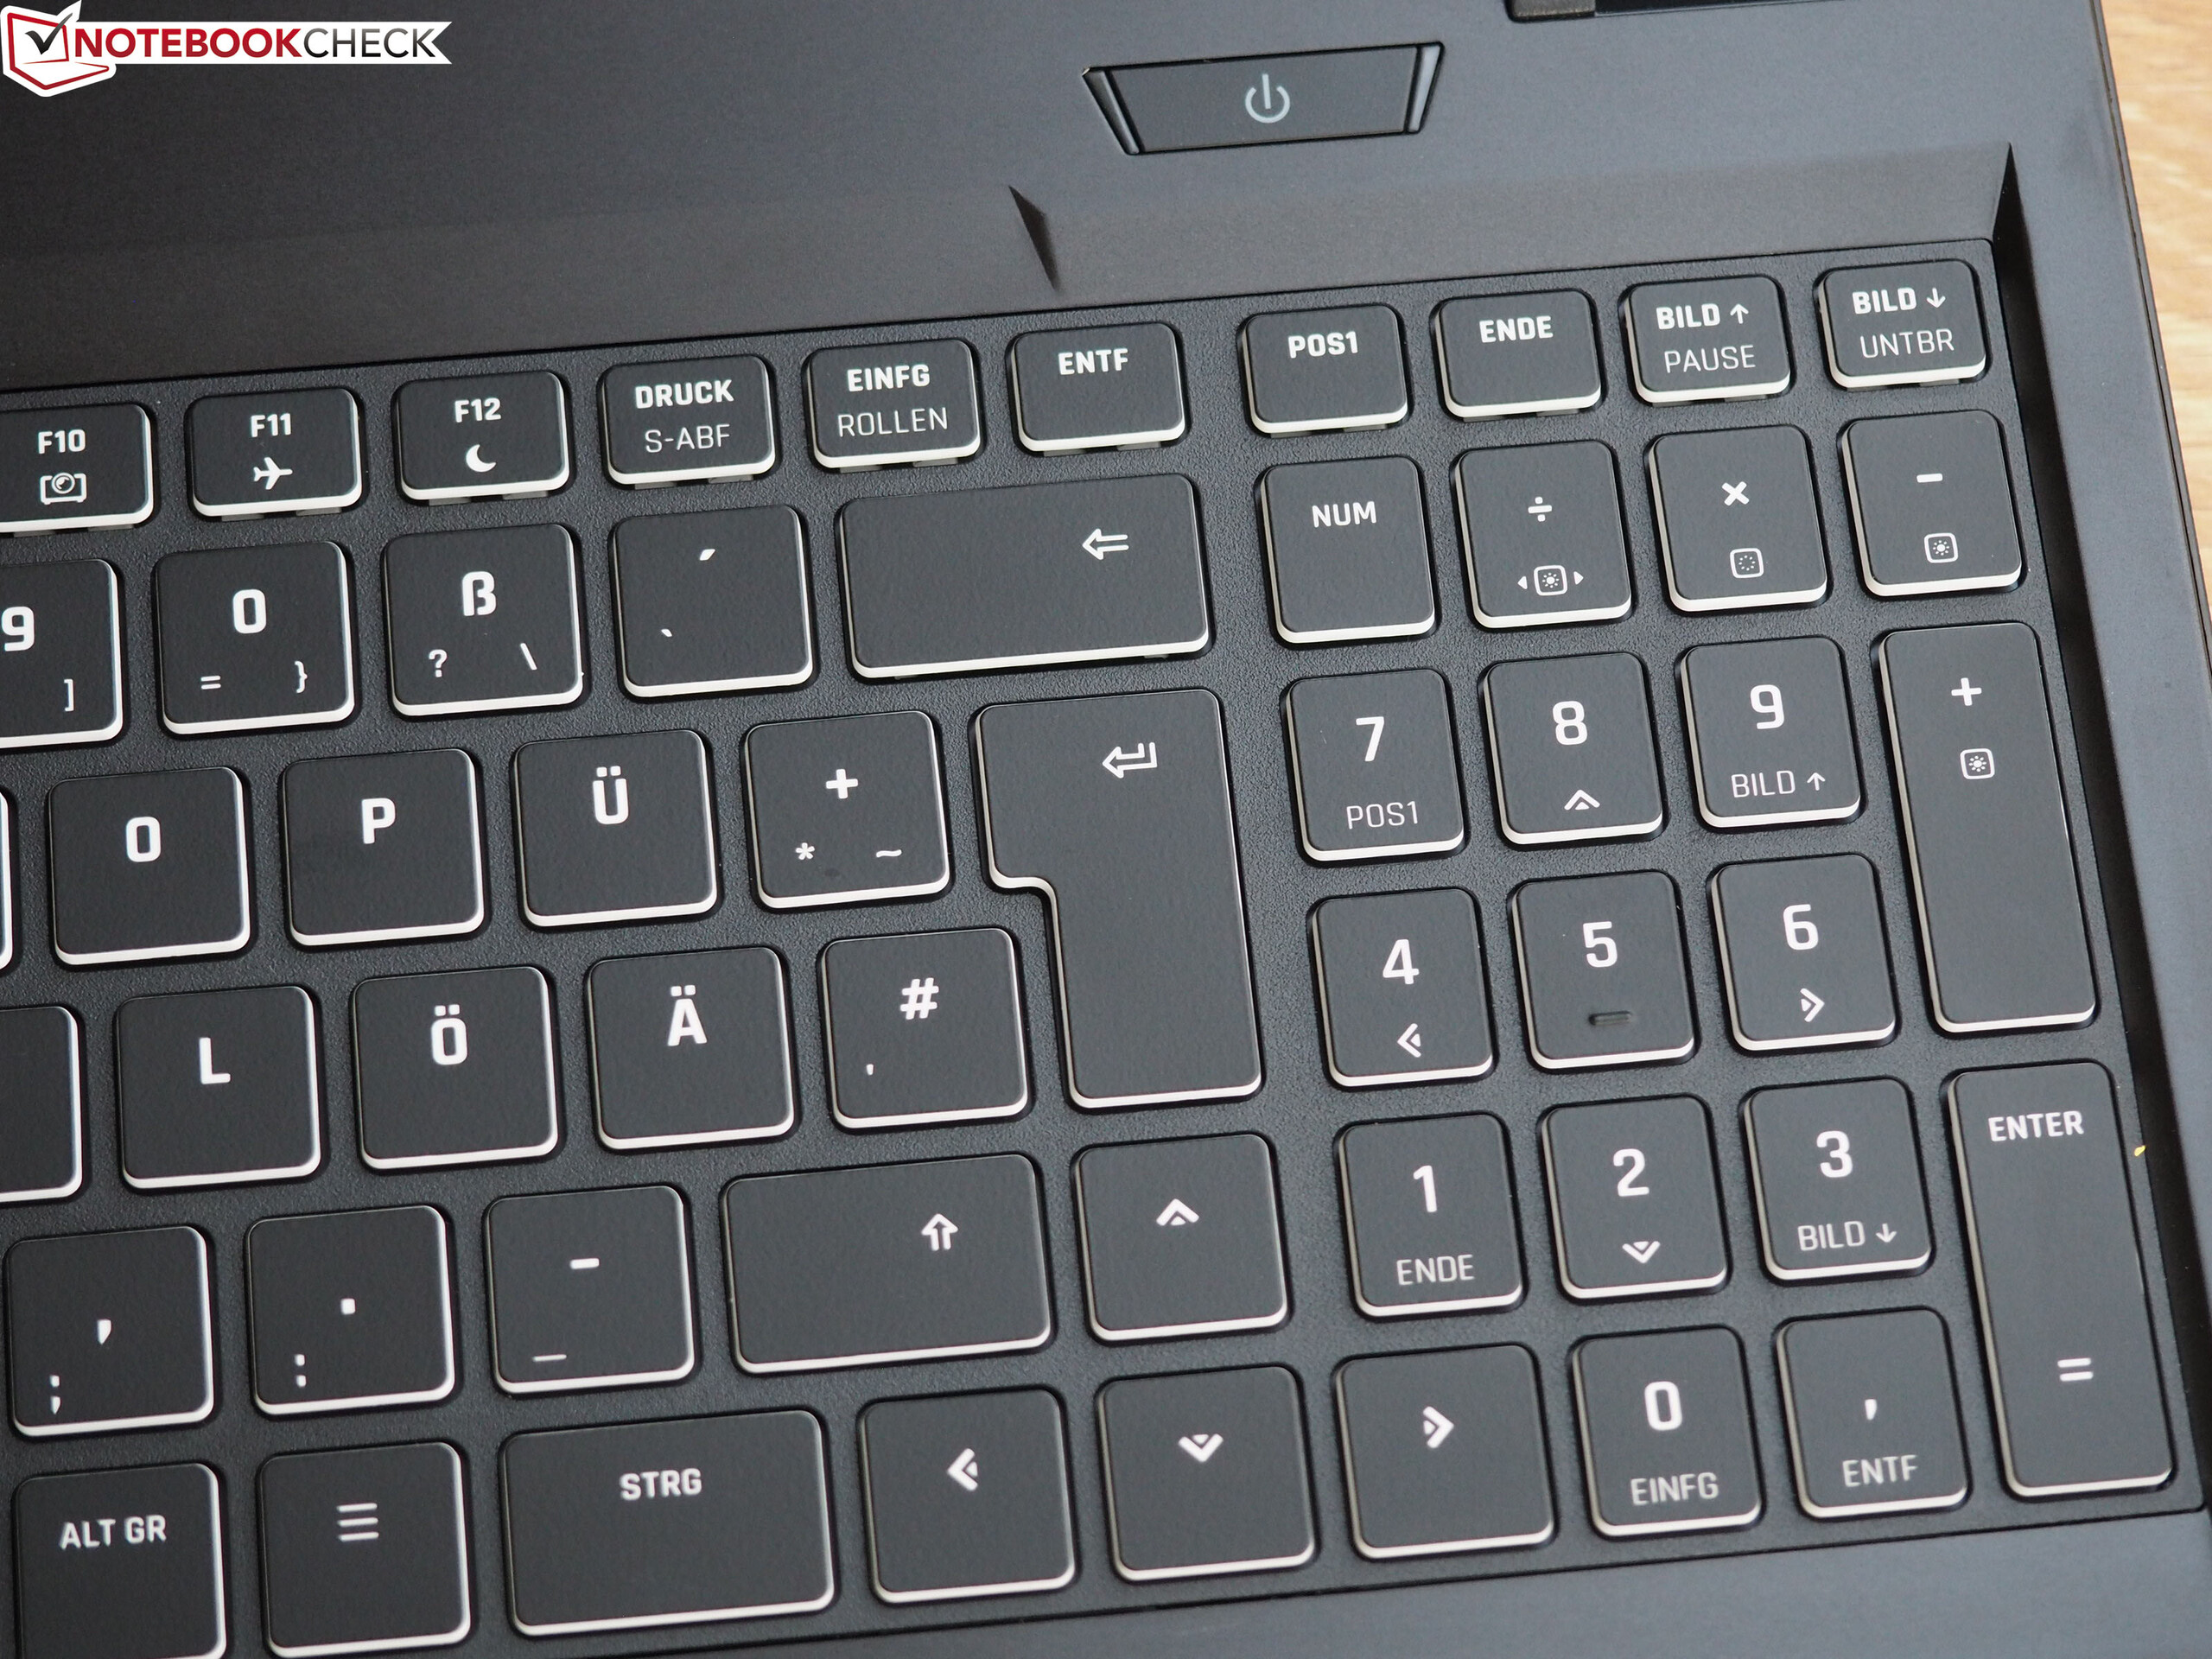
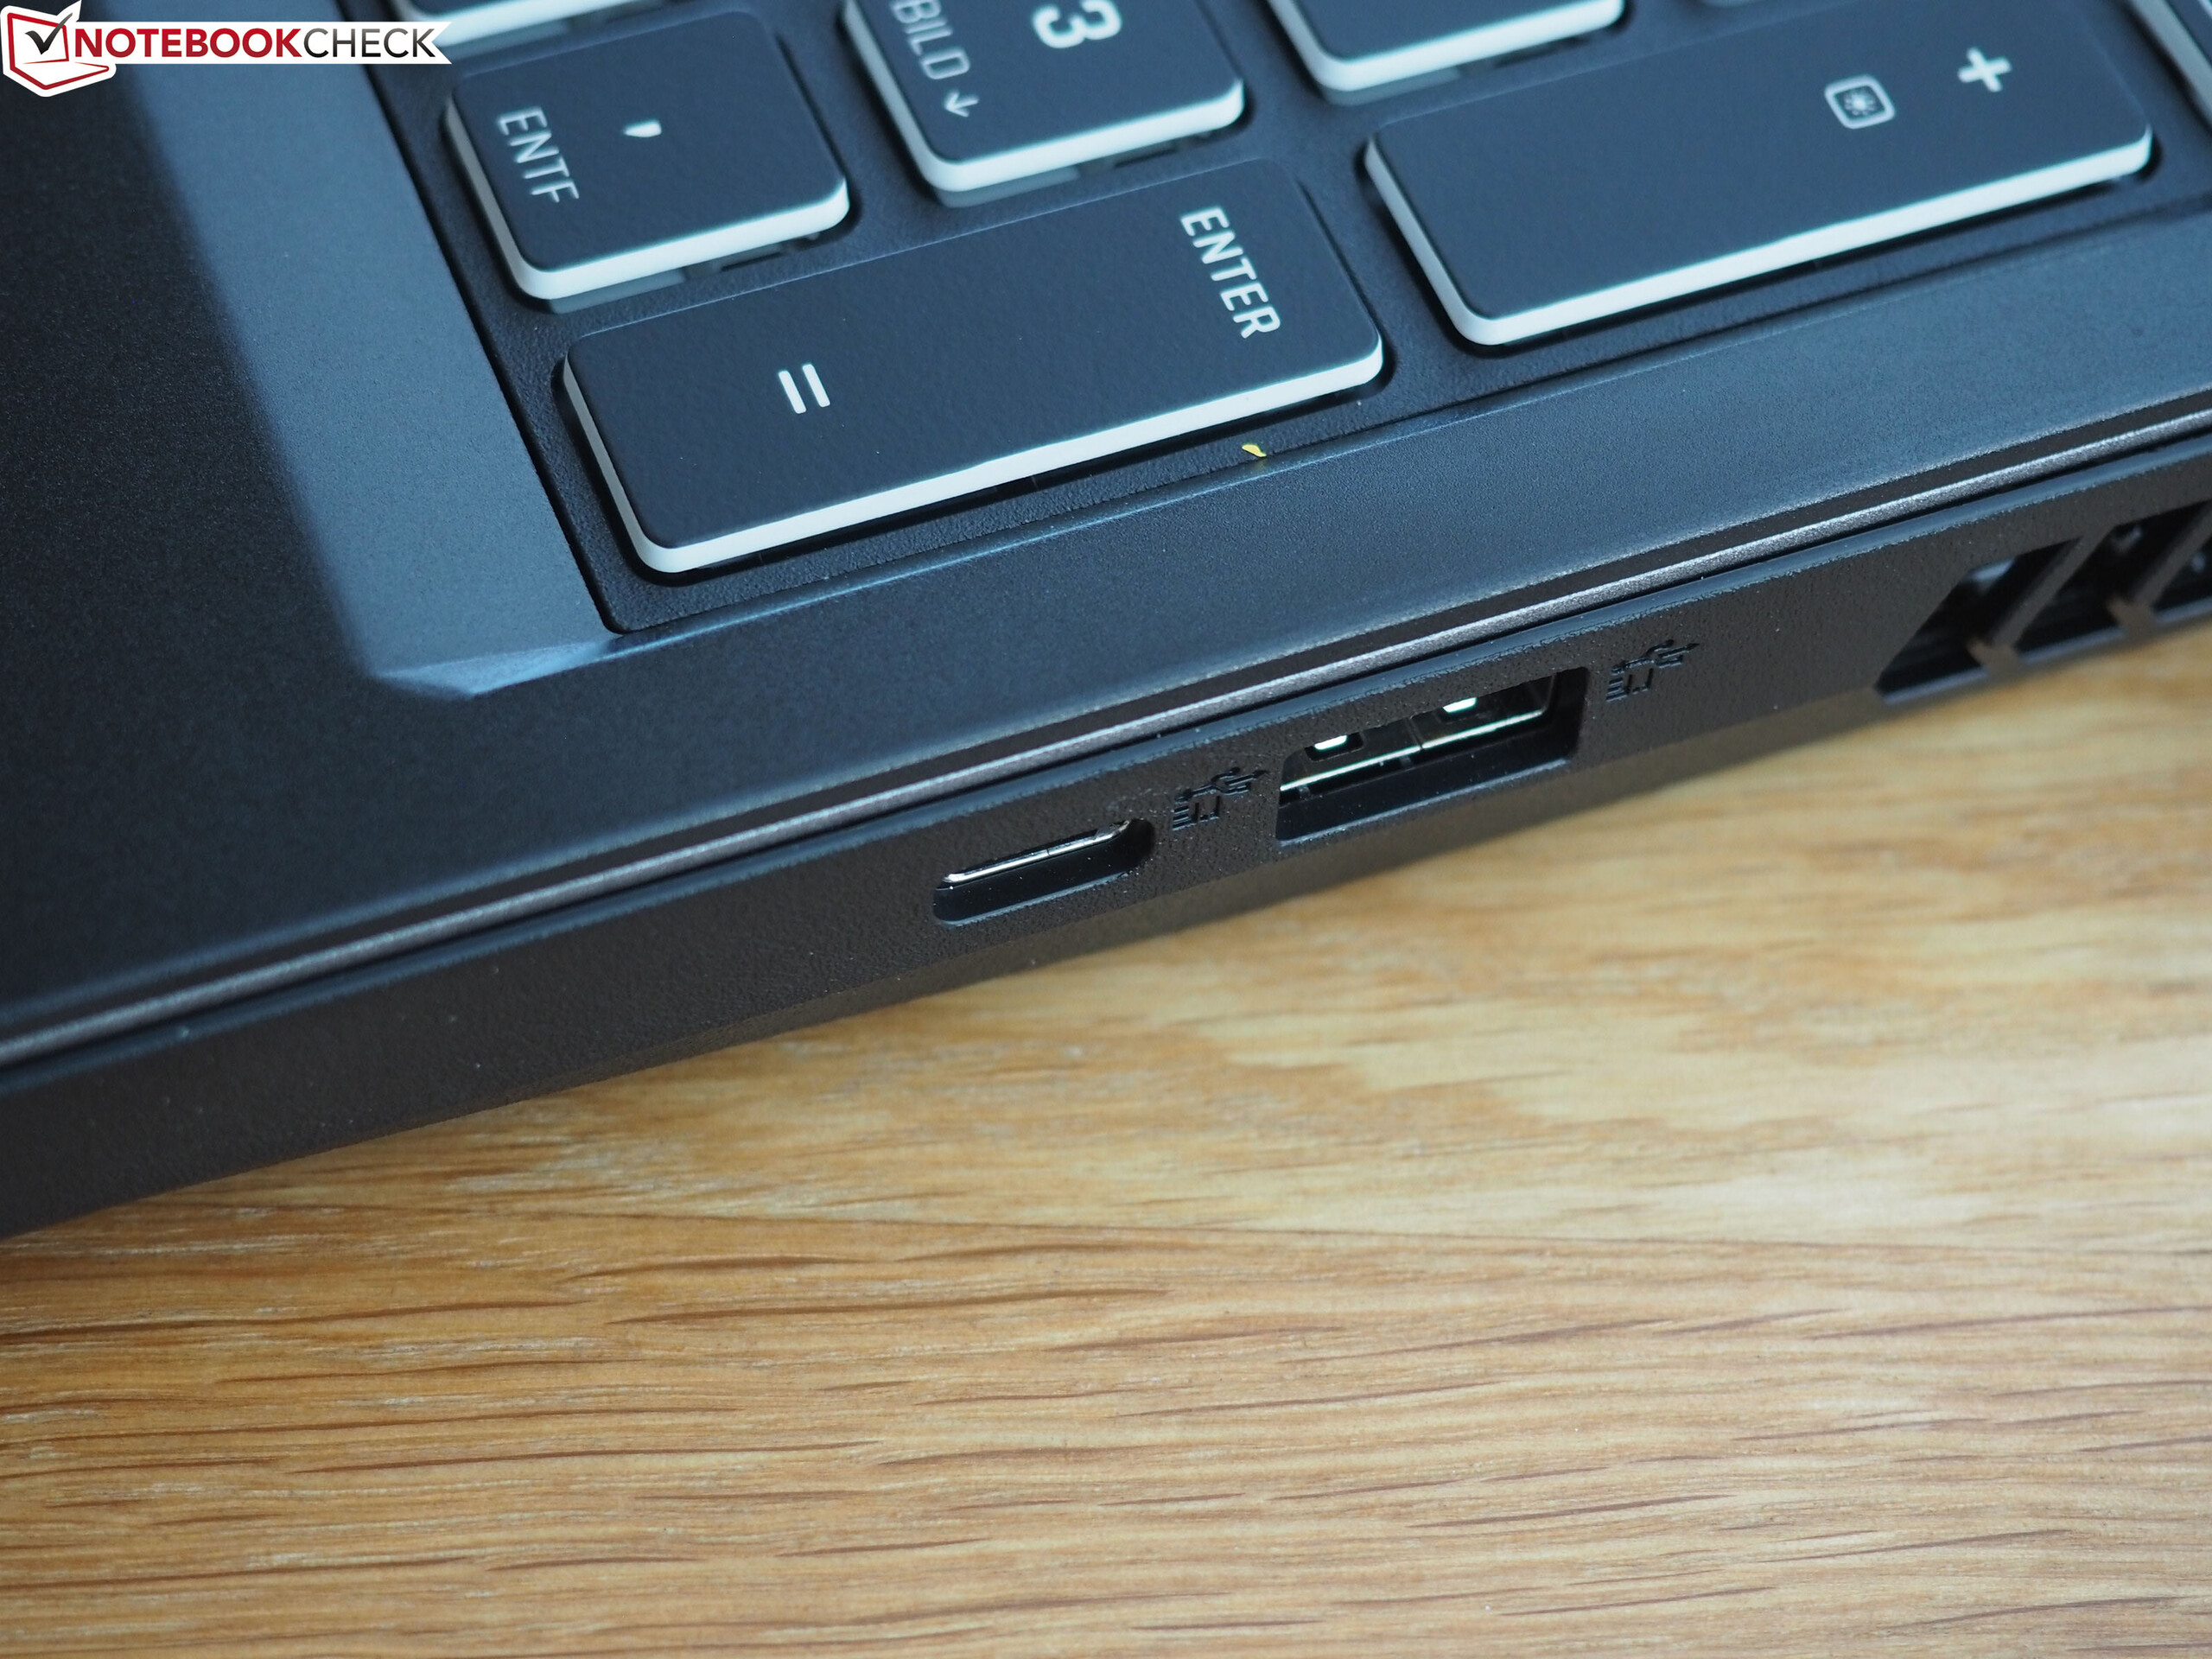
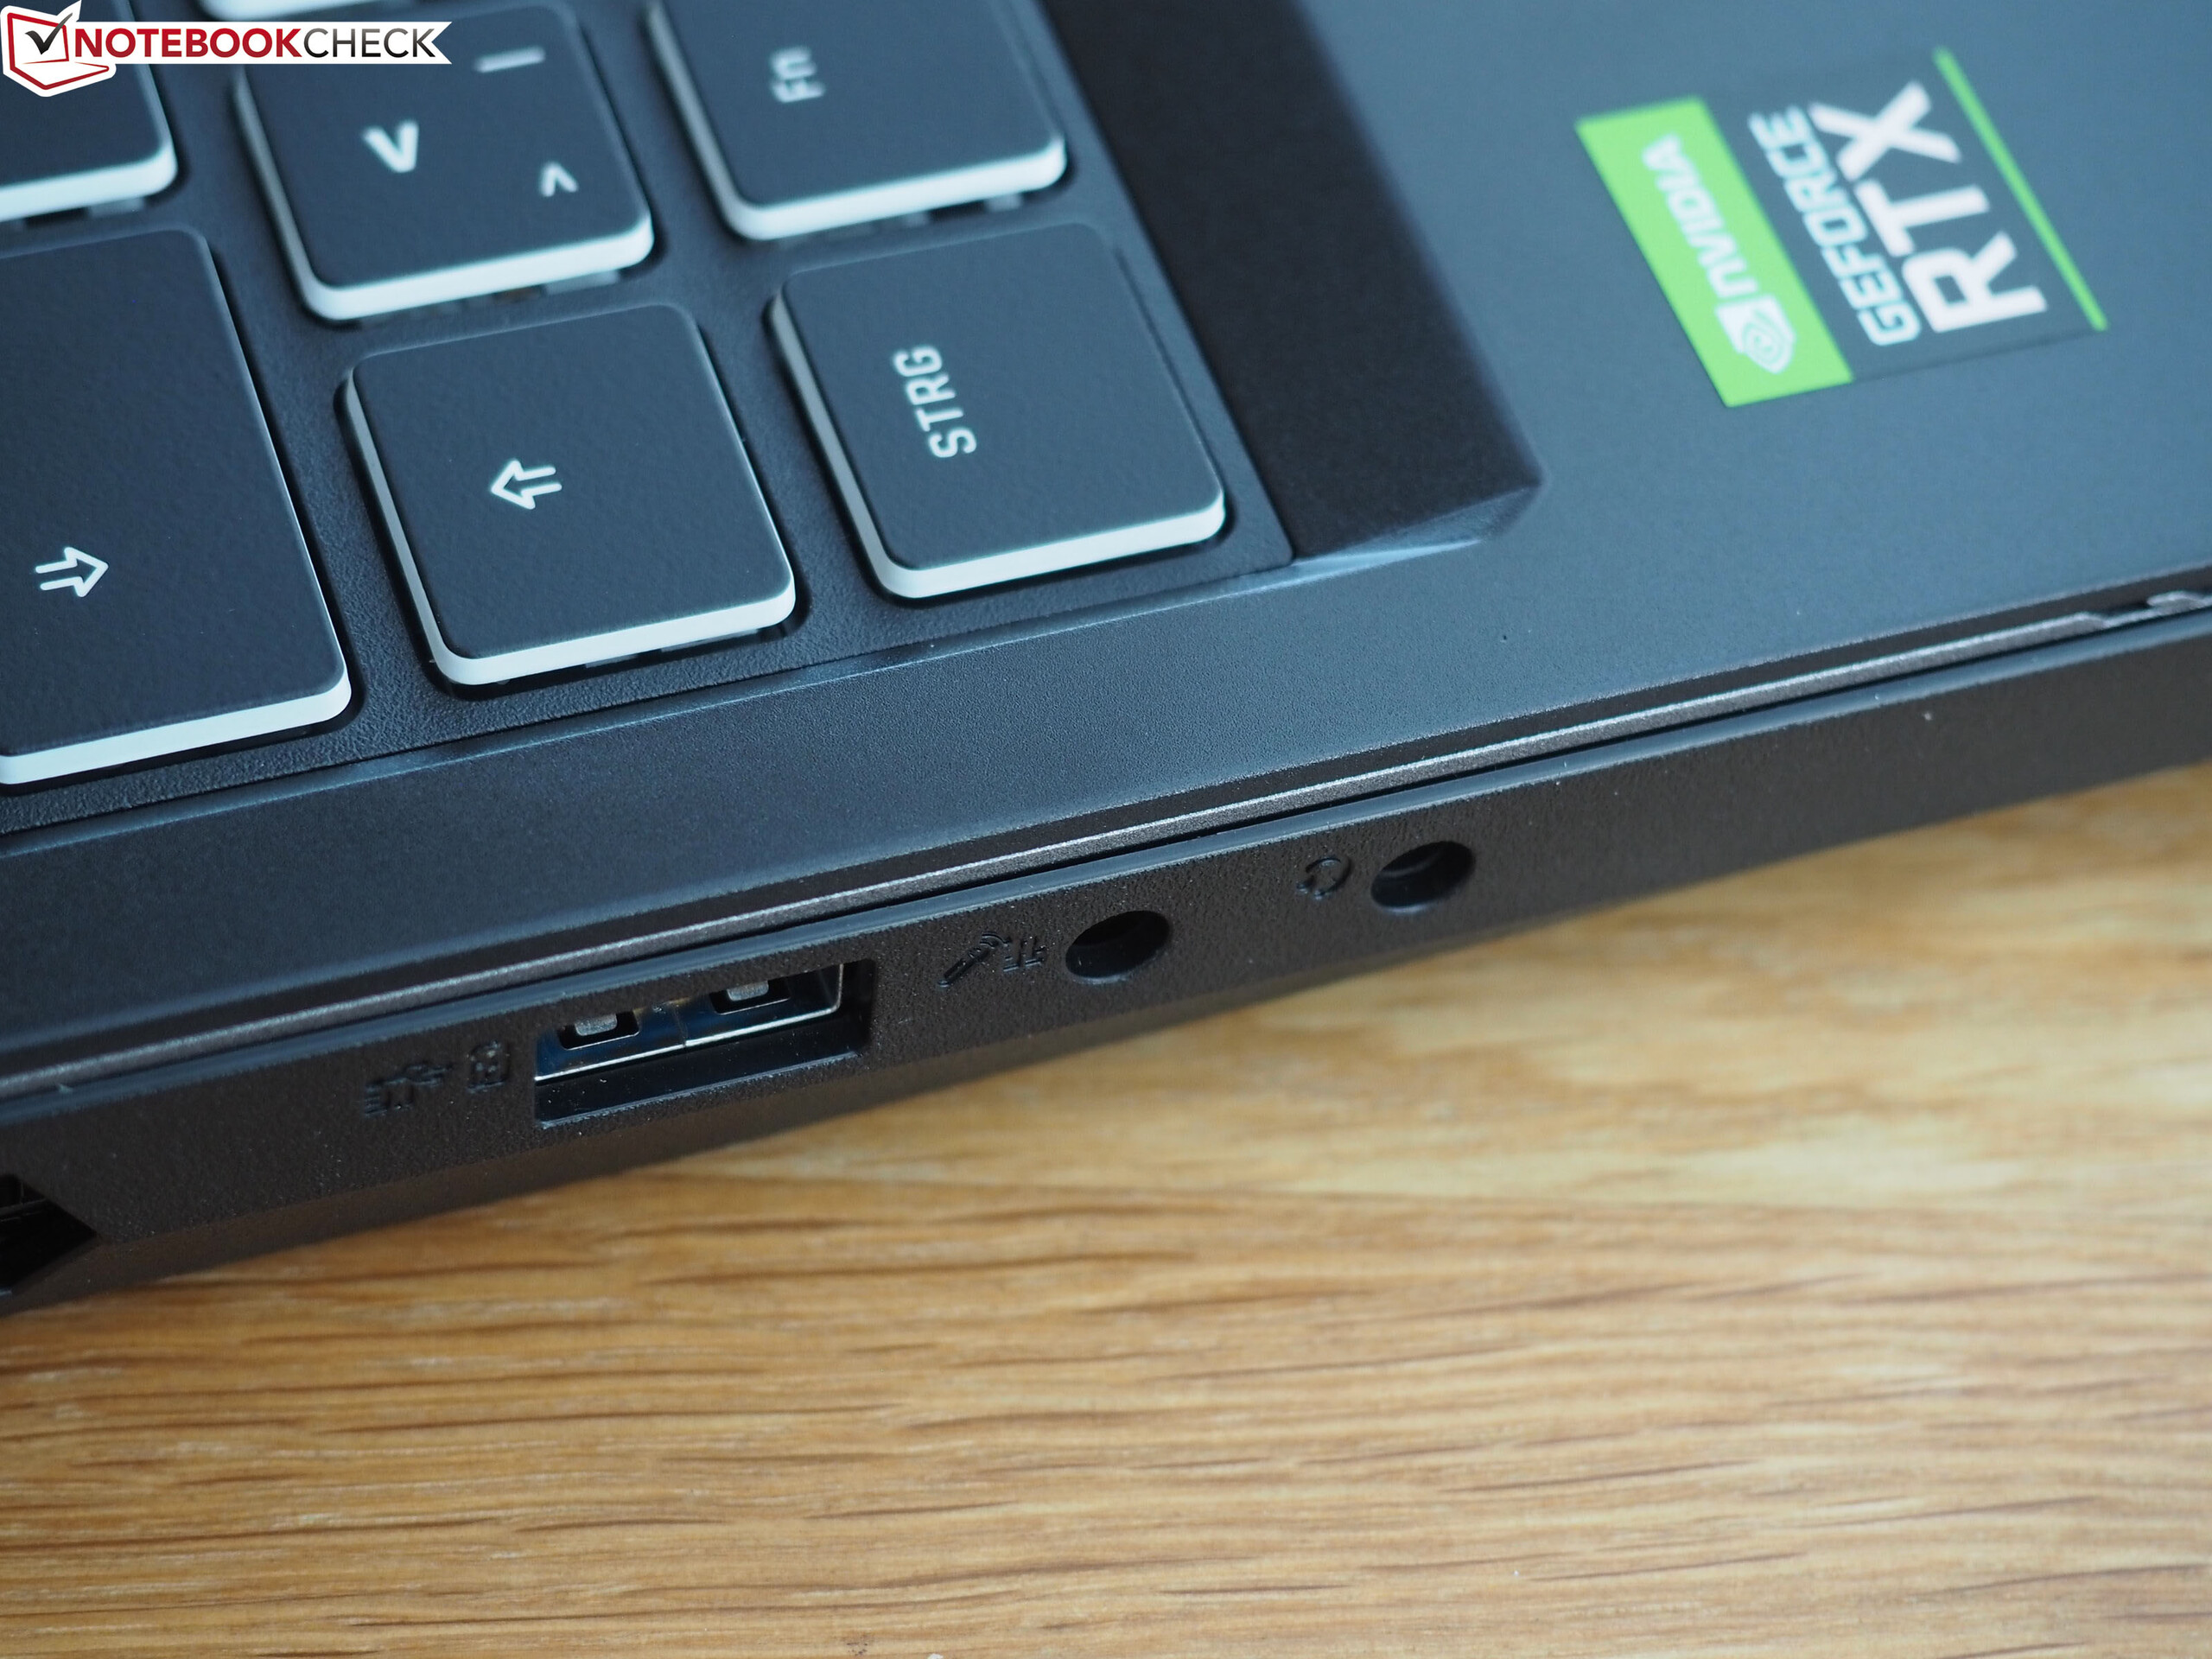
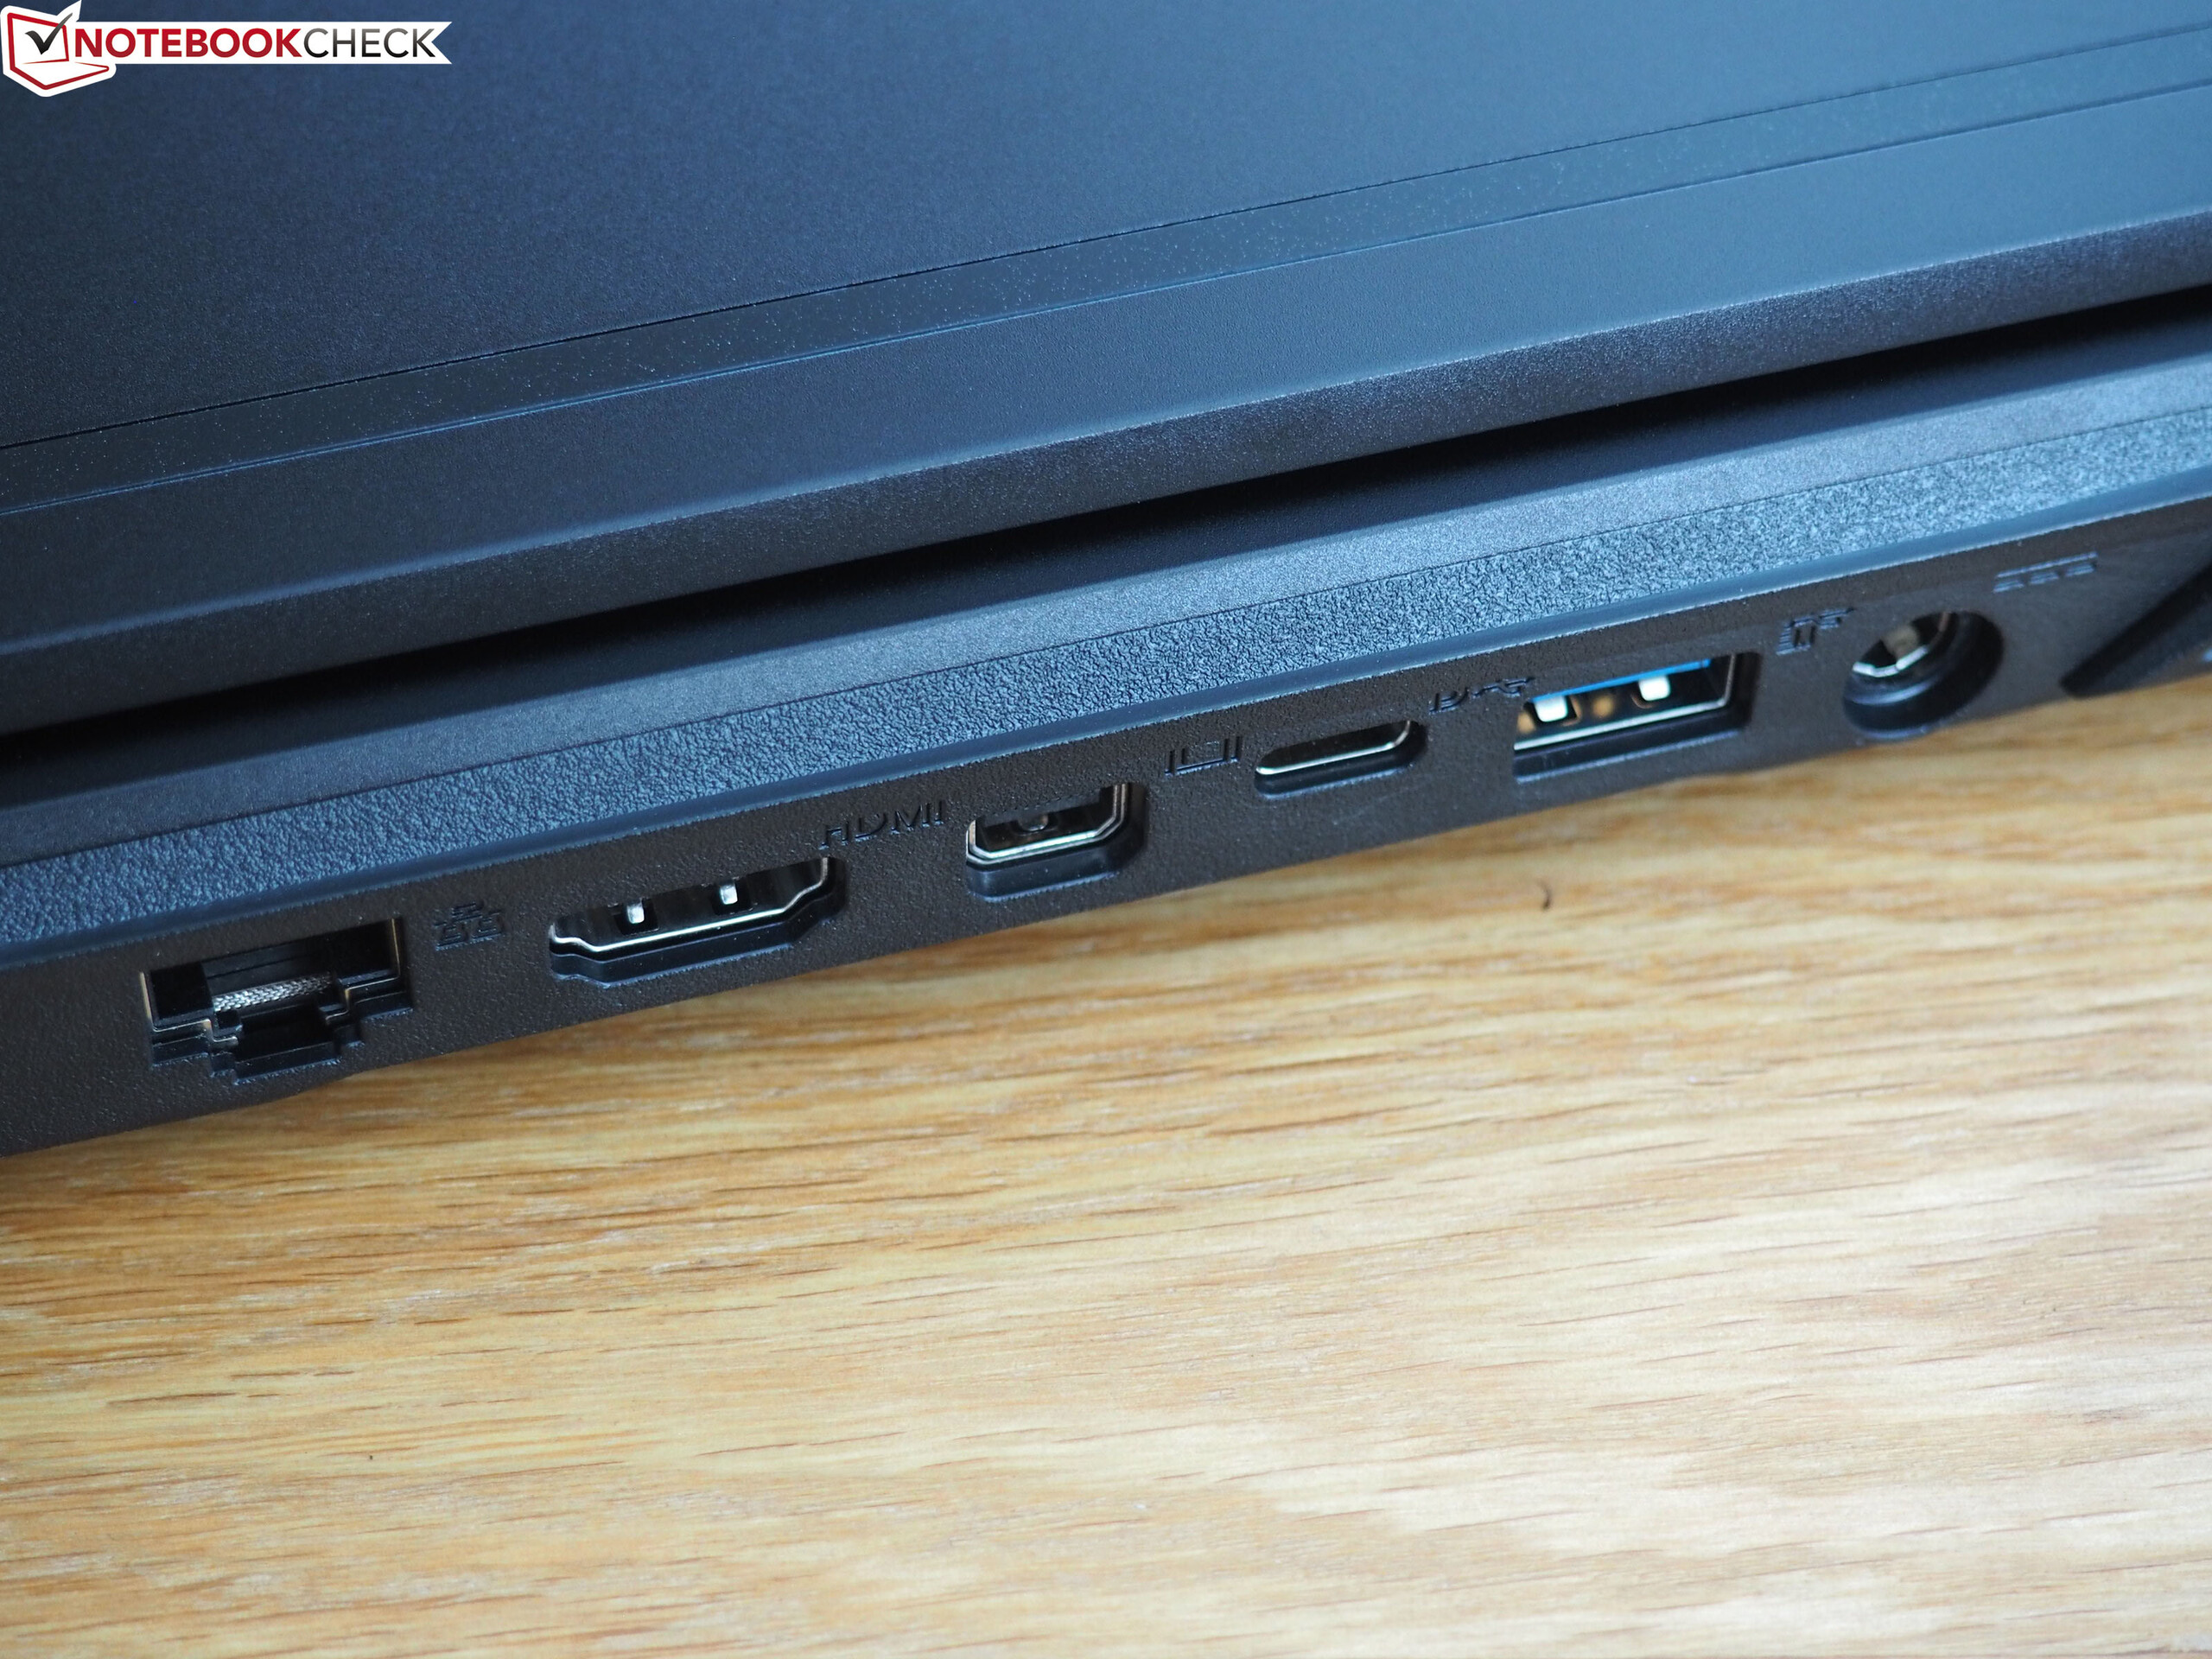
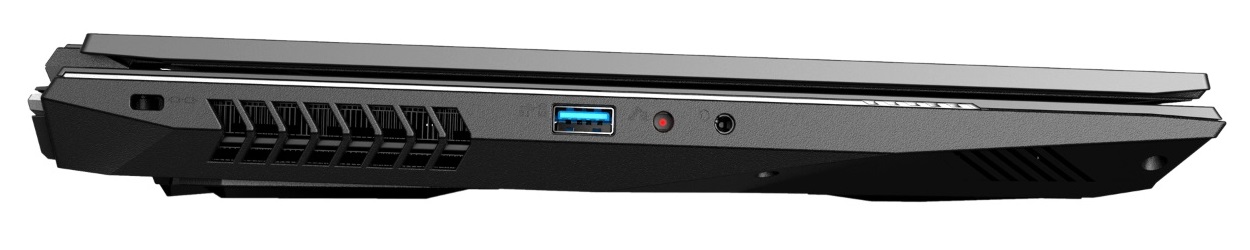
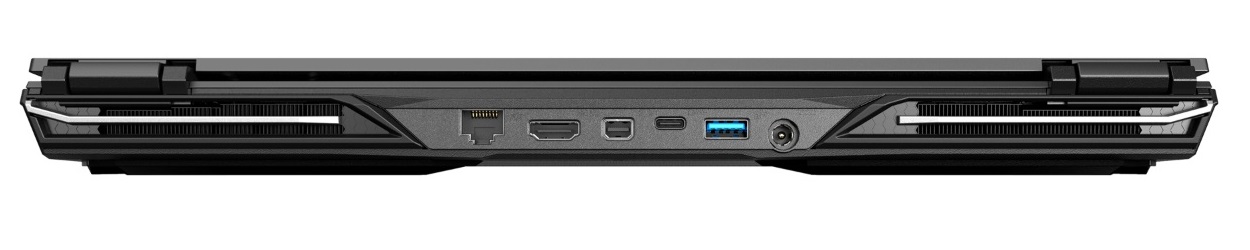
En Core i7-9750H och ett GeForce RTX 2070 kan visa alla moderna titlar med full detalj och passar perfekt för hardcore-gamers. Vidare har vår recensionsenhet ett matchande RGB-bakgrundsbelyst tangentbord, många uppgraderingsmöjligheter och konfigurationsalternativ samt ett brett utbud av portar inklusive Thunderbolt 3. Den responsiva 144 Hz-skärmen med hög kontrast var också trevlig.
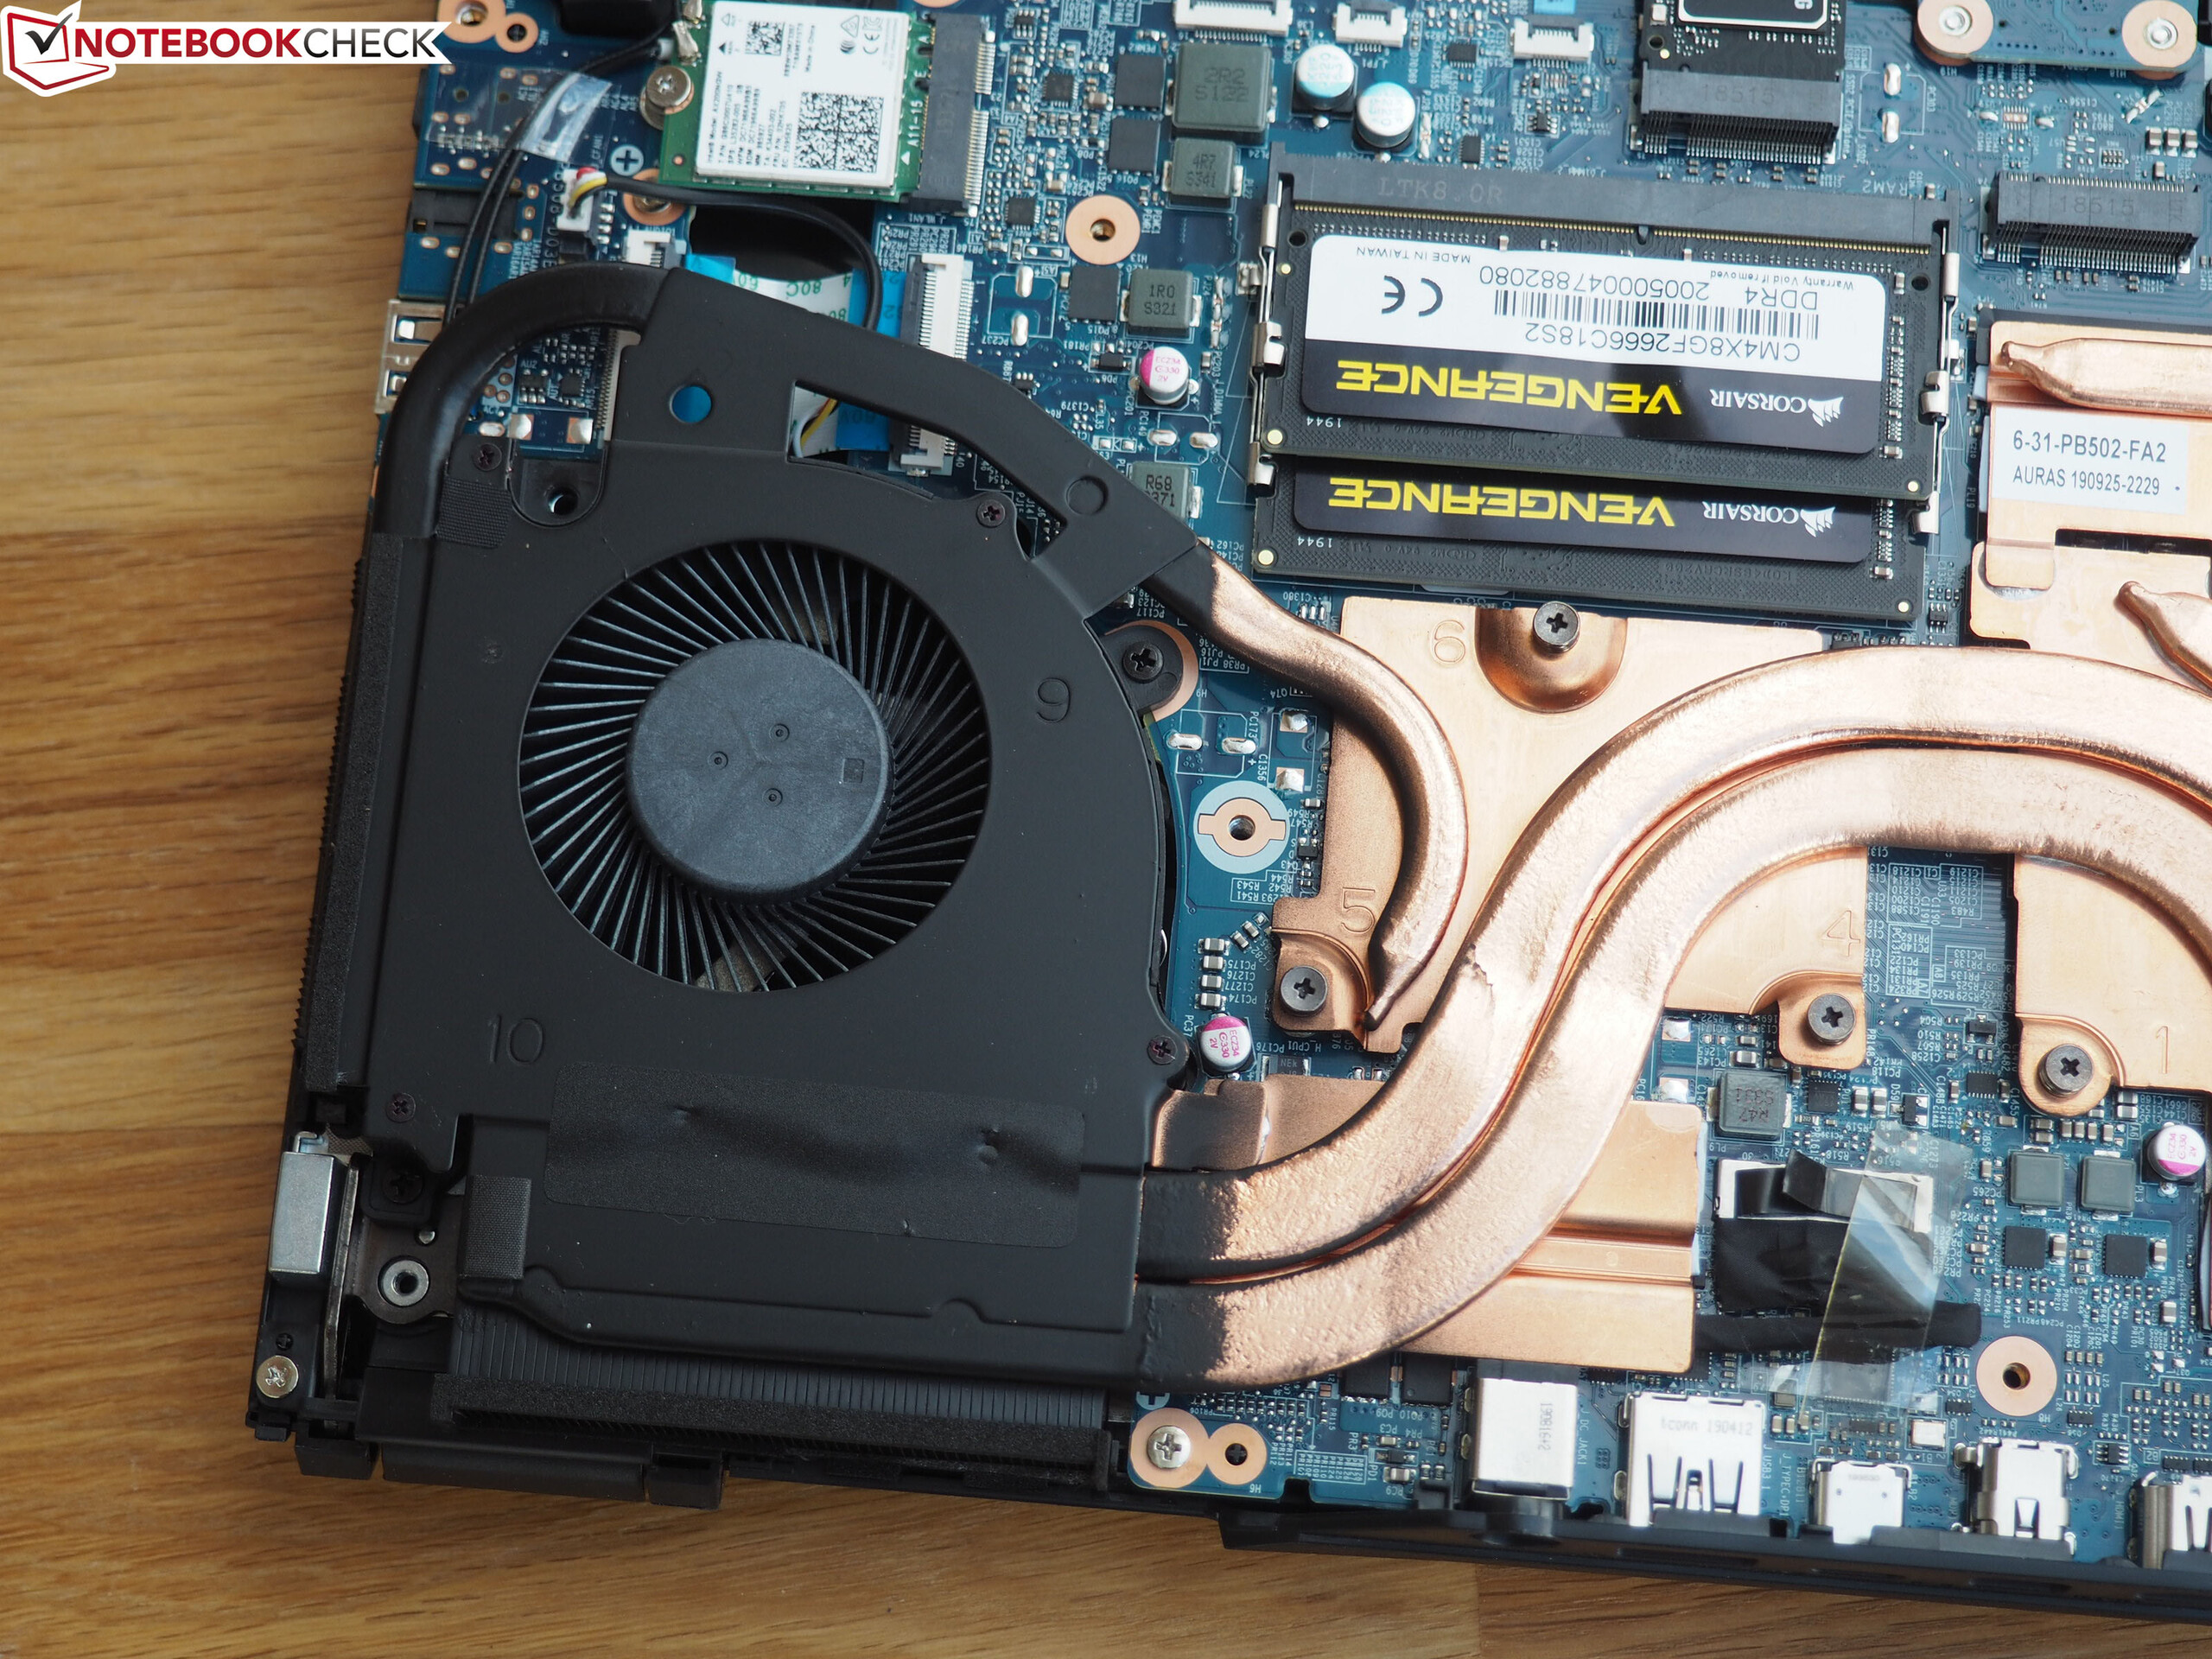
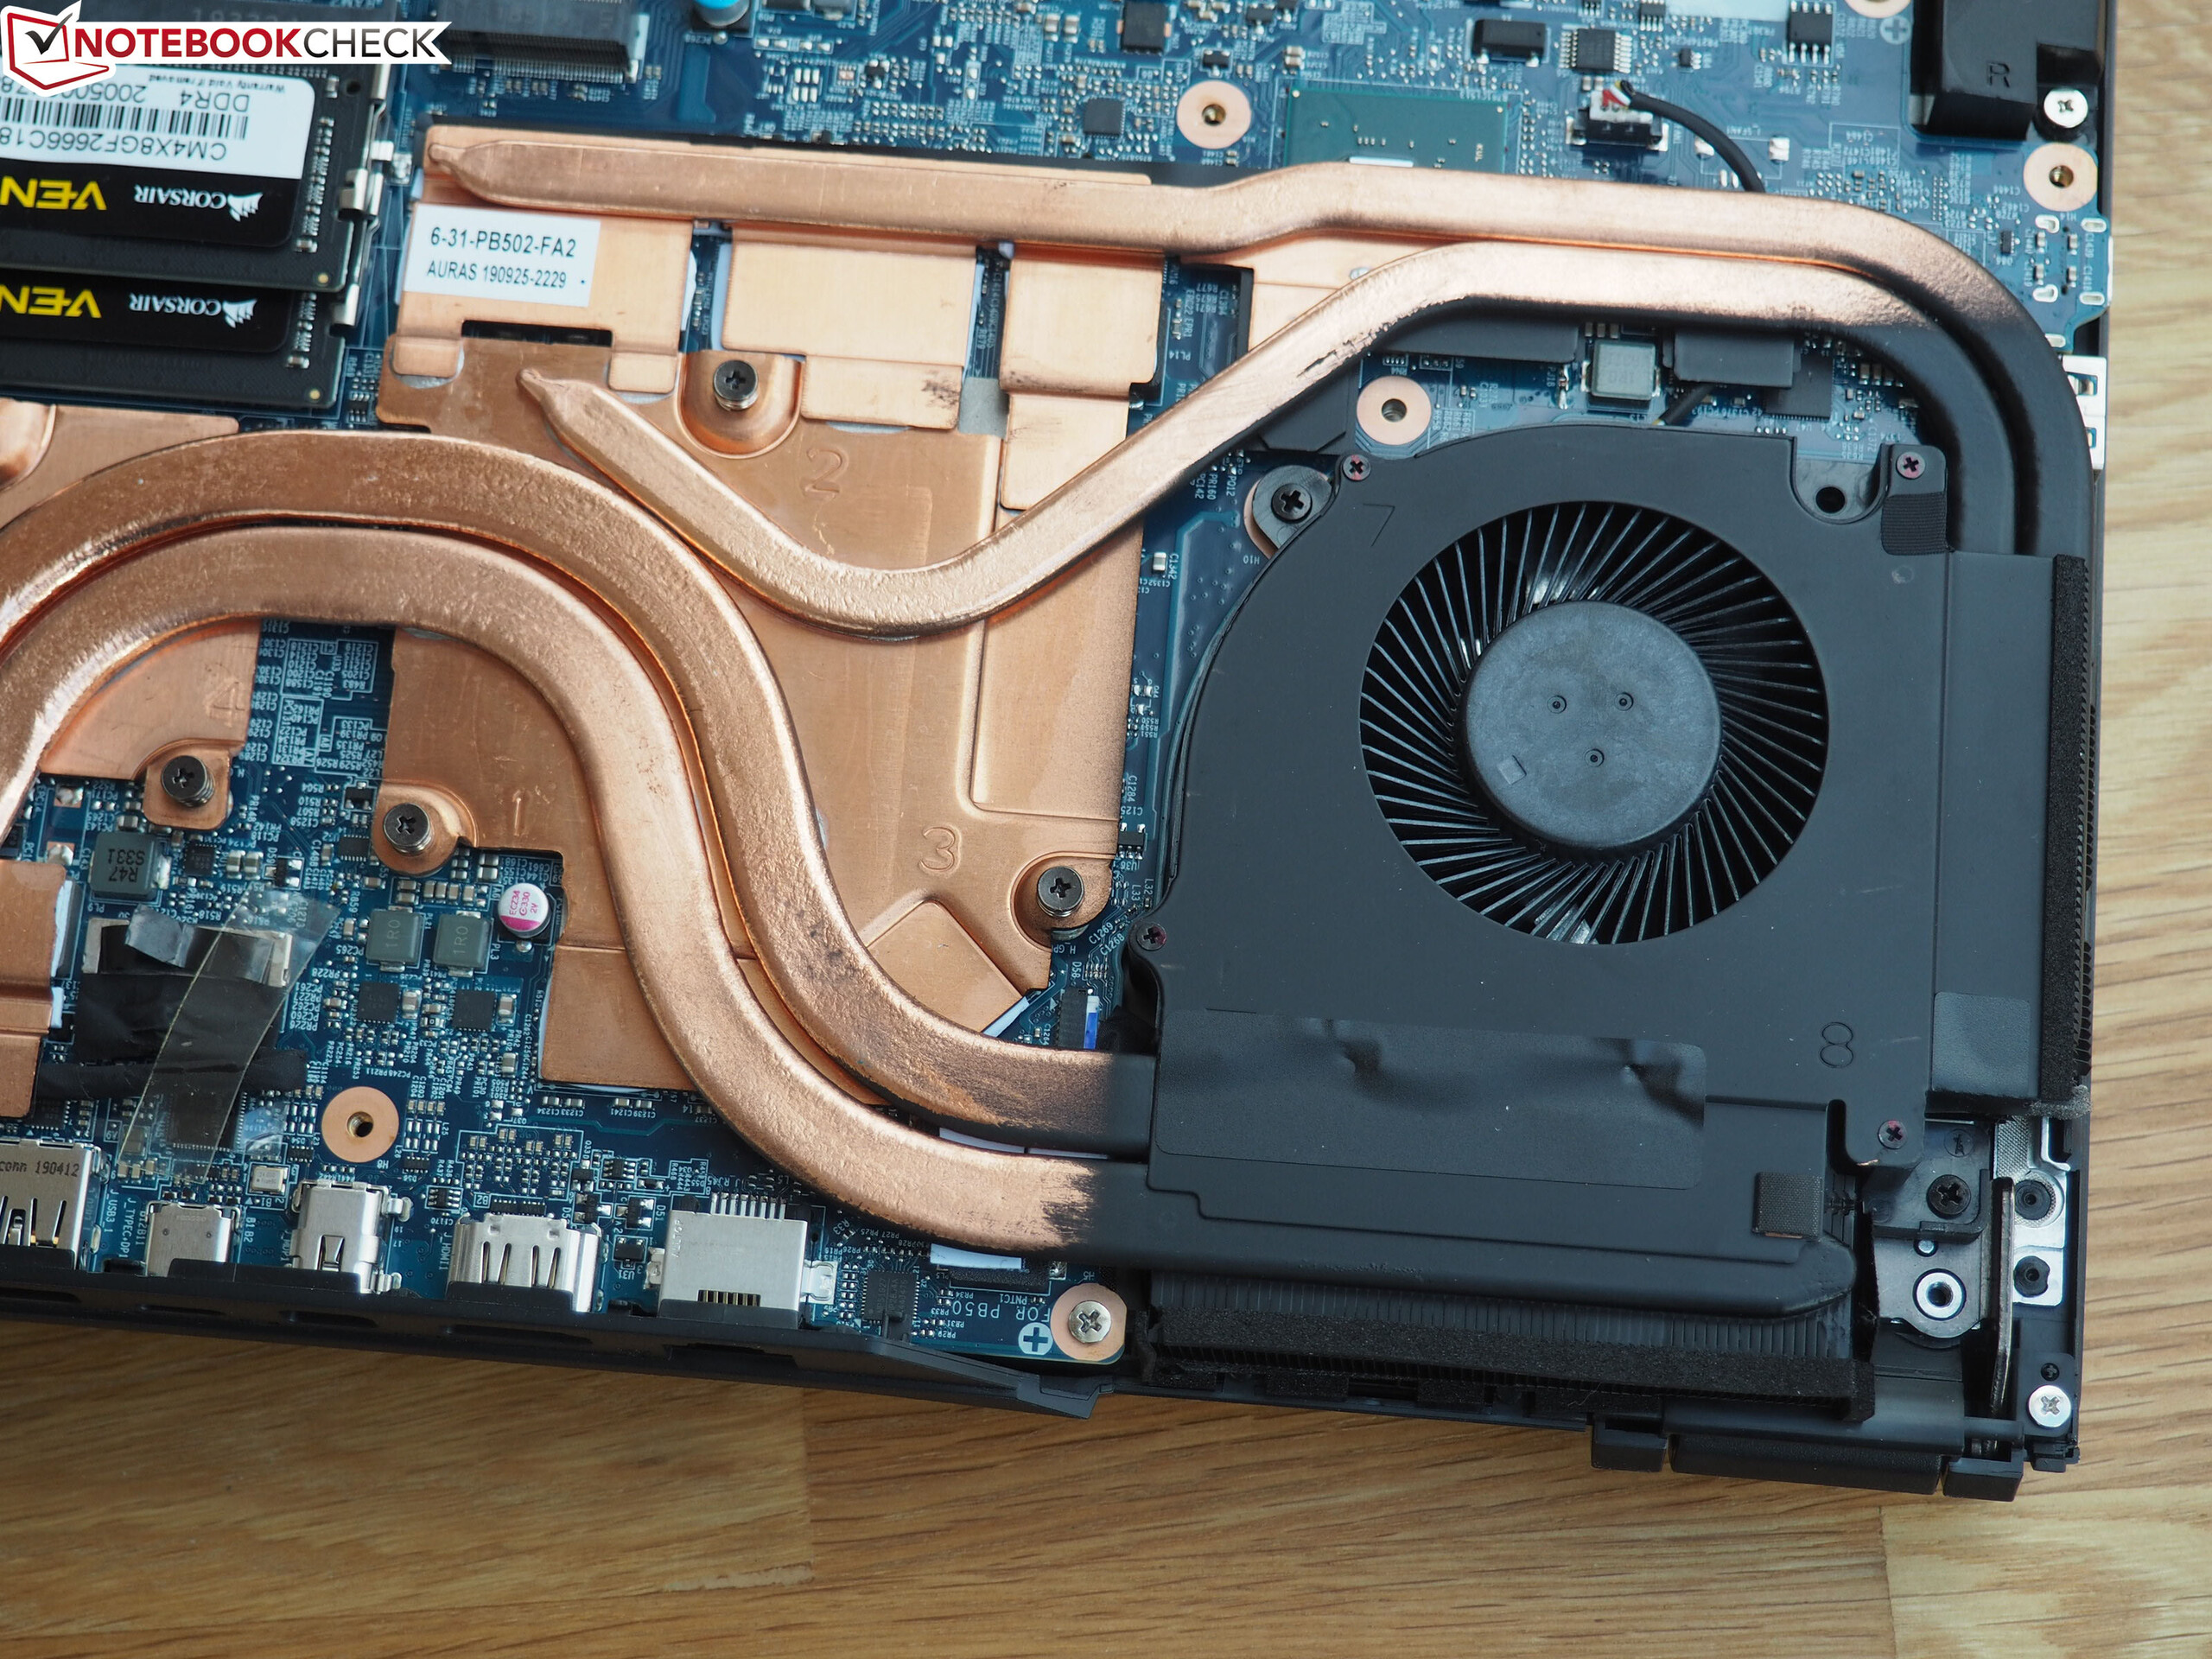
Tyvärr underminerar kylfläktarna ett i övrigt utmärkt koncept. Vi har redan tidigare klagat på att fläktarna ibland går på utan anledning och att 3D-drift generellt ger en för hög ljudnivå på Clevos barebone-modeller. Svag batteritid påverkar också vårt totala omdöme.
Schenker XMG Pro 15
- 02/19/2020 v7 (old)
Florian Glaser
Price comparison