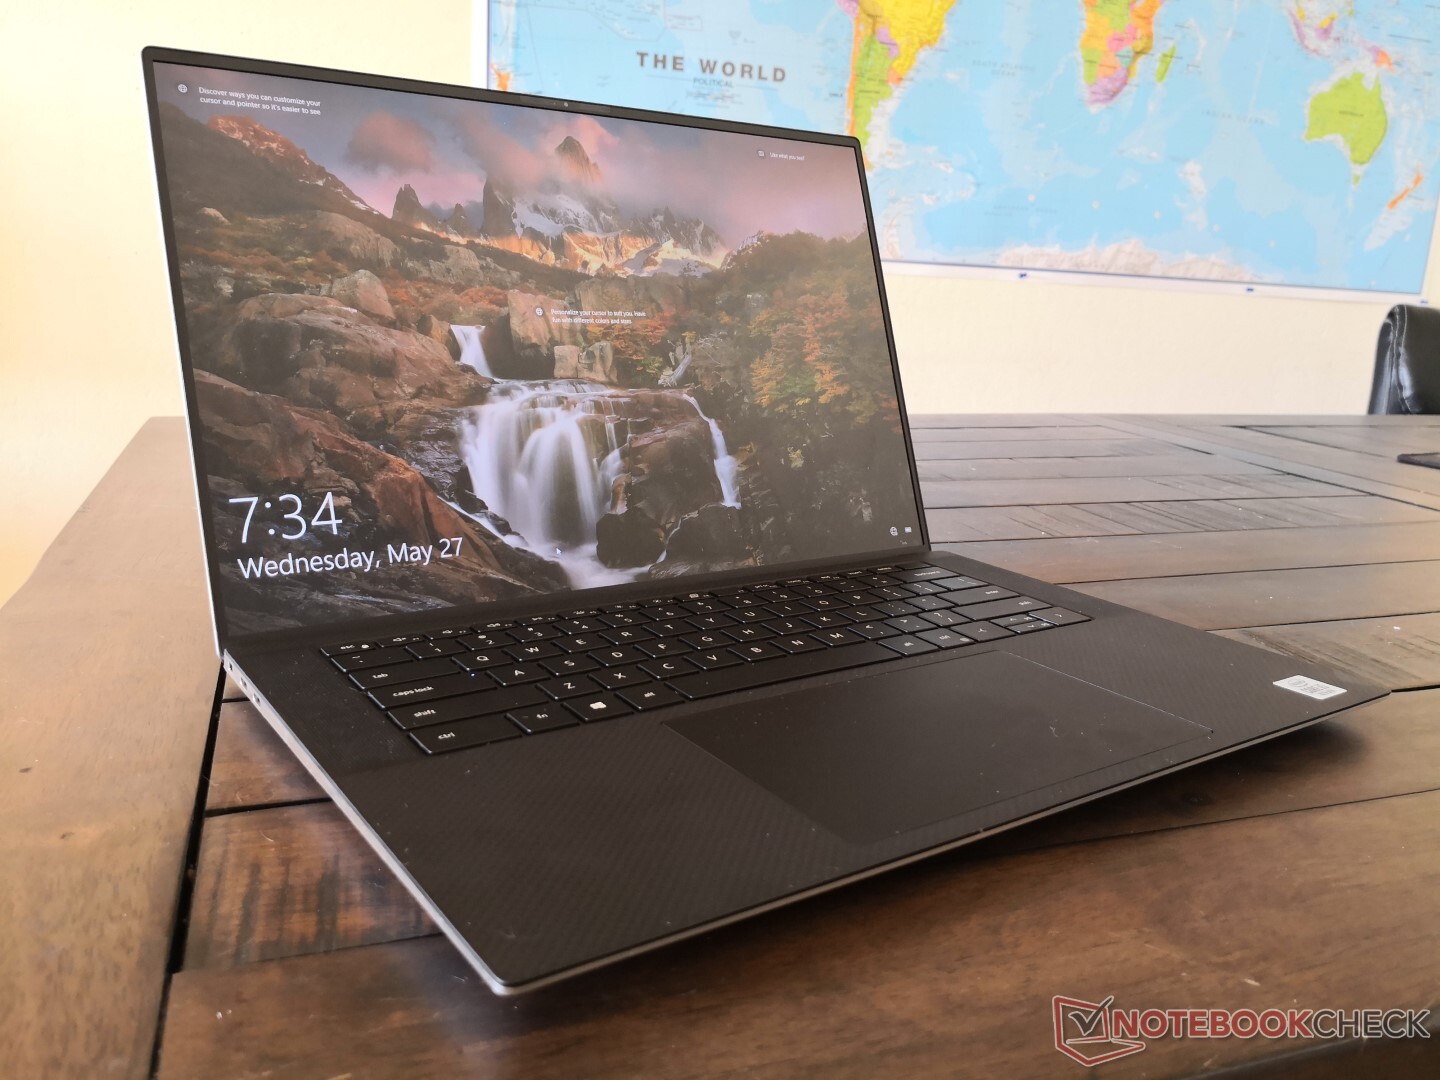
Test: Dell XPS 15 9500 Core i5 - Nu ännu mer lik en MacBook Pro (Sammanfattning)
Gradering | Datum | Modell | Vikt | Höjd | Storlek | Upplösning | Pris |
|---|---|---|---|---|---|---|---|
| 86.8 % v7 (old) | 06/2020 | Dell XPS 15 9500 Core i5 i5-10300H, UHD Graphics 630 | 1.8 kg | 18 mm | 15.60" | 1920x1200 | |
| 85.2 % v7 (old) | 03/2020 | Asus ZenBook 15 UX534FTC-A8190T i7-10510U, GeForce GTX 1650 Max-Q | 1.6 kg | 18.9 mm | 15.60" | 1920x1080 | |
| 86 % v7 (old) | 12/2019 | Lenovo Yoga C940-15IRH i7-9750H, GeForce GTX 1650 Max-Q | 2 kg | 19.7 mm | 15.60" | 1920x1080 | |
| 85 % v7 (old) | 01/2020 | HP Spectre X360 15-5ZV31AV i7-10510U, GeForce MX250 | 2.1 kg | 19.3 mm | 15.60" | 3840x2160 | |
| 89.7 % v7 (old) | 12/2019 | Apple MacBook Pro 16 2019 i9 5500M i9-9880H, Radeon Pro 5500M | 2 kg | 16.2 mm | 16.00" | 3072x1920 |
| SD Card Reader | |
| average JPG Copy Test (av. of 3 runs) | |
| Dell XPS 15 9500 Core i5 (Toshiba Exceria Pro SDXC 64 GB UHS-II) | |
| Razer Blade Pro 17 4K UHD 120 Hz (Toshiba Exceria Pro SDXC 64 GB UHS-II) | |
| Dell XPS 15 7590 i5 iGPU FHD (Toshiba Exceria Pro SDXC 64 GB UHS-II) | |
| HP Spectre X360 15-5ZV31AV (Toshiba Exceria Pro M501 UHS-II) | |
| maximum AS SSD Seq Read Test (1GB) | |
| Dell XPS 15 9500 Core i5 (Toshiba Exceria Pro SDXC 64 GB UHS-II) | |
| Razer Blade Pro 17 4K UHD 120 Hz (Toshiba Exceria Pro SDXC 64 GB UHS-II) | |
| Dell XPS 15 7590 i5 iGPU FHD (Toshiba Exceria Pro SDXC 64 GB UHS-II) | |
| HP Spectre X360 15-5ZV31AV (Toshiba Exceria Pro M501 UHS-II) | |
| Networking | |
| iperf3 transmit AX12 | |
| MSI GS66 10SGS | |
| Dell XPS 13 9300 4K UHD | |
| Dell XPS 15 9500 Core i5 | |
| Acer Aspire 5 A515-54G | |
| Asus TUF A17 FA706IU-AS76 | |
| iperf3 receive AX12 | |
| Dell XPS 13 9300 4K UHD | |
| MSI GS66 10SGS | |
| Dell XPS 15 9500 Core i5 | |
| Acer Aspire 5 A515-54G | |
| Asus TUF A17 FA706IU-AS76 | |


| |||||||||||||||||||||||||
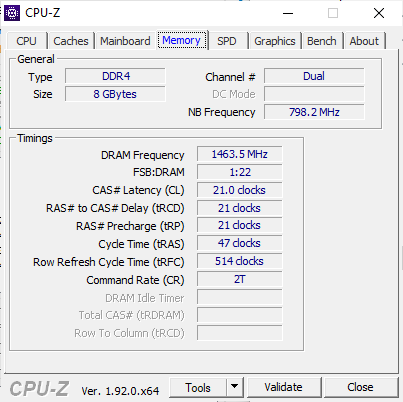
Distribution av ljusstyrkan: 85 %
Mitt på batteriet: 592 cd/m²
Kontrast: 1287:1 (Svärta: 0.46 cd/m²)
ΔE ColorChecker Calman: 3.19 | ∀{0.5-29.43 Ø4.74}
calibrated: 2.03
ΔE Greyscale Calman: 3.9 | ∀{0.09-98 Ø4.98}
100% sRGB (Argyll 1.6.3 3D)
71.6% AdobeRGB 1998 (Argyll 1.6.3 3D)
79.6% AdobeRGB 1998 (Argyll 3D)
100% sRGB (Argyll 3D)
81.5% Display P3 (Argyll 3D)
Gamma: 2.25
CCT: 6522 K
| Dell XPS 15 9500 Core i5 Sharp LQ156N1, IPS, 15.6", 1920x1200 | Dell XPS 15 7590 i5 iGPU FHD LQ156M1, IPS, 15.6", 1920x1080 | Asus ZenBook 15 UX534FTC-A8190T BOE CQ NV156FHM-N63, IPS, 15.6", 1920x1080 | Lenovo Yoga C940-15IRH LG Philips LP156WFC-SPU1, IPS, 15.6", 1920x1080 | HP Spectre X360 15-5ZV31AV AU Optronics AUO30EB, IPS, 15.6", 3840x2160 | Apple MacBook Pro 16 2019 i9 5500M APPA044, IPS, 16", 3072x1920 | |
|---|---|---|---|---|---|---|
| Display | -11% | -18% | -17% | -12% | ||
| Display P3 Coverage (%) | 81.5 | 66.5 -18% | 65 -20% | 61.5 -25% | 68.3 -16% | |
| sRGB Coverage (%) | 100 | 98 -2% | 86.2 -14% | 92.7 -7% | 94.3 -6% | |
| AdobeRGB 1998 Coverage (%) | 79.6 | 68.4 -14% | 62.9 -21% | 63.6 -20% | 68.4 -14% | |
| Response Times | -19% | -9% | -21% | -39% | -23% | |
| Response Time Grey 50% / Grey 80% * (ms) | 42 ? | 52.8 ? -26% | 45 ? -7% | 48.4 ? -15% | 56.8 ? -35% | 52.4 ? -25% |
| Response Time Black / White * (ms) | 28.8 ? | 32 ? -11% | 32 ? -11% | 36.4 ? -26% | 40.8 ? -42% | 34.9 ? -21% |
| PWM Frequency (Hz) | 1020 ? | 131700 | ||||
| Screen | 7% | -17% | -6% | -12% | 14% | |
| Brightness middle (cd/m²) | 592 | 588 -1% | 299 -49% | 484.8 -18% | 284.6 -52% | 519 -12% |
| Brightness (cd/m²) | 565 | 555 -2% | 280 -50% | 463 -18% | 285 -50% | 477 -16% |
| Brightness Distribution (%) | 85 | 89 5% | 89 5% | 82 -4% | 85 0% | 86 1% |
| Black Level * (cd/m²) | 0.46 | 0.4 13% | 0.21 54% | 0.26 43% | 0.25 46% | 0.39 15% |
| Contrast (:1) | 1287 | 1470 14% | 1424 11% | 1865 45% | 1138 -12% | 1331 3% |
| Colorchecker dE 2000 * | 3.19 | 2.5 22% | 4.76 -49% | 4.5 -41% | 3.52 -10% | 2.28 29% |
| Colorchecker dE 2000 max. * | 5.45 | 6.3 -16% | 9 -65% | 7.55 -39% | 5.56 -2% | 6.54 -20% |
| Colorchecker dE 2000 calibrated * | 2.03 | 0.6 70% | 1.19 41% | 3 -48% | 0.86 58% | |
| Greyscale dE 2000 * | 3.9 | 4.5 -15% | 3.53 9% | 5.7 -46% | 3.2 18% | 0.9 77% |
| Gamma | 2.25 98% | 2.2 100% | 2.3 96% | 2.45 90% | 2.28 96% | 2145 0% |
| CCT | 6522 100% | 6836 95% | 7228 90% | 6101 107% | 7070 92% | 6572 99% |
| Color Space (Percent of AdobeRGB 1998) (%) | 71.6 | 63.2 -12% | 56 -22% | 58.7 -18% | 61.1 -15% | 78 9% |
| Color Space (Percent of sRGB) (%) | 100 | 98 -2% | 86 -14% | 92.8 -7% | 93.8 -6% | |
| Totalt genomsnitt (program/inställningar) | -8% /
0% | -15% /
-16% | -15% /
-10% | -21% /
-15% | -5% /
8% |
* ... mindre är bättre
Visa svarstider
| ↔ Svarstid svart till vitt | ||
|---|---|---|
| 28.8 ms ... stiga ↗ och falla ↘ kombinerat | ↗ 15.2 ms stiga | 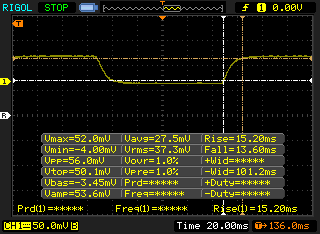 |
| ↘ 13.6 ms hösten | ||
| Skärmen visar relativt långsamma svarsfrekvenser i våra tester och kan vara för långsam för spelare. I jämförelse sträcker sig alla testade enheter från 0.1 (minst) till 240 (maximalt) ms. » 76 % av alla enheter är bättre. Detta innebär att den uppmätta svarstiden är sämre än genomsnittet av alla testade enheter (19.9 ms). | ||
| ↔ Svarstid 50 % grått till 80 % grått | ||
| 42 ms ... stiga ↗ och falla ↘ kombinerat | ↗ 20 ms stiga | 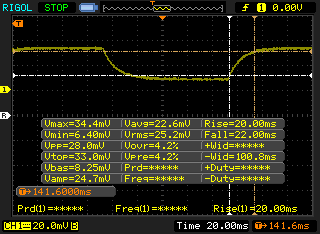 |
| ↘ 22 ms hösten | ||
| Skärmen visar långsamma svarsfrekvenser i våra tester och kommer att vara otillfredsställande för spelare. I jämförelse sträcker sig alla testade enheter från 0.165 (minst) till 636 (maximalt) ms. » 67 % av alla enheter är bättre. Detta innebär att den uppmätta svarstiden är sämre än genomsnittet av alla testade enheter (31.2 ms). | ||
Skärmflimmer / PWM (Puls-Width Modulation)
| Skärmflimmer / PWM upptäcktes inte | 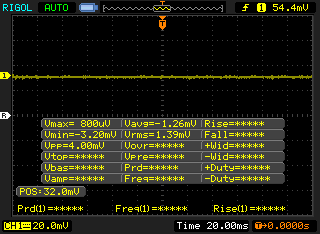 | ||
Som jämförelse: 52 % av alla testade enheter använder inte PWM för att dämpa skärmen. Om PWM upptäcktes mättes ett medelvärde av 7879 (minst: 5 - maximum: 343500) Hz. | |||
Cinebench R15: CPU Multi 64Bit | CPU Single 64Bit
Blender: v2.79 BMW27 CPU
7-Zip 18.03: 7z b 4 -mmt1 | 7z b 4
Geekbench 5.5: Single-Core | Multi-Core
HWBOT x265 Benchmark v2.2: 4k Preset
LibreOffice : 20 Documents To PDF
R Benchmark 2.5: Overall mean
| Cinebench R20 / CPU (Multi Core) | |
| Eluktronics RP-15 | |
| Gigabyte Aero 15 OLED XB-8DE51B0SP | |
| Dell XPS 15 7590 9980HK GTX 1650 | |
| Acer Predator Triton 500 PT515-52-70N3 | |
| Dell G5 15 5590 | |
| Lenovo IdeaPad S740-15IRH | |
| Gigabyte Aero 15-Y9 | |
| Dell XPS 15 9500 Core i5 | |
| Genomsnitt Intel Core i5-10300H (1397 - 2240, n=15) | |
| Dell G5 15 5590-PCNJJ | |
| Asus TUF FX505DT-EB73 | |
| HP Pavilion Gaming 15-ec0002ng | |
| Cinebench R20 / CPU (Single Core) | |
| Gigabyte Aero 15 OLED XB-8DE51B0SP | |
| Eluktronics RP-15 | |
| Acer Predator Triton 500 PT515-52-70N3 | |
| Lenovo IdeaPad S740-15IRH | |
| Dell XPS 15 7590 9980HK GTX 1650 | |
| Dell XPS 15 9500 Core i5 | |
| Genomsnitt Intel Core i5-10300H (312 - 470, n=15) | |
| Dell G5 15 5590-PCNJJ | |
| Dell G5 15 5590 | |
| Gigabyte Aero 15-Y9 | |
| Asus TUF FX505DT-EB73 | |
| HP Pavilion Gaming 15-ec0002ng | |
| Cinebench R15 / CPU Multi 64Bit | |
| Eluktronics RP-15 | |
| Gigabyte Aero 15 OLED XB-8DE51B0SP | |
| Dell XPS 15 7590 9980HK GTX 1650 | |
| Acer Predator Triton 500 PT515-52-70N3 | |
| Gigabyte Aero 15-Y9 | |
| Dell G5 15 5590 | |
| Lenovo IdeaPad S740-15IRH | |
| Dell XPS 15 9500 Core i5 | |
| Genomsnitt Intel Core i5-10300H (536 - 921, n=17) | |
| Dell G5 15 5590-PCNJJ | |
| Asus TUF FX505DT-EB73 | |
| HP Pavilion Gaming 15-ec0002ng | |
| Lenovo IdeaPad 330-15ICH | |
| Cinebench R15 / CPU Single 64Bit | |
| Gigabyte Aero 15 OLED XB-8DE51B0SP | |
| Dell XPS 15 7590 9980HK GTX 1650 | |
| Gigabyte Aero 15-Y9 | |
| Acer Predator Triton 500 PT515-52-70N3 | |
| Lenovo IdeaPad S740-15IRH | |
| Eluktronics RP-15 | |
| Dell XPS 15 9500 Core i5 | |
| Genomsnitt Intel Core i5-10300H (108 - 194, n=17) | |
| Lenovo IdeaPad 330-15ICH | |
| Dell G5 15 5590-PCNJJ | |
| Dell G5 15 5590 | |
| Asus TUF FX505DT-EB73 | |
| HP Pavilion Gaming 15-ec0002ng | |
| Blender / v2.79 BMW27 CPU | |
| Genomsnitt Intel Core i5-10300H (479 - 555, n=14) | |
| Dell XPS 15 9500 Core i5 | |
| Acer Predator Triton 500 PT515-52-70N3 | |
| Gigabyte Aero 15 OLED XB-8DE51B0SP | |
| Eluktronics RP-15 | |
| 7-Zip 18.03 / 7z b 4 -mmt1 | |
| Gigabyte Aero 15 OLED XB-8DE51B0SP | |
| Acer Predator Triton 500 PT515-52-70N3 | |
| Dell XPS 15 9500 Core i5 | |
| Eluktronics RP-15 | |
| Genomsnitt Intel Core i5-10300H (2945 - 4956, n=14) | |
| 7-Zip 18.03 / 7z b 4 | |
| Eluktronics RP-15 | |
| Gigabyte Aero 15 OLED XB-8DE51B0SP | |
| Acer Predator Triton 500 PT515-52-70N3 | |
| Dell XPS 15 9500 Core i5 | |
| Genomsnitt Intel Core i5-10300H (15146 - 24841, n=14) | |
| Geekbench 5.5 / Single-Core | |
| Gigabyte Aero 15 OLED XB-8DE51B0SP | |
| Acer Predator Triton 500 PT515-52-70N3 | |
| Eluktronics RP-15 | |
| Dell XPS 15 9500 Core i5 | |
| Genomsnitt Intel Core i5-10300H (703 - 1241, n=16) | |
| HP Pavilion Gaming 15-ec0002ng | |
| Geekbench 5.5 / Multi-Core | |
| Eluktronics RP-15 | |
| Gigabyte Aero 15 OLED XB-8DE51B0SP | |
| Acer Predator Triton 500 PT515-52-70N3 | |
| Dell XPS 15 9500 Core i5 | |
| Genomsnitt Intel Core i5-10300H (2783 - 4728, n=16) | |
| HP Pavilion Gaming 15-ec0002ng | |
| HWBOT x265 Benchmark v2.2 / 4k Preset | |
| Eluktronics RP-15 | |
| Gigabyte Aero 15 OLED XB-8DE51B0SP | |
| Acer Predator Triton 500 PT515-52-70N3 | |
| Dell XPS 15 9500 Core i5 | |
| Genomsnitt Intel Core i5-10300H (6.13 - 7.78, n=14) | |
| LibreOffice / 20 Documents To PDF | |
| Dell XPS 15 9500 Core i5 | |
| Eluktronics RP-15 | |
| Genomsnitt Intel Core i5-10300H (23.9 - 94, n=14) | |
| Gigabyte Aero 15 OLED XB-8DE51B0SP | |
| Acer Predator Triton 500 PT515-52-70N3 | |
| R Benchmark 2.5 / Overall mean | |
| Genomsnitt Intel Core i5-10300H (0.625 - 1.088, n=14) | |
| Dell XPS 15 9500 Core i5 | |
| Acer Predator Triton 500 PT515-52-70N3 | |
| Eluktronics RP-15 | |
| Gigabyte Aero 15 OLED XB-8DE51B0SP | |
Cinebench R15: CPU Multi 64Bit | CPU Single 64Bit
Blender: v2.79 BMW27 CPU
7-Zip 18.03: 7z b 4 -mmt1 | 7z b 4
Geekbench 5.5: Single-Core | Multi-Core
HWBOT x265 Benchmark v2.2: 4k Preset
LibreOffice : 20 Documents To PDF
R Benchmark 2.5: Overall mean
* ... mindre är bättre
| PCMark 8 Home Score Accelerated v2 | 3842 poäng | |
| PCMark 8 Work Score Accelerated v2 | 5271 poäng | |
| PCMark 10 Score | 4329 poäng | |
Hjälp | ||
| DPC Latencies / LatencyMon - interrupt to process latency (max), Web, Youtube, Prime95 | |
| HP ProBook 430 G7-8VU53EA | |
| Dell XPS 15 9500 Core i5 | |
| Razer Blade 15 RZ09-0328 | |
| Asus ZenBook Flip 14 UX463FA-AI039T | |
* ... mindre är bättre
| Dell XPS 15 9500 Core i5 Toshiba KBG40ZNS256G NVMe | Dell XPS 15 7590 i5 iGPU FHD Toshiba XG6 KXG60ZNV512G | Asus ZenBook 15 UX534FTC-A8190T Samsung SSD PM981 MZVLB1T0HALR | Lenovo Yoga C940-15IRH Intel Optane Memory H10 with Solid State Storage 32GB + 512GB HBRPEKNX0202A(L/H) | HP Spectre X360 15-5ZV31AV Intel SSD 660p 2TB SSDPEKNW020T8 | Apple MacBook Pro 16 2019 i9 5500M Apple SSD AP1024 7171 | |
|---|---|---|---|---|---|---|
| AS SSD | 109% | 112% | 38% | 62% | 122% | |
| Seq Read (MB/s) | 1423 | 2357 66% | 2643 86% | 769 -46% | 1220 -14% | 2531 78% |
| Seq Write (MB/s) | 766 | 1235 61% | 1533 100% | 351.1 -54% | 1152 50% | 2289 199% |
| 4K Read (MB/s) | 42.21 | 43.29 3% | 49.12 16% | 69.1 64% | 52.3 24% | 15.85 -62% |
| 4K Write (MB/s) | 74.8 | 99.7 33% | 134.7 80% | 100.9 35% | 146.6 96% | 39.88 -47% |
| 4K-64 Read (MB/s) | 973 | 1020 5% | 1028 6% | 472 -51% | 652 -33% | 1267 30% |
| 4K-64 Write (MB/s) | 218.8 | 1502 586% | 1353 518% | 948 333% | 847 287% | 1749 699% |
| Access Time Read * (ms) | 0.125 | 0.07 44% | 0.033 74% | 0.071 43% | 0.077 38% | 0.122 2% |
| Access Time Write * (ms) | 0.552 | 0.039 93% | 0.028 95% | 0.137 75% | 0.106 81% | 0.095 83% |
| Score Read (Points) | 1157 | 1299 12% | 1342 16% | 618 -47% | 826 -29% | 1536 33% |
| Score Write (Points) | 370 | 1726 366% | 1641 344% | 1084 193% | 1109 200% | 2018 445% |
| Score Total (Points) | 2094 | 3640 74% | 3622 73% | 2024 -3% | 2371 13% | 4317 106% |
| Copy ISO MB/s (MB/s) | 1151 | 2145 86% | 2226 93% | 839 -27% | 2070 80% | 1995 73% |
| Copy Program MB/s (MB/s) | 499.4 | 565 13% | 506 1% | 455.8 -9% | 571 14% | 584 17% |
| Copy Game MB/s (MB/s) | 733 | 1320 80% | 1230 68% | 969 32% | 1219 66% | 1135 55% |
| CrystalDiskMark 5.2 / 6 | 32% | 48% | 25% | 25% | 33% | |
| Write 4K (MB/s) | 93.3 | 93.6 0% | 138.1 48% | 102.2 10% | 151.5 62% | 55.5 -41% |
| Read 4K (MB/s) | 45.9 | 41.87 -9% | 45.89 0% | 114.3 149% | 59.3 29% | 16.21 -65% |
| Write Seq (MB/s) | 1211 | 1698 40% | 2147 77% | 468.3 -61% | 1424 18% | 1959 62% |
| Read Seq (MB/s) | 1633 | 1978 21% | 2188 34% | 1236 -24% | 1609 -1% | 1763 8% |
| Write 4K Q32T1 (MB/s) | 273.1 | 383.1 40% | 427.8 57% | 556 104% | 393.6 44% | 398.5 46% |
| Read 4K Q32T1 (MB/s) | 356 | 326.9 -8% | 404 13% | 421.6 18% | 369.4 4% | 648 82% |
| Write Seq Q32T1 (MB/s) | 1198 | 2778 132% | 2396 100% | 1264 6% | 1946 62% | 2727 128% |
| Read Seq Q32T1 (MB/s) | 2269 | 3119 37% | 3454 52% | 2239 -1% | 1934 -15% | 3242 43% |
| Totalt genomsnitt (program/inställningar) | 71% /
81% | 80% /
89% | 32% /
34% | 44% /
49% | 78% /
90% |
* ... mindre är bättre

Disk Throttling: DiskSpd Read Loop, Queue Depth 8
| 3DMark 11 | |
| 1280x720 Performance GPU | |
| Dell XPS 15 7590 9980HK GTX 1650 | |
| Dell XPS 15 9575 FY00N | |
| MSI Modern 15 A10RB | |
| Dell XPS 13 9300 Core i7-1065G7 | |
| Asus VivoBook S15 S530UN-BQ097T | |
| Microsoft Surface Laptop 3 13 Core i5-1035G7 | |
| Chuwi AeroBook Plus | |
| Dell XPS 15 9500 Core i5 | |
| Genomsnitt Intel UHD Graphics 630 (642 - 2025, n=12) | |
| Asus Vivobook 15 F512DA-SH31 | |
| Acer Extensa 15 EX215-51-56UX | |
| 1280x720 Performance Combined | |
| Dell XPS 15 7590 9980HK GTX 1650 | |
| Dell XPS 15 9575 FY00N | |
| MSI Modern 15 A10RB | |
| Asus VivoBook S15 S530UN-BQ097T | |
| Dell XPS 13 9300 Core i7-1065G7 | |
| Microsoft Surface Laptop 3 13 Core i5-1035G7 | |
| Chuwi AeroBook Plus | |
| Genomsnitt Intel UHD Graphics 630 (1647 - 2181, n=12) | |
| Dell XPS 15 9500 Core i5 | |
| Asus Vivobook 15 F512DA-SH31 | |
| Acer Extensa 15 EX215-51-56UX | |
| 3DMark 11 Performance | 1985 poäng | |
| 3DMark Cloud Gate Standard Score | 9619 poäng | |
| 3DMark Fire Strike Score | 1095 poäng | |
| 3DMark Time Spy Score | 441 poäng | |
Hjälp | ||
| låg | med. | hög | ultra | |
|---|---|---|---|---|
| The Witcher 3 (2015) | 17.3 | 10.8 | ||
| Dota 2 Reborn (2015) | 79 | 50 | 19.7 | 17.4 |
| X-Plane 11.11 (2018) | 22.4 | 14.3 | 12.8 |
| Dell XPS 15 9500 Core i5 UHD Graphics 630, i5-10300H, Toshiba KBG40ZNS256G NVMe | Dell XPS 15 7590 i5 iGPU FHD UHD Graphics 630, i5-9300H, Toshiba XG6 KXG60ZNV512G | Asus ZenBook 15 UX534FTC-A8190T GeForce GTX 1650 Max-Q, i7-10510U, Samsung SSD PM981 MZVLB1T0HALR | Lenovo Yoga C940-15IRH GeForce GTX 1650 Max-Q, i7-9750H, Intel Optane Memory H10 with Solid State Storage 32GB + 512GB HBRPEKNX0202A(L/H) | HP Spectre X360 15-5ZV31AV GeForce MX250, i7-10510U, Intel SSD 660p 2TB SSDPEKNW020T8 | Apple MacBook Pro 16 2019 i9 5500M Radeon Pro 5500M, i9-9880H, Apple SSD AP1024 7171 | |
|---|---|---|---|---|---|---|
| Noise | -4% | -6% | -13% | -7% | -15% | |
| av / miljö * (dB) | 28 | 29.3 -5% | 30.3 -8% | 28.7 -2% | 30.1 -8% | 29.8 -6% |
| Idle Minimum * (dB) | 28 | 29.3 -5% | 30.3 -8% | 28.7 -2% | 30.1 -8% | 29.9 -7% |
| Idle Average * (dB) | 28 | 29.3 -5% | 30.3 -8% | 28.8 -3% | 30.1 -8% | 29.9 -7% |
| Idle Maximum * (dB) | 28 | 29.8 -6% | 30.9 -10% | 28.8 -3% | 30.1 -8% | 29.9 -7% |
| Load Average * (dB) | 28 | 32.4 -16% | 31.3 -12% | 45 -61% | 30.1 -8% | 43 -54% |
| Load Maximum * (dB) | 41.9 | 37.2 11% | 38.2 9% | 44.7 -7% | 42 -0% | 46.1 -10% |
| Witcher 3 ultra * (dB) | 38.1 | 44.7 | 39.7 | 45.4 |
* ... mindre är bättre
Ljudnivå
| Låg belastning |
| 28 / 28 / 28 dB(A) |
| Hög belastning |
| 28 / 41.9 dB(A) |
 | ||
30 dB tyst 40 dB(A) hörbar 50 dB(A) högt ljud |
||
min: | ||
(±) Den maximala temperaturen på ovansidan är 42.4 °C / 108 F, jämfört med genomsnittet av 36.8 °C / 98 F , allt från 21 till 71 °C för klassen Multimedia.
(+) Botten värms upp till maximalt 39.6 °C / 103 F, jämfört med genomsnittet av 39.1 °C / 102 F
(+) Vid tomgångsbruk är medeltemperaturen för ovansidan 23.2 °C / 74 F, jämfört med enhetsgenomsnittet på 31.3 °C / ### class_avg_f### F.
(+) Handledsstöden och pekplattan är kallare än hudtemperaturen med maximalt 28.4 °C / 83.1 F och är därför svala att ta på.
(±) Medeltemperaturen för handledsstödsområdet på liknande enheter var 28.7 °C / 83.7 F (+0.3 °C / 0.6 F).
Dell XPS 15 9500 Core i5 ljudanalys
(+) | högtalare kan spela relativt högt (84.2 dB)
Bas 100 - 315 Hz
(+) | bra bas - bara 4.6% från medianen
(±) | linjäriteten för basen är genomsnittlig (10% delta till föregående frekvens)
Mellan 400 - 2000 Hz
(+) | balanserad mellan - endast 3.3% från medianen
(+) | mids är linjära (4.5% delta till föregående frekvens)
Högsta 2 - 16 kHz
(+) | balanserade toppar - endast 2.4% från medianen
(+) | toppar är linjära (4.3% delta till föregående frekvens)
Totalt 100 - 16 000 Hz
(+) | det totala ljudet är linjärt (7.7% skillnad mot median)
Jämfört med samma klass
» 7% av alla testade enheter i den här klassen var bättre, 2% liknande, 91% sämre
» Den bästa hade ett delta på 5%, genomsnittet var 17%, sämst var 45%
Jämfört med alla testade enheter
» 1% av alla testade enheter var bättre, 0% liknande, 98% sämre
» Den bästa hade ett delta på 4%, genomsnittet var 24%, sämst var 134%
Apple MacBook 12 (Early 2016) 1.1 GHz ljudanalys
(+) | högtalare kan spela relativt högt (83.6 dB)
Bas 100 - 315 Hz
(±) | reducerad bas - i genomsnitt 11.3% lägre än medianen
(±) | linjäriteten för basen är genomsnittlig (14.2% delta till föregående frekvens)
Mellan 400 - 2000 Hz
(+) | balanserad mellan - endast 2.4% från medianen
(+) | mids är linjära (5.5% delta till föregående frekvens)
Högsta 2 - 16 kHz
(+) | balanserade toppar - endast 2% från medianen
(+) | toppar är linjära (4.5% delta till föregående frekvens)
Totalt 100 - 16 000 Hz
(+) | det totala ljudet är linjärt (10.2% skillnad mot median)
Jämfört med samma klass
» 7% av alla testade enheter i den här klassen var bättre, 2% liknande, 91% sämre
» Den bästa hade ett delta på 5%, genomsnittet var 18%, sämst var 53%
Jämfört med alla testade enheter
» 5% av alla testade enheter var bättre, 1% liknande, 94% sämre
» Den bästa hade ett delta på 4%, genomsnittet var 24%, sämst var 134%
| Av/Standby | |
| Låg belastning | |
| Hög belastning |
|
Förklaring:
min: | |
| Dell XPS 15 9500 Core i5 i5-10300H, UHD Graphics 630, Toshiba KBG40ZNS256G NVMe, IPS, 1920x1200, 15.6" | Dell XPS 15 7590 i5 iGPU FHD i5-9300H, UHD Graphics 630, Toshiba XG6 KXG60ZNV512G, IPS, 1920x1080, 15.6" | Asus ZenBook 15 UX534FTC-A8190T i7-10510U, GeForce GTX 1650 Max-Q, Samsung SSD PM981 MZVLB1T0HALR, IPS, 1920x1080, 15.6" | Lenovo Yoga C940-15IRH i7-9750H, GeForce GTX 1650 Max-Q, Intel Optane Memory H10 with Solid State Storage 32GB + 512GB HBRPEKNX0202A(L/H), IPS, 1920x1080, 15.6" | HP Spectre X360 15-5ZV31AV i7-10510U, GeForce MX250, Intel SSD 660p 2TB SSDPEKNW020T8, IPS, 3840x2160, 15.6" | Apple MacBook Pro 16 2019 i9 5500M i9-9880H, Radeon Pro 5500M, Apple SSD AP1024 7171, IPS, 3072x1920, 16" | |
|---|---|---|---|---|---|---|
| Power Consumption | -20% | -15% | -95% | -31% | -65% | |
| Idle Minimum * (Watt) | 2.9 | 3.79 -31% | 2.8 3% | 5.2 -79% | 5.2 -79% | 3.7 -28% |
| Idle Average * (Watt) | 7.6 | 6.9 9% | 7.7 -1% | 10.7 -41% | 8.5 -12% | 12.1 -59% |
| Idle Maximum * (Watt) | 8 | 9.2 -15% | 9.4 -18% | 24.3 -204% | 8.7 -9% | 17 -113% |
| Load Average * (Watt) | 41.7 | 62 -49% | 57 -37% | 84.4 -102% | 65.6 -57% | 91.5 -119% |
| Load Maximum * (Watt) | 94.8 | 108 -14% | 116 -22% | 142.8 -51% | 92.4 3% | 102.3 -8% |
| Witcher 3 ultra * (Watt) | 62 | 83.9 | 56.5 | 103 |
* ... mindre är bättre
| Dell XPS 15 9500 Core i5 i5-10300H, UHD Graphics 630, 56 Wh | Dell XPS 15 7590 i5 iGPU FHD i5-9300H, UHD Graphics 630, 97 Wh | Asus ZenBook 15 UX534FTC-A8190T i7-10510U, GeForce GTX 1650 Max-Q, 71 Wh | Lenovo Yoga C940-15IRH i7-9750H, GeForce GTX 1650 Max-Q, 69 Wh | HP Spectre X360 15-5ZV31AV i7-10510U, GeForce MX250, 84 Wh | Apple MacBook Pro 16 2019 i9 5500M i9-9880H, Radeon Pro 5500M, 99.8 Wh | |
|---|---|---|---|---|---|---|
| Batteridrifttid | 29% | 29% | -21% | 28% | -4% | |
| Reader / Idle (h) | 26.4 | 27.2 3% | 18.2 -31% | 22.6 -14% | ||
| WiFi v1.3 (h) | 9.3 | 14.1 52% | 12.4 33% | 9.7 4% | 10.8 16% | 12 29% |
| Load (h) | 1.6 | 1.7 6% | 2.4 50% | 1 -37% | 2.9 81% | 1 -37% |
| Witcher 3 ultra (h) | 0.9 |
För
Emot
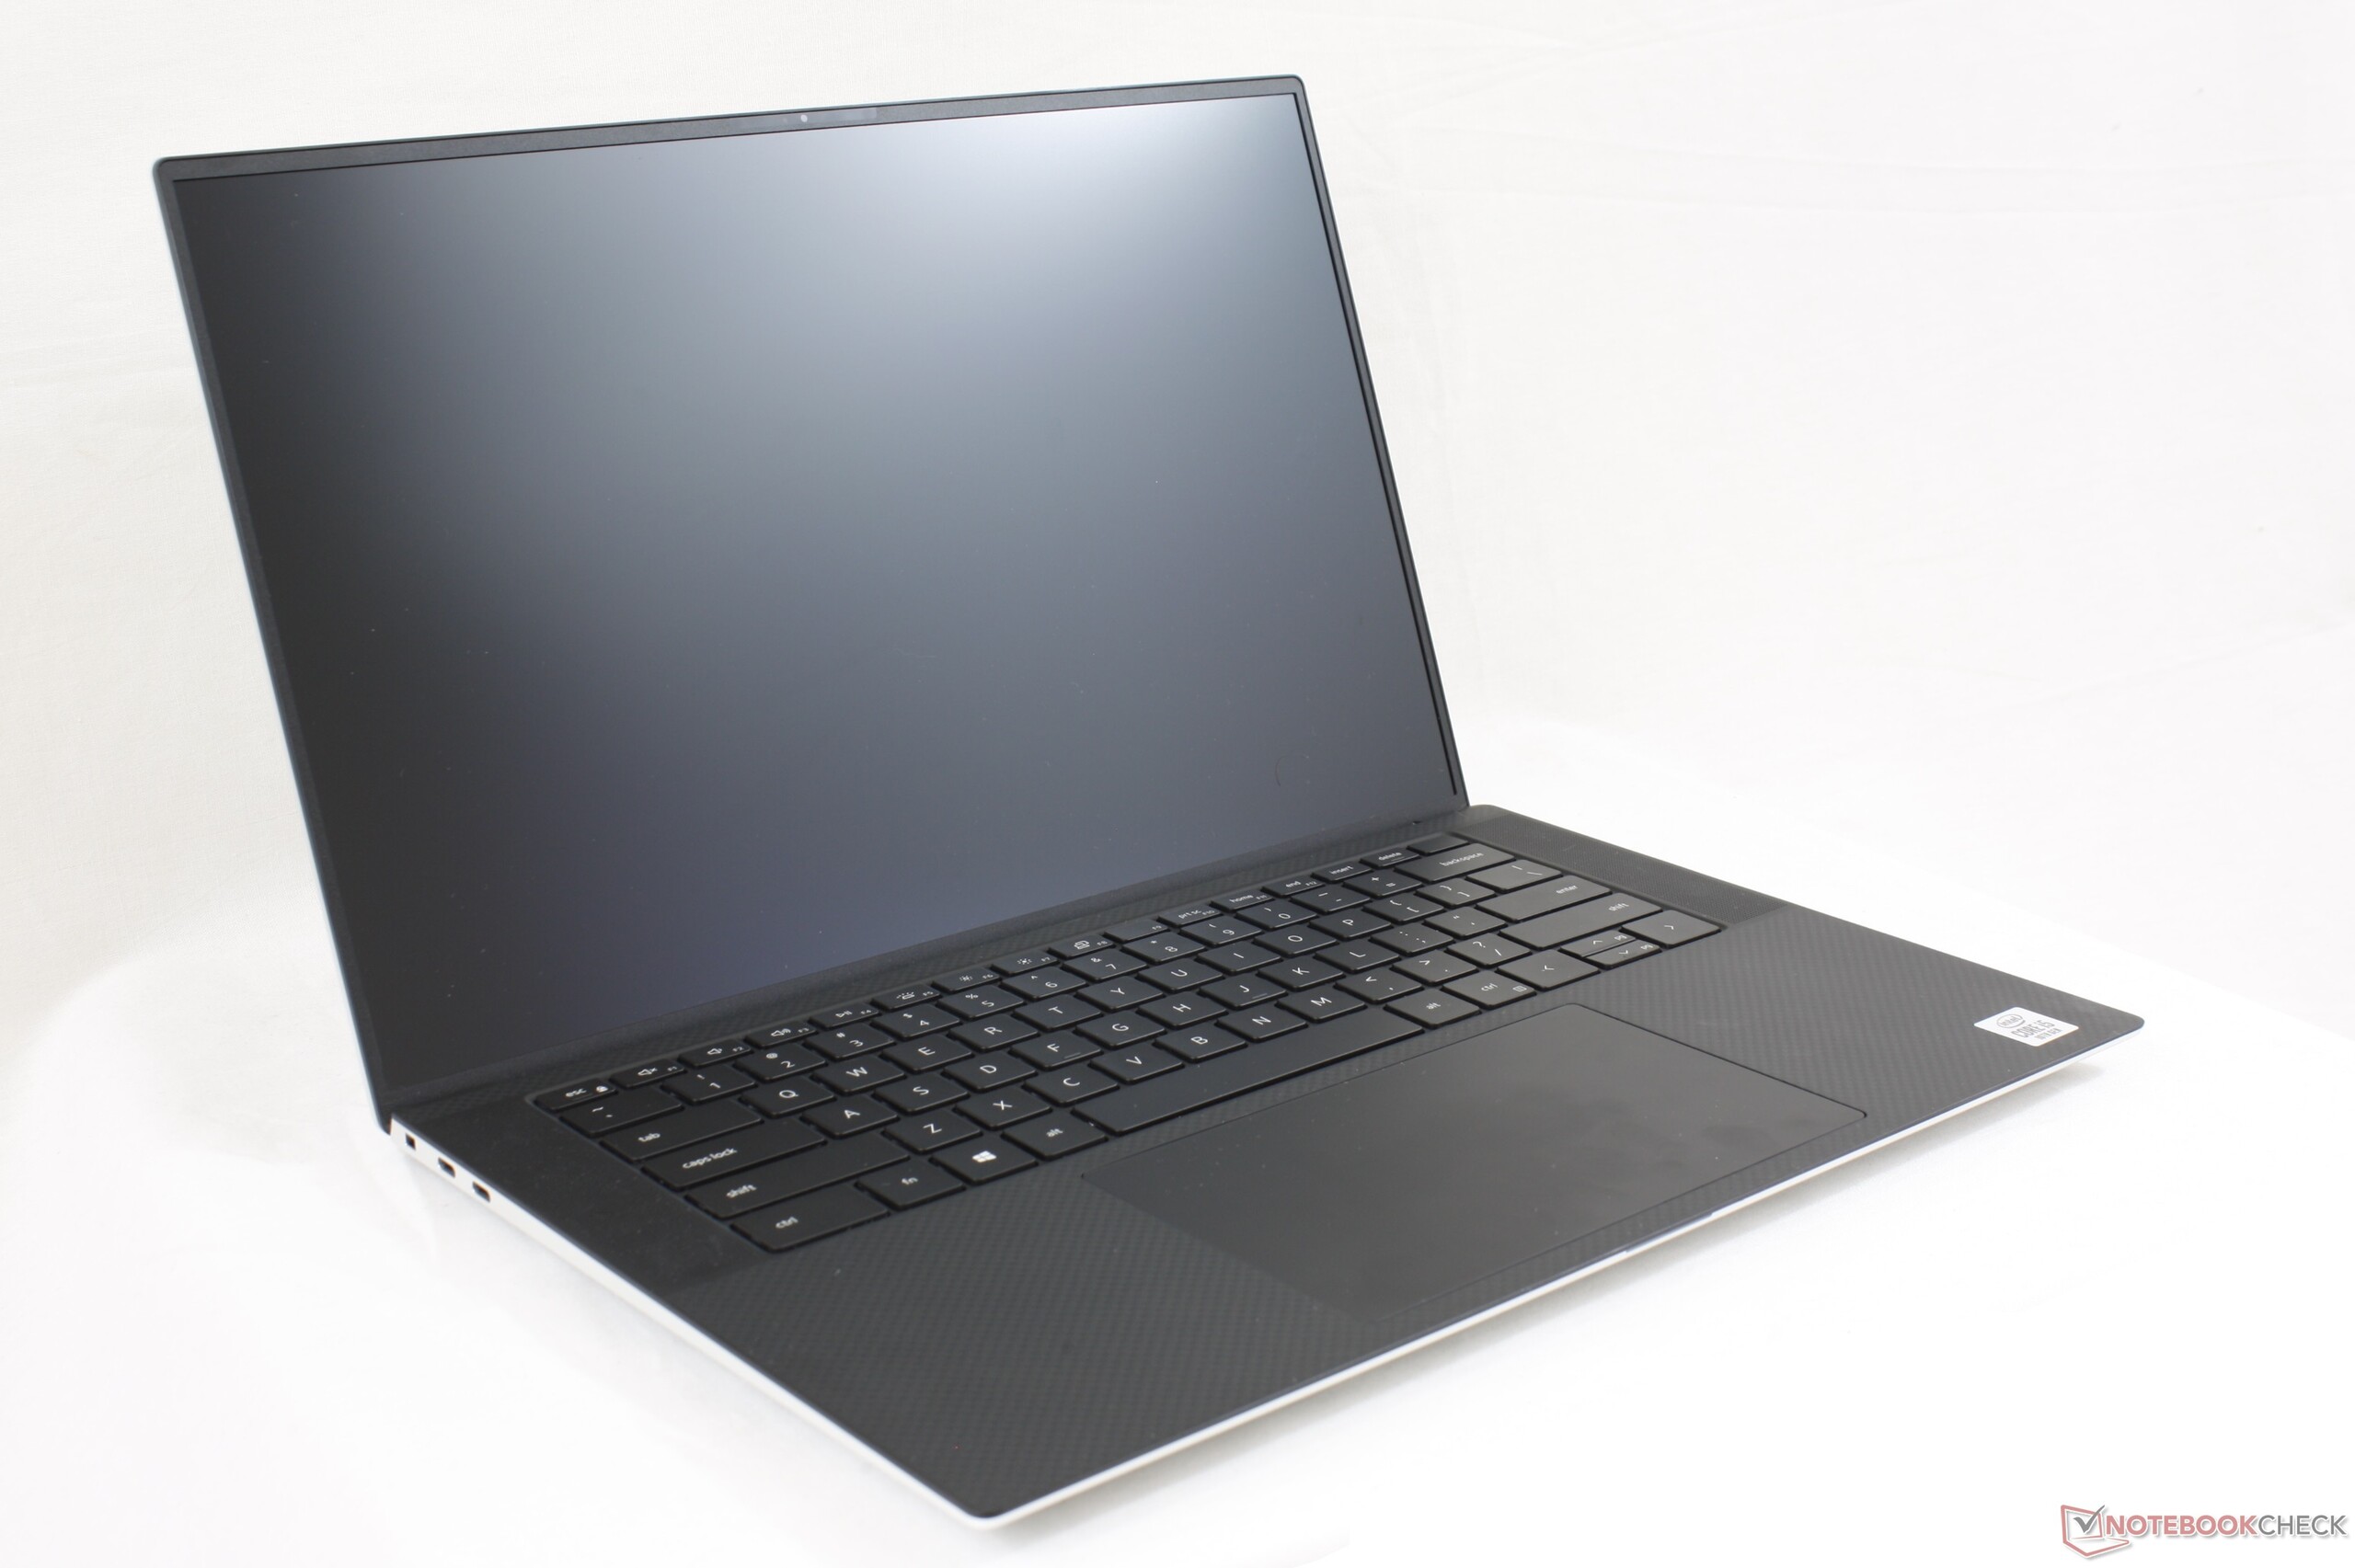
Omdöme — Större skärm trots ännu mindre fotavtryck
Läs den fullständiga versionen av den här recensionen på engelska här.
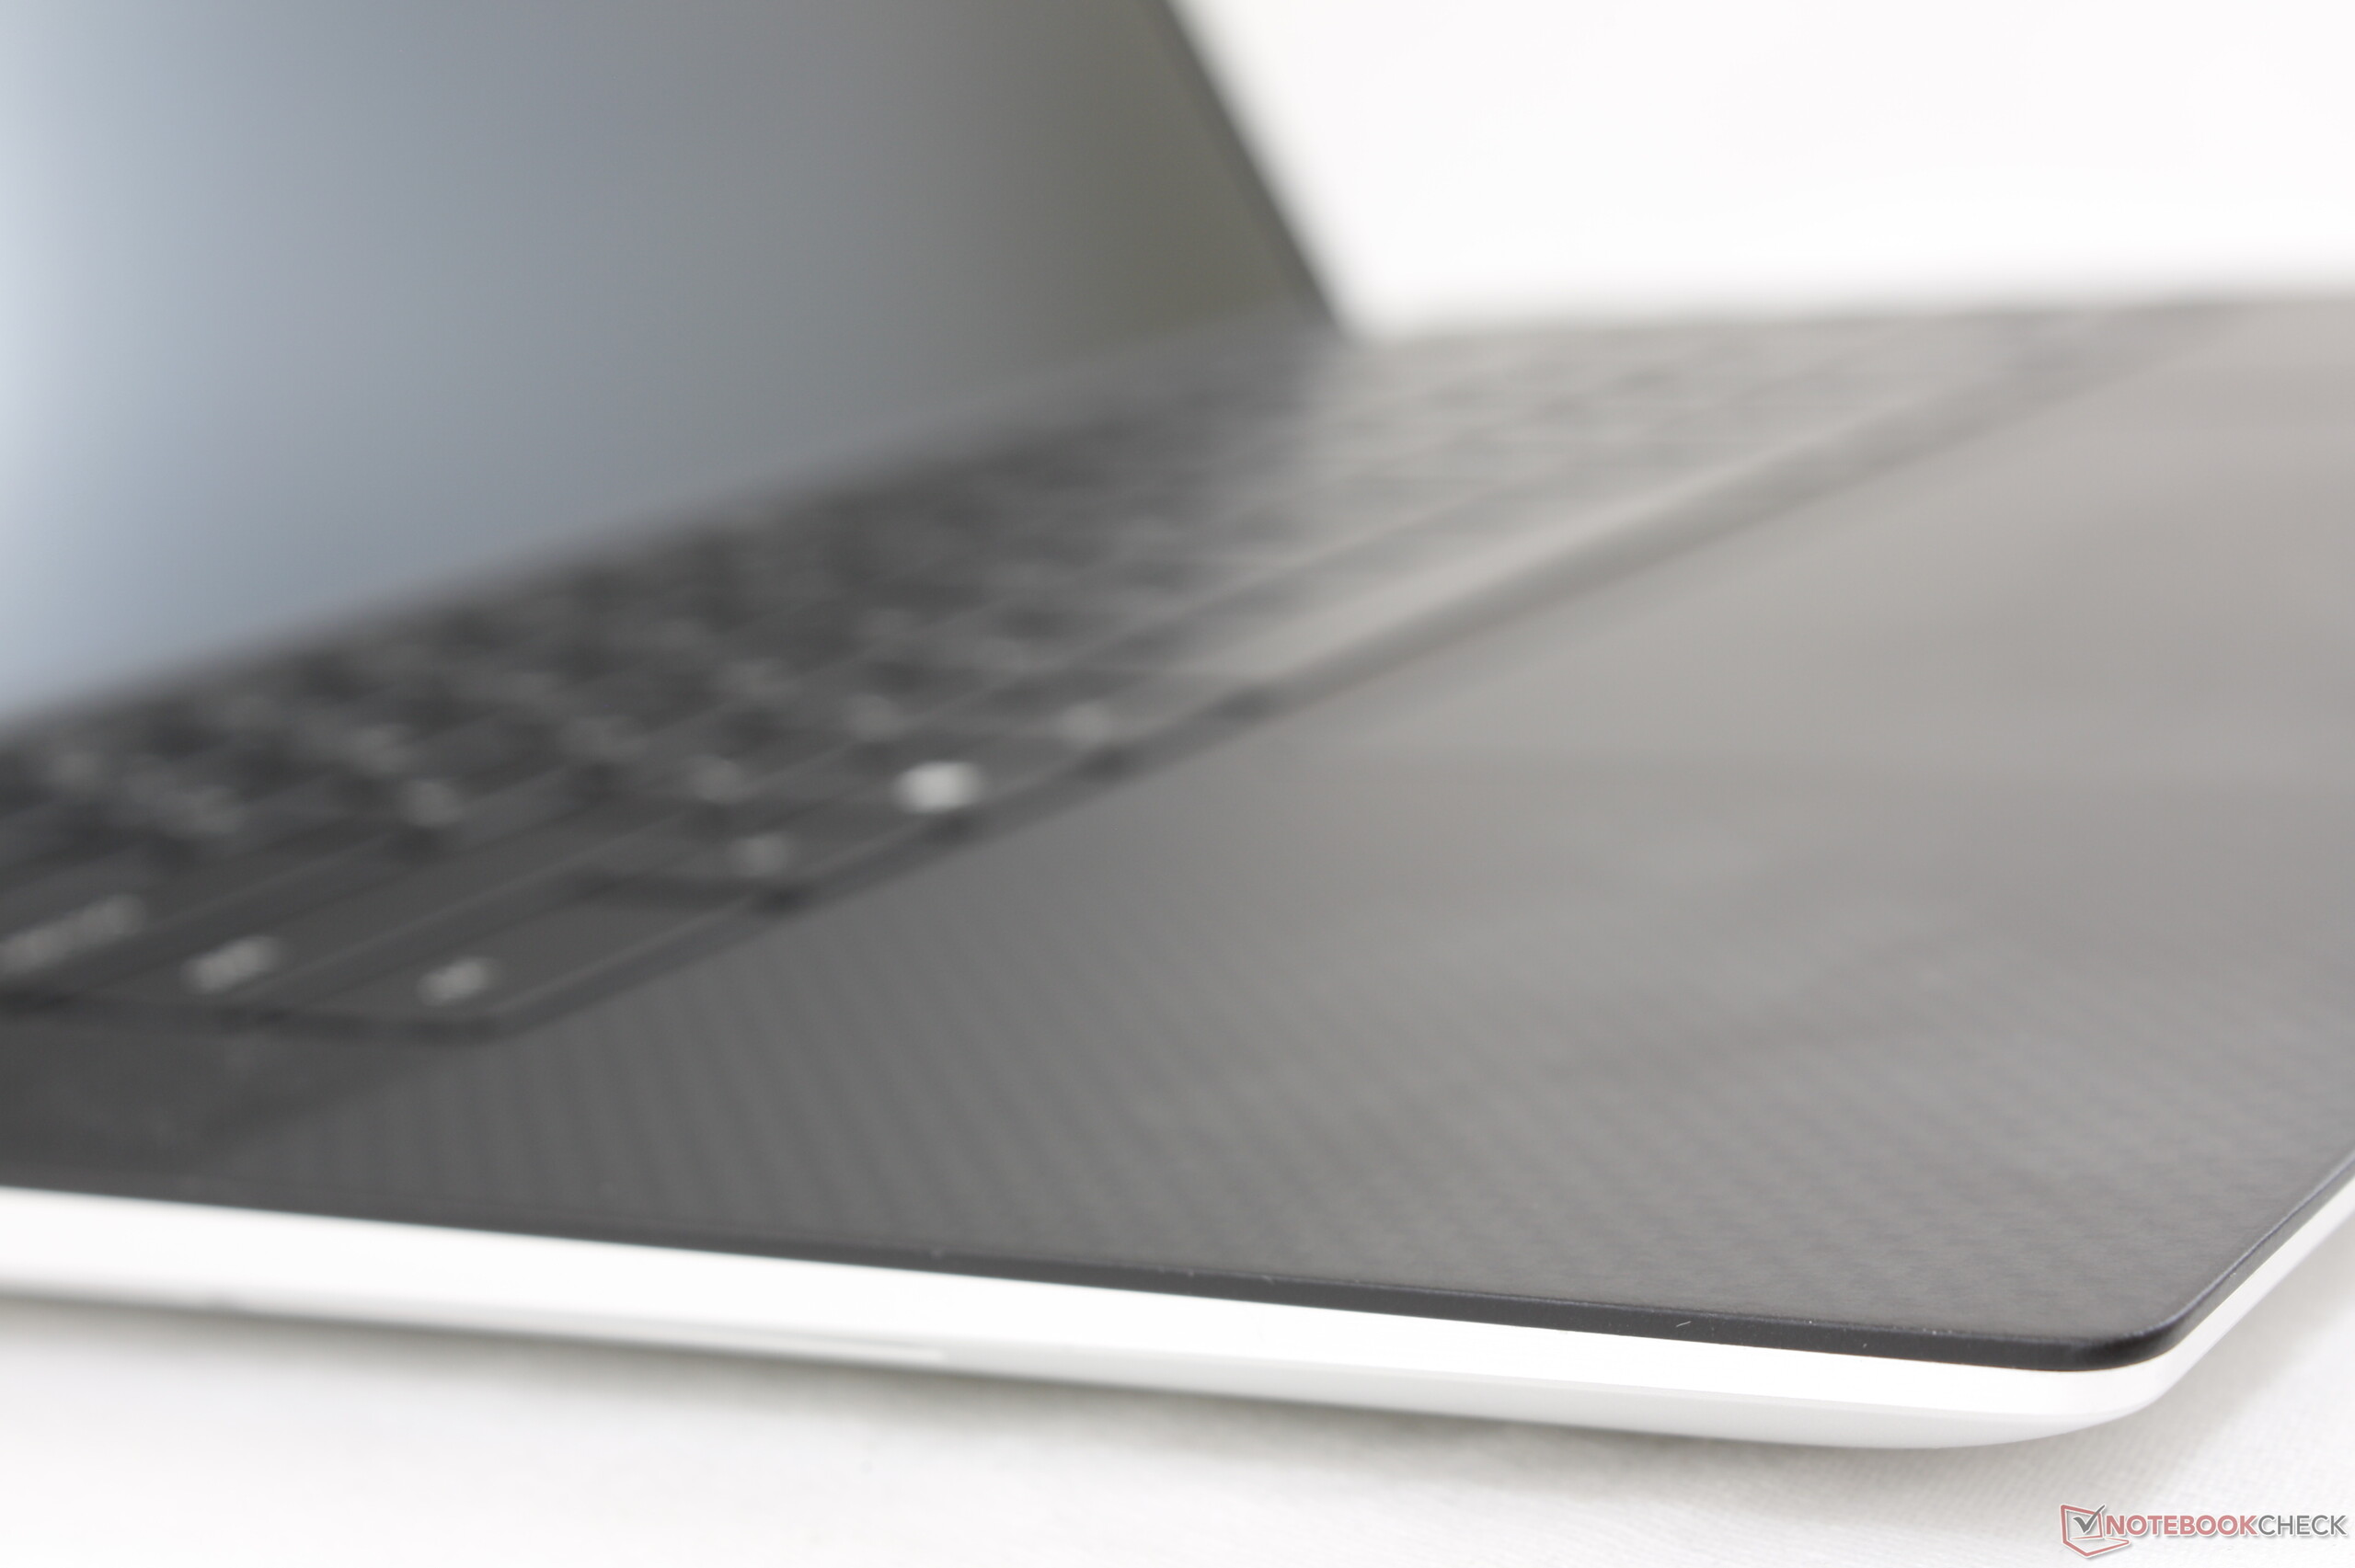
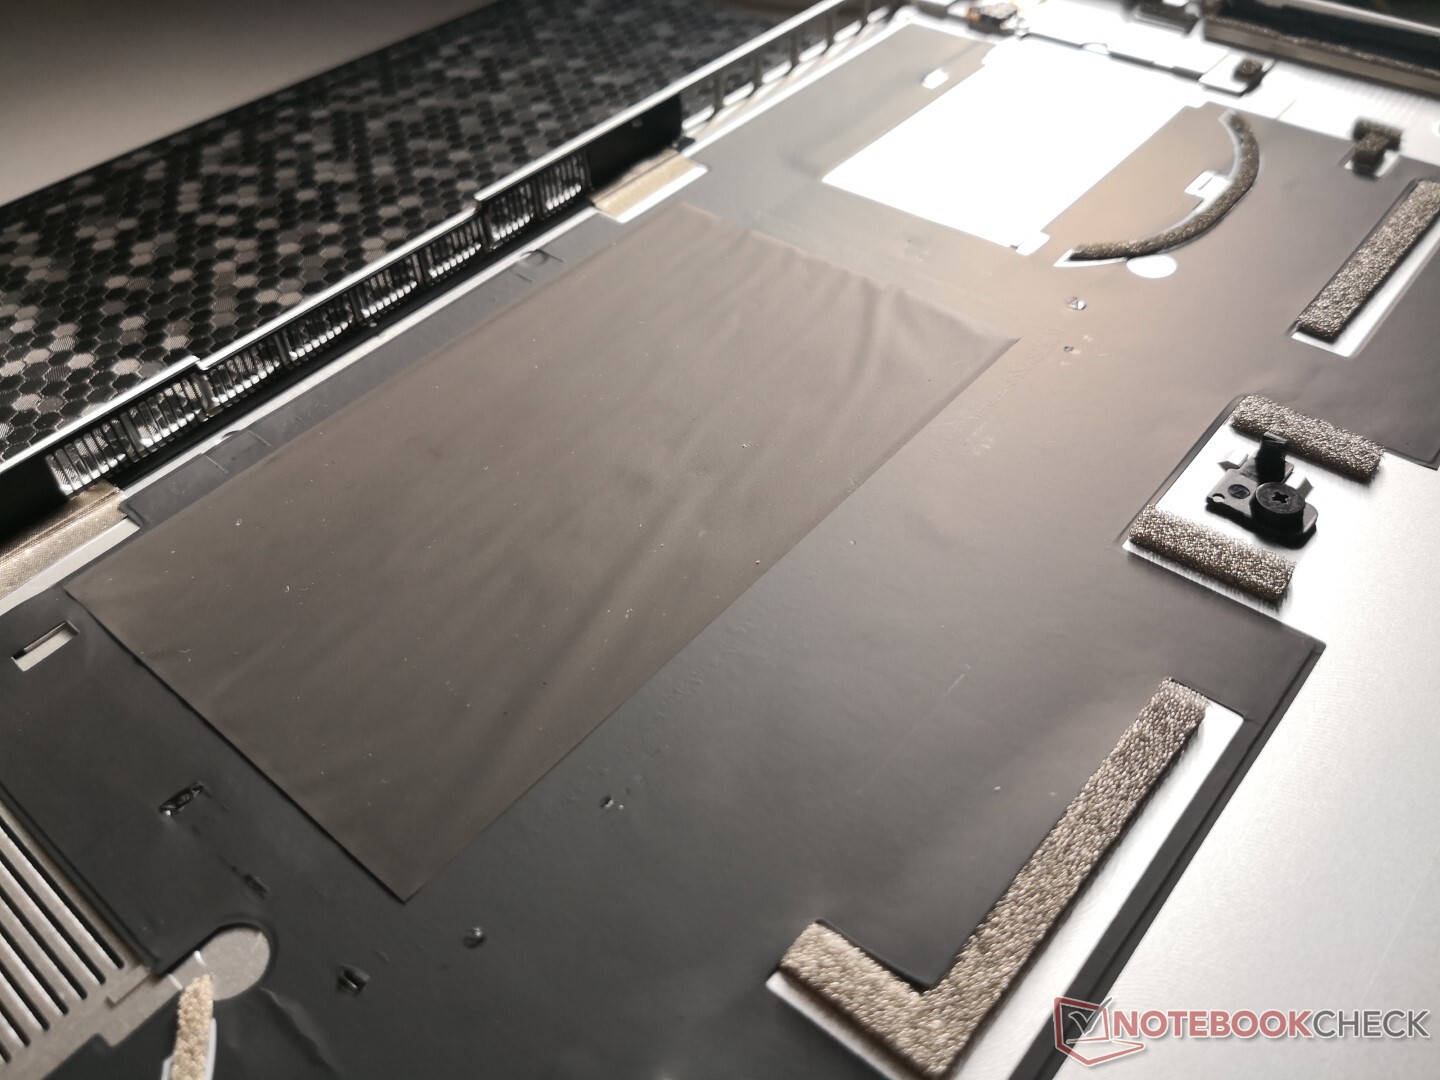
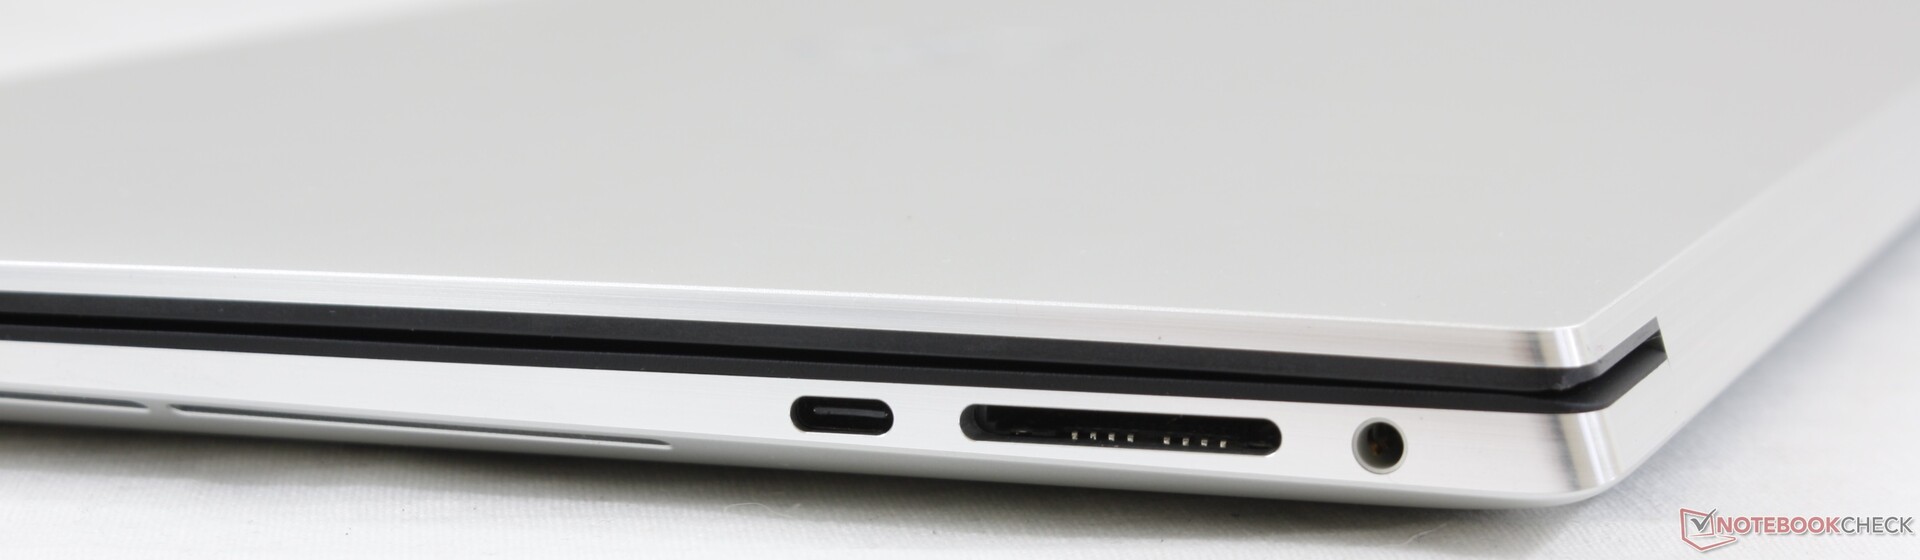
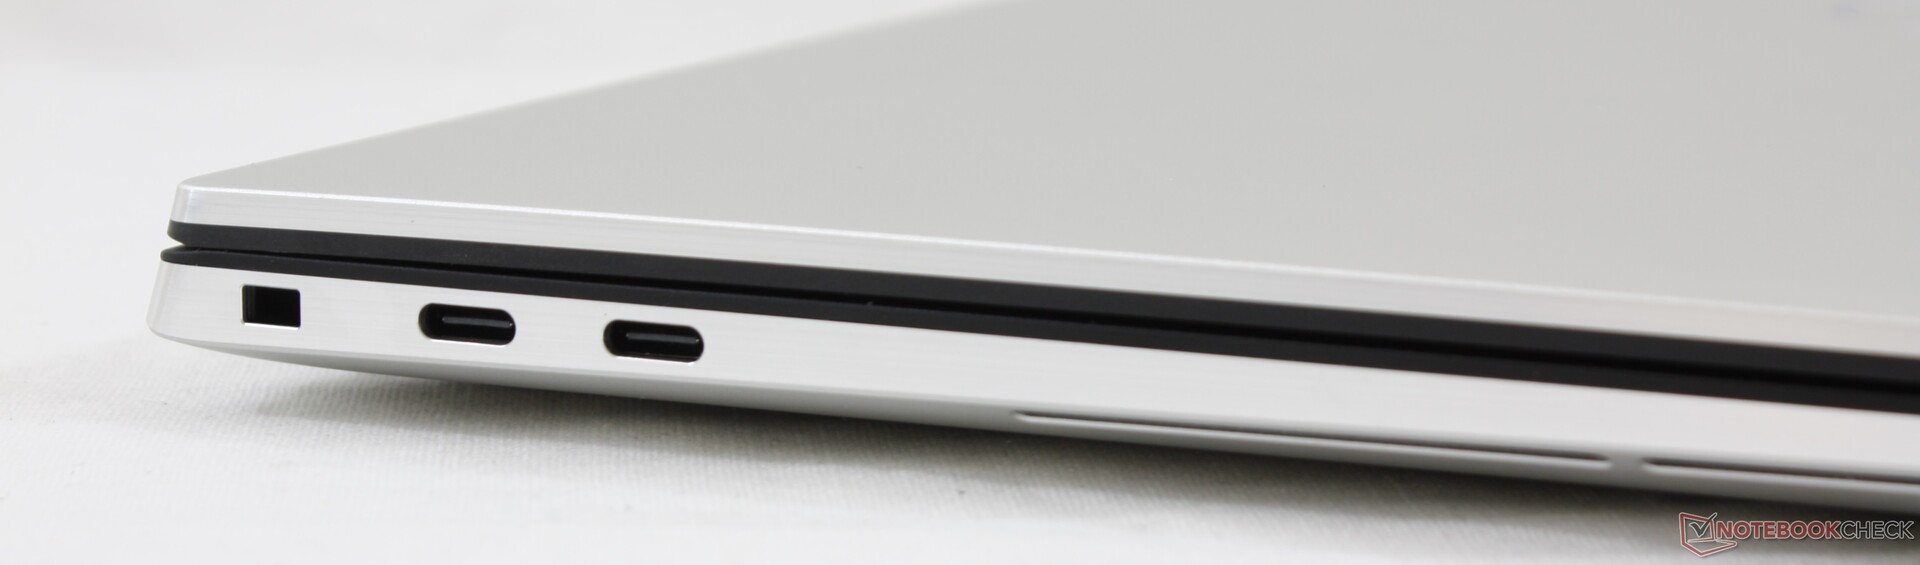
Sett från en genomsnittlig konsuments perspektiv gör den uppfräschade XPS 15 nästan allt rätt. En ljusstark 16:10-skärm, förbättrad tangentbordsåterkoppling, en rymlig klickplatta, ett utökat ljudsystem, lång batteritid, tysta fläktar, RAM som går att uppgradera och en ny sekundär M.2-plats är alla saker som hjälper till att göra detta system till en fröjd att använda. Om du har väntat med att uppgradera till en XPS 15 är det nu dags att tänka om, för den senaste revideringen är på många betydande vis bättre än den äldre designen. Det kommer onekligen bli irriterande att den saknar både HDMI och USB Typ A, men det ingår åtminstone adaptrar i förpackningen, vilket är mer än vi kan säga om MacBook Pro.
Från ett entusiastperspektiv känns det däremot inte som att kyllösningen har förbättrats särskilt mycket. Kärntemperaturerna når redan över 90 C på vår fyrkärniga baskonfiguration med Core i5, vilket innebär att de mer avancerade varianterna med Core i7 och GeForce GTX troligen kommer bli ännu varmare och mer högljudda. Om du inte gillade den ospektakulära kyllösningen på den förra modellen kommer knappast den nya modellen ändra din uppfattning. Vidare är det nu svårare att serva WLAN-modulen och tangentbordet då båda komponenterna är mer integrerade i moderkortet.
Vi kommer att återgå till XPS 15 9500 snart med fler konfigurationer för att få en bättre bild över hur modellen presterar totalt sett. Men för ett utgångspris på 13.000 kronor gör Dells flaggskepp rätt på nästan alla sätt och lämnar ett beundransvärt första intryck.
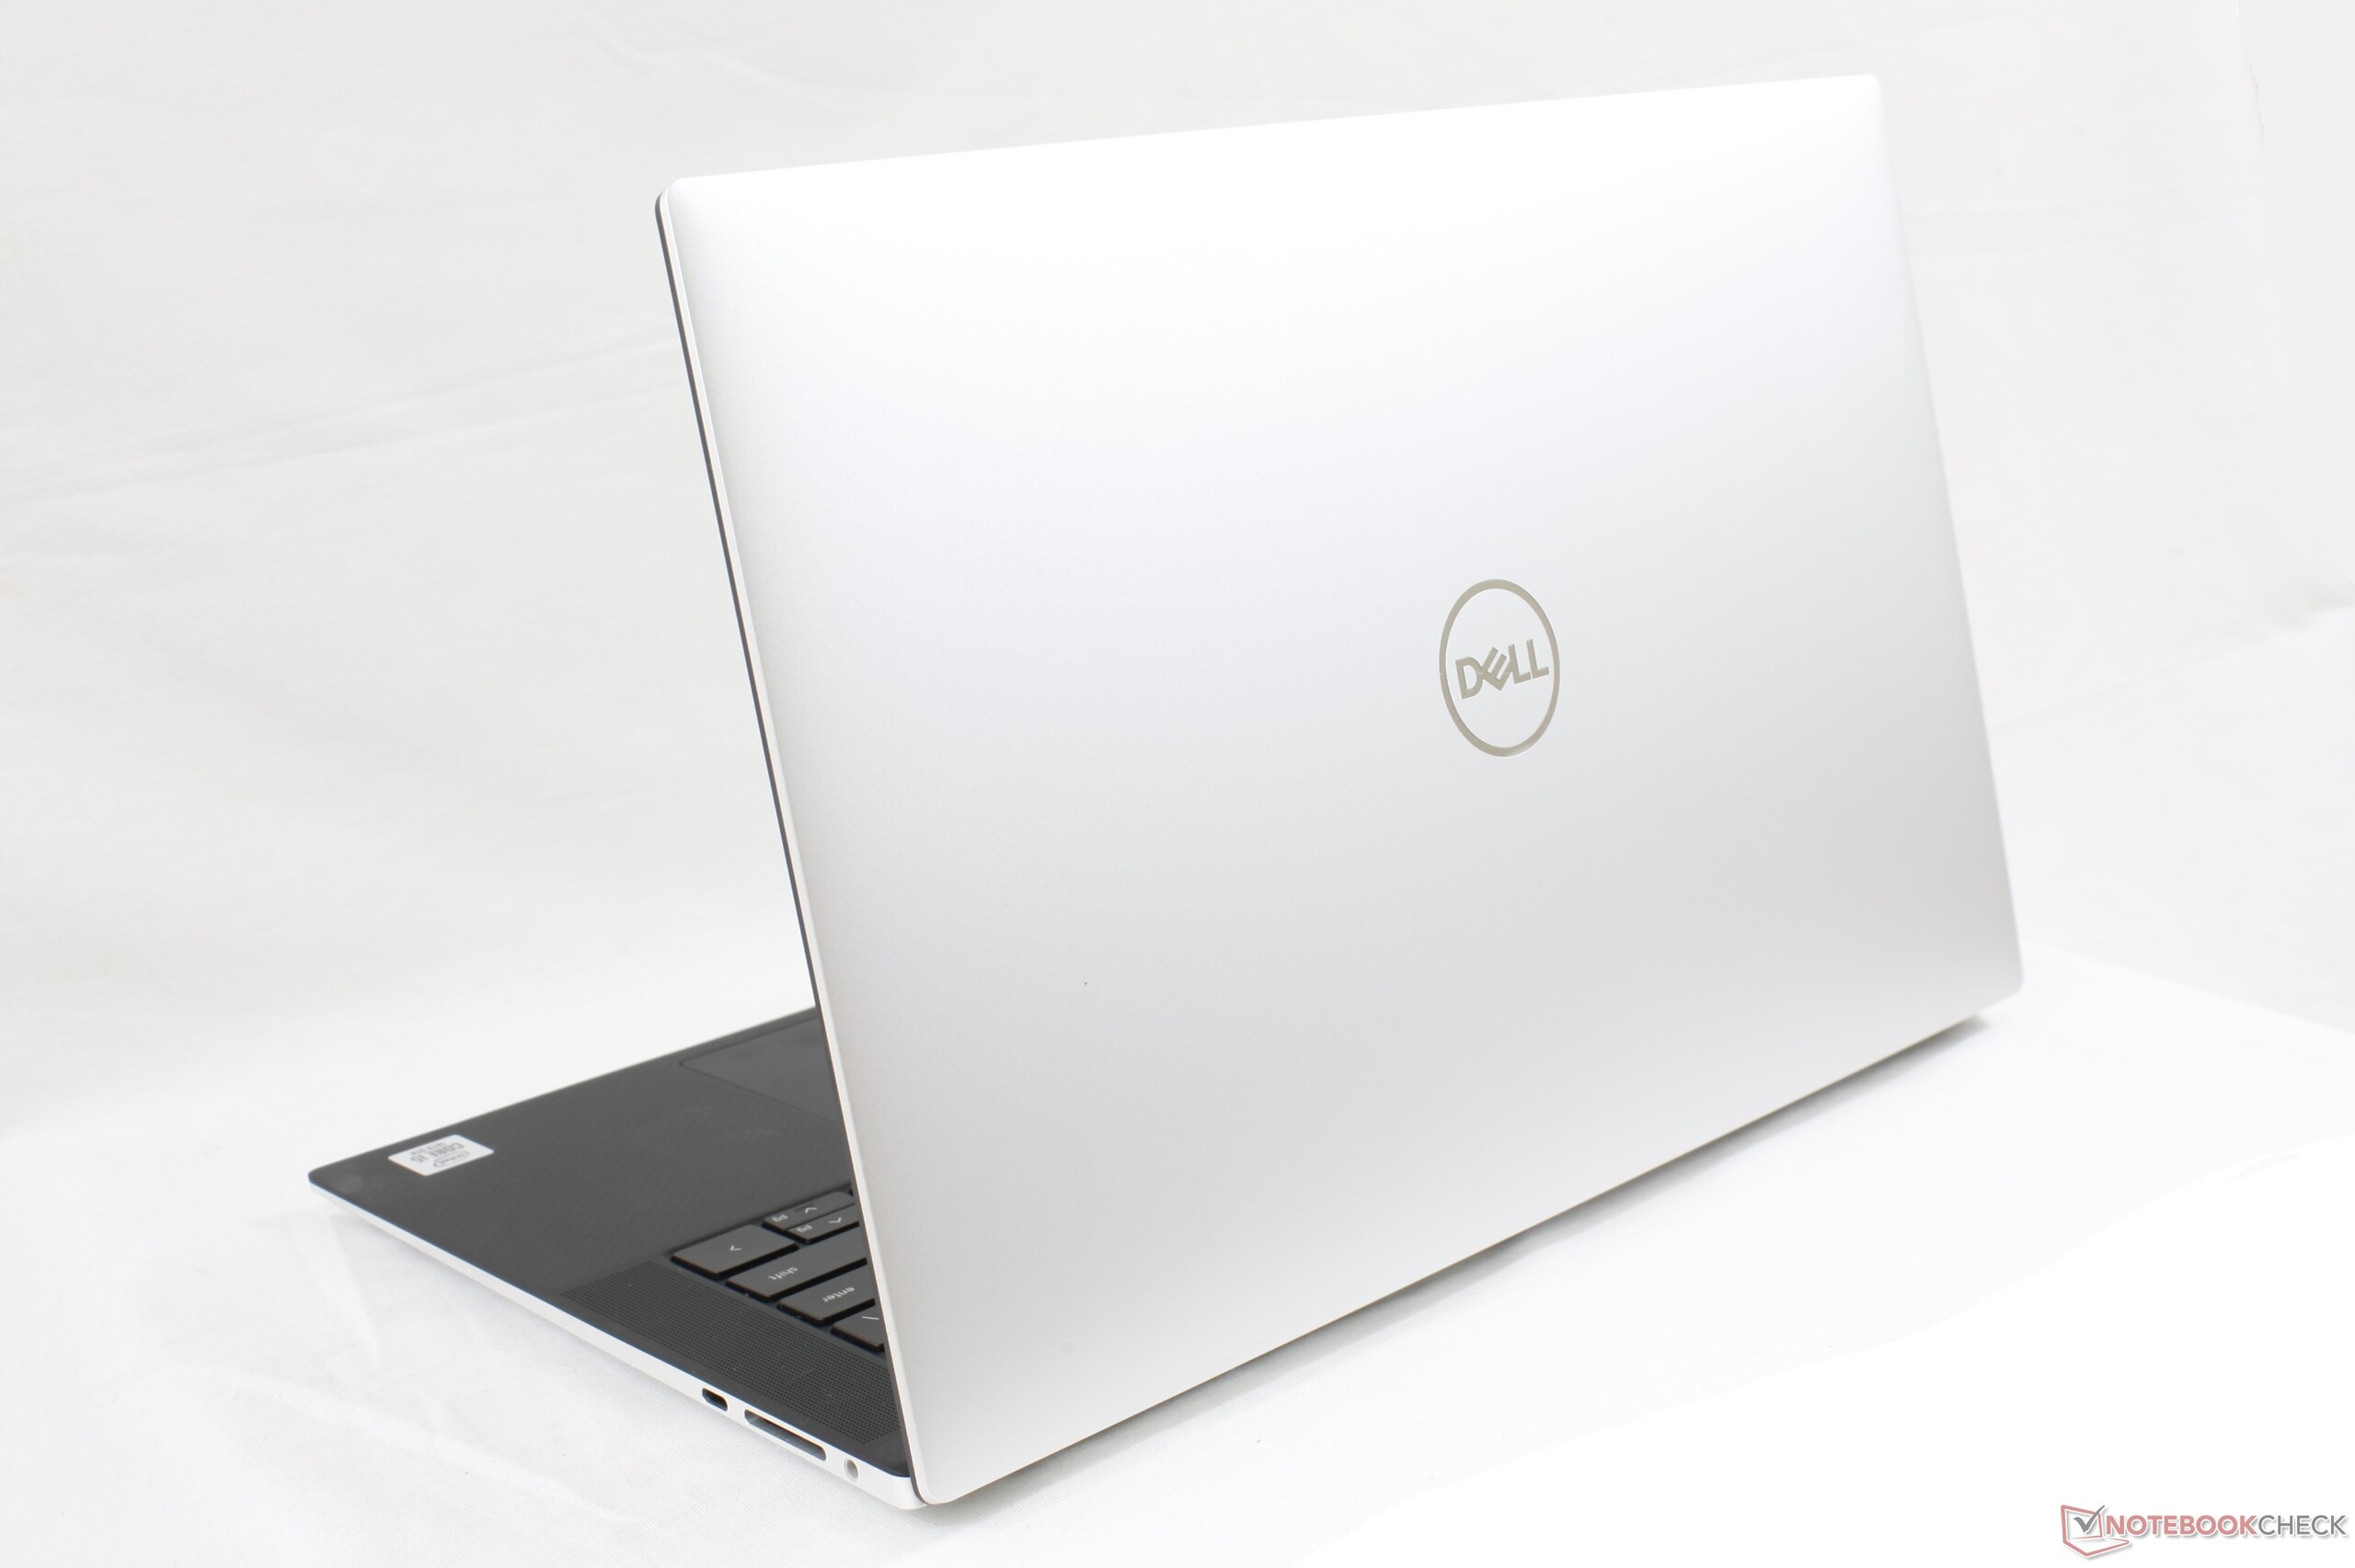
Dell XPS 15 9500 Core i5
- 06/09/2020 v7 (old)
Allen Ngo
Price comparison
