Test: Dell XPS 15 2018 9570 (8300H, GTX 1050, 97Wh) Laptop (Sammanfattning)
| SD Card Reader | |
| average JPG Copy Test (av. of 3 runs) | |
| Dell XPS 13 9370 FHD i5 (Toshiba Exceria Pro M501 64 GB UHS-II) | |
| Genomsnitt av klass Multimedia (23 - 531, n=36, senaste 2 åren) | |
| Dell XPS 15 2018 i5 FHD 97Wh | |
| Gigabyte Aero 14-K8 (Toshiba Exceria Pro SDXC 64 GB UHS-II) | |
| Gigabyte Aero 15 (Toshiba Exceria Pro SDXC 64 GB UHS-II) | |
| Asus Zenbook Pro UX550VE-DB71T (Toshiba Exceria Pro SDXC 64 GB UHS-II) | |
| Dell XPS 15 2017 9560 (7300HQ, Full-HD) (Toshiba Exceria Pro SDXC 64 GB UHS-II) | |
| maximum AS SSD Seq Read Test (1GB) | |
| Dell XPS 13 9370 FHD i5 (Toshiba Exceria Pro M501 64 GB UHS-II) | |
| Dell XPS 15 2017 9560 (7300HQ, Full-HD) (Toshiba Exceria Pro SDXC 64 GB UHS-II) | |
| Dell XPS 15 2018 i5 FHD 97Wh | |
| Genomsnitt av klass Multimedia (37.3 - 1455, n=35, senaste 2 åren) | |
| Asus Zenbook Pro UX550VE-DB71T (Toshiba Exceria Pro SDXC 64 GB UHS-II) | |
| Gigabyte Aero 15 (Toshiba Exceria Pro SDXC 64 GB UHS-II) | |
| Gigabyte Aero 14-K8 (Toshiba Exceria Pro SDXC 64 GB UHS-II) | |
| |||||||||||||||||||||||||
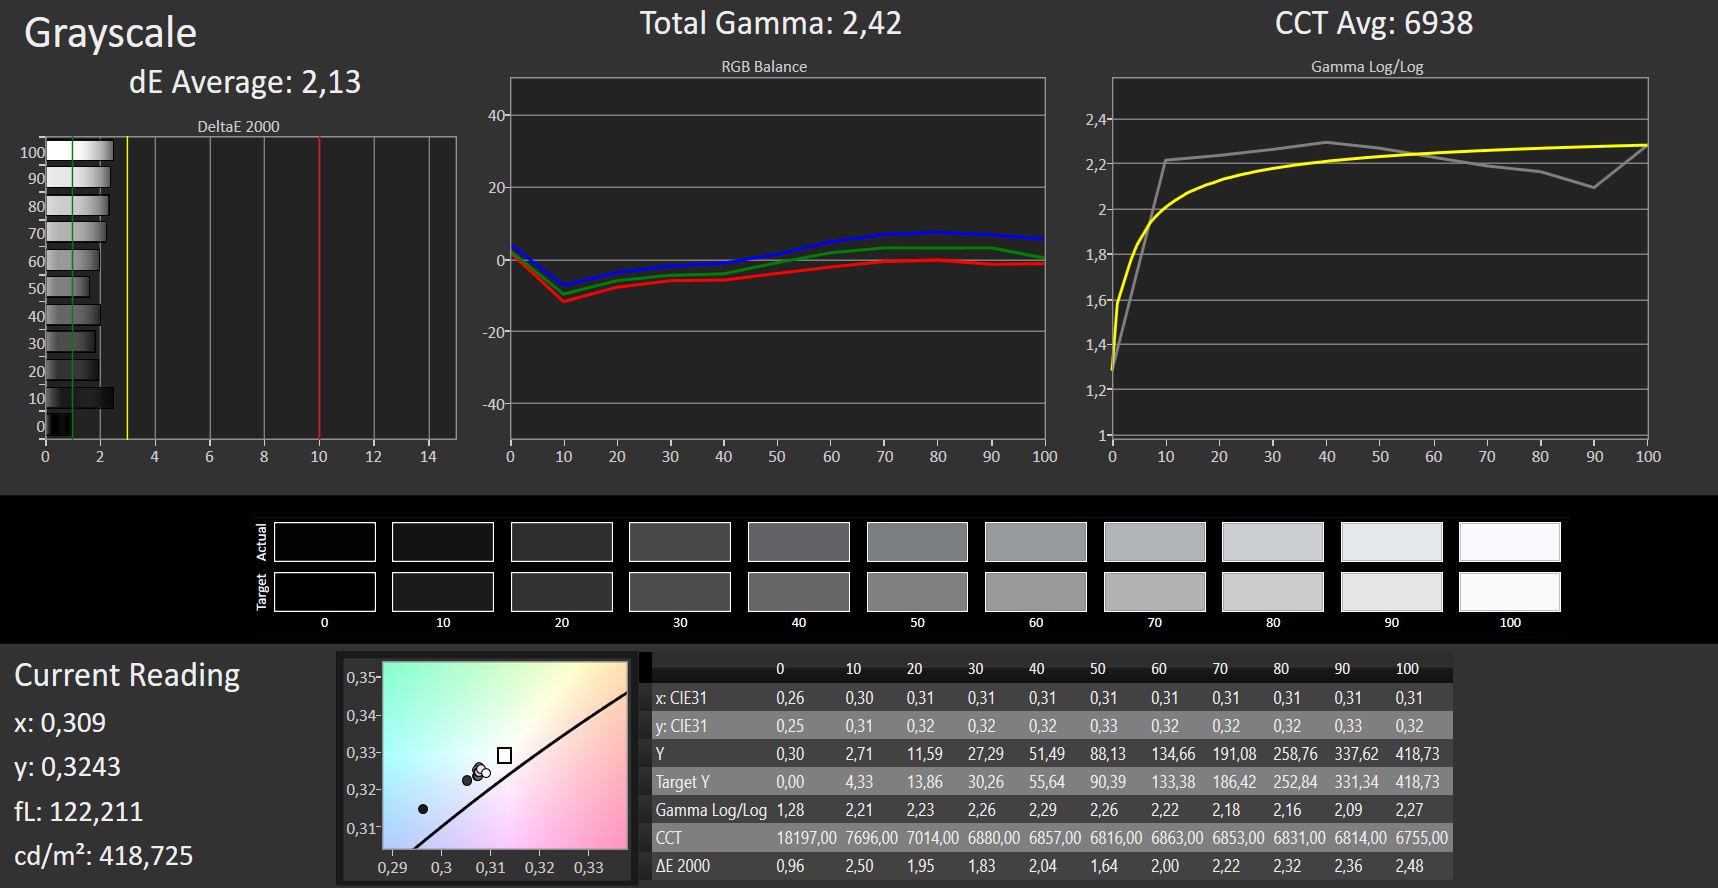
Distribution av ljusstyrkan: 86 %
Mitt på batteriet: 414 cd/m²
Kontrast: 1424:1 (Svärta: 0.29 cd/m²)
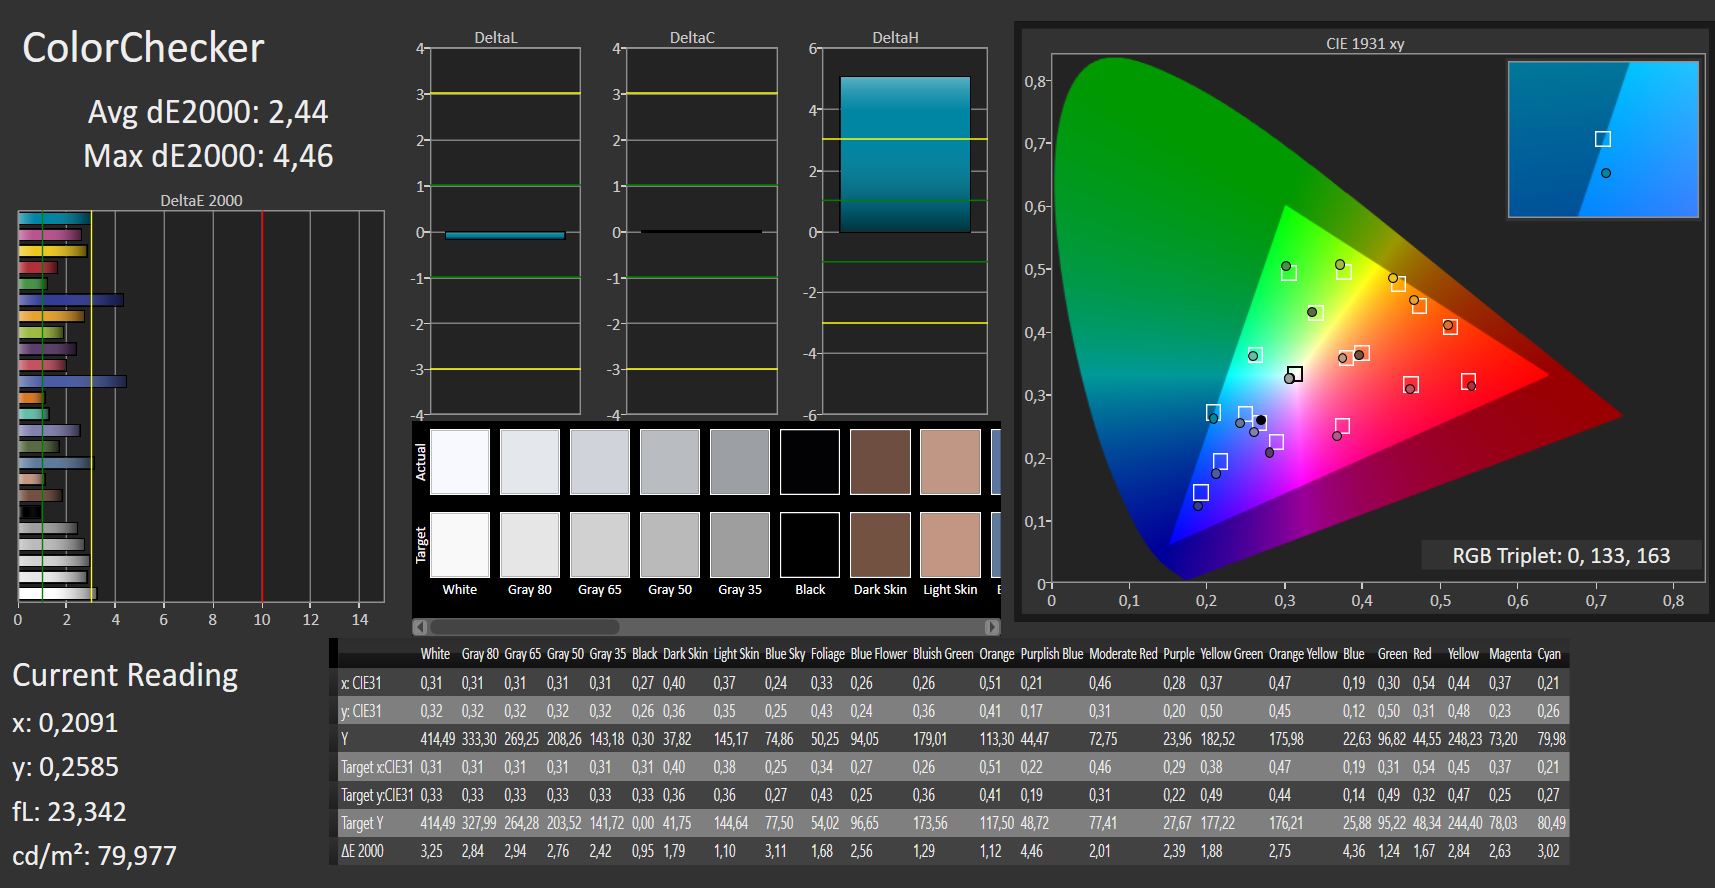
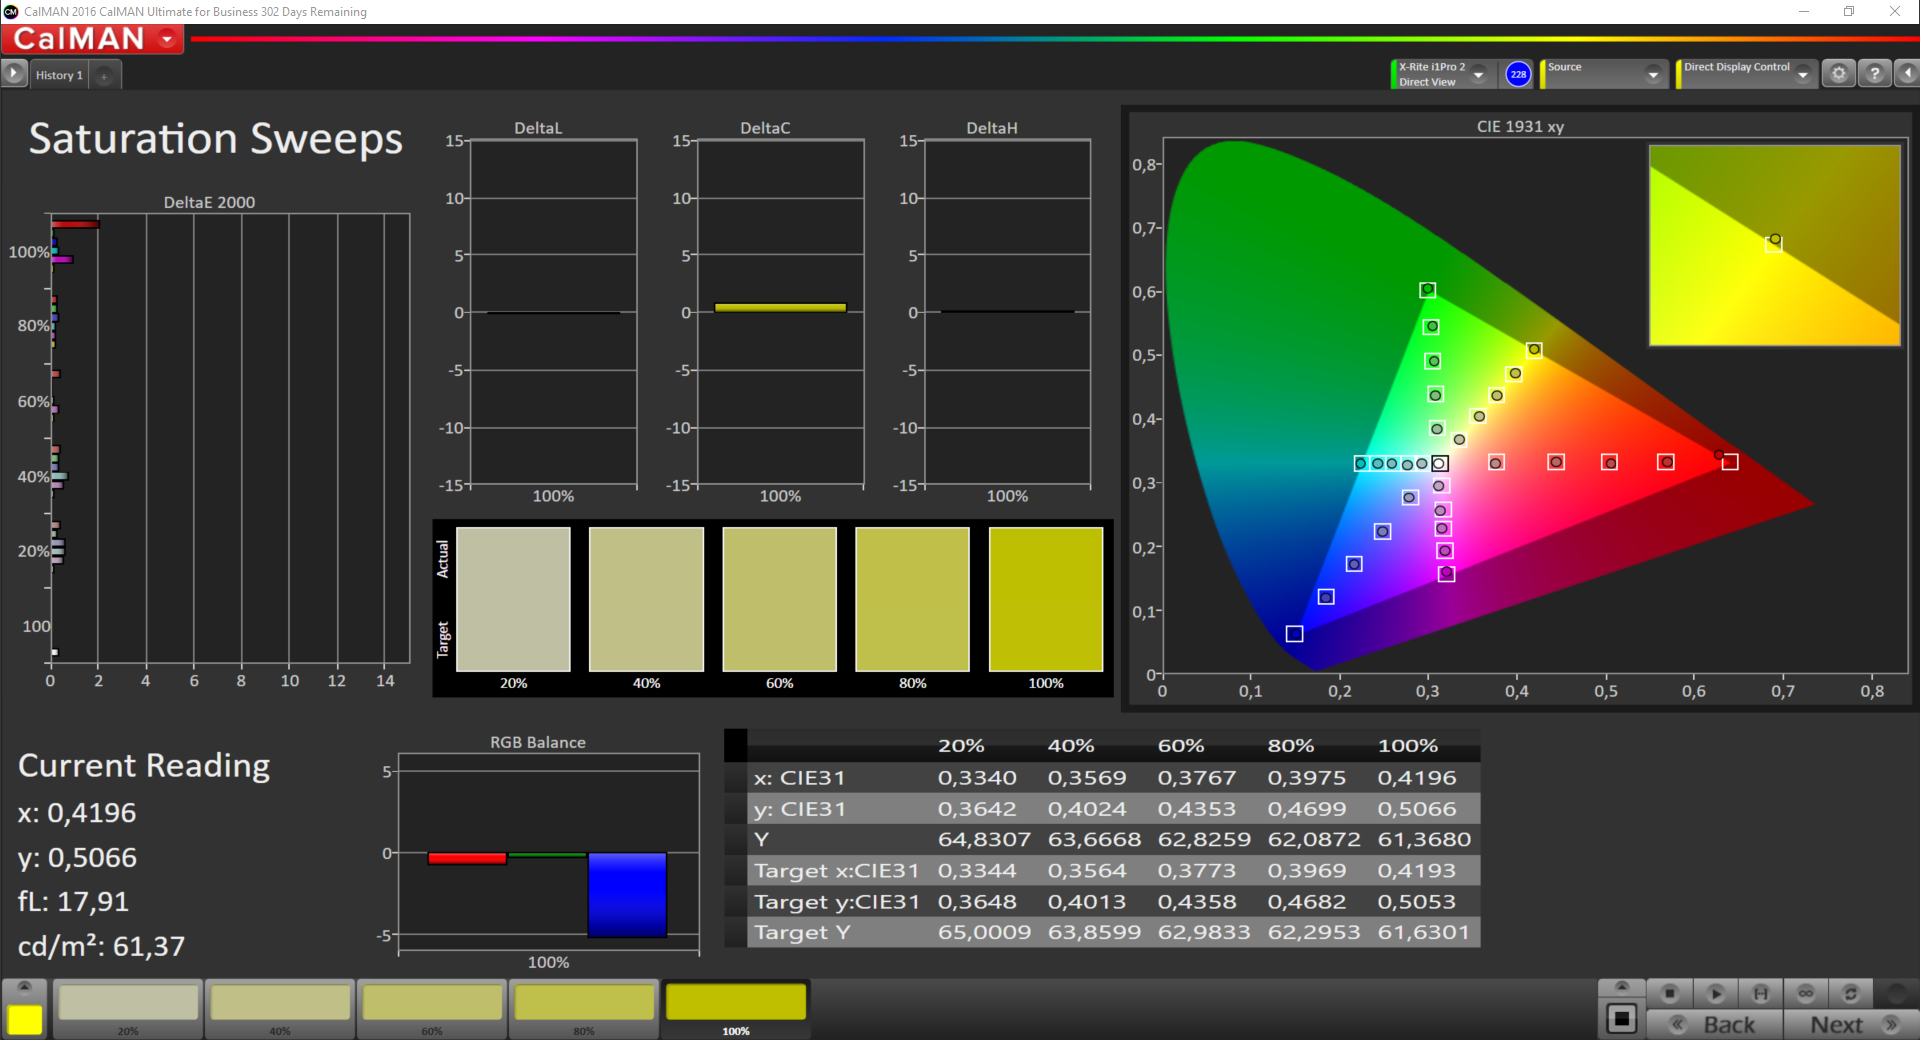
ΔE ColorChecker Calman: 2.44 | ∀{0.5-29.43 Ø4.71}
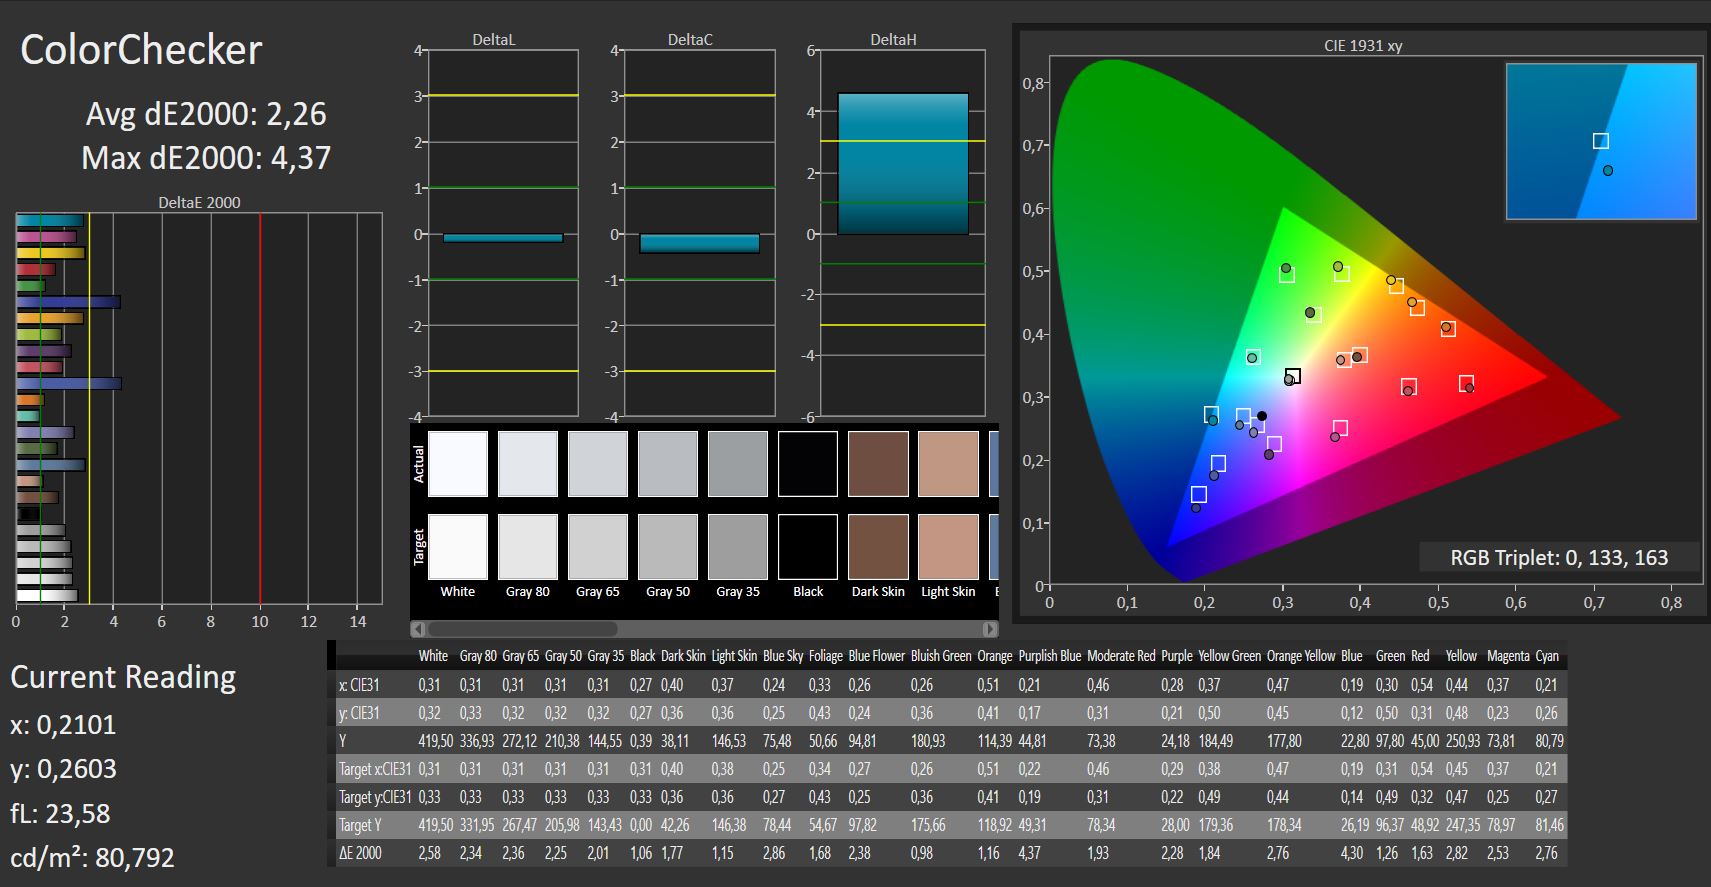
calibrated: 2.48
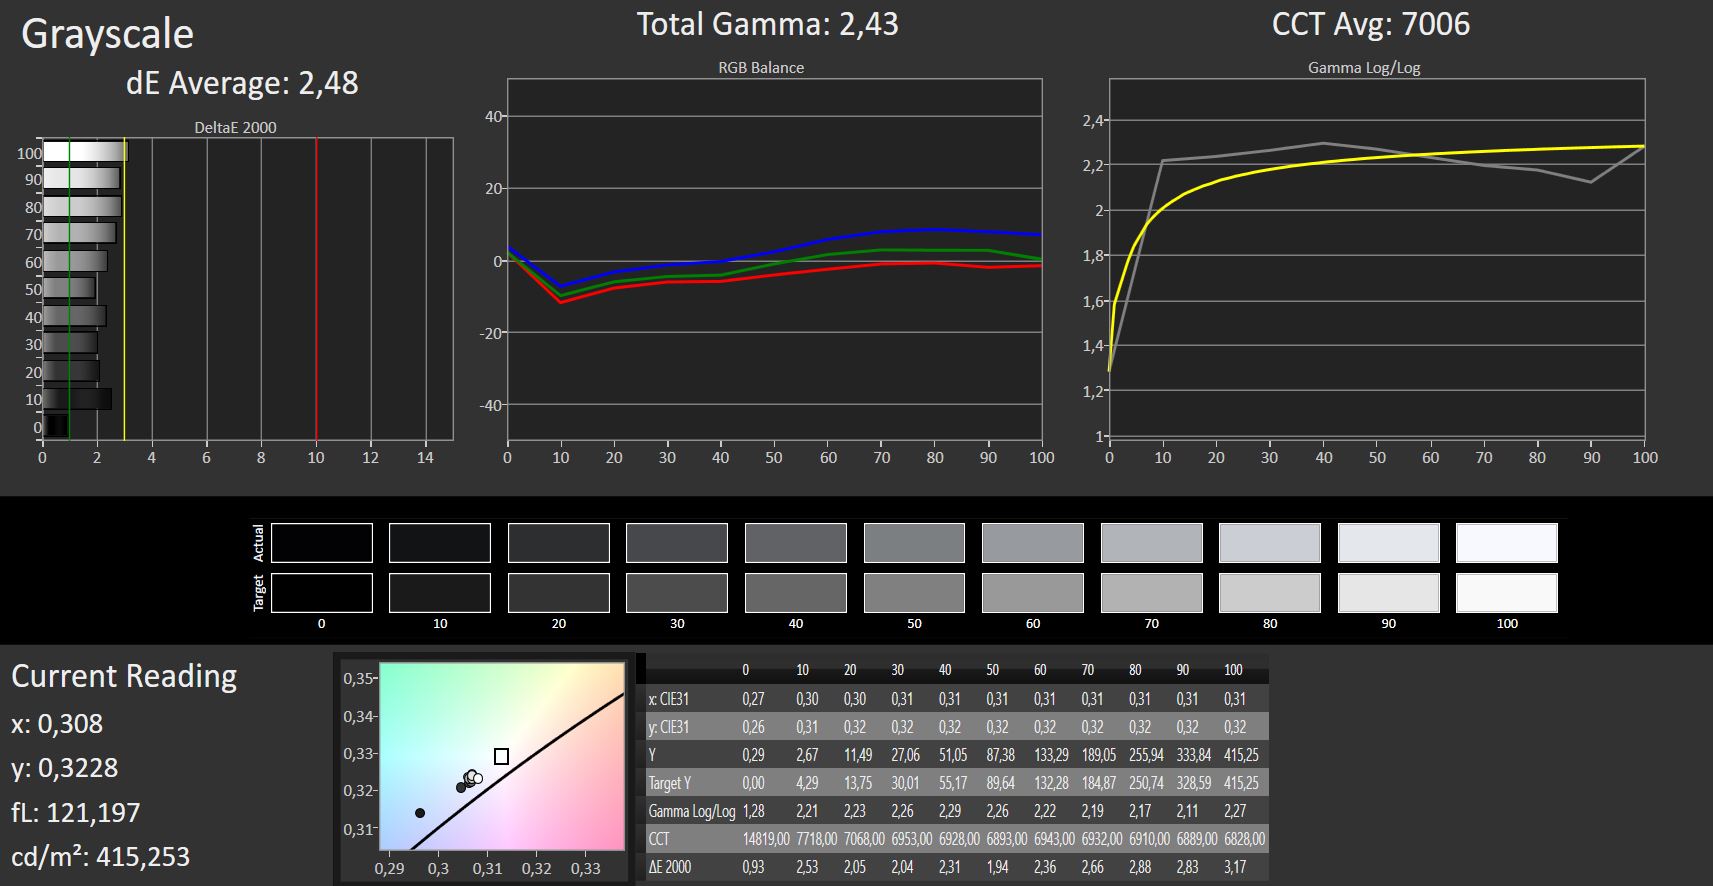
ΔE Greyscale Calman: 2.48 | ∀{0.09-98 Ø4.96}
96% sRGB (Argyll 1.6.3 3D)
62% AdobeRGB 1998 (Argyll 1.6.3 3D)
66.7% AdobeRGB 1998 (Argyll 3D)
96.5% sRGB (Argyll 3D)
66% Display P3 (Argyll 3D)
Gamma: 2.43
CCT: 7006 K
| Dell XPS 15 2018 i5 FHD 97Wh Sharp SHP149A LQ156M1, , 1920x1080, 15.6" | Dell XPS 15 9560 (i7-7700HQ, UHD) 3840x2160, 15.6" | Dell XPS 15 2017 9560 (7300HQ, Full-HD) Sharp SHP1453 LQ156M1, , 1920x1080, 15.6" | Dell XPS 13 9370 FHD i5 SHP1484, , 1920x1080, 13.3" | Apple MacBook Pro 15 2017 (2.8 GHz, 555) APPA031, , 2880x1800, 15.4" | Gigabyte Aero 14-K8 AU Optronics B140QAN01.5 (AUO1536), , 2560x1440, 14" | Gigabyte Aero 15 N156HCA-EA1 (CMN15D7), , 1920x1080, 15.6" | Asus Zenbook Pro UX550VE-DB71T N156HCE-EN1 (CMN15E8), , 1920x1080, 15.6" | |
|---|---|---|---|---|---|---|---|---|
| Display | 30% | 4% | 3% | 27% | 3% | -2% | -4% | |
| Display P3 Coverage (%) | 66 | 89.7 36% | 68.9 4% | 68.9 4% | 97.9 48% | 69.1 5% | 65.2 -1% | 64.3 -3% |
| sRGB Coverage (%) | 96.5 | 100 4% | 98.9 2% | 96.6 0% | 99.9 4% | 96 -1% | 92.5 -4% | 90.4 -6% |
| AdobeRGB 1998 Coverage (%) | 66.7 | 100 50% | 70.9 6% | 69.6 4% | 85.9 29% | 70.3 5% | 66.5 0% | 65.3 -2% |
| Response Times | -24% | -43% | -40% | -6% | -5% | 3% | 2% | |
| Response Time Grey 50% / Grey 80% * (ms) | 49 ? | 57.2 ? -17% | 54 ? -10% | 62.4 ? -27% | 48 ? 2% | 47.2 ? 4% | 42.8 ? 13% | 43.2 ? 12% |
| Response Time Black / White * (ms) | 30 ? | 39.2 ? -31% | 52.4 ? -75% | 45.6 ? -52% | 33.8 ? -13% | 34 ? -13% | 32 ? -7% | 32.8 ? -9% |
| PWM Frequency (Hz) | 961 ? | 962 | 1008 ? | 119000 ? | 26000 ? | 25510 ? | ||
| Screen | -35% | -41% | -16% | 10% | 6% | -45% | -62% | |
| Brightness middle (cd/m²) | 413 | 370.1 -10% | 400 -3% | 428 4% | 545 32% | 256 -38% | 320 -23% | 288.2 -30% |
| Brightness (cd/m²) | 378 | 356 -6% | 392 4% | 405 7% | 523 38% | 250 -34% | 316 -16% | 266 -30% |
| Brightness Distribution (%) | 86 | 87 1% | 89 3% | 87 1% | 86 0% | 90 5% | 90 5% | 75 -13% |
| Black Level * (cd/m²) | 0.29 | 0.37 -28% | 0.26 10% | 0.26 10% | 0.44 -52% | 0.28 3% | 0.36 -24% | 0.3 -3% |
| Contrast (:1) | 1424 | 1000 -30% | 1538 8% | 1646 16% | 1239 -13% | 914 -36% | 889 -38% | 961 -33% |
| Colorchecker dE 2000 * | 2.44 | 5.3 -117% | 4.9 -101% | 3.8 -56% | 1.6 34% | 1.21 50% | 4.62 -89% | 5.5 -125% |
| Colorchecker dE 2000 max. * | 4.46 | 9.9 -122% | 11 -147% | 7.2 -61% | 3.8 15% | 2.11 53% | 9.75 -119% | 11.3 -153% |
| Colorchecker dE 2000 calibrated * | 2.48 | |||||||
| Greyscale dE 2000 * | 2.48 | 4.6 -85% | 7.2 -190% | 4.4 -77% | 1.9 23% | 1.13 54% | 6 -142% | 7.9 -219% |
| Gamma | 2.43 91% | 2.31 95% | 2.11 104% | 2.21 100% | 2.26 97% | 2.42 91% | 2.46 89% | 2.09 105% |
| CCT | 7006 93% | 6284 103% | 6911 94% | 7067 92% | 6834 95% | 6422 101% | 6761 96% | 6559 99% |
| Color Space (Percent of AdobeRGB 1998) (%) | 62 | 88.3 42% | 64.2 4% | 62.8 1% | 62 0% | 60 -3% | 58.5 -6% | |
| Color Space (Percent of sRGB) (%) | 96 | 100 4% | 98.9 3% | 96.4 0% | 96 0% | 92 -4% | 90 -6% | |
| Totalt genomsnitt (program/inställningar) | -10% /
-21% | -27% /
-32% | -18% /
-15% | 10% /
11% | 1% /
4% | -15% /
-30% | -21% /
-42% |
* ... mindre är bättre


Visa svarstider
| ↔ Svarstid svart till vitt | ||
|---|---|---|
| 30 ms ... stiga ↗ och falla ↘ kombinerat | ↗ 16 ms stiga | 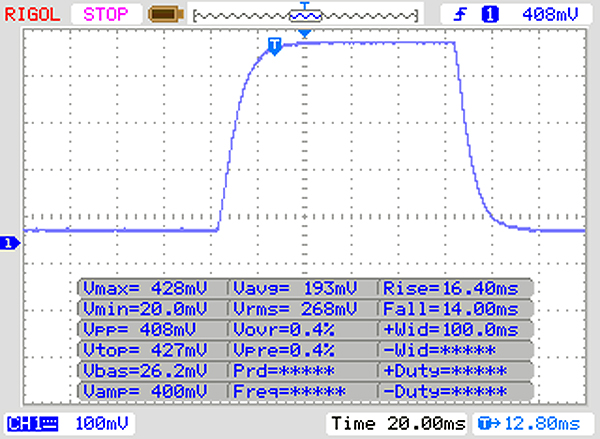 |
| ↘ 14 ms hösten | ||
| Skärmen visar långsamma svarsfrekvenser i våra tester och kommer att vara otillfredsställande för spelare. I jämförelse sträcker sig alla testade enheter från 0.1 (minst) till 240 (maximalt) ms. » 80 % av alla enheter är bättre. Detta innebär att den uppmätta svarstiden är sämre än genomsnittet av alla testade enheter (19.8 ms). | ||
| ↔ Svarstid 50 % grått till 80 % grått | ||
| 49 ms ... stiga ↗ och falla ↘ kombinerat | ↗ 25 ms stiga | 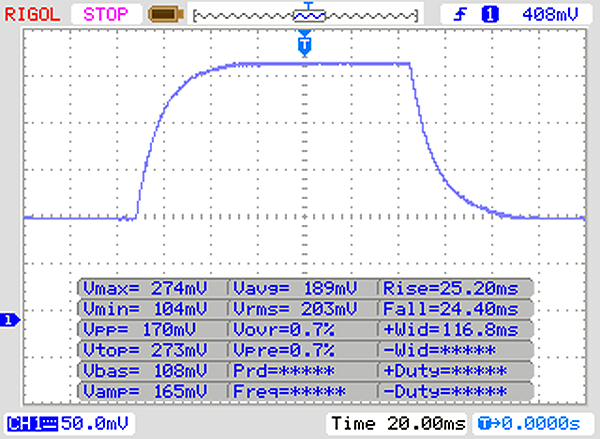 |
| ↘ 40 ms hösten | ||
| Skärmen visar långsamma svarsfrekvenser i våra tester och kommer att vara otillfredsställande för spelare. I jämförelse sträcker sig alla testade enheter från 0.165 (minst) till 636 (maximalt) ms. » 85 % av alla enheter är bättre. Detta innebär att den uppmätta svarstiden är sämre än genomsnittet av alla testade enheter (30.9 ms). | ||
Skärmflimmer / PWM (Puls-Width Modulation)
| Skärmflimmer / PWM upptäckt | 961 Hz | ≤ 10 % ljusstyrka inställning | 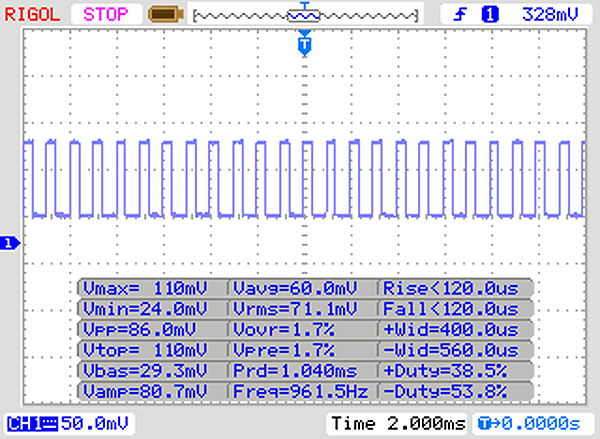 |
Displayens bakgrundsbelysning flimrar vid 961 Hz (i värsta fall, t.ex. med PWM) Flimrande upptäckt vid en ljusstyrkeinställning på 10 % och lägre. Det ska inte finnas något flimmer eller PWM över denna ljusstyrkeinställning. Frekvensen för 961 Hz är ganska hög, så de flesta användare som är känsliga för PWM bör inte märka något flimmer. Som jämförelse: 52 % av alla testade enheter använder inte PWM för att dämpa skärmen. Om PWM upptäcktes mättes ett medelvärde av 7741 (minst: 5 - maximum: 343500) Hz. | |||
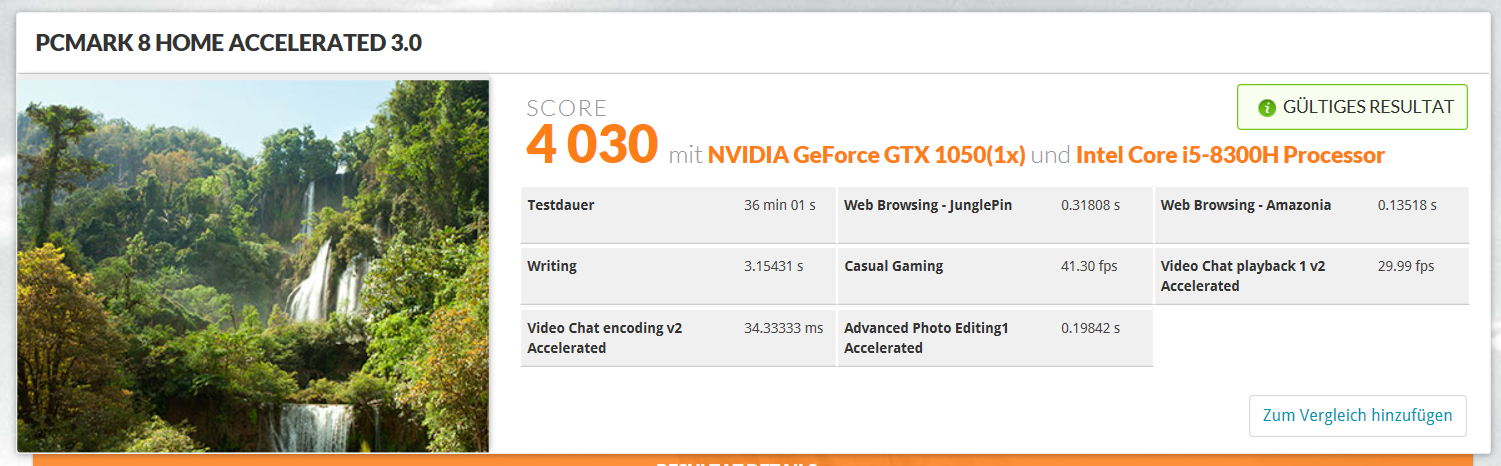
| PCMark 8 Home Score Accelerated v2 | 4030 poäng | |
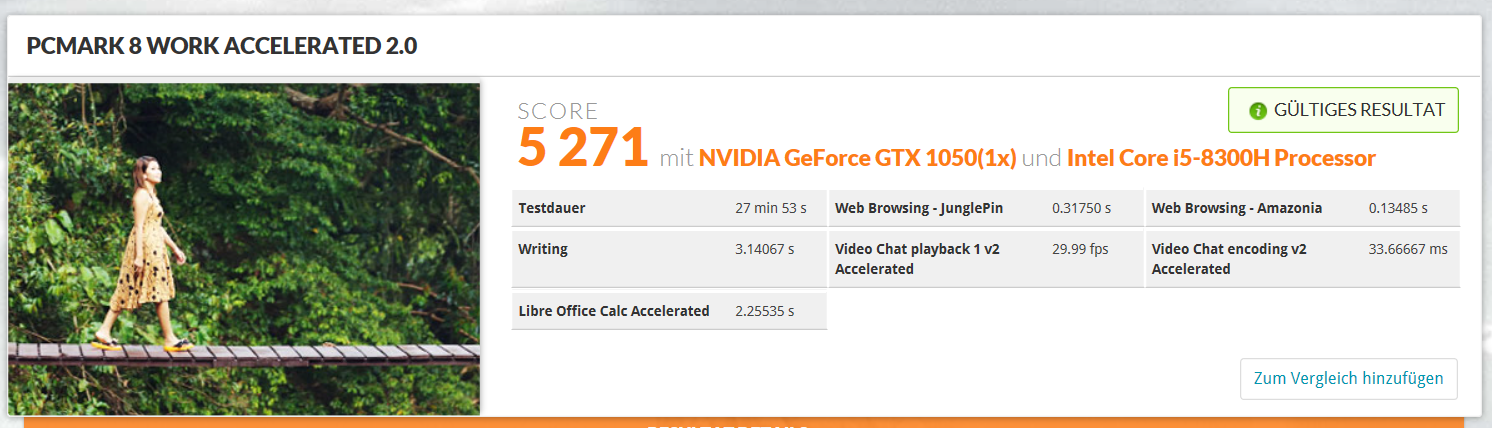
| PCMark 8 Work Score Accelerated v2 | 5271 poäng | |
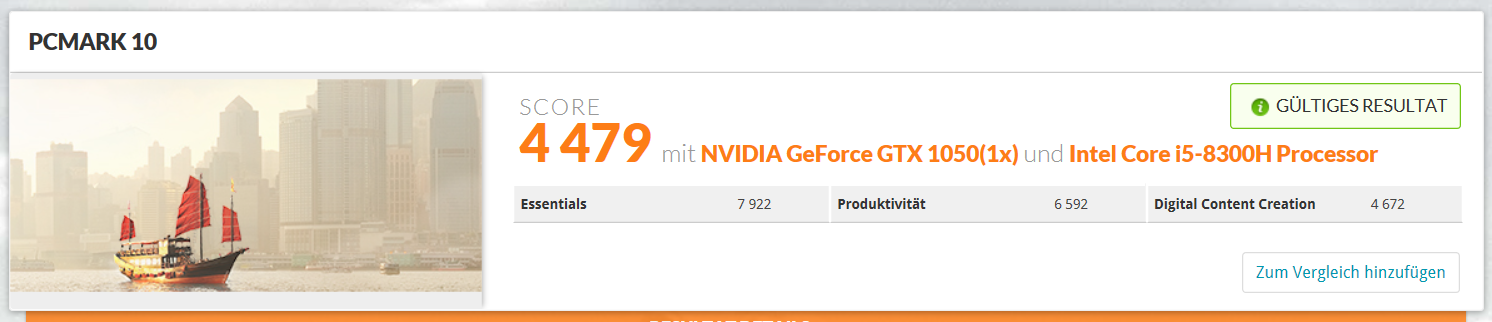
| PCMark 10 Score | 4479 poäng | |
Hjälp | ||
| Dell XPS 15 2018 i5 FHD 97Wh Lite-On CA3-8D256-Q11 | Apple MacBook Pro 15 2017 (2.8 GHz, 555) Apple SSD SM0256L | Gigabyte Aero 15 Lite-On CX2-8B512-Q11 | Dell XPS 13 9370 FHD i5 Toshiba XG5 KXG50ZNV256G | Dell XPS 15 9560 (i7-7700HQ, UHD) Lite-On CX2-8B512-Q11 | Genomsnitt Lite-On CA3-8D256-Q11 | |
|---|---|---|---|---|---|---|
| CrystalDiskMark 3.0 | 44% | 63% | 5% | 54% | 0% | |
| Read Seq (MB/s) | 1706 | 1557 -9% | 1769 4% | 1875 10% | 1684 -1% | 1706 ? 0% |
| Write Seq (MB/s) | 613 | 1505 146% | 1133 85% | 352.7 -42% | 1106 80% | 613 ? 0% |
| Read 512 (MB/s) | 1171 | 968 -17% | 891 -24% | 840 -28% | 977 -17% | 1171 ? 0% |
| Write 512 (MB/s) | 483.4 | 1124 133% | 1069 121% | 353.9 -27% | 1119 131% | 483 ? 0% |
| Read 4k (MB/s) | 40.64 | 10.76 -74% | 44.7 10% | 34.18 -16% | 45.14 11% | 40.6 ? 0% |
| Write 4k (MB/s) | 89.4 | 12.87 -86% | 123.3 38% | 127.5 43% | 134.1 50% | 89.4 ? 0% |
| Read 4k QD32 (MB/s) | 233.8 | 631 170% | 645 176% | 381.8 63% | 509 118% | 234 ? 0% |
| Write 4k QD32 (MB/s) | 249.1 | 468.4 88% | 490.5 97% | 339.9 36% | 398.1 60% | 249 ? 0% |

| 3DMark 11 Performance | 7974 poäng | |
| 3DMark Cloud Gate Standard Score | 21868 poäng | |
| 3DMark Fire Strike Score | 5687 poäng | |
Hjälp | ||
| Rise of the Tomb Raider - 1920x1080 Very High Preset AA:FX AF:16x | |
| Asus GL503VD-DB74 | |
| Asus Zenbook Pro UX550VE-DB71T | |
| Asus ROG Strix GL703VD-DB74 | |
| MSI GL62M 7RD-077 | |
| Dell XPS 15 2018 i5 FHD 97Wh | |
| Dell Inspiron 15 7000 7577 | |
| Dell XPS 15 9560 (i7-7700HQ, UHD) | |
| HP Pavilion 15 Power 1GK62AV | |
| Genomsnitt NVIDIA GeForce GTX 1050 Mobile (27 - 39, n=30) | |
| Asus FX504GD | |
| Asus Strix GL753VD-GC045T | |
| Acer Nitro 5 Spin NP515-51-86CX | |
| BioShock Infinite - 1920x1080 Ultra Preset, DX11 (DDOF) | |
| Acer Nitro 5 AN515-51-788E | |
| Dell XPS 15 2018 i5 FHD 97Wh | |
| MSI GL62M 7RD-077 | |
| Dell XPS 15 9560 (i7-7700HQ, UHD) | |
| Asus GL503VD-DB74 | |
| Asus ROG Strix GL703VD-DB74 | |
| Dell Inspiron 15 7000 7577 | |
| HP Pavilion 15 Power 1GK62AV | |
| Asus FX504GD | |
| Genomsnitt NVIDIA GeForce GTX 1050 Mobile (48.6 - 67.5, n=35) | |
| MSI GV72 7RD-1048XPL | |
| Apple MacBook Pro 15 2017 (2.8 GHz, 555) | |
| Dell XPS 13 9370 FHD i5 | |
| Final Fantasy XV Benchmark - 1280x720 Lite Quality | |
| Genomsnitt av klass Multimedia (21.4 - 232, n=56, senaste 2 åren) | |
| Dell XPS 15 2018 i5 FHD 97Wh | |
| MSI GL62M 7RD-077 | |
| Genomsnitt NVIDIA GeForce GTX 1050 Mobile (41 - 63.8, n=6) | |
| Asus GL753VD | |
| Acer Nitro 5 Spin NP515-51-86CX | |
| Apple MacBook Pro 15 2017 (2.8 GHz, 555) | |
| Dirt 4 - 1920x1080 High Preset AA:2xMS AF:8x | |
| MSI GL62M 7RD-077 | |
| Dell XPS 15 2018 i5 FHD 97Wh | |
| Acer Nitro 5 AN515-51-788E | |
| Genomsnitt NVIDIA GeForce GTX 1050 Mobile (46.2 - 63.7, n=4) | |
| Apple MacBook Pro 15 2017 (2.8 GHz, 555) | |
| Fallout 4 - 1920x1080 Ultra Preset AA:T AF:16x | |
| Asus GL503VD-DB74 | |
| Dell XPS 15 2018 i5 FHD 97Wh | |
| Dell XPS 15 9560 (i7-7700HQ, UHD) | |
| Genomsnitt NVIDIA GeForce GTX 1050 Mobile (31 - 37, n=10) | |
| Asus Strix GL753VD-GC045T | |
| HP Pavilion 15 Power 1GK62AV | |
| The Witcher 3 - 1920x1080 High Graphics & Postprocessing (Nvidia HairWorks Off) | |
| MSI GT75 8RG-090 Titan | |
| Genomsnitt av klass Multimedia (22 - 157, n=5, senaste 2 åren) | |
| Gigabyte Aero 15 | |
| Acer Nitro 5 AN515-51-788E | |
| Gigabyte Aero 14-K8 | |
| Asus ROG Strix GL703VD-DB74 | |
| Dell Inspiron 15 7000 7577 | |
| Asus FX504GD | |
| HP Pavilion 15 Power 1GK62AV | |
| Dell XPS 15 2018 i5 FHD 97Wh | |
| Dell XPS 15 9560 (i7-7700HQ, UHD) | |
| Genomsnitt NVIDIA GeForce GTX 1050 Mobile (29.1 - 43, n=29) | |
| Dell XPS 15 2017 9560 (7300HQ, Full-HD) | |
| MSI GV72 7RD-1048XPL | |
| Asus Strix GL753VD-GC045T | |
| Apple MacBook Pro 15 2017 (2.8 GHz, 555) | |
| låg | med. | hög | ultra | |
|---|---|---|---|---|
| BioShock Infinite (2013) | 67.5 | |||
| The Witcher 3 (2015) | 46.7 | 39 | 22.7 | |
| Fallout 4 (2015) | 45.4 | 36.7 | ||
| Rise of the Tomb Raider (2016) | 73.2 | 40.6 | 33.2 | |
| Dirt 4 (2017) | 61.9 | 32.6 | ||
| F1 2017 (2017) | 57 | 36 | ||
| Final Fantasy XV Benchmark (2018) | 63.6 | 32.5 | 22.7 |
Ljudnivå
| Låg belastning |
| 30.3 / 30.3 / 30.3 dB(A) |
| Hög belastning |
| 37.1 / 43 dB(A) |
 | ||
30 dB tyst 40 dB(A) hörbar 50 dB(A) högt ljud |
||
min: | ||
| Dell XPS 15 2018 i5 FHD 97Wh GeForce GTX 1050 Mobile, i5-8300H, Lite-On CA3-8D256-Q11 | Dell XPS 13 9370 FHD i5 UHD Graphics 620, i5-8250U, Toshiba XG5 KXG50ZNV256G | Apple MacBook Pro 15 2017 (2.8 GHz, 555) Radeon Pro 555, i7-7700HQ, Apple SSD SM0256L | Dell XPS 15 2017 9560 (7300HQ, Full-HD) GeForce GTX 1050 Mobile, i5-7300HQ, WDC WD10SPCX-75KHST0 + SanDisk Z400s M.2 2242 32 GB Cache | Gigabyte Aero 15 GeForce GTX 1060 Mobile, i7-7700HQ, Lite-On CX2-8B512-Q11 | Asus Zenbook Pro UX550VE-DB71T GeForce GTX 1050 Ti Mobile, i7-7700HQ, Samsung PM961 NVMe MZVLW512HMJP | |
|---|---|---|---|---|---|---|
| Noise | 7% | -2% | -10% | -7% | -4% | |
| av / miljö * (dB) | 30.3 | 29.1 4% | 30.9 -2% | 30.3 -0% | 31 -2% | 28.3 7% |
| Idle Minimum * (dB) | 30.3 | 29.1 4% | 31.3 -3% | 31.6 -4% | 32 -6% | 30.4 -0% |
| Idle Average * (dB) | 30.3 | 29.1 4% | 31.3 -3% | 31.6 -4% | 33 -9% | 31 -2% |
| Idle Maximum * (dB) | 30.3 | 29.1 4% | 31.7 -5% | 33.4 -10% | 34 -12% | 31.2 -3% |
| Load Average * (dB) | 37.1 | 32.2 13% | 39.7 -7% | 47.8 -29% | 39 -5% | 43.3 -17% |
| Witcher 3 ultra * (dB) | 43.3 | 35.5 18% | 43 1% | 46.2 -7% | ||
| Load Maximum * (dB) | 43 | 37.3 13% | 48.6 -13% | 47.8 -11% | 50 -16% | 46.2 -7% |
* ... mindre är bättre
(-) Den maximala temperaturen på ovansidan är 55 °C / 131 F, jämfört med genomsnittet av 36.8 °C / 98 F , allt från 21 till 71 °C för klassen Multimedia.
(-) Botten värms upp till maximalt 49.1 °C / 120 F, jämfört med genomsnittet av 39.1 °C / 102 F
(+) Vid tomgångsbruk är medeltemperaturen för ovansidan 28.7 °C / 84 F, jämfört med enhetsgenomsnittet på 31.3 °C / ### class_avg_f### F.
(-) När du spelar The Witcher 3 är medeltemperaturen för ovansidan 40.5 °C / 105 F, jämfört med enhetsgenomsnittet på 31.3 °C / ## #class_avg_f### F.
(±) Handledsstöden och pekplattan kan bli väldigt varma vid beröring med maximalt 37.1 °C / 98.8 F.
(-) Medeltemperaturen för handledsstödsområdet på liknande enheter var 28.7 °C / 83.7 F (-8.4 °C / -15.1 F).
Dell XPS 15 2018 i5 FHD 97Wh ljudanalys
(±) | högtalarljudstyrkan är genomsnittlig men bra (73 dB)
Bas 100 - 315 Hz
(±) | reducerad bas - i genomsnitt 10.9% lägre än medianen
(+) | basen är linjär (4.9% delta till föregående frekvens)
Mellan 400 - 2000 Hz
(±) | högre mellan - i genomsnitt 6.8% högre än median
(+) | mids är linjära (6.8% delta till föregående frekvens)
Högsta 2 - 16 kHz
(+) | balanserade toppar - endast 3.7% från medianen
(+) | toppar är linjära (6.9% delta till föregående frekvens)
Totalt 100 - 16 000 Hz
(±) | linjäriteten för det totala ljudet är genomsnittlig (16.6% skillnad mot median)
Jämfört med samma klass
» 44% av alla testade enheter i den här klassen var bättre, 7% liknande, 50% sämre
» Den bästa hade ett delta på 5%, genomsnittet var 17%, sämst var 45%
Jämfört med alla testade enheter
» 29% av alla testade enheter var bättre, 6% liknande, 65% sämre
» Den bästa hade ett delta på 4%, genomsnittet var 23%, sämst var 134%
Apple MacBook Pro 15 2017 (2.8 GHz, 555) ljudanalys
(+) | högtalare kan spela relativt högt (87 dB)
Bas 100 - 315 Hz
(±) | reducerad bas - i genomsnitt 8.7% lägre än medianen
(±) | linjäriteten för basen är genomsnittlig (11.1% delta till föregående frekvens)
Mellan 400 - 2000 Hz
(+) | balanserad mellan - endast 2.5% från medianen
(±) | linjäriteten för mids är genomsnittlig (7.5% delta till föregående frekvens)
Högsta 2 - 16 kHz
(+) | balanserade toppar - endast 1.7% från medianen
(+) | toppar är linjära (5% delta till föregående frekvens)
Totalt 100 - 16 000 Hz
(+) | det totala ljudet är linjärt (7.9% skillnad mot median)
Jämfört med samma klass
» 7% av alla testade enheter i den här klassen var bättre, 2% liknande, 91% sämre
» Den bästa hade ett delta på 5%, genomsnittet var 17%, sämst var 45%
Jämfört med alla testade enheter
» 2% av alla testade enheter var bättre, 1% liknande, 98% sämre
» Den bästa hade ett delta på 4%, genomsnittet var 23%, sämst var 134%
Dell XPS 15 2017 9560 (7300HQ, Full-HD) ljudanalys
(+) | högtalare kan spela relativt högt (87 dB)
Bas 100 - 315 Hz
(-) | nästan ingen bas - i genomsnitt 15.8% lägre än medianen
(±) | linjäriteten för basen är genomsnittlig (13.9% delta till föregående frekvens)
Mellan 400 - 2000 Hz
(+) | balanserad mellan - endast 4.3% från medianen
(±) | linjäriteten för mids är genomsnittlig (7.1% delta till föregående frekvens)
Högsta 2 - 16 kHz
(+) | balanserade toppar - endast 3.1% från medianen
(±) | linjäriteten för toppar är genomsnittlig (7.9% delta till föregående frekvens)
Totalt 100 - 16 000 Hz
(+) | det totala ljudet är linjärt (13.5% skillnad mot median)
Jämfört med samma klass
» 29% av alla testade enheter i den här klassen var bättre, 4% liknande, 67% sämre
» Den bästa hade ett delta på 5%, genomsnittet var 17%, sämst var 45%
Jämfört med alla testade enheter
» 14% av alla testade enheter var bättre, 4% liknande, 82% sämre
» Den bästa hade ett delta på 4%, genomsnittet var 23%, sämst var 134%
| Av/Standby | |
| Låg belastning | |
| Hög belastning |
|
Förklaring:
min: | |
| Dell XPS 15 2018 i5 FHD 97Wh i5-8300H, GeForce GTX 1050 Mobile, Lite-On CA3-8D256-Q11, LED IGZO IPS InfinityEdge, 1920x1080, 15.6" | Apple MacBook Pro 15 2017 (2.8 GHz, 555) i7-7700HQ, Radeon Pro 555, Apple SSD SM0256L, IPS, 2880x1800, 15.4" | Gigabyte Aero 14-K8 i7-8750H, GeForce GTX 1050 Ti Mobile, Crucial MX300 CT525MX300SSD1, IPS, 2560x1440, 14" | Gigabyte Aero 15 i7-7700HQ, GeForce GTX 1060 Mobile, Lite-On CX2-8B512-Q11, IPS, 1920x1080, 15.6" | Asus Zenbook Pro UX550VE-DB71T i7-7700HQ, GeForce GTX 1050 Ti Mobile, Samsung PM961 NVMe MZVLW512HMJP, IPS, 1920x1080, 15.6" | Dell XPS 13 9370 FHD i5 i5-8250U, UHD Graphics 620, Toshiba XG5 KXG50ZNV256G, IPS, 1920x1080, 13.3" | MSI GT75 8RG-090 Titan i9-8950HK, GeForce GTX 1080 Mobile, 2x Samsung PM961 MZVLW256HEHP (RAID 0), TN, 1920x1080, 17.3" | Dell XPS 15 9560 (i7-7700HQ, UHD) i7-7700HQ, GeForce GTX 1050 Mobile, Lite-On CX2-8B512-Q11, IGZO IPS, 3840x2160, 15.6" | Dell XPS 15 2017 9560 (7300HQ, Full-HD) i5-7300HQ, GeForce GTX 1050 Mobile, WDC WD10SPCX-75KHST0 + SanDisk Z400s M.2 2242 32 GB Cache, LED IGZO IPS InfinityEdge, 1920x1080, 15.6" | Genomsnitt NVIDIA GeForce GTX 1050 Mobile | Genomsnitt av klass Multimedia | |
|---|---|---|---|---|---|---|---|---|---|---|---|
| Power Consumption | -39% | -55% | -121% | -30% | 25% | -418% | -116% | -49% | -62% | -45% | |
| Idle Minimum * (Watt) | 2.9 | 3.4 -17% | 7 -141% | 12 -314% | 6.3 -117% | 3.14 -8% | 31 -969% | 11.9 -310% | 6.6 -128% | 6.99 ? -141% | 5.62 ? -94% |
| Idle Average * (Watt) | 5.8 | 13.9 -140% | 10 -72% | 15 -159% | 7.9 -36% | 5.22 10% | 35 -503% | 17.1 -195% | 9 -55% | 10.7 ? -84% | 10.2 ? -76% |
| Idle Maximum * (Watt) | 7.5 | 17.6 -135% | 13 -73% | 20 -167% | 8.1 -8% | 6 20% | 45 -500% | 17.3 -131% | 10.7 -43% | 12.7 ? -69% | 12.5 ? -67% |
| Load Average * (Watt) | 77.5 | 71.1 8% | 73 6% | 82 -6% | 84.9 -10% | 38.5 50% | 130 -68% | 94.7 -22% | 77.5 -0% | 82.9 ? -7% | 65 ? 16% |
| Witcher 3 ultra * (Watt) | 84 | 57.9 31% | 96 -14% | 111 -32% | 96.3 -15% | 268 -219% | 104.8 -25% | ||||
| Load Maximum * (Watt) | 107 | 88.5 17% | 143 -34% | 161 -50% | 102.4 4% | 50.4 53% | 374 -250% | 122 -14% | 130 -21% | 115.3 ? -8% | 111.9 ? -5% |
* ... mindre är bättre
| Dell XPS 15 2018 i5 FHD 97Wh i5-8300H, GeForce GTX 1050 Mobile, 97 Wh | Dell XPS 15 2017 9560 (7300HQ, Full-HD) i5-7300HQ, GeForce GTX 1050 Mobile, 56 Wh | Dell XPS 15 9560 (i7-7700HQ, UHD) i7-7700HQ, GeForce GTX 1050 Mobile, 97 Wh | Dell XPS 13 9370 FHD i5 i5-8250U, UHD Graphics 620, 52 Wh | Apple MacBook Pro 15 2017 (2.8 GHz, 555) i7-7700HQ, Radeon Pro 555, 76 Wh | Asus Zenbook Pro UX550VE-DB71T i7-7700HQ, GeForce GTX 1050 Ti Mobile, 73 Wh | Gigabyte Aero 14-K8 i7-8750H, GeForce GTX 1050 Ti Mobile, 94.24 Wh | Gigabyte Aero 15 i7-7700HQ, GeForce GTX 1060 Mobile, 94.24 Wh | Genomsnitt av klass Multimedia | |
|---|---|---|---|---|---|---|---|---|---|
| Batteridrifttid | -45% | -33% | -14% | -10% | -40% | 19% | -28% | -18% | |
| WiFi v1.3 (h) | 15.7 | 5.6 -64% | 7.2 -54% | 10.7 -32% | 10.7 -32% | 8.9 -43% | 11 -30% | 7 -55% | 12.3 ? -22% |
| Witcher 3 ultra (h) | 1 | 1.5 50% | |||||||
| Load (h) | 1.9 | 1.4 -26% | 1.7 -11% | 2 5% | 1 -47% | 1.2 -37% | 3.2 68% | 1.9 0% | 1.645 ? -13% |
| Reader / Idle (h) | 9.4 | 13.9 | 23.6 | 17.1 | 17.6 | 10.6 | 24.9 ? | ||
| H.264 (h) | 13.9 | 8.5 | 7.7 | 16.8 ? |
För
Emot
Läs den fullständiga versionen av den här recensionen på engelska här.
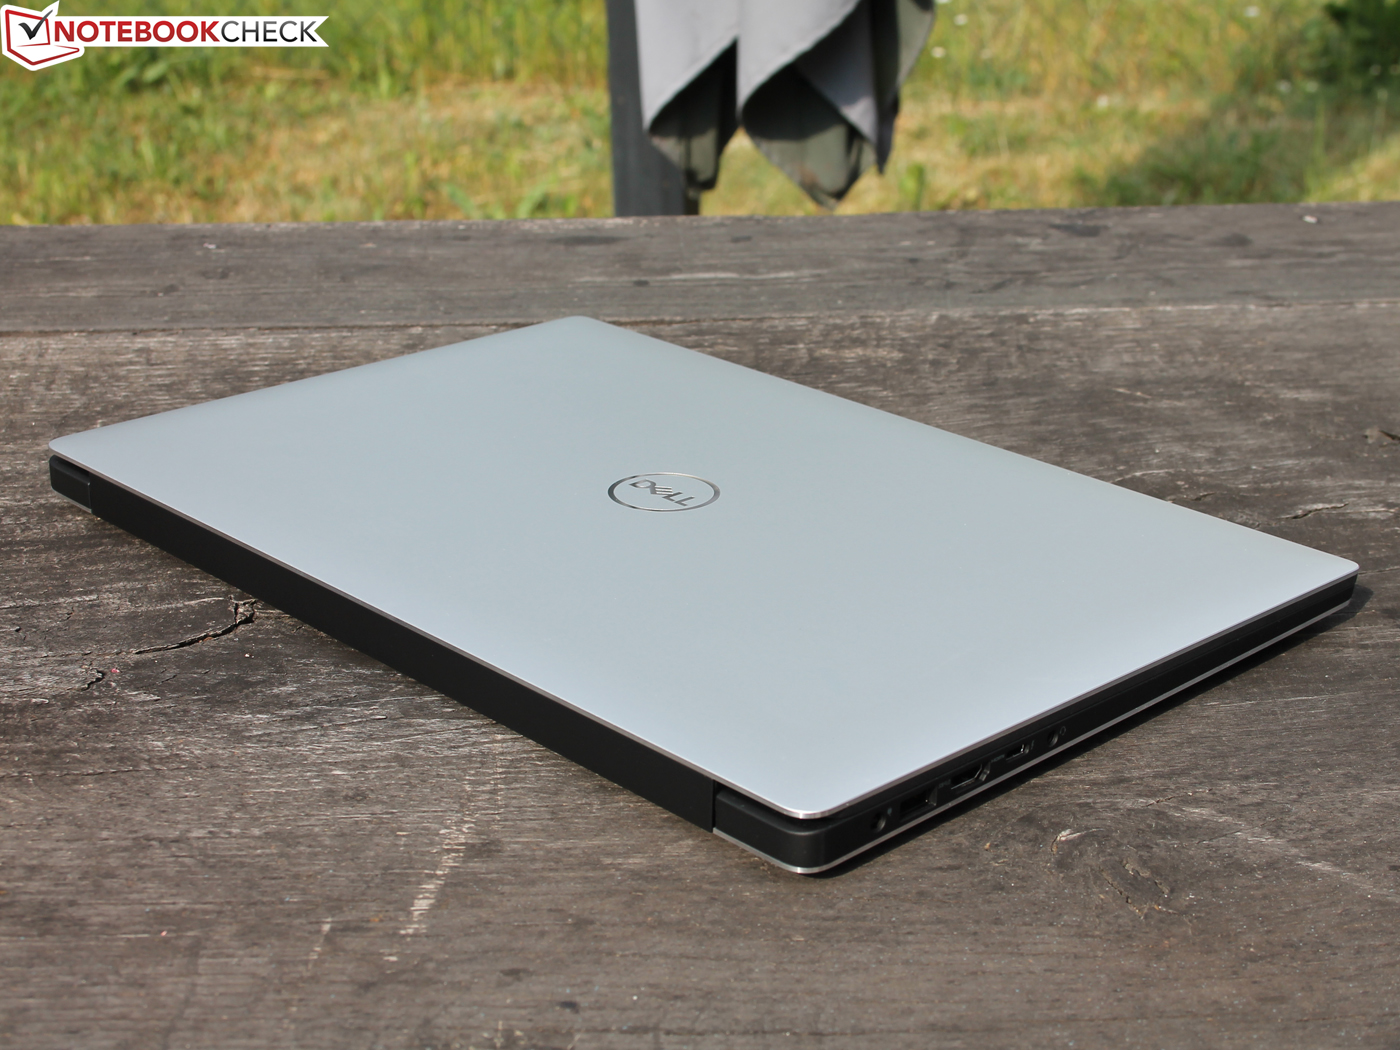
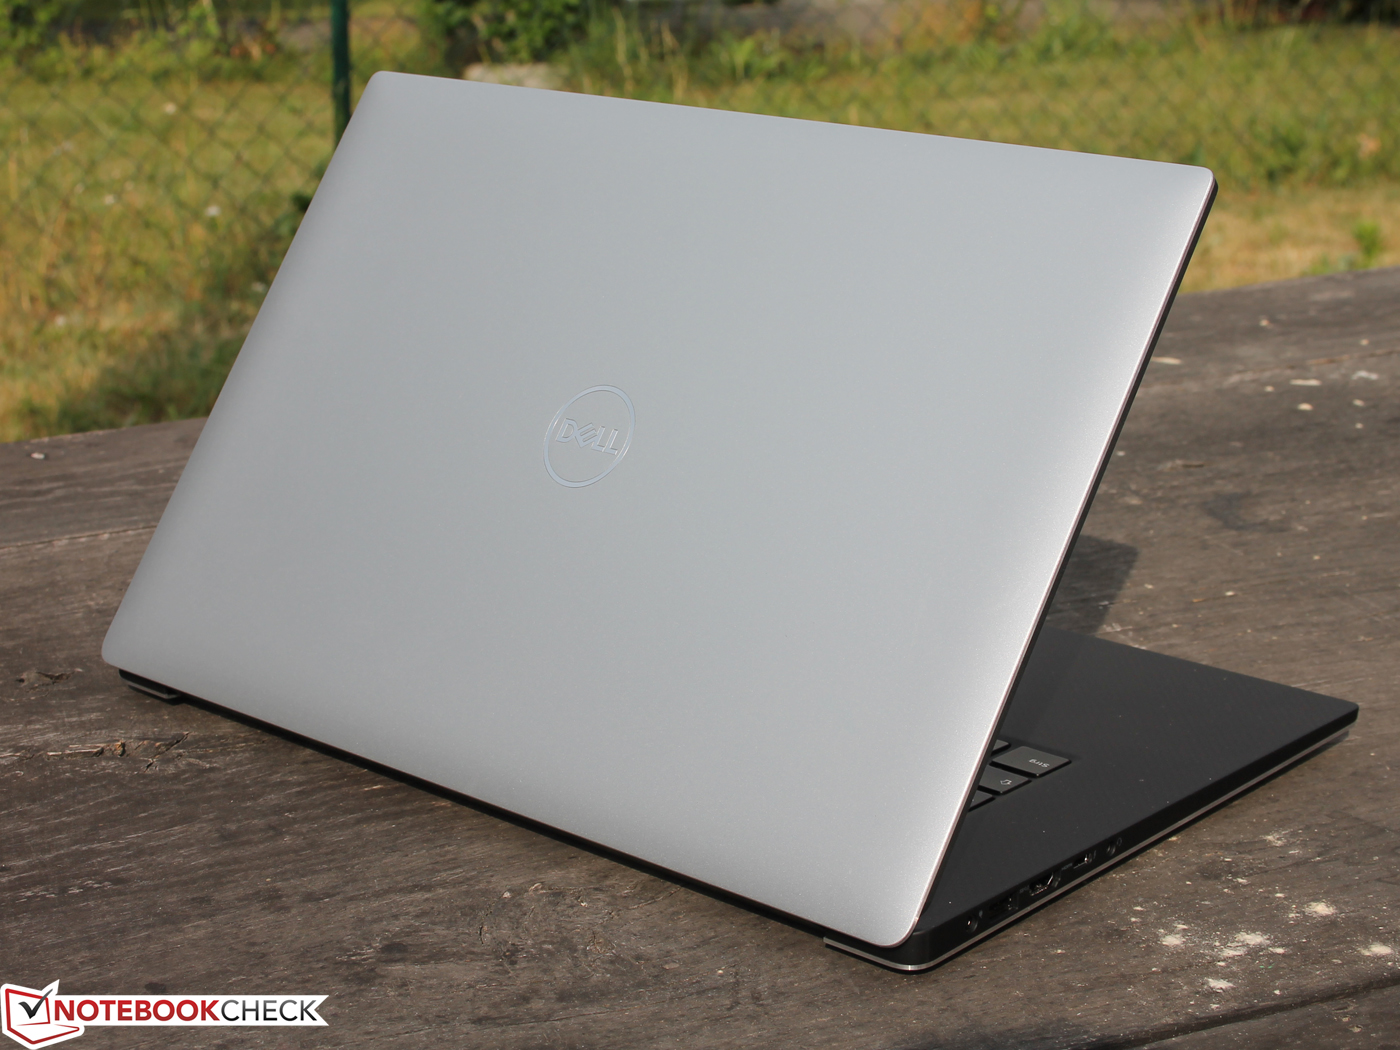
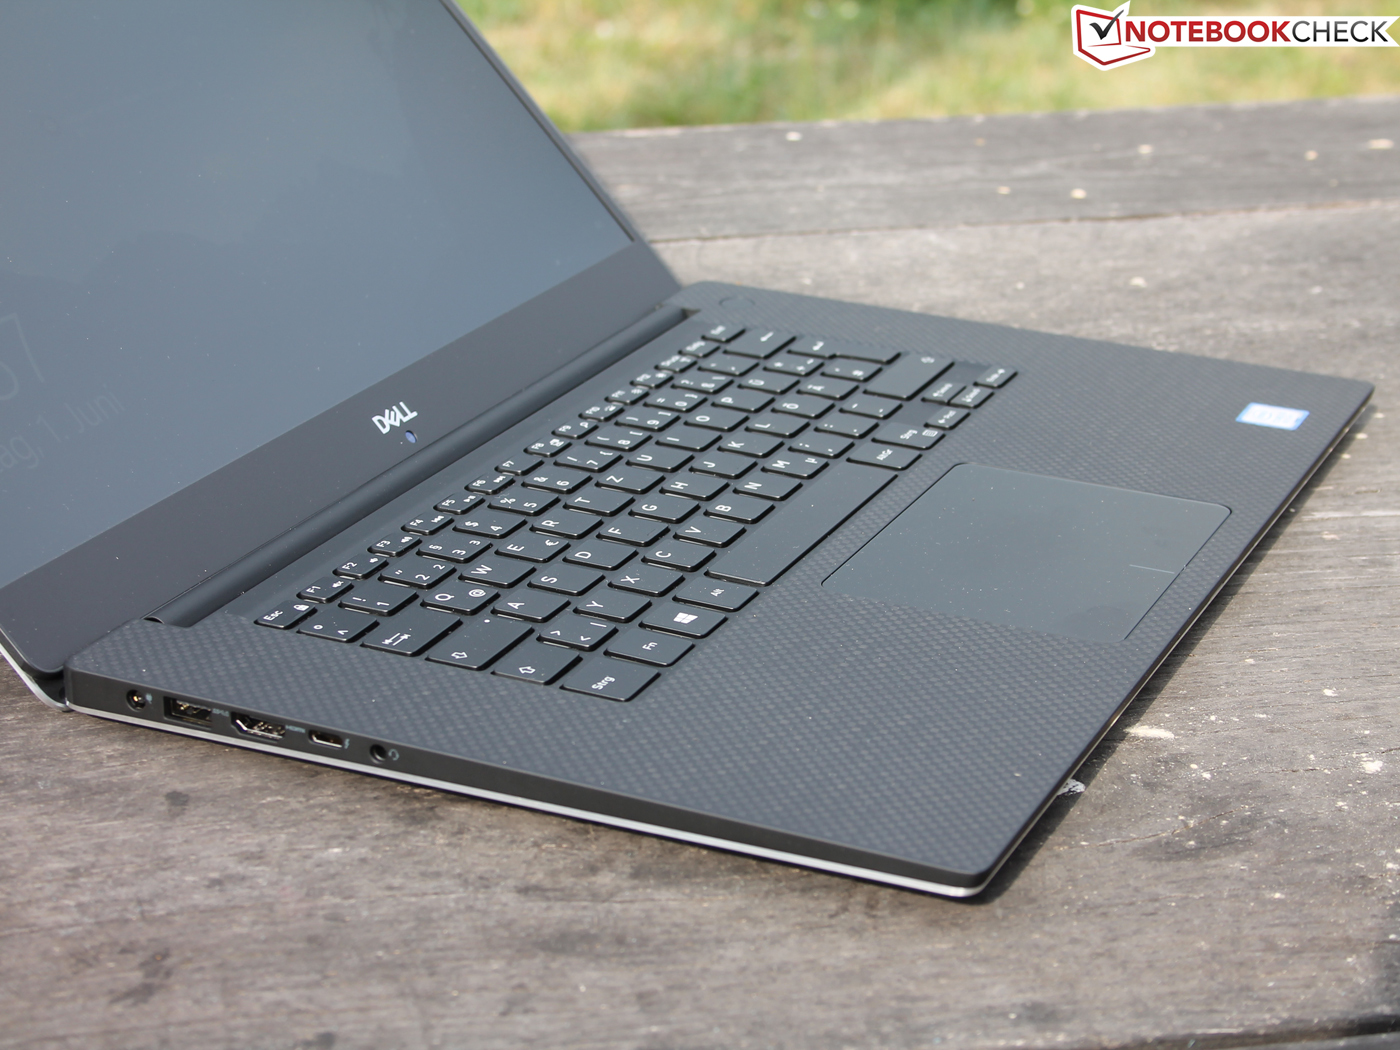
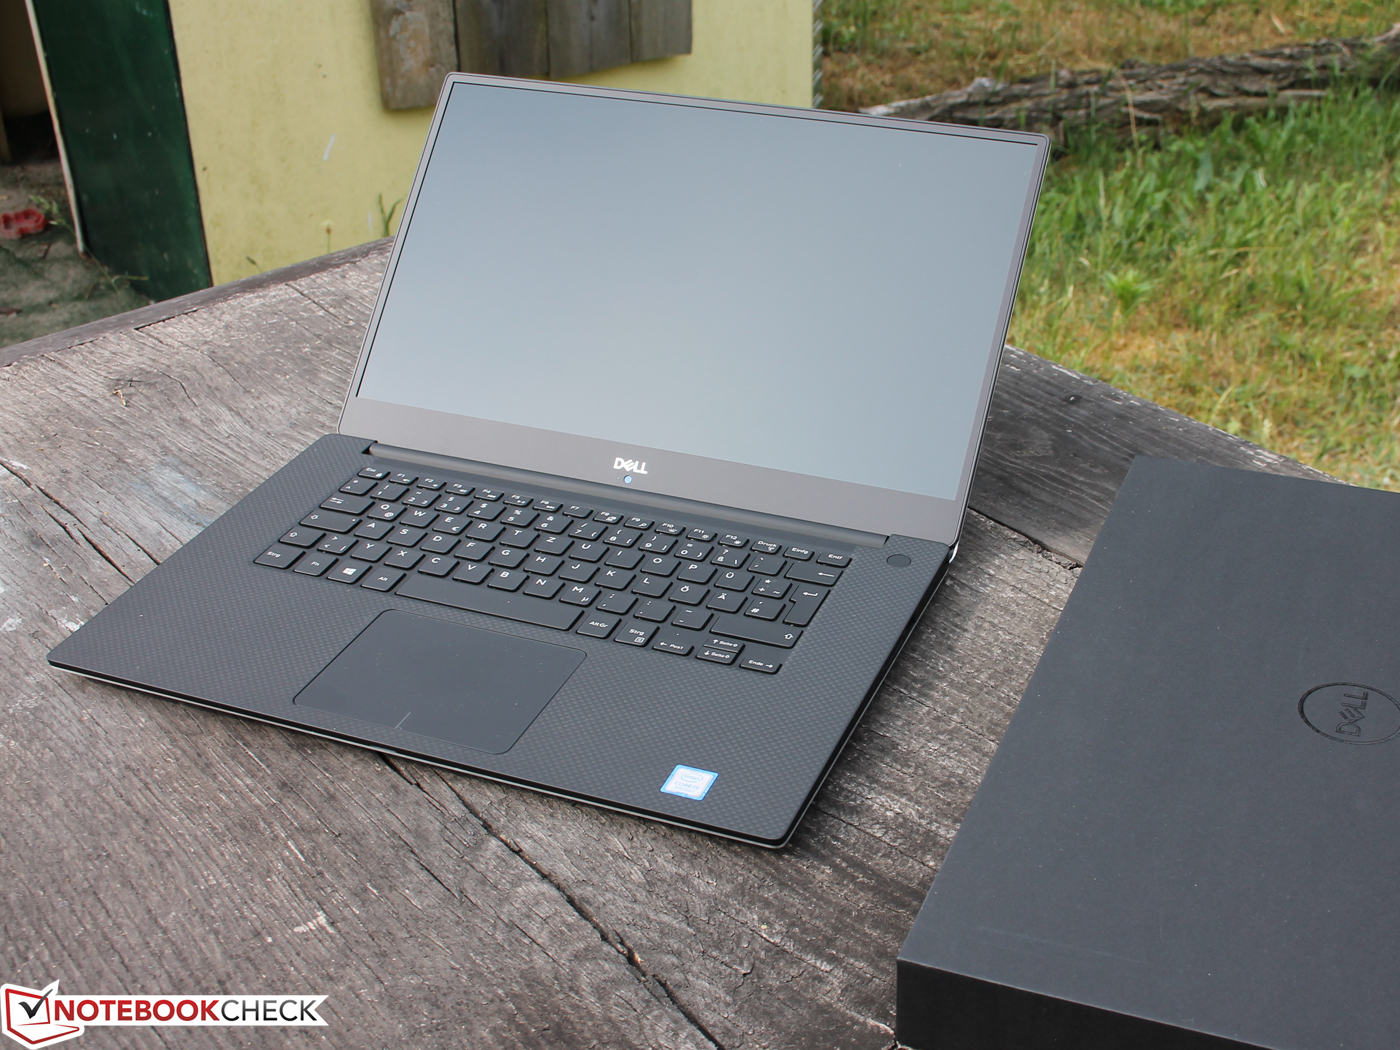
På utsidan har inte mycket ändrats, men den som använder XPS 15 2018 kommer snart att märka följande: Dell har lyckats göra en redan utmärkt laptop ännu bättre. Ljudnivå, värmeutveckling, batteritid och detaljer i portutbudet har förbättrats. Resultatet är en högre rankning.
Dell har lyckats göra en laptop som redan var riktigt bra ännu bättre. Ljudnivå, värmeutveckling, batteritid och detaljer i portutbudet har förbättrats.
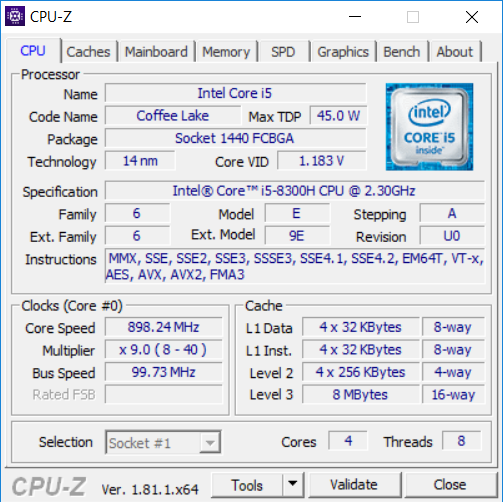
Prestandan hos i5-8300H har mycket att erbjuda användaren. Jämfört med dom dyrare versionerna med Core i7-8750H eller Core i9-8950HK (båda med sex kärnor) så har i5-8300H egentligen bara en riktig nackdel när det kommer till intensiv multitasking.
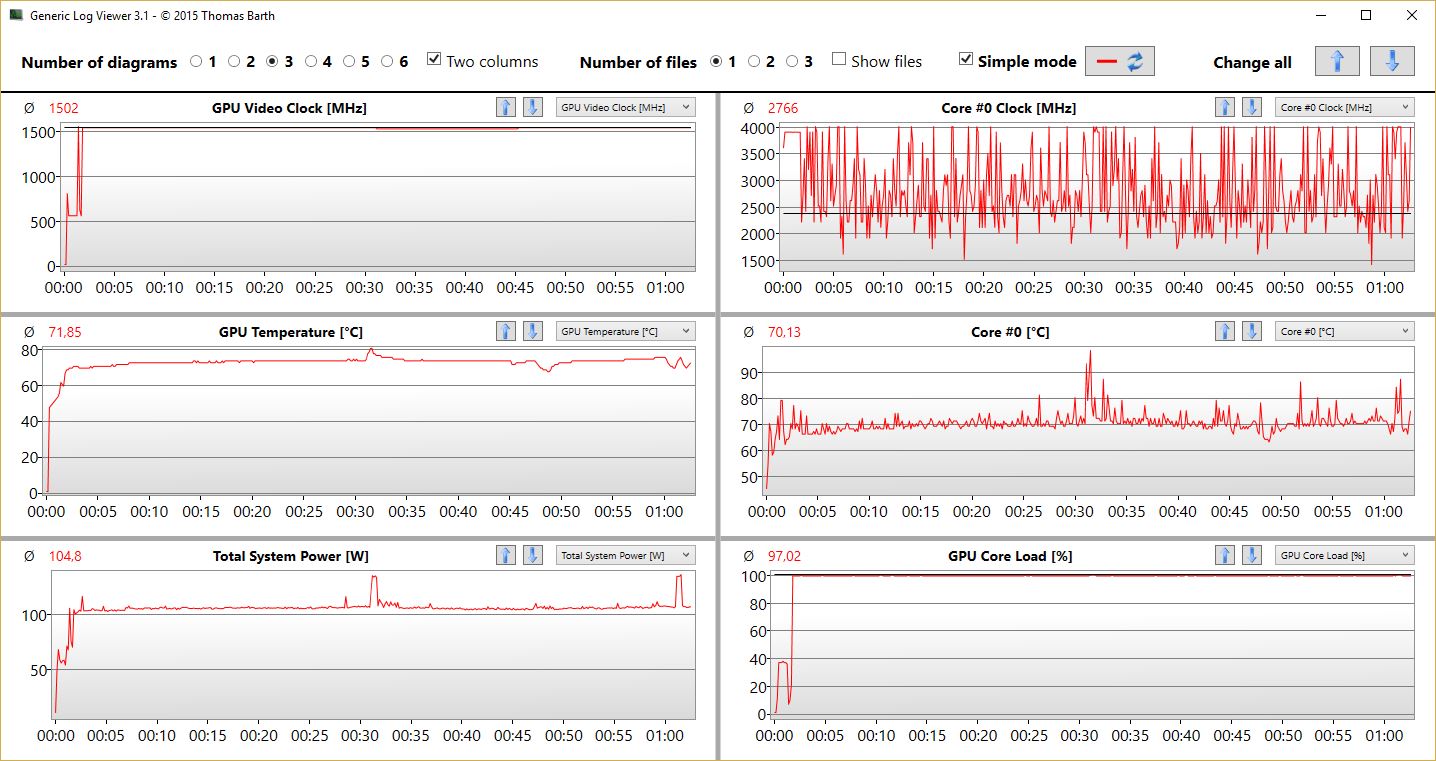
i5-8300H använder sitt kylsystem fullt ut (dubbel fläkt, 94 °C), och den stryps bara minimalt av temperaturgränsen (-3.5%). Vi är nyfikna över att se hur den sexkärniga modellen står sig i detta höljet och huruvida även den kan hålla strypningen på en minimal nivå. Det var bara stresstestet som fick processorn att strypas ordentligt, precis som förväntat. Nvidia GPU:n tar prioritet. Detta gäller inte för vanlig processorbelastning, utan gäller bara den ganska orealistiska kombinationen av 100% belastning på både CPU och GPU.
Vår 8300H-enhet fick bra resultat i PCMark-testerna och det finns bara små skillnader i prestanda på 0 - 6% jämfört med kraftfulla multimediaenheter. Lite-On SSD-enheten kan enligt prestandatesterna inte riktigt hålla jämna steg med SSD-enheterna i XPS 15 2017 eller Aero 15, men detta verkar inte ha en inverkan på PCMark-resultaten.
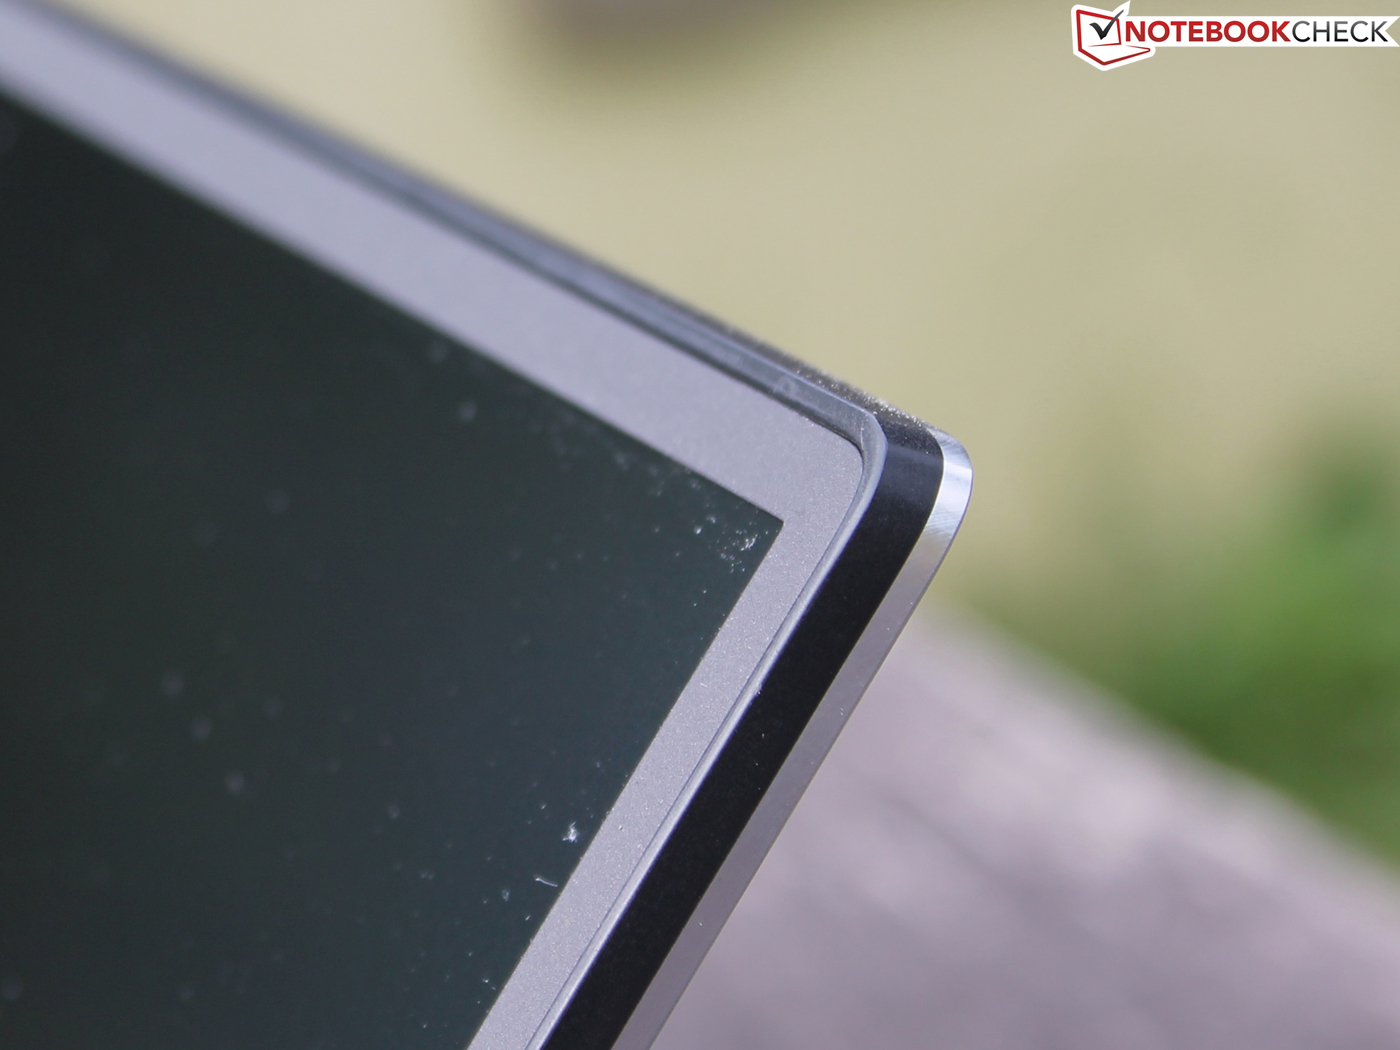
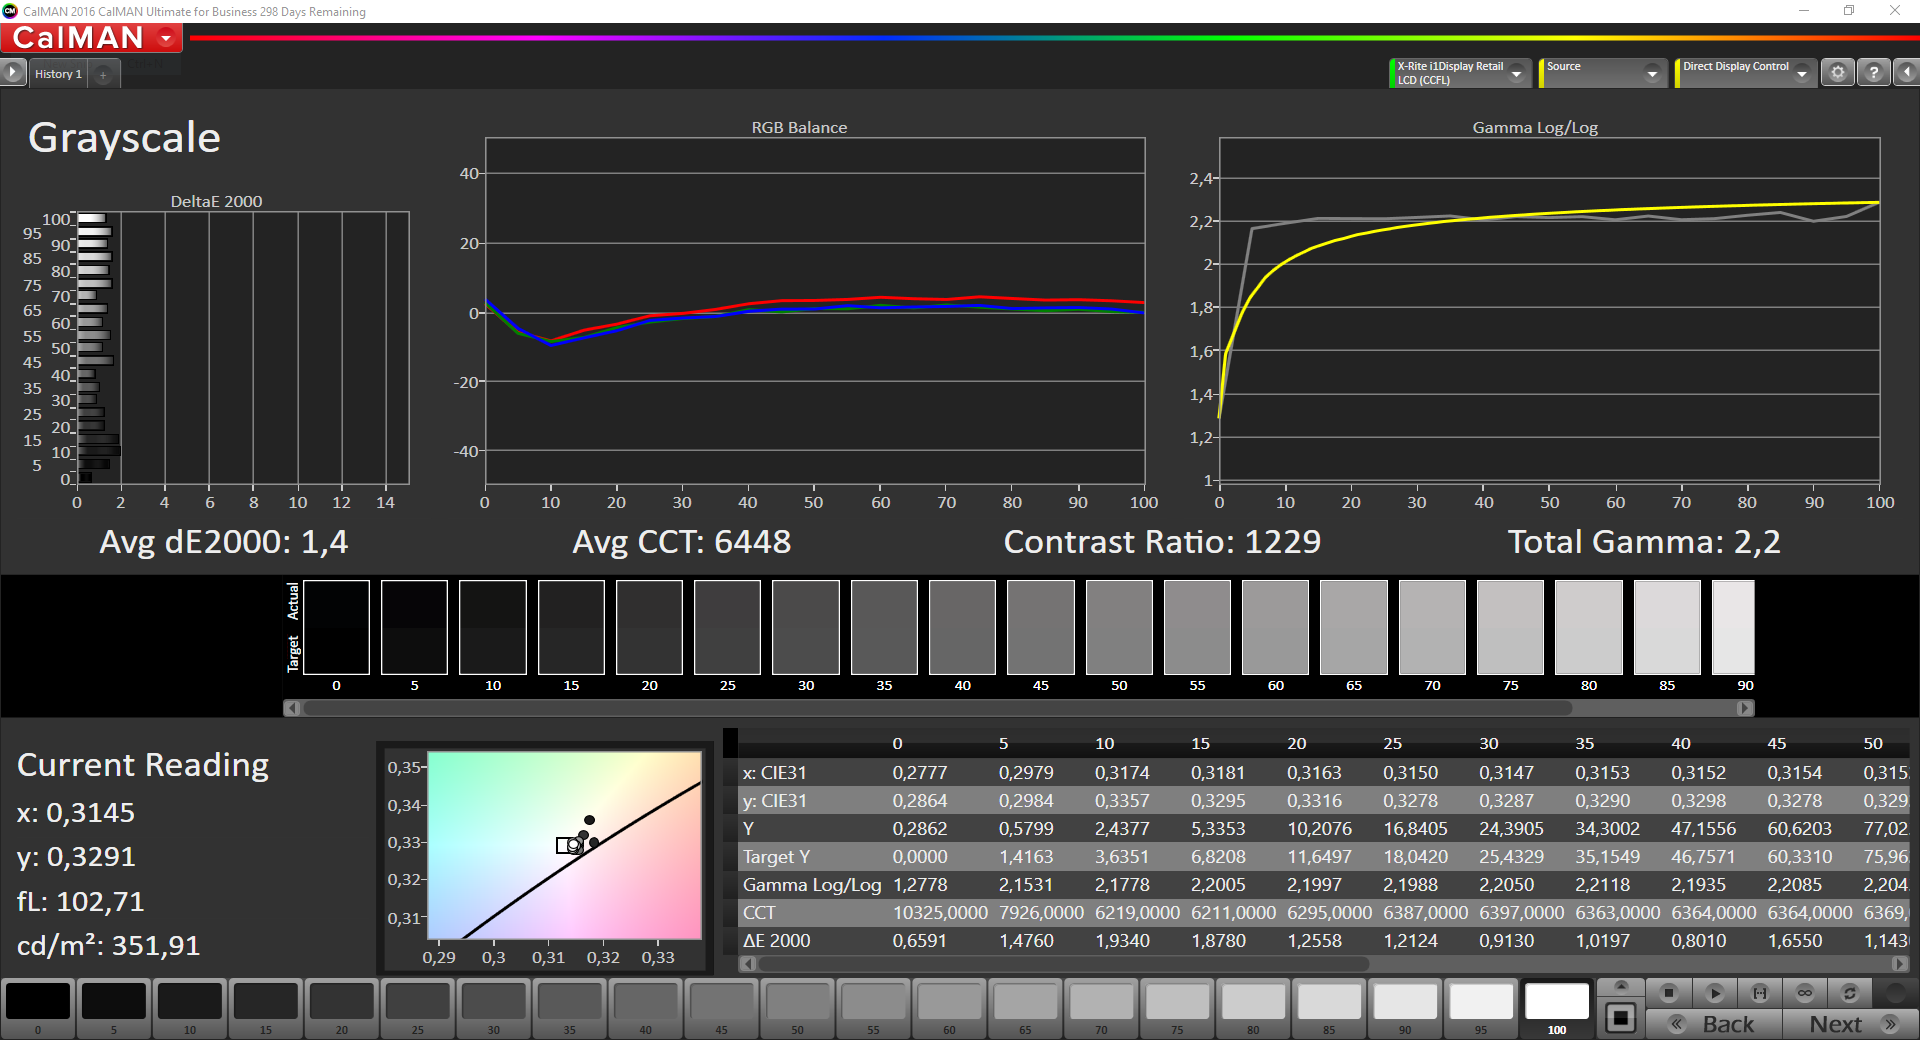
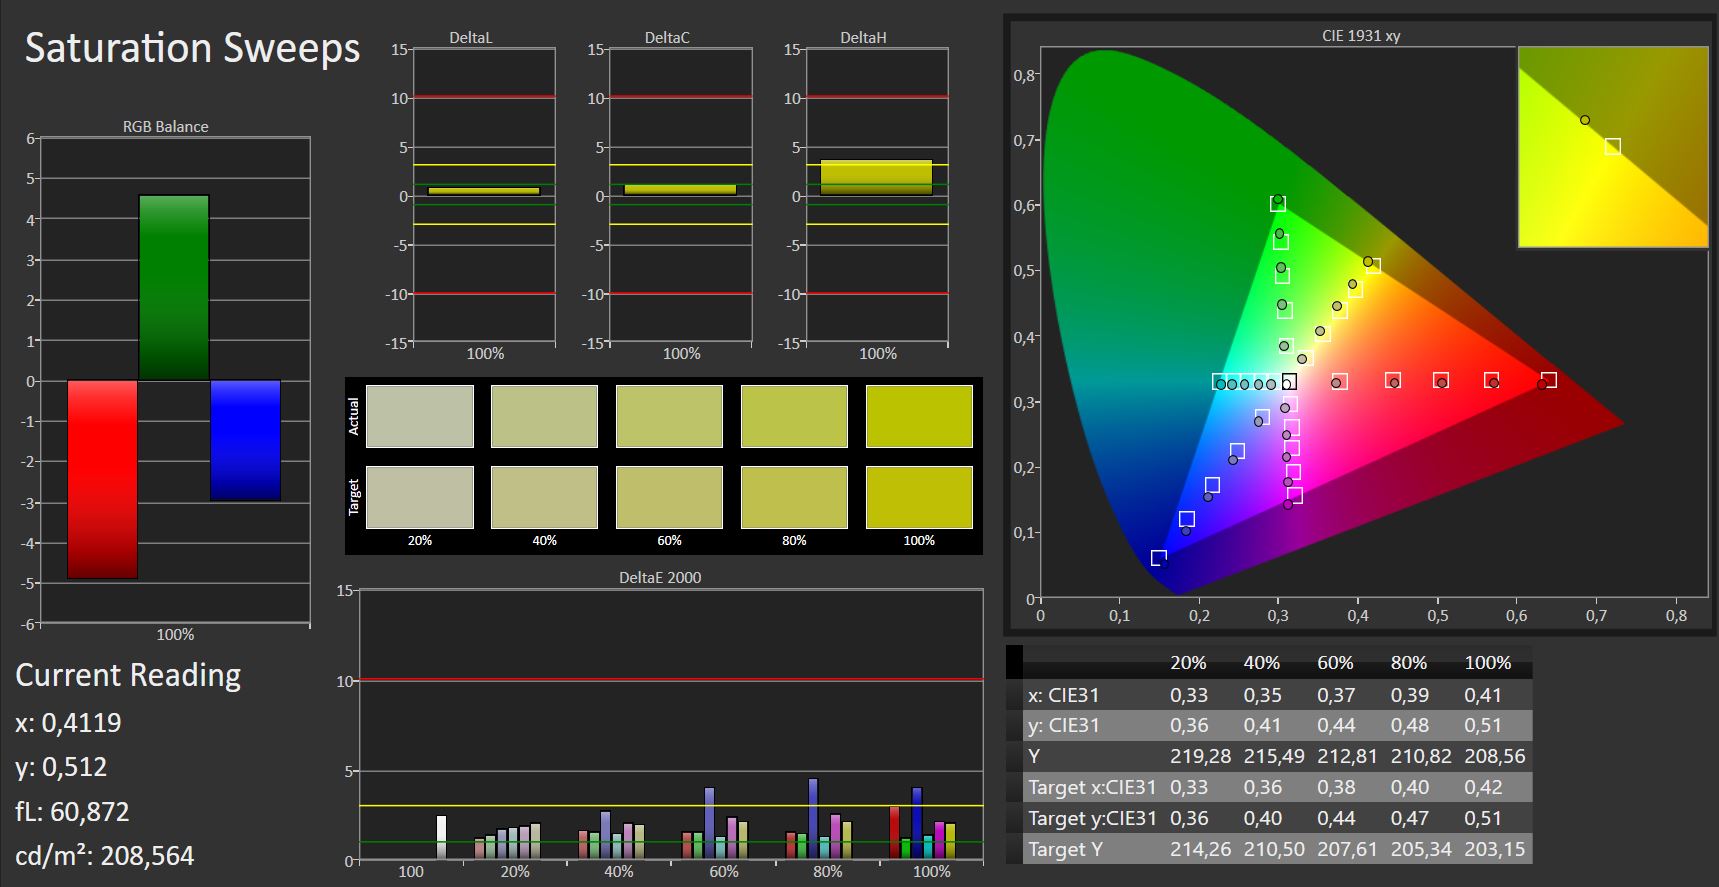
Vi föredrar FHD-skärmen framför motsvarigheten från 2017 års modell. Även om panelen är av samma konstruktion så har den nya skärmen bättre färgåtergivning direkt vid leverans (utan kalibrering) samt kortare responstider. Kontrast och färgrymdstäckning förblir väldigt bra. Men detta är första gången Dell har valt att använda PWM för att reducera ljusstyrkan, även om det inte sker förräns ljusstyrkan är på 10% eller lägre och borde för dom flesta användare därför inte påverka den vardagliga användningen.
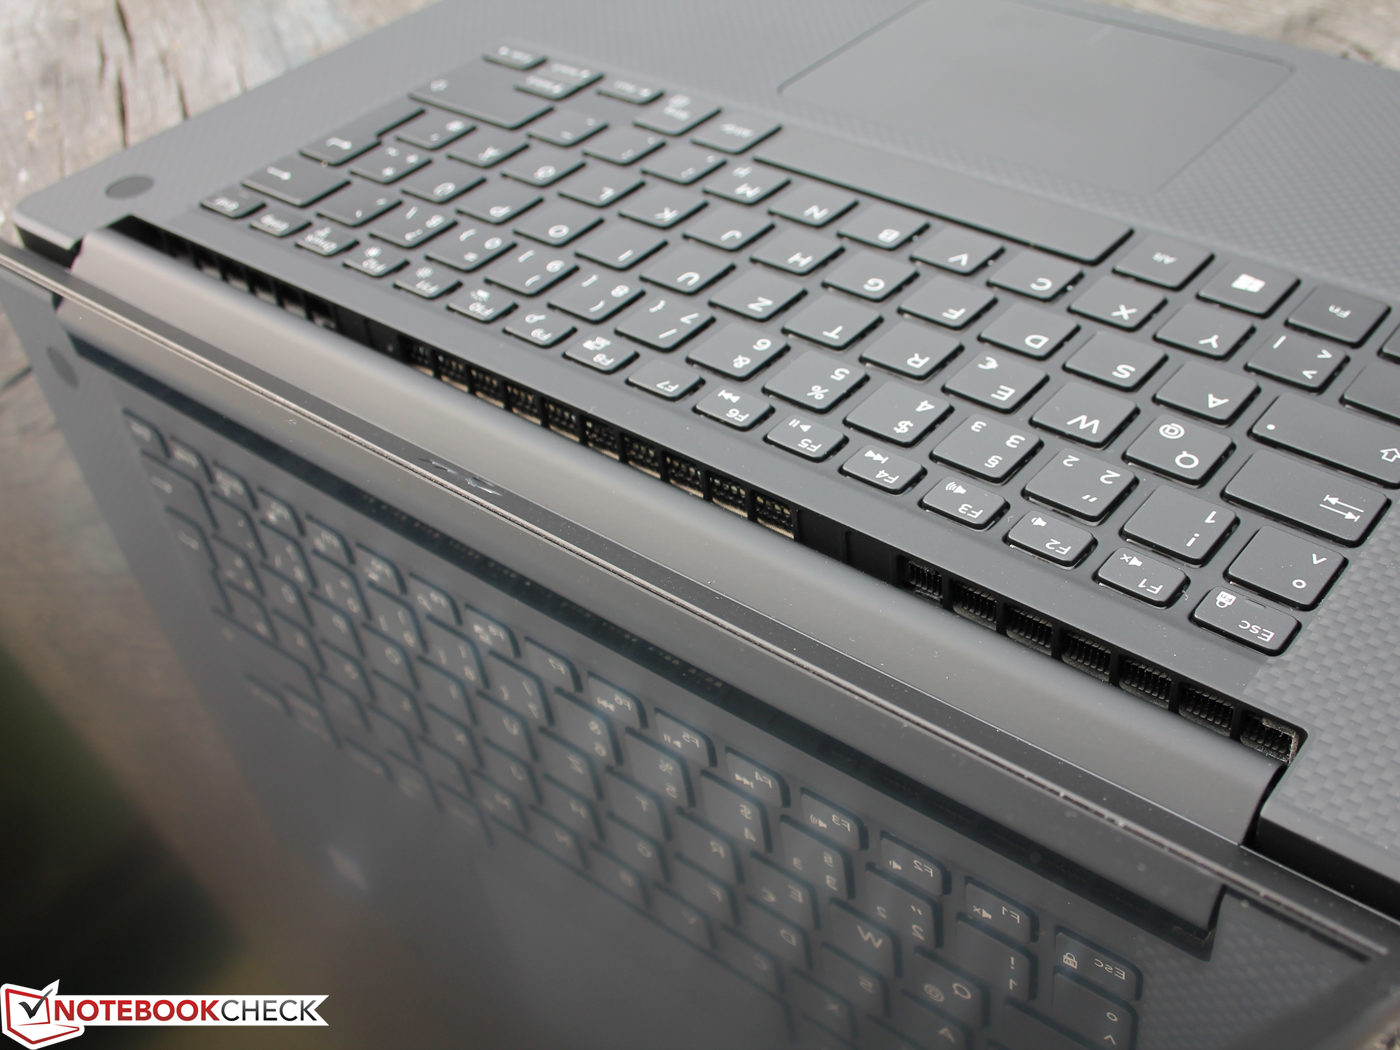
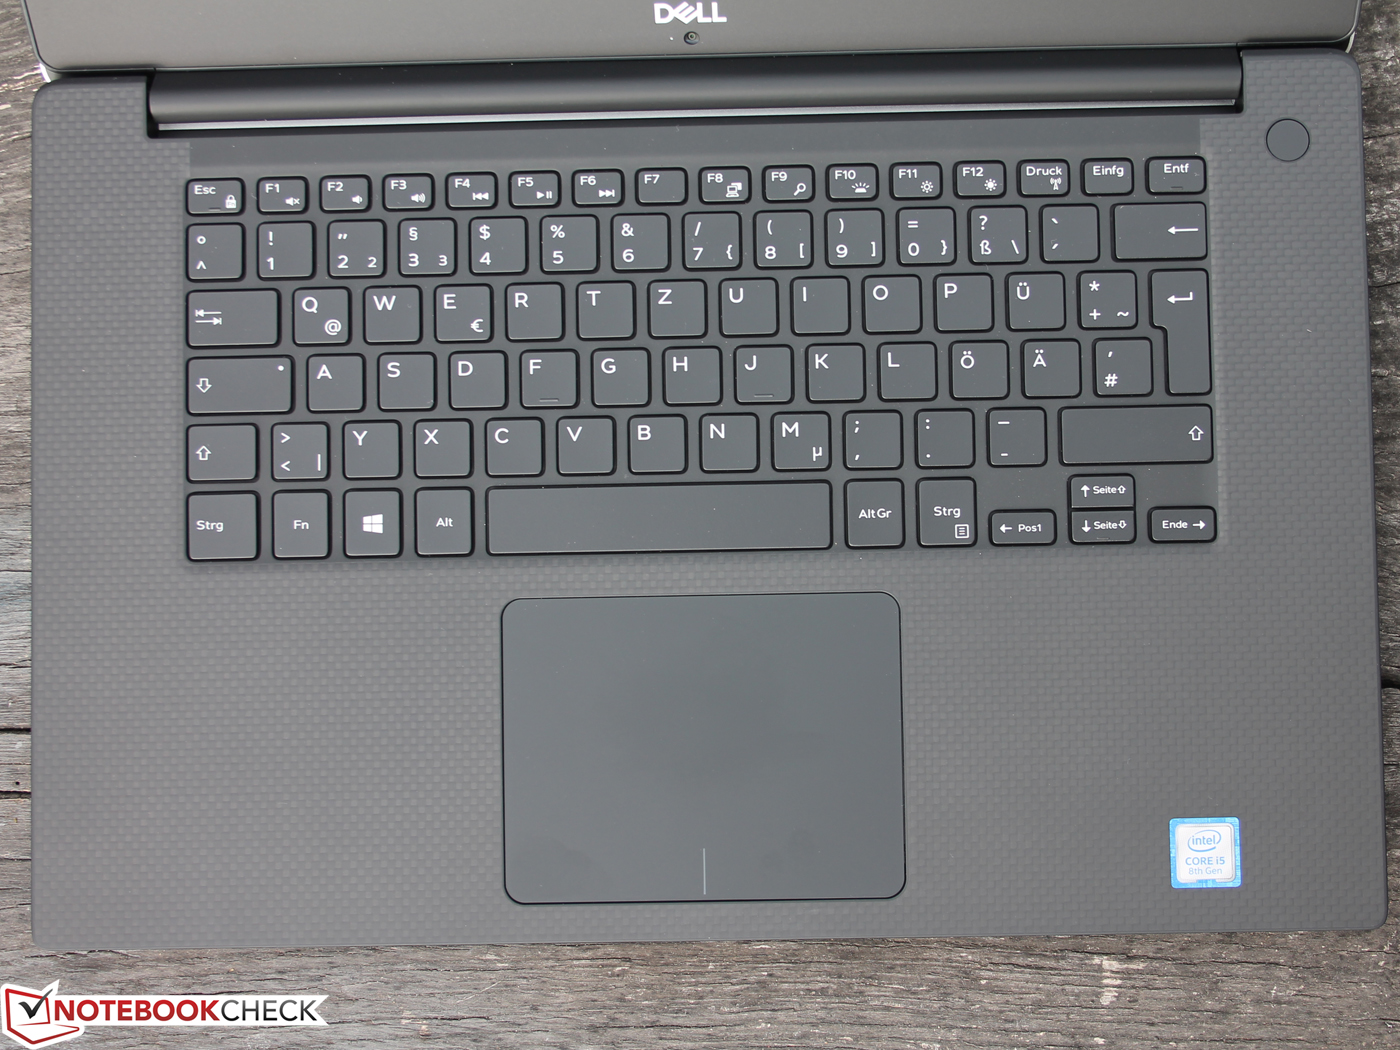
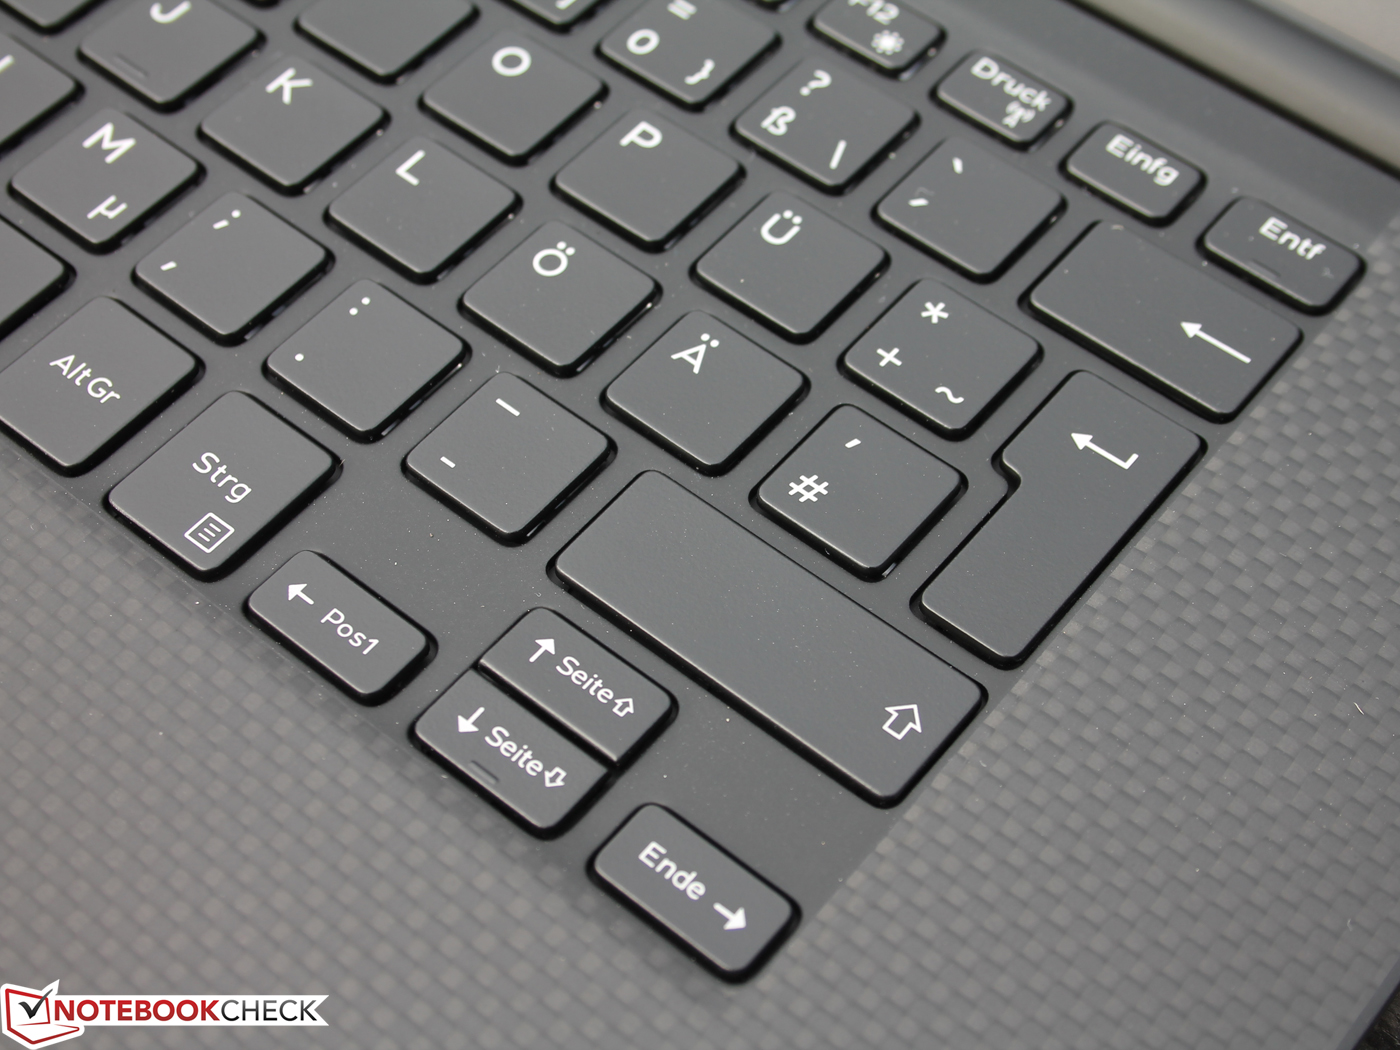
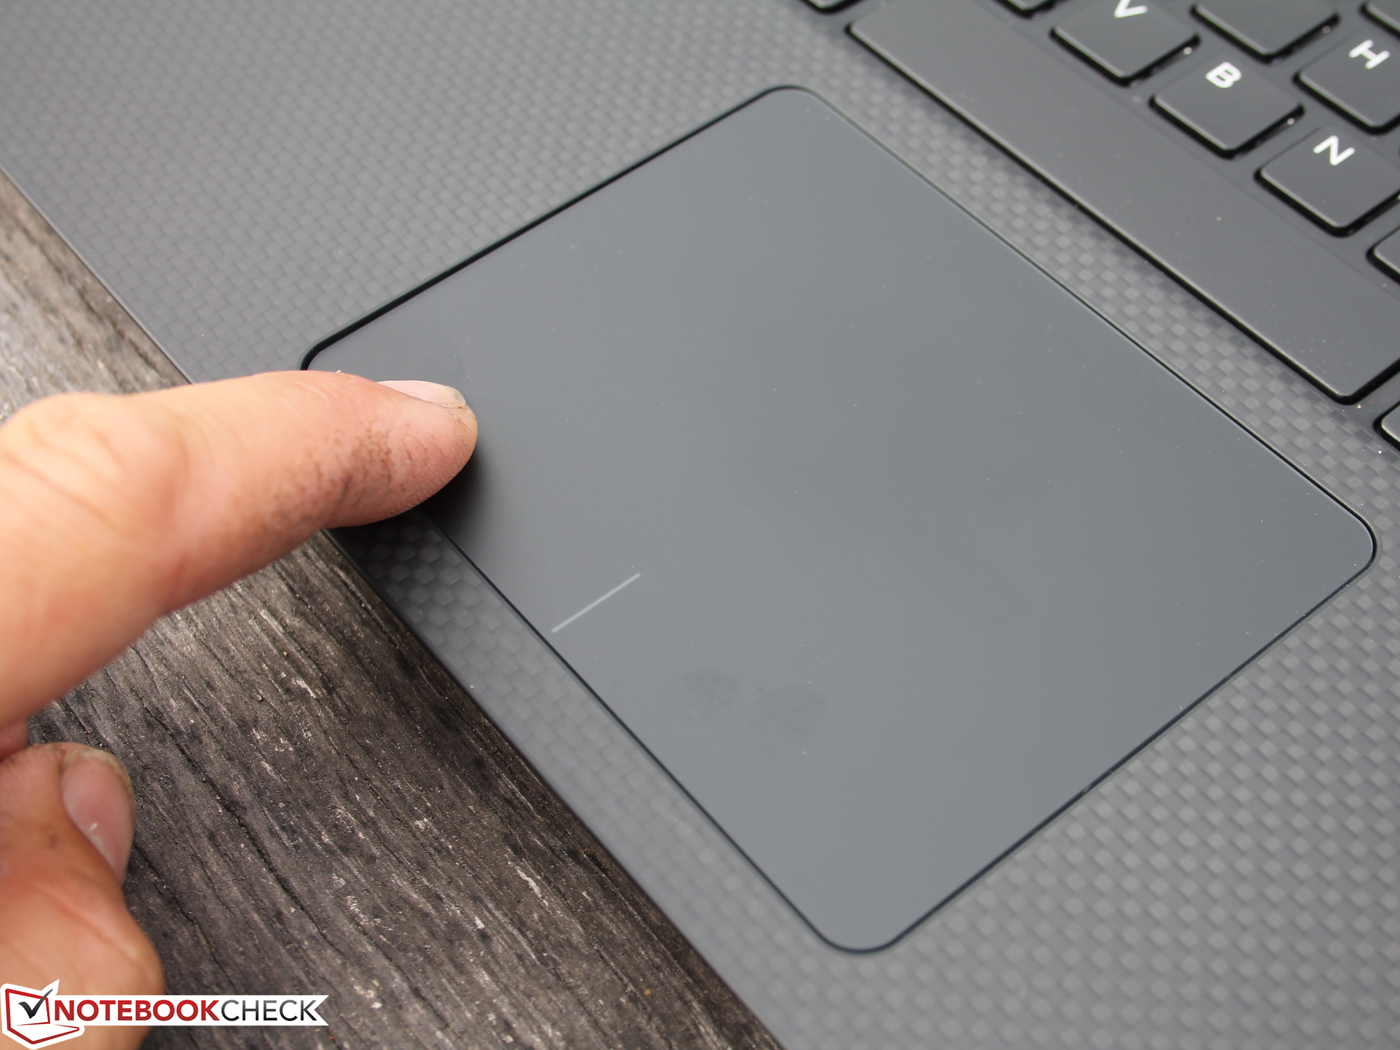
Inmatningsenheterna är som vanligt av hög kvalitet och är lämpliga för den som skriver ofta, här har inget ändrats. Bakgrundsbelysningen för tangentbordet har fortfarande PWM på 64 Hz på lägre ljusstyrkenivåer.
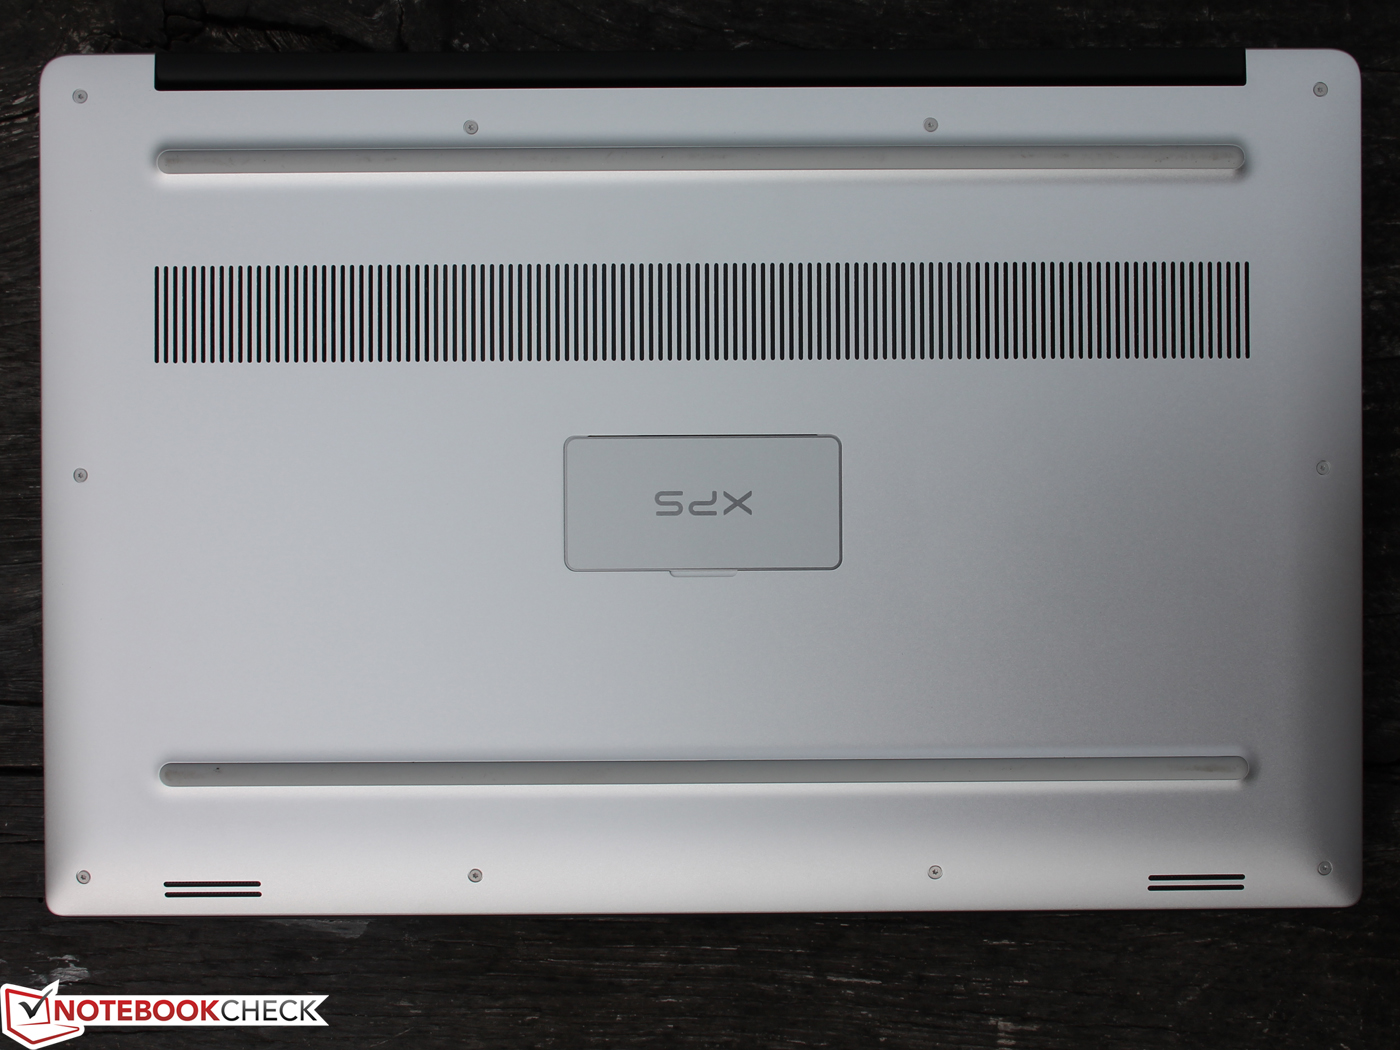
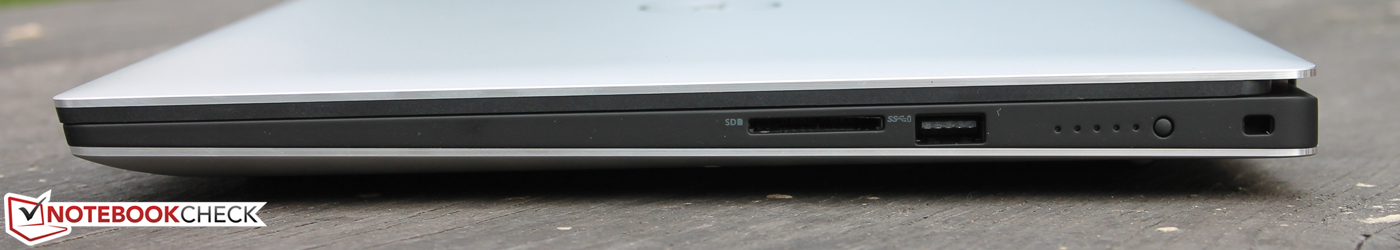
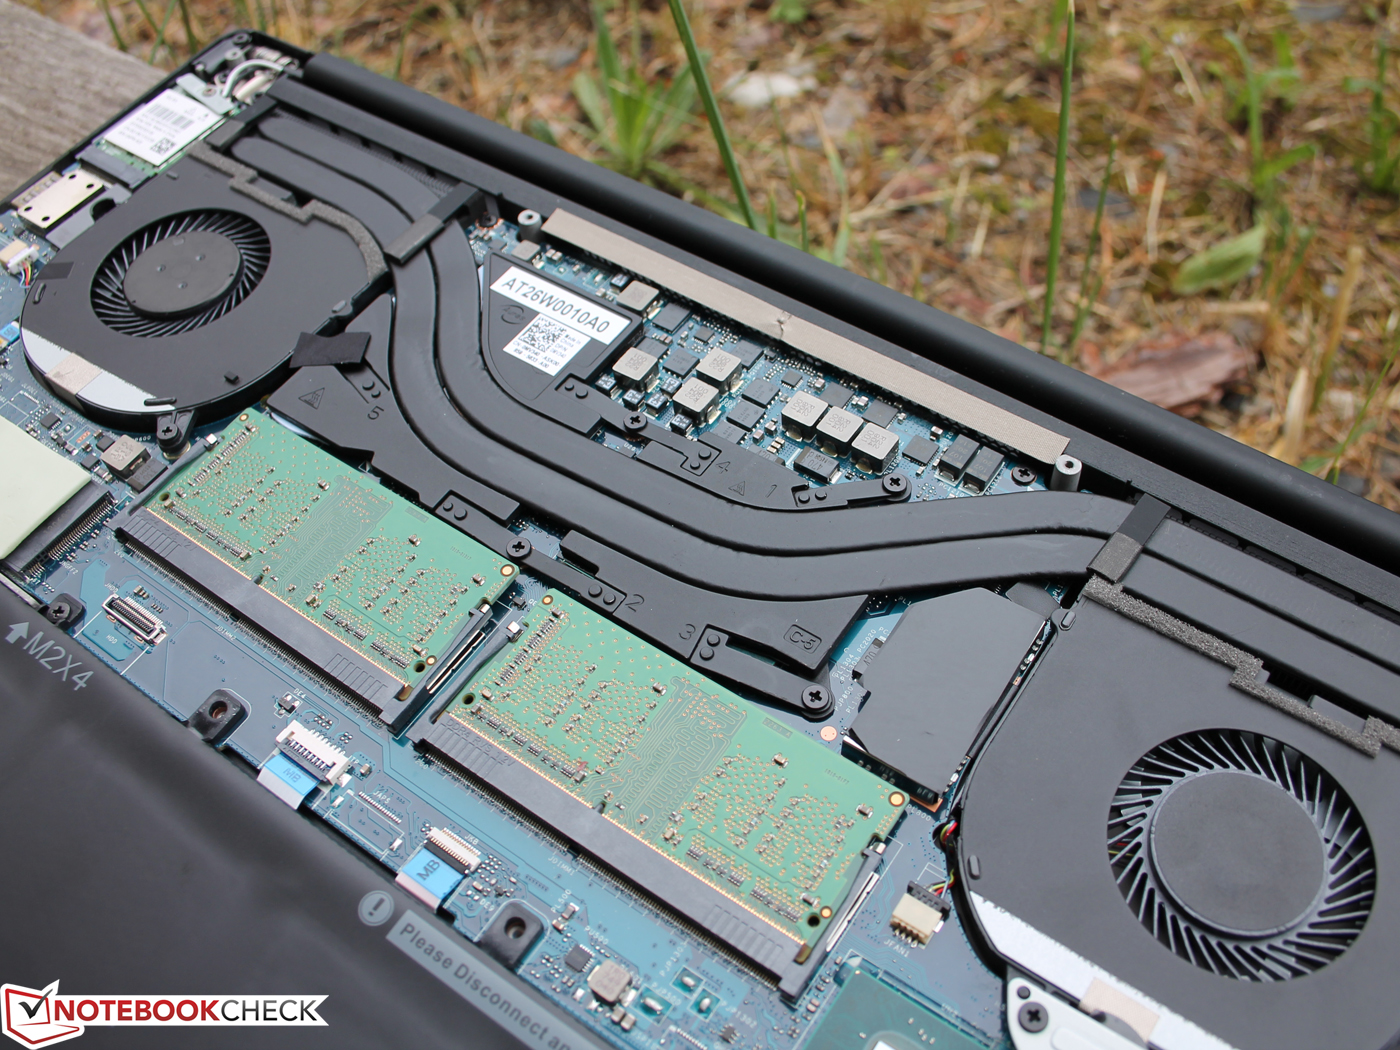
Dell erbjuder fortfarande dom grundläggande alternativen med varianter för antingen 2 lagringsenheter och 56 Wh eller 1 lagringsenhet och 97 Wh. Detta möjliggör stor flexibilitet när man konfigurerar sin enhet och det gör det också möjligt att kombinera en i7 med 56 Wh.
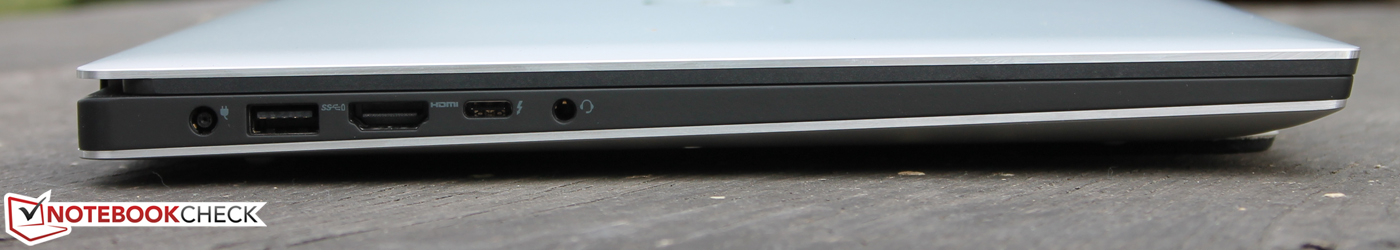
Batteritiden är utmärkt: Nästan 16 timmar i vårt WiFi-test. I spel har GTX 1050 Ti en fördel på runt 20%; GTX 1050 presterar över genomsnittet. Vi är nyfikna över att se vad GTX 1050 Ti kan göra i XPS 15. Spelare med en extern GPU såsom Razer Core kommer vara nöjda med dom fyra PCIe-filerna som Thunderbolt 3-porten har (9560 hade bara två filer).
Vi fann inget att kritisera med enhetens ljudnivå, som inte var ideal i 2017 års modell av XPS 15. Den maximala ljudnivån är lägre och fläkten håller sig avstängd vid tomgång med ett webbskript. Det är därför möjligt att arbeta tyst även när man använder kontorsapplikationer.
Härnäst kommer vi att ta en titt på Core i7/i9, GTX 1050 Ti-versionerna av XPS 15 9570. Testenheterna är redan på väg.
Uppdatering 2018-06-06
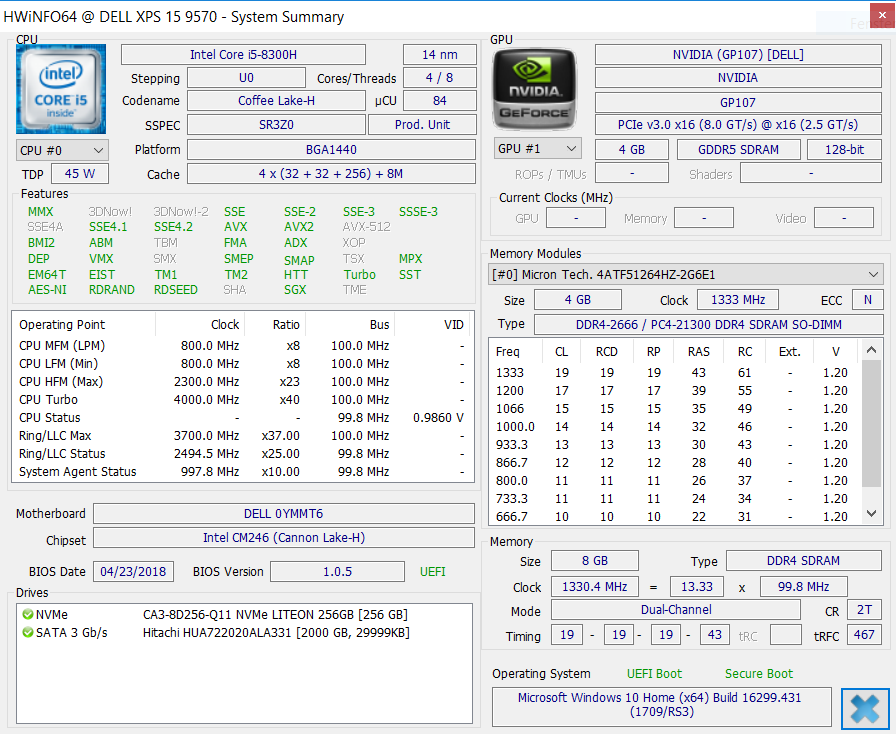
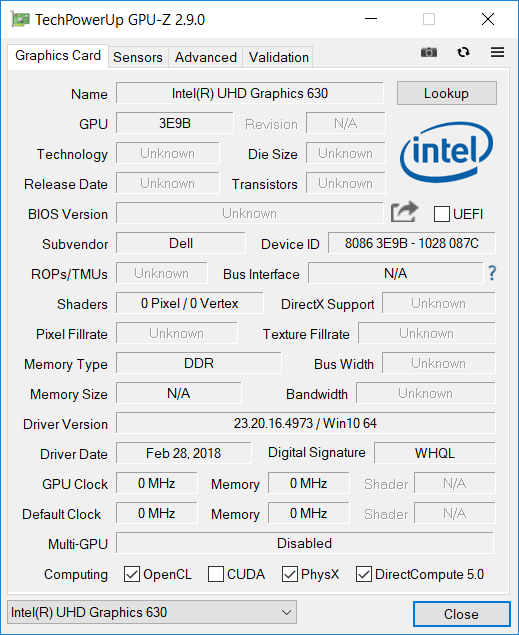
Under recensionens gång har Dell bekräftat ett drivrutinsproblem som orsakar att grafikkortet identifieras felaktigt. A01-drivrutinen från 2018-05-30 borde känna igen GPU:n korrekt. Du kan ladda ner drivrutinen från Dells hemsida här.
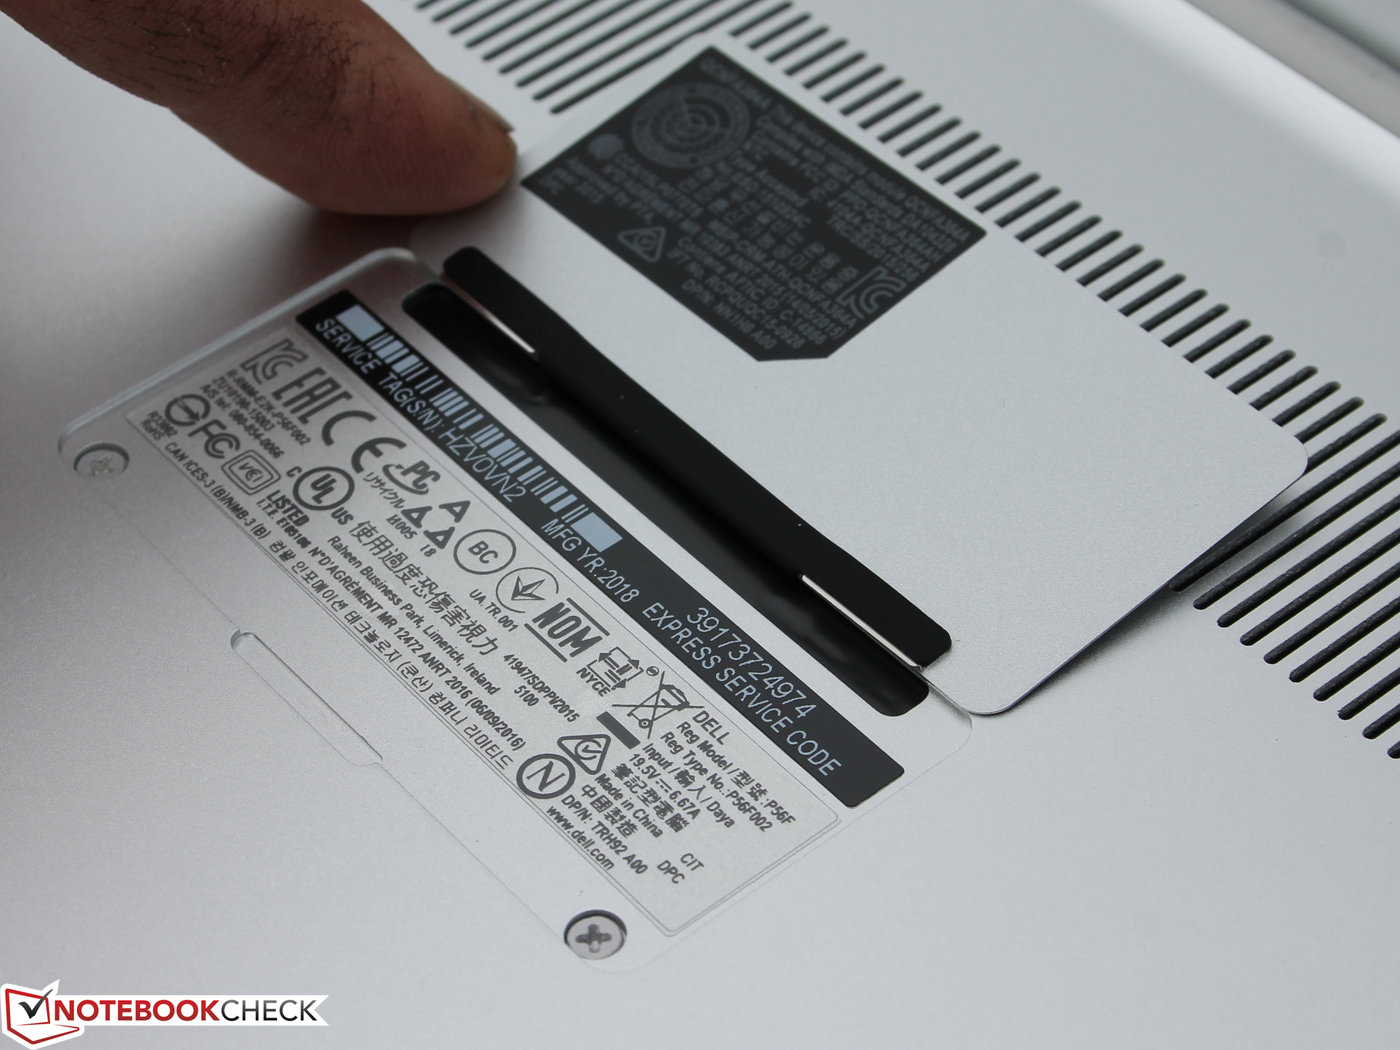
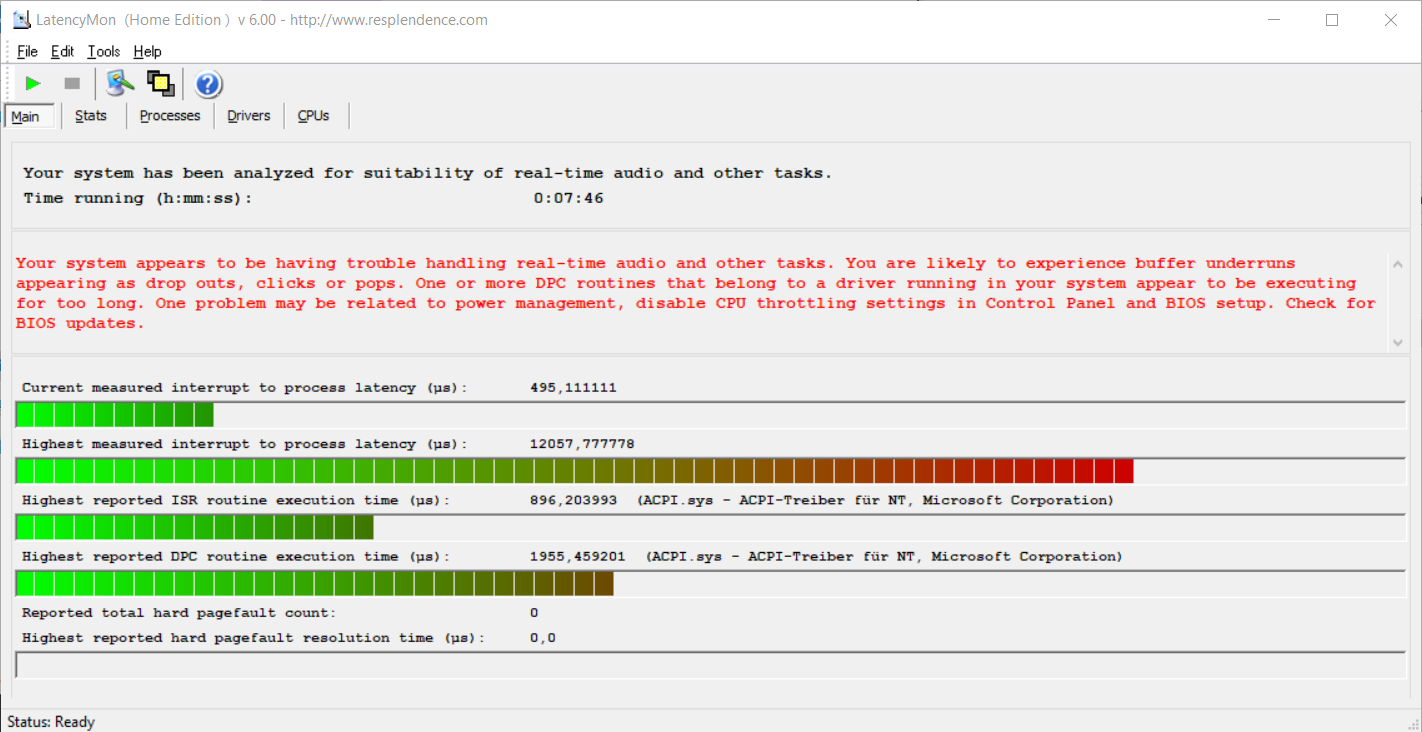
Vår testenhet kommer från Dells officiella butik, där vi köpte den. Det är således en version som vi har testat i det skick den anlände i (från fabrik). Prestandatesterna utfördes i Dells "Ultra Performance"-läge. Ett problem med SSD-enheten (ePSA-fel "Hårddisk - Ingen NVMe-enhet upptäckt på CPI-etikett 00B8, namnrymd ID 09") resulterade i ett plötsligt stopp av våra tester. Som tur var hade vi redan utfört dom tester och mätningar som var relevanta för vår poängsättning. Systemet hade redan låst sig tre gånger under testerna och kunde bara återaktiveras genom att utföra en hård omstart (hålla nere strömbrytaren en lång stund). Detta problem påverkade dock inte vår bedömning då vi tror att det är ett problem som specifikt rör vår enhet och som inte gäller hela serien.
Dell XPS 15 2018 i5 FHD 97Wh
- 06/05/2018 v6 (old)
Sebastian Jentsch
Price comparison
