Överväldigande kraft - Recension av Dell XPS 15 7590 med Core i9, GeForce GTX 1650 och OLED
| SD Card Reader | |
| average JPG Copy Test (av. of 3 runs) | |
| Gigabyte Aero 15 OLED XA (Toshiba Exceria Pro SDXC 64 GB UHS-II) | |
| Dell XPS 15 9570 Core i9 UHD (Toshiba Exceria Pro SDXC 64 GB UHS-II) | |
| Dell XPS 15 7590 9980HK GTX 1650 (Toshiba Exceria Pro SDXC 64 GB UHS-II) | |
| HP Spectre x360 15-df0126ng (Toshiba Exceria Pro M501 microSDXC 64GB) | |
| Asus ZenBook 15 UX533FD (Toshiba Exceria Pro SDXC 64 GB UHS-II) | |
| maximum AS SSD Seq Read Test (1GB) | |
| Gigabyte Aero 15 OLED XA (Toshiba Exceria Pro SDXC 64 GB UHS-II) | |
| Dell XPS 15 9570 Core i9 UHD (Toshiba Exceria Pro SDXC 64 GB UHS-II) | |
| HP Spectre x360 15-df0126ng (Toshiba Exceria Pro M501 microSDXC 64GB) | |
| Dell XPS 15 7590 9980HK GTX 1650 (Toshiba Exceria Pro SDXC 64 GB UHS-II) | |
| Asus ZenBook 15 UX533FD (Toshiba Exceria Pro SDXC 64 GB UHS-II) | |
| |||||||||||||||||||||||||
Distribution av ljusstyrkan: 94 %
Mitt på batteriet: 418.4 cd/m²
Kontrast: ∞:1 (Svärta: 0 cd/m²)
ΔE ColorChecker Calman: 6.06 | ∀{0.5-29.43 Ø4.72}
ΔE Greyscale Calman: 2.8 | ∀{0.09-98 Ø4.97}
99.6% sRGB (Argyll 1.6.3 3D)
81% AdobeRGB 1998 (Argyll 1.6.3 3D)
91.8% AdobeRGB 1998 (Argyll 3D)
99.6% sRGB (Argyll 3D)
88.1% Display P3 (Argyll 3D)
Gamma: 2.15
CCT: 6235 K
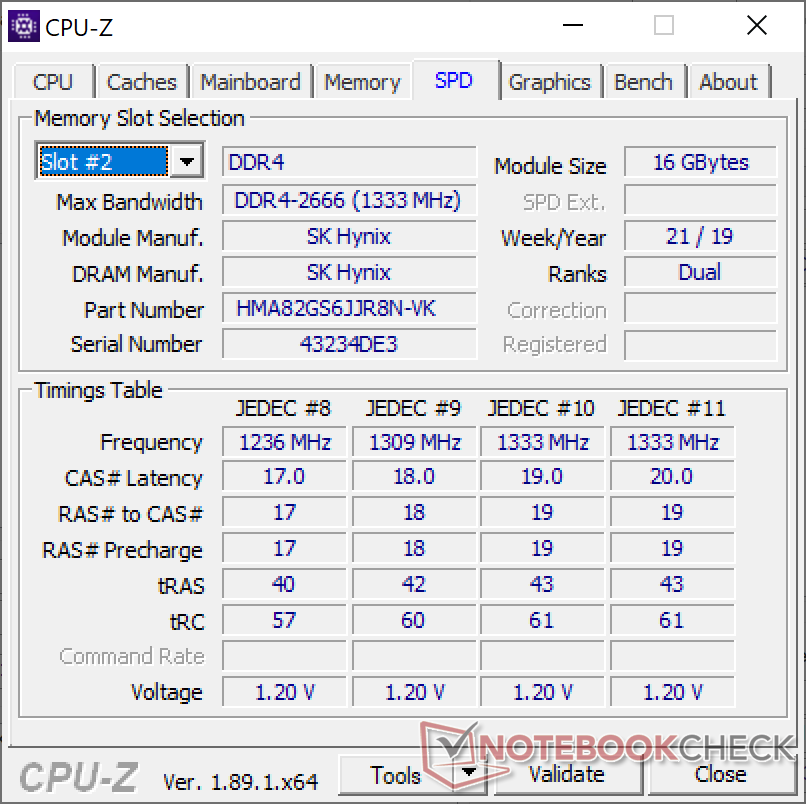
| Dell XPS 15 7590 9980HK GTX 1650 Samsung 156WR04, SDCA029, OLED, 15.6", 3840x2160 | Dell XPS 15 9570 Core i9 UHD LQ156D1, IPS, 15.6", 3840x2160 | Asus ZenBook 15 UX533FD BOE07D8, IPS, 15.6", 1920x1080 | HP Spectre x360 15-df0126ng AU Optronics AUO30EB, IPS, 15.6", 3840x2160 | Gigabyte Aero 15 OLED XA Samsung SDCA029, OLED, 15.6", 3840x2160 | Razer Blade 15 RTX 2080 Max-Q Sharp LQ156M1JW03 (SHP14C5), IPS, 15.6", 1920x1080 | |
|---|---|---|---|---|---|---|
| Display | -8% | -22% | -18% | -17% | ||
| Display P3 Coverage (%) | 88.1 | 79.6 -10% | 67.2 -24% | 68.1 -23% | 66.9 -24% | |
| sRGB Coverage (%) | 99.6 | 98.4 -1% | 88.4 -11% | 94.2 -5% | 98.1 -2% | |
| AdobeRGB 1998 Coverage (%) | 91.8 | 79.7 -13% | 64.6 -30% | 68.4 -25% | 68.5 -25% | |
| Response Times | -1698% | -1650% | -1785% | 2% | -395% | |
| Response Time Grey 50% / Grey 80% * (ms) | 2.3 ? | 52.4 ? -2178% | 45 ? -1857% | 57 ? -2378% | 2.4 ? -4% | 12.8 ? -457% |
| Response Time Black / White * (ms) | 2.4 ? | 31.6 ? -1217% | 37 ? -1442% | 31 ? -1192% | 2.2 ? 8% | 10.4 ? -333% |
| PWM Frequency (Hz) | 59.5 ? | 1000 ? | 60 ? | 23810 ? | ||
| Screen | -28% | -18% | -9% | 7% | 8% | |
| Brightness middle (cd/m²) | 421.2 | 451.9 7% | 311 -26% | 330 -22% | 373 -11% | 293 -30% |
| Brightness (cd/m²) | 417 | 414 -1% | 303 -27% | 310 -26% | 375 -10% | 270 -35% |
| Brightness Distribution (%) | 94 | 81 -14% | 81 -14% | 87 -7% | 93 -1% | 87 -7% |
| Black Level * (cd/m²) | 0.36 | 0.24 | 0.37 | 0.29 | ||
| Colorchecker dE 2000 * | 6.06 | 5.62 7% | 5.1 16% | 4.03 33% | 3.98 34% | 1.69 72% |
| Colorchecker dE 2000 max. * | 11.89 | 19.1 -61% | 8.91 25% | 6.74 43% | 6.28 47% | 3.37 72% |
| Greyscale dE 2000 * | 2.8 | 6.9 -146% | 4.93 -76% | 4.49 -60% | 2.81 -0% | 2.3 18% |
| Gamma | 2.15 102% | 2.2 100% | 2.44 90% | 2.57 86% | 2.62 84% | 2.3 96% |
| CCT | 6235 104% | 6254 104% | 7641 85% | 6744 96% | 6434 101% | 6758 96% |
| Color Space (Percent of AdobeRGB 1998) (%) | 81 | 71.8 -11% | 58 -28% | 61 -25% | 78 -4% | 63 -22% |
| Color Space (Percent of sRGB) (%) | 99.6 | 98.5 -1% | 88 -12% | 94 -6% | 97 -3% | 98.5 -1% |
| Contrast (:1) | 1255 | 1296 | 892 | 1010 | ||
| Colorchecker dE 2000 calibrated * | 2.69 | 2.48 | 1.96 | 1.24 | ||
| Totalt genomsnitt (program/inställningar) | -578% /
-280% | -563% /
-270% | -604% /
-284% | 5% /
6% | -135% /
-60% |
* ... mindre är bättre
Visa svarstider
| ↔ Svarstid svart till vitt | ||
|---|---|---|
| 2.4 ms ... stiga ↗ och falla ↘ kombinerat | ↗ 1.1 ms stiga | 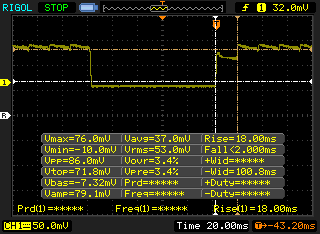 |
| ↘ 1.3 ms hösten | ||
| Skärmen visar väldigt snabba svarsfrekvenser i våra tester och borde vara mycket väl lämpad för fartfyllt spel. I jämförelse sträcker sig alla testade enheter från 0.1 (minst) till 240 (maximalt) ms. » 13 % av alla enheter är bättre. Det betyder att den uppmätta svarstiden är bättre än genomsnittet av alla testade enheter (19.8 ms). | ||
| ↔ Svarstid 50 % grått till 80 % grått | ||
| 2.3 ms ... stiga ↗ och falla ↘ kombinerat | ↗ 1.1 ms stiga | 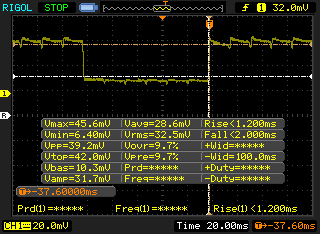 |
| ↘ 1.2 ms hösten | ||
| Skärmen visar väldigt snabba svarsfrekvenser i våra tester och borde vara mycket väl lämpad för fartfyllt spel. I jämförelse sträcker sig alla testade enheter från 0.165 (minst) till 636 (maximalt) ms. » 11 % av alla enheter är bättre. Det betyder att den uppmätta svarstiden är bättre än genomsnittet av alla testade enheter (31 ms). | ||
Skärmflimmer / PWM (Puls-Width Modulation)
| Skärmflimmer / PWM upptäckt | 59.5 Hz | ≤ 100 % ljusstyrka inställning | 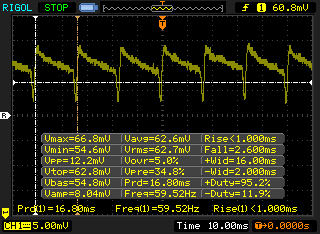 |
Displayens bakgrundsbelysning flimrar vid 59.5 Hz (i värsta fall, t.ex. med PWM) Flimrande upptäckt vid en ljusstyrkeinställning på 100 % och lägre. Det ska inte finnas något flimmer eller PWM över denna ljusstyrkeinställning. Frekvensen för 59.5 Hz är mycket låg, så flimmer kan orsaka ögon- och huvudvärk efter långvarig användning. Som jämförelse: 52 % av alla testade enheter använder inte PWM för att dämpa skärmen. Om PWM upptäcktes mättes ett medelvärde av 7775 (minst: 5 - maximum: 343500) Hz. | |||
| Cinebench R10 | |
| Rendering Multiple CPUs 32Bit | |
| Genomsnitt Intel Core i9-9980HK (39440 - 50439, n=4) | |
| Schenker XMG Ultra 15 Turing | |
| Eurocom Sky X4C | |
| Dell G5 15 5590 | |
| Asus GL702ZC-GC104T | |
| HP Omen 15-dc1020ng | |
| Asus ZenBook 15 UX533FD | |
| Asus ROG Zephyrus G15 GA502DU | |
| Rendering Single 32Bit | |
| Genomsnitt Intel Core i9-9980HK (7709 - 9734, n=4) | |
| Schenker XMG Ultra 15 Turing | |
| Eurocom Sky X4C | |
| HP Omen 15-dc1020ng | |
| Dell G5 15 5590 | |
| Asus ROG Zephyrus G15 GA502DU | |
| Asus GL702ZC-GC104T | |
| Asus ZenBook 15 UX533FD | |
| wPrime 2.10 - 1024m | |
| Asus ROG Zephyrus G15 GA502DU | |
| Eurocom Sky X4C | |
| Genomsnitt Intel Core i9-9980HK (110.4 - 120.2, n=2) | |
* ... mindre är bättre
| PCMark 8 Home Score Accelerated v2 | 3799 poäng | |
| PCMark 8 Work Score Accelerated v2 | 4762 poäng | |
| PCMark 10 Score | 5469 poäng | |
Hjälp | ||
| Dell XPS 15 7590 9980HK GTX 1650 Toshiba XG6 KXG60ZNV1T02 | Dell XPS 15 9570 Core i9 UHD Samsung SSD PM981 MZVLB1T0HALR | Asus ZenBook 15 UX533FD WDC PC SN520 SDAPNUW-512G | HP Spectre x360 15-df0126ng Toshiba XG5-P KXG50PNV2T04 | Gigabyte Aero 15 OLED XA Intel SSD 600p SSDPEKKW512G8L | |
|---|---|---|---|---|---|
| AS SSD | -4% | -22% | -45% | -4% | |
| Seq Read (MB/s) | 1723 | 1320 -23% | 579 -66% | 2018 17% | 2095 22% |
| Seq Write (MB/s) | 1386 | 1500 8% | 411.8 -70% | 773 -44% | 1464 6% |
| 4K Read (MB/s) | 43.25 | 30.73 -29% | 41.81 -3% | 24.62 -43% | 56.8 31% |
| 4K Write (MB/s) | 98.3 | 94.4 -4% | 131.6 34% | 92.8 -6% | 109.8 12% |
| 4K-64 Read (MB/s) | 1078 | 1453 35% | 975 -10% | 845 -22% | 871 -19% |
| 4K-64 Write (MB/s) | 1456 | 1815 25% | 1047 -28% | 957 -34% | 773 -47% |
| Access Time Read * (ms) | 0.05 | 0.061 -22% | 0.08 -60% | 0.147 -194% | 0.045 10% |
| Access Time Write * (ms) | 0.039 | 0.044 -13% | 0.027 31% | 0.057 -46% | 0.033 15% |
| Score Read (Points) | 1294 | 1616 25% | 1075 -17% | 1071 -17% | 1137 -12% |
| Score Write (Points) | 1693 | 2059 22% | 1220 -28% | 1127 -33% | 1029 -39% |
| Score Total (Points) | 3638 | 4507 24% | 2845 -22% | 2684 -26% | 2732 -25% |
| Copy ISO MB/s (MB/s) | 3182 | 2577 -19% | 1652 -48% | ||
| Copy Program MB/s (MB/s) | 984 | 515 -48% | 328.5 -67% | ||
| Copy Game MB/s (MB/s) | 1824 | 1120 -39% | 700 -62% |
* ... mindre är bättre

| 3DMark 11 Performance | 12340 poäng | |
| 3DMark Cloud Gate Standard Score | 30573 poäng | |
| 3DMark Fire Strike Score | 7356 poäng | |
| 3DMark Time Spy Score | 3676 poäng | |
Hjälp | ||
| Shadow of the Tomb Raider - 1920x1080 Highest Preset AA:T | |
| Alienware Area-51m i9-9900K RTX 2080 | |
| MSI GE75 9SG | |
| Razer Blade Pro 17 RTX 2060 | |
| Gigabyte Aero 15 OLED XA | |
| HP Pavilion Gaming 17-cd0085cl | |
| MSI GF75 Thin 9SC | |
| Genomsnitt NVIDIA GeForce GTX 1650 Mobile (34 - 47, n=15) | |
| Asus Zephyrus S GX531GM | |
| Asus G752VY | |
| Dell XPS 15 7590 9980HK GTX 1650 | |
| Asus TUF FX705GE-EW096T | |
| Rocket League - 1920x1080 High Quality AA:High FX | |
| Genomsnitt NVIDIA GeForce GTX 1650 Mobile (96.4 - 162.2, n=6) | |
| HP Spectre x360 15-df0126ng | |
| Asus GL703GE-ES73 | |
| Dell XPS 15 7590 9980HK GTX 1650 | |
| låg | med. | hög | ultra | 4K | |
|---|---|---|---|---|---|
| BioShock Infinite (2013) | 342.5 | 223.4 | 171.8 | 68.5 | |
| The Witcher 3 (2015) | 183.5 | 111.5 | 64.8 | 36 | |
| Rocket League (2017) | 248 | 152.5 | 96.4 | 41.1 | |
| Shadow of the Tomb Raider (2018) | 111 | 42 | 38 | 34 | 14 |
| Dell XPS 15 7590 9980HK GTX 1650 GeForce GTX 1650 Mobile, i9-9980HK, Toshiba XG6 KXG60ZNV1T02 | Dell XPS 15 9570 Core i9 UHD GeForce GTX 1050 Ti Max-Q, i9-8950HK, Samsung SSD PM981 MZVLB1T0HALR | Asus ZenBook 15 UX533FD GeForce GTX 1050 Max-Q, i7-8565U, WDC PC SN520 SDAPNUW-512G | HP Spectre x360 15-df0126ng GeForce GTX 1050 Ti Max-Q, i7-8750H, Toshiba XG5-P KXG50PNV2T04 | Gigabyte Aero 15 OLED XA GeForce RTX 2070 Max-Q, i7-9750H, Intel SSD 600p SSDPEKKW512G8L | Razer Blade 15 RTX 2080 Max-Q GeForce RTX 2080 Max-Q, i7-9750H, Samsung SSD PM981 MZVLB512HAJQ | |
|---|---|---|---|---|---|---|
| Noise | 3% | -1% | -1% | -17% | 5% | |
| av / miljö * (dB) | 28.2 | 28.2 -0% | 30.5 -8% | 30.4 -8% | 30 -6% | 28.3 -0% |
| Idle Minimum * (dB) | 28.2 | 28.5 -1% | 30.5 -8% | 30.4 -8% | 34 -21% | 28.8 -2% |
| Idle Average * (dB) | 28.2 | 28.6 -1% | 30.5 -8% | 30.4 -8% | 35 -24% | 28.8 -2% |
| Idle Maximum * (dB) | 30.4 | 28.8 5% | 30.5 -0% | 31.6 -4% | 45 -48% | 29 5% |
| Load Average * (dB) | 43.8 | 36.2 17% | 40.8 7% | 43.2 1% | 43 2% | 33.5 24% |
| Witcher 3 ultra * (dB) | 47.2 | 47.6 -1% | 52 -10% | 45 5% | ||
| Load Maximum * (dB) | 47.2 | 47.6 -1% | 41.8 11% | 38.3 19% | 54 -14% | 45.2 4% |
* ... mindre är bättre
Ljudnivå
| Låg belastning |
| 28.2 / 28.2 / 30.4 dB(A) |
| Hög belastning |
| 43.8 / 47.2 dB(A) |
 | ||
30 dB tyst 40 dB(A) hörbar 50 dB(A) högt ljud |
||
min: | ||
(-) Den maximala temperaturen på ovansidan är 50.4 °C / 123 F, jämfört med genomsnittet av 36.8 °C / 98 F , allt från 21 till 71 °C för klassen Multimedia.
(-) Botten värms upp till maximalt 49.2 °C / 121 F, jämfört med genomsnittet av 39.1 °C / 102 F
(+) Vid tomgångsbruk är medeltemperaturen för ovansidan 30.9 °C / 88 F, jämfört med enhetsgenomsnittet på 31.3 °C / ### class_avg_f### F.
(-) När du spelar The Witcher 3 är medeltemperaturen för ovansidan 39.4 °C / 103 F, jämfört med enhetsgenomsnittet på 31.3 °C / ## #class_avg_f### F.
(+) Handledsstöden och pekplattan är kallare än hudtemperaturen med maximalt 31.8 °C / 89.2 F och är därför svala att ta på.
(-) Medeltemperaturen för handledsstödsområdet på liknande enheter var 28.7 °C / 83.7 F (-3.1 °C / -5.5 F).
Dell XPS 15 7590 9980HK GTX 1650 ljudanalys
(+) | högtalare kan spela relativt högt (88.4 dB)
Bas 100 - 315 Hz
(-) | nästan ingen bas - i genomsnitt 24.9% lägre än medianen
(±) | linjäriteten för basen är genomsnittlig (14.4% delta till föregående frekvens)
Mellan 400 - 2000 Hz
(+) | balanserad mellan - endast 2.8% från medianen
(±) | linjäriteten för mids är genomsnittlig (7.8% delta till föregående frekvens)
Högsta 2 - 16 kHz
(+) | balanserade toppar - endast 1.9% från medianen
(+) | toppar är linjära (5.3% delta till föregående frekvens)
Totalt 100 - 16 000 Hz
(±) | linjäriteten för det totala ljudet är genomsnittlig (17.8% skillnad mot median)
Jämfört med samma klass
» 52% av alla testade enheter i den här klassen var bättre, 7% liknande, 41% sämre
» Den bästa hade ett delta på 5%, genomsnittet var 17%, sämst var 45%
Jämfört med alla testade enheter
» 36% av alla testade enheter var bättre, 8% liknande, 56% sämre
» Den bästa hade ett delta på 4%, genomsnittet var 24%, sämst var 134%
Apple MacBook 12 (Early 2016) 1.1 GHz ljudanalys
(+) | högtalare kan spela relativt högt (83.6 dB)
Bas 100 - 315 Hz
(±) | reducerad bas - i genomsnitt 11.3% lägre än medianen
(±) | linjäriteten för basen är genomsnittlig (14.2% delta till föregående frekvens)
Mellan 400 - 2000 Hz
(+) | balanserad mellan - endast 2.4% från medianen
(+) | mids är linjära (5.5% delta till föregående frekvens)
Högsta 2 - 16 kHz
(+) | balanserade toppar - endast 2% från medianen
(+) | toppar är linjära (4.5% delta till föregående frekvens)
Totalt 100 - 16 000 Hz
(+) | det totala ljudet är linjärt (10.2% skillnad mot median)
Jämfört med samma klass
» 7% av alla testade enheter i den här klassen var bättre, 2% liknande, 91% sämre
» Den bästa hade ett delta på 5%, genomsnittet var 18%, sämst var 53%
Jämfört med alla testade enheter
» 5% av alla testade enheter var bättre, 1% liknande, 94% sämre
» Den bästa hade ett delta på 4%, genomsnittet var 24%, sämst var 134%
| Av/Standby | |
| Låg belastning | |
| Hög belastning |
|
Förklaring:
min: | |
| Dell XPS 15 7590 9980HK GTX 1650 i9-9980HK, GeForce GTX 1650 Mobile, Toshiba XG6 KXG60ZNV1T02, OLED, 3840x2160, 15.6" | Dell XPS 15 9570 Core i9 UHD i9-8950HK, GeForce GTX 1050 Ti Max-Q, Samsung SSD PM981 MZVLB1T0HALR, IPS, 3840x2160, 15.6" | Asus ZenBook 15 UX533FD i7-8565U, GeForce GTX 1050 Max-Q, WDC PC SN520 SDAPNUW-512G, IPS, 1920x1080, 15.6" | HP Spectre x360 15-df0126ng i7-8750H, GeForce GTX 1050 Ti Max-Q, Toshiba XG5-P KXG50PNV2T04, IPS, 3840x2160, 15.6" | Gigabyte Aero 15 OLED XA i7-9750H, GeForce RTX 2070 Max-Q, Intel SSD 600p SSDPEKKW512G8L, OLED, 3840x2160, 15.6" | Razer Blade 15 RTX 2080 Max-Q i7-9750H, GeForce RTX 2080 Max-Q, Samsung SSD PM981 MZVLB512HAJQ, IPS, 1920x1080, 15.6" | MSI GF75 Thin 9SC i7-9750H, GeForce GTX 1650 Mobile, Crucial P1 SSD CT1000P1SSD8, IPS, 1920x1080, 17.3" | |
|---|---|---|---|---|---|---|---|
| Power Consumption | -6% | 37% | 34% | -101% | -46% | -13% | |
| Idle Minimum * (Watt) | 6.2 | 7.1 -15% | 2.7 56% | 2.1 66% | 23 -271% | 12.5 -102% | 6.1 2% |
| Idle Average * (Watt) | 9.6 | 13.6 -42% | 8 17% | 6.7 30% | 25 -160% | 15.3 -59% | 11.2 -17% |
| Idle Maximum * (Watt) | 21.2 | 14.1 33% | 10.6 50% | 11.4 46% | 33 -56% | 20.7 2% | 24.5 -16% |
| Load Average * (Watt) | 104.3 | 103.9 -0% | 74 29% | 77.7 26% | 96 8% | 90.2 14% | 94.7 9% |
| Witcher 3 ultra * (Watt) | 91.7 | 103 -12% | 168 -83% | 162 -77% | 105.8 -15% | ||
| Load Maximum * (Watt) | 135.3 | 130.9 3% | 89 34% | 131.5 3% | 197 -46% | 209.3 -55% | 192.2 -42% |
* ... mindre är bättre
| Dell XPS 15 7590 9980HK GTX 1650 i9-9980HK, GeForce GTX 1650 Mobile, 97 Wh | Dell XPS 15 9570 Core i9 UHD i9-8950HK, GeForce GTX 1050 Ti Max-Q, 97 Wh | Asus ZenBook 15 UX533FD i7-8565U, GeForce GTX 1050 Max-Q, 73 Wh | HP Spectre x360 15-df0126ng i7-8750H, GeForce GTX 1050 Ti Max-Q, 84 Wh | Gigabyte Aero 15 OLED XA i7-9750H, GeForce RTX 2070 Max-Q, 94.24 Wh | Razer Blade 15 RTX 2080 Max-Q i7-9750H, GeForce RTX 2080 Max-Q, 80 Wh | MSI GF75 Thin 9SC i7-9750H, GeForce GTX 1650 Mobile, 51 Wh | |
|---|---|---|---|---|---|---|---|
| Batteridrifttid | -20% | 25% | 2% | -29% | -19% | -40% | |
| Reader / Idle (h) | 15.2 | 15 -1% | 26.5 74% | 18.8 24% | 9.9 -35% | 15.9 5% | |
| WiFi v1.3 (h) | 7.8 | 8.6 10% | 8.7 12% | 8.8 13% | 5.7 -27% | 6.6 -15% | 4.7 -40% |
| Load (h) | 3.3 | 1 -70% | 2.9 -12% | 2.3 -30% | 2.5 -24% | 1.7 -48% |
För
Emot
Läs den fullständiga versionen av den här recensionen på engelska här.
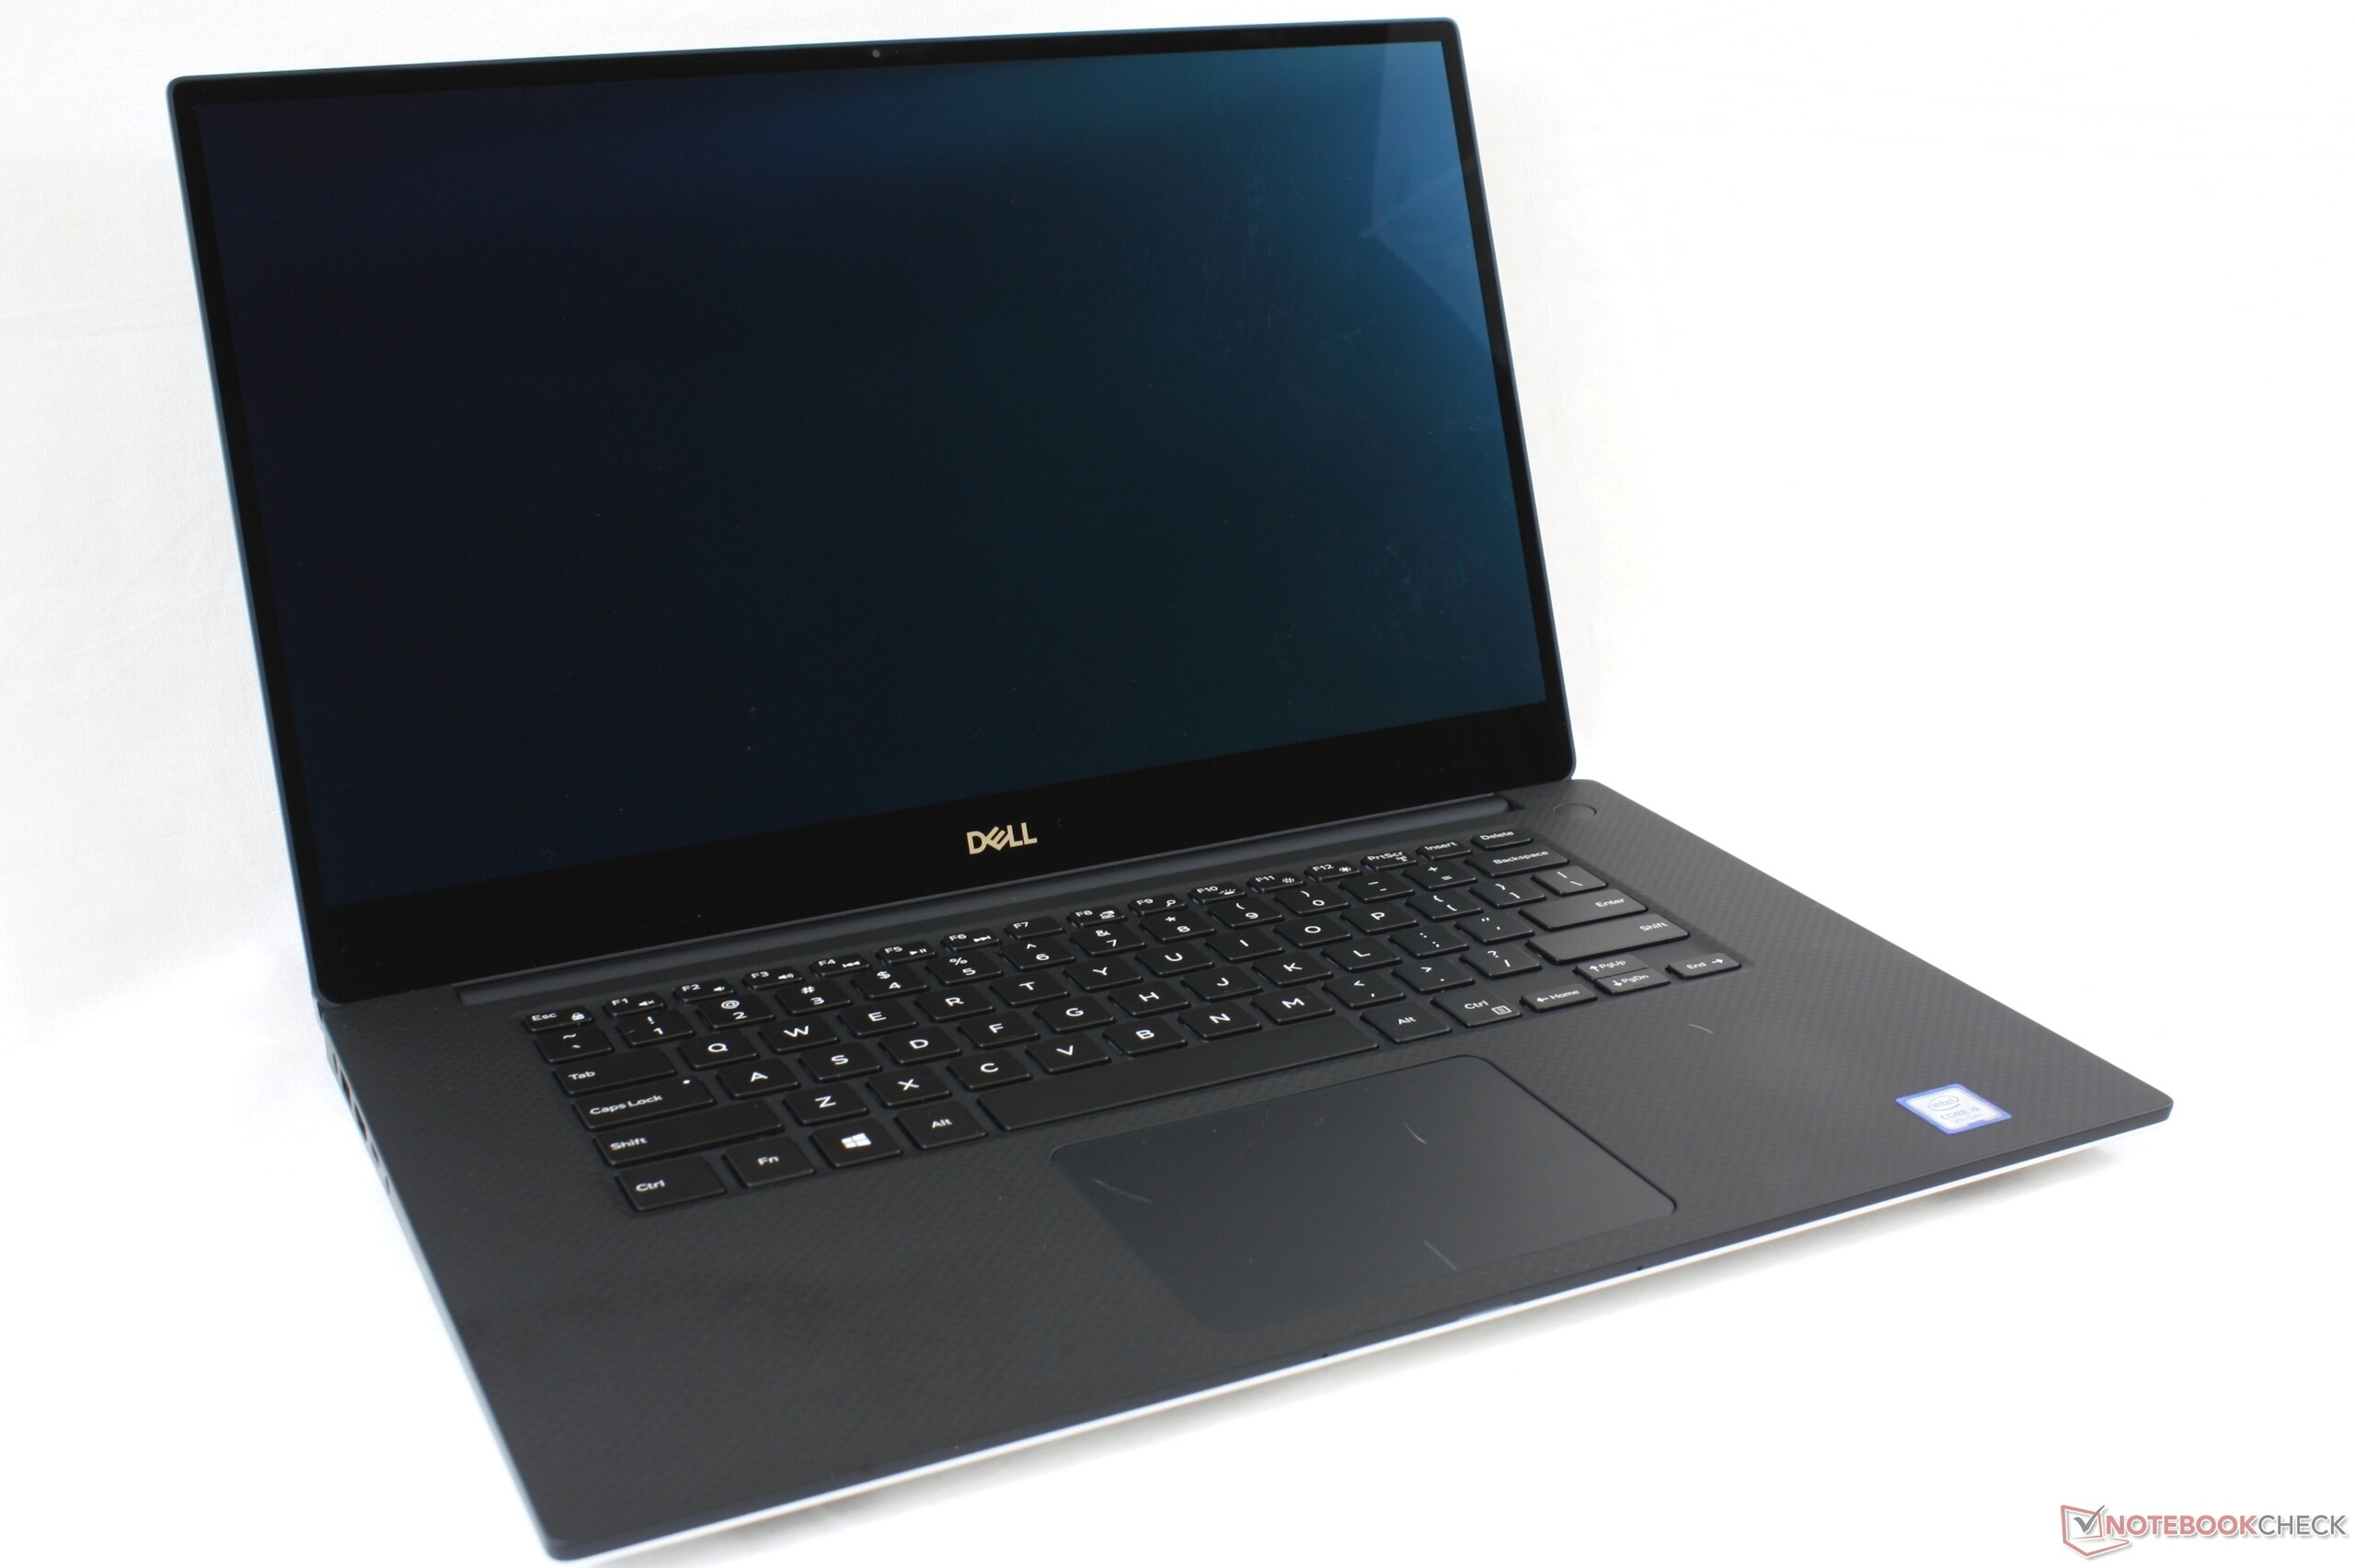
XPS 15 7590 med en Core i9-9980HK och ett GTX 1650 är den snabbaste versionen av XPS 15 hittills — något annat hade varit märkligt. Men det är å andra sidan också den långsammaste implementeringen av i9-9980HK och GTX 1650 som vi testat hittills på en laptop. Det finns en anledning till att man inte ser särskilt många Ultrabook-modeller med Core i9-processorer, för att inte tala om olåsta i9-processorer OCH GeForce GTX-grafikkort. Att pressa in så mycket prestanda i ett chassi av den här storleken kommer begränsa processorns fulla potential då den onekligen blir beroende av kyllösningen. Vi vet att samma Core i9 och GTX 1650 som sitter i XPS 15 är kapabla till att prestera mycket bättre baserat på vad vi uppmätt tidigare på större datorer med samma uppsättning av CPU och GPU.
Siffrorna känns logiska när man ser tillbaka på hur designen av XPS 15 har ändrats historiskt. Chassit utvecklades för nästan fem år sedan under Intel Skylakes dagar, långt innan Core i9 ens existerade. Core i9-processorerna är kända för sina väldigt höga Turbo Boost-klockfrekvenser som bara kan utnyttjas väl med en lämplig kyllösning. Om du inte kan upprätthålla de höga Turbo Boost-klockfrekvenserna kommer den generella prestandan inte vara särskilt mycket högre än på en vanlig Core i7. Dessa häftiga nya processorer prövar gränsen för vad det åldrande XPS 15-chassit klarar av.
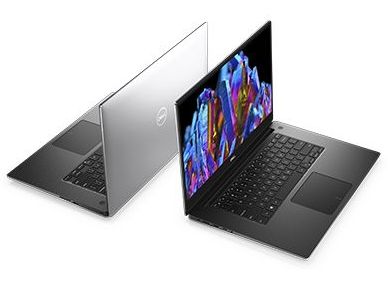
Trots skakiga resultat för både CPU och GeForce GTX så är XPS 15 fortfarande en av de mest välkända Ultrabook-modellerna på marknaden. Det är förvånande att den visuella designen har åldrats så väl i fråga om konstruktionskvalitet och estetik jämfört med nyare Ultrabook-modeller på 15.6 tum. Men om du vill ha bättre prestanda per krona och en mer balanserad maskin rekommenderar vi istället Core i7- eller Core i5-varianterna av XPS 15 7590.
Konfigurationen med Core i9-9980HK och GTX 1650 presterar bättre än förra årets konfiguration med Core i9-8950H och GTX 1050 Ti Max-Q, men skillnaderna är små och inte så stora som de kunde ha varit. Alternativet för en upplåst Core i9 fungerar helt enkelt inte särskilt bra i XPS 15:s nuvarande chassi. Den mest tilltalande egenskapen hos 7590-serien är inte uppgraderingen av CPU och GPU utan det nya OLED-alternativet.
Dell XPS 15 7590 9980HK GTX 1650
- 08/31/2022 v7 (old)
Allen Ngo
Price comparison
