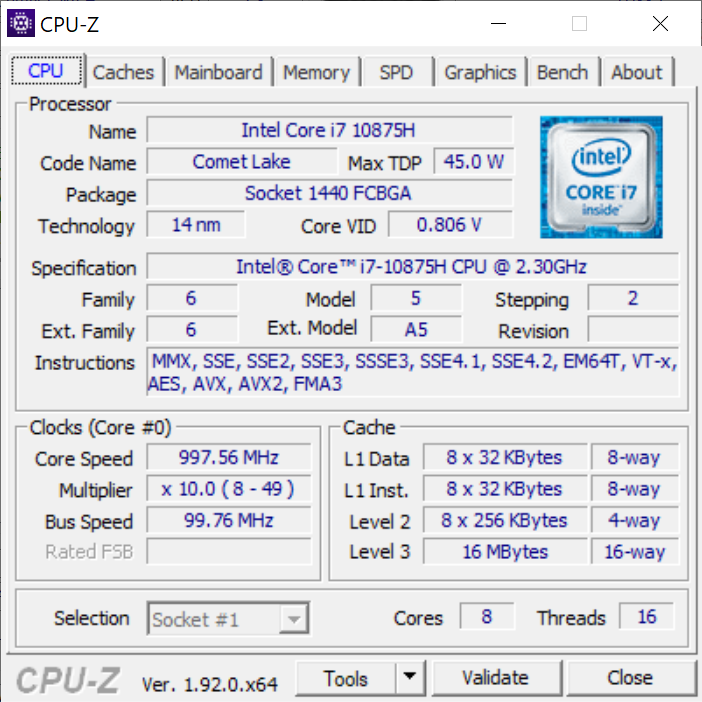
Test: Dell XPS 15 9500 Core i7 GeForce GTX 1650 Ti - Inget Core i9-nonsens (Sammanfattning)
Gradering | Datum | Modell | Vikt | Höjd | Storlek | Upplösning | Pris |
|---|---|---|---|---|---|---|---|
| 90.1 % v7 (old) | 06/2020 | Dell XPS 15 9500 Core i7 4K UHD i7-10875H, GeForce GTX 1650 Ti Mobile | 2 kg | 18 mm | 15.60" | 3840x2400 | |
| 86 % v7 (old) | 12/2019 | Lenovo Yoga C940-15IRH i7-9750H, GeForce GTX 1650 Max-Q | 2 kg | 19.7 mm | 15.60" | 1920x1080 | |
| 85.2 % v7 (old) | 03/2020 | Asus ZenBook 15 UX534FTC-A8190T i7-10510U, GeForce GTX 1650 Max-Q | 1.6 kg | 18.9 mm | 15.60" | 1920x1080 | |
| 85.2 % v7 (old) | 11/2019 | MSI Prestige 15 A10SC i7-10710U, GeForce GTX 1650 Max-Q | 1.7 kg | 16 mm | 15.60" | 3840x2160 | |
| 86.8 % v7 (old) | 06/2020 | Dell XPS 15 9500 Core i5 i5-10300H, UHD Graphics 630 | 1.8 kg | 18 mm | 15.60" | 1920x1200 | |
| 89.7 % v7 (old) | 12/2019 | Apple MacBook Pro 16 2019 i9 5500M i9-9880H, Radeon Pro 5500M | 2 kg | 16.2 mm | 16.00" | 3072x1920 |

| SD Card Reader | |
| average JPG Copy Test (av. of 3 runs) | |
| Dell XPS 15 9500 Core i7 4K UHD (Toshiba Exceria Pro SDXC 64 GB UHS-II) | |
| Dell XPS 15 7590 9980HK GTX 1650 (Toshiba Exceria Pro SDXC 64 GB UHS-II) | |
| MSI Prestige 15 A10SC (Toshiba Exceria Pro M501 UHS-II) | |
| Dell XPS 15 9575 i5-8305G (Toshiba Exceria Pro M501 UHS-II) | |
| maximum AS SSD Seq Read Test (1GB) | |
| Dell XPS 15 9575 i5-8305G (Toshiba Exceria Pro M501 UHS-II) | |
| Dell XPS 15 9500 Core i7 4K UHD (Toshiba Exceria Pro SDXC 64 GB UHS-II) | |
| MSI Prestige 15 A10SC (Toshiba Exceria Pro M501 UHS-II) | |
| Dell XPS 15 7590 9980HK GTX 1650 (Toshiba Exceria Pro SDXC 64 GB UHS-II) | |


| |||||||||||||||||||||||||
Distribution av ljusstyrkan: 91 %
Mitt på batteriet: 557.9 cd/m²
Kontrast: 1431:1 (Svärta: 0.39 cd/m²)
ΔE ColorChecker Calman: 4.54 | ∀{0.5-29.43 Ø4.73}
calibrated: 3.82
ΔE Greyscale Calman: 3.2 | ∀{0.09-98 Ø4.97}
100% sRGB (Argyll 1.6.3 3D)
89.5% AdobeRGB 1998 (Argyll 1.6.3 3D)
99.8% AdobeRGB 1998 (Argyll 3D)
100% sRGB (Argyll 3D)
89.7% Display P3 (Argyll 3D)
Gamma: 1.99
CCT: 6451 K
| Dell XPS 15 9500 Core i7 4K UHD Sharp LQ156R1, IPS, 15.6", 3840x2400 | Dell XPS 15 9500 Core i5 Sharp LQ156N1, IPS, 15.6", 1920x1200 | Lenovo Yoga C940-15IRH LG Philips LP156WFC-SPU1, IPS, 15.6", 1920x1080 | Asus ZenBook 15 UX534FTC-A8190T BOE CQ NV156FHM-N63, IPS, 15.6", 1920x1080 | MSI Prestige 15 A10SC Sharp LQ156D1JW42, IPS, 15.6", 3840x2160 | Apple MacBook Pro 16 2019 i9 5500M APPA044, IPS, 16", 3072x1920 | |
|---|---|---|---|---|---|---|
| Display | -10% | -25% | -26% | -5% | ||
| Display P3 Coverage (%) | 89.7 | 81.5 -9% | 61.5 -31% | 65 -28% | 82 -9% | |
| sRGB Coverage (%) | 100 | 100 0% | 92.7 -7% | 86.2 -14% | 98.3 -2% | |
| AdobeRGB 1998 Coverage (%) | 99.8 | 79.6 -20% | 63.6 -36% | 62.9 -37% | 96.2 -4% | |
| Response Times | 18% | 0% | 11% | -18% | -1% | |
| Response Time Grey 50% / Grey 80% * (ms) | 54 ? | 42 ? 22% | 48.4 ? 10% | 45 ? 17% | 60 ? -11% | 52.4 ? 3% |
| Response Time Black / White * (ms) | 33.2 ? | 28.8 ? 13% | 36.4 ? -10% | 32 ? 4% | 41.2 ? -24% | 34.9 ? -5% |
| PWM Frequency (Hz) | 26040 ? | 131700 | ||||
| Screen | 4% | -2% | -13% | 0% | 17% | |
| Brightness middle (cd/m²) | 557.9 | 592 6% | 484.8 -13% | 299 -46% | 464.5 -17% | 519 -7% |
| Brightness (cd/m²) | 541 | 565 4% | 463 -14% | 280 -48% | 451 -17% | 477 -12% |
| Brightness Distribution (%) | 91 | 85 -7% | 82 -10% | 89 -2% | 92 1% | 86 -5% |
| Black Level * (cd/m²) | 0.39 | 0.46 -18% | 0.26 33% | 0.21 46% | 0.5 -28% | 0.39 -0% |
| Contrast (:1) | 1431 | 1287 -10% | 1865 30% | 1424 0% | 929 -35% | 1331 -7% |
| Colorchecker dE 2000 * | 4.54 | 3.19 30% | 4.5 1% | 4.76 -5% | 3.36 26% | 2.28 50% |
| Colorchecker dE 2000 max. * | 7.92 | 5.45 31% | 7.55 5% | 9 -14% | 7.06 11% | 6.54 17% |
| Colorchecker dE 2000 calibrated * | 3.82 | 2.03 47% | 1.19 69% | 3.42 10% | 0.86 77% | |
| Greyscale dE 2000 * | 3.2 | 3.9 -22% | 5.7 -78% | 3.53 -10% | 1.3 59% | 0.9 72% |
| Gamma | 1.99 111% | 2.25 98% | 2.45 90% | 2.3 96% | 2.14 103% | 2145 0% |
| CCT | 6451 101% | 6522 100% | 6101 107% | 7228 90% | 6596 99% | 6572 99% |
| Color Space (Percent of AdobeRGB 1998) (%) | 89.5 | 71.6 -20% | 58.7 -34% | 56 -37% | 84.8 -5% | 78 -13% |
| Color Space (Percent of sRGB) (%) | 100 | 100 0% | 92.8 -7% | 86 -14% | 98.3 -2% | |
| Totalt genomsnitt (program/inställningar) | 4% /
3% | -9% /
-6% | -9% /
-13% | -8% /
-3% | 8% /
14% |
* ... mindre är bättre
Visa svarstider
| ↔ Svarstid svart till vitt | ||
|---|---|---|
| 33.2 ms ... stiga ↗ och falla ↘ kombinerat | ↗ 19.2 ms stiga | 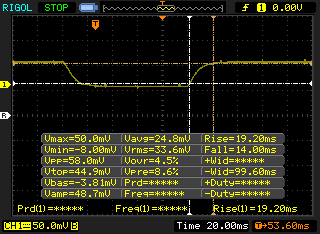 |
| ↘ 14 ms hösten | ||
| Skärmen visar långsamma svarsfrekvenser i våra tester och kommer att vara otillfredsställande för spelare. I jämförelse sträcker sig alla testade enheter från 0.1 (minst) till 240 (maximalt) ms. » 90 % av alla enheter är bättre. Detta innebär att den uppmätta svarstiden är sämre än genomsnittet av alla testade enheter (19.9 ms). | ||
| ↔ Svarstid 50 % grått till 80 % grått | ||
| 54 ms ... stiga ↗ och falla ↘ kombinerat | ↗ 26.4 ms stiga | 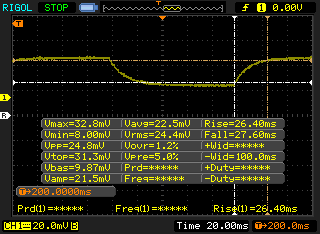 |
| ↘ 27.6 ms hösten | ||
| Skärmen visar långsamma svarsfrekvenser i våra tester och kommer att vara otillfredsställande för spelare. I jämförelse sträcker sig alla testade enheter från 0.165 (minst) till 636 (maximalt) ms. » 91 % av alla enheter är bättre. Detta innebär att den uppmätta svarstiden är sämre än genomsnittet av alla testade enheter (31.1 ms). | ||
Skärmflimmer / PWM (Puls-Width Modulation)
| Skärmflimmer / PWM upptäcktes inte | 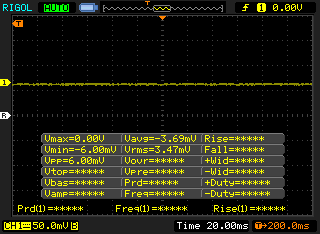 | ||
Som jämförelse: 52 % av alla testade enheter använder inte PWM för att dämpa skärmen. Om PWM upptäcktes mättes ett medelvärde av 7784 (minst: 5 - maximum: 343500) Hz. | |||
Cinebench R15: CPU Multi 64Bit | CPU Single 64Bit
Blender: v2.79 BMW27 CPU
7-Zip 18.03: 7z b 4 -mmt1 | 7z b 4
Geekbench 5.5: Single-Core | Multi-Core
HWBOT x265 Benchmark v2.2: 4k Preset
LibreOffice : 20 Documents To PDF
R Benchmark 2.5: Overall mean
| Cinebench R20 / CPU (Multi Core) | |
| Eluktronics RP-15 | |
| MSI GS66 Stealth 10SFS | |
| Genomsnitt Intel Core i7-10875H (1986 - 4176, n=32) | |
| Dell XPS 15 7590 9980HK GTX 1650 | |
| Dell XPS 15 9500 Core i7 4K UHD | |
| Apple MacBook Pro 15 2019 i9 Vega 16 | |
| Medion Erazer X15805 | |
| Razer Blade 15 RZ09-0328 | |
| Lenovo IdeaPad S740-15IRH | |
| Schenker Work 15 | |
| Dell XPS 15 9500 Core i5 | |
| MSI Alpha 15 A3DDK-034 | |
| Cinebench R20 / CPU (Single Core) | |
| Medion Erazer X15805 | |
| Dell XPS 15 9500 Core i7 4K UHD | |
| Eluktronics RP-15 | |
| Genomsnitt Intel Core i7-10875H (430 - 524, n=32) | |
| MSI GS66 Stealth 10SFS | |
| Razer Blade 15 RZ09-0328 | |
| Apple MacBook Pro 15 2019 i9 Vega 16 | |
| Lenovo IdeaPad S740-15IRH | |
| Dell XPS 15 7590 9980HK GTX 1650 | |
| Dell XPS 15 9500 Core i5 | |
| Schenker Work 15 | |
| MSI Alpha 15 A3DDK-034 | |
| Cinebench R15 / CPU Multi 64Bit | |
| Eluktronics RP-15 | |
| MSI GS66 Stealth 10SFS | |
| Dell XPS 15 7590 9980HK GTX 1650 | |
| Genomsnitt Intel Core i7-10875H (1003 - 1833, n=38) | |
| Dell XPS 15 9500 Core i7 4K UHD | |
| Apple MacBook Pro 15 2019 i9 Vega 16 | |
| Medion Erazer X15805 | |
| Razer Blade 15 RZ09-0328 | |
| Lenovo IdeaPad S740-15IRH | |
| Schenker Work 15 | |
| Dell XPS 15 9500 Core i5 | |
| MSI Alpha 15 A3DDK-034 | |
| Cinebench R15 / CPU Single 64Bit | |
| Dell XPS 15 9500 Core i7 4K UHD | |
| Genomsnitt Intel Core i7-10875H (190 - 220, n=37) | |
| Medion Erazer X15805 | |
| Dell XPS 15 7590 9980HK GTX 1650 | |
| MSI GS66 Stealth 10SFS | |
| Razer Blade 15 RZ09-0328 | |
| Lenovo IdeaPad S740-15IRH | |
| Eluktronics RP-15 | |
| Dell XPS 15 9500 Core i5 | |
| Apple MacBook Pro 15 2019 i9 Vega 16 | |
| Schenker Work 15 | |
| MSI Alpha 15 A3DDK-034 | |
| Blender / v2.79 BMW27 CPU | |
| Dell XPS 15 9500 Core i5 | |
| Schenker Work 15 | |
| Schenker Work 15 | |
| Razer Blade 15 RZ09-0328 | |
| Apple MacBook Pro 15 2019 i9 Vega 16 | |
| Dell XPS 15 9500 Core i7 4K UHD | |
| Genomsnitt Intel Core i7-10875H (259 - 535, n=30) | |
| MSI GS66 Stealth 10SFS | |
| Eluktronics RP-15 | |
| 7-Zip 18.03 / 7z b 4 -mmt1 | |
| Genomsnitt Intel Core i7-10875H (5071 - 5780, n=31) | |
| Dell XPS 15 9500 Core i7 4K UHD | |
| MSI GS66 Stealth 10SFS | |
| Razer Blade 15 RZ09-0328 | |
| Dell XPS 15 9500 Core i5 | |
| Eluktronics RP-15 | |
| Schenker Work 15 | |
| Schenker Work 15 | |
| 7-Zip 18.03 / 7z b 4 | |
| Eluktronics RP-15 | |
| MSI GS66 Stealth 10SFS | |
| Genomsnitt Intel Core i7-10875H (29844 - 49562, n=31) | |
| Dell XPS 15 9500 Core i7 4K UHD | |
| Razer Blade 15 RZ09-0328 | |
| Schenker Work 15 | |
| Schenker Work 15 | |
| Dell XPS 15 9500 Core i5 | |
| Geekbench 5.5 / Single-Core | |
| Dell XPS 15 9500 Core i7 4K UHD | |
| Genomsnitt Intel Core i7-10875H (1233 - 1371, n=29) | |
| MSI GS66 Stealth 10SFS | |
| Eluktronics RP-15 | |
| Dell XPS 15 9500 Core i5 | |
| Razer Blade 15 RZ09-0328 | |
| MSI Alpha 15 A3DDK-034 | |
| Geekbench 5.5 / Multi-Core | |
| Eluktronics RP-15 | |
| Dell XPS 15 9500 Core i7 4K UHD | |
| Genomsnitt Intel Core i7-10875H (5715 - 8620, n=29) | |
| MSI GS66 Stealth 10SFS | |
| Razer Blade 15 RZ09-0328 | |
| Dell XPS 15 9500 Core i5 | |
| MSI Alpha 15 A3DDK-034 | |
| HWBOT x265 Benchmark v2.2 / 4k Preset | |
| Eluktronics RP-15 | |
| MSI GS66 Stealth 10SFS | |
| Genomsnitt Intel Core i7-10875H (7.27 - 14.1, n=27) | |
| Dell XPS 15 9500 Core i7 4K UHD | |
| Razer Blade 15 RZ09-0328 | |
| Schenker Work 15 | |
| Schenker Work 15 | |
| Dell XPS 15 9500 Core i5 | |
| LibreOffice / 20 Documents To PDF | |
| Dell XPS 15 9500 Core i5 | |
| Eluktronics RP-15 | |
| Razer Blade 15 RZ09-0328 | |
| Dell XPS 15 9500 Core i7 4K UHD | |
| MSI GS66 Stealth 10SFS | |
| Genomsnitt Intel Core i7-10875H (30.2 - 84.3, n=30) | |
| R Benchmark 2.5 / Overall mean | |
| Dell XPS 15 9500 Core i5 | |
| MSI GS66 Stealth 10SFS | |
| Dell XPS 15 9500 Core i7 4K UHD | |
| Genomsnitt Intel Core i7-10875H (0.546 - 0.662, n=29) | |
| Eluktronics RP-15 | |
* ... mindre är bättre
| PCMark 8 Home Score Accelerated v2 | 3731 poäng | |
| PCMark 8 Work Score Accelerated v2 | 4540 poäng | |
| PCMark 10 Score | 5125 poäng | |
Hjälp | ||
| DPC Latencies / LatencyMon - interrupt to process latency (max), Web, Youtube, Prime95 | |
| Dell XPS 15 9500 Core i7 4K UHD | |
| MSI GS66 Stealth 10SFS | |
| Dell XPS 15 9500 Core i5 | |
| Eluktronics RP-15 | |
* ... mindre är bättre
| Dell XPS 15 9500 Core i7 4K UHD SK Hynix PC611 512GB | Dell XPS 15 7590 9980HK GTX 1650 Toshiba XG6 KXG60ZNV1T02 | Lenovo Yoga C940-15IRH Intel Optane Memory H10 with Solid State Storage 32GB + 512GB HBRPEKNX0202A(L/H) | Asus ZenBook 15 UX534FTC-A8190T Samsung SSD PM981 MZVLB1T0HALR | MSI Prestige 15 A10SC Samsung SSD PM981 MZVLB1T0HALR | Dell XPS 15 9500 Core i5 Toshiba KBG40ZNS256G NVMe | |
|---|---|---|---|---|---|---|
| AS SSD | 32% | -25% | 27% | 30% | -69% | |
| Seq Read (MB/s) | 2072 | 1723 -17% | 769 -63% | 2643 28% | 1274 -39% | 1423 -31% |
| Seq Write (MB/s) | 1486 | 1386 -7% | 351.1 -76% | 1533 3% | 1395 -6% | 766 -48% |
| 4K Read (MB/s) | 47.41 | 43.25 -9% | 69.1 46% | 49.12 4% | 50.3 6% | 42.21 -11% |
| 4K Write (MB/s) | 117.6 | 98.3 -16% | 100.9 -14% | 134.7 15% | 119.8 2% | 74.8 -36% |
| 4K-64 Read (MB/s) | 967 | 1078 11% | 472 -51% | 1028 6% | 1599 65% | 973 1% |
| 4K-64 Write (MB/s) | 715 | 1456 104% | 948 33% | 1353 89% | 1455 103% | 218.8 -69% |
| Access Time Read * (ms) | 0.057 | 0.05 12% | 0.071 -25% | 0.033 42% | 0.044 23% | 0.125 -119% |
| Access Time Write * (ms) | 0.096 | 0.039 59% | 0.137 -43% | 0.028 71% | 0.092 4% | 0.552 -475% |
| Score Read (Points) | 1222 | 1294 6% | 618 -49% | 1342 10% | 1777 45% | 1157 -5% |
| Score Write (Points) | 981 | 1693 73% | 1084 10% | 1641 67% | 1714 75% | 370 -62% |
| Score Total (Points) | 2809 | 3638 30% | 2024 -28% | 3622 29% | 4411 57% | 2094 -25% |
| Copy ISO MB/s (MB/s) | 1999 | 3182 59% | 839 -58% | 2226 11% | 2830 42% | 1151 -42% |
| Copy Program MB/s (MB/s) | 627 | 984 57% | 455.8 -27% | 506 -19% | 609 -3% | 499.4 -20% |
| Copy Game MB/s (MB/s) | 1001 | 1824 82% | 969 -3% | 1230 23% | 1424 42% | 733 -27% |
| CrystalDiskMark 5.2 / 6 | 1% | 2% | 8% | -13% | -23% | |
| Write 4K (MB/s) | 123.3 | 104.3 -15% | 102.2 -17% | 138.1 12% | 150.8 22% | 93.3 -24% |
| Read 4K (MB/s) | 41.85 | 45.23 8% | 114.3 173% | 45.89 10% | 47.3 13% | 45.9 10% |
| Write Seq (MB/s) | 2054 | 1729 -16% | 468.3 -77% | 2147 5% | 981 -52% | 1211 -41% |
| Read Seq (MB/s) | 1617 | 1861 15% | 1236 -24% | 2188 35% | 976 -40% | 1633 1% |
| Write 4K Q32T1 (MB/s) | 413 | 509 23% | 556 35% | 427.8 4% | 442.7 7% | 273.1 -34% |
| Read 4K Q32T1 (MB/s) | 377.5 | 388.5 3% | 421.6 12% | 404 7% | 499.7 32% | 356 -6% |
| Write Seq Q32T1 (MB/s) | 2705 | 2813 4% | 1264 -53% | 2396 -11% | 1706 -37% | 1198 -56% |
| Read Seq Q32T1 (MB/s) | 3442 | 2906 -16% | 2239 -35% | 3454 0% | 1758 -49% | 2269 -34% |
| Totalt genomsnitt (program/inställningar) | 17% /
20% | -12% /
-15% | 18% /
20% | 9% /
14% | -46% /
-52% |
* ... mindre är bättre

Diskstrypning: DiskSpd Read Loop, Queue Depth 8
| 3DMark | |
| 1920x1080 Fire Strike Graphics | |
| Eluktronics RP-15 | |
| Maingear Vector 15 | |
| MSI P65 8RF-451 - Creator | |
| Asus Zephyrus S GX531GM | |
| Dell XPS 15 9500 Core i7 4K UHD | |
| Gainward GeForce GTX 1650 4 GB | |
| Dell XPS 15 7590 9980HK GTX 1650 | |
| Lenovo IdeaPad S740-15IRH | |
| Dell XPS 15 9570 i7 UHD | |
| Dell XPS 15 9500 Core i5 | |
| 2560x1440 Time Spy Graphics | |
| Eluktronics RP-15 | |
| Maingear Vector 15 | |
| MSI P65 8RF-451 - Creator | |
| Asus Zephyrus S GX531GM | |
| Dell XPS 15 9500 Core i7 4K UHD | |
| Gainward GeForce GTX 1650 4 GB | |
| Dell XPS 15 7590 9980HK GTX 1650 | |
| Lenovo IdeaPad S740-15IRH | |
| Dell XPS 15 9570 i7 UHD | |
| Dell XPS 15 9500 Core i5 | |
| 2560x1440 Time Spy Score | |
| Eluktronics RP-15 | |
| Maingear Vector 15 | |
| MSI P65 8RF-451 - Creator | |
| Gainward GeForce GTX 1650 4 GB | |
| Asus Zephyrus S GX531GM | |
| Dell XPS 15 9500 Core i7 4K UHD | |
| Dell XPS 15 7590 9980HK GTX 1650 | |
| Lenovo IdeaPad S740-15IRH | |
| Dell XPS 15 9570 i7 UHD | |
| Dell XPS 15 9500 Core i5 | |
| 3DMark 11 | |
| 1280x720 Performance GPU | |
| Eluktronics RP-15 | |
| Maingear Vector 15 | |
| MSI P65 8RF-451 - Creator | |
| Gainward GeForce GTX 1650 4 GB | |
| Dell XPS 15 9500 Core i7 4K UHD | |
| Asus Zephyrus S GX531GM | |
| Dell XPS 15 7590 9980HK GTX 1650 | |
| Lenovo IdeaPad S740-15IRH | |
| Dell XPS 15 9570 i7 UHD | |
| Dell XPS 15 9500 Core i5 | |
| 1280x720 Performance Combined | |
| Eluktronics RP-15 | |
| Dell XPS 15 9500 Core i7 4K UHD | |
| Maingear Vector 15 | |
| Gainward GeForce GTX 1650 4 GB | |
| Lenovo IdeaPad S740-15IRH | |
| Dell XPS 15 9570 i7 UHD | |
| MSI P65 8RF-451 - Creator | |
| Dell XPS 15 7590 9980HK GTX 1650 | |
| Asus Zephyrus S GX531GM | |
| Dell XPS 15 9500 Core i5 | |
| 3DMark 06 Standard Score | 39720 poäng | |
| 3DMark Vantage P Result | 43517 poäng | |
| 3DMark 11 Performance | 13331 poäng | |
| 3DMark Cloud Gate Standard Score | 20269 poäng | |
| 3DMark Fire Strike Score | 9222 poäng | |
| 3DMark Time Spy Score | 3774 poäng | |
Hjälp | ||
| låg | med. | hög | ultra | 4K | |
|---|---|---|---|---|---|
| The Witcher 3 (2015) | 209.9 | 100.8 | 65.6 | 38.1 | |
| Dota 2 Reborn (2015) | 150 | 139 | 130 | 120 | 51.8 |
| X-Plane 11.11 (2018) | 109 | 78.2 | 63.3 | 45.8 | |
| Shadow of the Tomb Raider (2018) | 139 | 62 | 57 | 48 | |
| Assassin´s Creed Odyssey (2018) | 86 | 60 | 42 | 25 | |
| Apex Legends (2019) | 144 | 91 | 84 | 74 | |
| Far Cry New Dawn (2019) | 73 | 57 | 58 | 51 | |
| Metro Exodus (2019) | 91.6 | 48.7 | 35.9 | 27.9 | |
| Dirt Rally 2.0 (2019) | 247.3 | 92.7 | 74.6 | 44.8 | |
| The Division 2 (2019) | 115 | 56 | 47 | 35 | |
| Anno 1800 (2019) | 68.4 | 64.5 | 49.1 | 27.6 | |
| Total War: Three Kingdoms (2019) | 190.2 | 59.1 | 40.8 | 27.2 | |
| F1 2019 (2019) | 206 | 105 | 89 | 76 | |
| Borderlands 3 (2019) | 128.3 | 59.9 | 38.5 | 29.3 | |
| Ghost Recon Breakpoint (2019) | 72 | 53 | 47 | 31 | |
| GRID 2019 (2019) | 103.8 | 70.7 | 64.1 | 27.3 | |
| Need for Speed Heat (2019) | 60.4 | 43.3 | 39 | 37.3 | |
| Star Wars Jedi Fallen Order (2019) | 44.1 | 41.5 | 40.7 | ||
| Escape from Tarkov (2020) | 120.5 | 89.7 | 60.4 | 73 | |
| Hunt Showdown (2020) | 150 | 58.5 | 47.5 | ||
| Doom Eternal (2020) | 149.5 | 90.7 | 66.6 |
| Dell XPS 15 9500 Core i7 4K UHD GeForce GTX 1650 Ti Mobile, i7-10875H, SK Hynix PC611 512GB | Dell XPS 15 7590 9980HK GTX 1650 GeForce GTX 1650 Mobile, i9-9980HK, Toshiba XG6 KXG60ZNV1T02 | Lenovo Yoga C940-15IRH GeForce GTX 1650 Max-Q, i7-9750H, Intel Optane Memory H10 with Solid State Storage 32GB + 512GB HBRPEKNX0202A(L/H) | Asus ZenBook 15 UX534FTC-A8190T GeForce GTX 1650 Max-Q, i7-10510U, Samsung SSD PM981 MZVLB1T0HALR | MSI Prestige 15 A10SC GeForce GTX 1650 Max-Q, i7-10710U, Samsung SSD PM981 MZVLB1T0HALR | Dell XPS 15 9500 Core i5 UHD Graphics 630, i5-10300H, Toshiba KBG40ZNS256G NVMe | |
|---|---|---|---|---|---|---|
| Noise | -2% | -0% | 4% | 3% | 9% | |
| av / miljö * (dB) | 28.4 | 28.2 1% | 28.7 -1% | 30.3 -7% | 29.3 -3% | 28 1% |
| Idle Minimum * (dB) | 28.4 | 28.2 1% | 28.7 -1% | 30.3 -7% | 30.1 -6% | 28 1% |
| Idle Average * (dB) | 28.4 | 28.2 1% | 28.8 -1% | 30.3 -7% | 30.2 -6% | 28 1% |
| Idle Maximum * (dB) | 28.4 | 30.4 -7% | 28.8 -1% | 30.9 -9% | 30.2 -6% | 28 1% |
| Load Average * (dB) | 46 | 43.8 5% | 45 2% | 31.3 32% | 31.5 32% | 28 39% |
| Witcher 3 ultra * (dB) | 42 | 47.2 -12% | 44.7 -6% | 38.1 9% | 37 12% | |
| Load Maximum * (dB) | 47.1 | 47.2 -0% | 44.7 5% | 38.2 19% | 47 -0% | 41.9 11% |
* ... mindre är bättre
Ljudnivå
| Låg belastning |
| 28.4 / 28.4 / 28.4 dB(A) |
| Hög belastning |
| 46 / 47.1 dB(A) |
 | ||
30 dB tyst 40 dB(A) hörbar 50 dB(A) högt ljud |
||
min: | ||
(±) Den maximala temperaturen på ovansidan är 44 °C / 111 F, jämfört med genomsnittet av 36.8 °C / 98 F , allt från 21 till 71 °C för klassen Multimedia.
(-) Botten värms upp till maximalt 48.8 °C / 120 F, jämfört med genomsnittet av 39.1 °C / 102 F
(+) Vid tomgångsbruk är medeltemperaturen för ovansidan 30.5 °C / 87 F, jämfört med enhetsgenomsnittet på 31.3 °C / ### class_avg_f### F.
(-) När du spelar The Witcher 3 är medeltemperaturen för ovansidan 38.9 °C / 102 F, jämfört med enhetsgenomsnittet på 31.3 °C / ## #class_avg_f### F.
(+) Handledsstöden och pekplattan når maximal hudtemperatur (34.4 °C / 93.9 F) och är därför inte varma.
(-) Medeltemperaturen för handledsstödsområdet på liknande enheter var 28.7 °C / 83.7 F (-5.7 °C / -10.2 F).
| Av/Standby | |
| Låg belastning | |
| Hög belastning |
|
Förklaring:
min: | |
| Dell XPS 15 9500 Core i7 4K UHD i7-10875H, GeForce GTX 1650 Ti Mobile, SK Hynix PC611 512GB, IPS, 3840x2400, 15.6" | Dell XPS 15 7590 9980HK GTX 1650 i9-9980HK, GeForce GTX 1650 Mobile, Toshiba XG6 KXG60ZNV1T02, OLED, 3840x2160, 15.6" | Lenovo Yoga C940-15IRH i7-9750H, GeForce GTX 1650 Max-Q, Intel Optane Memory H10 with Solid State Storage 32GB + 512GB HBRPEKNX0202A(L/H), IPS, 1920x1080, 15.6" | Asus ZenBook 15 UX534FTC-A8190T i7-10510U, GeForce GTX 1650 Max-Q, Samsung SSD PM981 MZVLB1T0HALR, IPS, 1920x1080, 15.6" | MSI Prestige 15 A10SC i7-10710U, GeForce GTX 1650 Max-Q, Samsung SSD PM981 MZVLB1T0HALR, IPS, 3840x2160, 15.6" | Dell XPS 15 9500 Core i5 i5-10300H, UHD Graphics 630, Toshiba KBG40ZNS256G NVMe, IPS, 1920x1200, 15.6" | |
|---|---|---|---|---|---|---|
| Power Consumption | 4% | 6% | 41% | 14% | 49% | |
| Idle Minimum * (Watt) | 5.7 | 6.2 -9% | 5.2 9% | 2.8 51% | 6.1 -7% | 2.9 49% |
| Idle Average * (Watt) | 13.5 | 9.6 29% | 10.7 21% | 7.7 43% | 13.2 2% | 7.6 44% |
| Idle Maximum * (Watt) | 19.6 | 21.2 -8% | 24.3 -24% | 9.4 52% | 19.2 2% | 8 59% |
| Load Average * (Watt) | 114.1 | 104.3 9% | 84.4 26% | 57 50% | 75 34% | 41.7 63% |
| Witcher 3 ultra * (Watt) | 93 | 91.7 1% | 83.9 10% | 62 33% | 74 20% | |
| Load Maximum * (Watt) | 135.2 | 135.3 -0% | 142.8 -6% | 116 14% | 89.7 34% | 94.8 30% |
* ... mindre är bättre
| Dell XPS 15 9500 Core i7 4K UHD i7-10875H, GeForce GTX 1650 Ti Mobile, 86 Wh | Dell XPS 15 7590 9980HK GTX 1650 i9-9980HK, GeForce GTX 1650 Mobile, 97 Wh | Lenovo Yoga C940-15IRH i7-9750H, GeForce GTX 1650 Max-Q, 69 Wh | Asus ZenBook 15 UX534FTC-A8190T i7-10510U, GeForce GTX 1650 Max-Q, 71 Wh | MSI Prestige 15 A10SC i7-10710U, GeForce GTX 1650 Max-Q, 82 Wh | Dell XPS 15 9575 i5-8305G i5-8305G, Vega M GL / 870, 75 Wh | Dell XPS 15 9500 Core i5 i5-10300H, UHD Graphics 630, 56 Wh | |
|---|---|---|---|---|---|---|---|
| Batteridrifttid | 6% | -21% | 25% | -9% | -28% | -1% | |
| Reader / Idle (h) | 23 | 15.2 -34% | 18.2 -21% | 27.2 18% | 19.1 -17% | 11.1 -52% | 26.4 15% |
| WiFi v1.3 (h) | 9.1 | 7.8 -14% | 9.7 7% | 12.4 36% | 7.6 -16% | 9.4 3% | 9.3 2% |
| Load (h) | 2 | 3.3 65% | 1 -50% | 2.4 20% | 2.1 5% | 1.3 -35% | 1.6 -20% |
För
Emot
Läs den fullständiga versionen av den här recensionen på engelska här.
XPS 15 9500 med en Core i7-10875H och GTX 1650 Ti-grafik är tänkt att ersätta förra årets XPS 15 med Core i9-9980HK och GTX 1650-grafik. Prestandamässigt är den nyare modellen en aning snabbare utan att för den sakens skull bli varmare eller låta mer. Men den som hoppades på en tystare eller svalare upplevelse får hålla tillbaka sina förväntningar för både energiförbrukningen och ljudnivån ligger på ungefär samma nivå som på förra generationen.
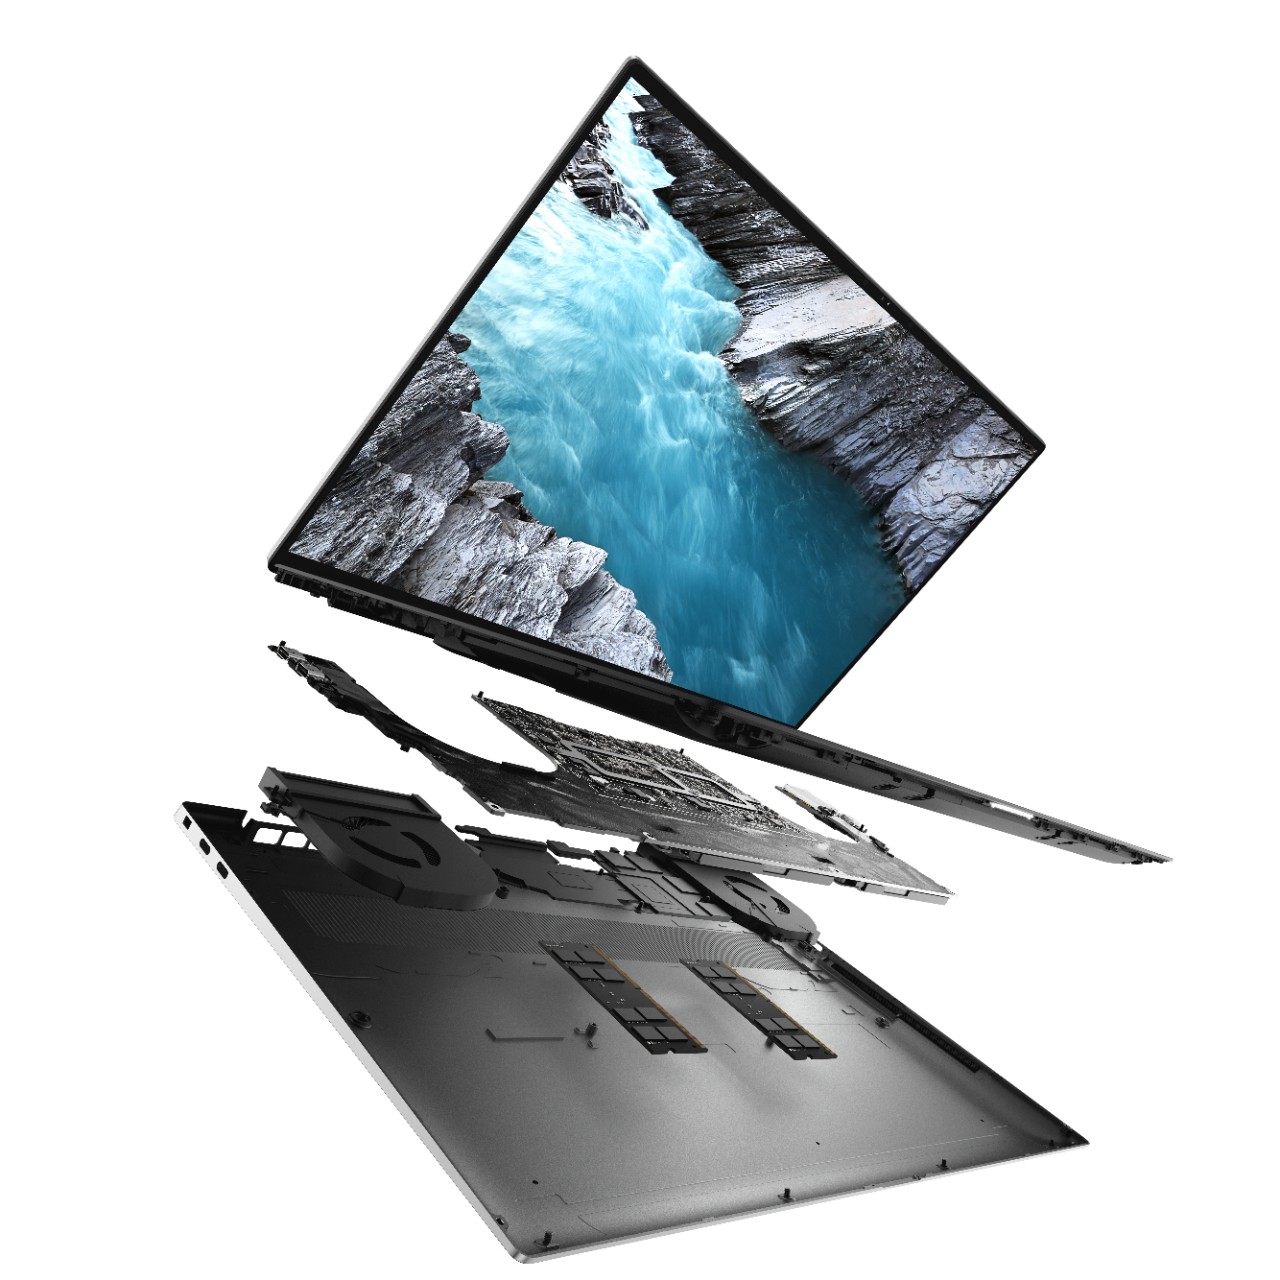
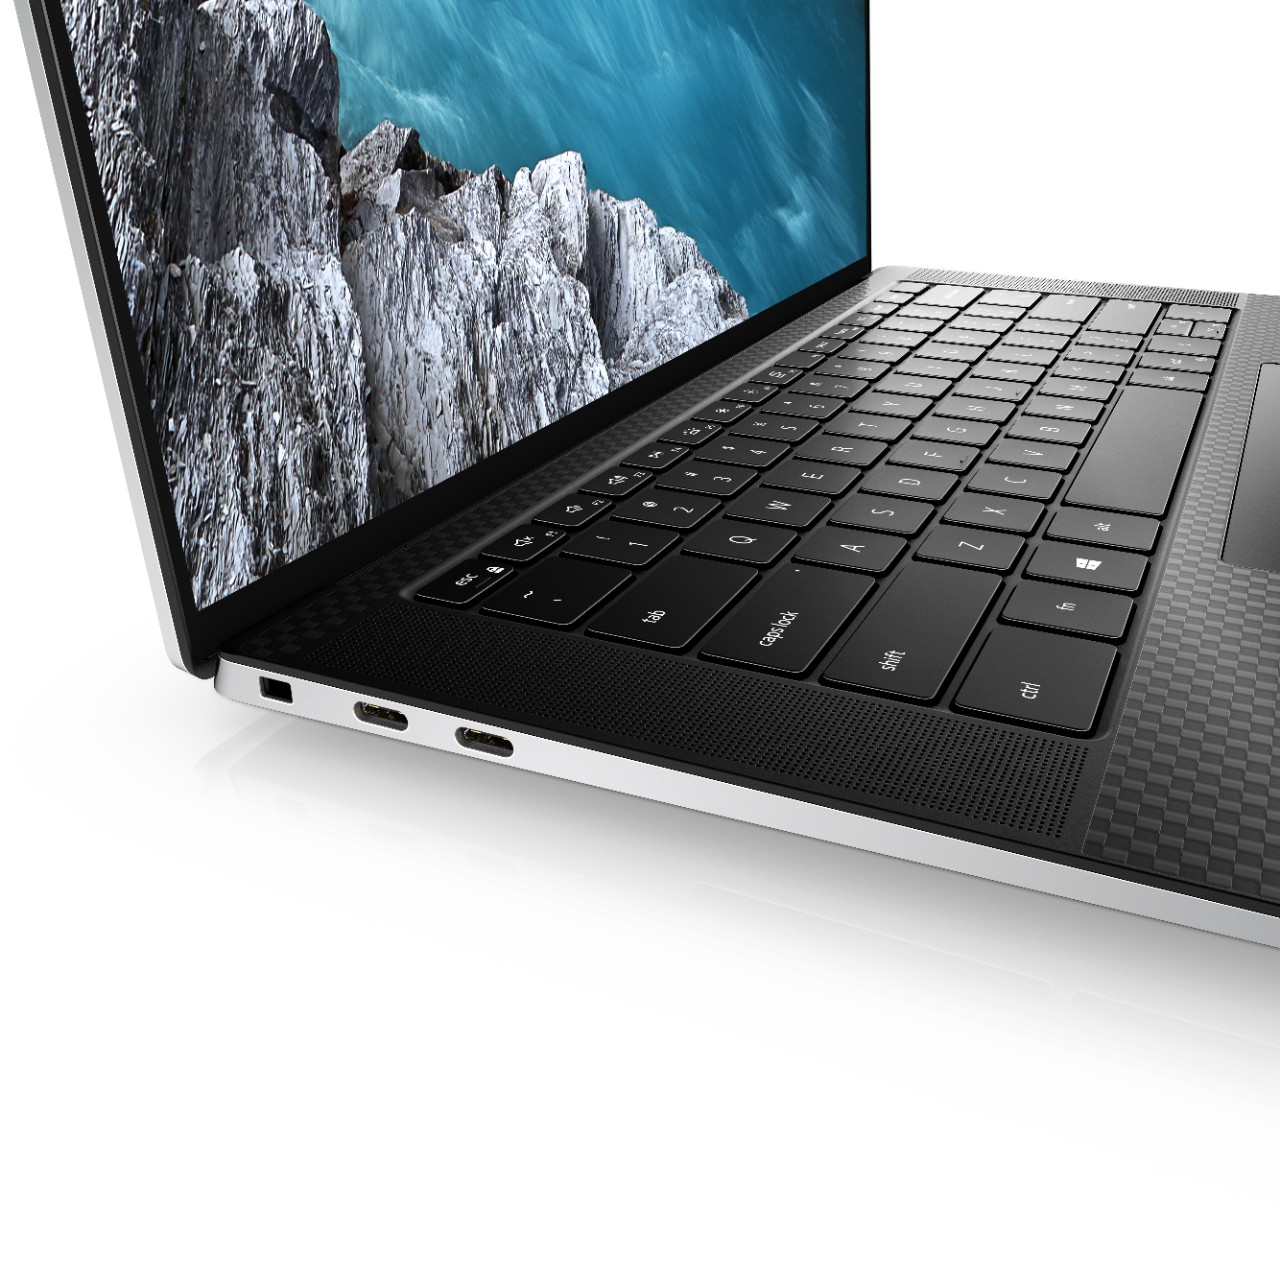
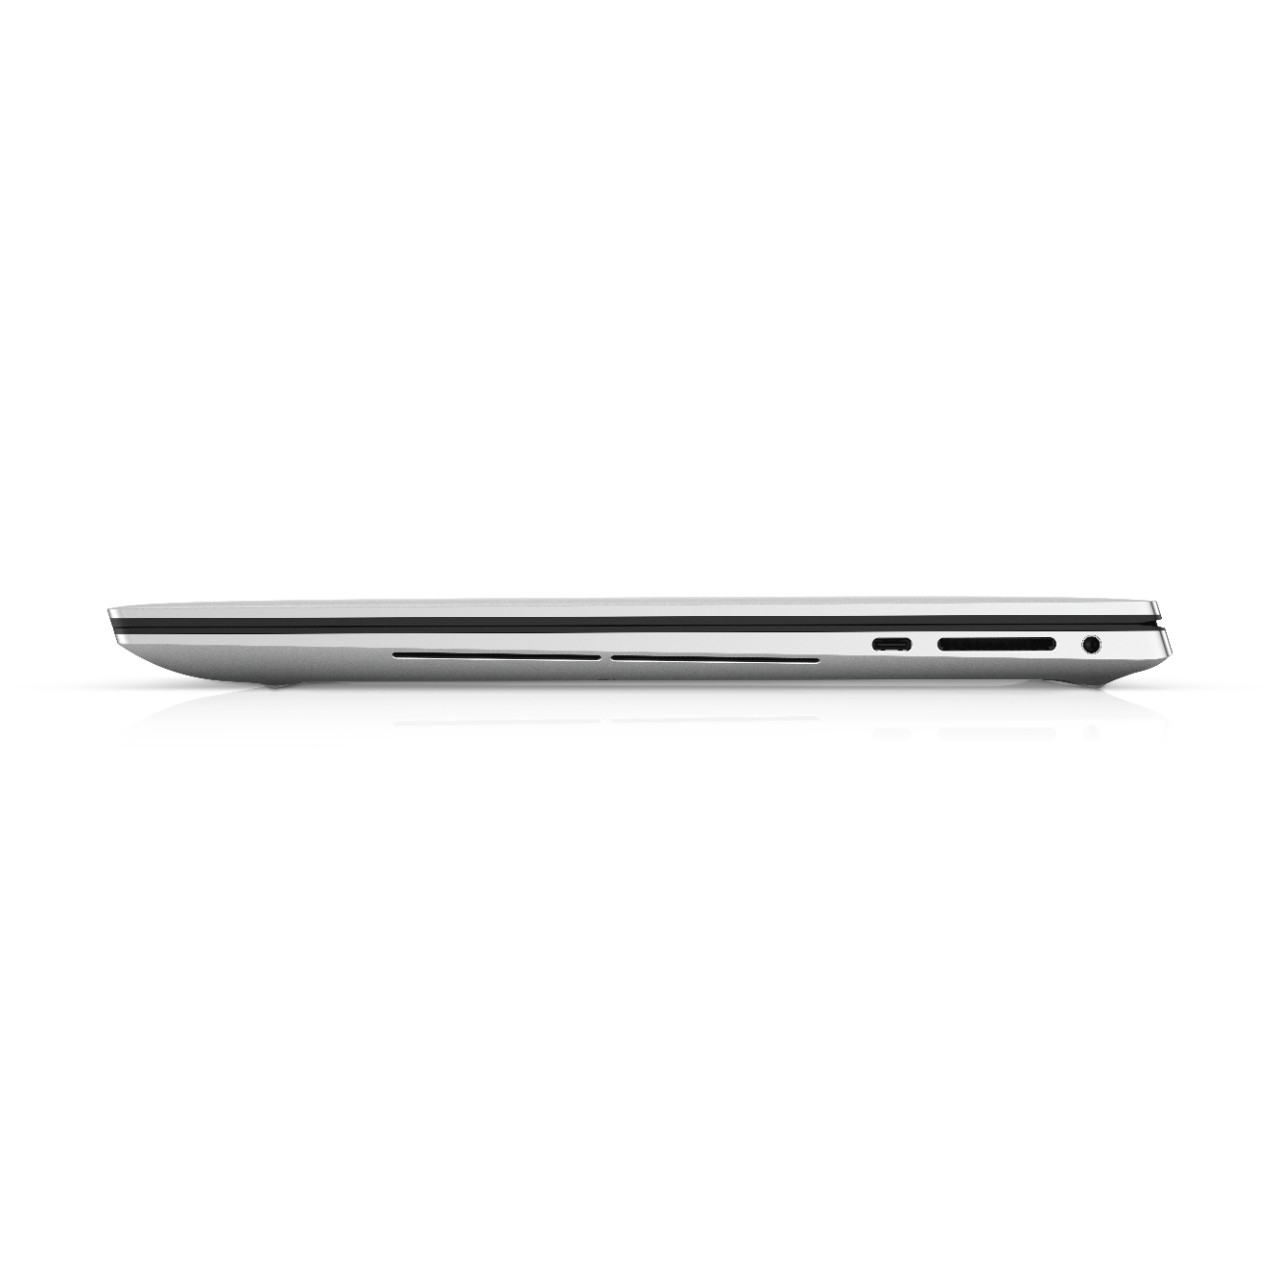
Den största anledningen att välja XPS 15 9500 framför den äldre XPS 15 7590 är 16:10-skärmen, för det är en förändring som märks omedelbart och är riktigt praktisk för användaren jämfört med de små uppgraderingarna av CPU- och GPU-prestanda. Övriga fysiska förändringar som mindre dimensioner, en större klickplatta, förbättrat ljud och bättre tangentbordsåterkoppling bidrar också till att göra den nyare modellen mycket bättre än 2019 års modell. Det största problemet vi har med den är att den förlitar sig för mycket på USB Typ C samt att GPU:n kunde varit bättre på att upprätthålla prestandan när man spelar. Som tur är kan det förstnämnda åtgärdas med adaptrar, och bryr man sig om det sistnämnda finns det många andra alternativ, hela vägen från Alienware till MSI, som har stabilare och ofta också högre GPU-prestanda.
2016 års XPS 15 var katalysatorn för trenden med tunt infattade Ultrabook-modeller och 2020 års XPS 15 kommer troligen göra samma sak med 16:10-skärmar. Bara detta får XPS 15 9500 att stå ut jämfört med andra Core H-drivna Ultrabook-modeller, detta i betydligt större utsträckning än någon processorskillnad du kan hitta.
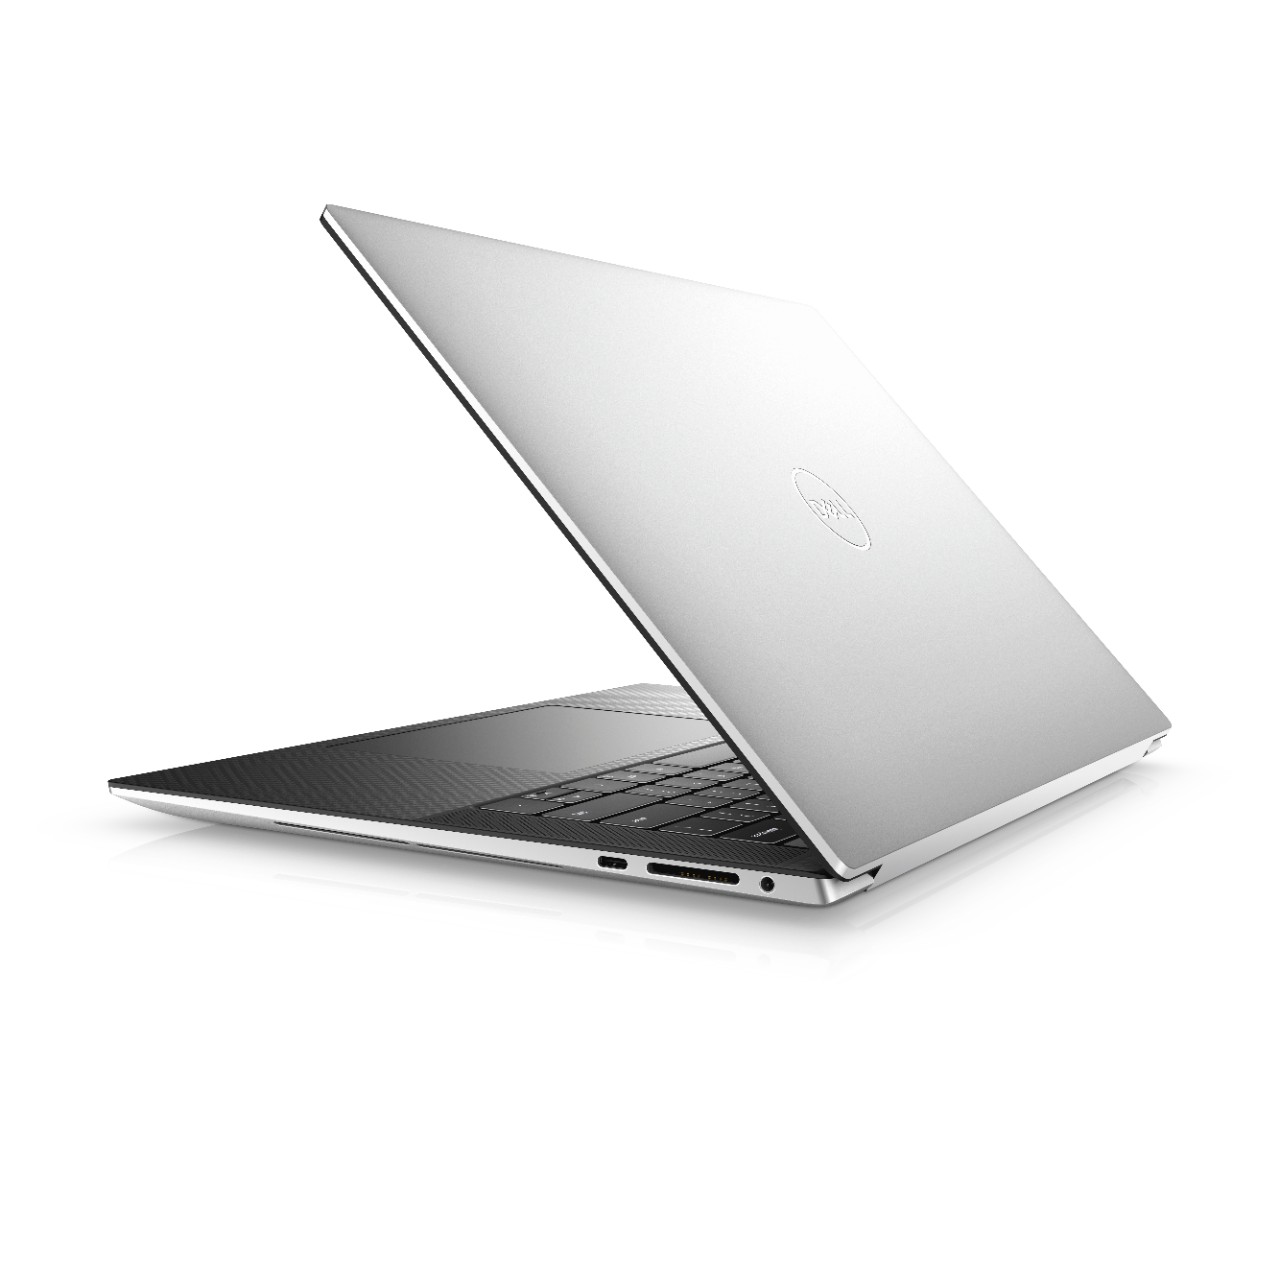
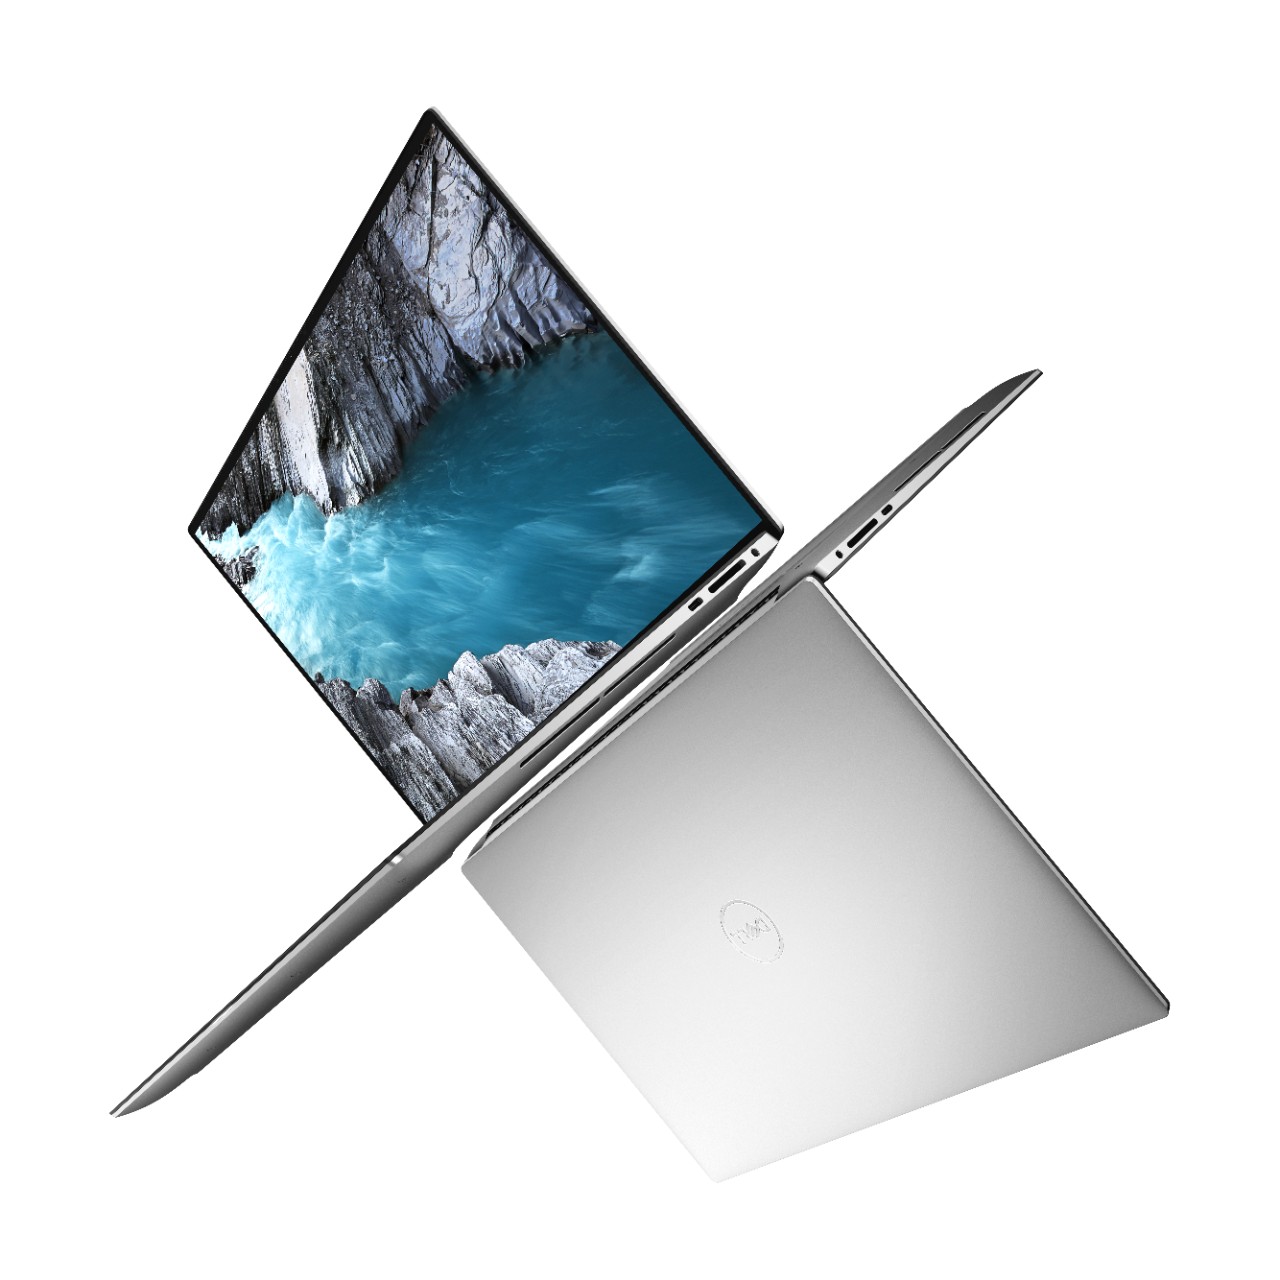
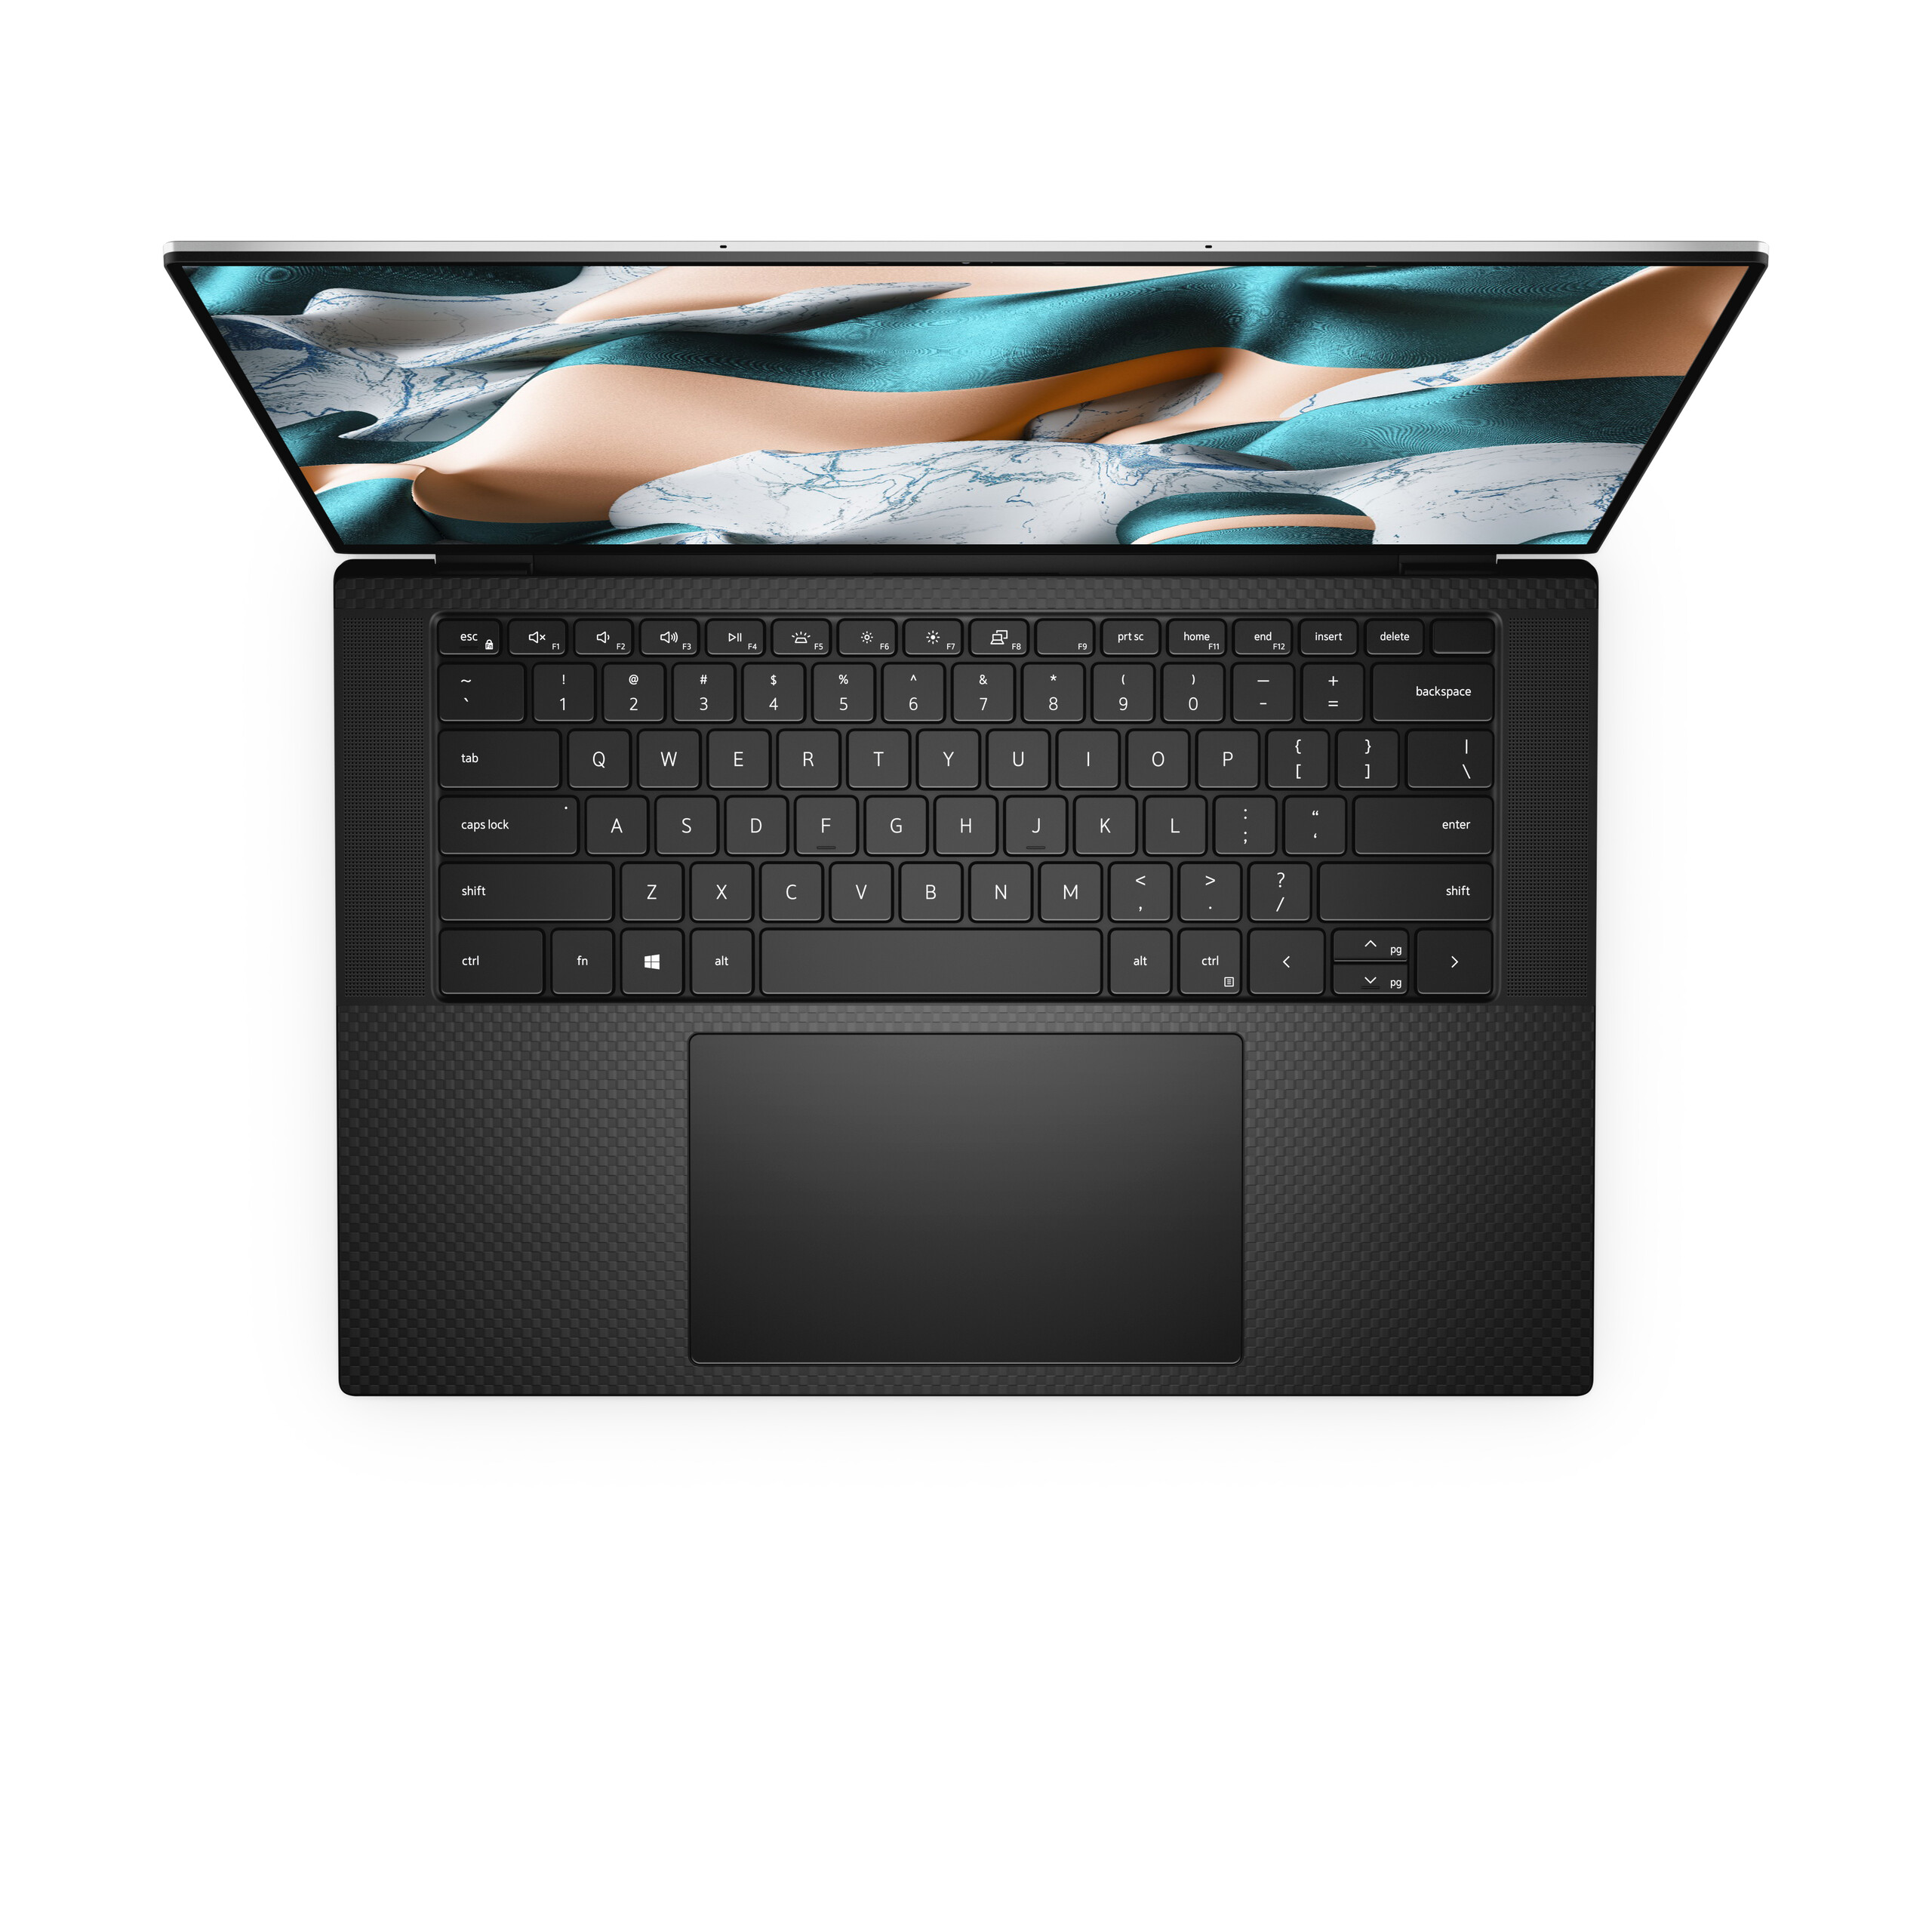
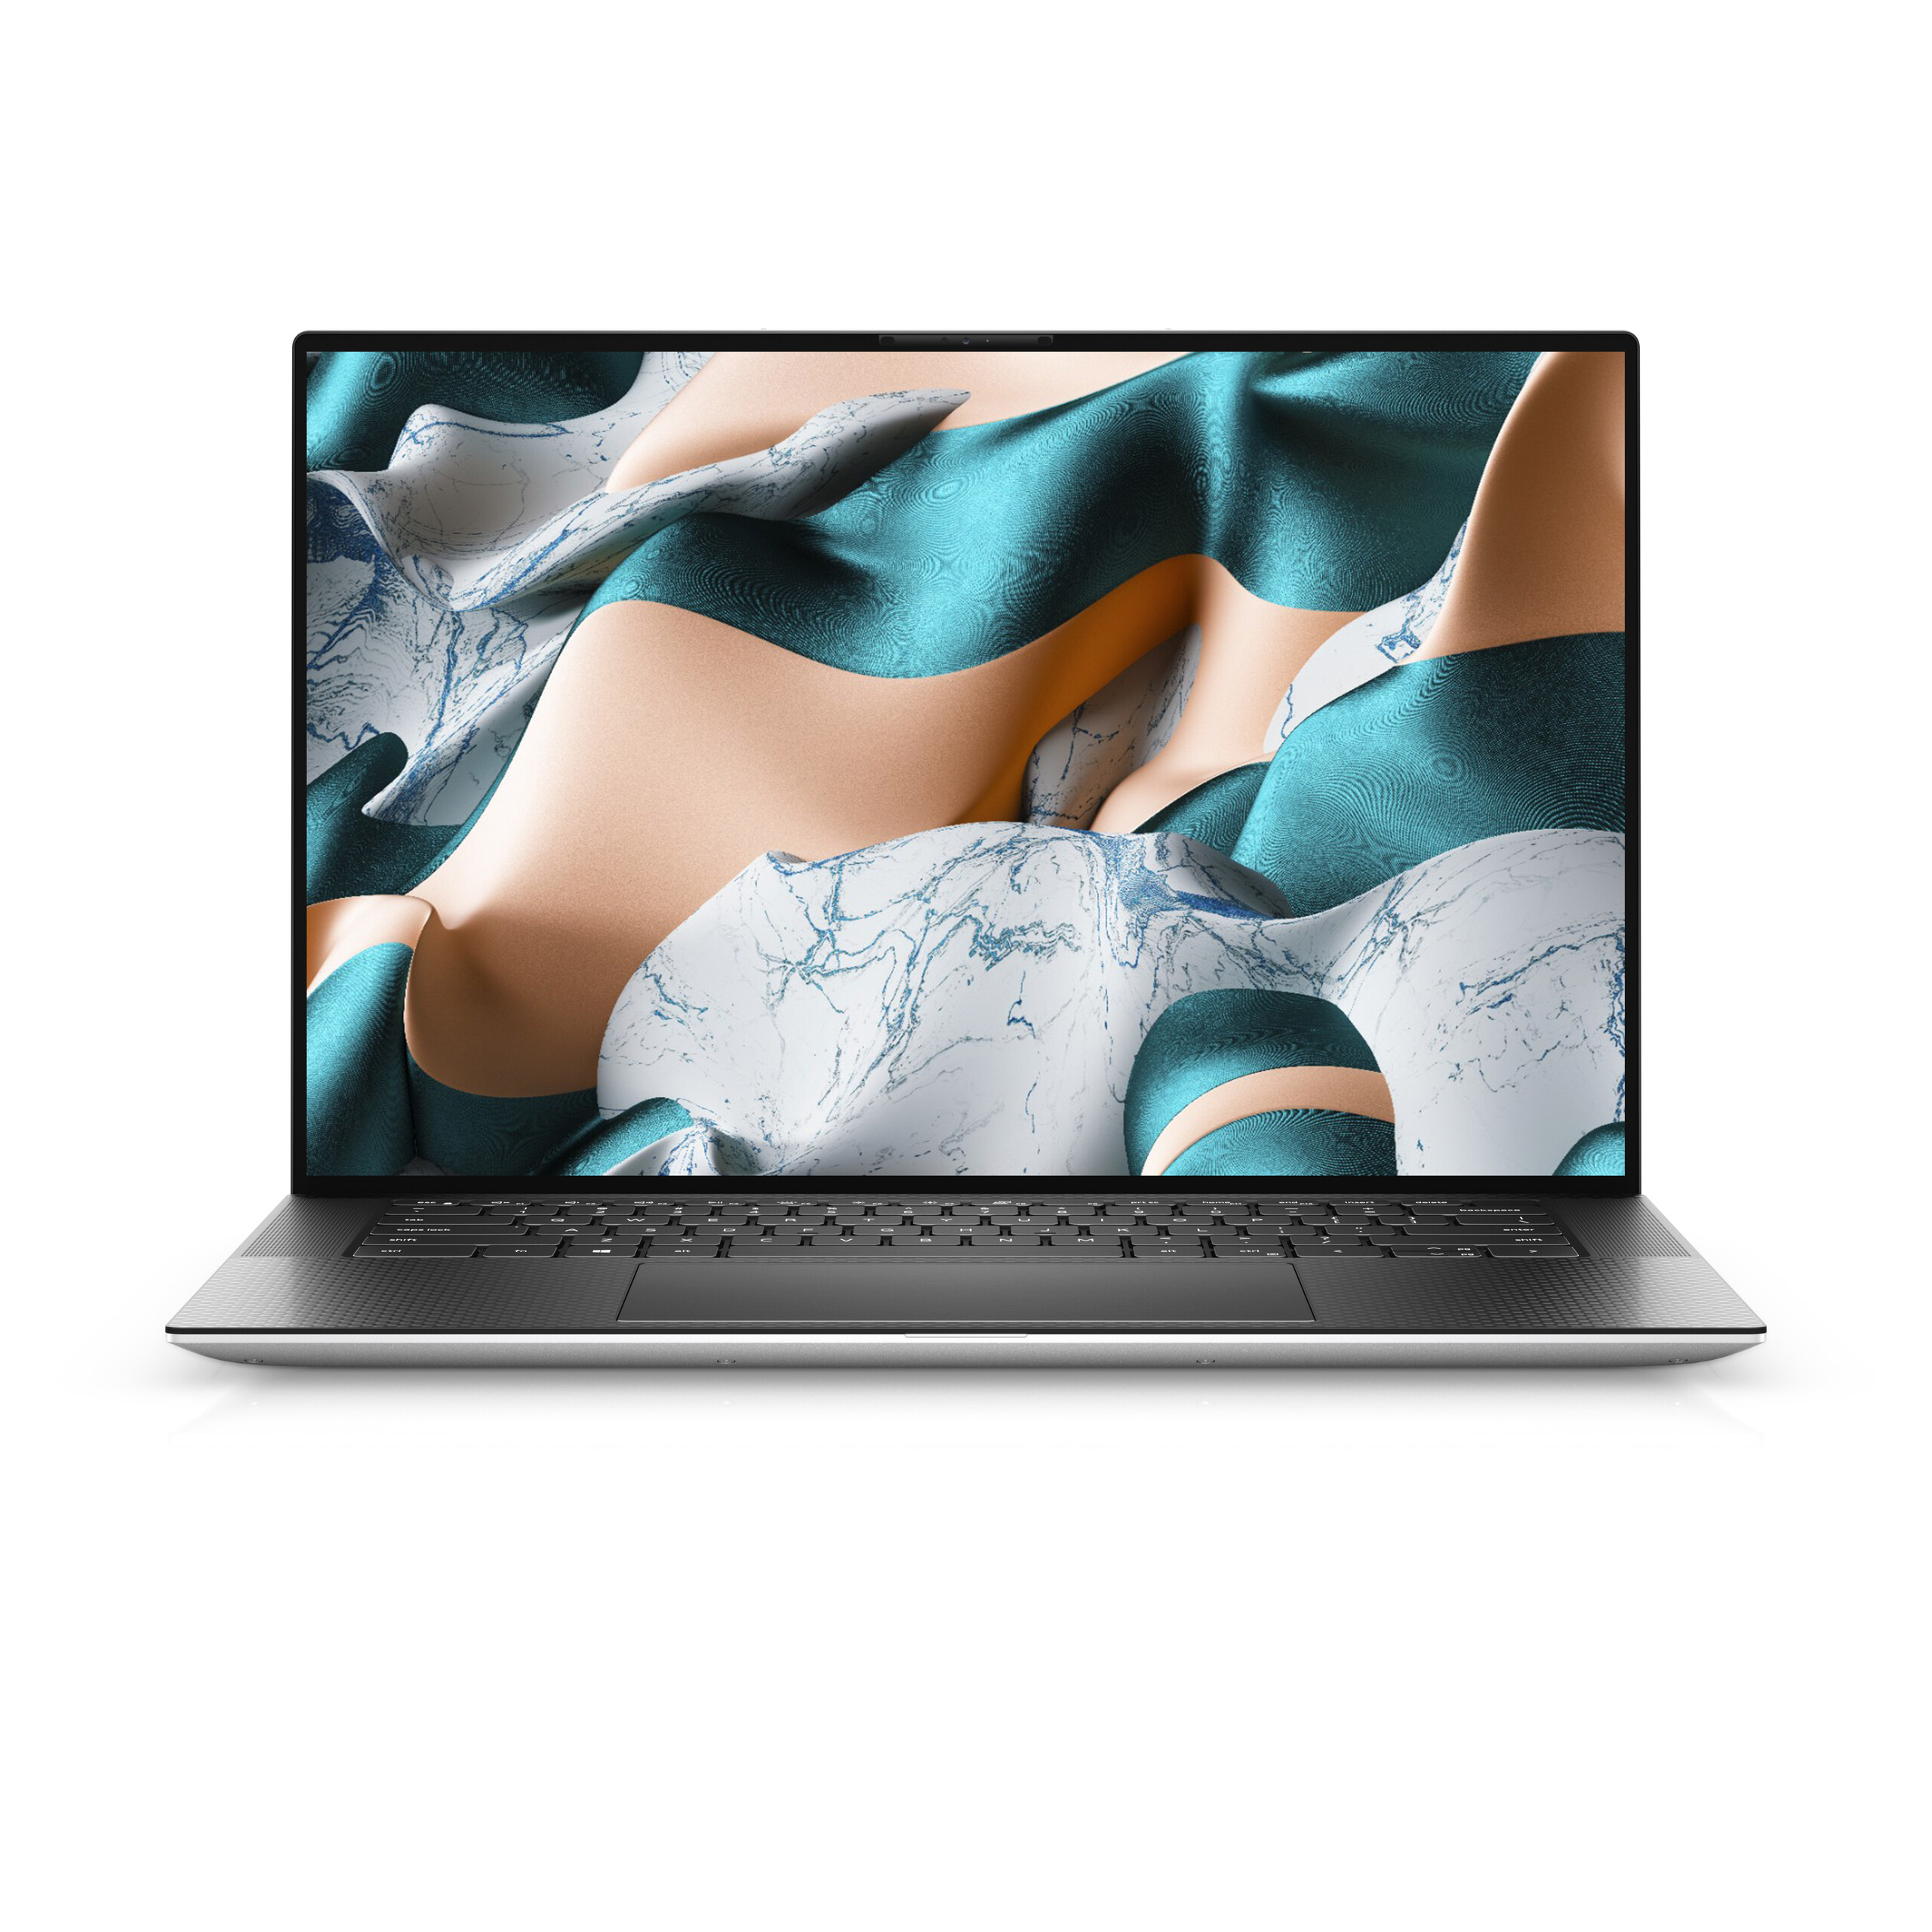
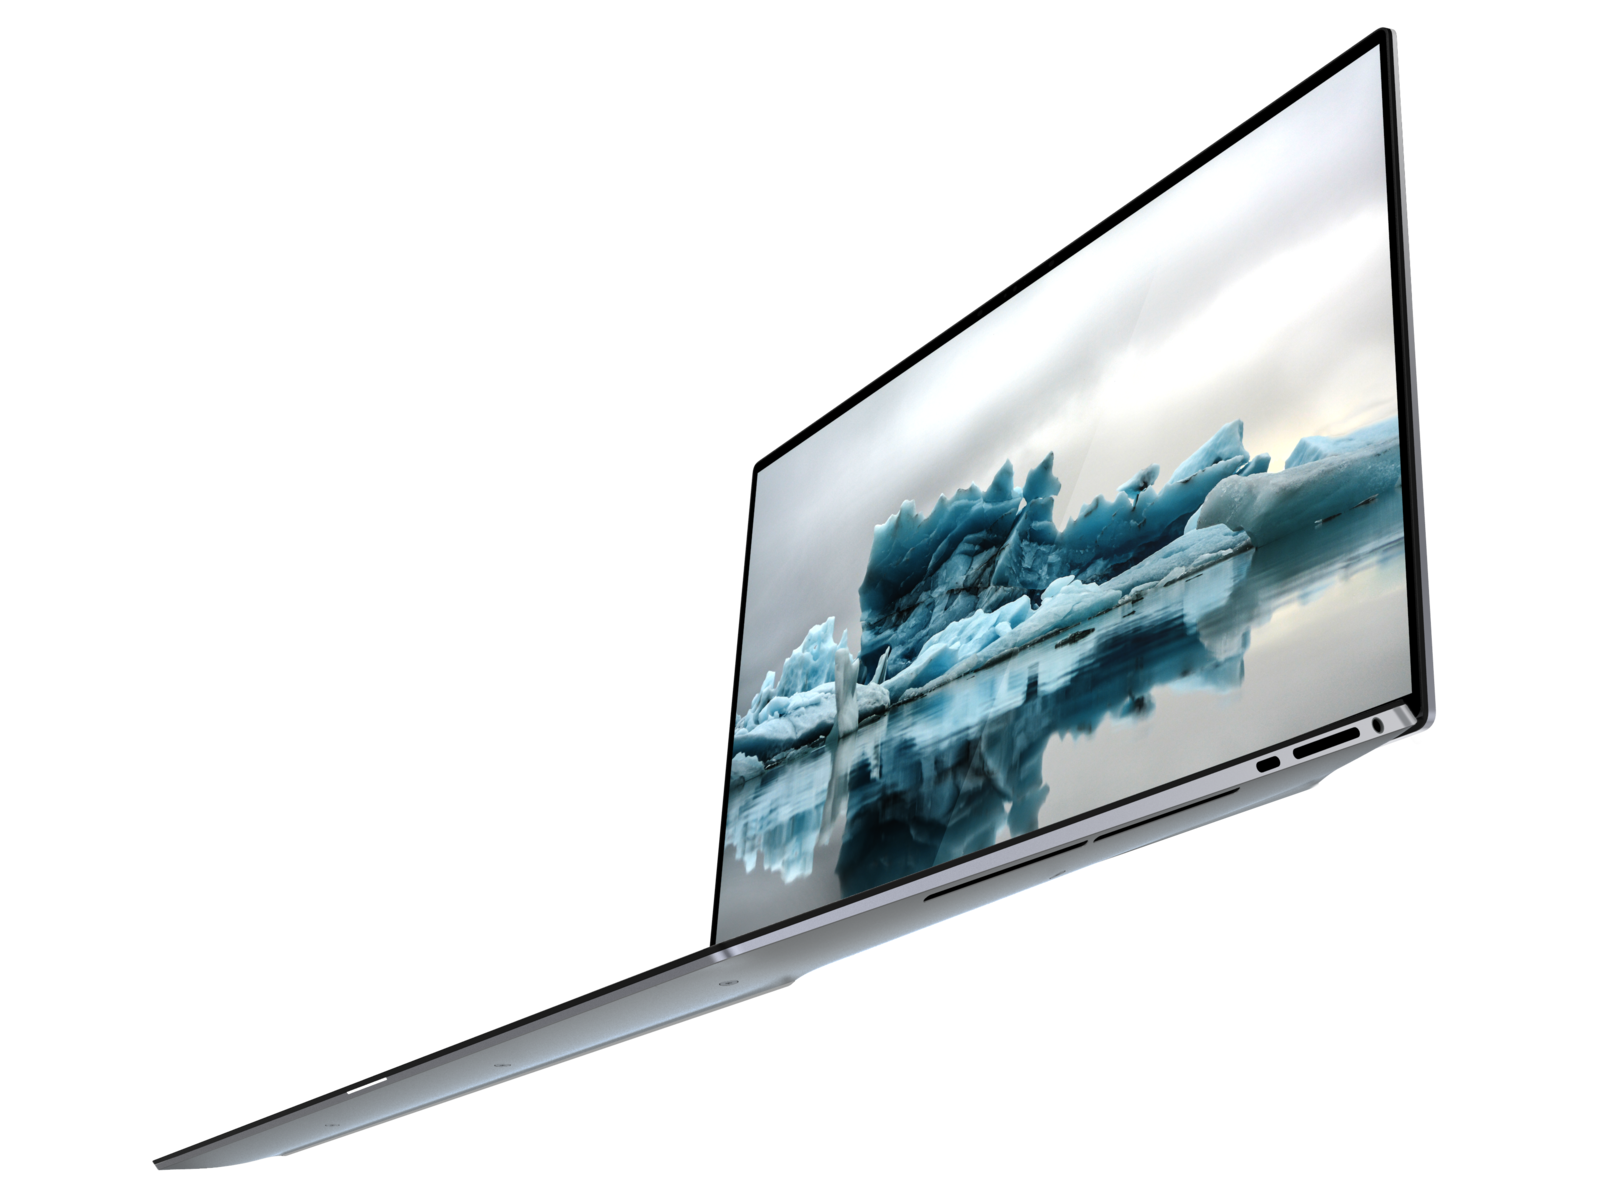
Dell XPS 15 9500 Core i7 4K UHD
- 06/09/2020 v7 (old)
Allen Ngo
Price comparison
