Test: Lenovo IdeaPad S740-15IRH - Bästa och dyraste IdeaPad-modellen hittills (Sammanfattning)
Gradering | Datum | Modell | Vikt | Höjd | Storlek | Upplösning | Pris |
|---|---|---|---|---|---|---|---|
| 85.5 % v7 (old) | 01/2020 | Lenovo IdeaPad S740-15IRH i7-9750H, GeForce GTX 1650 Max-Q | 1.9 kg | 19.95 mm | 15.60" | 3840x2160 | |
| 87.8 % v7 (old) | 08/2019 | Dell XPS 15 7590 9980HK GTX 1650 i9-9980HK, GeForce GTX 1650 Mobile | 2 kg | 17 mm | 15.60" | 3840x2160 | |
| 85 % v7 (old) | 01/2020 | HP Spectre X360 15-5ZV31AV i7-10510U, GeForce MX250 | 2.1 kg | 19.3 mm | 15.60" | 3840x2160 | |
| 82.7 % v6 (old) | 07/2018 | Lenovo Yoga 730-15IKB i5-8550U, GeForce GTX 1050 Mobile | 1.9 kg | 17.2 mm | 15.60" | 3840x2160 | |
| 83.1 % v7 (old) | 10/2019 | Asus ZenBook 15 UX534FT-DB77 i7-8565U, GeForce GTX 1650 Max-Q | 1.7 kg | 18.9 mm | 15.60" | 1920x1080 |
| SD Card Reader | |
| average JPG Copy Test (av. of 3 runs) | |
| Dell XPS 15 7590 9980HK GTX 1650 (Toshiba Exceria Pro SDXC 64 GB UHS-II) | |
| HP Spectre X360 15-5ZV31AV (Toshiba Exceria Pro M501 UHS-II) | |
| MSI Prestige 15 A10SC (Toshiba Exceria Pro M501 UHS-II) | |
| Lenovo IdeaPad S740-15IRH (Toshiba Exceria Pro M501 UHS-II) | |
| Asus ZenBook 15 UX534FT-DB77 (Toshiba Exceria Pro SDXC 64 GB UHS-II) | |
| maximum AS SSD Seq Read Test (1GB) | |
| MSI Prestige 15 A10SC (Toshiba Exceria Pro M501 UHS-II) | |
| Dell XPS 15 7590 9980HK GTX 1650 (Toshiba Exceria Pro SDXC 64 GB UHS-II) | |
| HP Spectre X360 15-5ZV31AV (Toshiba Exceria Pro M501 UHS-II) | |
| Lenovo IdeaPad S740-15IRH (Toshiba Exceria Pro M501 UHS-II) | |
| Asus ZenBook 15 UX534FT-DB77 (Toshiba Exceria Pro SDXC 64 GB UHS-II) | |
| Networking | |
| iperf3 transmit AX12 | |
| MSI Prestige 15 A10SC | |
| Lenovo Yoga 730-15IKB | |
| iperf3 receive AX12 | |
| MSI Prestige 15 A10SC | |
| Lenovo Yoga 730-15IKB | |
| |||||||||||||||||||||||||
Distribution av ljusstyrkan: 83 %
Mitt på batteriet: 475.8 cd/m²
Kontrast: 1220:1 (Svärta: 0.39 cd/m²)
ΔE ColorChecker Calman: 2.36 | ∀{0.5-29.43 Ø4.73}
calibrated: 1.62
ΔE Greyscale Calman: 3.8 | ∀{0.09-98 Ø4.97}
91.7% sRGB (Argyll 1.6.3 3D)
58% AdobeRGB 1998 (Argyll 1.6.3 3D)
63.1% AdobeRGB 1998 (Argyll 3D)
90.5% sRGB (Argyll 3D)
61.2% Display P3 (Argyll 3D)
Gamma: 2.28
CCT: 7046 K
| Lenovo IdeaPad S740-15IRH BOE HF NE156QUM-N55, IPS, 15.6", 3840x2160 | Dell XPS 15 7590 9980HK GTX 1650 Samsung 156WR04, SDCA029, OLED, 15.6", 3840x2160 | HP Spectre X360 15-5ZV31AV AU Optronics AUO30EB, IPS, 15.6", 3840x2160 | Lenovo Yoga 730-15IKB BOE HF NV156QUM-N51, IPS, 15.6", 3840x2160 | Asus ZenBook 15 UX534FT-DB77 BOE NV156FHM-N63, IPS, 15.6", 1920x1080 | MSI Prestige 15 A10SC Sharp LQ156D1JW42, IPS, 15.6", 3840x2160 | |
|---|---|---|---|---|---|---|
| Display | 33% | 8% | 5% | 3% | 32% | |
| Display P3 Coverage (%) | 61.2 | 88.1 44% | 68.3 12% | 68.7 12% | 66.6 9% | 82 34% |
| sRGB Coverage (%) | 90.5 | 99.6 10% | 94.3 4% | 90 -1% | 87.7 -3% | 98.3 9% |
| AdobeRGB 1998 Coverage (%) | 63.1 | 91.8 45% | 68.4 8% | 65.8 4% | 64.1 2% | 96.2 52% |
| Response Times | 93% | -46% | 12% | -12% | -50% | |
| Response Time Grey 50% / Grey 80% * (ms) | 40.4 ? | 2.3 ? 94% | 56.8 ? -41% | 34 ? 16% | 41.2 ? -2% | 60 ? -49% |
| Response Time Black / White * (ms) | 27.2 ? | 2.4 ? 91% | 40.8 ? -50% | 25 ? 8% | 33.2 ? -22% | 41.2 ? -51% |
| PWM Frequency (Hz) | 59.5 ? | 961 ? | 26040 ? | |||
| Screen | -22% | -13% | -19% | -39% | -8% | |
| Brightness middle (cd/m²) | 475.8 | 421.2 -11% | 284.6 -40% | 309 -35% | 312.6 -34% | 464.5 -2% |
| Brightness (cd/m²) | 439 | 417 -5% | 285 -35% | 299 -32% | 290 -34% | 451 3% |
| Brightness Distribution (%) | 83 | 94 13% | 85 2% | 84 1% | 85 2% | 92 11% |
| Black Level * (cd/m²) | 0.39 | 0.25 36% | 0.29 26% | 0.31 21% | 0.5 -28% | |
| Contrast (:1) | 1220 | 1138 -7% | 1066 -13% | 1008 -17% | 929 -24% | |
| Colorchecker dE 2000 * | 2.36 | 6.06 -157% | 3.52 -49% | 3.9 -65% | 5.78 -145% | 3.36 -42% |
| Colorchecker dE 2000 max. * | 6.29 | 11.89 -89% | 5.56 12% | 7.5 -19% | 8.86 -41% | 7.06 -12% |
| Colorchecker dE 2000 calibrated * | 1.62 | 3 -85% | 3.78 -133% | 3.42 -111% | ||
| Greyscale dE 2000 * | 3.8 | 2.8 26% | 3.2 16% | 4.58 -21% | 5.4 -42% | 1.3 66% |
| Gamma | 2.28 96% | 2.15 102% | 2.28 96% | 2.43 91% | 2.21 100% | 2.14 103% |
| CCT | 7046 92% | 6235 104% | 7070 92% | 7344 89% | 7864 83% | 6596 99% |
| Color Space (Percent of AdobeRGB 1998) (%) | 58 | 81 40% | 61.1 5% | 39 -33% | 57.1 -2% | 84.8 46% |
| Color Space (Percent of sRGB) (%) | 91.7 | 99.6 9% | 93.8 2% | 90 -2% | 87.4 -5% | 98.3 7% |
| Totalt genomsnitt (program/inställningar) | 35% /
8% | -17% /
-13% | -1% /
-10% | -16% /
-28% | -9% /
-6% |
* ... mindre är bättre
Visa svarstider
| ↔ Svarstid svart till vitt | ||
|---|---|---|
| 27.2 ms ... stiga ↗ och falla ↘ kombinerat | ↗ 14.8 ms stiga | 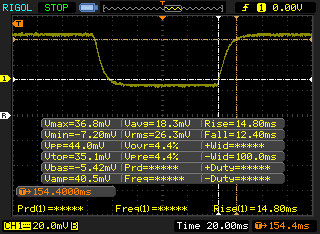 |
| ↘ 12.4 ms hösten | ||
| Skärmen visar relativt långsamma svarsfrekvenser i våra tester och kan vara för långsam för spelare. I jämförelse sträcker sig alla testade enheter från 0.1 (minst) till 240 (maximalt) ms. » 69 % av alla enheter är bättre. Detta innebär att den uppmätta svarstiden är sämre än genomsnittet av alla testade enheter (19.9 ms). | ||
| ↔ Svarstid 50 % grått till 80 % grått | ||
| 40.4 ms ... stiga ↗ och falla ↘ kombinerat | ↗ 18 ms stiga | 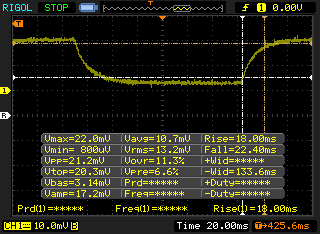 |
| ↘ 22 ms hösten | ||
| Skärmen visar långsamma svarsfrekvenser i våra tester och kommer att vara otillfredsställande för spelare. I jämförelse sträcker sig alla testade enheter från 0.165 (minst) till 636 (maximalt) ms. » 63 % av alla enheter är bättre. Detta innebär att den uppmätta svarstiden är sämre än genomsnittet av alla testade enheter (31.1 ms). | ||
Skärmflimmer / PWM (Puls-Width Modulation)
| Skärmflimmer / PWM upptäcktes inte |  | ||
Som jämförelse: 52 % av alla testade enheter använder inte PWM för att dämpa skärmen. Om PWM upptäcktes mättes ett medelvärde av 7791 (minst: 5 - maximum: 343500) Hz. | |||
| wPrime 2.10 - 1024m | |
| Asus ROG Zephyrus G15 GA502DU | |
| Dell XPS 13 7390 Core i7-10710U | |
| Genomsnitt Intel Core i7-9750H (n=1) | |
| MSI GE75 9SG | |
| Corsair One i160 | |
* ... mindre är bättre
| PCMark 8 Home Score Accelerated v2 | 3548 poäng | |
| PCMark 8 Work Score Accelerated v2 | 4555 poäng | |
| PCMark 10 Score | 4629 poäng | |
Hjälp | ||
| Lenovo IdeaPad S740-15IRH Samsung SSD PM981 MZVLB512HAJQ | Dell XPS 15 7590 9980HK GTX 1650 Toshiba XG6 KXG60ZNV1T02 | HP Spectre X360 15-5ZV31AV Intel SSD 660p 2TB SSDPEKNW020T8 | Lenovo Yoga 730-15IKB SK Hynix PC401 512GB M.2 (HFS512GD9TNG) | Asus ZenBook 15 UX534FT-DB77 Samsung SSD PM981 MZVLB1T0HALR | MSI Prestige 15 A10SC Samsung SSD PM981 MZVLB1T0HALR | |
|---|---|---|---|---|---|---|
| AS SSD | 4% | -24% | -26% | -4% | 4% | |
| Seq Read (MB/s) | 1791 | 1723 -4% | 1220 -32% | 2158 20% | 1887 5% | 1274 -29% |
| Seq Write (MB/s) | 1466 | 1386 -5% | 1152 -21% | 680 -54% | 1432 -2% | 1395 -5% |
| 4K Read (MB/s) | 47.24 | 43.25 -8% | 52.3 11% | 44.74 -5% | 52.3 11% | 50.3 6% |
| 4K Write (MB/s) | 96.9 | 98.3 1% | 146.6 51% | 123 27% | 146 51% | 119.8 24% |
| 4K-64 Read (MB/s) | 1077 | 1078 0% | 652 -39% | 623 -42% | 969 -10% | 1599 48% |
| 4K-64 Write (MB/s) | 1997 | 1456 -27% | 847 -58% | 486 -76% | 1375 -31% | 1455 -27% |
| Access Time Read * (ms) | 0.047 | 0.05 -6% | 0.077 -64% | 0.044 6% | 0.034 28% | 0.044 6% |
| Access Time Write * (ms) | 0.116 | 0.039 66% | 0.106 9% | 0.051 56% | 0.075 35% | 0.092 21% |
| Score Read (Points) | 1303 | 1294 -1% | 826 -37% | 884 -32% | 1210 -7% | 1777 36% |
| Score Write (Points) | 2241 | 1693 -24% | 1109 -51% | 677 -70% | 1664 -26% | 1714 -24% |
| Score Total (Points) | 4203 | 3638 -13% | 2371 -44% | 1951 -54% | 3483 -17% | 4411 5% |
| Copy ISO MB/s (MB/s) | 2127 | 3182 50% | 2070 -3% | 1641 -23% | 1375 -35% | 2830 33% |
| Copy Program MB/s (MB/s) | 828 | 984 19% | 571 -31% | 390 -53% | 468 -43% | 609 -26% |
| Copy Game MB/s (MB/s) | 1639 | 1824 11% | 1219 -26% | 574 -65% | 1287 -21% | 1424 -13% |
| CrystalDiskMark 5.2 / 6 | 5% | 1% | 12% | 13% | -5% | |
| Write 4K (MB/s) | 91.6 | 104.3 14% | 151.5 65% | 164.9 80% | 141.6 55% | 150.8 65% |
| Read 4K (MB/s) | 38.61 | 45.23 17% | 59.3 54% | 50.5 31% | 45.28 17% | 47.3 23% |
| Write Seq (MB/s) | 1991 | 1729 -13% | 1424 -28% | 1262 -37% | 1975 -1% | 981 -51% |
| Read Seq (MB/s) | 1827 | 1861 2% | 1609 -12% | 2054 12% | 2272 24% | 976 -47% |
| Write 4K Q32T1 (MB/s) | 490.3 | 509 4% | 393.6 -20% | 477.6 -3% | 458.6 -6% | 442.7 -10% |
| Read 4K Q32T1 (MB/s) | 292 | 388.5 33% | 369.4 27% | 550 88% | 391.4 34% | 499.7 71% |
| Write Seq Q32T1 (MB/s) | 2974 | 2813 -5% | 1946 -35% | 1400 -53% | 2393 -20% | 1706 -43% |
| Read Seq Q32T1 (MB/s) | 3449 | 2906 -16% | 1934 -44% | 2672 -23% | 3464 0% | 1758 -49% |
| Totalt genomsnitt (program/inställningar) | 5% /
4% | -12% /
-15% | -7% /
-12% | 5% /
2% | -1% /
1% |
* ... mindre är bättre

| 3DMark | |
| 1920x1080 Fire Strike Graphics | |
| Walmart EVOO Gaming 17 | |
| Schenker XMG Neo 15 XNE15M19 | |
| HP Omen 15-dc0015ng | |
| HP Gaming Pavilion 15-dk0009ng | |
| Asus Zephyrus S GX531GM | |
| MSI GT72S-6QEG16SR421BW | |
| Gainward GeForce GTX 1650 4 GB | |
| Lenovo IdeaPad S740-15IRH | |
| Genomsnitt NVIDIA GeForce GTX 1650 Max-Q (6985 - 8618, n=12) | |
| HP Spectre x360 15-df0126ng | |
| Lenovo Yoga 730-15IKB | |
| Asus Zenbook 14 UX433FN-A6023T | |
| 2560x1440 Time Spy Graphics | |
| Walmart EVOO Gaming 17 | |
| Schenker XMG Neo 15 XNE15M19 | |
| HP Gaming Pavilion 15-dk0009ng | |
| HP Omen 15-dc0015ng | |
| Asus Zephyrus S GX531GM | |
| Gainward GeForce GTX 1650 4 GB | |
| Lenovo IdeaPad S740-15IRH | |
| Genomsnitt NVIDIA GeForce GTX 1650 Max-Q (2836 - 3238, n=10) | |
| MSI GT72S-6QEG16SR421BW | |
| HP Spectre x360 15-df0126ng | |
| Lenovo Yoga 730-15IKB | |
| Asus Zenbook 14 UX433FN-A6023T | |
| 3DMark 11 | |
| 1280x720 Performance GPU | |
| Walmart EVOO Gaming 17 | |
| Schenker XMG Neo 15 XNE15M19 | |
| HP Omen 15-dc0015ng | |
| HP Gaming Pavilion 15-dk0009ng | |
| Gainward GeForce GTX 1650 4 GB | |
| Asus Zephyrus S GX531GM | |
| MSI GT72S-6QEG16SR421BW | |
| Lenovo IdeaPad S740-15IRH | |
| Genomsnitt NVIDIA GeForce GTX 1650 Max-Q (10248 - 12259, n=14) | |
| HP Spectre x360 15-df0126ng | |
| Lenovo Yoga 730-15IKB | |
| Asus Zenbook 14 UX433FN-A6023T | |
| 1280x720 Performance Combined | |
| Walmart EVOO Gaming 17 | |
| HP Gaming Pavilion 15-dk0009ng | |
| HP Omen 15-dc0015ng | |
| Schenker XMG Neo 15 XNE15M19 | |
| Gainward GeForce GTX 1650 4 GB | |
| Lenovo IdeaPad S740-15IRH | |
| MSI GT72S-6QEG16SR421BW | |
| Genomsnitt NVIDIA GeForce GTX 1650 Max-Q (6409 - 10846, n=13) | |
| HP Spectre x360 15-df0126ng | |
| Asus Zephyrus S GX531GM | |
| Lenovo Yoga 730-15IKB | |
| Asus Zenbook 14 UX433FN-A6023T | |
| 3DMark 11 Performance | 11966 poäng | |
| 3DMark Ice Storm Standard Score | 42968 poäng | |
| 3DMark Cloud Gate Standard Score | 25731 poäng | |
| 3DMark Fire Strike Score | 7545 poäng | |
| 3DMark Time Spy Score | 3373 poäng | |
Hjälp | ||
| Shadow of the Tomb Raider - 1920x1080 Highest Preset AA:T | |
| MSI RTX 2060 Gaming Z 6G | |
| HP Pavilion Gaming 17-cd0085cl | |
| MSI GF65 9SD | |
| Asus TUF FX705GM | |
| Gainward GeForce GTX 1650 4 GB | |
| Lenovo IdeaPad S740-15IRH | |
| Asus G752VY | |
| Genomsnitt NVIDIA GeForce GTX 1650 Max-Q (33 - 45, n=6) | |
| Asus TUF FX705GE-EW096T | |
| Xiaomi Mi Notebook Pro i7 | |
| The Witcher 3 - 1920x1080 Ultra Graphics & Postprocessing (HBAO+) | |
| MSI RTX 2060 Gaming Z 6G | |
| MSI GF65 9SD | |
| HP Pavilion Gaming 17-cd0085cl | |
| Gainward GeForce GTX 1650 4 GB | |
| Asus TUF FX705GM | |
| Dell G3 3590 | |
| Lenovo IdeaPad S740-15IRH | |
| Genomsnitt NVIDIA GeForce GTX 1650 Max-Q (27.5 - 36.5, n=11) | |
| Asus TUF FX705GE-EW096T | |
| Xiaomi Mi Notebook Pro i7 | |
| låg | med. | hög | ultra | |
|---|---|---|---|---|
| BioShock Infinite (2013) | 323.6 | 238.3 | 206.8 | 81.7 |
| The Witcher 3 (2015) | 188 | 114.8 | 60.4 | 34.4 |
| Shadow of the Tomb Raider (2018) | 117 | 56 | 47 | 41 |
| Lenovo IdeaPad S740-15IRH GeForce GTX 1650 Max-Q, i7-9750H, Samsung SSD PM981 MZVLB512HAJQ | Dell XPS 15 7590 9980HK GTX 1650 GeForce GTX 1650 Mobile, i9-9980HK, Toshiba XG6 KXG60ZNV1T02 | HP Spectre X360 15-5ZV31AV GeForce MX250, i7-10510U, Intel SSD 660p 2TB SSDPEKNW020T8 | Lenovo Yoga 730-15IKB GeForce GTX 1050 Mobile, i5-8550U, SK Hynix PC401 512GB M.2 (HFS512GD9TNG) | Asus ZenBook 15 UX534FT-DB77 GeForce GTX 1650 Max-Q, i7-8565U, Samsung SSD PM981 MZVLB1T0HALR | MSI Prestige 15 A10SC GeForce GTX 1650 Max-Q, i7-10710U, Samsung SSD PM981 MZVLB1T0HALR | |
|---|---|---|---|---|---|---|
| Noise | -2% | 4% | 1% | 6% | 3% | |
| av / miljö * (dB) | 28.5 | 28.2 1% | 30.1 -6% | 30.5 -7% | 28.4 -0% | 29.3 -3% |
| Idle Minimum * (dB) | 28.5 | 28.2 1% | 30.1 -6% | 30.5 -7% | 28.4 -0% | 30.1 -6% |
| Idle Average * (dB) | 28.5 | 28.2 1% | 30.1 -6% | 30.5 -7% | 28.4 -0% | 30.2 -6% |
| Idle Maximum * (dB) | 28.5 | 30.4 -7% | 30.1 -6% | 30.5 -7% | 28.4 -0% | 30.2 -6% |
| Load Average * (dB) | 45 | 43.8 3% | 30.1 33% | 37.5 17% | 33.9 25% | 31.5 30% |
| Witcher 3 ultra * (dB) | 43.9 | 47.2 -8% | 39.7 10% | 39.8 9% | 37 16% | |
| Load Maximum * (dB) | 44.7 | 47.2 -6% | 42 6% | 37.5 16% | 40.2 10% | 47 -5% |
* ... mindre är bättre
Ljudnivå
| Låg belastning |
| 28.5 / 28.5 / 28.5 dB(A) |
| Hög belastning |
| 45 / 44.7 dB(A) |
 | ||
30 dB tyst 40 dB(A) hörbar 50 dB(A) högt ljud |
||
min: | ||
(-) Den maximala temperaturen på ovansidan är 46.2 °C / 115 F, jämfört med genomsnittet av 36.8 °C / 98 F , allt från 21 till 71 °C för klassen Multimedia.
(-) Botten värms upp till maximalt 50 °C / 122 F, jämfört med genomsnittet av 39.1 °C / 102 F
(+) Vid tomgångsbruk är medeltemperaturen för ovansidan 31.2 °C / 88 F, jämfört med enhetsgenomsnittet på 31.3 °C / ### class_avg_f### F.
(±) När du spelar The Witcher 3 är medeltemperaturen för ovansidan 32.8 °C / 91 F, jämfört med enhetsgenomsnittet på 31.3 °C / ## #class_avg_f### F.
(+) Handledsstöden och pekplattan är kallare än hudtemperaturen med maximalt 30.2 °C / 86.4 F och är därför svala att ta på.
(±) Medeltemperaturen för handledsstödsområdet på liknande enheter var 28.7 °C / 83.7 F (-1.5 °C / -2.7 F).
Lenovo IdeaPad S740-15IRH ljudanalys
(±) | högtalarljudstyrkan är genomsnittlig men bra (78.8 dB)
Bas 100 - 315 Hz
(±) | reducerad bas - i genomsnitt 10.8% lägre än medianen
(-) | basen är inte linjär (15.2% delta till föregående frekvens)
Mellan 400 - 2000 Hz
(±) | högre mellan - i genomsnitt 5.1% högre än median
(±) | linjäriteten för mids är genomsnittlig (7.2% delta till föregående frekvens)
Högsta 2 - 16 kHz
(+) | balanserade toppar - endast 2.1% från medianen
(±) | linjäriteten för toppar är genomsnittlig (11.3% delta till föregående frekvens)
Totalt 100 - 16 000 Hz
(±) | linjäriteten för det totala ljudet är genomsnittlig (18.5% skillnad mot median)
Jämfört med samma klass
» 57% av alla testade enheter i den här klassen var bättre, 7% liknande, 36% sämre
» Den bästa hade ett delta på 5%, genomsnittet var 17%, sämst var 45%
Jämfört med alla testade enheter
» 41% av alla testade enheter var bättre, 8% liknande, 51% sämre
» Den bästa hade ett delta på 4%, genomsnittet var 24%, sämst var 134%
Apple MacBook 12 (Early 2016) 1.1 GHz ljudanalys
(+) | högtalare kan spela relativt högt (83.6 dB)
Bas 100 - 315 Hz
(±) | reducerad bas - i genomsnitt 11.3% lägre än medianen
(±) | linjäriteten för basen är genomsnittlig (14.2% delta till föregående frekvens)
Mellan 400 - 2000 Hz
(+) | balanserad mellan - endast 2.4% från medianen
(+) | mids är linjära (5.5% delta till föregående frekvens)
Högsta 2 - 16 kHz
(+) | balanserade toppar - endast 2% från medianen
(+) | toppar är linjära (4.5% delta till föregående frekvens)
Totalt 100 - 16 000 Hz
(+) | det totala ljudet är linjärt (10.2% skillnad mot median)
Jämfört med samma klass
» 7% av alla testade enheter i den här klassen var bättre, 2% liknande, 91% sämre
» Den bästa hade ett delta på 5%, genomsnittet var 18%, sämst var 53%
Jämfört med alla testade enheter
» 5% av alla testade enheter var bättre, 1% liknande, 94% sämre
» Den bästa hade ett delta på 4%, genomsnittet var 24%, sämst var 134%
| Av/Standby | |
| Låg belastning | |
| Hög belastning |
|
Förklaring:
min: | |
| Lenovo IdeaPad S740-15IRH i7-9750H, GeForce GTX 1650 Max-Q, Samsung SSD PM981 MZVLB512HAJQ, IPS, 3840x2160, 15.6" | Dell XPS 15 7590 9980HK GTX 1650 i9-9980HK, GeForce GTX 1650 Mobile, Toshiba XG6 KXG60ZNV1T02, OLED, 3840x2160, 15.6" | HP Spectre X360 15-5ZV31AV i7-10510U, GeForce MX250, Intel SSD 660p 2TB SSDPEKNW020T8, IPS, 3840x2160, 15.6" | Lenovo Yoga 730-15IKB i5-8550U, GeForce GTX 1050 Mobile, SK Hynix PC401 512GB M.2 (HFS512GD9TNG), IPS, 3840x2160, 15.6" | Asus ZenBook 15 UX534FT-DB77 i7-8565U, GeForce GTX 1650 Max-Q, Samsung SSD PM981 MZVLB1T0HALR, IPS, 1920x1080, 15.6" | MSI Prestige 15 A10SC i7-10710U, GeForce GTX 1650 Max-Q, Samsung SSD PM981 MZVLB1T0HALR, IPS, 3840x2160, 15.6" | |
|---|---|---|---|---|---|---|
| Power Consumption | 31% | 56% | 61% | 41% | 43% | |
| Idle Minimum * (Watt) | 28.6 | 6.2 78% | 5.2 82% | 4.8 83% | 5 83% | 6.1 79% |
| Idle Average * (Watt) | 26.5 | 9.6 64% | 8.5 68% | 10.1 62% | 13.2 50% | 13.2 50% |
| Idle Maximum * (Watt) | 32.1 | 21.2 34% | 8.7 73% | 10.7 67% | 24 25% | 19.2 40% |
| Load Average * (Watt) | 112.2 | 104.3 7% | 65.6 42% | 44 61% | 70 38% | 75 33% |
| Witcher 3 ultra * (Watt) | 90.1 | 91.7 -2% | 56.5 37% | 63.3 30% | 74 18% | |
| Load Maximum * (Watt) | 138.8 | 135.3 3% | 92.4 33% | 94.7 32% | 114 18% | 89.7 35% |
* ... mindre är bättre
| Lenovo IdeaPad S740-15IRH i7-9750H, GeForce GTX 1650 Max-Q, 69 Wh | Dell XPS 15 7590 9980HK GTX 1650 i9-9980HK, GeForce GTX 1650 Mobile, 97 Wh | HP Spectre X360 15-5ZV31AV i7-10510U, GeForce MX250, 84 Wh | Lenovo Yoga 730-15IKB i5-8550U, GeForce GTX 1050 Mobile, 51.5 Wh | Asus ZenBook 15 UX534FT-DB77 i7-8565U, GeForce GTX 1650 Max-Q, 71 Wh | MSI Prestige 15 A10SC i7-10710U, GeForce GTX 1650 Max-Q, 82 Wh | |
|---|---|---|---|---|---|---|
| Batteridrifttid | 127% | 139% | -8% | 127% | 79% | |
| Reader / Idle (h) | 12.4 | 15.2 23% | 22.6 82% | 11.6 -6% | 21.5 73% | 19.1 54% |
| WiFi v1.3 (h) | 9 | 7.8 -13% | 10.8 20% | 6.2 -31% | 8.4 -7% | 7.6 -16% |
| Load (h) | 0.7 | 3.3 371% | 2.9 314% | 0.8 14% | 2.9 314% | 2.1 200% |
För
Emot
Läs den fullständiga versionen av den här recensionen på engelska här.
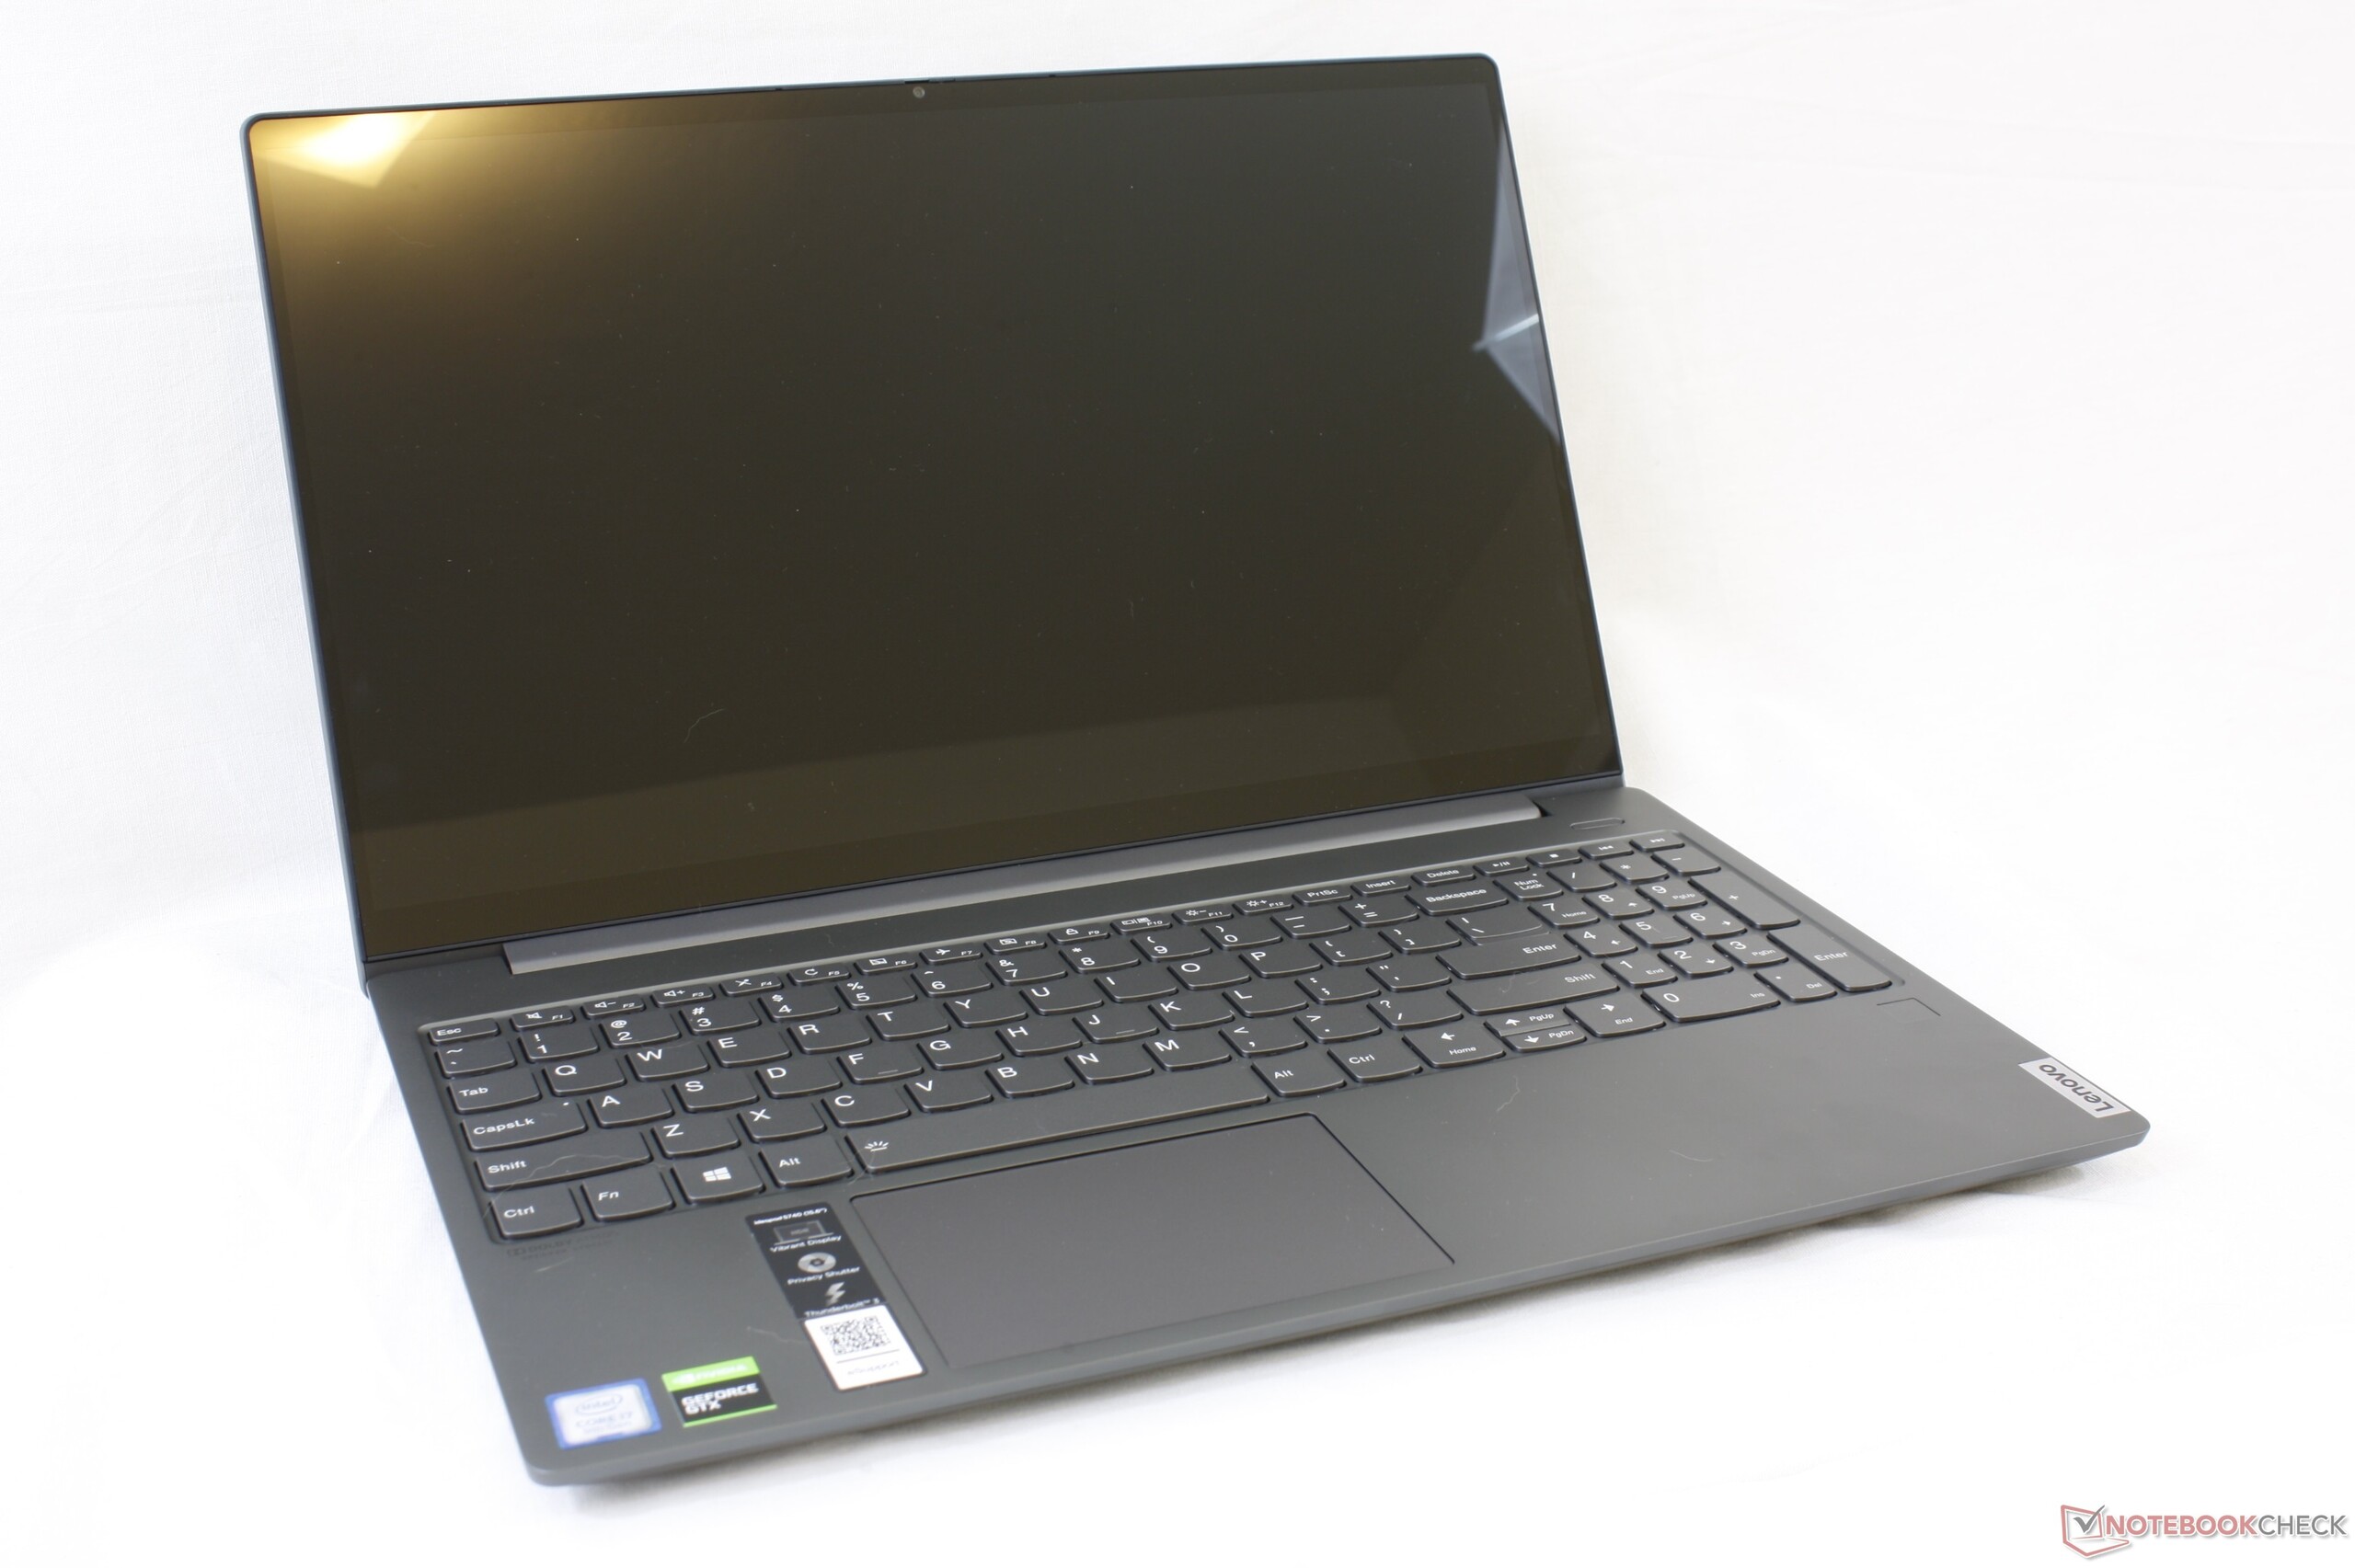
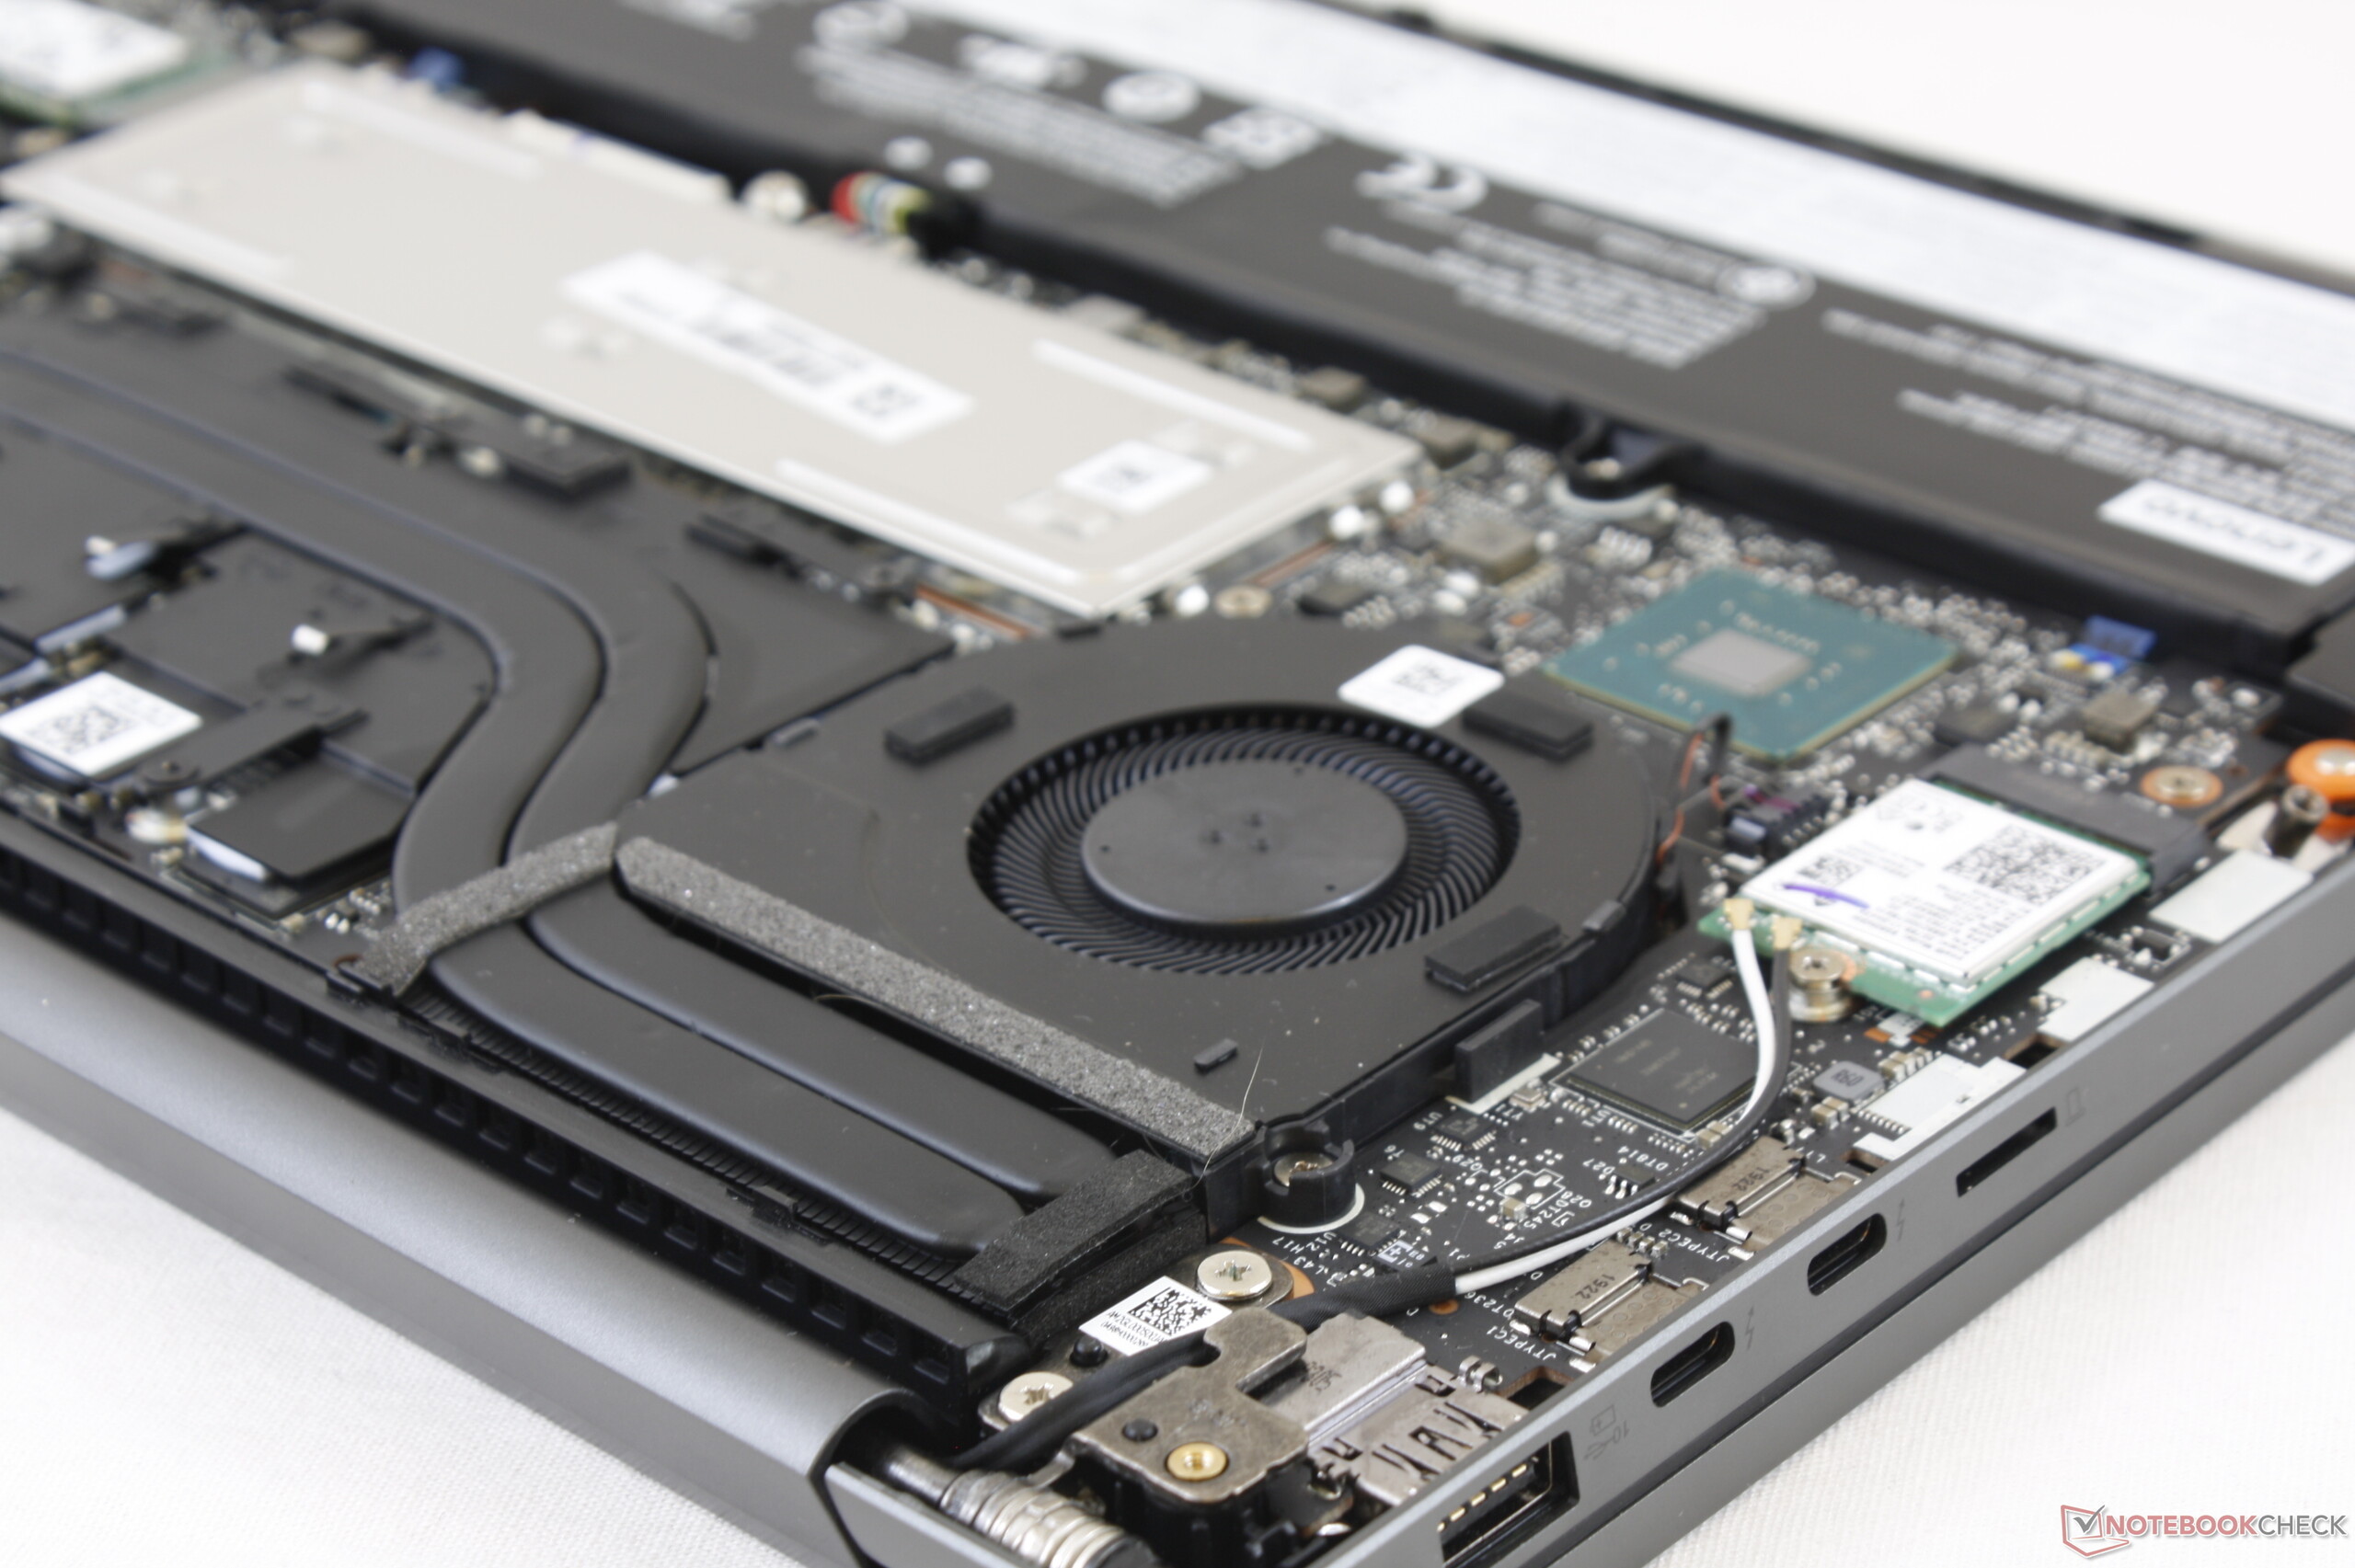
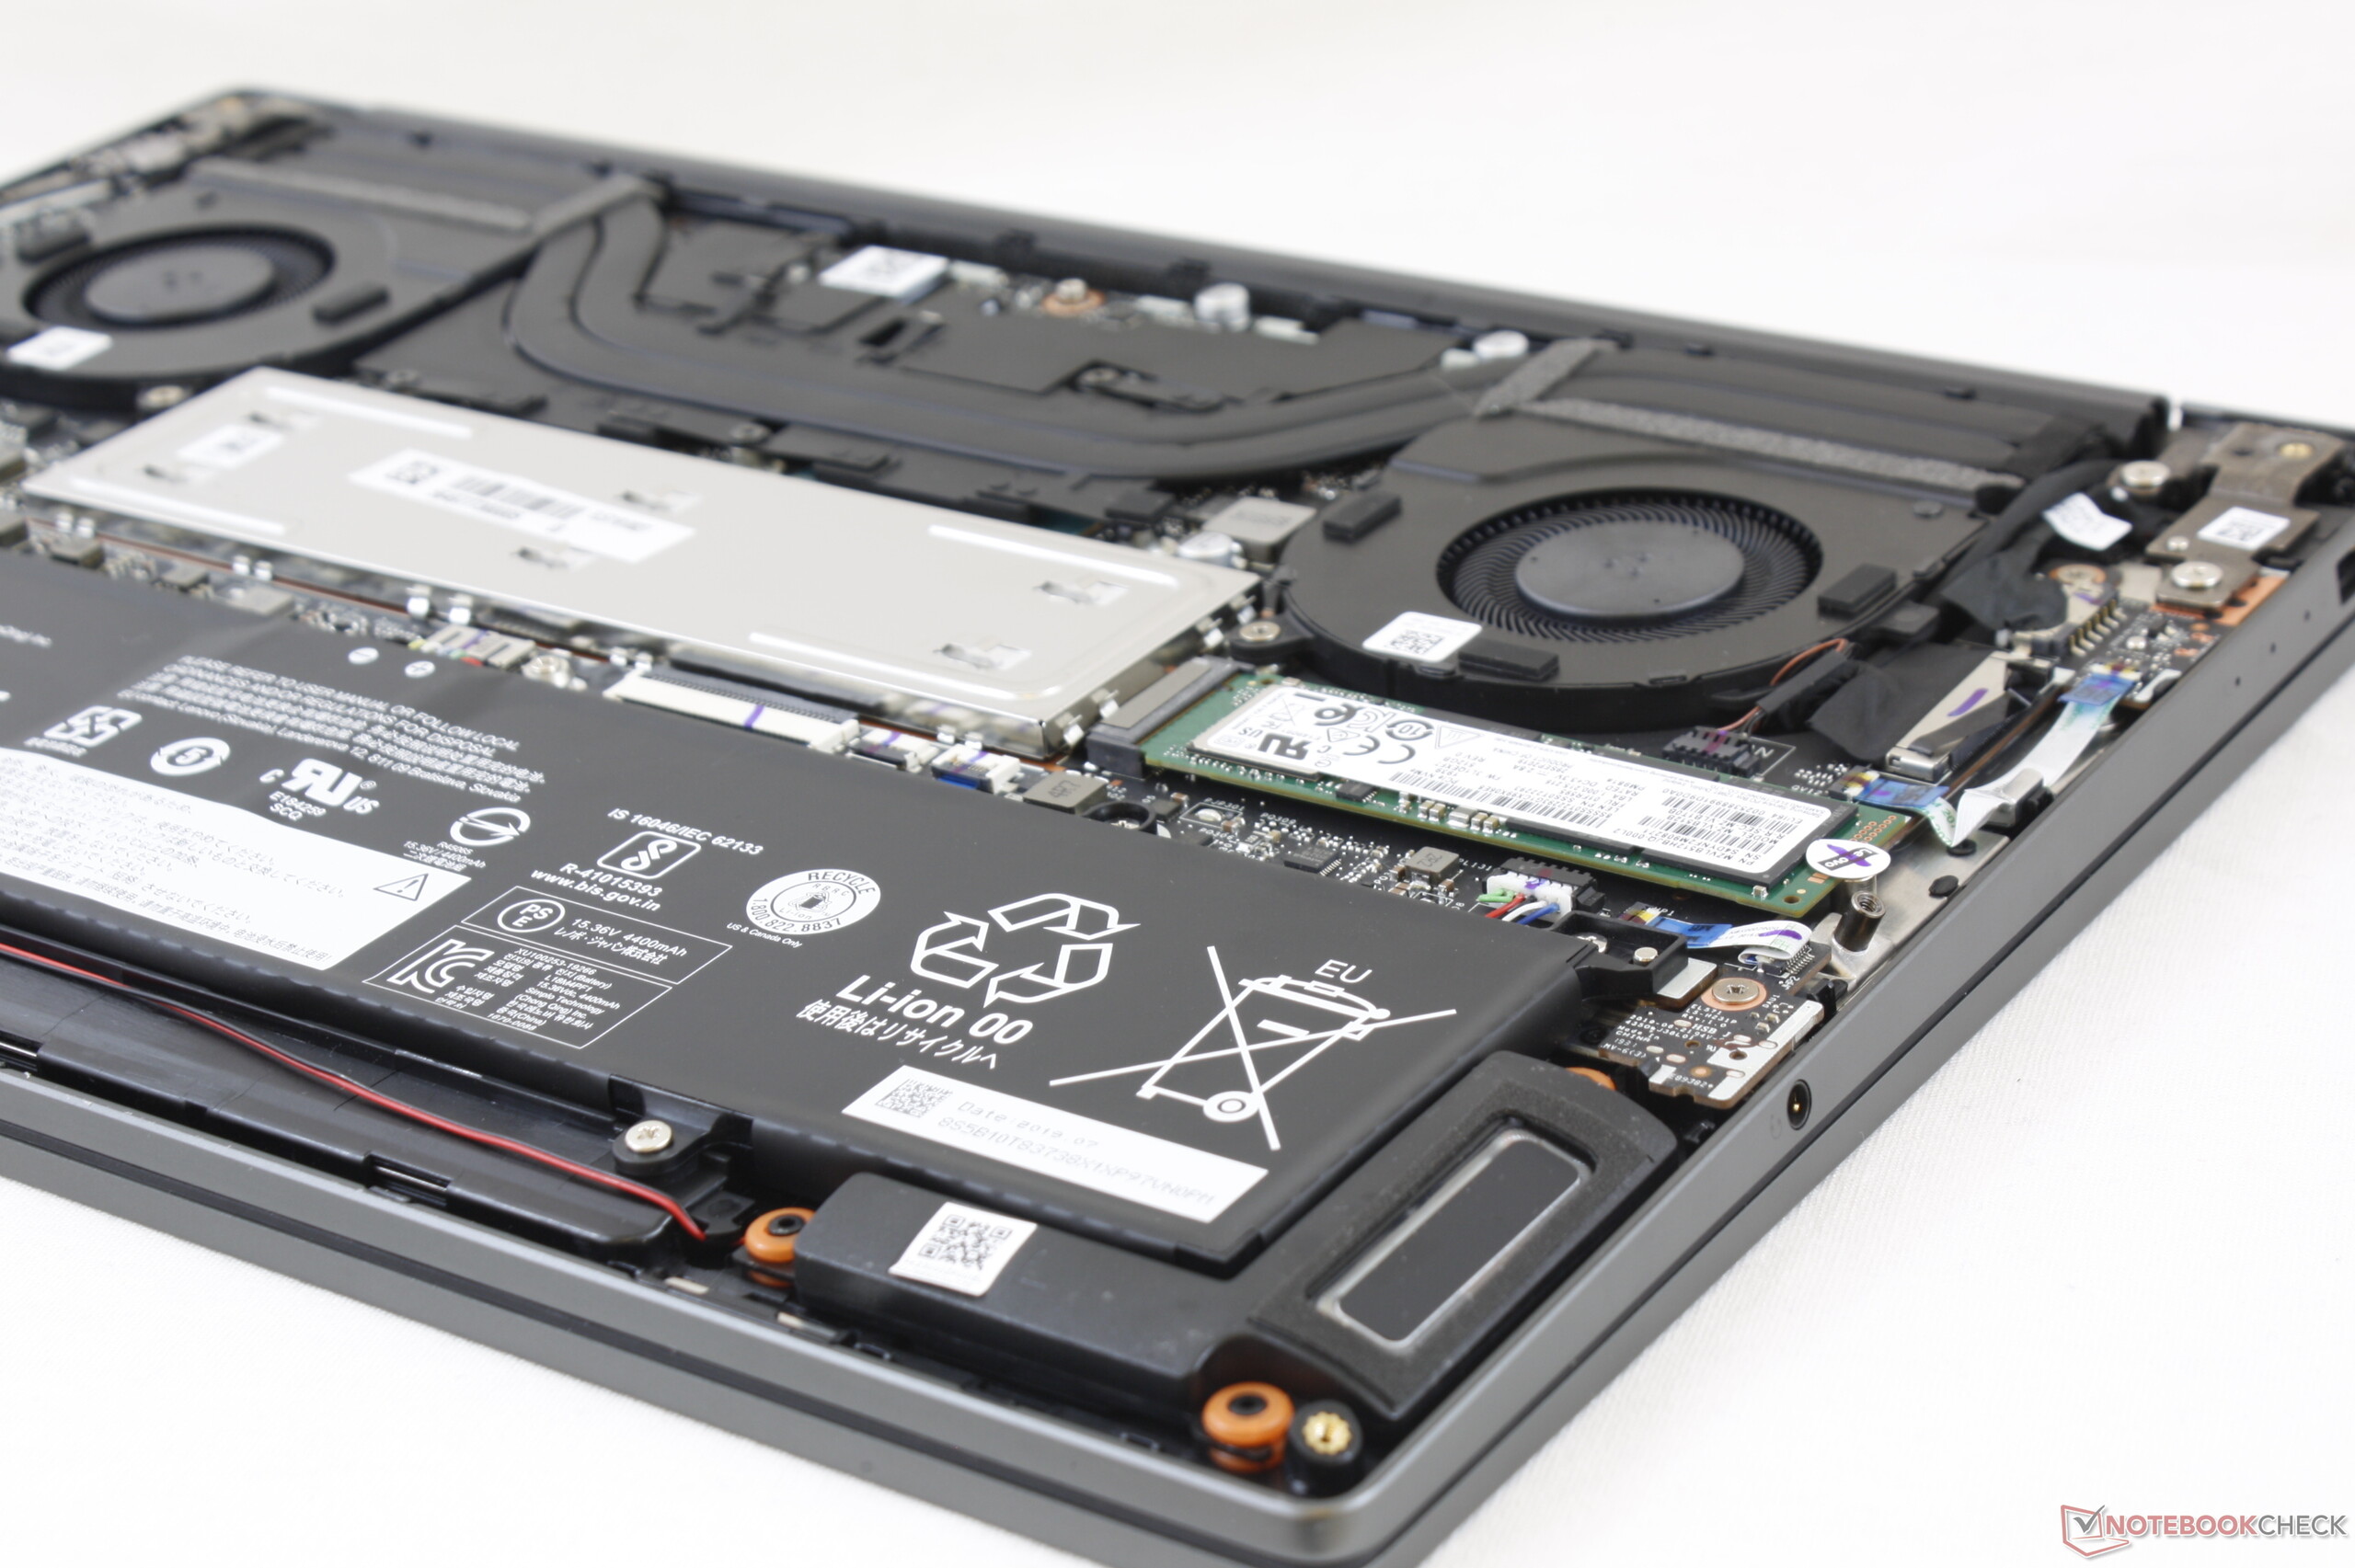
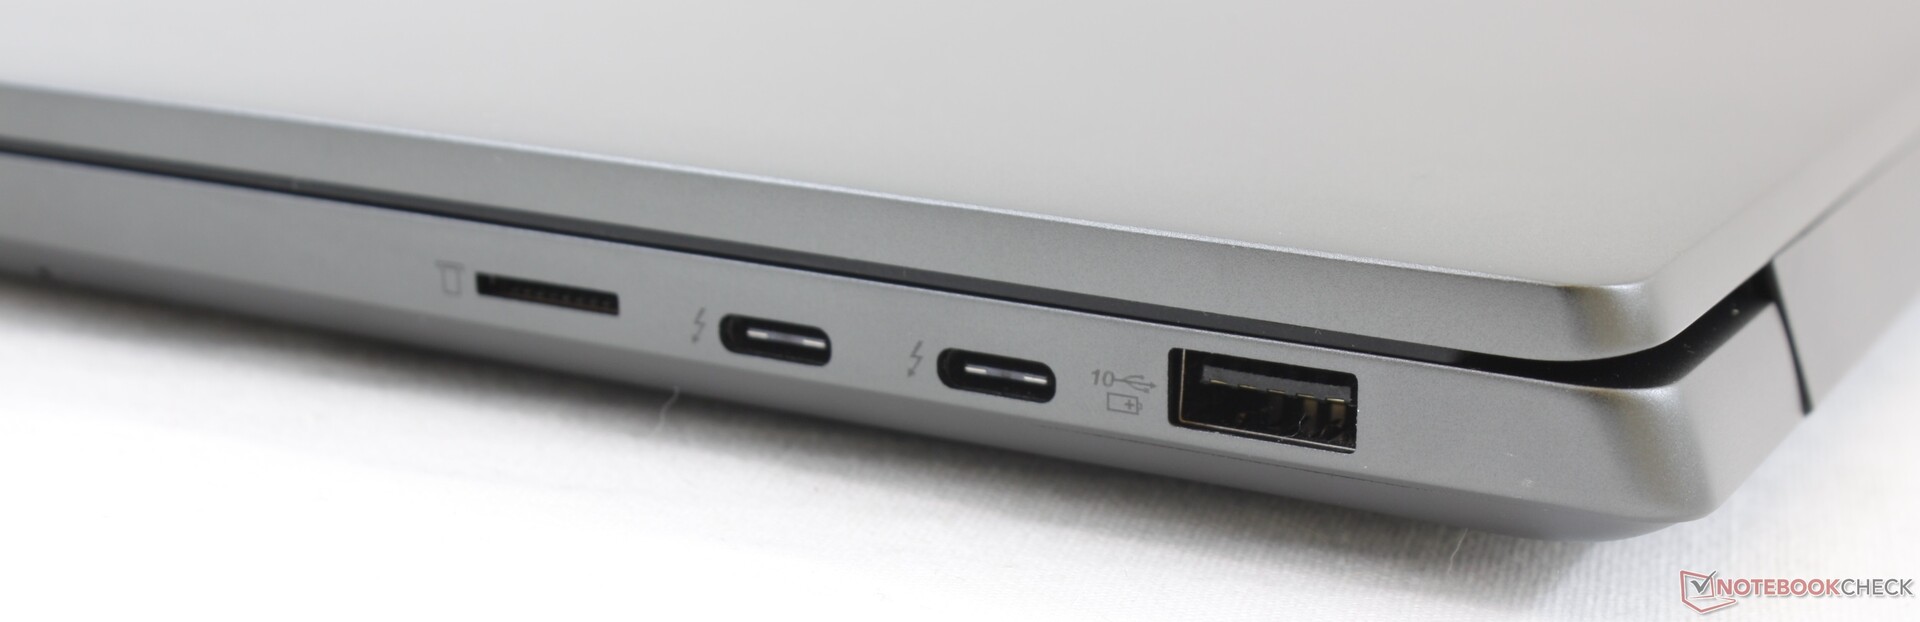
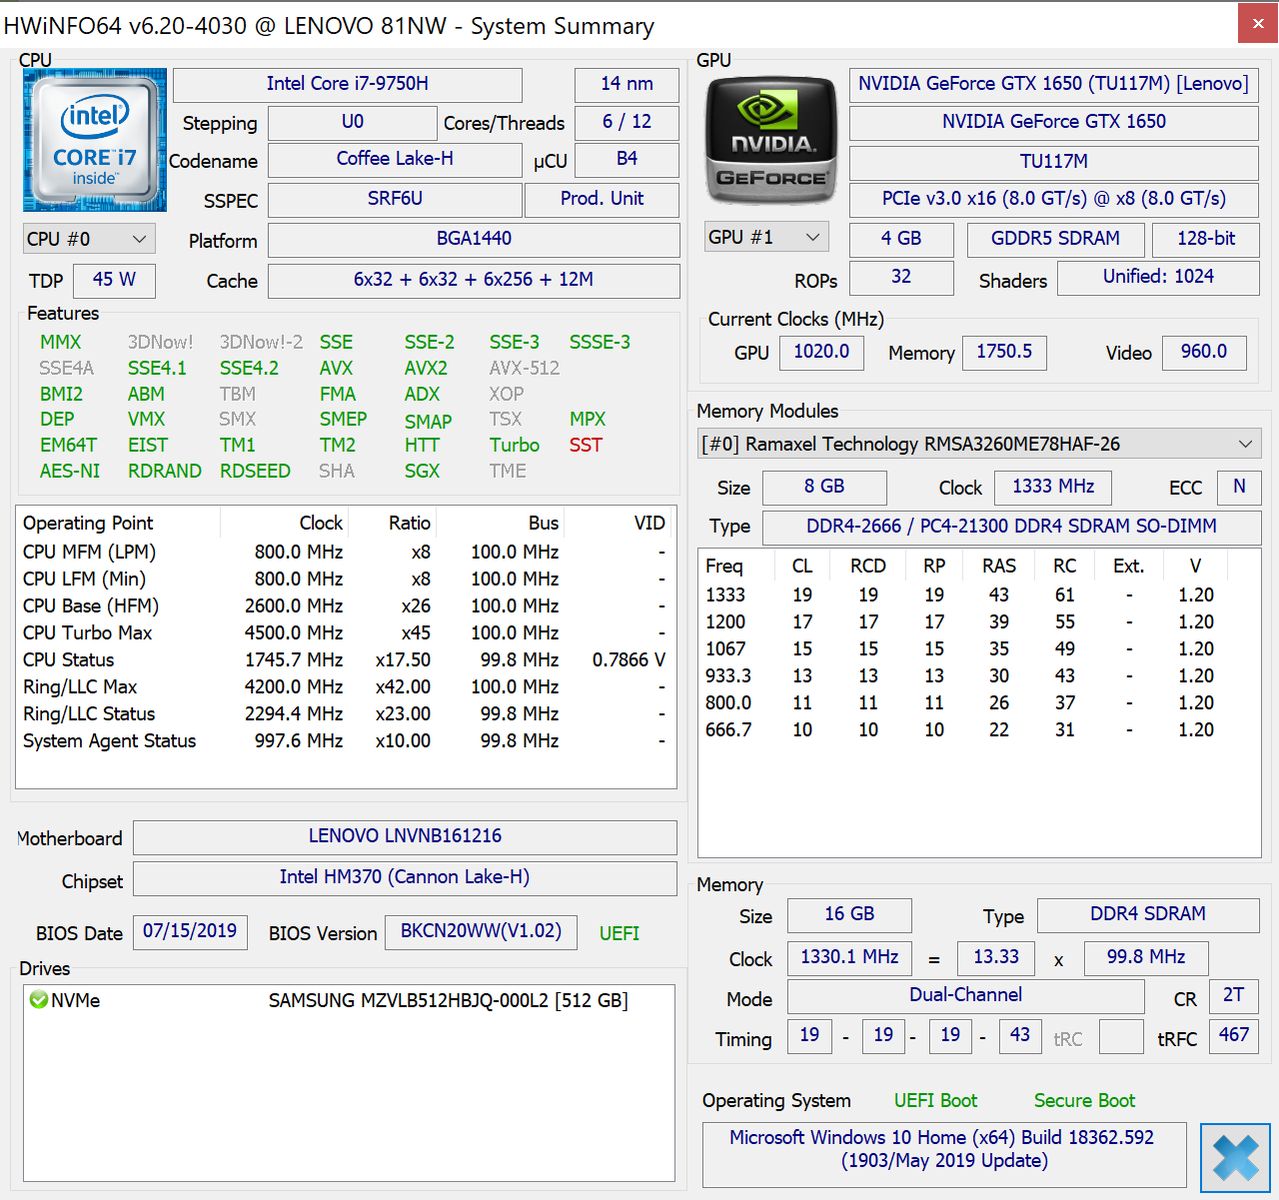
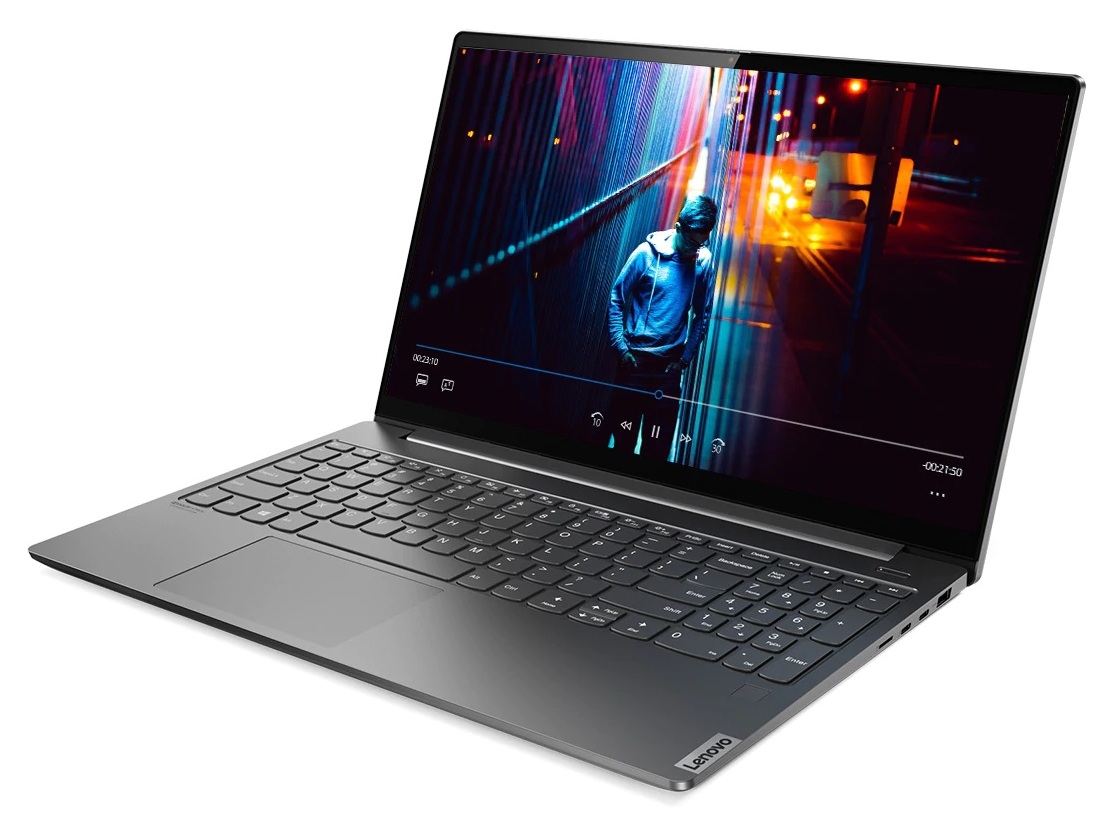
Lenovo IdeaPad S740 är en blandning av delar från mittenskiktet och toppskiktet. Core i7 CPU, GeForce GTX GPU, ljusstark 4K UHD-skärm, SSD från Samsung, dubbla Thunderbolt 3-portar och tunn infattning utmanar Dell XPS 15 och HP Spectre x360 15, modellerna som Lenovo försöker efterlikna. Samtidigt speglar det grunda tangentbordet, det begränsade portutbudet och det ganska böjliga chassit en billigare IdeaPad. Lenovos modell kostar en aning mindre än vad Dells och HP:s motsvarigheter gör med samma Core i7-9750H CPU och GTX 1650/1650 Max-Q GPU, men du får också en sämre skrivupplevelse och en svagare design.
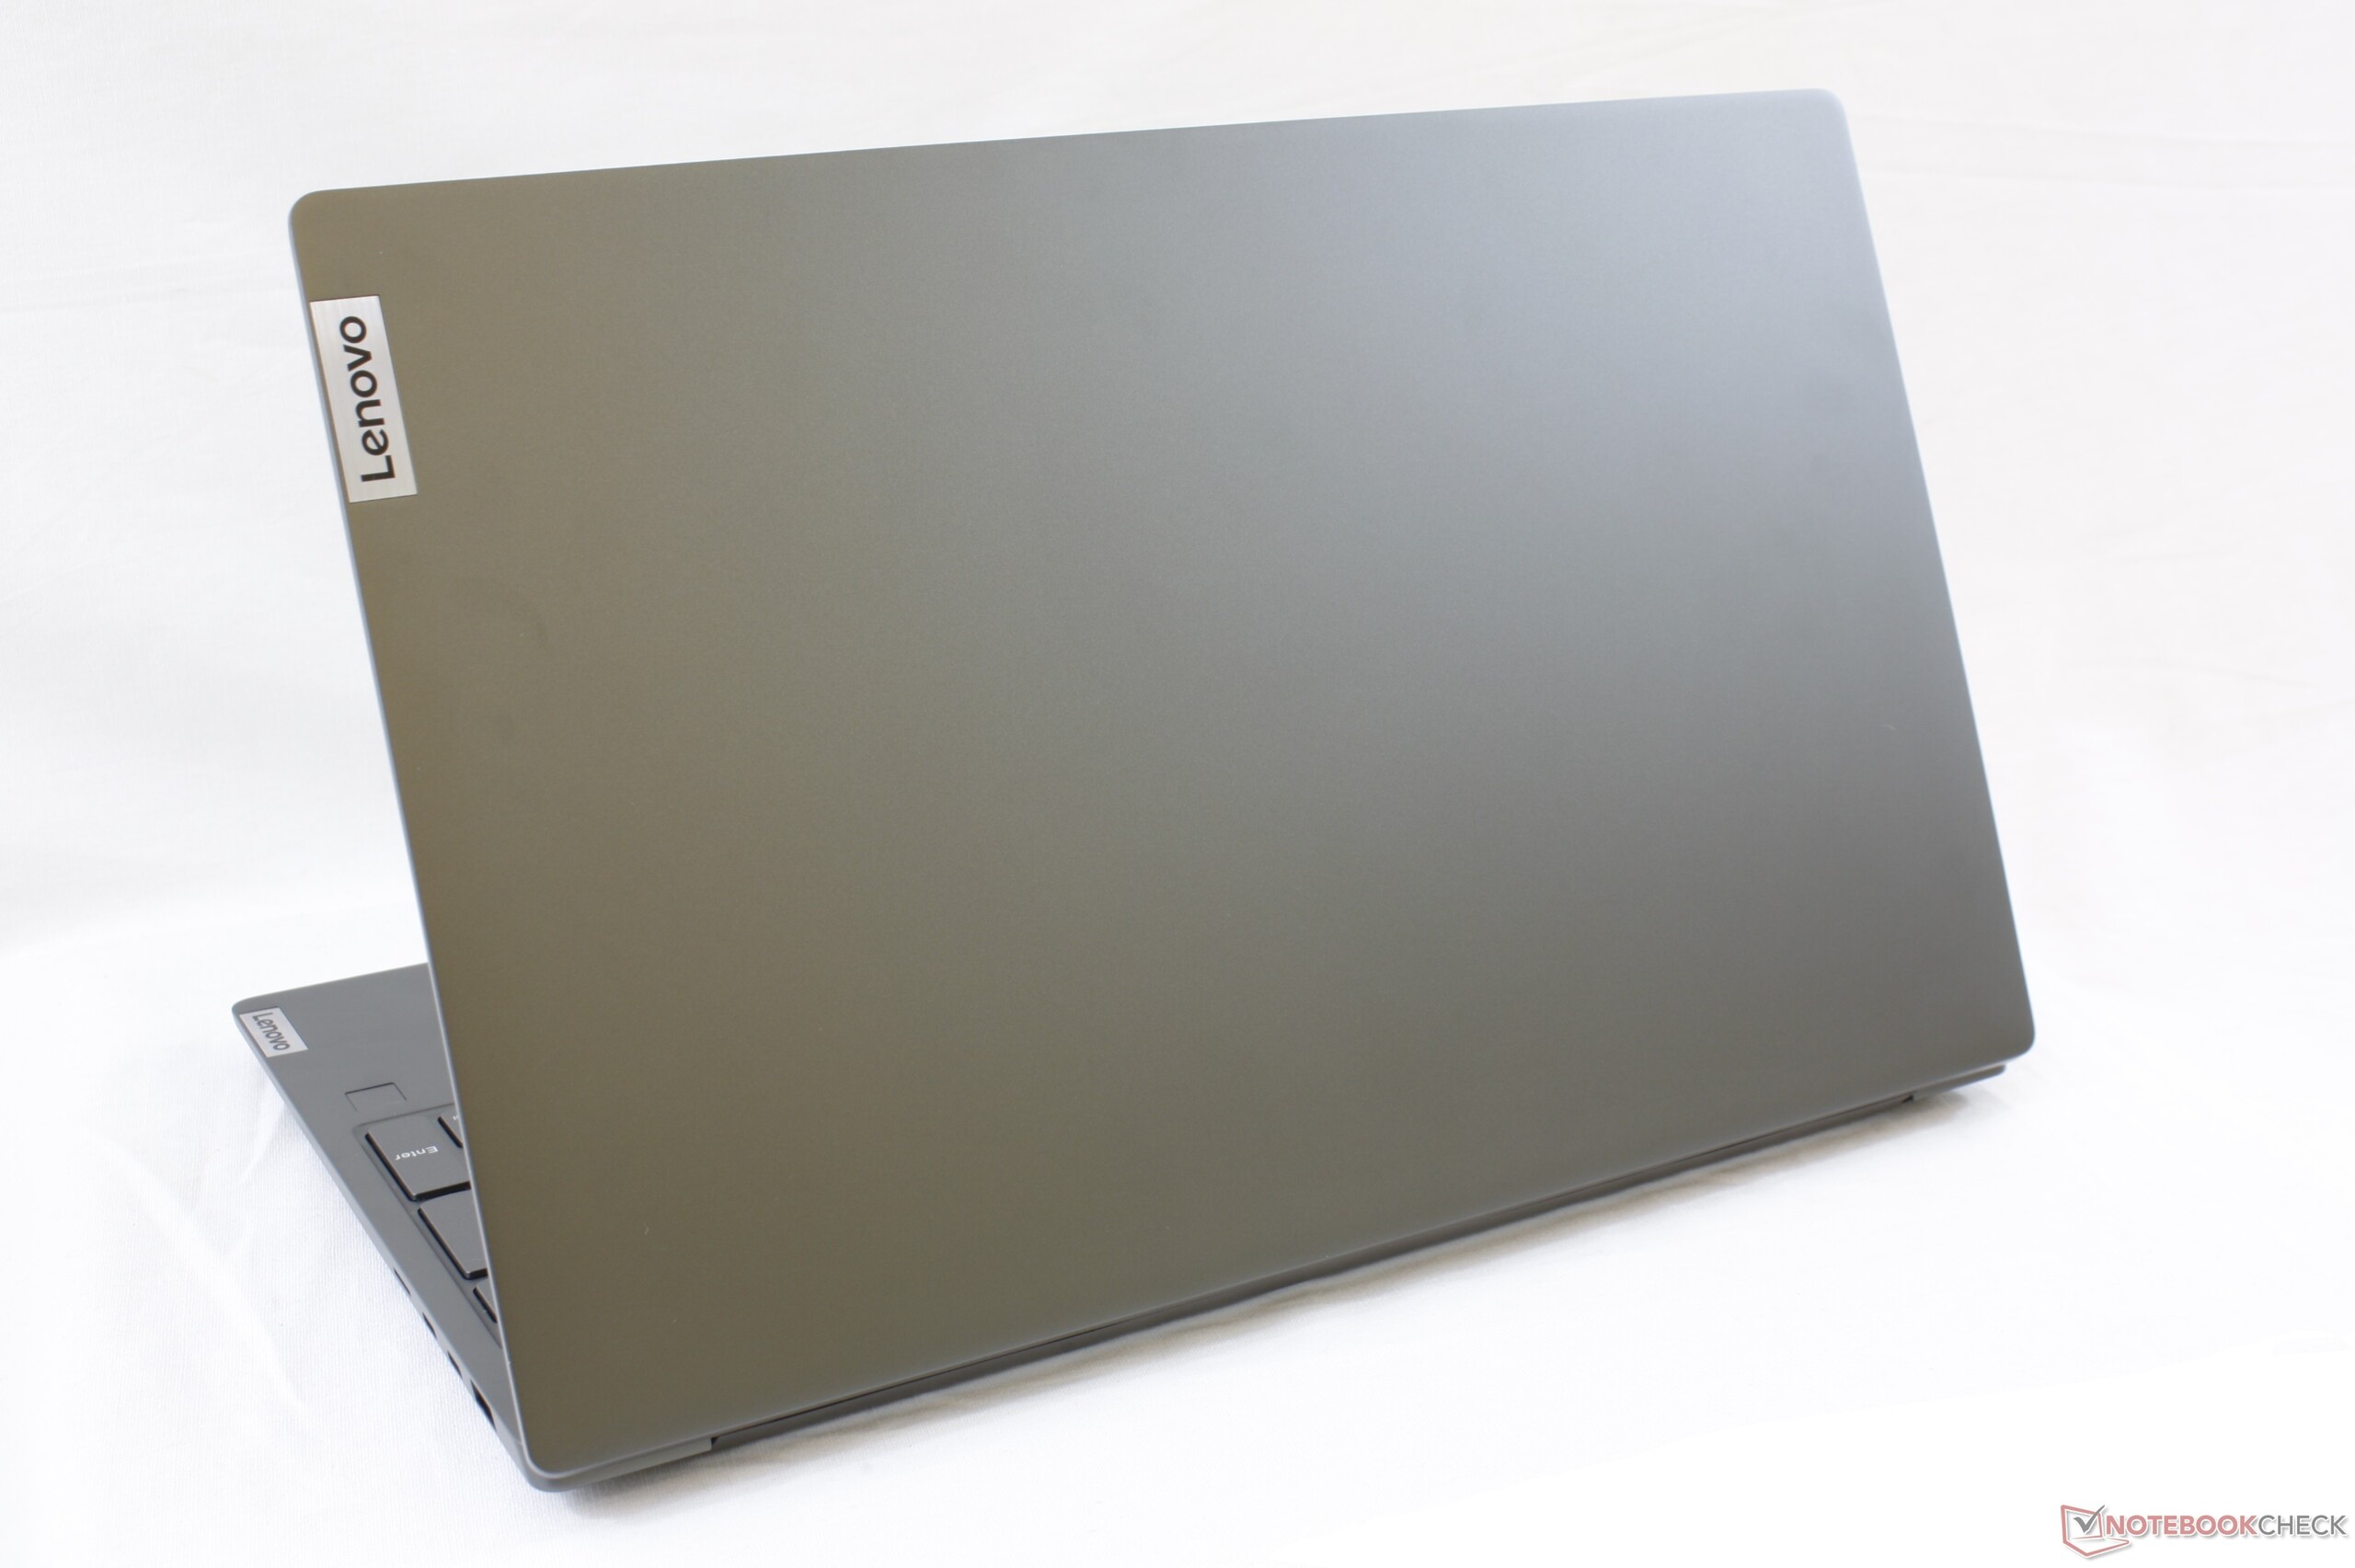
Jämfört med andra IdeaPad-modeller är dock S740 bäst i klassen, både i fråga om utseende och prestanda. Den har kraften från en enklare spelmaskin utan att vara klumpig eller ha ett skrikigt utseende, saker som annars ofta associeras med sådana datorer. På så sätt uppnår den en bättre balans mellan spel, kontor, resor och pris än många andra alternativ från det här prisskiktet.
Dyrare än en typisk IdeaPad samtidigt som den inte kostar lika mycket som Dell XPS eller HP Spectre. IdeaPad S740 är för den som vill ha prestandan från en avancerad multimediamaskin utan att offra för mycket när det kommer till utseende och mobilitet.
Lenovo IdeaPad S740-15IRH
- 01/25/2020 v7 (old)
Allen Ngo
Price comparison
