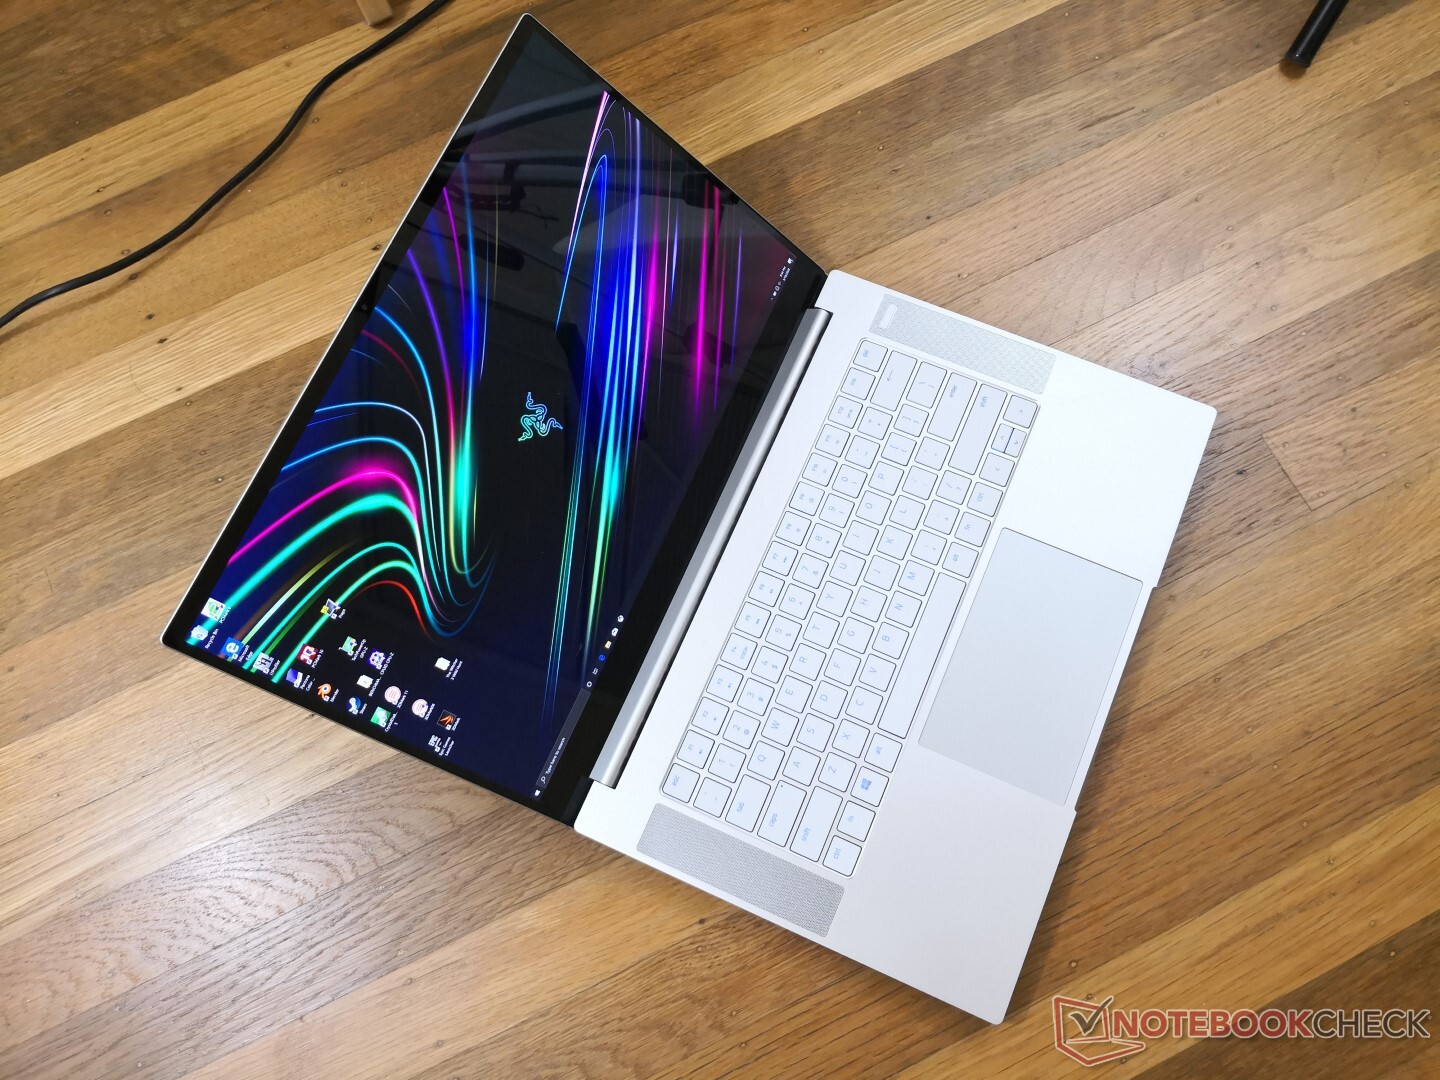
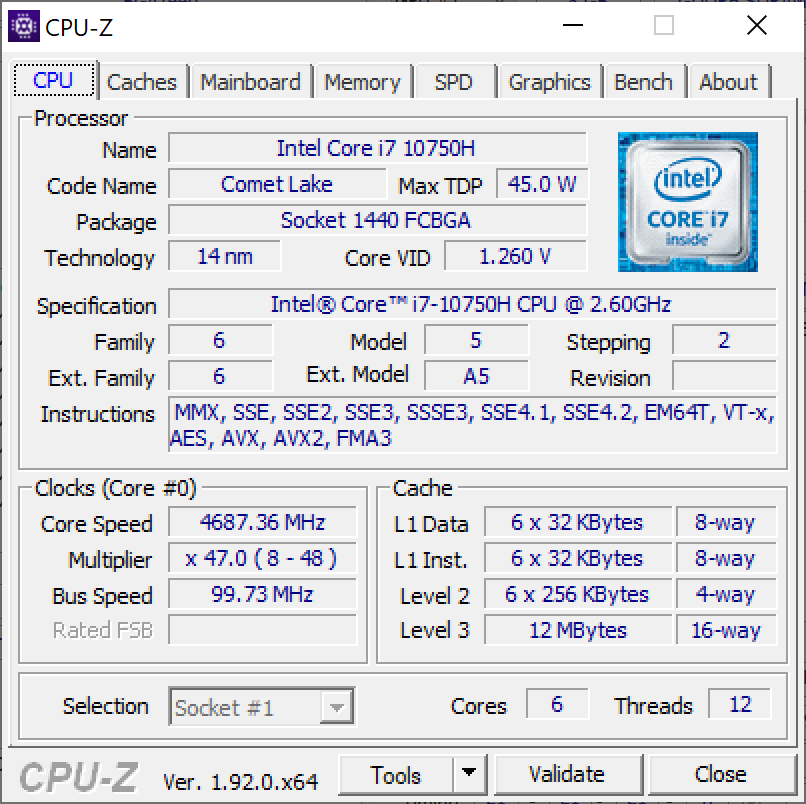
Test: 2020 Razer Blade 15 Base Model - Uppdatering med 10:e Generationens Intel Comet Lake-H (Sammanfattning)
Gradering | Datum | Modell | Vikt | Höjd | Storlek | Upplösning | Pris |
|---|---|---|---|---|---|---|---|
| 86 % v7 (old) | 05/2020 | Razer Blade 15 RZ09-0328 i7-10750H, GeForce RTX 2070 Max-Q | 2.1 kg | 19.9 mm | 15.60" | 3840x2160 | |
| 84 % v7 (old) | 05/2020 | MSI GS66 10SGS i7-10750H, GeForce RTX 2080 Super Max-Q | 2.2 kg | 20 mm | 15.60" | 1920x1080 | |
| 81.5 % v7 (old) | 04/2019 | Asus Zephyrus S GX531GX i7-8750H, GeForce RTX 2080 Max-Q | 2.1 kg | 15.75 mm | 15.60" | 1920x1080 | |
| 85.8 % v7 (old) | 05/2020 | Gigabyte Aero 15 OLED XB-8DE51B0SP i7-10875H, GeForce RTX 2070 Super Max-Q | 2.2 kg | 20 mm | 15.60" | 3840x2160 | |
| 83 % v7 (old) | 09/2019 | Alienware m15 R2 P87F i7-9750H, GeForce RTX 2080 Max-Q | 2.2 kg | 18.3 mm | 15.60" | 1920x1080 | |
| 82.3 % v7 (old) | 11/2019 | Xiaomi Mi Gaming Laptop 2019 i7-9750H, GeForce RTX 2060 Mobile | 2.6 kg | 21 mm | 15.60" | 1920x1080 |


| |||||||||||||||||||||||||
Distribution av ljusstyrkan: 91 %
Mitt på batteriet: 366.7 cd/m²
Kontrast: ∞:1 (Svärta: 0 cd/m²)
ΔE ColorChecker Calman: 5.21 | ∀{0.5-29.43 Ø4.71}
ΔE Greyscale Calman: 2 | ∀{0.09-98 Ø4.96}
100% sRGB (Argyll 1.6.3 3D)
86.6% AdobeRGB 1998 (Argyll 1.6.3 3D)
97.4% AdobeRGB 1998 (Argyll 3D)
100% sRGB (Argyll 3D)
99.9% Display P3 (Argyll 3D)
Gamma: 2.17
CCT: 6514 K
| Razer Blade 15 RZ09-0328 Samsung SDCA029, AMOLED, 15.6", 3840x2160 | MSI GS66 10SGS AU Optronics B156HAN12.0, IPS, 15.6", 1920x1080 | Razer Blade 15 RTX 2080 Max-Q Sharp LQ156M1JW03 (SHP14C5), IPS, 15.6", 1920x1080 | Asus Zephyrus S GX531GX AU Optronics B156HAN08.2, IPS, 15.6", 1920x1080 | Gigabyte Aero 15 OLED XB-8DE51B0SP Samsung SDCA029, OLED, 15.6", 3840x2160 | Alienware m15 R2 P87F Sharp LQ156M1, IPS, 15.6", 1920x1080 | |
|---|---|---|---|---|---|---|
| Display | -19% | -22% | -24% | 0% | -24% | |
| Display P3 Coverage (%) | 99.9 | 69.9 -30% | 66.9 -33% | 65.6 -34% | 99.9 0% | 65.3 -35% |
| sRGB Coverage (%) | 100 | 99.1 -1% | 98.1 -2% | 92.2 -8% | 100 0% | 95.1 -5% |
| AdobeRGB 1998 Coverage (%) | 97.4 | 71.1 -27% | 68.5 -30% | 66.9 -31% | 98.2 1% | 65.9 -32% |
| Response Times | -300% | -337% | -214% | 25% | -373% | |
| Response Time Grey 50% / Grey 80% * (ms) | 2.7 ? | 11.2 ? -315% | 12.8 ? -374% | 7 ? -159% | 2.2 ? 19% | 16.4 ? -507% |
| Response Time Black / White * (ms) | 2.6 ? | 10 ? -285% | 10.4 ? -300% | 9.6 ? -269% | 1.8 ? 31% | 8.8 ? -238% |
| PWM Frequency (Hz) | 59.5 ? | 23810 ? | 60 ? | 23810 ? | ||
| Screen | 8% | 4% | -6% | 20% | -52% | |
| Brightness middle (cd/m²) | 366.7 | 339.4 -7% | 293 -20% | 323.6 -12% | 385 5% | 324.2 -12% |
| Brightness (cd/m²) | 371 | 331 -11% | 270 -27% | 315 -15% | 390 5% | 304 -18% |
| Brightness Distribution (%) | 91 | 92 1% | 87 -4% | 91 0% | 93 2% | 90 -1% |
| Black Level * (cd/m²) | 0.24 | 0.29 | 0.29 | 0.38 | ||
| Colorchecker dE 2000 * | 5.21 | 1.58 70% | 1.69 68% | 3.31 36% | 2.46 53% | 5.01 4% |
| Colorchecker dE 2000 max. * | 7.92 | 3.8 52% | 3.37 57% | 5.74 28% | 4.01 49% | 12.7 -60% |
| Greyscale dE 2000 * | 2 | 2.3 -15% | 2.3 -15% | 2.9 -45% | 1.39 30% | 7.9 -295% |
| Gamma | 2.17 101% | 2.24 98% | 2.3 96% | 2.29 96% | 2.31 95% | 2.35 94% |
| CCT | 6514 100% | 6952 93% | 6758 96% | 6765 96% | 6395 102% | 8455 77% |
| Color Space (Percent of AdobeRGB 1998) (%) | 86.6 | 64.8 -25% | 63 -27% | 59.7 -31% | 98 13% | 60.8 -30% |
| Color Space (Percent of sRGB) (%) | 100 | 99.4 -1% | 98.5 -1% | 91.8 -8% | 100 0% | 95.5 -4% |
| Contrast (:1) | 1414 | 1010 | 1116 | 853 | ||
| Colorchecker dE 2000 calibrated * | 1.47 | 1.24 | 2.73 | 2.6 | 1.64 | |
| Totalt genomsnitt (program/inställningar) | -104% /
-46% | -118% /
-54% | -81% /
-42% | 15% /
16% | -150% /
-95% |
* ... mindre är bättre
Visa svarstider
| ↔ Svarstid svart till vitt | ||
|---|---|---|
| 2.6 ms ... stiga ↗ och falla ↘ kombinerat | ↗ 1.1 ms stiga | 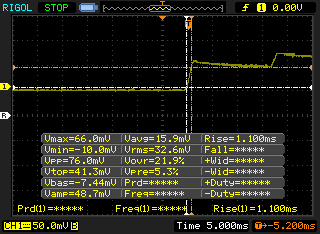 |
| ↘ 1.5 ms hösten | ||
| Skärmen visar väldigt snabba svarsfrekvenser i våra tester och borde vara mycket väl lämpad för fartfyllt spel. I jämförelse sträcker sig alla testade enheter från 0.1 (minst) till 240 (maximalt) ms. » 14 % av alla enheter är bättre. Det betyder att den uppmätta svarstiden är bättre än genomsnittet av alla testade enheter (19.8 ms). | ||
| ↔ Svarstid 50 % grått till 80 % grått | ||
| 2.7 ms ... stiga ↗ och falla ↘ kombinerat | ↗ 1.2 ms stiga | 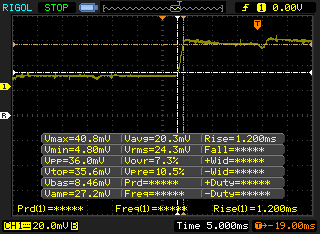 |
| ↘ 1.5 ms hösten | ||
| Skärmen visar väldigt snabba svarsfrekvenser i våra tester och borde vara mycket väl lämpad för fartfyllt spel. I jämförelse sträcker sig alla testade enheter från 0.165 (minst) till 636 (maximalt) ms. » 12 % av alla enheter är bättre. Det betyder att den uppmätta svarstiden är bättre än genomsnittet av alla testade enheter (30.9 ms). | ||
Skärmflimmer / PWM (Puls-Width Modulation)
| Skärmflimmer / PWM upptäckt | 59.5 Hz | ≤ 100 % ljusstyrka inställning | 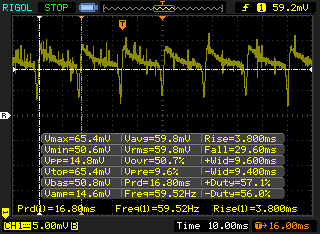 |
Displayens bakgrundsbelysning flimrar vid 59.5 Hz (i värsta fall, t.ex. med PWM) Flimrande upptäckt vid en ljusstyrkeinställning på 100 % och lägre. Det ska inte finnas något flimmer eller PWM över denna ljusstyrkeinställning. Frekvensen för 59.5 Hz är mycket låg, så flimmer kan orsaka ögon- och huvudvärk efter långvarig användning. Som jämförelse: 52 % av alla testade enheter använder inte PWM för att dämpa skärmen. Om PWM upptäcktes mättes ett medelvärde av 7741 (minst: 5 - maximum: 343500) Hz. | |||
Cinebench R15: CPU Multi 64Bit | CPU Single 64Bit
Blender: v2.79 BMW27 CPU
7-Zip 18.03: 7z b 4 -mmt1 | 7z b 4
Geekbench 5.5: Single-Core | Multi-Core
HWBOT x265 Benchmark v2.2: 4k Preset
LibreOffice : 20 Documents To PDF
R Benchmark 2.5: Overall mean
| Cinebench R20 / CPU (Multi Core) | |
| Eurocom Sky X4C i9-9900KS | |
| Asus Zephyrus G14 GA401IV | |
| Asus TUF Gaming A15 FA506UI | |
| Gigabyte Aero 15 OLED XB-8DE51B0SP | |
| MSI GS66 Stealth 10SFS | |
| MSI GE65 Raider 9SF-049US | |
| Genomsnitt Intel Core i7-10750H (1749 - 3325, n=43) | |
| Razer Blade 15 RZ09-0328 | |
| Genomsnitt Intel Core i7-9750H (2017 - 3133, n=55) | |
| MSI GE63 Raider 8SG | |
| Razer Blade 15 GTX 1660 Ti | |
| MSI Alpha 15 A3DDK-034 | |
| Cinebench R20 / CPU (Single Core) | |
| Gigabyte Aero 15 OLED XB-8DE51B0SP | |
| Eurocom Sky X4C i9-9900KS | |
| Asus Zephyrus G14 GA401IV | |
| MSI GS66 Stealth 10SFS | |
| MSI GE65 Raider 9SF-049US | |
| Genomsnitt Intel Core i7-10750H (431 - 504, n=43) | |
| Razer Blade 15 RZ09-0328 | |
| Genomsnitt Intel Core i7-9750H (416 - 486, n=55) | |
| Razer Blade 15 GTX 1660 Ti | |
| MSI GE63 Raider 8SG | |
| MSI Alpha 15 A3DDK-034 | |
| Cinebench R15 / CPU Multi 64Bit | |
| Eurocom Sky X4C i9-9900KS | |
| Asus Zephyrus G14 GA401IV | |
| Asus TUF Gaming A15 FA506UI | |
| Gigabyte Aero 15 OLED XB-8DE51B0SP | |
| MSI GS66 Stealth 10SFS | |
| MSI GE65 Raider 9SF-049US | |
| Genomsnitt Intel Core i7-10750H (804 - 1418, n=50) | |
| Genomsnitt Intel Core i7-9750H (952 - 1306, n=85) | |
| Razer Blade 15 RZ09-0328 | |
| MSI GE63 Raider 8SG | |
| Razer Blade 15 GTX 1660 Ti | |
| MSI Alpha 15 A3DDK-034 | |
| Cinebench R15 / CPU Single 64Bit | |
| Eurocom Sky X4C i9-9900KS | |
| Gigabyte Aero 15 OLED XB-8DE51B0SP | |
| MSI GS66 Stealth 10SFS | |
| MSI GE65 Raider 9SF-049US | |
| Genomsnitt Intel Core i7-10750H (184 - 213, n=45) | |
| Asus Zephyrus G14 GA401IV | |
| Razer Blade 15 RZ09-0328 | |
| Genomsnitt Intel Core i7-9750H (170 - 194, n=82) | |
| Razer Blade 15 GTX 1660 Ti | |
| MSI GE63 Raider 8SG | |
| MSI Alpha 15 A3DDK-034 | |
| Blender / v2.79 BMW27 CPU | |
| Genomsnitt Intel Core i7-9750H (342 - 495, n=21) | |
| Razer Blade 15 RZ09-0328 | |
| Genomsnitt Intel Core i7-10750H (322 - 587, n=43) | |
| Asus Zephyrus G14 GA401IV | |
| MSI GS66 Stealth 10SFS | |
| Gigabyte Aero 15 OLED XB-8DE51B0SP | |
| Eurocom Sky X4C i9-9900KS | |
| 7-Zip 18.03 / 7z b 4 -mmt1 | |
| Eurocom Sky X4C i9-9900KS | |
| Gigabyte Aero 15 OLED XB-8DE51B0SP | |
| MSI GS66 Stealth 10SFS | |
| Genomsnitt Intel Core i7-10750H (4504 - 5470, n=43) | |
| Razer Blade 15 RZ09-0328 | |
| Genomsnitt Intel Core i7-9750H (4580 - 5090, n=21) | |
| Asus Zephyrus G14 GA401IV | |
| 7-Zip 18.03 / 7z b 4 | |
| Eurocom Sky X4C i9-9900KS | |
| Asus Zephyrus G14 GA401IV | |
| Gigabyte Aero 15 OLED XB-8DE51B0SP | |
| MSI GS66 Stealth 10SFS | |
| Genomsnitt Intel Core i7-10750H (26040 - 37345, n=43) | |
| Genomsnitt Intel Core i7-9750H (28512 - 35174, n=21) | |
| Razer Blade 15 RZ09-0328 | |
| Geekbench 5.5 / Single-Core | |
| Eurocom Sky X4C i9-9900KS | |
| Gigabyte Aero 15 OLED XB-8DE51B0SP | |
| MSI GS66 Stealth 10SFS | |
| Genomsnitt Intel Core i7-10750H (1114 - 1333, n=43) | |
| Asus Zephyrus G14 GA401IV | |
| Genomsnitt Intel Core i7-9750H (1117 - 1251, n=13) | |
| Razer Blade 15 RZ09-0328 | |
| MSI Alpha 15 A3DDK-034 | |
| Geekbench 5.5 / Multi-Core | |
| Eurocom Sky X4C i9-9900KS | |
| Gigabyte Aero 15 OLED XB-8DE51B0SP | |
| Asus Zephyrus G14 GA401IV | |
| MSI GS66 Stealth 10SFS | |
| Genomsnitt Intel Core i7-10750H (4443 - 6674, n=43) | |
| Genomsnitt Intel Core i7-9750H (4859 - 6262, n=13) | |
| Razer Blade 15 RZ09-0328 | |
| MSI Alpha 15 A3DDK-034 | |
| HWBOT x265 Benchmark v2.2 / 4k Preset | |
| Eurocom Sky X4C i9-9900KS | |
| Gigabyte Aero 15 OLED XB-8DE51B0SP | |
| MSI GS66 Stealth 10SFS | |
| Asus Zephyrus G14 GA401IV | |
| Genomsnitt Intel Core i7-10750H (5.54 - 11.6, n=43) | |
| Genomsnitt Intel Core i7-9750H (7.1 - 10.7, n=21) | |
| Razer Blade 15 RZ09-0328 | |
| LibreOffice / 20 Documents To PDF | |
| Genomsnitt Intel Core i7-9750H (54.5 - 64.7, n=9) | |
| Genomsnitt Intel Core i7-10750H (43.1 - 99.2, n=43) | |
| Razer Blade 15 RZ09-0328 | |
| MSI GS66 Stealth 10SFS | |
| Gigabyte Aero 15 OLED XB-8DE51B0SP | |
| R Benchmark 2.5 / Overall mean | |
| Genomsnitt Intel Core i7-9750H (0.608 - 0.695, n=14) | |
| Genomsnitt Intel Core i7-10750H (0.578 - 0.708, n=42) | |
| MSI GS66 Stealth 10SFS | |
| Gigabyte Aero 15 OLED XB-8DE51B0SP | |
* ... mindre är bättre
| PCMark 8 | |
| Home Score Accelerated v2 | |
| MSI GS66 10SGS | |
| Razer Blade 15 RTX 2080 Max-Q | |
| Alienware m15 R2 P87F | |
| Asus Zephyrus S GX531GX | |
| Razer Blade 15 RZ09-0328 | |
| Work Score Accelerated v2 | |
| MSI GS66 10SGS | |
| Razer Blade 15 RTX 2080 Max-Q | |
| Alienware m15 R2 P87F | |
| Asus Zephyrus S GX531GX | |
| Razer Blade 15 RZ09-0328 | |
| PCMark 8 Home Score Accelerated v2 | 3696 poäng | |
| PCMark 8 Work Score Accelerated v2 | 4705 poäng | |
| PCMark 10 Score | 5244 poäng | |
Hjälp | ||
| DPC Latencies / LatencyMon - interrupt to process latency (max), Web, Youtube, Prime95 | |
| Apple MacBook Air 2020 i5 | |
| Gigabyte Aero 15 OLED XB-8DE51B0SP | |
| MSI GS66 10SGS | |
| Schenker XMG Apex 15 NH57AF1 | |
| Razer Blade 15 RZ09-0328 | |
* ... mindre är bättre
| Razer Blade 15 RZ09-0328 Lite-On CA5-8D512 | Razer Blade 15 RTX 2080 Max-Q Samsung SSD PM981 MZVLB512HAJQ | MSI GS66 10SGS Samsung SSD PM981 MZVLB512HAJQ | Asus Zephyrus S GX531GX Intel SSD 660p SSDPEKNW512G8 | Gigabyte Aero 15 OLED XB-8DE51B0SP Intel Optane Memory H10 with Solid State Storage 32GB + 512GB HBRPEKNX0202A(L/H) | Alienware m15 R2 P87F 2x Toshiba XG6 KXG60ZNV512G (RAID 0) | |
|---|---|---|---|---|---|---|
| AS SSD | 18% | 21% | -27% | -15% | 6% | |
| Seq Read (MB/s) | 2021 | 1832 -9% | 1086 -46% | 1239 -39% | 1200 -41% | 1925 -5% |
| Seq Write (MB/s) | 2090 | 1864 -11% | 1901 -9% | 920 -56% | 836 -60% | 2371 13% |
| 4K Read (MB/s) | 47.71 | 52.1 9% | 51 7% | 45.74 -4% | 65.8 38% | 37.2 -22% |
| 4K Write (MB/s) | 101.1 | 108.3 7% | 117.3 16% | 95.7 -5% | 103.8 3% | 108.9 8% |
| 4K-64 Read (MB/s) | 856 | 1159 35% | 1503 76% | 322 -62% | 789 -8% | 1177 38% |
| 4K-64 Write (MB/s) | 1041 | 1807 74% | 1721 65% | 722 -31% | 929 -11% | 1135 9% |
| Access Time Read * (ms) | 0.052 | 0.05 4% | 0.059 -13% | 0.073 -40% | 0.103 -98% | 0.065 -25% |
| Access Time Write * (ms) | 0.111 | 0.034 69% | 0.1 10% | 0.047 58% | 0.045 59% | 0.108 3% |
| Score Read (Points) | 1105 | 1394 26% | 1662 50% | 492 -55% | 975 -12% | 1407 27% |
| Score Write (Points) | 1351 | 2102 56% | 2029 50% | 910 -33% | 1117 -17% | 1481 10% |
| Score Total (Points) | 3037 | 4221 39% | 4588 51% | 1654 -46% | 2594 -15% | 3633 20% |
| Copy ISO MB/s (MB/s) | 2474 | 2083 -16% | 2155 -13% | 1236 -50% | 2073 -16% | |
| Copy Program MB/s (MB/s) | 679 | 496.5 -27% | 715 5% | 703 4% | 576 -15% | |
| Copy Game MB/s (MB/s) | 1037 | 977 -6% | 1506 45% | 812 -22% | 1426 38% | |
| CrystalDiskMark 5.2 / 6 | -11% | -9% | -41% | -2% | 4% | |
| Write 4K (MB/s) | 118.7 | 137.2 16% | 132.5 12% | 93.9 -21% | 127.4 7% | 108.8 -8% |
| Read 4K (MB/s) | 52.4 | 46.82 -11% | 45.03 -14% | 46.29 -12% | 147.5 181% | 45.41 -13% |
| Write Seq (MB/s) | 2247 | 1221 -46% | 1987 -12% | 974 -57% | 485.9 -78% | 2467 10% |
| Read Seq (MB/s) | 2234 | 1217 -46% | 1434 -36% | 1425 -36% | 1352 -39% | 2456 10% |
| Write 4K Q32T1 (MB/s) | 515 | 527 2% | 467.5 -9% | 259.4 -50% | 476.5 -7% | 532 3% |
| Read 4K Q32T1 (MB/s) | 584 | 614 5% | 536 -8% | 296.5 -49% | 531 -9% | 590 1% |
| Write Seq Q32T1 (MB/s) | 2235 | 1986 -11% | 2003 -10% | 977 -56% | 1061 -53% | 2801 25% |
| Read Seq Q32T1 (MB/s) | 3171 | 3234 2% | 3306 4% | 1666 -47% | 2552 -20% | 3172 0% |
| Totalt genomsnitt (program/inställningar) | 4% /
7% | 6% /
10% | -34% /
-32% | -9% /
-9% | 5% /
5% |
* ... mindre är bättre

Diskstrypning: DiskSpd Read Loop, Queue Depth 8
| 3DMark 11 Performance | 18964 poäng | |
| 3DMark Cloud Gate Standard Score | 26823 poäng | |
| 3DMark Fire Strike Score | 15800 poäng | |
| 3DMark Time Spy Score | 6527 poäng | |
Hjälp | ||
| Shadow of the Tomb Raider | |
| 1920x1080 Highest Preset AA:T | |
| Razer Blade Pro 17 4K UHD 120 Hz | |
| Asus ROG Strix RTX 2070 OC | |
| Razer Blade 15 RZ09-0328 | |
| Walmart EVOO Gaming 17 | |
| Asus Strix Scar III G531GW-AZ062T | |
| Genomsnitt NVIDIA GeForce RTX 2070 Max-Q (57 - 89, n=12) | |
| Asus Zephyrus G14 GA401IV | |
| Razer Blade 15 GTX 1660 Ti | |
| HP Omen 15-dc0015ng | |
| Asus TUF FX705GM | |
| 1920x1080 High Preset AA:SM | |
| Razer Blade Pro 17 4K UHD 120 Hz | |
| Asus ROG Strix RTX 2070 OC | |
| Walmart EVOO Gaming 17 | |
| Razer Blade 15 RZ09-0328 | |
| Asus Strix Scar III G531GW-AZ062T | |
| Genomsnitt NVIDIA GeForce RTX 2070 Max-Q (62 - 98, n=12) | |
| Asus Zephyrus G14 GA401IV | |
| Razer Blade 15 GTX 1660 Ti | |
| HP Omen 15-dc0015ng | |
| Asus TUF FX705GM | |
| låg | med. | hög | ultra | 4K | |
|---|---|---|---|---|---|
| The Witcher 3 (2015) | 289.6 | 203.3 | 118.8 | 61.9 | 43.5 |
| Dota 2 Reborn (2015) | 143 | 132 | 124 | 116 | 90.8 |
| X-Plane 11.11 (2018) | 94.1 | 88.5 | 79.5 | 51.4 | |
| Shadow of the Tomb Raider (2018) | 129 | 100 | 94 | 85 | 30 |
| Borderlands 3 (2019) | 135.6 | 103.2 | 74.4 | 57.3 | 21.5 |
| Razer Blade 15 RZ09-0328 GeForce RTX 2070 Max-Q, i7-10750H, Lite-On CA5-8D512 | MSI GS66 10SGS GeForce RTX 2080 Super Max-Q, i7-10750H, Samsung SSD PM981 MZVLB512HAJQ | Razer Blade 15 RTX 2080 Max-Q GeForce RTX 2080 Max-Q, i7-9750H, Samsung SSD PM981 MZVLB512HAJQ | Asus Zephyrus S GX531GX GeForce RTX 2080 Max-Q, i7-8750H, Intel SSD 660p SSDPEKNW512G8 | Gigabyte Aero 15 OLED XB-8DE51B0SP GeForce RTX 2070 Super Max-Q, i7-10875H, Intel Optane Memory H10 with Solid State Storage 32GB + 512GB HBRPEKNX0202A(L/H) | Alienware m15 R2 P87F GeForce RTX 2080 Max-Q, i7-9750H, 2x Toshiba XG6 KXG60ZNV512G (RAID 0) | |
|---|---|---|---|---|---|---|
| Noise | -2% | 7% | -8% | -13% | -10% | |
| av / miljö * (dB) | 28.4 | 28.5 -0% | 28.3 -0% | 28.7 -1% | 30 -6% | 28.3 -0% |
| Idle Minimum * (dB) | 28.4 | 30 -6% | 28.8 -1% | 29.8 -5% | 34 -20% | 28.5 -0% |
| Idle Average * (dB) | 28.4 | 30 -6% | 28.8 -1% | 32.4 -14% | 36 -27% | 28.5 -0% |
| Idle Maximum * (dB) | 31.7 | 30.9 3% | 29 9% | 38 -20% | 41 -29% | 49 -55% |
| Load Average * (dB) | 47.7 | 39.5 17% | 33.5 30% | 38.2 20% | 48 -1% | 49 -3% |
| Witcher 3 ultra * (dB) | 47.5 | 48 -1% | 45 5% | 56.6 -19% | 48 -1% | 49 -3% |
| Load Maximum * (dB) | 49.5 | 59.4 -20% | 45.2 9% | 56.6 -14% | 54 -9% | 55 -11% |
* ... mindre är bättre
Ljudnivå
| Låg belastning |
| 28.4 / 28.4 / 31.7 dB(A) |
| Hög belastning |
| 47.7 / 49.5 dB(A) |
 | ||
30 dB tyst 40 dB(A) hörbar 50 dB(A) högt ljud |
||
min: | ||
(-) Den maximala temperaturen på ovansidan är 49.6 °C / 121 F, jämfört med genomsnittet av 40.4 °C / 105 F , allt från 21.2 till 68.8 °C för klassen Gaming.
(-) Botten värms upp till maximalt 50.2 °C / 122 F, jämfört med genomsnittet av 43.2 °C / 110 F
(+) Vid tomgångsbruk är medeltemperaturen för ovansidan 30.3 °C / 87 F, jämfört med enhetsgenomsnittet på 33.9 °C / ### class_avg_f### F.
(-) När du spelar The Witcher 3 är medeltemperaturen för ovansidan 40.6 °C / 105 F, jämfört med enhetsgenomsnittet på 33.9 °C / ## #class_avg_f### F.
(±) Handledsstöden och pekplattan kan bli väldigt varma vid beröring med maximalt 39.6 °C / 103.3 F.
(-) Medeltemperaturen för handledsstödsområdet på liknande enheter var 28.8 °C / 83.8 F (-10.8 °C / -19.5 F).
Razer Blade 15 RZ09-0328 ljudanalys
(±) | högtalarljudstyrkan är genomsnittlig men bra (79.2 dB)
Bas 100 - 315 Hz
(±) | reducerad bas - i genomsnitt 12.3% lägre än medianen
(±) | linjäriteten för basen är genomsnittlig (12.7% delta till föregående frekvens)
Mellan 400 - 2000 Hz
(±) | högre mellan - i genomsnitt 8.4% högre än median
(+) | mids är linjära (5.9% delta till föregående frekvens)
Högsta 2 - 16 kHz
(±) | reducerade toppar - i genomsnitt 7.3% lägre än medianen
(±) | linjäriteten för toppar är genomsnittlig (7.5% delta till föregående frekvens)
Totalt 100 - 16 000 Hz
(±) | linjäriteten för det totala ljudet är genomsnittlig (27.7% skillnad mot median)
Jämfört med samma klass
» 93% av alla testade enheter i den här klassen var bättre, 1% liknande, 5% sämre
» Den bästa hade ett delta på 6%, genomsnittet var 18%, sämst var 132%
Jämfört med alla testade enheter
» 84% av alla testade enheter var bättre, 3% liknande, 13% sämre
» Den bästa hade ett delta på 4%, genomsnittet var 23%, sämst var 134%
Apple MacBook 12 (Early 2016) 1.1 GHz ljudanalys
(+) | högtalare kan spela relativt högt (83.6 dB)
Bas 100 - 315 Hz
(±) | reducerad bas - i genomsnitt 11.3% lägre än medianen
(±) | linjäriteten för basen är genomsnittlig (14.2% delta till föregående frekvens)
Mellan 400 - 2000 Hz
(+) | balanserad mellan - endast 2.4% från medianen
(+) | mids är linjära (5.5% delta till föregående frekvens)
Högsta 2 - 16 kHz
(+) | balanserade toppar - endast 2% från medianen
(+) | toppar är linjära (4.5% delta till föregående frekvens)
Totalt 100 - 16 000 Hz
(+) | det totala ljudet är linjärt (10.2% skillnad mot median)
Jämfört med samma klass
» 7% av alla testade enheter i den här klassen var bättre, 2% liknande, 90% sämre
» Den bästa hade ett delta på 5%, genomsnittet var 18%, sämst var 53%
Jämfört med alla testade enheter
» 5% av alla testade enheter var bättre, 1% liknande, 94% sämre
» Den bästa hade ett delta på 4%, genomsnittet var 23%, sämst var 134%
| Av/Standby | |
| Låg belastning | |
| Hög belastning |
|
Förklaring:
min: | |
| Razer Blade 15 RZ09-0328 i7-10750H, GeForce RTX 2070 Max-Q, Lite-On CA5-8D512, AMOLED, 3840x2160, 15.6" | MSI GS66 10SGS i7-10750H, GeForce RTX 2080 Super Max-Q, Samsung SSD PM981 MZVLB512HAJQ, IPS, 1920x1080, 15.6" | Razer Blade 15 RTX 2080 Max-Q i7-9750H, GeForce RTX 2080 Max-Q, Samsung SSD PM981 MZVLB512HAJQ, IPS, 1920x1080, 15.6" | Gigabyte Aero 15 OLED XB-8DE51B0SP i7-10875H, GeForce RTX 2070 Super Max-Q, Intel Optane Memory H10 with Solid State Storage 32GB + 512GB HBRPEKNX0202A(L/H), OLED, 3840x2160, 15.6" | Alienware m15 R2 P87F i7-9750H, GeForce RTX 2080 Max-Q, 2x Toshiba XG6 KXG60ZNV512G (RAID 0), IPS, 1920x1080, 15.6" | Xiaomi Mi Gaming Laptop 2019 i7-9750H, GeForce RTX 2060 Mobile, Toshiba XG6 KXG60ZNV512G, IPS, 1920x1080, 15.6" | |
|---|---|---|---|---|---|---|
| Power Consumption | -6% | 4% | -26% | -62% | 11% | |
| Idle Minimum * (Watt) | 11.1 | 14.9 -34% | 12.5 -13% | 18 -62% | 19 -71% | 10 10% |
| Idle Average * (Watt) | 13.7 | 17.5 -28% | 15.3 -12% | 21 -53% | 40.5 -196% | 13 5% |
| Idle Maximum * (Watt) | 33.4 | 29.5 12% | 20.7 38% | 38 -14% | 52 -56% | 20 40% |
| Load Average * (Watt) | 104.4 | 94.8 9% | 90.2 14% | 113 -8% | 132.3 -27% | 100 4% |
| Witcher 3 ultra * (Watt) | 159.9 | 146.1 9% | 162 -1% | 149 7% | 183.3 -15% | 159 1% |
| Load Maximum * (Watt) | 203.8 | 210.9 -3% | 209.3 -3% | 256 -26% | 217.2 -7% | 196 4% |
* ... mindre är bättre
| Razer Blade 15 RZ09-0328 i7-10750H, GeForce RTX 2070 Max-Q, 65 Wh | MSI GS66 10SGS i7-10750H, GeForce RTX 2080 Super Max-Q, 99.99 Wh | Razer Blade 15 RTX 2080 Max-Q i7-9750H, GeForce RTX 2080 Max-Q, 80 Wh | Asus Zephyrus S GX531GX i7-8750H, GeForce RTX 2080 Max-Q, 50 Wh | Gigabyte Aero 15 OLED XB-8DE51B0SP i7-10875H, GeForce RTX 2070 Super Max-Q, 94.2 Wh | Alienware m15 R2 P87F i7-9750H, GeForce RTX 2080 Max-Q, 76 Wh | |
|---|---|---|---|---|---|---|
| Batteridrifttid | 73% | 65% | -25% | 53% | 38% | |
| WiFi v1.3 (h) | 4 | 6.9 73% | 6.6 65% | 3 -25% | 6.1 53% | 5.5 38% |
| Reader / Idle (h) | 10.2 | 15.9 | 8.6 | 9.2 | ||
| Load (h) | 1.6 | 1.7 | 2.8 | 0.7 |
För
Emot
Läs den fullständiga versionen av den här recensionen på engelska här.
På den gamla goda tiden hade Intel en "tick-tock"-produktcykel för sina processorer där "tick" innebar en större arkitektonisk omdesign med betydande prestandauppdateringar och "tock" innebar en mer finjusterad version av "tick"-produkten. Den analogin gäller för 2020 års Razer Blade 15 då 10:e generationens Core i7-10750H CPU och Nvidias GeForce RTX Super Max-Q GPU är relativt små uppgraderingar jämfört med 9:e generationens Core i7-9750H och motsvarande GeForce RTX Max-Q. Chassit har fått några justeringar här och där, men det är fortfarande samma chassi som vi är vana vid. Eventuella fördelar i spelprestanda jämfört med förra årets modell ligger i genomsnitt på ensiffriga procentsatser.
Om du är intresserad av att skaffa Blade 15 kan det vara värt att överväga 2019 års modell, i synnerhet nu när den är billigare. Du missar inget viktigt om du skippar 2020 års Base Model-serie. Vi hoppas att nästa års modeller har mer påtagliga uppdateringar som tystare fläktar eller Ampere-grafikkort.
En förfining av den redan utmärkta 2019-serien. Den har dessutom några nya alternativ, men de är för det mesta små och inget att skryta om.
Razer Blade 15 RZ09-0328
- 08/31/2022 v7 (old)
Allen Ngo
Price comparison
