Test: Lenovo Yoga C940-15IRH - Den XPS 15 2-in-1 som Dell borde ha gjort (Sammanfattning)
Gradering | Datum | Modell | Vikt | Höjd | Storlek | Upplösning | Pris |
|---|---|---|---|---|---|---|---|
| 86 % v7 (old) | 12/2019 | Lenovo Yoga C940-15IRH i7-9750H, GeForce GTX 1650 Max-Q | 2 kg | 19.7 mm | 15.60" | 1920x1080 | |
| 87.8 % v7 (old) | 08/2019 | Dell XPS 15 7590 9980HK GTX 1650 i9-9980HK, GeForce GTX 1650 Mobile | 2 kg | 17 mm | 15.60" | 3840x2160 | |
| 83.1 % v7 (old) | 10/2019 | Asus ZenBook 15 UX534FT-DB77 i7-8565U, GeForce GTX 1650 Max-Q | 1.7 kg | 18.9 mm | 15.60" | 1920x1080 | |
| 83.9 % v7 (old) | 08/2019 | HP Gaming Pavilion 15-dk0009ng i7-9750H, GeForce GTX 1660 Ti Max-Q | 2.4 kg | 23.4 mm | 15.60" | 1920x1080 | |
| 85.2 % v7 (old) | 11/2019 | MSI Prestige 15 A10SC i7-10710U, GeForce GTX 1650 Max-Q | 1.7 kg | 16 mm | 15.60" | 3840x2160 |
| Networking | |
| iperf3 transmit AX12 | |
| MSI Prestige 15 A10SC | |
| Dell XPS 15 7590 9980HK GTX 1650 | |
| Asus ZenBook 15 UX534FT-DB77 | |
| iperf3 receive AX12 | |
| MSI Prestige 15 A10SC | |
| Asus ZenBook 15 UX534FT-DB77 | |
| Dell XPS 15 7590 9980HK GTX 1650 | |
| |||||||||||||||||||||||||
Distribution av ljusstyrkan: 82 %
Mitt på batteriet: 484.8 cd/m²
Kontrast: 1865:1 (Svärta: 0.26 cd/m²)
ΔE ColorChecker Calman: 4.5 | ∀{0.5-29.43 Ø4.71}
calibrated: 1.19
ΔE Greyscale Calman: 5.7 | ∀{0.09-98 Ø4.96}
92.8% sRGB (Argyll 1.6.3 3D)
58.7% AdobeRGB 1998 (Argyll 1.6.3 3D)
63.6% AdobeRGB 1998 (Argyll 3D)
92.7% sRGB (Argyll 3D)
61.5% Display P3 (Argyll 3D)
Gamma: 2.45
CCT: 6101 K
| Lenovo Yoga C940-15IRH LG Philips LP156WFC-SPU1, IPS, 15.6", 1920x1080 | Dell XPS 15 7590 9980HK GTX 1650 Samsung 156WR04, SDCA029, OLED, 15.6", 3840x2160 | Asus ZenBook 15 UX534FT-DB77 BOE NV156FHM-N63, IPS, 15.6", 1920x1080 | Lenovo Ideapad 720S-15IKB 81AC001AGE Chi Mei CMN15E8 / N156HCE-EN1 CMN, IPS, 15.6", 1920x1080 | HP Gaming Pavilion 15-dk0009ng LG Philips LGD05FE, IPS, 15.6", 1920x1080 | MSI GP65 Leopard 9SE-225US LG Philips LGD0625, IPS, 15.6", 1920x1080 | HP Spectre x360 15-df0126ng AU Optronics AUO30EB, IPS, 15.6", 3840x2160 | |
|---|---|---|---|---|---|---|---|
| Display | 31% | 1% | 0% | 3% | 4% | 7% | |
| Display P3 Coverage (%) | 61.5 | 88.1 43% | 66.6 8% | 63.6 3% | 64.2 4% | 64.8 5% | 68.1 11% |
| sRGB Coverage (%) | 92.7 | 99.6 7% | 87.7 -5% | 89.4 -4% | 95.1 3% | 96.2 4% | 94.2 2% |
| AdobeRGB 1998 Coverage (%) | 63.6 | 91.8 44% | 64.1 1% | 64.3 1% | 65.8 3% | 66.3 4% | 68.4 8% |
| Response Times | 94% | 12% | 31% | 69% | 76% | -2% | |
| Response Time Grey 50% / Grey 80% * (ms) | 48.4 ? | 2.3 ? 95% | 41.2 ? 15% | 34 ? 30% | 16.4 ? 66% | 9.6 ? 80% | 57 ? -18% |
| Response Time Black / White * (ms) | 36.4 ? | 2.4 ? 93% | 33.2 ? 9% | 25 ? 31% | 10.4 ? 71% | 10.4 ? 71% | 31 ? 15% |
| PWM Frequency (Hz) | 59.5 ? | 25000 ? | |||||
| Screen | -1% | -36% | -12% | 5% | 2% | -16% | |
| Brightness middle (cd/m²) | 484.8 | 421.2 -13% | 312.6 -36% | 332 -32% | 345 -29% | 348.3 -28% | 330 -32% |
| Brightness (cd/m²) | 463 | 417 -10% | 290 -37% | 301 -35% | 324 -30% | 327 -29% | 310 -33% |
| Brightness Distribution (%) | 82 | 94 15% | 85 4% | 83 1% | 86 5% | 85 4% | 87 6% |
| Black Level * (cd/m²) | 0.26 | 0.31 -19% | 0.29 -12% | 0.42 -62% | 0.4 -54% | 0.37 -42% | |
| Contrast (:1) | 1865 | 1008 -46% | 1145 -39% | 821 -56% | 871 -53% | 892 -52% | |
| Colorchecker dE 2000 * | 4.5 | 6.06 -35% | 5.78 -28% | 3.73 17% | 1.3 71% | 1.6 64% | 4.03 10% |
| Colorchecker dE 2000 max. * | 7.55 | 11.89 -57% | 8.86 -17% | 6.6 13% | 2.8 63% | 5.07 33% | 6.74 11% |
| Colorchecker dE 2000 calibrated * | 1.19 | 3.78 -218% | 2 -68% | 1.1 8% | 1 16% | 1.96 -65% | |
| Greyscale dE 2000 * | 5.7 | 2.8 51% | 5.4 5% | 3.96 31% | 1.2 79% | 2.3 60% | 4.49 21% |
| Gamma | 2.45 90% | 2.15 102% | 2.21 100% | 2.4 92% | 2.31 95% | 2.203 100% | 2.57 86% |
| CCT | 6101 107% | 6235 104% | 7864 83% | 6921 94% | 6476 100% | 6707 97% | 6744 96% |
| Color Space (Percent of AdobeRGB 1998) (%) | 58.7 | 81 38% | 57.1 -3% | 58 -1% | 60.5 3% | 61 4% | 61 4% |
| Color Space (Percent of sRGB) (%) | 92.8 | 99.6 7% | 87.4 -6% | 89 -4% | 94.9 2% | 96 3% | 94 1% |
| Totalt genomsnitt (program/inställningar) | 41% /
21% | -8% /
-23% | 6% /
-4% | 26% /
13% | 27% /
12% | -4% /
-10% |
* ... mindre är bättre
Visa svarstider
| ↔ Svarstid svart till vitt | ||
|---|---|---|
| 36.4 ms ... stiga ↗ och falla ↘ kombinerat | ↗ 21.2 ms stiga | 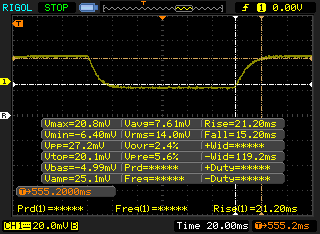 |
| ↘ 15.2 ms hösten | ||
| Skärmen visar långsamma svarsfrekvenser i våra tester och kommer att vara otillfredsställande för spelare. I jämförelse sträcker sig alla testade enheter från 0.1 (minst) till 240 (maximalt) ms. » 95 % av alla enheter är bättre. Detta innebär att den uppmätta svarstiden är sämre än genomsnittet av alla testade enheter (19.8 ms). | ||
| ↔ Svarstid 50 % grått till 80 % grått | ||
| 48.4 ms ... stiga ↗ och falla ↘ kombinerat | ↗ 24.4 ms stiga | 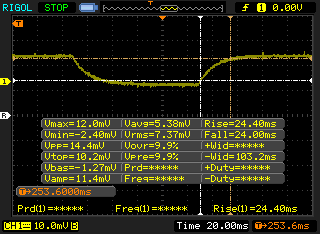 |
| ↘ 24 ms hösten | ||
| Skärmen visar långsamma svarsfrekvenser i våra tester och kommer att vara otillfredsställande för spelare. I jämförelse sträcker sig alla testade enheter från 0.165 (minst) till 636 (maximalt) ms. » 84 % av alla enheter är bättre. Detta innebär att den uppmätta svarstiden är sämre än genomsnittet av alla testade enheter (31 ms). | ||
Skärmflimmer / PWM (Puls-Width Modulation)
| Skärmflimmer / PWM upptäcktes inte | 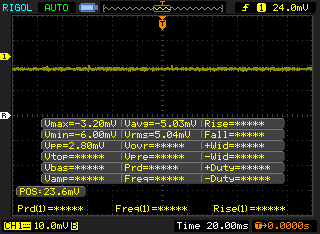 | ||
Som jämförelse: 52 % av alla testade enheter använder inte PWM för att dämpa skärmen. Om PWM upptäcktes mättes ett medelvärde av 7757 (minst: 5 - maximum: 343500) Hz. | |||
| PCMark 8 Home Score Accelerated v2 | 4069 poäng | |
| PCMark 8 Work Score Accelerated v2 | 5359 poäng | |
| PCMark 10 Score | 4887 poäng | |
Hjälp | ||
| Lenovo Yoga C940-15IRH Intel Optane Memory H10 with Solid State Storage 32GB + 512GB HBRPEKNX0202A(L/H) | Dell XPS 15 7590 9980HK GTX 1650 Toshiba XG6 KXG60ZNV1T02 | Asus ZenBook 15 UX534FT-DB77 Samsung SSD PM981 MZVLB1T0HALR | Lenovo Ideapad 720S-15IKB 81AC001AGE Samsung SSD PM981 MZVLB512HAJQ | HP Gaming Pavilion 15-dk0009ng Samsung SSD PM981 MZVLB256HAHQ | MSI GP65 Leopard 9SE-225US Toshiba KBG30ZMT512G | |
|---|---|---|---|---|---|---|
| AS SSD | 99% | 75% | 139% | 27% | -17% | |
| Seq Read (MB/s) | 769 | 1723 124% | 1887 145% | 2469 221% | 2088 172% | 1307 70% |
| Seq Write (MB/s) | 351.1 | 1386 295% | 1432 308% | 1991 467% | 1347 284% | 730 108% |
| 4K Read (MB/s) | 69.1 | 43.25 -37% | 52.3 -24% | 54.3 -21% | 36.14 -48% | 27.58 -60% |
| 4K Write (MB/s) | 100.9 | 98.3 -3% | 146 45% | 99.8 -1% | 96.5 -4% | 80.3 -20% |
| 4K-64 Read (MB/s) | 472 | 1078 128% | 969 105% | 1823 286% | 565 20% | 878 86% |
| 4K-64 Write (MB/s) | 948 | 1456 54% | 1375 45% | 1282 35% | 588 -38% | 246.8 -74% |
| Access Time Read * (ms) | 0.071 | 0.05 30% | 0.034 52% | 0.042 41% | 0.093 -31% | 0.231 -225% |
| Access Time Write * (ms) | 0.137 | 0.039 72% | 0.075 45% | 0.039 72% | 0.038 72% | 0.223 -63% |
| Score Read (Points) | 618 | 1294 109% | 1210 96% | 2125 244% | 810 31% | 1036 68% |
| Score Write (Points) | 1084 | 1693 56% | 1664 54% | 1581 46% | 819 -24% | 400 -63% |
| Score Total (Points) | 2024 | 3638 80% | 3483 72% | 4771 136% | 2014 0% | 1940 -4% |
| Copy ISO MB/s (MB/s) | 839 | 3182 279% | 1375 64% | 1043 24% | 993 18% | |
| Copy Program MB/s (MB/s) | 455.8 | 984 116% | 468 3% | 371.7 -18% | 309.5 -32% | |
| Copy Game MB/s (MB/s) | 969 | 1824 88% | 1287 33% | 399.9 -59% | 582 -40% | |
| CrystalDiskMark 5.2 / 6 | 50% | 63% | 59% | 14% | -26% | |
| Write 4K (MB/s) | 102.2 | 104.3 2% | 141.6 39% | 139.3 36% | 100 -2% | 99.3 -3% |
| Read 4K (MB/s) | 114.3 | 45.23 -60% | 45.28 -60% | 46.78 -59% | 31.39 -73% | 46.96 -59% |
| Write Seq (MB/s) | 468.3 | 1729 269% | 1975 322% | 2125 354% | 1308 179% | |
| Read Seq (MB/s) | 1236 | 1861 51% | 2272 84% | 2354 90% | 1083 -12% | |
| Write 4K Q32T1 (MB/s) | 556 | 509 -8% | 458.6 -18% | 298.4 -46% | 362.9 -35% | 240.1 -57% |
| Read 4K Q32T1 (MB/s) | 421.6 | 388.5 -8% | 391.4 -7% | 355.8 -16% | 425.7 1% | 581 38% |
| Write Seq Q32T1 (MB/s) | 1264 | 2813 123% | 2393 89% | 2128 68% | 1411 12% | 686 -46% |
| Read Seq Q32T1 (MB/s) | 2239 | 2906 30% | 3464 55% | 3324 48% | 3240 45% | 1581 -29% |
| Write 4K Q8T8 (MB/s) | 268.1 | |||||
| Read 4K Q8T8 (MB/s) | 977 | |||||
| Totalt genomsnitt (program/inställningar) | 75% /
81% | 69% /
70% | 99% /
105% | 21% /
23% | -22% /
-19% |
* ... mindre är bättre

| 3DMark 11 | |
| 1280x720 Performance GPU | |
| MSI RTX 2060 Gaming Z 6G | |
| Alienware 17 R5 | |
| MSI GP65 Leopard 9SE-225US | |
| Maingear Vector 15 | |
| HP Gaming Pavilion 15-dk0009ng | |
| Gainward GeForce GTX 1650 4 GB | |
| Asus Zephyrus S GX531GM | |
| Dell XPS 15 7590 9980HK GTX 1650 | |
| Lenovo Yoga C940-15IRH | |
| MSI Prestige 15 A10SC | |
| Genomsnitt NVIDIA GeForce GTX 1650 Max-Q (10248 - 12259, n=14) | |
| Dell XPS 15 9575 i7-8705G | |
| Asus TUF FX705GE-EW096T | |
| Lenovo ThinkPad X1 Extreme-20MF000XGE | |
| Asus Zenbook UX510UW-CN044T | |
| 1280x720 Performance Combined | |
| MSI RTX 2060 Gaming Z 6G | |
| MSI GP65 Leopard 9SE-225US | |
| HP Gaming Pavilion 15-dk0009ng | |
| Maingear Vector 15 | |
| Gainward GeForce GTX 1650 4 GB | |
| Alienware 17 R5 | |
| Lenovo Yoga C940-15IRH | |
| MSI Prestige 15 A10SC | |
| Dell XPS 15 7590 9980HK GTX 1650 | |
| Genomsnitt NVIDIA GeForce GTX 1650 Max-Q (6409 - 10846, n=13) | |
| Dell XPS 15 9575 i7-8705G | |
| Lenovo ThinkPad X1 Extreme-20MF000XGE | |
| Asus TUF FX705GE-EW096T | |
| Asus Zephyrus S GX531GM | |
| Asus Zenbook UX510UW-CN044T | |
| 3DMark 11 Performance | 11952 poäng | |
| 3DMark Cloud Gate Standard Score | 29013 poäng | |
| 3DMark Fire Strike Score | 7717 poäng | |
| 3DMark Time Spy Score | 3494 poäng | |
Hjälp | ||
| Shadow of the Tomb Raider | |
| 1280x720 Lowest Preset | |
| Corsair One i160 | |
| Eurocom Nightsky RX15 | |
| MSI GE75 9SG | |
| MSI RTX 2060 Gaming Z 6G | |
| Walmart EVOO Gaming 17 | |
| Gainward GeForce GTX 1650 4 GB | |
| Genomsnitt NVIDIA GeForce GTX 1650 Max-Q (92 - 151, n=5) | |
| MSI Prestige 15 A10SC | |
| Asus Zephyrus S GX531GM | |
| Dell XPS 15 7590 9980HK GTX 1650 | |
| Lenovo Yoga C940-15IRH | |
| Lenovo ThinkPad X1 Extreme-20MF000XGE | |
| MSI GE63 Raider 8SG | |
| Asus TUF FX705GE-EW096T | |
| Asus ROG Zephyrus G15 GA502DU | |
| Dell XPS 13 7390 2-in-1 Core i7 | |
| 1920x1080 Highest Preset AA:T | |
| Corsair One i160 | |
| MSI GE75 9SG | |
| Eurocom Nightsky RX15 | |
| MSI RTX 2060 Gaming Z 6G | |
| Walmart EVOO Gaming 17 | |
| MSI GE63 Raider 8SG | |
| Asus ROG Zephyrus G15 GA502DU | |
| Lenovo Yoga C940-15IRH | |
| Gainward GeForce GTX 1650 4 GB | |
| Asus Zephyrus S GX531GM | |
| Genomsnitt NVIDIA GeForce GTX 1650 Max-Q (33 - 45, n=6) | |
| MSI Prestige 15 A10SC | |
| Dell XPS 15 7590 9980HK GTX 1650 | |
| Asus TUF FX705GE-EW096T | |
| Lenovo ThinkPad X1 Extreme-20MF000XGE | |
| låg | med. | hög | ultra | |
|---|---|---|---|---|
| BioShock Infinite (2013) | 317.2 | 231.2 | 215.2 | 84.3 |
| The Witcher 3 (2015) | 196 | 119.8 | 65.1 | 36.5 |
| Rocket League (2017) | 247.2 | 222.4 | 145.6 | |
| Shadow of the Tomb Raider (2018) | 105 | 58 | 51 | 45 |
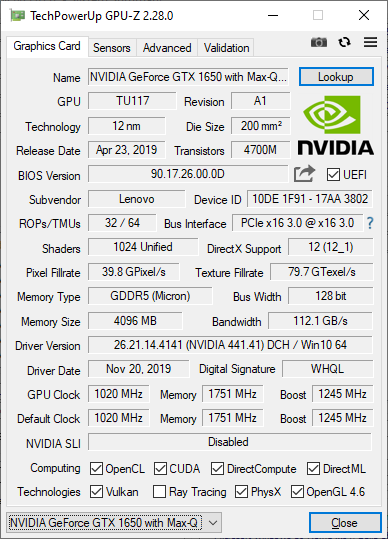
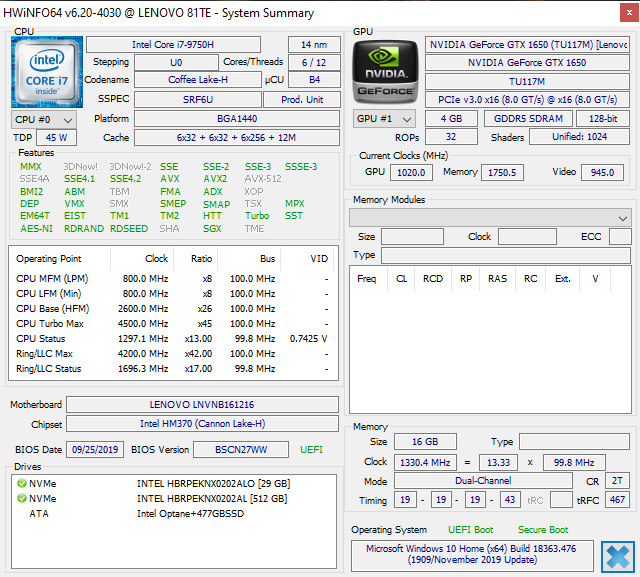
| Lenovo Yoga C940-15IRH GeForce GTX 1650 Max-Q, i7-9750H, Intel Optane Memory H10 with Solid State Storage 32GB + 512GB HBRPEKNX0202A(L/H) | Dell XPS 15 7590 9980HK GTX 1650 GeForce GTX 1650 Mobile, i9-9980HK, Toshiba XG6 KXG60ZNV1T02 | Asus ZenBook 15 UX534FT-DB77 GeForce GTX 1650 Max-Q, i7-8565U, Samsung SSD PM981 MZVLB1T0HALR | Lenovo Ideapad 720S-15IKB 81AC001AGE GeForce GTX 1050 Ti Max-Q, i7-7700HQ, Samsung SSD PM981 MZVLB512HAJQ | HP Gaming Pavilion 15-dk0009ng GeForce GTX 1660 Ti Max-Q, i7-9750H, Samsung SSD PM981 MZVLB256HAHQ | MSI GP65 Leopard 9SE-225US GeForce RTX 2060 Mobile, i7-9750H, Toshiba KBG30ZMT512G | |
|---|---|---|---|---|---|---|
| Noise | -1% | 7% | 0% | 8% | -0% | |
| av / miljö * (dB) | 28.7 | 28.2 2% | 28.4 1% | 30.3 -6% | 28.2 2% | 28.2 2% |
| Idle Minimum * (dB) | 28.7 | 28.2 2% | 28.4 1% | 30.3 -6% | 29.3 -2% | 29.5 -3% |
| Idle Average * (dB) | 28.8 | 28.2 2% | 28.4 1% | 30.3 -5% | 29.3 -2% | 29.6 -3% |
| Idle Maximum * (dB) | 28.8 | 30.4 -6% | 28.4 1% | 30.3 -5% | 29.3 -2% | 29.6 -3% |
| Load Average * (dB) | 45 | 43.8 3% | 33.9 25% | 39.3 13% | 32.3 28% | 33 27% |
| Witcher 3 ultra * (dB) | 44.7 | 47.2 -6% | 39.8 11% | 34 24% | 47.2 -6% | |
| Load Maximum * (dB) | 44.7 | 47.2 -6% | 40.2 10% | 39.6 11% | 41.2 8% | 52 -16% |
* ... mindre är bättre
Ljudnivå
| Låg belastning |
| 28.7 / 28.8 / 28.8 dB(A) |
| Hög belastning |
| 45 / 44.7 dB(A) |
 | ||
30 dB tyst 40 dB(A) hörbar 50 dB(A) högt ljud |
||
min: | ||
(-) Den maximala temperaturen på ovansidan är 46.2 °C / 115 F, jämfört med genomsnittet av 36.8 °C / 98 F , allt från 21 till 71 °C för klassen Multimedia.
(±) Botten värms upp till maximalt 45 °C / 113 F, jämfört med genomsnittet av 39.1 °C / 102 F
(+) Vid tomgångsbruk är medeltemperaturen för ovansidan 23.9 °C / 75 F, jämfört med enhetsgenomsnittet på 31.3 °C / ### class_avg_f### F.
(±) När du spelar The Witcher 3 är medeltemperaturen för ovansidan 32 °C / 90 F, jämfört med enhetsgenomsnittet på 31.3 °C / ## #class_avg_f### F.
(+) Handledsstöden och pekplattan är kallare än hudtemperaturen med maximalt 31 °C / 87.8 F och är därför svala att ta på.
(-) Medeltemperaturen för handledsstödsområdet på liknande enheter var 28.7 °C / 83.7 F (-2.3 °C / -4.1 F).
Lenovo Yoga C940-15IRH ljudanalys
(+) | högtalare kan spela relativt högt (85.3 dB)
Bas 100 - 315 Hz
(±) | reducerad bas - i genomsnitt 9.8% lägre än medianen
(±) | linjäriteten för basen är genomsnittlig (14% delta till föregående frekvens)
Mellan 400 - 2000 Hz
(±) | högre mellan - i genomsnitt 6.5% högre än median
(+) | mids är linjära (5.1% delta till föregående frekvens)
Högsta 2 - 16 kHz
(+) | balanserade toppar - endast 3.4% från medianen
(±) | linjäriteten för toppar är genomsnittlig (8.5% delta till föregående frekvens)
Totalt 100 - 16 000 Hz
(±) | linjäriteten för det totala ljudet är genomsnittlig (17.8% skillnad mot median)
Jämfört med samma klass
» 52% av alla testade enheter i den här klassen var bättre, 7% liknande, 41% sämre
» Den bästa hade ett delta på 5%, genomsnittet var 17%, sämst var 45%
Jämfört med alla testade enheter
» 36% av alla testade enheter var bättre, 8% liknande, 56% sämre
» Den bästa hade ett delta på 4%, genomsnittet var 23%, sämst var 134%
Apple MacBook 12 (Early 2016) 1.1 GHz ljudanalys
(+) | högtalare kan spela relativt högt (83.6 dB)
Bas 100 - 315 Hz
(±) | reducerad bas - i genomsnitt 11.3% lägre än medianen
(±) | linjäriteten för basen är genomsnittlig (14.2% delta till föregående frekvens)
Mellan 400 - 2000 Hz
(+) | balanserad mellan - endast 2.4% från medianen
(+) | mids är linjära (5.5% delta till föregående frekvens)
Högsta 2 - 16 kHz
(+) | balanserade toppar - endast 2% från medianen
(+) | toppar är linjära (4.5% delta till föregående frekvens)
Totalt 100 - 16 000 Hz
(+) | det totala ljudet är linjärt (10.2% skillnad mot median)
Jämfört med samma klass
» 7% av alla testade enheter i den här klassen var bättre, 2% liknande, 90% sämre
» Den bästa hade ett delta på 5%, genomsnittet var 18%, sämst var 53%
Jämfört med alla testade enheter
» 5% av alla testade enheter var bättre, 1% liknande, 94% sämre
» Den bästa hade ett delta på 4%, genomsnittet var 23%, sämst var 134%
| Av/Standby | |
| Låg belastning | |
| Hög belastning |
|
Förklaring:
min: | |
| Lenovo Yoga C940-15IRH i7-9750H, GeForce GTX 1650 Max-Q, Intel Optane Memory H10 with Solid State Storage 32GB + 512GB HBRPEKNX0202A(L/H), IPS, 1920x1080, 15.6" | Dell XPS 15 7590 9980HK GTX 1650 i9-9980HK, GeForce GTX 1650 Mobile, Toshiba XG6 KXG60ZNV1T02, OLED, 3840x2160, 15.6" | Asus ZenBook 15 UX534FT-DB77 i7-8565U, GeForce GTX 1650 Max-Q, Samsung SSD PM981 MZVLB1T0HALR, IPS, 1920x1080, 15.6" | HP Gaming Pavilion 15-dk0009ng i7-9750H, GeForce GTX 1660 Ti Max-Q, Samsung SSD PM981 MZVLB256HAHQ, IPS, 1920x1080, 15.6" | MSI GP65 Leopard 9SE-225US i7-9750H, GeForce RTX 2060 Mobile, Toshiba KBG30ZMT512G, IPS, 1920x1080, 15.6" | HP Pavilion Gaming 15-cx0003ng i7-8750H, GeForce GTX 1050 Ti Mobile, Intel Optane 16 GB MEMPEK1J016GAH + HGST HTS721010A9E630 1 TB HDD, IPS, 1920x1080, 15.6" | |
|---|---|---|---|---|---|---|
| Power Consumption | -4% | 7% | -11% | -61% | 9% | |
| Idle Minimum * (Watt) | 5.2 | 6.2 -19% | 5 4% | 6.8 -31% | 13.6 -162% | 5.5 -6% |
| Idle Average * (Watt) | 10.7 | 9.6 10% | 13.2 -23% | 10.7 -0% | 17.9 -67% | 8.5 21% |
| Idle Maximum * (Watt) | 24.3 | 21.2 13% | 24 1% | 12.5 49% | 20.6 15% | 11.9 51% |
| Load Average * (Watt) | 84.4 | 104.3 -24% | 70 17% | 87.2 -3% | 96 -14% | 94 -11% |
| Witcher 3 ultra * (Watt) | 83.9 | 91.7 -9% | 63.3 25% | 121 -44% | 154.6 -84% | 86 -3% |
| Load Maximum * (Watt) | 142.8 | 135.3 5% | 114 20% | 191.4 -34% | 218.6 -53% | 144 -1% |
* ... mindre är bättre
| Lenovo Yoga C940-15IRH i7-9750H, GeForce GTX 1650 Max-Q, 69 Wh | Dell XPS 15 7590 9980HK GTX 1650 i9-9980HK, GeForce GTX 1650 Mobile, 97 Wh | Asus ZenBook 15 UX534FT-DB77 i7-8565U, GeForce GTX 1650 Max-Q, 71 Wh | Lenovo Ideapad 720S-15IKB 81AC001AGE i7-7700HQ, GeForce GTX 1050 Ti Max-Q, 79 Wh | HP Gaming Pavilion 15-dk0009ng i7-9750H, GeForce GTX 1660 Ti Max-Q, 52.5 Wh | MSI GP65 Leopard 9SE-225US i7-9750H, GeForce RTX 2060 Mobile, 51 Wh | Dell XPS 15 9575 i7-8705G i7-8705G, Vega M GL / 870, 75 Wh | |
|---|---|---|---|---|---|---|---|
| Batteridrifttid | 65% | 65% | 32% | -24% | -39% | -19% | |
| Reader / Idle (h) | 18.2 | 15.2 -16% | 21.5 18% | 22.6 24% | 8.7 -52% | 6 -67% | 11.2 -38% |
| WiFi v1.3 (h) | 9.7 | 7.8 -20% | 8.4 -13% | 9.8 1% | 4.8 -51% | 3.9 -60% | 7 -28% |
| Load (h) | 1 | 3.3 230% | 2.9 190% | 1.7 70% | 1.3 30% | 1.1 10% | 1.1 10% |
| Witcher 3 ultra (h) | 1 |
För
Emot
Läs den fullständiga versionen av den här recensionen på engelska här.
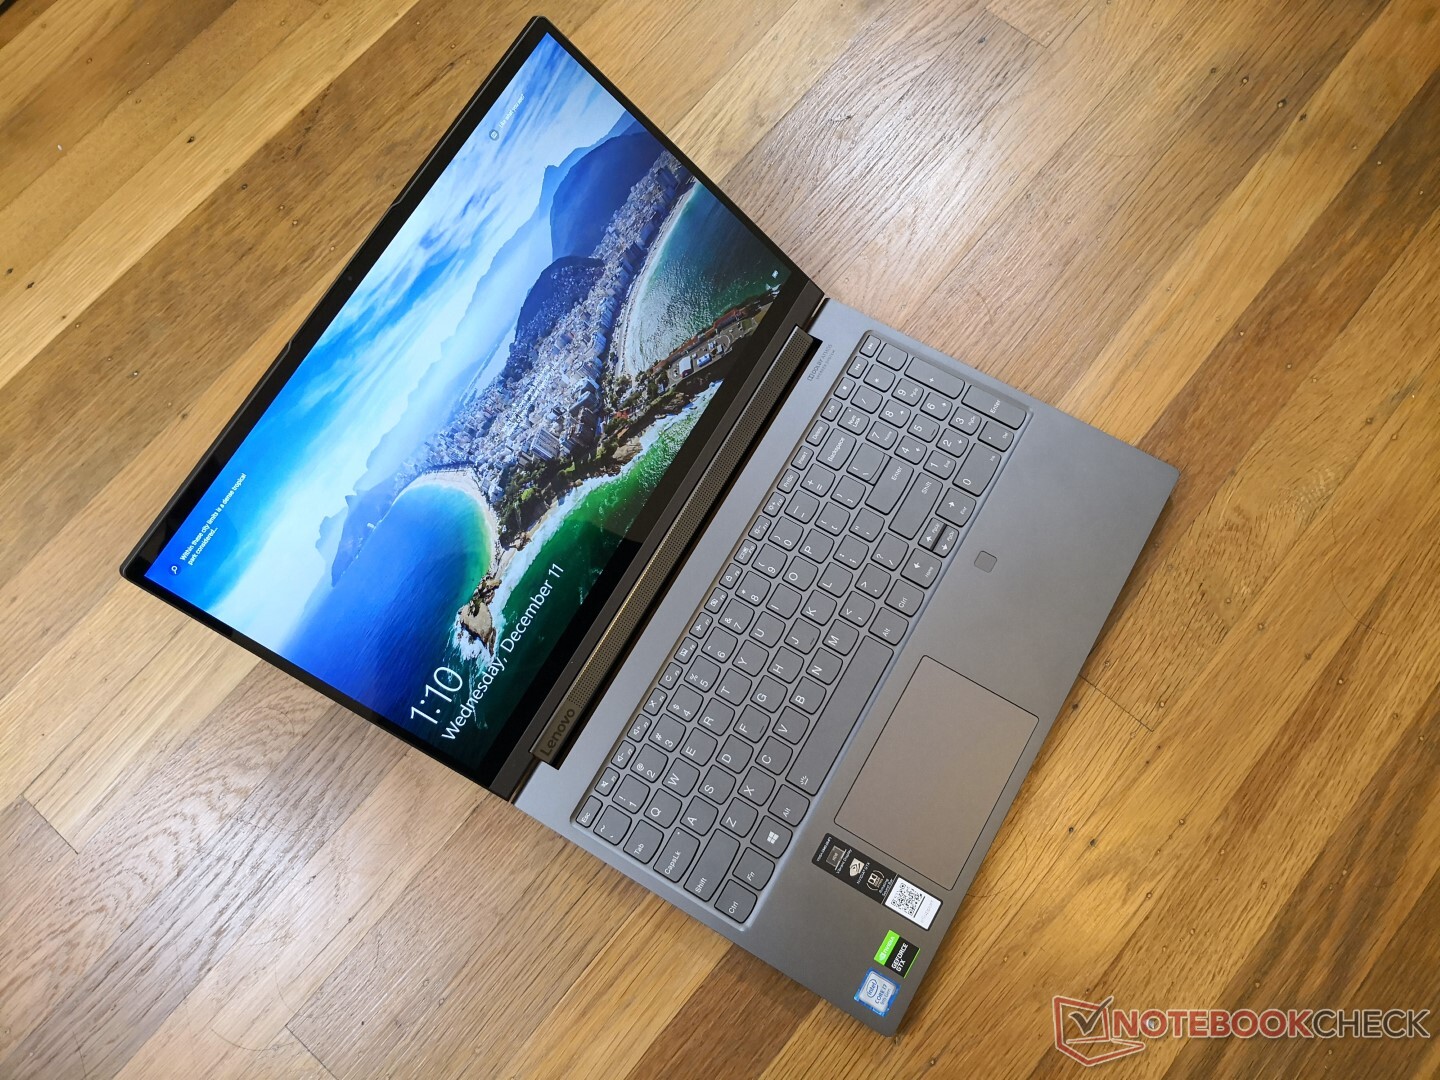
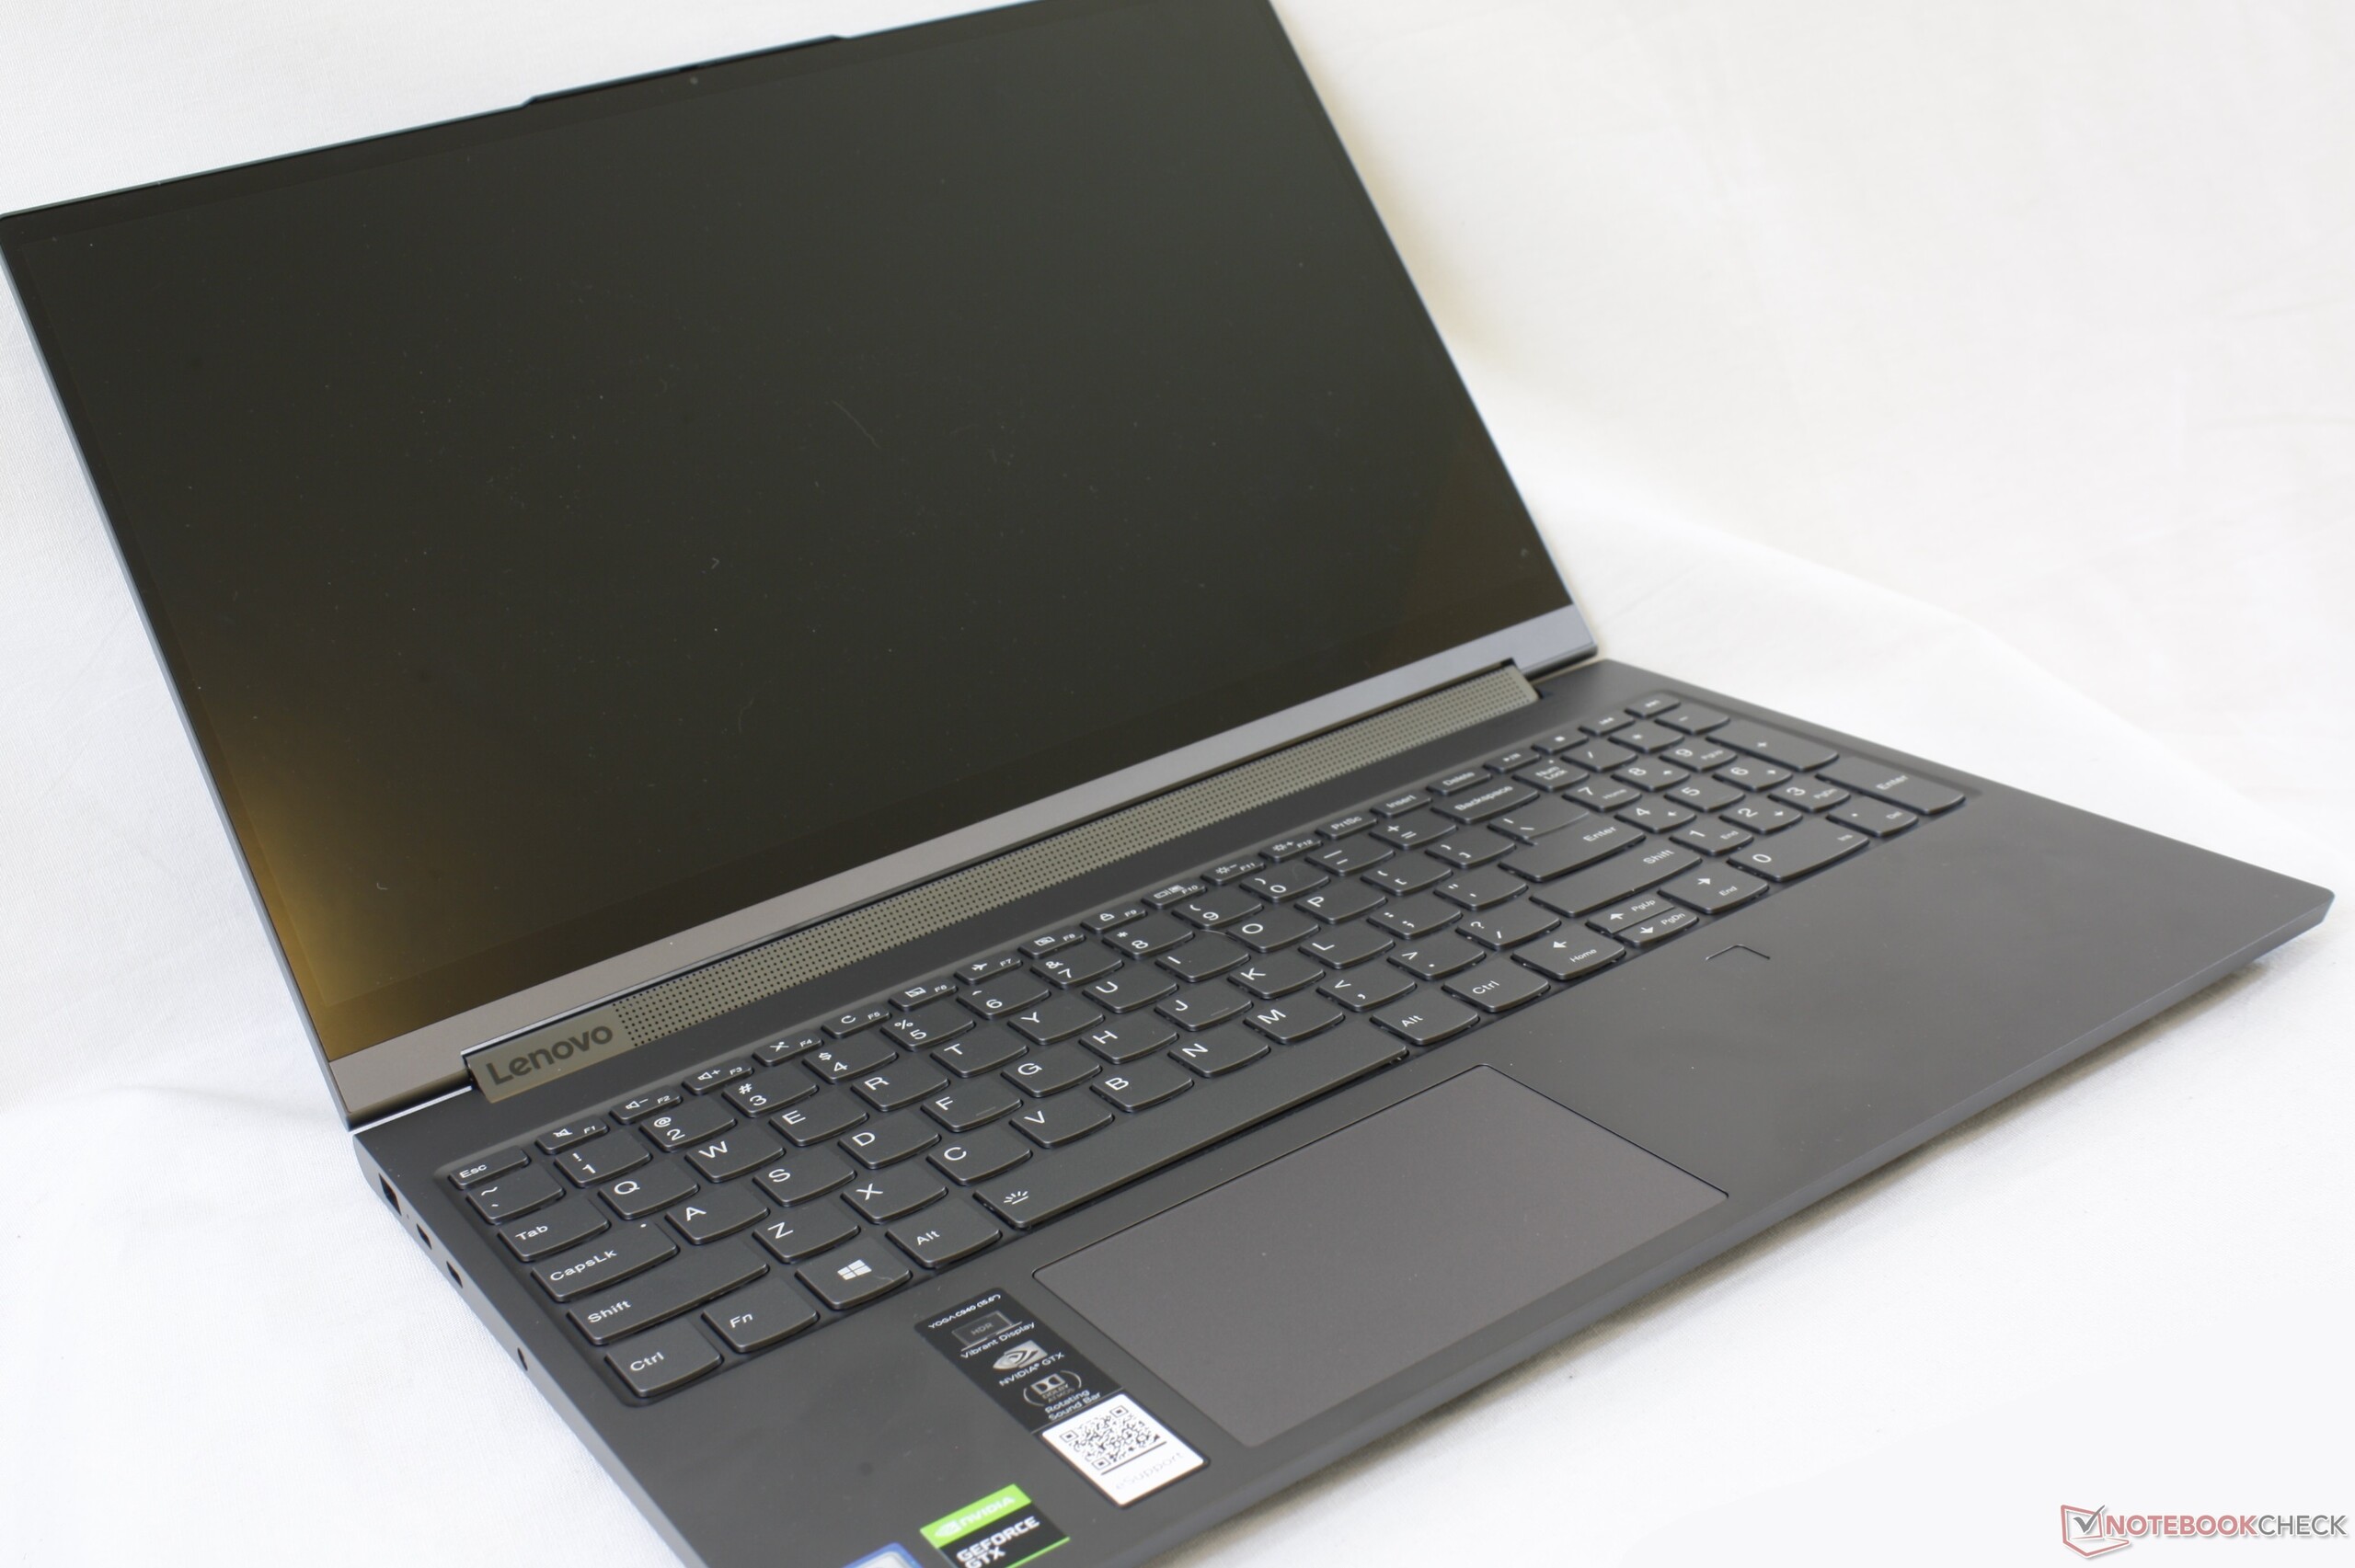
När Dell utannonserade XPS 15 2-in-1 förväntade vi oss en vanlig ihopvikbar XPS 15 men med 360-gradersgångjärn. Istället fick vi ett helt annat chassi med en oprövad CPU/GPU-serie som kan ha gjort fans av XPS 15 tveksamma. Lenovo Yoga C940-15 är faktiskt närmare det som de flesta användare nog väntat sig att XPS 15 2-in-1 skulle varit: en omvandlingsbar med tryckkänslig skärm, ett traditionellt chiclet-tangentbord, en vanlig Intel Core H CPU, en GeForce GTX GPU, lagring som är lätt att byta och ett säkrare garage för pennan istället för en kinkig magnetisk lösning.
Att ha en spelkapabel GTX GPU i en 15.6-tums omvandlingsbar har sina nackdelar. I synnerhet då surfplatteläget passar bäst för att användas då och då eller i korta stunder med tanke på enhetens storlek och vikt. Men Yoga C940 är ändå lättare, mindre, mer ljusstark och mer kraftfull än konkurrenten HP Spectre x360 15 2019, vilket gör den till ett bättre alternativ i den här specifika kategorin. XPS 15 9575 2-in-1 är en liten bit mindre, men den är sämre på de flesta andra områden inklusive prestanda, batteritid, ljusstyrka och ljud. Vi hoppas att framtida versioner kommer förbättra den höga vikten och de mjuka tangentbordsknapparna samt den mjuka klickplattan.
Lenovo Yoga C940-15 har riktigt hög prestanda i förhållande till sin volym för en omvandlingsbar på 15.6 tum. Även om den varken är särskilt lätt eller billig till ett pris av 15.000 kronor är den ett bättre alternativ jämfört med XPS 15 2-in-1 eller senaste HP Spectre x360 15.
Lenovo Yoga C940-15IRH
- 12/15/2019 v7 (old)
Allen Ngo
Price comparison
