Test: Apple MacBook Pro 16 2019 - En övertygande multimedialaptop som drivs av en Core i9-9880H och en Radeon Pro 5500M (Sammanfattning)
Gradering | Datum | Modell | Vikt | Höjd | Storlek | Upplösning | Pris |
|---|---|---|---|---|---|---|---|
| 89.7 % v7 (old) | 12/2019 | Apple MacBook Pro 16 2019 i9 5500M i9-9880H, Radeon Pro 5500M | 2 kg | 16.2 mm | 16.00" | 3072x1920 | |
| 87.1 % v7 (old) | 02/2020 | Lenovo ThinkPad X1 Extreme 2019 20QV000WGE i7-9750H, GeForce GTX 1650 Mobile | 1.7 kg | 18.7 mm | 15.60" | 3840x2160 | |
| 87.8 % v7 (old) | 08/2019 | Dell XPS 15 7590 9980HK GTX 1650 i9-9980HK, GeForce GTX 1650 Mobile | 2 kg | 17 mm | 15.60" | 3840x2160 | |
| 89.4 % v7 (old) | 03/2020 | Apple MacBook Pro 15 2019 i9 Vega 20 i9-9980HK, Radeon Pro Vega 20 | 1.8 kg | 15.5 mm | 15.40" | 2880x1800 | |
| 87.8 % v6 (old) | 06/2018 | Asus ZenBook Pro 15 UX580GE i9-8950HK, GeForce GTX 1050 Ti Mobile | 1.9 kg | 18.9 mm | 15.60" | 3840x2160 | |
| 85 % v7 (old) | 06/2019 | MSI P65 Creator 9SF-657 i9-9880H, GeForce RTX 2070 Max-Q | 1.9 kg | 18 mm | 15.60" | 3840x2160 |


| |||||||||||||||||||||||||
Distribution av ljusstyrkan: 86 %
Mitt på batteriet: 519 cd/m²
Kontrast: 1331:1 (Svärta: 0.39 cd/m²)
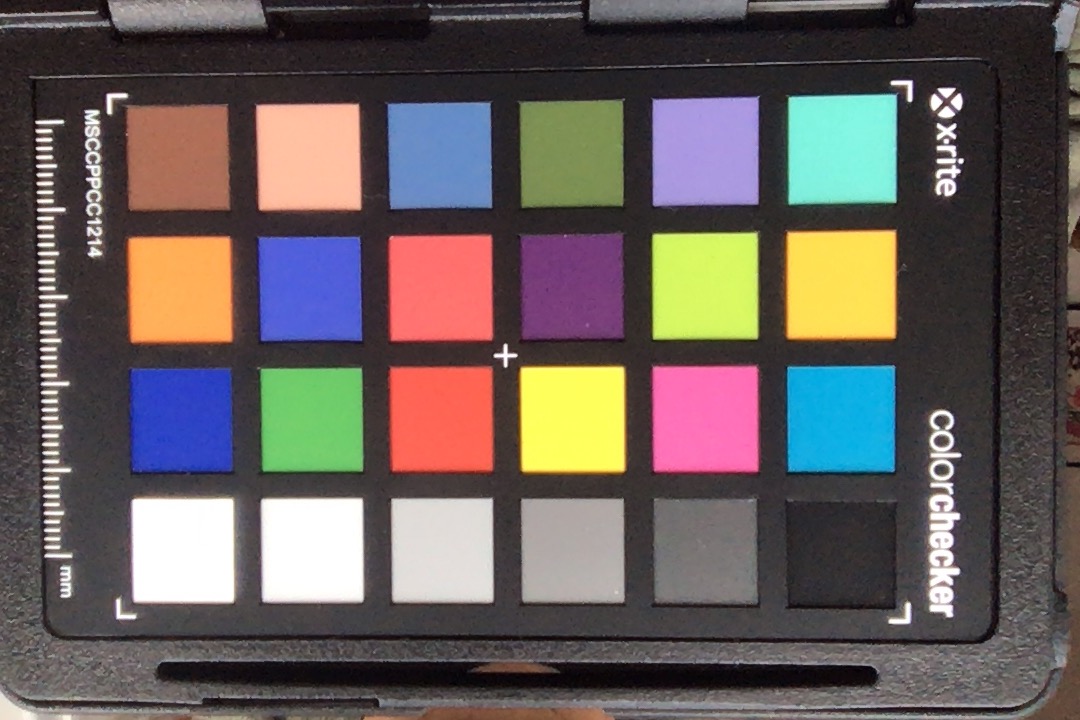
ΔE ColorChecker Calman: 2.28 | ∀{0.5-29.43 Ø4.73}
calibrated: 0.86
ΔE Greyscale Calman: 0.9 | ∀{0.09-98 Ø4.97}
100% sRGB (Calman 2D)
78% AdobeRGB 1998 (Argyll 1.6.3 3D)
Gamma: 2145
CCT: 6572 K
| Apple MacBook Pro 16 2019 i9 5500M APPA044, IPS, 3072x1920, 16" | Dell XPS 15 7590 9980HK GTX 1650 Samsung 156WR04, SDCA029, OLED, 3840x2160, 15.6" | Lenovo ThinkPad X1 Extreme 2019 20QV000WGE NE156QUM-N66, IPS, 3840x2160, 15.6" | Apple MacBook Pro 15 2018 (2.6 GHz, 560X) APPA040, IPS, 2880x1800, 15.4" | Asus ZenBook Pro 15 UX580GE AU Optronics B156ZAN03.1, IPS, 3840x2160, 15.6" | MSI P65 Creator 9SF-657 AU Optronics AUO41EB, IPS, 3840x2160, 15.6" | |
|---|---|---|---|---|---|---|
| Display | ||||||
| Display P3 Coverage (%) | 88.1 | 82 | 98.7 | 85.9 | 84.4 | |
| sRGB Coverage (%) | 99.6 | 99.1 | 99.9 | 100 | 100 | |
| AdobeRGB 1998 Coverage (%) | 91.8 | 96.9 | 86.6 | 99.1 | 98.5 | |
| Response Times | 95% | 12% | 15% | 26% | 7% | |
| Response Time Grey 50% / Grey 80% * (ms) | 52.4 ? | 2.3 ? 96% | 46.4 ? 11% | 43.2 ? 18% | 44 ? 16% | 51 ? 3% |
| Response Time Black / White * (ms) | 34.9 ? | 2.4 ? 93% | 30.4 ? 13% | 31.2 ? 11% | 22.8 ? 35% | 31 ? 11% |
| PWM Frequency (Hz) | 131700 | 59.5 ? | 117000 ? | |||
| Screen | -68% | -85% | 9% | -69% | -66% | |
| Brightness middle (cd/m²) | 519 | 421.2 -19% | 464 -11% | 520 0% | 357.6 -31% | 445 -14% |
| Brightness (cd/m²) | 477 | 417 -13% | 448 -6% | 492 3% | 350 -27% | 462 -3% |
| Brightness Distribution (%) | 86 | 94 9% | 90 5% | 88 2% | 85 -1% | 83 -3% |
| Black Level * (cd/m²) | 0.39 | 0.36 8% | 0.39 -0% | 0.35 10% | 0.5 -28% | |
| Contrast (:1) | 1331 | 1289 -3% | 1333 0% | 1022 -23% | 890 -33% | |
| Colorchecker dE 2000 * | 2.28 | 6.06 -166% | 4.2 -84% | 1.2 47% | 4.12 -81% | 4.75 -108% |
| Colorchecker dE 2000 max. * | 6.54 | 11.89 -82% | 11.4 -74% | 2.3 65% | 9.91 -52% | 7.79 -19% |
| Colorchecker dE 2000 calibrated * | 0.86 | 0.8 7% | 4.23 -392% | |||
| Greyscale dE 2000 * | 0.9 | 2.8 -211% | 7.2 -700% | 1.3 -44% | 1.8 -100% | 4.49 -399% |
| Gamma | 2145 0% | 2.15 102% | 2.17 101% | 2.18 101% | 2.17 101% | 2.49 88% |
| CCT | 6572 99% | 6235 104% | 6345 102% | 6738 96% | 6613 98% | 7374 88% |
| Color Space (Percent of AdobeRGB 1998) (%) | 78 | 81 4% | 85.2 9% | 87.5 12% | 87 12% | |
| Color Space (Percent of sRGB) (%) | 99.6 | 99 | 100 | 100 | ||
| Totalt genomsnitt (program/inställningar) | 14% /
-32% | -37% /
-69% | 12% /
10% | -22% /
-53% | -30% /
-53% |
* ... mindre är bättre
Visa svarstider
| ↔ Svarstid svart till vitt | ||
|---|---|---|
| 34.9 ms ... stiga ↗ och falla ↘ kombinerat | ↗ 17.8 ms stiga | 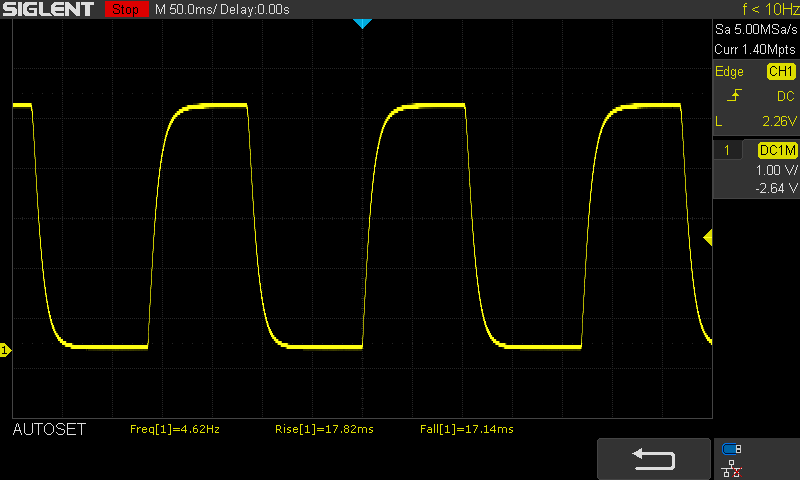 |
| ↘ 17.1 ms hösten | ||
| Skärmen visar långsamma svarsfrekvenser i våra tester och kommer att vara otillfredsställande för spelare. I jämförelse sträcker sig alla testade enheter från 0.1 (minst) till 240 (maximalt) ms. » 92 % av alla enheter är bättre. Detta innebär att den uppmätta svarstiden är sämre än genomsnittet av alla testade enheter (19.9 ms). | ||
| ↔ Svarstid 50 % grått till 80 % grått | ||
| 52.4 ms ... stiga ↗ och falla ↘ kombinerat | ↗ 23.9 ms stiga | 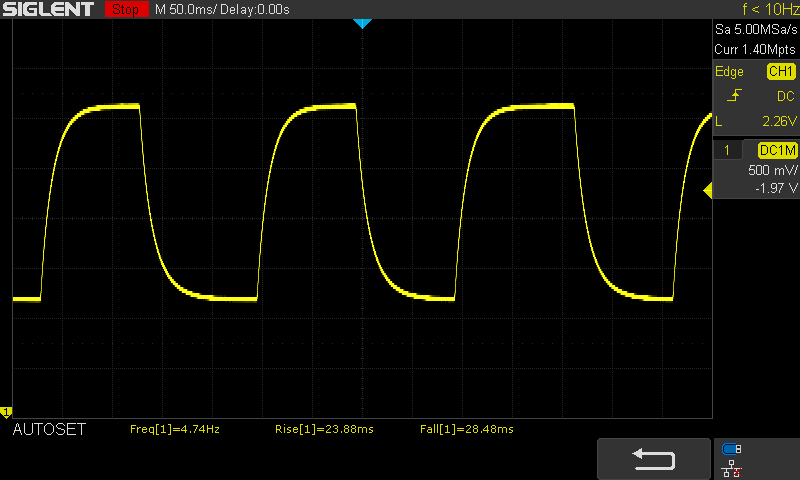 |
| ↘ 28.5 ms hösten | ||
| Skärmen visar långsamma svarsfrekvenser i våra tester och kommer att vara otillfredsställande för spelare. I jämförelse sträcker sig alla testade enheter från 0.165 (minst) till 636 (maximalt) ms. » 89 % av alla enheter är bättre. Detta innebär att den uppmätta svarstiden är sämre än genomsnittet av alla testade enheter (31.1 ms). | ||
Skärmflimmer / PWM (Puls-Width Modulation)
| Skärmflimmer / PWM upptäckt | 131700 Hz | 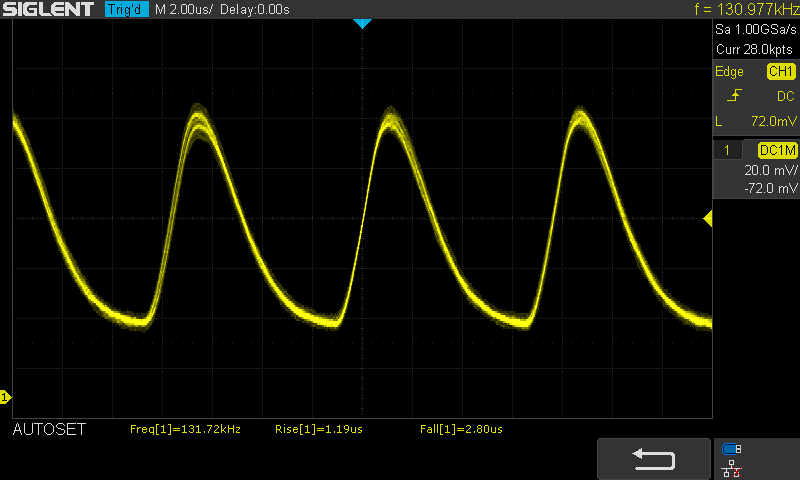 | |
Displayens bakgrundsbelysning flimrar vid 131700 Hz (i värsta fall, t.ex. med PWM) . Frekvensen för 131700 Hz är ganska hög, så de flesta användare som är känsliga för PWM bör inte märka något flimmer. Som jämförelse: 52 % av alla testade enheter använder inte PWM för att dämpa skärmen. Om PWM upptäcktes mättes ett medelvärde av 7784 (minst: 5 - maximum: 343500) Hz. | |||
| PCMark 8 Home Score Accelerated v2 | 4900 poäng | |
| PCMark 8 Creative Score Accelerated v2 | 7359 poäng | |
| PCMark 8 Work Score Accelerated v2 | 4812 poäng | |
| PCMark 10 Score | 5500 poäng | |
Hjälp | ||
| Apple MacBook Pro 16 2019 i9 5500M Apple SSD AP1024 7171 | Dell XPS 15 7590 9980HK GTX 1650 Toshiba XG6 KXG60ZNV1T02 | Microsoft Surface Laptop 3 15 Ryzen 5 3580U SK hynix BC501 HFM256GDGTNG | Dell Precision 5540 SK hynix PC400 512 GB | Gigabyte Aero 17 XA RP77 Intel SSD 760p SSDPEKKW512G8 | Eurocom Nightsky RX15 Samsung SSD 970 Pro 512GB | |
|---|---|---|---|---|---|---|
| CrystalDiskMark 5.2 / 6 | 30% | -11% | 8% | 52% | 58% | |
| Write 4K (MB/s) | 55.5 | 104.3 88% | 99 78% | 98 77% | 169.6 206% | 153 176% |
| Read 4K (MB/s) | 16.21 | 45.23 179% | 35.63 120% | 41.25 154% | 58 258% | 60.5 273% |
| Write Seq (MB/s) | 1959 | 1729 -12% | 706 -64% | 1295 -34% | 1516 -23% | 1938 -1% |
| Read Seq (MB/s) | 1763 | 1861 6% | 1044 -41% | 1441 -18% | 2362 34% | 1932 10% |
| Write 4K Q32T1 (MB/s) | 398.5 | 509 28% | 326.6 -18% | 429.2 8% | 481.8 21% | 482.5 21% |
| Read 4K Q32T1 (MB/s) | 648 | 388.5 -40% | 270 -58% | 400.1 -38% | 506 -22% | 594 -8% |
| Write Seq Q32T1 (MB/s) | 2727 | 2813 3% | 820 -70% | 1366 -50% | 1530 -44% | 2324 -15% |
| Read Seq Q32T1 (MB/s) | 3242 | 2906 -10% | 2028 -37% | 2201 -32% | 2645 -18% | 3539 9% |
| AS SSD | 34% | -26% | 8% | -17% | 21% | |
| Seq Read (MB/s) | 2531 | 1723 -32% | 1122 -56% | 1743 -31% | 1812 -28% | 2352 -7% |
| Seq Write (MB/s) | 2289 | 1386 -39% | 514 -78% | 930 -59% | 1512 -34% | 2184 -5% |
| 4K Read (MB/s) | 15.85 | 43.25 173% | 34.98 121% | 39.1 147% | 32.68 106% | 28.65 81% |
| 4K Write (MB/s) | 39.88 | 98.3 146% | 96.8 143% | 92.1 131% | 107.7 170% | 61.3 54% |
| 4K-64 Read (MB/s) | 1267 | 1078 -15% | 492 -61% | 956 -25% | 504 -60% | 1317 4% |
| 4K-64 Write (MB/s) | 1749 | 1456 -17% | 339.9 -81% | 863 -51% | 534 -69% | 2156 23% |
| Access Time Read * (ms) | 0.122 | 0.05 59% | 0.056 54% | 0.074 39% | 0.05 59% | 0.101 17% |
| Access Time Write * (ms) | 0.095 | 0.039 59% | 0.11 -16% | 0.053 44% | 0.227 -139% | 0.09 5% |
| Score Read (Points) | 1536 | 1294 -16% | 639 -58% | 1170 -24% | 718 -53% | 1581 3% |
| Score Write (Points) | 2018 | 1693 -16% | 488 -76% | 1048 -48% | 793 -61% | 2435 21% |
| Score Total (Points) | 4317 | 3638 -16% | 1434 -67% | 2781 -36% | 1871 -57% | 4813 11% |
| Copy ISO MB/s (MB/s) | 1995 | 3182 59% | 828 -58% | 946 -53% | 2705 36% | |
| Copy Program MB/s (MB/s) | 584 | 984 68% | 200.5 -66% | 414.3 -29% | 666 14% | |
| Copy Game MB/s (MB/s) | 1135 | 1824 61% | 387.4 -66% | 1263 11% | 1583 39% | |
| PCMark 8 | ||||||
| Storage Score v2 (Points) | 1818 | |||||
| Totalt genomsnitt (program/inställningar) | 32% /
33% | -19% /
-21% | 8% /
8% | 18% /
8% | 40% /
35% |
* ... mindre är bättre

| 3DMark 06 Standard Score | 34321 poäng | |
| 3DMark 11 Performance | 14097 poäng | |
| 3DMark Cloud Gate Standard Score | 30690 poäng | |
| 3DMark Fire Strike Score | 9196 poäng | |
| 3DMark Time Spy Score | 3629 poäng | |
Hjälp | ||
SpecViewPerf 13
| Deus Ex Mankind Divided - 1920x1080 Ultra Preset AA:2xMS AF:8x | |
| Genomsnitt NVIDIA GeForce GTX 1660 Ti Mobile (n=1) | |
| Apple MacBook Pro 16 2019 i9 5500M | |
| Genomsnitt NVIDIA GeForce GTX 1650 Mobile (n=1) | |
| Apple MacBook Pro 15 2018 (2.6 GHz, 560X) | |
| Rage 2 - 1920x1080 Ultra Preset (Resolution Scale Off) | |
| Genomsnitt NVIDIA GeForce GTX 1660 Ti Mobile (67.9 - 68.8, n=2) | |
| Genomsnitt NVIDIA GeForce GTX 1660 Ti Max-Q (58.2 - 64.8, n=2) | |
| MSI Alpha 15 A3DDK | |
| Genomsnitt NVIDIA GeForce GTX 1650 Mobile (45.1 - 60, n=3) | |
| Apple MacBook Pro 16 2019 i9 5500M | |
| låg | med. | hög | ultra | QHD | 4K | |
|---|---|---|---|---|---|---|
| Counter-Strike: GO (2012) | 208 | 118 | 71.4 | |||
| GTA V (2015) | 168 | 91.4 | 47.6 | 34.5 | 32.3 | |
| The Witcher 3 (2015) | 68 | 38.8 | ||||
| Dota 2 Reborn (2015) | 137 | 125 | 111 | 107 | 53.9 | |
| World of Warships (2015) | 43.4 | |||||
| Rainbow Six Siege (2015) | 126 | 44.8 | ||||
| Overwatch (2016) | 98 | |||||
| Deus Ex Mankind Divided (2016) | 52 | 27.8 | 16.9 | |||
| Rocket League (2017) | 153 | 107 | 59 | |||
| Final Fantasy XV Benchmark (2018) | 48.4 | 20.4 | ||||
| World of Tanks enCore (2018) | 76 | 49.1 | 24.6 | |||
| Far Cry 5 (2018) | 55 | 40 | 20 | |||
| Shadow of the Tomb Raider (2018) | 120 | 58 | 54 | 46 | 30 | 13 |
| Battlefield V (2018) | 85 | 76 | 62 | 58.9 | 47 | 14.4 |
| Apex Legends (2019) | 63 | 43.5 | ||||
| Far Cry New Dawn (2019) | 86 | 67 | 64 | 57 | 41 | 21 |
| Metro Exodus (2019) | 92 | 47.1 | 34.3 | 28.6 | 22 | |
| Dirt Rally 2.0 (2019) | 90 | 50.2 | 35.8 | |||
| The Division 2 (2019) | 56 | 39 | ||||
| Anno 1800 (2019) | 67 | 44.6 | 21.7 | |||
| Rage 2 (2019) | 113 | 53.7 | 45.2 | 44.4 | 28.4 | |
| Total War: Three Kingdoms (2019) | 175 | 64.1 | 40.5 | 29.7 | 19 | 7 |
| F1 2019 (2019) | 174 | 105 | 97 | 65 | 49 | |
| Control (2019) | 139 | 41.5 | 29.2 | 18.1 | ||
| Borderlands 3 (2019) | 41.4 | 30.8 | 21.4 | 3.8 | ||
| FIFA 20 (2019) | 144 | 124 | 90 | |||
| Ghost Recon Breakpoint (2019) | 50 | 35 | ||||
| GRID 2019 (2019) | 46.3 | 36.6 | 23.2 | |||
| Call of Duty Modern Warfare 2019 (2019) | 34.7 | |||||
| Need for Speed Heat (2019) | 74 | 56.7 | 50.9 | 44.7 | 28 | 12.8 |
| Star Wars Jedi Fallen Order (2019) | 75 | 61 | 54.3 | 35 | 16.2 | |
| Red Dead Redemption 2 (2019) | 97.6 | 55.2 | 35.8 | 20.9 | 0 () | 0 () |
| Fall Guys (2020) | 59.4 | 59.4 | 38.1 | |||
| Hearthstone (2020) | 33.2 | 32 | 59.7 | 59.6 | ||
| Doom Eternal (2020) | 84.8 | 47.5 | 27.5 | 21.9 | 15.1 | |
| Gears Tactics (2020) | 60 | 47.6 | 30.7 | |||
| F1 2020 (2020) | 0 spelet startar inte | |||||
| Flight Simulator 2020 (2020) | 47.4 | 28 | 19.2 | 12.2 | ||
| Mafia Definitive Edition (2020) | 52.5 | 37.5 | ||||
| Star Wars Squadrons (2020) | 95.6 | 69.7 | 26.4 | |||
| FIFA 21 (2020) | 151 | 115 | 70 | |||
| Cyberpunk 2077 1.0 (2020) | 54.8 | 29.9 | 23.5 | |||
| Hitman 3 (2021) | 157 | 81.3 | 66.3 | 62 | ||
| Outriders (2021) | 70.7 | 44.4 | 36 | 27.6 | ||
| Resident Evil Village (2021) | 81.7 | 38.9 | 40.6 | |||
| Far Cry 6 (2021) | 0 spelet startar inte | |||||
| Riders Republic (2021) | 61 | 41 | 28 | |||
| Call of Duty Vanguard (2021) | 43.1 | 21.7 | ||||
| Forza Horizon 5 (2021) | 85 | 31 |
Ljudnivå
| Låg belastning |
| 29.9 / 29.9 / 29.9 dB(A) |
| Hög belastning |
| 43 / 46.1 dB(A) |
 | ||
30 dB tyst 40 dB(A) hörbar 50 dB(A) högt ljud |
||
min: | ||
(±) Den maximala temperaturen på ovansidan är 42 °C / 108 F, jämfört med genomsnittet av 36.8 °C / 98 F , allt från 21 till 71 °C för klassen Multimedia.
(+) Botten värms upp till maximalt 38 °C / 100 F, jämfört med genomsnittet av 39.1 °C / 102 F
(+) Vid tomgångsbruk är medeltemperaturen för ovansidan 22.8 °C / 73 F, jämfört med enhetsgenomsnittet på 31.3 °C / ### class_avg_f### F.
(+) Handledsstöden och pekplattan är kallare än hudtemperaturen med maximalt 27 °C / 80.6 F och är därför svala att ta på.
(±) Medeltemperaturen för handledsstödsområdet på liknande enheter var 28.7 °C / 83.7 F (+1.7 °C / 3.1 F).
Apple MacBook Pro 16 2019 i9 5500M ljudanalys
(+) | högtalare kan spela relativt högt (82.3 dB)
Bas 100 - 315 Hz
(+) | bra bas - bara 2.3% från medianen
(+) | basen är linjär (5% delta till föregående frekvens)
Mellan 400 - 2000 Hz
(+) | balanserad mellan - endast 2.7% från medianen
(+) | mids är linjära (3.4% delta till föregående frekvens)
Högsta 2 - 16 kHz
(+) | balanserade toppar - endast 2.1% från medianen
(+) | toppar är linjära (2.6% delta till föregående frekvens)
Totalt 100 - 16 000 Hz
(+) | det totala ljudet är linjärt (6.9% skillnad mot median)
Jämfört med samma klass
» 5% av alla testade enheter i den här klassen var bättre, 1% liknande, 94% sämre
» Den bästa hade ett delta på 5%, genomsnittet var 17%, sämst var 45%
Jämfört med alla testade enheter
» 1% av alla testade enheter var bättre, 0% liknande, 99% sämre
» Den bästa hade ett delta på 4%, genomsnittet var 24%, sämst var 134%
Dell XPS 15 7590 9980HK GTX 1650 ljudanalys
(+) | högtalare kan spela relativt högt (88.4 dB)
Bas 100 - 315 Hz
(-) | nästan ingen bas - i genomsnitt 24.9% lägre än medianen
(±) | linjäriteten för basen är genomsnittlig (14.4% delta till föregående frekvens)
Mellan 400 - 2000 Hz
(+) | balanserad mellan - endast 2.8% från medianen
(±) | linjäriteten för mids är genomsnittlig (7.8% delta till föregående frekvens)
Högsta 2 - 16 kHz
(+) | balanserade toppar - endast 1.9% från medianen
(+) | toppar är linjära (5.3% delta till föregående frekvens)
Totalt 100 - 16 000 Hz
(±) | linjäriteten för det totala ljudet är genomsnittlig (17.8% skillnad mot median)
Jämfört med samma klass
» 52% av alla testade enheter i den här klassen var bättre, 7% liknande, 41% sämre
» Den bästa hade ett delta på 5%, genomsnittet var 17%, sämst var 45%
Jämfört med alla testade enheter
» 36% av alla testade enheter var bättre, 8% liknande, 56% sämre
» Den bästa hade ett delta på 4%, genomsnittet var 24%, sämst var 134%
Apple MacBook Pro 15 2018 (2.6 GHz, 560X) ljudanalys
(+) | högtalare kan spela relativt högt (85 dB)
Bas 100 - 315 Hz
(+) | bra bas - bara 4.7% från medianen
(±) | linjäriteten för basen är genomsnittlig (8.3% delta till föregående frekvens)
Mellan 400 - 2000 Hz
(+) | balanserad mellan - endast 1.8% från medianen
(+) | mids är linjära (3.5% delta till föregående frekvens)
Högsta 2 - 16 kHz
(+) | balanserade toppar - endast 2.6% från medianen
(+) | toppar är linjära (5.7% delta till föregående frekvens)
Totalt 100 - 16 000 Hz
(+) | det totala ljudet är linjärt (6.4% skillnad mot median)
Jämfört med samma klass
» 4% av alla testade enheter i den här klassen var bättre, 1% liknande, 95% sämre
» Den bästa hade ett delta på 5%, genomsnittet var 17%, sämst var 45%
Jämfört med alla testade enheter
» 1% av alla testade enheter var bättre, 0% liknande, 99% sämre
» Den bästa hade ett delta på 4%, genomsnittet var 24%, sämst var 134%
| Av/Standby | |
| Låg belastning | |
| Hög belastning |
|
Förklaring:
min: | |
| Apple MacBook Pro 16 2019 i9 5500M i9-9880H, Radeon Pro 5500M, Apple SSD AP1024 7171, IPS, 3072x1920, 16" | Apple MacBook Pro 15 2018 (2.6 GHz, 560X) i7-8850H, Radeon Pro 560X, Apple SSD AP0512, IPS, 2880x1800, 15.4" | Dell XPS 15 7590 9980HK GTX 1650 i9-9980HK, GeForce GTX 1650 Mobile, Toshiba XG6 KXG60ZNV1T02, OLED, 3840x2160, 15.6" | MSI P65 Creator 9SF-657 i9-9880H, GeForce RTX 2070 Max-Q, 2x Samsung SSD PM981 MZVLB512HAJQ (RAID 0), IPS, 3840x2160, 15.6" | Lenovo ThinkPad X1 Extreme 2019 20QV000WGE i7-9750H, GeForce GTX 1650 Mobile, Samsung SSD PM981 MZVLB512HAJQ, IPS, 3840x2160, 15.6" | Genomsnitt av klass Multimedia | |
|---|---|---|---|---|---|---|
| Power Consumption | 11% | -18% | -67% | -31% | 2% | |
| Idle Minimum * (Watt) | 3.7 | 3.4 8% | 6.2 -68% | 9.4 -154% | 8.5 -130% | 5.71 ? -54% |
| Idle Average * (Watt) | 12.1 | 11 9% | 9.6 21% | 17.4 -44% | 14.7 -21% | 10.1 ? 17% |
| Idle Maximum * (Watt) | 17 | 14.9 12% | 21.2 -25% | 19.6 -15% | 19.4 -14% | 12.4 ? 27% |
| Load Average * (Watt) | 91.5 | 78.9 14% | 104.3 -14% | 103 -13% | 89.6 2% | 65 ? 29% |
| Witcher 3 ultra * (Watt) | 103 | 91.7 11% | 96.1 7% | |||
| Load Maximum * (Watt) | 102.3 | 91.2 11% | 135.3 -32% | 216 -111% | 129.8 -27% | 112.2 ? -10% |
* ... mindre är bättre
| Apple MacBook Pro 16 2019 i9 5500M i9-9880H, Radeon Pro 5500M, 99.8 Wh | Lenovo ThinkPad X1 Extreme 2019 20QV000WGE i7-9750H, GeForce GTX 1650 Mobile, 80 Wh | Dell XPS 15 7590 9980HK GTX 1650 i9-9980HK, GeForce GTX 1650 Mobile, 97 Wh | Asus ZenBook Pro 15 UX580GE i9-8950HK, GeForce GTX 1050 Ti Mobile, 71 Wh | MSI P65 Creator 9SF-657 i9-9880H, GeForce RTX 2070 Max-Q, 82 Wh | Apple MacBook Pro 15 2018 (2.6 GHz, 560X) i7-8850H, Radeon Pro 560X, 83 Wh | Genomsnitt av klass Multimedia | |
|---|---|---|---|---|---|---|---|
| Batteridrifttid | -31% | 98% | -9% | -20% | 24% | 46% | |
| H.264 (h) | 9.7 | 4.7 -52% | 11.7 21% | 16.4 ? 69% | |||
| WiFi v1.3 (h) | 12 | 4.8 -60% | 7.8 -35% | 6.3 -47% | 6 -50% | 10.2 -15% | 12 ? 0% |
| Witcher 3 ultra (h) | 0.9 | 1.5 67% | |||||
| Load (h) | 1 | 1.2 20% | 3.3 230% | 1.3 30% | 1.1 10% | 1.675 ? 68% |
För
Emot
Omdöme - En fantastisk men dyr multimedialaptop

Läs den fullständiga versionen av den här recensionen på engelska här.
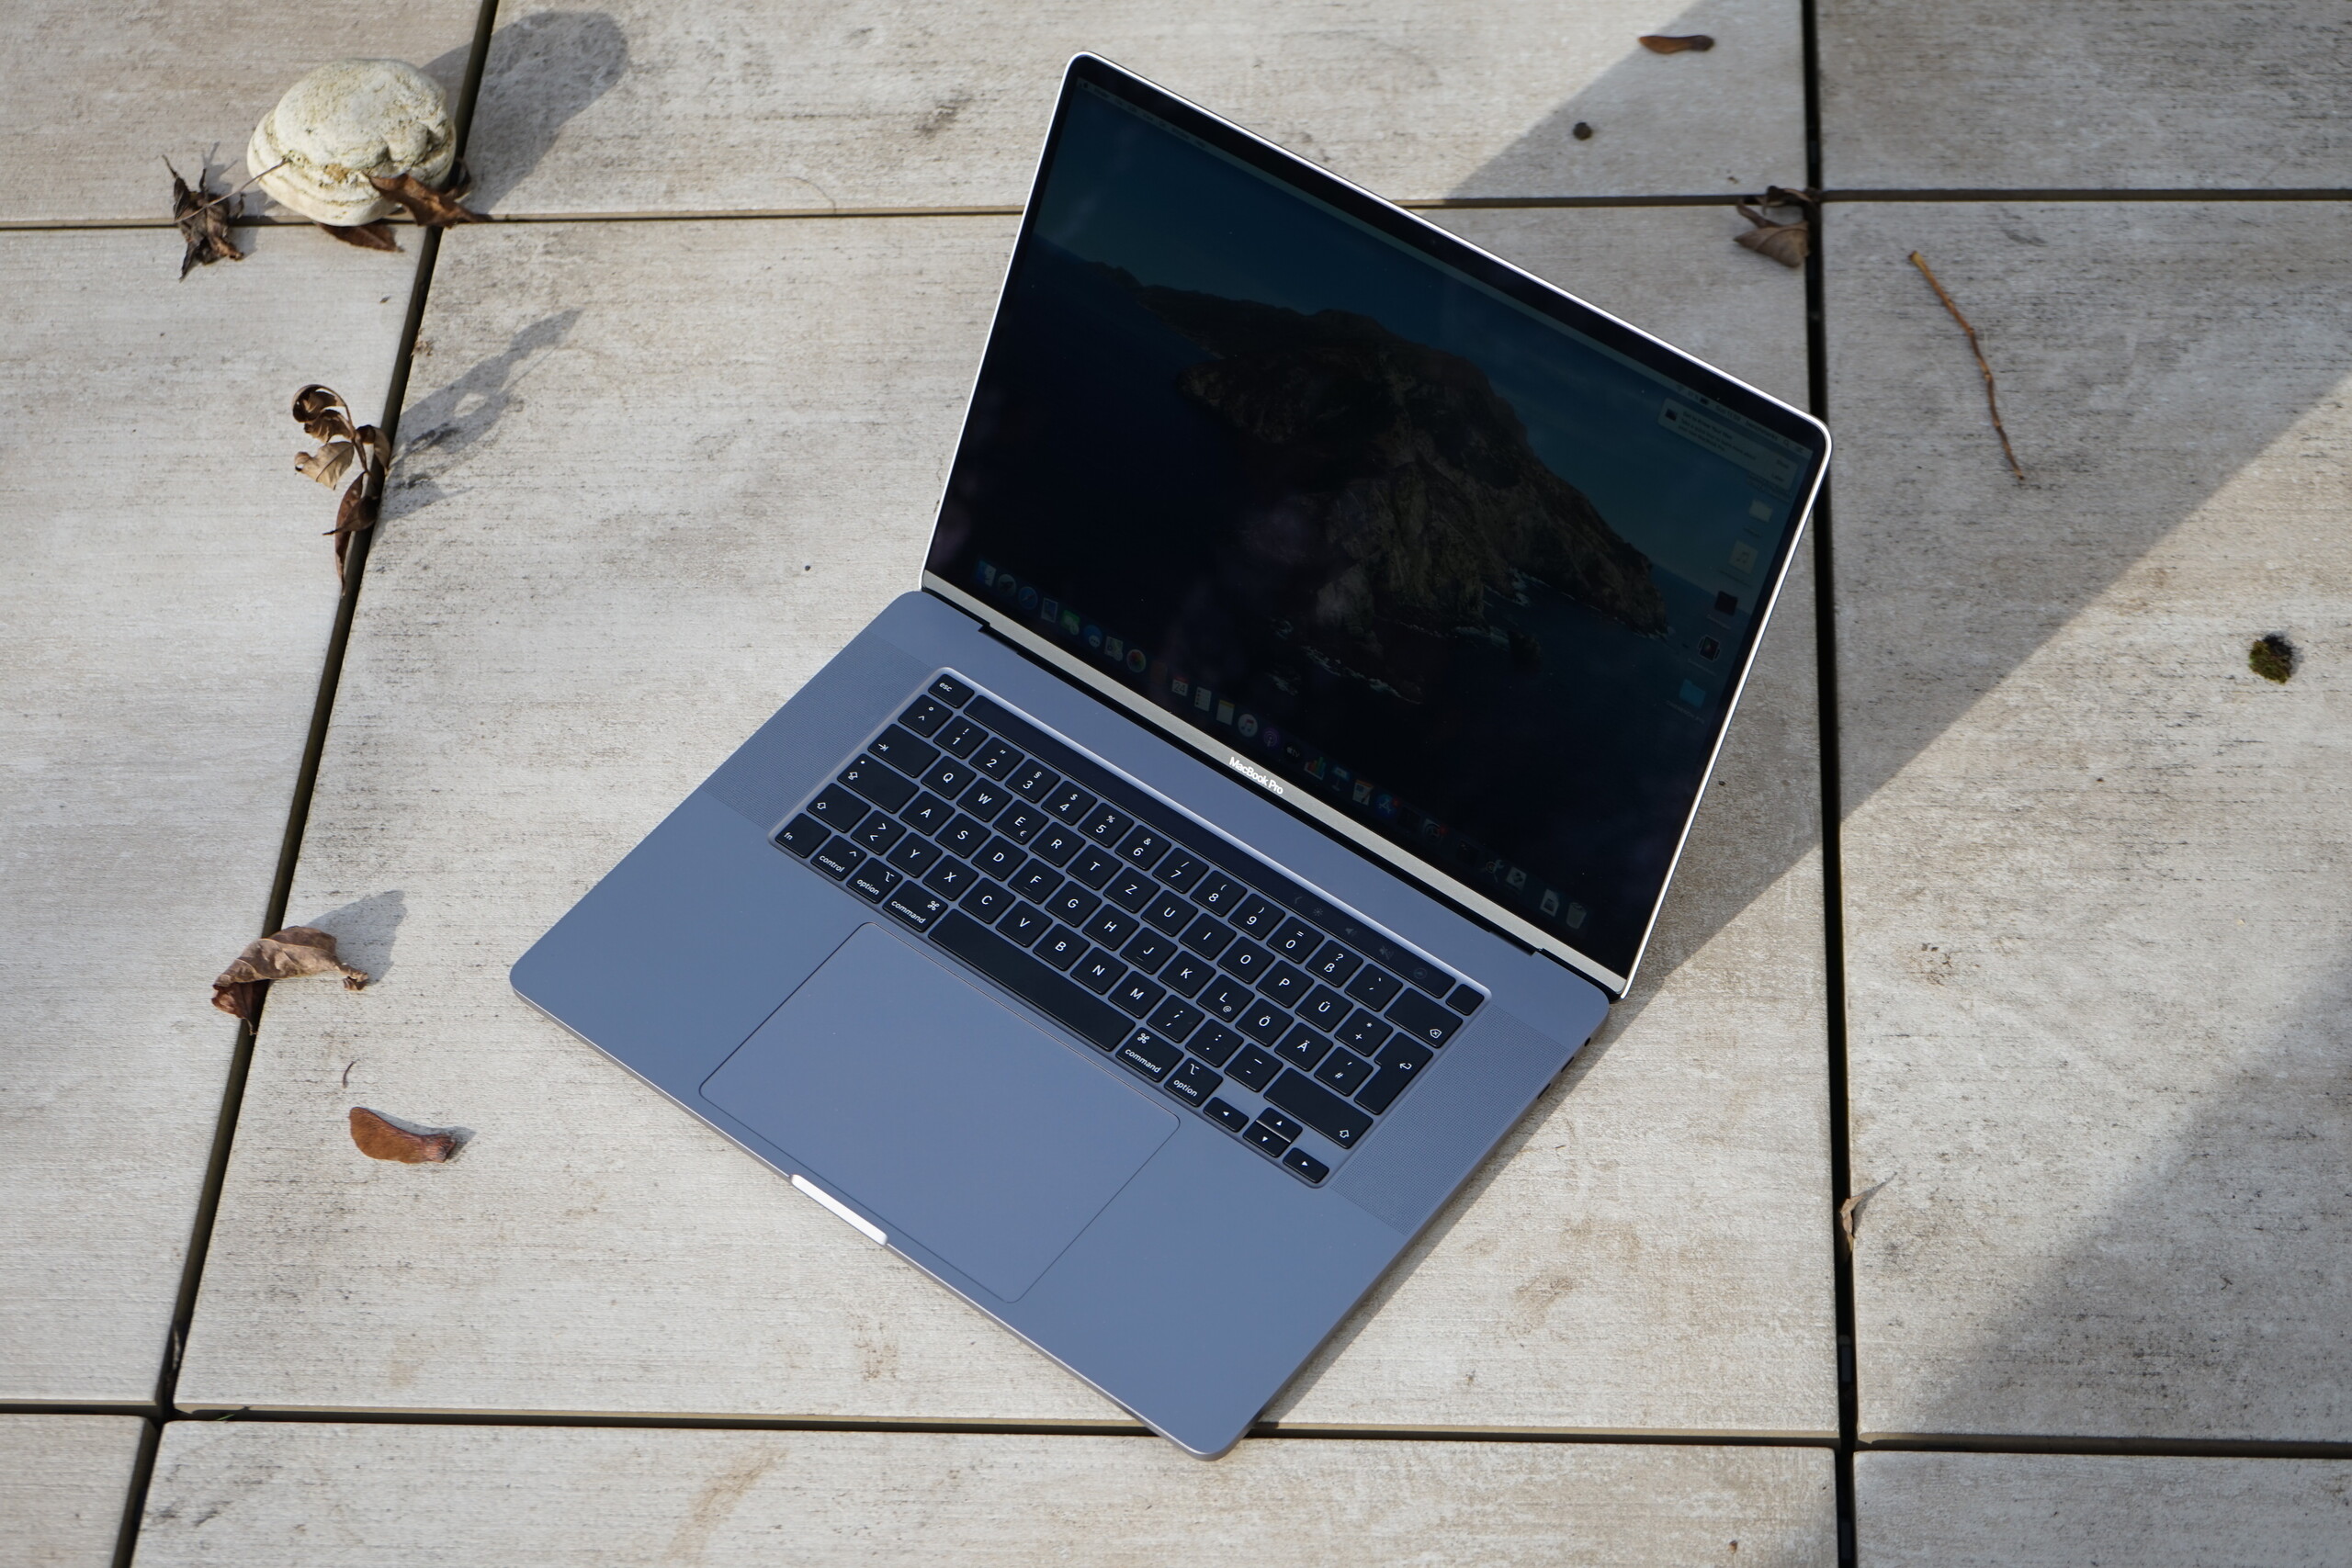
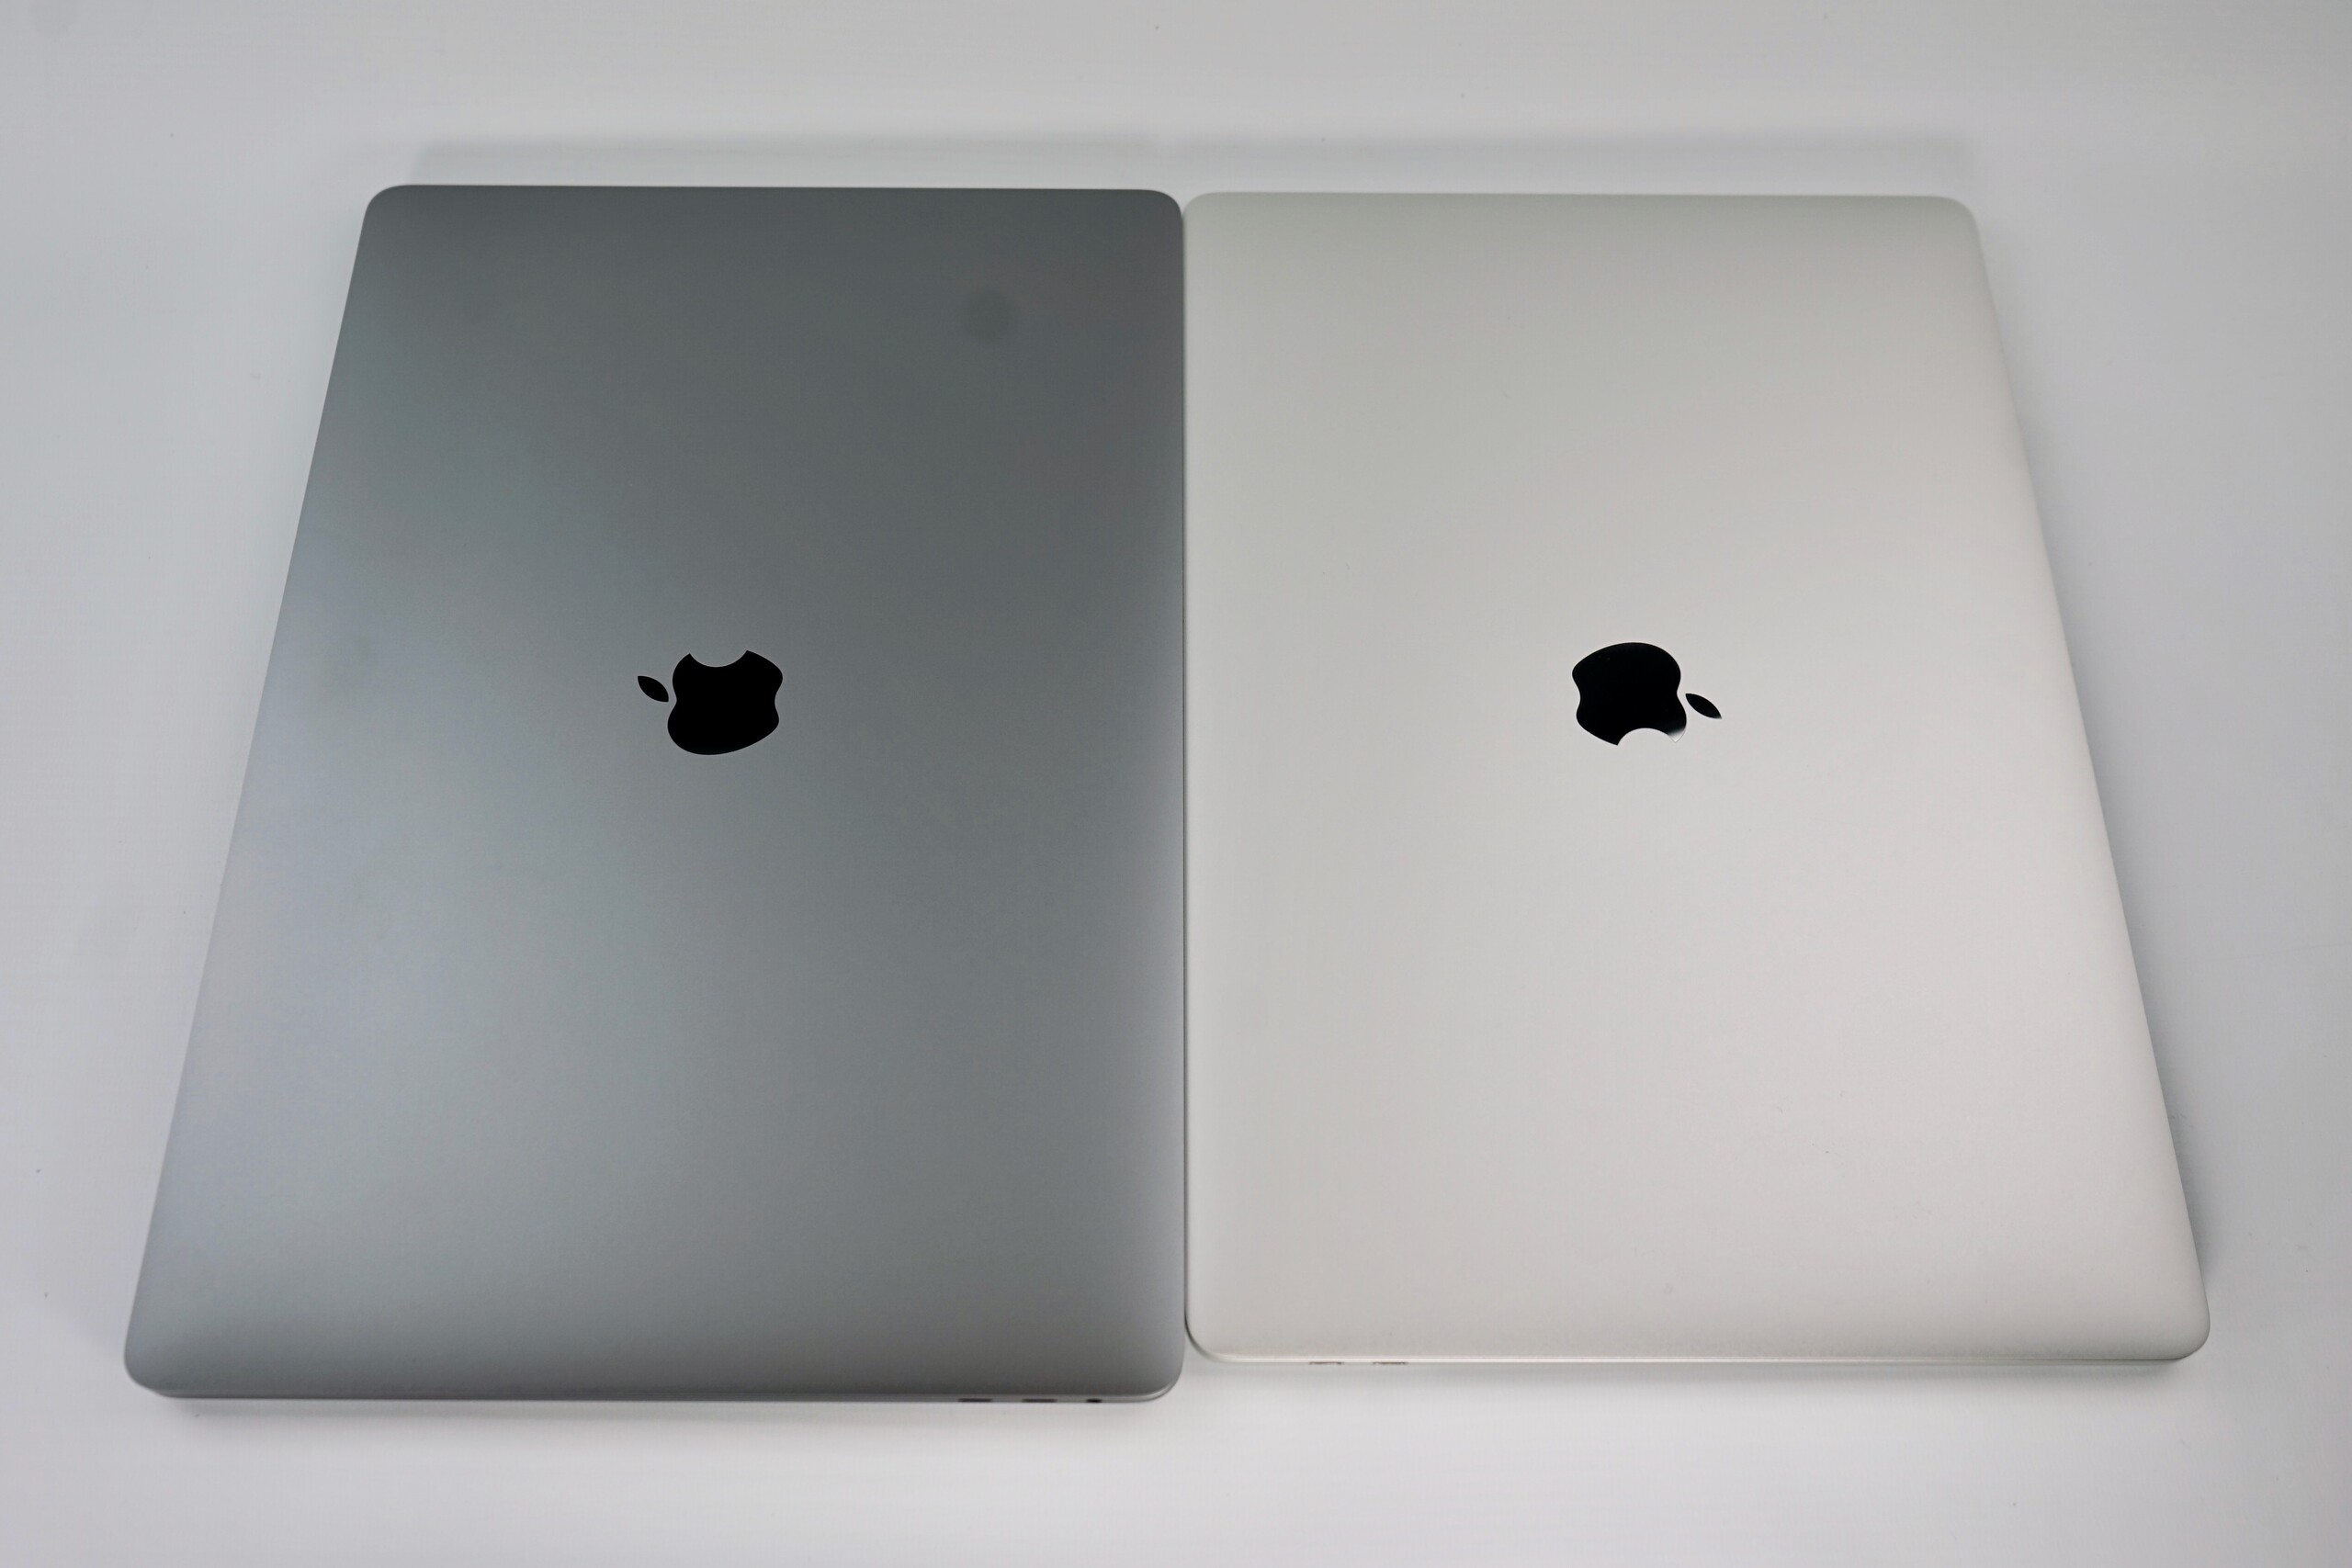
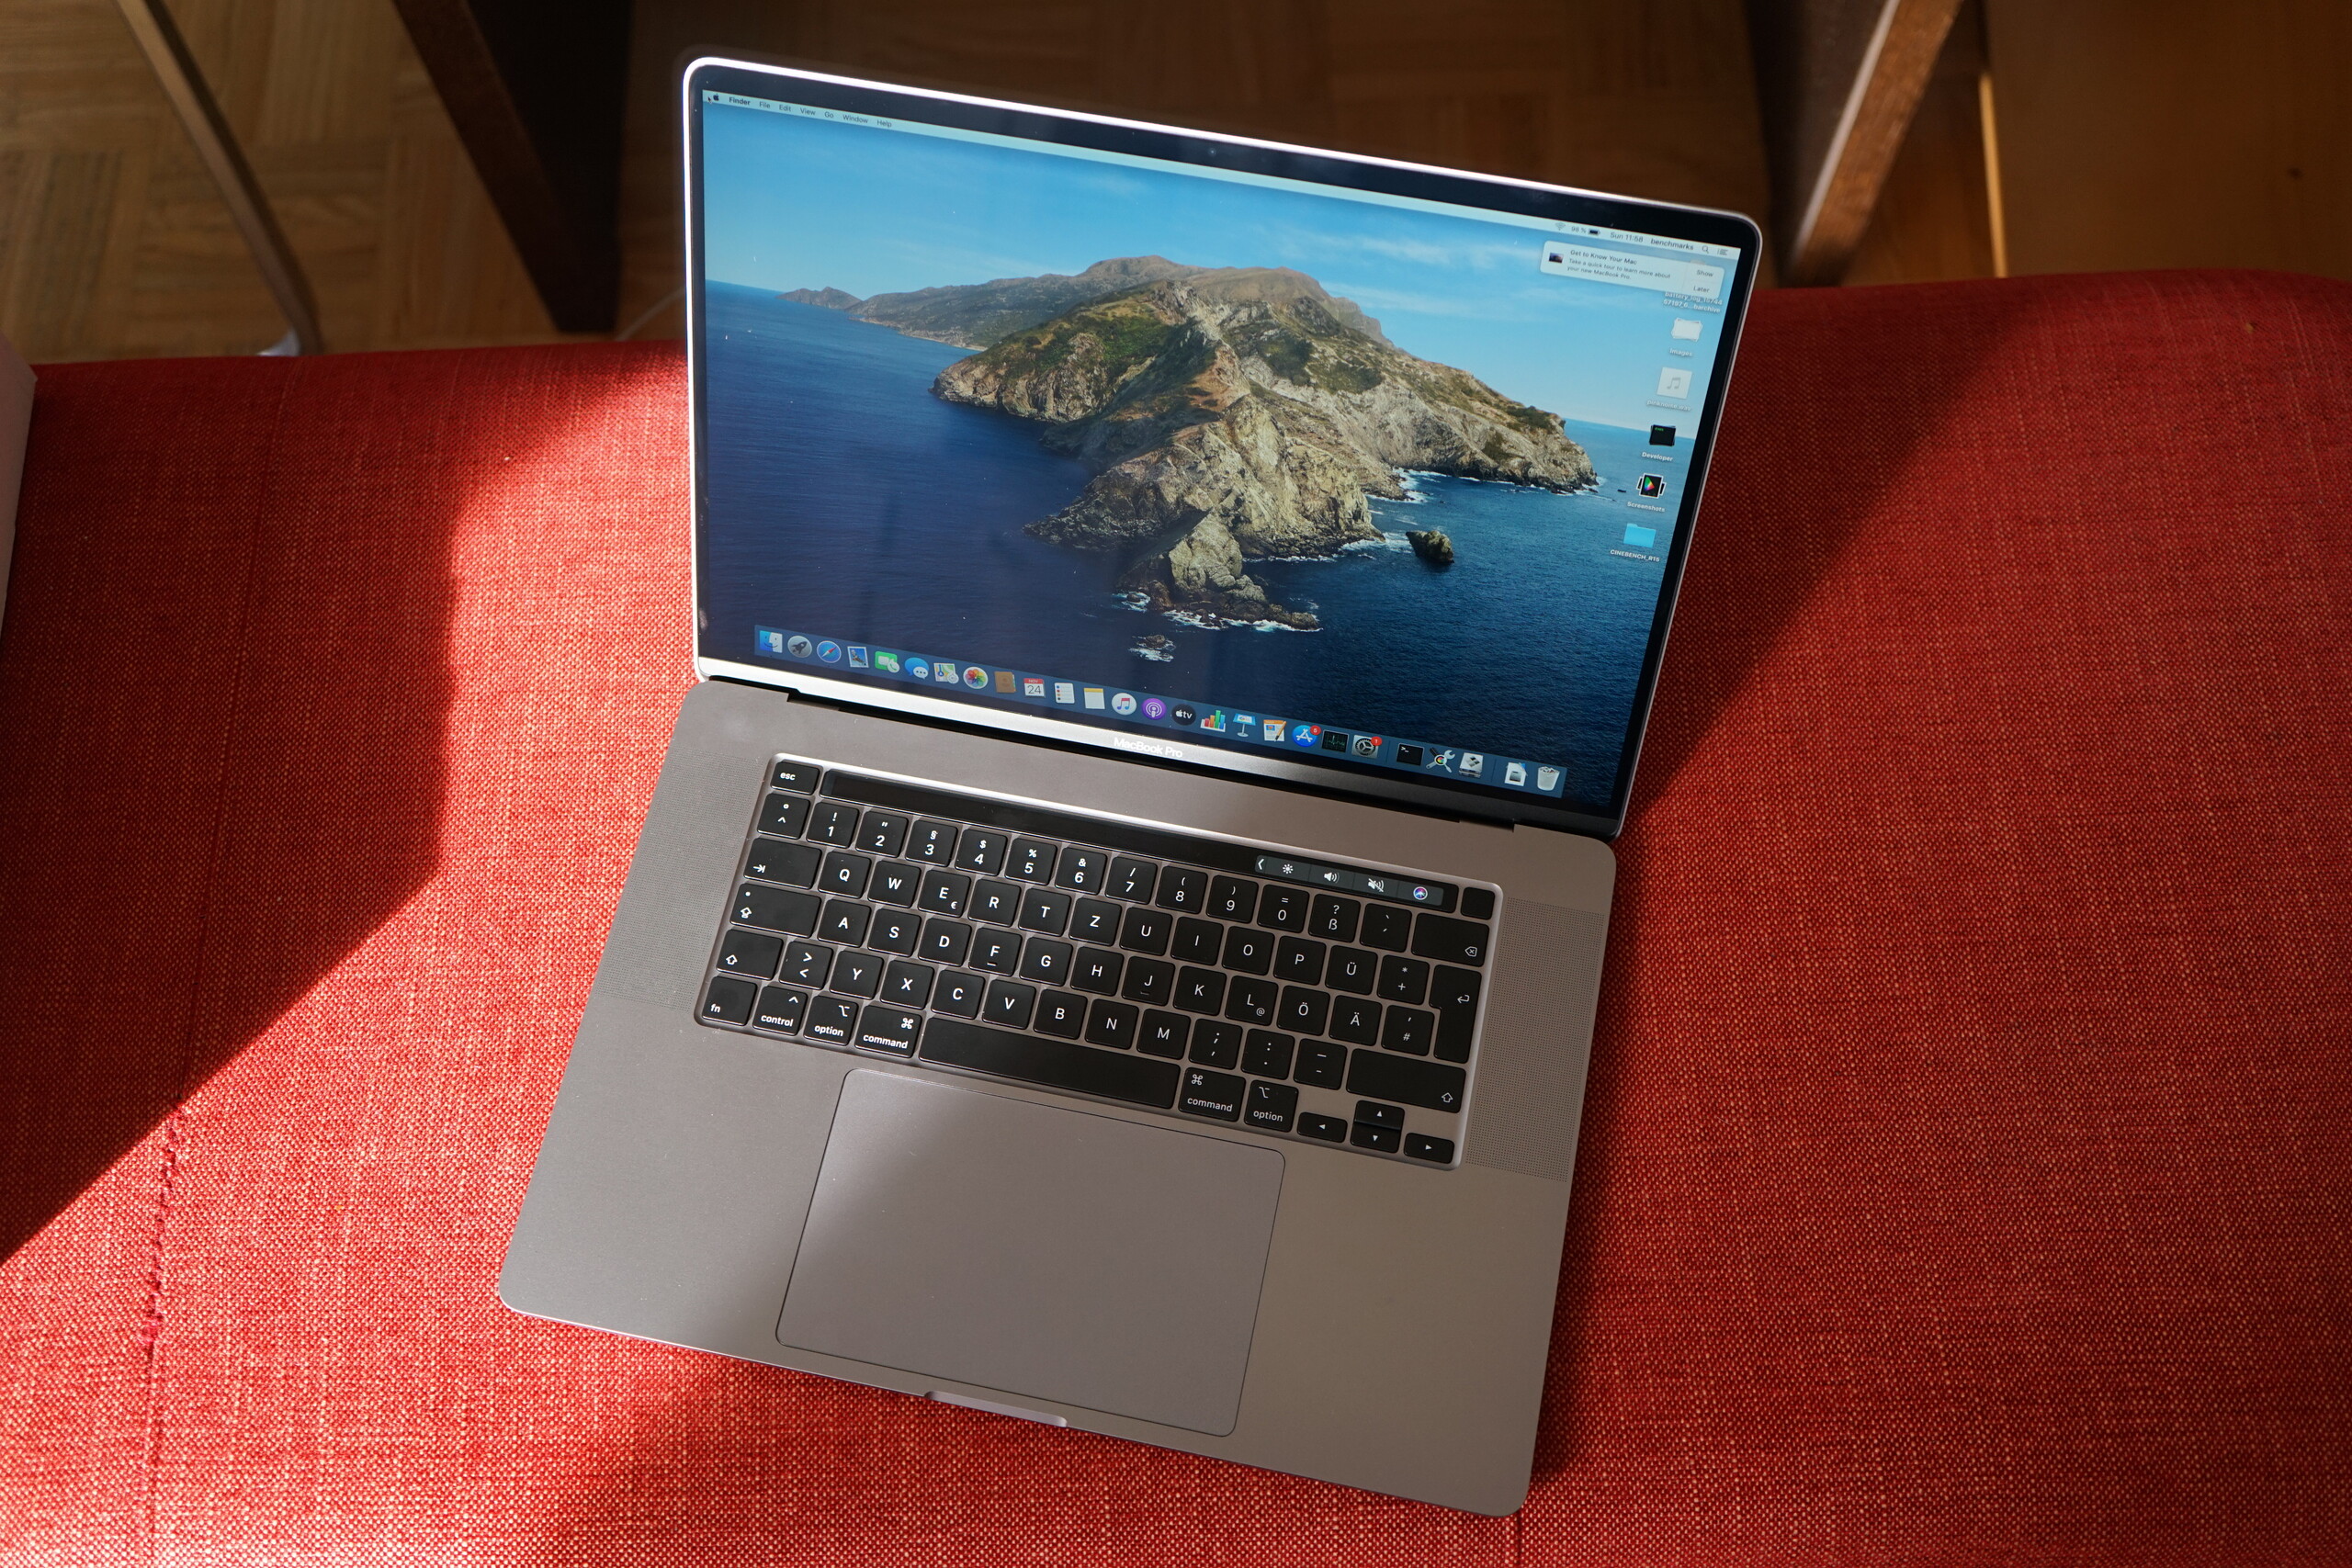
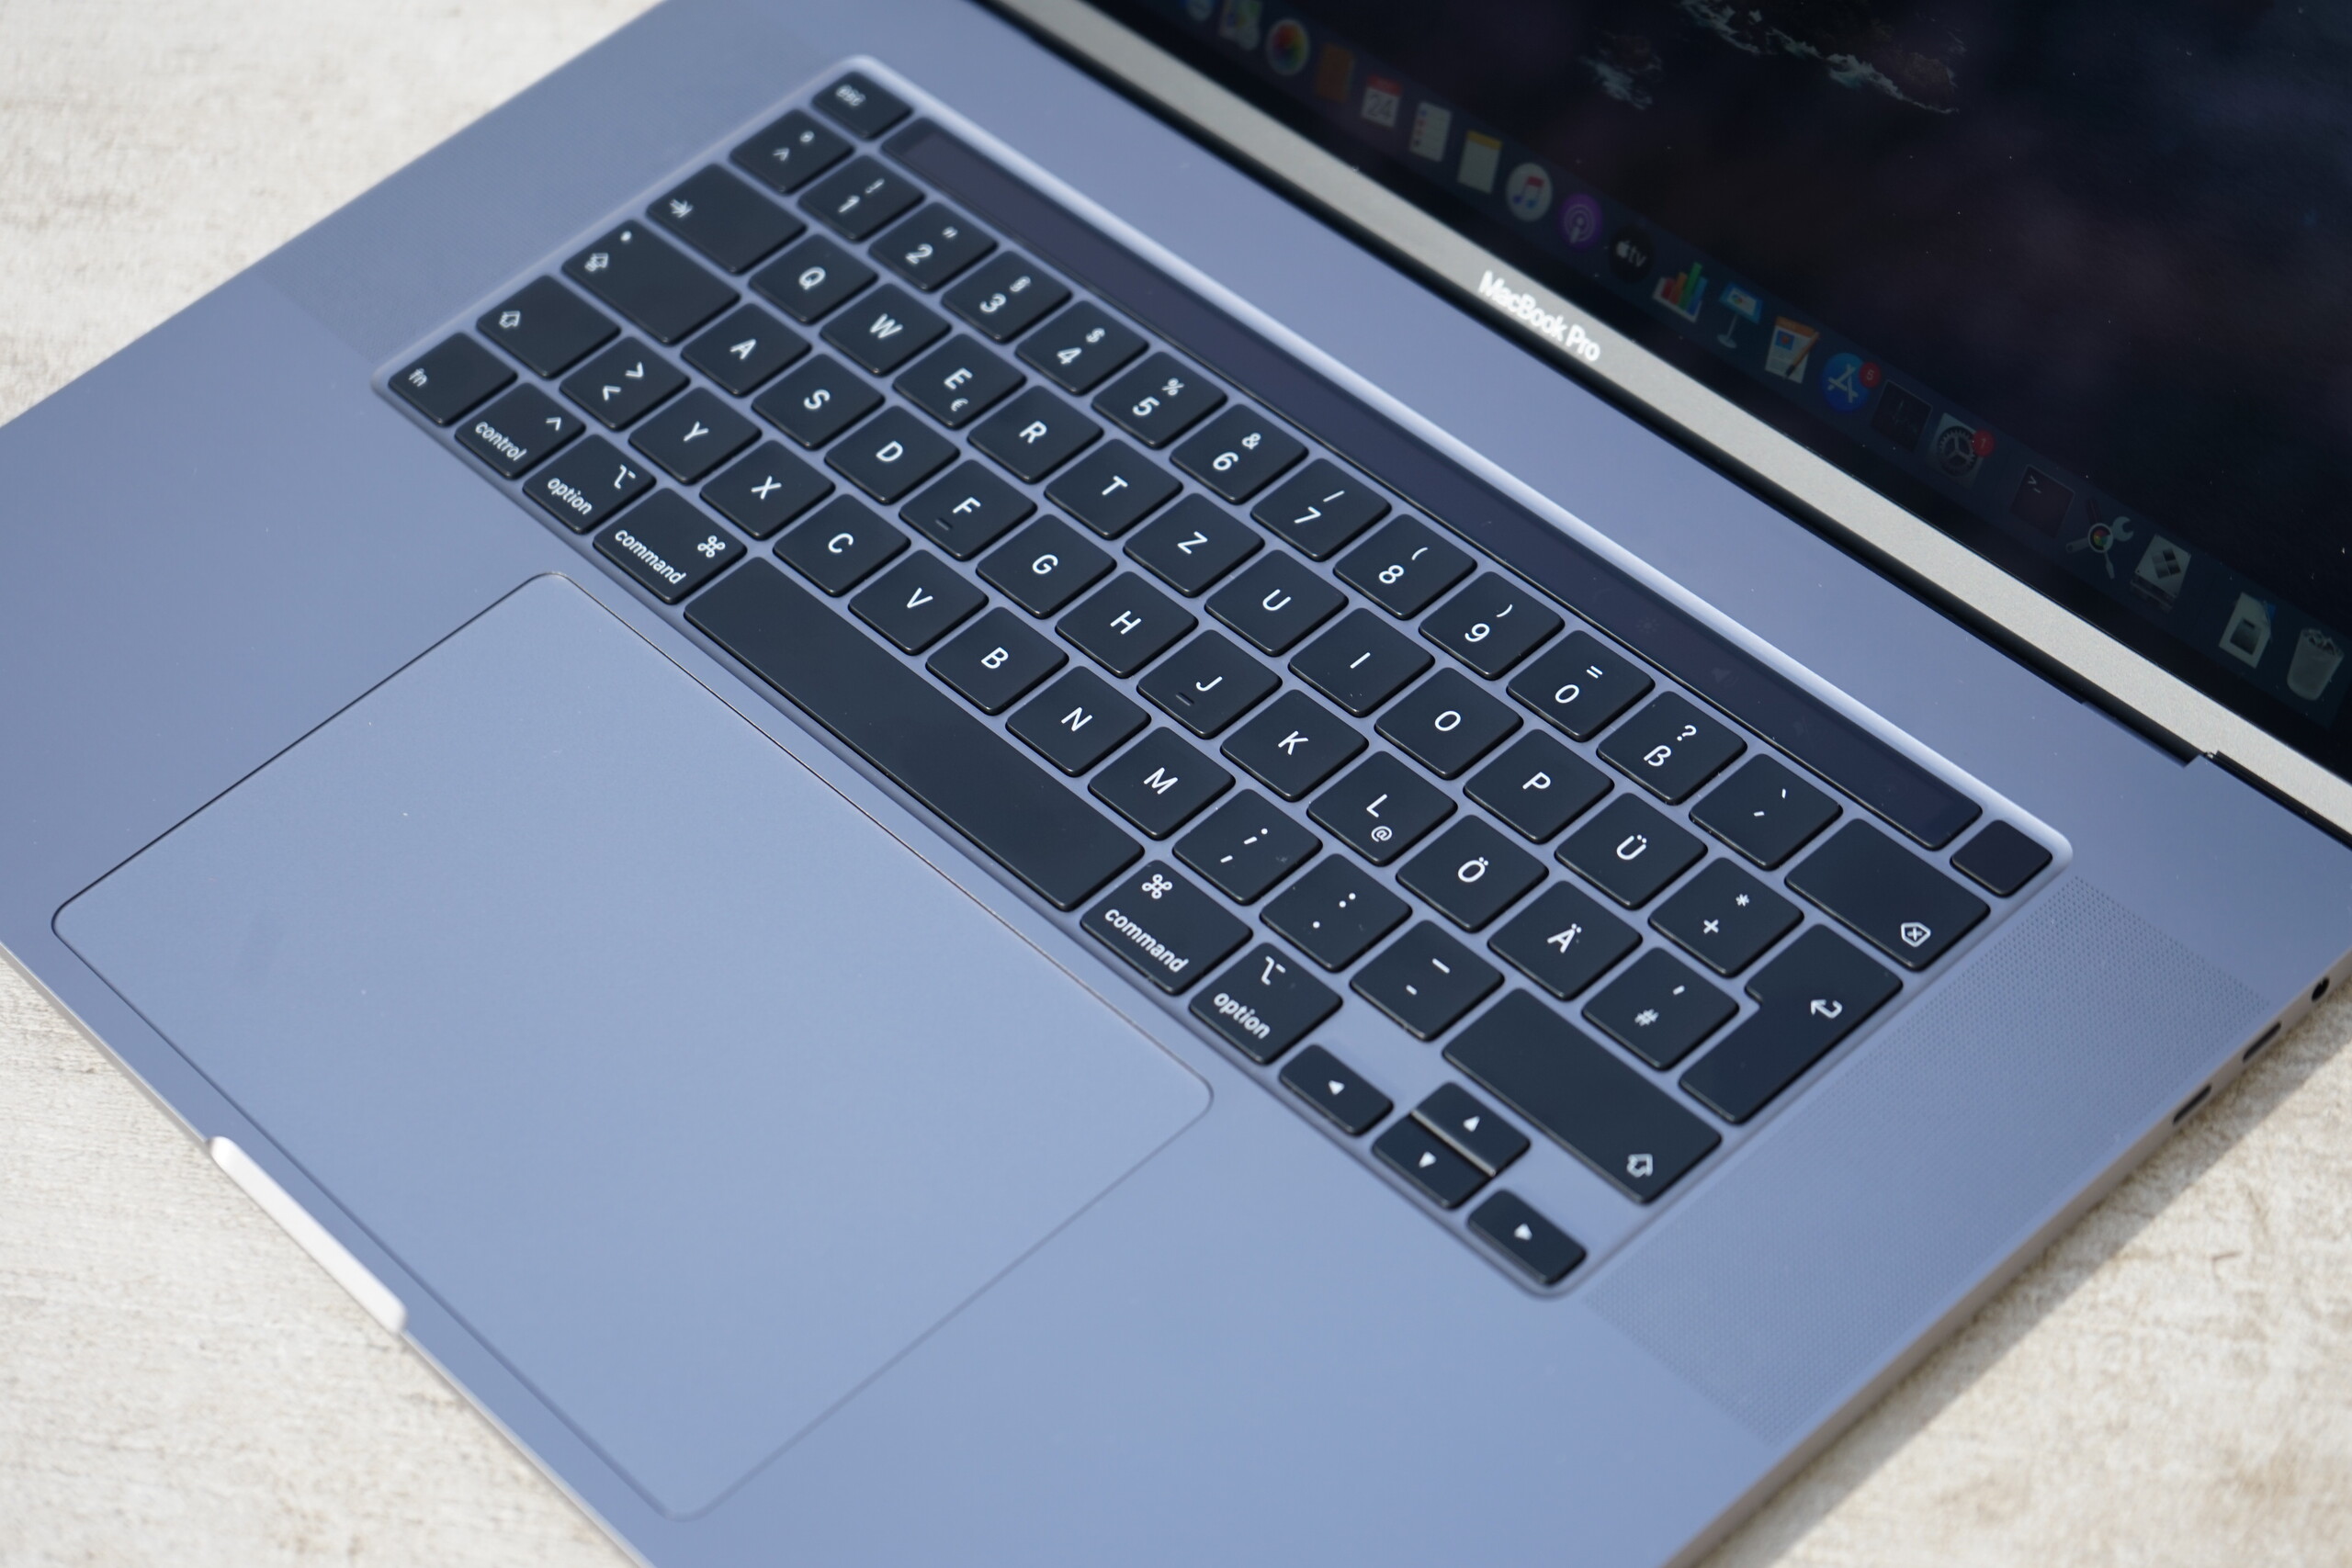
Med sin nya MacBook Pro på 16 tum har Apple förfinat sina gamla 15-tumsdesign och gjort små men viktiga ändringar. För det första har man bytt ut den kraftigt kritiserade butterfly-tangentbordsmekanismen med en saxbrytar-design som inte bara är beprövad utan dessutom borde vara hållbarare och ge mer resväg än butterfly-knapparna. Även om Apple har återanvänt mycket av designen från sin senaste MacBook Pro 15 till sin nya 16-tumsmodell är den sistnämnda aningen tjockare än sin föregångare och har effektivare kylning.
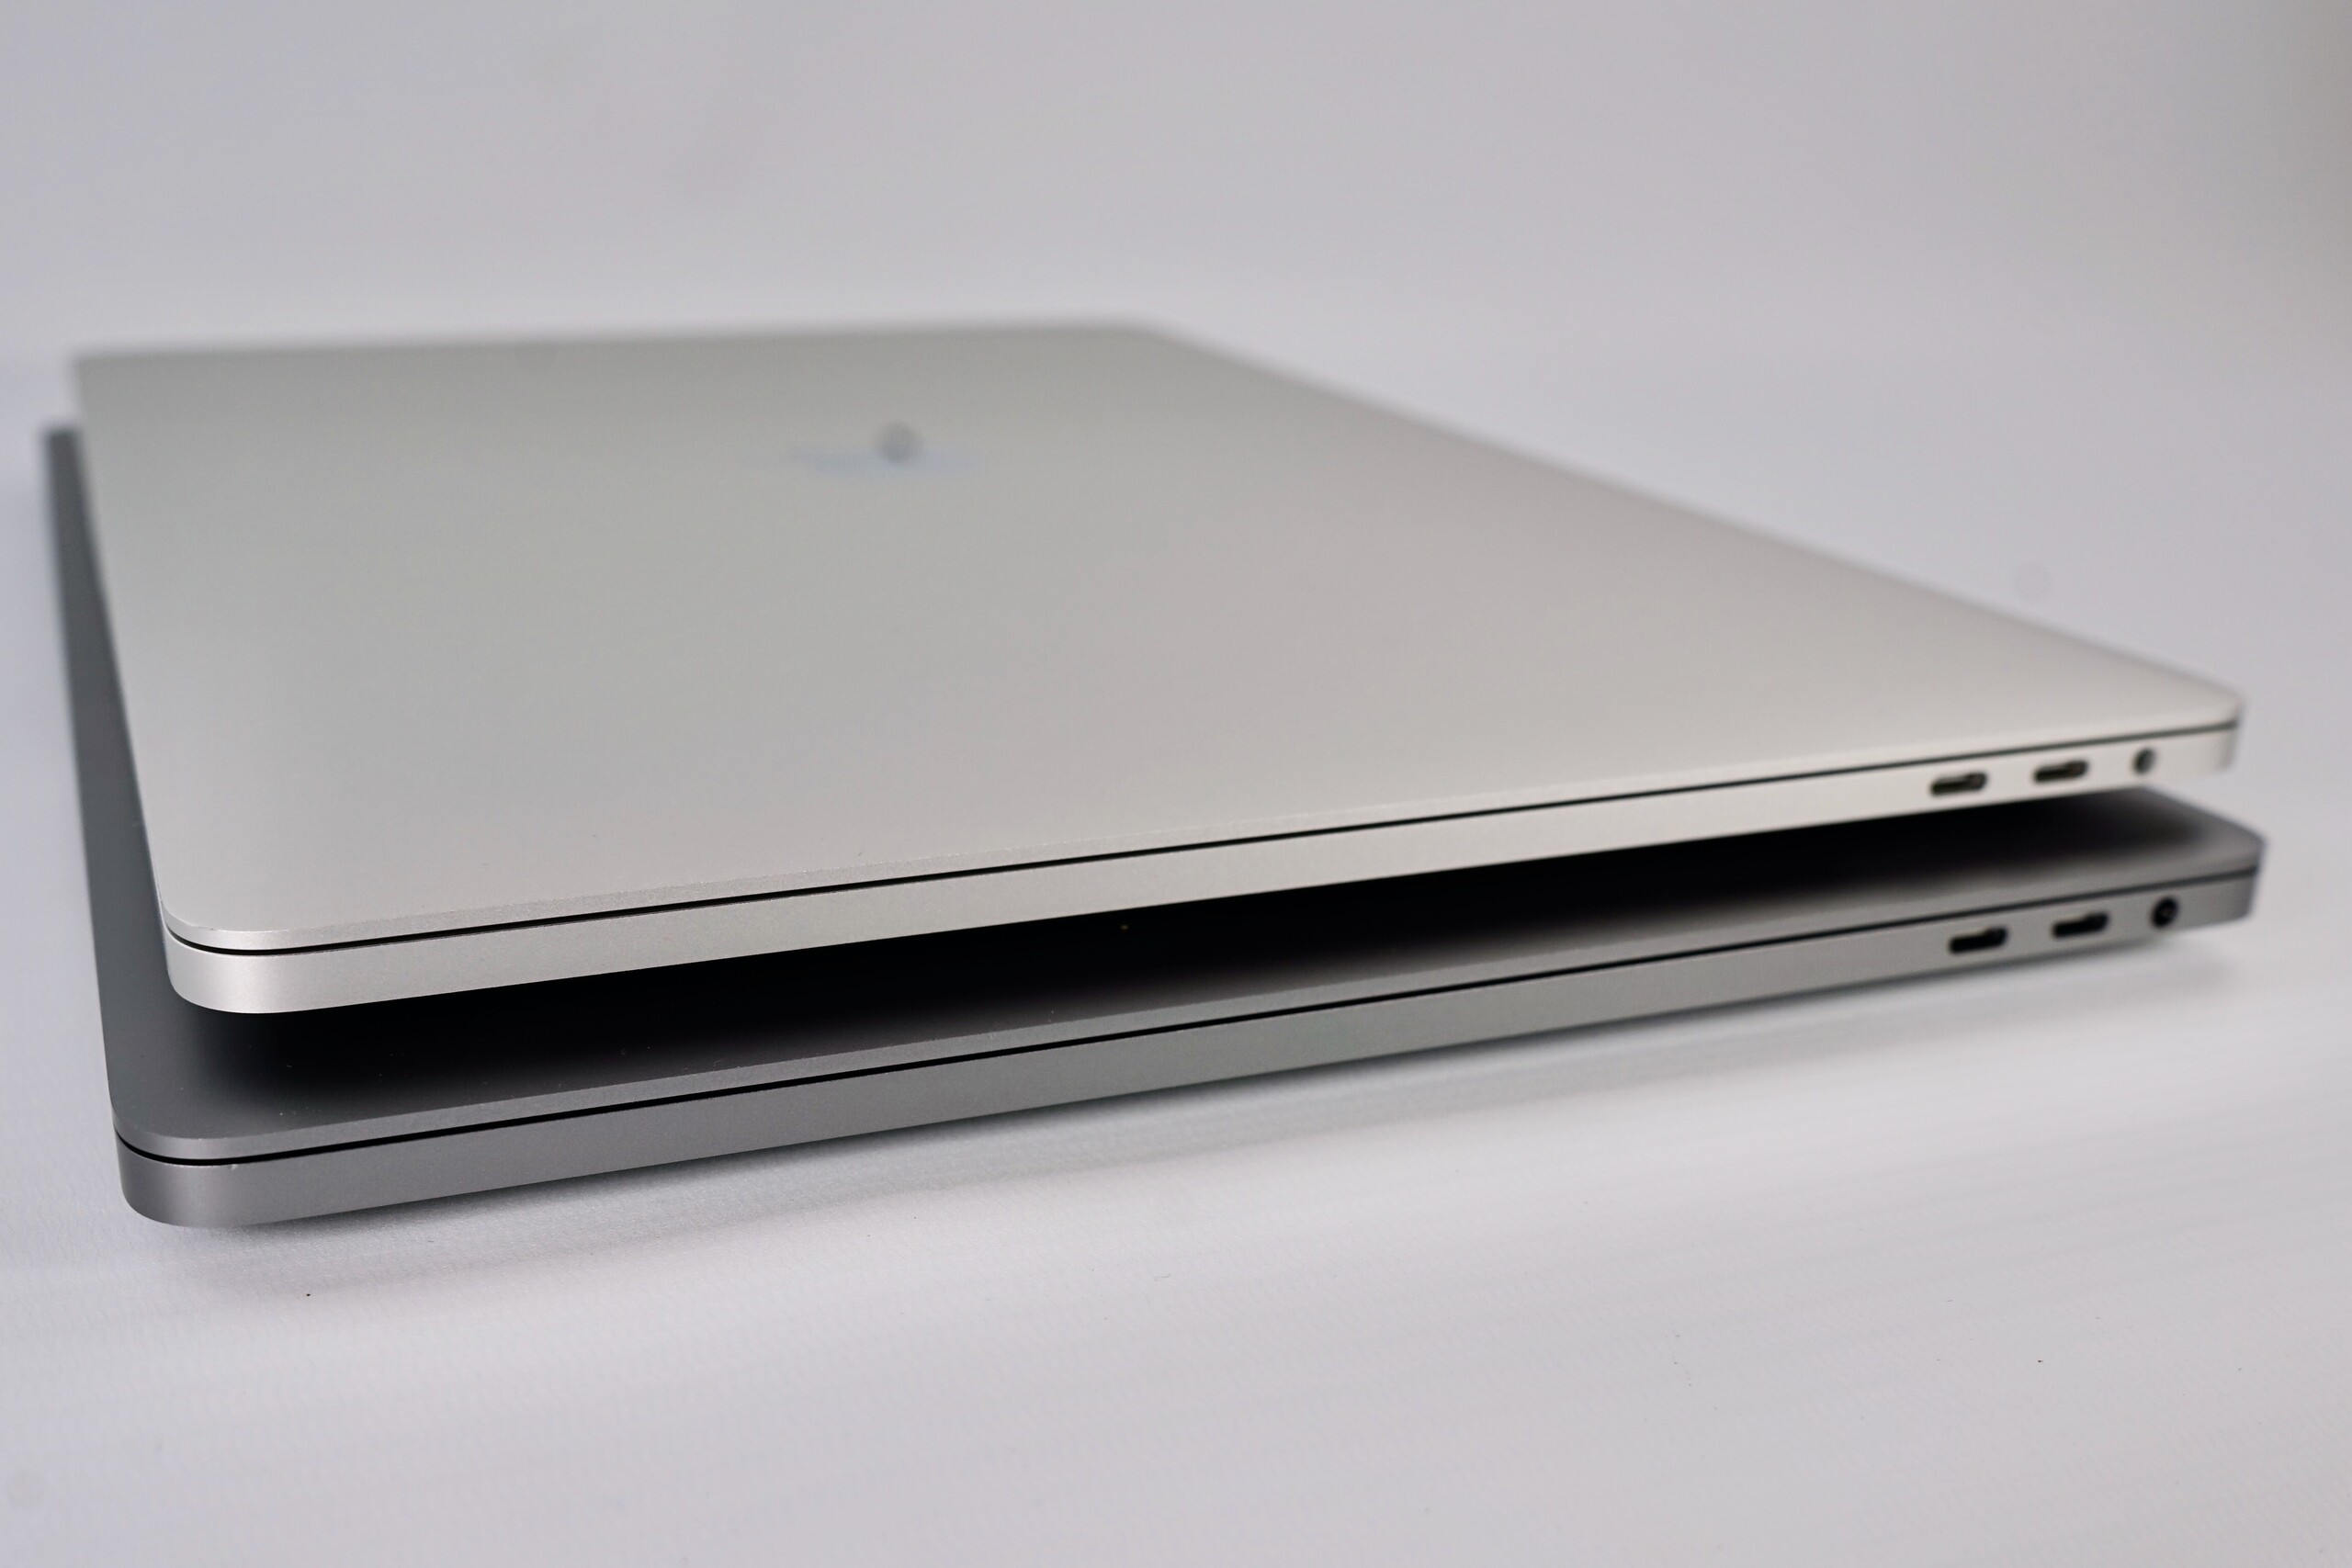
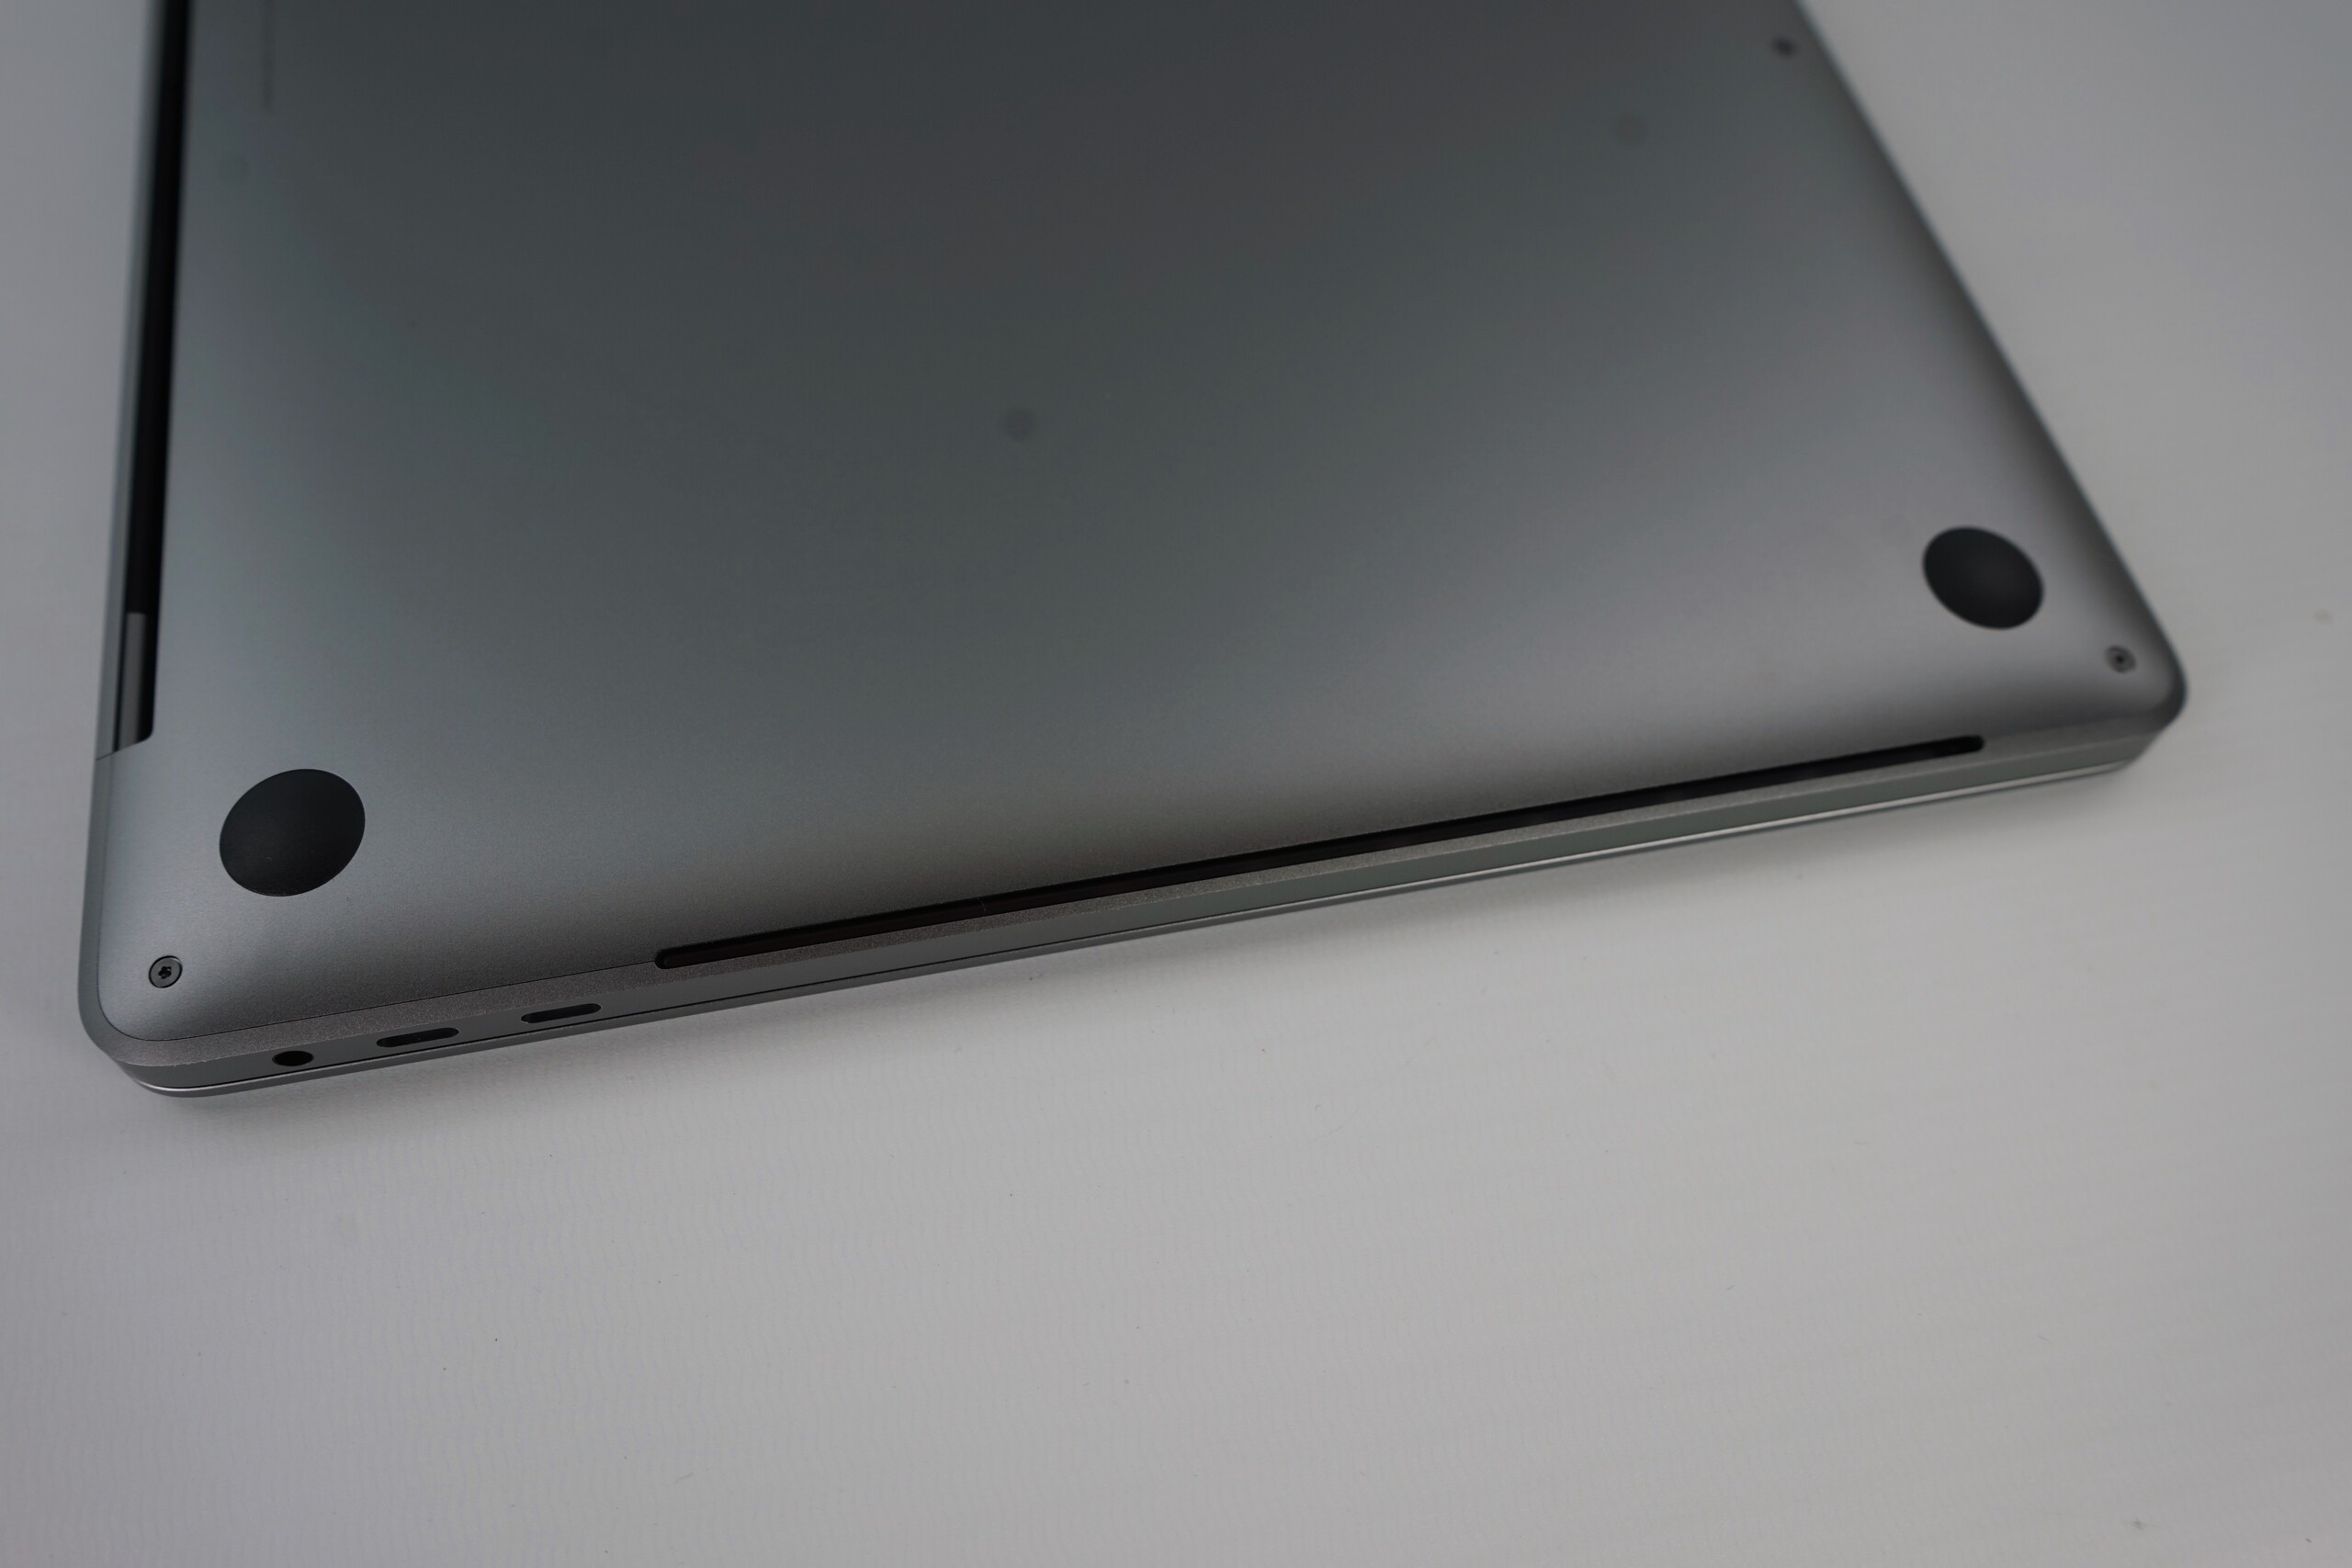
Tyvärr envisas Apple med att bara inkludera fyra Thunderbolt 3-portar och en hörlursanslutning på sin nya MacBook Pro. Ethernet, HDMI, kortläsare och USB Typ A-portar förekommer inte längre i Apples ekosystem, så man får köpa minst en adapter. På samma sätt är möjligheterna till reparationer och uppgraderingar precis lika dåliga som innan och Apple har lött fast CPU, GPU, RAM, SSD och WiFi-chip direkt på moderkortet. Det innebär inte bara att du får leva med ett utdaterad 802.11ac WiFi-chip från Broadcom utan också att du får byta hela moderkortet om någon av dessa komponenter skulle gå sönder.
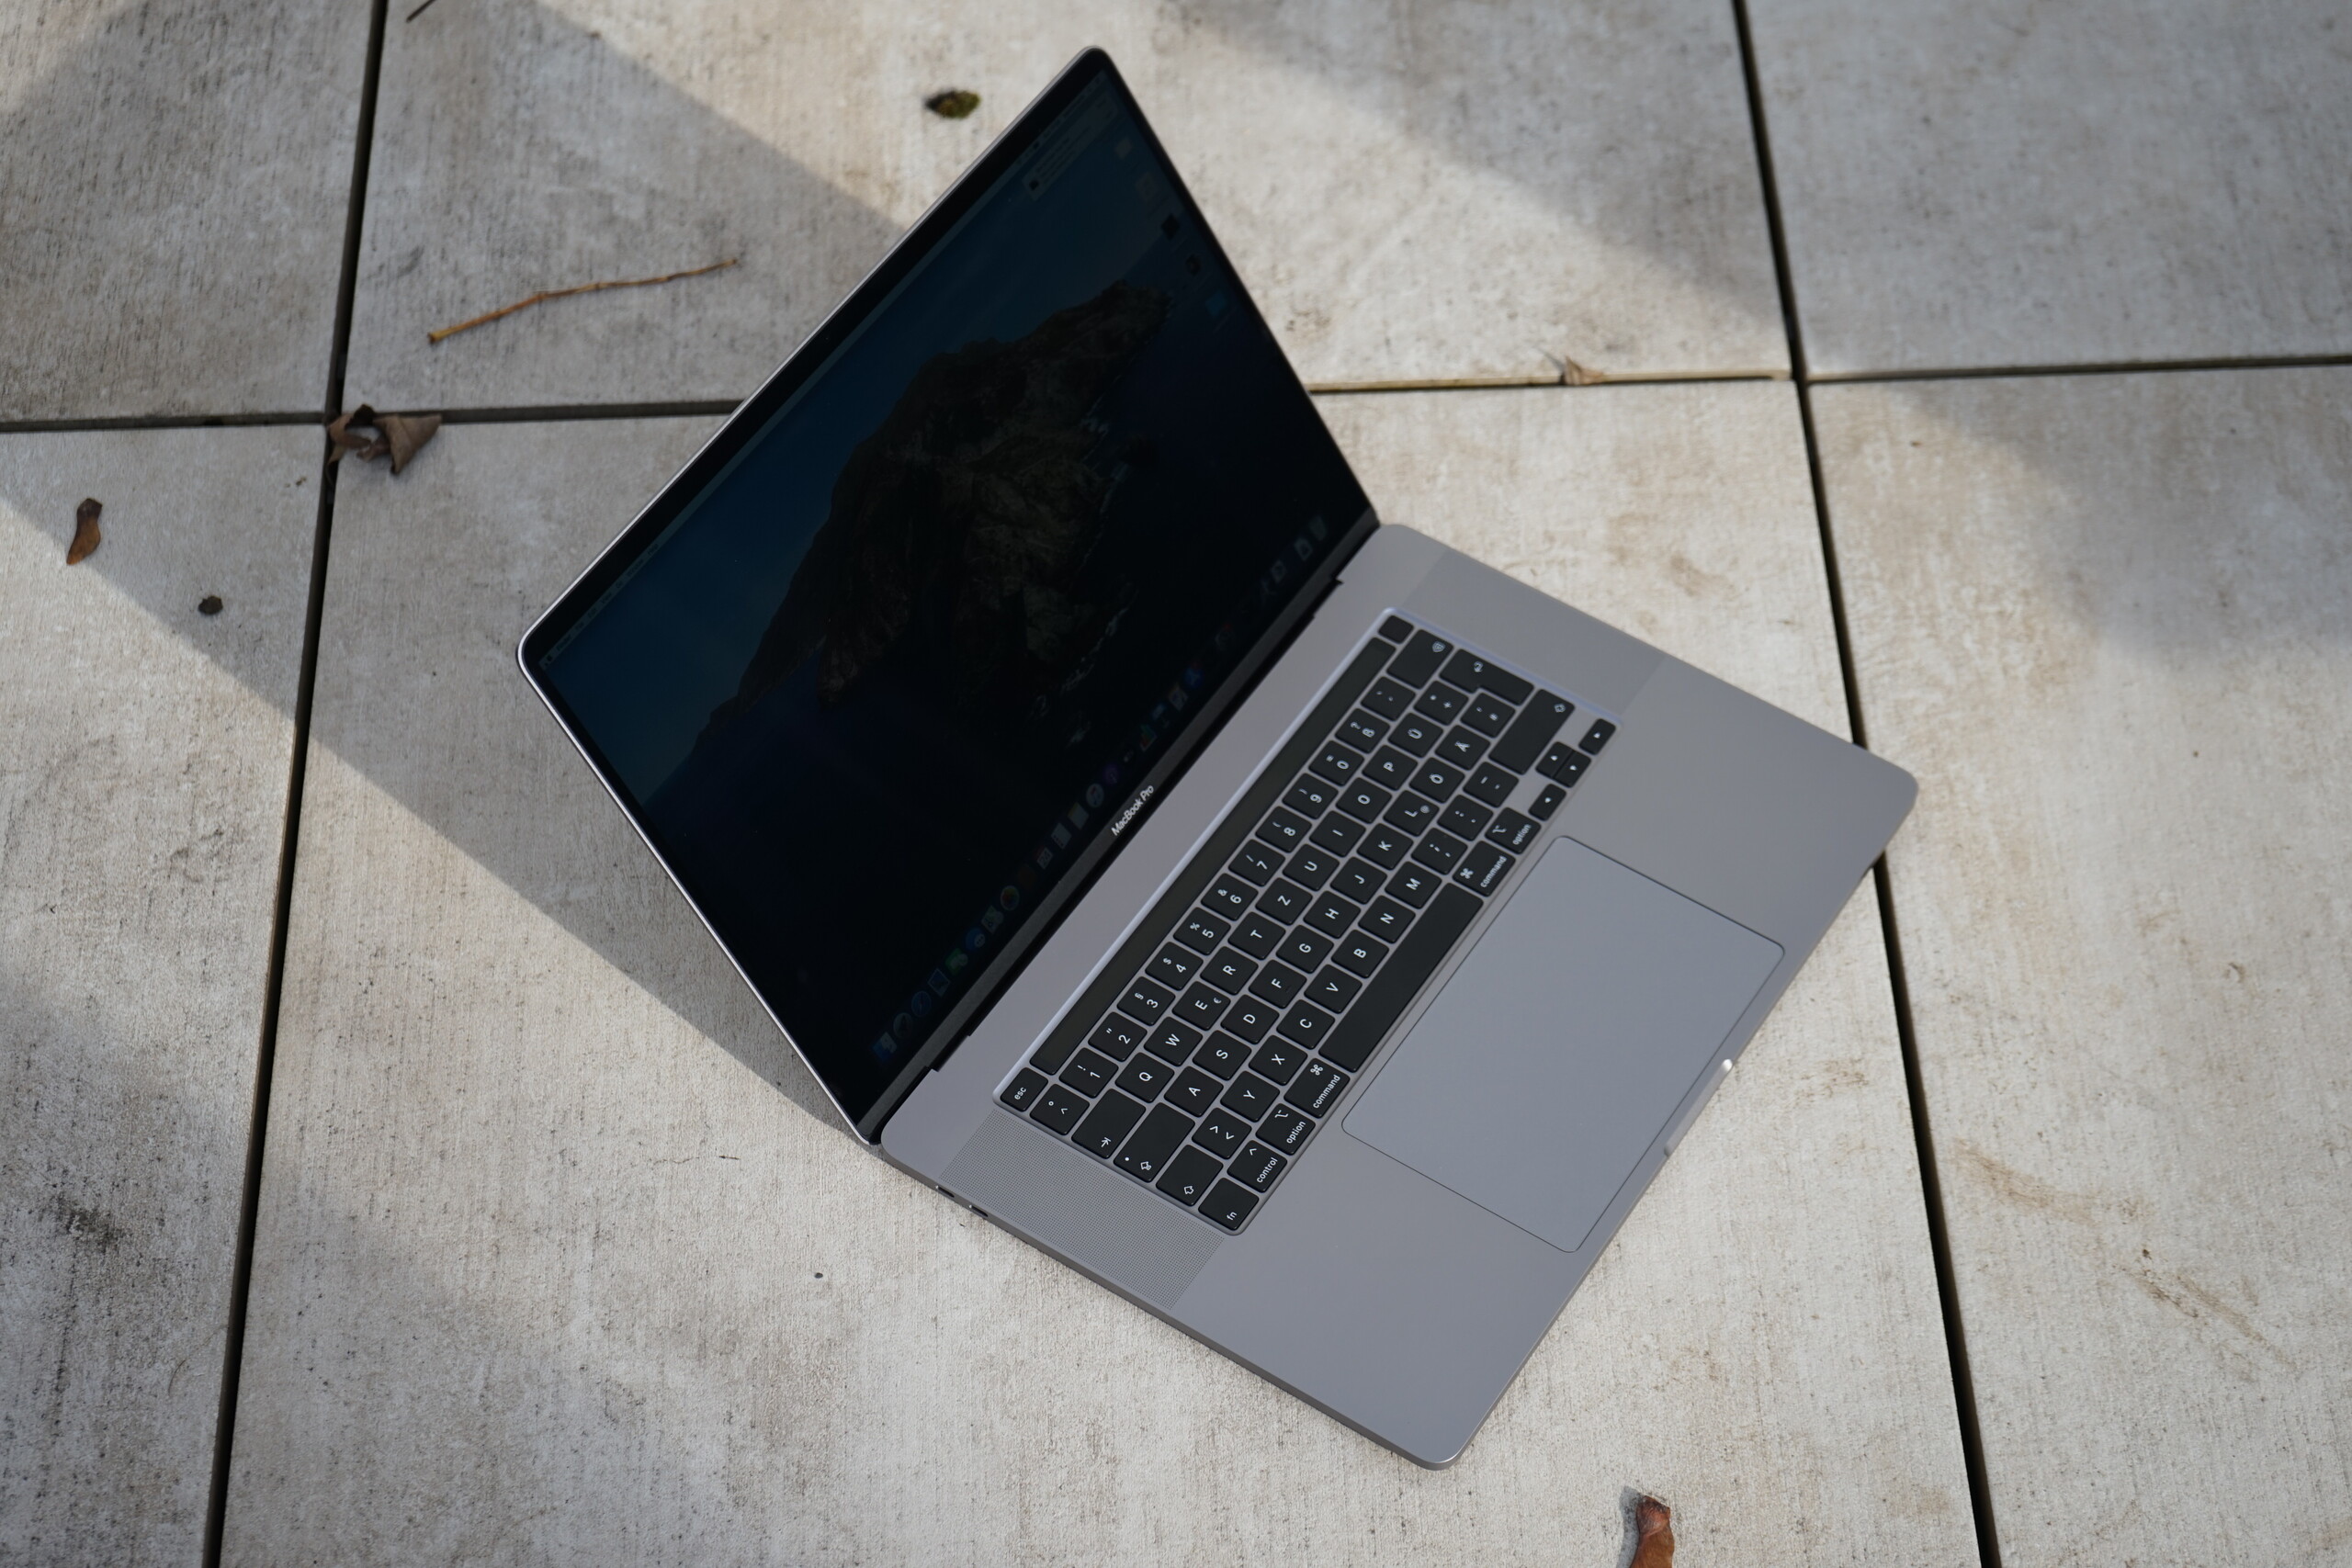
MacBook Pro 16 är en utmärkt och lyxig multimedialaptop med dåliga möjligheter till reparation.
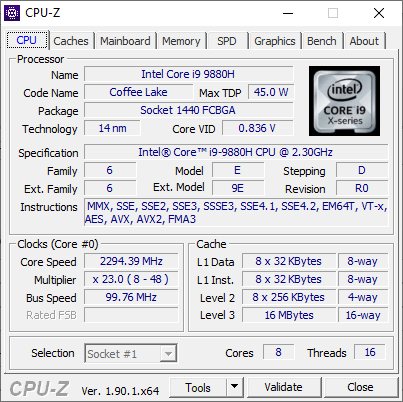
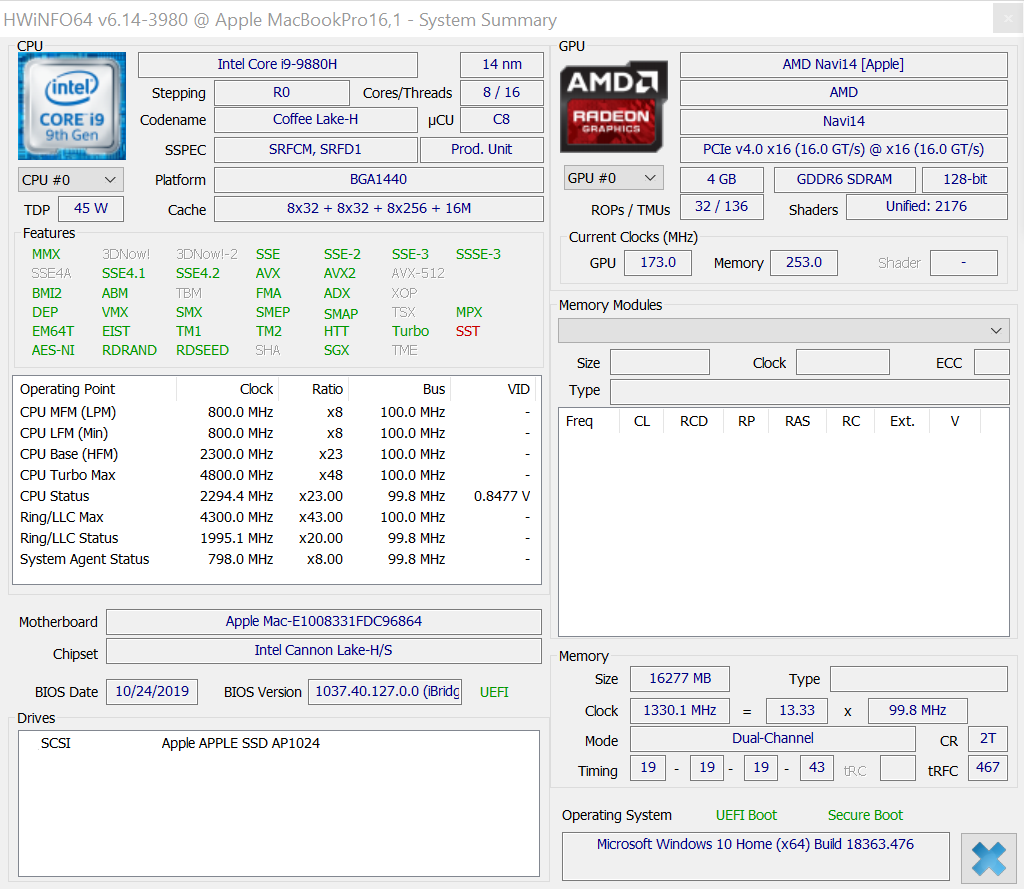
Den nya 16-tumsskärmen bjuder inte heller på några överraskningar. Den har varken stöd för 120 Hz bilduppdatering eller Adaptive Sync, men den har lika bra bildkvalitet som de MacBook Pro-modeller vi recenserat tidigare. Det större chassit har dessutom gjort att Apple kunnat utrusta MacBook Pro 16 med betydligt bättre högtalare än på sin 15-tumsföregångare. Effektivare kylning har behövts länge och gör att vår recensionsenhet får ut betydligt högre prestanda ur sin Core i9-9880H processor jämfört med sin föregångare. Även om den nya Navi GPU:n inte riktigt kommer få Windows-världen att haja till så är den en bra uppgradering från Vega-chippen som Apple använde i sin senaste MacBook Pro 15.
MacBook Pro 16 sätter inga rekord för batteritid vid jämförelse med andra multimedialaptops trots att den har ett batteri på 100 Wh. Detta då en Core i9-processor, en stor skärm och en dedikerad GPU är energikrävande komponenter. Men du bör klara dig nästan två timmar längre mellan laddningarna när du surfar på nätet jämfört med MacBook Pro 15, vilket är en påtaglig förbättring. MacBook Pro 16 bör åtminstone stå sig en hel arbetsdag mellan laddningarna, vilket ingen av våra jämförelseenheter klarade av.
Totalt sett är MacBook Pro 16 en utmärkt multimedialaptop. Den lider av en del brister, där den största är det oerhörda priset. 27.990 kronor ger dig dessutom bara ett års garanti och du vill nog överväga att köpa minst en USB Typ C-adapter.
Apple MacBook Pro 16 2019 i9 5500M
- 12/02/2019 v7 (old)
Klaus Hinum, Andreas Osthoff
Price comparison
