Test: Asus Vivobook 15 F512DA - AMD Ryzen 3 för 4.000 kronor (Sammanfattning)
Gradering | Datum | Modell | Vikt | Höjd | Storlek | Upplösning | Pris |
|---|---|---|---|---|---|---|---|
| 73.1 % v7 (old) | 04/2020 | Asus Vivobook 15 F512DA-SH31 R3 3200U, Vega 3 | 1.8 kg | 19.9 mm | 15.60" | 1920x1080 | |
| 79.4 % v7 (old) | 03/2020 | Lenovo Ideapad S340-15IIL i7-1065G7, Iris Plus Graphics G7 (Ice Lake 64 EU) | 1.8 kg | 17.9 mm | 15.60" | 1920x1080 | |
| 78.4 % v7 (old) | 11/2019 | Acer Aspire 5 A515-43-R6WW R5 3500U, Vega 8 | 1.8 kg | 18 mm | 15.60" | 1920x1080 | |
| 77.6 % v6 (old) | 05/2022 | Dell Inspiron 15 3585 (2300U, Vega 6) R3 2300U, Vega 6 | 1.9 kg | 20 mm | 15.60" | 1920x1080 | |
| 85.2 % v7 (old) | 03/2020 | Huawei MateBook D 15-53010TUY R5 3500U, Vega 8 | 1.5 kg | 16.9 mm | 15.60" | 1920x1080 |

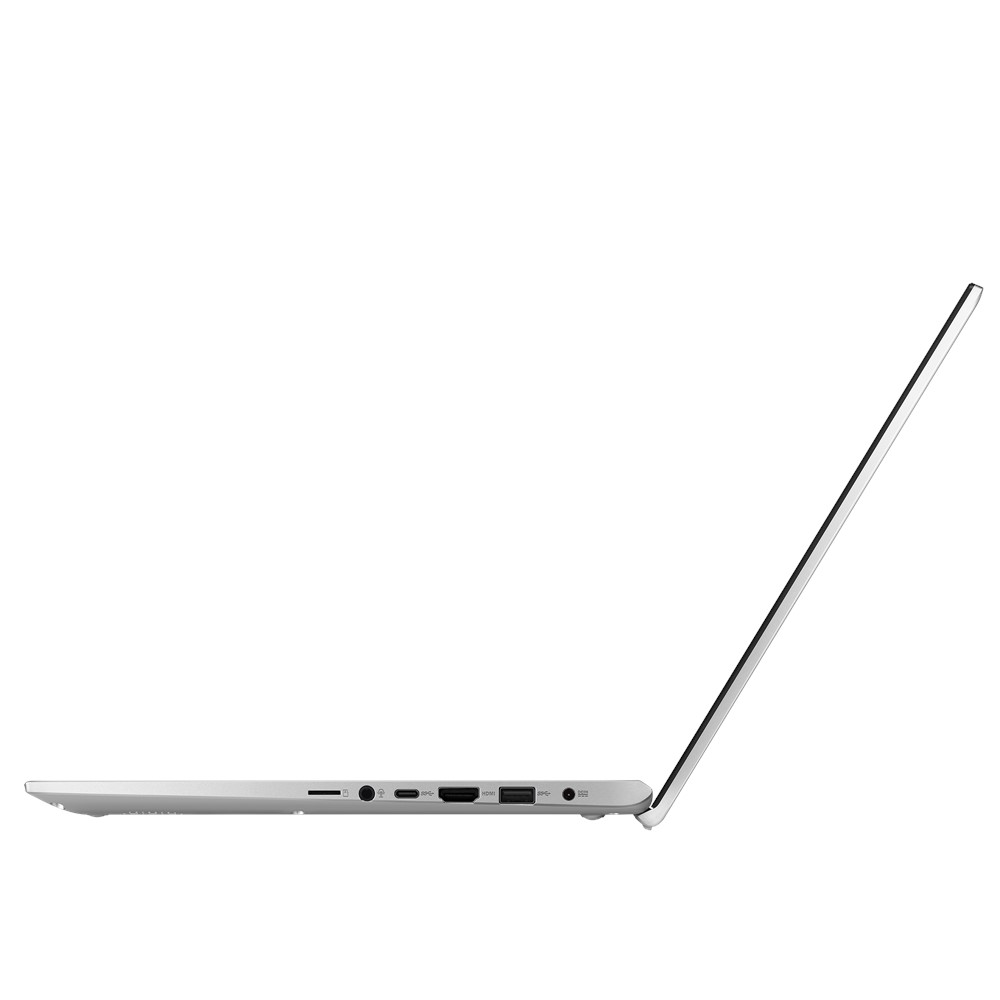
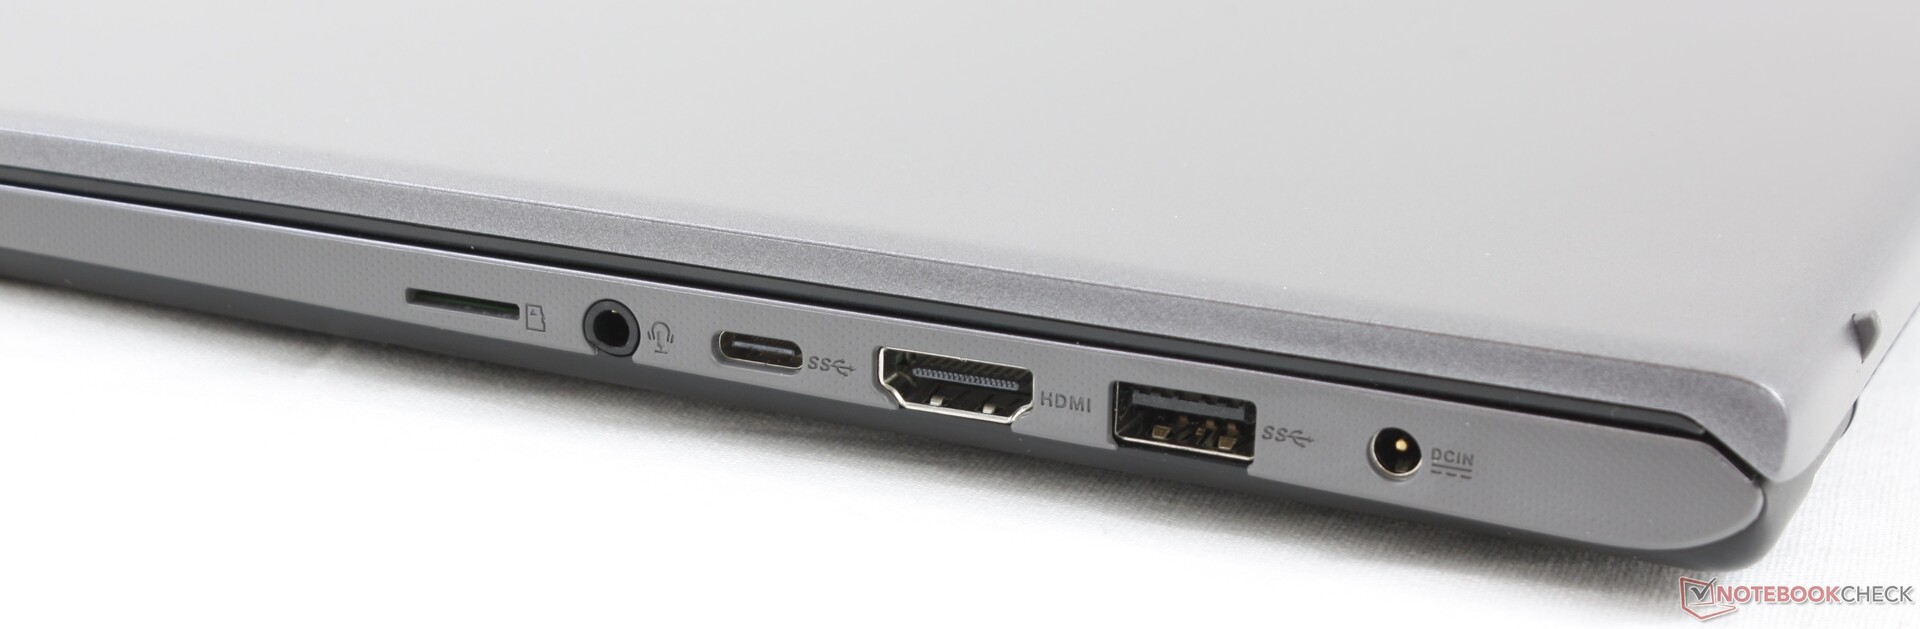
| SD Card Reader | |
| average JPG Copy Test (av. of 3 runs) | |
| Dell XPS 15 9570 Core i9 UHD (Toshiba Exceria Pro SDXC 64 GB UHS-II) | |
| Lenovo Ideapad S340-15IIL (Toshiba Exceria Pro SDXC 64 GB UHS-II) | |
| Dell Inspiron 15 3585 (2300U, Vega 6) (Toshiba Exceria Pro SDXC 64 GB UHS-II) | |
| Asus Vivobook 15 F512DA-SH31 (Toshiba Exceria Pro M501 64 GB UHS-II) | |
| maximum AS SSD Seq Read Test (1GB) | |
| Dell XPS 15 9570 Core i9 UHD (Toshiba Exceria Pro SDXC 64 GB UHS-II) | |
| Lenovo Ideapad S340-15IIL (Toshiba Exceria Pro SDXC 64 GB UHS-II) | |
| Asus Vivobook 15 F512DA-SH31 (Toshiba Exceria Pro M501 64 GB UHS-II) | |
| Dell Inspiron 15 3585 (2300U, Vega 6) (Toshiba Exceria Pro SDXC 64 GB UHS-II) | |
| Networking | |
| iperf3 transmit AX12 | |
| Microsoft Surface Laptop 3 13 Core i5-1035G7 | |
| Lenovo ThinkPad X1 Yoga 20SA000GUS | |
| Acer Aspire 5 A515-54G | |
| Asus Vivobook 15 F512DA-SH31 | |
| iperf3 receive AX12 | |
| Microsoft Surface Laptop 3 13 Core i5-1035G7 | |
| Lenovo ThinkPad X1 Yoga 20SA000GUS | |
| Acer Aspire 5 A515-54G | |
| Asus Vivobook 15 F512DA-SH31 | |


| |||||||||||||||||||||||||
Distribution av ljusstyrkan: 89 %
Mitt på batteriet: 216.3 cd/m²
Kontrast: 294:1 (Svärta: 0.86 cd/m²)
ΔE ColorChecker Calman: 4.83 | ∀{0.5-29.43 Ø4.73}
calibrated: 3.78
ΔE Greyscale Calman: 4.6 | ∀{0.09-98 Ø4.97}
58.1% sRGB (Argyll 1.6.3 3D)
36.9% AdobeRGB 1998 (Argyll 1.6.3 3D)
40% AdobeRGB 1998 (Argyll 3D)
58.2% sRGB (Argyll 3D)
38.71% Display P3 (Argyll 3D)
Gamma: 2.34
CCT: 6841 K
| Asus Vivobook 15 F512DA-SH31 AU Optronics B156HAN02.1, IPS, 15.6", 1920x1080 | Lenovo Ideapad S340-15IIL BOE CQ NV156FHM-T03, IPS, 15.6", 1920x1080 | Acer Aspire 5 A515-43-R6WW CEC PANDA LM156LF-CL07, IPS, 15.6", 1920x1080 | Dell Inspiron 15 3585 (2300U, Vega 6) BOE0802, TN, 15.6", 1920x1080 | Asus ZenBook 15 UX534FTC-A8190T BOE CQ NV156FHM-N63, IPS, 15.6", 1920x1080 | Huawei MateBook D 15-53010TUY AU Optronics AUO28ED, IPS, 15.6", 1920x1080 | |
|---|---|---|---|---|---|---|
| Display | 3% | 2% | 1% | 58% | 5% | |
| Display P3 Coverage (%) | 38.71 | 40.43 4% | 39.53 2% | 39.22 1% | 65 68% | 40.49 5% |
| sRGB Coverage (%) | 58.2 | 58.8 1% | 59.5 2% | 58.9 1% | 86.2 48% | 60.9 5% |
| AdobeRGB 1998 Coverage (%) | 40 | 41.77 4% | 40.84 2% | 40.52 1% | 62.9 57% | 41.84 5% |
| Response Times | -24% | 8% | 26% | -17% | -13% | |
| Response Time Grey 50% / Grey 80% * (ms) | 36 ? | 46.4 ? -29% | 36 ? -0% | 39 ? -8% | 45 ? -25% | 43.6 ? -21% |
| Response Time Black / White * (ms) | 29.6 ? | 35.2 ? -19% | 25 ? 16% | 12 ? 59% | 32 ? -8% | 31.2 ? -5% |
| PWM Frequency (Hz) | 178 ? | 250 ? | ||||
| Screen | 23% | 35% | -22% | 67% | 58% | |
| Brightness middle (cd/m²) | 252.8 | 320.8 27% | 250 -1% | 225 -11% | 299 18% | 271 7% |
| Brightness (cd/m²) | 237 | 309 30% | 228 -4% | 213 -10% | 280 18% | 256 8% |
| Brightness Distribution (%) | 89 | 87 -2% | 83 -7% | 88 -1% | 89 0% | 90 1% |
| Black Level * (cd/m²) | 0.86 | 0.27 69% | 0.205 76% | 0.535 38% | 0.21 76% | 0.15 83% |
| Contrast (:1) | 294 | 1188 304% | 1220 315% | 421 43% | 1424 384% | 1807 515% |
| Colorchecker dE 2000 * | 4.83 | 7.68 -59% | 5.65 -17% | 10.37 -115% | 4.76 1% | 4.7 3% |
| Colorchecker dE 2000 max. * | 16.38 | 21.97 -34% | 13.7 16% | 19.75 -21% | 9 45% | 20.4 -25% |
| Colorchecker dE 2000 calibrated * | 3.78 | 4.65 -23% | 3.89 -3% | 4.6 -22% | ||
| Greyscale dE 2000 * | 4.6 | 7.3 -59% | 6.32 -37% | 12.09 -163% | 3.53 23% | 1.6 65% |
| Gamma | 2.34 94% | 2.12 104% | 2.45 90% | 2.72 81% | 2.3 96% | 2.17 101% |
| CCT | 6841 95% | 6213 105% | 7287 89% | 13335 49% | 7228 90% | 6649 98% |
| Color Space (Percent of AdobeRGB 1998) (%) | 36.9 | 37.8 2% | 38 3% | 37 0% | 56 52% | 38.5 4% |
| Color Space (Percent of sRGB) (%) | 58.1 | 58.3 0% | 59 2% | 59 2% | 86 48% | 60.6 4% |
| Totalt genomsnitt (program/inställningar) | 1% /
14% | 15% /
25% | 2% /
-12% | 36% /
54% | 17% /
40% |
* ... mindre är bättre
Visa svarstider
| ↔ Svarstid svart till vitt | ||
|---|---|---|
| 29.6 ms ... stiga ↗ och falla ↘ kombinerat | ↗ 18 ms stiga | 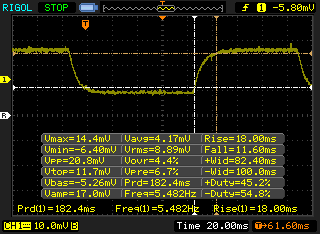 |
| ↘ 11.6 ms hösten | ||
| Skärmen visar relativt långsamma svarsfrekvenser i våra tester och kan vara för långsam för spelare. I jämförelse sträcker sig alla testade enheter från 0.1 (minst) till 240 (maximalt) ms. » 79 % av alla enheter är bättre. Detta innebär att den uppmätta svarstiden är sämre än genomsnittet av alla testade enheter (19.9 ms). | ||
| ↔ Svarstid 50 % grått till 80 % grått | ||
| 36 ms ... stiga ↗ och falla ↘ kombinerat | ↗ 20 ms stiga | 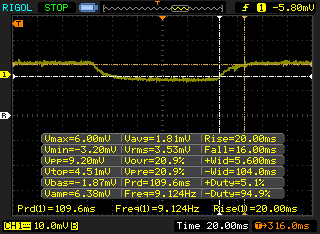 |
| ↘ 16 ms hösten | ||
| Skärmen visar långsamma svarsfrekvenser i våra tester och kommer att vara otillfredsställande för spelare. I jämförelse sträcker sig alla testade enheter från 0.165 (minst) till 636 (maximalt) ms. » 50 % av alla enheter är bättre. Detta innebär att den uppmätta svarstiden är sämre än genomsnittet av alla testade enheter (31.1 ms). | ||
Skärmflimmer / PWM (Puls-Width Modulation)
| Skärmflimmer / PWM upptäcktes inte | 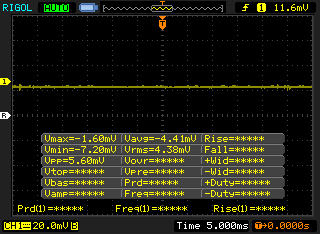 | ||
Som jämförelse: 52 % av alla testade enheter använder inte PWM för att dämpa skärmen. Om PWM upptäcktes mättes ett medelvärde av 7798 (minst: 5 - maximum: 343500) Hz. | |||
| Cinebench R20 | |
| CPU (Single Core) | |
| MSI Prestige 15 A10SC | |
| Acer Aspire 5 A515-54G | |
| HP Pavilion x360 15-dq0065cl | |
| Dell XPS 13 7390 2-in-1 Core i3 | |
| Huawei MateBook D 15-53010TUY | |
| Asus VivoBook Flip 14 TP412UA-EC969T | |
| Dell Inspiron 15 5000 5585 | |
| Asus Vivobook 15 F512DA-SH31 | |
| Genomsnitt AMD Ryzen 3 3200U (274 - 318, n=5) | |
| Dell Latitude 3400 | |
| HP ProBook x360 11 G4 | |
| Intel NUC5i3RYK | |
| Chuwi UBook CWI509 | |
| Chuwi LapBook Plus | |
| CPU (Multi Core) | |
| MSI Prestige 15 A10SC | |
| Huawei MateBook D 15-53010TUY | |
| Dell Inspiron 15 5000 5585 | |
| Acer Aspire 5 A515-54G | |
| HP Pavilion x360 15-dq0065cl | |
| Dell XPS 13 7390 2-in-1 Core i3 | |
| Asus VivoBook Flip 14 TP412UA-EC969T | |
| Asus Vivobook 15 F512DA-SH31 | |
| Dell Latitude 3400 | |
| Genomsnitt AMD Ryzen 3 3200U (453 - 727, n=5) | |
| Intel NUC5i3RYK | |
| HP ProBook x360 11 G4 | |
| Chuwi UBook CWI509 | |
| Chuwi LapBook Plus | |
| Cinebench R15 | |
| CPU Single 64Bit | |
| MSI Prestige 15 A10SC | |
| HP Pavilion x360 15-dq0065cl | |
| Acer Aspire 5 A515-54G | |
| Dell XPS 13 7390 2-in-1 Core i3 | |
| Dell Latitude 3400 | |
| Huawei MateBook D 15-53010TUY | |
| Asus VivoBook Flip 14 TP412UA-EC969T | |
| Dell Inspiron 15 5000 5585 | |
| Genomsnitt AMD Ryzen 3 3200U (126 - 130, n=3) | |
| Asus Vivobook 15 F512DA-SH31 | |
| HP ProBook x360 11 G4 | |
| Intel NUC5i3RYK | |
| Chuwi UBook CWI509 | |
| Chuwi LapBook Plus | |
| CPU Multi 64Bit | |
| MSI Prestige 15 A10SC | |
| Huawei MateBook D 15-53010TUY | |
| Dell Inspiron 15 5000 5585 | |
| Acer Aspire 5 A515-54G | |
| HP Pavilion x360 15-dq0065cl | |
| Dell XPS 13 7390 2-in-1 Core i3 | |
| Dell Latitude 3400 | |
| Asus VivoBook Flip 14 TP412UA-EC969T | |
| Genomsnitt AMD Ryzen 3 3200U (318 - 353, n=3) | |
| Asus Vivobook 15 F512DA-SH31 | |
| Intel NUC5i3RYK | |
| Intel NUC5i3RYK | |
| HP ProBook x360 11 G4 | |
| Chuwi UBook CWI509 | |
| Chuwi LapBook Plus | |
| Cinebench R11.5 | |
| CPU Single 64Bit | |
| Dell XPS 13 7390 2-in-1 Core i3 | |
| Dell Inspiron 15 5000 5585 | |
| Chuwi LapBook Plus | |
| CPU Multi 64Bit | |
| Dell Inspiron 15 5000 5585 | |
| Dell XPS 13 7390 2-in-1 Core i3 | |
| Chuwi LapBook Plus | |
| Cinebench R10 | |
| Rendering Multiple CPUs 32Bit | |
| Dell XPS 13 7390 2-in-1 Core i3 | |
| Asus VivoBook Flip 14 TP412UA-EC969T | |
| Dell Latitude 3400 | |
| Genomsnitt AMD Ryzen 3 3200U (n=1) | |
| HP ProBook x360 11 G4 | |
| Chuwi LapBook Plus | |
| Rendering Single 32Bit | |
| Dell XPS 13 7390 2-in-1 Core i3 | |
| Dell Latitude 3400 | |
| Asus VivoBook Flip 14 TP412UA-EC969T | |
| Genomsnitt AMD Ryzen 3 3200U (n=1) | |
| HP ProBook x360 11 G4 | |
| Chuwi LapBook Plus | |
| wPrime 2.10 - 1024m | |
| Chuwi LapBook Plus | |
| HP ProBook x360 11 G4 | |
| Intel NUC5i3RYK | |
| Genomsnitt AMD Ryzen 3 3200U (n=1) | |
| Dell XPS 13 7390 2-in-1 Core i3 | |
* ... mindre är bättre
| PCMark 10 | |
| Score | |
| Dell Inspiron 15 5000 5585 | |
| Huawei MateBook D 15-53010TUY | |
| Asus VivoBook Flip 14 TP412UA-EC969T | |
| Genomsnitt AMD Ryzen 3 3200U, AMD Radeon RX Vega 3 (3028 - 3326, n=3) | |
| Asus Vivobook 15 F512DA-SH31 | |
| Chuwi LapBook Plus | |
| Essentials | |
| Dell Inspiron 15 5000 5585 | |
| Huawei MateBook D 15-53010TUY | |
| Asus VivoBook Flip 14 TP412UA-EC969T | |
| Genomsnitt AMD Ryzen 3 3200U, AMD Radeon RX Vega 3 (6441 - 7487, n=3) | |
| Asus Vivobook 15 F512DA-SH31 | |
| Chuwi LapBook Plus | |
| Productivity | |
| Dell Inspiron 15 5000 5585 | |
| Asus VivoBook Flip 14 TP412UA-EC969T | |
| Huawei MateBook D 15-53010TUY | |
| Genomsnitt AMD Ryzen 3 3200U, AMD Radeon RX Vega 3 (5448 - 5698, n=3) | |
| Asus Vivobook 15 F512DA-SH31 | |
| Chuwi LapBook Plus | |
| Digital Content Creation | |
| Dell Inspiron 15 5000 5585 | |
| Huawei MateBook D 15-53010TUY | |
| Asus VivoBook Flip 14 TP412UA-EC969T | |
| Genomsnitt AMD Ryzen 3 3200U, AMD Radeon RX Vega 3 (2148 - 2343, n=3) | |
| Asus Vivobook 15 F512DA-SH31 | |
| Chuwi LapBook Plus | |
| PCMark 8 | |
| Home Score Accelerated v2 | |
| Huawei MateBook D 15-53010TUY | |
| Dell Inspiron 15 5000 5585 | |
| Asus VivoBook Flip 14 TP412UA-EC969T | |
| Genomsnitt AMD Ryzen 3 3200U, AMD Radeon RX Vega 3 (2742 - 3065, n=3) | |
| Asus Vivobook 15 F512DA-SH31 | |
| Chuwi LapBook Plus | |
| Work Score Accelerated v2 | |
| Huawei MateBook D 15-53010TUY | |
| Asus VivoBook Flip 14 TP412UA-EC969T | |
| Dell Inspiron 15 5000 5585 | |
| Genomsnitt AMD Ryzen 3 3200U, AMD Radeon RX Vega 3 (4239 - 4400, n=3) | |
| Asus Vivobook 15 F512DA-SH31 | |
| PCMark 8 Home Score Accelerated v2 | 2742 poäng | |
| PCMark 8 Work Score Accelerated v2 | 4239 poäng | |
| PCMark 10 Score | 3028 poäng | |
Hjälp | ||
| DPC Latencies / LatencyMon - interrupt to process latency (max), Web, Youtube, Prime95 | |
| Asus Vivobook 15 F512DA-SH31 | |
* ... mindre är bättre
| Asus Vivobook 15 F512DA-SH31 SanDisk X600 SD9SN8W-128G | Lenovo Ideapad S340-15IIL Intel SSD 660p SSDPEKNW512G8 | Acer Aspire 5 A515-43-R6WW Intel SSD 660p 1TB SSDPEKNW010T8 | Dell Inspiron 15 3585 (2300U, Vega 6) Toshiba BG3 KBG30ZMS256G | Asus ZenBook 15 UX534FTC-A8190T Samsung SSD PM981 MZVLB1T0HALR | Huawei MateBook D 15-53010TUY Samsung SSD PM981 MZVLB256HAHQ | |
|---|---|---|---|---|---|---|
| AS SSD | 444% | 357% | 153% | 773% | 530% | |
| Seq Read (MB/s) | 341.4 | 1447 324% | 1358 298% | 1291 278% | 2643 674% | 2613 665% |
| Seq Write (MB/s) | 134.2 | 926 590% | 1300 869% | 688 413% | 1533 1042% | 1549 1054% |
| 4K Read (MB/s) | 27.83 | 40.06 44% | 44.88 61% | 21.87 -21% | 49.12 77% | 47.15 69% |
| 4K Write (MB/s) | 54.9 | 97.9 78% | 77.5 41% | 35.62 -35% | 134.7 145% | 111.6 103% |
| 4K-64 Read (MB/s) | 217.1 | 323.7 49% | 586 170% | 632 191% | 1028 374% | 748 245% |
| 4K-64 Write (MB/s) | 68.1 | 791 1062% | 738 984% | 221.2 225% | 1353 1887% | 1275 1772% |
| Access Time Read * (ms) | 0.153 | 0.06 61% | 0.33 -116% | 0.033 78% | 0.062 59% | |
| Access Time Write * (ms) | 1.075 | 0.144 87% | 0.057 95% | 0.234 78% | 0.028 97% | 0.042 96% |
| Score Read (Points) | 279 | 508 82% | 767 175% | 783 181% | 1342 381% | 1057 279% |
| Score Write (Points) | 136 | 982 622% | 945 595% | 326 140% | 1641 1107% | 1542 1034% |
| Score Total (Points) | 559 | 1738 211% | 2115 278% | 1489 166% | 3622 548% | 3097 454% |
| Copy ISO MB/s (MB/s) | 115.9 | 943 714% | 432.6 273% | 2226 1821% | ||
| Copy Program MB/s (MB/s) | 44.51 | 612 1275% | 95.6 115% | 506 1037% | ||
| Copy Game MB/s (MB/s) | 74.3 | 826 1012% | 263.4 255% | 1230 1555% | ||
| CrystalDiskMark 5.2 / 6 | 198% | 204% | 96% | 395% | 314% | |
| Write 4K (MB/s) | 65.2 | 130.8 101% | 114.9 76% | 87.3 34% | 138.1 112% | 134.8 107% |
| Read 4K (MB/s) | 31.22 | 54.8 76% | 52.7 69% | 23.54 -25% | 45.89 47% | 41.68 34% |
| Write Seq (MB/s) | 284.8 | 978 243% | 1361 378% | 824 189% | 2147 654% | 1651 480% |
| Read Seq (MB/s) | 497.5 | 1627 227% | 1385 178% | 715 44% | 2188 340% | 2300 362% |
| Write 4K Q32T1 (MB/s) | 164 | 450.1 174% | 181.1 10% | 147.8 -10% | 427.8 161% | 260 59% |
| Read 4K Q32T1 (MB/s) | 230.2 | 345.9 50% | 340.5 48% | 256.1 11% | 404 75% | 335.1 46% |
| Write Seq Q32T1 (MB/s) | 221.7 | 982 343% | 1519 585% | 733 231% | 2396 981% | 1641 640% |
| Read Seq Q32T1 (MB/s) | 389.7 | 1842 373% | 1515 289% | 1525 291% | 3454 786% | 3452 786% |
| Totalt genomsnitt (program/inställningar) | 321% /
354% | 281% /
289% | 125% /
132% | 584% /
635% | 422% /
439% |
* ... mindre är bättre

| 3DMark 11 Performance | 1794 poäng | |
| 3DMark Ice Storm Standard Score | 61617 poäng | |
| 3DMark Cloud Gate Standard Score | 5975 poäng | |
| 3DMark Fire Strike Score | 943 poäng | |
| 3DMark Time Spy Score | 340 poäng | |
Hjälp | ||
| Dota 2 Reborn | |
| 1280x720 min (0/3) fastest | |
| Acer Aspire 5 A515-54G | |
| Lenovo ThinkBook 15 | |
| Dell XPS 13 9300 i5 FHD | |
| Asus VivoBook S15 S510UA | |
| Lenovo ThinkPad X1 Yoga 20SA000GUS | |
| Intel NUC5i3RYK | |
| Huawei MateBook D 15-53010TUY | |
| HP Pavilion 15-cw1212ng | |
| Asus Vivobook 15 F512DA-SH31 | |
| 1366x768 med (1/3) | |
| Acer Aspire 5 A515-54G | |
| Huawei MateBook D 15-53010TUY | |
| Asus VivoBook S15 S510UA | |
| Lenovo ThinkBook 15 | |
| Lenovo ThinkPad X1 Yoga 20SA000GUS | |
| Dell XPS 13 9300 i5 FHD | |
| HP Pavilion 15-cw1212ng | |
| Asus Vivobook 15 F512DA-SH31 | |
| Intel NUC5i3RYK | |
| låg | med. | hög | ultra | |
|---|---|---|---|---|
| Dota 2 Reborn (2015) | 60.8 | 38.8 | 18.2 | 16.9 |
| X-Plane 11.11 (2018) | 18.3 | 12.3 | 11.1 |
| Asus Vivobook 15 F512DA-SH31 Vega 3, R3 3200U, SanDisk X600 SD9SN8W-128G | Lenovo Ideapad S340-15IIL Iris Plus Graphics G7 (Ice Lake 64 EU), i7-1065G7, Intel SSD 660p SSDPEKNW512G8 | Acer Aspire 5 A515-43-R6WW Vega 8, R5 3500U, Intel SSD 660p 1TB SSDPEKNW010T8 | Dell Inspiron 15 3585 (2300U, Vega 6) Vega 6, R3 2300U, Toshiba BG3 KBG30ZMS256G | Asus ZenBook 15 UX534FTC-A8190T GeForce GTX 1650 Max-Q, i7-10510U, Samsung SSD PM981 MZVLB1T0HALR | Huawei MateBook D 15-53010TUY Vega 8, R5 3500U, Samsung SSD PM981 MZVLB256HAHQ | |
|---|---|---|---|---|---|---|
| Noise | 1% | -7% | -10% | -6% | -1% | |
| av / miljö * (dB) | 29.2 | 28.5 2% | 30.2 -3% | 30.6 -5% | 30.3 -4% | 29.6 -1% |
| Idle Minimum * (dB) | 29.2 | 28.5 2% | 30.2 -3% | 30.6 -5% | 30.3 -4% | 29.6 -1% |
| Idle Average * (dB) | 29.2 | 28.5 2% | 30.2 -3% | 30.6 -5% | 30.3 -4% | 29.6 -1% |
| Idle Maximum * (dB) | 29.2 | 28.5 2% | 30.2 -3% | 30.6 -5% | 30.9 -6% | 29.6 -1% |
| Load Average * (dB) | 30.5 | 30.3 1% | 34.8 -14% | 36.7 -20% | 31.3 -3% | 30.6 -0% |
| Load Maximum * (dB) | 34 | 35.5 -4% | 39.5 -16% | 41.1 -21% | 38.2 -12% | 33.8 1% |
| Witcher 3 ultra * (dB) | 38.1 |
* ... mindre är bättre
Ljudnivå
| Låg belastning |
| 29.2 / 29.2 / 29.2 dB(A) |
| Hög belastning |
| 30.5 / 34 dB(A) |
 | ||
30 dB tyst 40 dB(A) hörbar 50 dB(A) högt ljud |
||
min: | ||
(+) Den maximala temperaturen på ovansidan är 33 °C / 91 F, jämfört med genomsnittet av 36.8 °C / 98 F , allt från 21 till 71 °C för klassen Multimedia.
(±) Botten värms upp till maximalt 41.4 °C / 107 F, jämfört med genomsnittet av 39.1 °C / 102 F
(+) Vid tomgångsbruk är medeltemperaturen för ovansidan 25.8 °C / 78 F, jämfört med enhetsgenomsnittet på 31.3 °C / ### class_avg_f### F.
(+) Handledsstöden och pekplattan är kallare än hudtemperaturen med maximalt 24.2 °C / 75.6 F och är därför svala att ta på.
(+) Medeltemperaturen för handledsstödsområdet på liknande enheter var 28.7 °C / 83.7 F (+4.5 °C / 8.1 F).
Asus Vivobook 15 F512DA-SH31 ljudanalys
(±) | högtalarljudstyrkan är genomsnittlig men bra (78.6 dB)
Bas 100 - 315 Hz
(±) | reducerad bas - i genomsnitt 13.6% lägre än medianen
(±) | linjäriteten för basen är genomsnittlig (13.9% delta till föregående frekvens)
Mellan 400 - 2000 Hz
(+) | balanserad mellan - endast 3.7% från medianen
(+) | mids är linjära (5% delta till föregående frekvens)
Högsta 2 - 16 kHz
(+) | balanserade toppar - endast 3% från medianen
(+) | toppar är linjära (6.2% delta till föregående frekvens)
Totalt 100 - 16 000 Hz
(±) | linjäriteten för det totala ljudet är genomsnittlig (18.9% skillnad mot median)
Jämfört med samma klass
» 59% av alla testade enheter i den här klassen var bättre, 7% liknande, 33% sämre
» Den bästa hade ett delta på 5%, genomsnittet var 17%, sämst var 45%
Jämfört med alla testade enheter
» 44% av alla testade enheter var bättre, 8% liknande, 48% sämre
» Den bästa hade ett delta på 4%, genomsnittet var 24%, sämst var 134%
Apple MacBook 12 (Early 2016) 1.1 GHz ljudanalys
(+) | högtalare kan spela relativt högt (83.6 dB)
Bas 100 - 315 Hz
(±) | reducerad bas - i genomsnitt 11.3% lägre än medianen
(±) | linjäriteten för basen är genomsnittlig (14.2% delta till föregående frekvens)
Mellan 400 - 2000 Hz
(+) | balanserad mellan - endast 2.4% från medianen
(+) | mids är linjära (5.5% delta till föregående frekvens)
Högsta 2 - 16 kHz
(+) | balanserade toppar - endast 2% från medianen
(+) | toppar är linjära (4.5% delta till föregående frekvens)
Totalt 100 - 16 000 Hz
(+) | det totala ljudet är linjärt (10.2% skillnad mot median)
Jämfört med samma klass
» 7% av alla testade enheter i den här klassen var bättre, 2% liknande, 91% sämre
» Den bästa hade ett delta på 5%, genomsnittet var 18%, sämst var 53%
Jämfört med alla testade enheter
» 5% av alla testade enheter var bättre, 1% liknande, 94% sämre
» Den bästa hade ett delta på 4%, genomsnittet var 24%, sämst var 134%
| Av/Standby | |
| Låg belastning | |
| Hög belastning |
|
Förklaring:
min: | |
| Asus Vivobook 15 F512DA-SH31 R3 3200U, Vega 3, SanDisk X600 SD9SN8W-128G, IPS, 1920x1080, 15.6" | Lenovo Ideapad S340-15IIL i7-1065G7, Iris Plus Graphics G7 (Ice Lake 64 EU), Intel SSD 660p SSDPEKNW512G8, IPS, 1920x1080, 15.6" | Acer Aspire 5 A515-43-R6WW R5 3500U, Vega 8, Intel SSD 660p 1TB SSDPEKNW010T8, IPS, 1920x1080, 15.6" | Dell Inspiron 15 3585 (2300U, Vega 6) R3 2300U, Vega 6, Toshiba BG3 KBG30ZMS256G, TN, 1920x1080, 15.6" | Asus ZenBook 15 UX534FTC-A8190T i7-10510U, GeForce GTX 1650 Max-Q, Samsung SSD PM981 MZVLB1T0HALR, IPS, 1920x1080, 15.6" | Huawei MateBook D 15-53010TUY R5 3500U, Vega 8, Samsung SSD PM981 MZVLB256HAHQ, IPS, 1920x1080, 15.6" | |
|---|---|---|---|---|---|---|
| Power Consumption | -19% | -3% | -37% | -65% | -33% | |
| Idle Minimum * (Watt) | 3.2 | 3.8 -19% | 3.7 -16% | 6.3 -97% | 2.8 13% | 5.2 -63% |
| Idle Average * (Watt) | 6.8 | 6.9 -1% | 6.2 9% | 9.2 -35% | 7.7 -13% | 8.8 -29% |
| Idle Maximum * (Watt) | 7.7 | 7.7 -0% | 8.4 -9% | 9.6 -25% | 9.4 -22% | 10.2 -32% |
| Load Average * (Watt) | 30.3 | 43.3 -43% | 31.1 -3% | 38 -25% | 57 -88% | 37.5 -24% |
| Witcher 3 ultra * (Watt) | 28.2 | 40.4 -43% | 62 -120% | |||
| Load Maximum * (Watt) | 44.4 | 47.5 -7% | 43.1 3% | 46 -4% | 116 -161% | 50.9 -15% |
* ... mindre är bättre
| Asus Vivobook 15 F512DA-SH31 R3 3200U, Vega 3, 37 Wh | Lenovo Ideapad S340-15IIL i7-1065G7, Iris Plus Graphics G7 (Ice Lake 64 EU), 36 Wh | Acer Aspire 5 A515-43-R6WW R5 3500U, Vega 8, 48 Wh | Dell Inspiron 15 3585 (2300U, Vega 6) R3 2300U, Vega 6, 42 Wh | Asus ZenBook 15 UX534FTC-A8190T i7-10510U, GeForce GTX 1650 Max-Q, 71 Wh | Huawei MateBook D 15-53010TUY R5 3500U, Vega 8, 42 Wh | |
|---|---|---|---|---|---|---|
| Batteridrifttid | -28% | 30% | -12% | 107% | 30% | |
| WiFi v1.3 (h) | 6 | 4.3 -28% | 7.8 30% | 5.3 -12% | 12.4 107% | 7.8 30% |
| Reader / Idle (h) | 10 | 17.7 | 7.3 | 27.2 | ||
| Load (h) | 1.1 | 2.2 | 1.8 | 2.4 | 1.3 |
För
Emot
Läs den fullständiga versionen av den här recensionen på engelska här.
Vår konfiguration med Ryzen 3 kostar mindre än varianten med Intels Core i3 samtidigt som den har i princip samma prestanda. Detta är ett bra exempel på att AMD är överlägsna Intel när det kommer till prestanda per krona, även i budgetsektionen. Bristerna inkluderar att den har lite lagringsutrymme och bara 4 GB RAM, men den är däremot förvånansvärt lätt att serva och uppgradera vilket ger systemet längre uthållighet och gör det lättare att rekommendera.
Om du kan tänka dig att spendera runt 2.000 kronor till rekommenderar vi att du istället tar en titt på AMD-drivna Huawei MateBook D 15, särskilt om du planerar att resa mycket. VivoBooks mörka skärm gör den svår att använda utomhus. Men om ditt kontorsarbete eller filmtittande i huvudsak sker inomhus räcker denna enkla VivoBook till. Kom bara ihåg att testa din trådlösa prestanda för vi hade problem med den på vår testenhet.
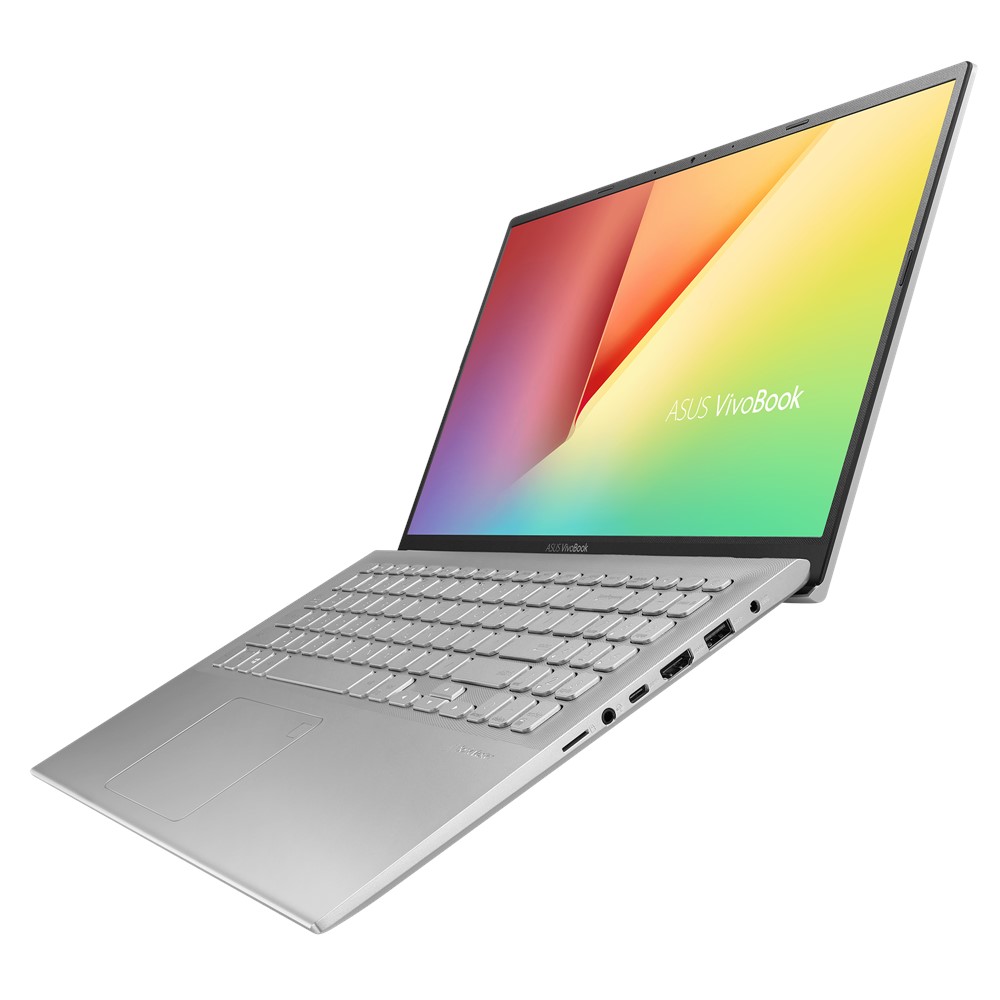
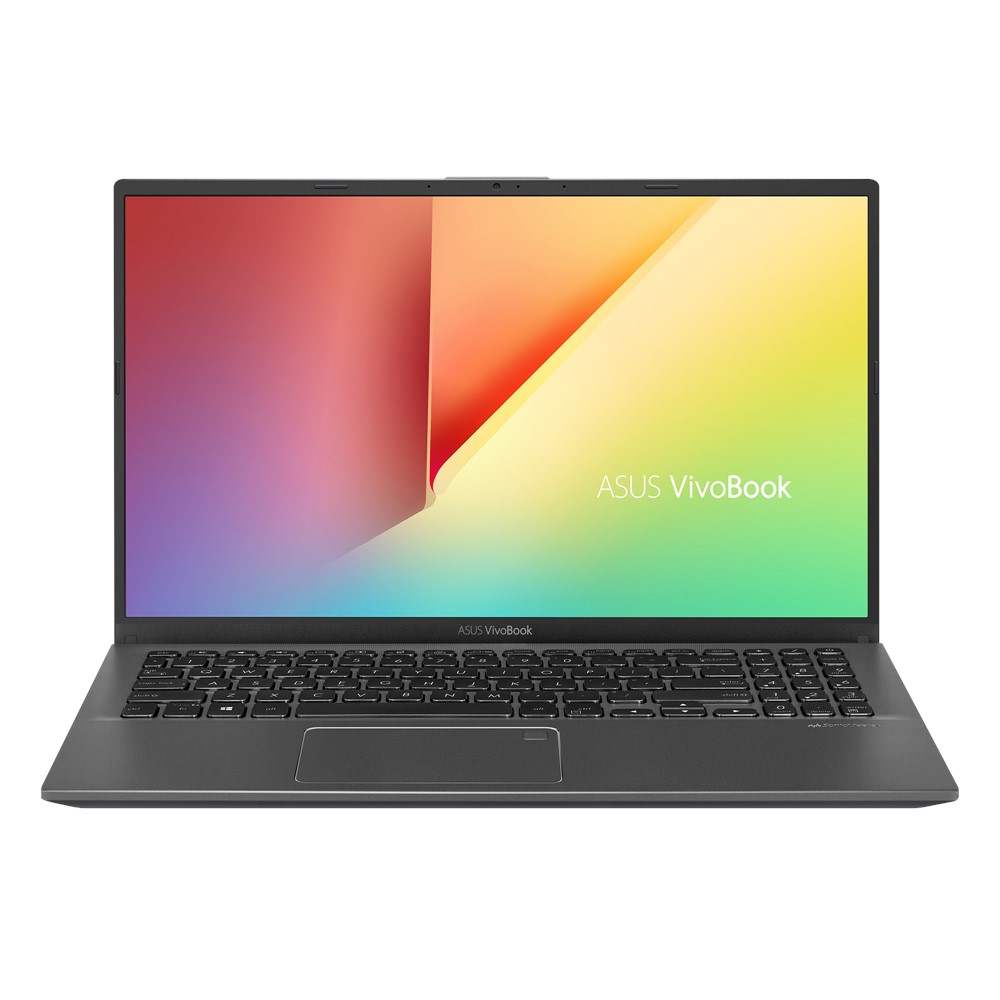
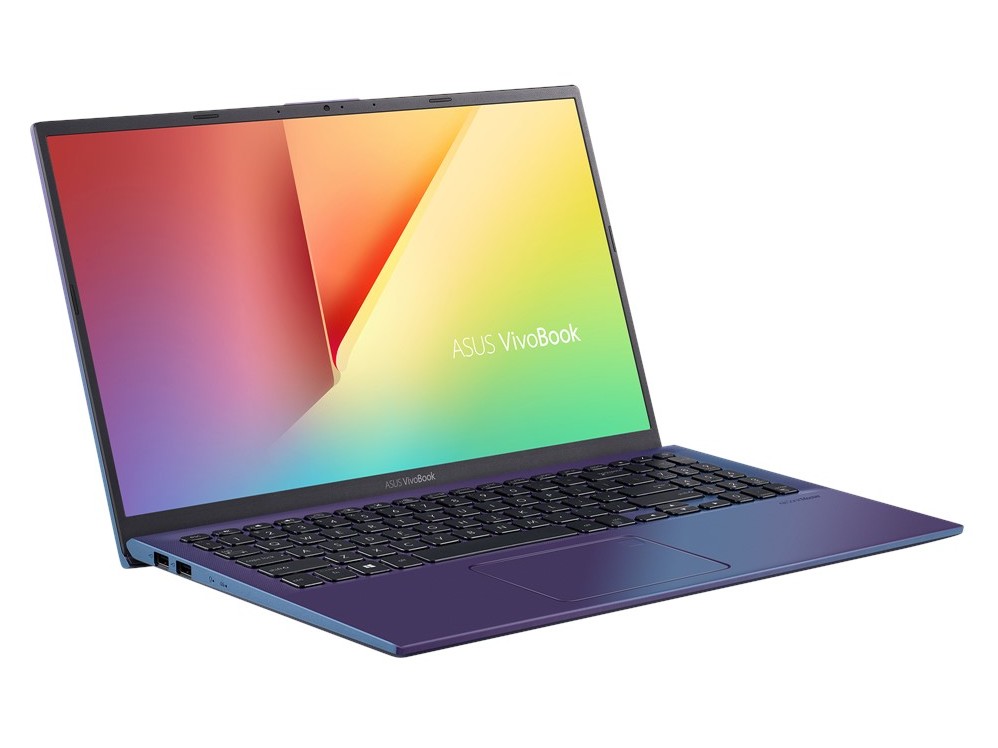
Asus Vivobook 15 F512DA-SH31
- 04/20/2020 v7 (old)
Allen Ngo
Price comparison
