Test: Dell G5 15 5590 - Pris/Prestanda-kung och problembarn. (Sammanfattning)
Gradering | Datum | Modell | Vikt | Höjd | Storlek | Upplösning | Pris |
|---|---|---|---|---|---|---|---|
| 79.6 % v7 (old) | 11/2019 | Dell G5 15 5590-PCNJJ i5-9300H, GeForce GTX 1650 Mobile | 2.7 kg | 23.7 mm | 15.60" | 1920x1080 | |
| 81.5 % v7 (old) | HP Omen 15-dc1020ng i5-9300H, GeForce GTX 1650 Mobile | 2.3 kg | 25 mm | 15.60" | 1920x1080 | ||
| 82.5 % v6 (old) | 05/2019 | Acer Aspire Nitro 5 AN515-54-53Z2 i5-9300H, GeForce GTX 1650 Mobile | 2.2 kg | 27 mm | 15.60" | 1920x1080 | |
| 83.9 % v7 (old) | 08/2019 | HP Gaming Pavilion 15-dk0009ng i7-9750H, GeForce GTX 1660 Ti Max-Q | 2.4 kg | 23.4 mm | 15.60" | 1920x1080 | |
| 82.3 % v7 (old) | 08/2019 | Lenovo Legion Y540-15IRH-81SX00B2GE i7-9750H, GeForce GTX 1660 Ti Mobile | 2.2 kg | 26 mm | 15.60" | 1920x1080 |

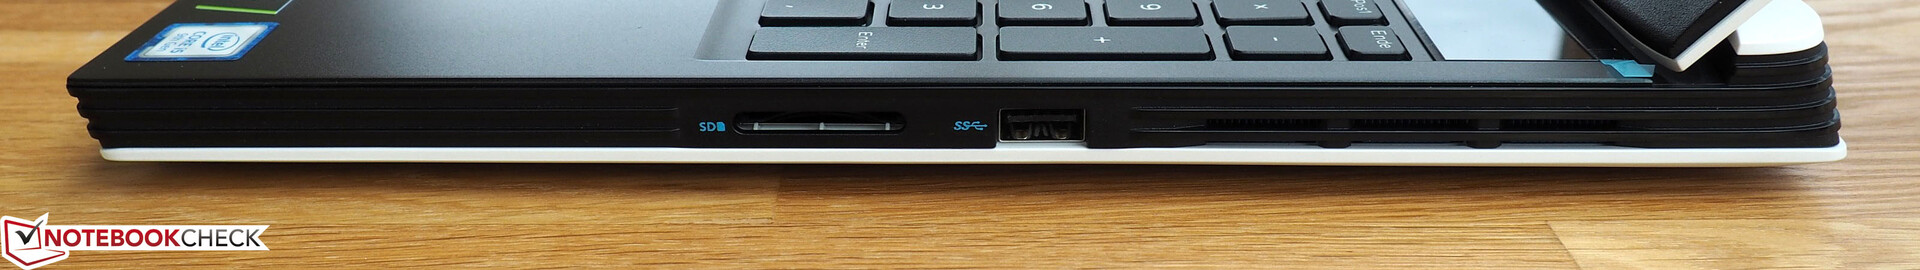
| SD Card Reader | |
| average JPG Copy Test (av. of 3 runs) | |
| Genomsnitt av klass Gaming (20.9 - 210, n=55, senaste 2 åren) | |
| HP Omen 15-dc1020ng (Toshiba Exceria Pro SDXC 64 GB UHS-II) | |
| HP Gaming Pavilion 15-dk0009ng (Toshiba Exceria Pro SDXC 64 GB UHS-II) | |
| Dell G5 15 5590-PCNJJ (Toshiba Exceria Pro SDXC 64 GB UHS-II) | |
| maximum AS SSD Seq Read Test (1GB) | |
| Genomsnitt av klass Gaming (25.5 - 261, n=52, senaste 2 åren) | |
| HP Omen 15-dc1020ng (Toshiba Exceria Pro SDXC 64 GB UHS-II) | |
| HP Gaming Pavilion 15-dk0009ng (Toshiba Exceria Pro SDXC 64 GB UHS-II) | |
| Dell G5 15 5590-PCNJJ (Toshiba Exceria Pro SDXC 64 GB UHS-II) | |
| Networking | |
| iperf3 transmit AX12 | |
| Acer Aspire Nitro 5 AN515-54-53Z2 | |
| HP Omen 15-dc1020ng | |
| Dell G5 15 5590-PCNJJ | |
| HP Gaming Pavilion 15-dk0009ng | |
| Lenovo Legion Y540-15IRH-81SX00B2GE | |
| iperf3 receive AX12 | |
| Dell G5 15 5590-PCNJJ | |
| Acer Aspire Nitro 5 AN515-54-53Z2 | |
| HP Omen 15-dc1020ng | |
| Lenovo Legion Y540-15IRH-81SX00B2GE | |
| HP Gaming Pavilion 15-dk0009ng | |
| |||||||||||||||||||||||||
Distribution av ljusstyrkan: 87 %
Mitt på batteriet: 234 cd/m²
Kontrast: 1064:1 (Svärta: 0.22 cd/m²)
ΔE ColorChecker Calman: 6.52 | ∀{0.5-29.43 Ø4.71}
calibrated: 3.56
ΔE Greyscale Calman: 5.33 | ∀{0.09-98 Ø4.96}
57% sRGB (Argyll 1.6.3 3D)
36% AdobeRGB 1998 (Argyll 1.6.3 3D)
96.8% AdobeRGB 1998 (Argyll 3D)
99.9% sRGB (Argyll 3D)
83.1% Display P3 (Argyll 3D)
Gamma: 2.86
CCT: 5983 K
| Dell G5 15 5590-PCNJJ AU Optronics B156HAN (AUO23ED), IPS, 1920x1080 | HP Omen 15-dc1020ng LGD05CE, IPS, 1920x1080 | Acer Aspire Nitro 5 AN515-54-53Z2 LG LP156WFC-SPD1 (LGD0563), IPS, 1920x1080 | HP Gaming Pavilion 15-dk0009ng LG Philips LGD05FE, IPS, 1920x1080 | Lenovo Legion Y540-15IRH-81SX00B2GE BOE 084D, IPS, 1920x1080 | |
|---|---|---|---|---|---|
| Display | -52% | -52% | -20% | -21% | |
| Display P3 Coverage (%) | 83.1 | 38.37 -54% | 37.97 -54% | 64.2 -23% | 63.6 -23% |
| sRGB Coverage (%) | 99.9 | 57.6 -42% | 57 -43% | 95.1 -5% | 91.7 -8% |
| AdobeRGB 1998 Coverage (%) | 96.8 | 39.69 -59% | 39.23 -59% | 65.8 -32% | 65.2 -33% |
| Response Times | 9% | 12% | 66% | 71% | |
| Response Time Grey 50% / Grey 80% * (ms) | 48 ? | 40 ? 17% | 42 ? 12% | 16.4 ? 66% | 8.8 ? 82% |
| Response Time Black / White * (ms) | 30 ? | 29.6 ? 1% | 26.8 ? 11% | 10.4 ? 65% | 12 ? 60% |
| PWM Frequency (Hz) | |||||
| Screen | -2% | 9% | 38% | 27% | |
| Brightness middle (cd/m²) | 234 | 251 7% | 238 2% | 345 47% | 299 28% |
| Brightness (cd/m²) | 216 | 232 7% | 226 5% | 324 50% | 290 34% |
| Brightness Distribution (%) | 87 | 76 -13% | 83 -5% | 86 -1% | 89 2% |
| Black Level * (cd/m²) | 0.22 | 0.17 23% | 0.27 -23% | 0.42 -91% | 0.29 -32% |
| Contrast (:1) | 1064 | 1476 39% | 881 -17% | 821 -23% | 1031 -3% |
| Colorchecker dE 2000 * | 6.52 | 6.2 5% | 4.11 37% | 1.3 80% | 3.7 43% |
| Colorchecker dE 2000 max. * | 10.58 | 18.6 -76% | 6.89 35% | 2.8 74% | 7 34% |
| Colorchecker dE 2000 calibrated * | 3.56 | 4.8 -35% | 3.76 -6% | 1.1 69% | 2 44% |
| Greyscale dE 2000 * | 5.33 | 4.2 21% | 1.78 67% | 1.2 77% | 4.1 23% |
| Gamma | 2.86 77% | 2.32 95% | 2.41 91% | 2.31 95% | 2.19 100% |
| CCT | 5983 109% | 7454 87% | 6311 103% | 6476 100% | 7166 91% |
| Color Space (Percent of AdobeRGB 1998) (%) | 36 | 36.5 1% | 36 0% | 60.5 68% | 59.3 65% |
| Color Space (Percent of sRGB) (%) | 57 | 57.4 1% | 57 0% | 94.9 66% | 91.5 61% |
| Totalt genomsnitt (program/inställningar) | -15% /
-10% | -10% /
-2% | 28% /
30% | 26% /
24% |
* ... mindre är bättre
Visa svarstider
| ↔ Svarstid svart till vitt | ||
|---|---|---|
| 30 ms ... stiga ↗ och falla ↘ kombinerat | ↗ 16.8 ms stiga | 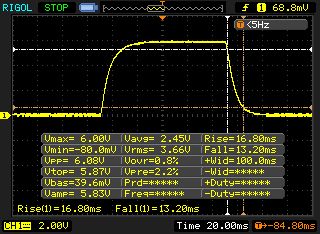 |
| ↘ 13.2 ms hösten | ||
| Skärmen visar långsamma svarsfrekvenser i våra tester och kommer att vara otillfredsställande för spelare. I jämförelse sträcker sig alla testade enheter från 0.1 (minst) till 240 (maximalt) ms. » 80 % av alla enheter är bättre. Detta innebär att den uppmätta svarstiden är sämre än genomsnittet av alla testade enheter (19.8 ms). | ||
| ↔ Svarstid 50 % grått till 80 % grått | ||
| 48 ms ... stiga ↗ och falla ↘ kombinerat | ↗ 22.8 ms stiga | 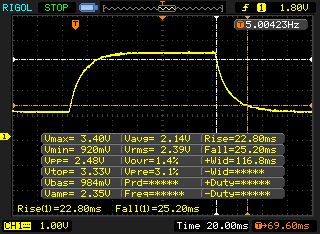 |
| ↘ 25.2 ms hösten | ||
| Skärmen visar långsamma svarsfrekvenser i våra tester och kommer att vara otillfredsställande för spelare. I jämförelse sträcker sig alla testade enheter från 0.165 (minst) till 636 (maximalt) ms. » 82 % av alla enheter är bättre. Detta innebär att den uppmätta svarstiden är sämre än genomsnittet av alla testade enheter (30.9 ms). | ||
Skärmflimmer / PWM (Puls-Width Modulation)
| Skärmflimmer / PWM upptäcktes inte | 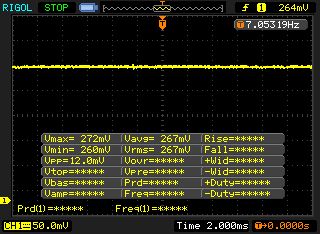 | ||
Som jämförelse: 52 % av alla testade enheter använder inte PWM för att dämpa skärmen. Om PWM upptäcktes mättes ett medelvärde av 7748 (minst: 5 - maximum: 343500) Hz. | |||
| Cinebench R15 | |
| CPU Single 64Bit | |
| Genomsnitt av klass Gaming (188.8 - 350, n=107, senaste 2 åren) | |
| Lenovo Legion Y540-15IRH-81SX00B2GE | |
| HP Gaming Pavilion 15-dk0009ng | |
| Acer Aspire Nitro 5 AN515-54-53Z2 | |
| HP Omen 15-dc1020ng | |
| Dell G5 15 5590-PCNJJ | |
| CPU Multi 64Bit | |
| Genomsnitt av klass Gaming (1578 - 6330, n=106, senaste 2 åren) | |
| Lenovo Legion Y540-15IRH-81SX00B2GE | |
| HP Gaming Pavilion 15-dk0009ng | |
| Dell G5 15 5590-PCNJJ | |
| HP Omen 15-dc1020ng | |
| Acer Aspire Nitro 5 AN515-54-53Z2 | |
| Cinebench R20 | |
| CPU (Single Core) | |
| Genomsnitt av klass Gaming (442 - 913, n=107, senaste 2 åren) | |
| Lenovo Legion Y540-15IRH-81SX00B2GE | |
| HP Gaming Pavilion 15-dk0009ng | |
| HP Omen 15-dc1020ng | |
| Dell G5 15 5590-PCNJJ | |
| CPU (Multi Core) | |
| Genomsnitt av klass Gaming (4029 - 16433, n=107, senaste 2 åren) | |
| Lenovo Legion Y540-15IRH-81SX00B2GE | |
| HP Gaming Pavilion 15-dk0009ng | |
| Dell G5 15 5590-PCNJJ | |
| HP Omen 15-dc1020ng | |
| Dell G5 15 5590-PCNJJ KBG30ZMS128G | HP Omen 15-dc1020ng WDC PC SN720 SDAQNTW-512G | Acer Aspire Nitro 5 AN515-54-53Z2 WDC PC SN520 SDAPNUW-512G | HP Gaming Pavilion 15-dk0009ng Samsung SSD PM981 MZVLB256HAHQ | Lenovo Legion Y540-15IRH-81SX00B2GE WDC PC SN720 SDAPNTW-512G | |
|---|---|---|---|---|---|
| CrystalDiskMark 5.2 / 6 | 502% | 314% | 316% | 489% | |
| Write 4K (MB/s) | 65.3 | 112.1 72% | 109.1 67% | 100 53% | 158.8 143% |
| Read 4K (MB/s) | 29.71 | 42.01 41% | 42.05 42% | 31.39 6% | 29.11 -2% |
| Write Seq (MB/s) | 128.8 | 1964 1425% | 1457 1031% | 1308 916% | 1584 1130% |
| Read Seq (MB/s) | 859 | 2065 140% | 1421 65% | 1083 26% | 1694 97% |
| Write 4K Q32T1 (MB/s) | 95.8 | 318.2 232% | 287.8 200% | 362.9 279% | 536 459% |
| Read 4K Q32T1 (MB/s) | 197.6 | 406.7 106% | 317.9 61% | 425.7 115% | 363.9 84% |
| Write Seq Q32T1 (MB/s) | 132.5 | 2534 1812% | 1455 998% | 1411 965% | 2536 1814% |
| Read Seq Q32T1 (MB/s) | 1208 | 3438 185% | 1739 44% | 3240 168% | 3458 186% |

| 3DMark 11 Performance | 11926 poäng | |
| 3DMark Ice Storm Standard Score | 96370 poäng | |
| 3DMark Cloud Gate Standard Score | 25549 poäng | |
| 3DMark Fire Strike Score | 8059 poäng | |
| 3DMark Time Spy Score | 3616 poäng | |
Hjälp | ||
| 3DMark | |
| 1920x1080 Fire Strike Graphics | |
| Genomsnitt av klass Gaming (12242 - 62849, n=116, senaste 2 åren) | |
| Lenovo Legion Y540-15IRH-81SX00B2GE | |
| HP Gaming Pavilion 15-dk0009ng | |
| HP Omen 15-dc1020ng | |
| Acer Aspire Nitro 5 AN515-54-53Z2 | |
| Dell G5 15 5590-PCNJJ | |
| 2560x1440 Time Spy Graphics | |
| Genomsnitt av klass Gaming (5012 - 26212, n=116, senaste 2 åren) | |
| HP Gaming Pavilion 15-dk0009ng | |
| HP Omen 15-dc1020ng | |
| Dell G5 15 5590-PCNJJ | |
| 3DMark 11 - 1280x720 Performance GPU | |
| Genomsnitt av klass Gaming (21841 - 80022, n=105, senaste 2 åren) | |
| Lenovo Legion Y540-15IRH-81SX00B2GE | |
| HP Gaming Pavilion 15-dk0009ng | |
| HP Omen 15-dc1020ng | |
| Dell G5 15 5590-PCNJJ | |
| Acer Aspire Nitro 5 AN515-54-53Z2 | |
| The Witcher 3 | |
| 1920x1080 High Graphics & Postprocessing (Nvidia HairWorks Off) | |
| Genomsnitt av klass Gaming (341 - 404, n=2, senaste 2 åren) | |
| HP Gaming Pavilion 15-dk0009ng | |
| HP Omen 15-dc1020ng | |
| Acer Aspire Nitro 5 AN515-54-53Z2 | |
| Dell G5 15 5590-PCNJJ | |
| 1920x1080 Ultra Graphics & Postprocessing (HBAO+) | |
| Genomsnitt av klass Gaming (104.7 - 240, n=7, senaste 2 åren) | |
| HP Gaming Pavilion 15-dk0009ng | |
| Lenovo Legion Y540-15IRH-81SX00B2GE | |
| HP Omen 15-dc1020ng | |
| Acer Aspire Nitro 5 AN515-54-53Z2 | |
| Dell G5 15 5590-PCNJJ | |
| låg | med. | hög | ultra | |
|---|---|---|---|---|
| BioShock Infinite (2013) | 266 | 230 | 209 | 86.1 |
| The Witcher 3 (2015) | 176 | 110 | 59.8 | 34.4 |
| Rocket League (2017) | 249 | 204 | 136 | |
| Shadow of the Tomb Raider (2018) | 98 | 57 | 48 | 43 |
| Assassin´s Creed Odyssey (2018) | 71 | 56 | 48 | 30 |
| Apex Legends (2019) | 144 | 81.7 | 66.5 | 65.4 |
| Metro Exodus (2019) | 85.3 | 41 | 30.8 | 25.1 |
| Anthem (2019) | 62.7 | 56.8 | 47.3 | 44.9 |
| Dirt Rally 2.0 (2019) | 203 | 89.3 | 71 | 41.8 |
| The Division 2 (2019) | 114 | 63 | 50 | 37 |
| Anno 1800 (2019) | 74.9 | 64.5 | 40.1 | 19.4 |
| Rage 2 (2019) | 117 | 54.5 | 46 | 45.1 |
| Total War: Three Kingdoms (2019) | 166 | 63.9 | 38.5 | 24.4 |
| F1 2019 (2019) | 172 | 102 | 85 | 59 |
| Control (2019) | 129 | 44.2 | 32.1 | |
| Borderlands 3 (2019) | 98.9 | 58.3 | 39 | 29.5 |
| FIFA 20 (2019) | 188 | 154 | 148 | 137 |
| Ghost Recon Breakpoint (2019) | 85 | 48 | 44 | 30 |
| GRID 2019 (2019) | 123 | 76.2 | 59.7 | 41.3 |
Ljudnivå
| Låg belastning |
| 31 / 32 / 35 dB(A) |
| Hårddisk |
| 32 dB(A) |
| Hög belastning |
| 49 / 53 dB(A) |
 | ||
30 dB tyst 40 dB(A) hörbar 50 dB(A) högt ljud |
||
min: | ||
| Dell G5 15 5590-PCNJJ i5-9300H, GeForce GTX 1650 Mobile | HP Omen 15-dc1020ng i5-9300H, GeForce GTX 1650 Mobile | Acer Aspire Nitro 5 AN515-54-53Z2 i5-9300H, GeForce GTX 1650 Mobile | HP Gaming Pavilion 15-dk0009ng i7-9750H, GeForce GTX 1660 Ti Max-Q | Lenovo Legion Y540-15IRH-81SX00B2GE i7-9750H, GeForce GTX 1660 Ti Mobile | Genomsnitt av klass Gaming | |
|---|---|---|---|---|---|---|
| Noise | 15% | 4% | 17% | 11% | 12% | |
| av / miljö * (dB) | 30 | 28.8 4% | 30 -0% | 28.2 6% | 29.3 2% | 24.1 ? 20% |
| Idle Minimum * (dB) | 31 | 28.8 7% | 30 3% | 29.3 5% | 29.3 5% | 26 ? 16% |
| Idle Average * (dB) | 32 | 29.5 8% | 31 3% | 29.3 8% | 29.3 8% | 27.5 ? 14% |
| Idle Maximum * (dB) | 35 | 31.1 11% | 33 6% | 29.3 16% | 29.3 16% | 30.1 ? 14% |
| Load Average * (dB) | 49 | 35.2 28% | 46 6% | 32.3 34% | 35.7 27% | 43.8 ? 11% |
| Witcher 3 ultra * (dB) | 47 | 35.2 25% | 46 2% | 34 28% | 44.2 6% | |
| Load Maximum * (dB) | 53 | 41 23% | 49 8% | 41.2 22% | 45.6 14% | 54.3 ? -2% |
* ... mindre är bättre
(-) Den maximala temperaturen på ovansidan är 49 °C / 120 F, jämfört med genomsnittet av 40.4 °C / 105 F , allt från 21.2 till 68.8 °C för klassen Gaming.
(-) Botten värms upp till maximalt 55 °C / 131 F, jämfört med genomsnittet av 43.2 °C / 110 F
(+) Vid tomgångsbruk är medeltemperaturen för ovansidan 24.8 °C / 77 F, jämfört med enhetsgenomsnittet på 33.9 °C / ### class_avg_f### F.
(±) När du spelar The Witcher 3 är medeltemperaturen för ovansidan 37.3 °C / 99 F, jämfört med enhetsgenomsnittet på 33.9 °C / ## #class_avg_f### F.
(+) Handledsstöden och pekplattan når maximal hudtemperatur (32 °C / 89.6 F) och är därför inte varma.
(-) Medeltemperaturen för handledsstödsområdet på liknande enheter var 28.8 °C / 83.8 F (-3.2 °C / -5.8 F).
| Dell G5 15 5590-PCNJJ i5-9300H, GeForce GTX 1650 Mobile | HP Omen 15-dc1020ng i5-9300H, GeForce GTX 1650 Mobile | Acer Aspire Nitro 5 AN515-54-53Z2 i5-9300H, GeForce GTX 1650 Mobile | HP Gaming Pavilion 15-dk0009ng i7-9750H, GeForce GTX 1660 Ti Max-Q | Lenovo Legion Y540-15IRH-81SX00B2GE i7-9750H, GeForce GTX 1660 Ti Mobile | Genomsnitt av klass Gaming | |
|---|---|---|---|---|---|---|
| Heat | 10% | 5% | 5% | -18% | -9% | |
| Maximum Upper Side * (°C) | 49 | 40.3 18% | 47 4% | 46.7 5% | 42.7 13% | 45.2 ? 8% |
| Maximum Bottom * (°C) | 55 | 48.5 12% | 50 9% | 53.7 2% | 52.7 4% | 48.2 ? 12% |
| Idle Upper Side * (°C) | 25 | 23.9 4% | 24 4% | 23.8 5% | 33.1 -32% | 31 ? -24% |
| Idle Bottom * (°C) | 26 | 24.6 5% | 25 4% | 23.7 9% | 41 -58% | 34.2 ? -32% |
* ... mindre är bättre
Dell G5 15 5590-PCNJJ ljudanalys
(+) | högtalare kan spela relativt högt (87 dB)
Bas 100 - 315 Hz
(-) | nästan ingen bas - i genomsnitt 19.7% lägre än medianen
(±) | linjäriteten för basen är genomsnittlig (11.9% delta till föregående frekvens)
Mellan 400 - 2000 Hz
(±) | högre mellan - i genomsnitt 5.7% högre än median
(+) | mids är linjära (4.9% delta till föregående frekvens)
Högsta 2 - 16 kHz
(±) | reducerade toppar - i genomsnitt 6.5% lägre än medianen
(±) | linjäriteten för toppar är genomsnittlig (9.6% delta till föregående frekvens)
Totalt 100 - 16 000 Hz
(±) | linjäriteten för det totala ljudet är genomsnittlig (17.4% skillnad mot median)
Jämfört med samma klass
» 48% av alla testade enheter i den här klassen var bättre, 12% liknande, 40% sämre
» Den bästa hade ett delta på 6%, genomsnittet var 18%, sämst var 132%
Jämfört med alla testade enheter
» 33% av alla testade enheter var bättre, 8% liknande, 58% sämre
» Den bästa hade ett delta på 4%, genomsnittet var 23%, sämst var 134%
HP Omen 15-dc1020ng ljudanalys
(-) | inte särskilt höga högtalare (71.1 dB)
Bas 100 - 315 Hz
(-) | nästan ingen bas - i genomsnitt 21.6% lägre än medianen
(±) | linjäriteten för basen är genomsnittlig (11.3% delta till föregående frekvens)
Mellan 400 - 2000 Hz
(+) | balanserad mellan - endast 1.8% från medianen
(±) | linjäriteten för mids är genomsnittlig (8.8% delta till föregående frekvens)
Högsta 2 - 16 kHz
(+) | balanserade toppar - endast 3.2% från medianen
(+) | toppar är linjära (5.8% delta till föregående frekvens)
Totalt 100 - 16 000 Hz
(±) | linjäriteten för det totala ljudet är genomsnittlig (22.2% skillnad mot median)
Jämfört med samma klass
» 79% av alla testade enheter i den här klassen var bättre, 6% liknande, 14% sämre
» Den bästa hade ett delta på 6%, genomsnittet var 18%, sämst var 132%
Jämfört med alla testade enheter
» 65% av alla testade enheter var bättre, 6% liknande, 29% sämre
» Den bästa hade ett delta på 4%, genomsnittet var 23%, sämst var 134%
| Av/Standby | |
| Låg belastning | |
| Hög belastning |
|
Förklaring:
min: | |
| Dell G5 15 5590-PCNJJ i5-9300H, GeForce GTX 1650 Mobile | HP Omen 15-dc1020ng i5-9300H, GeForce GTX 1650 Mobile | Acer Aspire Nitro 5 AN515-54-53Z2 i5-9300H, GeForce GTX 1650 Mobile | HP Gaming Pavilion 15-dk0009ng i7-9750H, GeForce GTX 1660 Ti Max-Q | Lenovo Legion Y540-15IRH-81SX00B2GE i7-9750H, GeForce GTX 1660 Ti Mobile | Genomsnitt av klass Gaming | |
|---|---|---|---|---|---|---|
| Power Consumption | 0% | -2% | -34% | -98% | -122% | |
| Idle Minimum * (Watt) | 4 | 4.04 -1% | 5 -25% | 6.8 -70% | 14.5 -263% | 13 ? -225% |
| Idle Average * (Watt) | 7 | 7.2 -3% | 7 -0% | 10.7 -53% | 18.5 -164% | 19 ? -171% |
| Idle Maximum * (Watt) | 12 | 11.4 5% | 11 8% | 12.5 -4% | 20 -67% | 24.5 ? -104% |
| Load Average * (Watt) | 95 | 80.8 15% | 89 6% | 87.2 8% | 81.6 14% | 111.1 ? -17% |
| Witcher 3 ultra * (Watt) | 86 | 93.6 -9% | 90 -5% | 121 -41% | 132 -53% | |
| Load Maximum * (Watt) | 135 | 144.5 -7% | 132 2% | 191.4 -42% | 208.1 -54% | 260 ? -93% |
* ... mindre är bättre
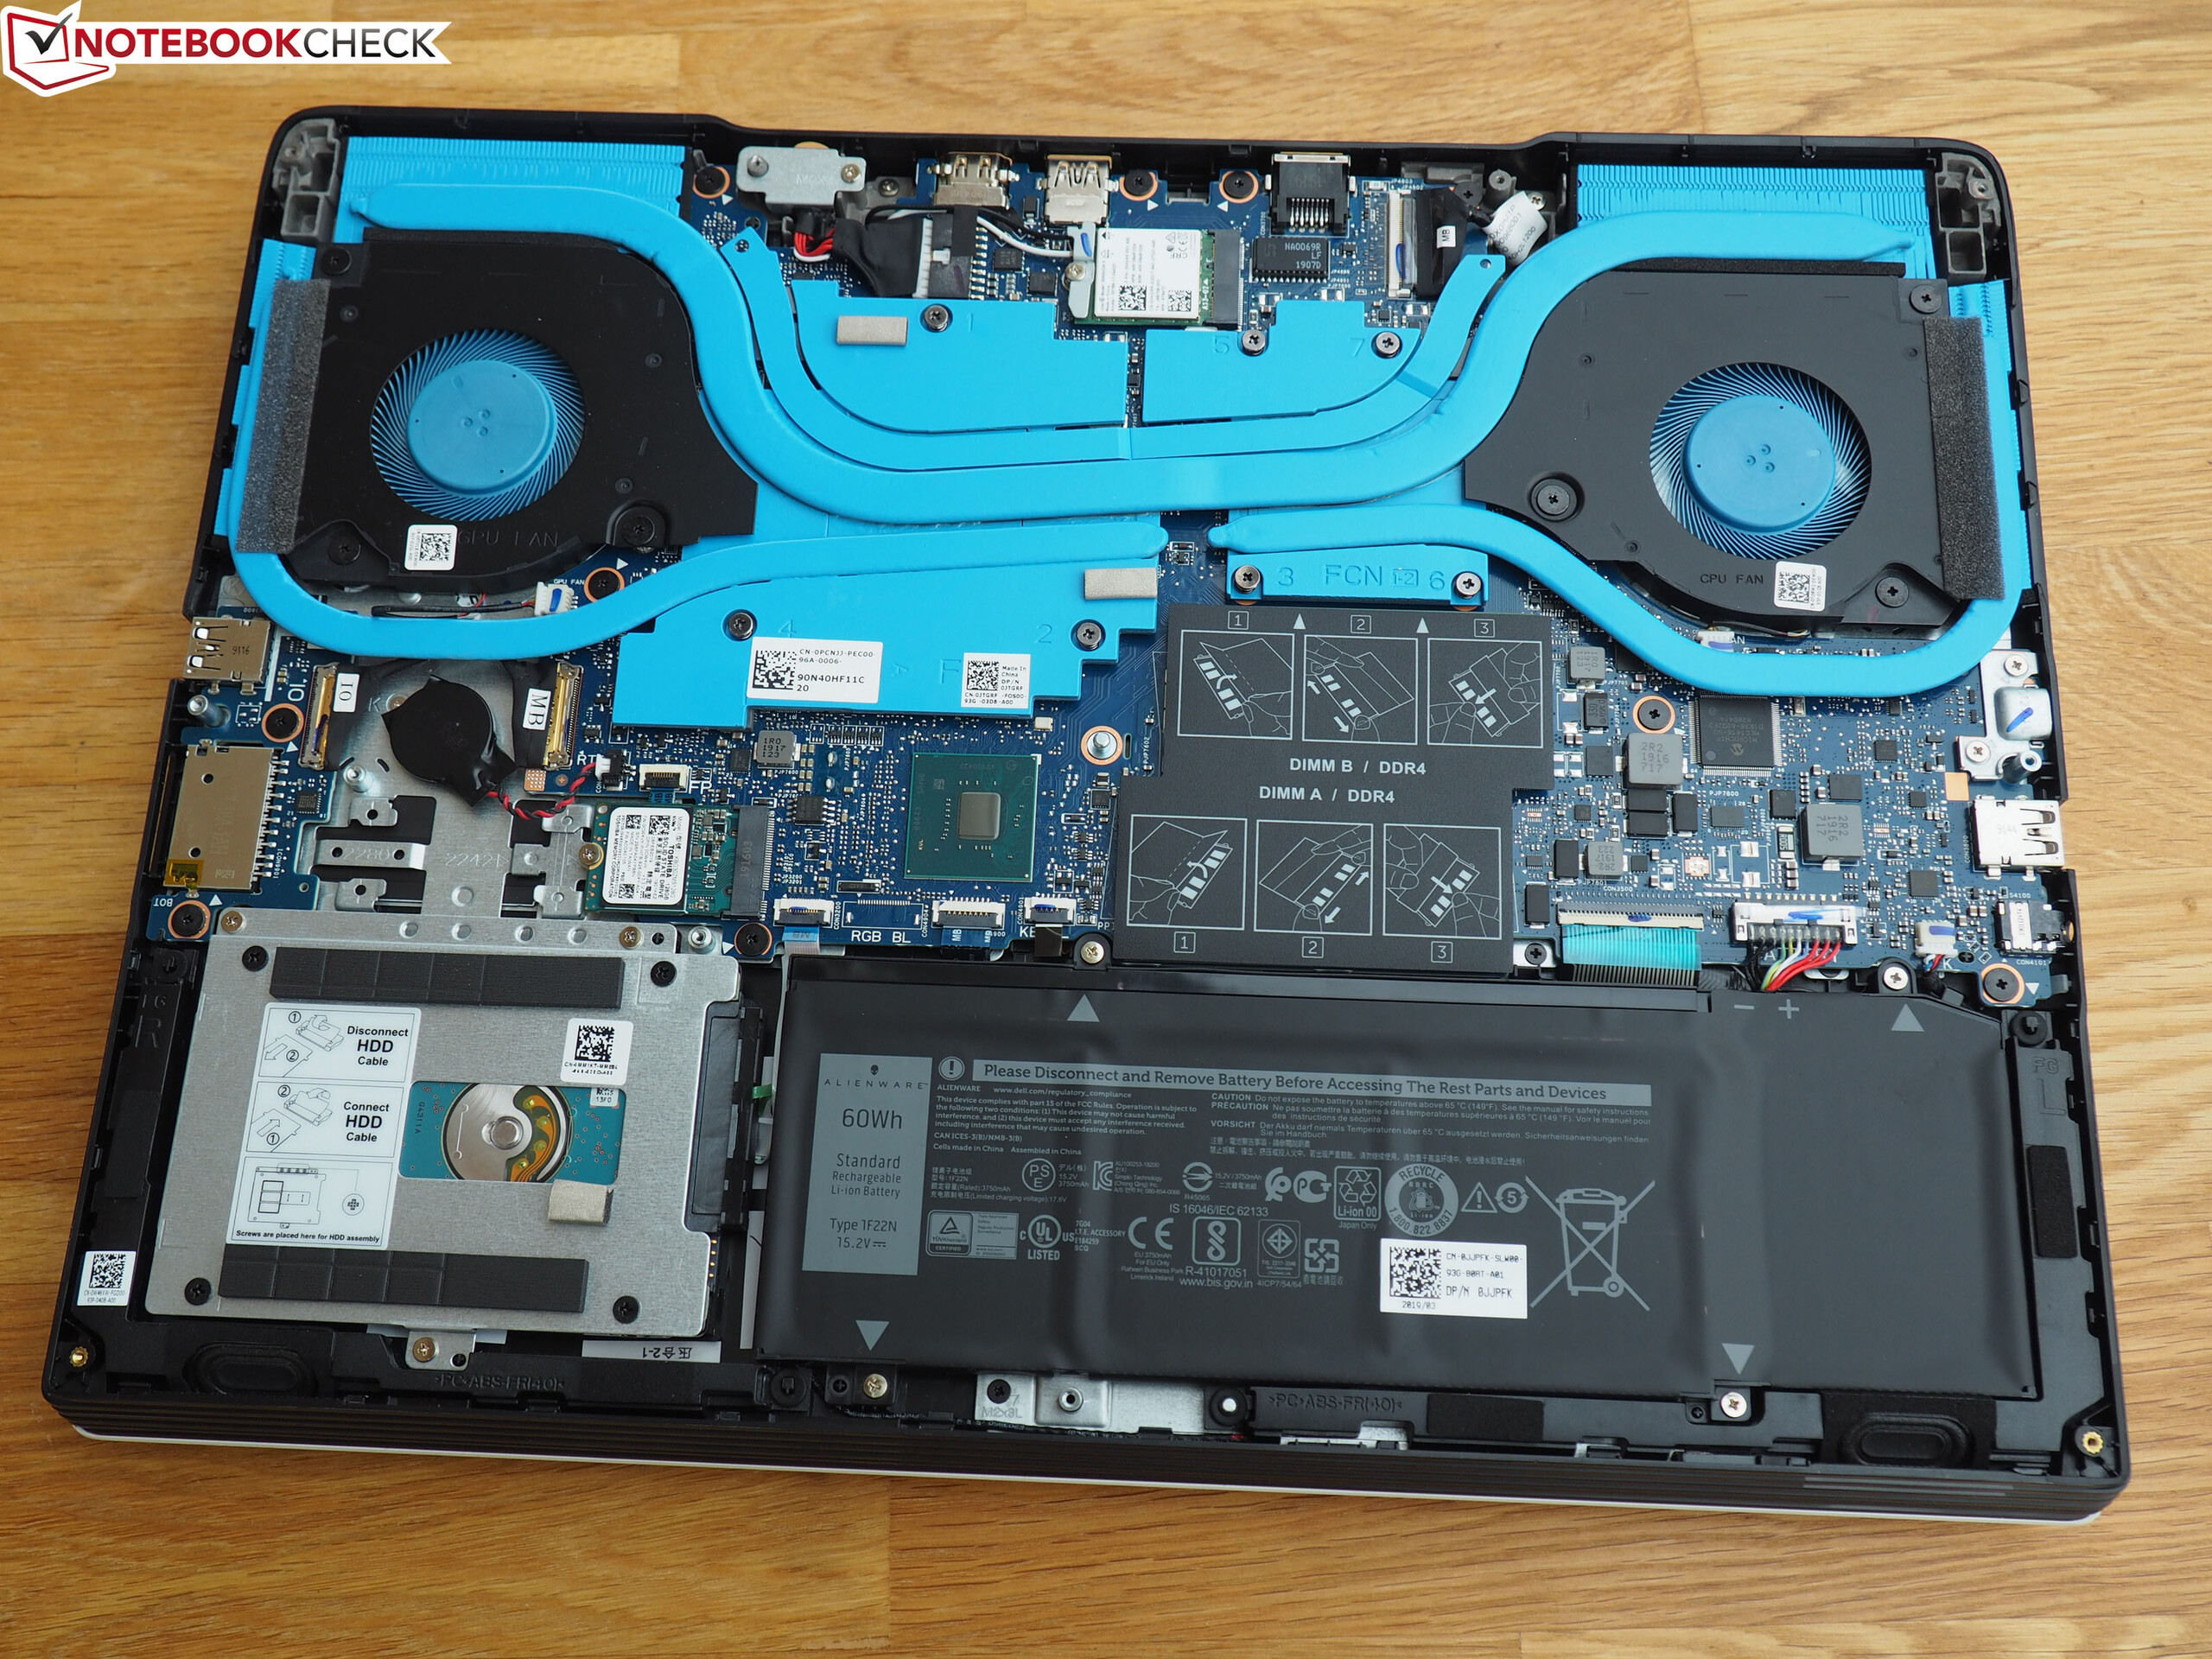
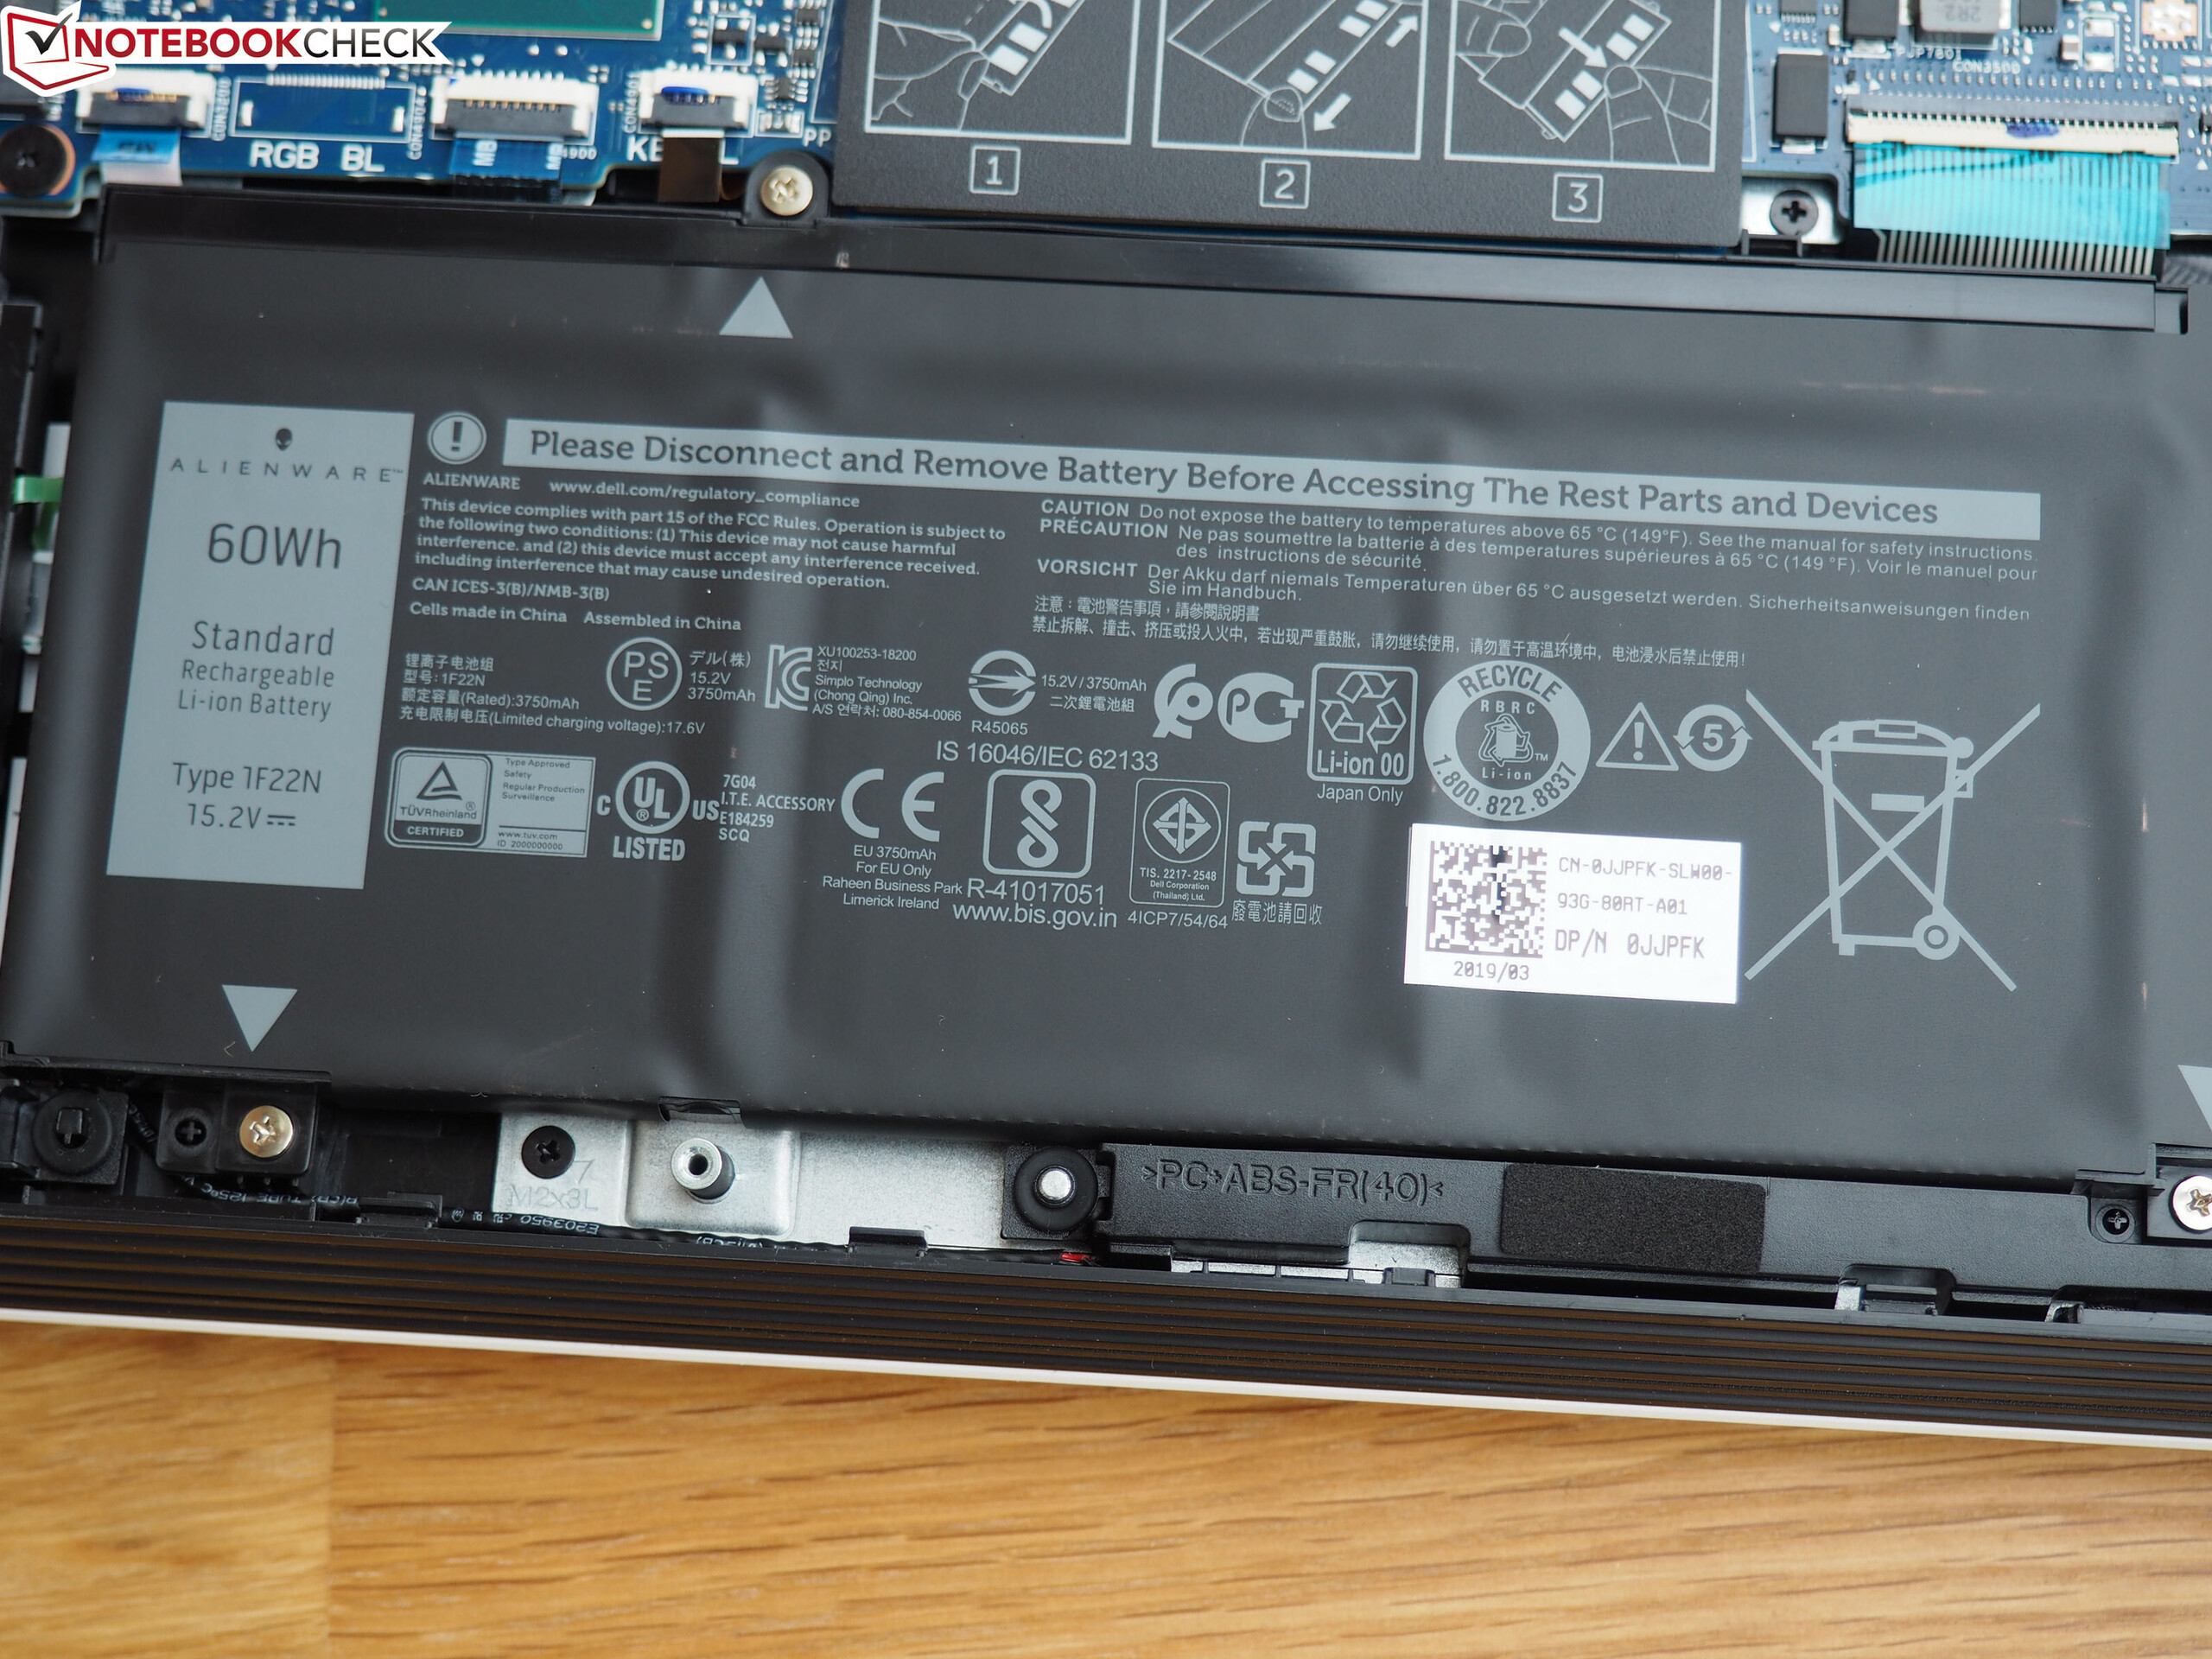
| Dell G5 15 5590-PCNJJ i5-9300H, GeForce GTX 1650 Mobile, 60 Wh | HP Omen 15-dc1020ng i5-9300H, GeForce GTX 1650 Mobile, 52.5 Wh | Acer Aspire Nitro 5 AN515-54-53Z2 i5-9300H, GeForce GTX 1650 Mobile, 57 Wh | HP Gaming Pavilion 15-dk0009ng i7-9750H, GeForce GTX 1660 Ti Max-Q, 52.5 Wh | Lenovo Legion Y540-15IRH-81SX00B2GE i7-9750H, GeForce GTX 1660 Ti Mobile, 57 Wh | Genomsnitt av klass Gaming | |
|---|---|---|---|---|---|---|
| Batteridrifttid | -18% | -4% | -40% | -61% | -29% | |
| Reader / Idle (h) | 14.5 | 15.9 10% | 17.4 20% | 8.7 -40% | 4 -72% | 8.27 ? -43% |
| WiFi v1.3 (h) | 8 | 6.4 -20% | 8.1 1% | 4.8 -40% | 2.4 -70% | 7.11 ? -11% |
| Load (h) | 2.2 | 1.2 -45% | 1.5 -32% | 1.3 -41% | 1.3 -41% | 1.502 ? -32% |
| H.264 (h) | 8 | 5.3 | 8.32 ? | |||
| Witcher 3 ultra (h) | 1 | 1 |
För
Emot
Läs den fullständiga versionen av den här recensionen på engelska här.
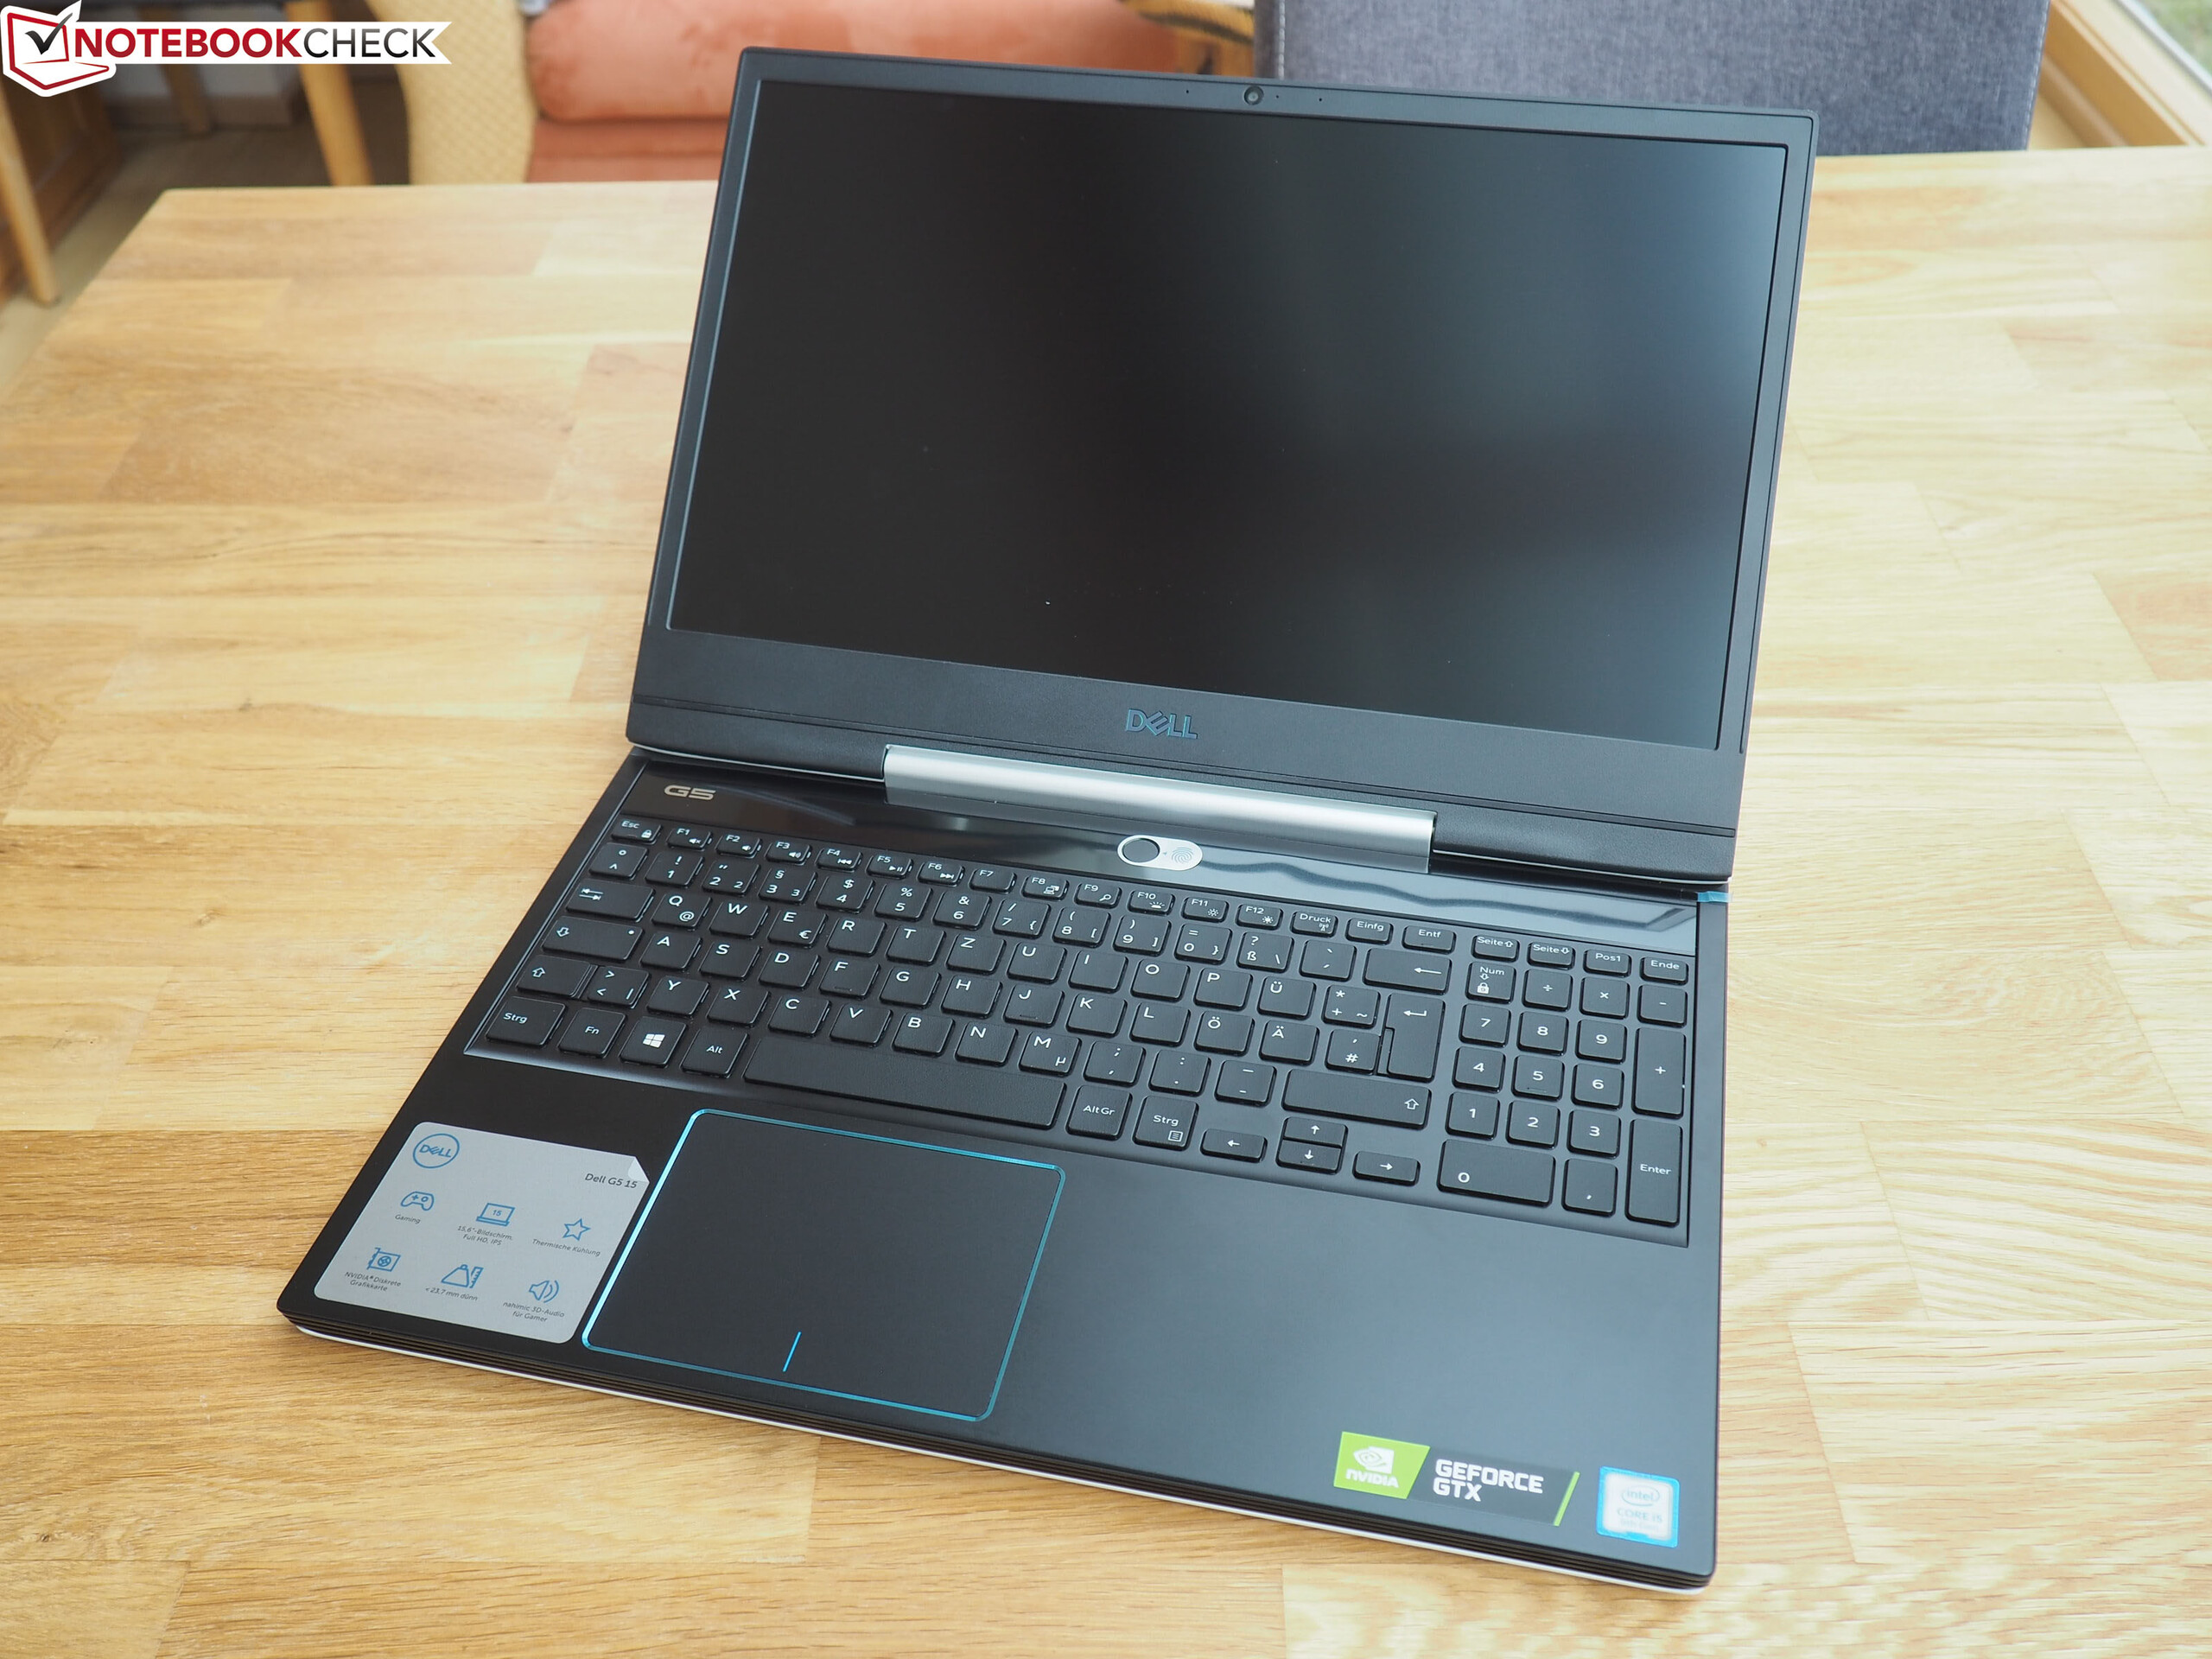
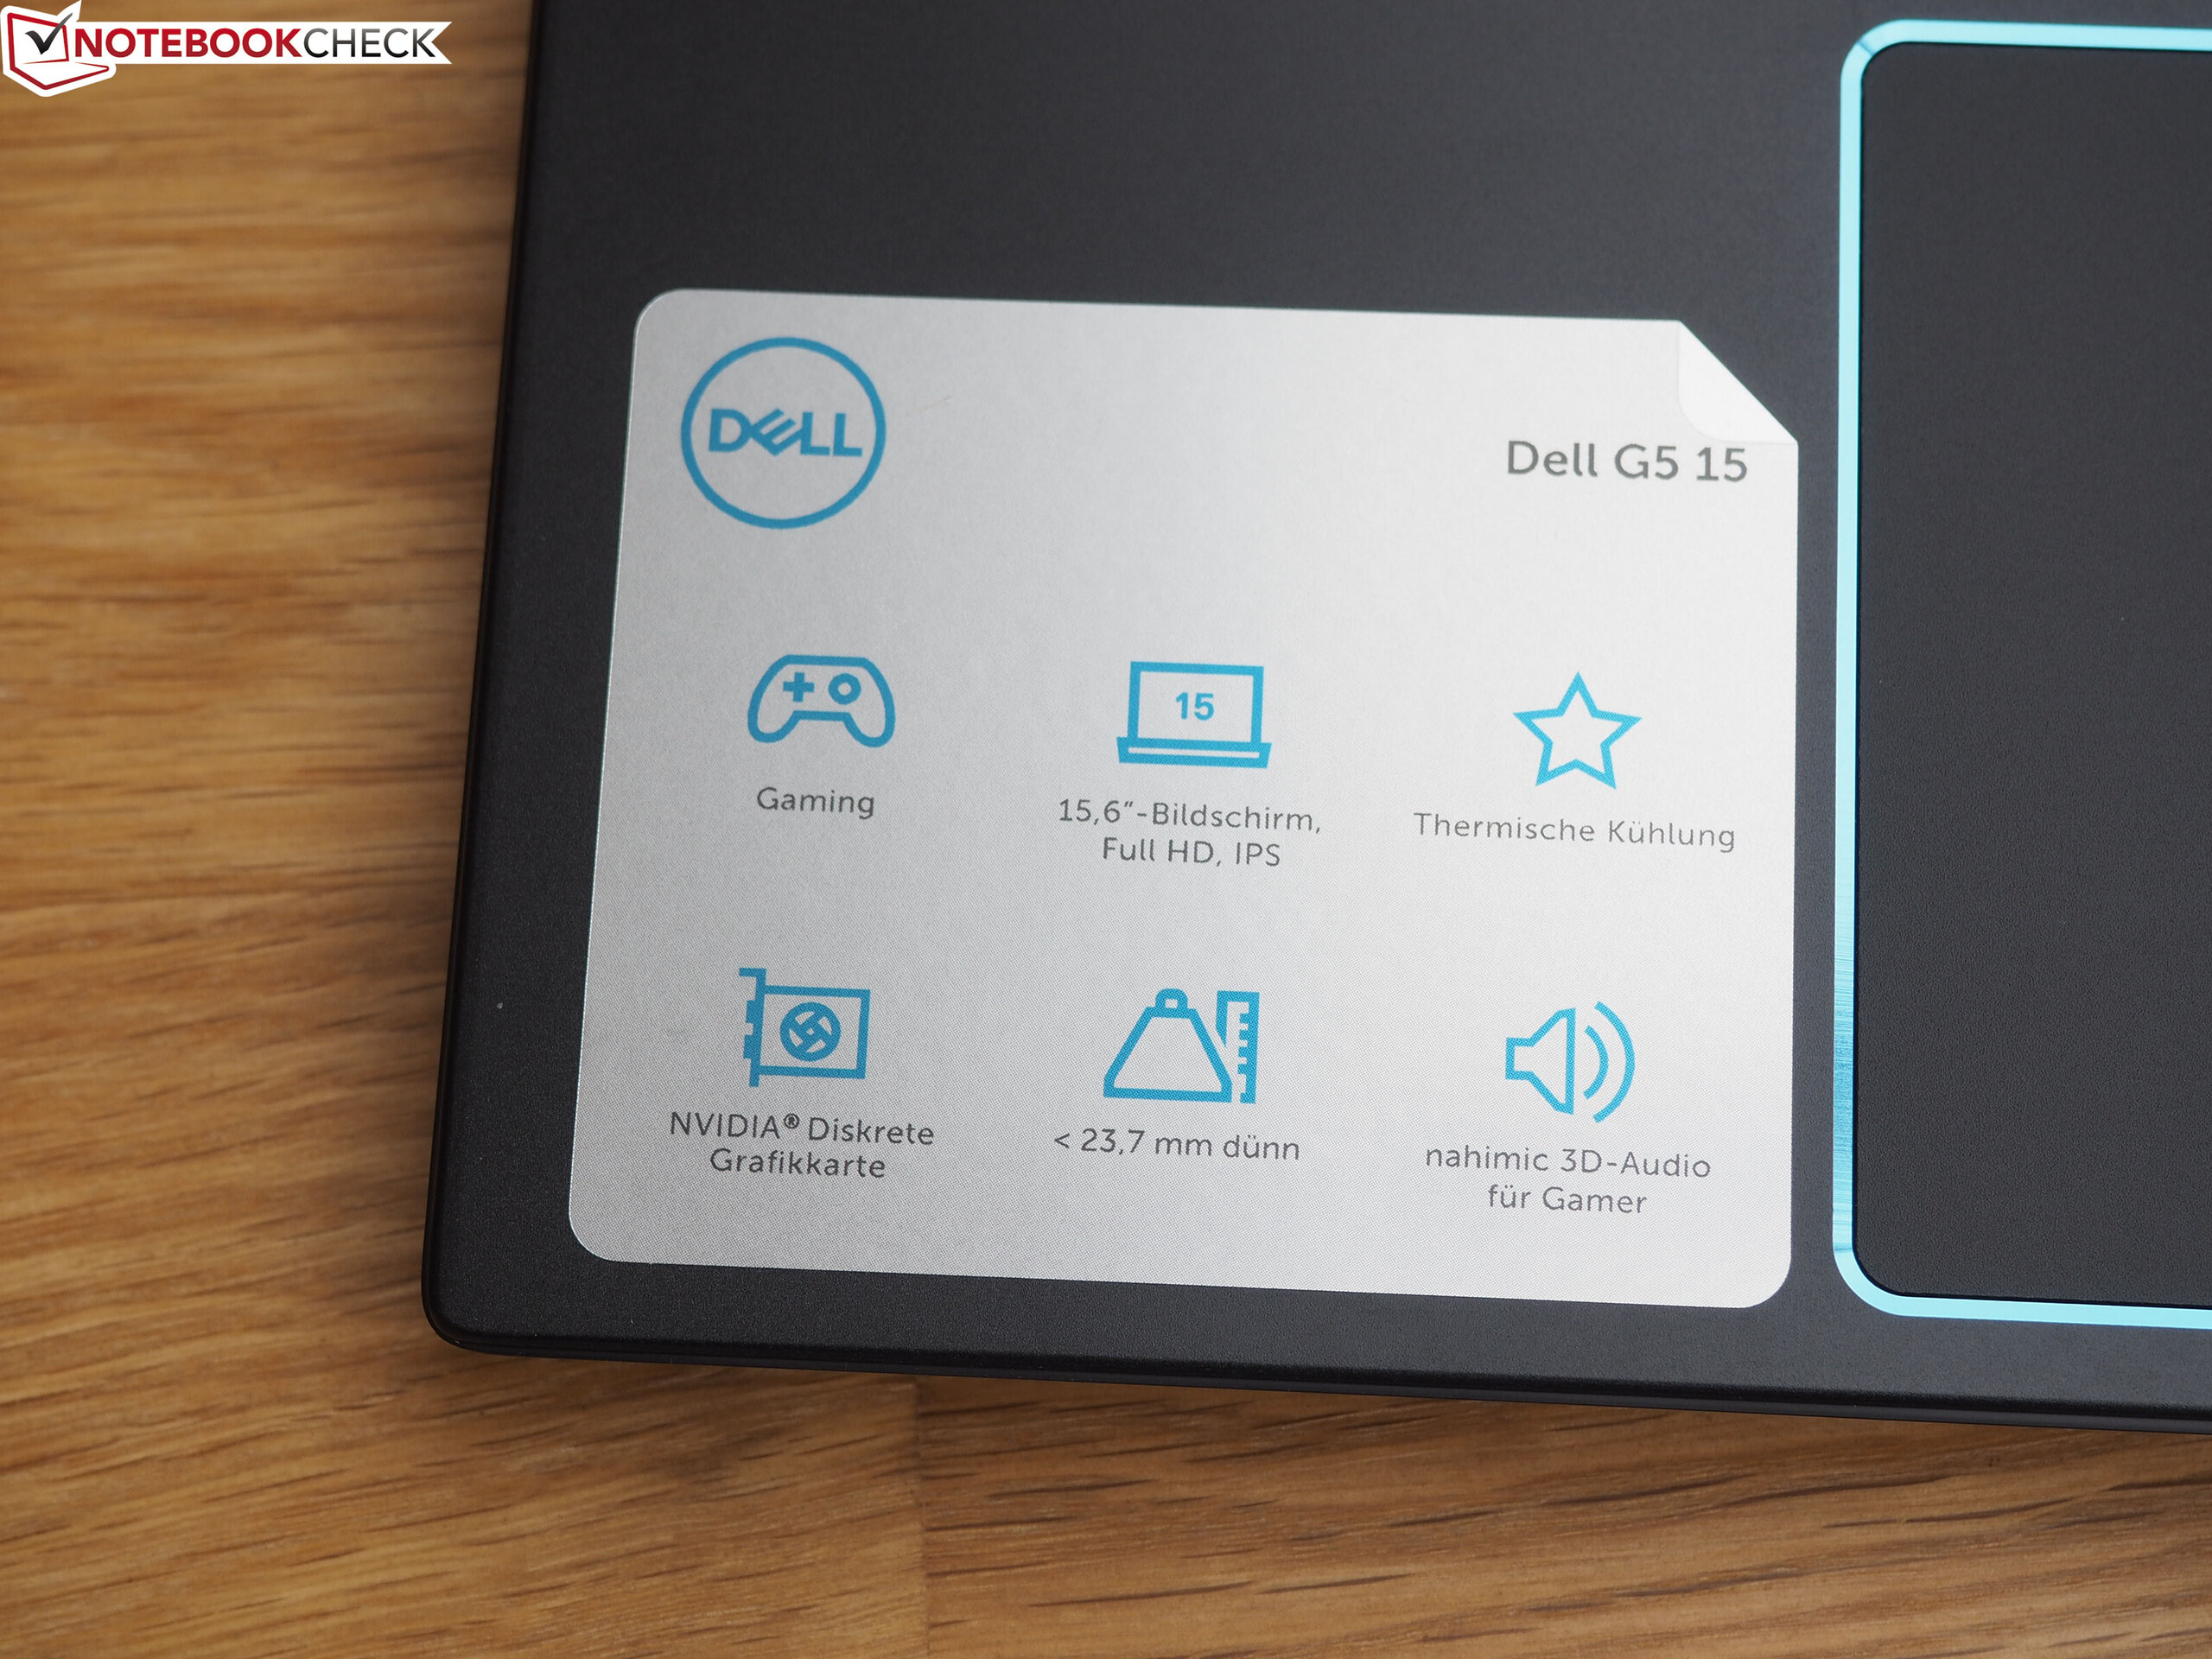
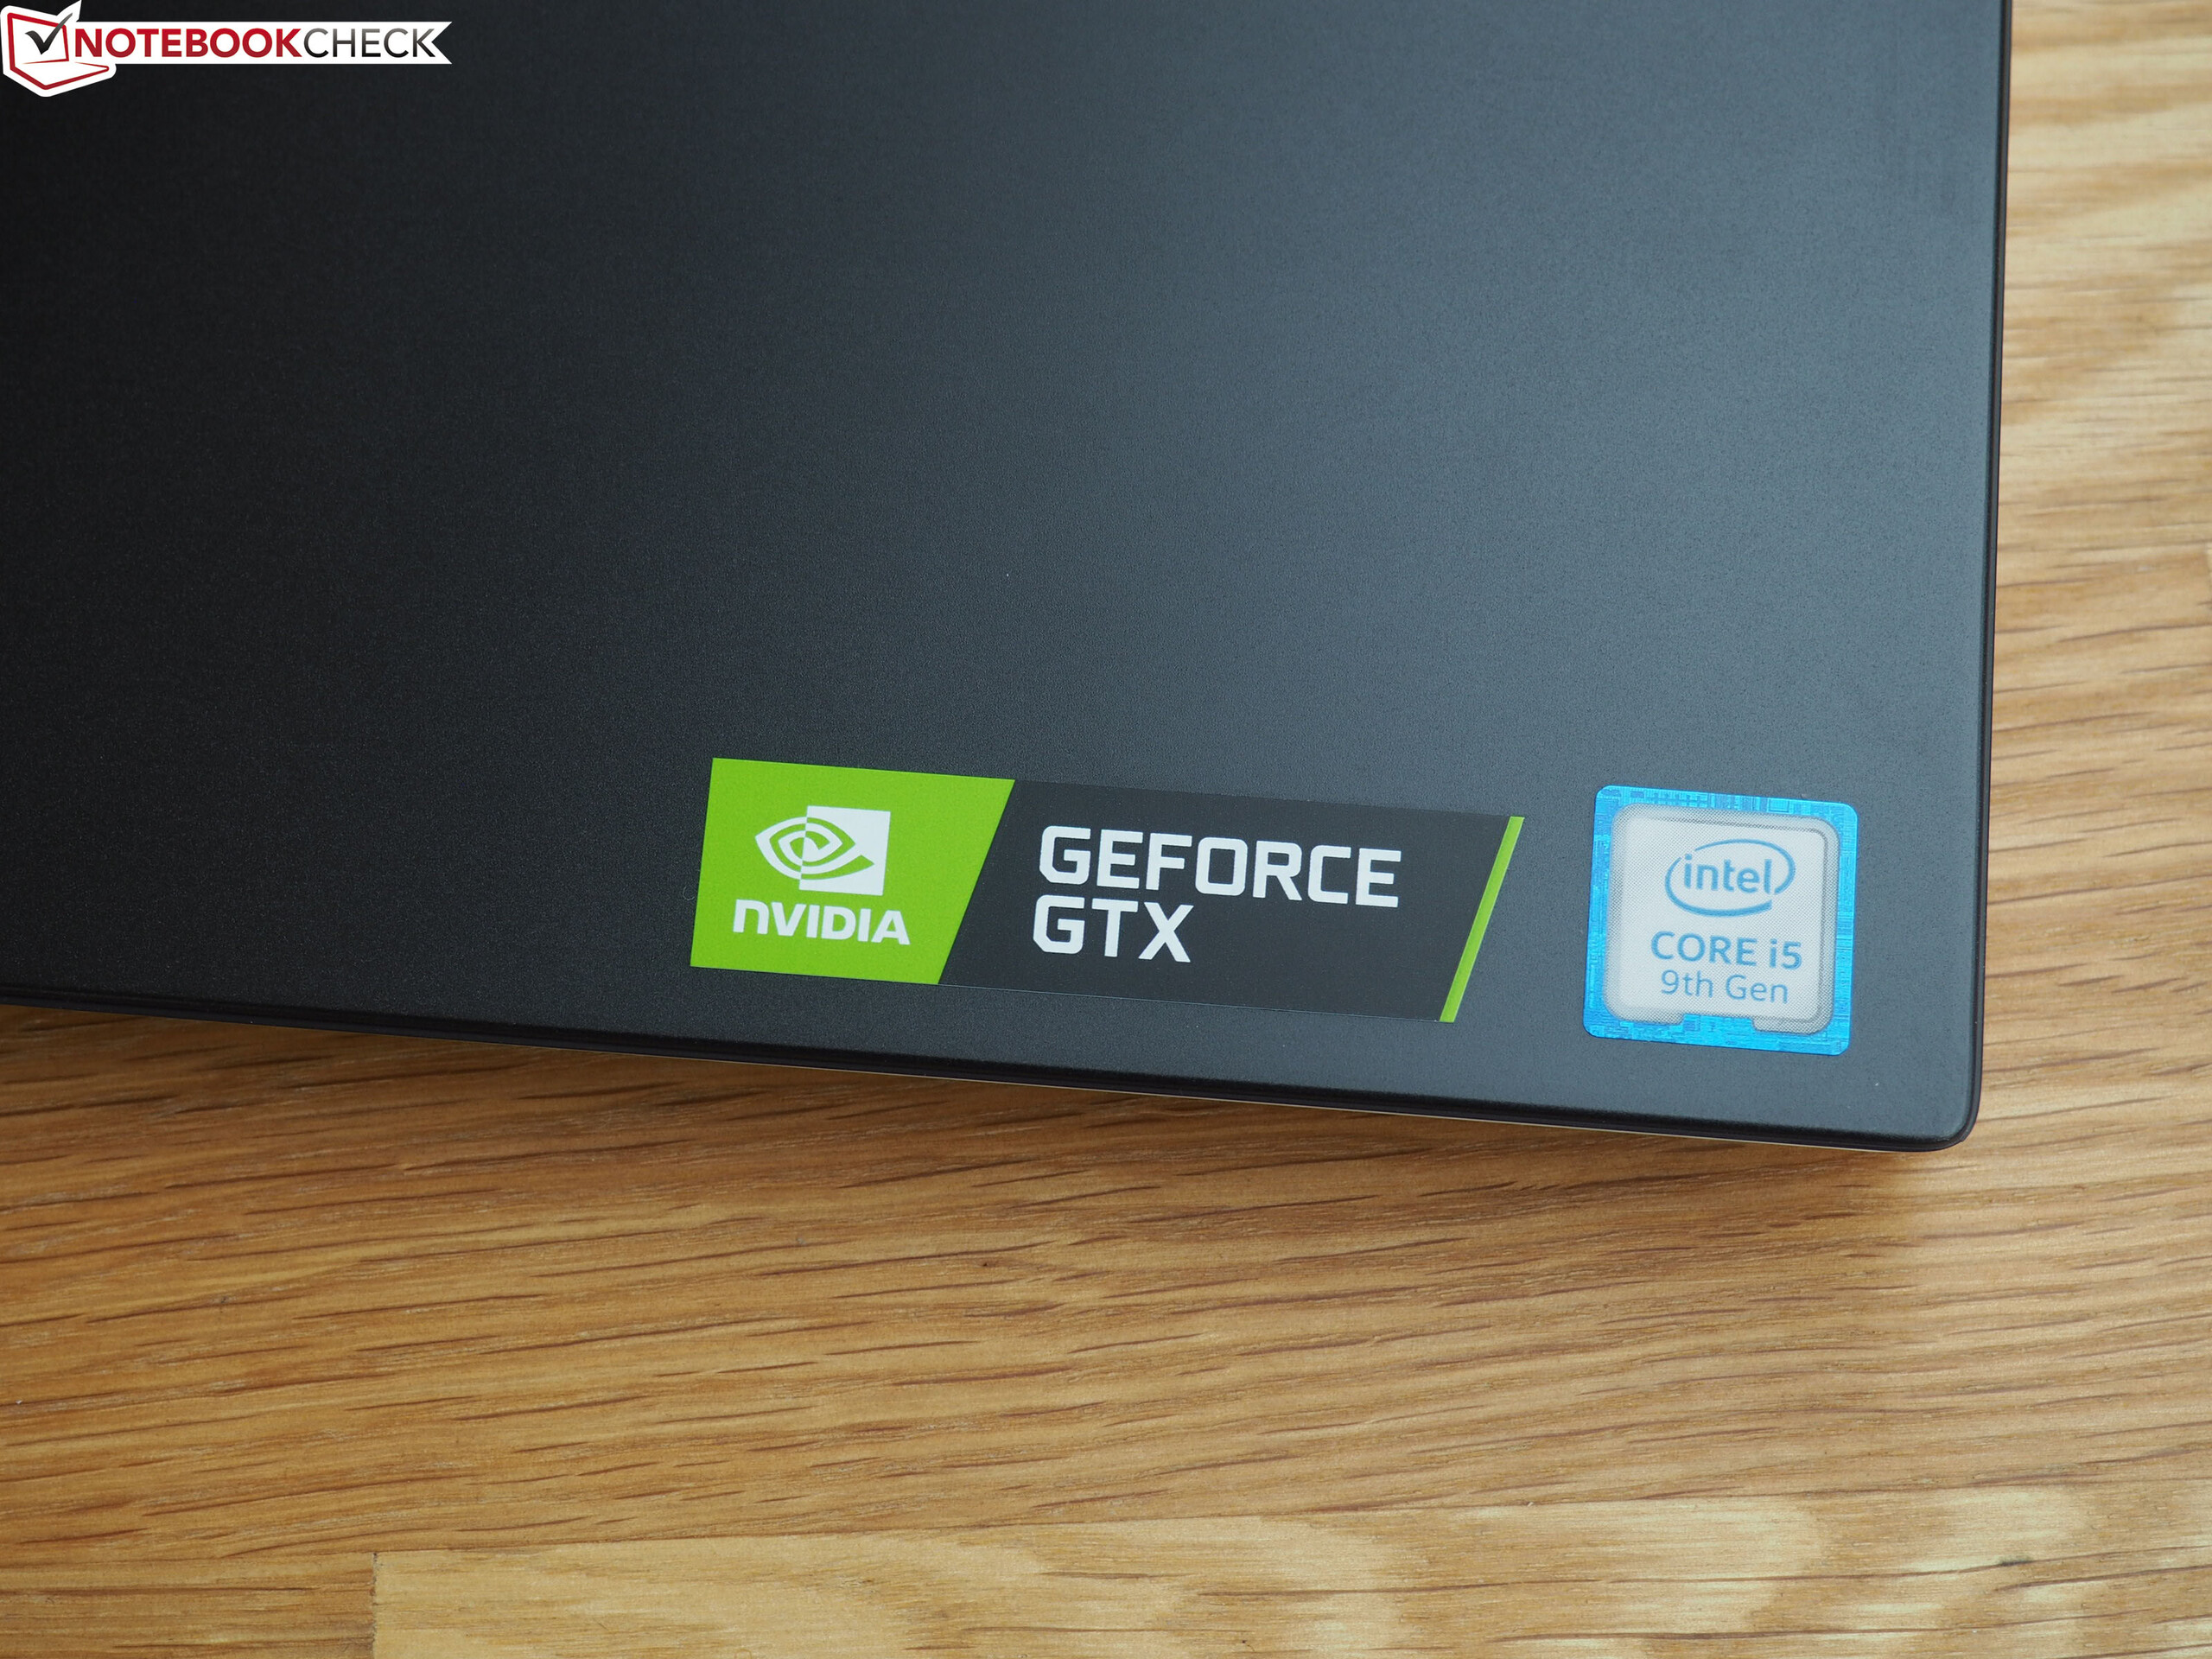
På papperet ser Dell G5 5590-PCNJJ utmärkt ut. För 10.000 kronor får man en smidig och spelförberedd 15-tumslaptop med en fyrkärnig CPU och en DirectX 12 GPU från den senaste hårdvarugenerationen.
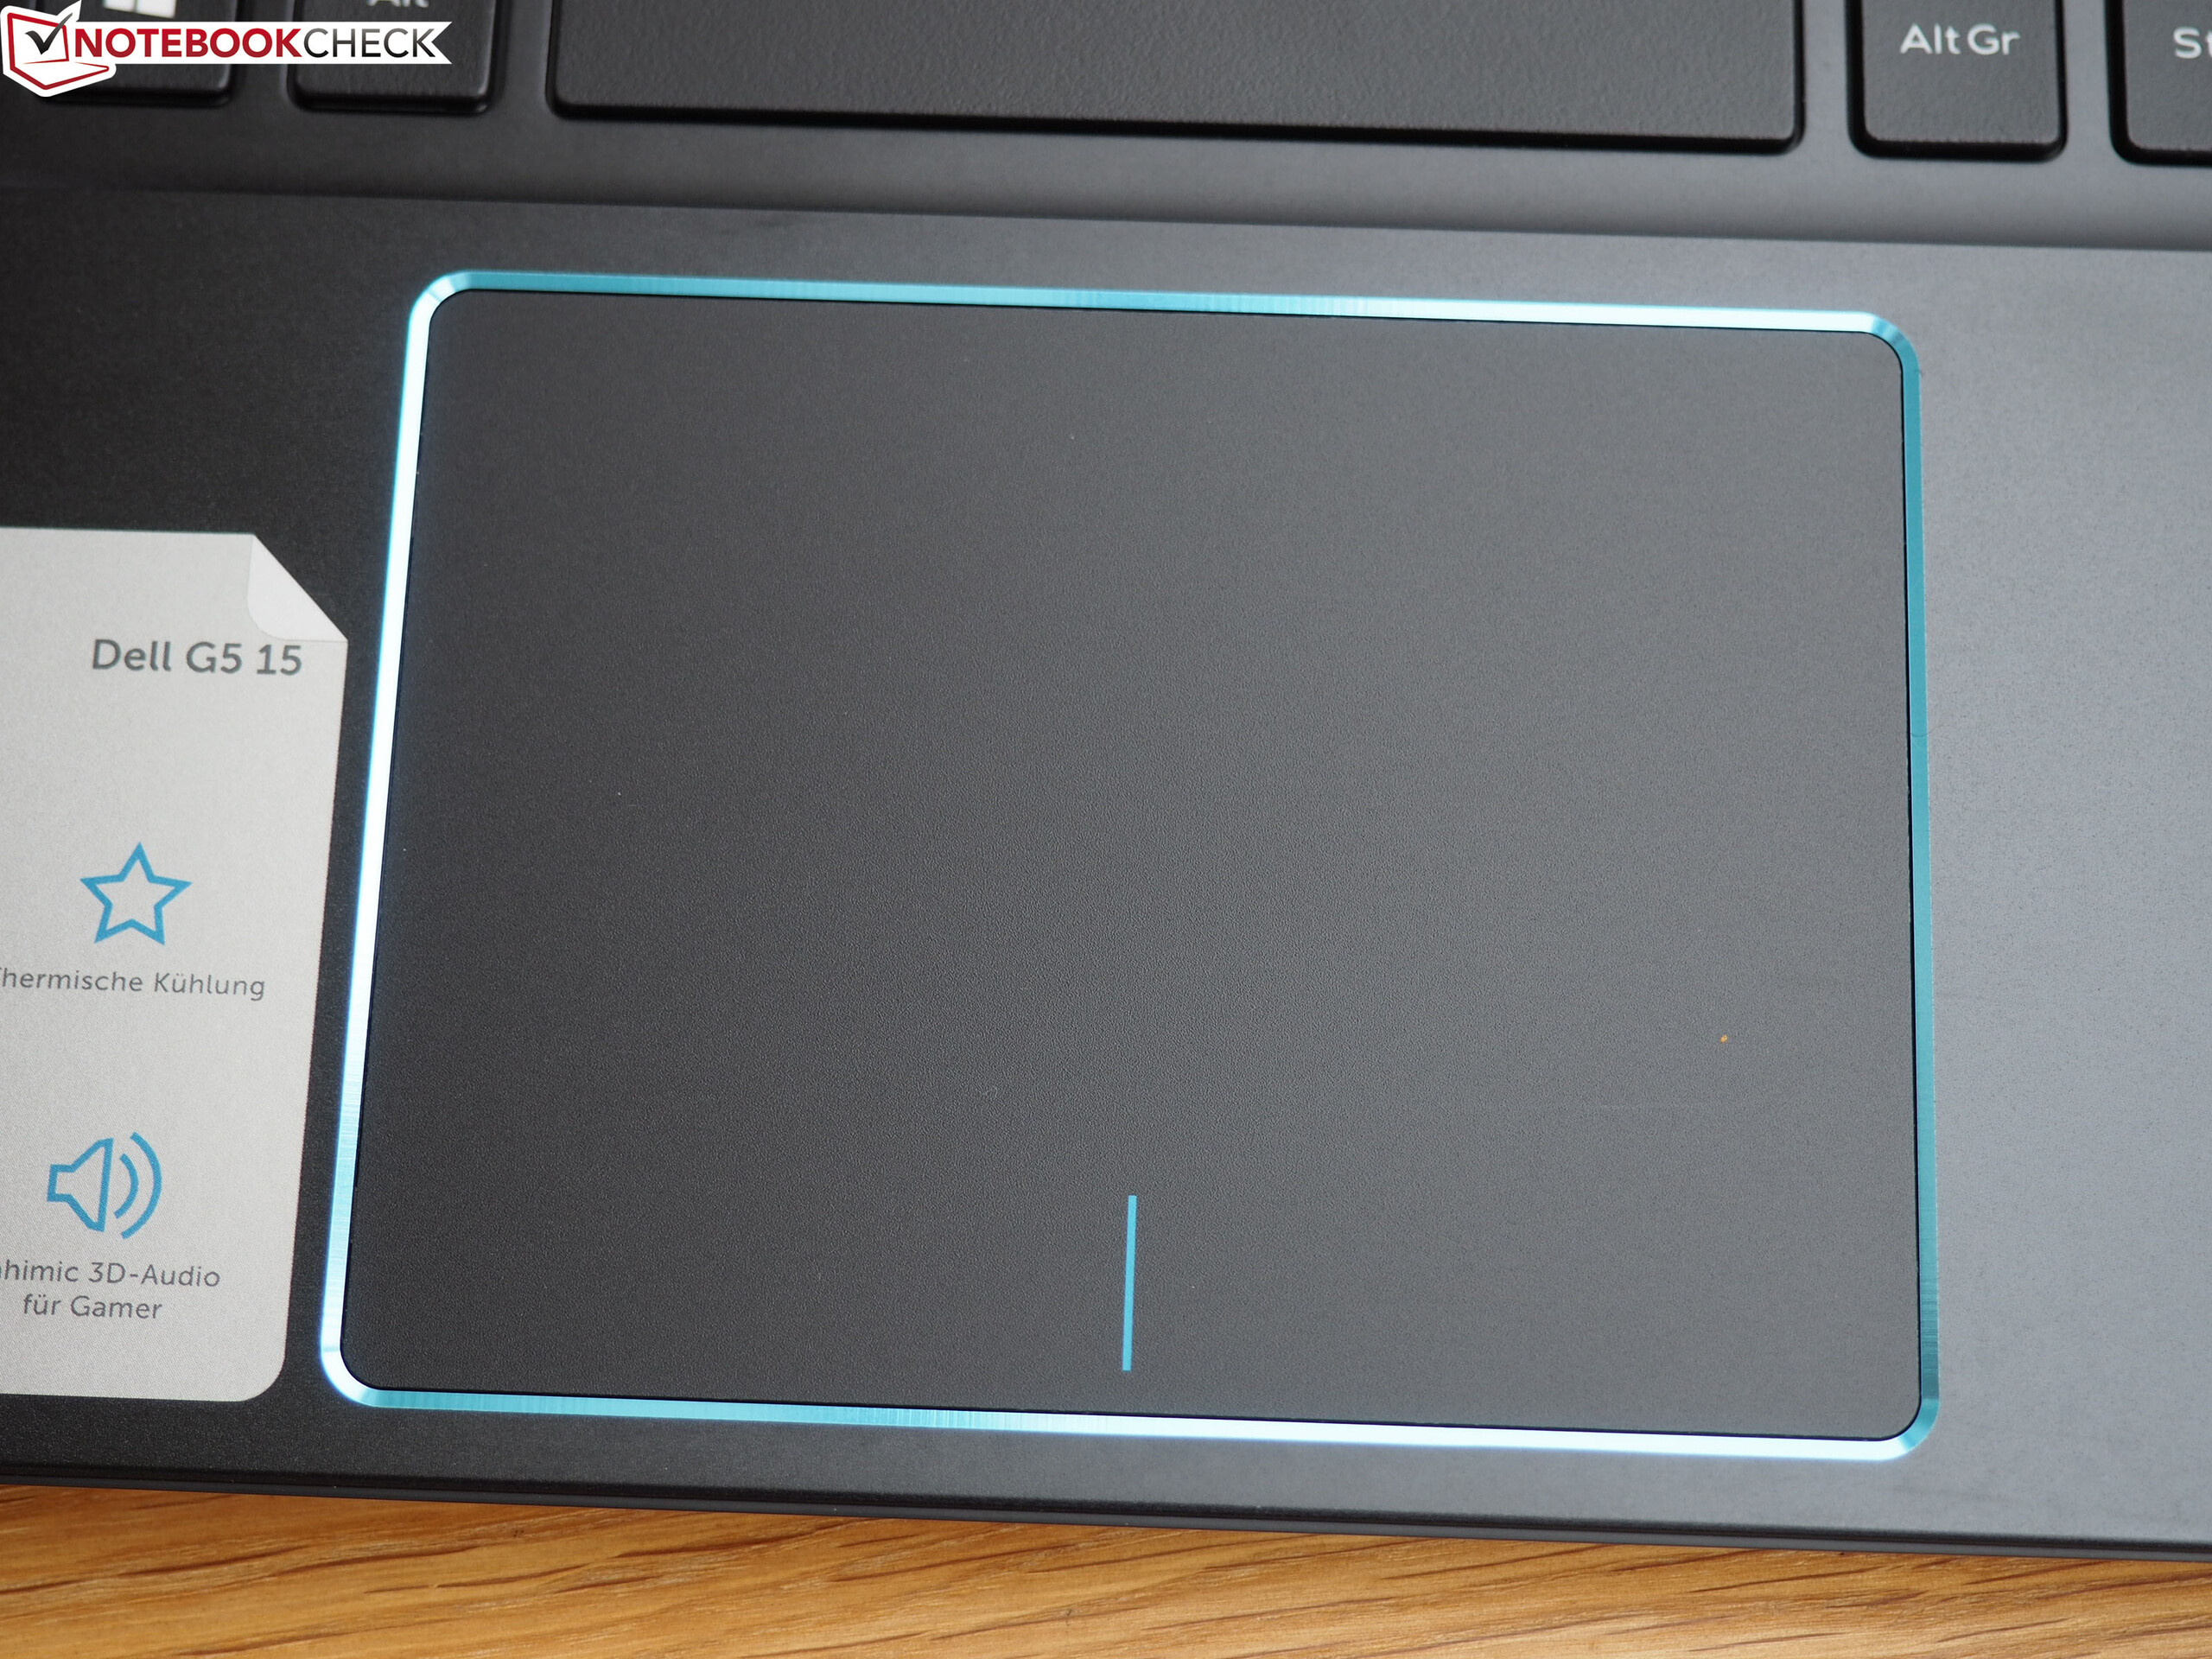
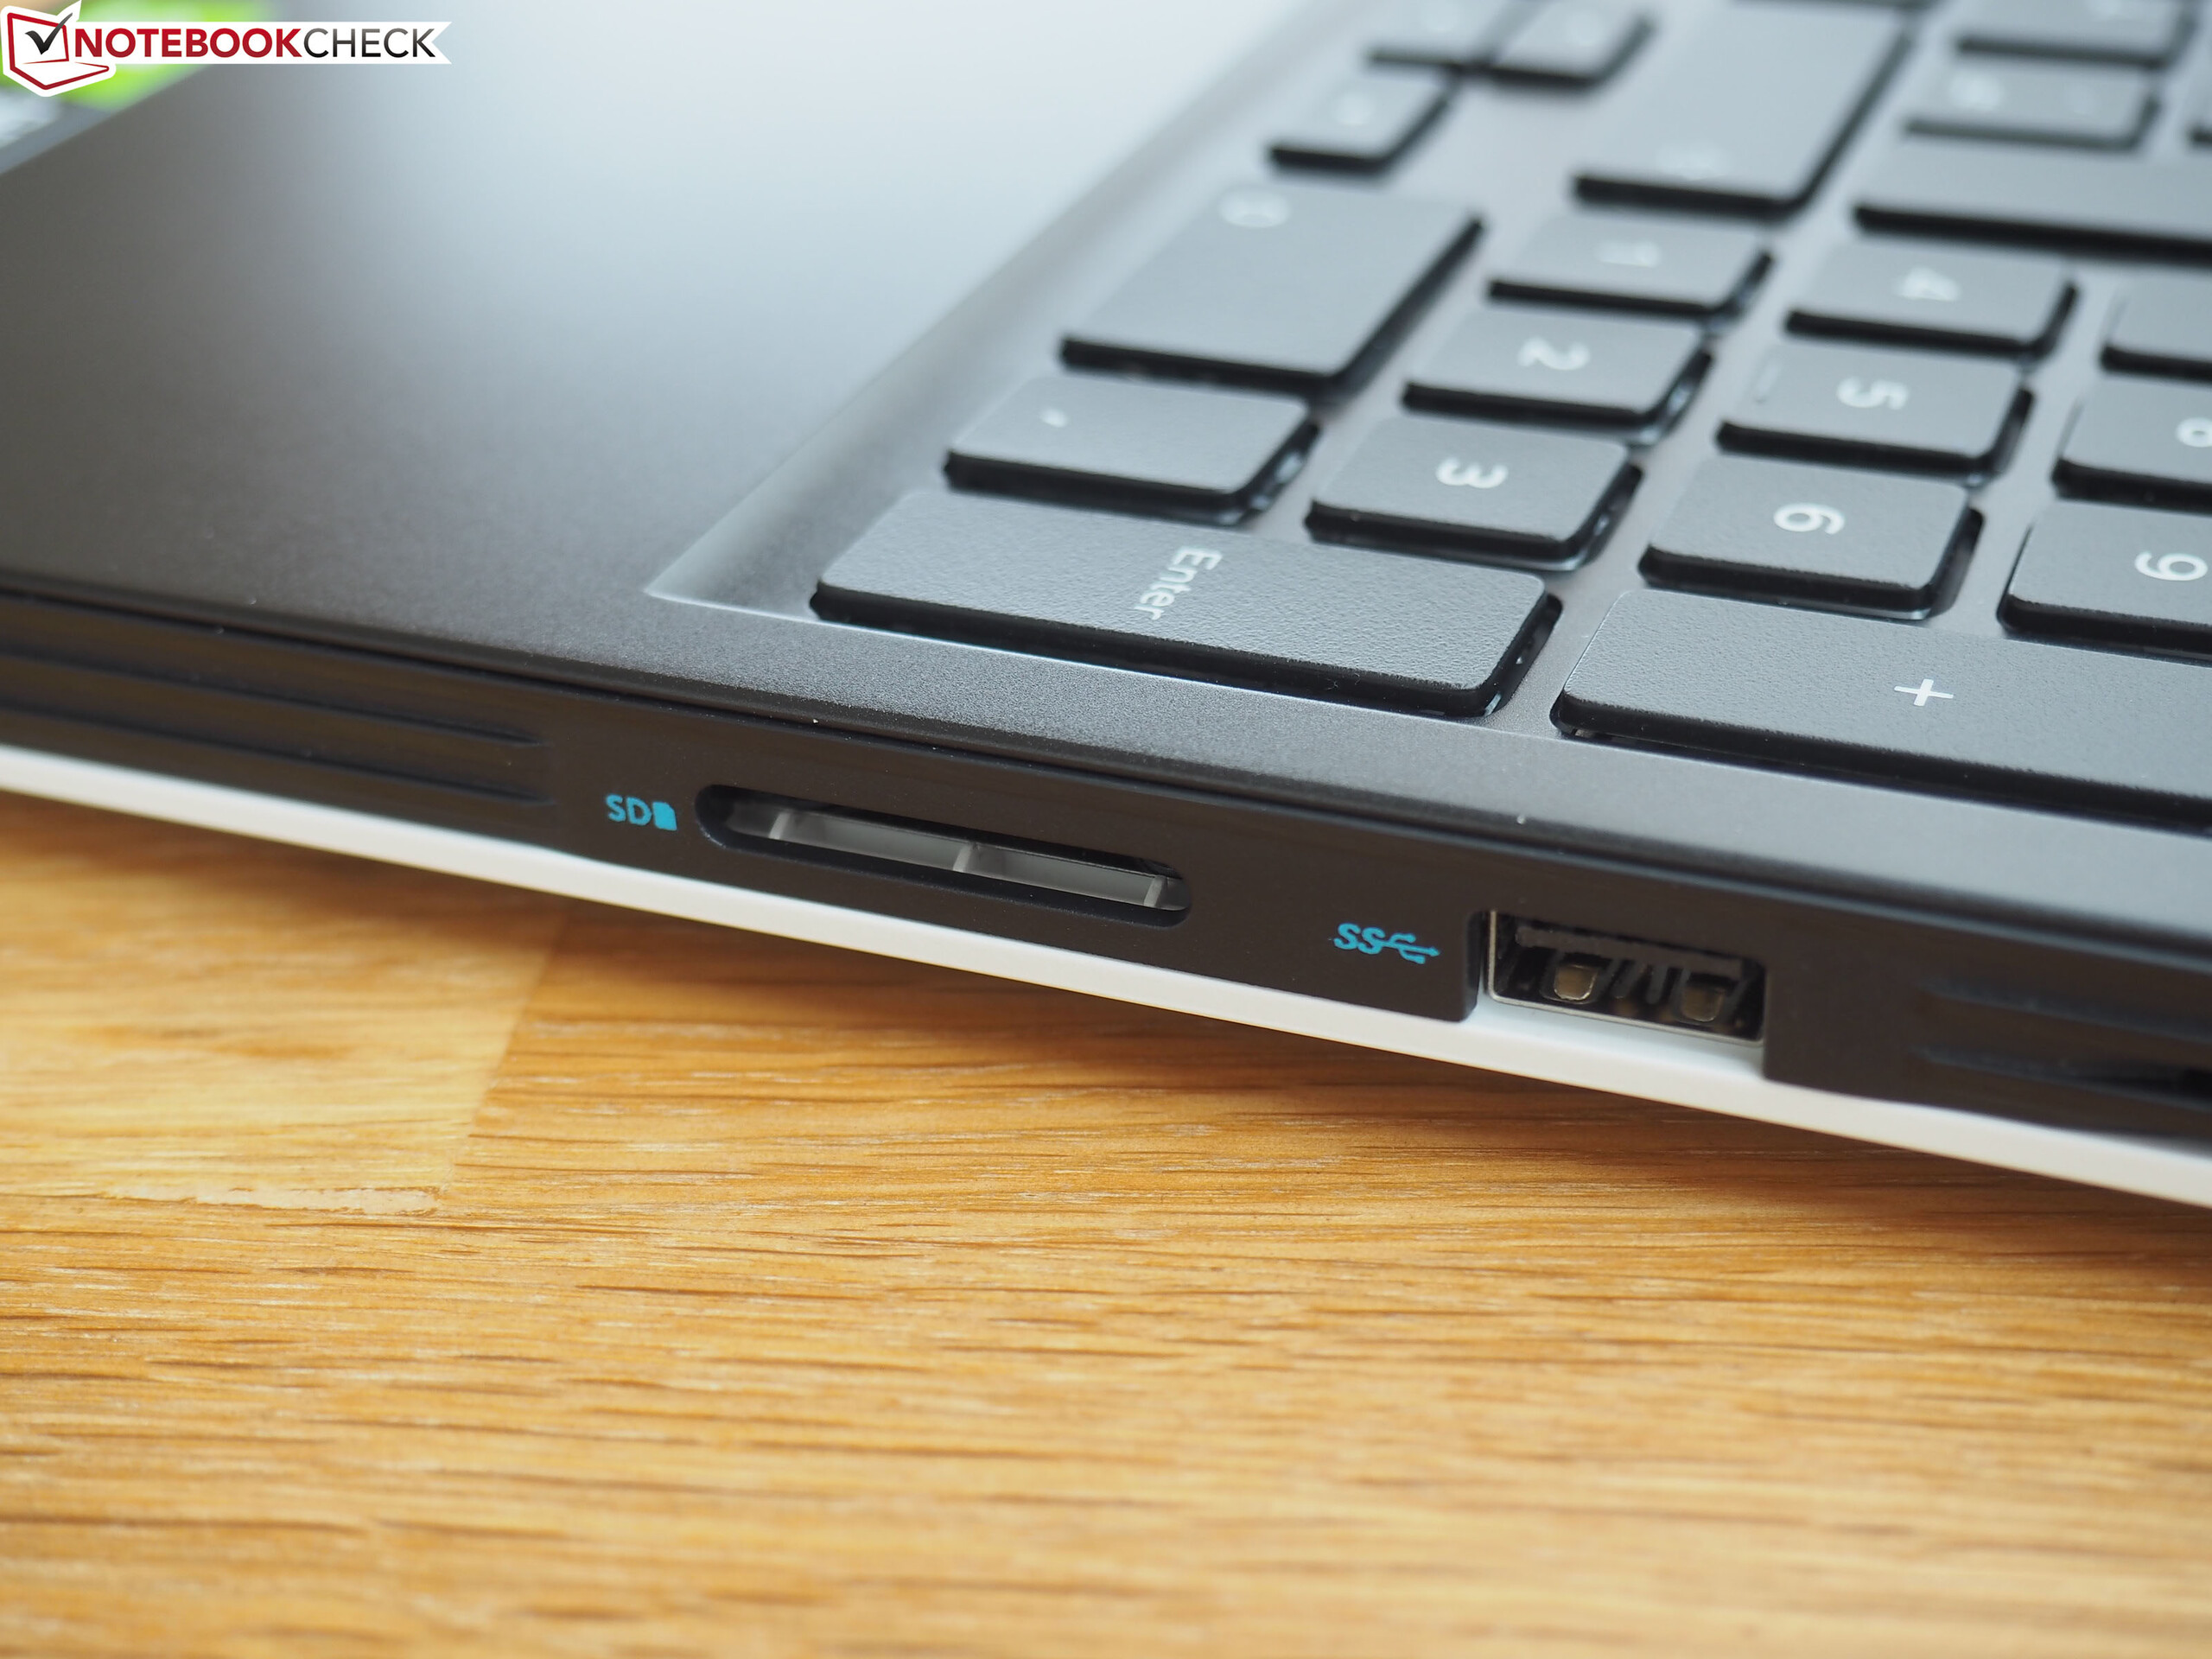
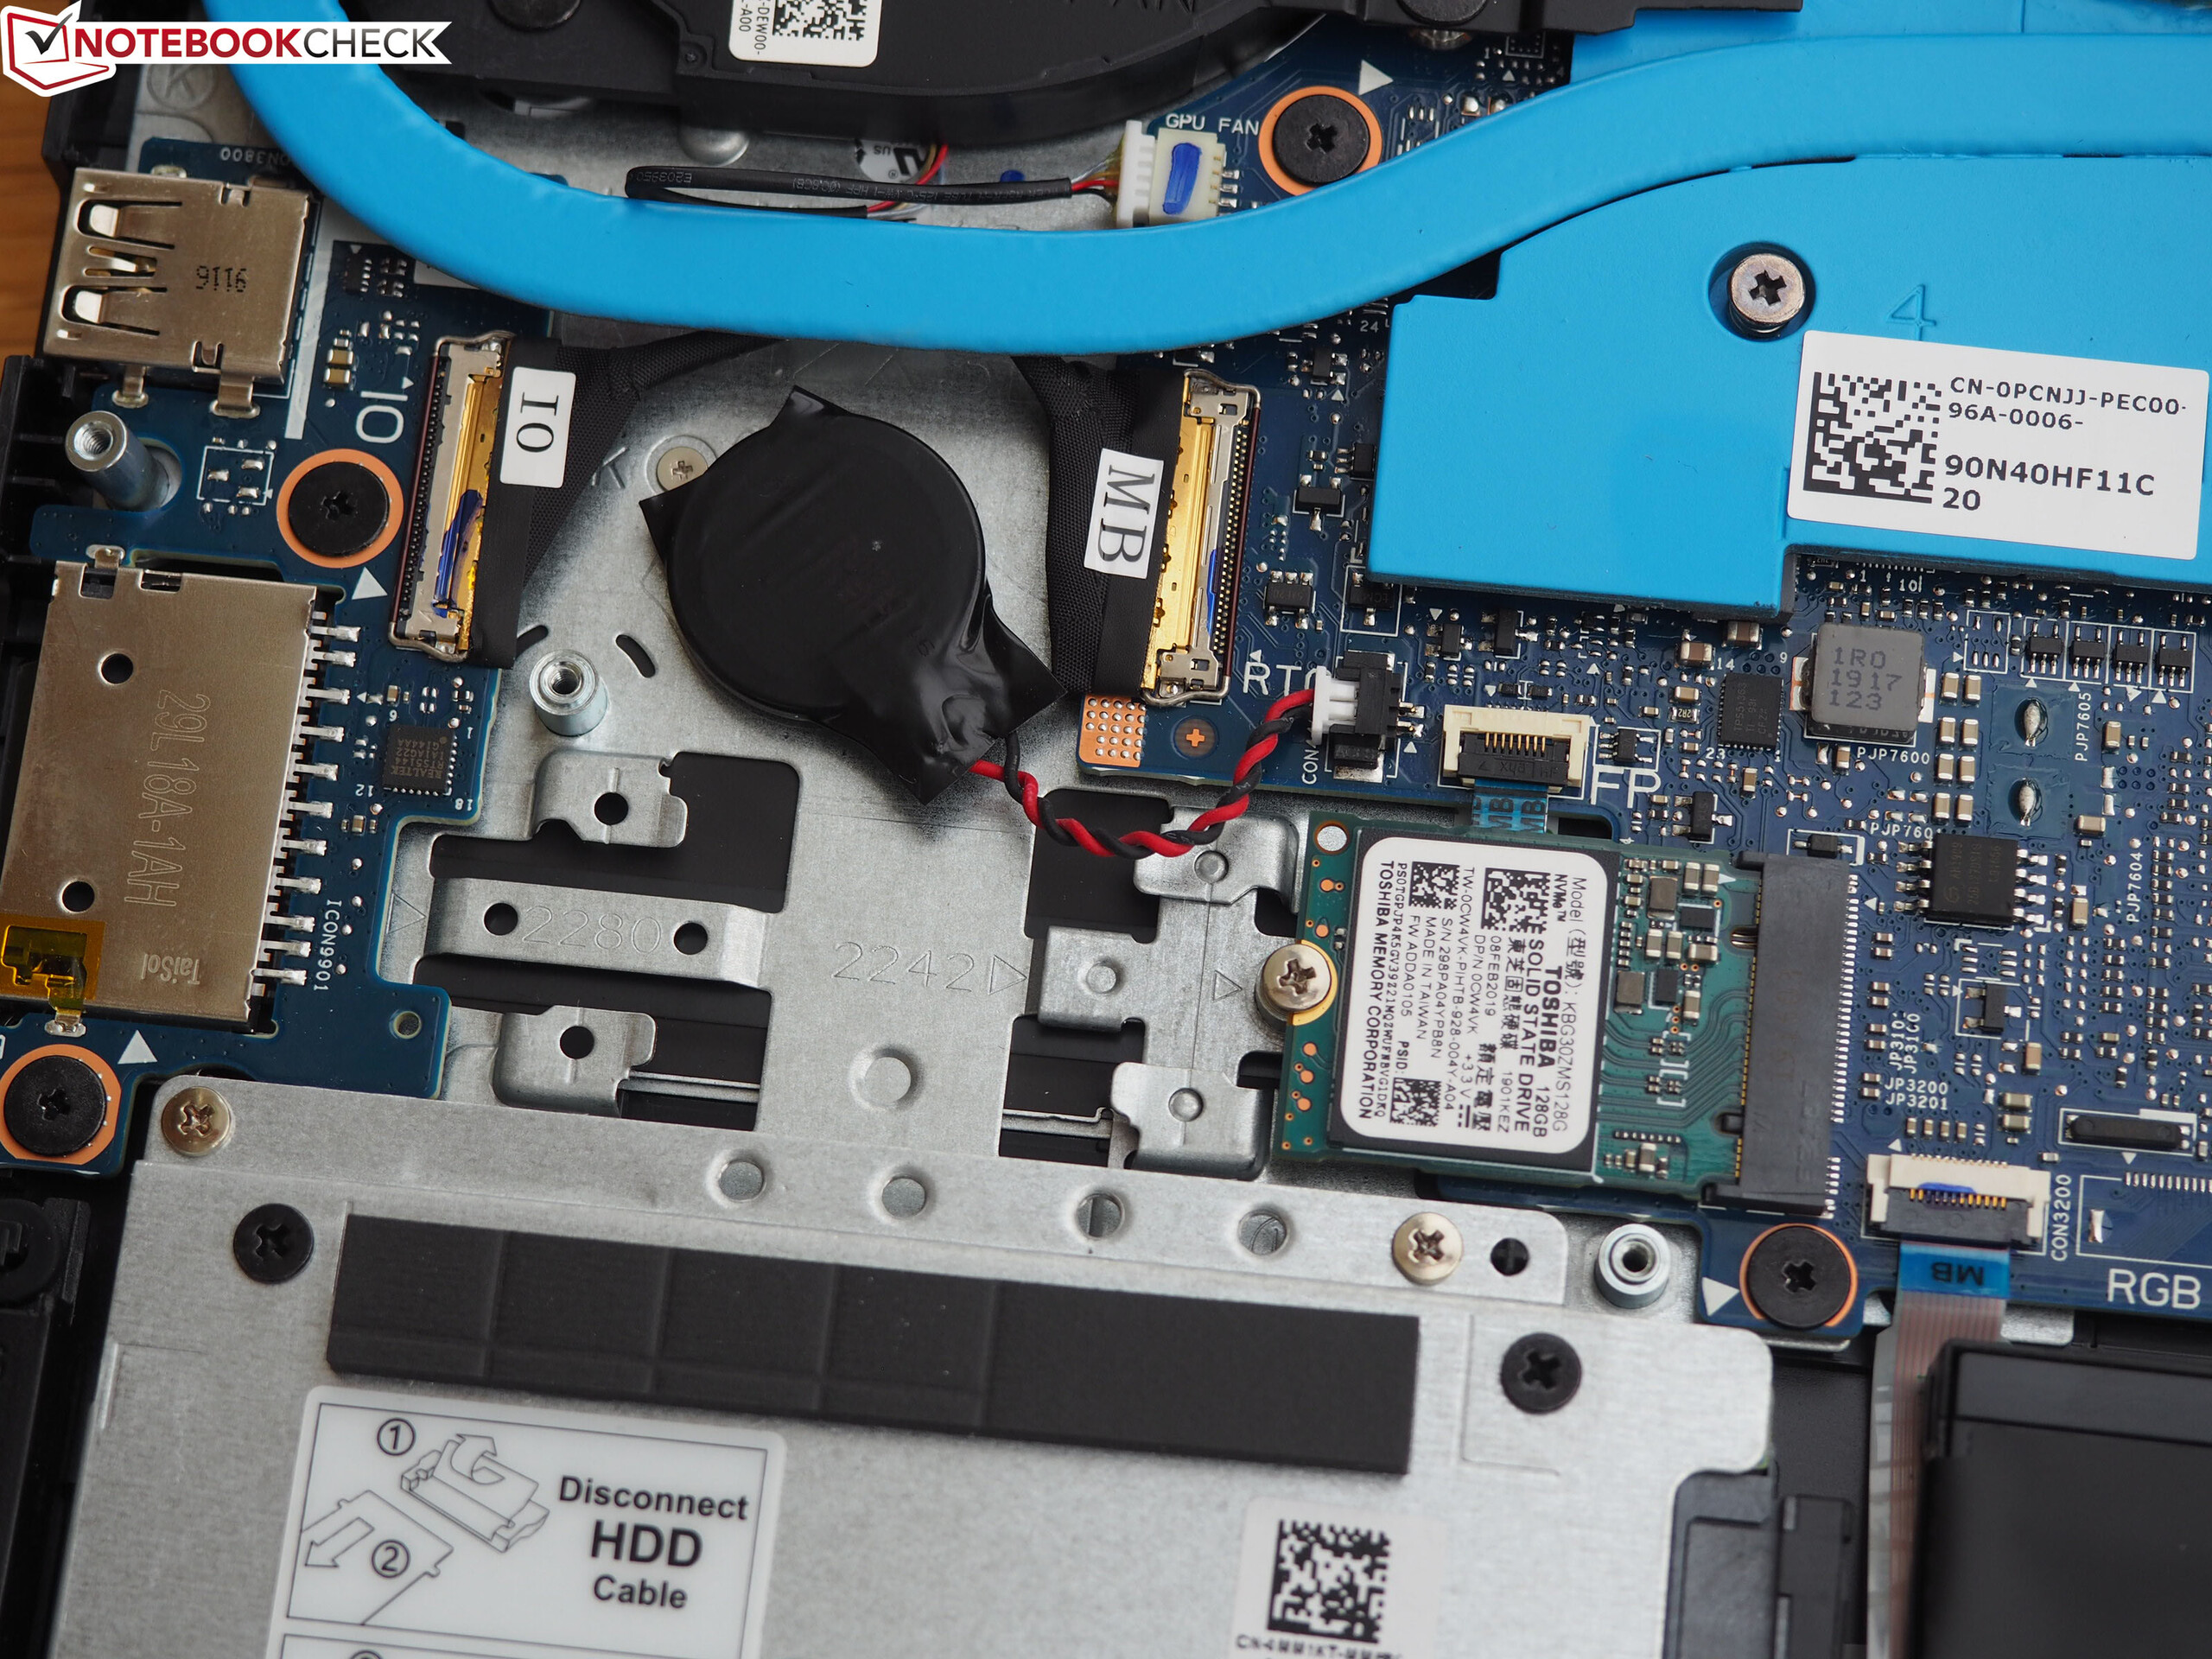
Tyvärr lider enheten av en del brister som fläckar ner det i övrigt goda intrycket. För att kunna hålla priset och tillverkningskostnaderna låga har Dell skärt ner på en del saker. Som ett resultat får man leva med en långsam kortläsare, ett knarrande chassi, en mörk skärm med dålig färgåtergivning och en SSD-enhet med långsamma skrivhastigheter.
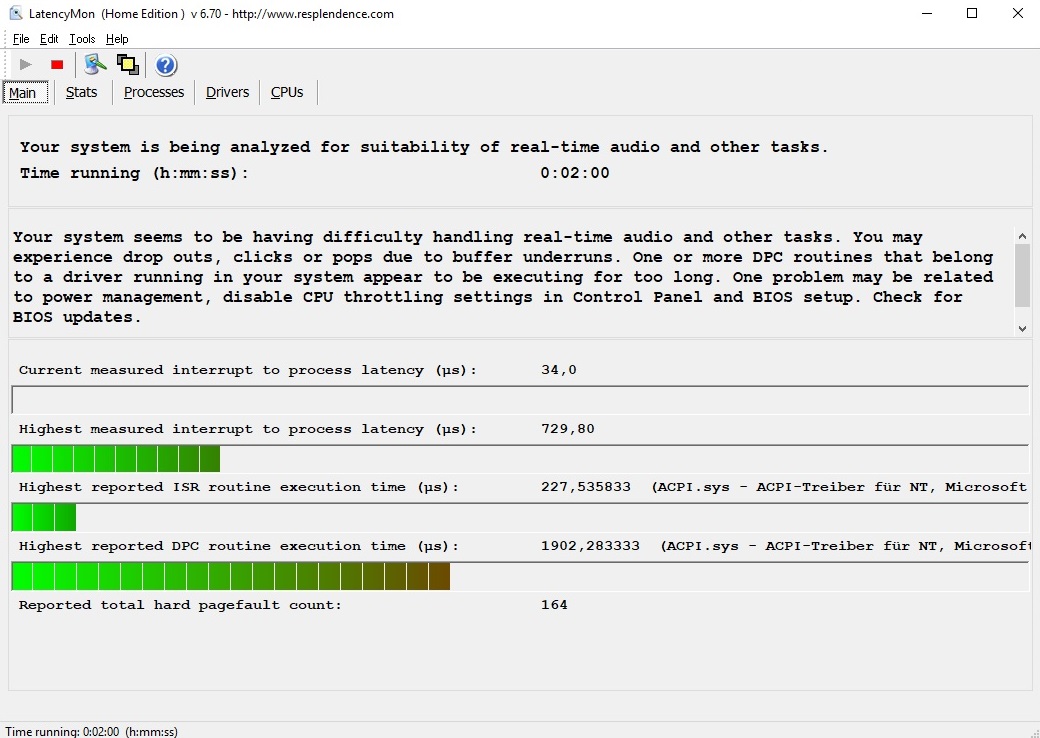
Det största problemet rör processorns beteende i fråga om klockfrekvenser när den kör 3D-applikationer (såsom spel) då olika grader av strypning uppstår - detta är svårt att acceptera på en spellaptop, även om en BIOS-uppdatering kan tänkas lösa problemet i framtiden.
Sammanfattningsvis skulle HP Omen 15 eller Acer Nitro 5 passa prismedvetna köpare bättre eftersom de har färre brister. Notera att vi inom en snar framtid kommer ta ytterligare en titt på en G5-modell som med en Core i7-9750H och ett GeForce RTX 2070 Max-Q är både bättre utrustad och betydligt dyrare.
Dell G5 15 5590-PCNJJ
- 05/14/2020 v7 (old)
Florian Glaser
Price comparison