Prestanda-debut för Radeon RX 6550M: Lenovo ThinkPad Z16 Gen 2 - recension av bärbar dator

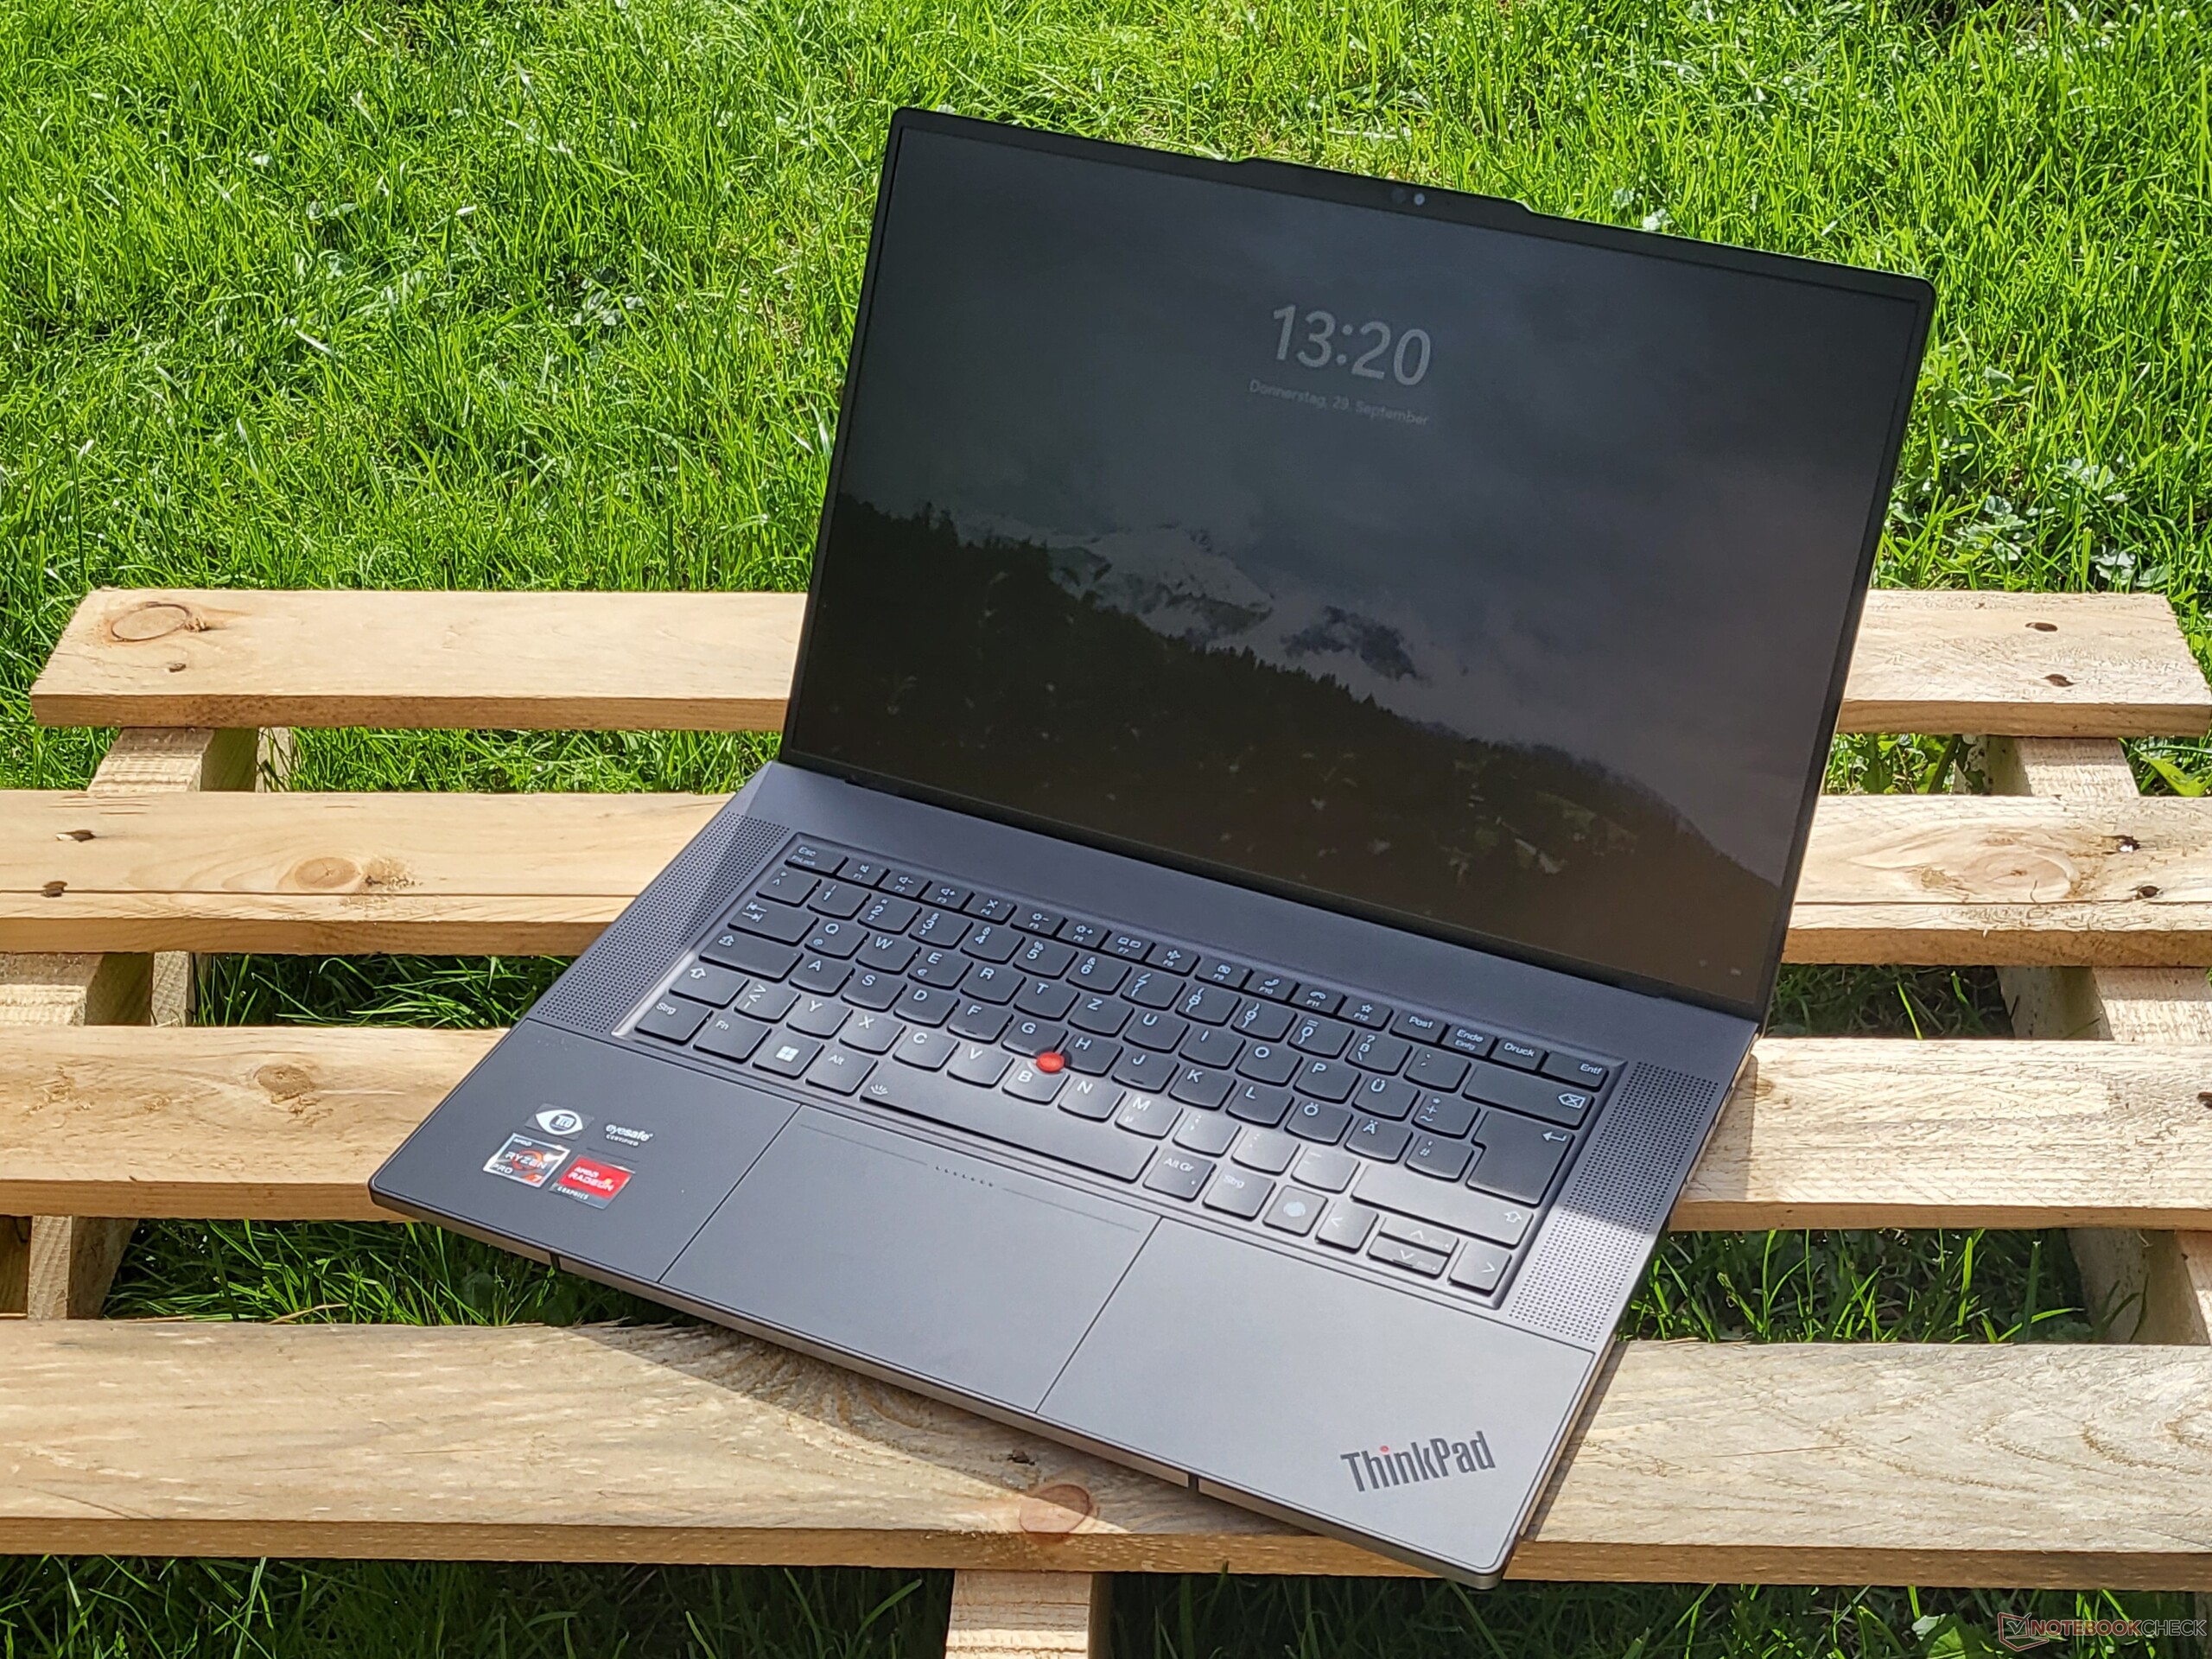
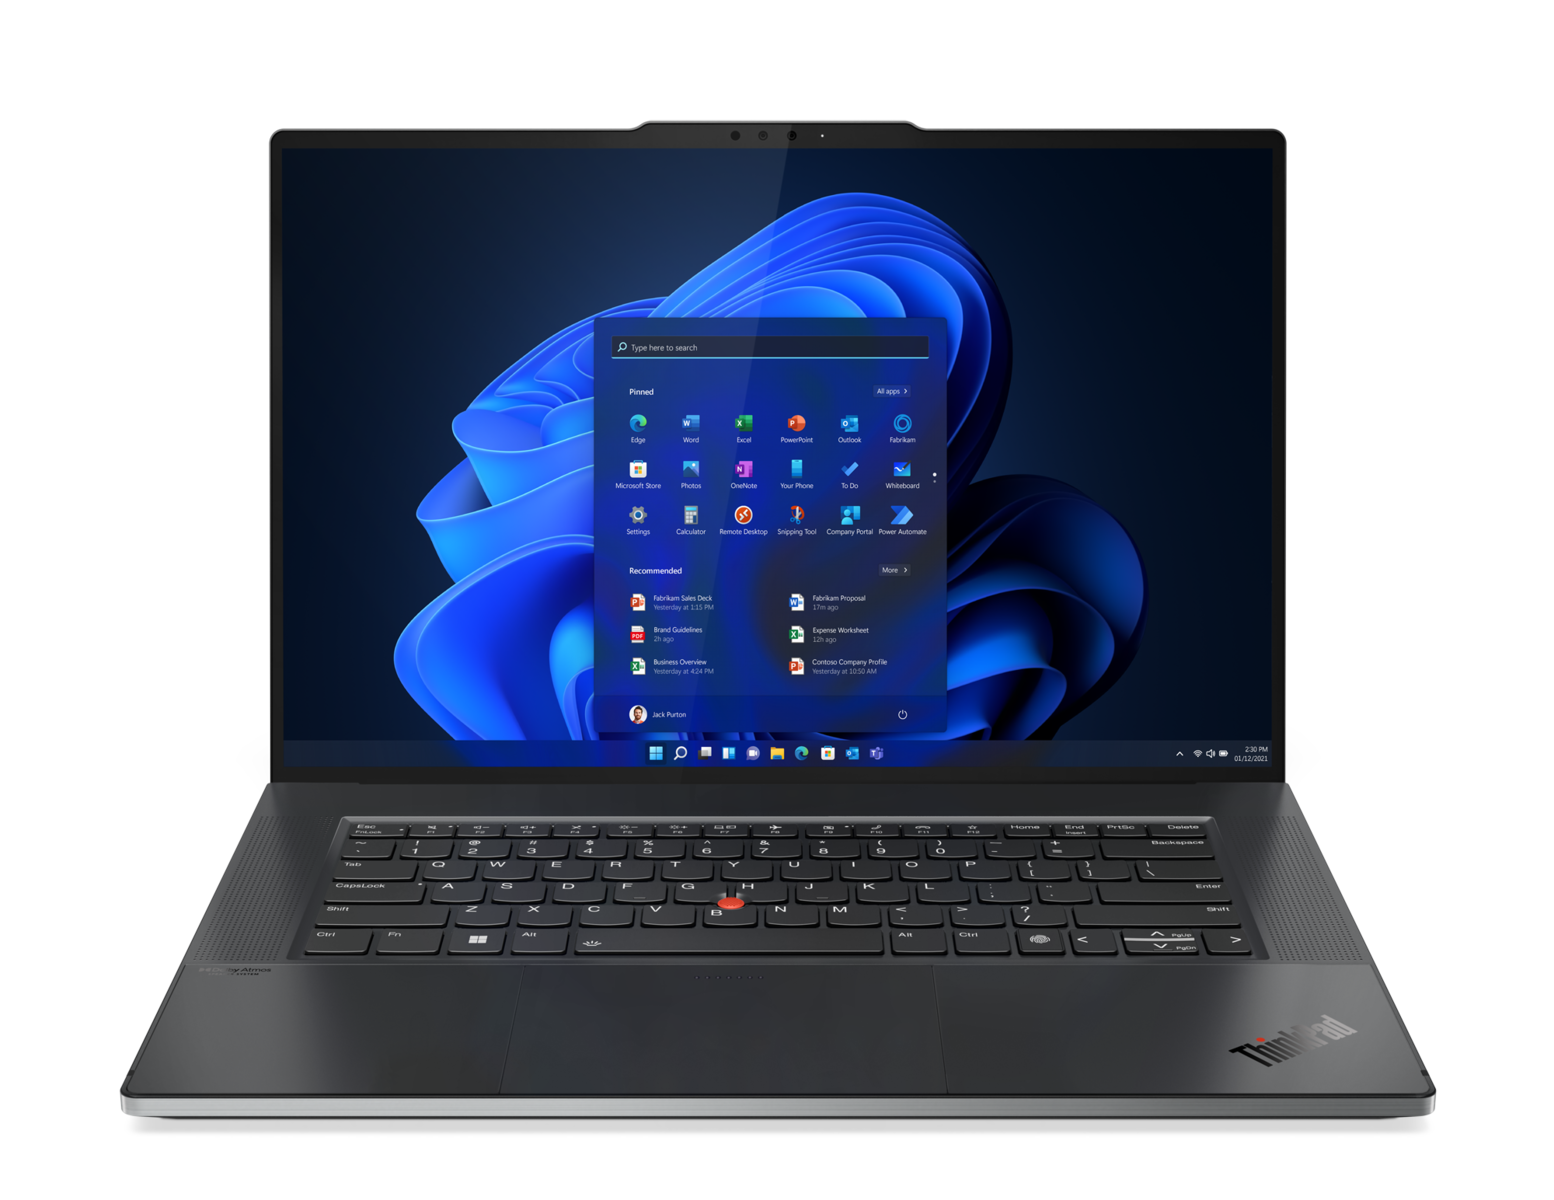
ThinkPad Z16 G2 efterträder den ett år gamla ThinkPad Z16 G1 med nya AMD Zen 4 CPU-alternativ, snabbare Radeon RX-grafik och en ny 2400p OLED-pekskärm. Den råkar också vara en av de mycket få bärbara datorer som har den ovanliga instegsmodellen Radeon RX 6550M. Chassit är i övrigt identiskt med ThinkPad Z16 G1 och vi rekommenderar därför att du kollar in vår befintliga recension av den första generationens modell för att lära dig mer om de fysiska egenskaperna och anslutningsmöjligheterna i serien.
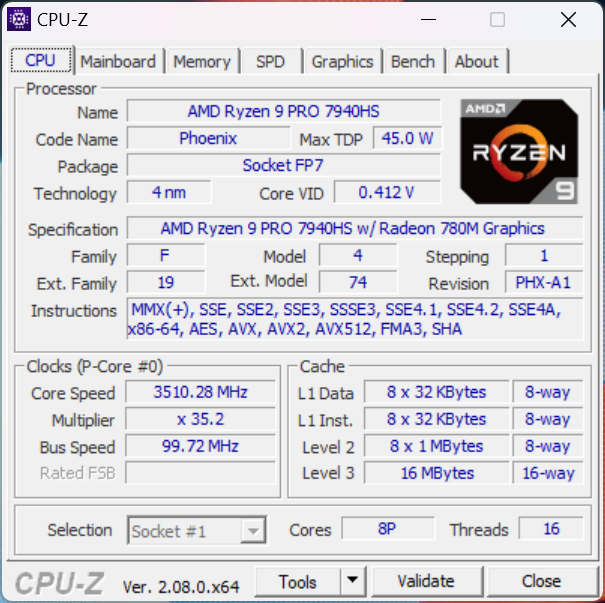
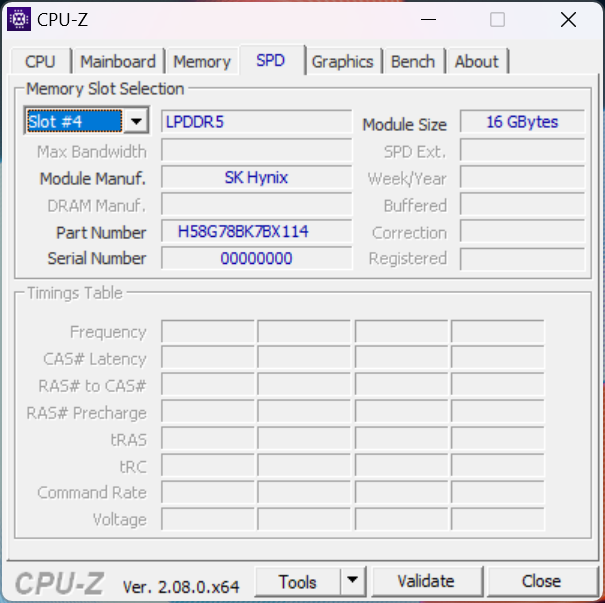
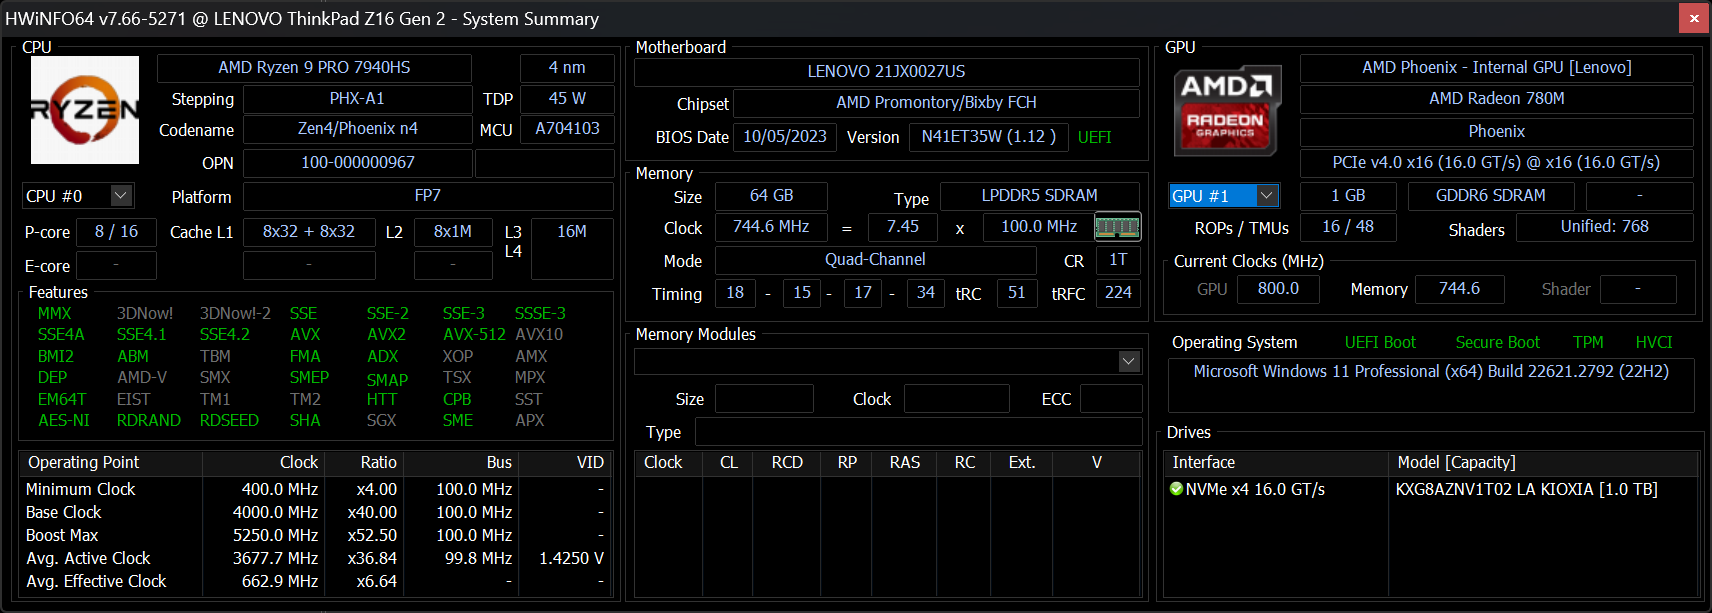
Vår specifika testenhet är den mest avancerade konfigurationen med Ryzen 9 Pro 7940HS, Radeon RX 6550M, OLED-pekskärm och 64 GB RAM-minne för cirka 2600 USD. Mindre SKU:er börjar med Ryzen 5 Pro 7640HS, integrerad grafik och en 1200p IPS-skärm för $1600. ThinkPad Z16 kan betraktas som en semi-professionell bärbar dator för multimedia eller innehållsskapare eftersom den har Ryzen Pro-processorer istället för de typiska icke-Pro-alternativen.
Alternativ till ThinkPad Z16 G2 inkluderar andra avancerade 16-tums bärbara datorer för innehållsskapare som MSI Skapare Z16P, Apple MacBook Pro 16, Asus Vivobook Pro 16Xeller Dell XPS-serien.
Fler Lenovo recensioner:
Potentiella konkurrenter i jämförelse
Gradering | Datum | Modell | Vikt | Höjd | Storlek | Upplösning | Pris |
|---|---|---|---|---|---|---|---|
| 88.6 % v7 (old) | 12/2023 | Lenovo ThinkPad Z16 Gen 2 R9 PRO 7940HS, Radeon RX 6550M | 1.8 kg | 15.8 mm | 16.00" | 3840x2400 | |
| 87.3 % v7 (old) | 10/2022 | Lenovo ThinkPad Z16 G1 21D5S00T00 R7 PRO 6850H, Radeon RX 6500M | 1.9 kg | 15.8 mm | 16.00" | 1920x1200 | |
| 85.7 % v7 (old) | 11/2023 | Lenovo ThinkBook 16 G6 ABP R5 7530U, Vega 7 | 1.8 kg | 17.5 mm | 16.00" | 1920x1200 | |
| 83.7 % v7 (old) | 06/2022 | MSI Creator Z16P B12UHST i9-12900H, GeForce RTX 3080 Ti Laptop GPU | 2.4 kg | 20.4 mm | 16.00" | 2560x1600 | |
| 93.7 % v7 (old) | 11/2023 | Apple MacBook Pro 16 2023 M3 Pro Apple M3 Pro 12-Core, M3 Pro 18-Core GPU | 2.1 kg | 16.9 mm | 16.20" | 3456x2234 | |
| 86.2 % v7 (old) | 07/2023 | Asus Vivobook Pro 16X K6604JV-MX016W i9-13980HX, GeForce RTX 4060 Laptop GPU | 2.1 kg | 22.8 mm | 16.00" | 3200x2000 |
Fall
SD-kortläsare
| SD Card Reader | |
| average JPG Copy Test (av. of 3 runs) | |
| Lenovo ThinkPad Z16 Gen 2 (Toshiba Exceria Pro SDXC 64 GB UHS-II) | |
| Asus Vivobook Pro 16X K6604JV-MX016W | |
| Lenovo ThinkPad Z16 G1 21D5S00T00 | |
| Lenovo ThinkBook 16 G6 ABP (Angelbird AV Pro V60) | |
| MSI Creator Z16P B12UHST (AV PRO microSD 128 GB V60) | |
| maximum AS SSD Seq Read Test (1GB) | |
| Lenovo ThinkPad Z16 G1 21D5S00T00 | |
| Lenovo ThinkPad Z16 Gen 2 (Toshiba Exceria Pro SDXC 64 GB UHS-II) | |
| Asus Vivobook Pro 16X K6604JV-MX016W | |
| Lenovo ThinkBook 16 G6 ABP (Angelbird AV Pro V60) | |
Kommunikation
Lenovo har bytt ut Qualcomm WCN685x från förra årets modell mot en MediaTek MT7922 i årets modell. Överföringshastigheterna förblir stabila och utmärkta när de kopplas till våra Wi-Fi 6 eller Wi-Fi 6E-nätverk.
| Networking | |
| iperf3 transmit AXE11000 | |
| Lenovo ThinkPad Z16 G1 21D5S00T00 | |
| Asus Vivobook Pro 16X K6604JV-MX016W | |
| Lenovo ThinkPad Z16 Gen 2 | |
| Lenovo ThinkBook 16 G6 ABP | |
| iperf3 receive AXE11000 | |
| Lenovo ThinkPad Z16 G1 21D5S00T00 | |
| Asus Vivobook Pro 16X K6604JV-MX016W | |
| MSI Creator Z16P B12UHST | |
| Lenovo ThinkPad Z16 Gen 2 | |
| Lenovo ThinkBook 16 G6 ABP | |
| iperf3 transmit AXE11000 6GHz | |
| Lenovo ThinkPad Z16 G1 21D5S00T00 | |
| Asus Vivobook Pro 16X K6604JV-MX016W | |
| Lenovo ThinkPad Z16 Gen 2 | |
| iperf3 receive AXE11000 6GHz | |
| Lenovo ThinkPad Z16 G1 21D5S00T00 | |
| Asus Vivobook Pro 16X K6604JV-MX016W | |
| Lenovo ThinkPad Z16 Gen 2 | |
Webbkamera
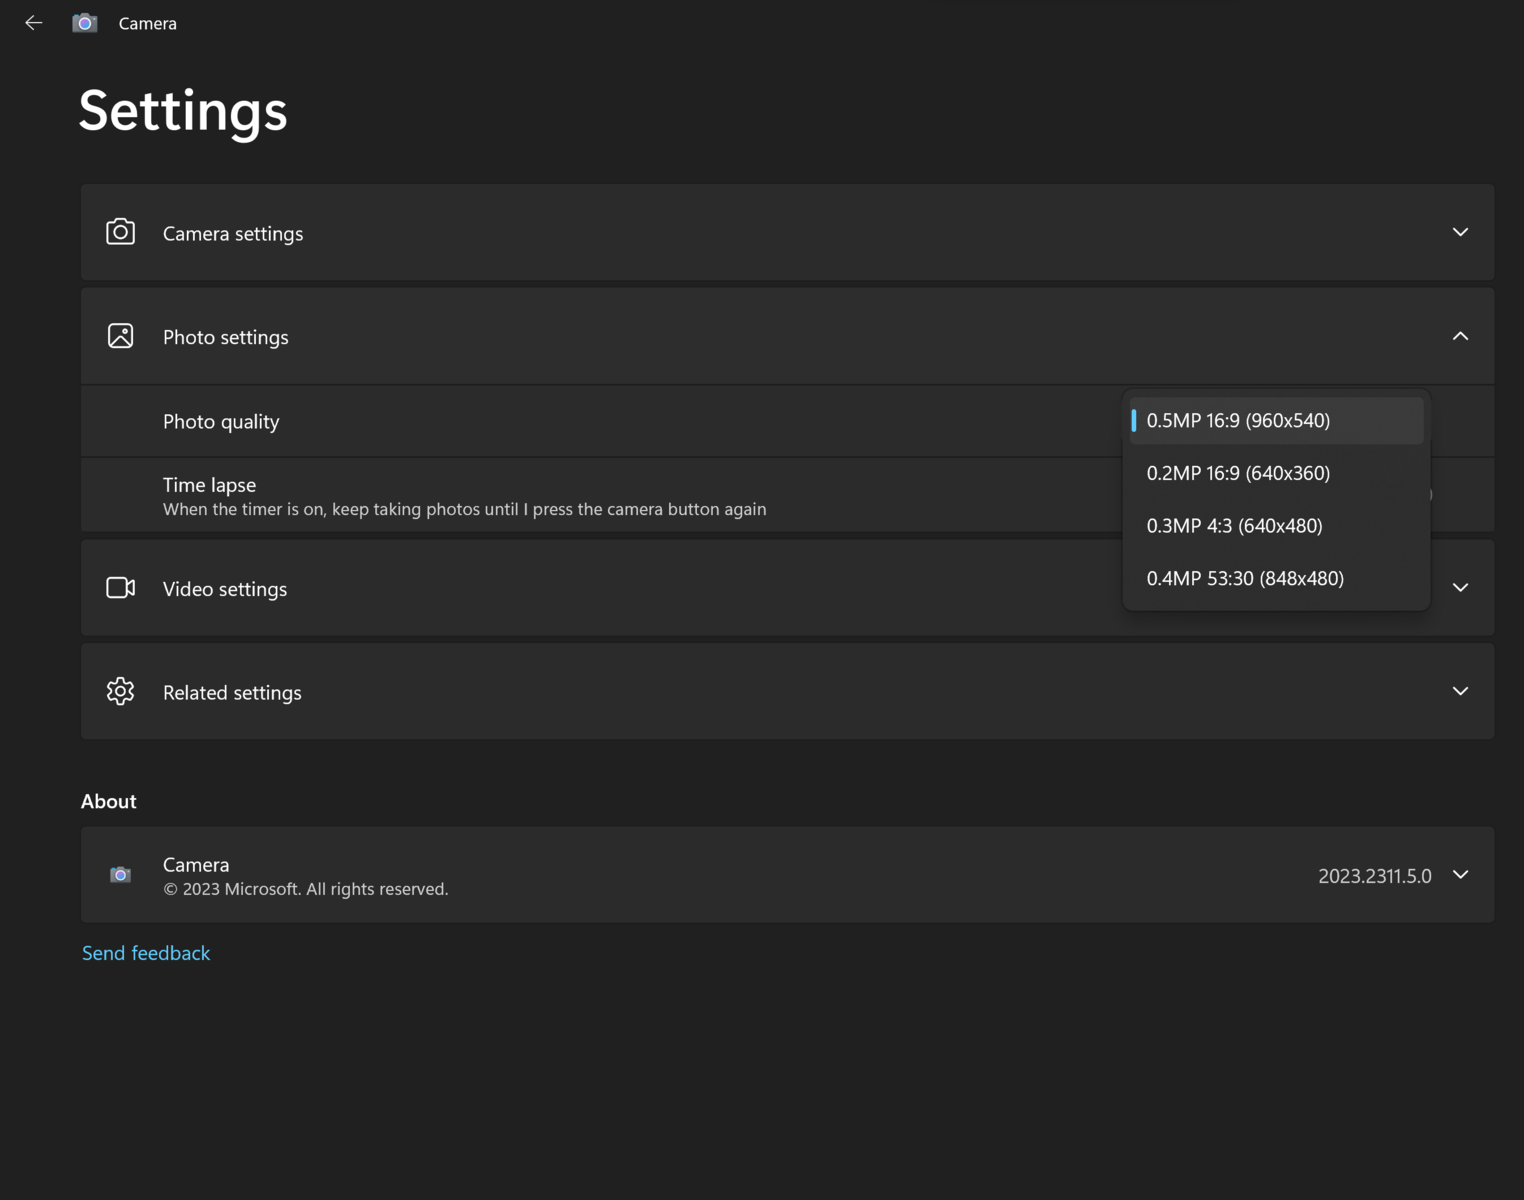
Även om Lenovo annonserar en 2 MP webbkamera, kan vi bara välja upp till 0,5 MP med den inbyggda kameraappen, vilket visas av skärmdumpen till höger. Vi har meddelat Lenovo om felet och kommer att uppdatera det här avsnittet om vi får ett svar.


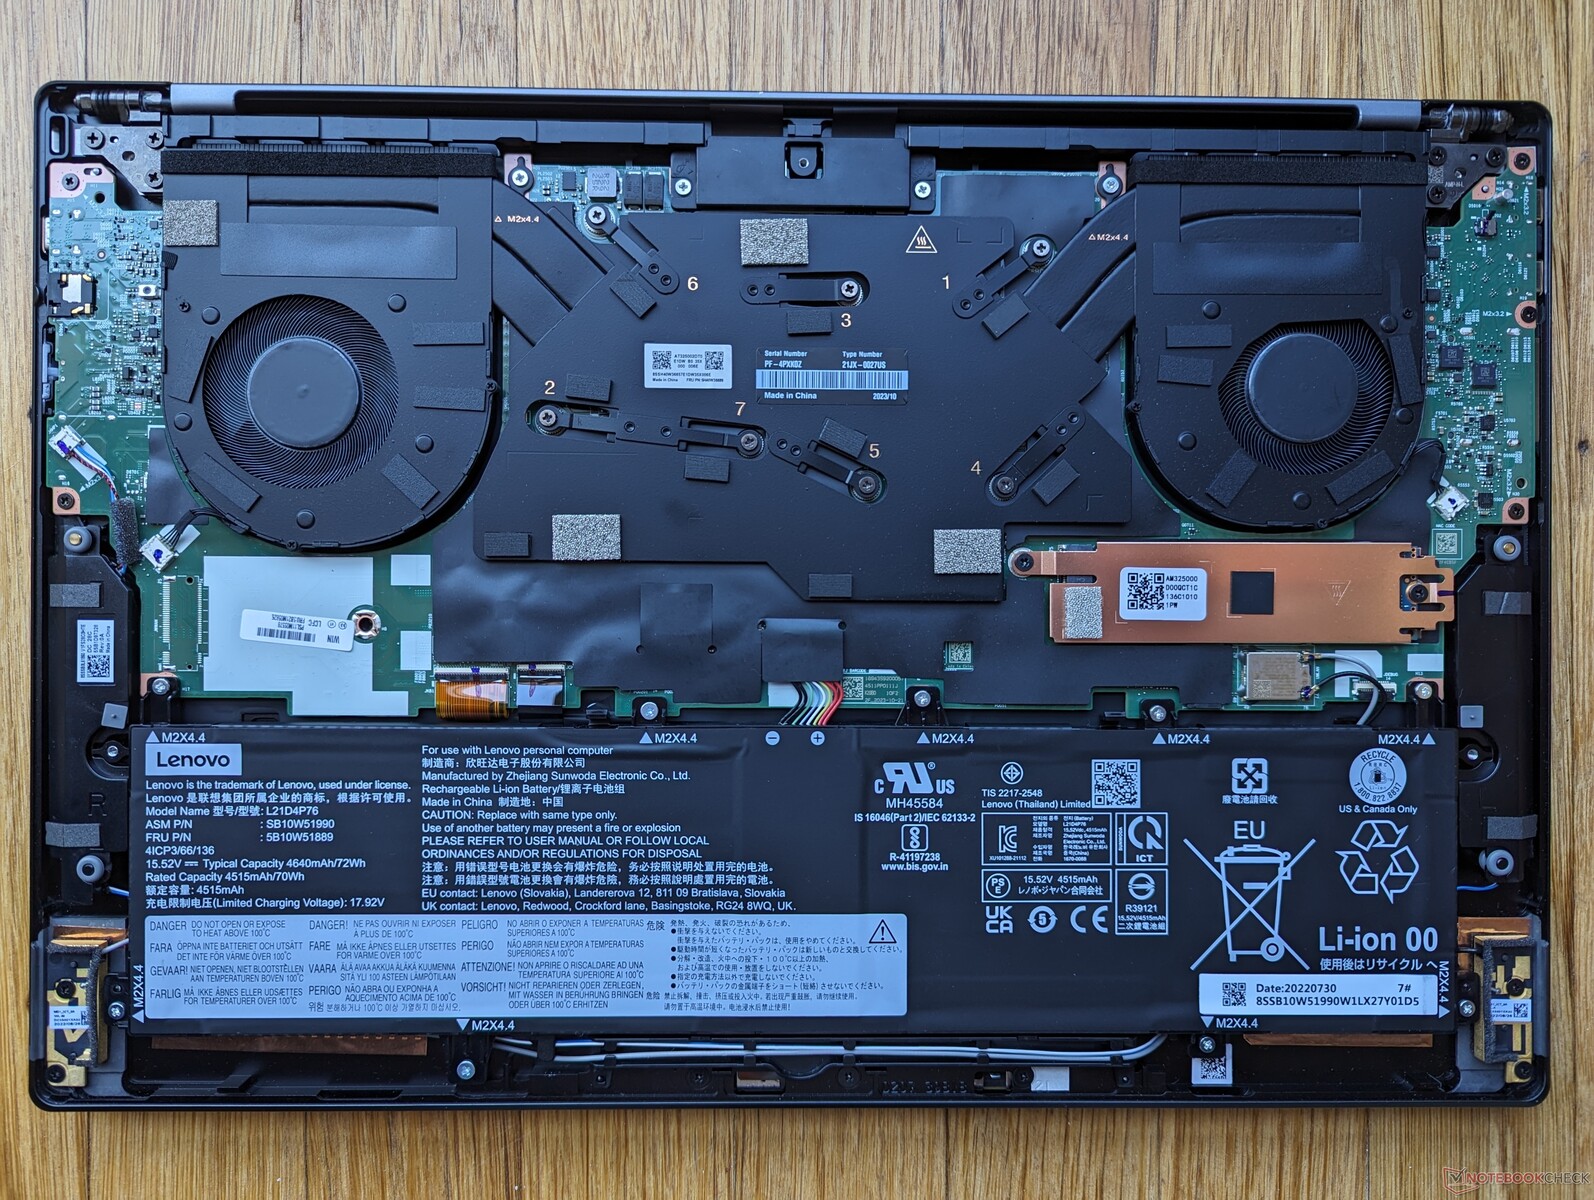
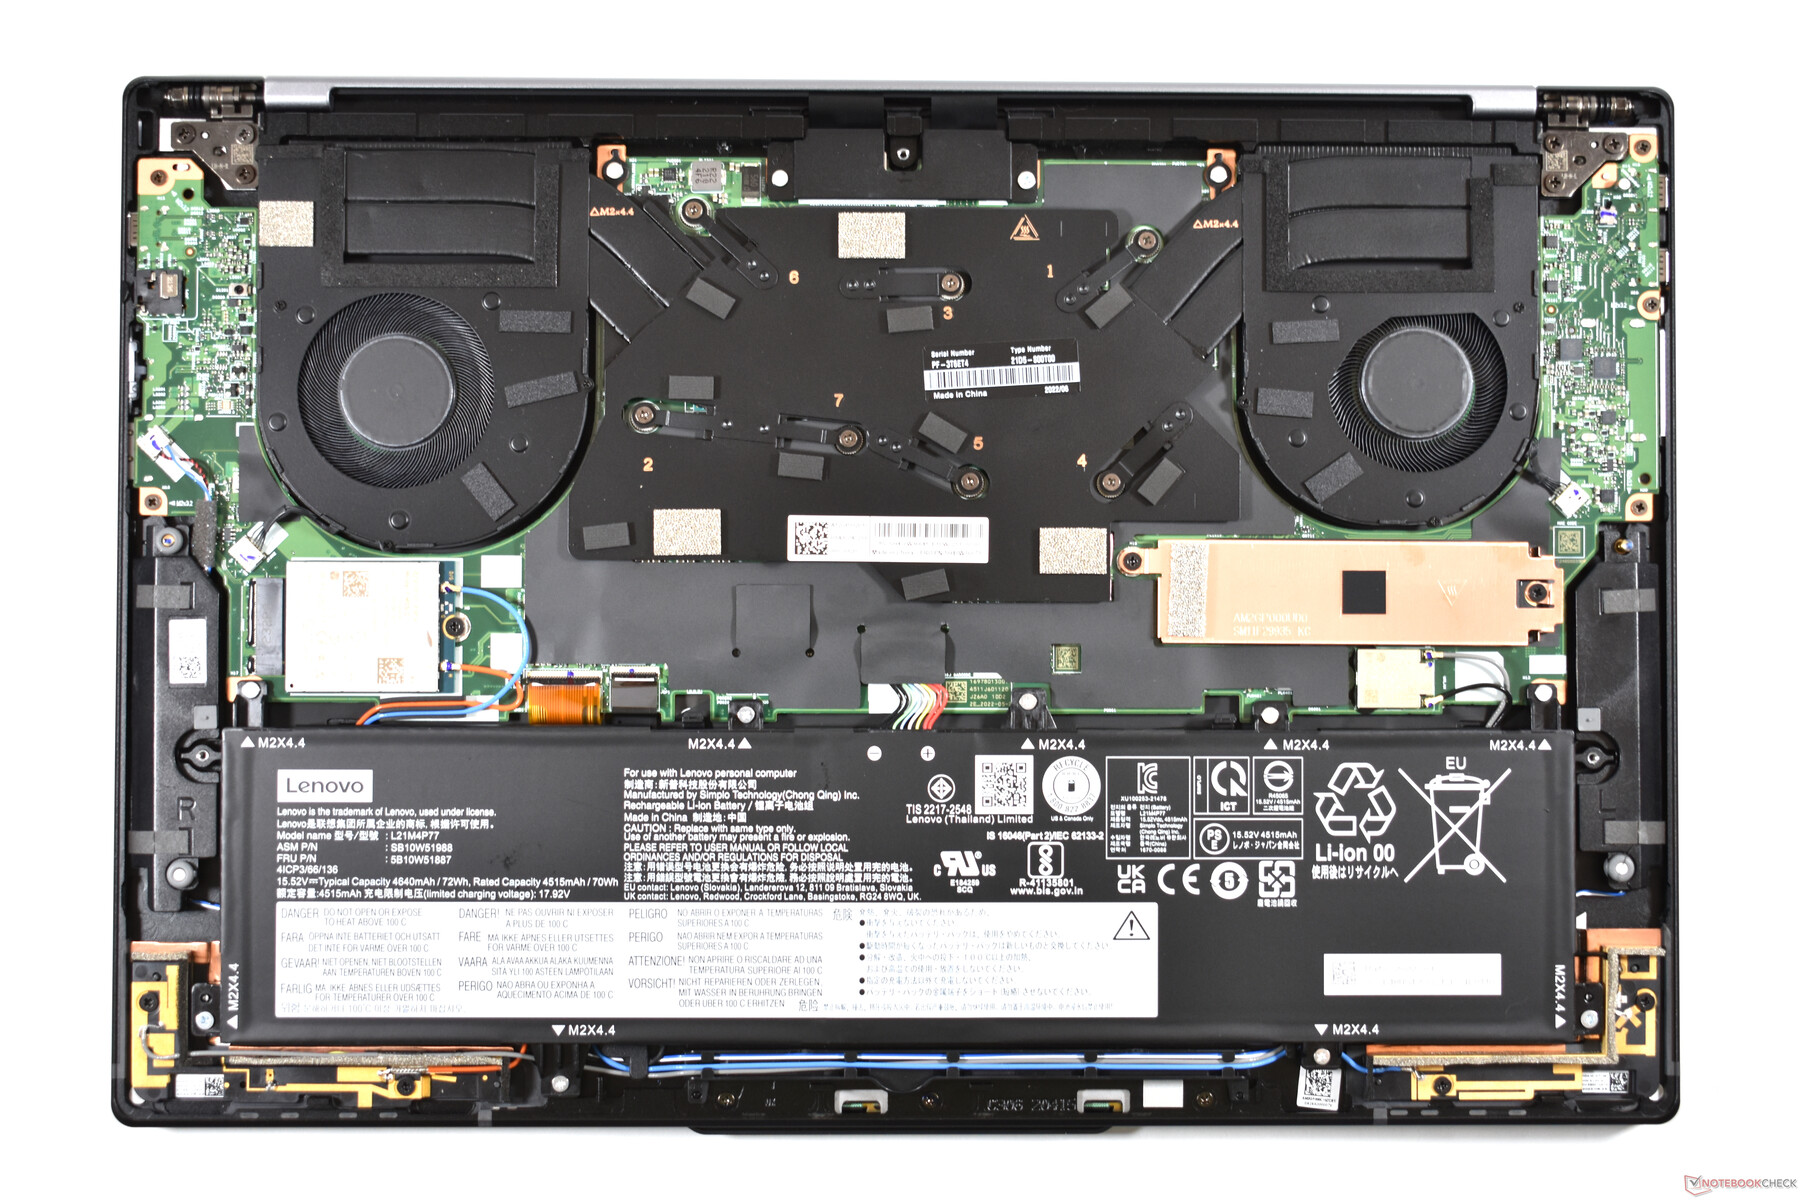
Underhåll
När bottenpanelen tas bort syns inga större interna skillnader mellan Gen 1- och Gen 2-versionerna. Vår Gen 2-konfiguration inkluderar dock inte WAN-stöd och därför saknas M.2 WAN-kortplatsen och antennen. Detta innebär tyvärr att användare inte kan köpa en SKU utan WAN-stöd med avsikten att lägga till en WAN-modul i framtiden.
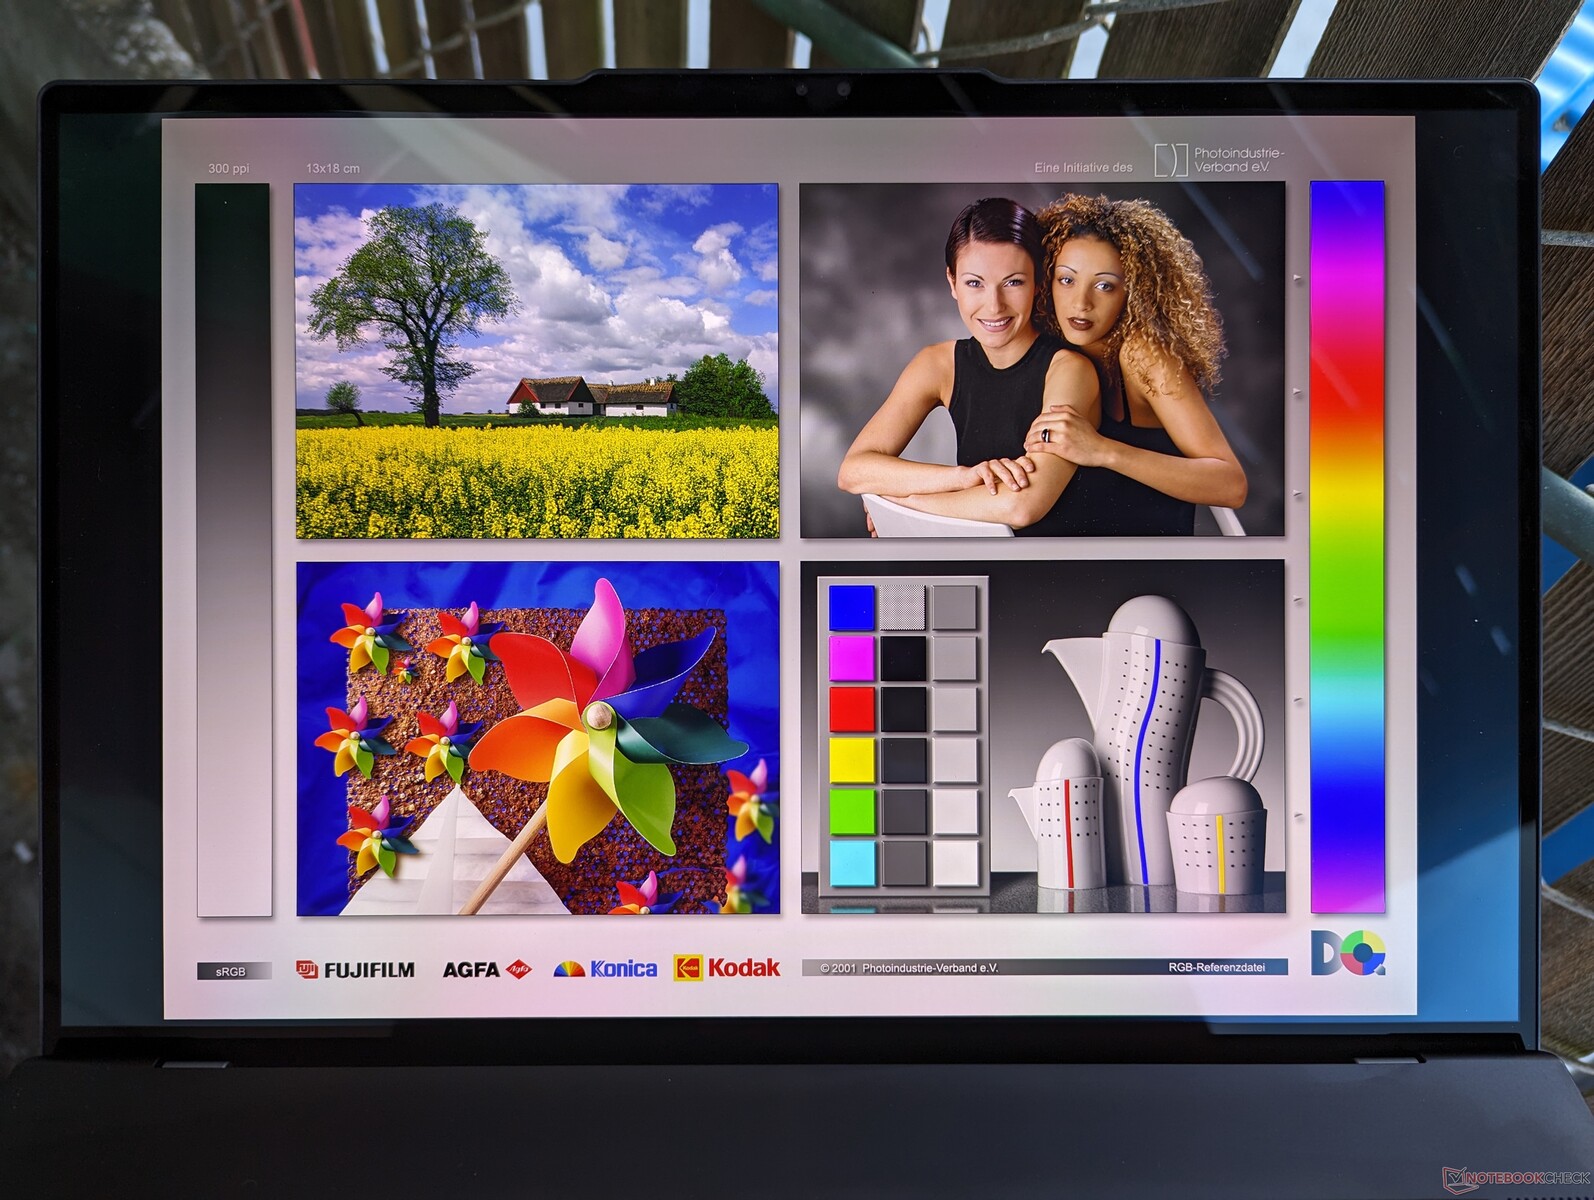
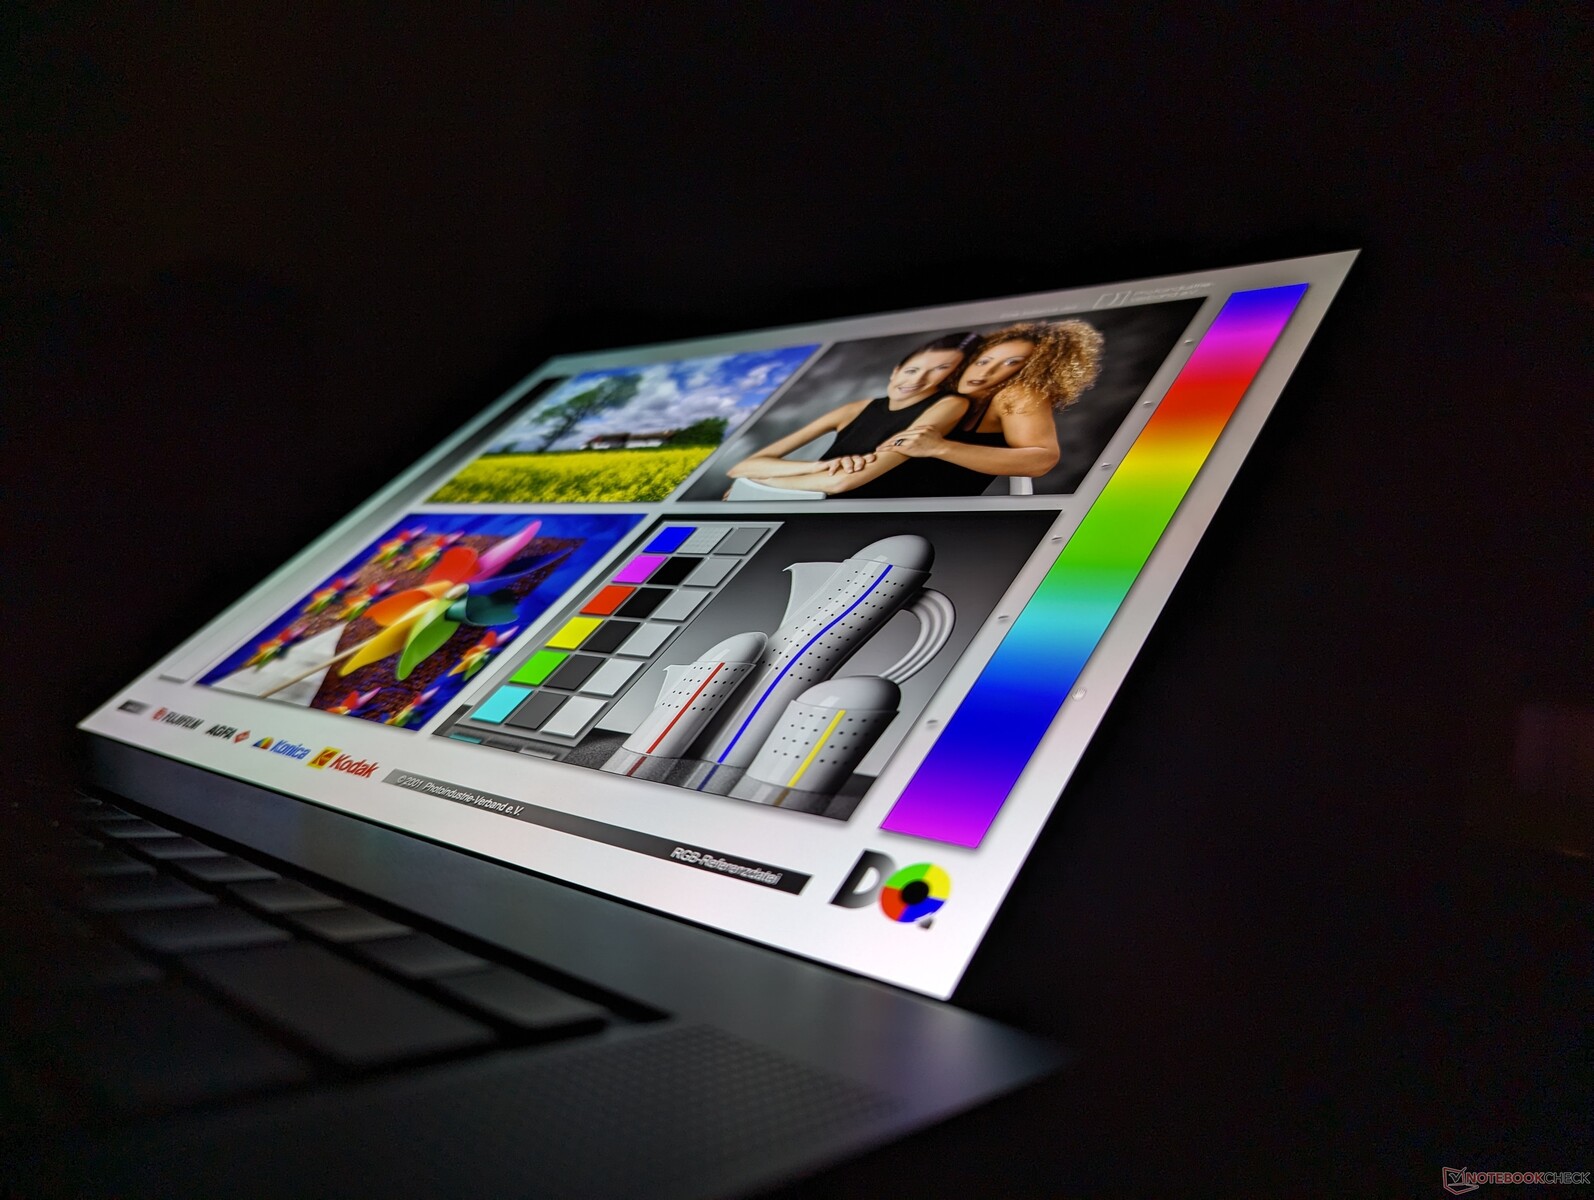
Display
Lenovo erbjuder följande fyra bildskärmsalternativ som alla endast är 60 Hz och utan FreeSync-stöd:
- 1920 x 1200, IPS, matt, beröringsfri, 100% sRGB, 400 nits
- 1920 x 1200, IPS, glansig, touch, 100% sRGB, 400 nits
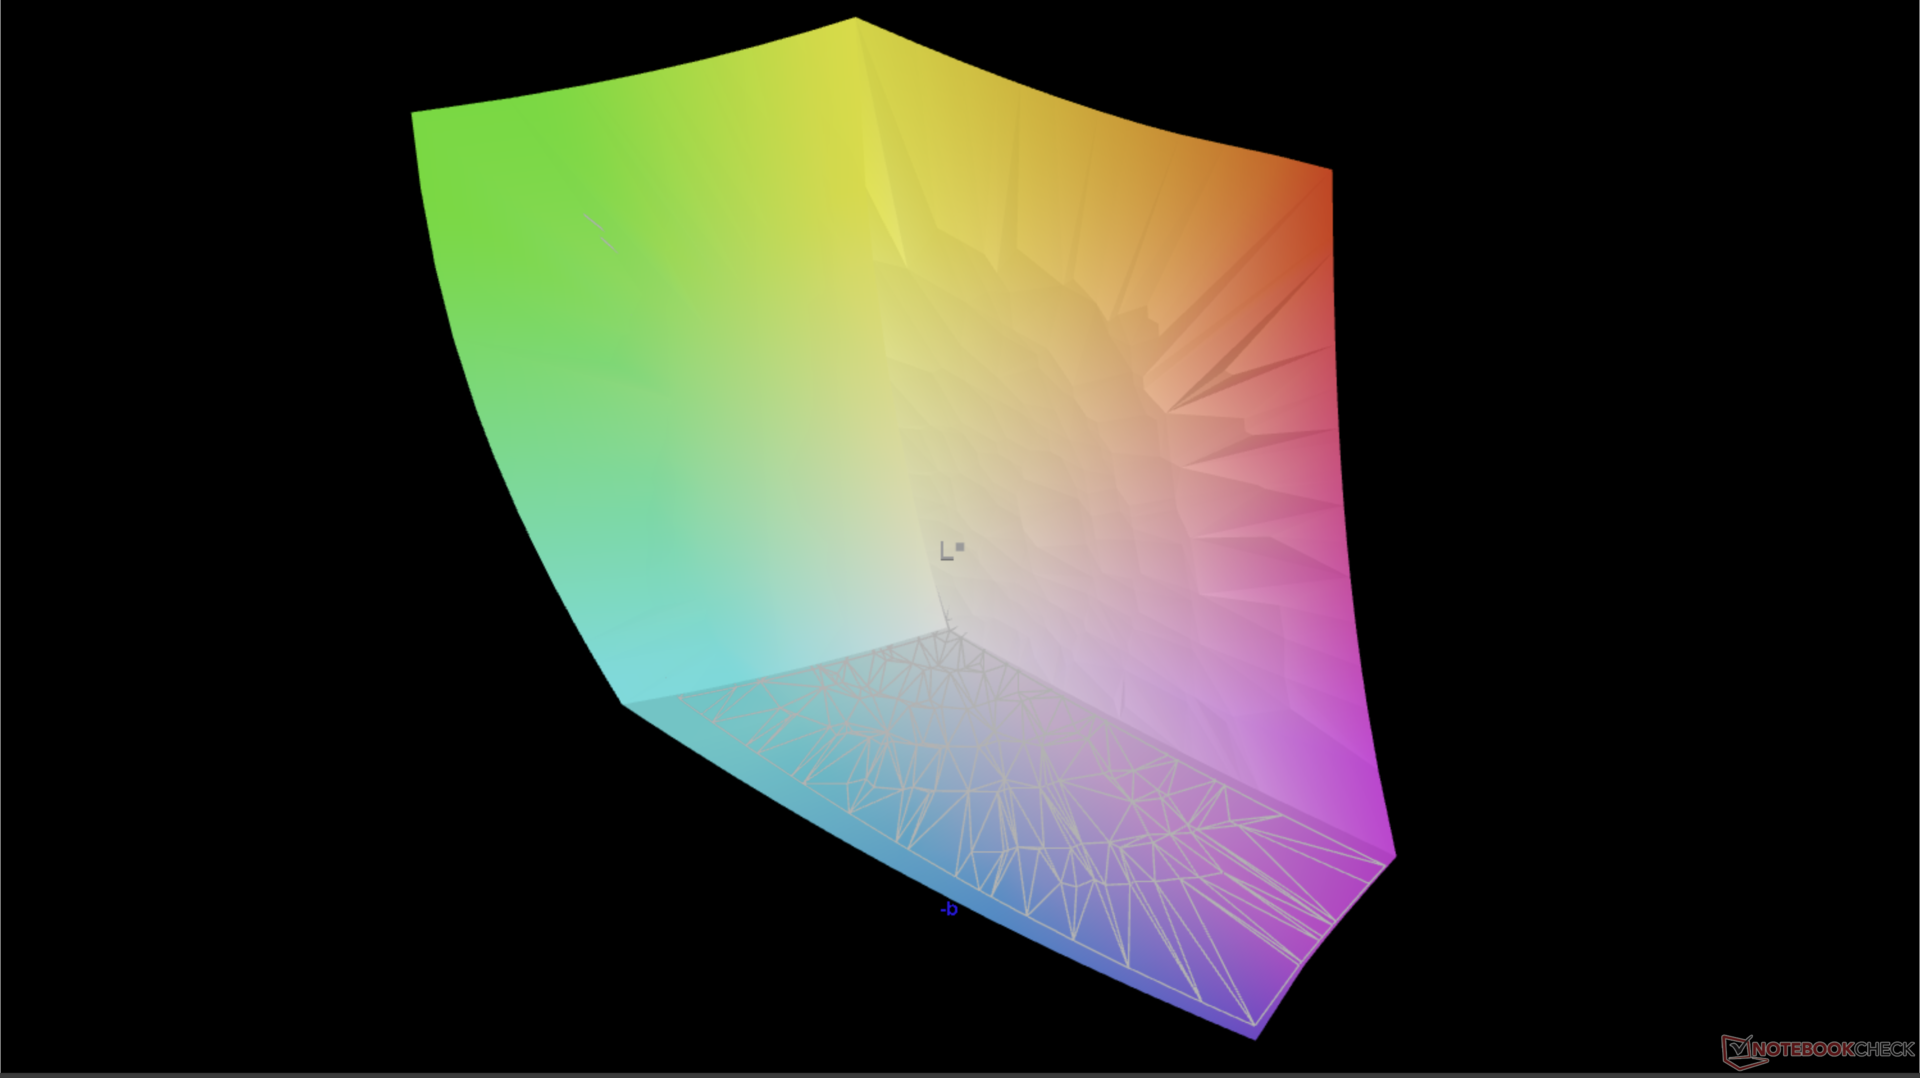
- 3840 x 2400, OLED, glansig, touch, 100% DCI-P3, 400 nits, HDR400
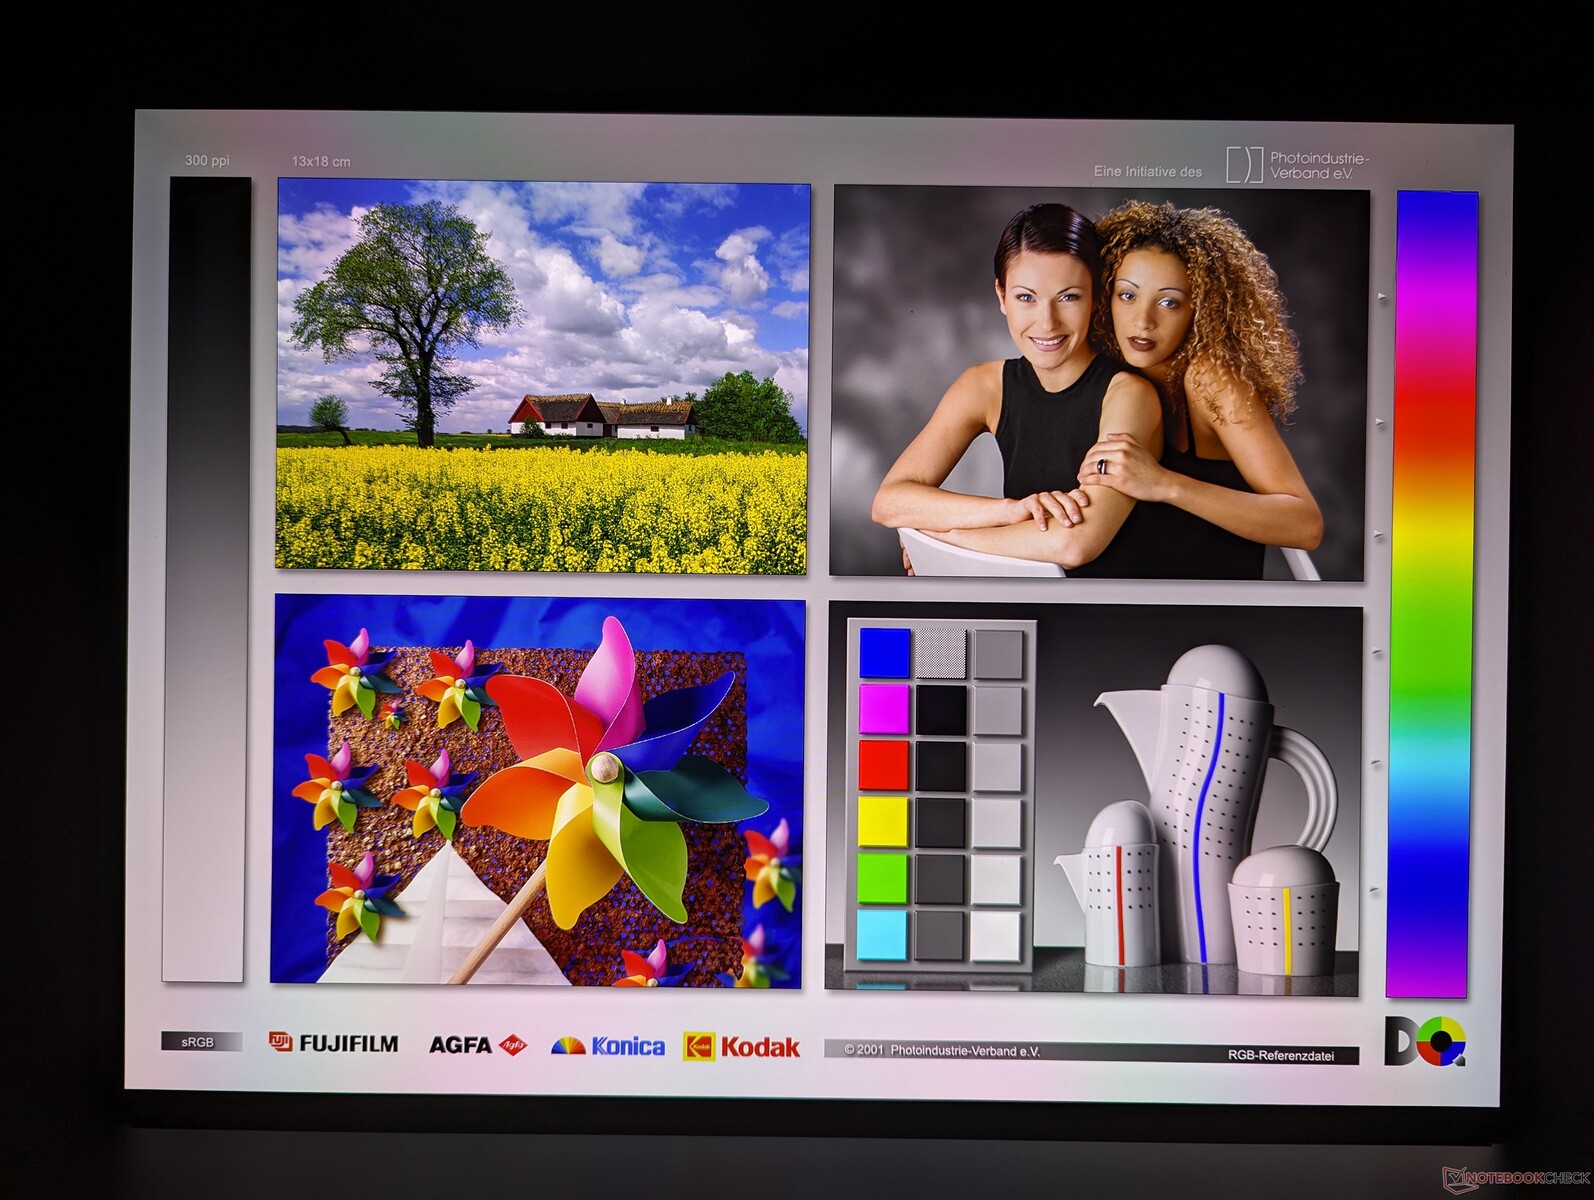
Samma Samsung ATNA60YV04-0 OLED-panel som sitter på vårt testexemplar finns även på den senaste ThinkPad P1 G6 och tittarupplevelsen är därför snarlik mellan dessa två modeller. Det är inte ovanligt att en tillverkare använder samma panelalternativ på flera modeller.
Jämfört med 1200p-panelen på vår Gen 1-enhet erbjuder OLED-panelen djupare svarta nivåer, HDR-stöd, snabbare svartvita svarstider, mer levande färger och en högre inbyggd upplösning. Oavsett alternativ är vi glada över att se full sRGB-täckning som standard utan några billiga SKU:er att undvika. Vi hoppas att framtida revisioner kommer att inkludera paneler med hög uppdateringsfrekvens a la Asus VivoBook-serien.

| |||||||||||||||||||||||||
Distribution av ljusstyrkan: 97 %
Mitt på batteriet: 390.1 cd/m²
Kontrast: ∞:1 (Svärta: 0 cd/m²)
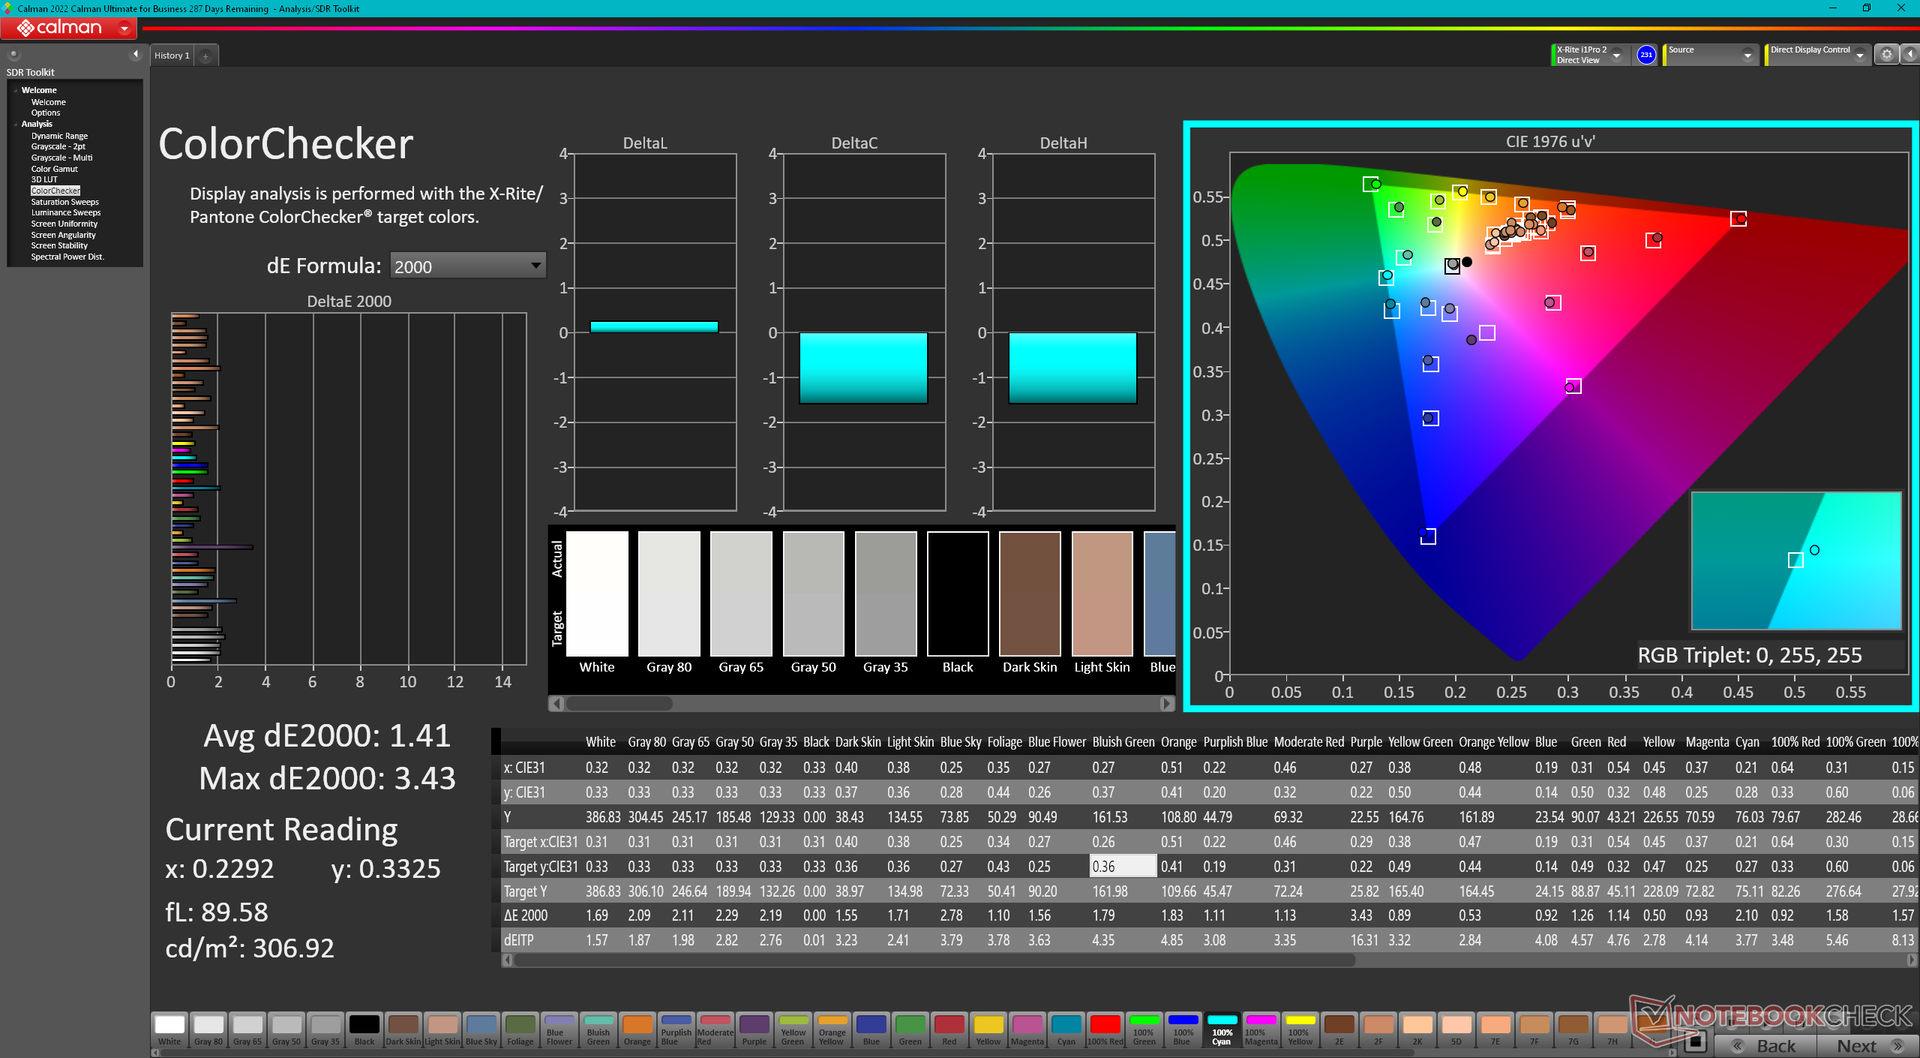
ΔE ColorChecker Calman: 1.41 | ∀{0.5-29.43 Ø4.72}
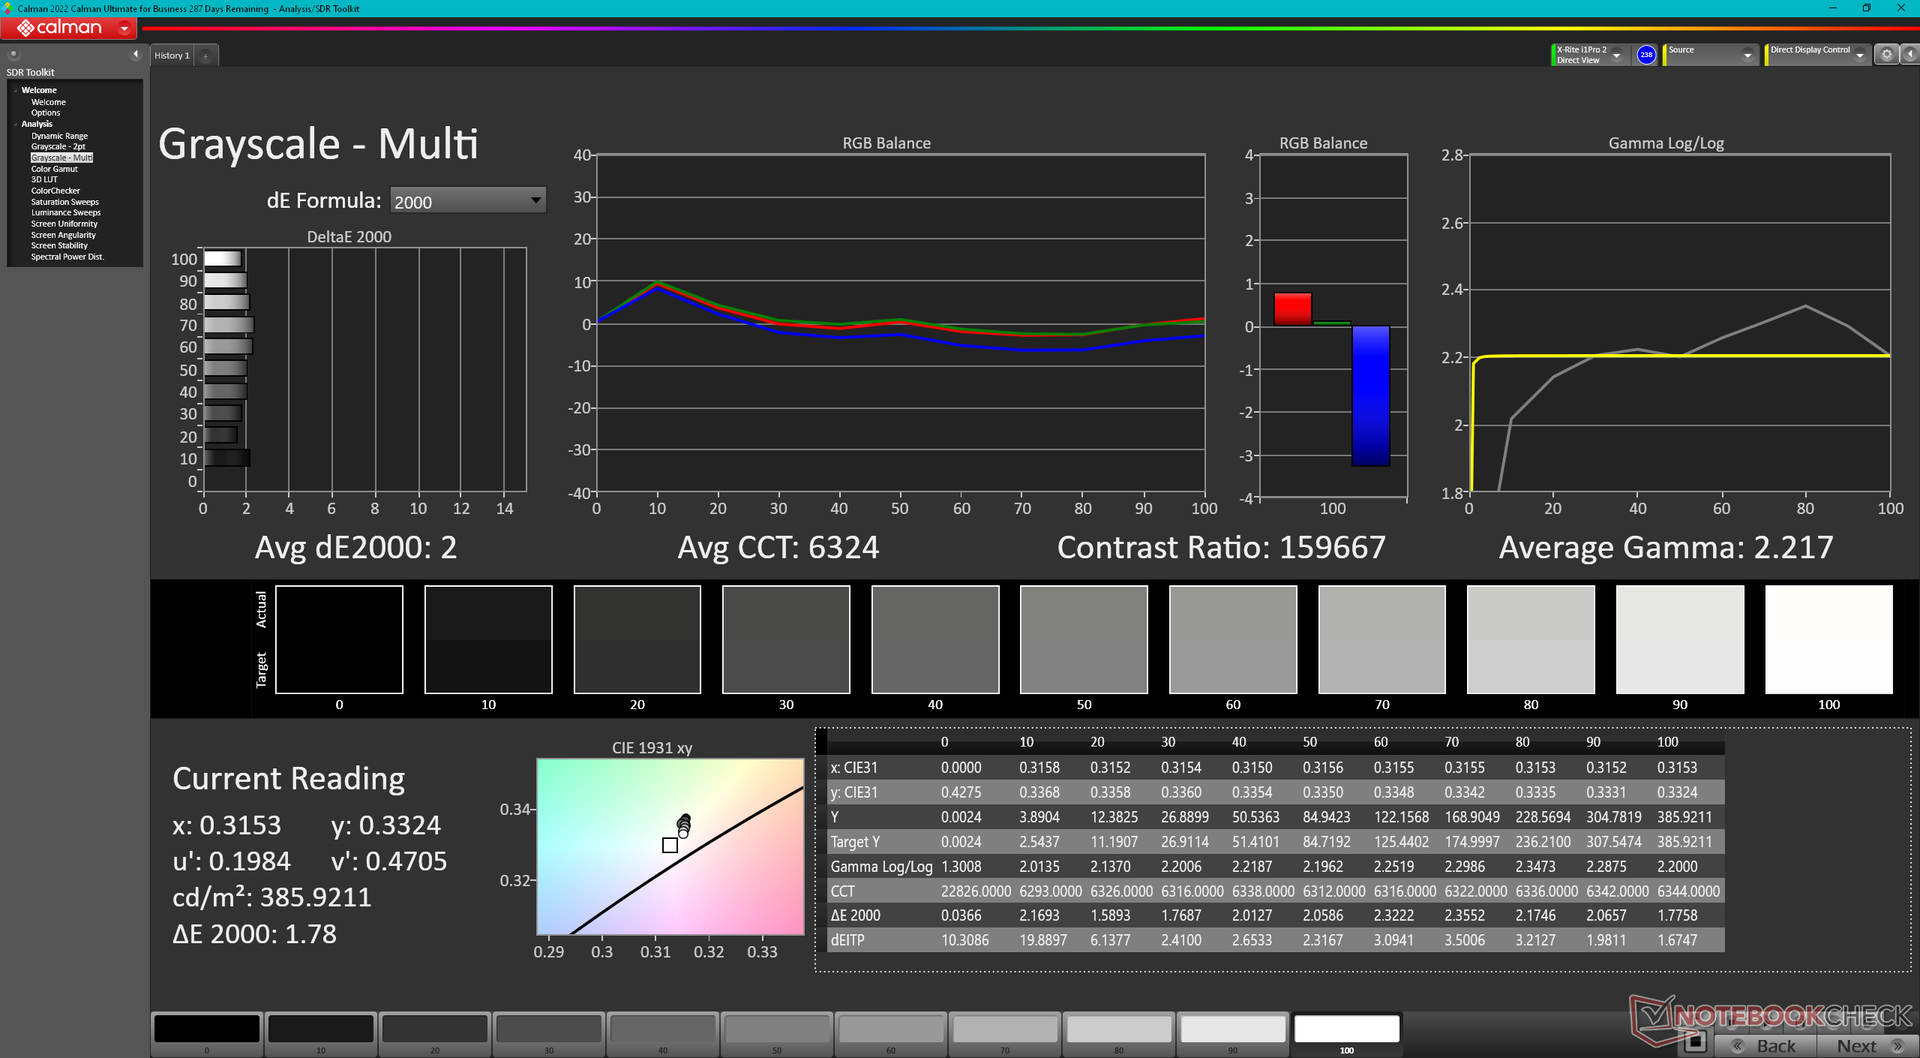
ΔE Greyscale Calman: 2 | ∀{0.09-98 Ø4.97}
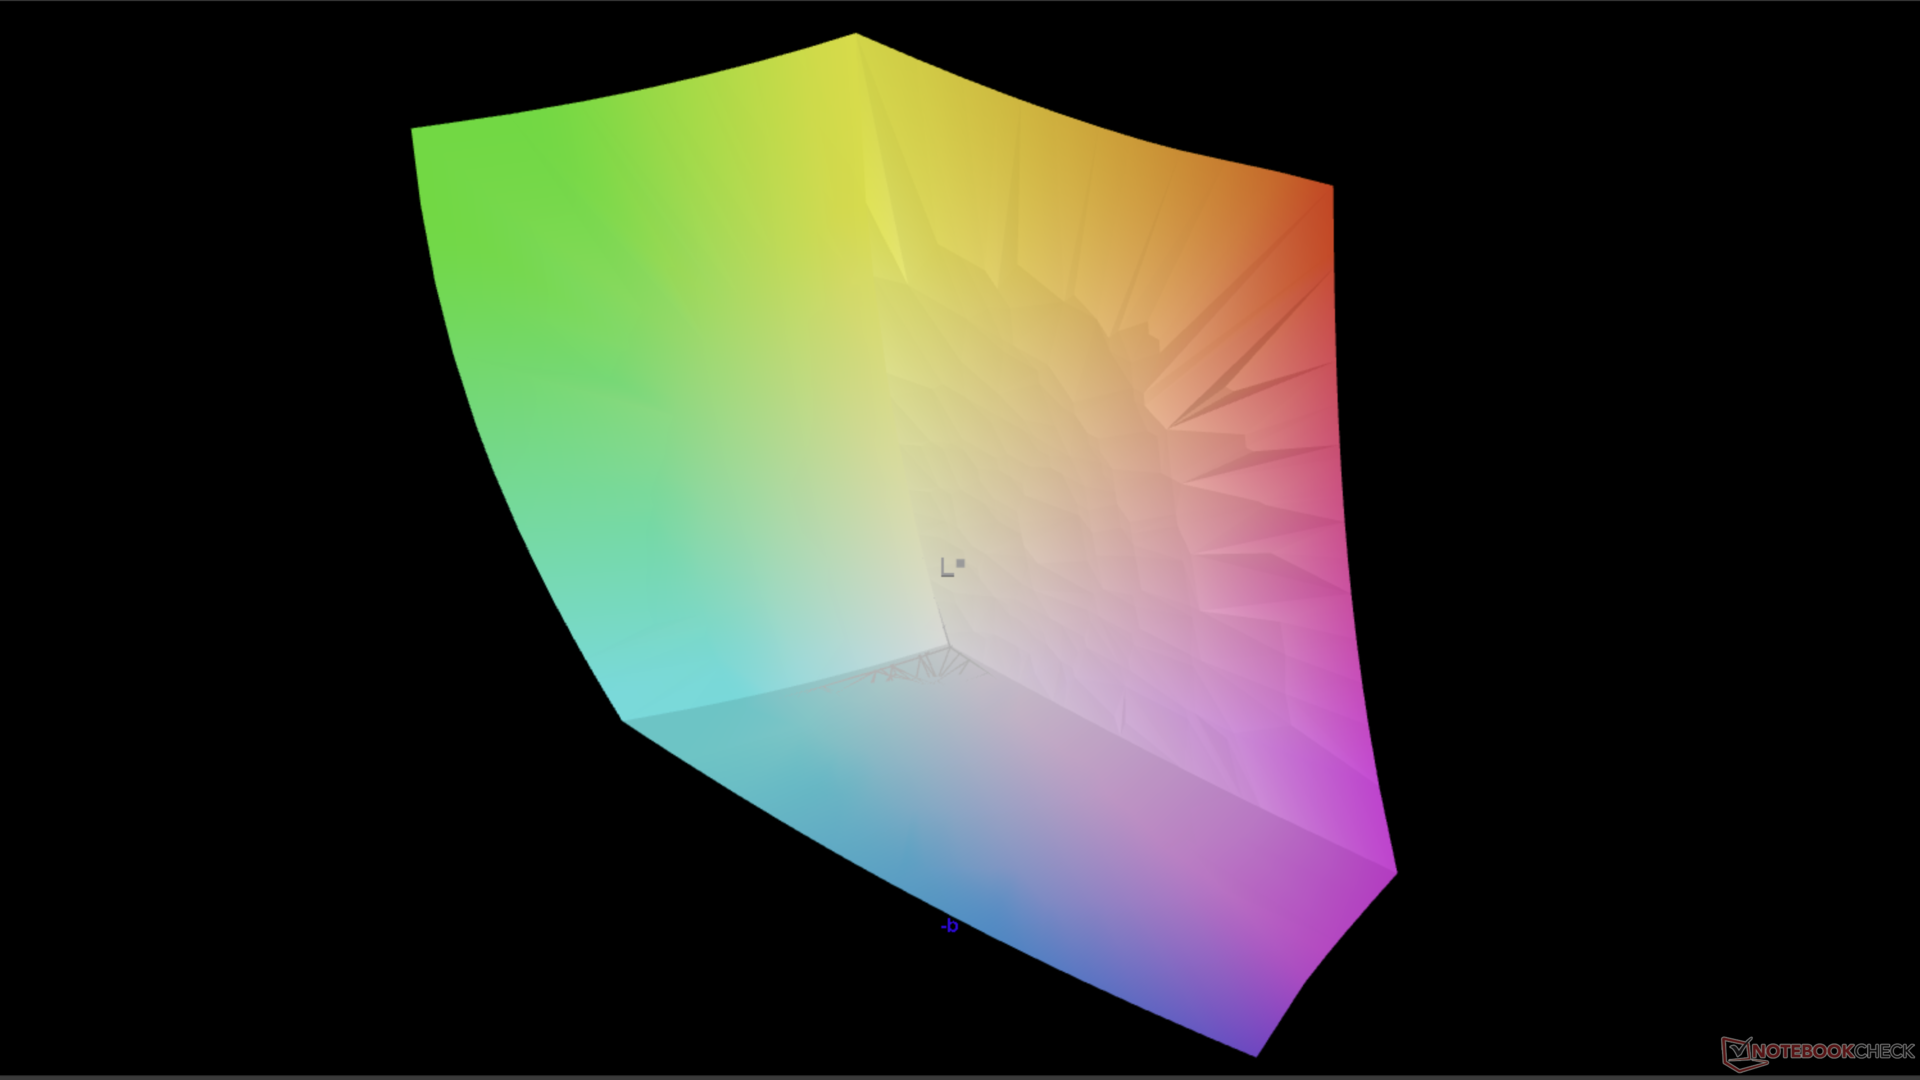
96.7% AdobeRGB 1998 (Argyll 3D)
100% sRGB (Argyll 3D)
99.7% Display P3 (Argyll 3D)
Gamma: 2.22
CCT: 6324 K
| Lenovo ThinkPad Z16 Gen 2 Samsung ATNA60YV04-0, OLED, 3840x2400, 16" | Lenovo ThinkPad Z16 G1 21D5S00T00 NE160WUM-N62 , IPS LED, 1920x1200, 16" | Lenovo ThinkBook 16 G6 ABP LEN160WUXGA, IPS, 1920x1200, 16" | MSI Creator Z16P B12UHST AUOD298, IPS True Pixel (~100% DCI-P3), 2560x1600, 16" | Asus Vivobook Pro 16X K6604JV-MX016W Samsung SDC4178 ATNA60BX01-1, OLED, 3200x2000, 16" | Apple MacBook Pro 16 2023 M3 Max Mini-LED, 3456x2234, 16" | |
|---|---|---|---|---|---|---|
| Display | -18% | -52% | -4% | -1% | -1% | |
| Display P3 Coverage (%) | 99.7 | 70 -30% | 40.4 -59% | 97.6 -2% | 98.4 -1% | 99.2 -1% |
| sRGB Coverage (%) | 100 | 99.7 0% | 59.8 -40% | 99.9 0% | 99.7 0% | |
| AdobeRGB 1998 Coverage (%) | 96.7 | 72.1 -25% | 42 -57% | 86.8 -10% | 95.8 -1% | |
| Response Times | -1637% | -1414% | -417% | 20% | -2852% | |
| Response Time Grey 50% / Grey 80% * (ms) | 1.86 ? | 40 ? -2051% | 32.8 ? -1663% | 12.9 ? -594% | 1.6 ? 14% | 66.9 ? -3497% |
| Response Time Black / White * (ms) | 1.89 ? | 25 ? -1223% | 23.9 ? -1165% | 6.4 ? -239% | 1.4 ? 26% | 43.6 ? -2207% |
| PWM Frequency (Hz) | 60 ? | 120 ? | 14877 | |||
| Screen | -3% | -185% | -23% | -5% | 25% | |
| Brightness middle (cd/m²) | 390.1 | 487 25% | 310 -21% | 428 10% | 347 -11% | 630 61% |
| Brightness (cd/m²) | 393 | 446 13% | 290 -26% | 394 0% | 346 -12% | 604 54% |
| Brightness Distribution (%) | 97 | 83 -14% | 86 -11% | 86 -11% | 97 0% | 94 -3% |
| Black Level * (cd/m²) | 0.31 | 0.22 | 0.42 | 0.06 | ||
| Colorchecker dE 2000 * | 1.41 | 1.8 -28% | 6.2 -340% | 1.67 -18% | 1.89 -34% | 1.2 15% |
| Colorchecker dE 2000 max. * | 3.43 | 3.3 4% | 24.7 -620% | 5.71 -66% | 3.26 5% | 2.8 18% |
| Greyscale dE 2000 * | 2 | 2.3 -15% | 3.8 -90% | 3.1 -55% | 1.55 22% | 1.9 5% |
| Gamma | 2.22 99% | 2.16 102% | 2.22 99% | 2.195 100% | 2.39 92% | 2.29 96% |
| CCT | 6324 103% | 6867 95% | 6011 108% | 6498 100% | 6458 101% | 6812 95% |
| Contrast (:1) | 1571 | 1409 | 1019 | 5783 | ||
| Colorchecker dE 2000 calibrated * | 0.8 | 5.3 | 0.71 | 1.97 | ||
| Totalt genomsnitt (program/inställningar) | -553% /
-304% | -550% /
-372% | -148% /
-90% | 5% /
1% | -943% /
-617% |
* ... mindre är bättre
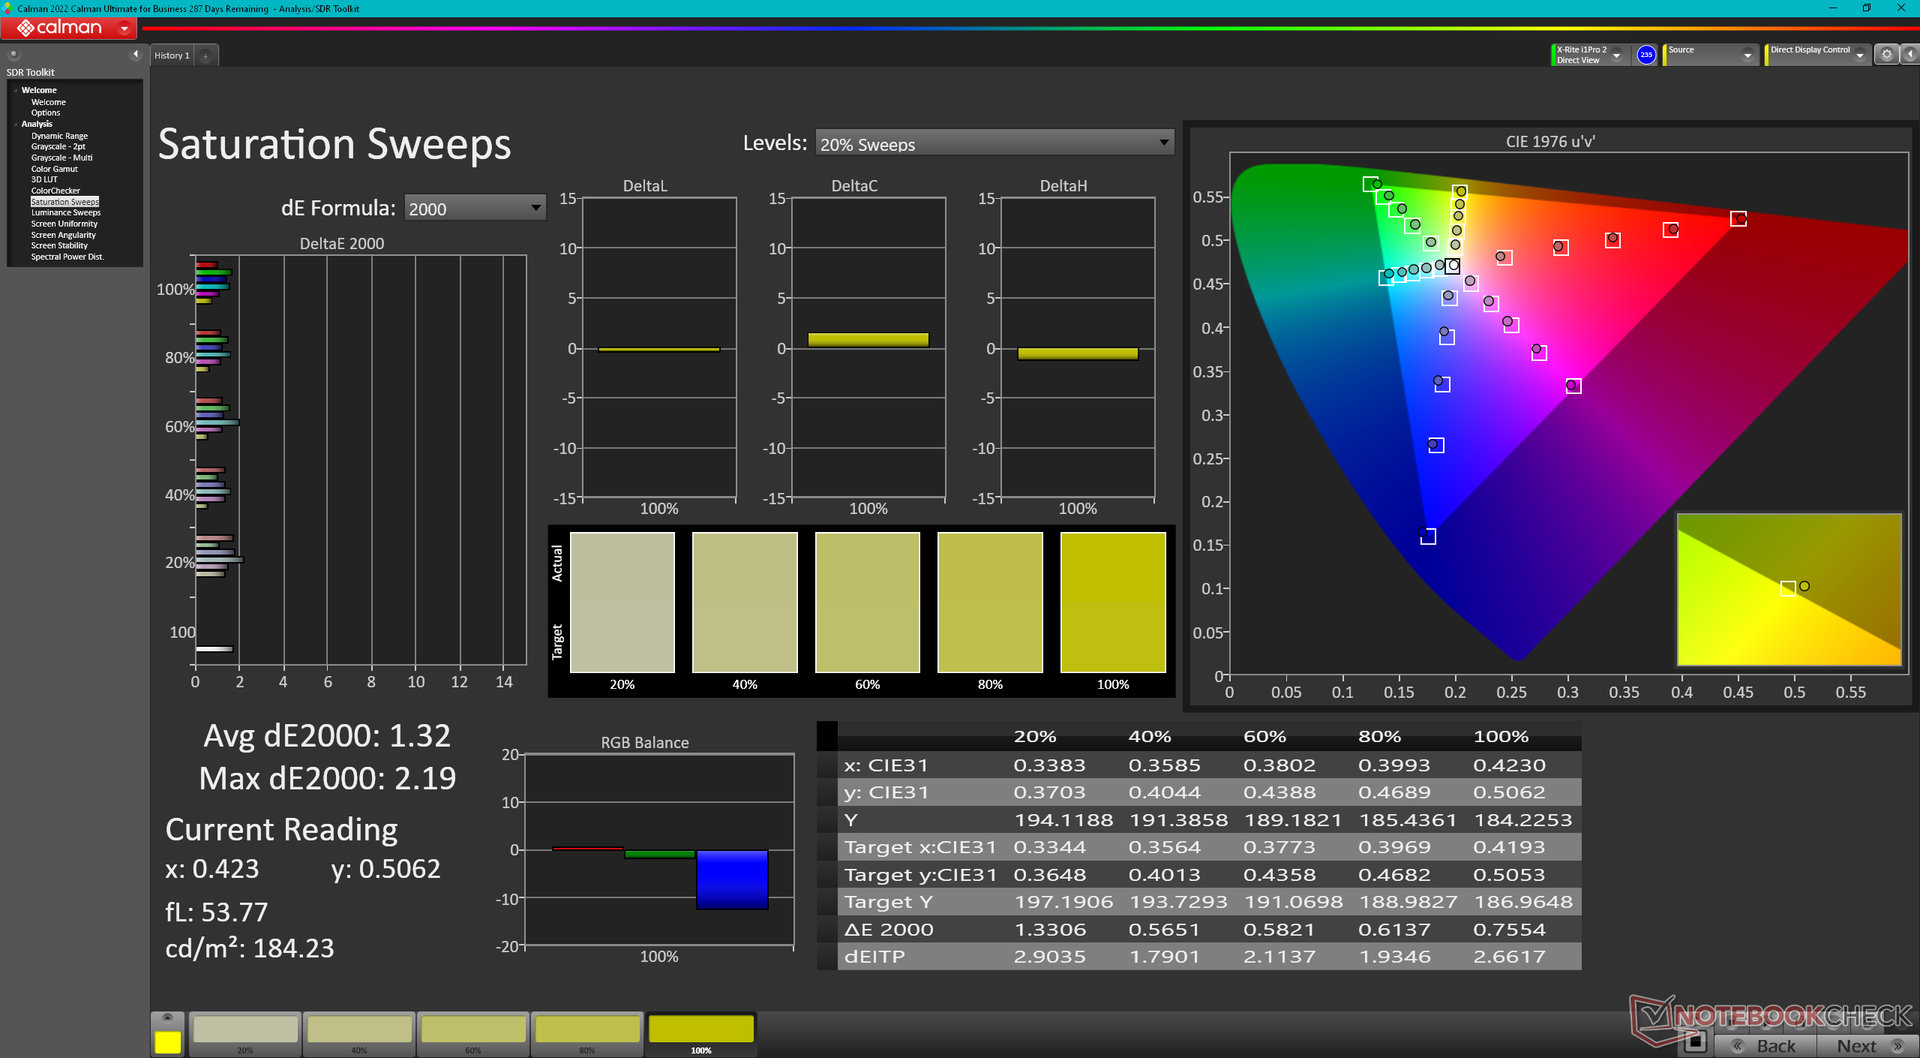
OLED-skärmen är väl kalibrerad redan från start med genomsnittliga deltaE-värden för gråskala och färg på bara 2,0 respektive 1,41. En slutanvändarkalibrering är därför inte nödvändig för de allra flesta användare.
Visa svarstider
| ↔ Svarstid svart till vitt | ||
|---|---|---|
| 1.89 ms ... stiga ↗ och falla ↘ kombinerat | ↗ ms stiga | 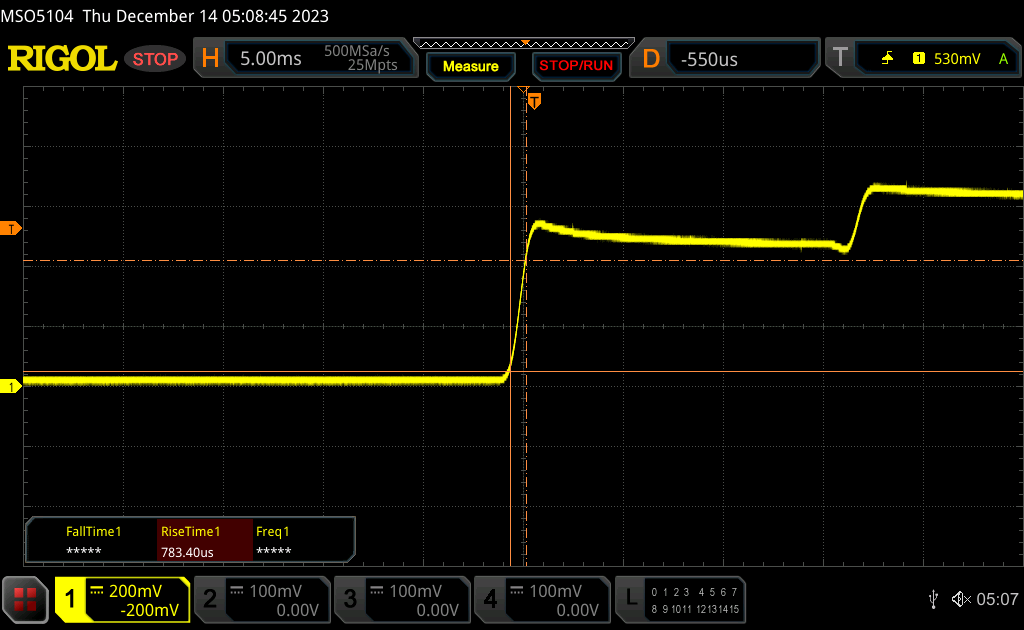 |
| ↘ 0.89 ms hösten | ||
| Skärmen visar väldigt snabba svarsfrekvenser i våra tester och borde vara mycket väl lämpad för fartfyllt spel. I jämförelse sträcker sig alla testade enheter från 0.1 (minst) till 240 (maximalt) ms. » 11 % av alla enheter är bättre. Det betyder att den uppmätta svarstiden är bättre än genomsnittet av alla testade enheter (19.8 ms). | ||
| ↔ Svarstid 50 % grått till 80 % grått | ||
| 1.86 ms ... stiga ↗ och falla ↘ kombinerat | ↗ 0.96 ms stiga | 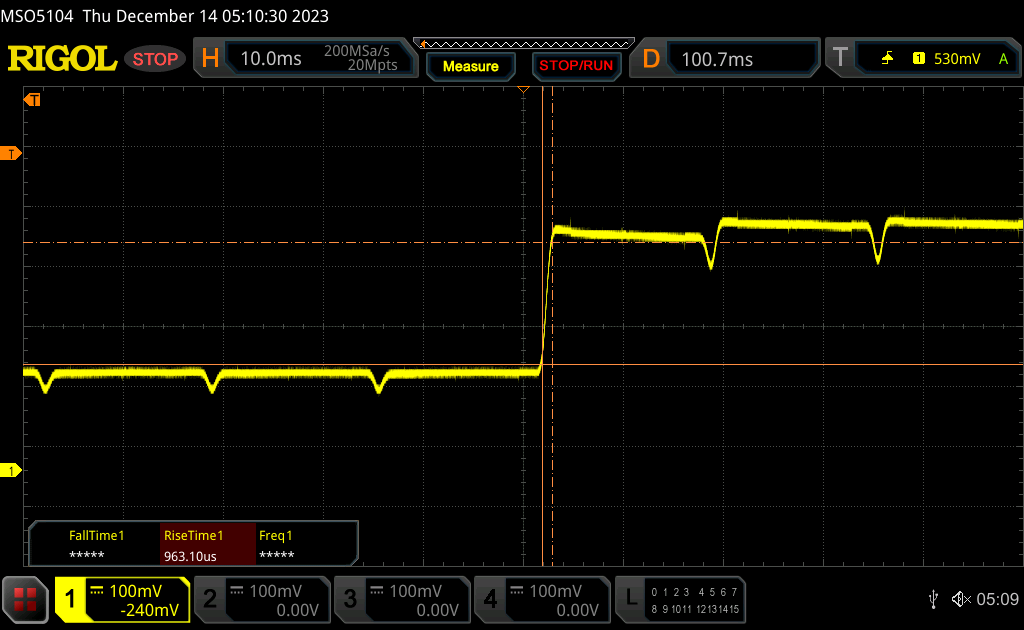 |
| ↘ 0.9 ms hösten | ||
| Skärmen visar väldigt snabba svarsfrekvenser i våra tester och borde vara mycket väl lämpad för fartfyllt spel. I jämförelse sträcker sig alla testade enheter från 0.165 (minst) till 636 (maximalt) ms. » 9 % av alla enheter är bättre. Det betyder att den uppmätta svarstiden är bättre än genomsnittet av alla testade enheter (31 ms). | ||
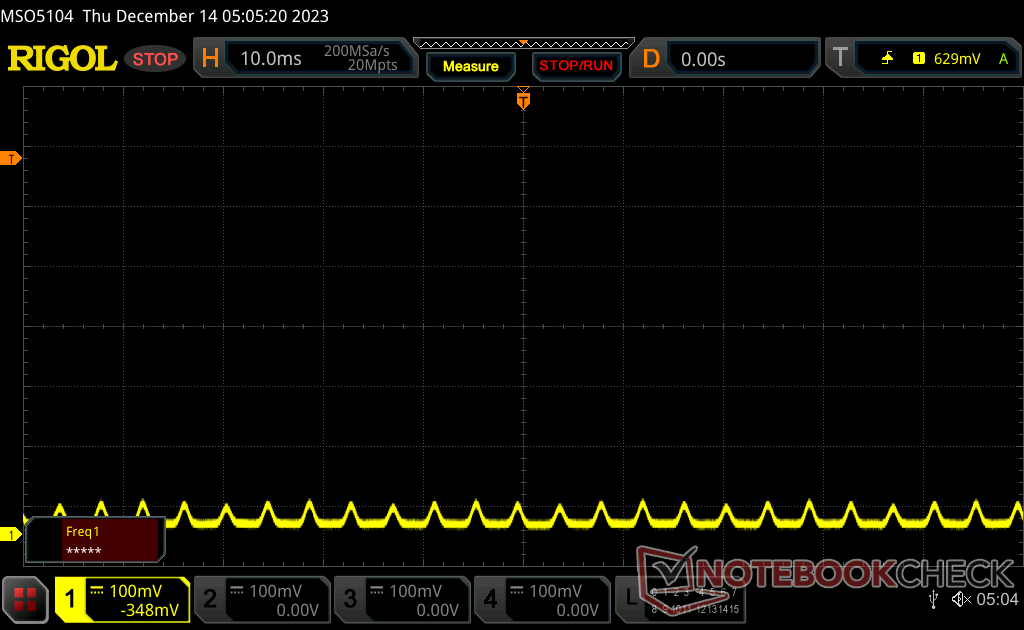
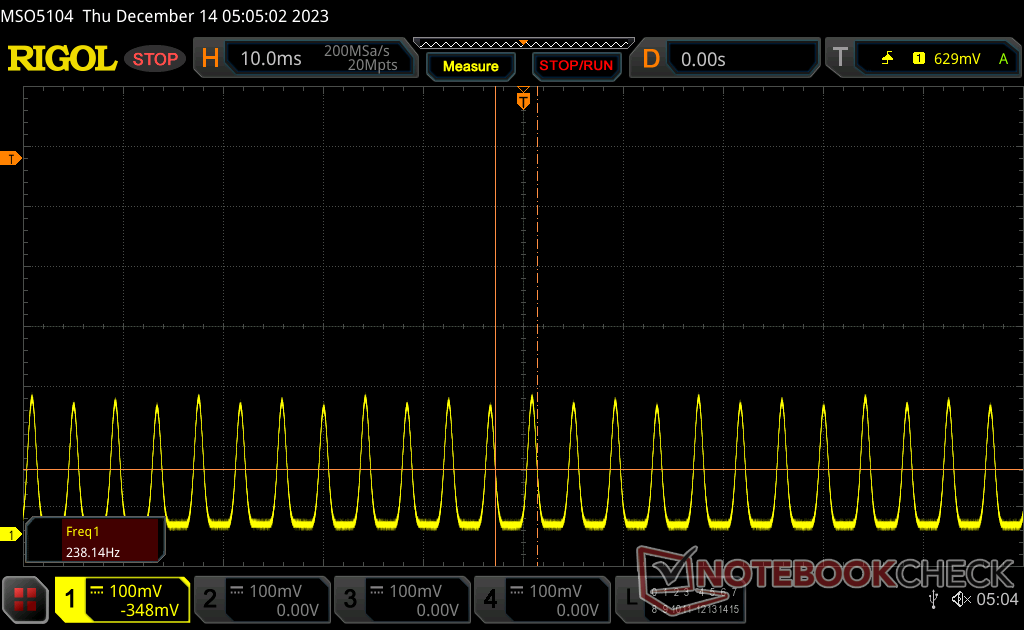
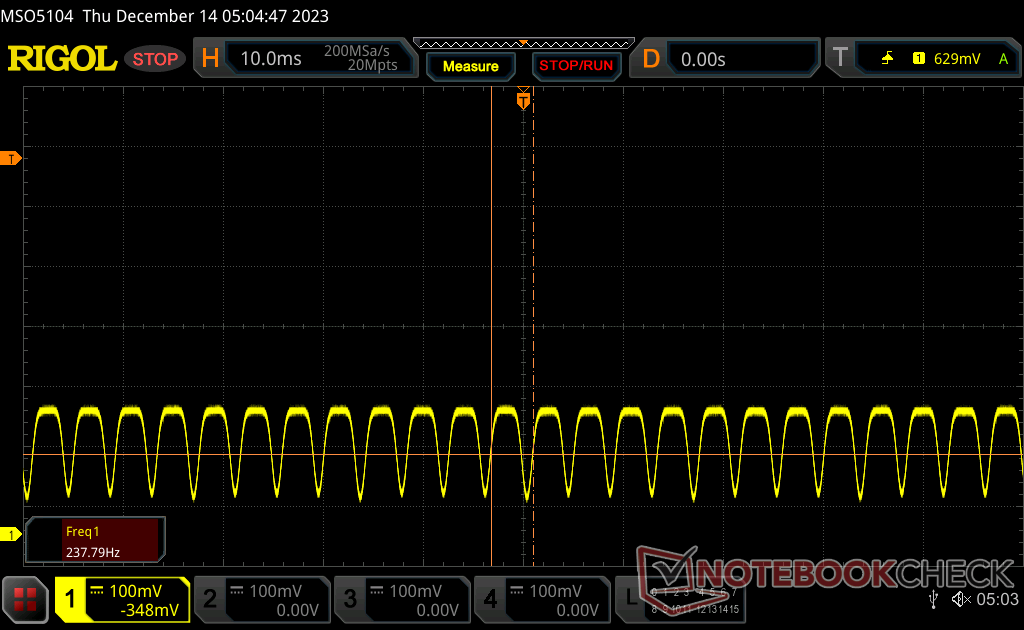
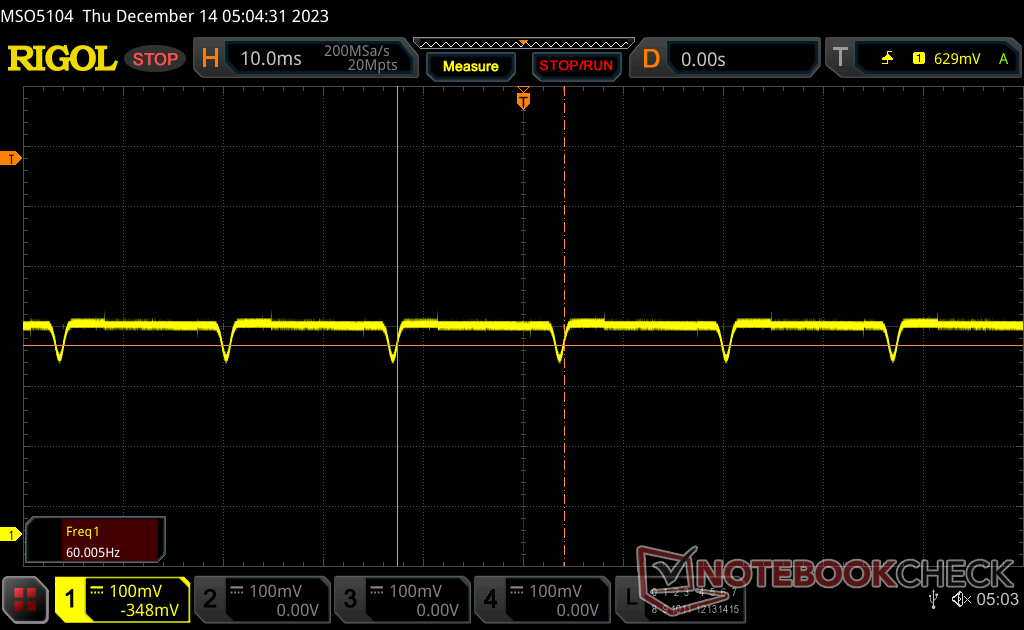
Skärmflimmer / PWM (Puls-Width Modulation)
| Skärmflimmer / PWM upptäckt | 60 Hz | ≤ 100 % ljusstyrka inställning | 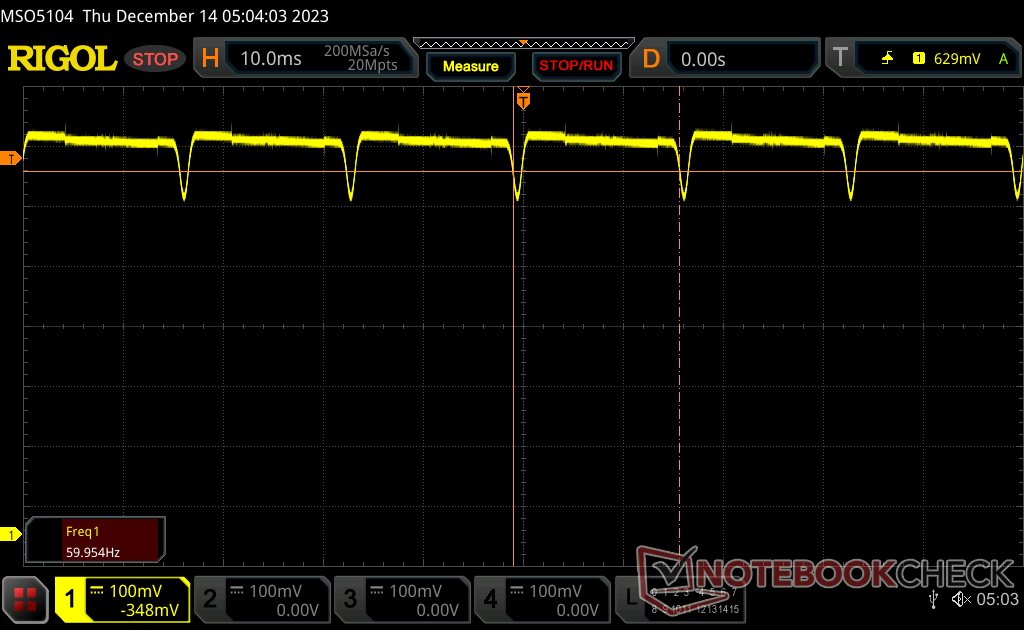 |
Displayens bakgrundsbelysning flimrar vid 60 Hz (i värsta fall, t.ex. med PWM) Flimrande upptäckt vid en ljusstyrkeinställning på 100 % och lägre. Det ska inte finnas något flimmer eller PWM över denna ljusstyrkeinställning. Frekvensen för 60 Hz är mycket låg, så flimmer kan orsaka ögon- och huvudvärk efter långvarig användning. Som jämförelse: 52 % av alla testade enheter använder inte PWM för att dämpa skärmen. Om PWM upptäcktes mättes ett medelvärde av 7781 (minst: 5 - maximum: 343500) Hz. | |||
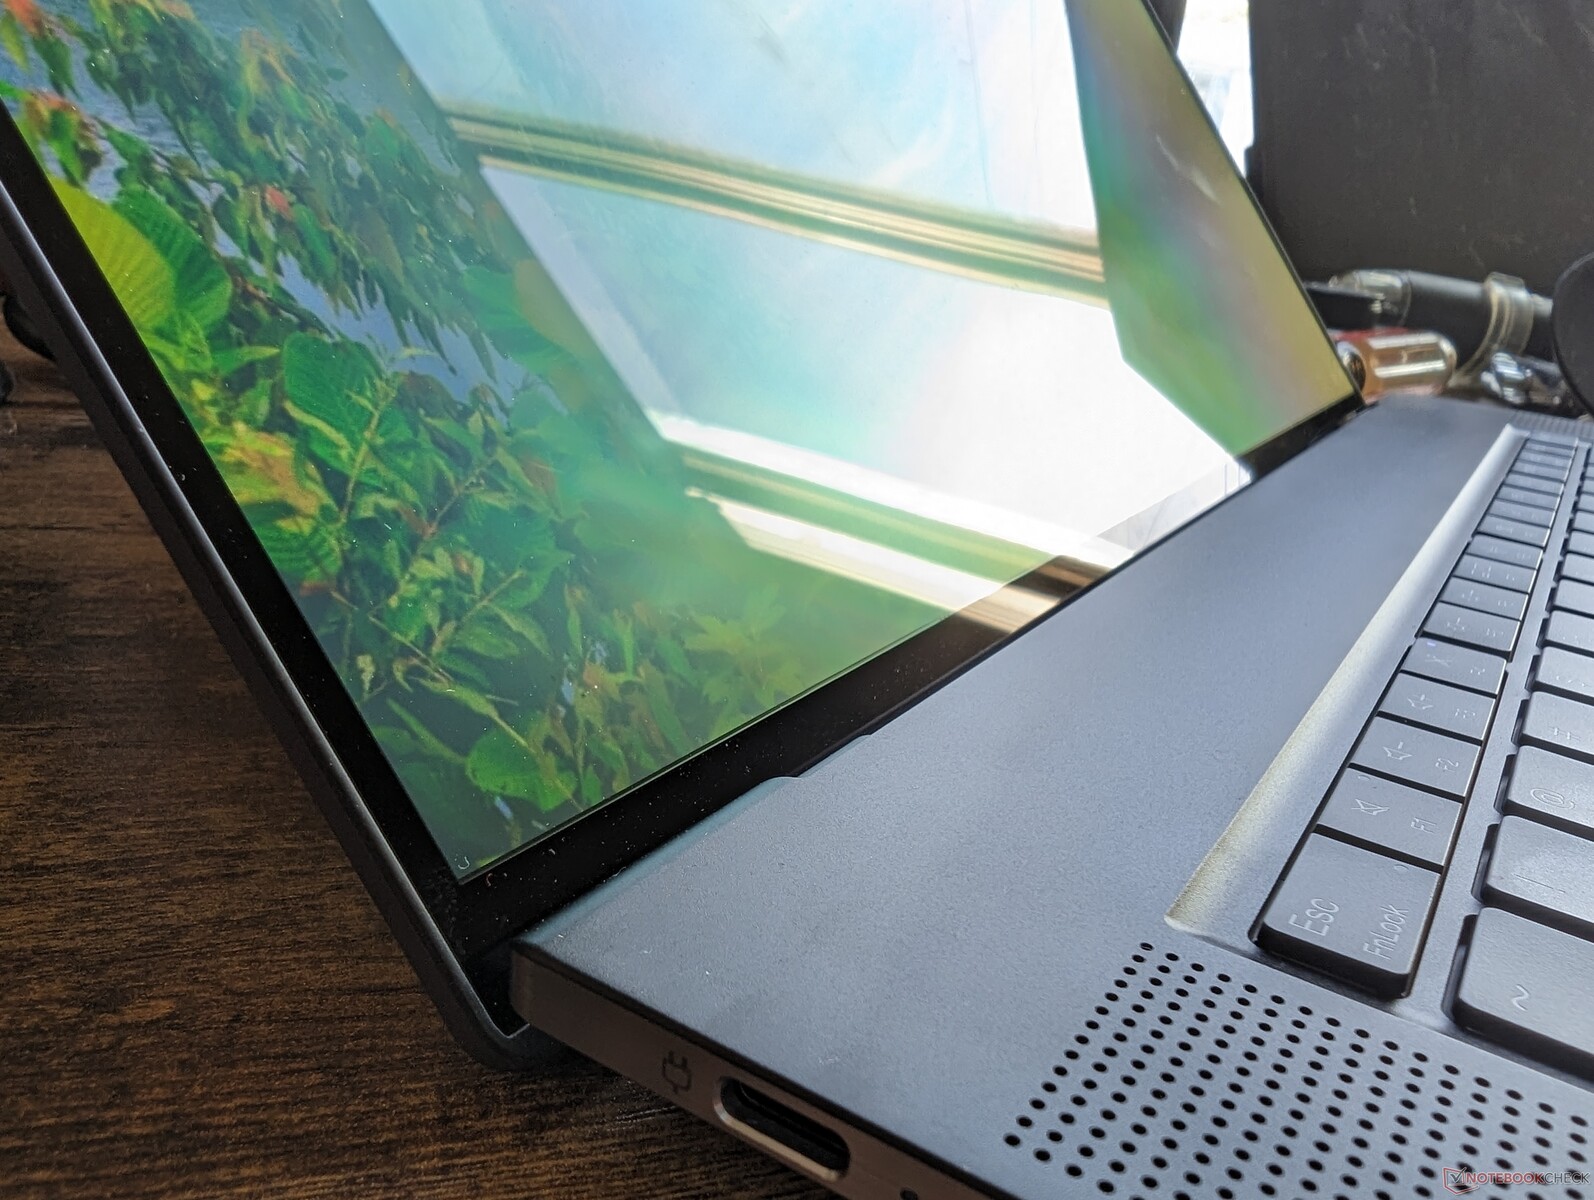
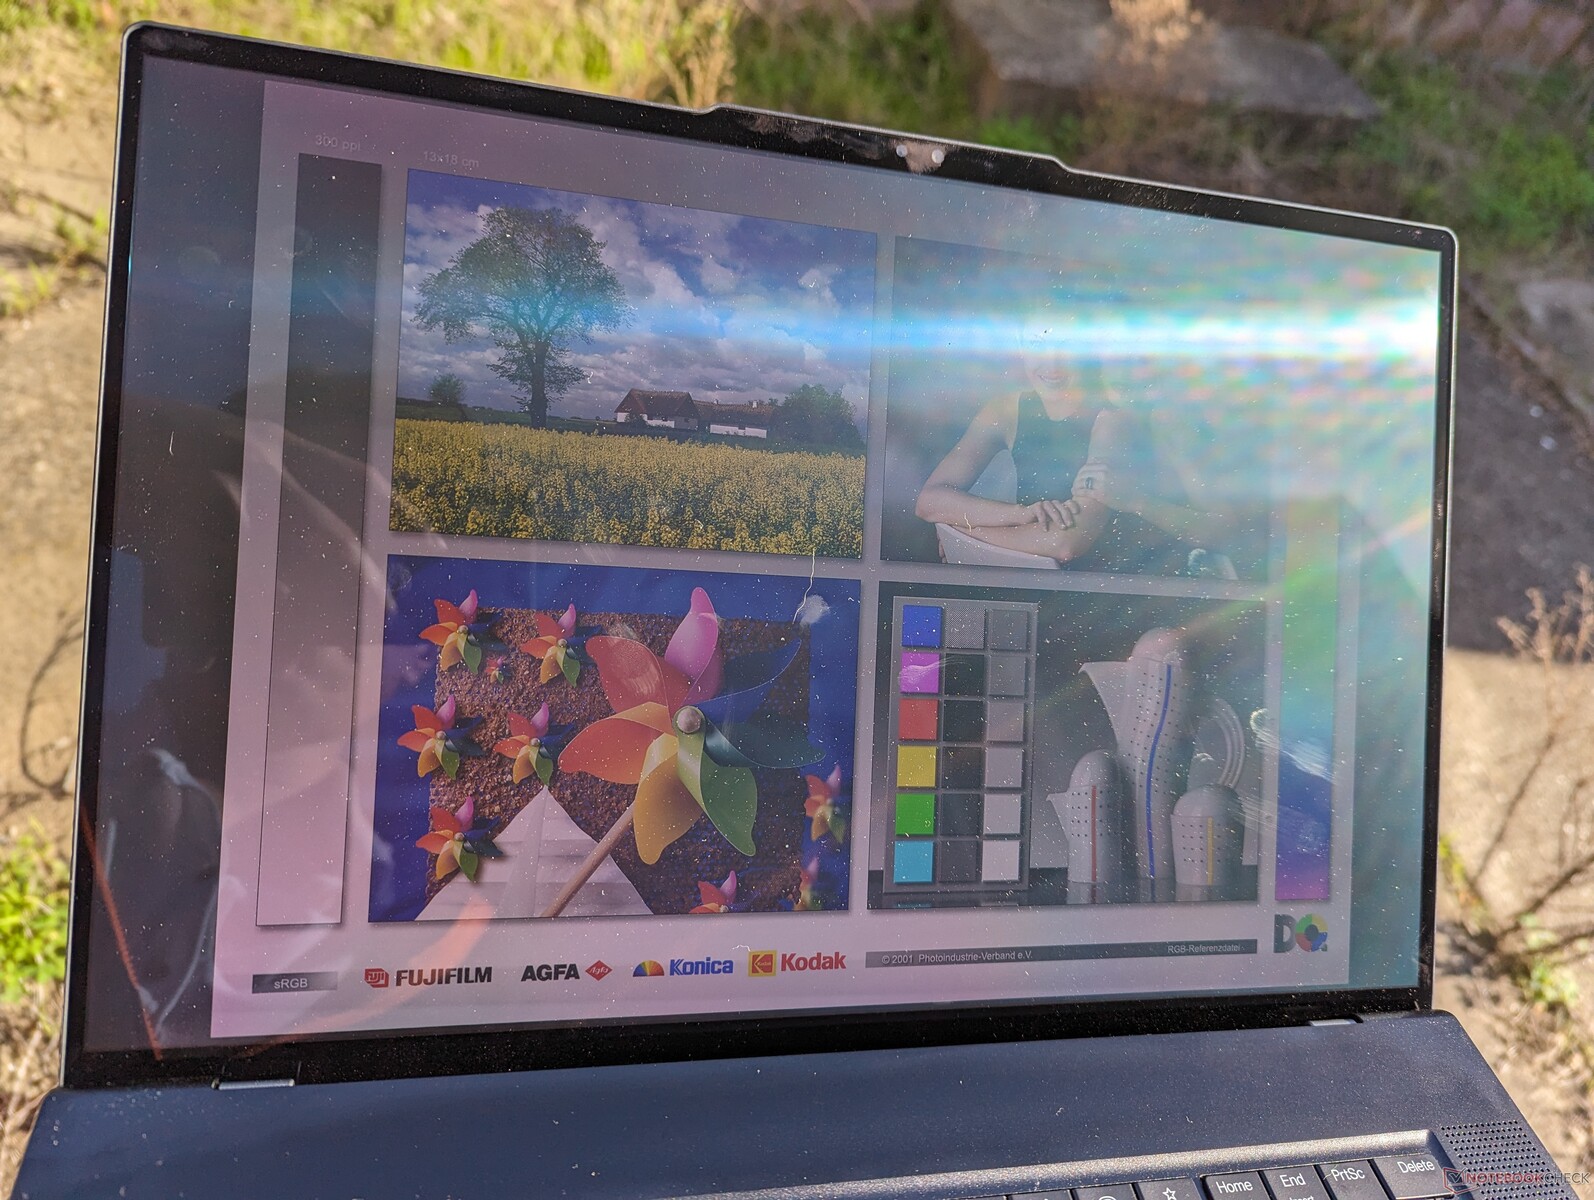
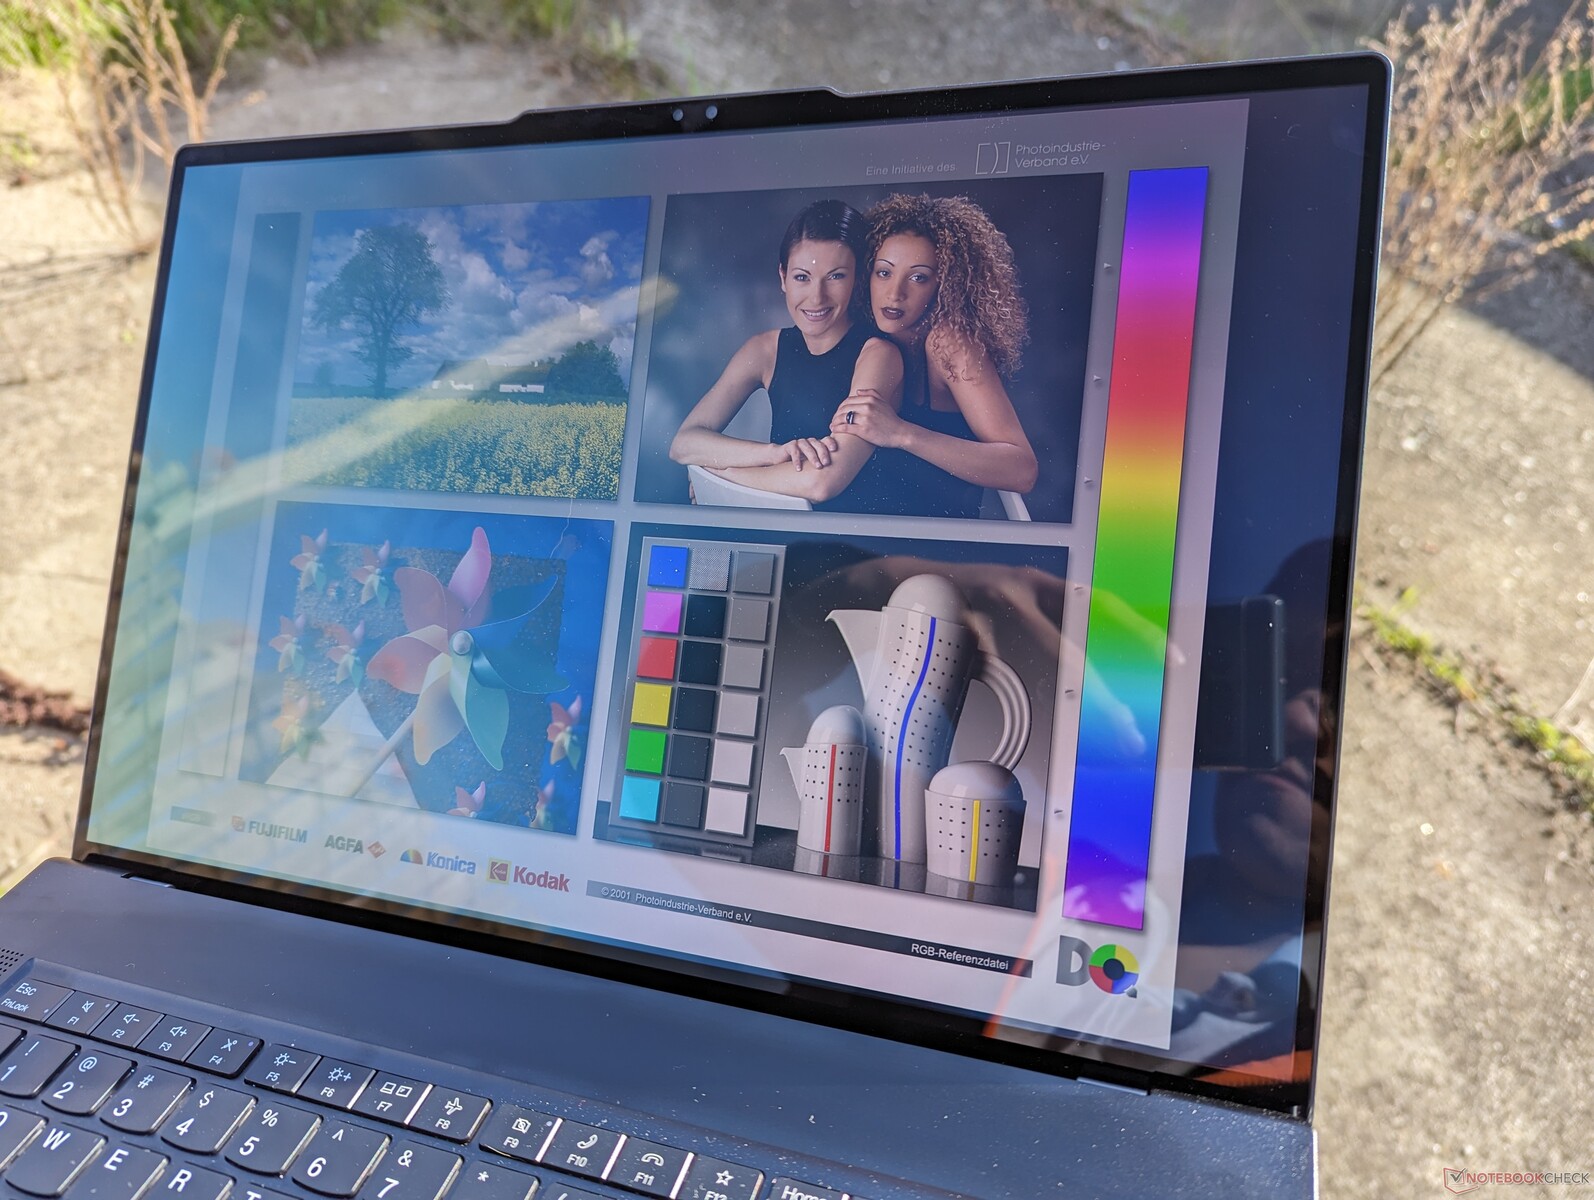
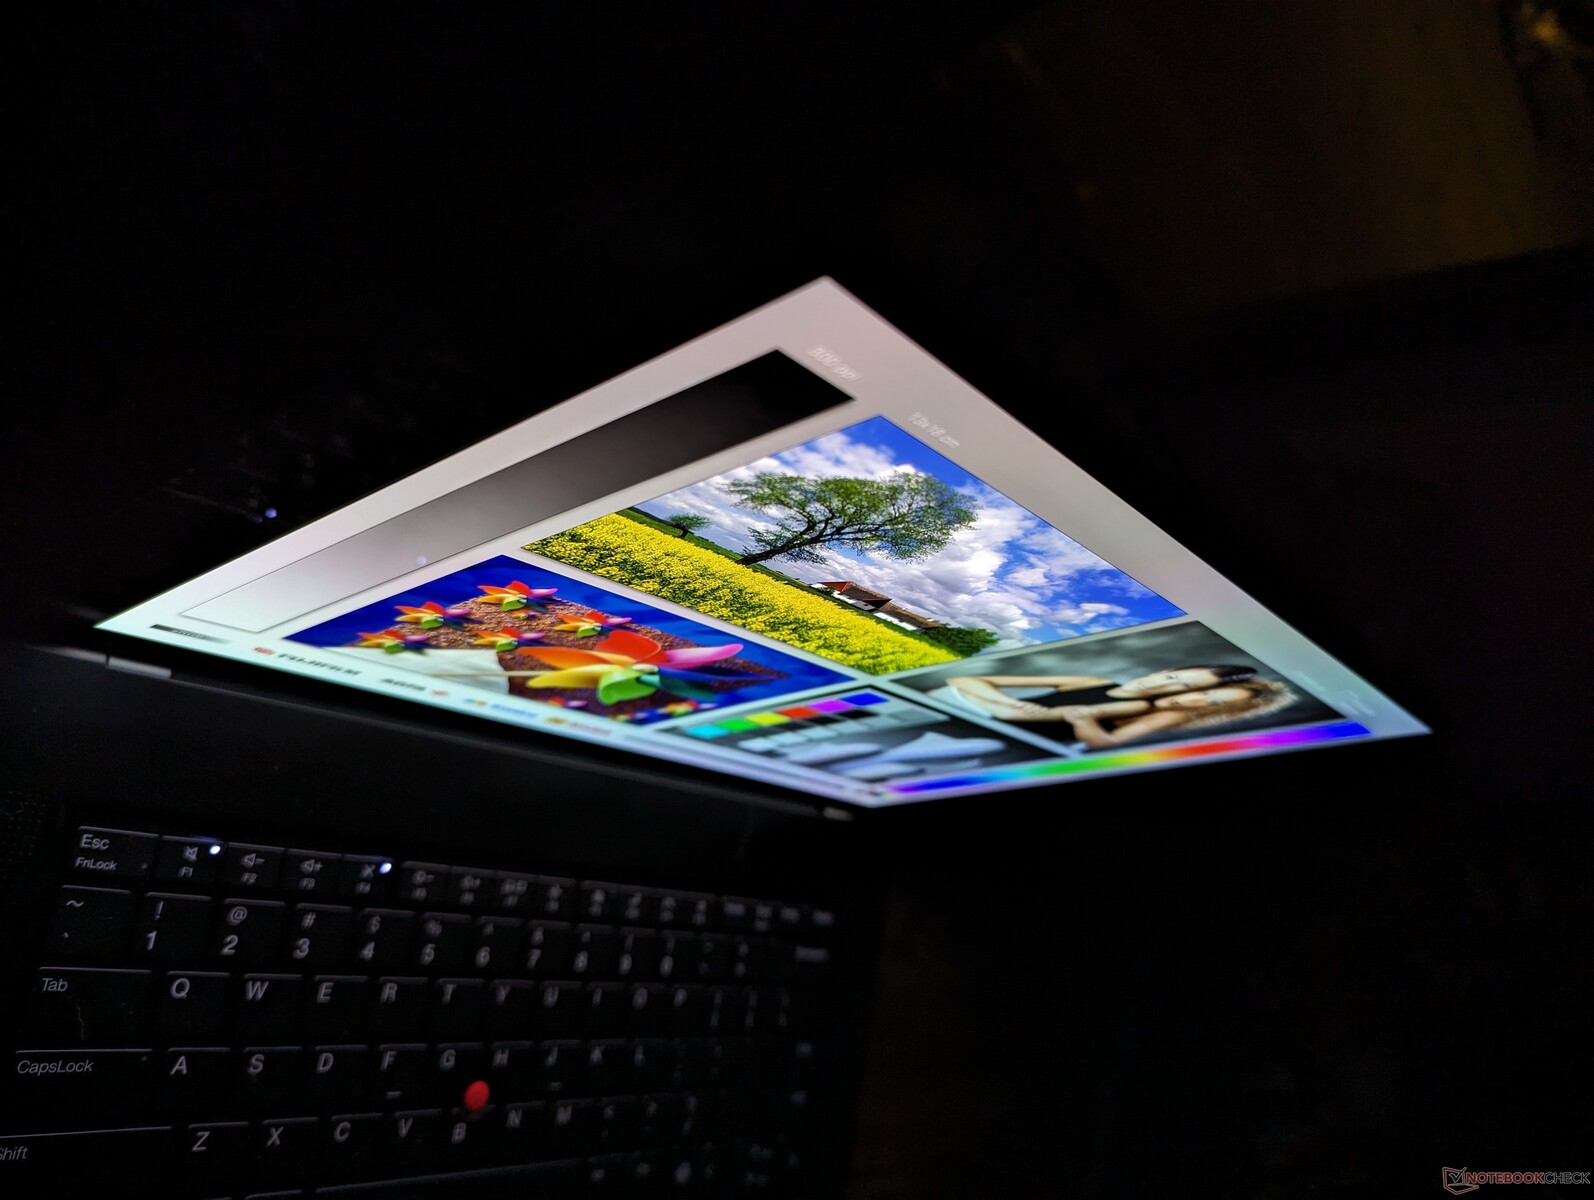
Betraktningsvinklarna är bredare än IPS medan de djupare svartnivåerna hjälper till att bibehålla färgerna i stark omgivningsbelysning. Trots detta är bländning från den glansiga ytan oundviklig och maximal ljusstyrka är inte ljusare än baskonfigurationen med 1200p IPS. Som jämförelse kan nämnas skärmen på MacBook Pro 16 50 procent ljusstarkare för bättre synlighet utomhus.
Prestanda
Villkor för testning
Vi ställde in Windows på prestandaläge innan vi körde riktmärkena nedan. Den förinstallerade programvaran Lenovo Commercial Vantage innehåller inga ytterligare inställningar för strömprofiler utöver det vanliga Windows-urvalet. Det är dock viktigt för BIOS-uppdateringar och justering av batteriladdningsbeteende.
Processor
Ryzen 9 Pro Ryzen 9 Pro 7940HS presterar identiskt med Ryzen 9 7940HS som finns på Asus TUF Gaming A16. Användare behöver alltså inte offra prestanda för att dra nytta av Pro-funktionerna. Den övergripande prestandan är jämförbar med förra årets 12:e generation Core i9-12900H i både enkel- och flertrådade arbetsbelastningar.
Prestandaskillnaderna mellan vår Zen 4 Ryzen 9 Pro 7940HS och Zen 3+ Ryzen 7 Pro 6850H i förra årets ThinkPad Z16 Gen 1 kan vara ganska betydande, 35 till 45 procent för flertrådade arbetsbelastningar på grund av det större antalet kärnor. Prestandaökningen med Zen 4 är därför en av de främsta anledningarna till att välja Gen 2-versionen av ThinkPad Z16 istället för Gen 1.
Konfigurationer i det lägre segmentet erbjuder Ryzen 7 Pro 7840HS eller Ryzen 5 Pro 7640HS istället. Ryzen 7-alternativet presterar nästan identiskt med Ryzen 9-alternativet baserat på vår tid med Lenovo Legion Slim 5 16 och det rekommenderas därför att välja en Ryzen 7-konfiguration för att spara på kostnaderna. Faktum är att Ryzen 7 Pro 7840HS har exakt samma antal kärnor och funktioner som Ryzen 9 Pro 7940HS med endast mycket små skillnader på 100 till 200 MHz i klockfrekvens.
Nedgradering till Ryzen 5 Pro 7640HS-konfigurationen förväntas påverka processorprestandan mer markant med cirka 30 till 35 procent baserat på vår tid med HP ZBook Firefly 14 G10. Prestandadeltan mellan Ryzen 5-, Ryzen 7- och Ryzen 9-alternativen är därför kraftigt skev mellan Ryzen 5- och Ryzen 7 SKU:erna.
Cinebench R15 Multi Loop
Cinebench R23: Multi Core | Single Core
Cinebench R20: CPU (Multi Core) | CPU (Single Core)
Cinebench R15: CPU Multi 64Bit | CPU Single 64Bit
Blender: v2.79 BMW27 CPU
7-Zip 18.03: 7z b 4 | 7z b 4 -mmt1
Geekbench 5.5: Multi-Core | Single-Core
HWBOT x265 Benchmark v2.2: 4k Preset
LibreOffice : 20 Documents To PDF
R Benchmark 2.5: Overall mean
* ... mindre är bättre
AIDA64: FP32 Ray-Trace | FPU Julia | CPU SHA3 | CPU Queen | FPU SinJulia | FPU Mandel | CPU AES | CPU ZLib | FP64 Ray-Trace | CPU PhotoWorxx
| Performance rating | |
| Lenovo ThinkPad Z16 Gen 2 | |
| Asus Vivobook Pro 16X K6604JV-MX016W | |
| Genomsnitt AMD Ryzen 9 PRO 7940HS | |
| Lenovo ThinkPad Z16 G1 21D5S00T00 | |
| MSI Creator Z16P B12UHST | |
| Lenovo ThinkBook 16 G6 ABP | |
| AIDA64 / FP32 Ray-Trace | |
| Lenovo ThinkPad Z16 Gen 2 | |
| Genomsnitt AMD Ryzen 9 PRO 7940HS (24034 - 27411, n=3) | |
| Asus Vivobook Pro 16X K6604JV-MX016W | |
| Lenovo ThinkPad Z16 G1 21D5S00T00 | |
| Lenovo ThinkBook 16 G6 ABP | |
| MSI Creator Z16P B12UHST | |
| AIDA64 / FPU Julia | |
| Lenovo ThinkPad Z16 Gen 2 | |
| Asus Vivobook Pro 16X K6604JV-MX016W | |
| Genomsnitt AMD Ryzen 9 PRO 7940HS (101262 - 116960, n=3) | |
| Lenovo ThinkPad Z16 G1 21D5S00T00 | |
| Lenovo ThinkBook 16 G6 ABP | |
| MSI Creator Z16P B12UHST | |
| AIDA64 / CPU SHA3 | |
| Asus Vivobook Pro 16X K6604JV-MX016W | |
| Lenovo ThinkPad Z16 Gen 2 | |
| Genomsnitt AMD Ryzen 9 PRO 7940HS (4418 - 4944, n=3) | |
| Lenovo ThinkPad Z16 G1 21D5S00T00 | |
| MSI Creator Z16P B12UHST | |
| Lenovo ThinkBook 16 G6 ABP | |
| AIDA64 / CPU Queen | |
| Asus Vivobook Pro 16X K6604JV-MX016W | |
| Lenovo ThinkPad Z16 Gen 2 | |
| Genomsnitt AMD Ryzen 9 PRO 7940HS (112873 - 124565, n=3) | |
| MSI Creator Z16P B12UHST | |
| Lenovo ThinkPad Z16 G1 21D5S00T00 | |
| Lenovo ThinkBook 16 G6 ABP | |
| AIDA64 / FPU SinJulia | |
| Lenovo ThinkPad Z16 Gen 2 | |
| Genomsnitt AMD Ryzen 9 PRO 7940HS (14147 - 15304, n=3) | |
| Asus Vivobook Pro 16X K6604JV-MX016W | |
| Lenovo ThinkPad Z16 G1 21D5S00T00 | |
| MSI Creator Z16P B12UHST | |
| Lenovo ThinkBook 16 G6 ABP | |
| AIDA64 / FPU Mandel | |
| Lenovo ThinkPad Z16 Gen 2 | |
| Genomsnitt AMD Ryzen 9 PRO 7940HS (54003 - 62357, n=3) | |
| Asus Vivobook Pro 16X K6604JV-MX016W | |
| Lenovo ThinkPad Z16 G1 21D5S00T00 | |
| Lenovo ThinkBook 16 G6 ABP | |
| MSI Creator Z16P B12UHST | |
| AIDA64 / CPU AES | |
| Asus Vivobook Pro 16X K6604JV-MX016W | |
| MSI Creator Z16P B12UHST | |
| Lenovo ThinkPad Z16 Gen 2 | |
| Genomsnitt AMD Ryzen 9 PRO 7940HS (76133 - 88705, n=3) | |
| Lenovo ThinkPad Z16 G1 21D5S00T00 | |
| Lenovo ThinkBook 16 G6 ABP | |
| AIDA64 / CPU ZLib | |
| Asus Vivobook Pro 16X K6604JV-MX016W | |
| MSI Creator Z16P B12UHST | |
| Lenovo ThinkPad Z16 Gen 2 | |
| Genomsnitt AMD Ryzen 9 PRO 7940HS (976 - 1079, n=3) | |
| Lenovo ThinkPad Z16 G1 21D5S00T00 | |
| Lenovo ThinkBook 16 G6 ABP | |
| AIDA64 / FP64 Ray-Trace | |
| Lenovo ThinkPad Z16 Gen 2 | |
| Genomsnitt AMD Ryzen 9 PRO 7940HS (12715 - 14590, n=3) | |
| Asus Vivobook Pro 16X K6604JV-MX016W | |
| Lenovo ThinkPad Z16 G1 21D5S00T00 | |
| Lenovo ThinkBook 16 G6 ABP | |
| MSI Creator Z16P B12UHST | |
| AIDA64 / CPU PhotoWorxx | |
| Asus Vivobook Pro 16X K6604JV-MX016W | |
| MSI Creator Z16P B12UHST | |
| Lenovo ThinkPad Z16 Gen 2 | |
| Genomsnitt AMD Ryzen 9 PRO 7940HS (24030 - 37800, n=3) | |
| Lenovo ThinkPad Z16 G1 21D5S00T00 | |
| Lenovo ThinkBook 16 G6 ABP | |
Systemets prestanda
CrossMark: Overall | Productivity | Creativity | Responsiveness
WebXPRT 3: Overall
WebXPRT 4: Overall
Mozilla Kraken 1.1: Total
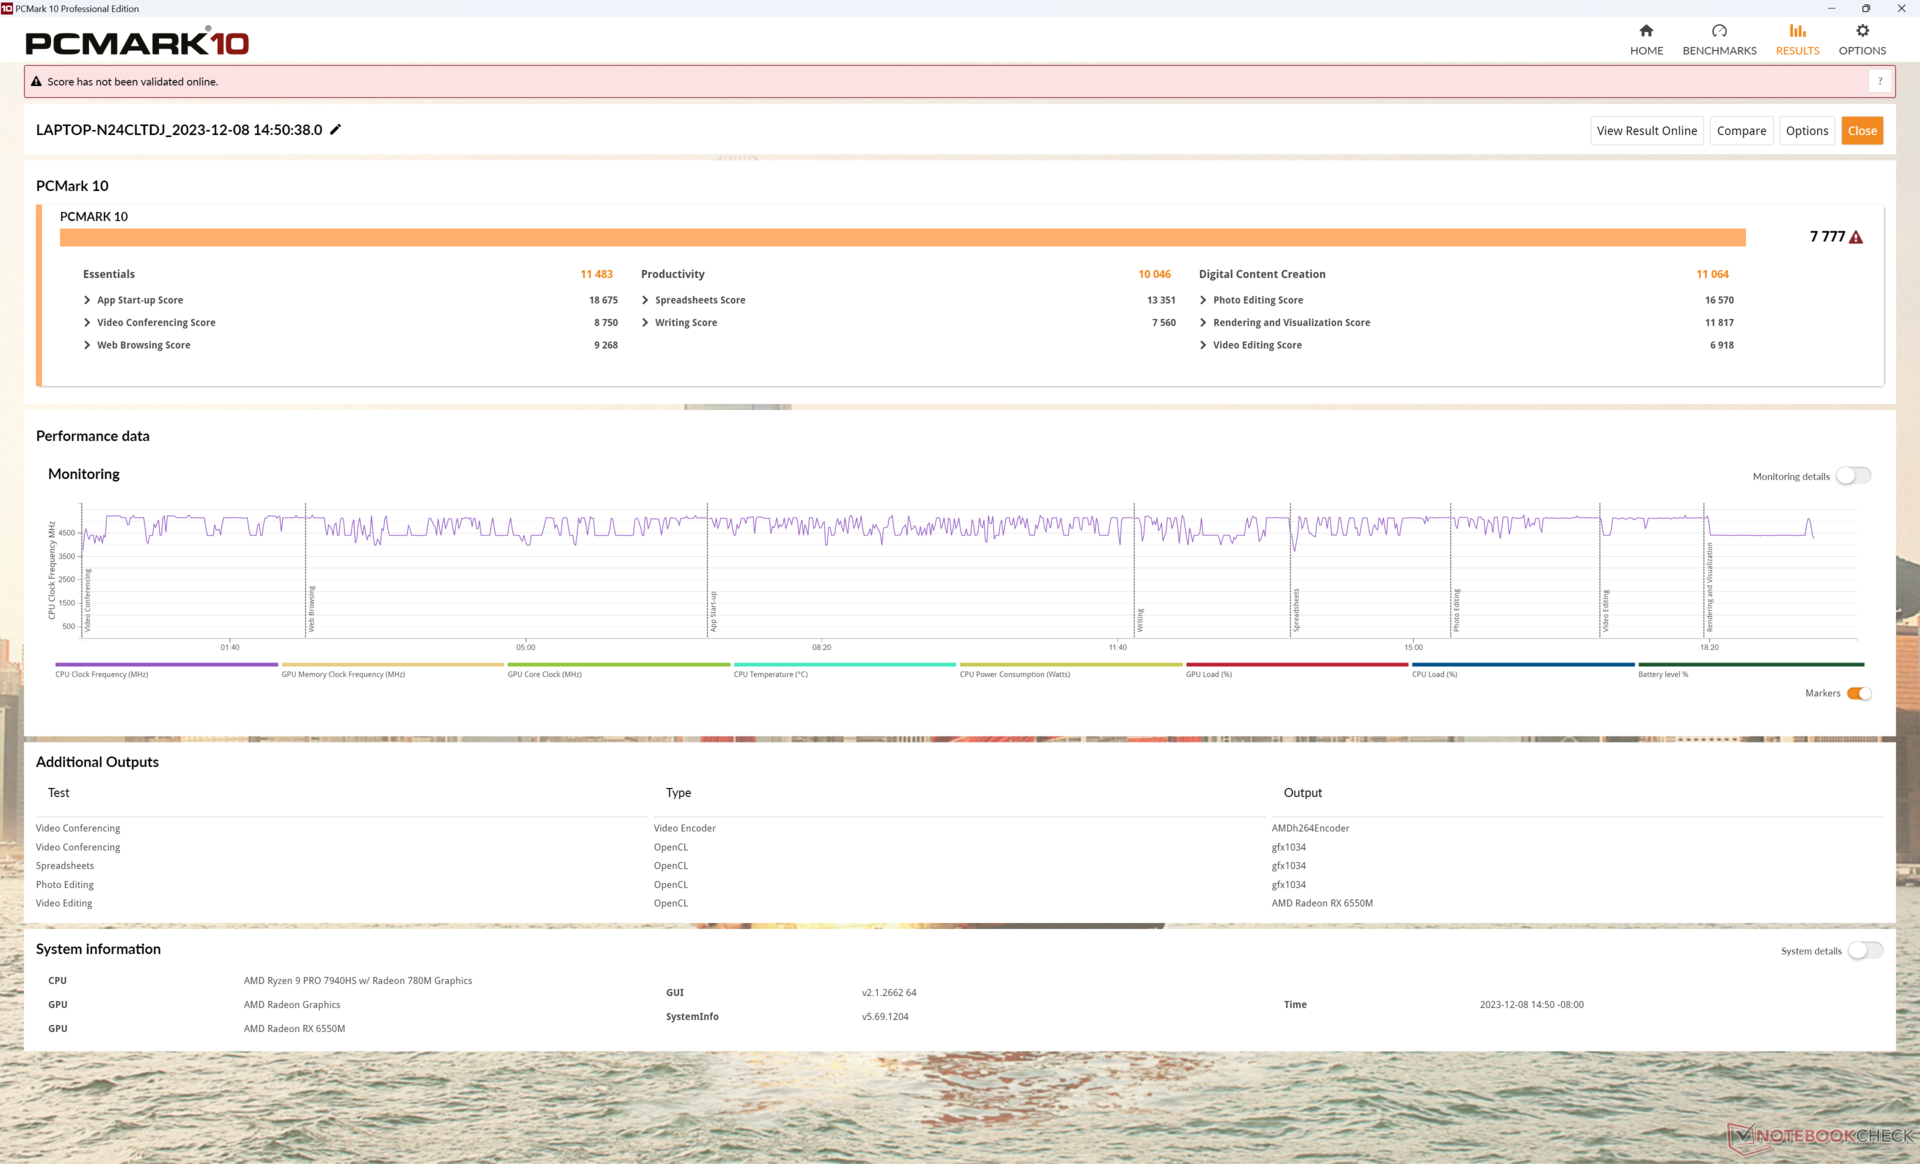
| PCMark 10 / Score | |
| MSI Creator Z16P B12UHST | |
| Lenovo ThinkPad Z16 Gen 2 | |
| Genomsnitt AMD Ryzen 9 PRO 7940HS, AMD Radeon RX 6550M (n=1) | |
| Asus Vivobook Pro 16X K6604JV-MX016W | |
| Lenovo ThinkPad Z16 G1 21D5S00T00 | |
| Lenovo ThinkBook 16 G6 ABP | |
| PCMark 10 / Essentials | |
| Lenovo ThinkPad Z16 Gen 2 | |
| Genomsnitt AMD Ryzen 9 PRO 7940HS, AMD Radeon RX 6550M (n=1) | |
| MSI Creator Z16P B12UHST | |
| Lenovo ThinkBook 16 G6 ABP | |
| Asus Vivobook Pro 16X K6604JV-MX016W | |
| Lenovo ThinkPad Z16 G1 21D5S00T00 | |
| PCMark 10 / Productivity | |
| MSI Creator Z16P B12UHST | |
| Lenovo ThinkPad Z16 Gen 2 | |
| Genomsnitt AMD Ryzen 9 PRO 7940HS, AMD Radeon RX 6550M (n=1) | |
| Lenovo ThinkBook 16 G6 ABP | |
| Asus Vivobook Pro 16X K6604JV-MX016W | |
| Lenovo ThinkPad Z16 G1 21D5S00T00 | |
| PCMark 10 / Digital Content Creation | |
| MSI Creator Z16P B12UHST | |
| Lenovo ThinkPad Z16 Gen 2 | |
| Genomsnitt AMD Ryzen 9 PRO 7940HS, AMD Radeon RX 6550M (n=1) | |
| Asus Vivobook Pro 16X K6604JV-MX016W | |
| Lenovo ThinkPad Z16 G1 21D5S00T00 | |
| Lenovo ThinkBook 16 G6 ABP | |
| CrossMark / Overall | |
| Asus Vivobook Pro 16X K6604JV-MX016W | |
| Apple MacBook Pro 16 2023 M3 Pro | |
| Lenovo ThinkPad Z16 Gen 2 | |
| Genomsnitt AMD Ryzen 9 PRO 7940HS, AMD Radeon RX 6550M (n=1) | |
| Lenovo ThinkPad Z16 G1 21D5S00T00 | |
| Lenovo ThinkBook 16 G6 ABP | |
| CrossMark / Productivity | |
| Asus Vivobook Pro 16X K6604JV-MX016W | |
| Apple MacBook Pro 16 2023 M3 Pro | |
| Lenovo ThinkPad Z16 Gen 2 | |
| Genomsnitt AMD Ryzen 9 PRO 7940HS, AMD Radeon RX 6550M (n=1) | |
| Lenovo ThinkPad Z16 G1 21D5S00T00 | |
| Lenovo ThinkBook 16 G6 ABP | |
| CrossMark / Creativity | |
| Apple MacBook Pro 16 2023 M3 Pro | |
| Asus Vivobook Pro 16X K6604JV-MX016W | |
| Lenovo ThinkPad Z16 Gen 2 | |
| Genomsnitt AMD Ryzen 9 PRO 7940HS, AMD Radeon RX 6550M (n=1) | |
| Lenovo ThinkPad Z16 G1 21D5S00T00 | |
| Lenovo ThinkBook 16 G6 ABP | |
| CrossMark / Responsiveness | |
| Asus Vivobook Pro 16X K6604JV-MX016W | |
| Apple MacBook Pro 16 2023 M3 Pro | |
| Lenovo ThinkPad Z16 Gen 2 | |
| Genomsnitt AMD Ryzen 9 PRO 7940HS, AMD Radeon RX 6550M (n=1) | |
| Lenovo ThinkPad Z16 G1 21D5S00T00 | |
| Lenovo ThinkBook 16 G6 ABP | |
| WebXPRT 3 / Overall | |
| Apple MacBook Pro 16 2023 M3 Pro | |
| MSI Creator Z16P B12UHST | |
| Lenovo ThinkPad Z16 Gen 2 | |
| Genomsnitt AMD Ryzen 9 PRO 7940HS, AMD Radeon RX 6550M (n=1) | |
| Asus Vivobook Pro 16X K6604JV-MX016W | |
| Lenovo ThinkBook 16 G6 ABP | |
| Lenovo ThinkPad Z16 G1 21D5S00T00 | |
| WebXPRT 4 / Overall | |
| Lenovo ThinkPad Z16 Gen 2 | |
| Genomsnitt AMD Ryzen 9 PRO 7940HS, AMD Radeon RX 6550M (n=1) | |
| Asus Vivobook Pro 16X K6604JV-MX016W | |
| Lenovo ThinkBook 16 G6 ABP | |
| Lenovo ThinkPad Z16 G1 21D5S00T00 | |
| Mozilla Kraken 1.1 / Total | |
| Lenovo ThinkBook 16 G6 ABP | |
| Lenovo ThinkPad Z16 G1 21D5S00T00 | |
| Lenovo ThinkPad Z16 Gen 2 | |
| Genomsnitt AMD Ryzen 9 PRO 7940HS, AMD Radeon RX 6550M (n=1) | |
| Asus Vivobook Pro 16X K6604JV-MX016W | |
| MSI Creator Z16P B12UHST | |
| Apple MacBook Pro 16 2023 M3 Pro | |
* ... mindre är bättre
| PCMark 10 Score | 7777 poäng | |
Hjälp | ||
| AIDA64 / Memory Copy | |
| Asus Vivobook Pro 16X K6604JV-MX016W | |
| Lenovo ThinkPad Z16 Gen 2 | |
| MSI Creator Z16P B12UHST | |
| Lenovo ThinkPad Z16 G1 21D5S00T00 | |
| Genomsnitt AMD Ryzen 9 PRO 7940HS (34339 - 66740, n=3) | |
| Lenovo ThinkBook 16 G6 ABP | |
| AIDA64 / Memory Read | |
| Asus Vivobook Pro 16X K6604JV-MX016W | |
| MSI Creator Z16P B12UHST | |
| Lenovo ThinkPad Z16 Gen 2 | |
| Lenovo ThinkPad Z16 G1 21D5S00T00 | |
| Lenovo ThinkBook 16 G6 ABP | |
| Genomsnitt AMD Ryzen 9 PRO 7940HS (30289 - 50398, n=3) | |
| AIDA64 / Memory Write | |
| Lenovo ThinkPad Z16 Gen 2 | |
| Asus Vivobook Pro 16X K6604JV-MX016W | |
| MSI Creator Z16P B12UHST | |
| Genomsnitt AMD Ryzen 9 PRO 7940HS (39877 - 91516, n=3) | |
| Lenovo ThinkPad Z16 G1 21D5S00T00 | |
| Lenovo ThinkBook 16 G6 ABP | |
| AIDA64 / Memory Latency | |
| Lenovo ThinkPad Z16 G1 21D5S00T00 | |
| Lenovo ThinkPad Z16 Gen 2 | |
| Genomsnitt AMD Ryzen 9 PRO 7940HS (102.2 - 121.3, n=3) | |
| Lenovo ThinkBook 16 G6 ABP | |
| MSI Creator Z16P B12UHST | |
| Asus Vivobook Pro 16X K6604JV-MX016W | |
* ... mindre är bättre
DPC-fördröjning
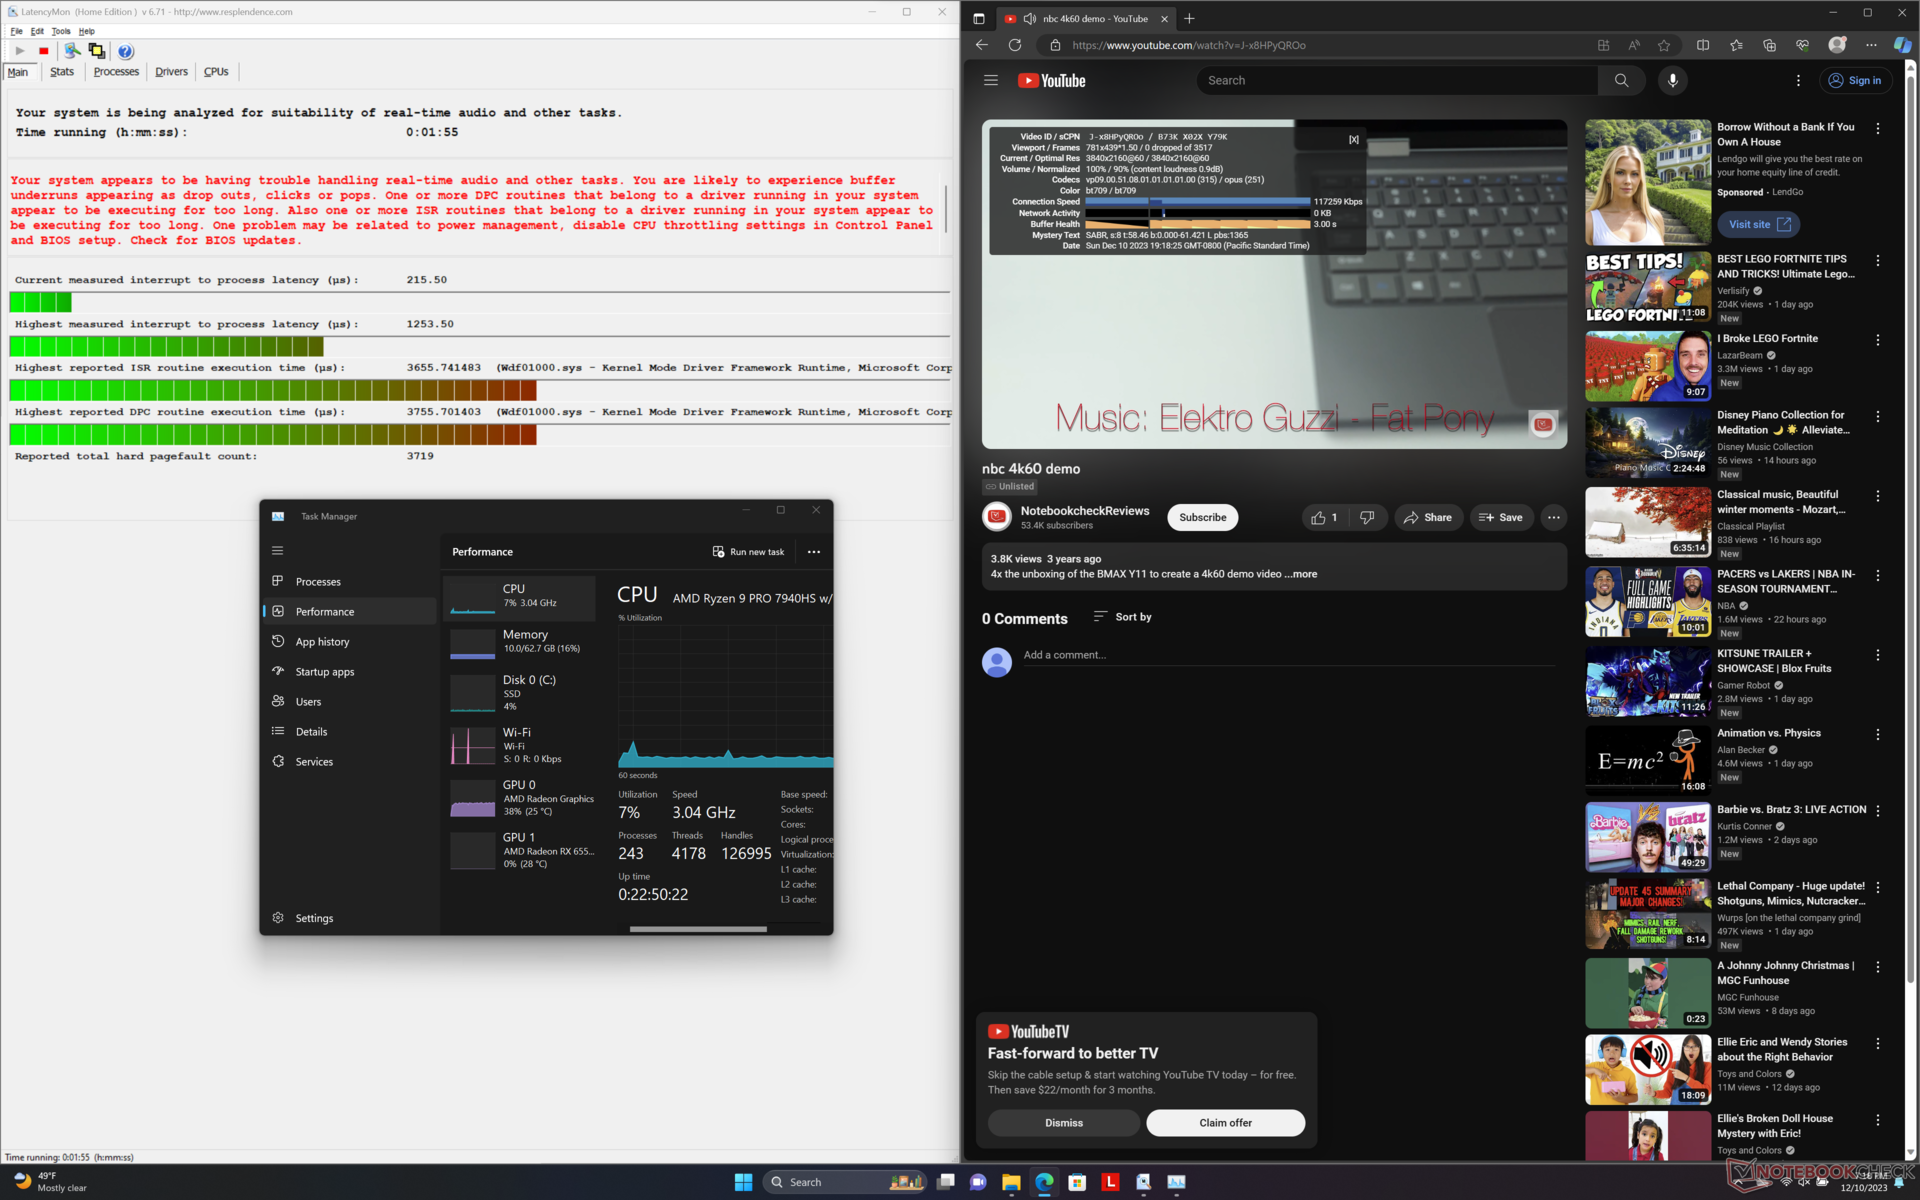
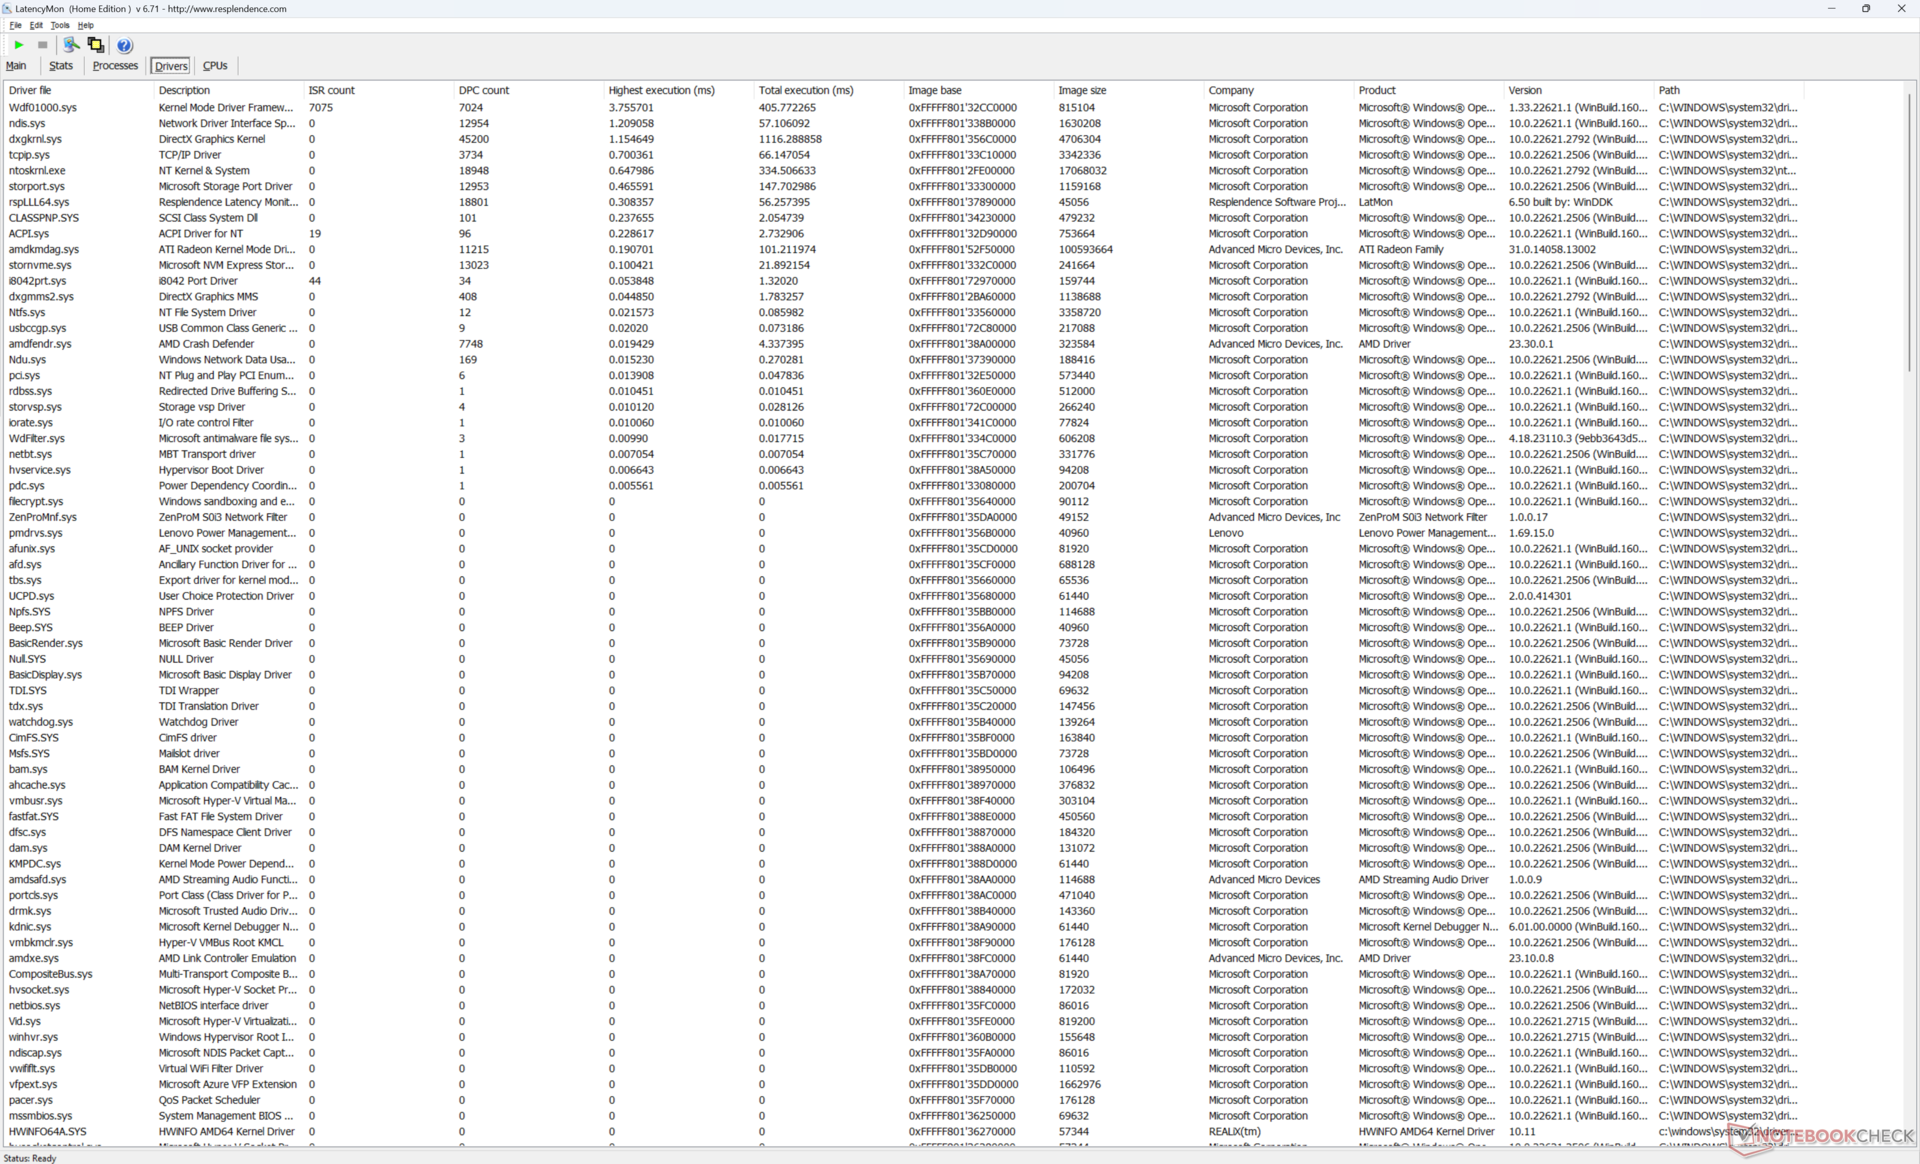
LatencyMon visar mindre DPC-problem när man öppnar flera webbläsarflikar på vår hemsida. uppspelning av 4K-video vid 60 FPS är annars perfekt utan några tappade bildrutor, till skillnad från vad vi upplevde på den senaste Intel-Nvidia-drivna ThinkPad P1 G6.
| DPC Latencies / LatencyMon - interrupt to process latency (max), Web, Youtube, Prime95 | |
| Asus Vivobook Pro 16X K6604JV-MX016W | |
| Lenovo ThinkPad Z16 Gen 2 | |
| Lenovo ThinkBook 16 G6 ABP | |
| MSI Creator Z16P B12UHST | |
| Lenovo ThinkPad Z16 G1 21D5S00T00 | |
* ... mindre är bättre
Lagringsenheter
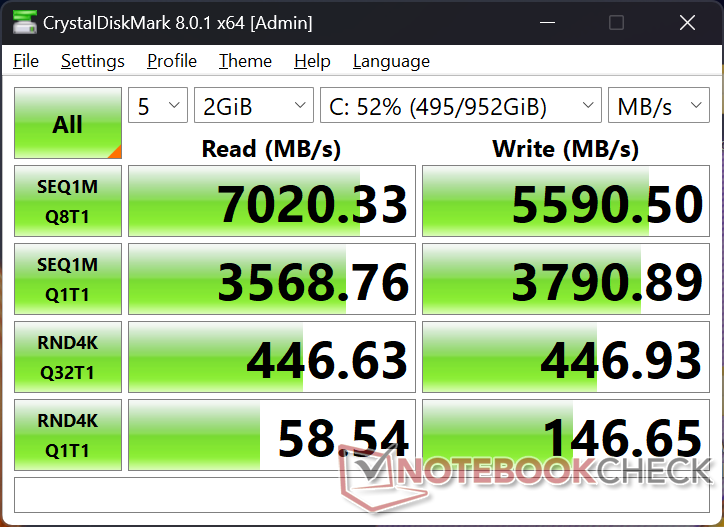
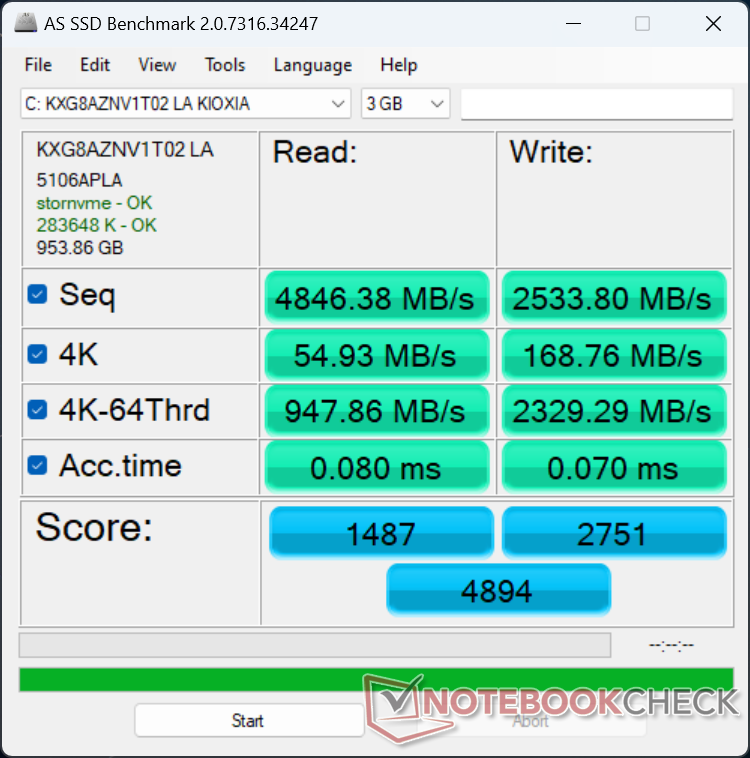
Vår testenhet levereras med Kioxia XG8 medan vår äldre ThinkPad Z16 Gen 1 skulle levereras med Samsung PM9A1. Trots detta är de två SSD-enheterna avancerade PCIe4 x4 NVMe-enheter med liknande maximala läshastigheter på ~7000 MB/s vardera.
Tyvärr uppvisade Kioxia-enheten också problem med prestandastrypning efter några minuters belastning, precis som med Samsung-enheten på vår ThinkPad Z16 Gen 1, vilket framgår av jämförelsediagrammet nedan. Läshastigheterna sjönk från ~7000 MB/s till ~5800 MB/s över tid, sannolikt på grund av otillräcklig värmeavledning. Att inkludera en stor värmeplatta mellan SSD-enheten och metallhöljet kan hjälpa till med prestandan.
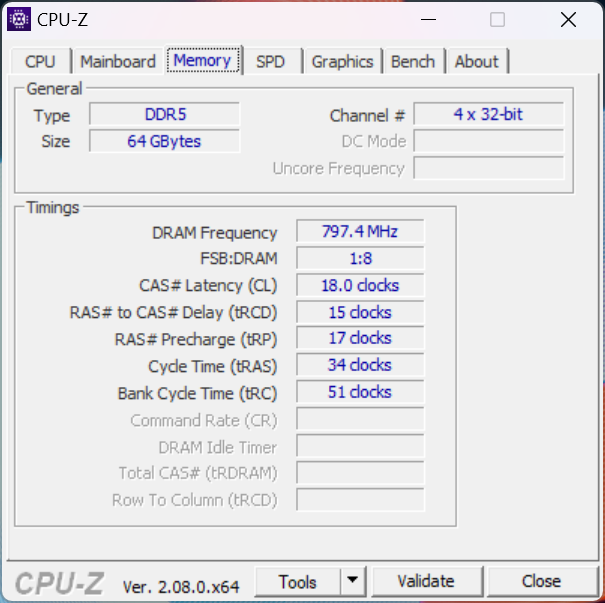
RAM-minnet är lödd och det finns inget stöd för en andra SSD till skillnad från MSI Creator Z16P som har två RAM-platser och två M.2 SSD-platser.

| Drive Performance rating - Percent | |
| MSI Creator Z16P B12UHST | |
| Lenovo ThinkPad Z16 G1 21D5S00T00 | |
| Lenovo ThinkPad Z16 Gen 2 | |
| Lenovo ThinkBook 16 G6 ABP | |
| Asus Vivobook Pro 16X K6604JV-MX016W | |
* ... mindre är bättre
Disk Throttling: DiskSpd Read Loop, Queue Depth 8
GPU-prestanda
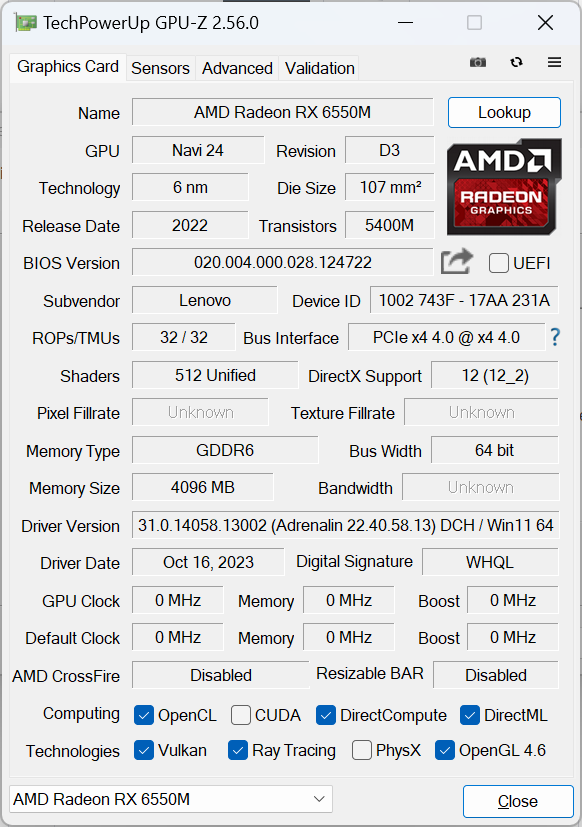
Förhållandet mellan Radeon RX 6550M och RX 6500M är ungefär som mellan GeForce RTX 3050 Ti och RTX 3050; skillnaderna är små och ligger i genomsnitt inom 10 procentenheter. De två Radeon GPU:erna har samma 64-bitars minnesbussbredd, RDNA2-arkitektur, 1024 stream-processorer, 4 GB GDDR6 VRAM med mera. Radeon RX 6550M når något högre klockfrekvenser (2560 MHz vs. 2191 MHz) och maximal TGP (60 W vs. 55 W) än 6500M. men det är allt.
Den lilla ökningen av klockfrekvenser leder till bara små ökningar av benchmarkpoängen, vilket framgår av jämförelsediagrammet nedan.
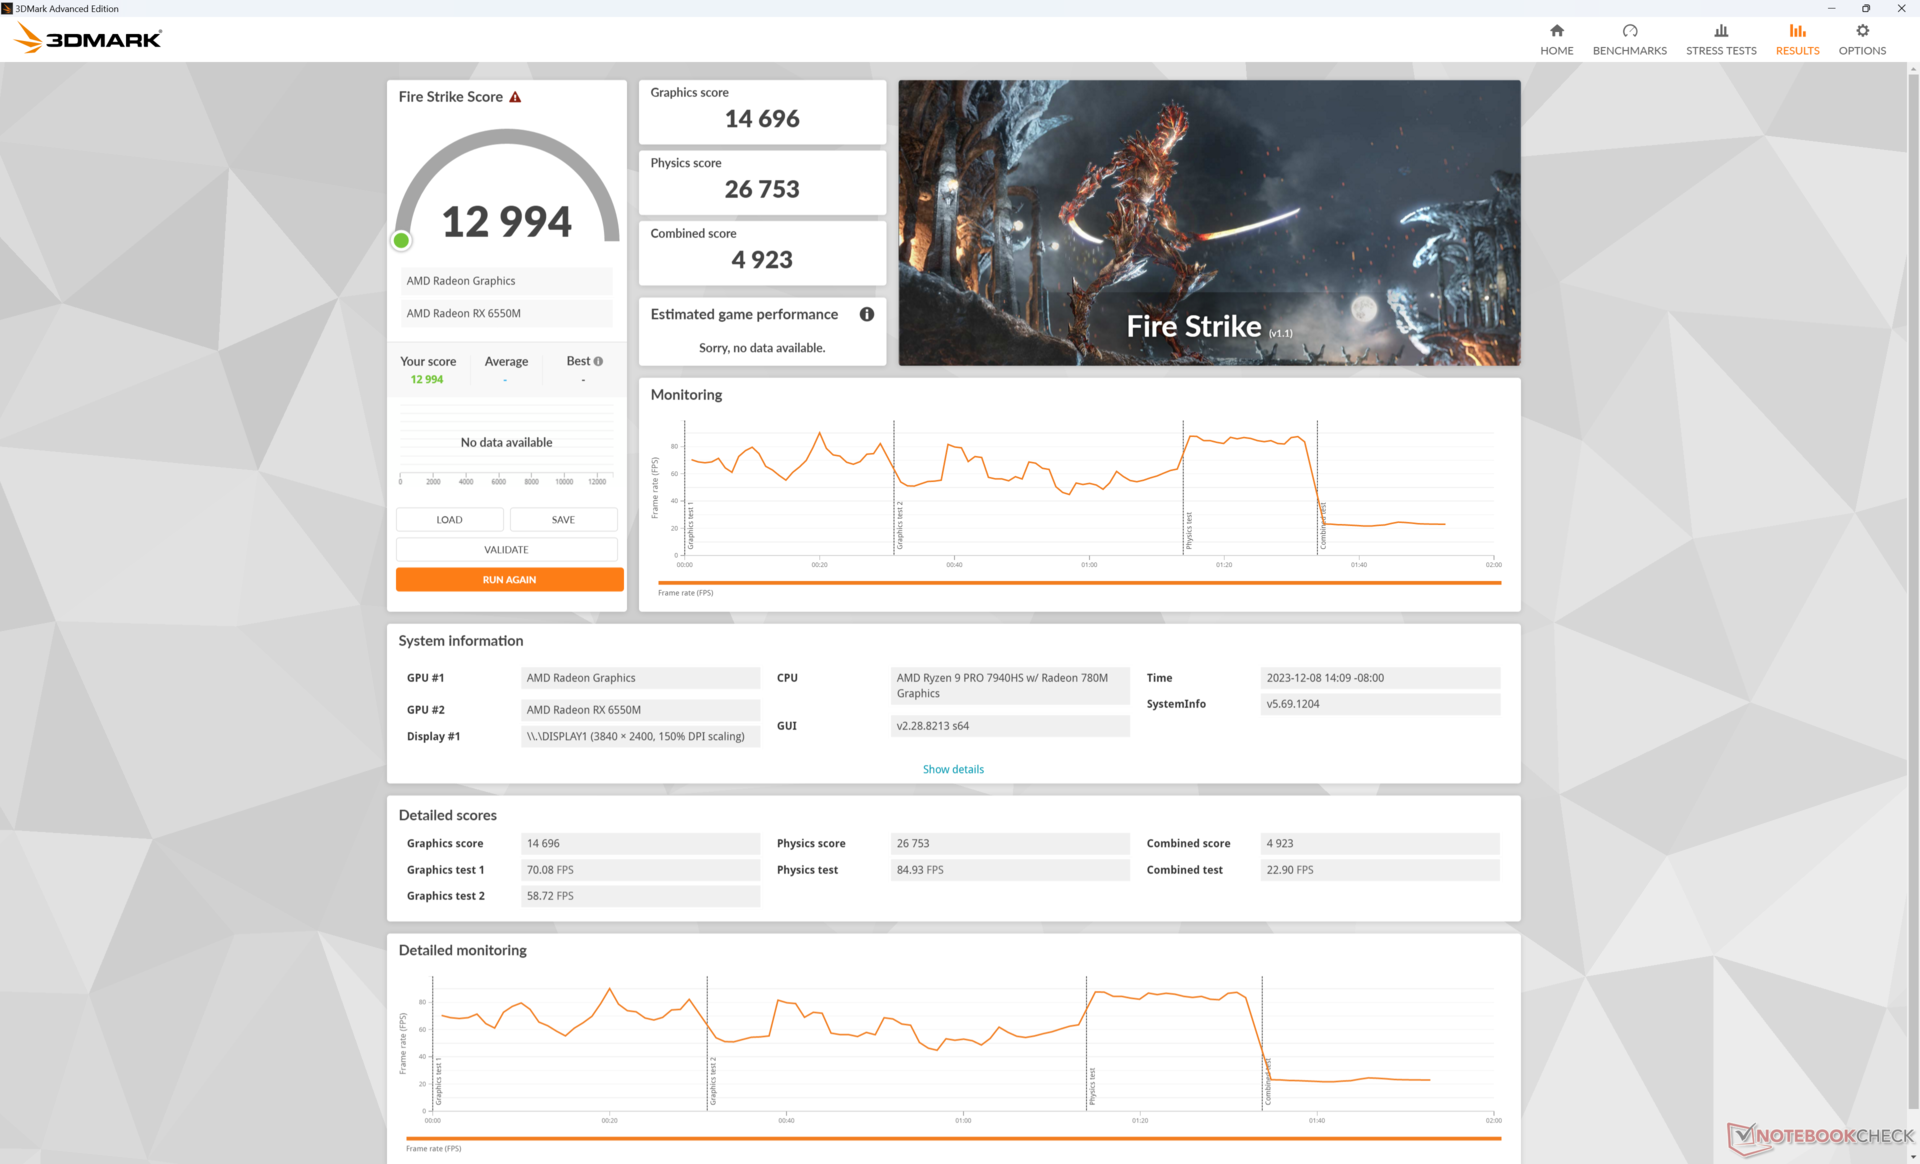
Att köra i balanserat läge istället för prestandaläge påverkar prestandan något, vilket framgår av våra Fire Strike -resultat i tabellen nedan. Att köra på batteridrift skulle minska grafikprestandan mycket mer än processorprestandan.
| Kraftprofil | Fysikresultat | Poäng för grafik | Kombinerat resultat |
| Prestanda-läge | 26753 | 14696 | 4923 |
| Balanserat läge | 26333 (-2%) | 13975 (-5%) | 4776 (-3%) |
| Batteridrift | 25622 (-4%) | 9649 (-34%) | 3114 (-37%) |
Tänk på att den RDNA2-baserade Radeon RX 6550M kommer precis efter lanseringen av den avancerade RDNA3-baserade Radeon RX 7900M vilket innebär att fler RDNA3 GPU:er i mellanklassen kommer att lanseras inom kort. RDNA3 är en betydande förbättring jämfört med RDNA2 när det gäller prestanda, strömförbrukning, stöd för AI-uppskalning och särskilt ray-tracing-funktioner.
| 3DMark Performance rating - Percent | |
| Asus Zephyrus Duo 16 GX650PY-NM006W | |
| Alienware m16 R1 AMD | |
| Lenovo ThinkPad P1 G6 21FV001KUS | |
| MSI Raider GE68 HX 13VG, i7-13700HX | |
| MSI Raider GE68HX 13VF | |
| HP Victus 16-r0076TX -1! | |
| MSI Creator Z16P B12UHST -1! | |
| Lenovo ThinkPad Z16 G1 21D5S00T00 -1! | |
| Asus VivoBook Pro 16 -1! | |
| Lenovo ThinkPad Z16 Gen 2 | |
| Genomsnitt AMD Radeon RX 6550M | |
| HP Victus 15 fa0020nr | |
| Asus VivoBook Pro 16X OLED N7600PC-L2026X -1! | |
| LG Gram 2in1 16 16T90R - G.AA78G -1! | |
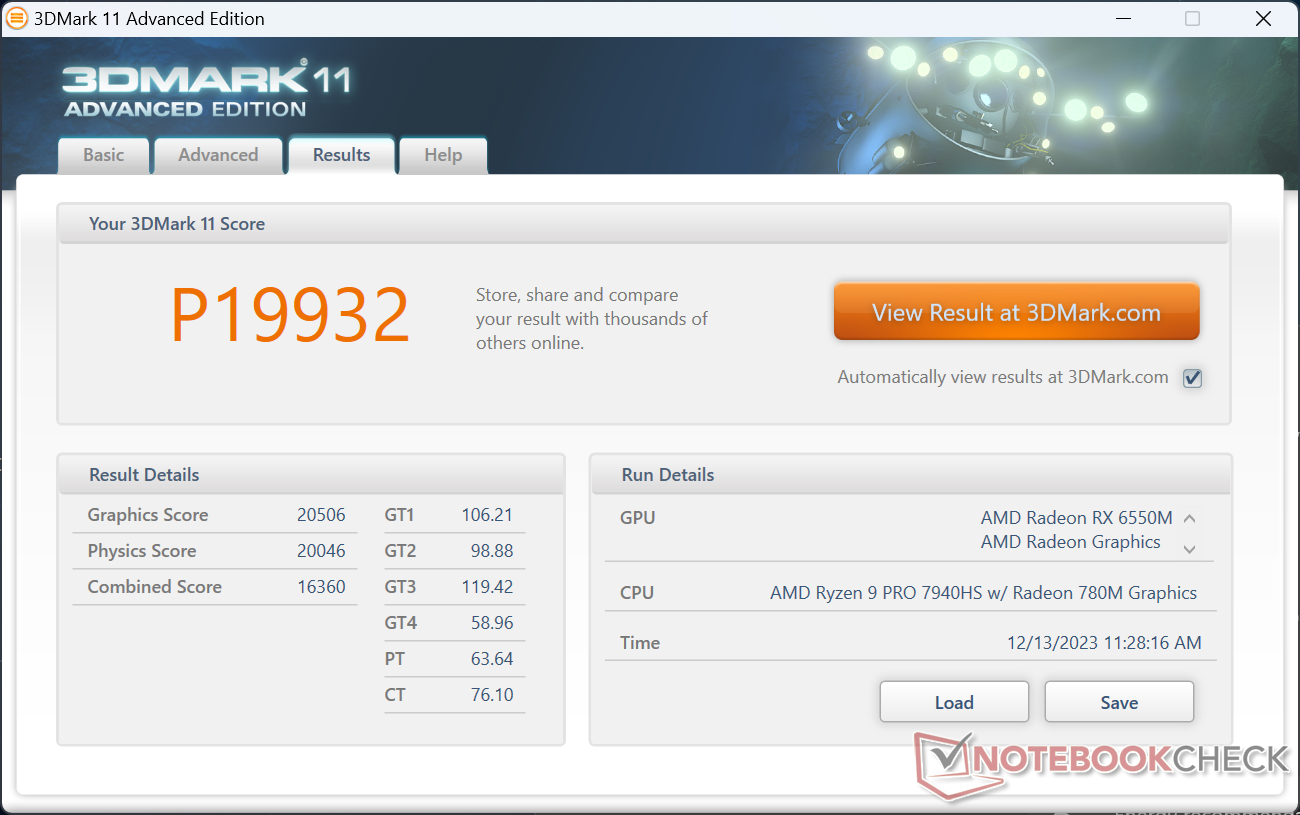
| 3DMark 11 Performance | 19932 poäng | |
| 3DMark Fire Strike Score | 12994 poäng | |
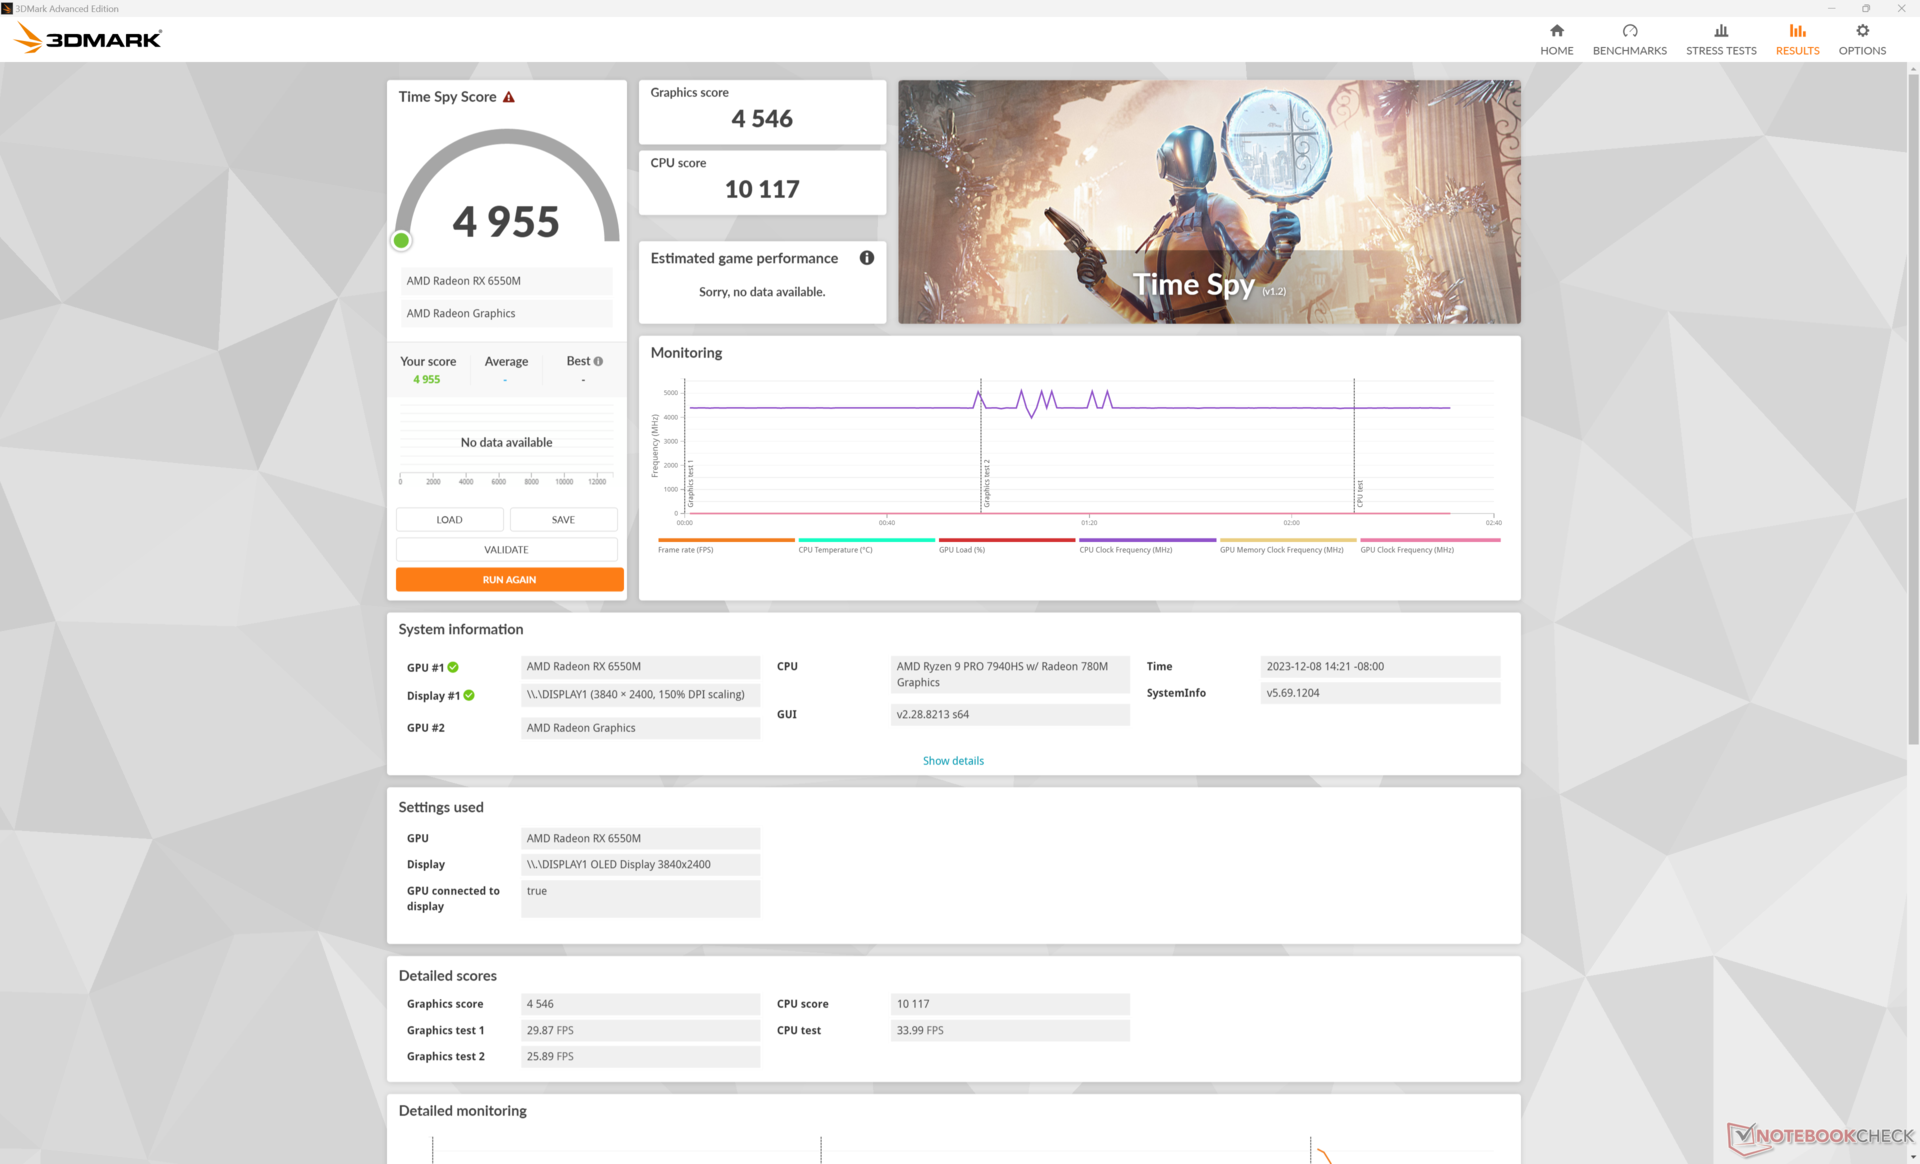
| 3DMark Time Spy Score | 4955 poäng | |
Hjälp | ||
| Blender | |
| v3.3 Classroom METAL | |
| Apple MacBook Pro 16 2023 M3 Pro | |
| v3.3 Classroom HIP/AMD | |
| Lenovo ThinkPad Z16 G1 21D5S00T00 | |
| v3.3 Classroom OPTIX/RTX | |
| Asus VivoBook Pro 16 | |
| HP Victus 16-r0076TX | |
| MSI Raider GE68HX 13VF | |
| MSI Raider GE68 HX 13VG, i7-13700HX | |
| Alienware m16 R1 AMD | |
| Lenovo ThinkPad P1 G6 21FV001KUS | |
| Asus Zephyrus Duo 16 GX650PY-NM006W | |
| v3.3 Classroom CUDA | |
| Asus VivoBook Pro 16 | |
| HP Victus 16-r0076TX | |
| MSI Raider GE68HX 13VF | |
| MSI Raider GE68 HX 13VG, i7-13700HX | |
| Lenovo ThinkPad P1 G6 21FV001KUS | |
| Alienware m16 R1 AMD | |
| Asus Zephyrus Duo 16 GX650PY-NM006W | |
| v3.3 Classroom CPU | |
| LG Gram 2in1 16 16T90R - G.AA78G | |
| Lenovo ThinkPad Z16 G1 21D5S00T00 | |
| Asus VivoBook Pro 16 | |
| HP Victus 16-r0076TX | |
| Lenovo ThinkPad P1 G6 21FV001KUS | |
| Apple MacBook Pro 16 2023 M3 Pro | |
| Lenovo ThinkPad Z16 Gen 2 | |
| Genomsnitt AMD Radeon RX 6550M (n=1) | |
| MSI Raider GE68 HX 13VG, i7-13700HX | |
| MSI Raider GE68HX 13VF | |
| Alienware m16 R1 AMD | |
| Asus Zephyrus Duo 16 GX650PY-NM006W | |
* ... mindre är bättre
Spelprestanda
Prestandan vid spel kan variera från att vara nästan identisk med Radeon RX 6500M till att vara upp till 30 procent snabbare beroende på titel och inställningar. Final Fantasy XV skulle till exempel prestera nästan lika bra mellan våra Radeon RX 6550M- och 6500M-modeller medan andra titlar som Far Cry 5 eller F1 22 kan köras upp till 15 till 30 procent snabbare. Tiny Tina's Wonderlands kan köras upp till 30 procent snabbare endast med högre grafiska inställningar. Resultaten är därför mycket beroende av applikationen, men prestandafördelarna är i allmänhet högre än vad 3DMark-poängen annars skulle antyda, vilket är goda nyheter för spelare.
Intressant är att den övergripande prestandan är hals i hals med MacBook Pro 16 M3 Pro när vi testar nyare spel som Cyberpunk 2077 och Baldur's Gate 3. Med tanke på att vår Radeon är en större diskret GPU, talar detta sitt tydliga språk om effektiviteten hos den integrerade Apple SoC-lösningen.
| Performance rating - Percent | |
| Asus Zephyrus Duo 16 GX650PY-NM006W | |
| Alienware m16 R1 AMD -1! | |
| Lenovo ThinkPad P1 G6 21FV001KUS -1! | |
| MSI Raider GE68 HX 13VG, i7-13700HX | |
| MSI Raider GE68HX 13VF -1! | |
| MSI Creator Z16P B12UHST | |
| HP Victus 16-r0076TX -1! | |
| Lenovo ThinkPad Z16 Gen 2 -1! | |
| Apple MacBook Pro 16 2023 M3 Pro -4! | |
| Lenovo ThinkPad Z16 G1 21D5S00T00 | |
| LG Gram 2in1 16 16T90R - G.AA78G | |
| The Witcher 3 - 1920x1080 Ultra Graphics & Postprocessing (HBAO+) | |
| Asus Zephyrus Duo 16 GX650PY-NM006W | |
| Alienware m16 R1 AMD | |
| Lenovo ThinkPad P1 G6 21FV001KUS | |
| MSI Raider GE68 HX 13VG, i7-13700HX | |
| MSI Raider GE68HX 13VF | |
| HP Victus 16-r0076TX | |
| MSI Creator Z16P B12UHST | |
| Lenovo ThinkPad Z16 Gen 2 | |
| Apple MacBook Pro 16 2023 M3 Pro | |
| Lenovo ThinkPad Z16 G1 21D5S00T00 | |
| LG Gram 2in1 16 16T90R - G.AA78G | |
| GTA V - 1920x1080 Highest AA:4xMSAA + FX AF:16x | |
| Asus Zephyrus Duo 16 GX650PY-NM006W | |
| Lenovo ThinkPad P1 G6 21FV001KUS | |
| MSI Raider GE68 HX 13VG, i7-13700HX | |
| MSI Creator Z16P B12UHST | |
| Apple MacBook Pro 16 2023 M3 Pro | |
| Lenovo ThinkPad Z16 G1 21D5S00T00 | |
| LG Gram 2in1 16 16T90R - G.AA78G | |
| Final Fantasy XV Benchmark - 1920x1080 High Quality | |
| Asus Zephyrus Duo 16 GX650PY-NM006W | |
| Alienware m16 R1 AMD | |
| Lenovo ThinkPad P1 G6 21FV001KUS | |
| MSI Raider GE68 HX 13VG, i7-13700HX | |
| MSI Raider GE68HX 13VF | |
| MSI Creator Z16P B12UHST | |
| HP Victus 16-r0076TX | |
| Lenovo ThinkPad Z16 Gen 2 | |
| Lenovo ThinkPad Z16 G1 21D5S00T00 | |
| LG Gram 2in1 16 16T90R - G.AA78G | |
| Strange Brigade - 1920x1080 ultra AA:ultra AF:16 | |
| Alienware m16 R1 AMD | |
| Asus Zephyrus Duo 16 GX650PY-NM006W | |
| MSI Raider GE68 HX 13VG, i7-13700HX | |
| MSI Raider GE68HX 13VF | |
| MSI Creator Z16P B12UHST | |
| HP Victus 16-r0076TX | |
| Lenovo ThinkPad Z16 Gen 2 | |
| Lenovo ThinkPad Z16 G1 21D5S00T00 | |
| LG Gram 2in1 16 16T90R - G.AA78G | |
| Dota 2 Reborn - 1920x1080 ultra (3/3) best looking | |
| MSI Raider GE68HX 13VF | |
| Asus Zephyrus Duo 16 GX650PY-NM006W | |
| MSI Raider GE68 HX 13VG, i7-13700HX | |
| Alienware m16 R1 AMD | |
| MSI Creator Z16P B12UHST | |
| Lenovo ThinkPad P1 G6 21FV001KUS | |
| HP Victus 16-r0076TX | |
| Lenovo ThinkPad Z16 Gen 2 | |
| Lenovo ThinkPad Z16 G1 21D5S00T00 | |
| LG Gram 2in1 16 16T90R - G.AA78G | |
| X-Plane 11.11 - 1920x1080 high (fps_test=3) | |
| MSI Raider GE68HX 13VF | |
| MSI Raider GE68 HX 13VG, i7-13700HX | |
| Lenovo ThinkPad P1 G6 21FV001KUS | |
| Asus Zephyrus Duo 16 GX650PY-NM006W | |
| Alienware m16 R1 AMD | |
| HP Victus 16-r0076TX | |
| MSI Creator Z16P B12UHST | |
| LG Gram 2in1 16 16T90R - G.AA78G | |
| Lenovo ThinkPad Z16 G1 21D5S00T00 | |
| Lenovo ThinkPad Z16 Gen 2 | |
| Cyberpunk 2077 | |
| 1280x720 Low Preset (FSR off) | |
| Lenovo ThinkPad Z16 Gen 2 | |
| Genomsnitt AMD Radeon RX 6550M (n=1) | |
| LG Gram 2in1 16 16T90R - G.AA78G | |
| 1920x1080 Low Preset (FSR off) | |
| Lenovo ThinkPad Z16 Gen 2 | |
| Genomsnitt AMD Radeon RX 6550M (n=1) | |
| Apple MacBook Pro 16 2023 M3 Pro | |
| LG Gram 2in1 16 16T90R - G.AA78G | |
| 1920x1080 Medium Preset (FSR off) | |
| Lenovo ThinkPad Z16 Gen 2 | |
| Genomsnitt AMD Radeon RX 6550M (n=1) | |
| Apple MacBook Pro 16 2023 M3 Pro | |
| LG Gram 2in1 16 16T90R - G.AA78G | |
| 1920x1080 High Preset (FSR off) | |
| Lenovo ThinkPad P1 G6 21FV001KUS | |
| Apple MacBook Pro 16 2023 M3 Pro | |
| Lenovo ThinkPad Z16 Gen 2 | |
| Genomsnitt AMD Radeon RX 6550M (n=1) | |
| LG Gram 2in1 16 16T90R - G.AA78G | |
| 1920x1080 Ultra Preset (FSR off) | |
| Lenovo ThinkPad P1 G6 21FV001KUS | |
| Apple MacBook Pro 16 2023 M3 Pro | |
| Lenovo ThinkPad Z16 Gen 2 | |
| Genomsnitt AMD Radeon RX 6550M (n=1) | |
| LG Gram 2in1 16 16T90R - G.AA78G | |
| 2560x1440 Ultra Preset (FSR off) | |
| Lenovo ThinkPad P1 G6 21FV001KUS | |
| Lenovo ThinkPad Z16 Gen 2 | |
| Genomsnitt AMD Radeon RX 6550M (n=1) | |
| Baldur's Gate 3 | |
| 1920x1080 Low Preset AA:SM | |
| Lenovo ThinkPad Z16 Gen 2 | |
| Genomsnitt AMD Radeon RX 6550M (n=1) | |
| 1920x1080 Medium Preset AA:T | |
| Lenovo ThinkPad Z16 Gen 2 | |
| Genomsnitt AMD Radeon RX 6550M (n=1) | |
| 1920x1080 High Preset AA:T | |
| Apple MacBook Pro 16 2023 M3 Pro | |
| Lenovo ThinkPad Z16 Gen 2 | |
| Genomsnitt AMD Radeon RX 6550M (n=1) | |
| 1920x1080 Ultra Preset AA:T | |
| Lenovo ThinkPad P1 G6 21FV001KUS | |
| Apple MacBook Pro 16 2023 M3 Pro | |
| Lenovo ThinkPad Z16 Gen 2 | |
| Genomsnitt AMD Radeon RX 6550M (n=1) | |
| 2560x1440 Ultra Preset AA:T | |
| Lenovo ThinkPad P1 G6 21FV001KUS | |
| Lenovo ThinkPad Z16 Gen 2 | |
| Genomsnitt AMD Radeon RX 6550M (n=1) | |
Witcher 3 FPS Chart
| låg | med. | hög | ultra | QHD | |
|---|---|---|---|---|---|
| The Witcher 3 (2015) | 277.2 | 171.5 | 83.2 | 49.4 | |
| Dota 2 Reborn (2015) | 137.1 | 127.3 | 112.3 | 103 | |
| Final Fantasy XV Benchmark (2018) | 129.3 | 67.4 | 47.8 | 31.2 | |
| X-Plane 11.11 (2018) | 53.7 | 41.2 | 33 | ||
| Far Cry 5 (2018) | 115 | 91 | 84 | 79 | |
| Strange Brigade (2018) | 319 | 122.5 | 101.1 | 88.4 | |
| Tiny Tina's Wonderlands (2022) | 124.1 | 95.5 | 59.7 | 30.3 | 27.2 |
| F1 22 (2022) | 132.5 | 120.8 | 87.5 | 19.3 | 11.3 |
| Baldur's Gate 3 (2023) | 61.6 | 52.9 | 44.7 | 43 | 29 |
| Cyberpunk 2077 (2023) | 62.8 | 45.9 | 34.7 | 28.6 | 17.3 |
Utsläpp
Buller från systemet
Fläktarnas ljudnivå beror i hög grad på vilken strömprofil som valts. Till exempel är fläktarna bara riktigt tysta i strömsparprofilen eftersom de annars alltid är aktiva vid nästan 30 dB(A) oavsett belastningen på skärmen. På samma sätt ligger fläktljudet i balanserat läge på cirka 41-45 dB(A) jämfört med 52 dB(A) i prestandaläget, vilket är en betydande skillnad trots de små prestandaskillnaderna mellan de två profilerna som nämnts ovan. I synnerhet Performance-läget är märkbart högre än många andra 16-tums bärbara datorer som MSI Creator Z16P eller MacBook Pro 16.
Fläktpulseringen hålls annars till ett minimum. När vi kör 3DMark 06, till exempel, ligger fläktljudet på stadiga 29,5 dB(A) under hela den första benchmarkscenen utan några plötsliga toppar.
Ljudnivå
| Låg belastning |
| 22.9 / 29.4 / 29.4 dB(A) |
| Hög belastning |
| 29.5 / 52 dB(A) |
 | ||
30 dB tyst 40 dB(A) hörbar 50 dB(A) högt ljud |
||
min: | ||
| Lenovo ThinkPad Z16 Gen 2 Radeon RX 6550M, R9 PRO 7940HS, Kioxia XG8 KXG8AZNV1T02 | Lenovo ThinkPad Z16 G1 21D5S00T00 Radeon RX 6500M, R7 PRO 6850H, Samsung PM9A1 MZVL21T0HCLR | Lenovo ThinkBook 16 G6 ABP Vega 7, R5 7530U, SK hynix HFS512GEJ9X125N | MSI Creator Z16P B12UHST GeForce RTX 3080 Ti Laptop GPU, i9-12900H, Samsung PM9A1 MZVL22T0HBLB | Apple MacBook Pro 16 2023 M3 Pro M3 Pro 18-Core GPU, Apple M3 Pro 12-Core, Apple SSD AP0512Z | Asus Vivobook Pro 16X K6604JV-MX016W GeForce RTX 4060 Laptop GPU, i9-13980HX, Solidigm P41 Plus SSDPFKNU010TZ | |
|---|---|---|---|---|---|---|
| Noise | 9% | 11% | -8% | 12% | -18% | |
| av / miljö * (dB) | 22.6 | 23.7 -5% | 24.3 -8% | 26 -15% | 24.4 -8% | 25.2 -12% |
| Idle Minimum * (dB) | 22.9 | 23.7 -3% | 24.3 -6% | 27 -18% | 24.4 -7% | 26.6 -16% |
| Idle Average * (dB) | 29.4 | 23.7 19% | 24.3 17% | 29 1% | 24.4 17% | 26.6 10% |
| Idle Maximum * (dB) | 29.4 | 23.7 19% | 24.3 17% | 31 -5% | 24.4 17% | 29.2 1% |
| Load Average * (dB) | 29.5 | 25.9 12% | 29.7 -1% | 43 -46% | 26.9 9% | 53.4 -81% |
| Witcher 3 ultra * (dB) | 52 | 46.9 10% | 32.1 38% | 43 17% | 25.1 52% | |
| Load Maximum * (dB) | 52 | 46.9 10% | 41.4 20% | 46 12% | 50.4 3% | 56.9 -9% |
* ... mindre är bättre
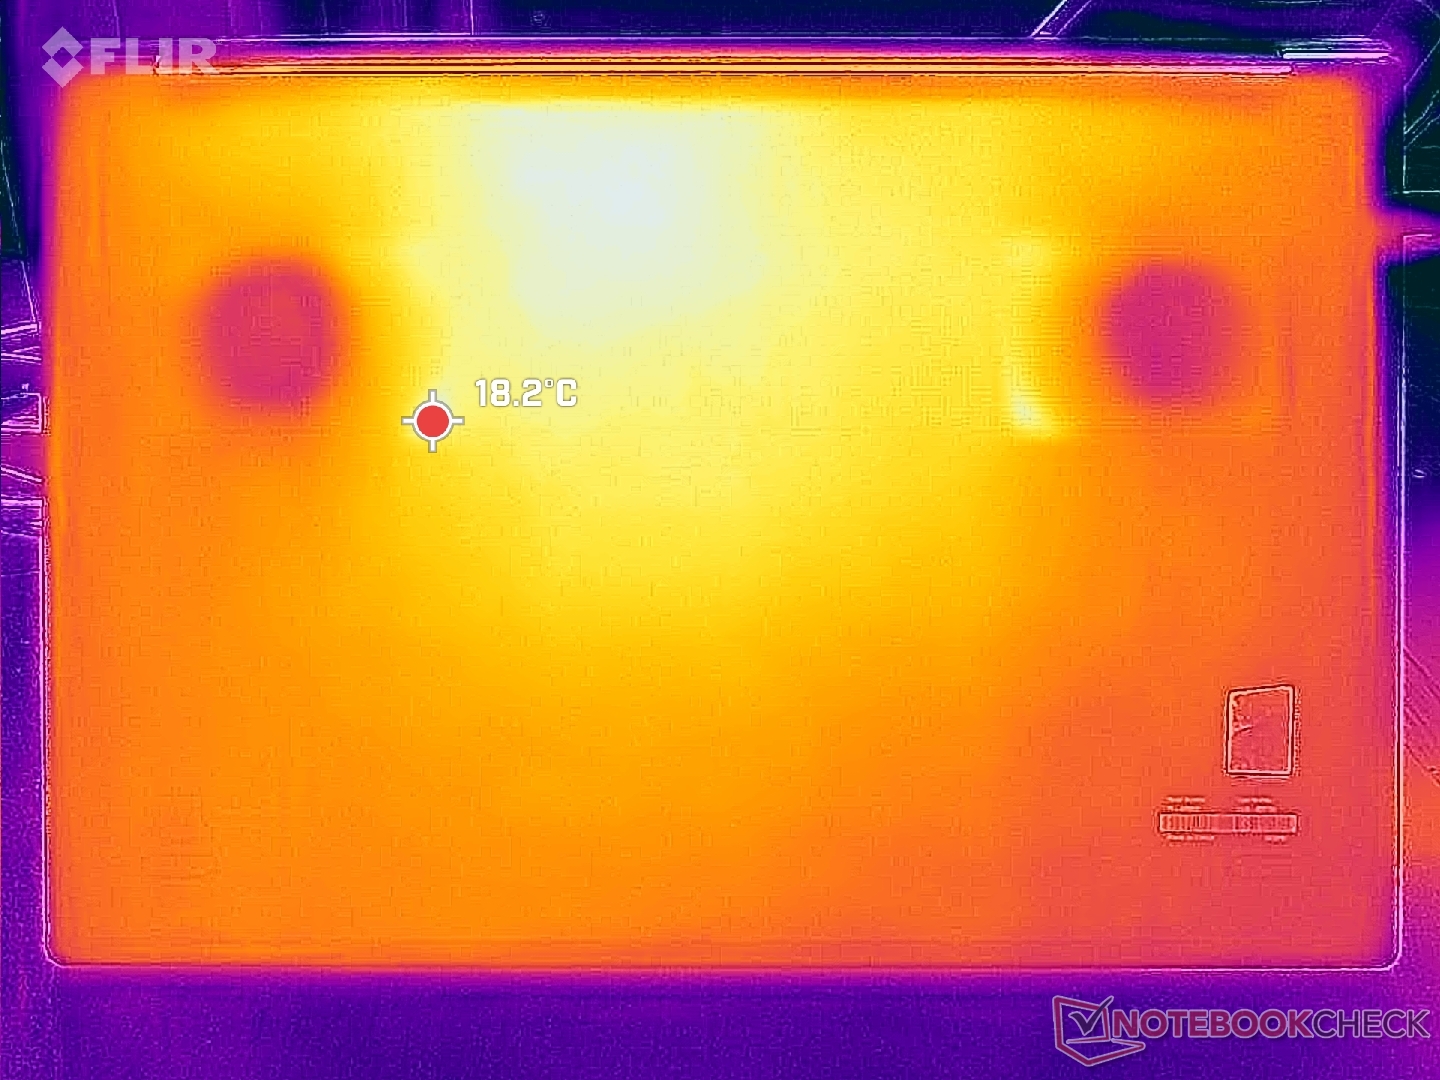
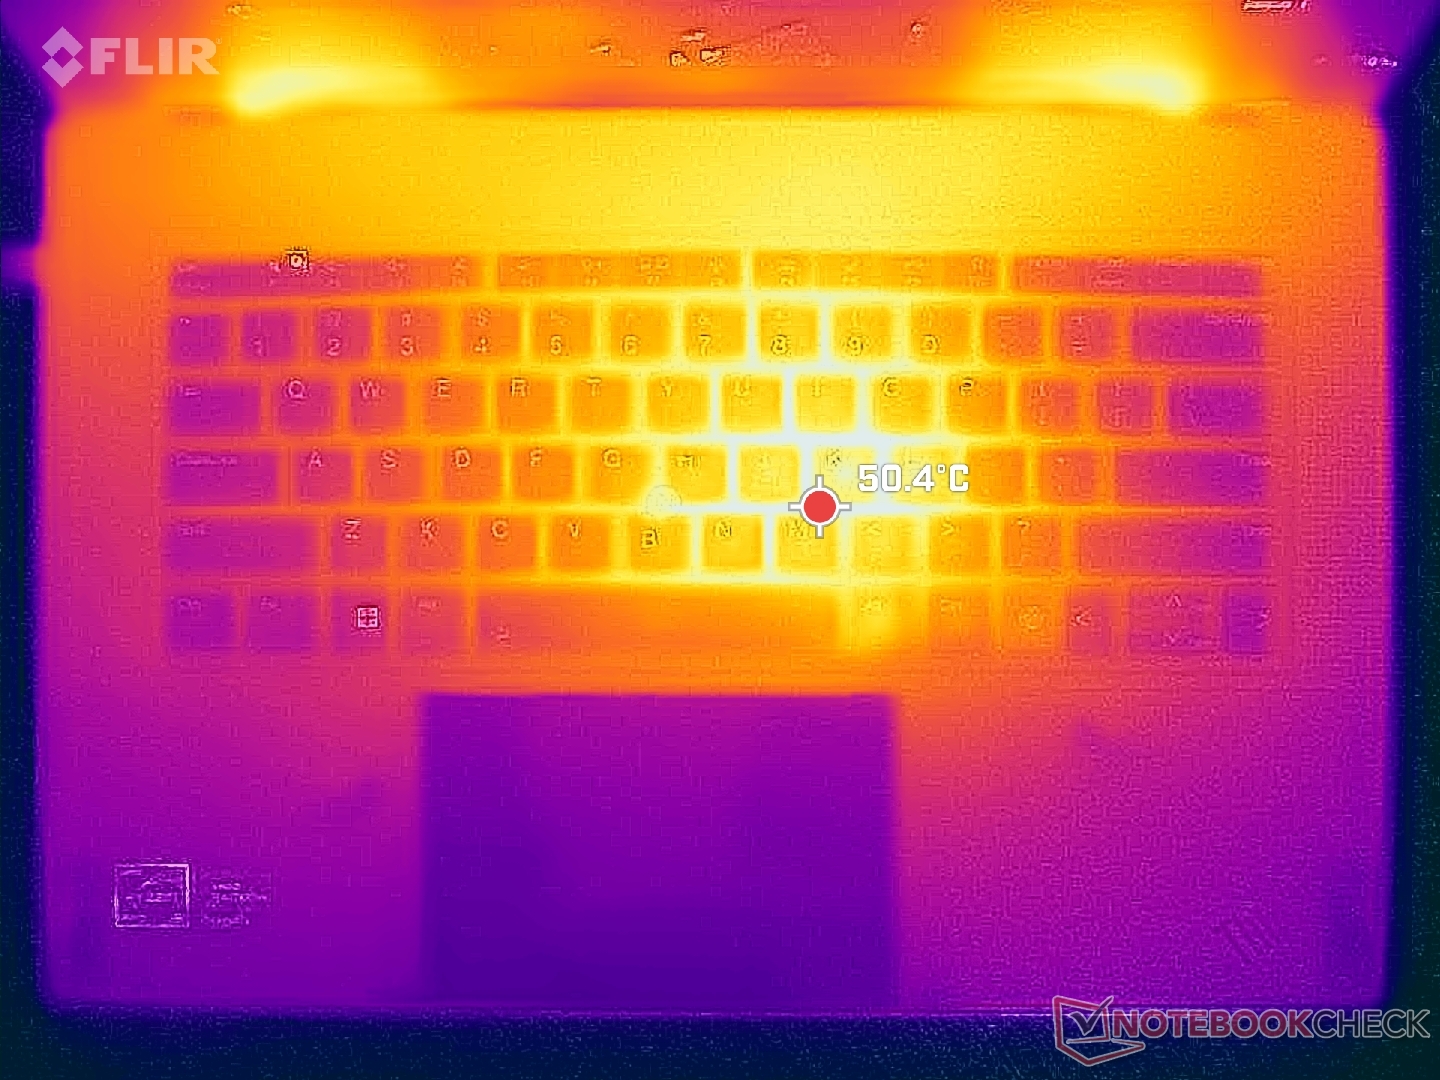
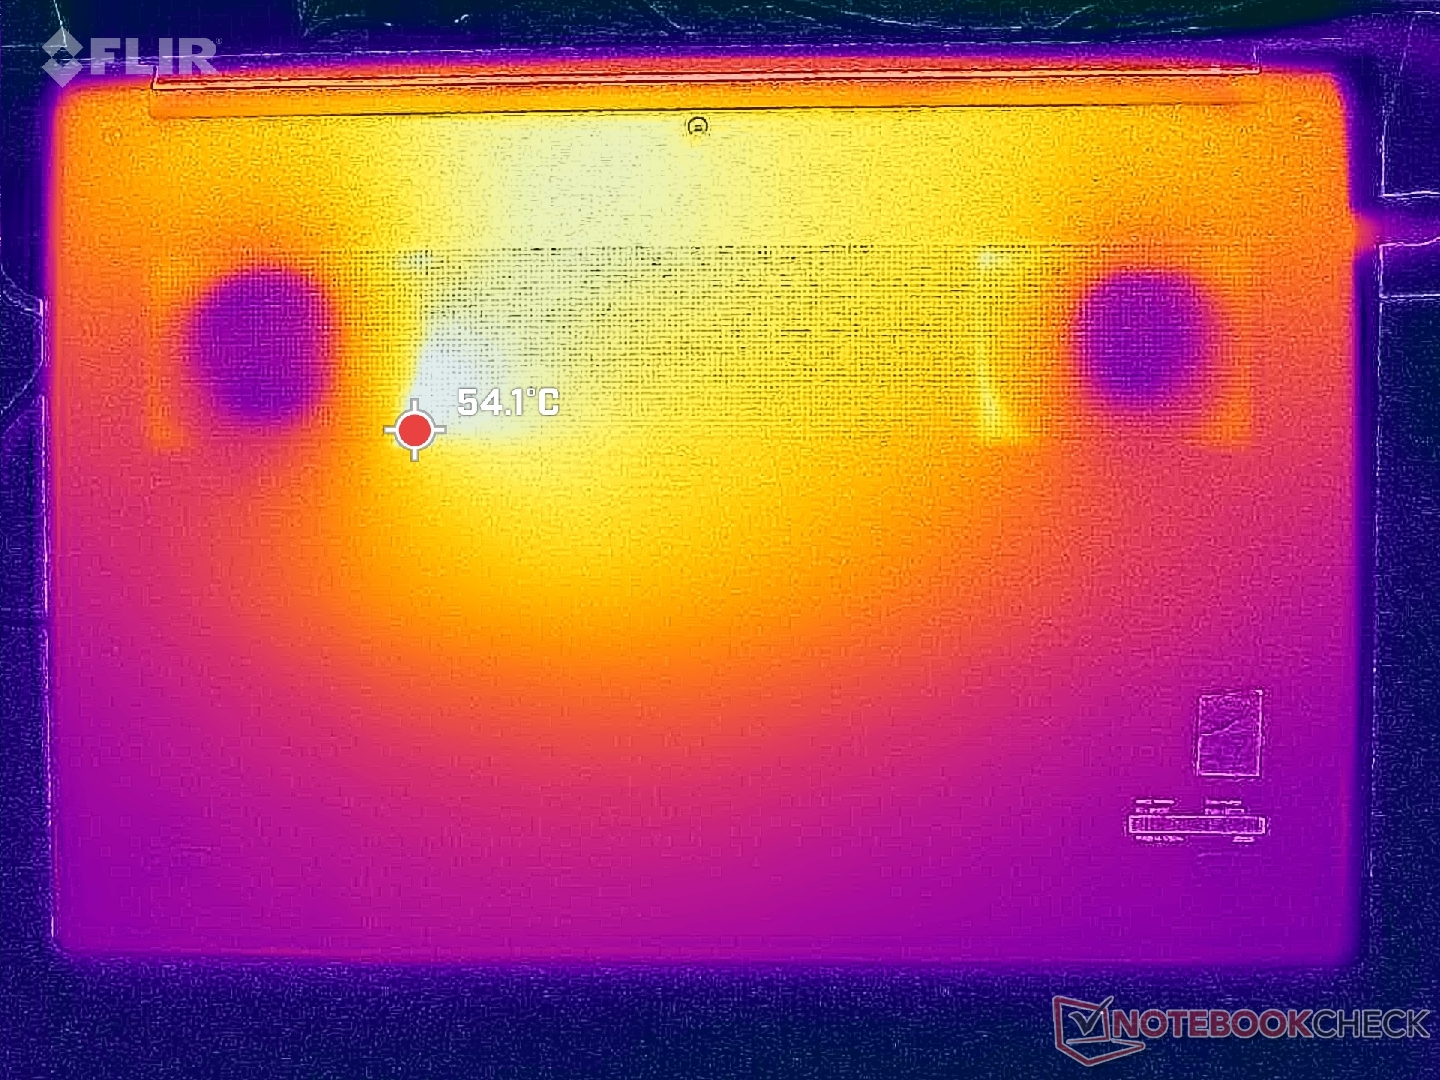
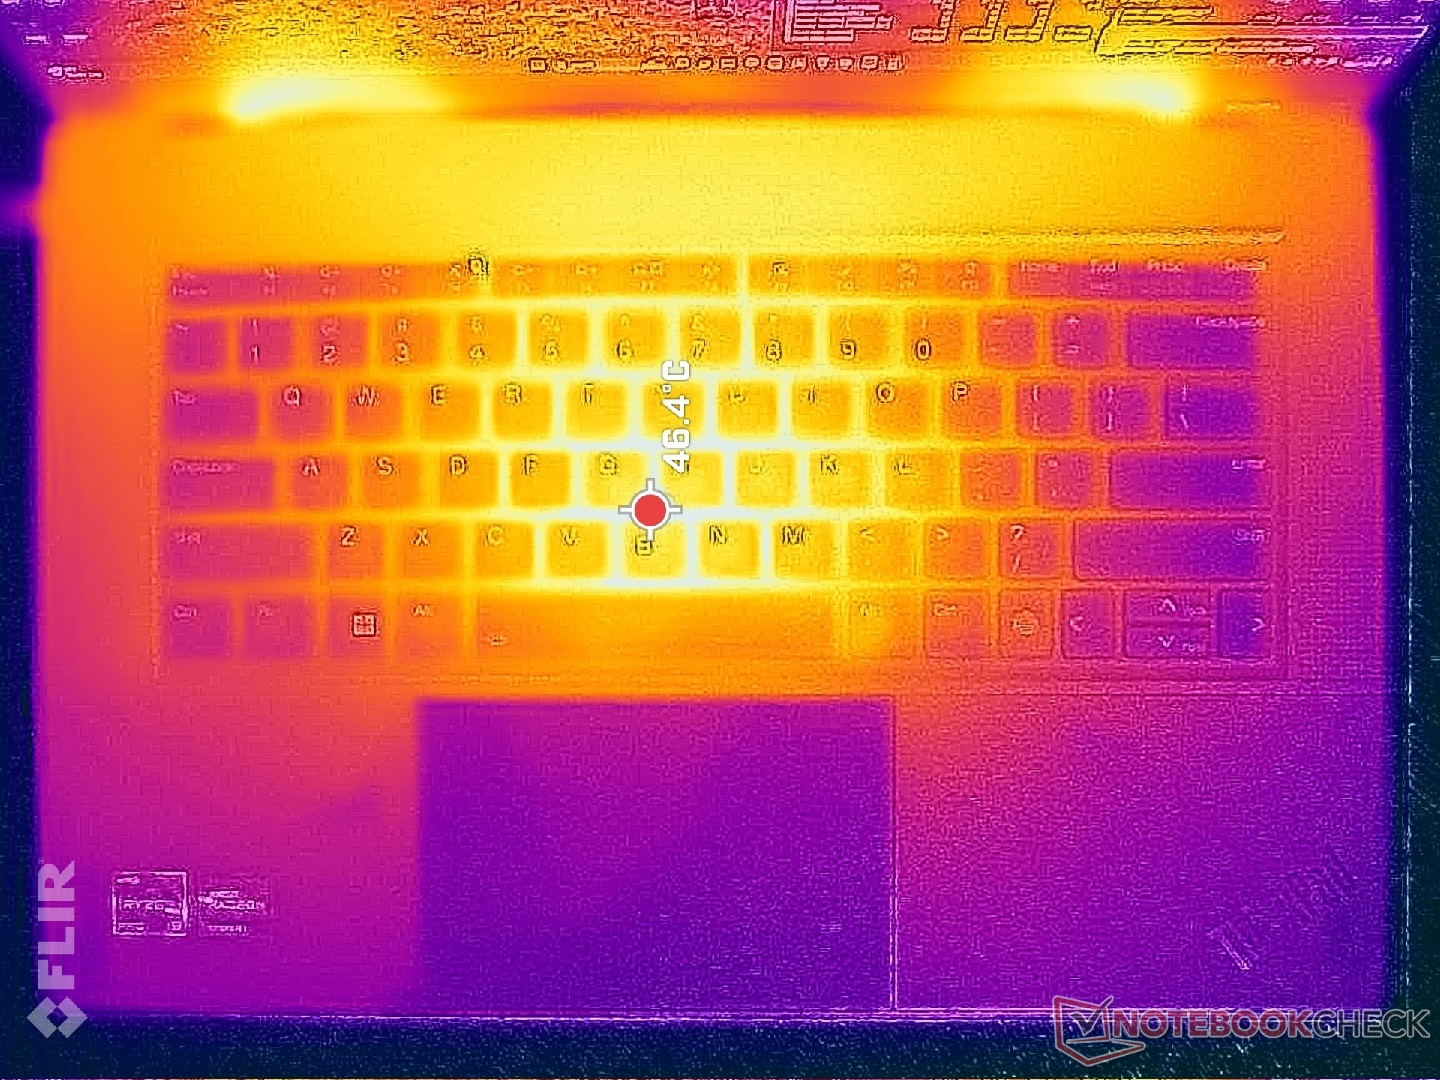
Temperatur
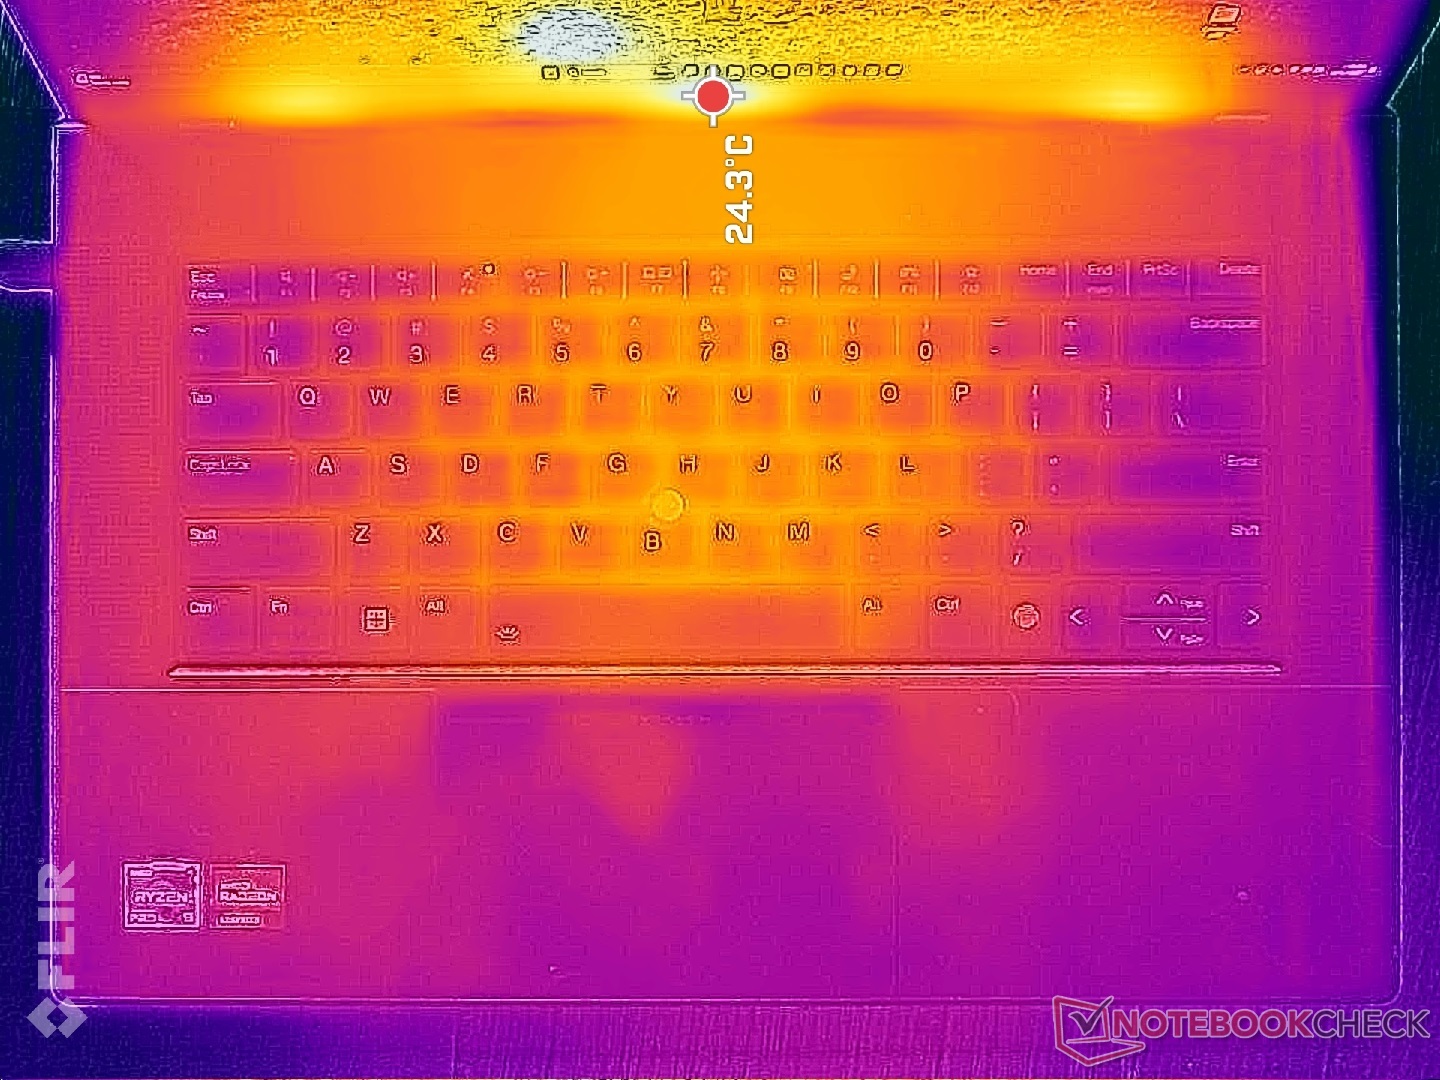
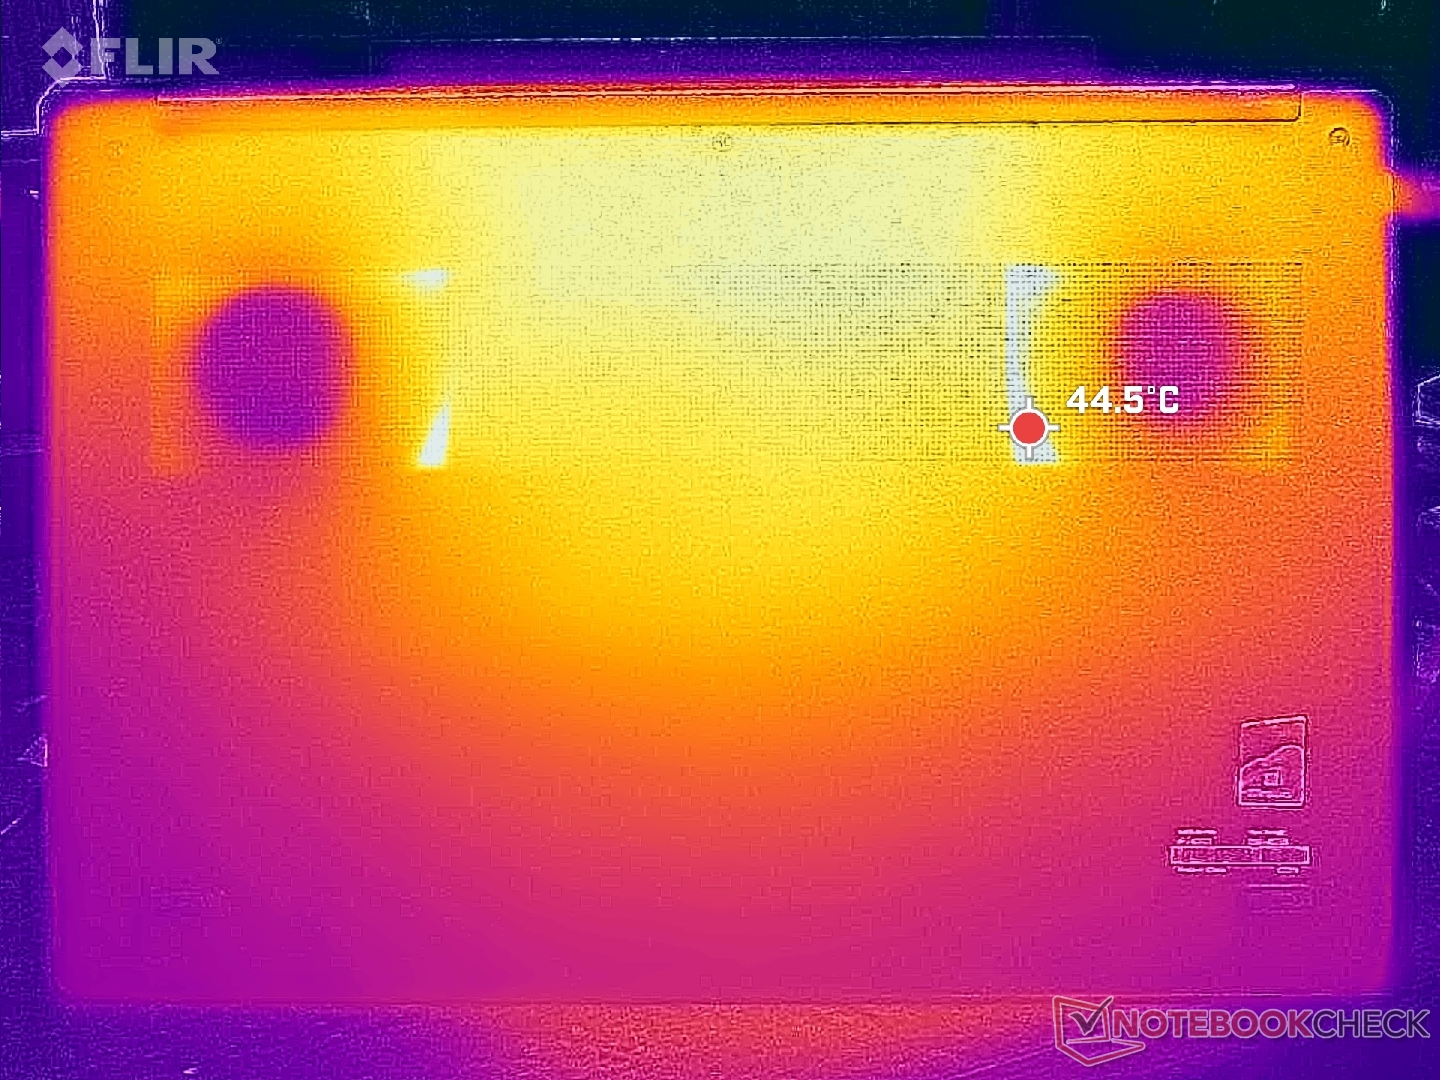
Yttemperaturerna stiger och faller ganska snabbt och med större ytterligheter eftersom det mesta av chassit är metall. När du kör krävande belastningar som spel kan hot spots vara så varma som 47 C och 43 C på tangentbordets mitt- respektive bottenplatta, men detta kan vara ännu varmare på över 50 C beroende på omgivningstemperaturen, som vad vi observerade på ThinkPad Z16 Gen 1. Resultaten är ändå mycket svalare än vad vi registrerade på MSI Skapare Z16P som skulle bli alldeles för varm för sitt eget bästa.
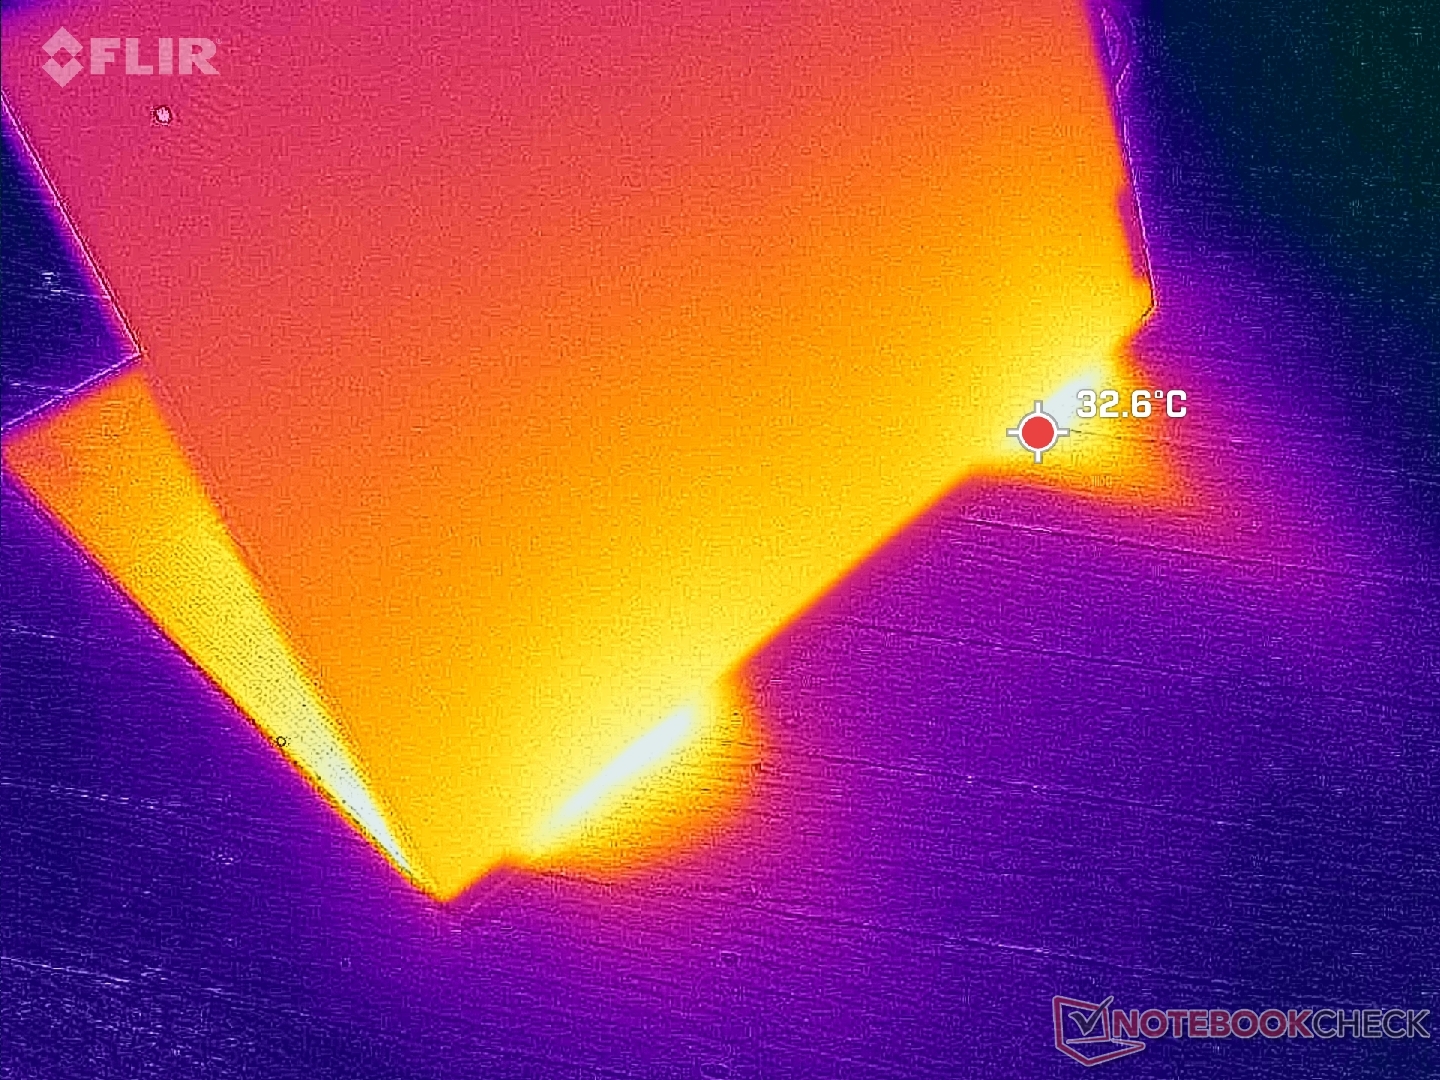
(±) Den maximala temperaturen på ovansidan är 43 °C / 109 F, jämfört med genomsnittet av 36.8 °C / 98 F , allt från 21 till 71 °C för klassen Multimedia.
(±) Botten värms upp till maximalt 41.6 °C / 107 F, jämfört med genomsnittet av 39.1 °C / 102 F
(+) Vid tomgångsbruk är medeltemperaturen för ovansidan 20.3 °C / 69 F, jämfört med enhetsgenomsnittet på 31.3 °C / ### class_avg_f### F.
(-) När du spelar The Witcher 3 är medeltemperaturen för ovansidan 38.1 °C / 101 F, jämfört med enhetsgenomsnittet på 31.3 °C / ## #class_avg_f### F.
(+) Handledsstöden och pekplattan är kallare än hudtemperaturen med maximalt 30 °C / 86 F och är därför svala att ta på.
(±) Medeltemperaturen för handledsstödsområdet på liknande enheter var 28.7 °C / 83.7 F (-1.3 °C / -2.3 F).
| Lenovo ThinkPad Z16 Gen 2 AMD Ryzen 9 PRO 7940HS, AMD Radeon RX 6550M | Lenovo ThinkPad Z16 G1 21D5S00T00 AMD Ryzen 7 PRO 6850H, AMD Radeon RX 6500M | Lenovo ThinkBook 16 G6 ABP AMD Ryzen 5 7530U, AMD Radeon RX Vega 7 | MSI Creator Z16P B12UHST Intel Core i9-12900H, NVIDIA GeForce RTX 3080 Ti Laptop GPU | Apple MacBook Pro 16 2023 M3 Pro Apple M3 Pro 12-Core, Apple M3 Pro 18-Core GPU | Asus Vivobook Pro 16X K6604JV-MX016W Intel Core i9-13980HX, NVIDIA GeForce RTX 4060 Laptop GPU | |
|---|---|---|---|---|---|---|
| Heat | -33% | -30% | -49% | -2% | -36% | |
| Maximum Upper Side * (°C) | 43 | 56.8 -32% | 40.8 5% | 67 -56% | 38.1 11% | 39.7 8% |
| Maximum Bottom * (°C) | 41.6 | 53.3 -28% | 50.5 -21% | 69 -66% | 37 11% | 60 -44% |
| Idle Upper Side * (°C) | 21.2 | 28.2 -33% | 29.3 -38% | 29 -37% | 24.2 -14% | 30.9 -46% |
| Idle Bottom * (°C) | 21.4 | 29.4 -37% | 35.2 -64% | 29 -36% | 24.6 -15% | 34.7 -62% |
* ... mindre är bättre
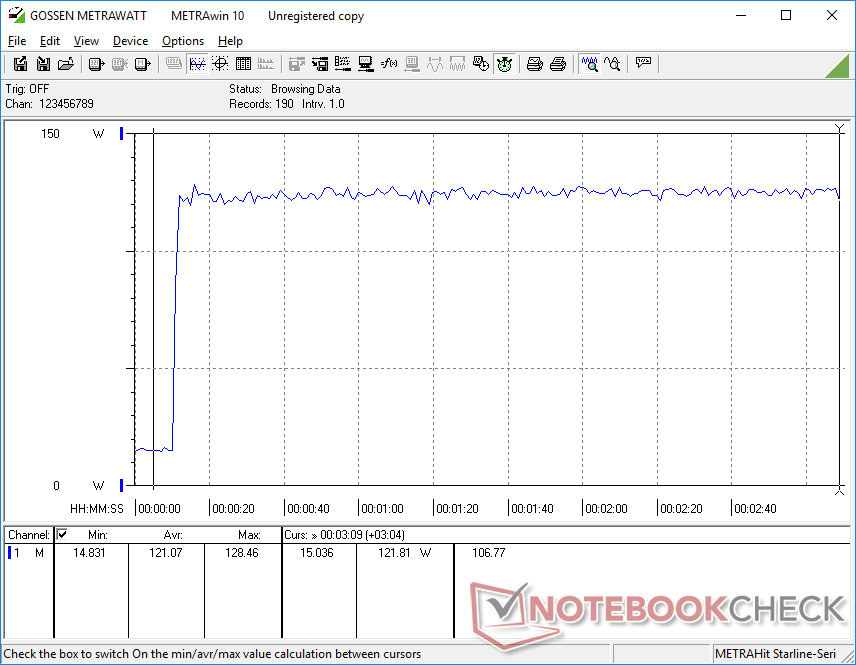
Stresstest
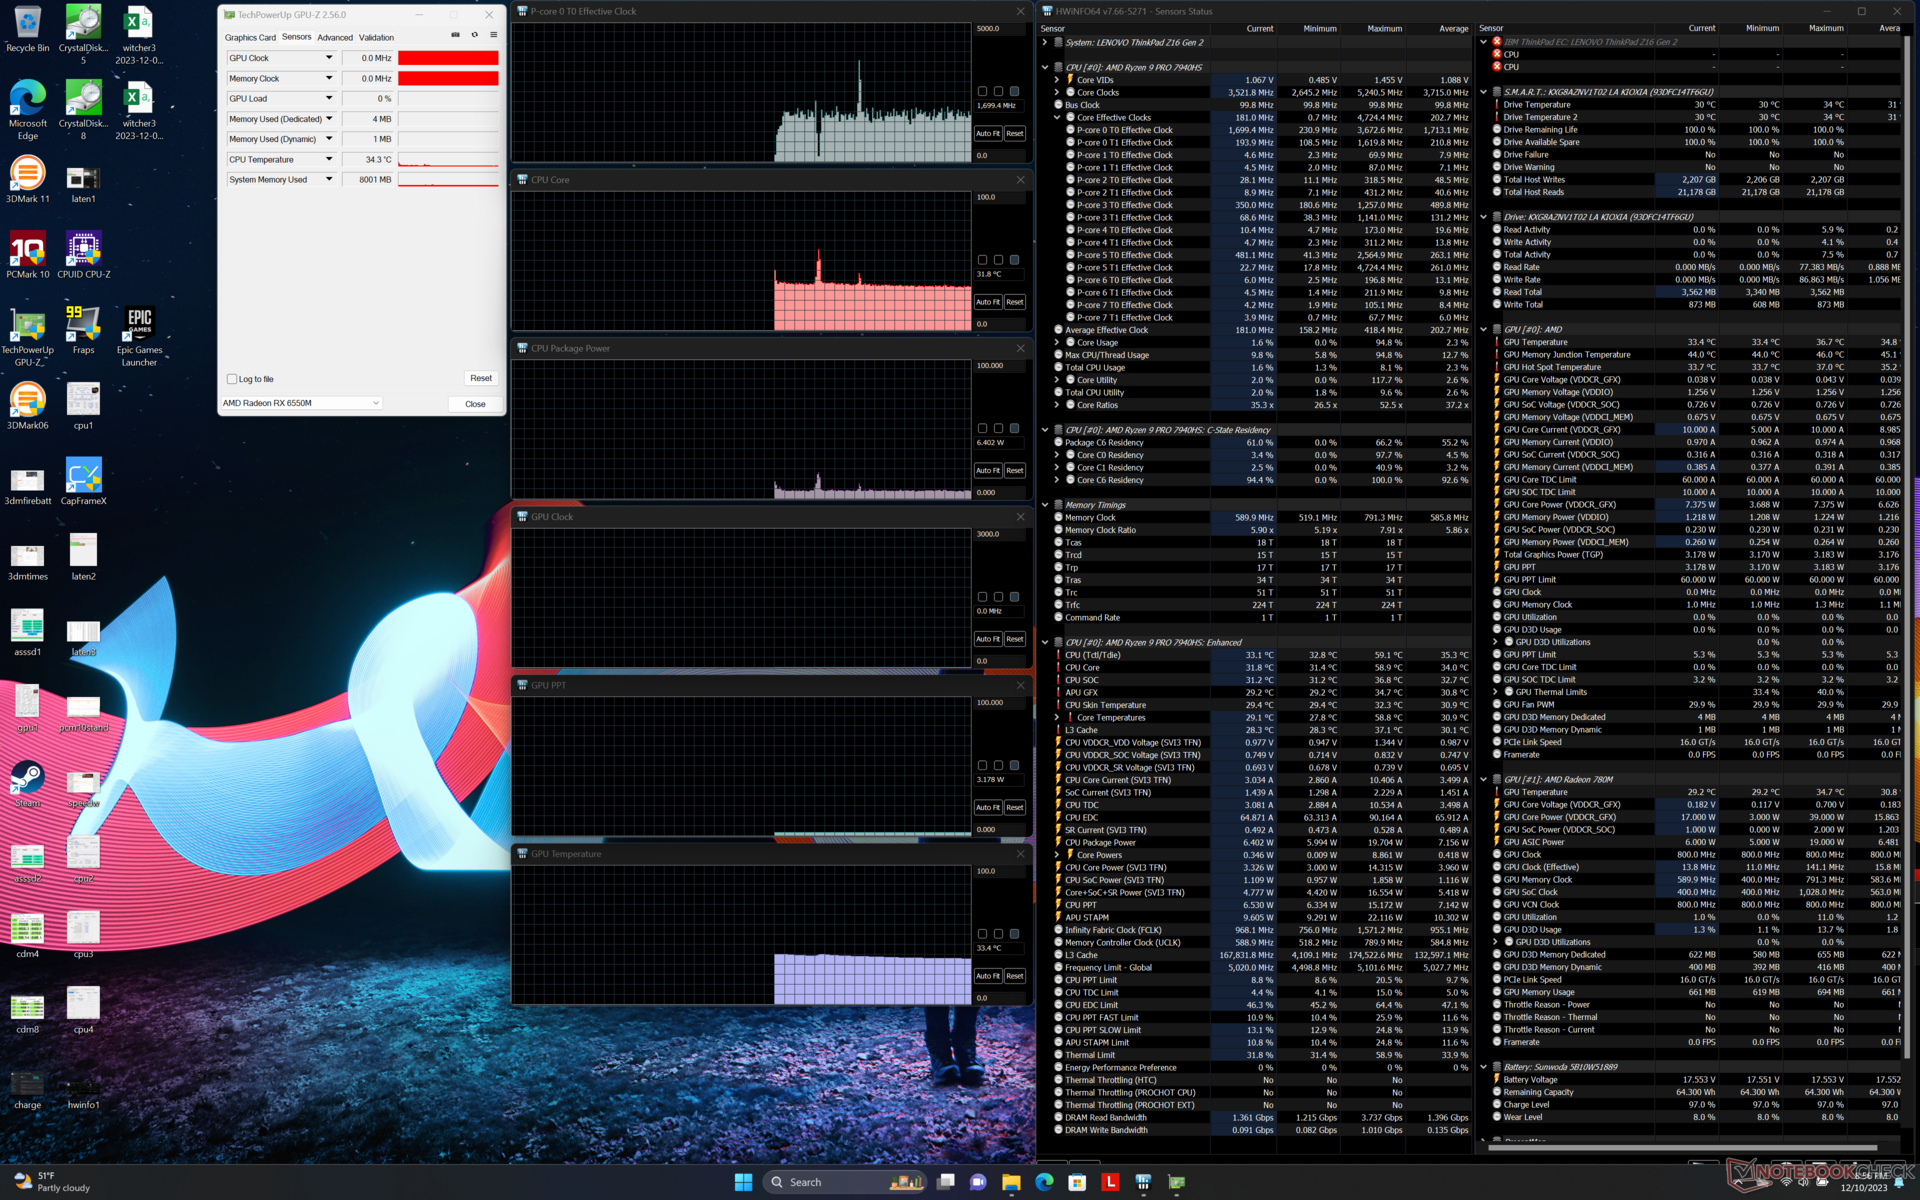
När Prime95 kördes ökade CPU:n till 4,6 GHz och 82 W under bara några sekunder innan den sjönk och stabiliserades på 4,4 GHz, 69 W och behagliga 100 C. Det är tydligt att CPU:n körs så snabbt den kan inom gränserna för den överliggande kyllösningen.
GPU-klockfrekvenserna och kortets strömförbrukning i Performance-läget skulle stabiliseras på 2630 MHz respektive 59 W, jämfört med 2133 MHz och 39 W i Balanced-läget. Mest anmärkningsvärt är att prestandaförlusten mellan de två lägena vid körning Witcher 3 är minimal vid bara några få bildrutor även om skillnaderna i fläktljud är betydande. Användare kan därför överväga att spela i balanserat läge för de mycket tystare fläktarna och något svalare kärntemperaturerna.
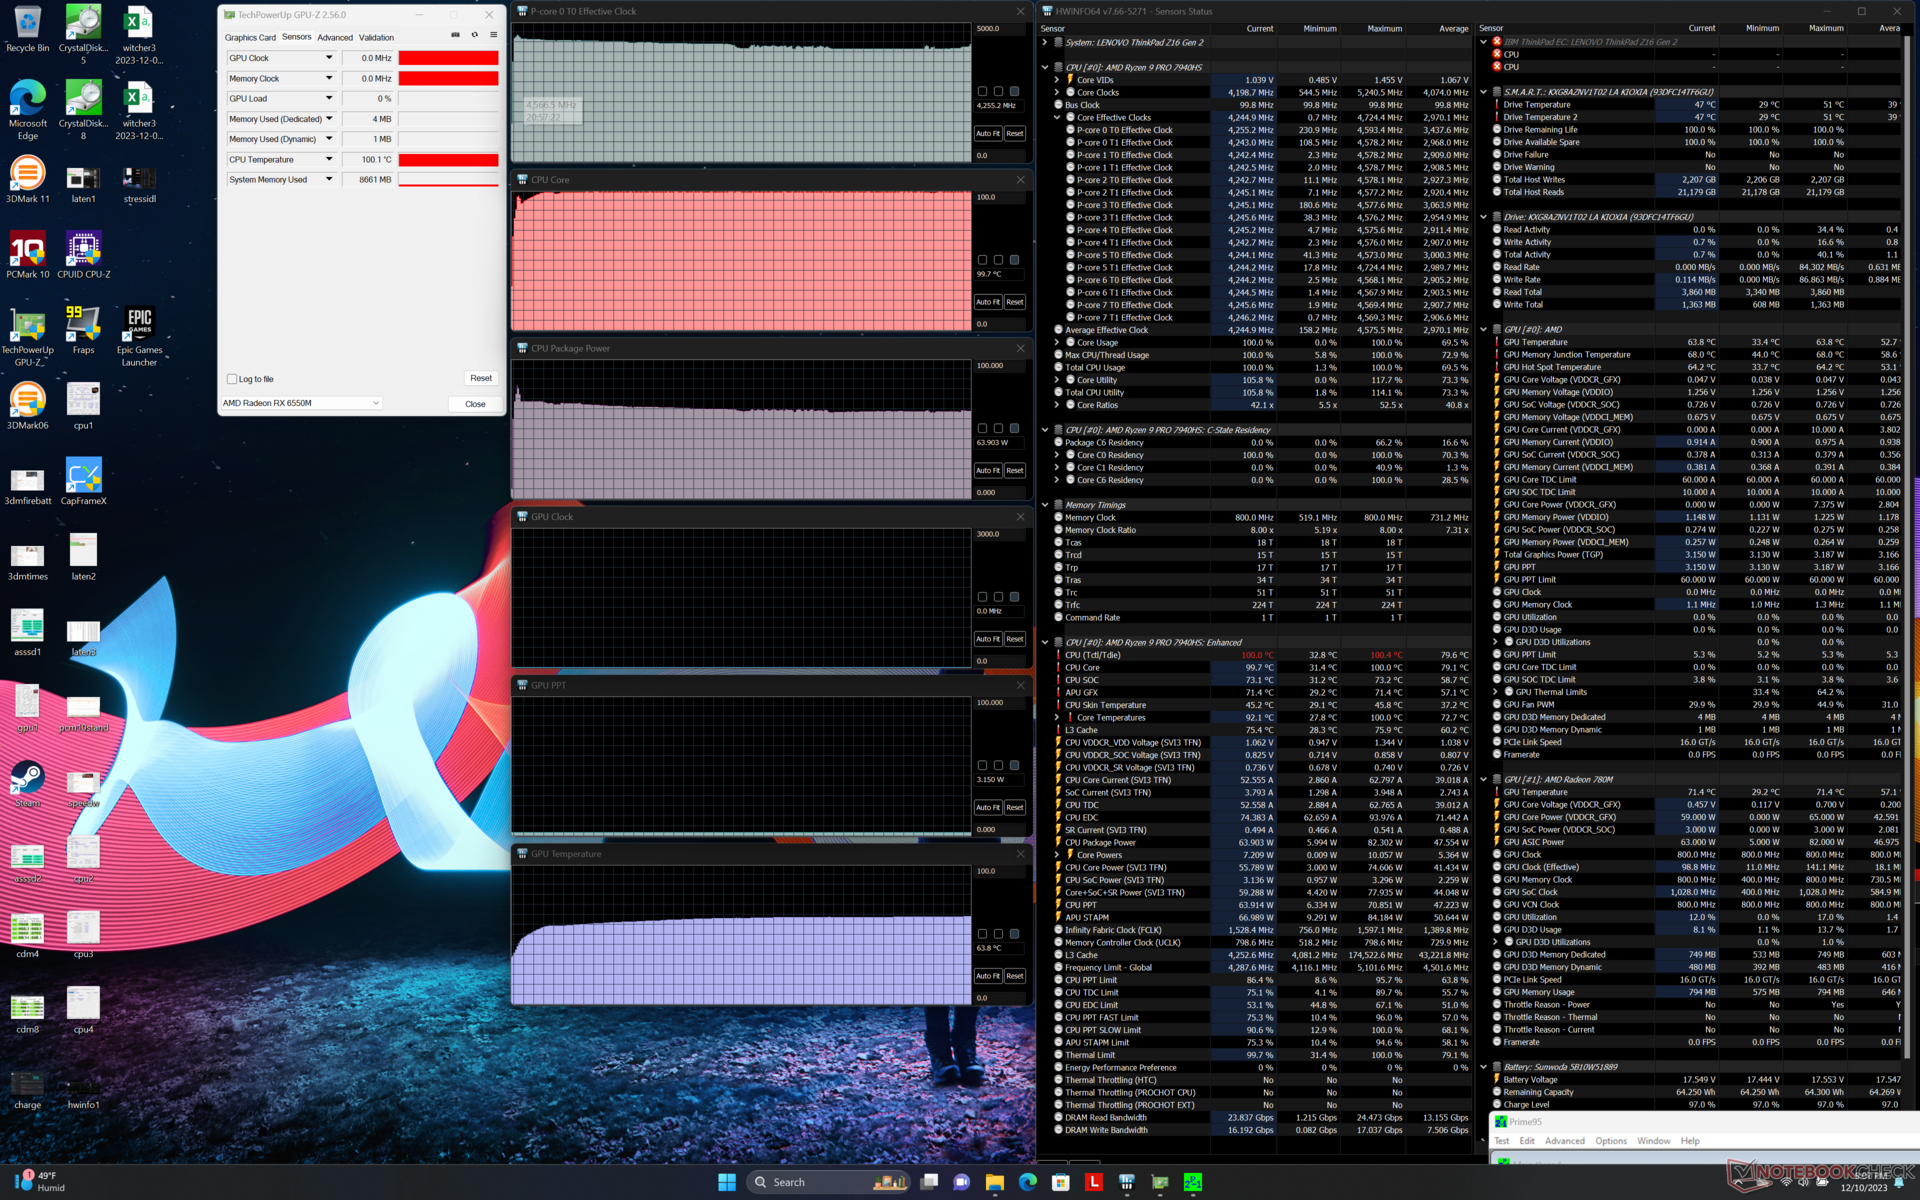
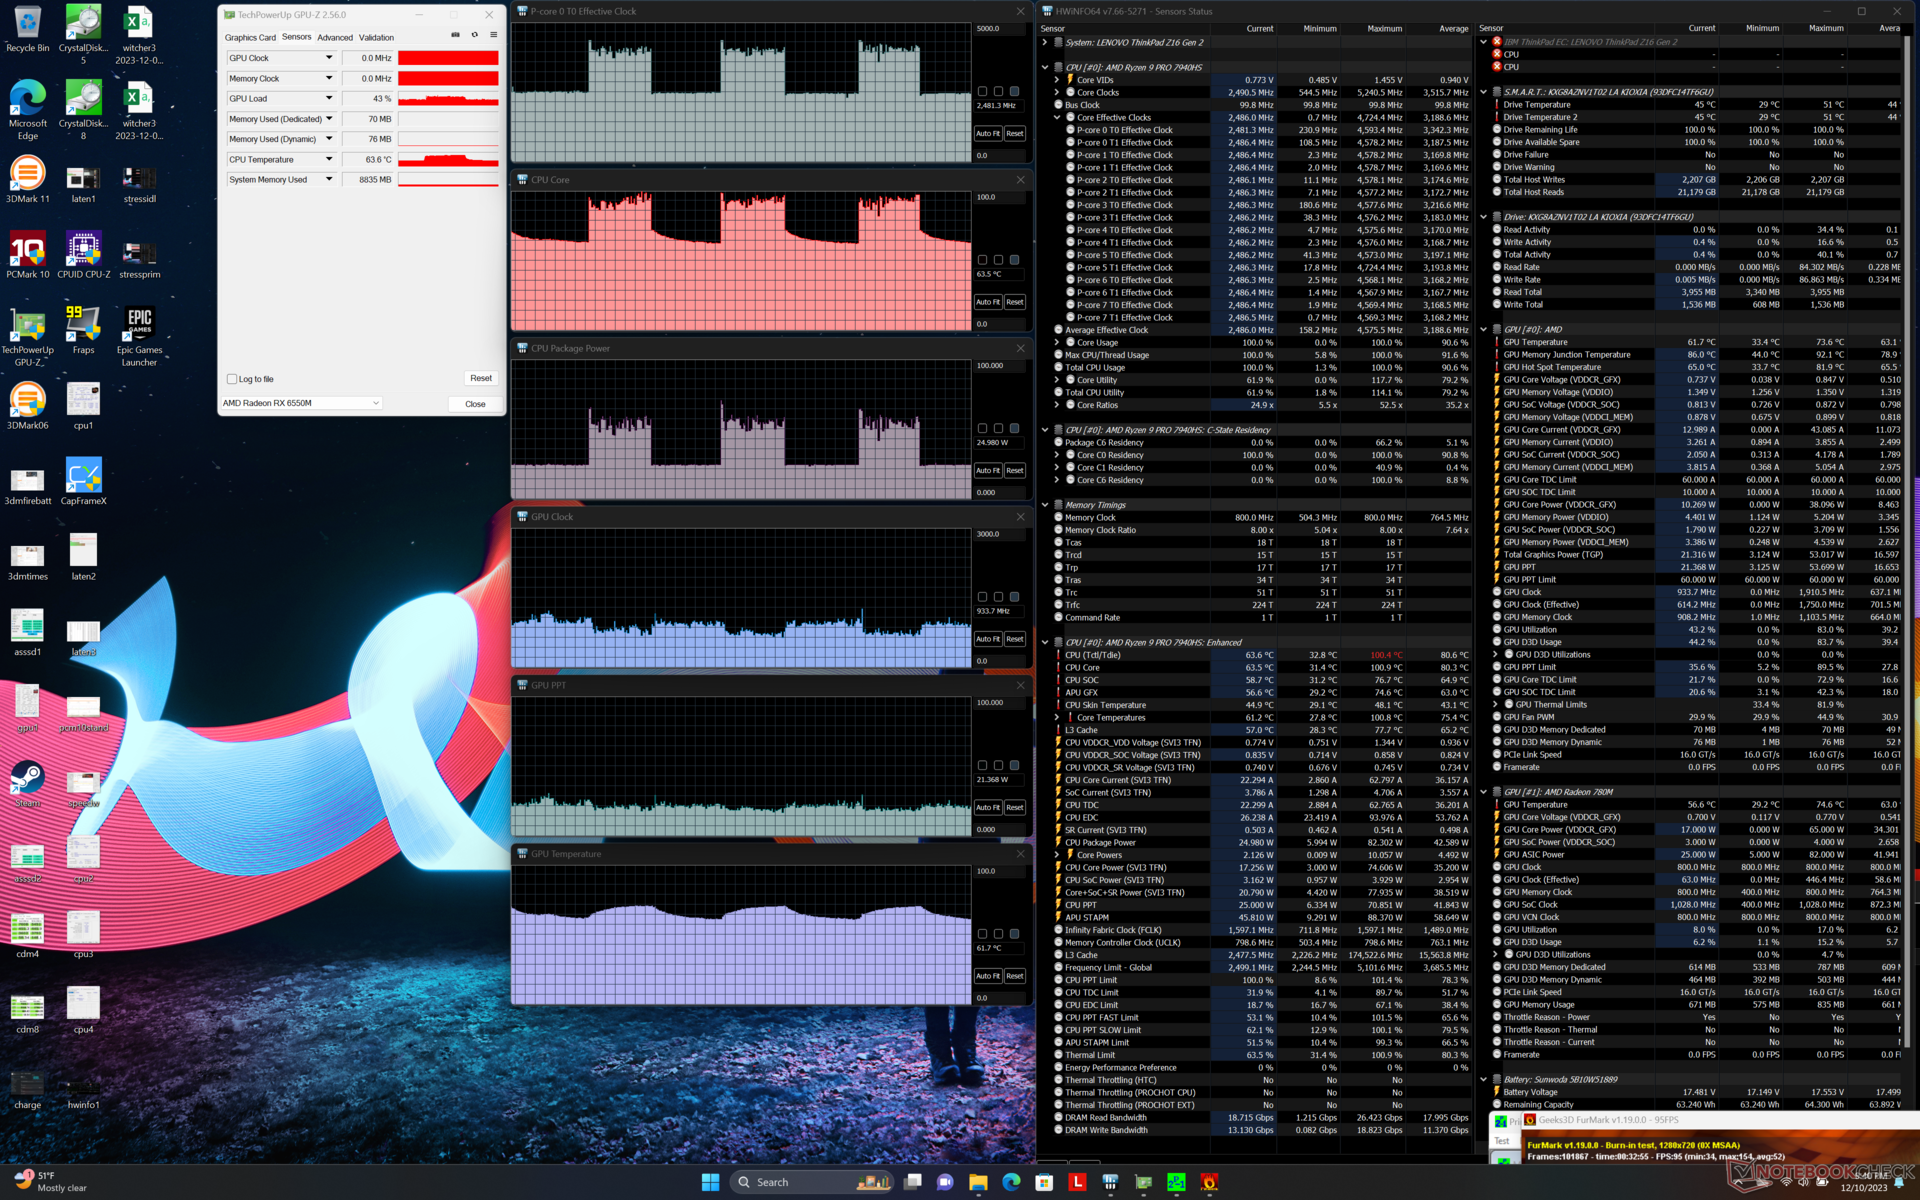
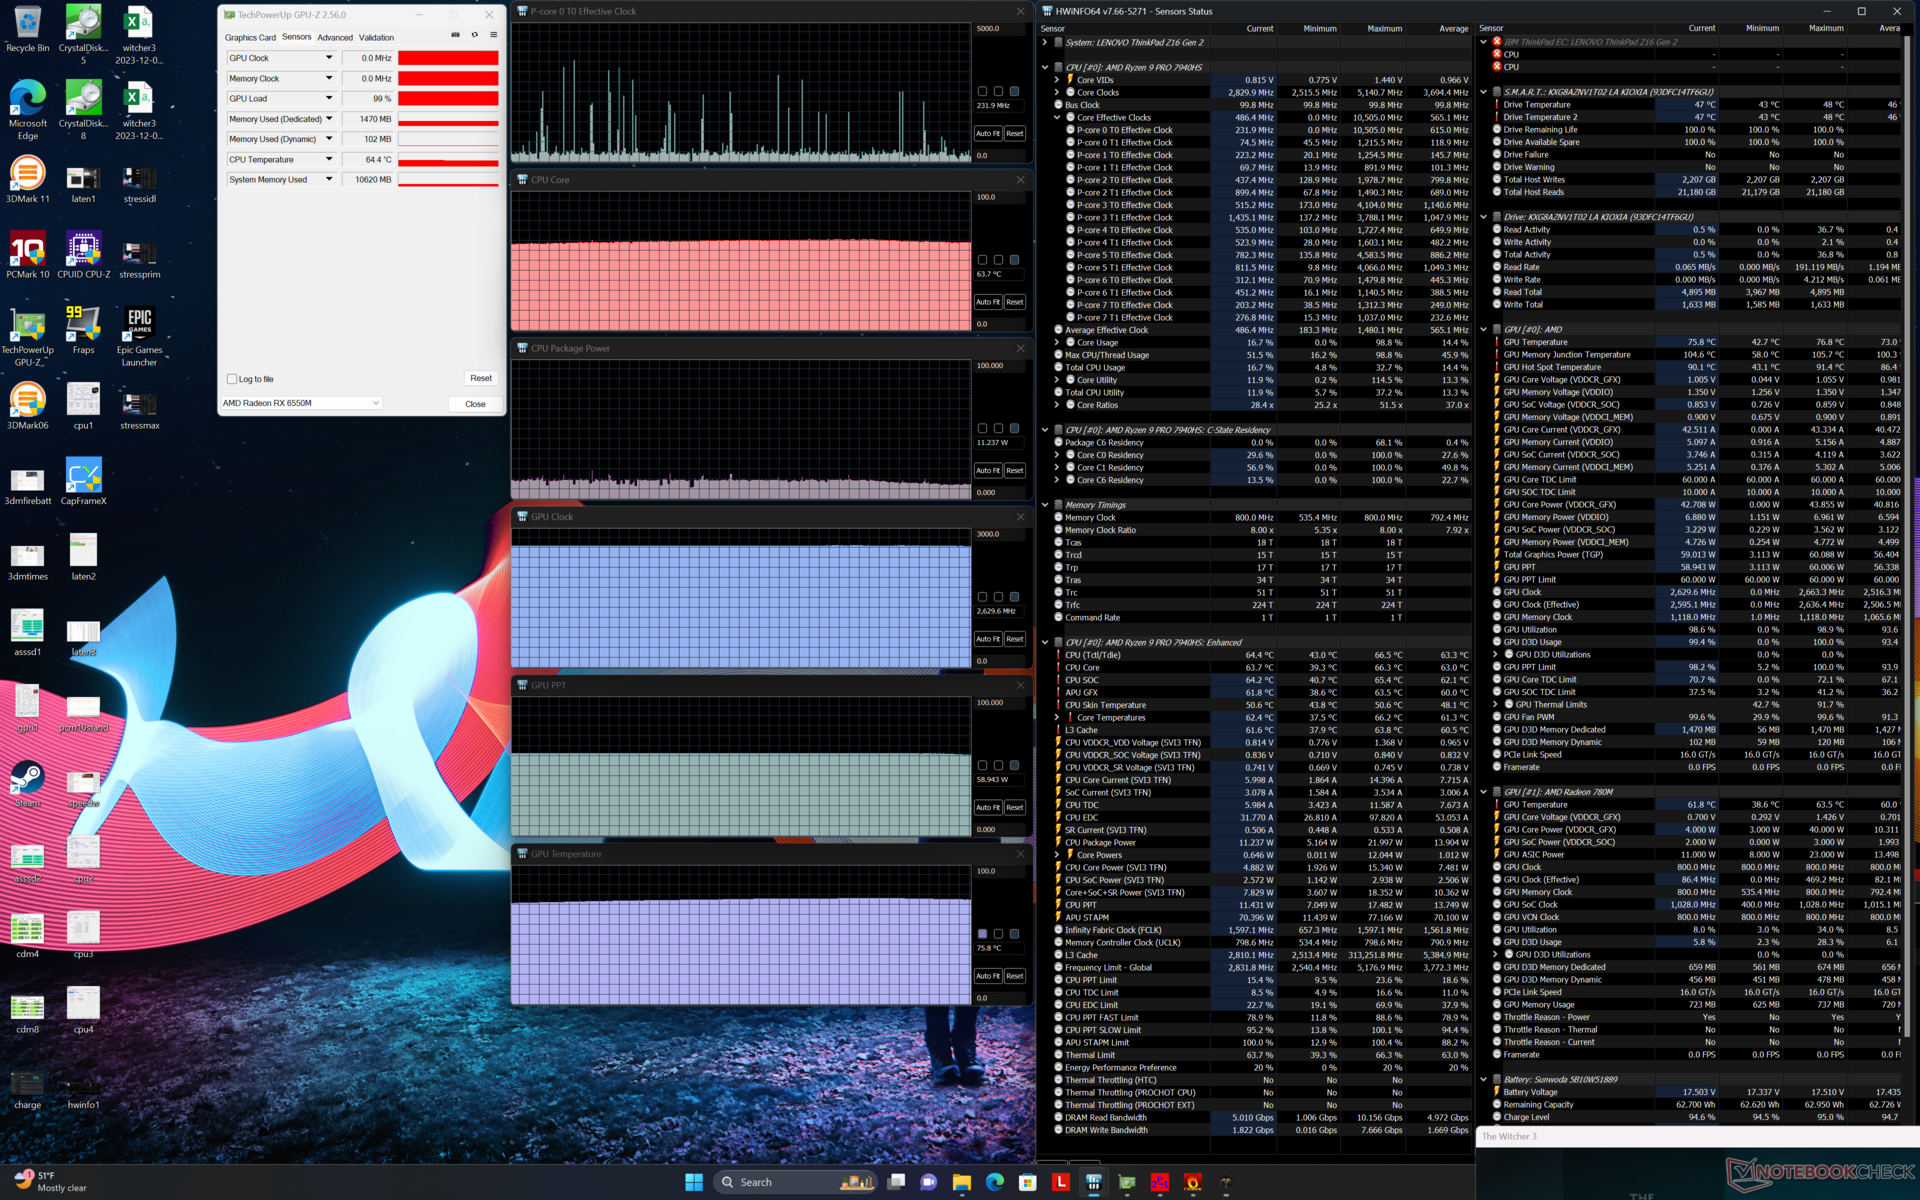
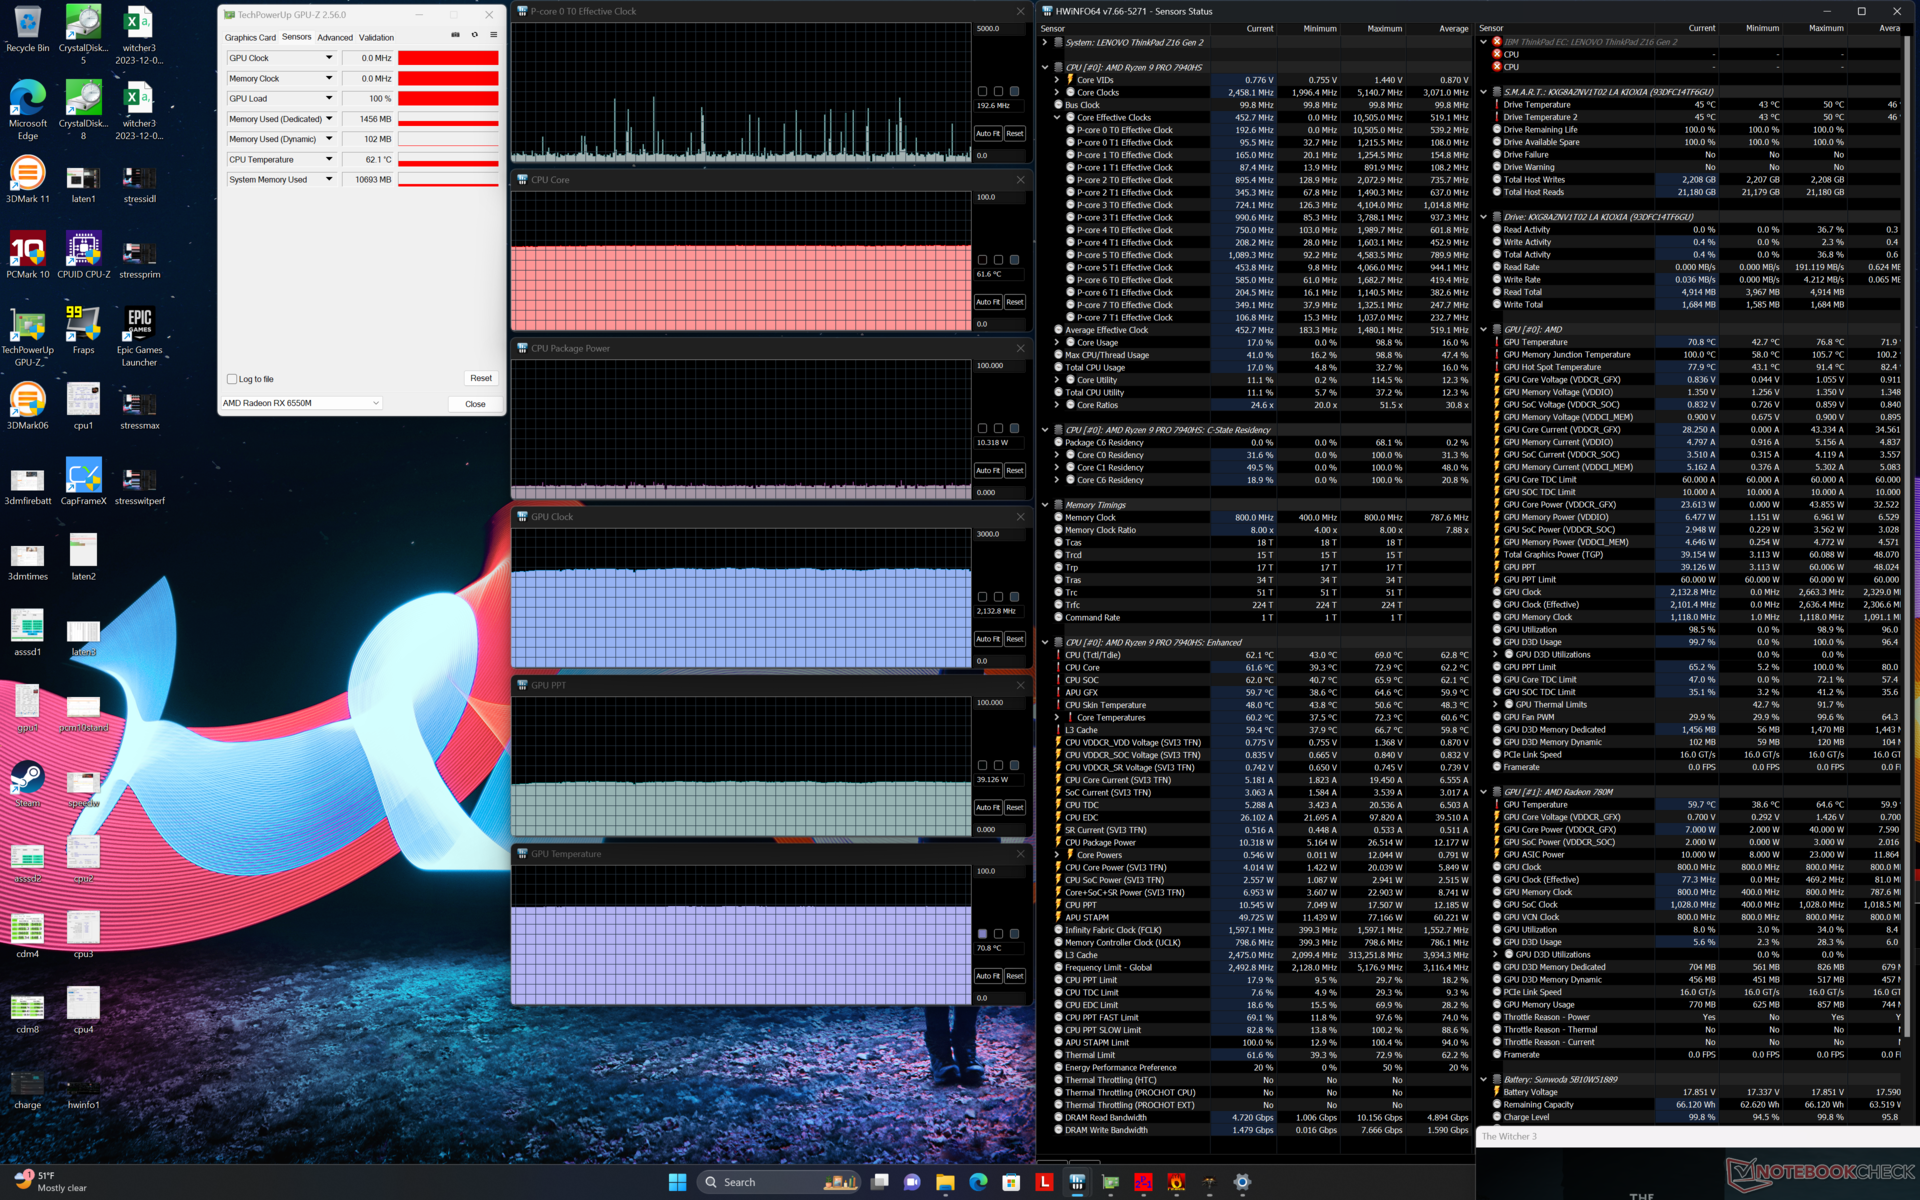
| CPU-klocka (GHz) | GPU-klocka (MHz) | Genomsnittlig CPU-temperatur (°C) | Genomsnittlig GPU-temperatur (°C) | |
| System i viloläge | -- | -- | 32 | 33 |
| Prime95 Stress | 4.2 | -- | 100 | 64 |
| Prime95 + FurMark Stress | 2.5 - 4.0 | 750 - 1000 | 64 - 100 | 62 - 72 |
| Witcher 3 Stress(balanserat läge) | ~0,2 | 2133 | 62 | 71 |
| Witcher 3 Stress (Performance mode) | ~0.2 | 2630 | 64 | 76 |
Högtalare
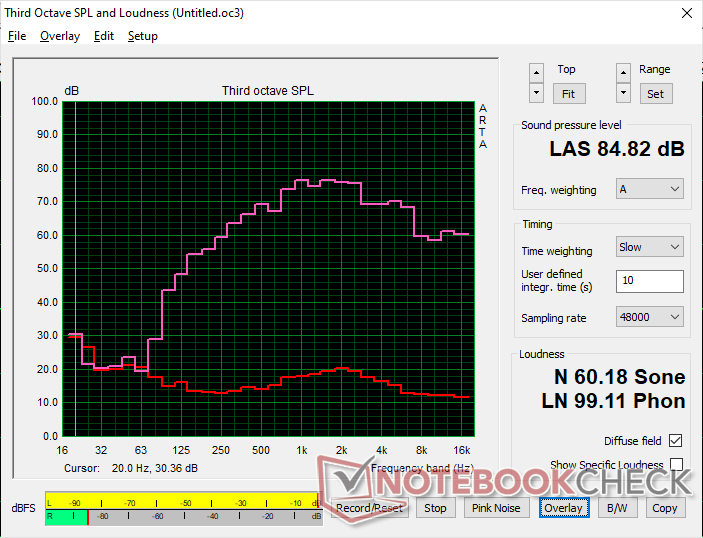
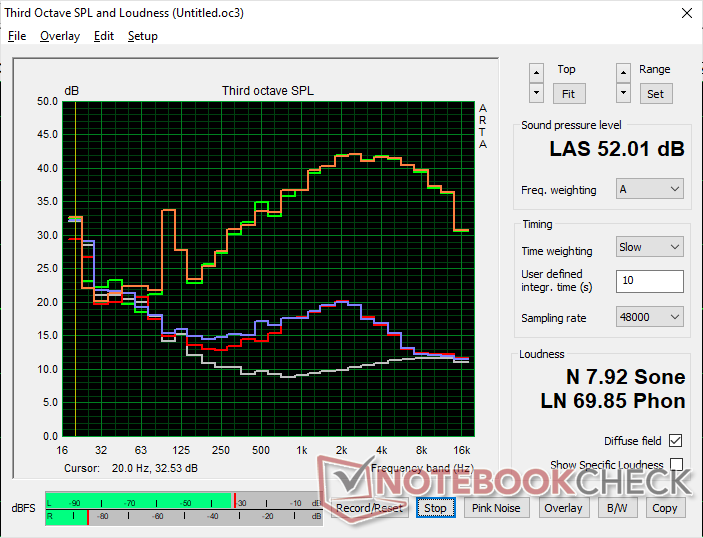
Lenovo ThinkPad Z16 Gen 2 ljudanalys
(+) | högtalare kan spela relativt högt (84.8 dB)
Bas 100 - 315 Hz
(±) | reducerad bas - i genomsnitt 13% lägre än medianen
(±) | linjäriteten för basen är genomsnittlig (11.1% delta till föregående frekvens)
Mellan 400 - 2000 Hz
(±) | högre mellan - i genomsnitt 5.5% högre än median
(+) | mids är linjära (4.9% delta till föregående frekvens)
Högsta 2 - 16 kHz
(+) | balanserade toppar - endast 4.7% från medianen
(+) | toppar är linjära (5.2% delta till föregående frekvens)
Totalt 100 - 16 000 Hz
(+) | det totala ljudet är linjärt (14.8% skillnad mot median)
Jämfört med samma klass
» 35% av alla testade enheter i den här klassen var bättre, 4% liknande, 61% sämre
» Den bästa hade ett delta på 5%, genomsnittet var 17%, sämst var 45%
Jämfört med alla testade enheter
» 20% av alla testade enheter var bättre, 4% liknande, 76% sämre
» Den bästa hade ett delta på 4%, genomsnittet var 24%, sämst var 134%
Apple MacBook Pro 16 2021 M1 Pro ljudanalys
(+) | högtalare kan spela relativt högt (84.7 dB)
Bas 100 - 315 Hz
(+) | bra bas - bara 3.8% från medianen
(+) | basen är linjär (5.2% delta till föregående frekvens)
Mellan 400 - 2000 Hz
(+) | balanserad mellan - endast 1.3% från medianen
(+) | mids är linjära (2.1% delta till föregående frekvens)
Högsta 2 - 16 kHz
(+) | balanserade toppar - endast 1.9% från medianen
(+) | toppar är linjära (2.7% delta till föregående frekvens)
Totalt 100 - 16 000 Hz
(+) | det totala ljudet är linjärt (4.6% skillnad mot median)
Jämfört med samma klass
» 0% av alla testade enheter i den här klassen var bättre, 0% liknande, 100% sämre
» Den bästa hade ett delta på 5%, genomsnittet var 17%, sämst var 45%
Jämfört med alla testade enheter
» 0% av alla testade enheter var bättre, 0% liknande, 100% sämre
» Den bästa hade ett delta på 4%, genomsnittet var 24%, sämst var 134%
Energiförvaltning
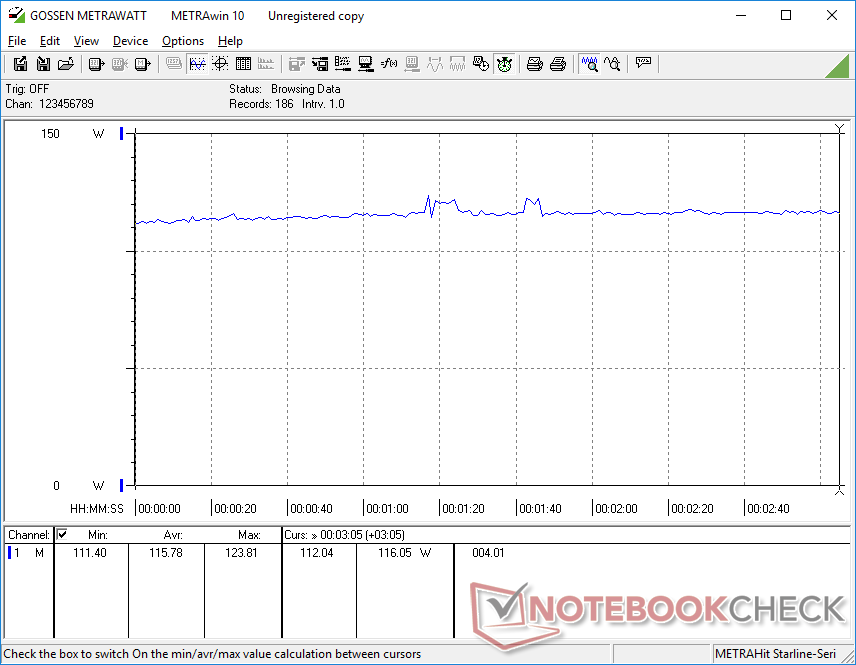
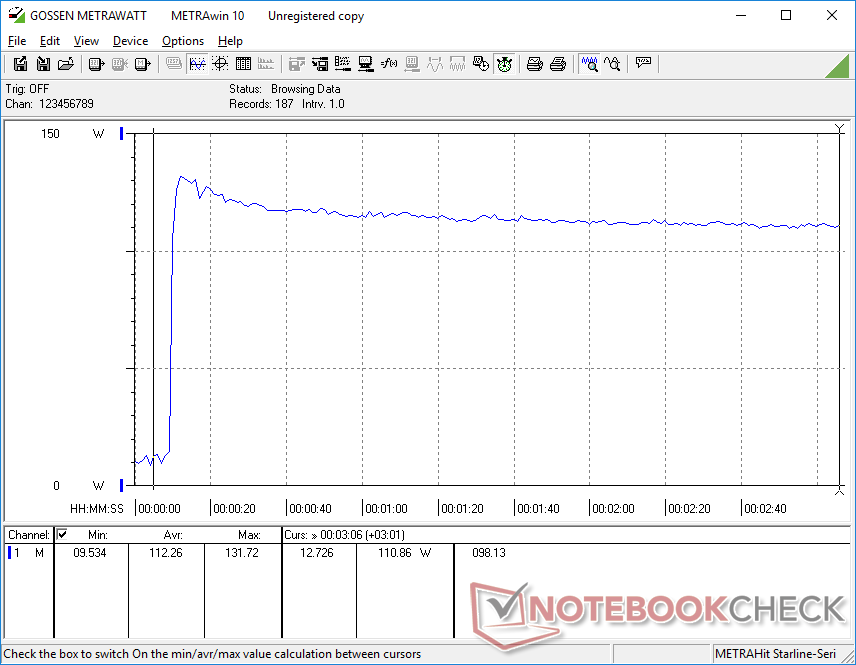
Strömförbrukning
4K OLED-panelen påverkar strömförbrukningen med en betydande mängd. Exempelvis är strömförbrukningen bara 7 W vid tomgång på en helt svart skärm, medan en helt vit skärm med maximal ljusstyrka kan kräva nästan 19 W jämfört med bara 10 W på IPS-konfigurationen. Skillnaderna i strömförbrukning mellan IPS och OLED beskrivs mer i detalj här.
Förbrukningen vid CPU- eller GPU-intensiva uppgifter är något högre än på ThinkPad Z16 Gen 1 även efter att hänsyn tagits till den mer krävande OLED-panelen. Skillnaderna är dock små i förhållande till de stora prestandaökningar som Zen 4 Ryzen 9-processorn erbjuder.
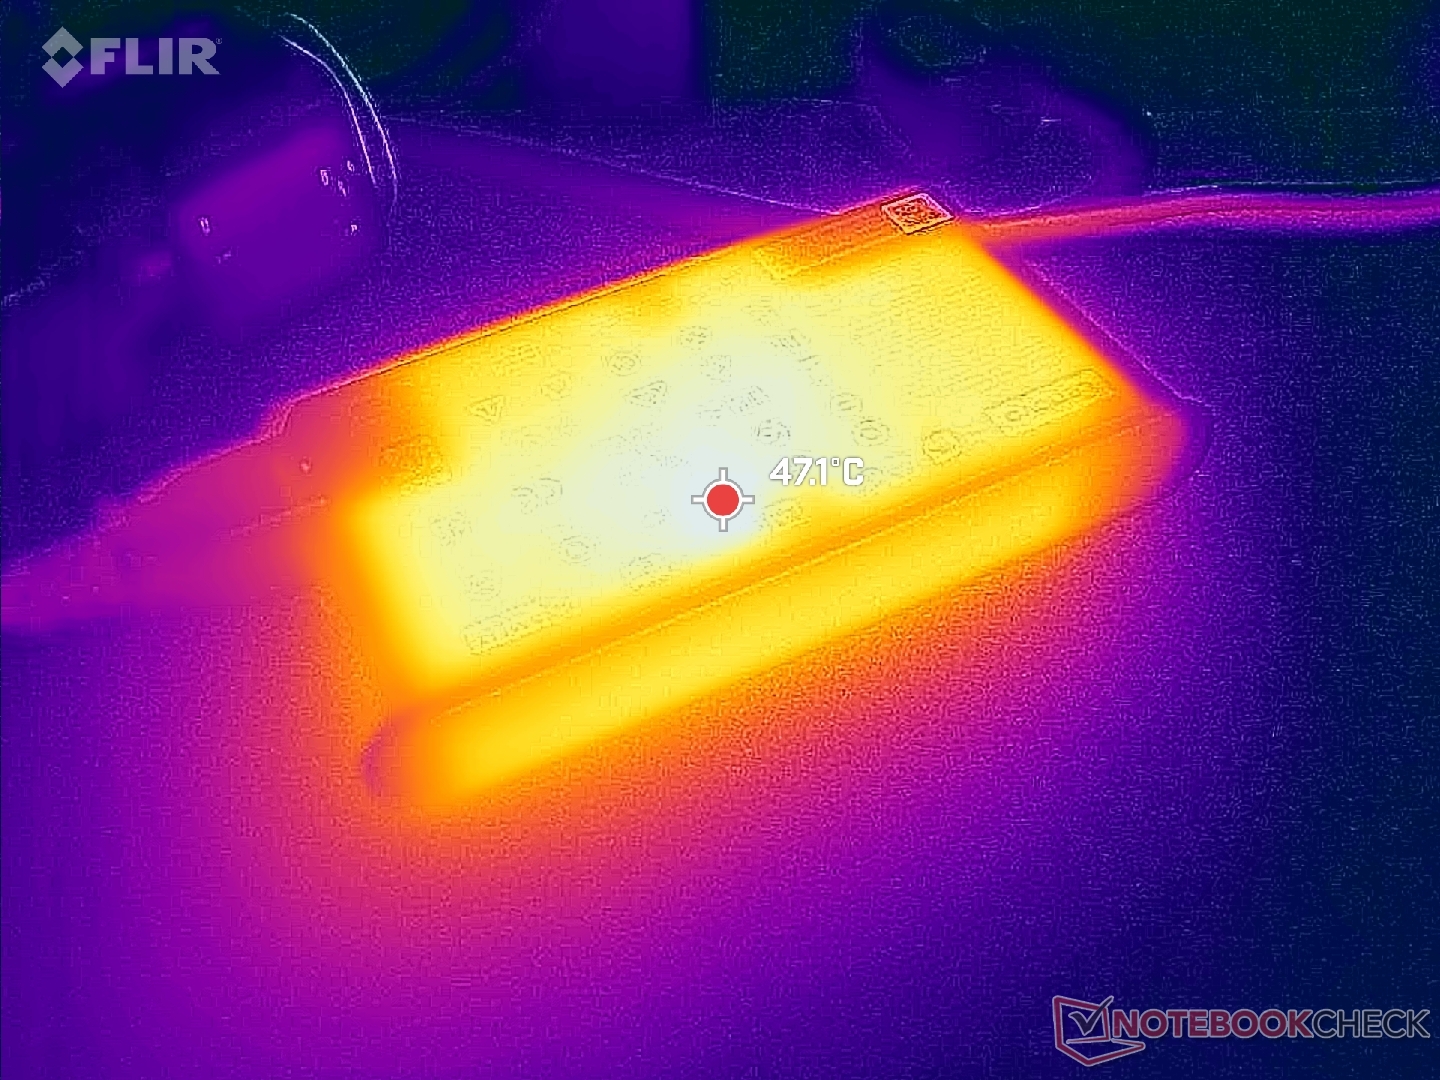
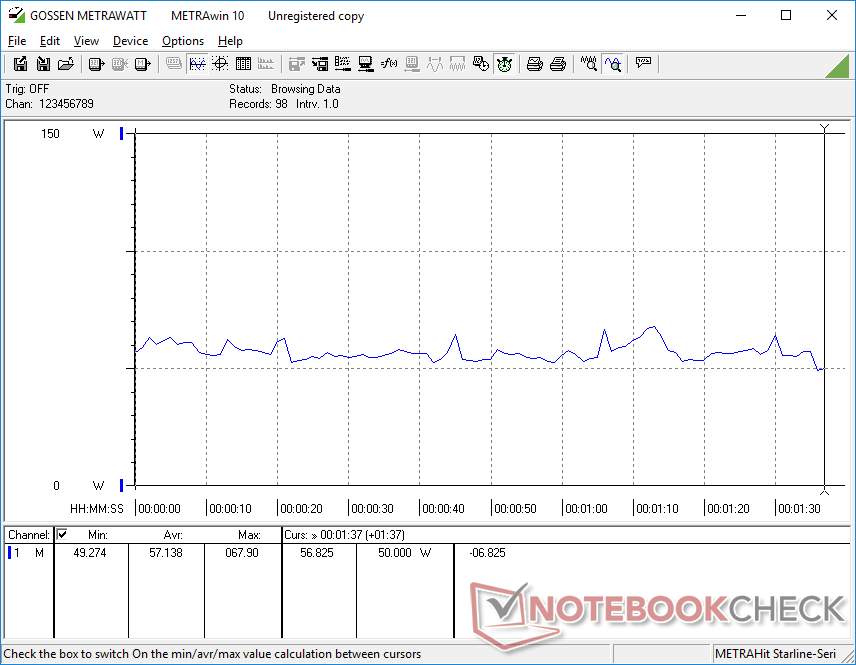
Vi kan mäta en maximal förbrukning på 132 W från den medelstora (~14,6 x 7,7 x 2,3 cm) 135 W USB-C AC-adaptern. Gaming kräver redan nästan 120 W, vilket innebär att laddningshastigheten kommer att sakta ner till en krypning om du kör krävande belastningar samtidigt.
| Av/Standby | |
| Låg belastning | |
| Hög belastning |
|
Förklaring:
min: | |
| Lenovo ThinkPad Z16 Gen 2 R9 PRO 7940HS, Radeon RX 6550M, Kioxia XG8 KXG8AZNV1T02, OLED, 3840x2400, 16" | Lenovo ThinkPad Z16 G1 21D5S00T00 R7 PRO 6850H, Radeon RX 6500M, Samsung PM9A1 MZVL21T0HCLR, IPS LED, 1920x1200, 16" | Lenovo ThinkBook 16 G6 ABP R5 7530U, Vega 7, SK hynix HFS512GEJ9X125N, IPS, 1920x1200, 16" | MSI Creator Z16P B12UHST i9-12900H, GeForce RTX 3080 Ti Laptop GPU, Samsung PM9A1 MZVL22T0HBLB, IPS True Pixel (~100% DCI-P3), 2560x1600, 16" | Asus Vivobook Pro 16X K6604JV-MX016W i9-13980HX, GeForce RTX 4060 Laptop GPU, Solidigm P41 Plus SSDPFKNU010TZ, OLED, 3200x2000, 16" | Apple MacBook Pro 16 2023 M3 Max Apple M3 Max 16-Core, M3 Max 40-Core GPU, Apple SSD AP8192Z, Mini-LED, 3456x2234, 16" | |
|---|---|---|---|---|---|---|
| Power Consumption | 15% | 45% | -60% | -71% | -17% | |
| Idle Minimum * (Watt) | 7.5 | 5.3 29% | 3.7 51% | 11 -47% | 13.8 -84% | 5.2 31% |
| Idle Average * (Watt) | 9.6 | 8.6 10% | 7.1 26% | 17 -77% | 16 -67% | 16.9 -76% |
| Idle Maximum * (Watt) | 18.5 | 9.5 49% | 7.7 58% | 26 -41% | 19 -3% | 17.2 7% |
| Load Average * (Watt) | 57.1 | 65.2 -14% | 43.9 23% | 124 -117% | 147 -157% | 90.5 -58% |
| Witcher 3 ultra * (Watt) | 115.8 | 93.6 19% | 40.8 65% | 133.5 -15% | 147.8 -28% | 109 6% |
| Load Maximum * (Watt) | 131.7 | 133.81 -2% | 66.6 49% | 212 -61% | 244 -85% | 145.2 -10% |
* ... mindre är bättre
Power Consumption Witcher 3 / Stresstest
Power Consumption external Monitor
Batteritid
Körtiderna är generellt kortare än på förra årets modell, vilket till stor del beror på vår mer krävande OLED-panel. Eftersom de flesta webbsidor har en övervägande vit färg kan strömförbrukningen vara 10 W högre även om de aktiva applikationerna inte är krävande, vilket nämns i avsnittet Strömförbrukning ovan. Vi kunde bara registrera en WLAN-körtid på 6 timmar jämfört med 10 timmar på ThinkPad Z16 IPS-konfigurationen eller över 16 timmar på MacBook Pro 16.
Laddning från tom till full kapacitet är långsammare än vanligt på cirka 2,5 timmar jämfört med 1,5 till 2 timmar på de flesta Ultrabooks. Detta är en av få bärbara datorer med både Ryzen 9 och diskret grafik som drivs med USB-C.
| Lenovo ThinkPad Z16 Gen 2 R9 PRO 7940HS, Radeon RX 6550M, 72 Wh | Lenovo ThinkPad Z16 G1 21D5S00T00 R7 PRO 6850H, Radeon RX 6500M, 72 Wh | Lenovo ThinkBook 16 G6 ABP R5 7530U, Vega 7, 45 Wh | MSI Creator Z16P B12UHST i9-12900H, GeForce RTX 3080 Ti Laptop GPU, 90 Wh | Asus Vivobook Pro 16X K6604JV-MX016W i9-13980HX, GeForce RTX 4060 Laptop GPU, 90 Wh | Apple MacBook Pro 16 2023 M3 Max Apple M3 Max 16-Core, M3 Max 40-Core GPU, 99.6 Wh | |
|---|---|---|---|---|---|---|
| Batteridrifttid | 45% | 68% | -27% | -2% | 75% | |
| Reader / Idle (h) | 10.2 | |||||
| WiFi v1.3 (h) | 6 | 9.9 65% | 10.1 68% | 5.2 -13% | 6.5 8% | 16.7 178% |
| Load (h) | 1.7 | 2.1 24% | 1 -41% | 1.5 -12% | 1.2 -29% | |
| H.264 (h) | 11.9 | 11.6 | 5.8 | 5.3 | 20.4 |
För
Emot
Dom - Fantastisk design hålls tillbaka av en medelmåttig GPU
I vår recension av den ursprungliga Gen 1-modellen lovordade vi ThinkPad Z16 för dess robusta och attraktiva konstruktion samt bekväma tangentbord och styrplatta. Gen 2-modellen behåller alla dessa fördelar och har dessutom en mycket snabbare Ryzen Pro-processor och en högkvalitativ OLED-pekskärm som ger märkbart bättre prestanda och färger. Dessa två tillägg är de främsta anledningarna till att välja Gen 2-versionen framför Gen 1.
ThinkPad Z16 Gen 2 är definitivt snygg och sexig och den nya Zen 4 Pro-processorn är inte att leka med. Radeon RX 6550M är dock för lite och för sent, särskilt i den här prisklassen.
Den nya Radeon RX 6550M hjälper också till att skilja mellan de två modellversionerna, men dess prestanda är inte imponerande, särskilt när du tar hänsyn till det höga priset på $1600+. Inte nog med att GPU:n är av en äldre AMD-arkitektur, bärbara datorer med GeForce RTX 3050 Ti kan hittas för under tusenlappen samtidigt som de erbjuder en liknande prestandanivå. Radeon GPU är definitivt en av de svagaste aspekterna av ThinkPad Z16-serien hittills.
Om du inte bryr dig om Ryzen Pro, då
Asus Vivobook Pro 16X eller till och med HP Spectre x360 16-serien fungera som utmärkta alternativ till ThinkPad Z16 Gen 2 eftersom alla erbjuder liknande OLED- och diskreta grafikalternativ i tunna chassidesigner. Förhoppningsvis kommer framtida revideringar från Lenovo att inkludera antingen GeForce RTX eller nyare RDNA3-alternativ.Pris och tillgänglighet
Lenovo levererar nu ThinkPad Z16 Gen 2 från $1600 USD för Ryzen 5, integrerad GPU och 1200p IPS-konfiguration upp till över $2600 enligt recensionen.
Lenovo ThinkPad Z16 Gen 2
- 12/16/2023 v7 (old)
Allen Ngo
Genomskinlighet
Valet av enheter som ska granskas görs av vår redaktion. Testprovet gavs till författaren som ett lån av tillverkaren eller återförsäljaren för denna recension. Långivaren hade inget inflytande på denna recension och inte heller fick tillverkaren en kopia av denna recension innan publiceringen. Det fanns ingen skyldighet att publicera denna recension. Som ett oberoende medieföretag är Notebookcheck inte föremål för auktoritet från tillverkare, återförsäljare eller förlag.
This is how Notebookcheck is testingEvery year, Notebookcheck independently reviews hundreds of laptops and smartphones using standardized procedures to ensure that all results are comparable. We have continuously developed our test methods for around 20 years and set industry standards in the process. In our test labs, high-quality measuring equipment is utilized by experienced technicians and editors. These tests involve a multi-stage validation process. Our complex rating system is based on hundreds of well-founded measurements and benchmarks, which maintains objectivity.
Price comparison

