Asus VivoBook Pro 16 (2023) granskning av bärbar dator: Core i9-13900H, RTX 4050 och 3,2K OLED passar bra för hobbyskapare

Asus har uppdaterat sin VivoBook-serie med flera nya modeller under 2023. Efter att ha granskatAsus VivoBook 14X,VivoBook 15XochVivoBook Pro 16X K6604vänder vi nu vår uppmärksamhet mot det senaste tillskottet, VivoBook Pro 16 K6602VU.
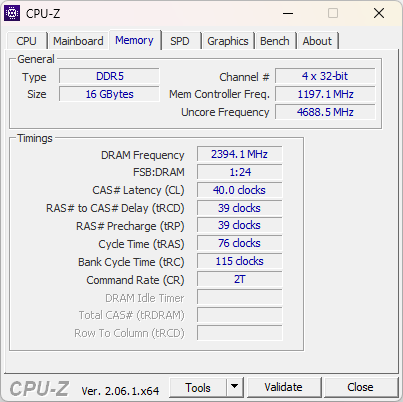
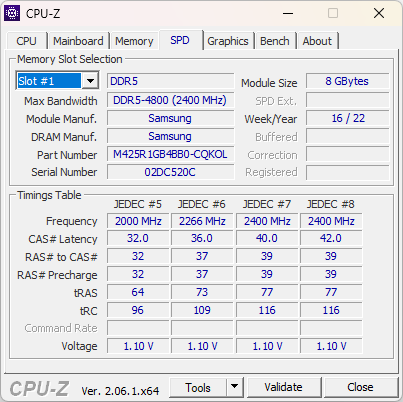
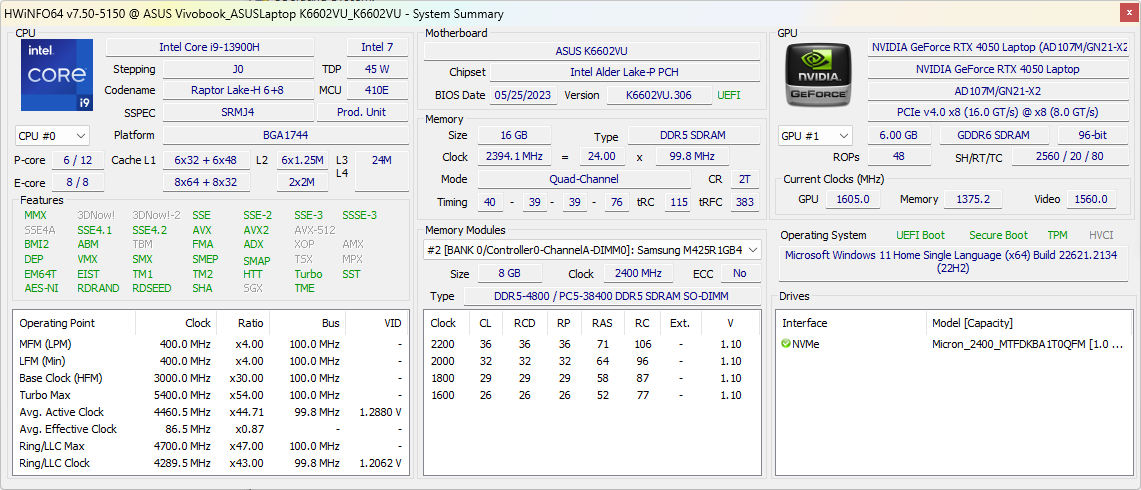
2023 VivoBook Pro 16 erbjuder flera viktiga uppgraderingar jämfört medsenaste generationen. Den har några kraftfulla komponenter, inklusive enIntel Core i9-13900HcPU ochNvidia GeForce RTX 4050grafik. Vår testenhet var också utrustad med 16 GB snabb DDR5-4800 RAM, en 1 TB PCIe Gen4 SSD och en livfull 120 Hz 16:10 3,2K OLED-skärm med Dolby Vision-stöd.
Denna välutrustade enhet är dock inte billig - vår VivoBook Pro 16 config kostar 1 54 990 ₹ (2 199 € inkl. moms) på den indiska marknaden. Vi testar VivoBook Pro 16 för att se om den lever upp till den höga prislappen.
Potentiella konkurrenter i jämförelse
Gradering | Datum | Modell | Vikt | Höjd | Storlek | Upplösning | Pris |
|---|---|---|---|---|---|---|---|
| 87.6 % v7 (old) | 11/2023 | Asus VivoBook Pro 16 K6602VU i9-13900H, GeForce RTX 4050 Laptop GPU | 1.9 kg | 19 mm | 16.00" | 3200x2000 | |
| 86.2 % v7 (old) | 07/2023 | Asus Vivobook Pro 16X K6604JV-MX016W i9-13980HX, GeForce RTX 4060 Laptop GPU | 2.1 kg | 22.8 mm | 16.00" | 3200x2000 | |
| 89.7 % v7 (old) | 06/2023 | Asus ROG Flow X16 GV601V i9-13900H, GeForce RTX 4060 Laptop GPU | 2.1 kg | 19.4 mm | 16.00" | 2560x1600 | |
| 89 % v7 (old) | 08/2023 | Lenovo Legion Pro 5 16ARX8 (R5 7645HX, RTX 4050) R5 7645HX, GeForce RTX 4050 Laptop GPU | 2.5 kg | 27.3 mm | 16.00" | 2560x1600 | |
| 86.9 % v7 (old) | 06/2023 | Asus TUF Gaming A16 FA617XS R9 7940HS, Radeon RX 7600S | 2.2 kg | 22.1 mm | 16.00" | 1920x1200 | |
| 86.3 % v7 (old) | 05/2023 | Asus VivoBook Pro 16 i7-12700H, GeForce RTX 3050 Ti Laptop GPU | 1.9 kg | 20 mm | 16.00" | 2560x1600 | |
| 86.2 % v7 (old) | 03/2023 | Gigabyte AERO 16 OLED BSF i9-13900H, GeForce RTX 4070 Laptop GPU | 2.1 kg | 18 mm | 16.00" | 3840x2400 |
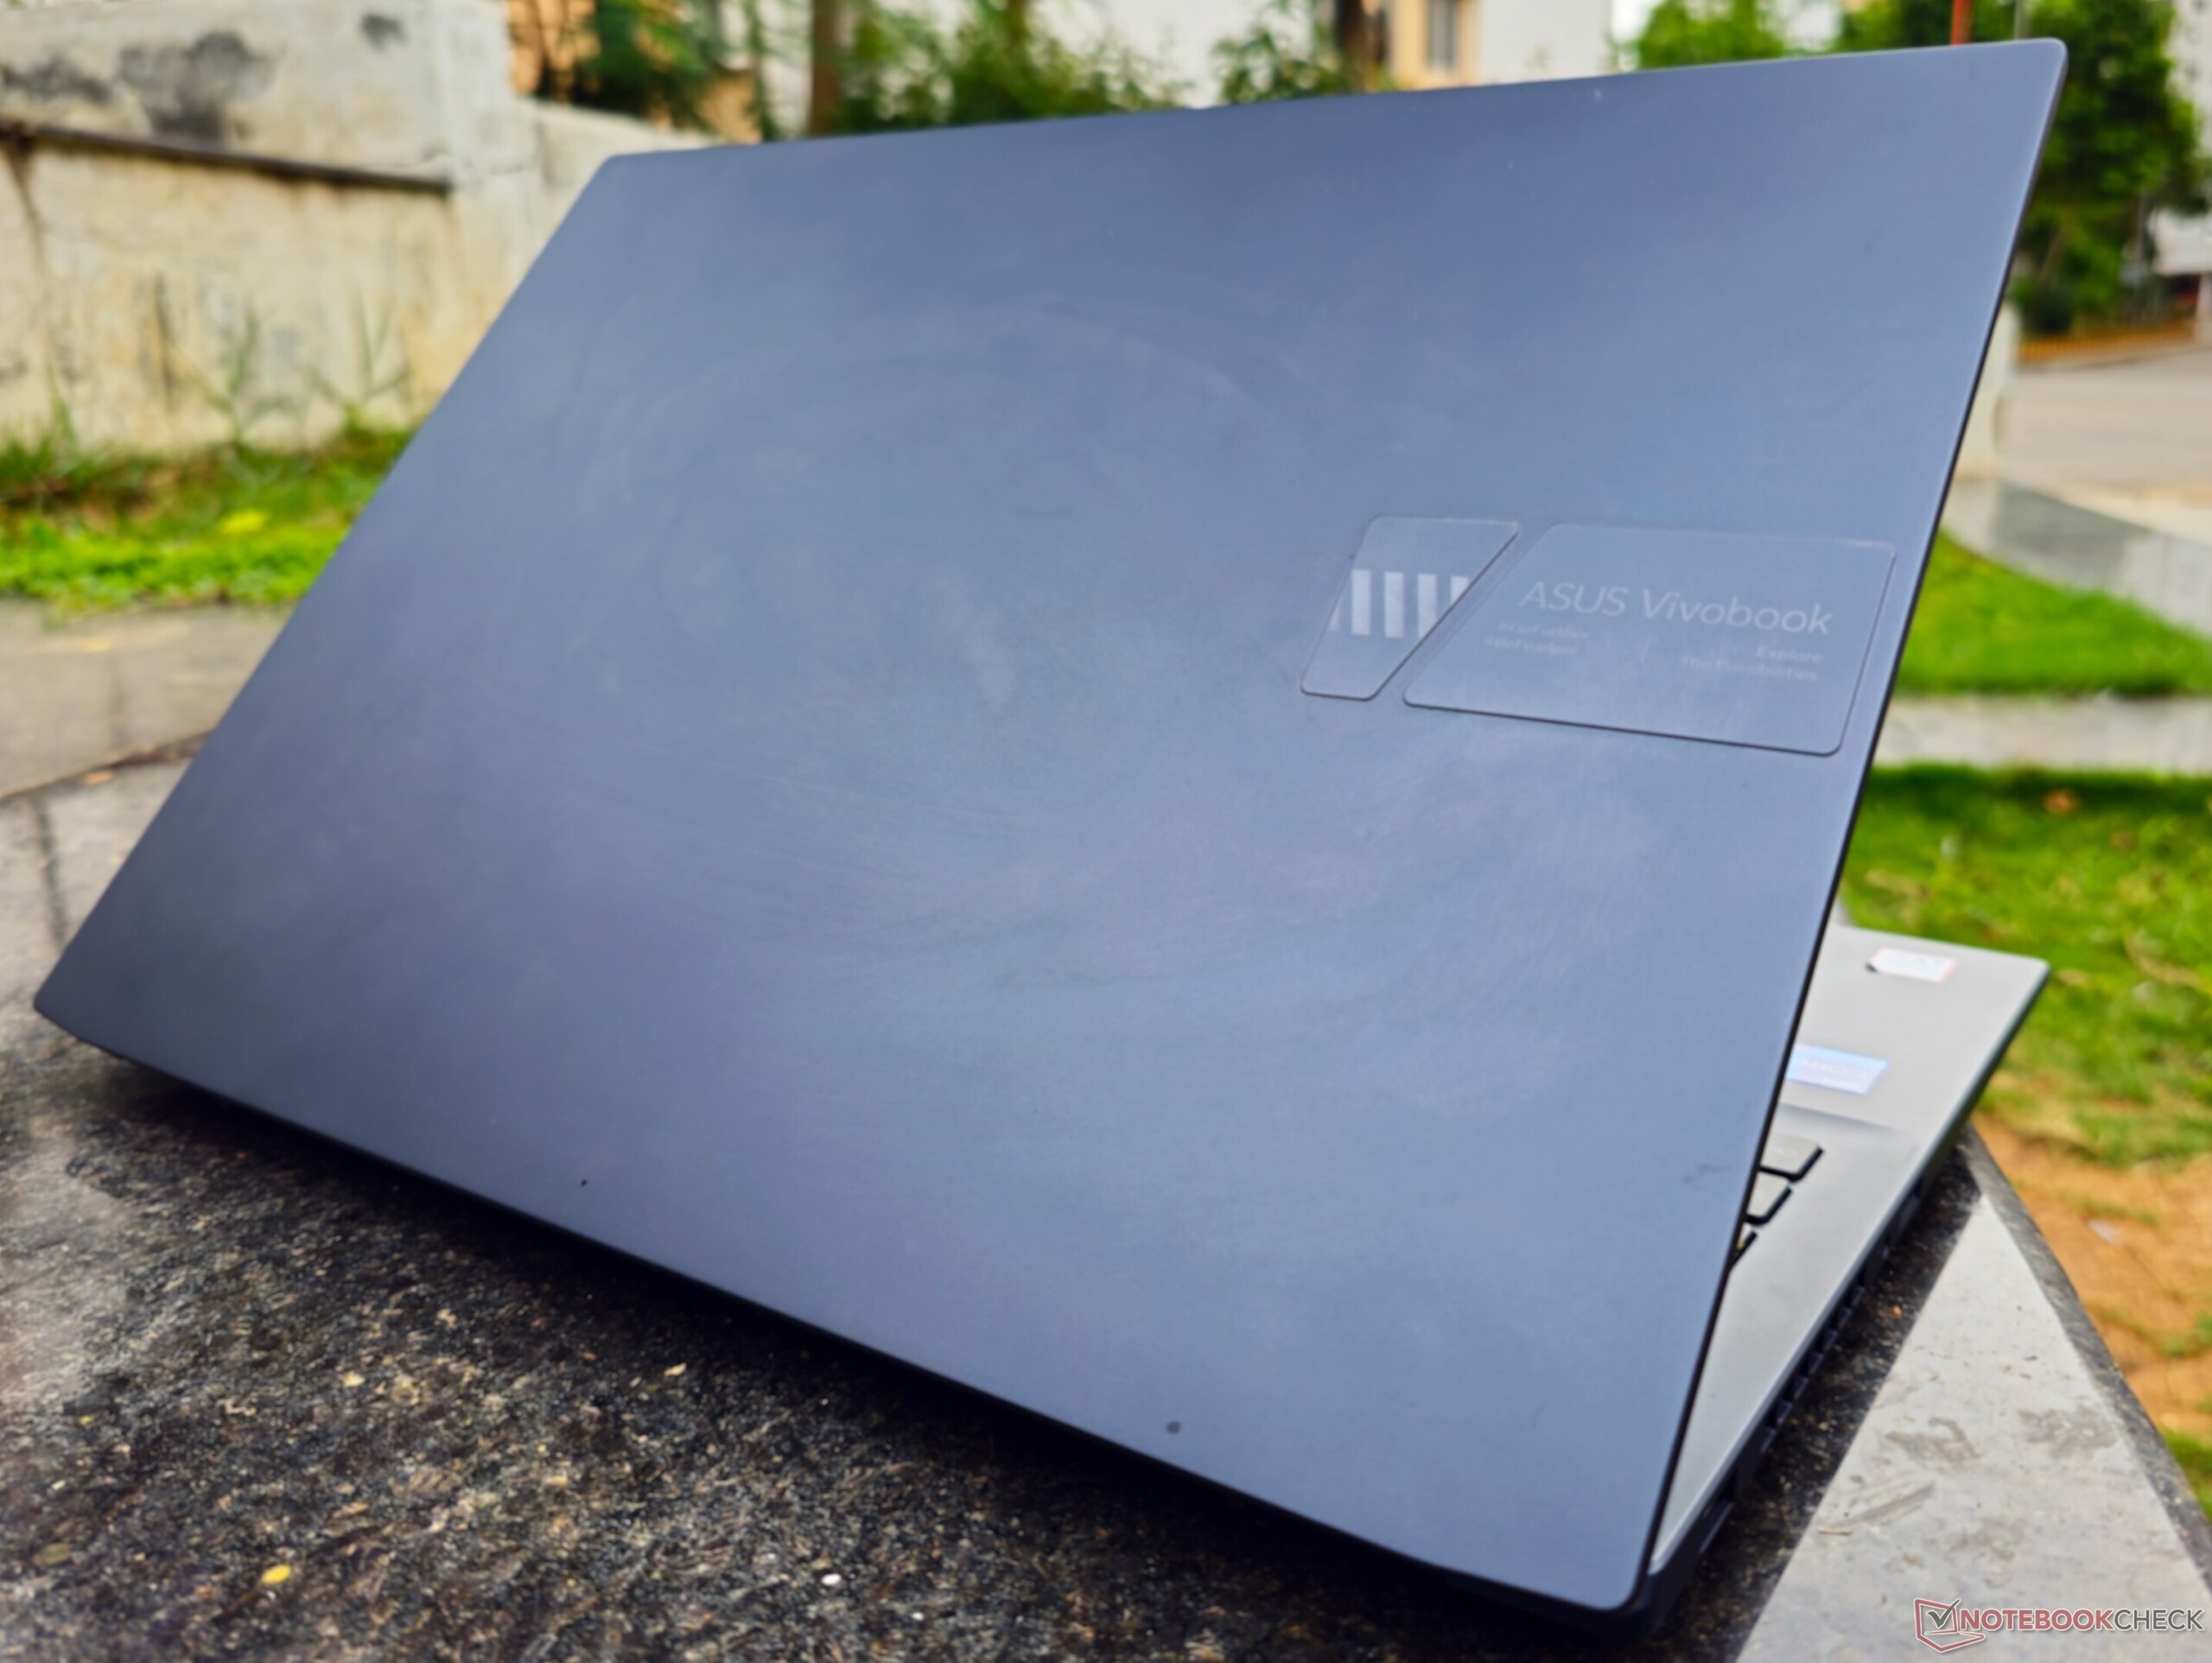
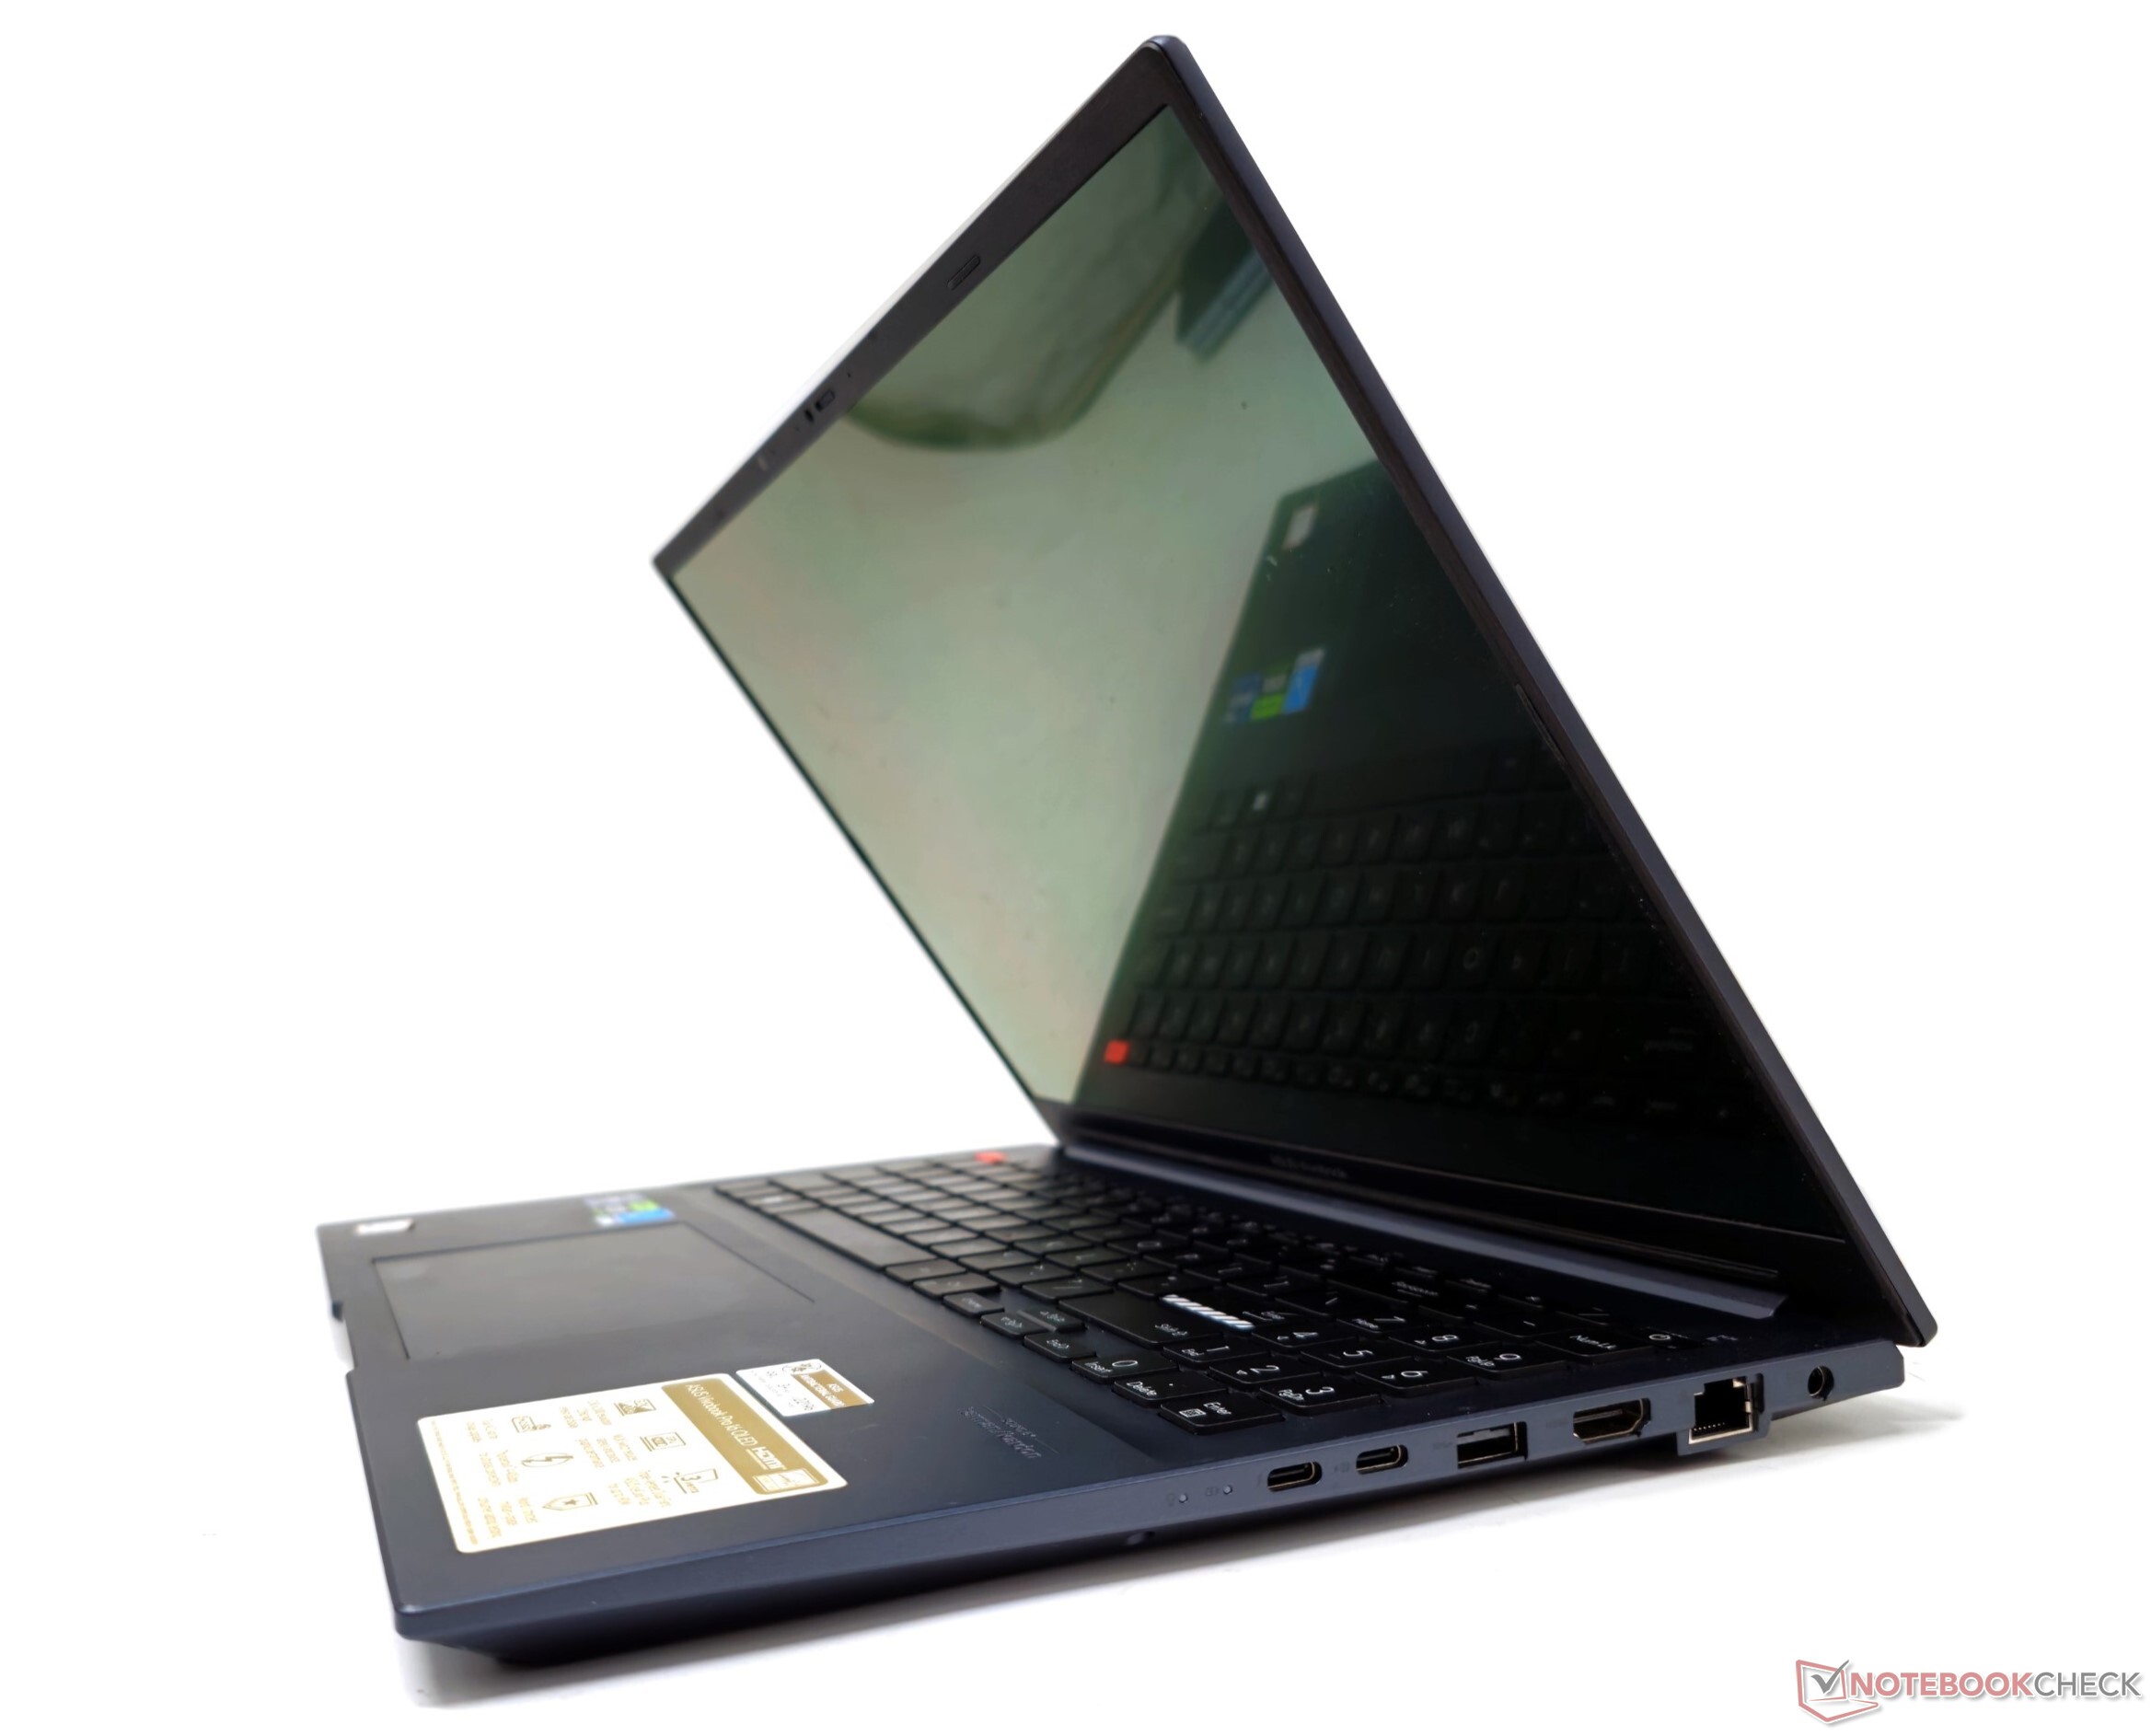
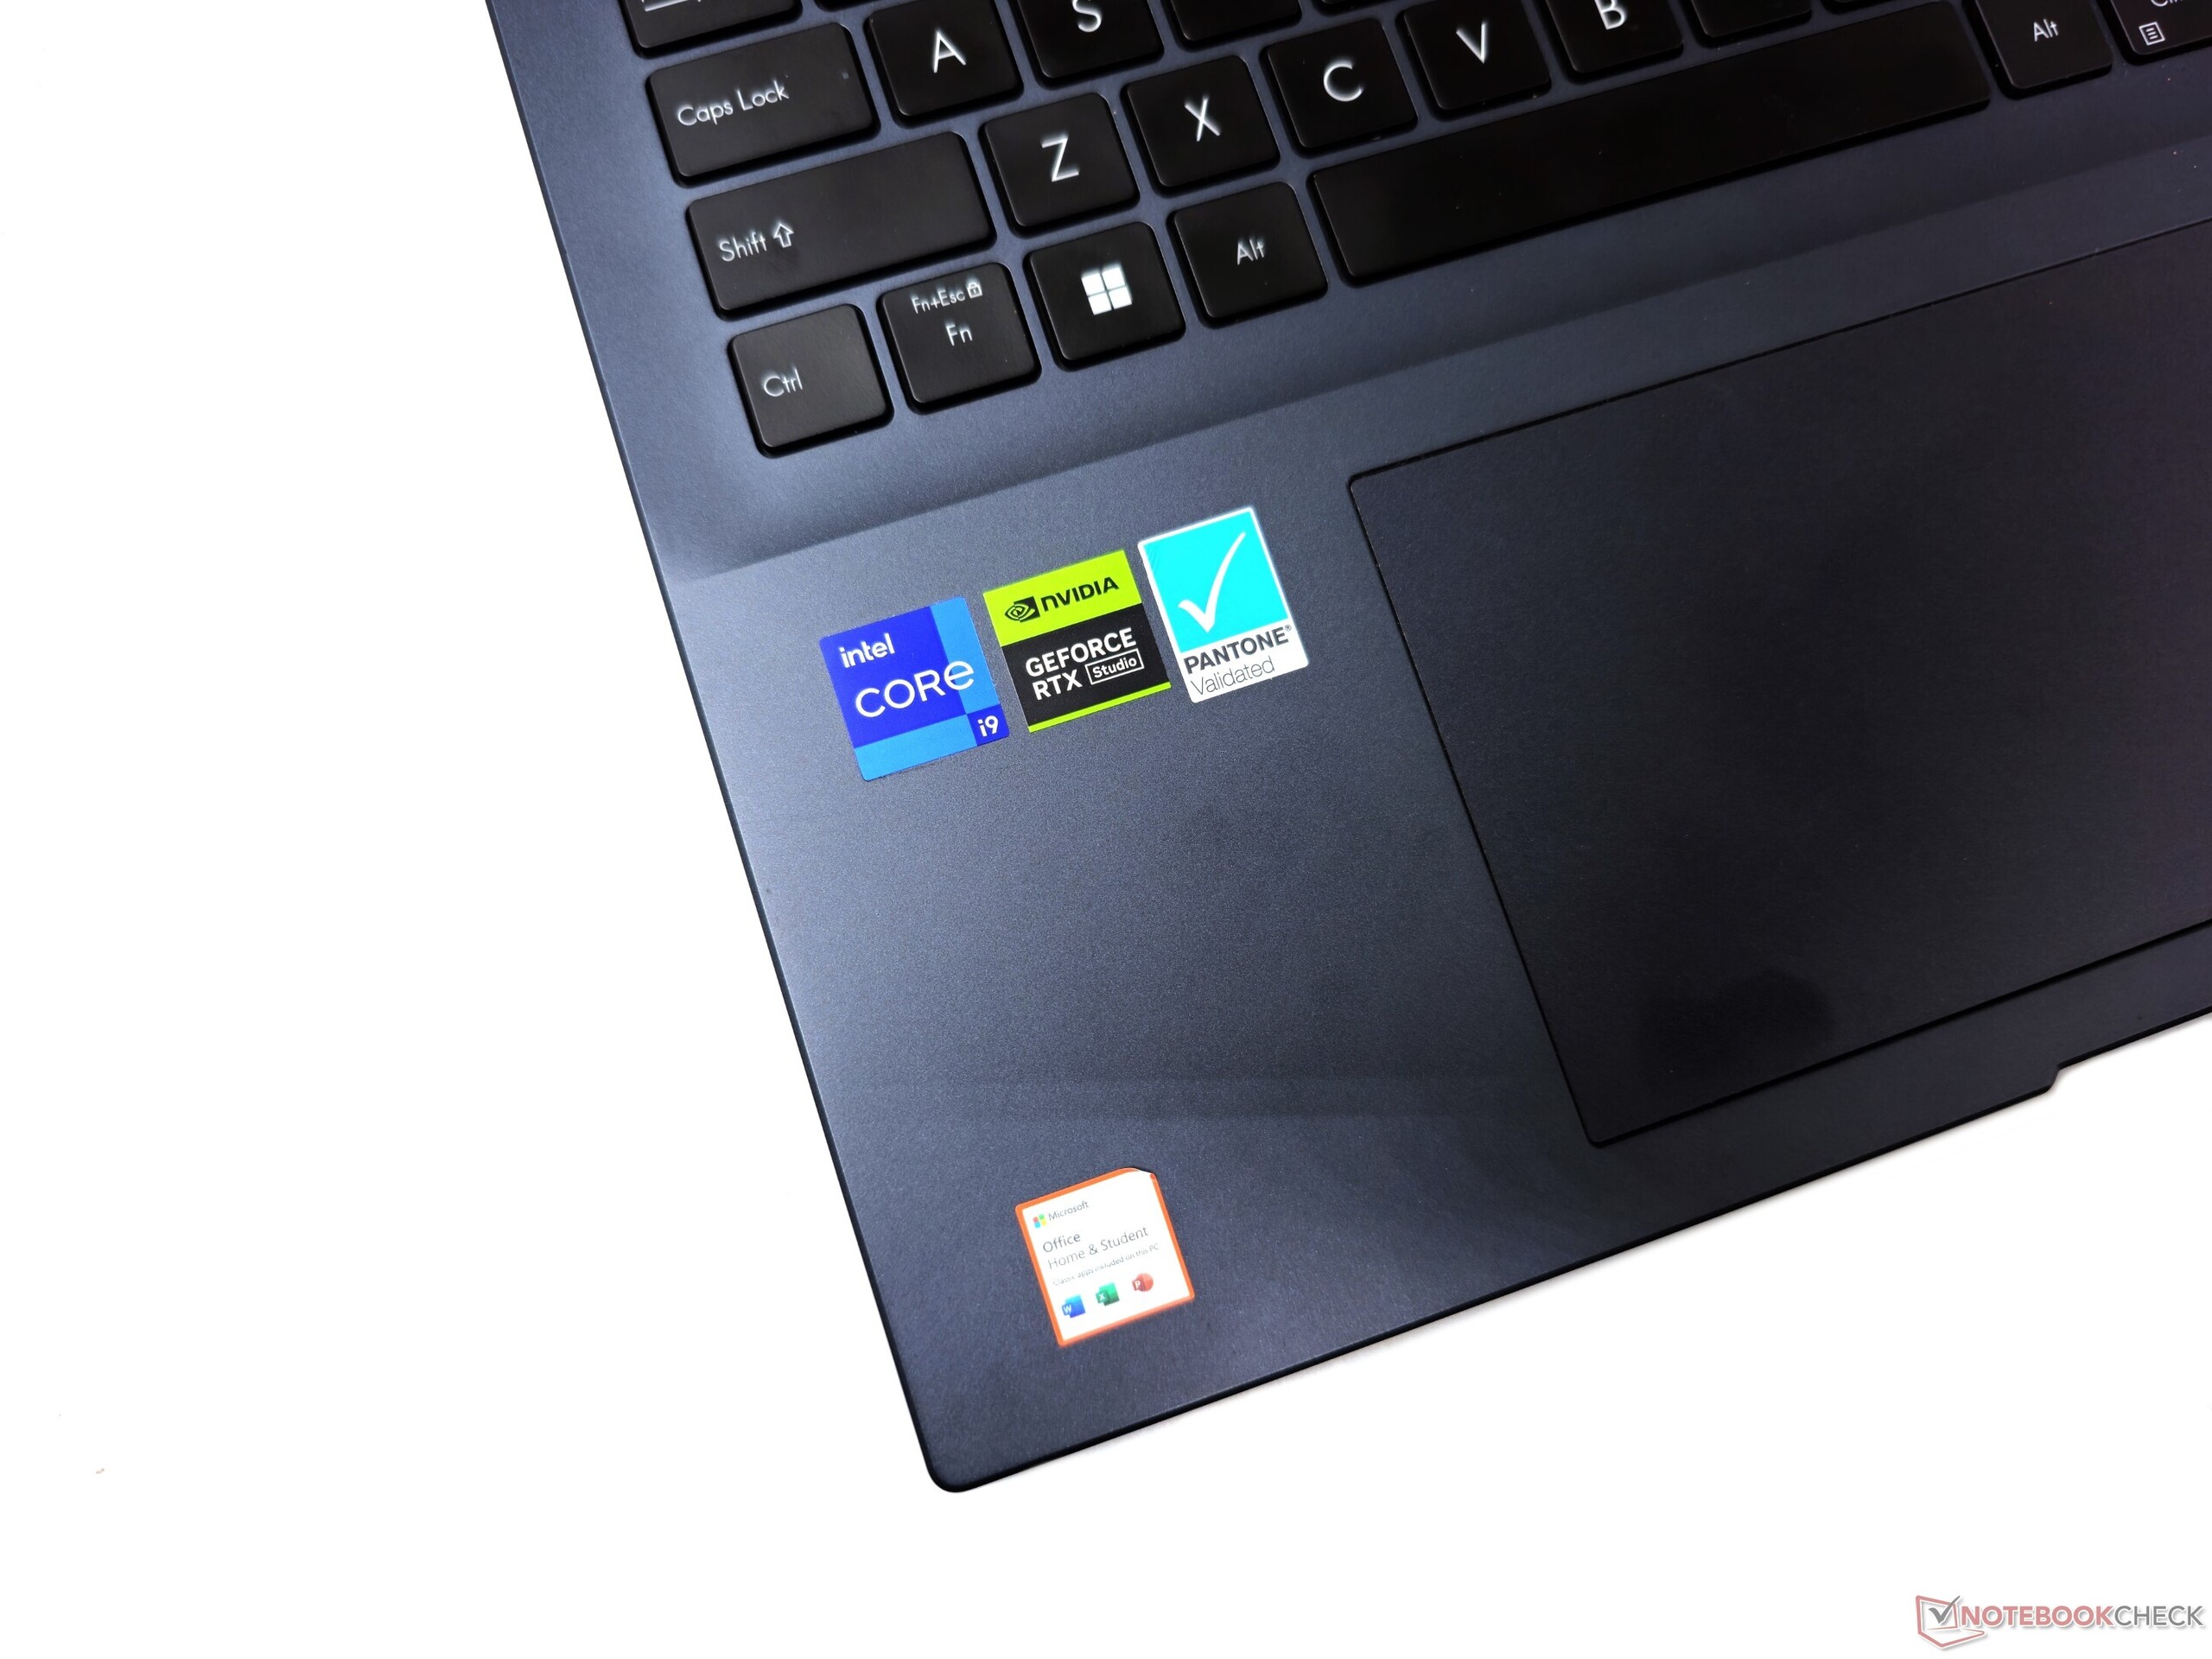
Chassi: Plastkonstruktion med 180° metalliskt lock
VivoBook Pro 16-chassit finns i färgalternativen Cool Silver och Quiet Blue (vår utvärderingsenhet) och väger 1,9 kg. Precis som med andra VivoBooks är konstruktionen huvudsakligen av plast med ett metallock som kan läggas helt platt i 180 grader och är lätt att öppna med en hand utan att skjuta den bärbara datorns bas.
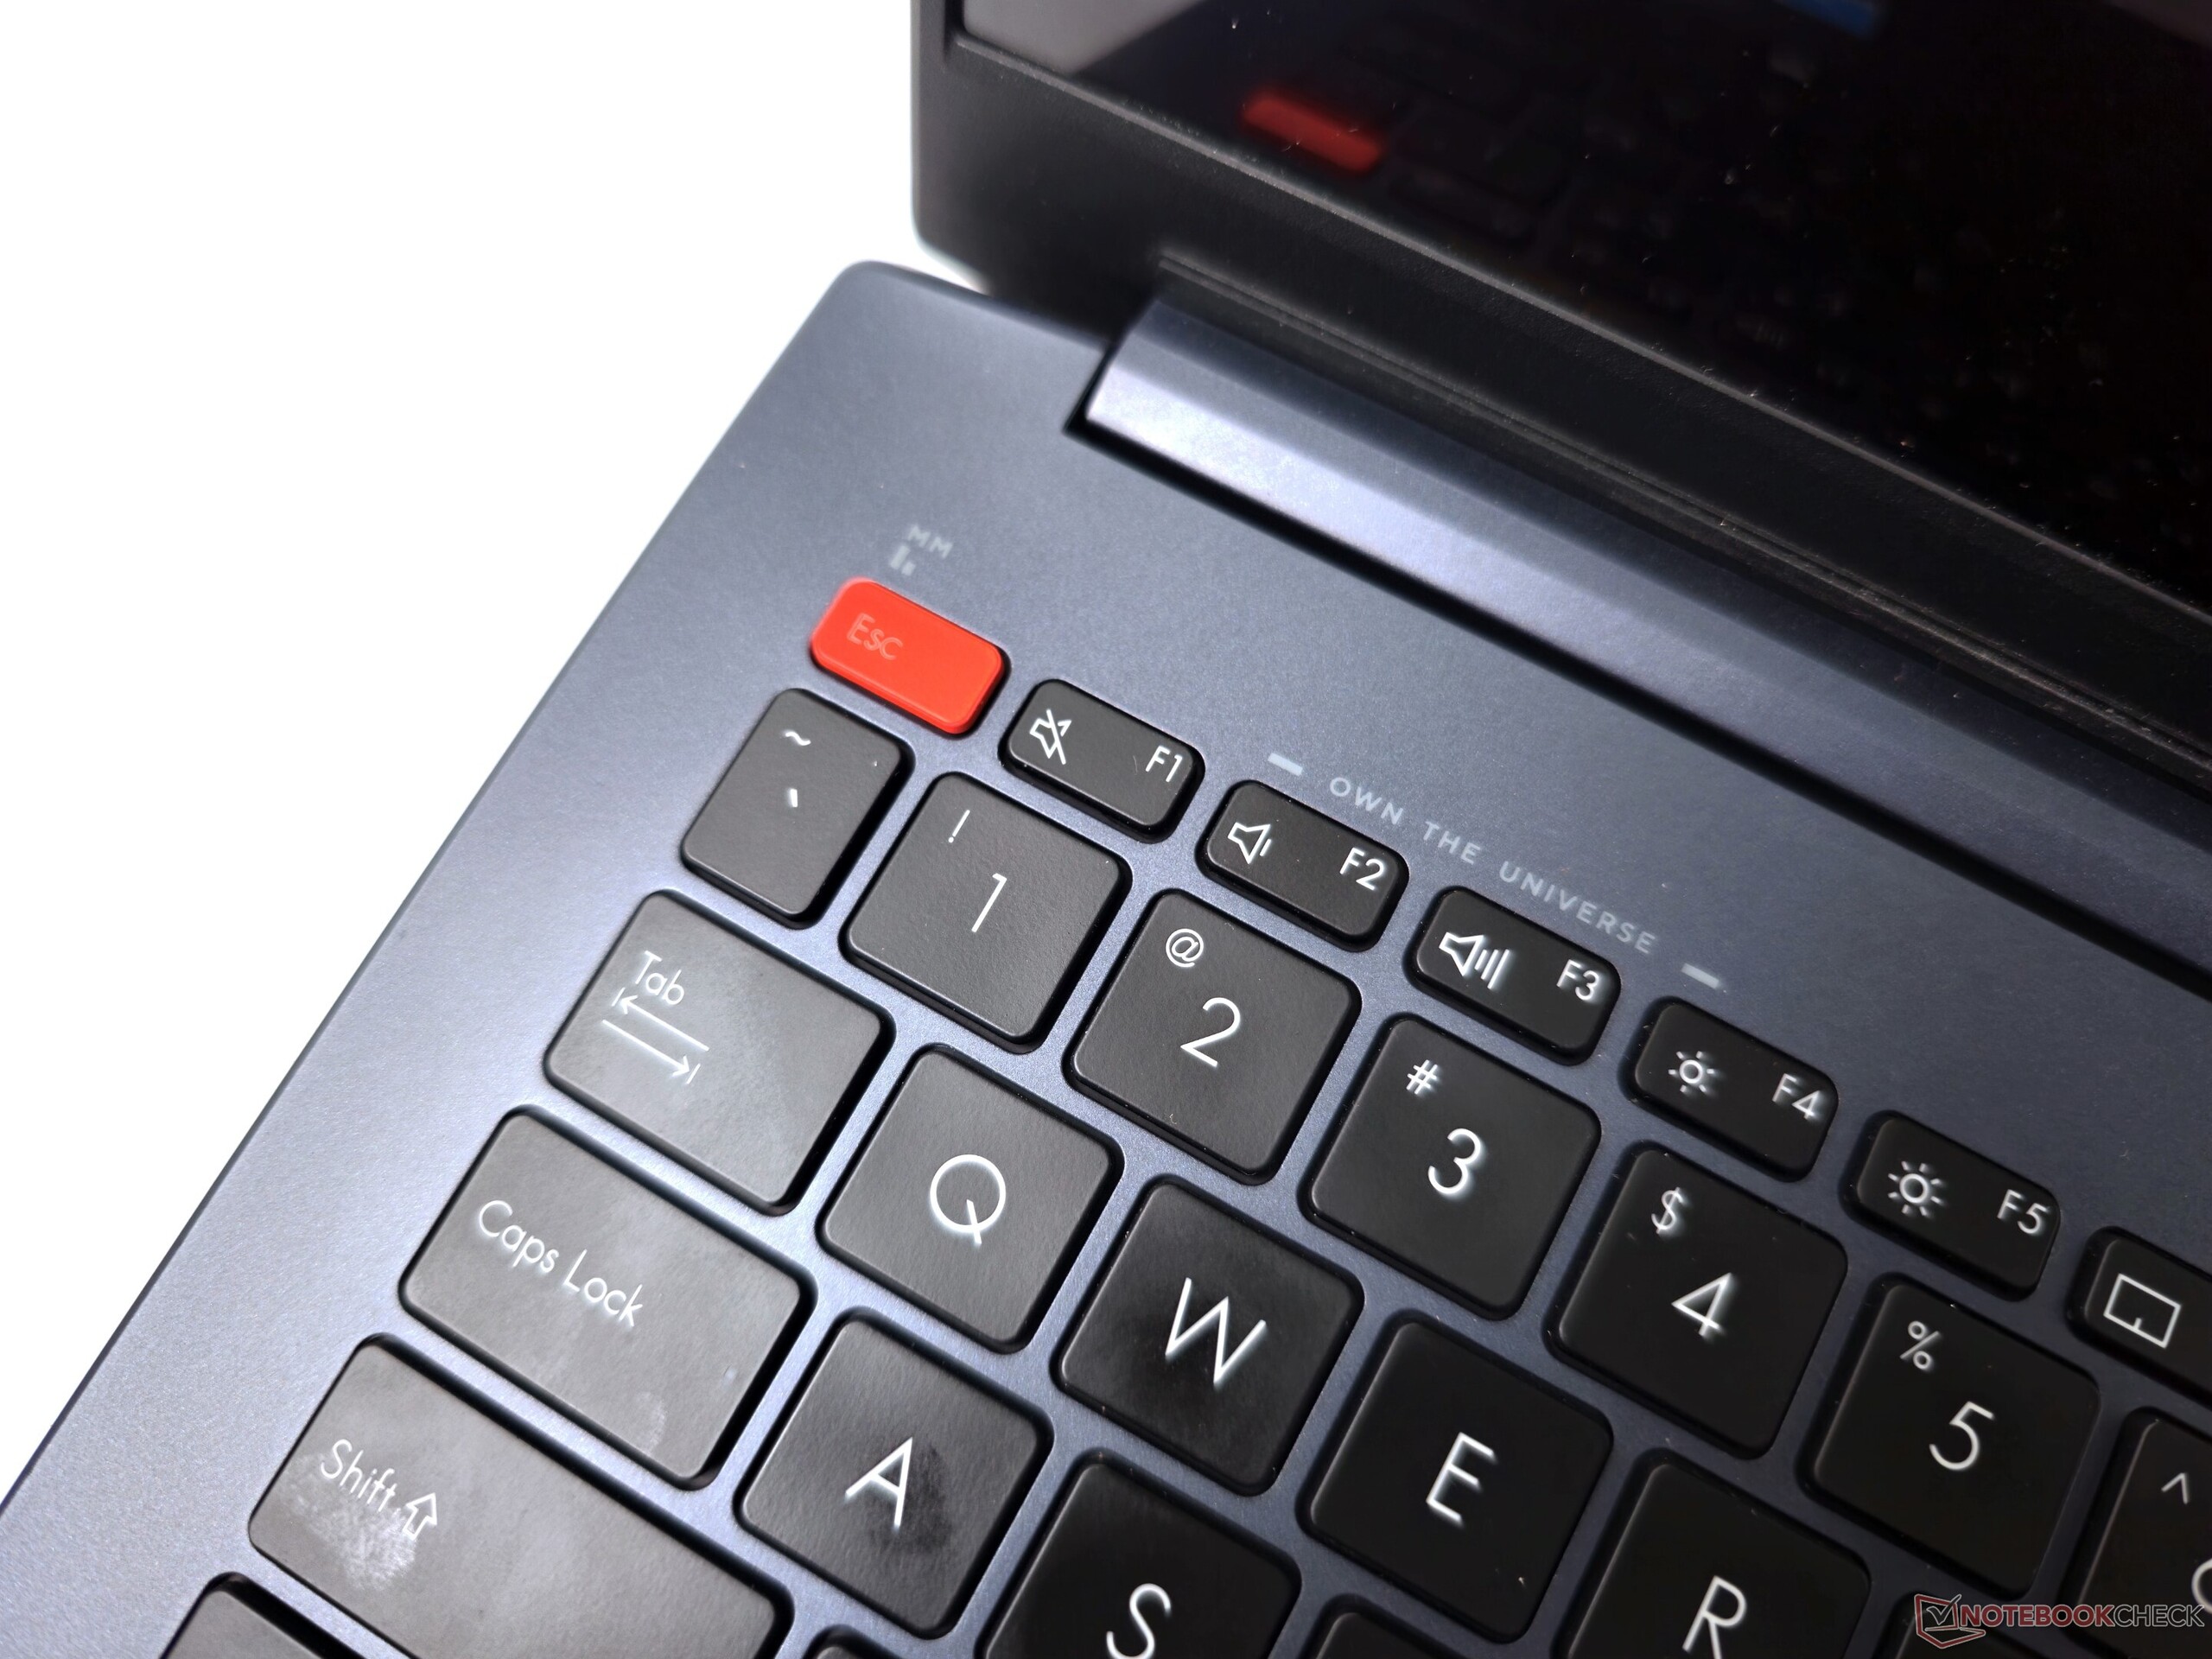
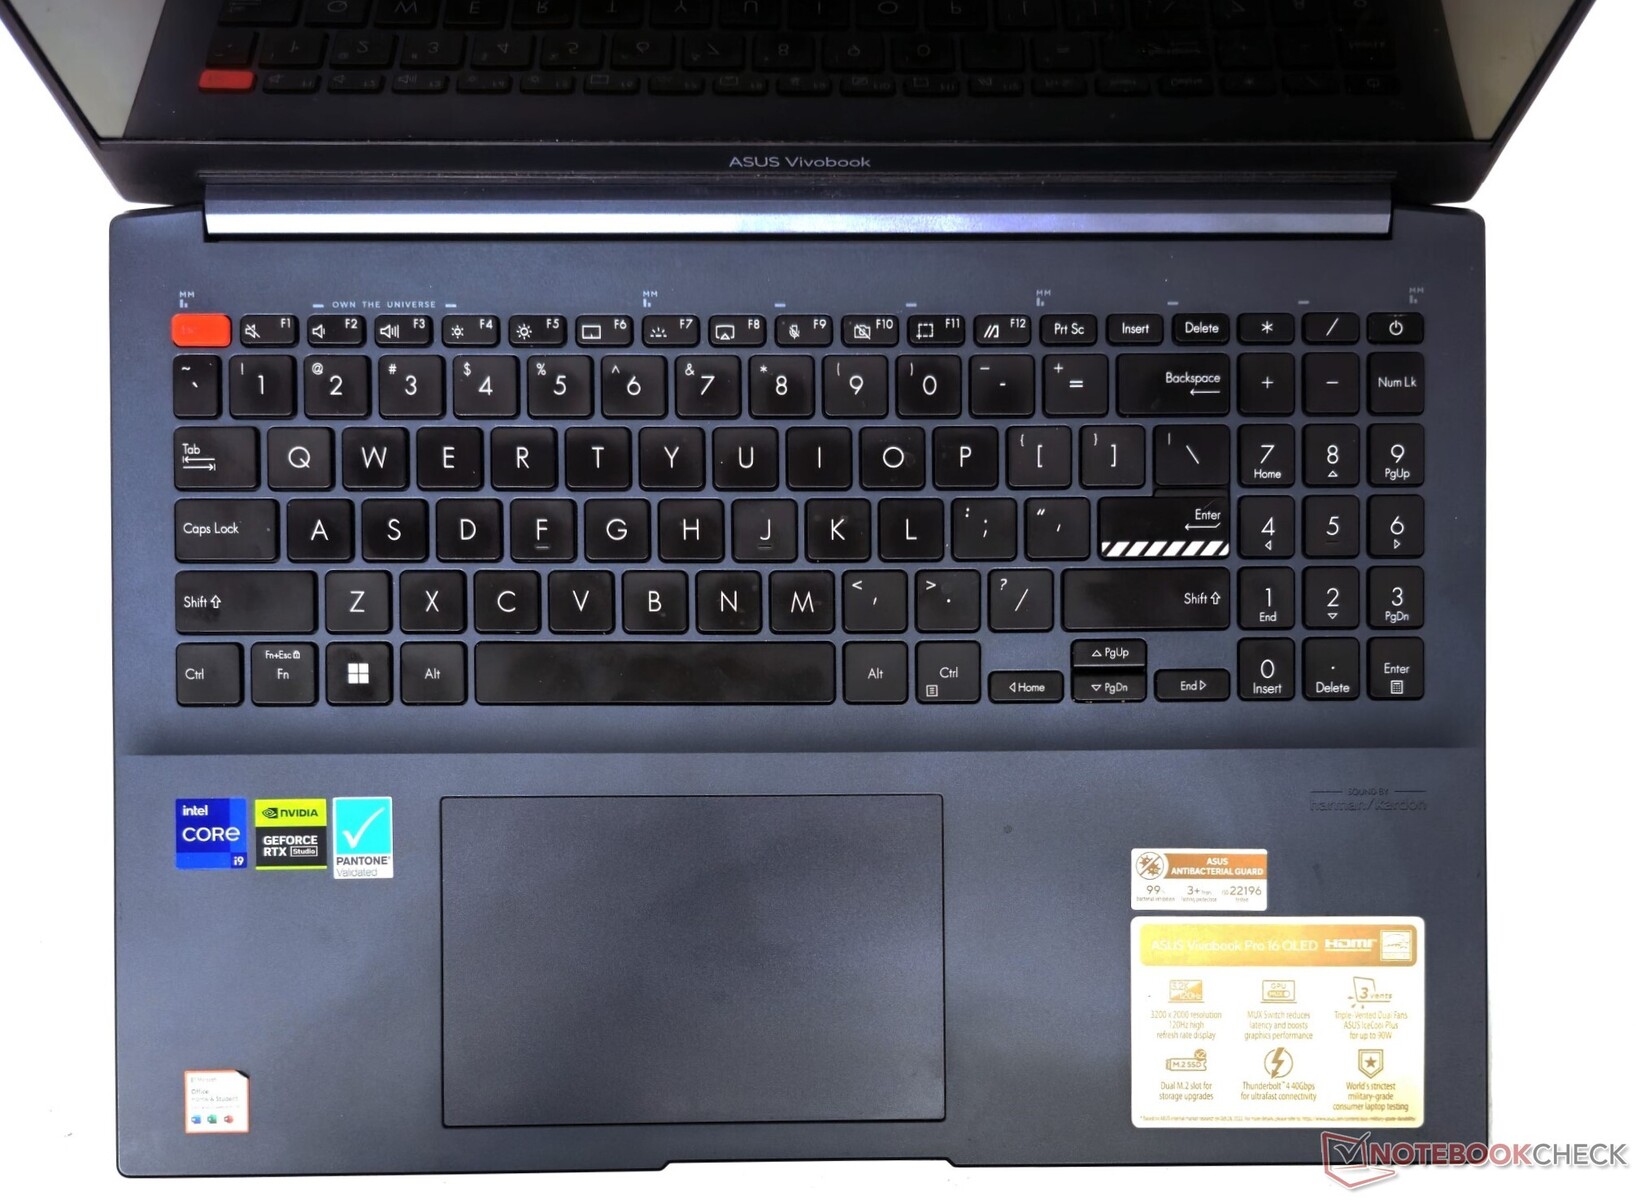
De matta, släta ytorna ger en subtil men ändå attraktiv estetik. VivoBook-designens kännetecken som logotypen på locket och den randiga Enter-tangenten är närvarande. En orangefärgad Esc-tangent ger en annan färgklick som liknar VivoBook Pro 16X.
Byggkvaliteten är överlag hyfsad med viss flexibilitet i tangentbordsdäcket och skärmen, men inget som påverkar vid regelbunden användning. Gångjärnen är robusta - tillräckligt för att hålla skärmen stadigt i alla vinklar utan att knaka.
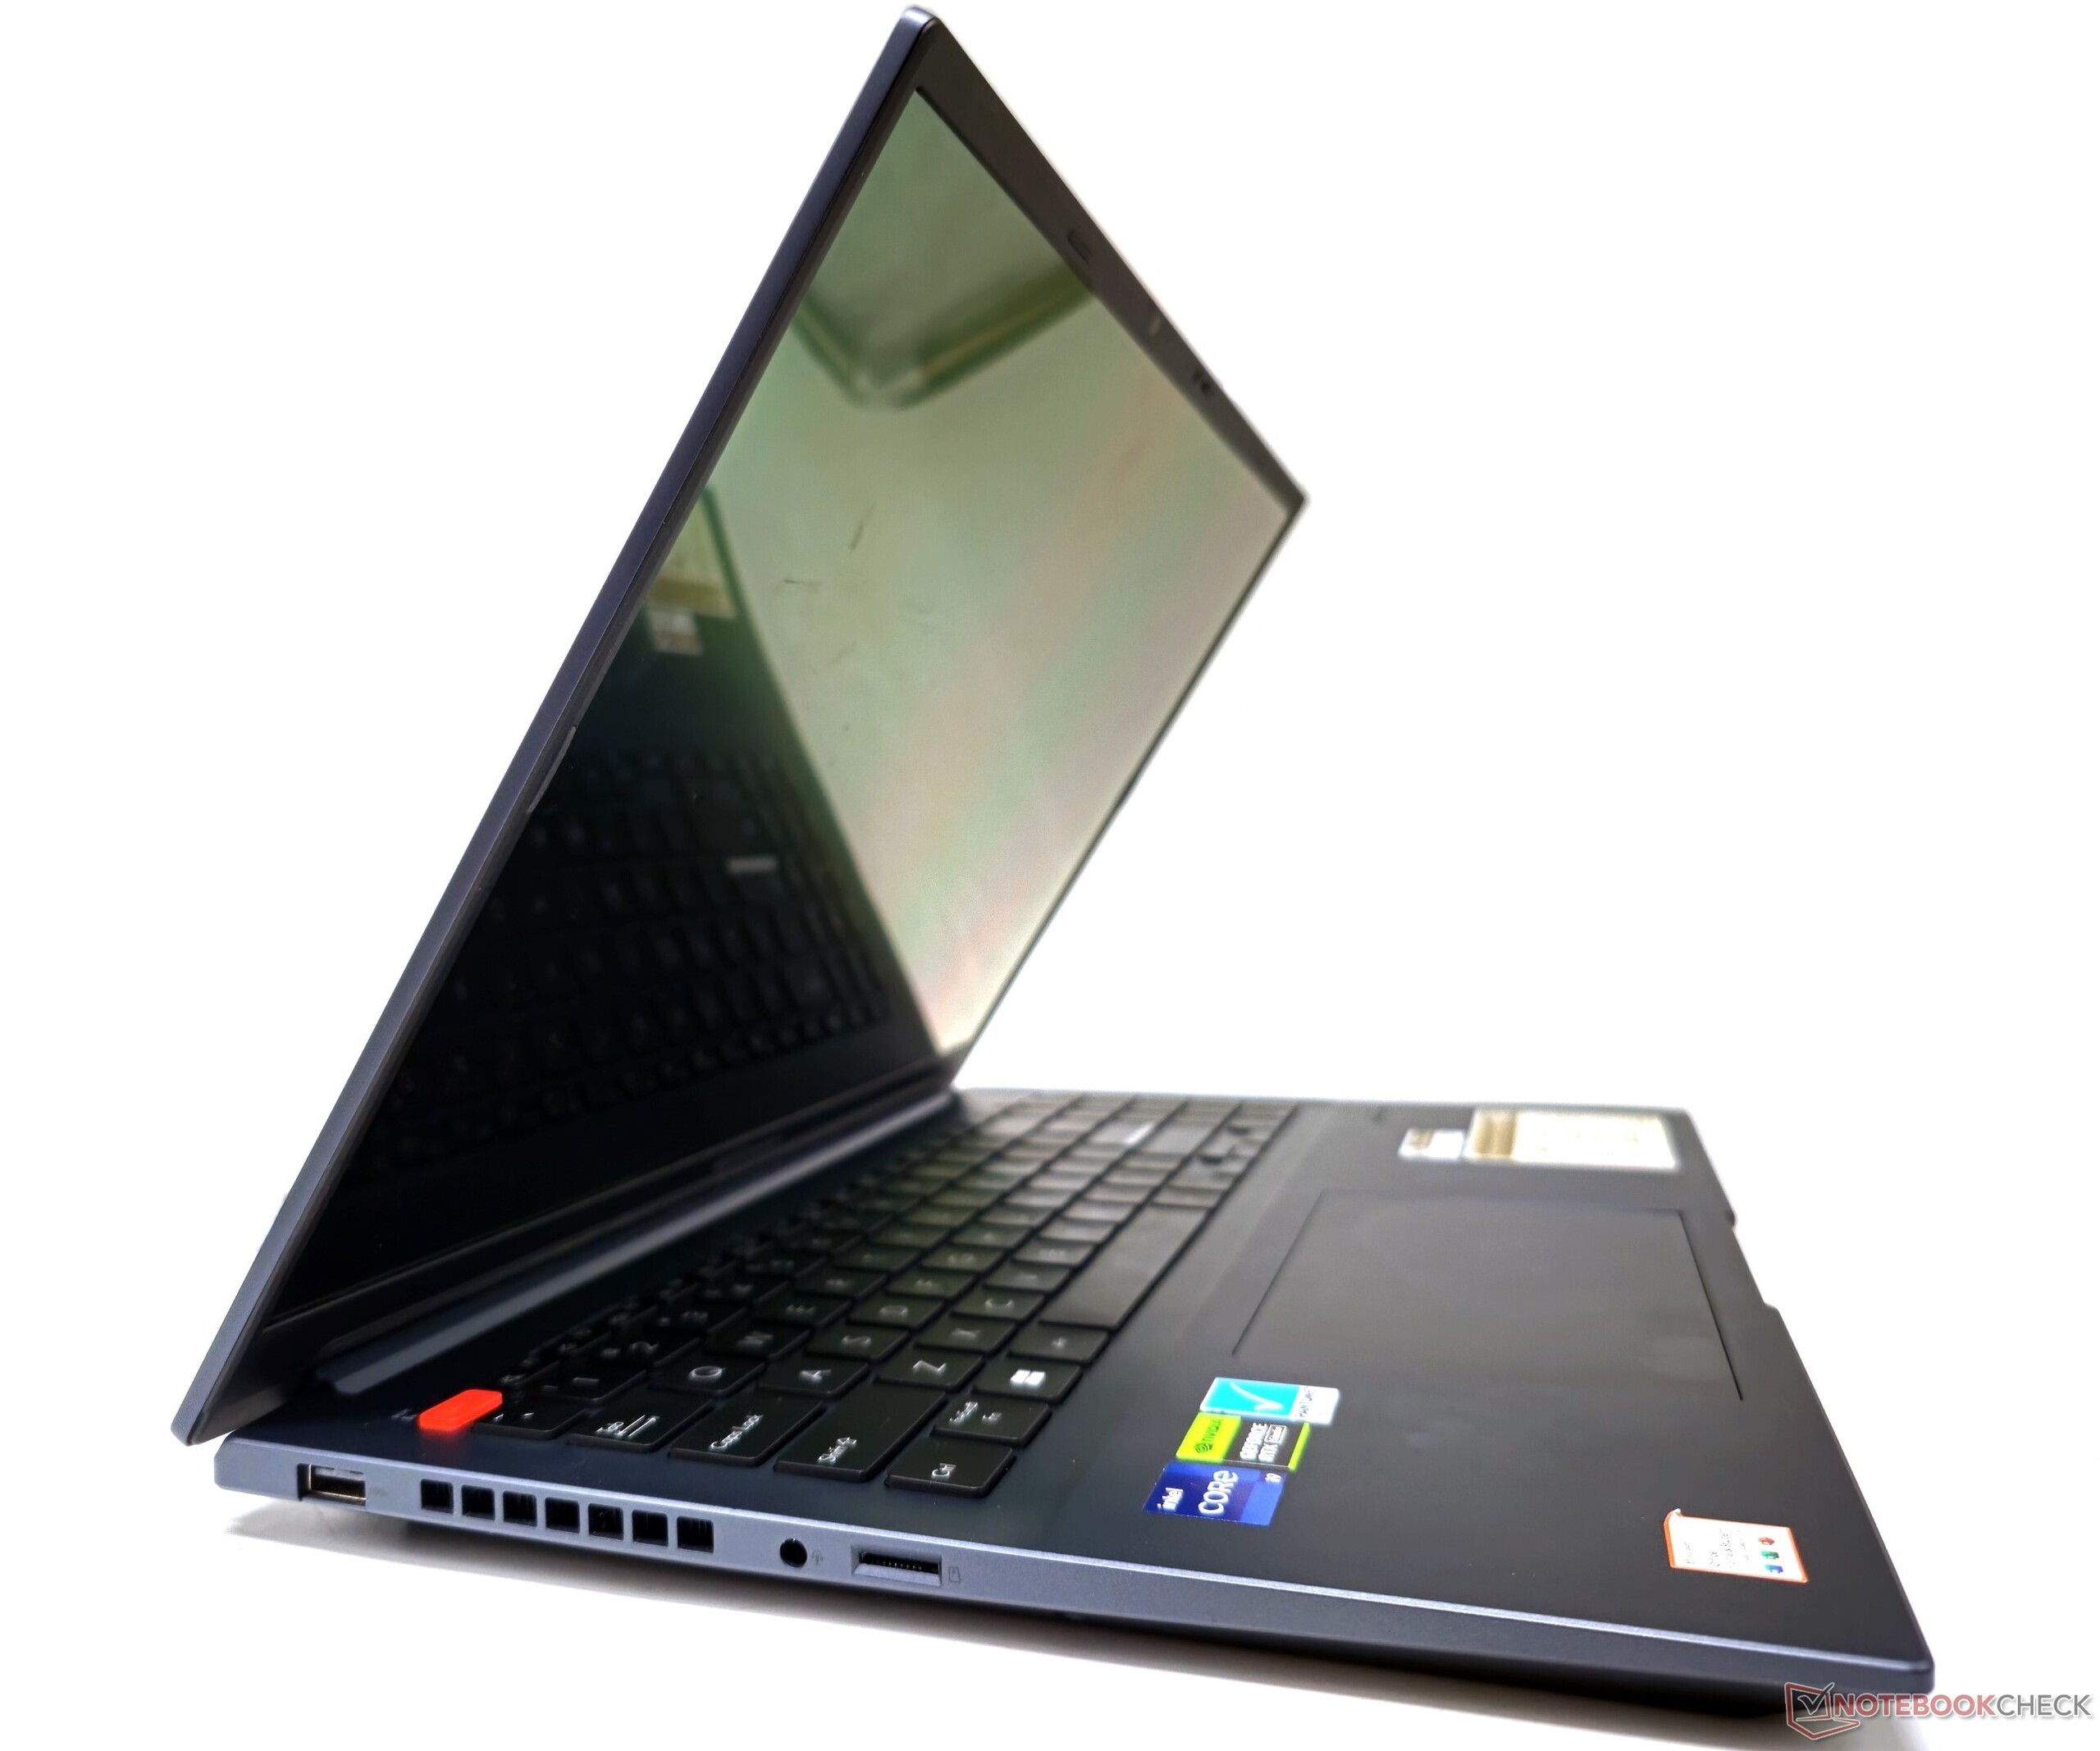
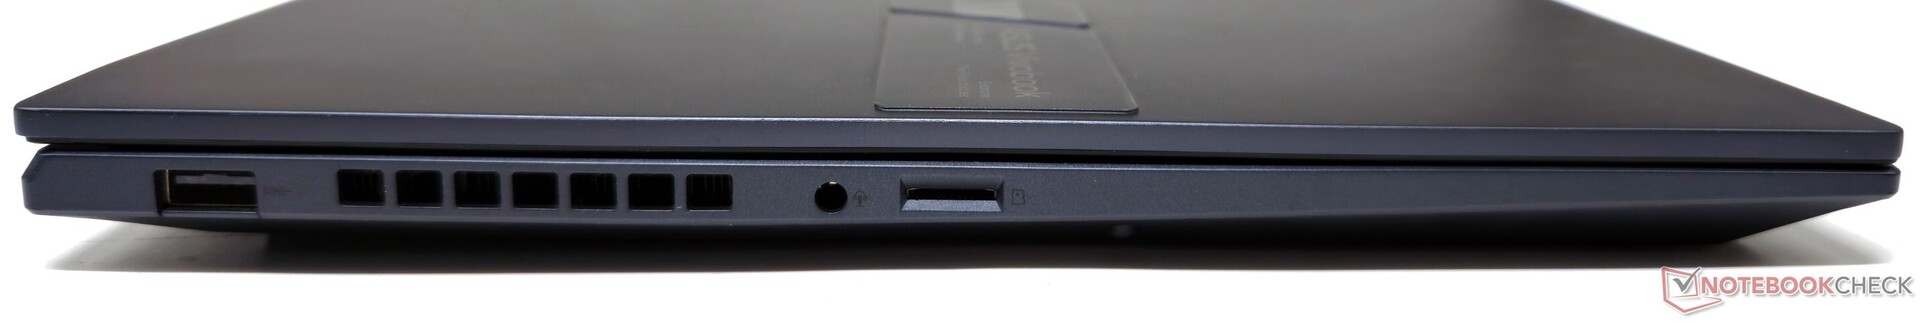
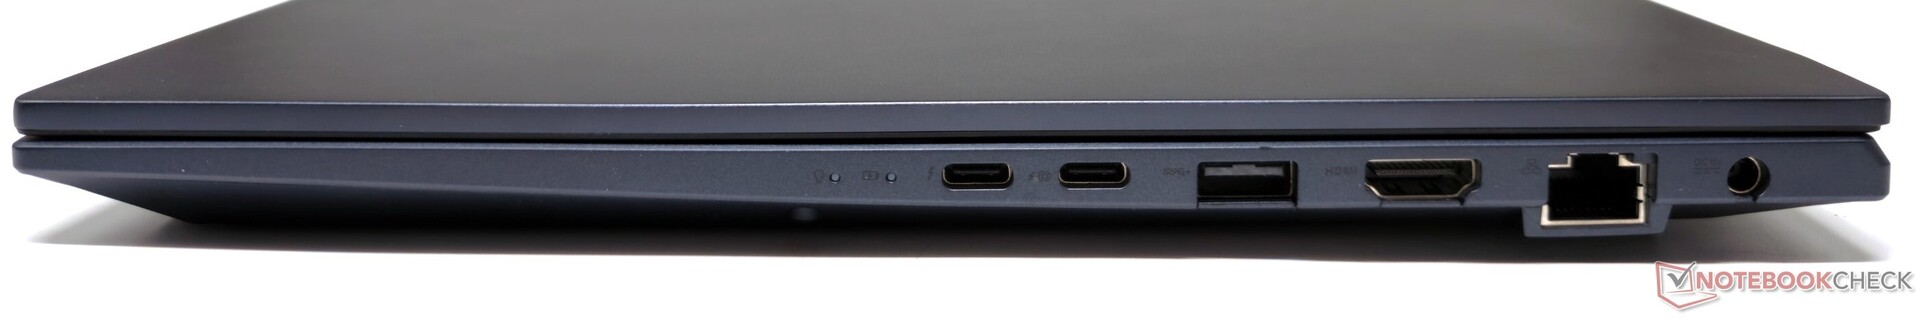
Anslutningsmöjligheter: Wi-Fi 6E genomströmning kan behöva lite finjustering
Asus har utrustat VivoBook Pro 16 med en anständig uppsättning portar, inklusive Thunderbolt 4. USB 3.2 Gen2 Type-C-porten har stöd för både DisplayPort-out och Power Delivery.
Precis som på andra VivoBooks som vi har sett i år är portarna fördelade på enhetens högra sida, vilket kan vara irriterande när man använder en trådbunden mus. Tack och lov kan alla portar användas samtidigt utan störningar.
SD-kortläsare
Enligt Asus stöder VivoBook Pro 16:s inbyggda microSD-kortläsare överföringshastigheter på upp till 312 MB/s. I våra tester med ett Angelbird AV Pro V60 microSD-kort registrerade vi sekventiella läshastigheter på upp till 232 MB/s i AS-SSD-riktmärket för sekventiell läsning. Kopiering av olika JPG-filer från kortet toppade på 163,5 MB/s.
Även om det är något under Asus angivna maximala hastighet, är kortläsarhastigheterna betydligt högre jämfört med den tidigare generationens modell.
| SD Card Reader | |
| average JPG Copy Test (av. of 3 runs) | |
| Gigabyte AERO 16 OLED BSF | |
| Asus VivoBook Pro 16 K6602VU (Angelbird AV Pro V60) | |
| Genomsnitt av klass Multimedia (23 - 531, n=44, senaste 2 åren) | |
| Asus Vivobook Pro 16X K6604JV-MX016W | |
| Asus ROG Flow X16 GV601V | |
| Asus VivoBook Pro 16 (AV Pro SD microSD 128 GB V60) | |
| maximum AS SSD Seq Read Test (1GB) | |
| Asus ROG Flow X16 GV601V | |
| Asus VivoBook Pro 16 K6602VU (Angelbird AV Pro V60) | |
| Genomsnitt av klass Multimedia (27.9 - 1455, n=43, senaste 2 åren) | |
| Gigabyte AERO 16 OLED BSF | |
| Asus Vivobook Pro 16X K6604JV-MX016W | |
| Asus VivoBook Pro 16 (AV Pro SD microSD 128 GB V60) | |
Kommunikation
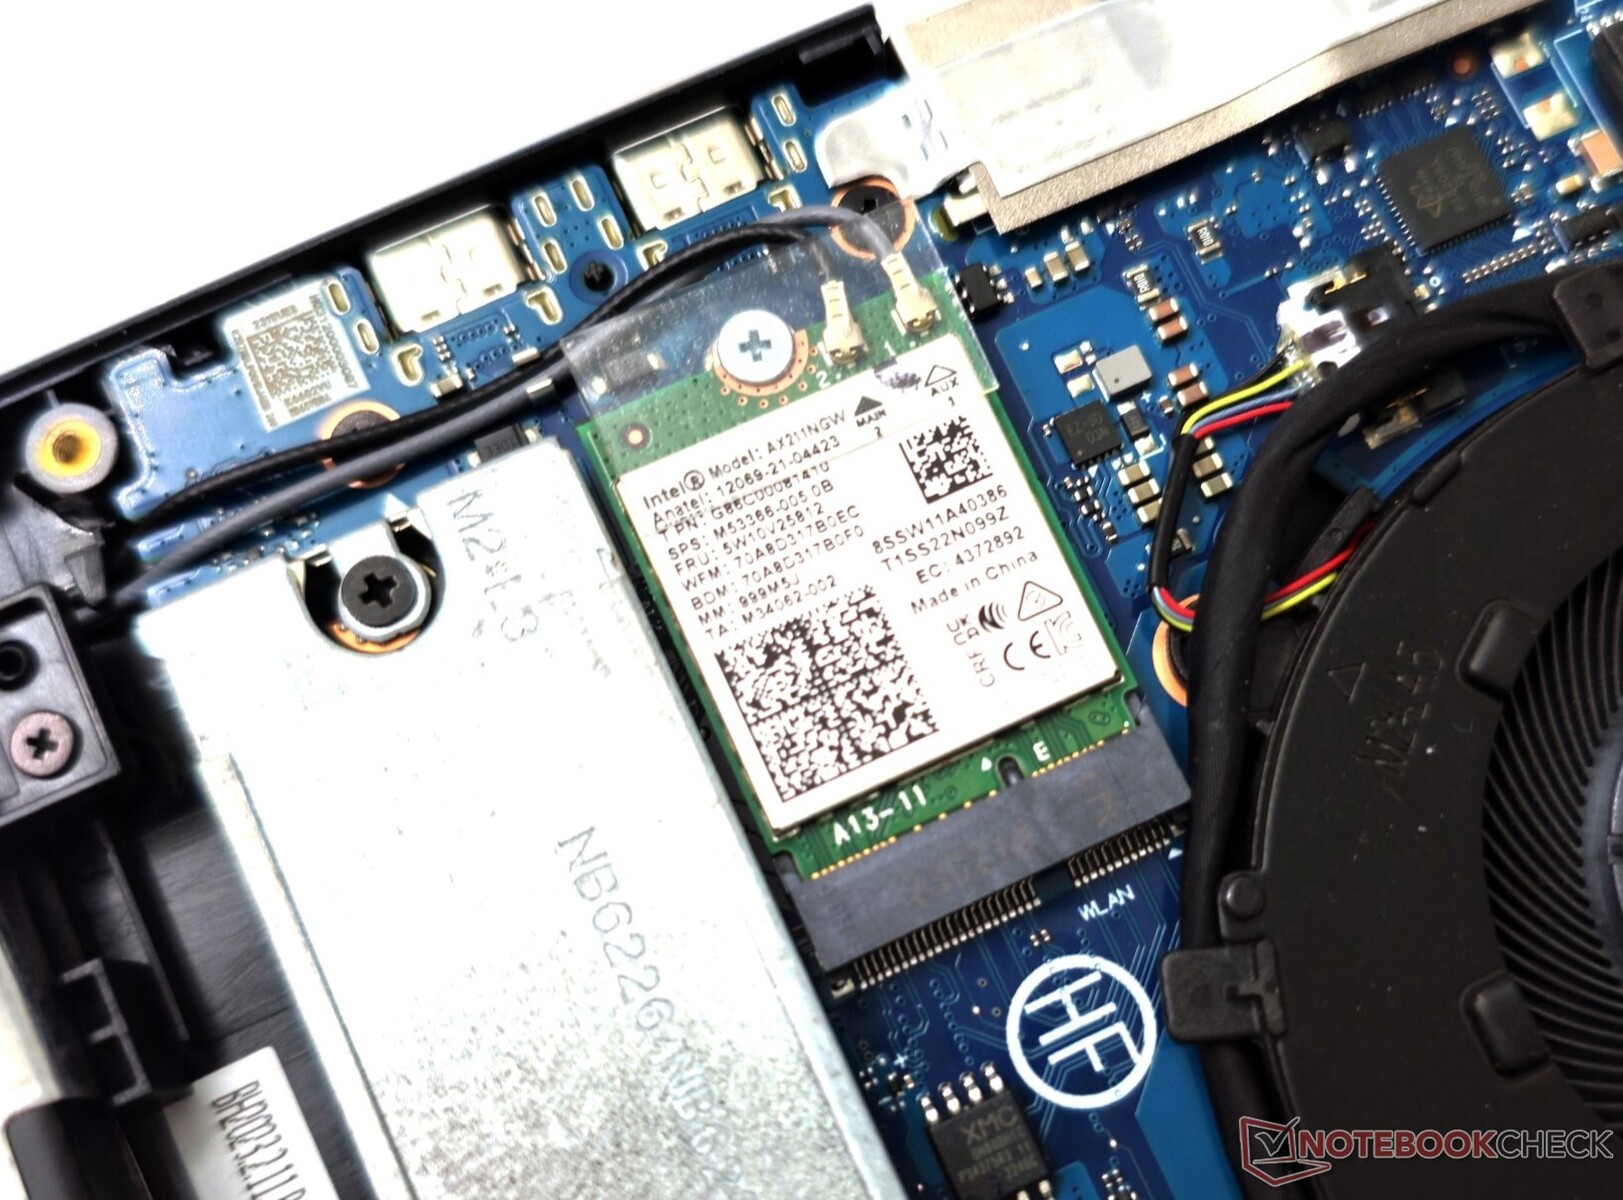
VivoBook Pro 16 är utrustad med ett Intel Wi-Fi 6E AX211 trådlöst kort. I testerna registrerade vi starka sändnings- och mottagningshastigheter över 5 GHz Wi-Fi.
Prestandan i 6 GHz-bandet var hyfsad, men inte riktigt lika snabb som 5 GHz, i vår installation med en Asus ROG Rapture GT-AXE11000 referensrouter.
I jämförelse medLenovo Legion Pro 5 en bra, relativt stabil 6 GHz-genomströmning med sitt MediaTek Wi-Fi 6E MT7922-kort.
| Networking / iperf3 transmit AXE11000 | |
| Lenovo Legion Pro 5 16ARX8 (R5 7645HX, RTX 4050) | |
| Asus VivoBook Pro 16 K6602VU | |
| Asus VivoBook Pro 16 | |
| Asus Vivobook Pro 16X K6604JV-MX016W | |
| Genomsnitt av klass Multimedia (606 - 1978, n=61, senaste 2 åren) | |
| Genomsnitt Intel Wi-Fi 6E AX211 (64 - 1921, n=276) | |
| Asus ROG Flow X16 GV601V | |
| Asus TUF Gaming A16 FA617XS | |
| Networking / iperf3 receive AXE11000 | |
| Asus Vivobook Pro 16X K6604JV-MX016W | |
| Asus VivoBook Pro 16 K6602VU | |
| Lenovo Legion Pro 5 16ARX8 (R5 7645HX, RTX 4050) | |
| Genomsnitt Intel Wi-Fi 6E AX211 (582 - 1890, n=276) | |
| Genomsnitt av klass Multimedia (682 - 1818, n=61, senaste 2 åren) | |
| Asus ROG Flow X16 GV601V | |
| Asus TUF Gaming A16 FA617XS | |
| Networking / iperf3 transmit AXE11000 6GHz | |
| Lenovo Legion Pro 5 16ARX8 (R5 7645HX, RTX 4050) | |
| Asus ROG Flow X16 GV601V | |
| Asus Vivobook Pro 16X K6604JV-MX016W | |
| Genomsnitt av klass Multimedia (869 - 2373, n=25, senaste 2 åren) | |
| Gigabyte AERO 16 OLED BSF | |
| Asus VivoBook Pro 16 K6602VU | |
| Genomsnitt Intel Wi-Fi 6E AX211 (385 - 1851, n=226) | |
| Networking / iperf3 receive AXE11000 6GHz | |
| Asus Vivobook Pro 16X K6604JV-MX016W | |
| Asus VivoBook Pro 16 | |
| Lenovo Legion Pro 5 16ARX8 (R5 7645HX, RTX 4050) | |
| Genomsnitt av klass Multimedia (1212 - 2361, n=25, senaste 2 åren) | |
| Asus ROG Flow X16 GV601V | |
| Asus VivoBook Pro 16 K6602VU | |
| Gigabyte AERO 16 OLED BSF | |
| Genomsnitt Intel Wi-Fi 6E AX211 (700 - 1857, n=226) | |
Webbkamera
1080p-webbkameran med en fysisk sekretesslucka visar stora färgavvikelser, men den övergripande bildkvaliteten är användbar för grundläggande videosamtal och konferenser. Detaljerna är ganska välbevarade, men klarheten och skärpan kan behöva en hel del förbättringar.


Säkerhet
VivoBook Pro 16 har en fingeravtrycksläsare i strömknappen för Windows Hello-baserade inloggningar. Fingeravtrycksläsaren fungerar snabbt och är ganska responsiv. En TPM 2.0-modul är tillgänglig för att uppfylla kraven i Windows 11.
Tillbehör och garanti
Vår enhet hade inga ytterligare tillbehör i förpackningen förutom 150 W-strömadaptern och det vanliga pappersarbetet.
I Indien erbjuder Asus en standardgaranti på ett år för VivoBook Pro 16. Dessutom kan köpare välja mellan flera alternativ för garanti och skydd mot oavsiktlig skada från 999 kr till 2 999 kr, förutsatt att de registrerar sitt köp inom 15 kalenderdagar.
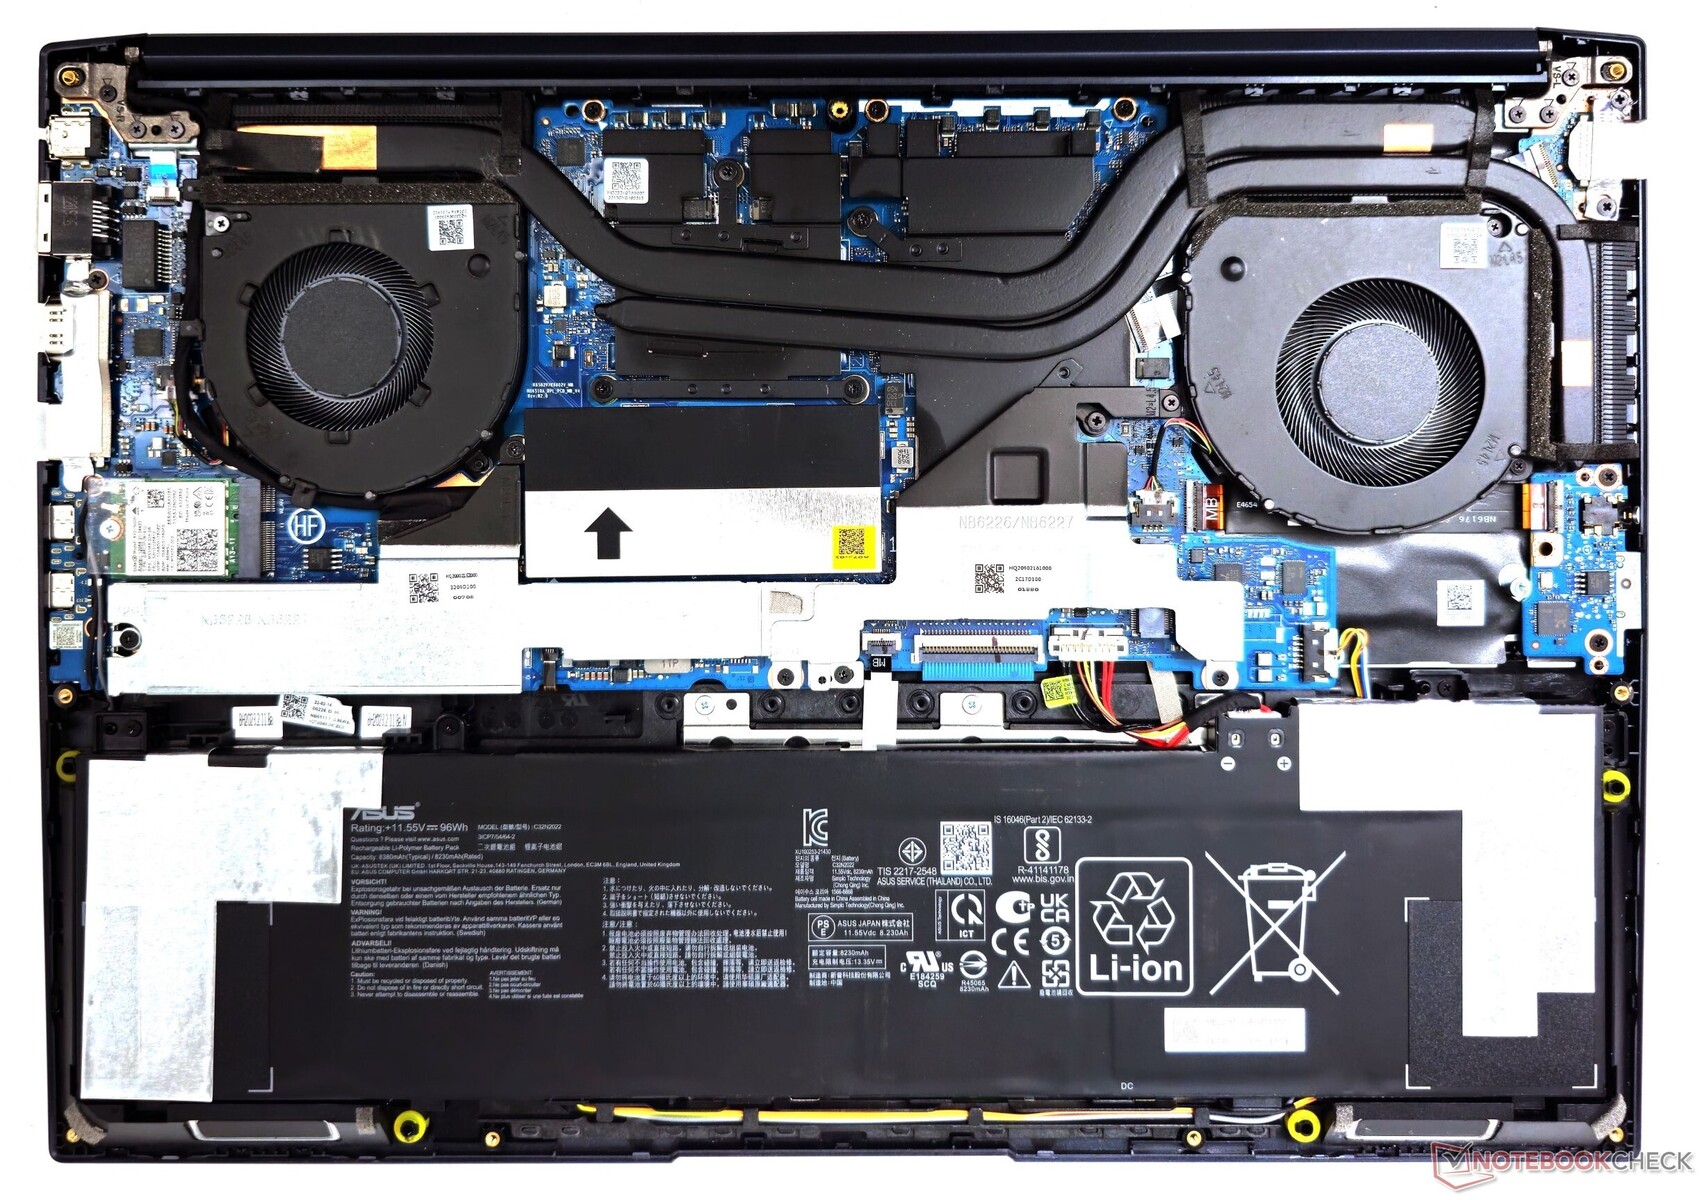
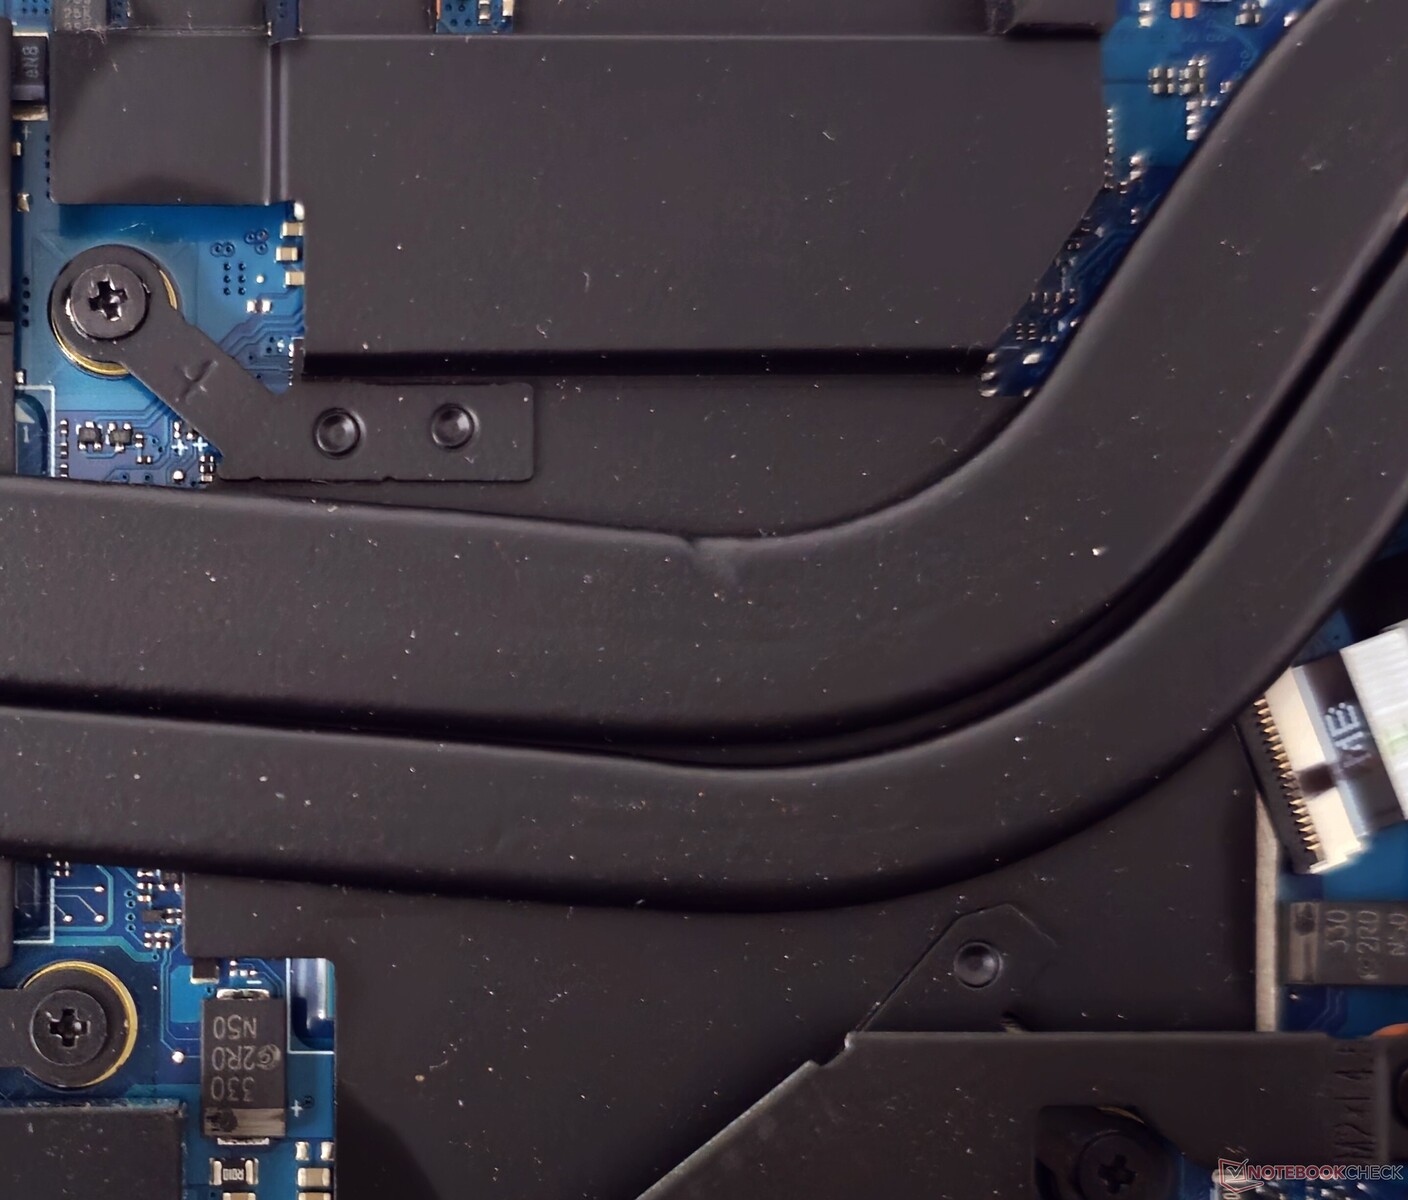
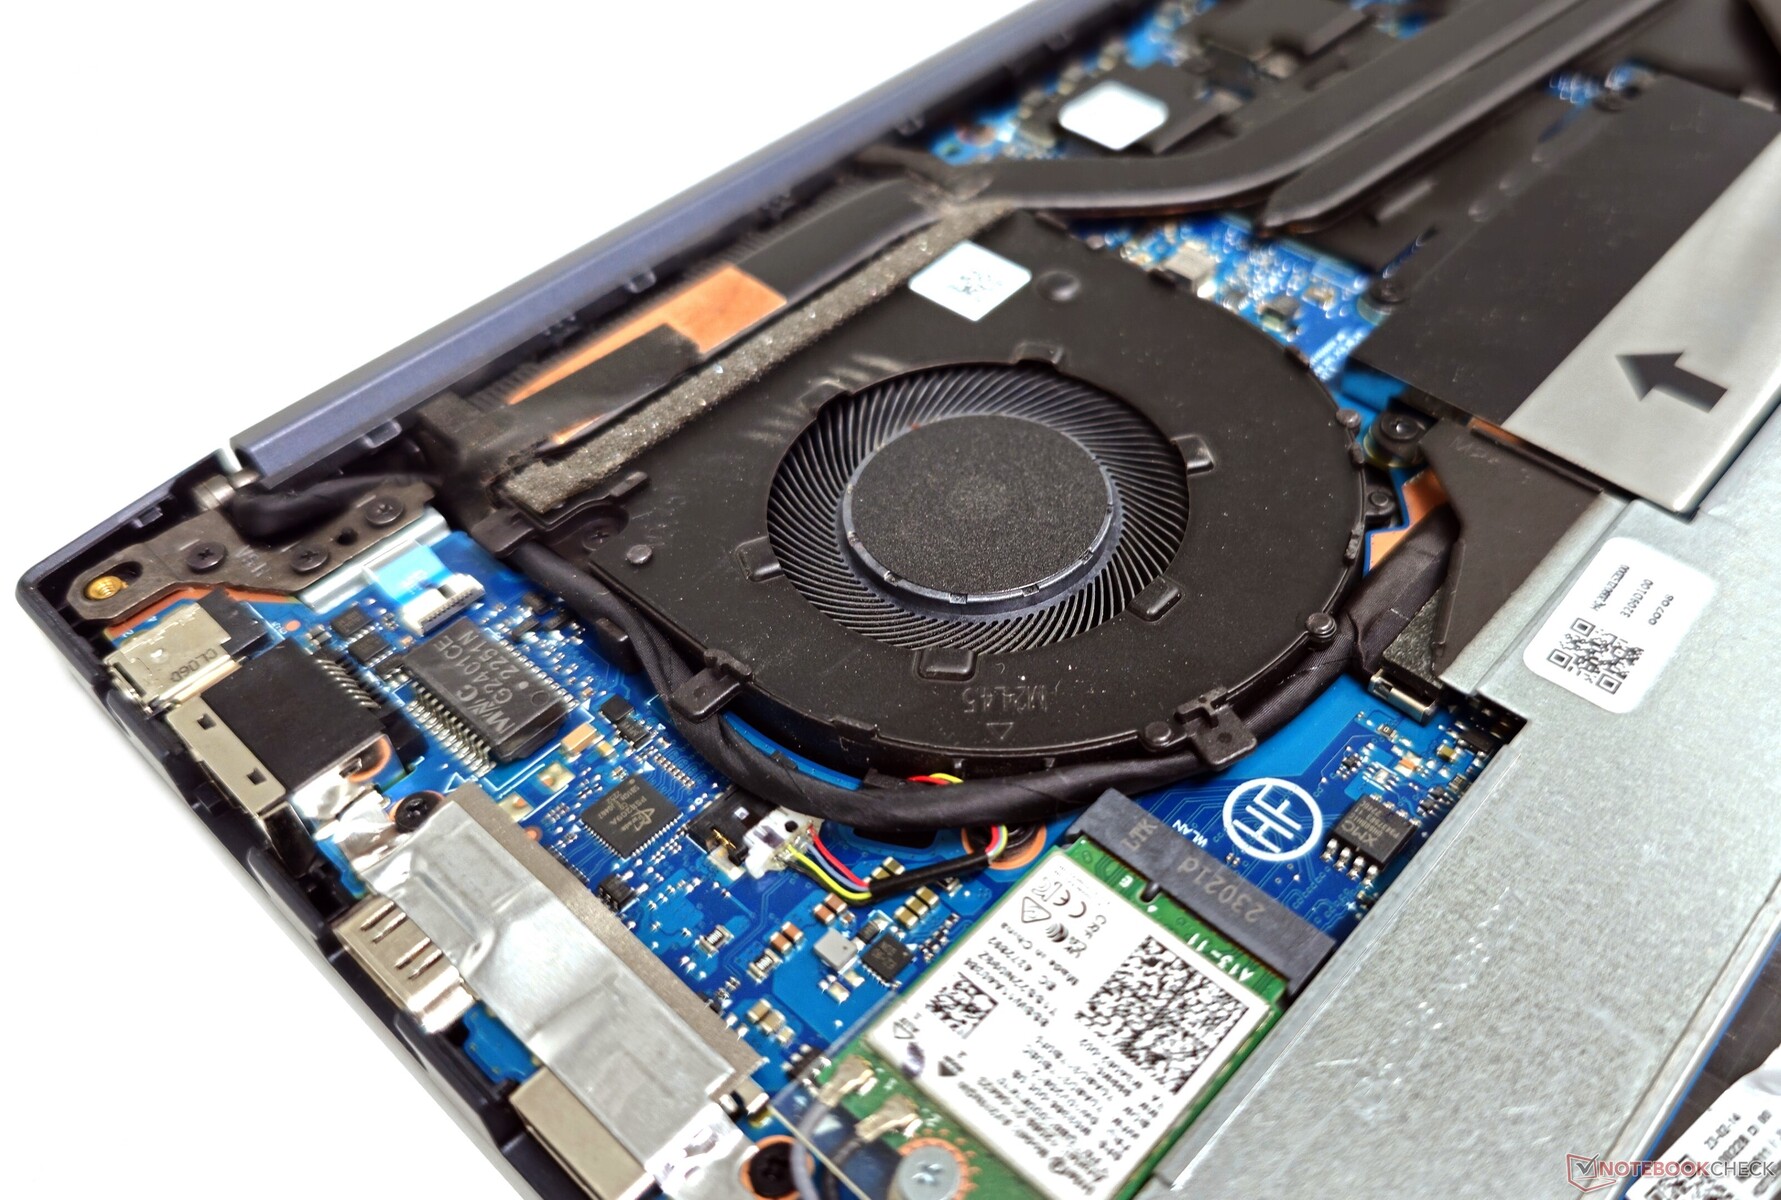
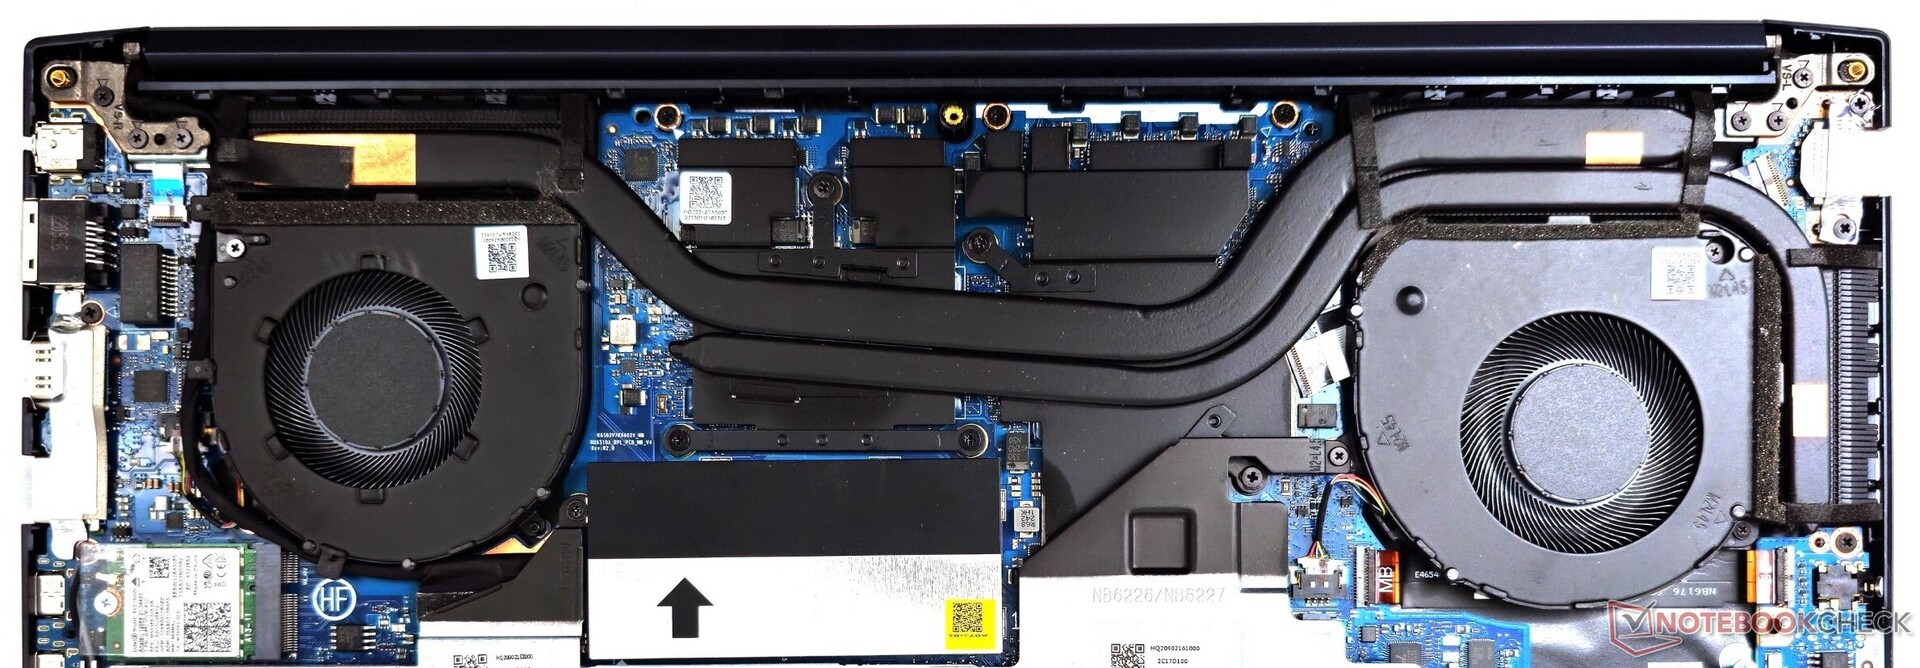
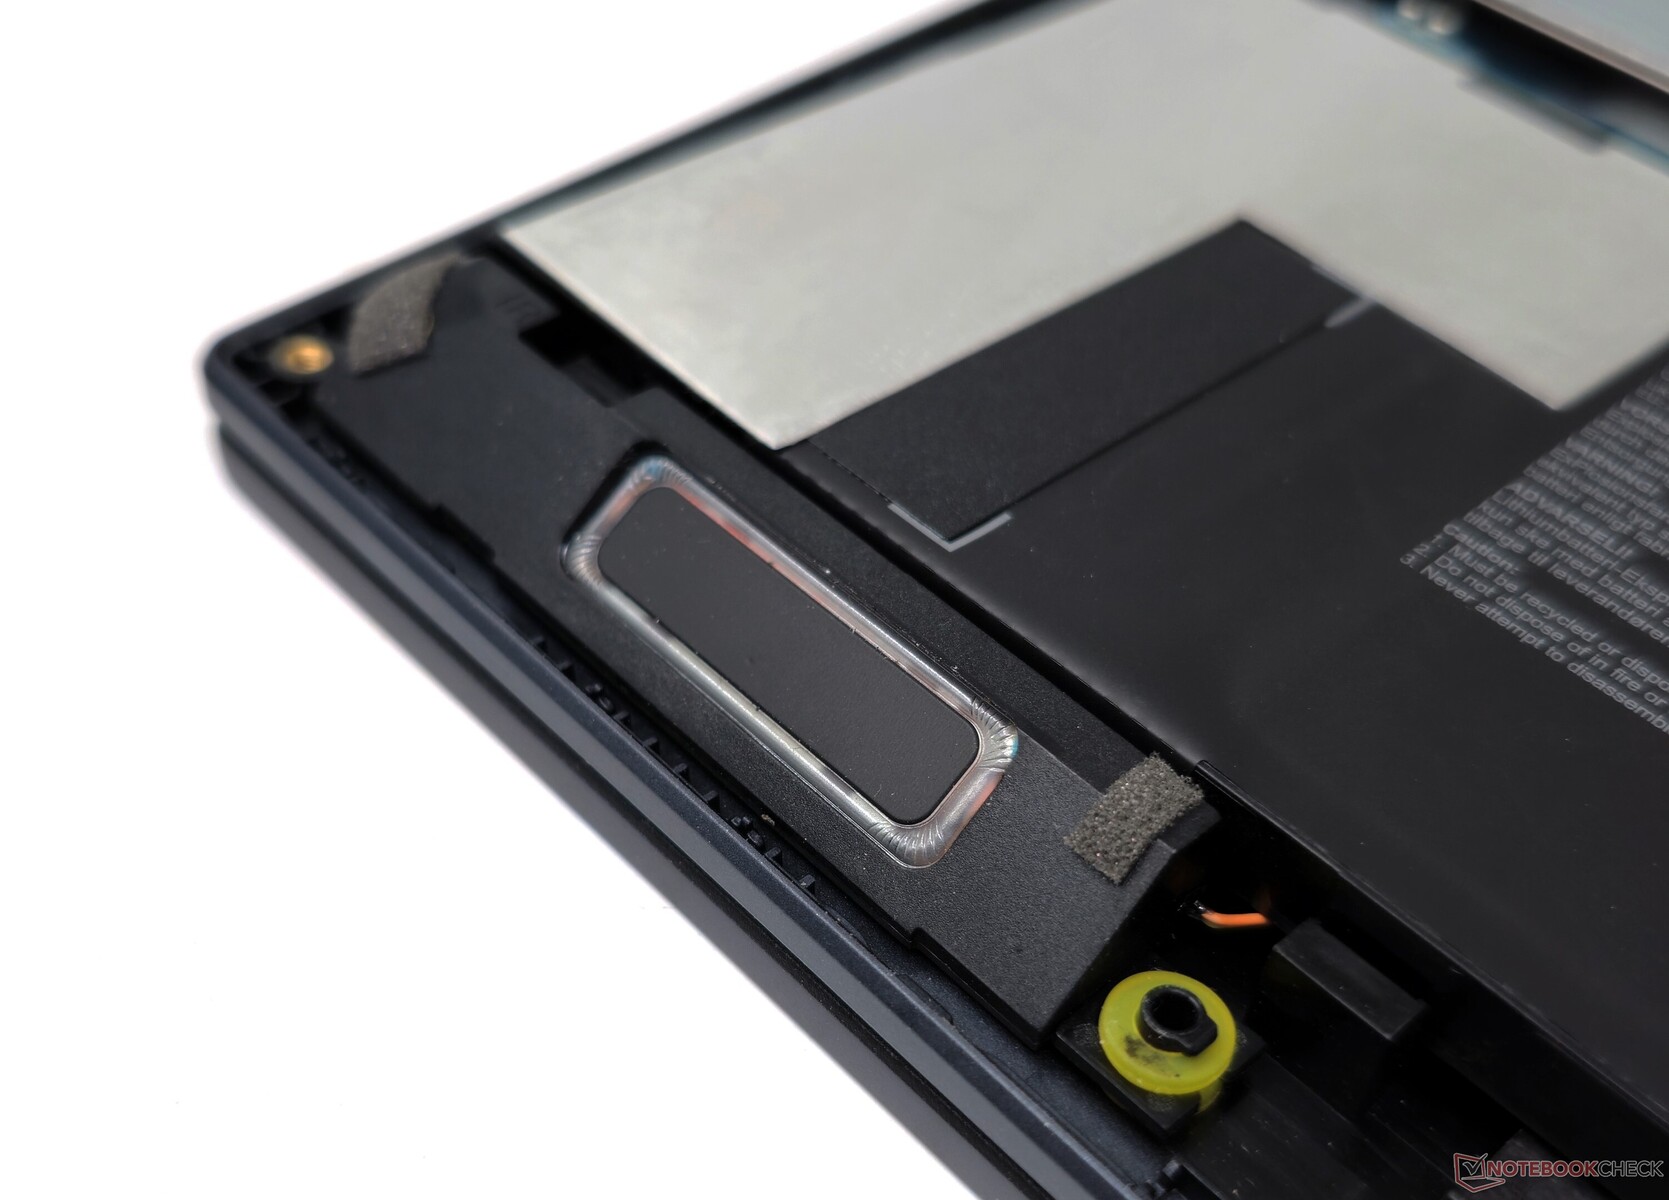
Underhåll
För att komma in i VivoBook Pro 16 krävs att nio Torx-skruvar tas bort för att lossa bottenpanelen. På insidan finns nyckelkomponenter som RAM-minne, NVMe SSD och Wi-Fi-kort som kan uppgraderas. Batteriet kan också bytas ut vid behov genom att skruva loss det.
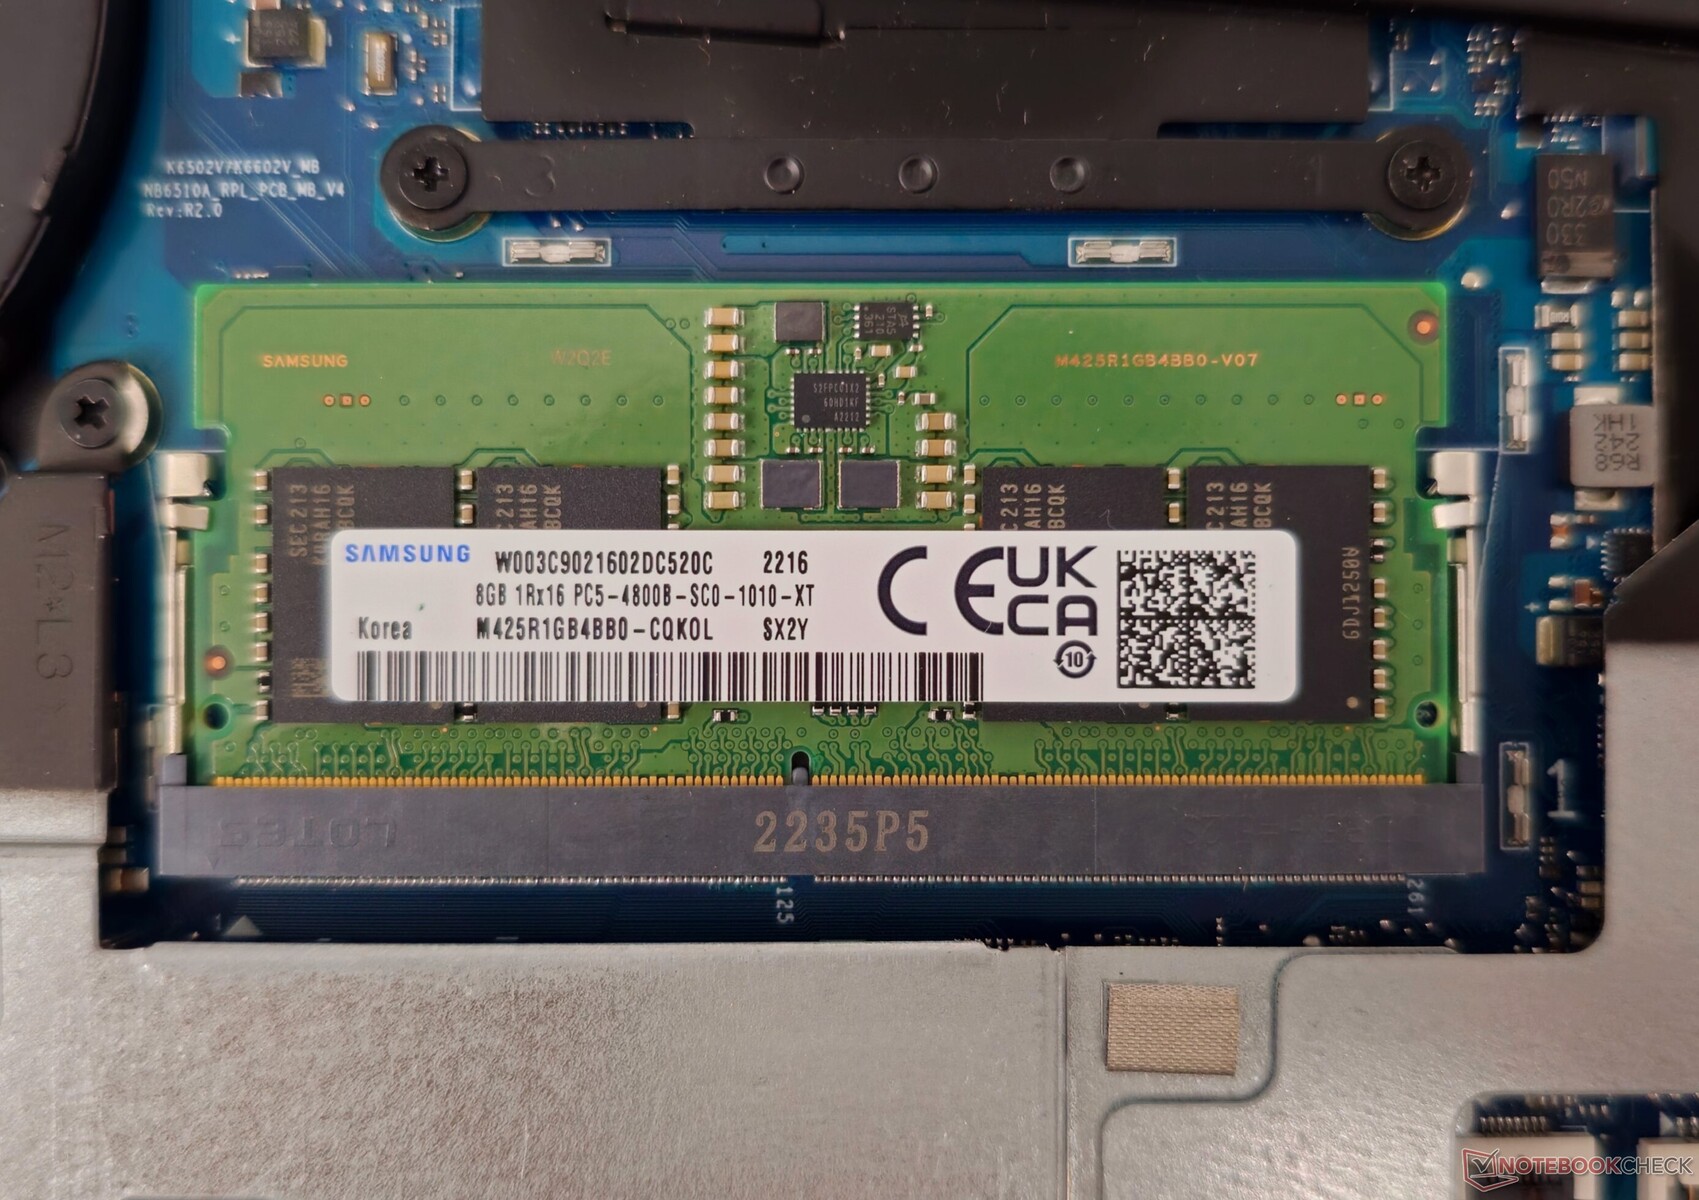
RAM-utbyggnaden är begränsad till maximalt 24 GB eftersom 8 GB DDR5-minne är fastlödda på moderkortet och endast en SO-DIMM-kortplats är tillgänglig för att lägga till mer RAM.
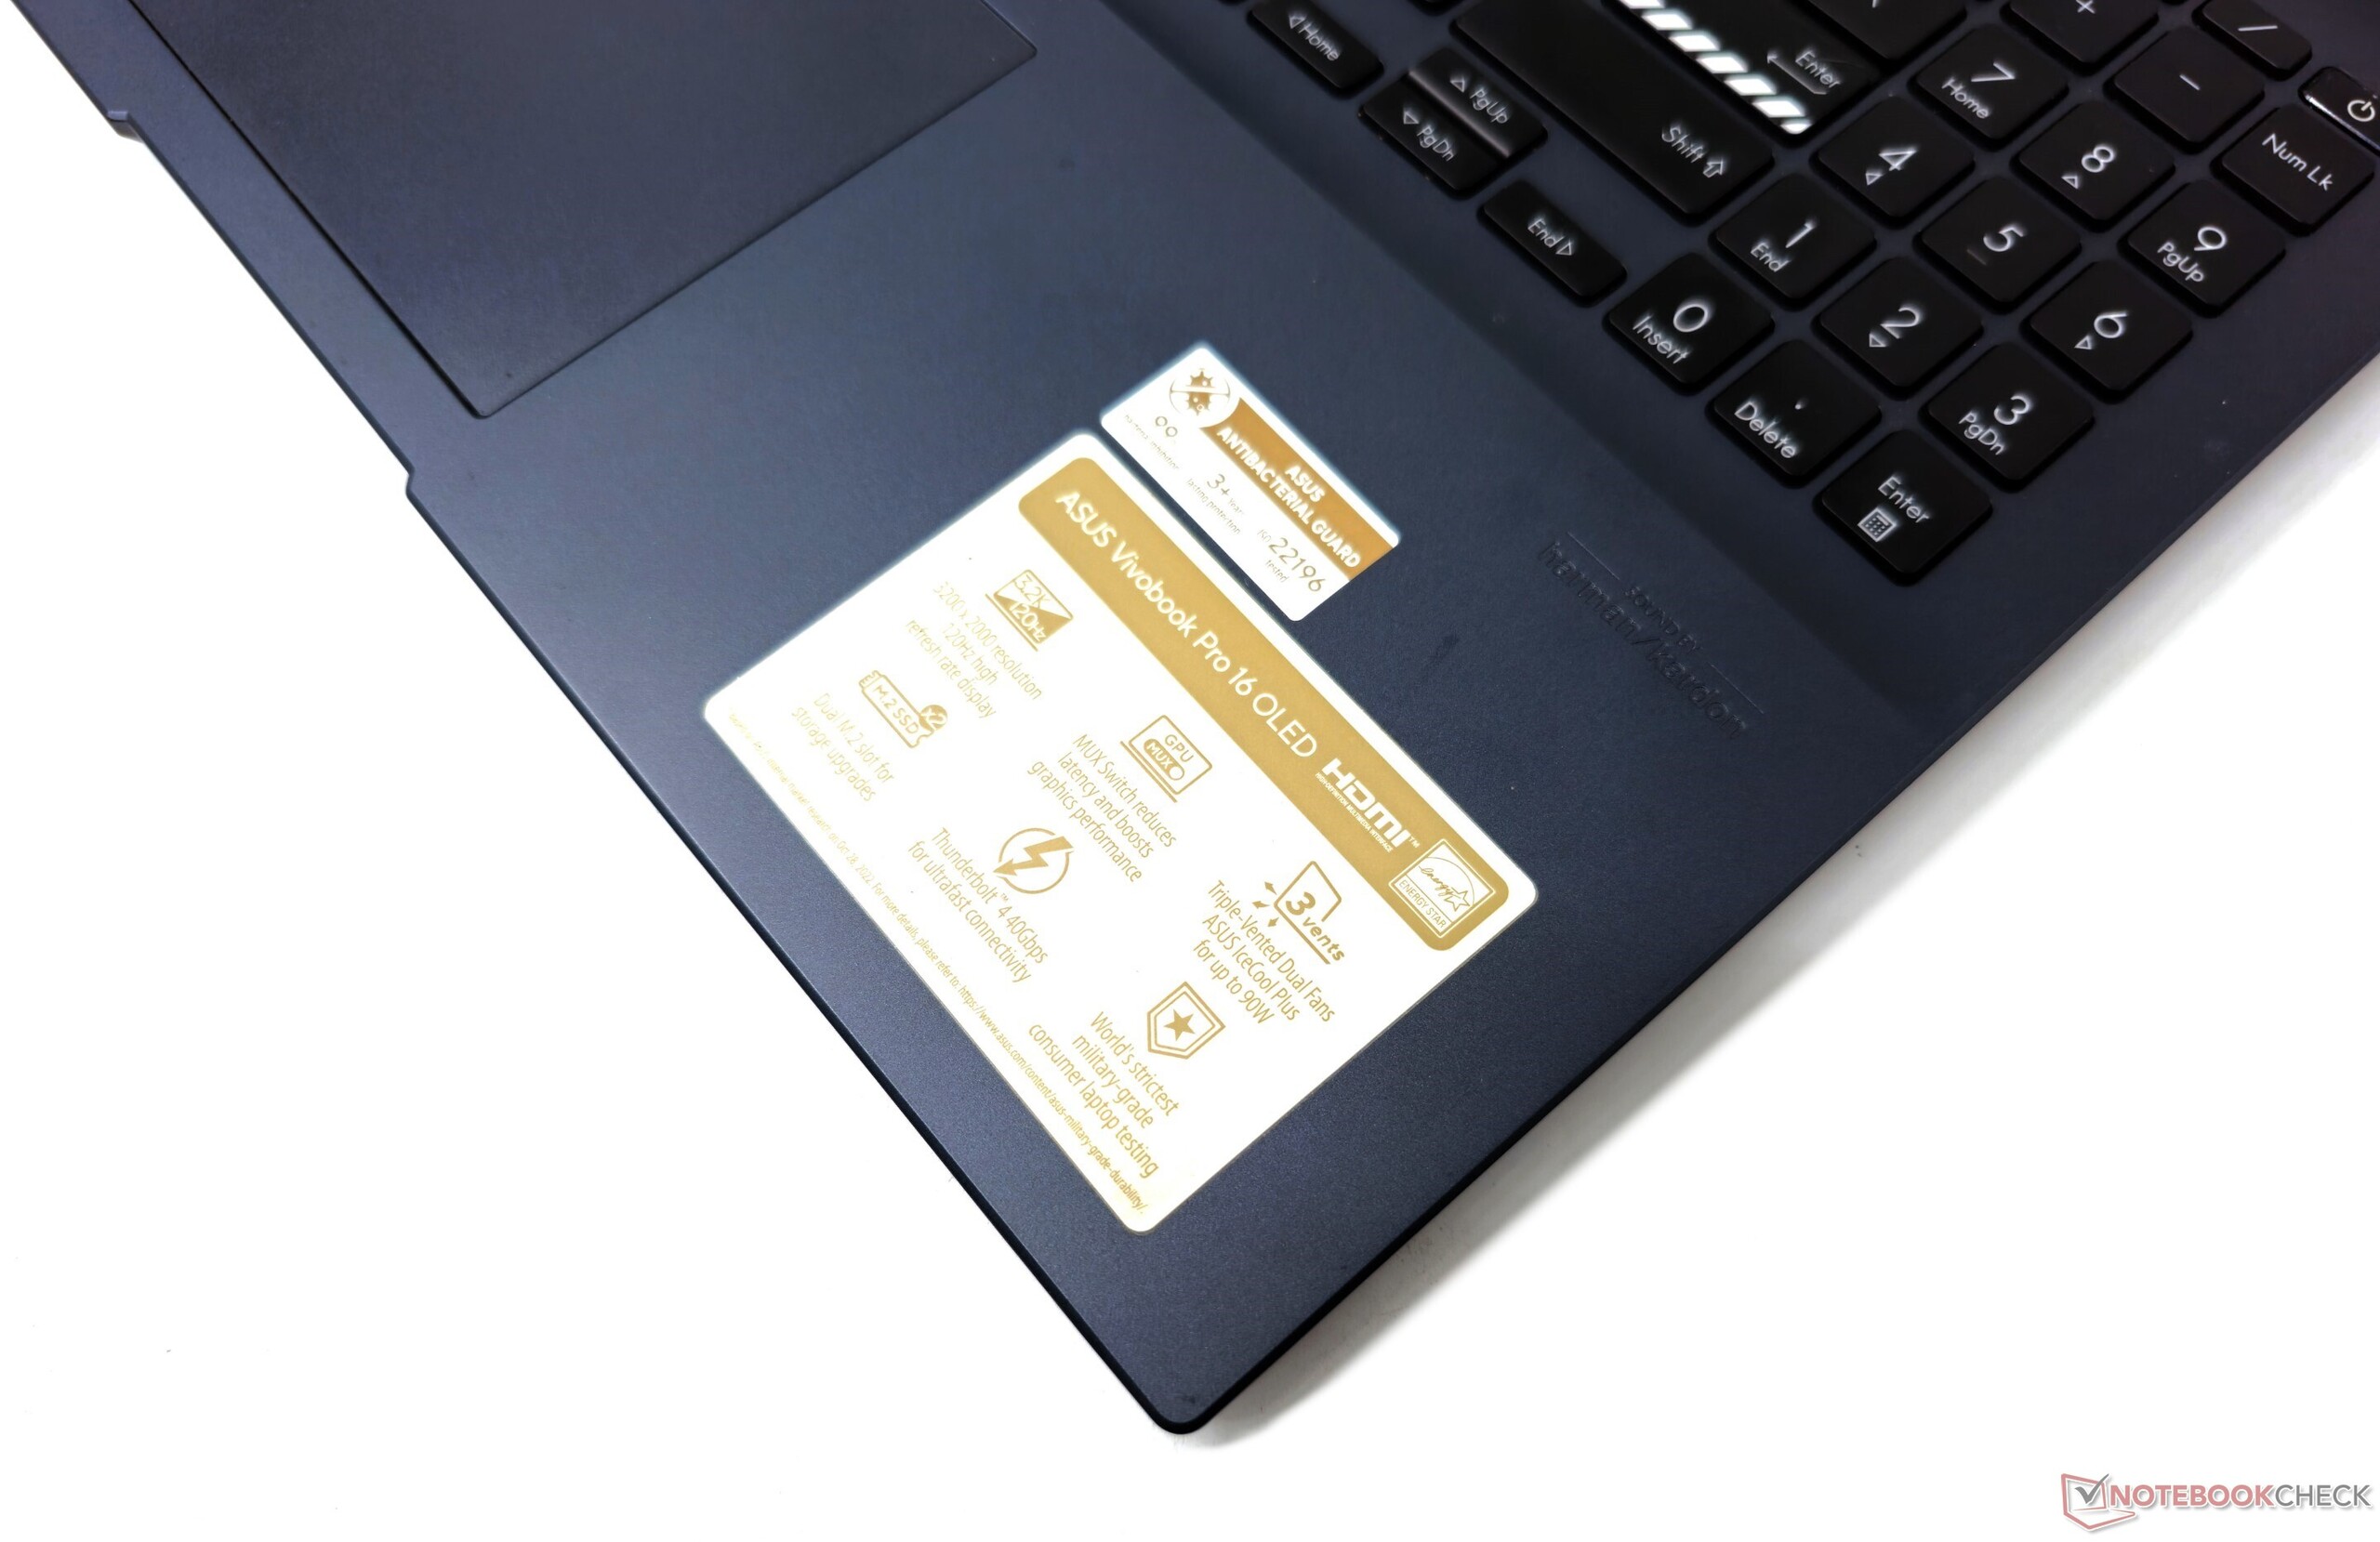
Inmatningsenheter: Fullstort tangentbord med trånga piltangenter
Tangentbord
Asus utrustar VivoBook Pro 16 med sitt signatur ErgoSense-tangentbord, liknande det vi har sett med VivoBook 15X och Pro 16X-modellerna. Tangentbordet ger en responsiv skrivupplevelse med 1,4 mm slaglängd. MyAsus-appen gör det möjligt att ställa in den primära funktionen för F1-F12 eller speciella genvägar för tangenterna på den övre raden.
Skrivupplevelsen känns bekväm för daglig produktivitet, även om piltangenterna känns trånga. En vit bakgrundsbelysning i tre nivåer underlättar skrivning i mörker.
Pekplatta
Den 9 cm x 13 cm stora ytan ger en smidig och responsiv glidning, där hela ytan fungerar som vänster musknapp. Windows Precision har fullt stöd för gester. Det finns ingen inbyggd Asus Dial till skillnad från vad vi har sett med VivoBook Pro 16X.
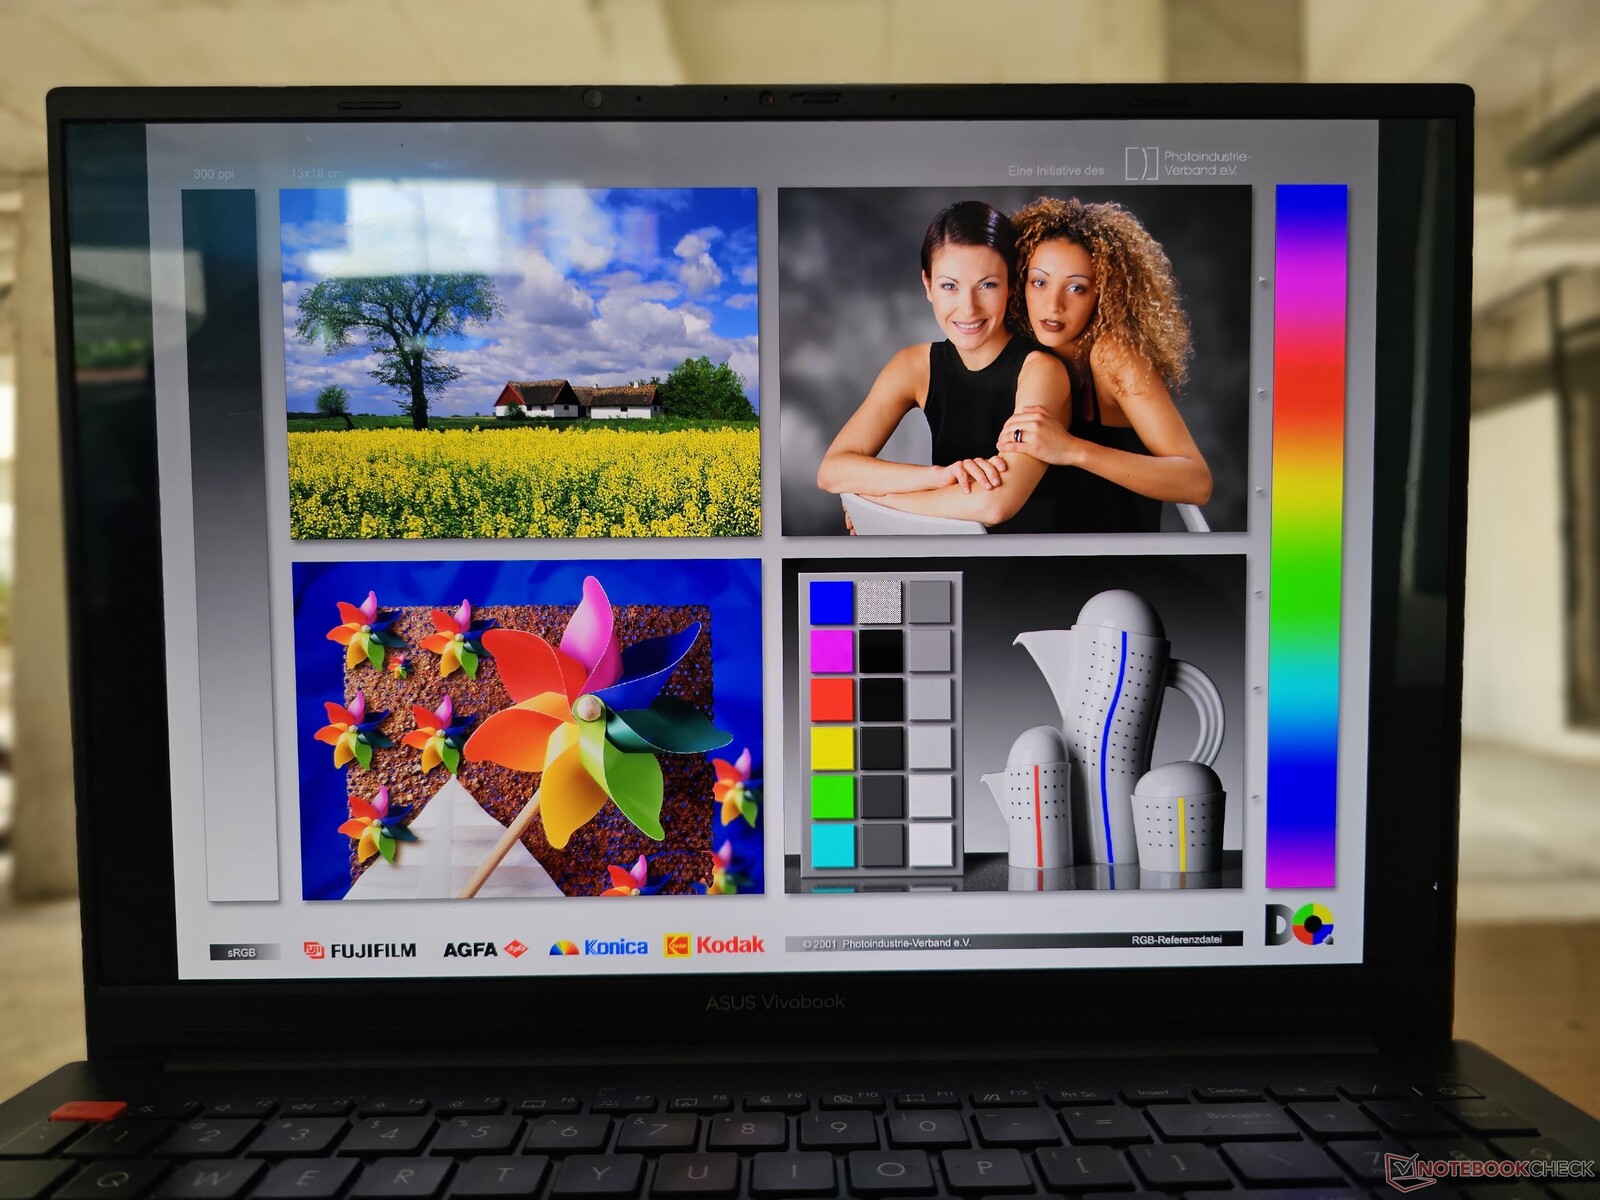
Bildskärm: 3.2K Dolby Vision HDR OLED med 240 Hz DC-dimning
VivoBook Pro 16 använder samma 16:10 Samsung ATNA60BX01 OLED-panel som Pro 16X och ProArt StudioBook 16med en upplösning på 3200 x 2000 och 120 Hz uppdateringsfrekvens. Som förväntat från en OLED-panel levererar den ett nästan oändligt kontrastförhållande med djup svärta och utan någon bakgrundsbelysning. Ljusfördelningen är också mycket enhetlig.
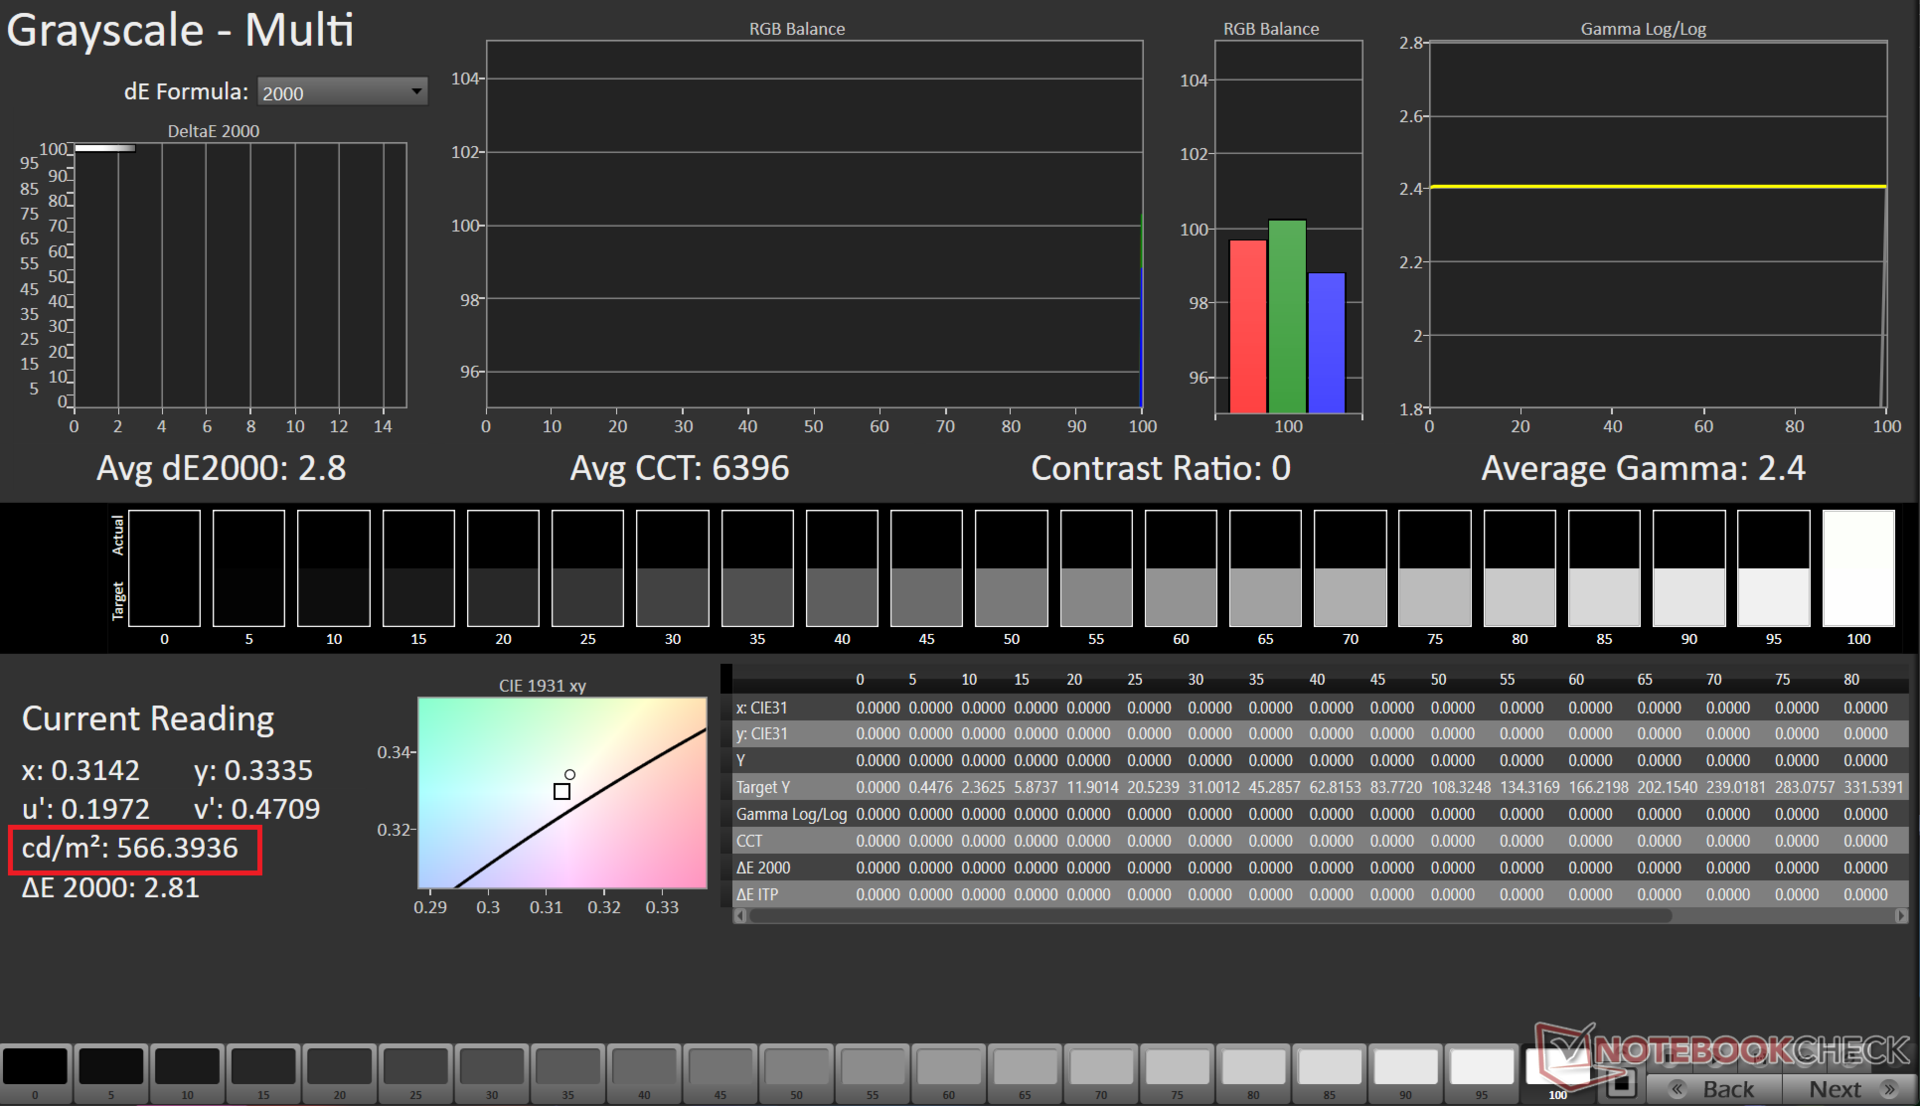
I SDR-läge registrerade vi en maximal ljusstyrka på 358 nits. Med HDR aktiverat kan skärmen nå upp till 566 nits, nära VESA DisplayHDR 600-specifikationen. MyAsus-appen tillhandahåller flera justeringar som DC-dimning, färgskala och OLED-pixelförskjutning som förhindrar inbränning.
Även om maximal SDR-ljusstyrka är något lägre än idealet, skapar OLED-panelens perfekta svärta ändå en uppslukande tittarupplevelse.

| |||||||||||||||||||||||||
Distribution av ljusstyrkan: 98 %
Mitt på batteriet: 348 cd/m²
Kontrast: ∞:1 (Svärta: 0 cd/m²)
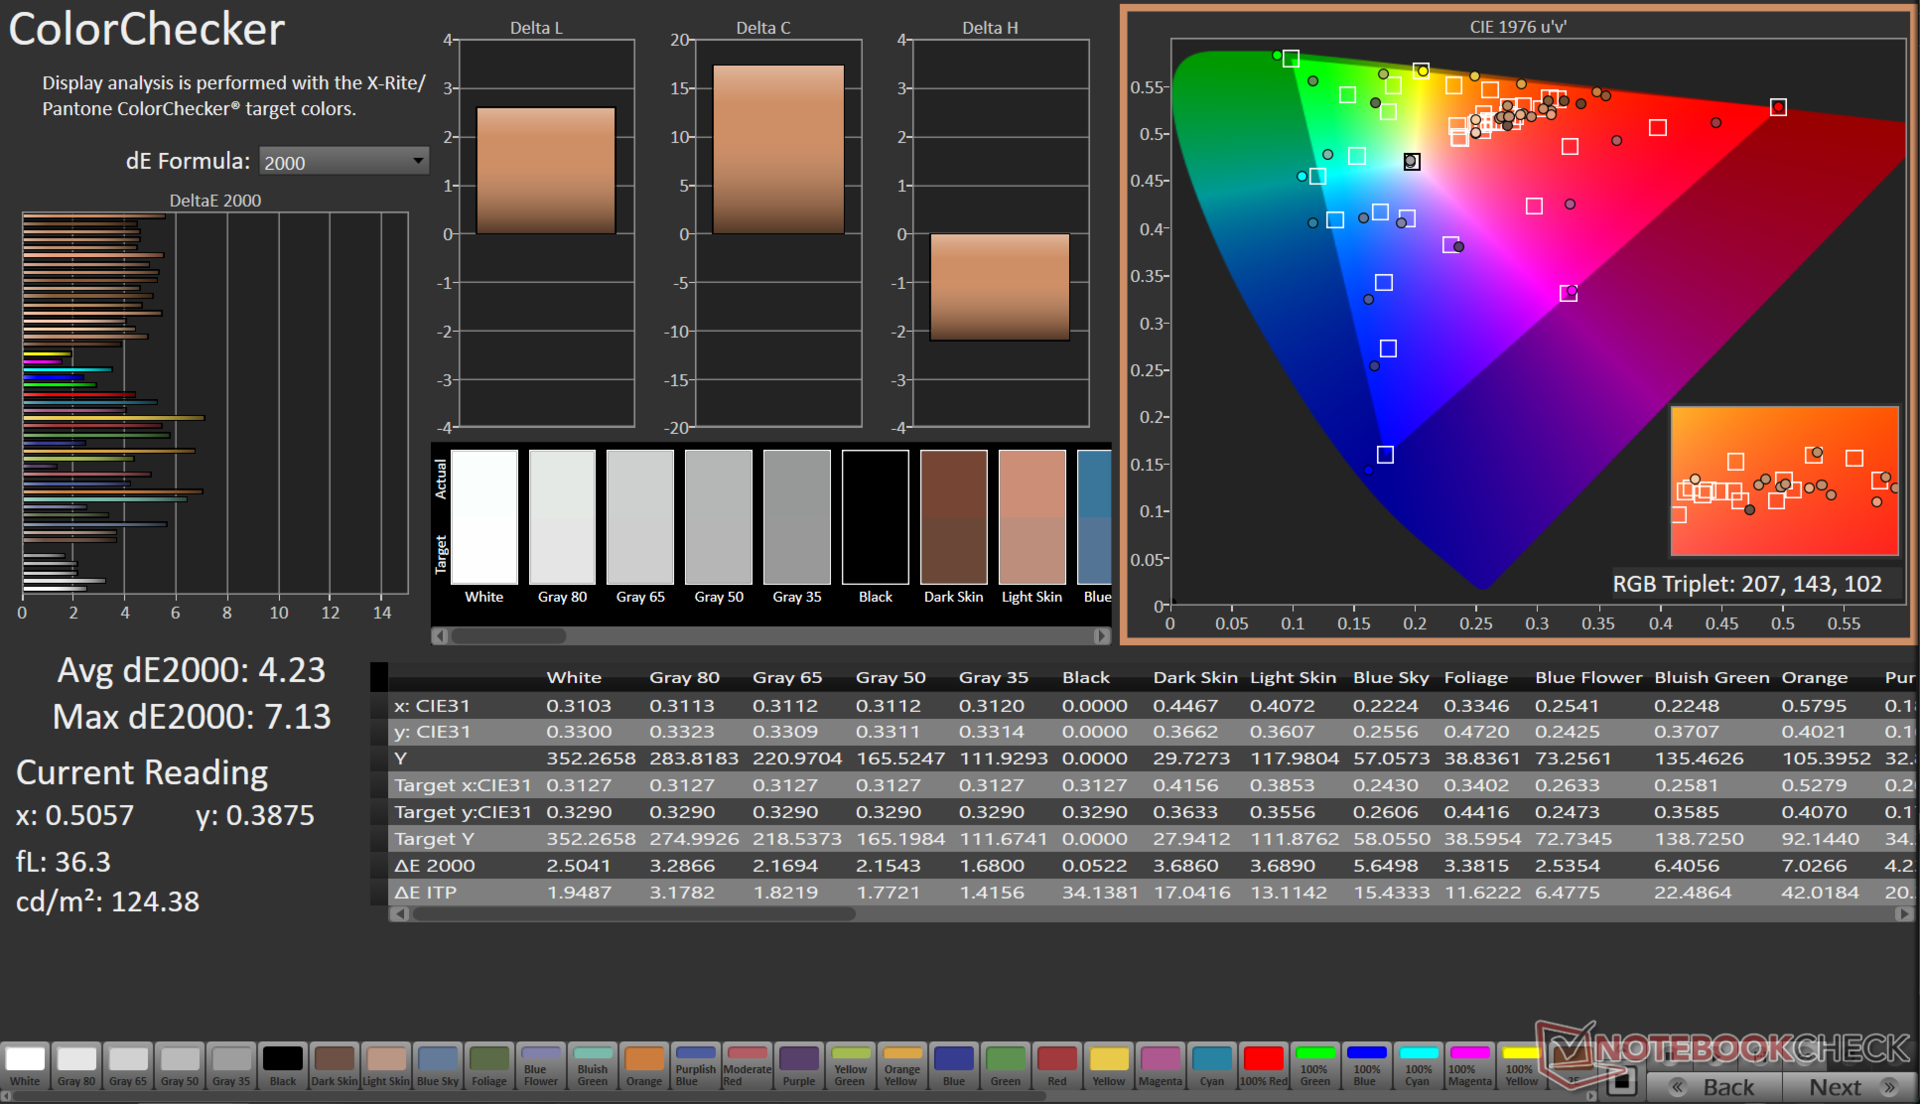
ΔE ColorChecker Calman: 4.23 | ∀{0.5-29.43 Ø4.72}
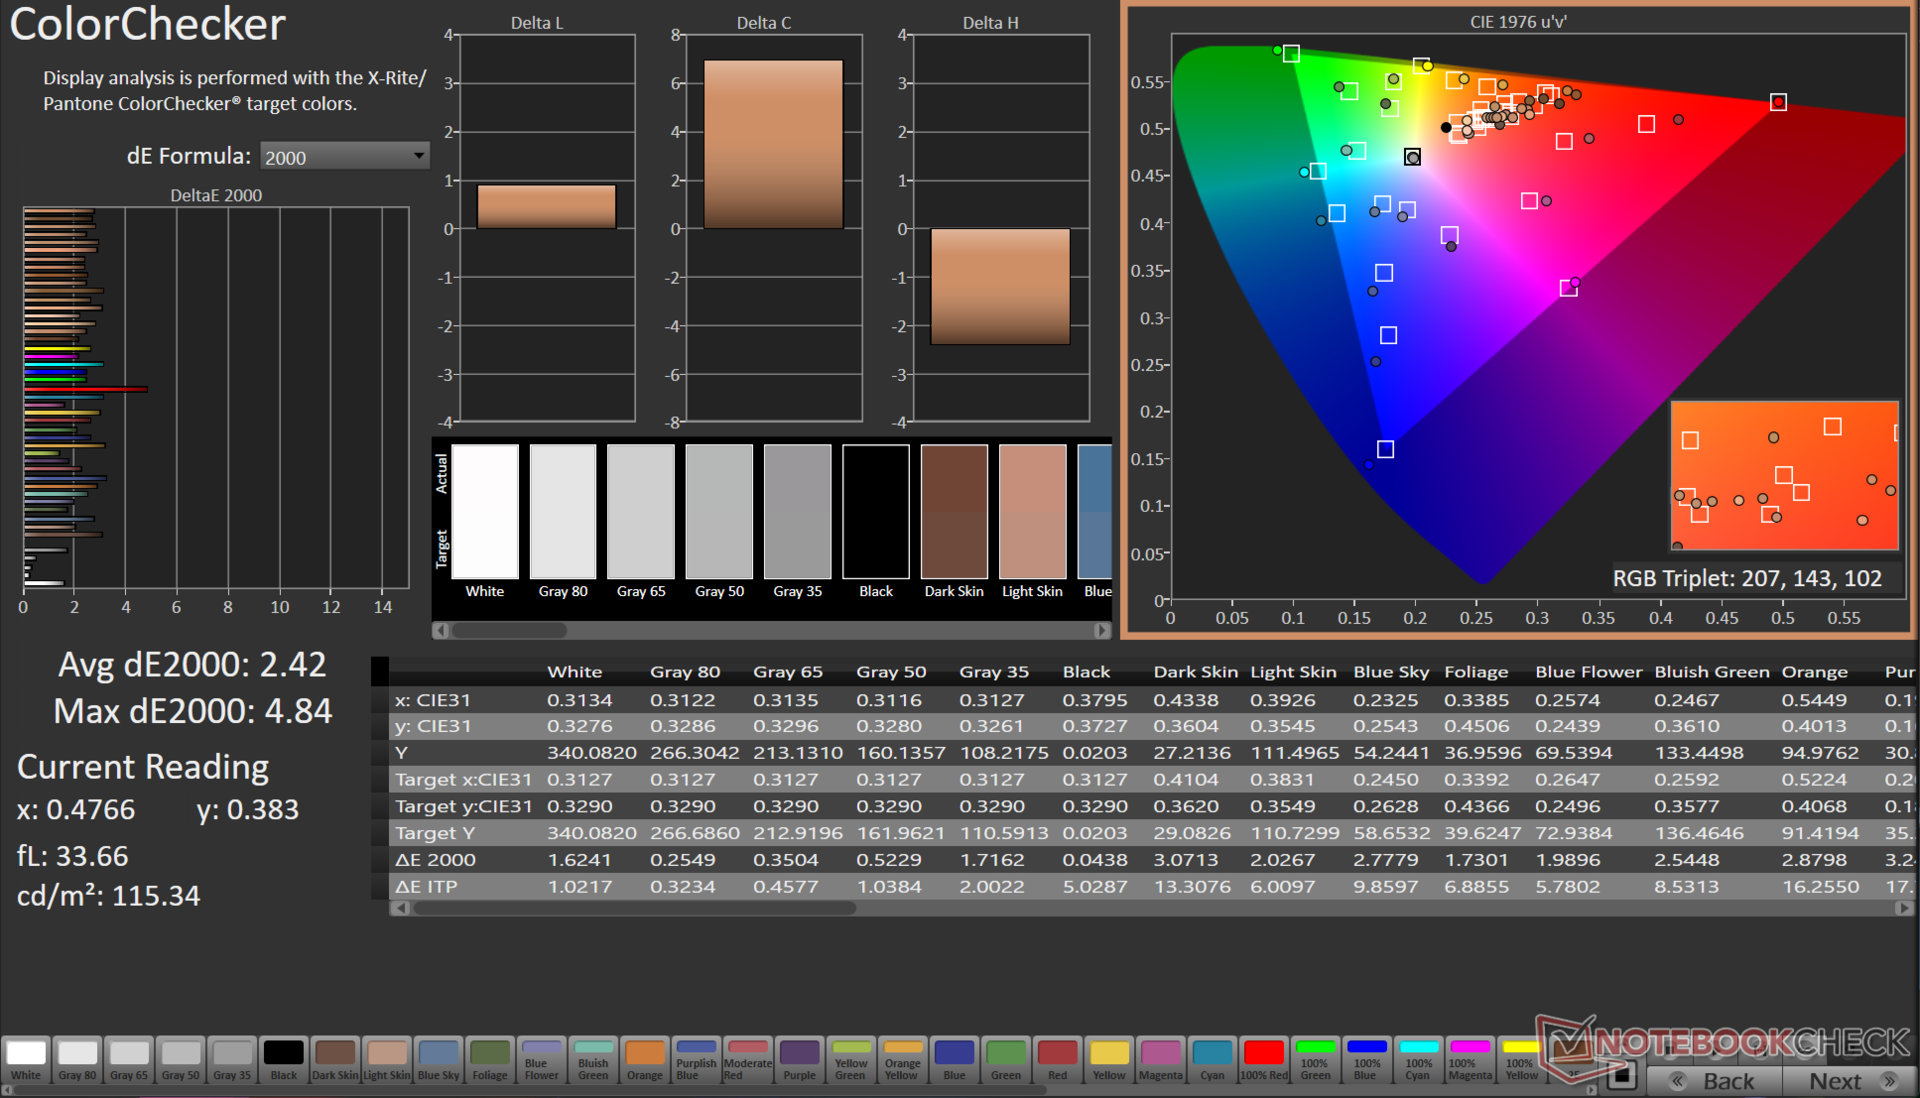
calibrated: 2.42
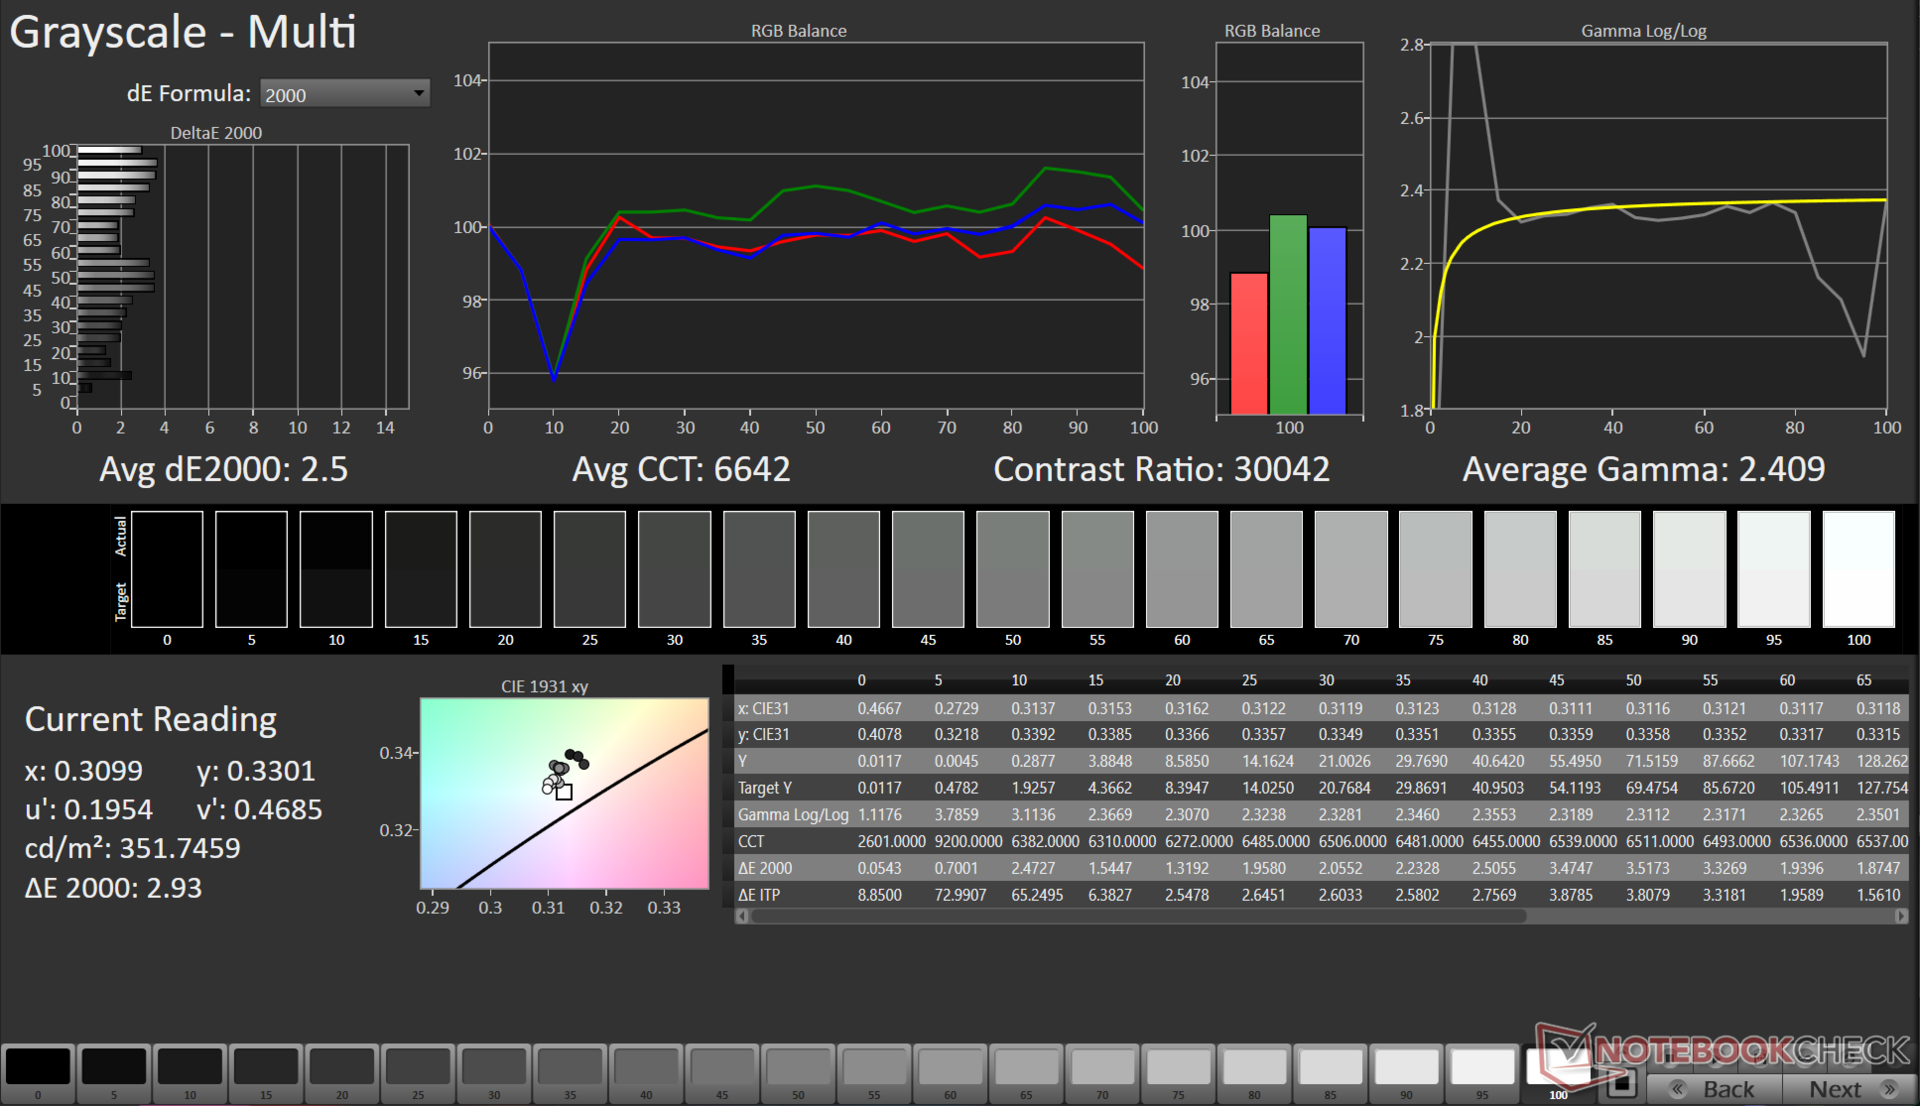
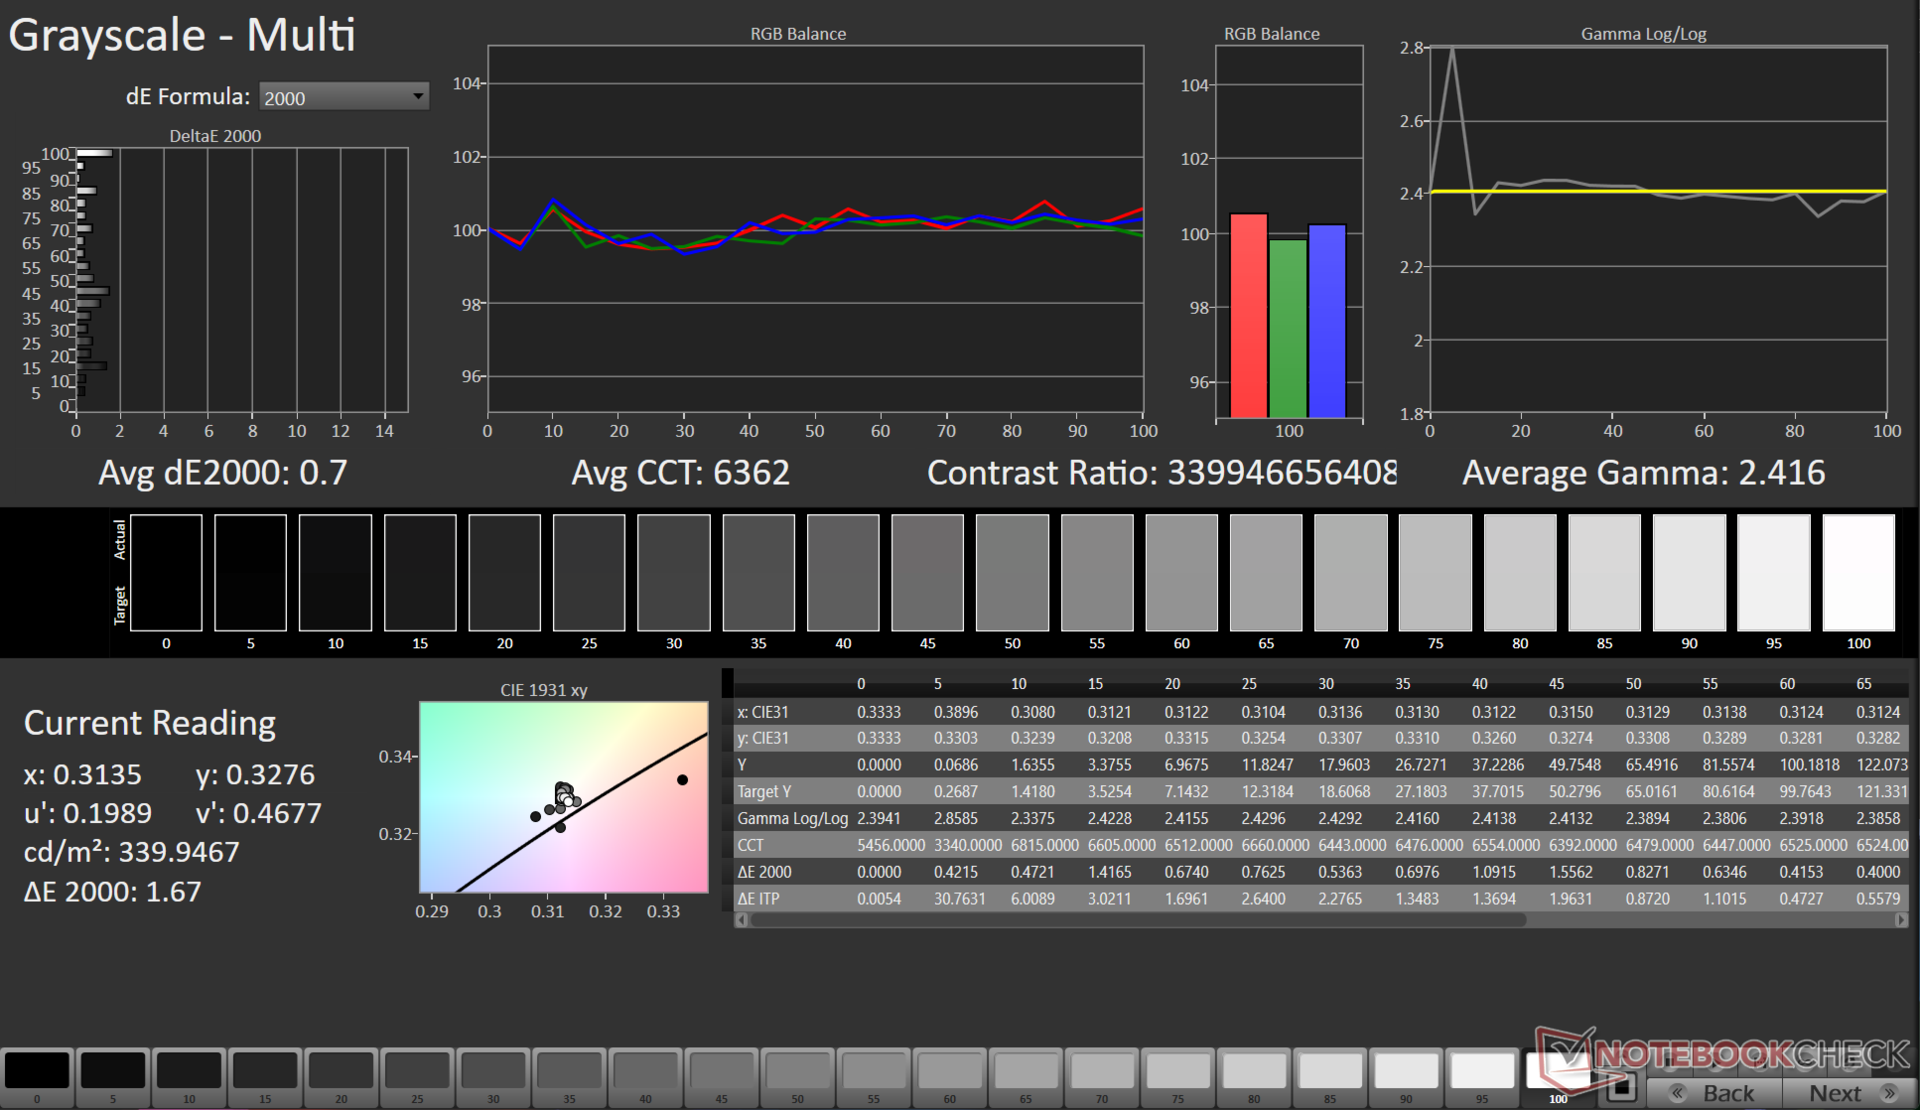
ΔE Greyscale Calman: 2.5 | ∀{0.09-98 Ø4.97}
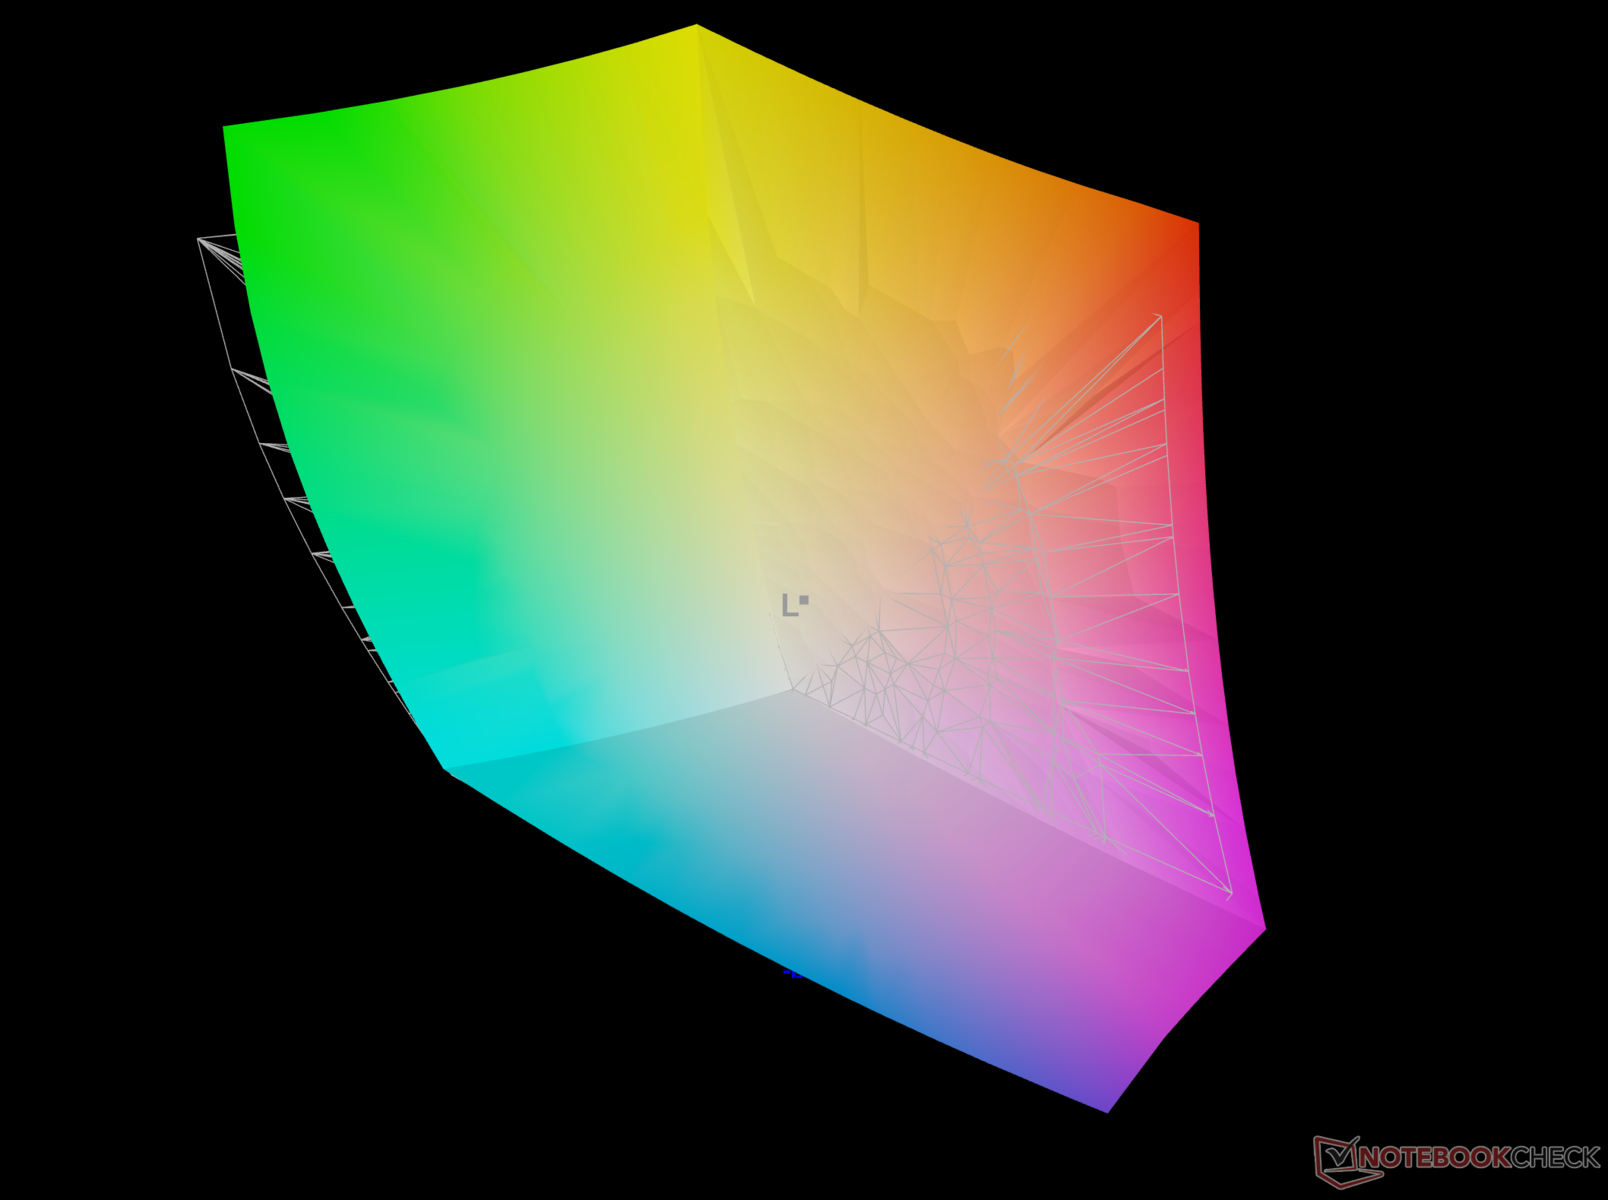
96.5% AdobeRGB 1998 (Argyll 3D)
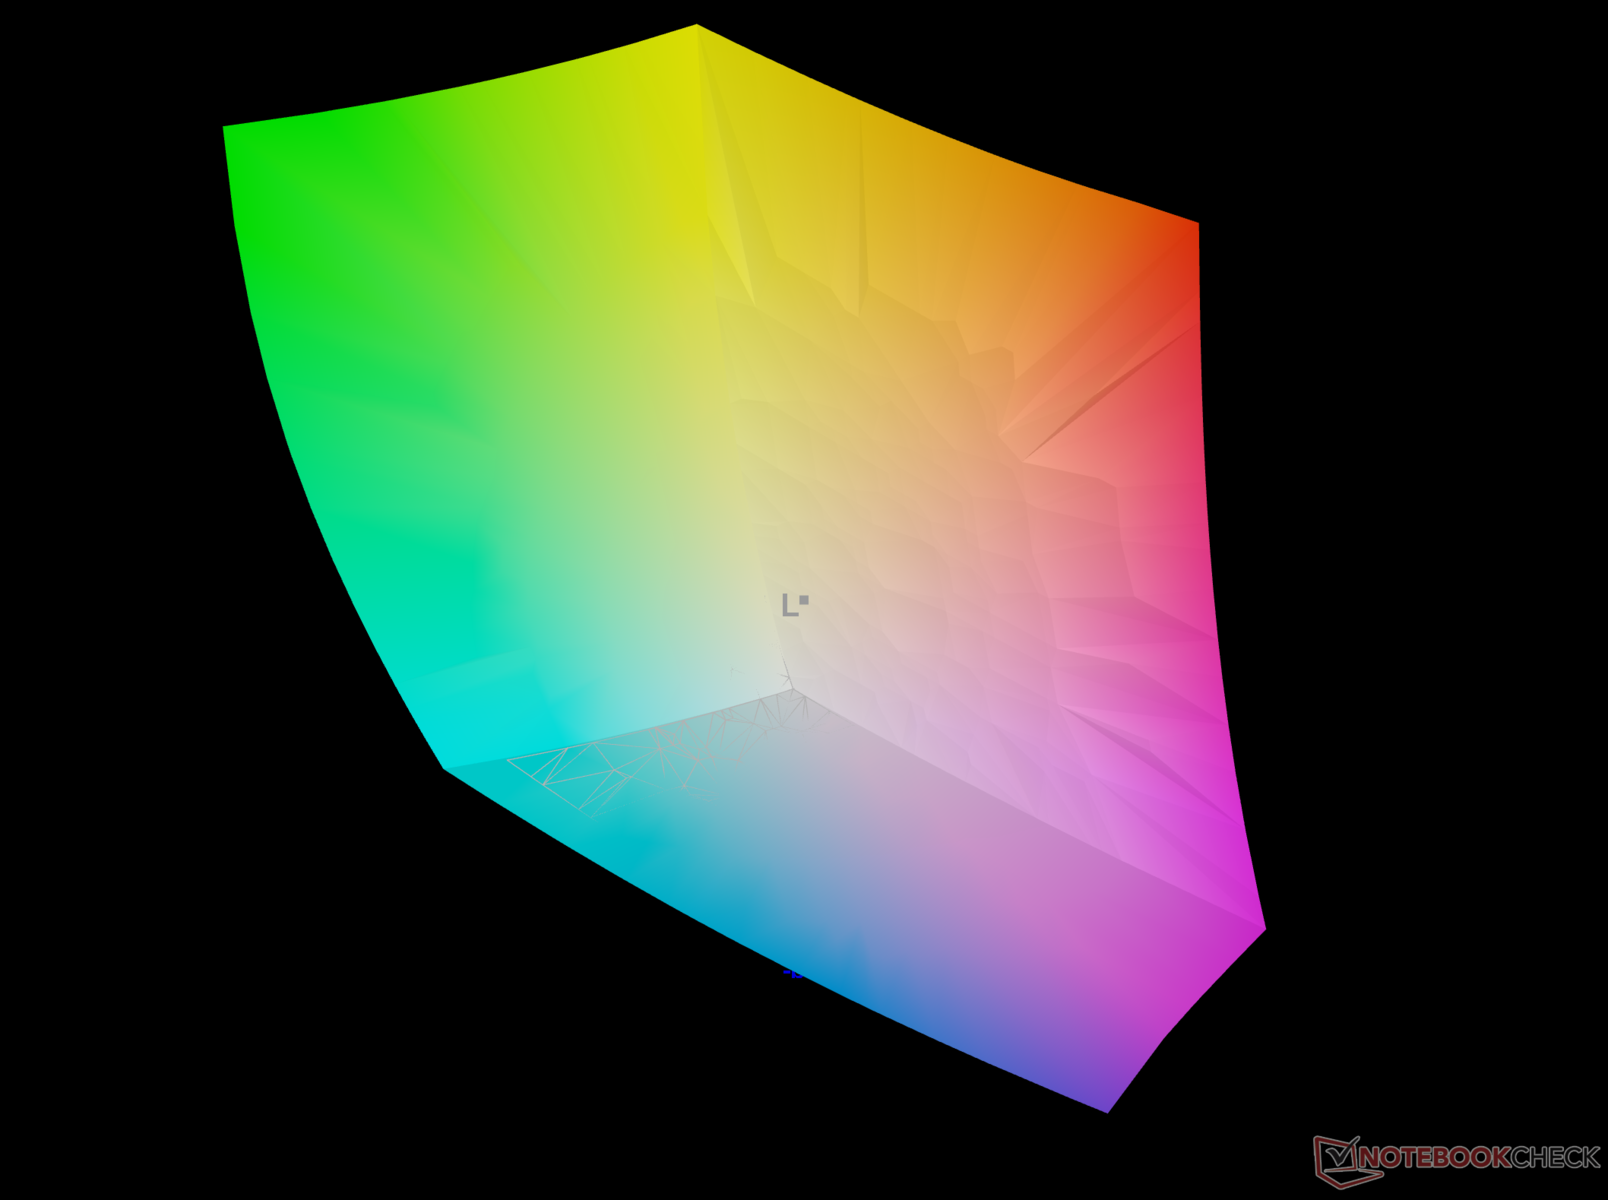
99.7% sRGB (Argyll 3D)
98.7% Display P3 (Argyll 3D)
Gamma: 2.4
CCT: 6642 K
| Asus VivoBook Pro 16 K6602VU Samsung ATNA60BX01-1, OLED, 3200x2000, 16" | Asus Vivobook Pro 16X K6604JV-MX016W Samsung SDC4178 ATNA60BX01-1, OLED, 3200x2000, 16" | Gigabyte AERO 16 OLED BSF Samsung SDC4191 (ATNA60YV09-0, OLED, 3840x2400, 16" | Asus ROG Flow X16 GV601V TMX1603 (TL160ADMP03-0), IPS, 2560x1600, 16" | Lenovo Legion Pro 5 16ARX8 (R5 7645HX, RTX 4050) CSOT T3 MNG007DA2-2, IPS, 2560x1600, 16" | Asus TUF Gaming A16 FA617XS BOE NE160WUM-NX2, IPS, 1920x1200, 16" | Asus VivoBook Pro 16 Au Optronics B160QAN02.L, IPS, 2560x1600, 16" | |
|---|---|---|---|---|---|---|---|
| Display | -0% | 0% | -5% | -17% | -20% | -4% | |
| Display P3 Coverage (%) | 98.7 | 98.4 0% | 99.9 1% | 96.61 -2% | 71.6 -27% | 69.3 -30% | 98.5 0% |
| sRGB Coverage (%) | 99.7 | 99.7 0% | 100 0% | 99.92 0% | 99.8 0% | 97.3 -2% | 99.9 0% |
| AdobeRGB 1998 Coverage (%) | 96.5 | 95.8 -1% | 96.4 0% | 84.63 -12% | 72.9 -24% | 70.7 -27% | 86.1 -11% |
| Response Times | -23% | -55% | -209% | -802% | -1085% | -78% | |
| Response Time Grey 50% / Grey 80% * (ms) | 0.68 ? | 1.6 ? -135% | 2 ? -194% | 3.8 ? -459% | 12 ? -1665% | 15.6 ? -2194% | 2 ? -194% |
| Response Time Black / White * (ms) | 13.2 ? | 1.4 ? 89% | 1.98 ? 85% | 7.6 ? 42% | 5.2 ? 61% | 10 ? 24% | 8 ? 39% |
| PWM Frequency (Hz) | 240 ? | 120 ? | 60 | ||||
| Screen | 23% | 23% | 24% | 45% | 18% | 24% | |
| Brightness middle (cd/m²) | 353 | 347 -2% | 389.97 10% | 486 38% | 543 54% | 301 -15% | 504 43% |
| Brightness (cd/m²) | 354 | 346 -2% | 395 12% | 469 32% | 516 46% | 294 -17% | 465 31% |
| Brightness Distribution (%) | 98 | 97 -1% | 97 -1% | 91 -7% | 87 -11% | 94 -4% | 87 -11% |
| Black Level * (cd/m²) | 0.06 | 0.03 | 0.39 | 0.58 | 0.21 | 0.35 | |
| Colorchecker dE 2000 * | 4.23 | 1.89 55% | 2 53% | 2.27 46% | 1.35 68% | 1.79 58% | 1.83 57% |
| Colorchecker dE 2000 max. * | 7.13 | 3.26 54% | 4.1 42% | 5.73 20% | 3.22 55% | 3.48 51% | 5.51 23% |
| Colorchecker dE 2000 calibrated * | 2.42 | 1.97 19% | 1.68 31% | 0.6 75% | 1.31 46% | 1.2 50% | 1.34 45% |
| Greyscale dE 2000 * | 2.5 | 1.55 38% | 2.23 11% | 3.36 -34% | 1.03 59% | 2.5 -0% | 3.02 -21% |
| Gamma | 2.4 92% | 2.39 92% | 2.41 91% | 2.46 89% | 2.38 92% | 2.265 97% | 2.39 92% |
| CCT | 6642 98% | 6458 101% | 6323 103% | 6625 98% | 6452 101% | 6157 106% | 6688 97% |
| Contrast (:1) | 5783 | 12999 | 1246 | 936 | 1433 | 1440 | |
| Totalt genomsnitt (program/inställningar) | 0% /
10% | -11% /
4% | -63% /
-22% | -258% /
-112% | -362% /
-176% | -19% /
0% |
* ... mindre är bättre
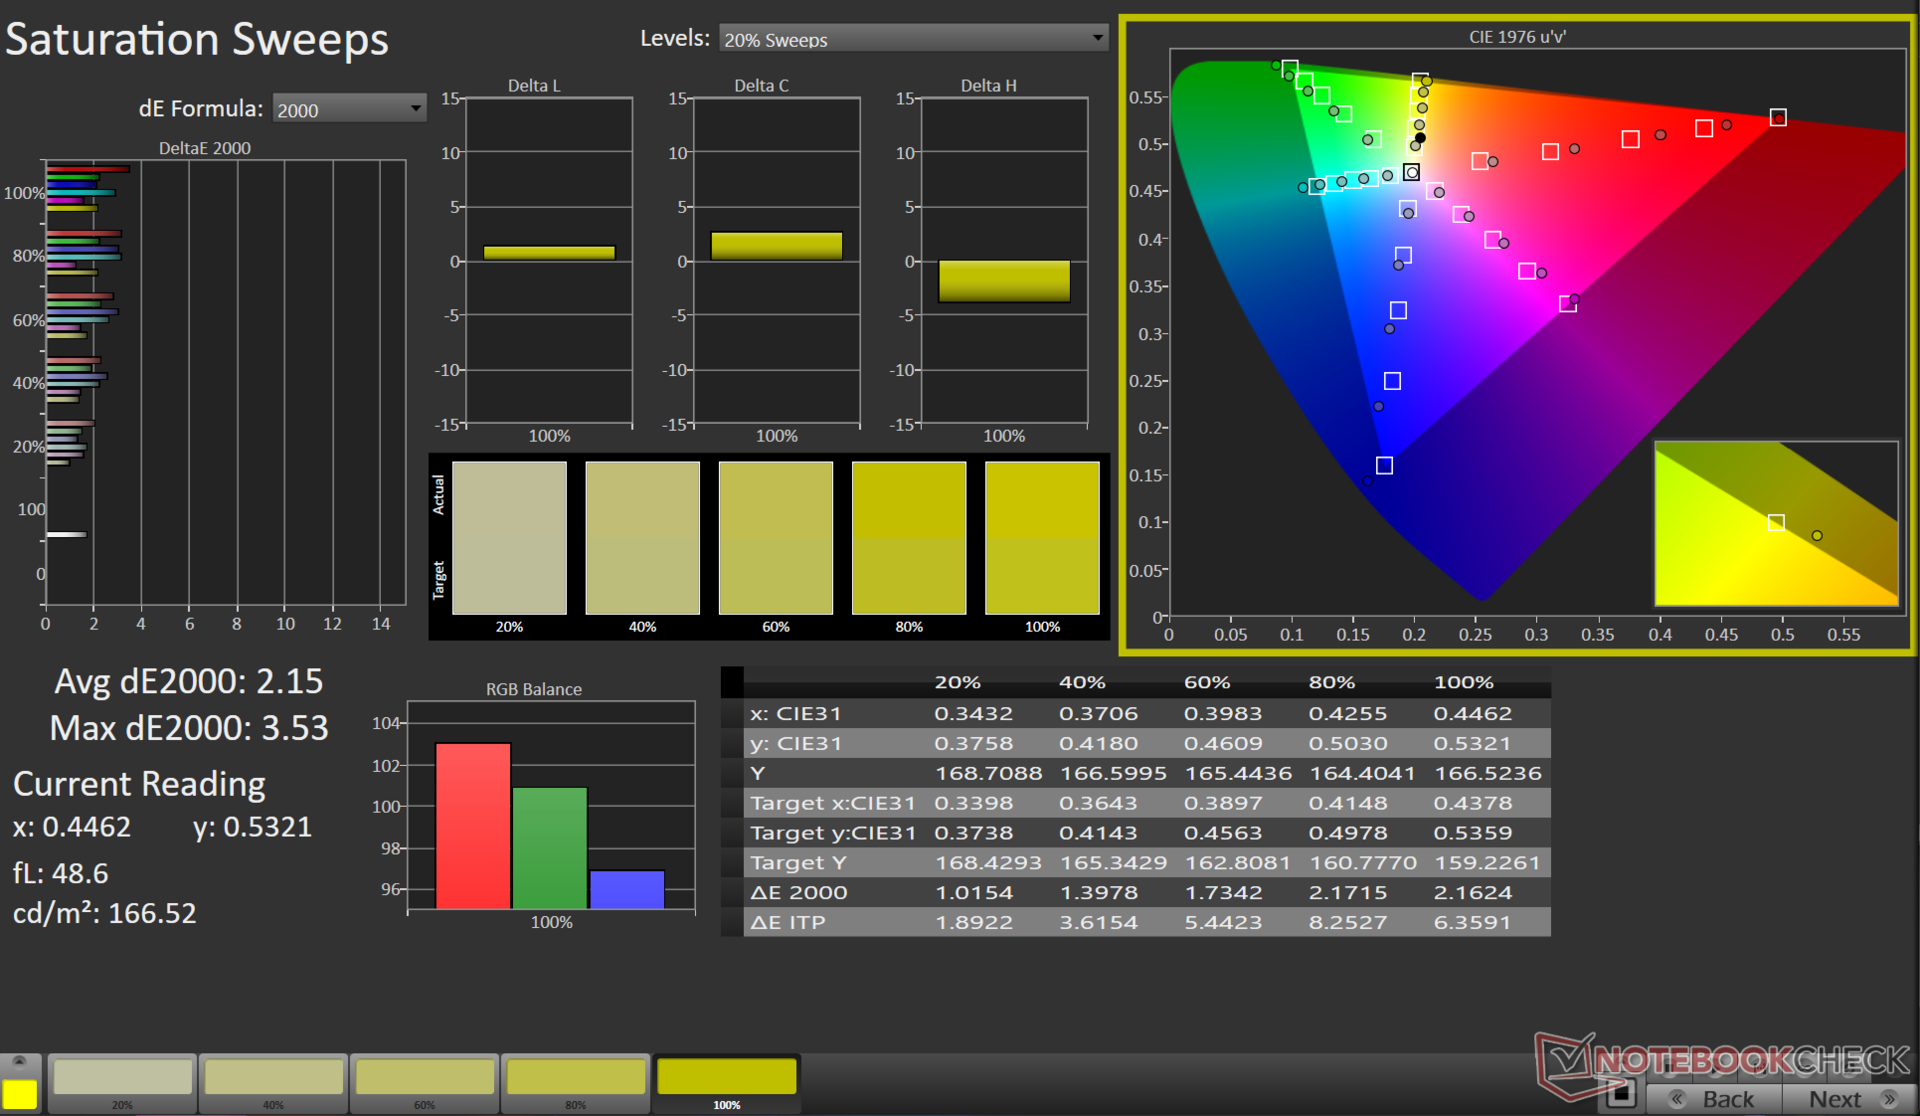
Färgmätningar och kalibrering utfördes i läget Normal med en inbyggd färgprofil och i färgrymden Display P3.
Panelen täcker mer eller mindre hela sRGB- och Display P3-färgskalan tillsammans med en imponerande 96,5% Adobe RGB-täckning. Det breda färgskalestödet gör VivoBook Pro 16:s skärm mycket lämplig för både multimediakonsumtion och skapande av innehåll.

VivoBook Pro 16:s färgnoggrannhet visar utrymme för förbättringar, med högre genomsnittliga Delta E-värden än idealiskt i vårt ColorChecker-test.
Vår kalibreringsrutin med X-Rite i1Basic Pro 3 spektrofotometer och Portrait Displays Calman Ultimate-programvara förbättrar avsevärt gråskalan (0,7) och ColorChecker Delta E 2000 (2,42) värden.
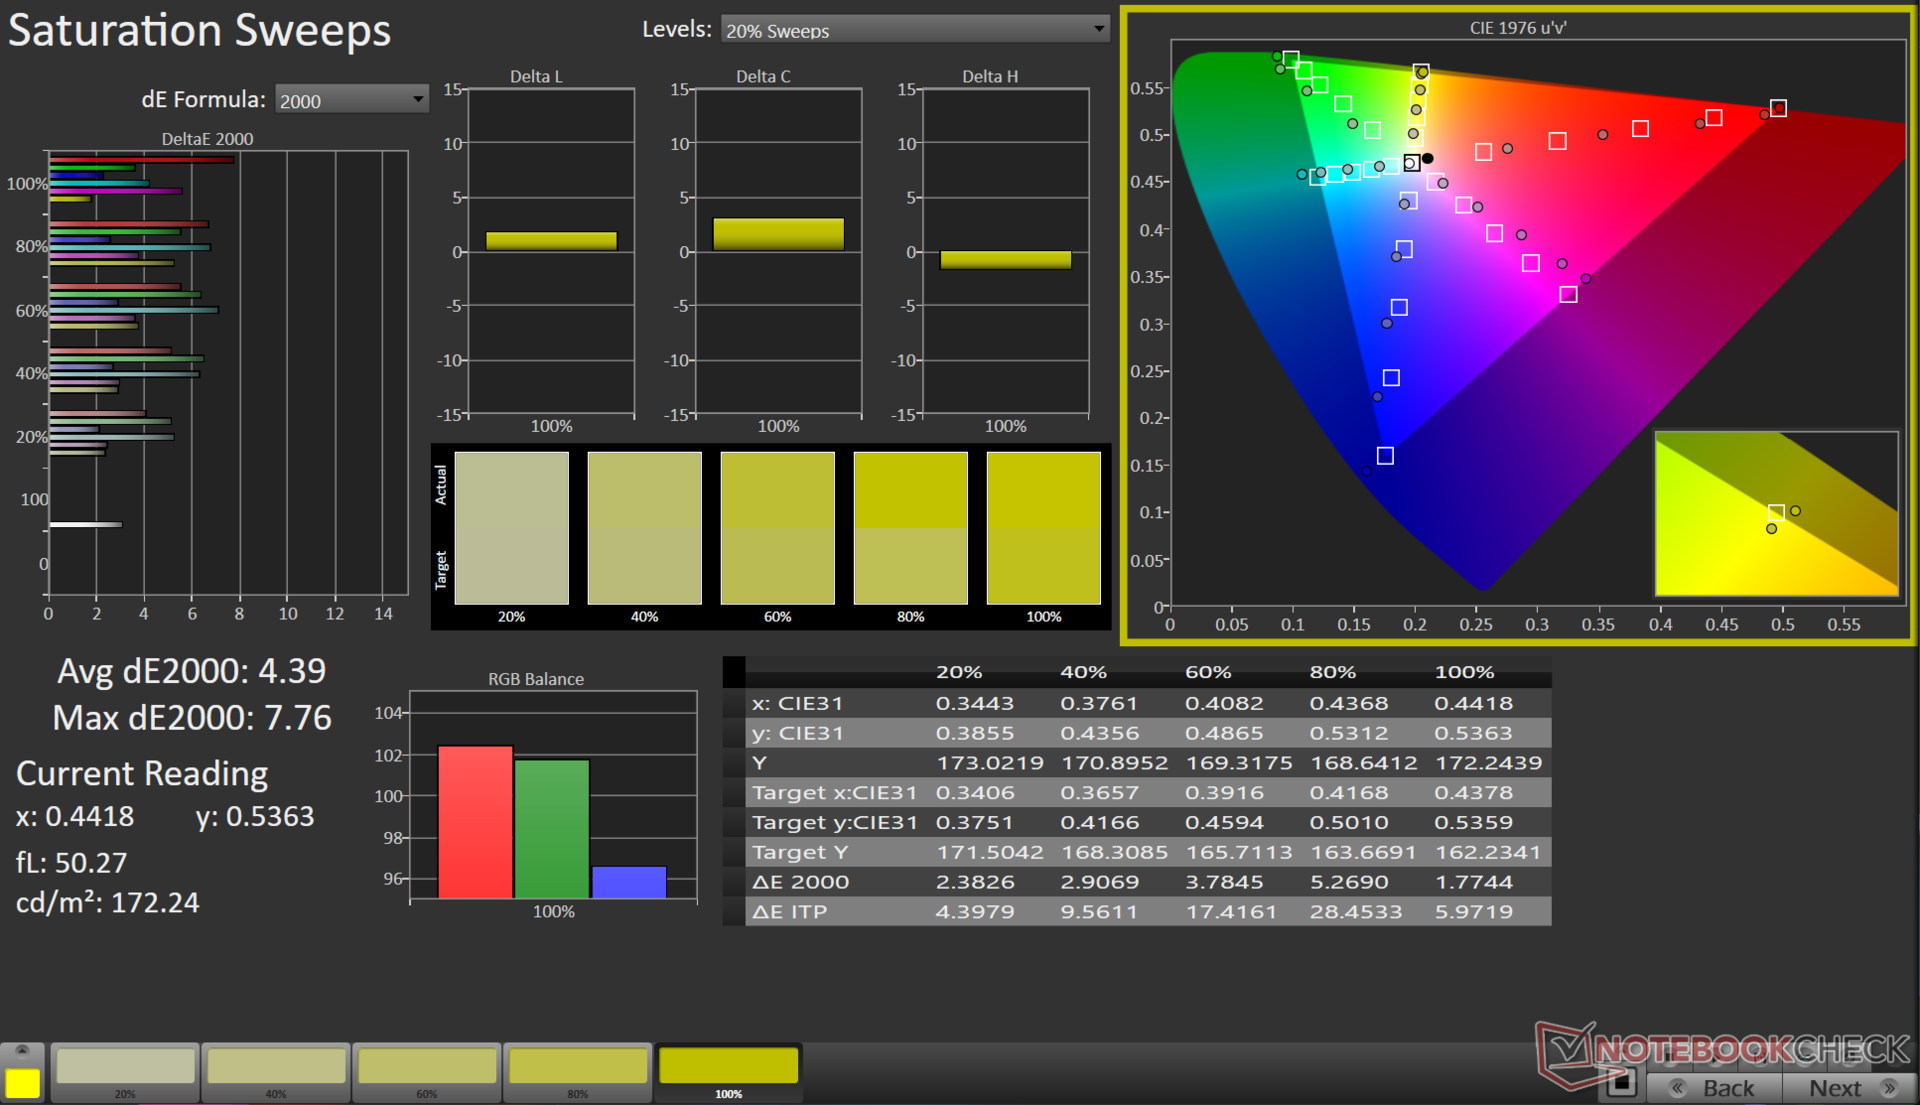
Vissa mindre problem med färgåtergivningen kvarstår dock, särskilt med fullt mättade röda nyanser och vissa hudtoner.
Den kalibrerade ICC-filen kan laddas ner från länken ovan.
Visa svarstider
| ↔ Svarstid svart till vitt | ||
|---|---|---|
| 13.2 ms ... stiga ↗ och falla ↘ kombinerat | ↗ 10.8 ms stiga | 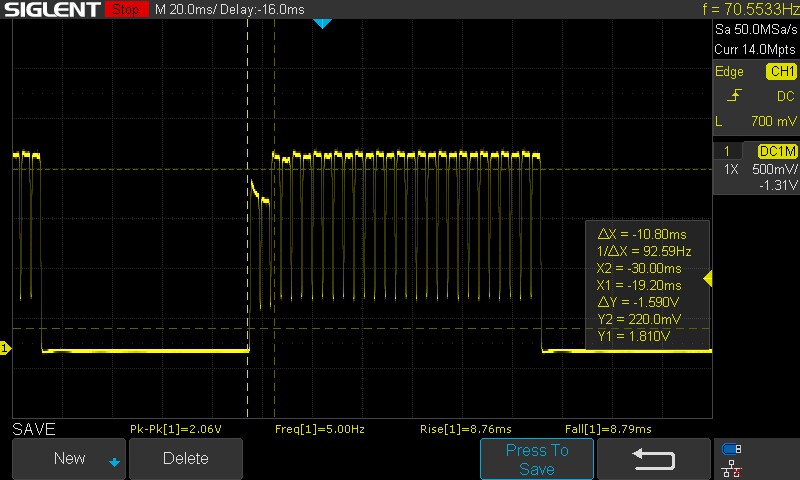 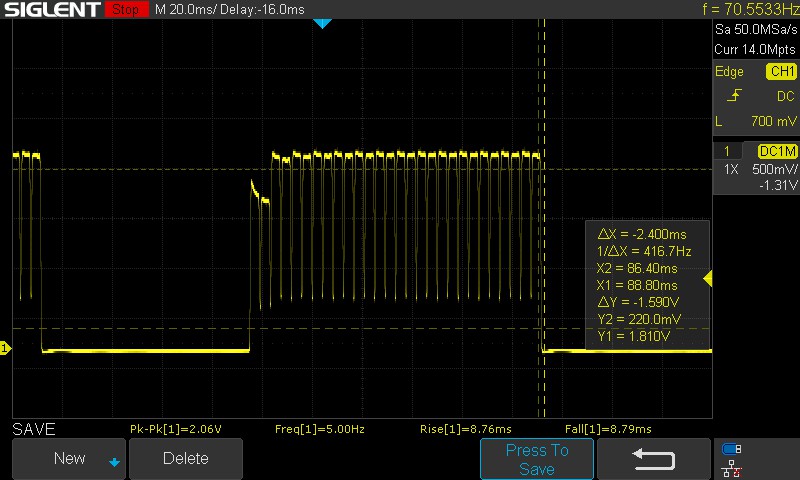 |
| ↘ 2.4 ms hösten | ||
| Skärmen visar bra svarsfrekvens i våra tester, men kan vara för långsam för konkurrenskraftiga spelare. I jämförelse sträcker sig alla testade enheter från 0.1 (minst) till 240 (maximalt) ms. » 34 % av alla enheter är bättre. Det betyder att den uppmätta svarstiden är bättre än genomsnittet av alla testade enheter (19.8 ms). | ||
| ↔ Svarstid 50 % grått till 80 % grått | ||
| 0.68 ms ... stiga ↗ och falla ↘ kombinerat | ↗ 0.32 ms stiga | 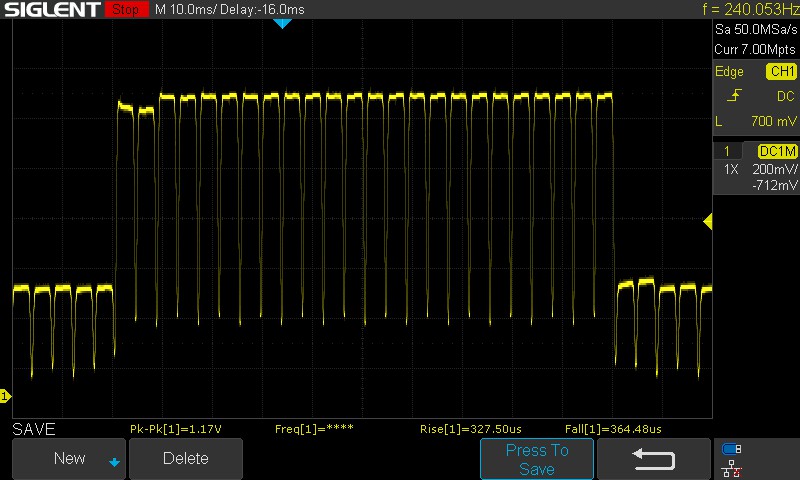 |
| ↘ 0.36 ms hösten | ||
| Skärmen visar väldigt snabba svarsfrekvenser i våra tester och borde vara mycket väl lämpad för fartfyllt spel. I jämförelse sträcker sig alla testade enheter från 0.165 (minst) till 636 (maximalt) ms. » 2 % av alla enheter är bättre. Det betyder att den uppmätta svarstiden är bättre än genomsnittet av alla testade enheter (31 ms). | ||
Övergången från 100% svart till 100% vitt tar ca 13,2 ms enligt manuell uppskattning, vilket inte är så illa. Övergångarna från 50% grå till 80% grå är mycket snabbare och tar bara ca 0,68 ms.
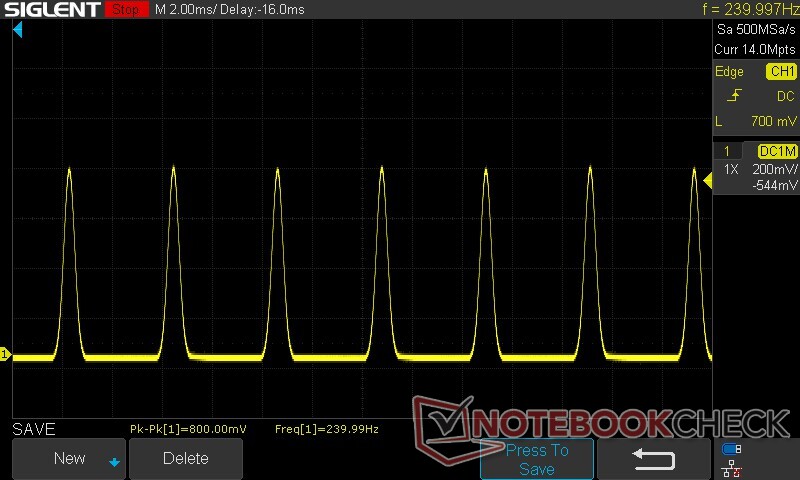
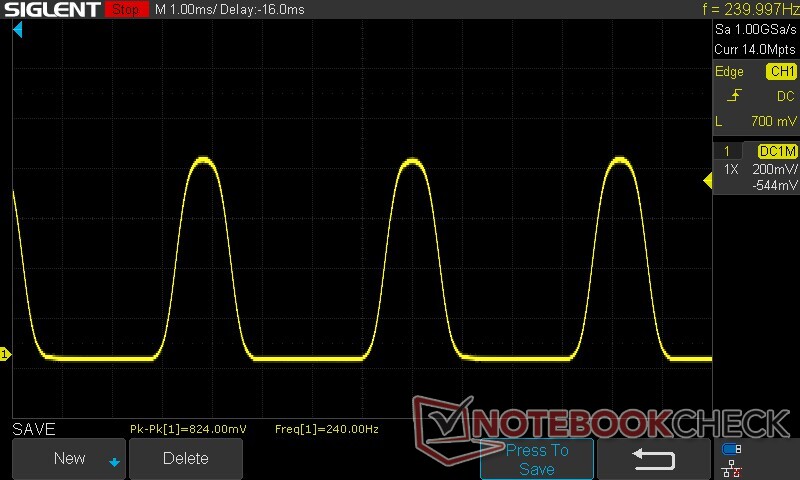
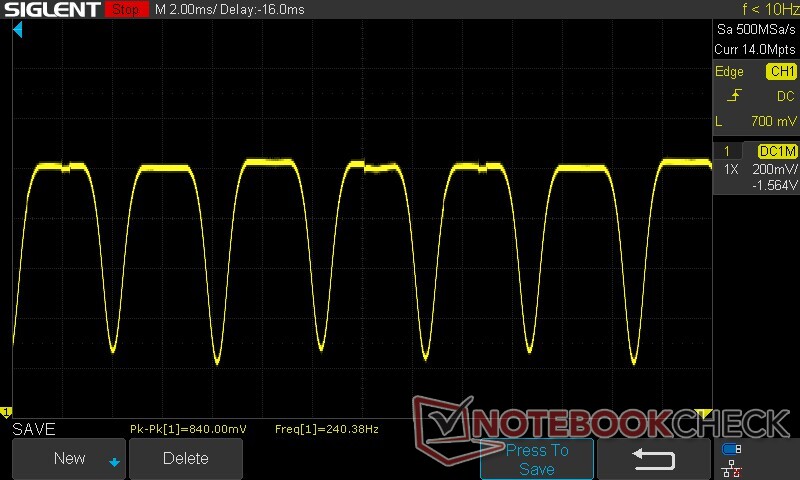
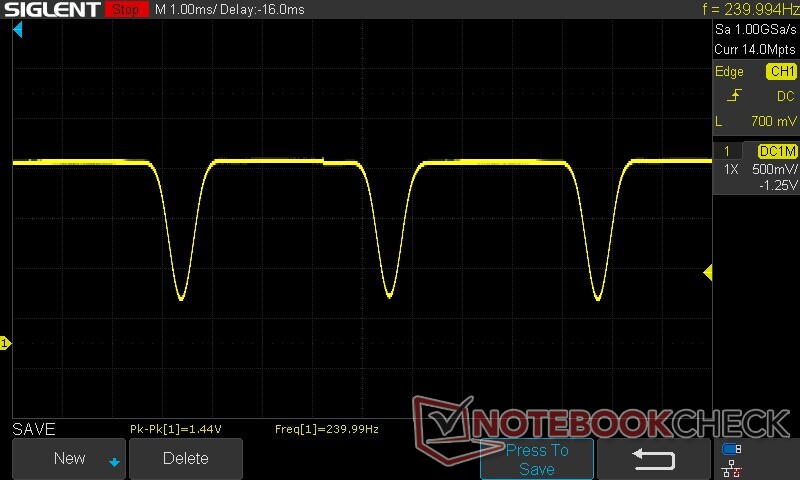
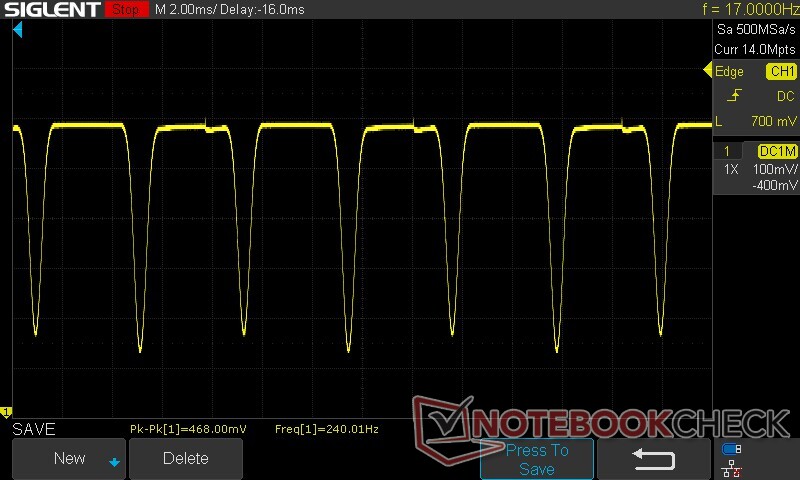
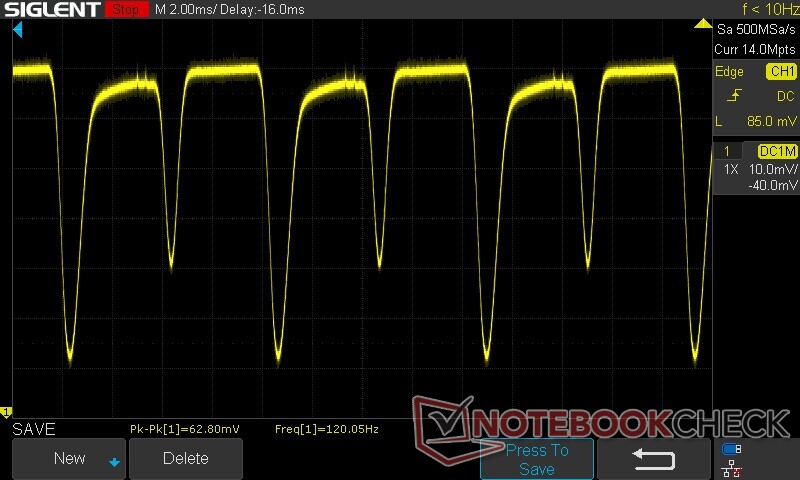
Skärmflimmer / PWM (Puls-Width Modulation)
| Skärmflimmer / PWM upptäckt | 240 Hz | ≤ 100 % ljusstyrka inställning | 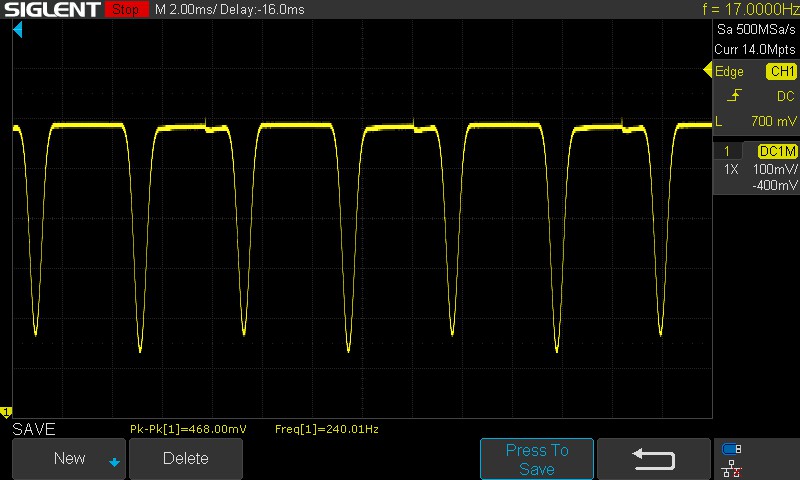 |
Displayens bakgrundsbelysning flimrar vid 240 Hz (i värsta fall, t.ex. med PWM) Flimrande upptäckt vid en ljusstyrkeinställning på 100 % och lägre. Det ska inte finnas något flimmer eller PWM över denna ljusstyrkeinställning. Frekvensen för 240 Hz är relativt låg, så känsliga användare kommer sannolikt att märka flimmer och uppleva ansträngda ögon vid den angivna ljusstyrkeinställningen och nedan. Som jämförelse: 52 % av alla testade enheter använder inte PWM för att dämpa skärmen. Om PWM upptäcktes mättes ett medelvärde av 7769 (minst: 5 - maximum: 343500) Hz. | |||
VivoBook Pro 16:s OLED-panel implementerar 240 Hz PWM under 60% ljusstyrka och växlar till 240 Hz DC-dimning över den tröskeln. Även om det är mindre tröttande än PWM, hade en DC-dimning med högre frekvens varit att föredra.
Vid en uppdateringsfrekvens på 60 Hz sjunker DC-dimningsfrekvensen till 120 Hz. För att minska risken för ögontrötthet rekommenderar vi att ljusstyrkan är högre än 60 %.
Mer information finns i våra artiklar, "Varför PWM är en sådan huvudvärk" och "Analys: DC Dimming vs. PWM - Kan du dimma AMOLED-skärmar utan att de flimrar". Du kan också få en översikt över uppmätt PWM i granskade enheter i vår Tabell över PWM-rankning.
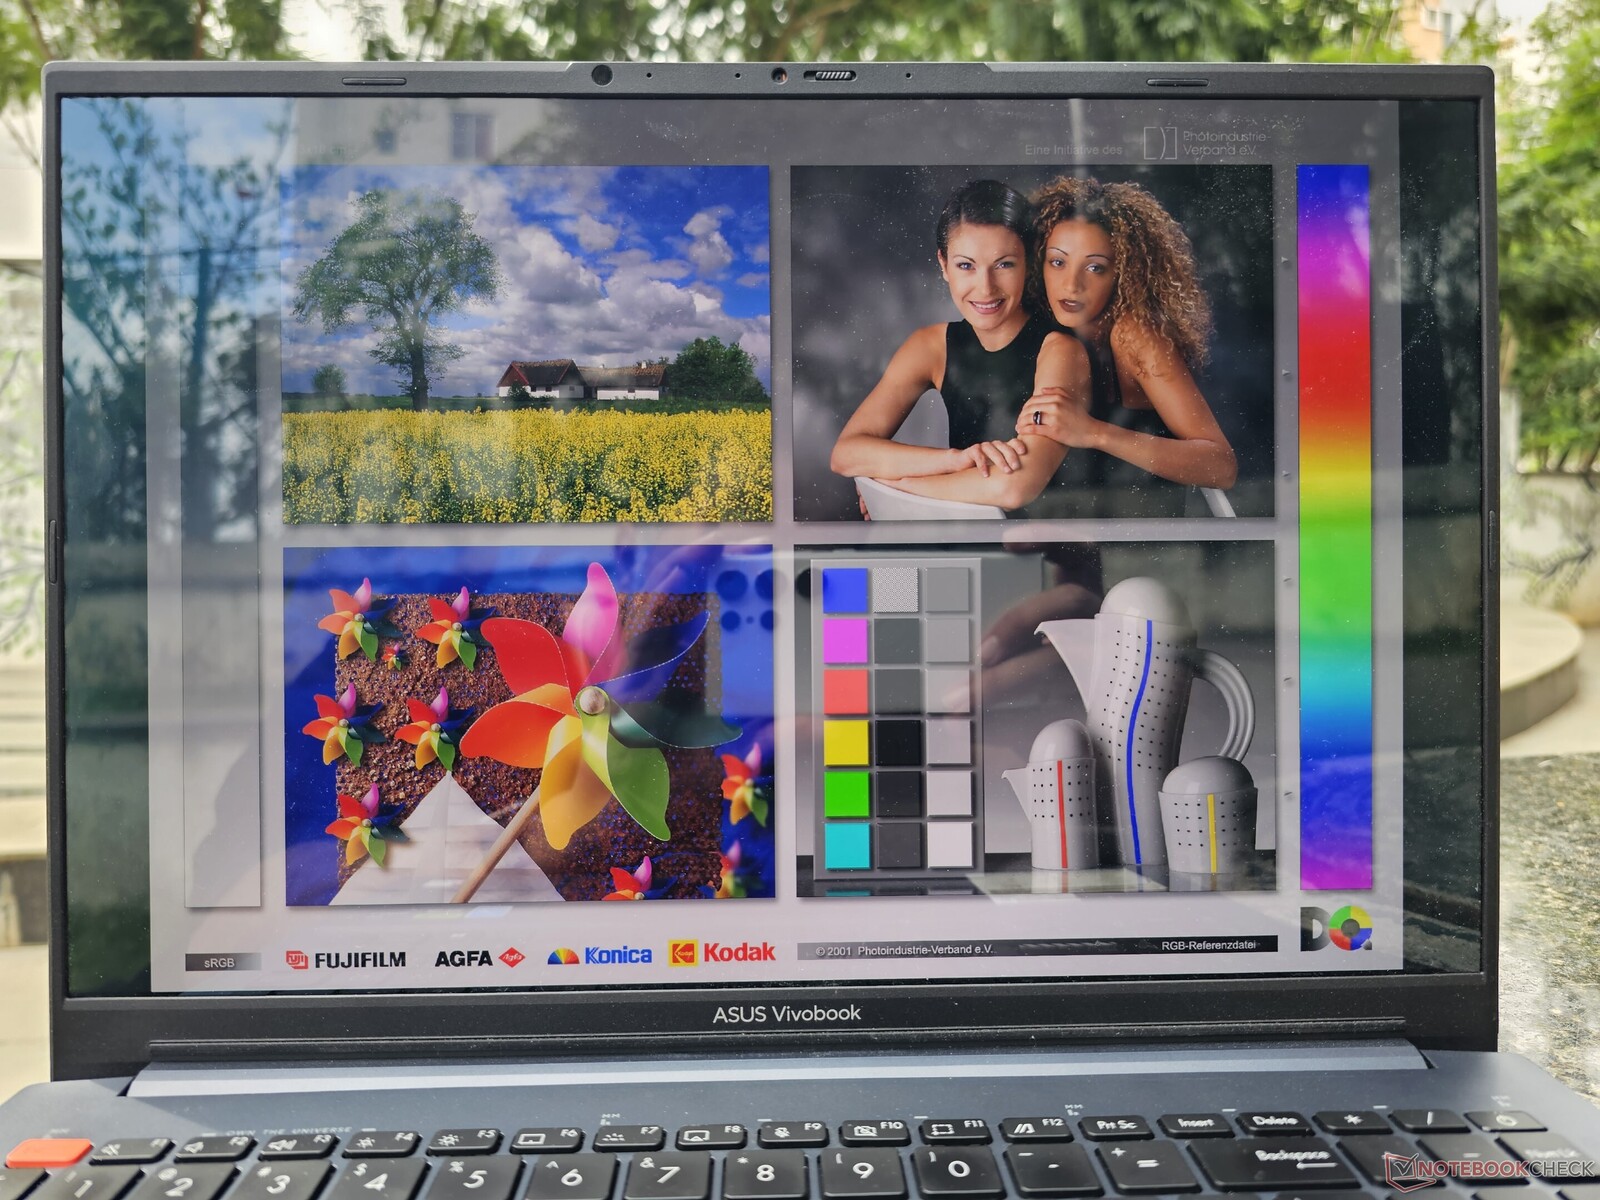
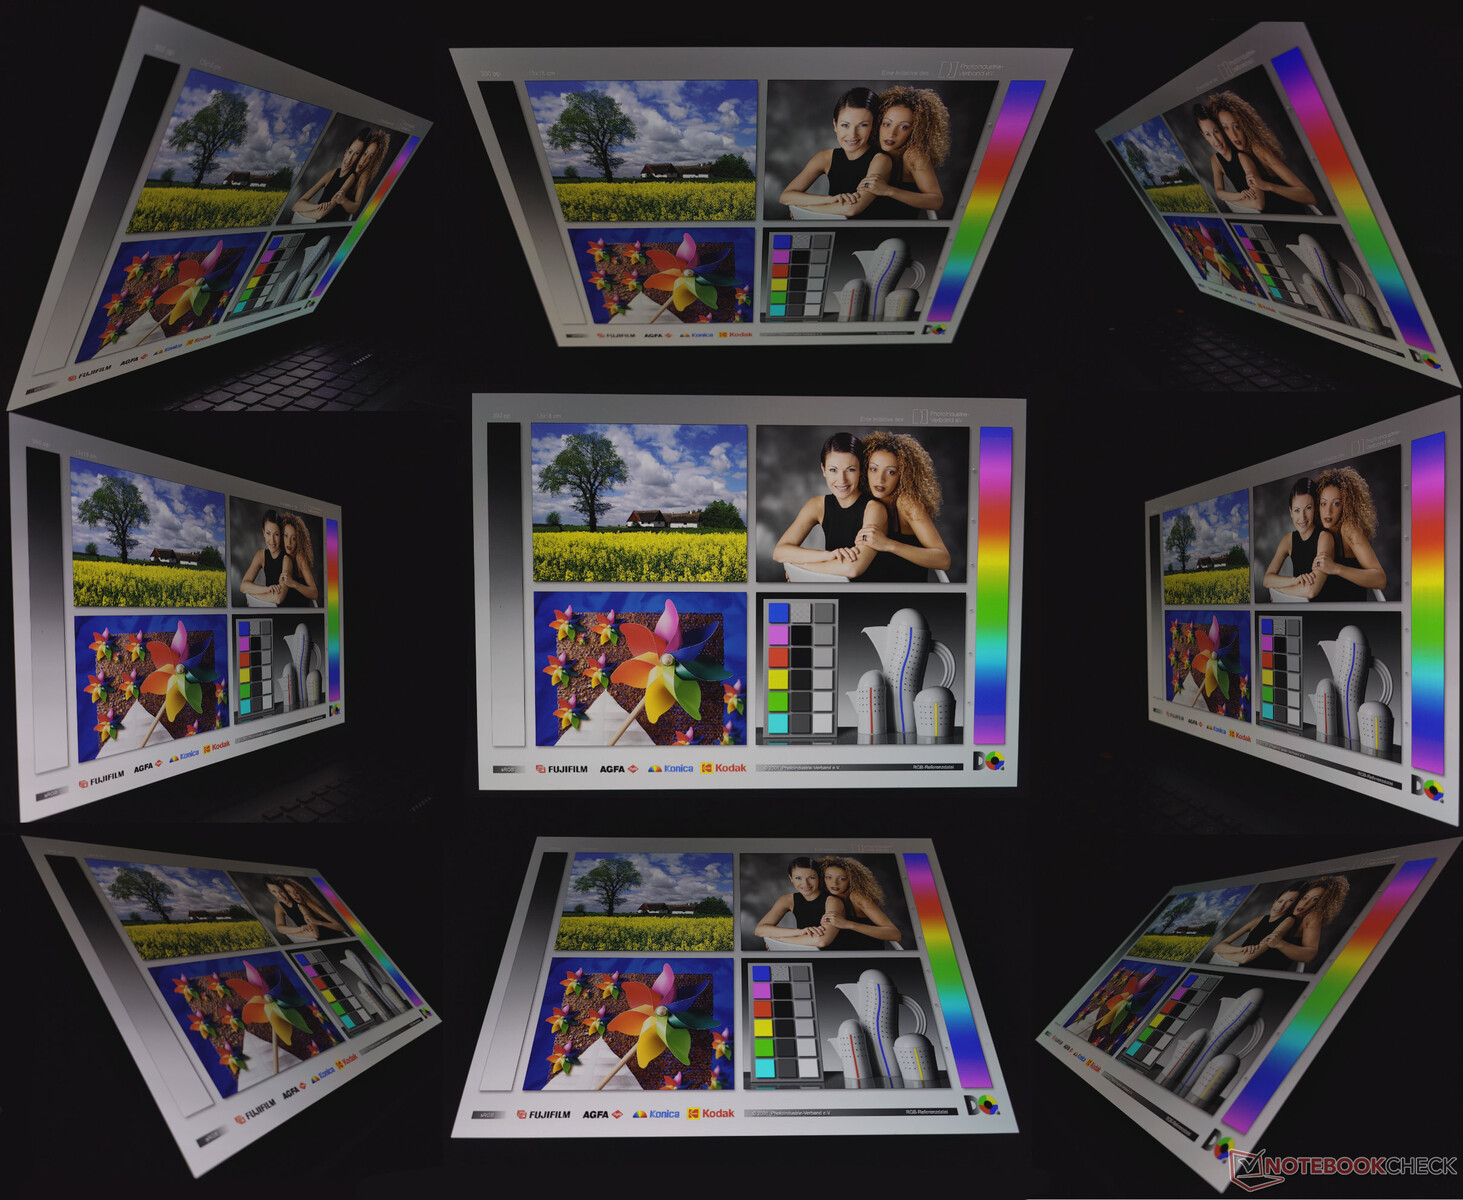
Den glansiga skärmen gör det besvärligt att titta utomhus i direkt solljus. Betraktningsvinklarna är stabila, men vi observerar en viss gröntoning i extrema vinklar, vilket är vanligt med OLED-skärmar.
Prestanda: Core i9-13900H och RTX 4050-kombinationen utnyttjas inte till sin fulla potential
Asus erbjuder VivoBook Pro 16 K6602VU i Intel 13:e generationens Core i5-13500H och Core i9-13900H alternativ, båda med Nvidia GeForce RTX 4050 grafik. Det finns även en VivoBook Pro 16 K6602HC tillgänglig med den äldre Core i9-11900H, RTX 3050 GPU för bärbar datoroch en FHD+ 120 Hz-skärm.
Villkor för testning
Prestandainställningarna upprepas i både MyAsus och ProArt Creator Hub-apparna. Vi använde prestandaläget med MUX växlad till den diskreta RTX 4050 GPU för alla riktmärken. Batteritesterna kördes med inställningen Whisper i MSHybrid-läget.
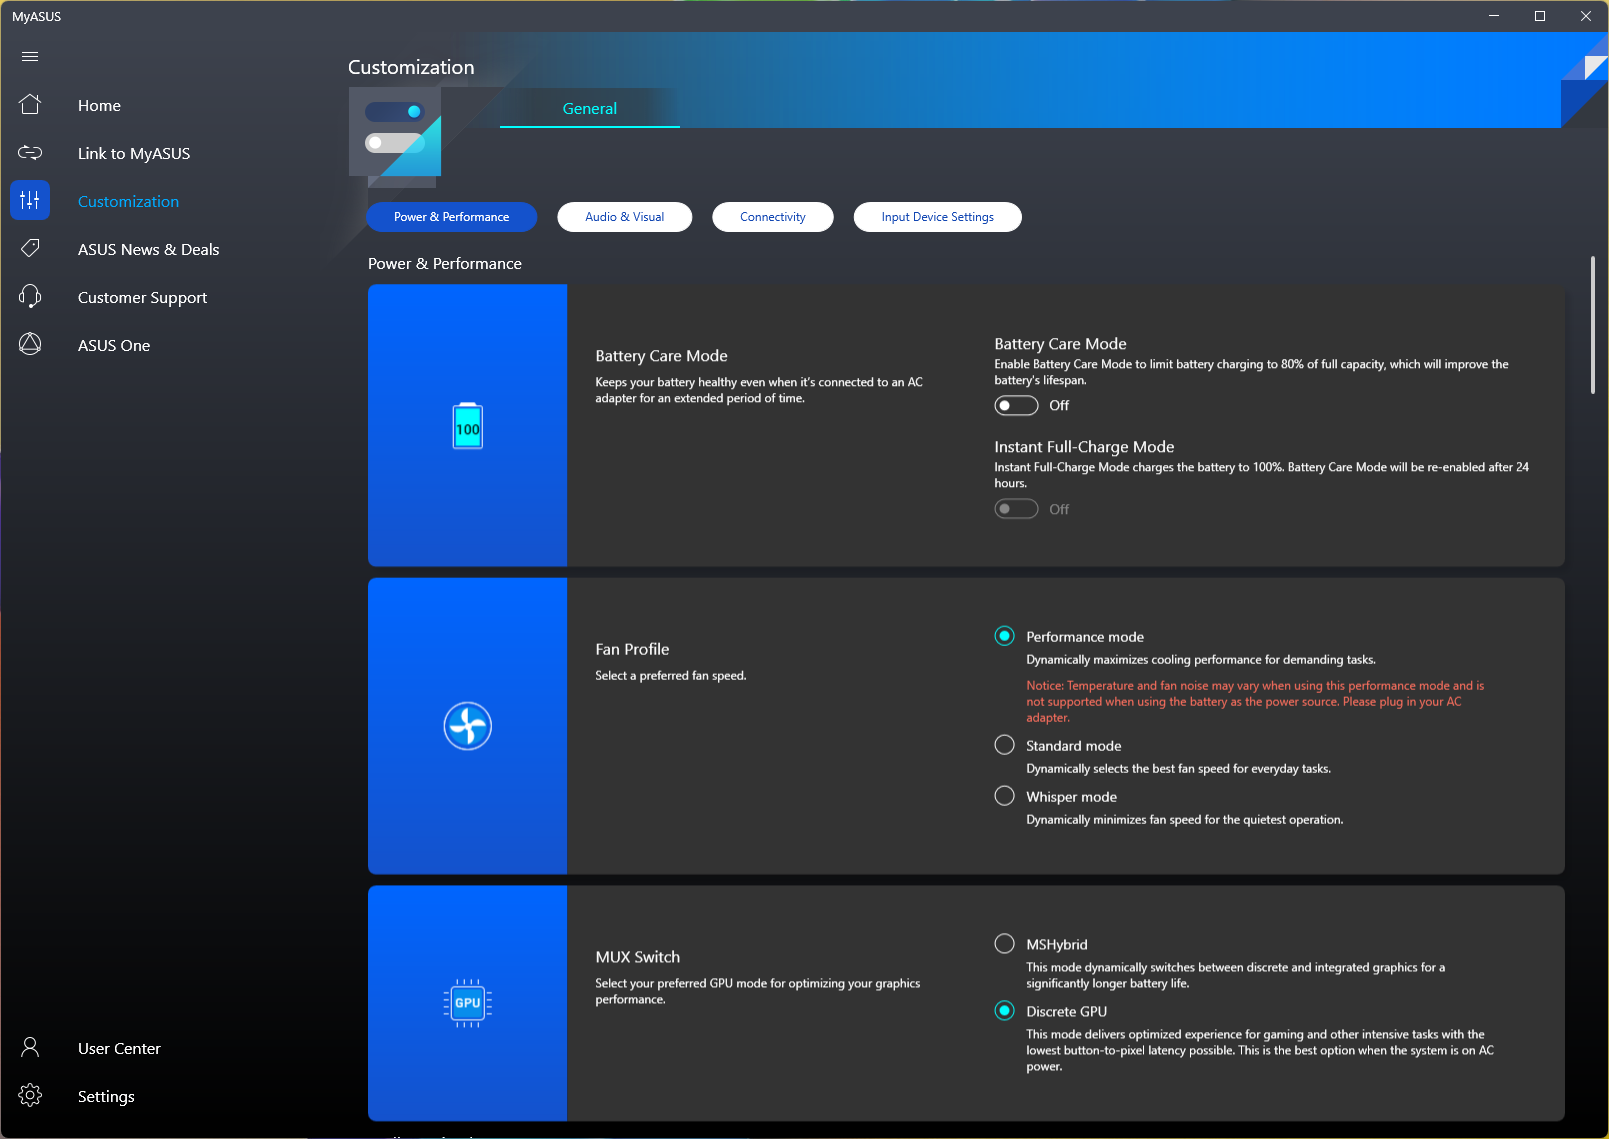
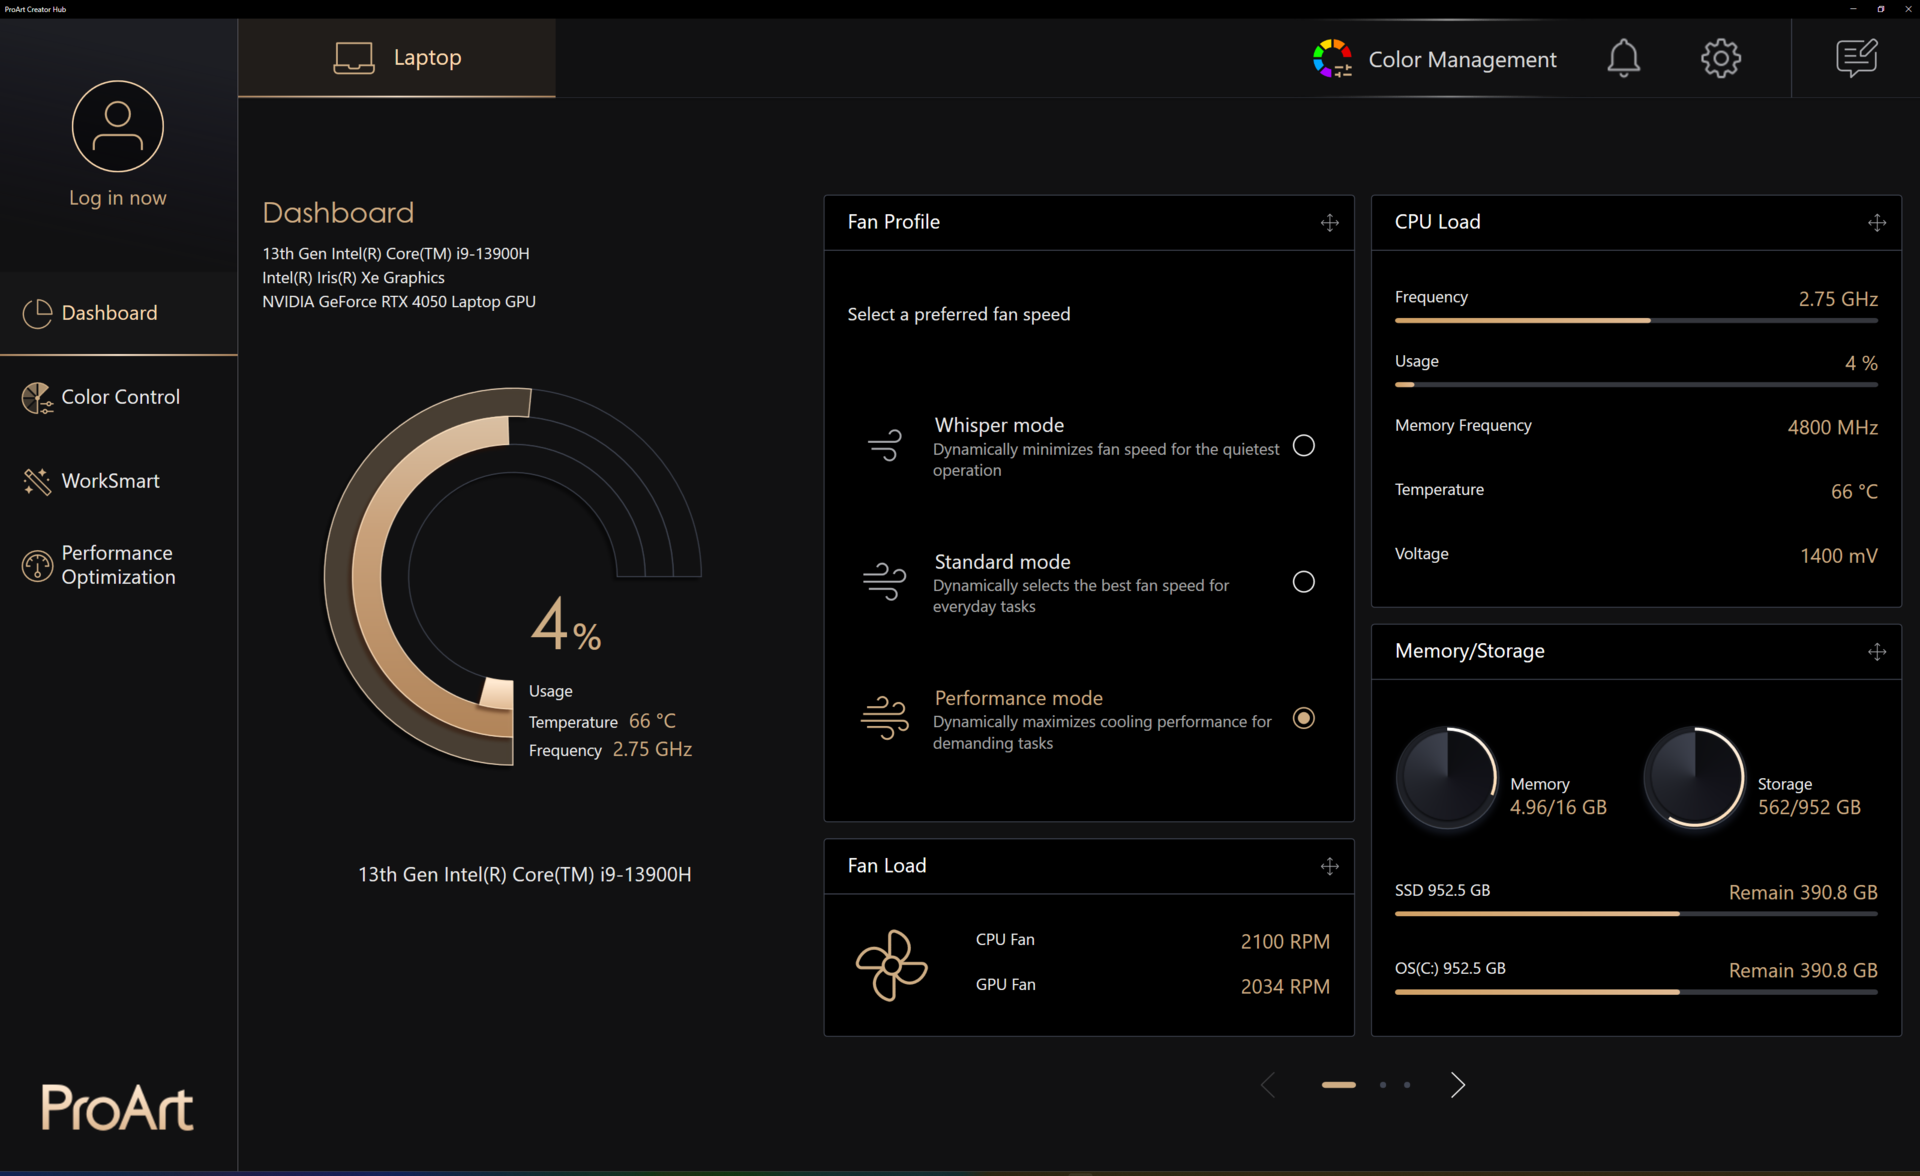
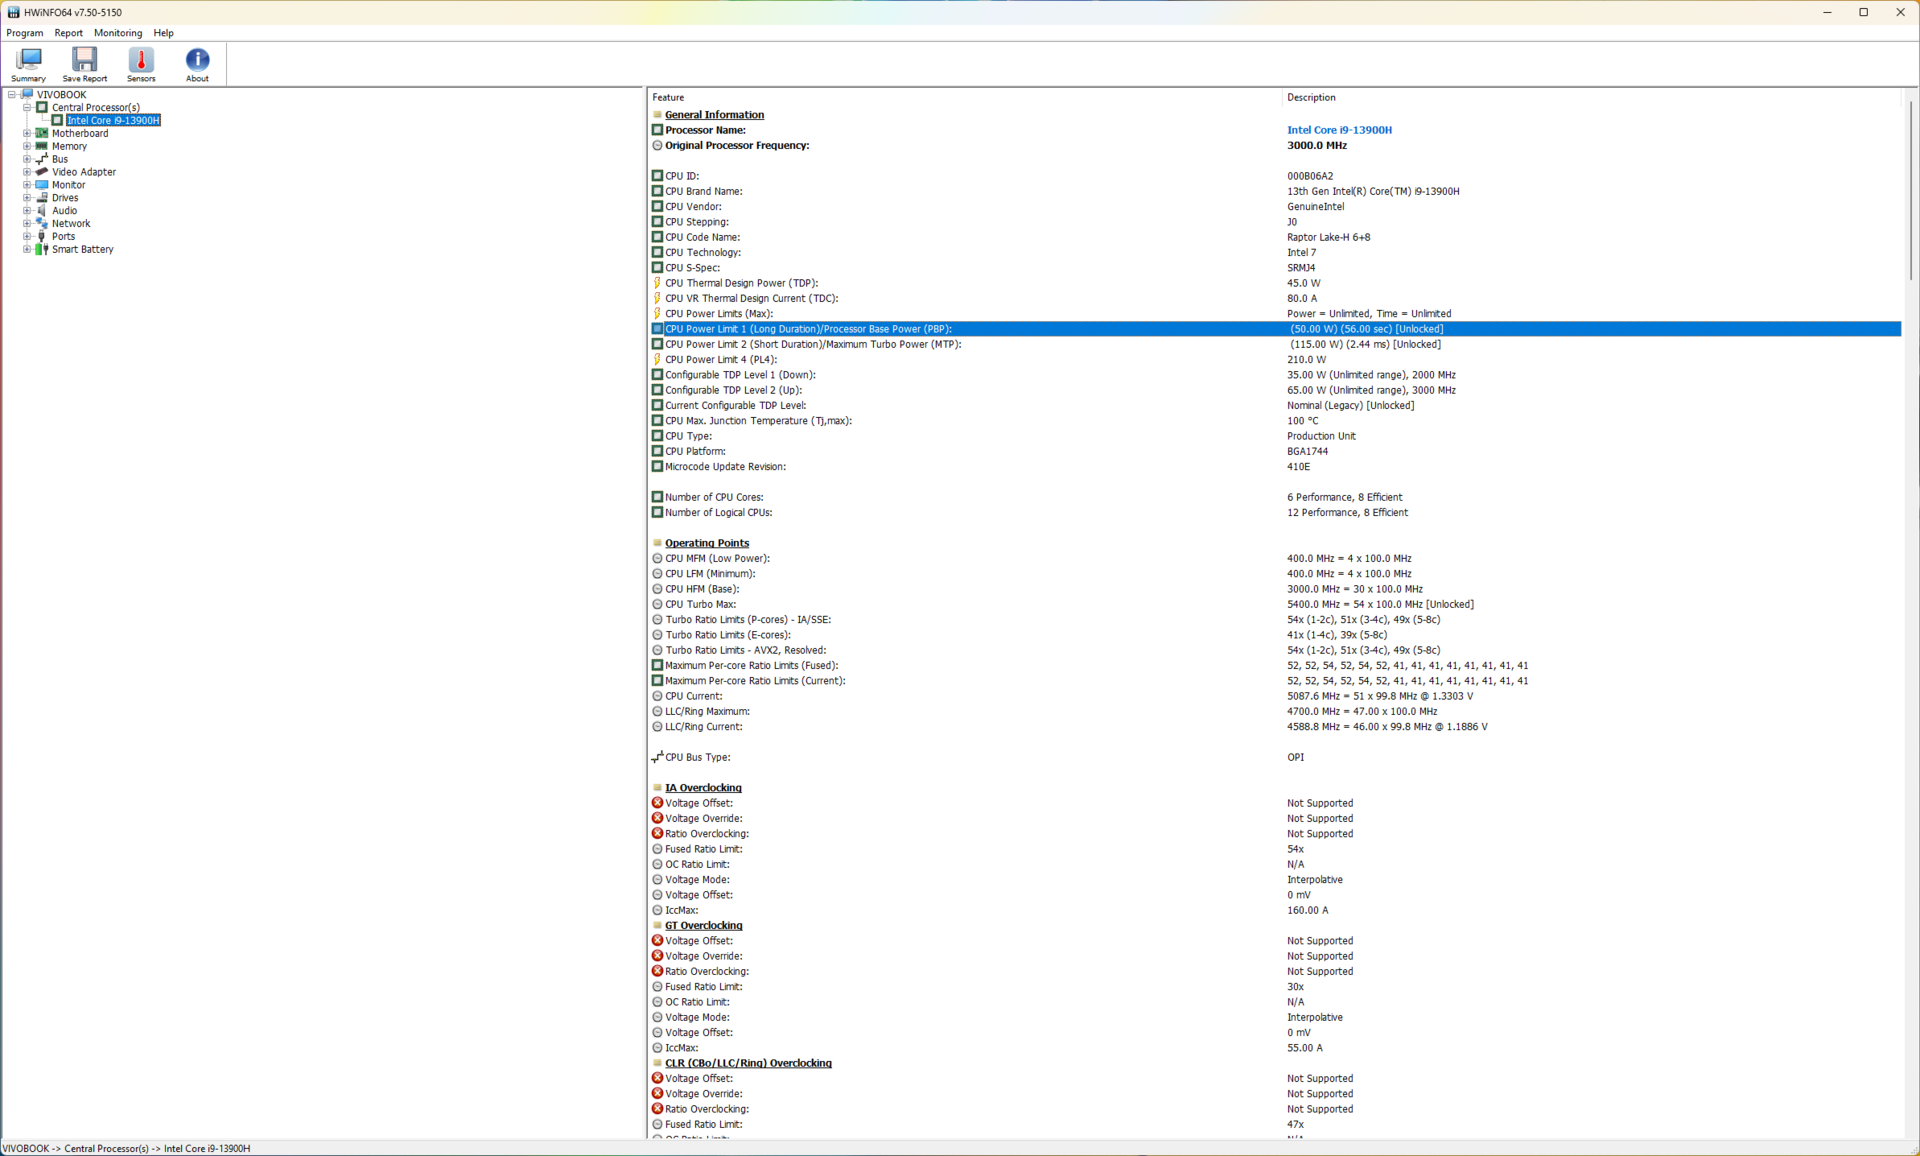
Effektgränserna är desamma i både standard- och prestandaläget. Det senare ger dock bättre prestanda under längre tid tack vare bättre kylning.
| Prestandaläge | PL1 (PBP) / Tau | PL2 (MTP) / Tau | Cinebench R15 Multi score | Cinebench R15 Multi score (30 loopar) |
|---|---|---|---|---|
| Whisper | 25 W / 56 s | 115 W / 2,44 ms | 1584 (-36%) | 766 (-63%) |
| Standard | 50 W / 56 s | 115 W / 2,44 ms | 2445 (-1,1%) | 1748 (-16%) |
| Prestanda | 50 W / 56 s | 115 W / 2,44 ms | 2473 (100%) | 2084 (100%) |
Processor
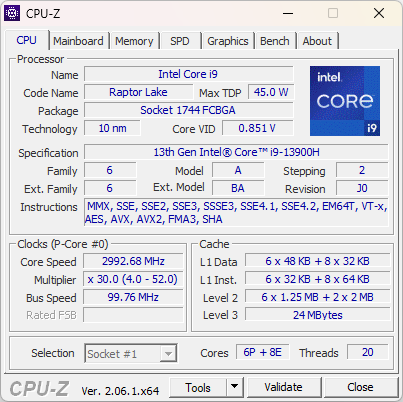
Intel Core i9-13900H är en 14-kärnig processor med 20 trådar, sex P-kärnor, åtta E-kärnor och en maximal enkelkärnig boost på 5,4 GHz. Detta är dock inte den snabbaste Core i9-13900H vi har sett.
Den övergripande CPU-prestandan är bara en aning bättre än förra generationens VivoBook Pro 16 Core i7-12700Hoch släpar även efter Ryzen 5 7645HX i Lenovo Legion Pro 5 med 6%. Den begränsade kraftbudgeten i vår testenhet hindrar Core i9-13900H:s prestanda jämfört med bärbara datorer som t.ex Gigabyte Aero 16 OLED och Asus ROG Flow X16 med samma processor.
Prestandan är ingen match för Core i9-13980HX som finns i VivoBook Pro 16X, som leder med en massiv 46% marginal kumulativt.
Med detta sagt verkar VivoBook Pro 16:s kylning göra ett bra jobb, vilket framgår av den ganska konsekventa Cinebench R15 multi-core loop-grafen.
Cinebench R15 Multi Loop
Cinebench R23: Multi Core | Single Core
Cinebench R20: CPU (Multi Core) | CPU (Single Core)
Cinebench R15: CPU Multi 64Bit | CPU Single 64Bit
Blender: v2.79 BMW27 CPU
7-Zip 18.03: 7z b 4 | 7z b 4 -mmt1
Geekbench 5.5: Multi-Core | Single-Core
HWBOT x265 Benchmark v2.2: 4k Preset
LibreOffice : 20 Documents To PDF
R Benchmark 2.5: Overall mean
| CPU Performance rating | |
| Asus Vivobook Pro 16X K6604JV-MX016W | |
| Asus ROG Flow X16 GV601V | |
| Asus TUF Gaming A16 FA617XS | |
| Genomsnitt Intel Core i9-13900H | |
| Gigabyte AERO 16 OLED BSF | |
| Genomsnitt av klass Multimedia | |
| Lenovo Legion Pro 5 16ARX8 (R5 7645HX, RTX 4050) | |
| Asus VivoBook Pro 16 K6602VU | |
| Asus VivoBook Pro 16 | |
| Cinebench R23 / Multi Core | |
| Asus Vivobook Pro 16X K6604JV-MX016W | |
| Asus ROG Flow X16 GV601V | |
| Gigabyte AERO 16 OLED BSF | |
| Asus TUF Gaming A16 FA617XS | |
| Genomsnitt Intel Core i9-13900H (11997 - 20385, n=28) | |
| Genomsnitt av klass Multimedia (4861 - 33362, n=81, senaste 2 åren) | |
| Asus VivoBook Pro 16 K6602VU | |
| Asus VivoBook Pro 16 | |
| Lenovo Legion Pro 5 16ARX8 (R5 7645HX, RTX 4050) | |
| Cinebench R23 / Single Core | |
| Asus ROG Flow X16 GV601V | |
| Genomsnitt av klass Multimedia (1128 - 2459, n=73, senaste 2 åren) | |
| Genomsnitt Intel Core i9-13900H (1297 - 2054, n=26) | |
| Asus Vivobook Pro 16X K6604JV-MX016W | |
| Lenovo Legion Pro 5 16ARX8 (R5 7645HX, RTX 4050) | |
| Asus TUF Gaming A16 FA617XS | |
| Asus VivoBook Pro 16 K6602VU | |
| Asus VivoBook Pro 16 | |
| Gigabyte AERO 16 OLED BSF | |
| Cinebench R20 / CPU (Multi Core) | |
| Asus Vivobook Pro 16X K6604JV-MX016W | |
| Asus ROG Flow X16 GV601V | |
| Gigabyte AERO 16 OLED BSF | |
| Asus TUF Gaming A16 FA617XS | |
| Genomsnitt Intel Core i9-13900H (4935 - 7716, n=25) | |
| Genomsnitt av klass Multimedia (1887 - 12912, n=64, senaste 2 åren) | |
| Asus VivoBook Pro 16 K6602VU | |
| Asus VivoBook Pro 16 | |
| Lenovo Legion Pro 5 16ARX8 (R5 7645HX, RTX 4050) | |
| Cinebench R20 / CPU (Single Core) | |
| Asus ROG Flow X16 GV601V | |
| Genomsnitt av klass Multimedia (425 - 853, n=64, senaste 2 åren) | |
| Genomsnitt Intel Core i9-13900H (428 - 792, n=25) | |
| Asus Vivobook Pro 16X K6604JV-MX016W | |
| Asus TUF Gaming A16 FA617XS | |
| Lenovo Legion Pro 5 16ARX8 (R5 7645HX, RTX 4050) | |
| Asus VivoBook Pro 16 K6602VU | |
| Asus VivoBook Pro 16 | |
| Gigabyte AERO 16 OLED BSF | |
| Cinebench R15 / CPU Multi 64Bit | |
| Asus Vivobook Pro 16X K6604JV-MX016W | |
| Asus ROG Flow X16 GV601V | |
| Gigabyte AERO 16 OLED BSF | |
| Genomsnitt Intel Core i9-13900H (2061 - 3100, n=26) | |
| Asus TUF Gaming A16 FA617XS | |
| Genomsnitt av klass Multimedia (856 - 5224, n=68, senaste 2 åren) | |
| Asus VivoBook Pro 16 K6602VU | |
| Asus VivoBook Pro 16 | |
| Lenovo Legion Pro 5 16ARX8 (R5 7645HX, RTX 4050) | |
| Cinebench R15 / CPU Single 64Bit | |
| Lenovo Legion Pro 5 16ARX8 (R5 7645HX, RTX 4050) | |
| Asus Vivobook Pro 16X K6604JV-MX016W | |
| Asus ROG Flow X16 GV601V | |
| Asus TUF Gaming A16 FA617XS | |
| Genomsnitt av klass Multimedia (184.8 - 326, n=66, senaste 2 åren) | |
| Genomsnitt Intel Core i9-13900H (211 - 297, n=26) | |
| Asus VivoBook Pro 16 | |
| Asus VivoBook Pro 16 K6602VU | |
| Gigabyte AERO 16 OLED BSF | |
| Blender / v2.79 BMW27 CPU | |
| Genomsnitt av klass Multimedia (100 - 557, n=65, senaste 2 åren) | |
| Asus VivoBook Pro 16 | |
| Lenovo Legion Pro 5 16ARX8 (R5 7645HX, RTX 4050) | |
| Asus VivoBook Pro 16 K6602VU | |
| Genomsnitt Intel Core i9-13900H (166 - 268, n=24) | |
| Asus TUF Gaming A16 FA617XS | |
| Asus ROG Flow X16 GV601V | |
| Gigabyte AERO 16 OLED BSF | |
| Asus Vivobook Pro 16X K6604JV-MX016W | |
| 7-Zip 18.03 / 7z b 4 | |
| Asus Vivobook Pro 16X K6604JV-MX016W | |
| Gigabyte AERO 16 OLED BSF | |
| Asus ROG Flow X16 GV601V | |
| Asus TUF Gaming A16 FA617XS | |
| Genomsnitt Intel Core i9-13900H (45045 - 79032, n=25) | |
| Asus VivoBook Pro 16 K6602VU | |
| Lenovo Legion Pro 5 16ARX8 (R5 7645HX, RTX 4050) | |
| Genomsnitt av klass Multimedia (26062 - 130368, n=62, senaste 2 åren) | |
| Asus VivoBook Pro 16 | |
| 7-Zip 18.03 / 7z b 4 -mmt1 | |
| Lenovo Legion Pro 5 16ARX8 (R5 7645HX, RTX 4050) | |
| Asus Vivobook Pro 16X K6604JV-MX016W | |
| Asus TUF Gaming A16 FA617XS | |
| Asus ROG Flow X16 GV601V | |
| Genomsnitt Intel Core i9-13900H (3665 - 6600, n=25) | |
| Genomsnitt av klass Multimedia (3666 - 7545, n=63, senaste 2 åren) | |
| Asus VivoBook Pro 16 K6602VU | |
| Asus VivoBook Pro 16 | |
| Gigabyte AERO 16 OLED BSF | |
| Geekbench 5.5 / Multi-Core | |
| Asus Vivobook Pro 16X K6604JV-MX016W | |
| Asus ROG Flow X16 GV601V | |
| Gigabyte AERO 16 OLED BSF | |
| Genomsnitt av klass Multimedia (4652 - 20422, n=62, senaste 2 åren) | |
| Genomsnitt Intel Core i9-13900H (9094 - 15410, n=26) | |
| Asus TUF Gaming A16 FA617XS | |
| Asus VivoBook Pro 16 K6602VU | |
| Lenovo Legion Pro 5 16ARX8 (R5 7645HX, RTX 4050) | |
| Asus VivoBook Pro 16 | |
| Geekbench 5.5 / Single-Core | |
| Asus TUF Gaming A16 FA617XS | |
| Asus Vivobook Pro 16X K6604JV-MX016W | |
| Asus ROG Flow X16 GV601V | |
| Lenovo Legion Pro 5 16ARX8 (R5 7645HX, RTX 4050) | |
| Genomsnitt av klass Multimedia (805 - 2974, n=62, senaste 2 åren) | |
| Genomsnitt Intel Core i9-13900H (1140 - 2043, n=26) | |
| Asus VivoBook Pro 16 K6602VU | |
| Gigabyte AERO 16 OLED BSF | |
| Asus VivoBook Pro 16 | |
| HWBOT x265 Benchmark v2.2 / 4k Preset | |
| Asus Vivobook Pro 16X K6604JV-MX016W | |
| Asus ROG Flow X16 GV601V | |
| Gigabyte AERO 16 OLED BSF | |
| Asus TUF Gaming A16 FA617XS | |
| Lenovo Legion Pro 5 16ARX8 (R5 7645HX, RTX 4050) | |
| Genomsnitt Intel Core i9-13900H (14.1 - 22.3, n=25) | |
| Genomsnitt av klass Multimedia (5.26 - 36.1, n=63, senaste 2 åren) | |
| Asus VivoBook Pro 16 K6602VU | |
| Asus VivoBook Pro 16 | |
| LibreOffice / 20 Documents To PDF | |
| Gigabyte AERO 16 OLED BSF | |
| Asus VivoBook Pro 16 K6602VU | |
| Lenovo Legion Pro 5 16ARX8 (R5 7645HX, RTX 4050) | |
| Asus Vivobook Pro 16X K6604JV-MX016W | |
| Genomsnitt av klass Multimedia (23.9 - 146.7, n=64, senaste 2 åren) | |
| Genomsnitt Intel Core i9-13900H (34.4 - 82.8, n=25) | |
| Asus VivoBook Pro 16 | |
| Asus TUF Gaming A16 FA617XS | |
| Asus ROG Flow X16 GV601V | |
| R Benchmark 2.5 / Overall mean | |
| Gigabyte AERO 16 OLED BSF | |
| Asus VivoBook Pro 16 | |
| Asus VivoBook Pro 16 K6602VU | |
| Genomsnitt av klass Multimedia (0.3604 - 0.947, n=63, senaste 2 åren) | |
| Genomsnitt Intel Core i9-13900H (0.4052 - 0.723, n=25) | |
| Lenovo Legion Pro 5 16ARX8 (R5 7645HX, RTX 4050) | |
| Asus TUF Gaming A16 FA617XS | |
| Asus ROG Flow X16 GV601V | |
| Asus Vivobook Pro 16X K6604JV-MX016W | |
* ... mindre är bättre
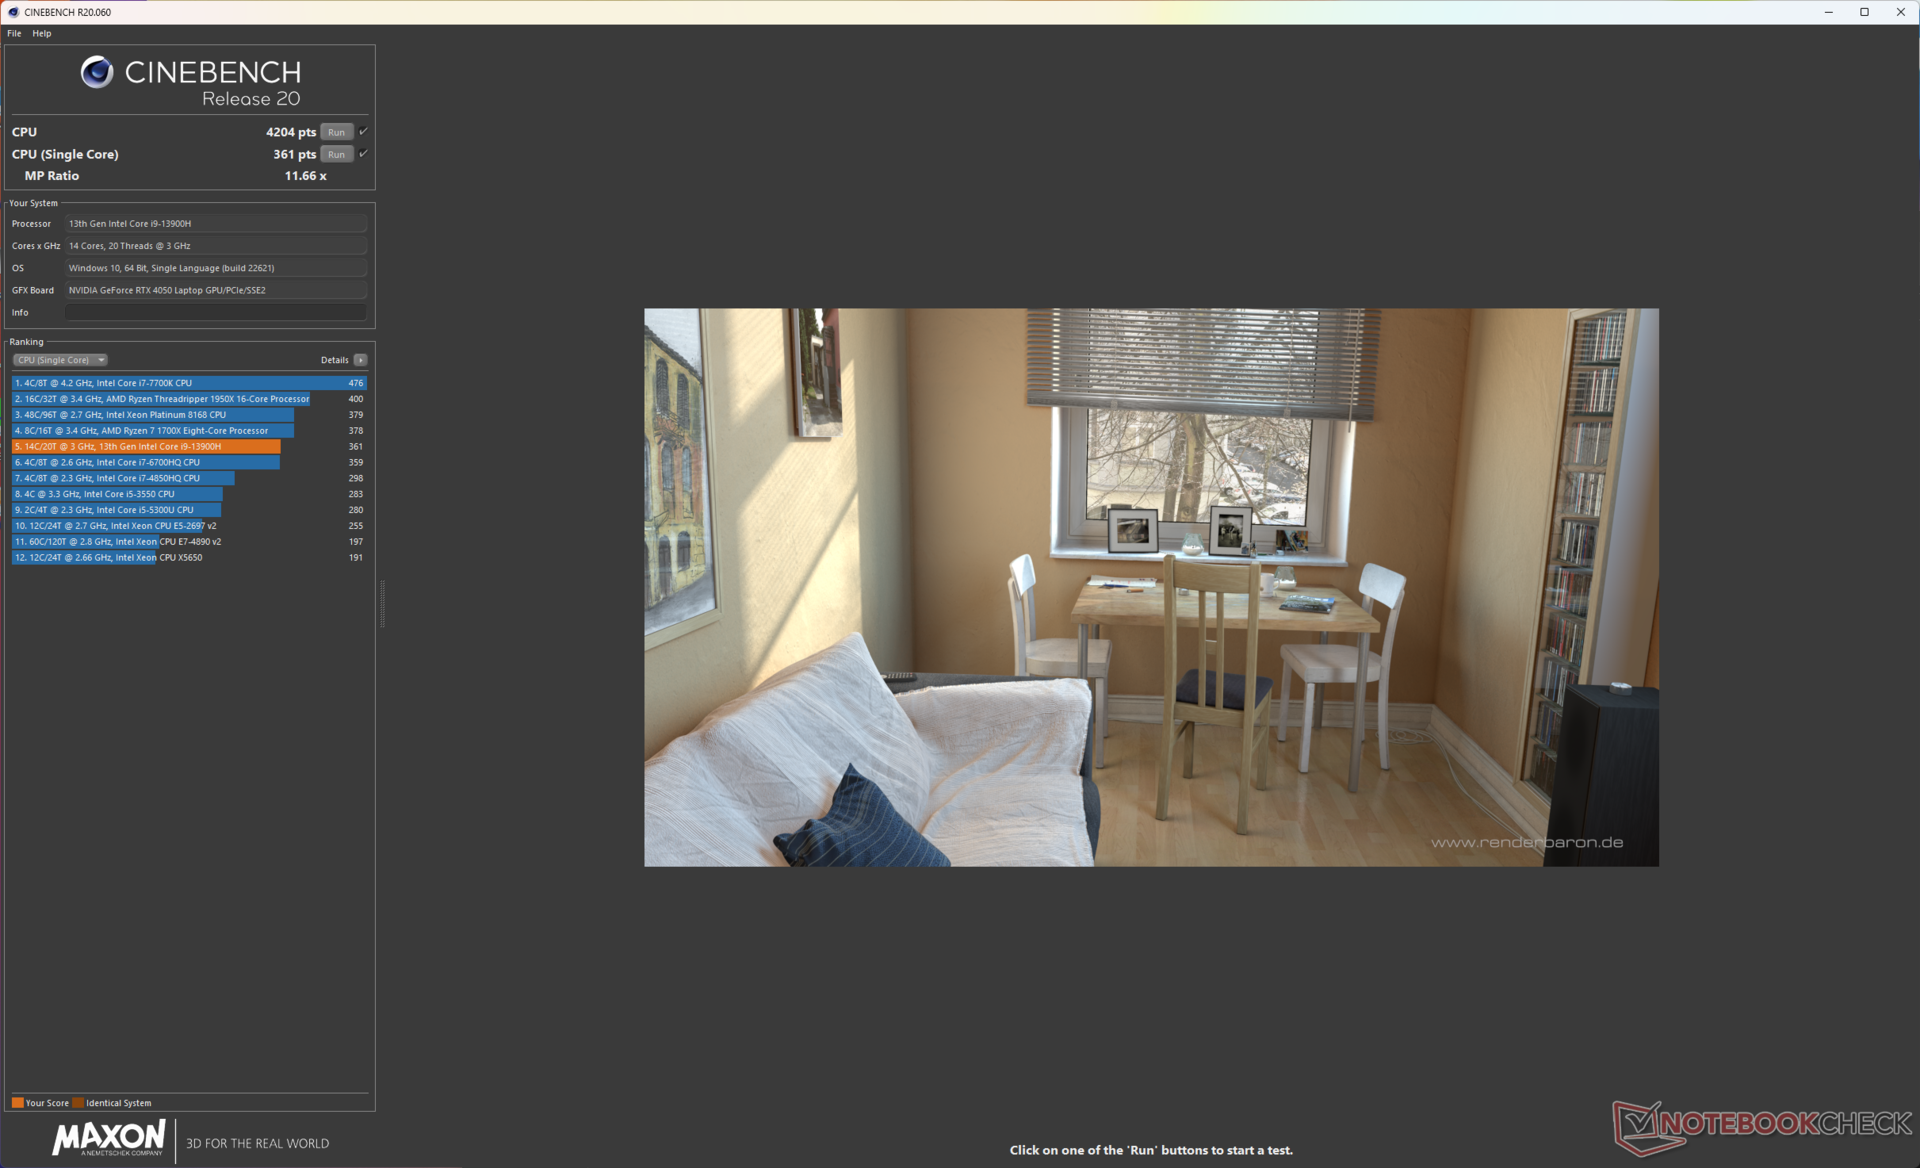
Cinebench R15 flerkärniga tester visar att VivoBook Pro 16 kämpar för att fullt ut utnyttja Core i9-13900H:s 115 W effektgräns, även i Performance-läget. Vi registrerade en maximal CPU-paketeffekt på bara 80 W i Performance, med max boost-klockor som bara nådde 3,6 GHz
Standard-läget är något mer konservativt med en maximal effekt på 76 W och boost-klockor på 3,5 GHz.
I Whisper når VivoBook Pro 16 en maximal effekt på 66,7 W men har en genomsnittlig CPU-paketeffekt på bara cirka 15 W. Detta resulterar i maximala klockfrekvenser på 3,45 GHz som i genomsnitt ligger på bara cirka 1 GHz under körningen.
Prestandan begränsas ytterligare av batteriet, med Cinebench R20-poäng som sjunker med 46,3 % i single-core och med 27 % i multi-core jämfört med AC-ström.
AIDA64: FP32 Ray-Trace | FPU Julia | CPU SHA3 | CPU Queen | FPU SinJulia | FPU Mandel | CPU AES | CPU ZLib | FP64 Ray-Trace | CPU PhotoWorxx
| Performance rating | |
| Asus TUF Gaming A16 FA617XS | |
| Asus Vivobook Pro 16X K6604JV-MX016W | |
| Gigabyte AERO 16 OLED BSF | |
| Asus ROG Flow X16 GV601V | |
| Lenovo Legion Pro 5 16ARX8 (R5 7645HX, RTX 4050) | |
| Genomsnitt av klass Multimedia | |
| Genomsnitt Intel Core i9-13900H | |
| Asus VivoBook Pro 16 K6602VU | |
| Asus VivoBook Pro 16 | |
| AIDA64 / FP32 Ray-Trace | |
| Asus TUF Gaming A16 FA617XS | |
| Lenovo Legion Pro 5 16ARX8 (R5 7645HX, RTX 4050) | |
| Asus Vivobook Pro 16X K6604JV-MX016W | |
| Gigabyte AERO 16 OLED BSF | |
| Genomsnitt av klass Multimedia (2214 - 50388, n=60, senaste 2 åren) | |
| Genomsnitt Intel Core i9-13900H (6788 - 19557, n=25) | |
| Asus VivoBook Pro 16 | |
| Asus VivoBook Pro 16 K6602VU | |
| Asus ROG Flow X16 GV601V | |
| AIDA64 / FPU Julia | |
| Asus TUF Gaming A16 FA617XS | |
| Asus Vivobook Pro 16X K6604JV-MX016W | |
| Lenovo Legion Pro 5 16ARX8 (R5 7645HX, RTX 4050) | |
| Gigabyte AERO 16 OLED BSF | |
| Asus ROG Flow X16 GV601V | |
| Genomsnitt av klass Multimedia (12867 - 201874, n=61, senaste 2 åren) | |
| Genomsnitt Intel Core i9-13900H (22551 - 95579, n=25) | |
| Asus VivoBook Pro 16 | |
| Asus VivoBook Pro 16 K6602VU | |
| AIDA64 / CPU SHA3 | |
| Asus Vivobook Pro 16X K6604JV-MX016W | |
| Asus TUF Gaming A16 FA617XS | |
| Asus ROG Flow X16 GV601V | |
| Gigabyte AERO 16 OLED BSF | |
| Genomsnitt av klass Multimedia (626 - 8623, n=61, senaste 2 åren) | |
| Lenovo Legion Pro 5 16ARX8 (R5 7645HX, RTX 4050) | |
| Genomsnitt Intel Core i9-13900H (2491 - 4270, n=25) | |
| Asus VivoBook Pro 16 | |
| Asus VivoBook Pro 16 K6602VU | |
| AIDA64 / CPU Queen | |
| Asus Vivobook Pro 16X K6604JV-MX016W | |
| Asus TUF Gaming A16 FA617XS | |
| Asus ROG Flow X16 GV601V | |
| Genomsnitt Intel Core i9-13900H (65121 - 120936, n=25) | |
| Asus VivoBook Pro 16 | |
| Lenovo Legion Pro 5 16ARX8 (R5 7645HX, RTX 4050) | |
| Gigabyte AERO 16 OLED BSF | |
| Asus VivoBook Pro 16 K6602VU | |
| Genomsnitt av klass Multimedia (13483 - 181505, n=48, senaste 2 åren) | |
| AIDA64 / FPU SinJulia | |
| Asus TUF Gaming A16 FA617XS | |
| Asus Vivobook Pro 16X K6604JV-MX016W | |
| Lenovo Legion Pro 5 16ARX8 (R5 7645HX, RTX 4050) | |
| Asus ROG Flow X16 GV601V | |
| Gigabyte AERO 16 OLED BSF | |
| Genomsnitt Intel Core i9-13900H (6108 - 11631, n=25) | |
| Genomsnitt av klass Multimedia (886 - 28794, n=61, senaste 2 åren) | |
| Asus VivoBook Pro 16 | |
| Asus VivoBook Pro 16 K6602VU | |
| AIDA64 / FPU Mandel | |
| Asus TUF Gaming A16 FA617XS | |
| Asus Vivobook Pro 16X K6604JV-MX016W | |
| Lenovo Legion Pro 5 16ARX8 (R5 7645HX, RTX 4050) | |
| Gigabyte AERO 16 OLED BSF | |
| Asus ROG Flow X16 GV601V | |
| Genomsnitt av klass Multimedia (6395 - 105740, n=60, senaste 2 åren) | |
| Genomsnitt Intel Core i9-13900H (11283 - 48474, n=25) | |
| Asus VivoBook Pro 16 | |
| Asus VivoBook Pro 16 K6602VU | |
| AIDA64 / CPU AES | |
| Gigabyte AERO 16 OLED BSF | |
| Asus VivoBook Pro 16 K6602VU | |
| Asus Vivobook Pro 16X K6604JV-MX016W | |
| Genomsnitt Intel Core i9-13900H (3691 - 149377, n=25) | |
| Asus TUF Gaming A16 FA617XS | |
| Asus ROG Flow X16 GV601V | |
| Genomsnitt av klass Multimedia (8171 - 126790, n=61, senaste 2 åren) | |
| Asus VivoBook Pro 16 | |
| Lenovo Legion Pro 5 16ARX8 (R5 7645HX, RTX 4050) | |
| AIDA64 / CPU ZLib | |
| Asus Vivobook Pro 16X K6604JV-MX016W | |
| Asus ROG Flow X16 GV601V | |
| Gigabyte AERO 16 OLED BSF | |
| Asus TUF Gaming A16 FA617XS | |
| Genomsnitt Intel Core i9-13900H (789 - 1254, n=25) | |
| Genomsnitt av klass Multimedia (143.8 - 2022, n=61, senaste 2 åren) | |
| Asus VivoBook Pro 16 K6602VU | |
| Asus VivoBook Pro 16 | |
| Lenovo Legion Pro 5 16ARX8 (R5 7645HX, RTX 4050) | |
| AIDA64 / FP64 Ray-Trace | |
| Asus TUF Gaming A16 FA617XS | |
| Lenovo Legion Pro 5 16ARX8 (R5 7645HX, RTX 4050) | |
| Asus Vivobook Pro 16X K6604JV-MX016W | |
| Gigabyte AERO 16 OLED BSF | |
| Asus ROG Flow X16 GV601V | |
| Genomsnitt av klass Multimedia (1014 - 26875, n=61, senaste 2 åren) | |
| Genomsnitt Intel Core i9-13900H (3655 - 10716, n=25) | |
| Asus VivoBook Pro 16 | |
| Asus VivoBook Pro 16 K6602VU | |
| AIDA64 / CPU PhotoWorxx | |
| Genomsnitt av klass Multimedia (8187 - 88154, n=61, senaste 2 åren) | |
| Gigabyte AERO 16 OLED BSF | |
| Asus Vivobook Pro 16X K6604JV-MX016W | |
| Genomsnitt Intel Core i9-13900H (10871 - 50488, n=25) | |
| Asus VivoBook Pro 16 K6602VU | |
| Asus ROG Flow X16 GV601V | |
| Asus TUF Gaming A16 FA617XS | |
| Lenovo Legion Pro 5 16ARX8 (R5 7645HX, RTX 4050) | |
| Asus VivoBook Pro 16 | |
Vår dedikerade Intel Core i9-13900H sida innehåller mer information och benchmark-jämförelser.
Systemets prestanda
En liknande trend syns även i PCMark 10 och CrossMark-testerna. Den Core i9-13980HX-vivoBook Pro 16X är nästan lika bra som vår testmodell i PCMark 10-resultat och uppnår 19% i kombinerade CrossMark-tester.
Med detta sagt fann vi inget anmärkningsvärt i den dagliga användningen för de vanliga produktivitets-, multimedia- eller webbsökningsuppgifterna.
CrossMark: Overall | Productivity | Creativity | Responsiveness
AIDA64: Memory Copy | Memory Read | Memory Write | Memory Latency
| PCMark 10 / Score | |
| Lenovo Legion Pro 5 16ARX8 (R5 7645HX, RTX 4050) | |
| Gigabyte AERO 16 OLED BSF | |
| Asus TUF Gaming A16 FA617XS | |
| Asus ROG Flow X16 GV601V | |
| Genomsnitt av klass Multimedia (4325 - 10386, n=58, senaste 2 åren) | |
| Asus VivoBook Pro 16 K6602VU | |
| Genomsnitt Intel Core i9-13900H, NVIDIA GeForce RTX 4050 Laptop GPU (n=1) | |
| Asus Vivobook Pro 16X K6604JV-MX016W | |
| Asus VivoBook Pro 16 | |
| PCMark 10 / Essentials | |
| Lenovo Legion Pro 5 16ARX8 (R5 7645HX, RTX 4050) | |
| Asus ROG Flow X16 GV601V | |
| Gigabyte AERO 16 OLED BSF | |
| Asus TUF Gaming A16 FA617XS | |
| Asus Vivobook Pro 16X K6604JV-MX016W | |
| Genomsnitt av klass Multimedia (8025 - 11664, n=57, senaste 2 åren) | |
| Asus VivoBook Pro 16 K6602VU | |
| Genomsnitt Intel Core i9-13900H, NVIDIA GeForce RTX 4050 Laptop GPU (n=1) | |
| Asus VivoBook Pro 16 | |
| PCMark 10 / Productivity | |
| Genomsnitt av klass Multimedia (7323 - 18233, n=57, senaste 2 åren) | |
| Lenovo Legion Pro 5 16ARX8 (R5 7645HX, RTX 4050) | |
| Asus TUF Gaming A16 FA617XS | |
| Asus ROG Flow X16 GV601V | |
| Gigabyte AERO 16 OLED BSF | |
| Asus Vivobook Pro 16X K6604JV-MX016W | |
| Asus VivoBook Pro 16 | |
| Asus VivoBook Pro 16 K6602VU | |
| Genomsnitt Intel Core i9-13900H, NVIDIA GeForce RTX 4050 Laptop GPU (n=1) | |
| PCMark 10 / Digital Content Creation | |
| Gigabyte AERO 16 OLED BSF | |
| Asus TUF Gaming A16 FA617XS | |
| Asus ROG Flow X16 GV601V | |
| Lenovo Legion Pro 5 16ARX8 (R5 7645HX, RTX 4050) | |
| Asus VivoBook Pro 16 K6602VU | |
| Genomsnitt Intel Core i9-13900H, NVIDIA GeForce RTX 4050 Laptop GPU (n=1) | |
| Genomsnitt av klass Multimedia (3651 - 16240, n=57, senaste 2 åren) | |
| Asus Vivobook Pro 16X K6604JV-MX016W | |
| Asus VivoBook Pro 16 | |
| CrossMark / Overall | |
| Asus Vivobook Pro 16X K6604JV-MX016W | |
| Asus ROG Flow X16 GV601V | |
| Lenovo Legion Pro 5 16ARX8 (R5 7645HX, RTX 4050) | |
| Gigabyte AERO 16 OLED BSF | |
| Genomsnitt av klass Multimedia (866 - 2728, n=67, senaste 2 åren) | |
| Asus TUF Gaming A16 FA617XS | |
| Asus VivoBook Pro 16 K6602VU | |
| Genomsnitt Intel Core i9-13900H, NVIDIA GeForce RTX 4050 Laptop GPU (n=1) | |
| Asus VivoBook Pro 16 | |
| CrossMark / Productivity | |
| Asus Vivobook Pro 16X K6604JV-MX016W | |
| Lenovo Legion Pro 5 16ARX8 (R5 7645HX, RTX 4050) | |
| Asus ROG Flow X16 GV601V | |
| Gigabyte AERO 16 OLED BSF | |
| Genomsnitt av klass Multimedia (931 - 2489, n=67, senaste 2 åren) | |
| Asus TUF Gaming A16 FA617XS | |
| Asus VivoBook Pro 16 | |
| Asus VivoBook Pro 16 K6602VU | |
| Genomsnitt Intel Core i9-13900H, NVIDIA GeForce RTX 4050 Laptop GPU (n=1) | |
| CrossMark / Creativity | |
| Asus Vivobook Pro 16X K6604JV-MX016W | |
| Asus ROG Flow X16 GV601V | |
| Genomsnitt av klass Multimedia (907 - 3465, n=67, senaste 2 åren) | |
| Lenovo Legion Pro 5 16ARX8 (R5 7645HX, RTX 4050) | |
| Asus TUF Gaming A16 FA617XS | |
| Gigabyte AERO 16 OLED BSF | |
| Asus VivoBook Pro 16 K6602VU | |
| Genomsnitt Intel Core i9-13900H, NVIDIA GeForce RTX 4050 Laptop GPU (n=1) | |
| Asus VivoBook Pro 16 | |
| CrossMark / Responsiveness | |
| Gigabyte AERO 16 OLED BSF | |
| Lenovo Legion Pro 5 16ARX8 (R5 7645HX, RTX 4050) | |
| Asus ROG Flow X16 GV601V | |
| Asus VivoBook Pro 16 | |
| Asus Vivobook Pro 16X K6604JV-MX016W | |
| Asus VivoBook Pro 16 K6602VU | |
| Genomsnitt Intel Core i9-13900H, NVIDIA GeForce RTX 4050 Laptop GPU (n=1) | |
| Genomsnitt av klass Multimedia (605 - 2024, n=67, senaste 2 åren) | |
| Asus TUF Gaming A16 FA617XS | |
| AIDA64 / Memory Copy | |
| Genomsnitt av klass Multimedia (11299 - 132135, n=61, senaste 2 åren) | |
| Asus Vivobook Pro 16X K6604JV-MX016W | |
| Gigabyte AERO 16 OLED BSF | |
| Asus ROG Flow X16 GV601V | |
| Asus TUF Gaming A16 FA617XS | |
| Asus VivoBook Pro 16 K6602VU | |
| Genomsnitt Intel Core i9-13900H, NVIDIA GeForce RTX 4050 Laptop GPU (n=1) | |
| Lenovo Legion Pro 5 16ARX8 (R5 7645HX, RTX 4050) | |
| Asus VivoBook Pro 16 | |
| AIDA64 / Memory Read | |
| Genomsnitt av klass Multimedia (11624 - 174586, n=61, senaste 2 åren) | |
| Asus Vivobook Pro 16X K6604JV-MX016W | |
| Gigabyte AERO 16 OLED BSF | |
| Asus ROG Flow X16 GV601V | |
| Asus VivoBook Pro 16 K6602VU | |
| Genomsnitt Intel Core i9-13900H, NVIDIA GeForce RTX 4050 Laptop GPU (n=1) | |
| Asus TUF Gaming A16 FA617XS | |
| Lenovo Legion Pro 5 16ARX8 (R5 7645HX, RTX 4050) | |
| Asus VivoBook Pro 16 | |
| AIDA64 / Memory Write | |
| Genomsnitt av klass Multimedia (11755 - 134998, n=61, senaste 2 åren) | |
| Asus TUF Gaming A16 FA617XS | |
| Gigabyte AERO 16 OLED BSF | |
| Asus Vivobook Pro 16X K6604JV-MX016W | |
| Asus ROG Flow X16 GV601V | |
| Asus VivoBook Pro 16 K6602VU | |
| Genomsnitt Intel Core i9-13900H, NVIDIA GeForce RTX 4050 Laptop GPU (n=1) | |
| Lenovo Legion Pro 5 16ARX8 (R5 7645HX, RTX 4050) | |
| Asus VivoBook Pro 16 | |
| AIDA64 / Memory Latency | |
| Genomsnitt av klass Multimedia (7 - 535, n=60, senaste 2 åren) | |
| Gigabyte AERO 16 OLED BSF | |
| Asus VivoBook Pro 16 K6602VU | |
| Genomsnitt Intel Core i9-13900H, NVIDIA GeForce RTX 4050 Laptop GPU (n=1) | |
| Asus ROG Flow X16 GV601V | |
| Asus VivoBook Pro 16 | |
| Asus TUF Gaming A16 FA617XS | |
| Asus Vivobook Pro 16X K6604JV-MX016W | |
| Lenovo Legion Pro 5 16ARX8 (R5 7645HX, RTX 4050) | |
* ... mindre är bättre
| PCMark 8 Home Score Accelerated v2 | 4484 poäng | |
| PCMark 8 Work Score Accelerated v2 | 5200 poäng | |
| PCMark 10 Score | 7054 poäng | |
Hjälp | ||
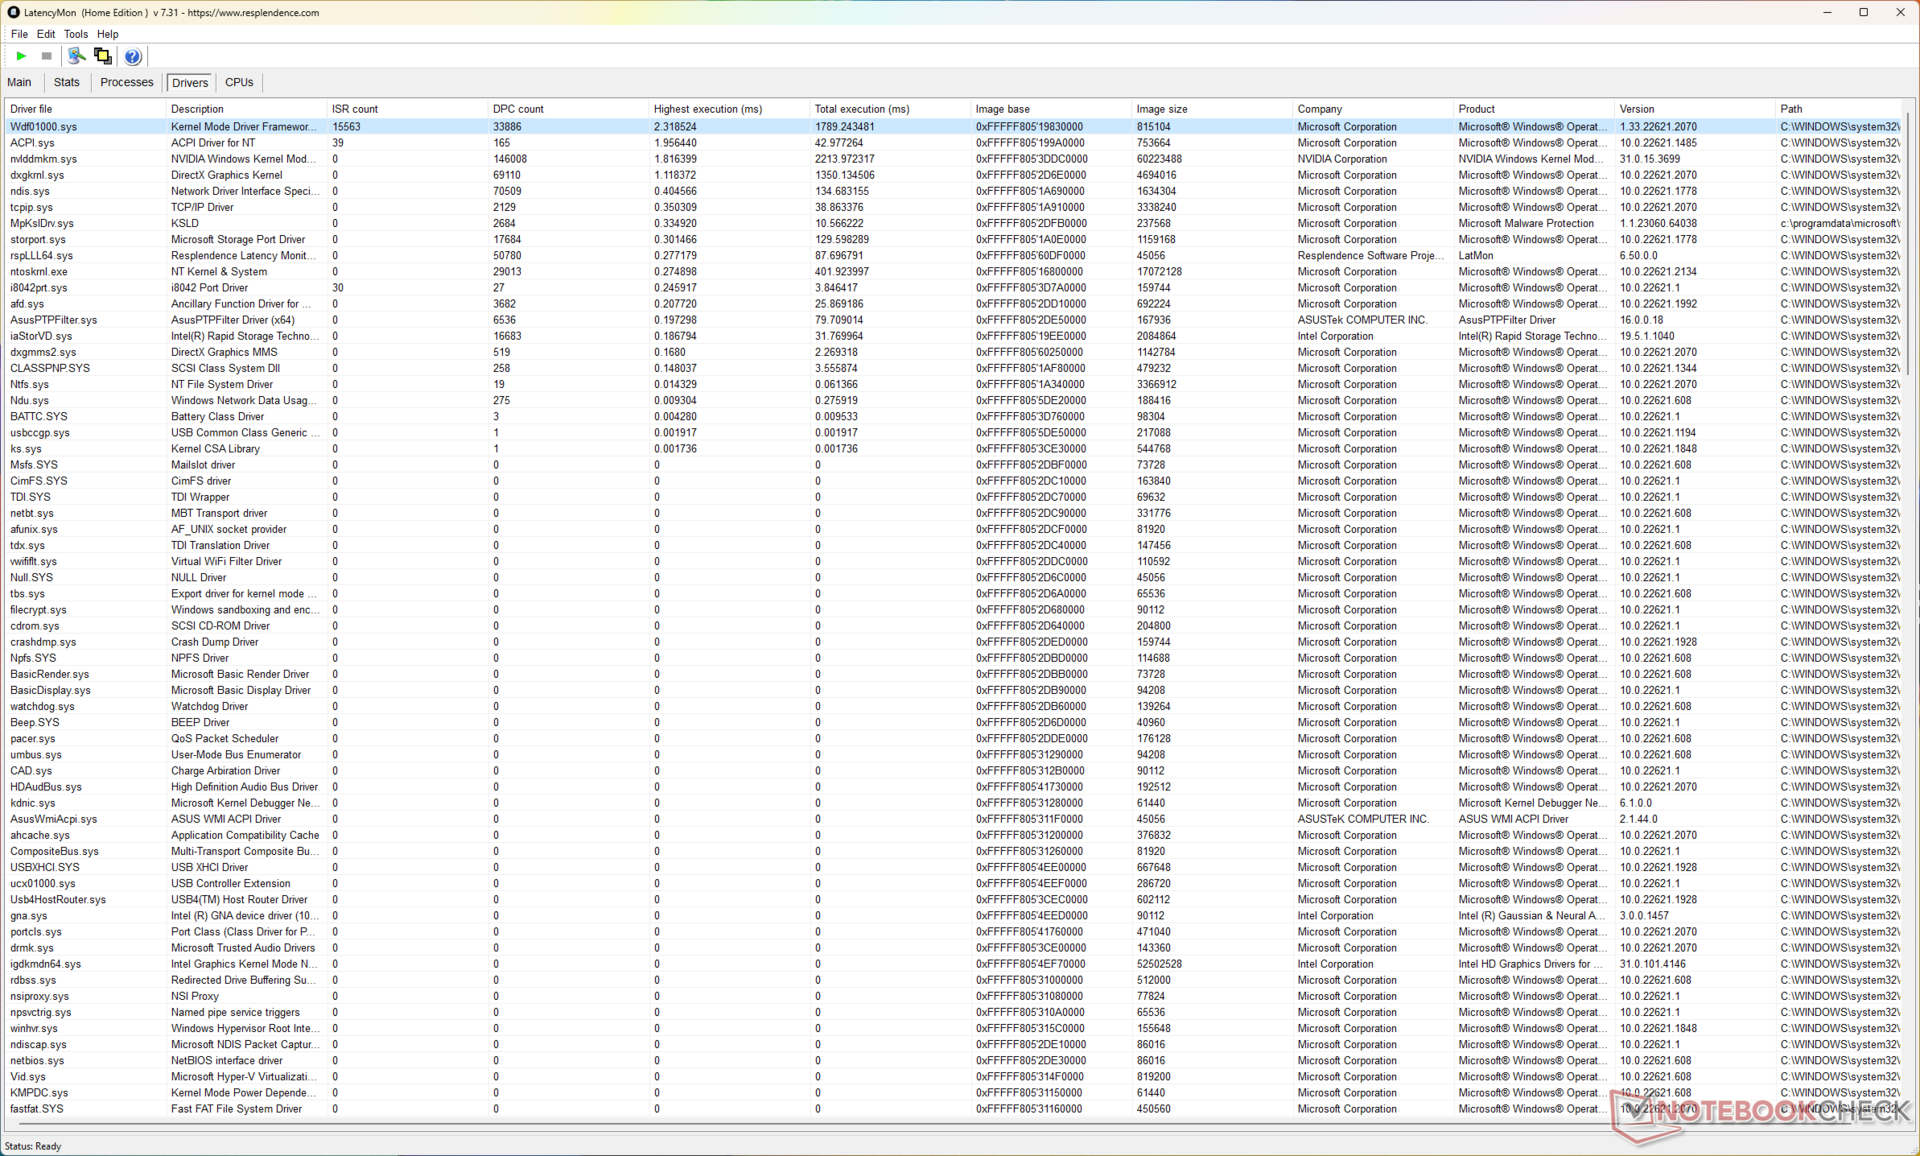
DPC-fördröjning
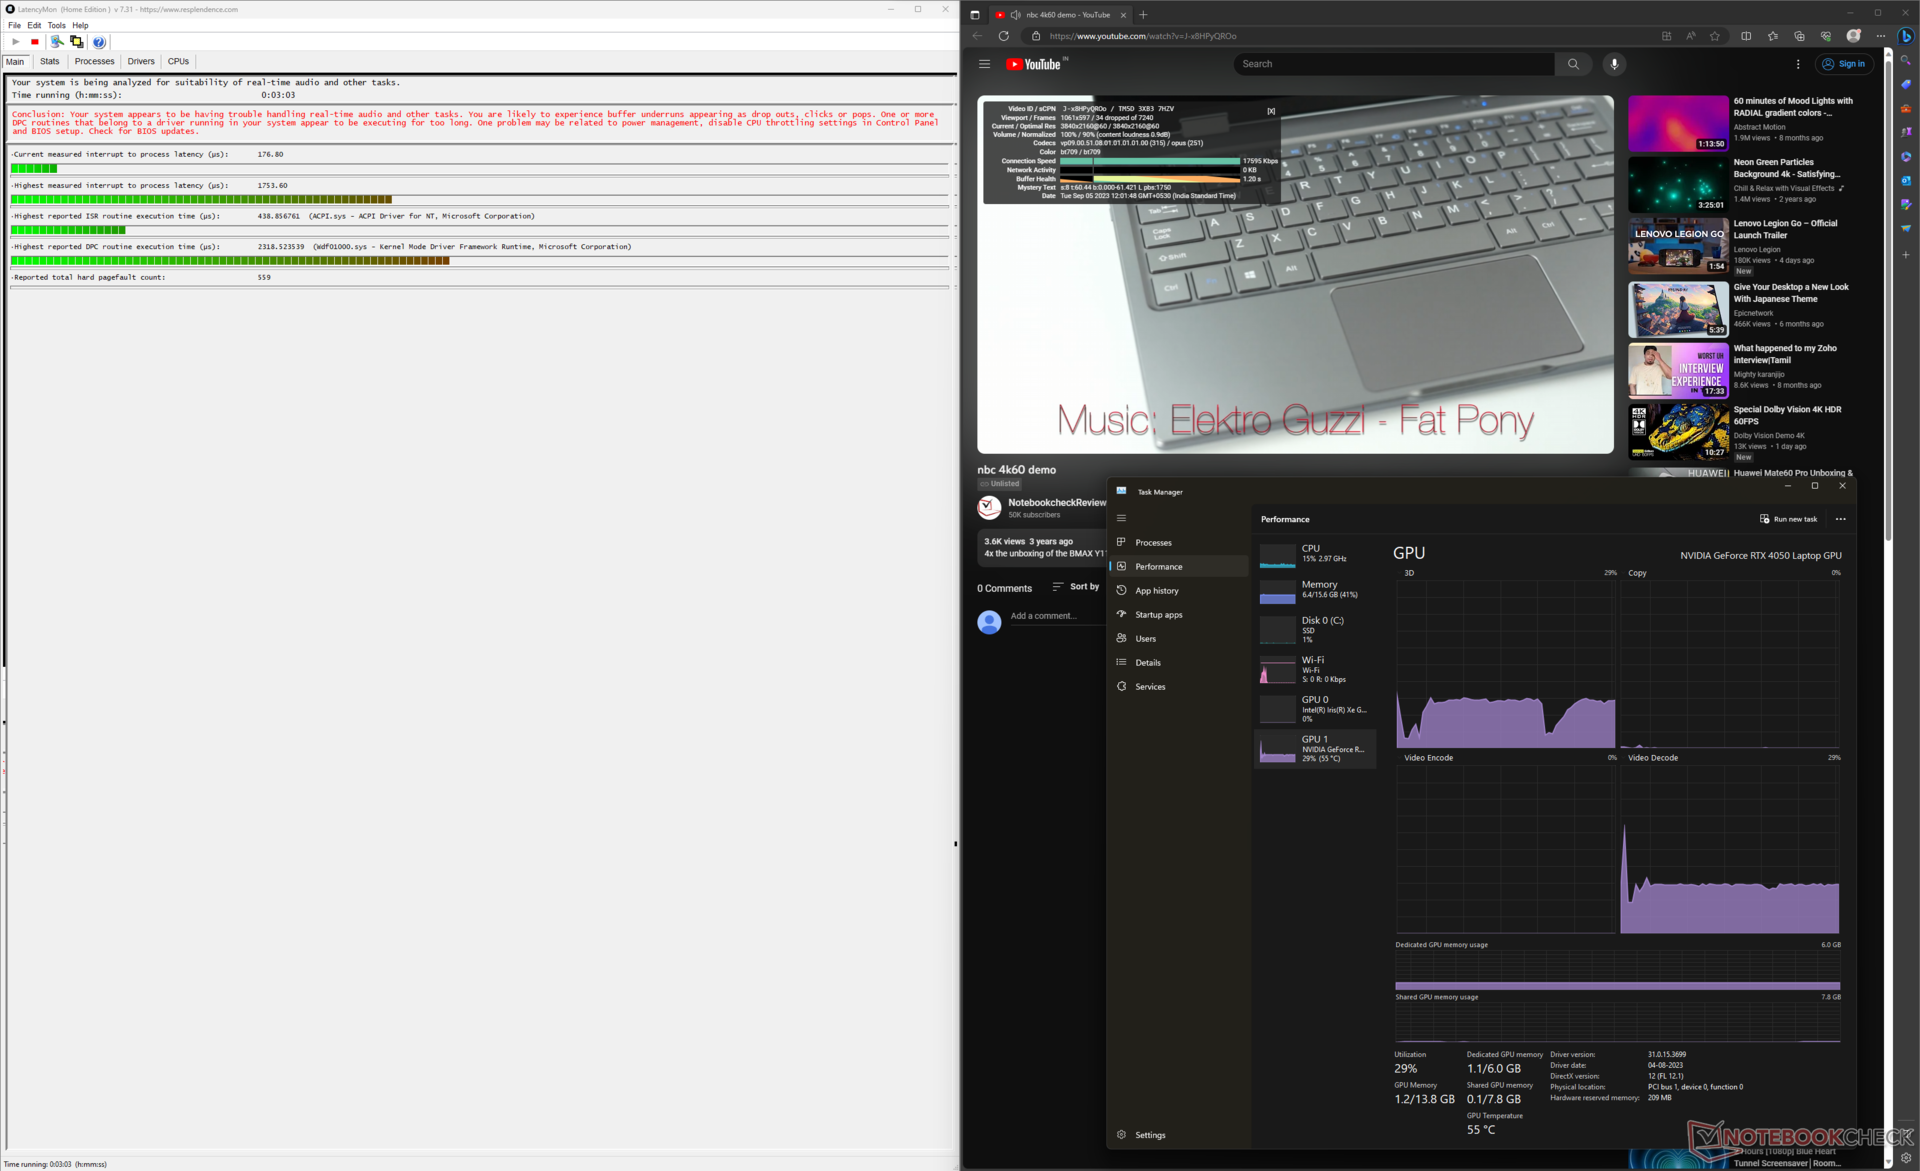
Vi uppmätte den högsta latensen mellan avbrott och process till cirka 1 753,6 µs, vilket potentiellt kan leda till problem med arbetsflöden för ljud- och videoredigering i realtid.
| DPC Latencies / LatencyMon - interrupt to process latency (max), Web, Youtube, Prime95 | |
| Asus Vivobook Pro 16X K6604JV-MX016W | |
| Asus VivoBook Pro 16 K6602VU | |
| Asus VivoBook Pro 16 | |
| Asus ROG Flow X16 GV601V | |
| Asus TUF Gaming A16 FA617XS | |
| Gigabyte AERO 16 OLED BSF | |
| Lenovo Legion Pro 5 16ARX8 (R5 7645HX, RTX 4050) | |
* ... mindre är bättre
Fler jämförelser av DPC-latens kan hittas i vår Ranking av DPC-latens sida.
Lagringsenheter
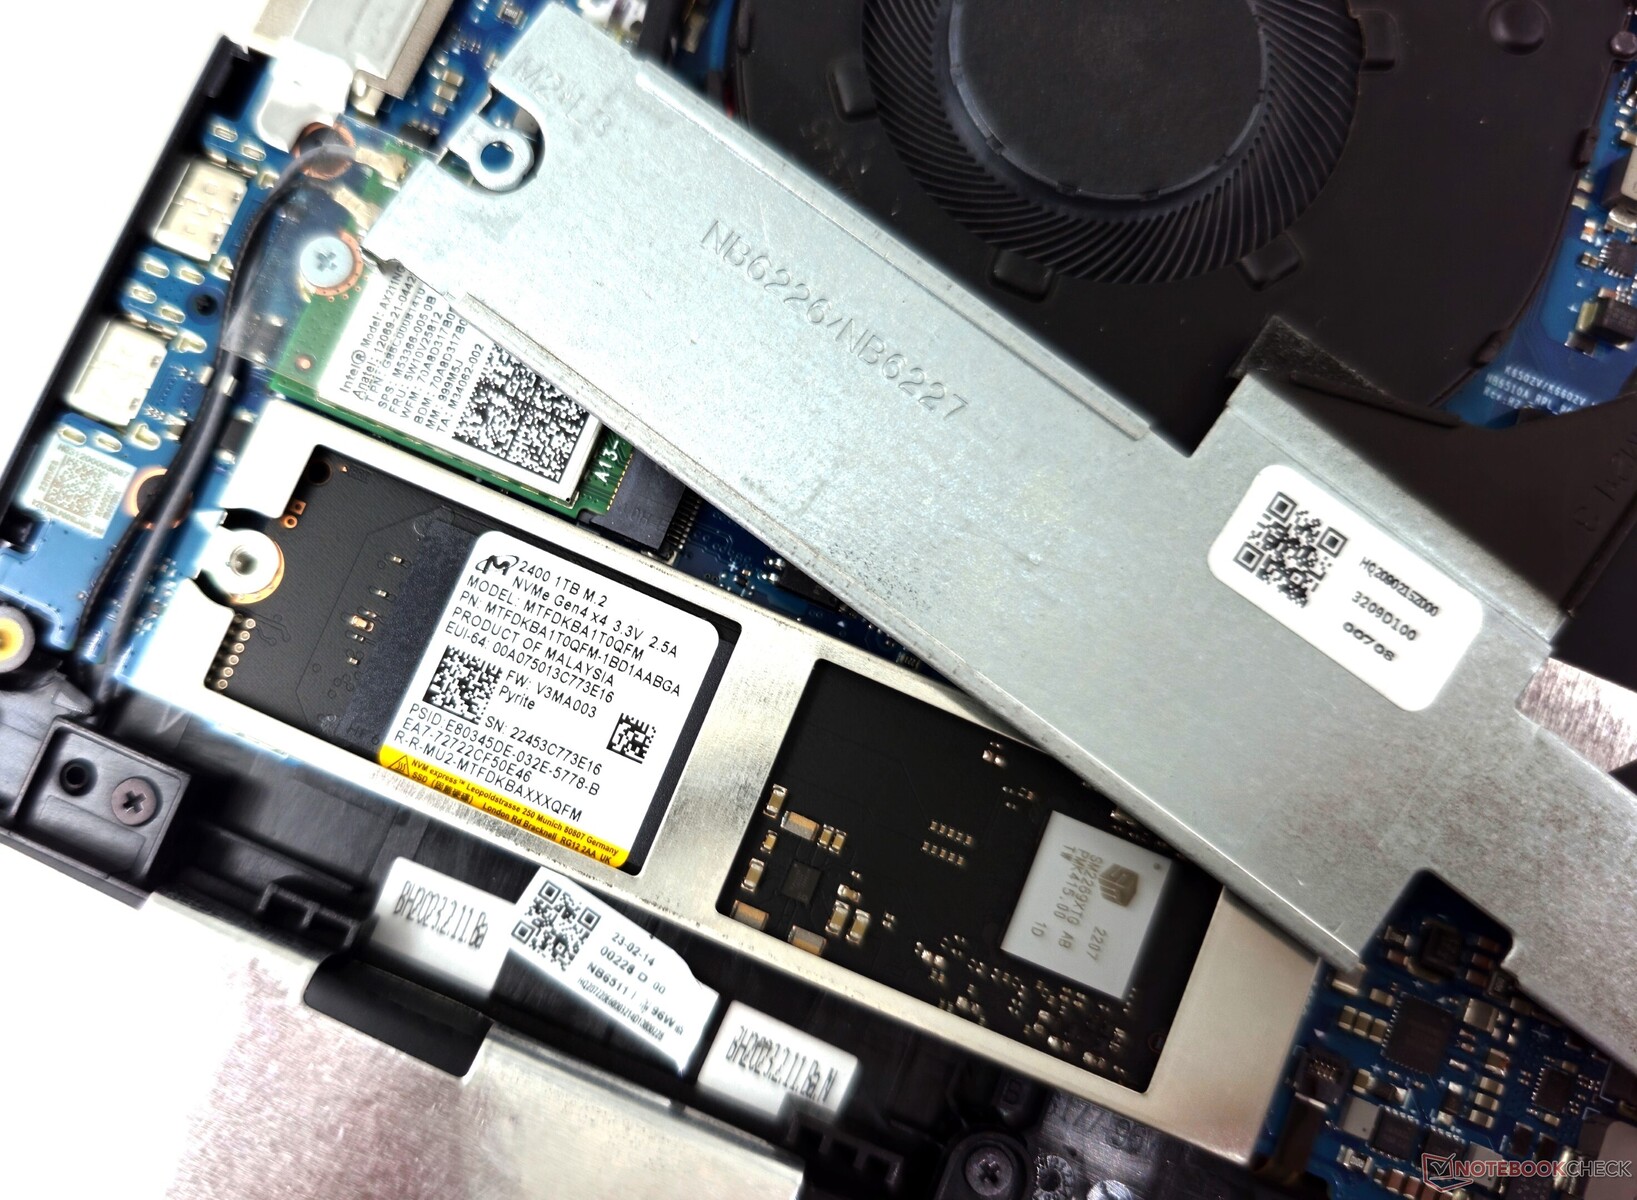
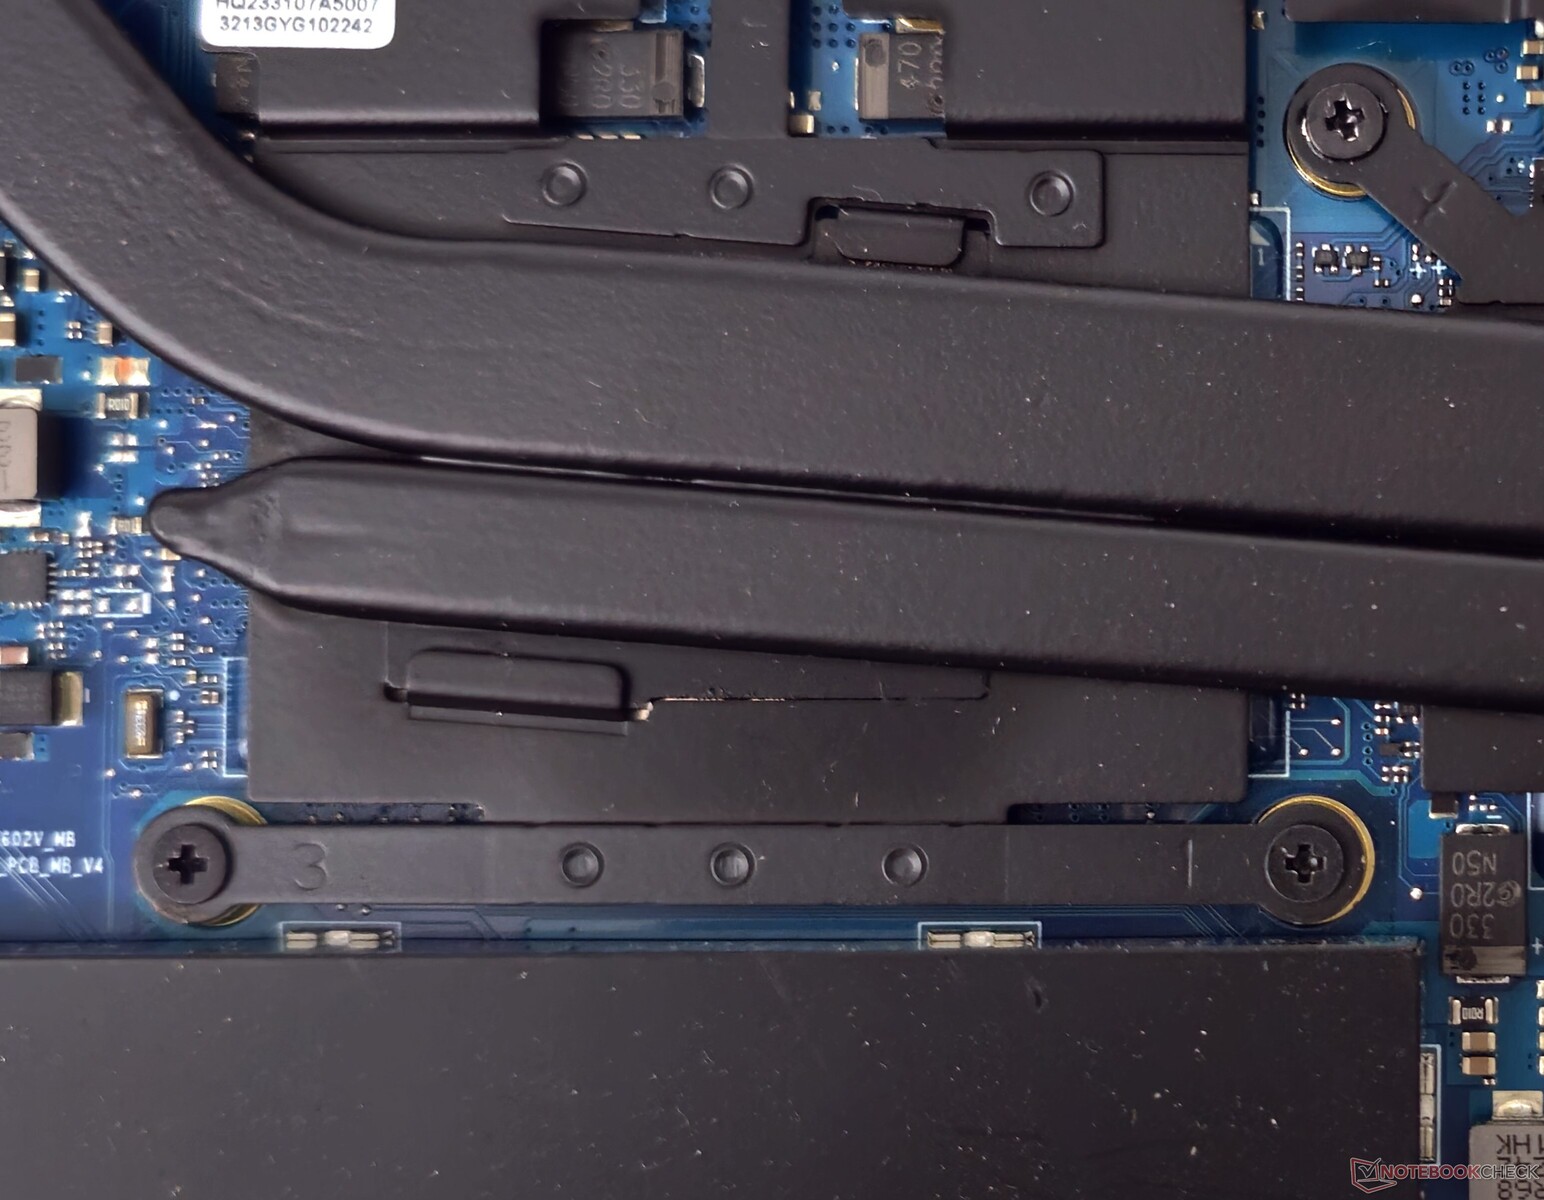
Micron 2400 1 TB PCIe Gen4 M.2 SSD är placerad under en lång aluminiumkåpa, som är lite besvärlig att ta bort. Den övergripande prestandan är något bättre än en Micron 2400 512 GB-enhet men ligger betydligt bakom WD SN560, Gigabyte och SK Hynix PC801-erbjudanden som finns i tävlingen.
Micron 2400 tar den största smällen i 4K-läsningar med ett ködjup på 1, även om den klarar sig mycket bättre i 4K Q32-läsningar.
En extra M.2-plats är tillgänglig för lagringsexpansion. Det finns inget utrymme för att lägga till 2,5-tums SATA-enheter.

* ... mindre är bättre
Vi observerade inte någon strypning av diskprestanda med en kontinuerlig DiskSpd-läsloop med ett ködjup på 8.
Disk Throttling: DiskSpd Read Loop, Queue Depth 8
Kolla in våra HDD- och SSD-riktmärken sida för fler jämförelser av lagringsprestanda.
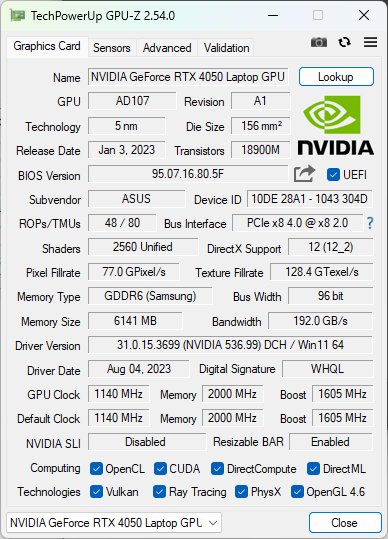
GPU-prestanda
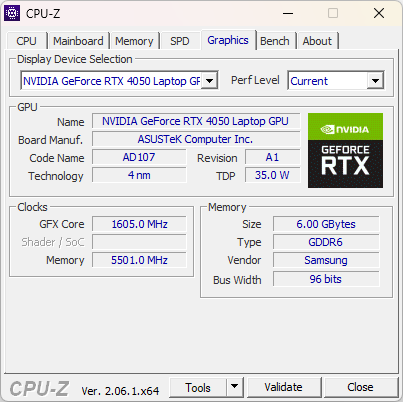
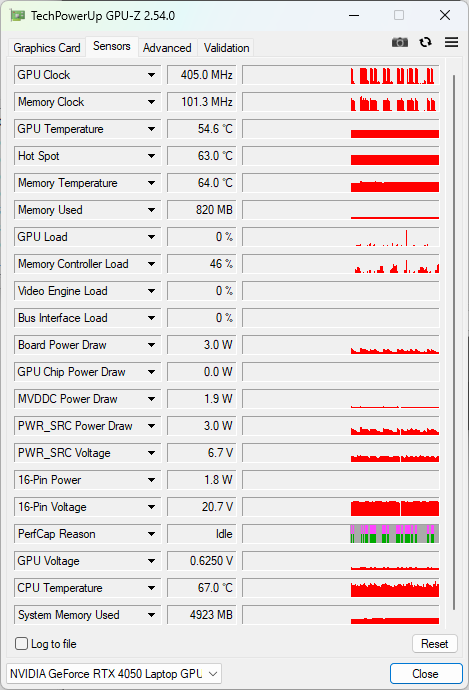
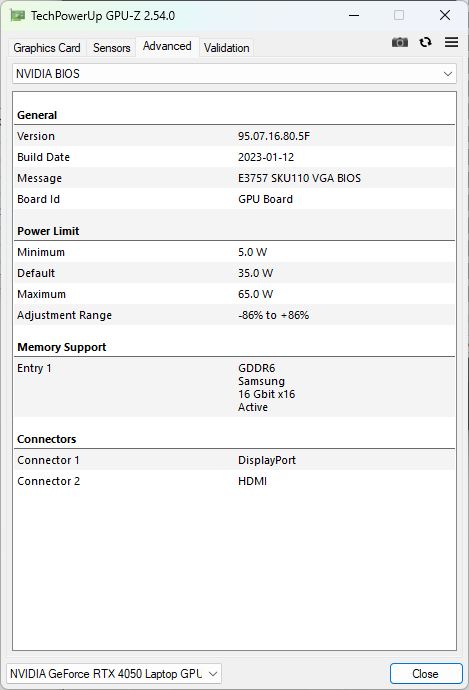
VivoBook Pro 16 använder sig av en 60 W Nvidia GeForce RTX 4050 Laptop GPU som kan öka upp till 1 605 MHz.
GPU:ns kumulativa 3DMark-prestanda är 58 % högre än för RTX 3050 Ti i förra årets VivoBook Pro 16. Den ligger dock 16% efter 140 W RTX 4050 i Legion Pro 5.
Jämfört med VivoBook Pro 16X och dess 140 W RTX 4060ligger vår enhets 60 W RTX 4050 bara 7 % efter i de övergripande 3DMark-mätvärdena.
3DMark Time Spy Grafikpoäng kan sjunka med 21% vid batteridrift.
| 3DMark 11 Performance | 25180 poäng | |
| 3DMark Ice Storm Standard Score | 232668 poäng | |
| 3DMark Cloud Gate Standard Score | 40077 poäng | |
| 3DMark Fire Strike Score | 18333 poäng | |
| 3DMark Fire Strike Extreme Score | 8859 poäng | |
| 3DMark Time Spy Score | 7458 poäng | |
Hjälp | ||
| Blender / v3.3 Classroom OPTIX/RTX | |
| Asus VivoBook Pro 16 | |
| Genomsnitt av klass Multimedia (12 - 105, n=24, senaste 2 åren) | |
| Asus VivoBook Pro 16 K6602VU | |
| Genomsnitt NVIDIA GeForce RTX 4050 Laptop GPU (25 - 37, n=40) | |
| Lenovo Legion Pro 5 16ARX8 (R5 7645HX, RTX 4050) | |
| Asus Vivobook Pro 16X K6604JV-MX016W | |
| Asus ROG Flow X16 GV601V | |
| Gigabyte AERO 16 OLED BSF | |
| Blender / v3.3 Classroom CUDA | |
| Asus VivoBook Pro 16 | |
| Genomsnitt av klass Multimedia (20 - 186, n=24, senaste 2 åren) | |
| Genomsnitt NVIDIA GeForce RTX 4050 Laptop GPU (47 - 68, n=39) | |
| Asus VivoBook Pro 16 K6602VU | |
| Lenovo Legion Pro 5 16ARX8 (R5 7645HX, RTX 4050) | |
| Asus Vivobook Pro 16X K6604JV-MX016W | |
| Asus ROG Flow X16 GV601V | |
| Gigabyte AERO 16 OLED BSF | |
| Blender / v3.3 Classroom CPU | |
| Genomsnitt av klass Multimedia (134.5 - 1042, n=67, senaste 2 åren) | |
| Genomsnitt NVIDIA GeForce RTX 4050 Laptop GPU (243 - 907, n=40) | |
| Asus VivoBook Pro 16 | |
| Asus VivoBook Pro 16 K6602VU | |
| Lenovo Legion Pro 5 16ARX8 (R5 7645HX, RTX 4050) | |
| Asus ROG Flow X16 GV601V | |
| Gigabyte AERO 16 OLED BSF | |
| Asus TUF Gaming A16 FA617XS | |
| Asus Vivobook Pro 16X K6604JV-MX016W | |
* ... mindre är bättre
Spelprestanda
VivoBook Pro 16:s RTX 4050 knyter an till Asus TUF Gaming A16's Radeon RX 7600S i kombinerad 1080p Ultra-spelprestanda. Men Legion Pro 5:s RTX 4050 med högre wattal får märkbara ledningar här.
Med detta sagt erbjuder årets Pro 16-iteration en imponerande 44% upplyftning jämfört med föregående generation med en RTX 3050 Ti.
| The Witcher 3 - 1920x1080 Ultra Graphics & Postprocessing (HBAO+) | |
| Gigabyte AERO 16 OLED BSF | |
| Asus ROG Flow X16 GV601V | |
| Asus TUF Gaming A16 FA617XS | |
| Asus Vivobook Pro 16X K6604JV-MX016W | |
| Lenovo Legion Pro 5 16ARX8 (R5 7645HX, RTX 4050) | |
| Asus VivoBook Pro 16 K6602VU | |
| Genomsnitt av klass Multimedia (11 - 121, n=13, senaste 2 åren) | |
| Asus VivoBook Pro 16 | |
Det är möjligt att uppnå spelbara bildhastigheter vid QHD Ultra-inställningar med RTX 4050 i äldre titlar. För mer moderna spel behöver du en hjälpande hand från uppskalare som Nvidia DLSS, AMD FSR eller Intel XeSS.
| The Witcher 3 | |
| 1920x1080 Ultra Graphics & Postprocessing (HBAO+) | |
| Gigabyte AERO 16 OLED BSF | |
| Asus ROG Flow X16 GV601V | |
| Asus TUF Gaming A16 FA617XS | |
| Asus Vivobook Pro 16X K6604JV-MX016W | |
| Lenovo Legion Pro 5 16ARX8 (R5 7645HX, RTX 4050) | |
| Asus VivoBook Pro 16 K6602VU | |
| Genomsnitt NVIDIA GeForce RTX 4050 Laptop GPU (18.5 - 94.7, n=40) | |
| Genomsnitt av klass Multimedia (11 - 121, n=13, senaste 2 åren) | |
| Asus VivoBook Pro 16 | |
| 2560x1440 Ultra Graphics & Postprocessing (HBAO+) | |
| Genomsnitt av klass Multimedia (78 - 88, n=2, senaste 2 åren) | |
| Asus VivoBook Pro 16 K6602VU | |
| Genomsnitt NVIDIA GeForce RTX 4050 Laptop GPU (39 - 61.3, n=8) | |
Witcher 3 FPS-diagram
Vi observerade en relativt stabil bildfrekvens när vi stressade med The Witcher 3 vid 1080p Ultra, vilket indikerar tillräcklig GPU-kylning.
| låg | med. | hög | ultra | QHD | 4K | |
|---|---|---|---|---|---|---|
| GTA V (2015) | 184.8 | 180.2 | 163.2 | 89 | 65.1 | |
| The Witcher 3 (2015) | 356 | 258 | 138.7 | 76.6 | 56.1 | 44.7 |
| Dota 2 Reborn (2015) | 169.6 | 153.7 | 140.1 | 126 | ||
| Final Fantasy XV Benchmark (2018) | 167 | 107.2 | 75.6 | 53.6 | ||
| X-Plane 11.11 (2018) | 159.2 | 134.6 | 108.4 | |||
| Far Cry 5 (2018) | 147 | 114 | 107 | 104 | 68 | |
| Strange Brigade (2018) | 449 | 187.4 | 151.6 | 132 | ||
| Cyberpunk 2077 1.6 (2022) | 97.5 | 74.4 | 62.2 | 57.4 | 43.1 | |
| F1 22 (2022) | 182.4 | 193.1 | 152.1 | 47.5 | 29.6 | |
| F1 23 (2023) | 197 | 200 | 140.7 | 39.7 | 25.6 |
Fler benchmark- och speljämförelser kan hittas i vår dedikerade Nvidia GeForce RTX 4050 Laptop GPU sida.
Utsläpp: Understiger den påstådda kombinerade TDP på 90 W
Buller från systemet
Asus tillämpar förinställda gränser för fläktljud för varje VivoBook Pro 16-prestandaprofil, i likhet med vad vi har sett med andra VivoBooks tidigare.
Standardprofilen siktar på mindre än 40 dB(A) ljudtrycksnivå (SPL) baserat på Asus specifikationer, vilket våra tester bekräftar. Viskningsläget sänker SPL ytterligare till under 30 dB(A).
Performance-läget ökar fläktarnas effekt till max, vilket resulterar i betydligt högre ljudnivåer upp till 52 dB (A) i våra mätningar.
Eftersom standard- och prestandalägena har liknande effektgränser rekommenderar vi att du väljer det förstnämnda för en mer dräglig akustik utan störande fläktljud.
Ljudnivå
| Låg belastning |
| 25.28 / 25.28 / 25.28 dB(A) |
| Hög belastning |
| 51.88 / 51.8 dB(A) |
 | ||
30 dB tyst 40 dB(A) hörbar 50 dB(A) högt ljud |
||
min: | ||
| Prestandaläge | Tomgång dB(A) | Genomsnittlig belastning dB(A) | Maximal belastning dB(A) | The Witcher 3 1080p Ultra dB(A) |
|---|---|---|---|---|
| Viskning | 22,22 | 27,73 | 28,47 | 28,17 |
| Standard | 25,08 | 37,63 | 38,81 | 39,12 |
| Prestanda | 25,28 | 51,88 | 51,80 | 49,03 |
| Asus VivoBook Pro 16 K6602VU i9-13900H, GeForce RTX 4050 Laptop GPU | Asus Vivobook Pro 16X K6604JV-MX016W i9-13980HX, GeForce RTX 4060 Laptop GPU | Asus ROG Flow X16 GV601V i9-13900H, GeForce RTX 4060 Laptop GPU | Lenovo Legion Pro 5 16ARX8 (R5 7645HX, RTX 4050) R5 7645HX, GeForce RTX 4050 Laptop GPU | Asus TUF Gaming A16 FA617XS R9 7940HS, Radeon RX 7600S | Asus VivoBook Pro 16 i7-12700H, GeForce RTX 3050 Ti Laptop GPU | Gigabyte AERO 16 OLED BSF i9-13900H, GeForce RTX 4070 Laptop GPU | |
|---|---|---|---|---|---|---|---|
| Noise | -10% | 4% | 8% | -3% | -8% | -6% | |
| av / miljö * (dB) | 20.96 | 25.2 -20% | 24 -15% | 23 -10% | 25 -19% | 25.2 -20% | 23 -10% |
| Idle Minimum * (dB) | 25.28 | 26.6 -5% | 24 5% | 23 9% | 25 1% | 25.2 -0% | 23 9% |
| Idle Average * (dB) | 25.28 | 26.6 -5% | 24 5% | 23 9% | 26 -3% | 25.2 -0% | 23 9% |
| Idle Maximum * (dB) | 25.28 | 29.2 -16% | 24 5% | 24.42 3% | 28 -11% | 25.2 -0% | 33.64 -33% |
| Load Average * (dB) | 51.88 | 53.4 -3% | 36.71 29% | 34.94 33% | 43 17% | 55.1 -6% | 51.49 1% |
| Witcher 3 ultra * (dB) | 49 | 50.92 -4% | 43.79 11% | 51 -4% | 55.27 -13% | ||
| Load Maximum * (dB) | 51.8 | 56.9 -10% | 50.92 2% | 50 3% | 53 -2% | 61.5 -19% | 55.24 -7% |
* ... mindre är bättre
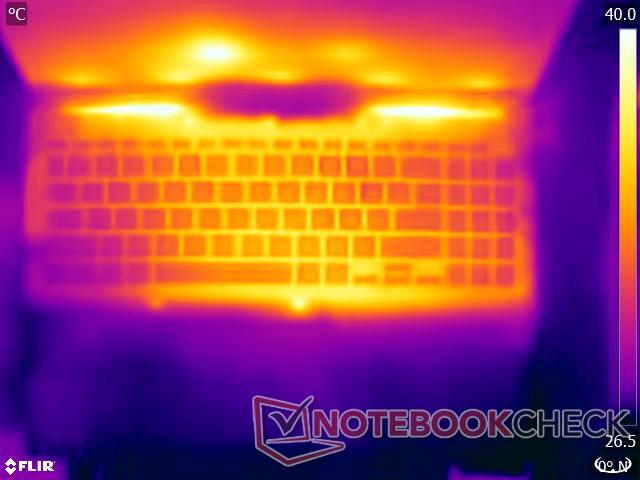
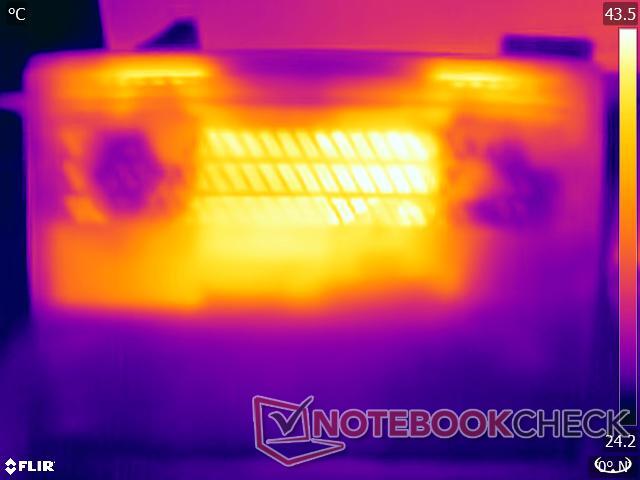
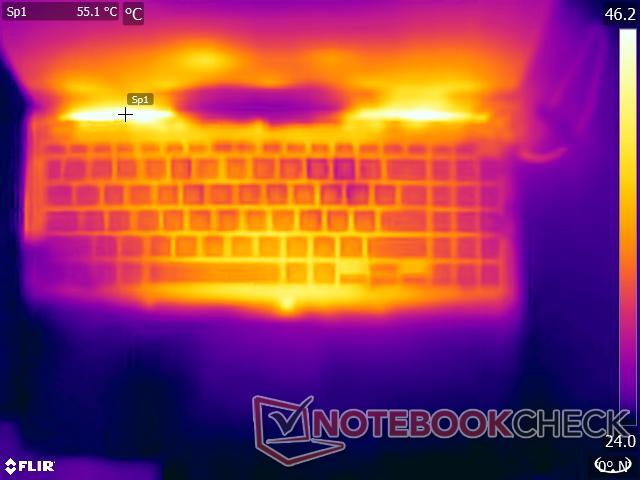
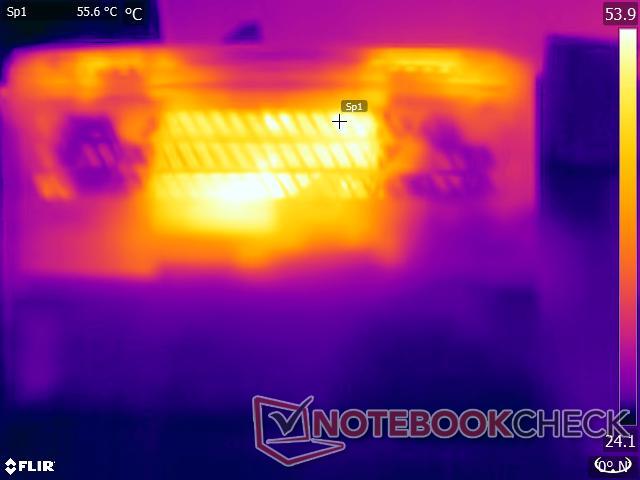
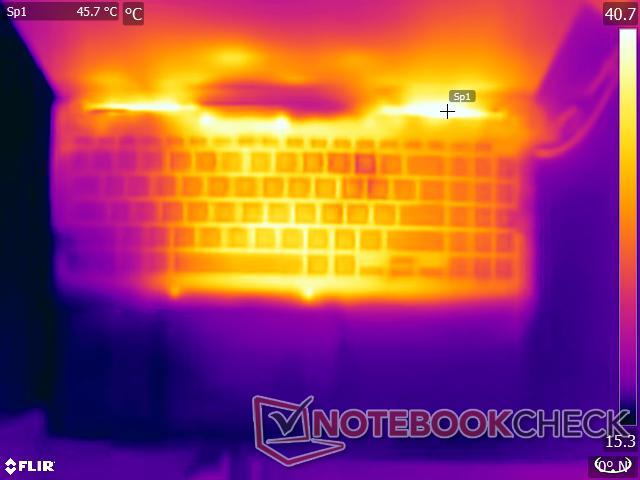
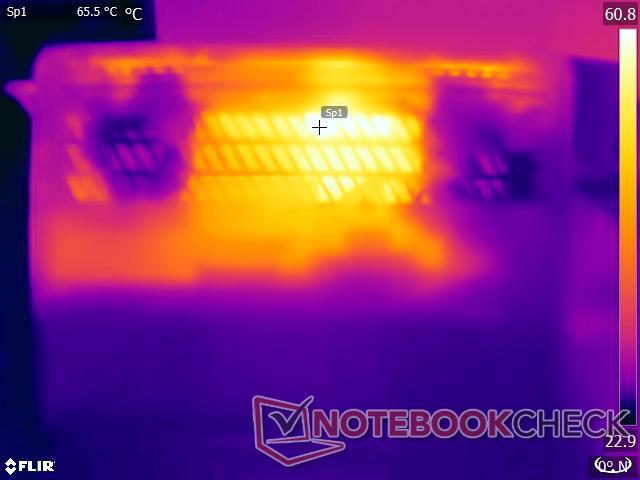
Temperatur
I Performance-läget registrerade vi temperaturer på upp till 42,6 °C och 48,4 °C på över- respektive undersidan under maximal belastning. Under The Witcher 3 stress vid 1080p Ultra nådde den nedre temperaturpunkten 63,6 °C.
Även om dessa temperaturer uppstår i krävande testscenarier är det fortfarande inte tillrådligt att använda laptopen vid tunga arbetsbelastningar. Allt utöver lätt produktivitet kan potentiellt resultera i märkbar värmeutveckling och obehag.
Pekplattan och handflatans stödområden förblir relativt svala även vid full belastning.
(±) Den maximala temperaturen på ovansidan är 42.6 °C / 109 F, jämfört med genomsnittet av 36.8 °C / 98 F , allt från 21 till 71 °C för klassen Multimedia.
(-) Botten värms upp till maximalt 48.4 °C / 119 F, jämfört med genomsnittet av 39.1 °C / 102 F
(±) Vid tomgångsbruk är medeltemperaturen för ovansidan 33.2 °C / 92 F, jämfört med enhetsgenomsnittet på 31.3 °C / ### class_avg_f### F.
(-) När du spelar The Witcher 3 är medeltemperaturen för ovansidan 39.3 °C / 103 F, jämfört med enhetsgenomsnittet på 31.3 °C / ## #class_avg_f### F.
(+) Handledsstöden och pekplattan är kallare än hudtemperaturen med maximalt 29.4 °C / 84.9 F och är därför svala att ta på.
(±) Medeltemperaturen för handledsstödsområdet på liknande enheter var 28.7 °C / 83.7 F (-0.7 °C / -1.2 F).
| Asus VivoBook Pro 16 K6602VU Intel Core i9-13900H, NVIDIA GeForce RTX 4050 Laptop GPU | Asus Vivobook Pro 16X K6604JV-MX016W Intel Core i9-13980HX, NVIDIA GeForce RTX 4060 Laptop GPU | Asus ROG Flow X16 GV601V Intel Core i9-13900H, NVIDIA GeForce RTX 4060 Laptop GPU | Lenovo Legion Pro 5 16ARX8 (R5 7645HX, RTX 4050) AMD Ryzen 5 7645HX, NVIDIA GeForce RTX 4050 Laptop GPU | Asus TUF Gaming A16 FA617XS AMD Ryzen 9 7940HS, AMD Radeon RX 7600S | Asus VivoBook Pro 16 Intel Core i7-12700H, NVIDIA GeForce RTX 3050 Ti Laptop GPU | Gigabyte AERO 16 OLED BSF Intel Core i9-13900H, NVIDIA GeForce RTX 4070 Laptop GPU | |
|---|---|---|---|---|---|---|---|
| Heat | 5% | 8% | -1% | 7% | 2% | 23% | |
| Maximum Upper Side * (°C) | 42.6 | 39.7 7% | 46 -8% | 45 -6% | 53 -24% | 44.2 -4% | 41 4% |
| Maximum Bottom * (°C) | 48.4 | 60 -24% | 41 15% | 54 -12% | 48 1% | 53 -10% | 47 3% |
| Idle Upper Side * (°C) | 39.4 | 30.9 22% | 36 9% | 36 9% | 30 24% | 32.1 19% | 23 42% |
| Idle Bottom * (°C) | 39.8 | 34.7 13% | 33 17% | 38 5% | 30 25% | 38.4 4% | 23 42% |
* ... mindre är bättre
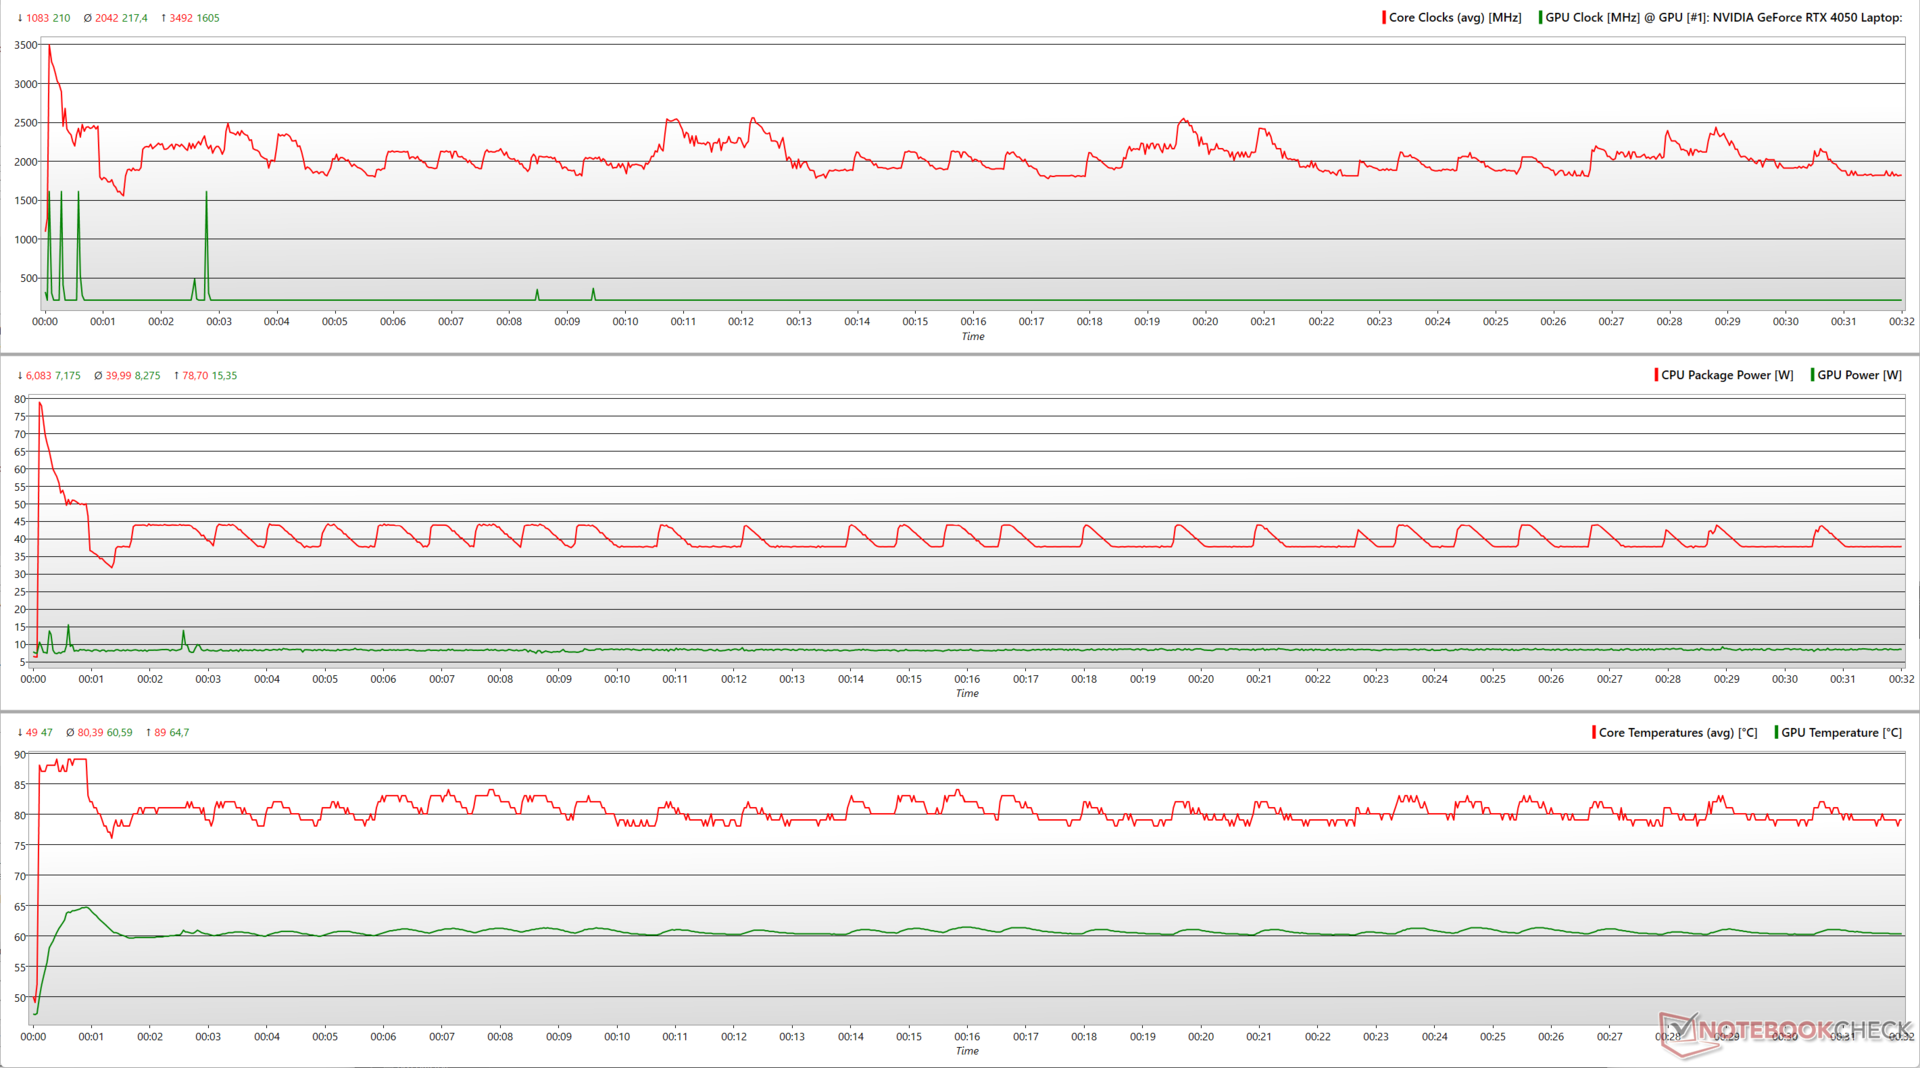
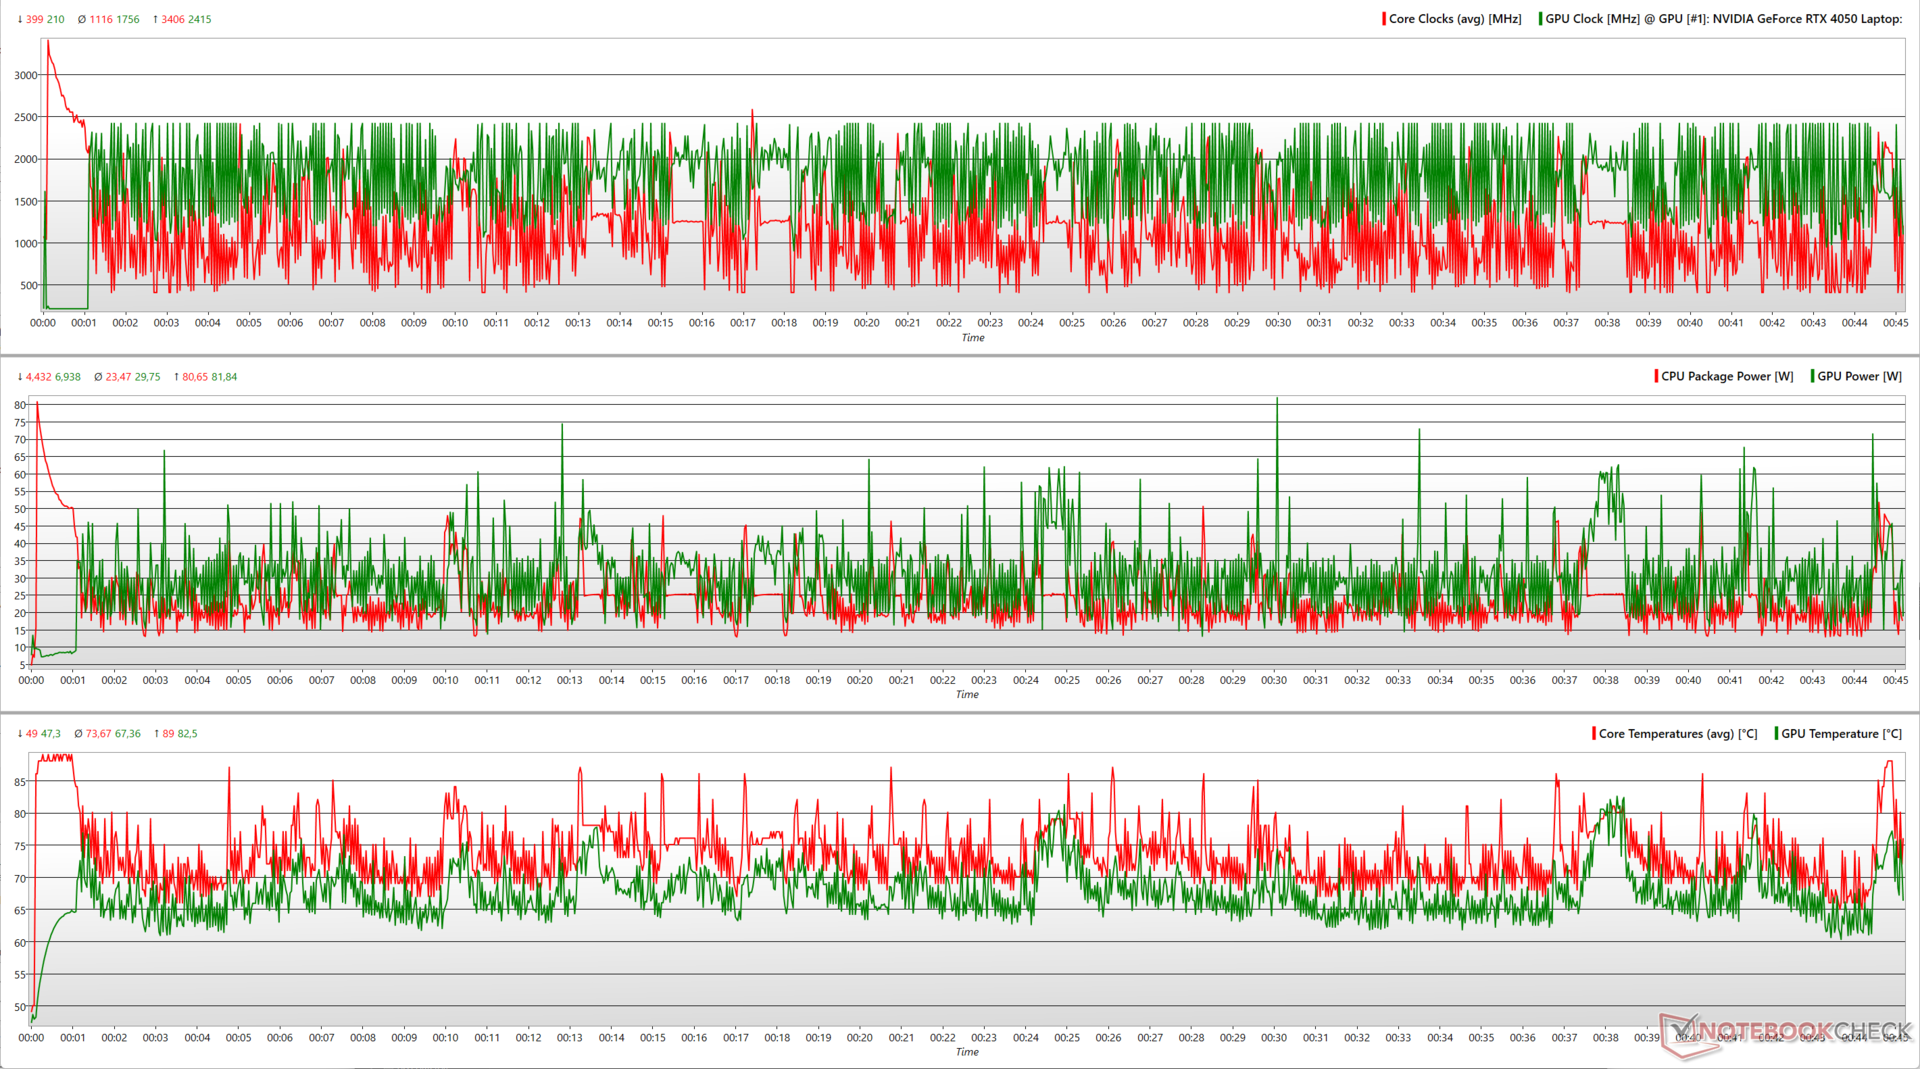
Stresstest
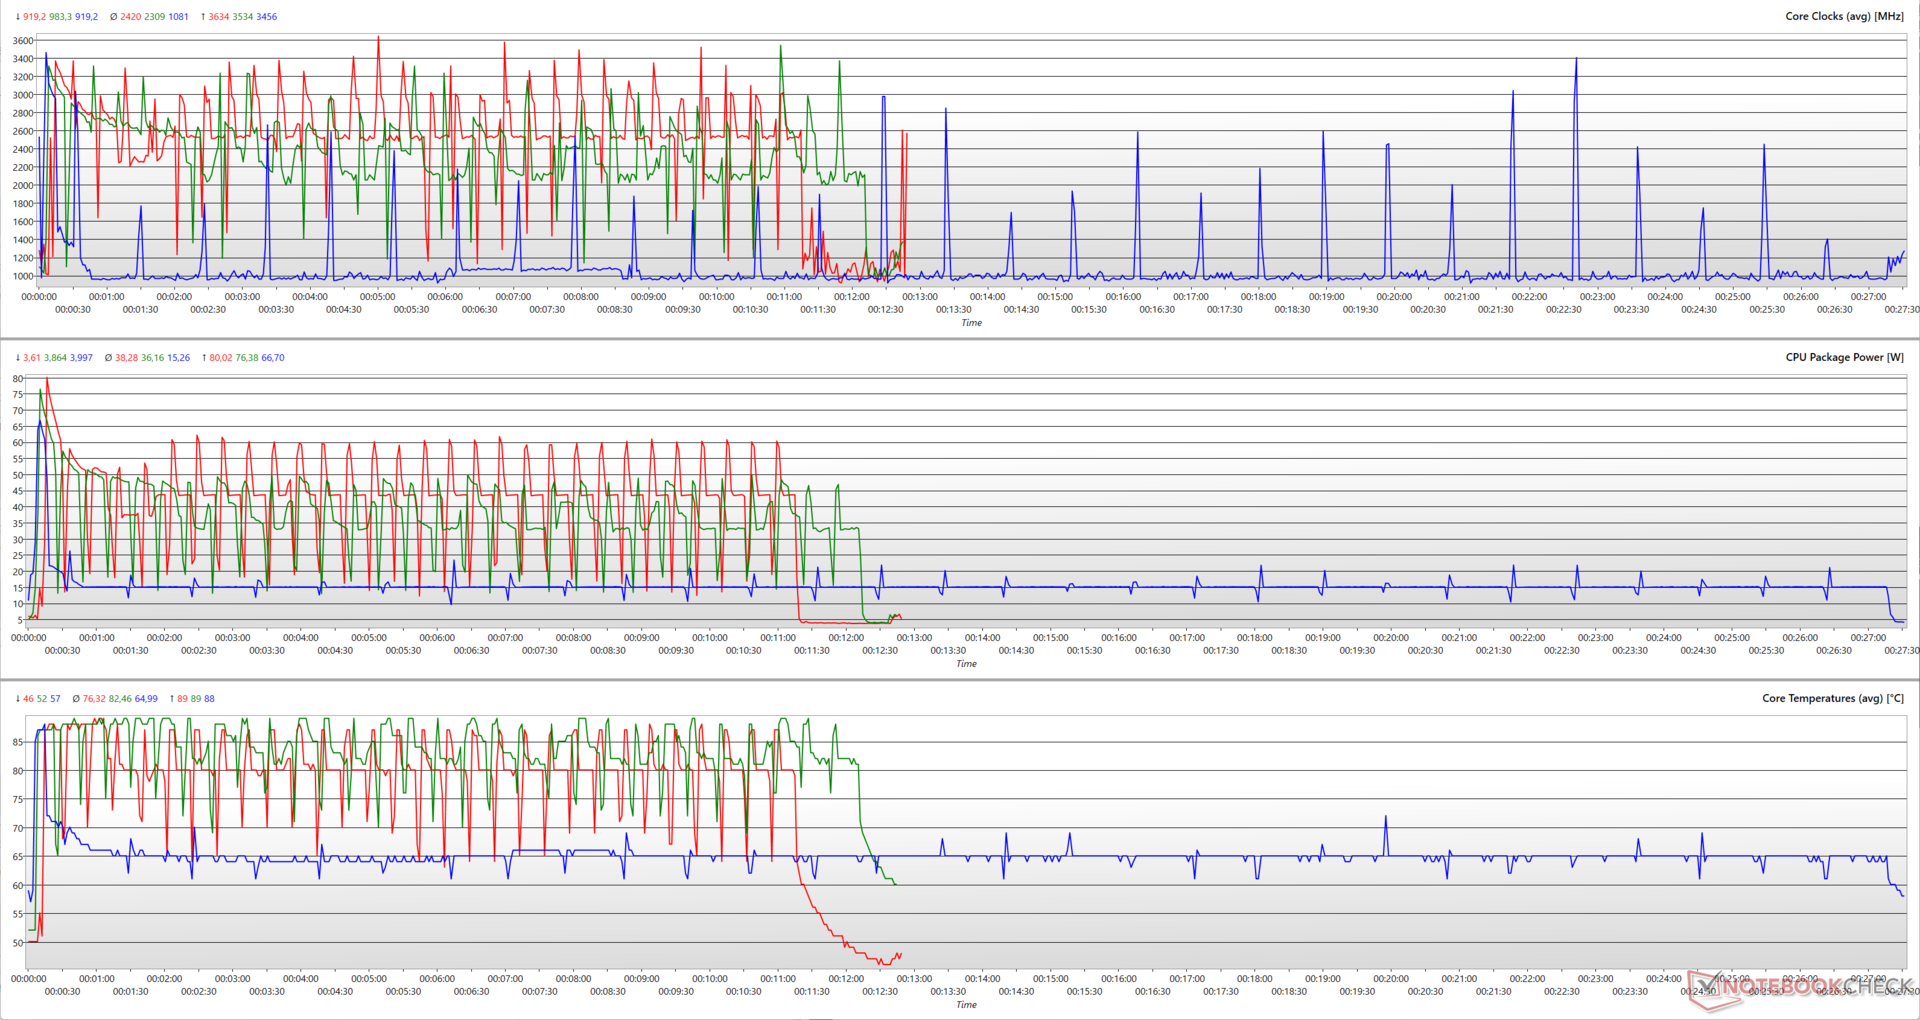
I Prime95 in-place large FFT stresstestning nådde VivoBook Pro 16:s Core i9-13900H en högsta klockhastighet på 3,49 GHz vid 78,7 W strömförbrukning. Genomsnittsklockorna låg runt 2 GHz med en energiförbrukning på 40 W.
När man lägger till FurMark GPU-stress, konkurrerar Core i9-13900H och RTX 4050 om delat termiskt utrymme. CPU:n sjunker till bara 1,1 GHz i genomsnitt vid 23,5 W, medan GPU:n ökar till 2 415 MHz i topp vid 82 W.
| Stresstest | CPU-klocka (GHz) | GPU-klocka (MHz) | Genomsnittlig CPU-temperatur (°C) | Genomsnittlig GPU-temperatur (°C) |
| System i viloläge | 1,7 | 210 | 49 | 46,4 |
| Prime95 | 2,01 | 210 | 79 | 60,6 |
| Prime95 + FurMark | 1,07 | 2 415 | 71 | 64,9 |
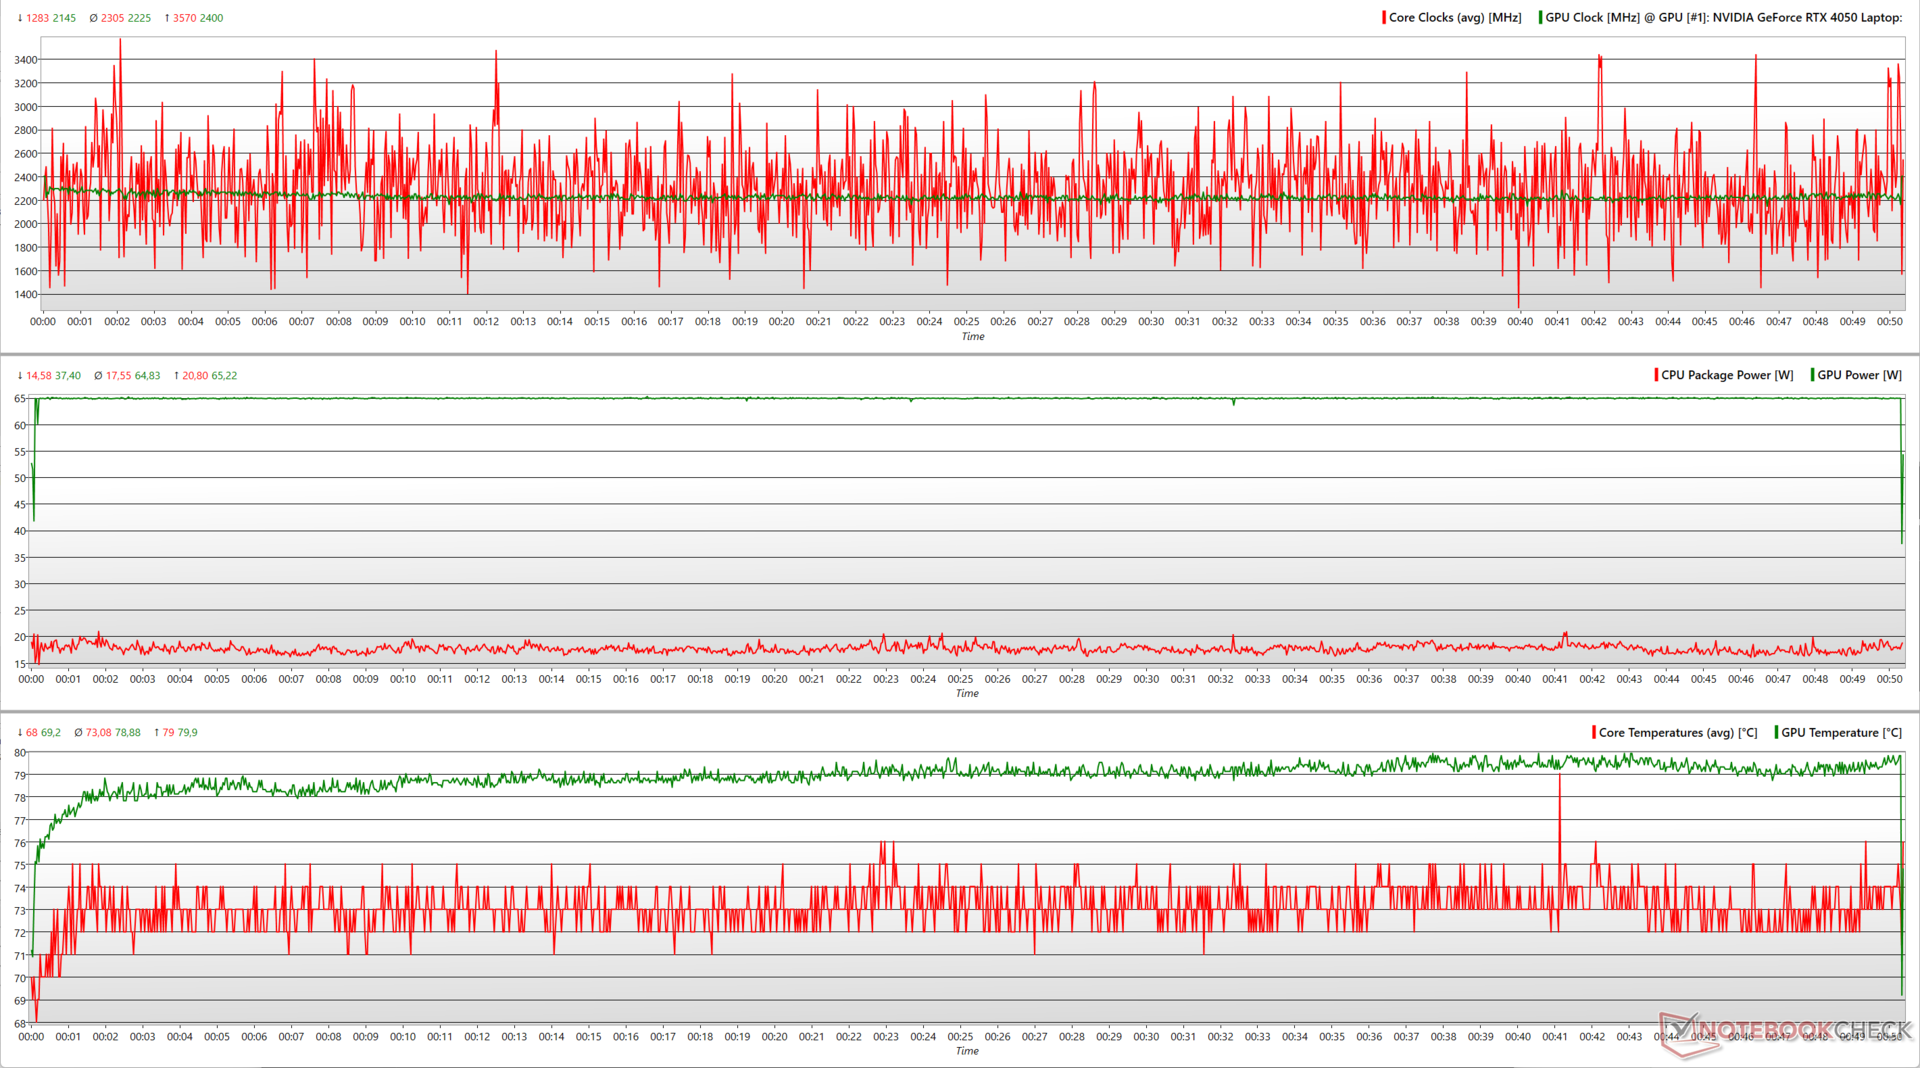
| The Witcher 3 1080p Ultra | 2,3 | 2 400 | 72 | 77,7 |
I en verklig spelbelastning(The Witcher 3 vid 1080p Ultra) visar VivoBook Pro 16 en mer rimlig kraftdelning mellan Core i9-13900H (2,3 GHz vid 17,5 W i genomsnitt) och RTX 4050 (2.225 MHz vid 65 W i genomsnitt).
Enligt Asus ska prestandaprofilen tillåta upp till 90 W kombinerad TDP mellan CPU och GPU. Våra stresstester nådde dock aldrig upp till det angivna värdet.
I Prime95 + FurMark nådde den kombinerade toppeffekten 162,5 W kortvarigt men genomsnittet var bara 53 W. Den bärbara datorn klarade sig bättre i The Witcher 3 -stressen och nådde kombinerad 86 W topp och 82 W genomsnitt delat mellan CPU och GPU.
Högtalare
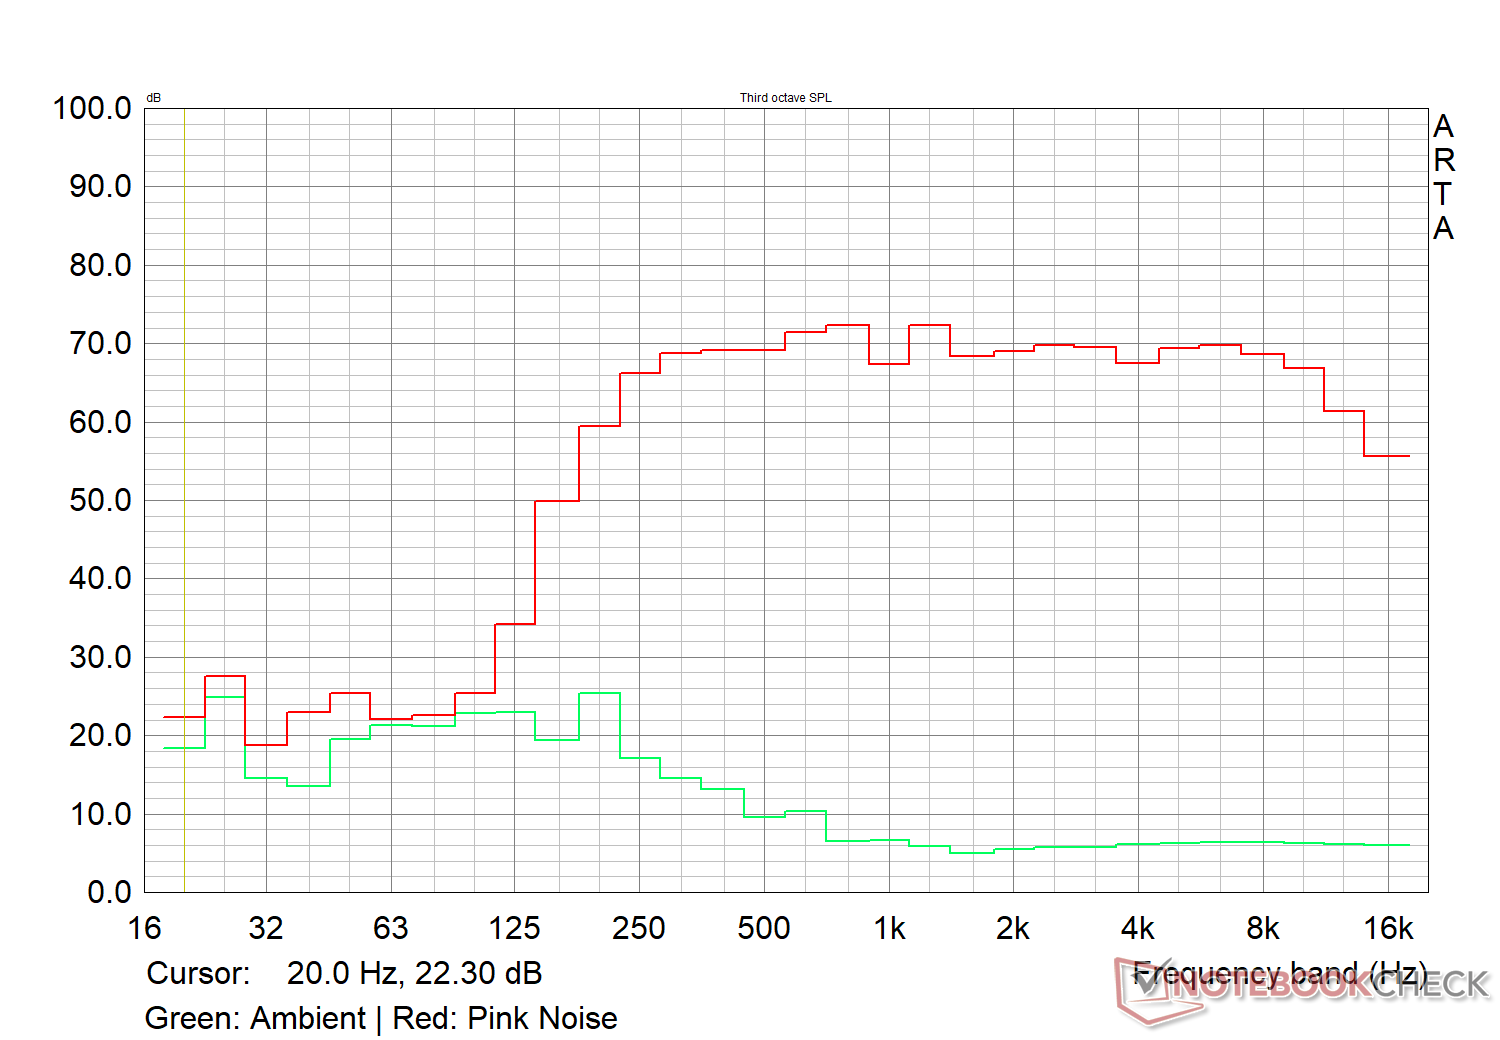
Asus erbjuder flera ljudförbättringar som Smart Amp, Audio Booster och Harman Kardon-tuning. De inbyggda högtalarna återger mellanregister och höga toner hyggligt, men basen är bristfällig.
I våra tester nådde ljudstyrkan 81,6 dB(A), vilket bör vara tillräckligt för inomhusbruk. Externt ljud via 3,5 mm-uttaget eller Bluetooth 5.3 ger en mycket bättre upplevelse, särskilt för musik och film.
Asus VivoBook Pro 16 K6602VU ljudanalys
(±) | högtalarljudstyrkan är genomsnittlig men bra (81.6 dB)
Bas 100 - 315 Hz
(-) | nästan ingen bas - i genomsnitt 18% lägre än medianen
(±) | linjäriteten för basen är genomsnittlig (12.4% delta till föregående frekvens)
Mellan 400 - 2000 Hz
(+) | balanserad mellan - endast 1.7% från medianen
(+) | mids är linjära (3.7% delta till föregående frekvens)
Högsta 2 - 16 kHz
(+) | balanserade toppar - endast 1% från medianen
(+) | toppar är linjära (1.9% delta till föregående frekvens)
Totalt 100 - 16 000 Hz
(+) | det totala ljudet är linjärt (11.2% skillnad mot median)
Jämfört med samma klass
» 17% av alla testade enheter i den här klassen var bättre, 4% liknande, 80% sämre
» Den bästa hade ett delta på 5%, genomsnittet var 17%, sämst var 45%
Jämfört med alla testade enheter
» 7% av alla testade enheter var bättre, 2% liknande, 91% sämre
» Den bästa hade ett delta på 4%, genomsnittet var 24%, sämst var 134%
Apple MacBook Pro 16 2021 M1 Pro ljudanalys
(+) | högtalare kan spela relativt högt (84.7 dB)
Bas 100 - 315 Hz
(+) | bra bas - bara 3.8% från medianen
(+) | basen är linjär (5.2% delta till föregående frekvens)
Mellan 400 - 2000 Hz
(+) | balanserad mellan - endast 1.3% från medianen
(+) | mids är linjära (2.1% delta till föregående frekvens)
Högsta 2 - 16 kHz
(+) | balanserade toppar - endast 1.9% från medianen
(+) | toppar är linjära (2.7% delta till föregående frekvens)
Totalt 100 - 16 000 Hz
(+) | det totala ljudet är linjärt (4.6% skillnad mot median)
Jämfört med samma klass
» 0% av alla testade enheter i den här klassen var bättre, 0% liknande, 100% sämre
» Den bästa hade ett delta på 5%, genomsnittet var 17%, sämst var 45%
Jämfört med alla testade enheter
» 0% av alla testade enheter var bättre, 0% liknande, 100% sämre
» Den bästa hade ett delta på 4%, genomsnittet var 24%, sämst var 134%
Energihantering: Högre strömförbrukning i viloläge men sparsam under belastning
Strömförbrukning
VivoBook Pro 16:s totala strömförbrukning under belastning är mycket ekonomisk jämfört med konkurrenterna. Strömförbrukningen i standby och viloläge verkar dock vara en anledning till oro.
Den medföljande 150 W nätadaptern är mer än tillräcklig för att driva den bärbara datorn under belastning.
| Av/Standby | |
| Låg belastning | |
| Hög belastning |
|
Förklaring:
min: | |
| Asus VivoBook Pro 16 K6602VU i9-13900H, GeForce RTX 4050 Laptop GPU, OLED, 3200x2000, 16" | Asus Vivobook Pro 16X K6604JV-MX016W i9-13980HX, GeForce RTX 4060 Laptop GPU, OLED, 3200x2000, 16" | Asus ROG Flow X16 GV601V i9-13900H, GeForce RTX 4060 Laptop GPU, IPS, 2560x1600, 16" | Lenovo Legion Pro 5 16ARX8 (R5 7645HX, RTX 4050) R5 7645HX, GeForce RTX 4050 Laptop GPU, IPS, 2560x1600, 16" | Asus TUF Gaming A16 FA617XS R9 7940HS, Radeon RX 7600S, IPS, 1920x1200, 16" | Asus VivoBook Pro 16 i7-12700H, GeForce RTX 3050 Ti Laptop GPU, IPS, 2560x1600, 16" | Gigabyte AERO 16 OLED BSF i9-13900H, GeForce RTX 4070 Laptop GPU, OLED, 3840x2400, 16" | Genomsnitt NVIDIA GeForce RTX 4050 Laptop GPU | Genomsnitt av klass Multimedia | |
|---|---|---|---|---|---|---|---|---|---|
| Power Consumption | -32% | -9% | -10% | 6% | -1% | -10% | 4% | 36% | |
| Idle Minimum * (Watt) | 21.06 | 13.8 34% | 9.6 54% | 13 38% | 7 67% | 8.7 59% | 11.8 44% | 9.95 ? 53% | 5.64 ? 73% |
| Idle Average * (Watt) | 24.27 | 16 34% | 16 34% | 17.4 28% | 10 59% | 13.1 46% | 16.1 34% | 15.8 ? 35% | 10 ? 59% |
| Idle Maximum * (Watt) | 25.12 | 19 24% | 16.9 33% | 21.8 13% | 15 40% | 18.3 27% | 17 32% | 20.1 ? 20% | 12.2 ? 51% |
| Load Average * (Watt) | 52.4 | 147 -181% | 104 -98% | 96.4 -84% | 86 -64% | 116 -121% | 100.6 -92% | 88 ? -68% | 64.8 ? -24% |
| Witcher 3 ultra * (Watt) | 110.2 | 147.8 -34% | 142 -29% | 125 -13% | 160.6 -46% | 117.6 -7% | 158 -43% | ||
| Load Maximum * (Watt) | 146 | 244 -67% | 214 -47% | 204 -40% | 172 -18% | 162 -11% | 192 -32% | 176.3 ? -21% | 111.7 ? 23% |
* ... mindre är bättre
Power Consumption: The Witcher 3 / Stress test
Power Consumption: External monitor
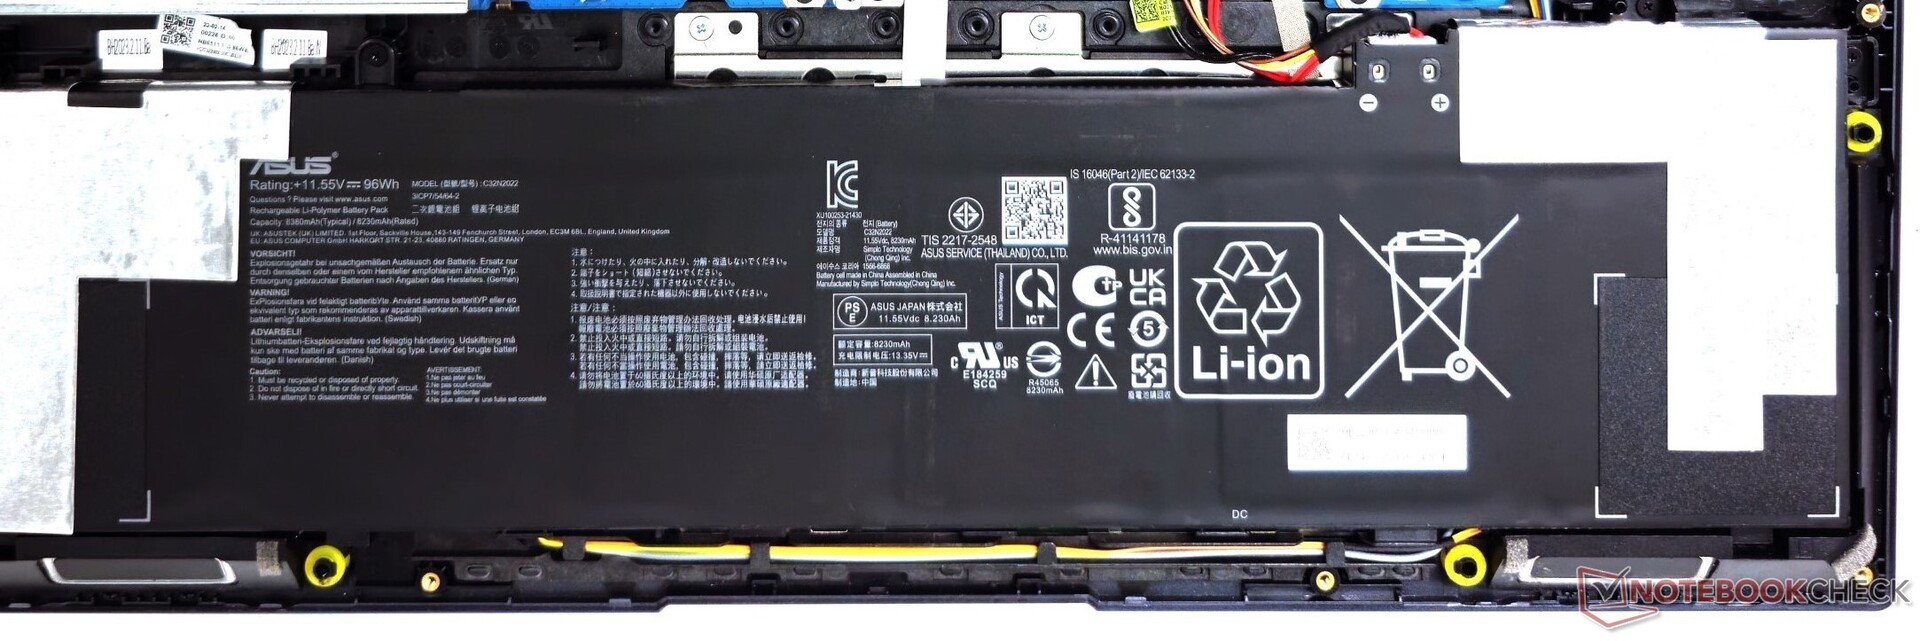
Batteritid
Batteriet på 96 WHr är en markant förbättring jämfört med 70 WHr-kapaciteten i förra årets modell. Batteriet klarar ~10 timmars drifttid vid webbsurfning och uppspelning av H.264 1080p-video vid 150 nits.
Den medföljande nätadaptern kan snabbladda batteriet till 50% på ca 30 minuter.
| Asus VivoBook Pro 16 K6602VU i9-13900H, GeForce RTX 4050 Laptop GPU, 96 Wh | Asus Vivobook Pro 16X K6604JV-MX016W i9-13980HX, GeForce RTX 4060 Laptop GPU, 90 Wh | Asus ROG Flow X16 GV601V i9-13900H, GeForce RTX 4060 Laptop GPU, 90 Wh | Lenovo Legion Pro 5 16ARX8 (R5 7645HX, RTX 4050) R5 7645HX, GeForce RTX 4050 Laptop GPU, 80 Wh | Asus TUF Gaming A16 FA617XS R9 7940HS, Radeon RX 7600S, 90 Wh | Asus VivoBook Pro 16 i7-12700H, GeForce RTX 3050 Ti Laptop GPU, 70 Wh | Gigabyte AERO 16 OLED BSF i9-13900H, GeForce RTX 4070 Laptop GPU, 88 Wh | Genomsnitt av klass Multimedia | |
|---|---|---|---|---|---|---|---|---|
| Batteridrifttid | -41% | -16% | -45% | 25% | -28% | -25% | 43% | |
| H.264 (h) | 9.8 | 5.3 -46% | 8.9 -9% | 5.4 -45% | 12.4 27% | 7.4 -24% | 16.4 ? 67% | |
| WiFi v1.3 (h) | 10.1 | 6.5 -36% | 7.9 -22% | 5.6 -45% | 12.4 23% | 7.3 -28% | 7.5 -26% | 12 ? 19% |
| Load (h) | 1.5 | 1.5 | 0.9 | 2.1 | 1.675 ? | |||
| Witcher 3 ultra (h) | 0.8 | |||||||
| Reader / Idle (h) | 20.3 | 25.2 ? |
För
Emot
Bedömning: Första stoppet innan du spenderar pengar på ProArt-serien
2023 Asus VivoBook Pro 16 K6602VU ger anmärkningsvärda uppgraderingar jämfört med sin föregångare. Även om VivoBook Pro 16 inte är lyxig är den gediget byggd.
Det som sticker ut är den underbara 3,2K 120 Hz OLED-skärmen som lånats från Asus dyrare ProArt-serie, som är utmärkt för både skapande och konsumtion av innehåll. Batteritiden har också förbättrats till cirka 10 timmar tack vare det nya 96 WHr-batteriet.
Asus VivoBook Pro 16 K6602 riktar sig till multimediaanvändare och hobbyskapare, och är den perfekta lösningen innan man överväger den dyrare ProArt StudioBook-serien. Medan Core i9-13900H och RTX 4050-kombinationen kan få de flesta jobb gjorda, kommer kraftanvändare att vilja leta någon annanstans.
Wi-Fi 6E-prestandan skulle kunna optimeras bättre och portplaceringen förbättras. Vår största invändning mot den här bärbara datorn är dock att Asus begränsar potentialen hos Core i9-13900H-processorn genom att begränsa effektgränserna under dess kapacitet.
CPU- och GPU-kombinationen underlevererar Asus påstådda 90 W kombinerade TDP-mål. Trots detta ger den fortfarande gott om prestanda för vardaglig produktivitet och kreativt amatörarbete. RTX 4050 möjliggör till och med anständigt högupplöst spelande med visst stöd från uppskalare.
Trots några få brister är VivoBook Pro 16 en stark utmanare för köpare som söker en väl avrundad multimedia-laptop som kan skapa såväl som spela runt 1,54,990 ₹ (2 199 €).
För dem som gillar VivoBooks estetik men vill ha något ännu mer kraftfullt finns
Asus VivoBook Pro 16X K6604 med Core i9-13980HX vara ett bra val. Den Gigabyte Aero 16 OLED BSF är ett annat genomförbart men dyrt alternativ om du söker en mer premiumkonstruktion och en kraftfull GPU.Pris och tillgänglighet
Den testade konfigurationen av Asus VivoBook Pro 16 OLED K6602VU kan fås för ₹1,54,990 från Asus India Store och Amazon India.
I USA erbjuder Best Buy för närvarande VivoBook Pro 16 K6602VV med RTX 4060 för 1 700 USD medan Amazon US lagrar den för 1 673 USD. FHD+-varianten av denna SKU kan fås för 1 300 USD på Amazon US.
Asus VivoBook Pro 16 K6602VU
- 11/09/2023 v7 (old)
Vaidyanathan Subramaniam
Genomskinlighet
Valet av enheter som ska granskas görs av vår redaktion. Testprovet gavs till författaren som ett lån av tillverkaren eller återförsäljaren för denna recension. Långivaren hade inget inflytande på denna recension och inte heller fick tillverkaren en kopia av denna recension innan publiceringen. Det fanns ingen skyldighet att publicera denna recension. Som ett oberoende medieföretag är Notebookcheck inte föremål för auktoritet från tillverkare, återförsäljare eller förlag.
This is how Notebookcheck is testingEvery year, Notebookcheck independently reviews hundreds of laptops and smartphones using standardized procedures to ensure that all results are comparable. We have continuously developed our test methods for around 20 years and set industry standards in the process. In our test labs, high-quality measuring equipment is utilized by experienced technicians and editors. These tests involve a multi-stage validation process. Our complex rating system is based on hundreds of well-founded measurements and benchmarks, which maintains objectivity.
Price comparison

