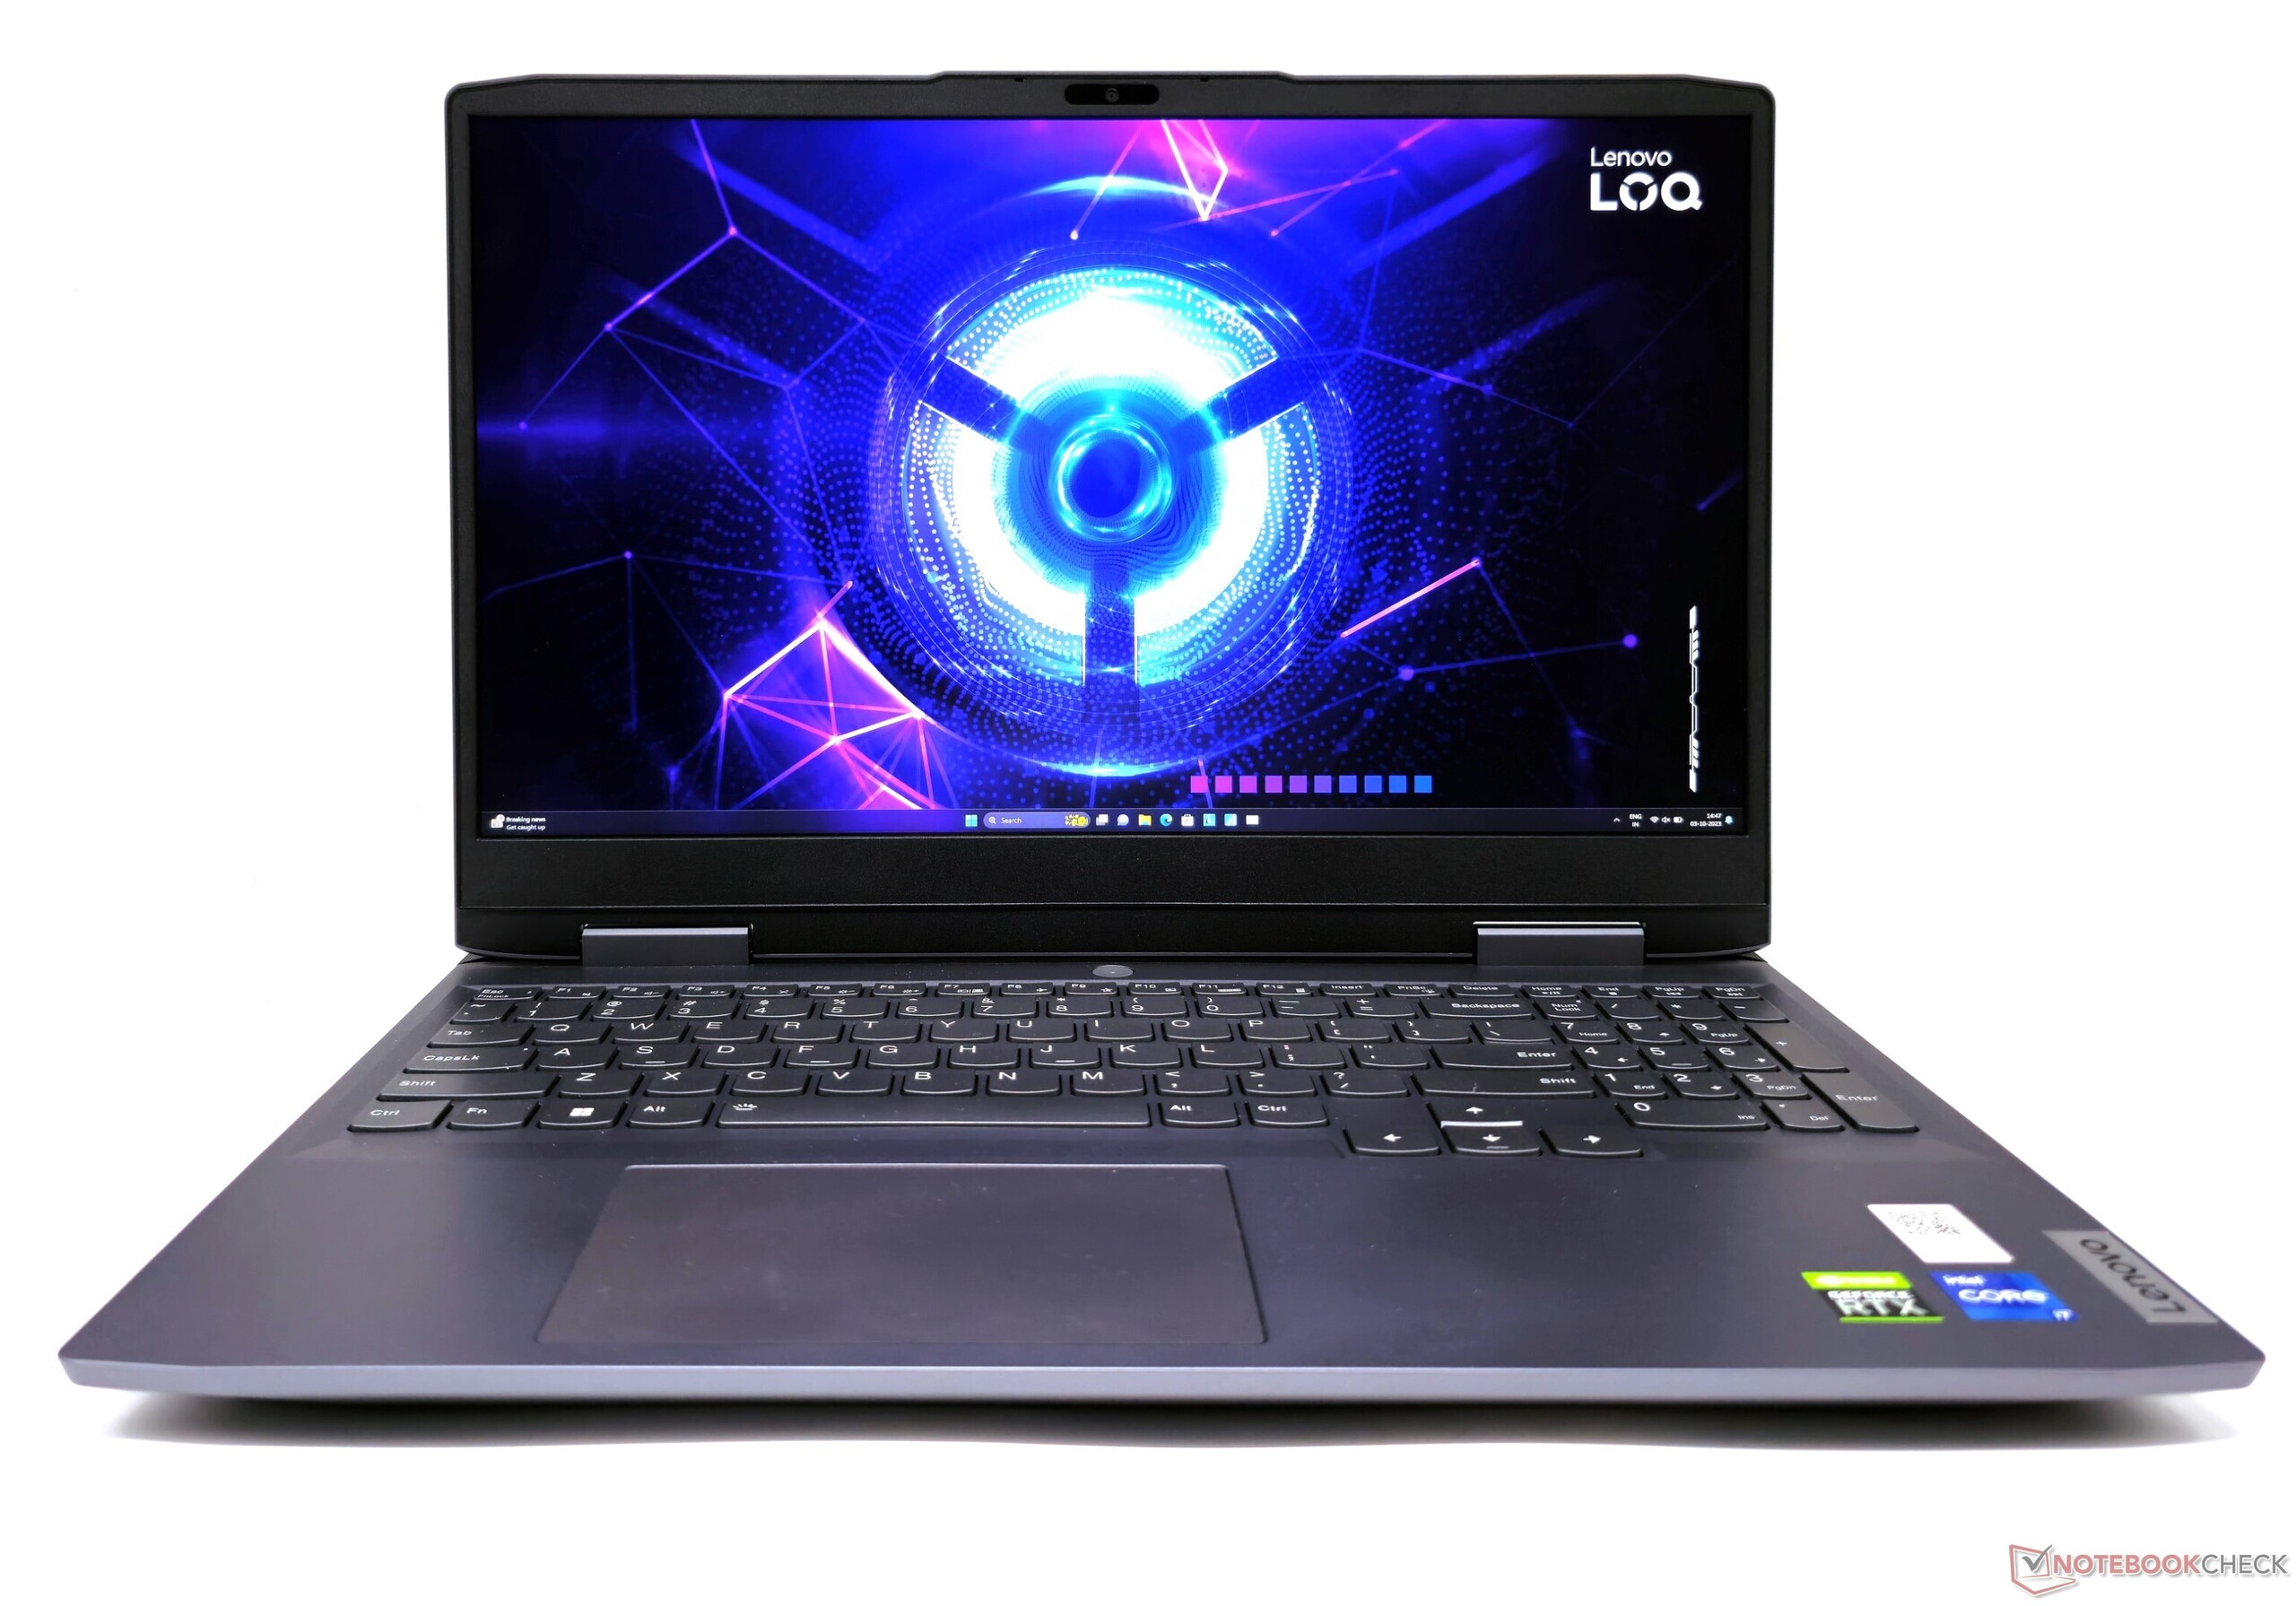
Lenovo LOQ 15 Core i7 recension: Prisvärt Legion -alternativ som ställer Intel vs AMD mot varandra

Lenovo LOQ-serien är inriktad på budgetspelare på nybörjarnivå som liknar Dell G-serien, HP Victus, Asus TUF, MSI Katana och Acer Nitro-uppställningarna. Vi granskade nyligen LOQ 15APH8 med enAMD Ryzen 7 7840HSochNvidia RTX 4050 bärbar GPU. Den LOQ 16IRH8 kombinerade på samma sätt Intel- och Nvidia-kisel genom att para ihop en Core i7-13620H med RTX 4060 grafik.
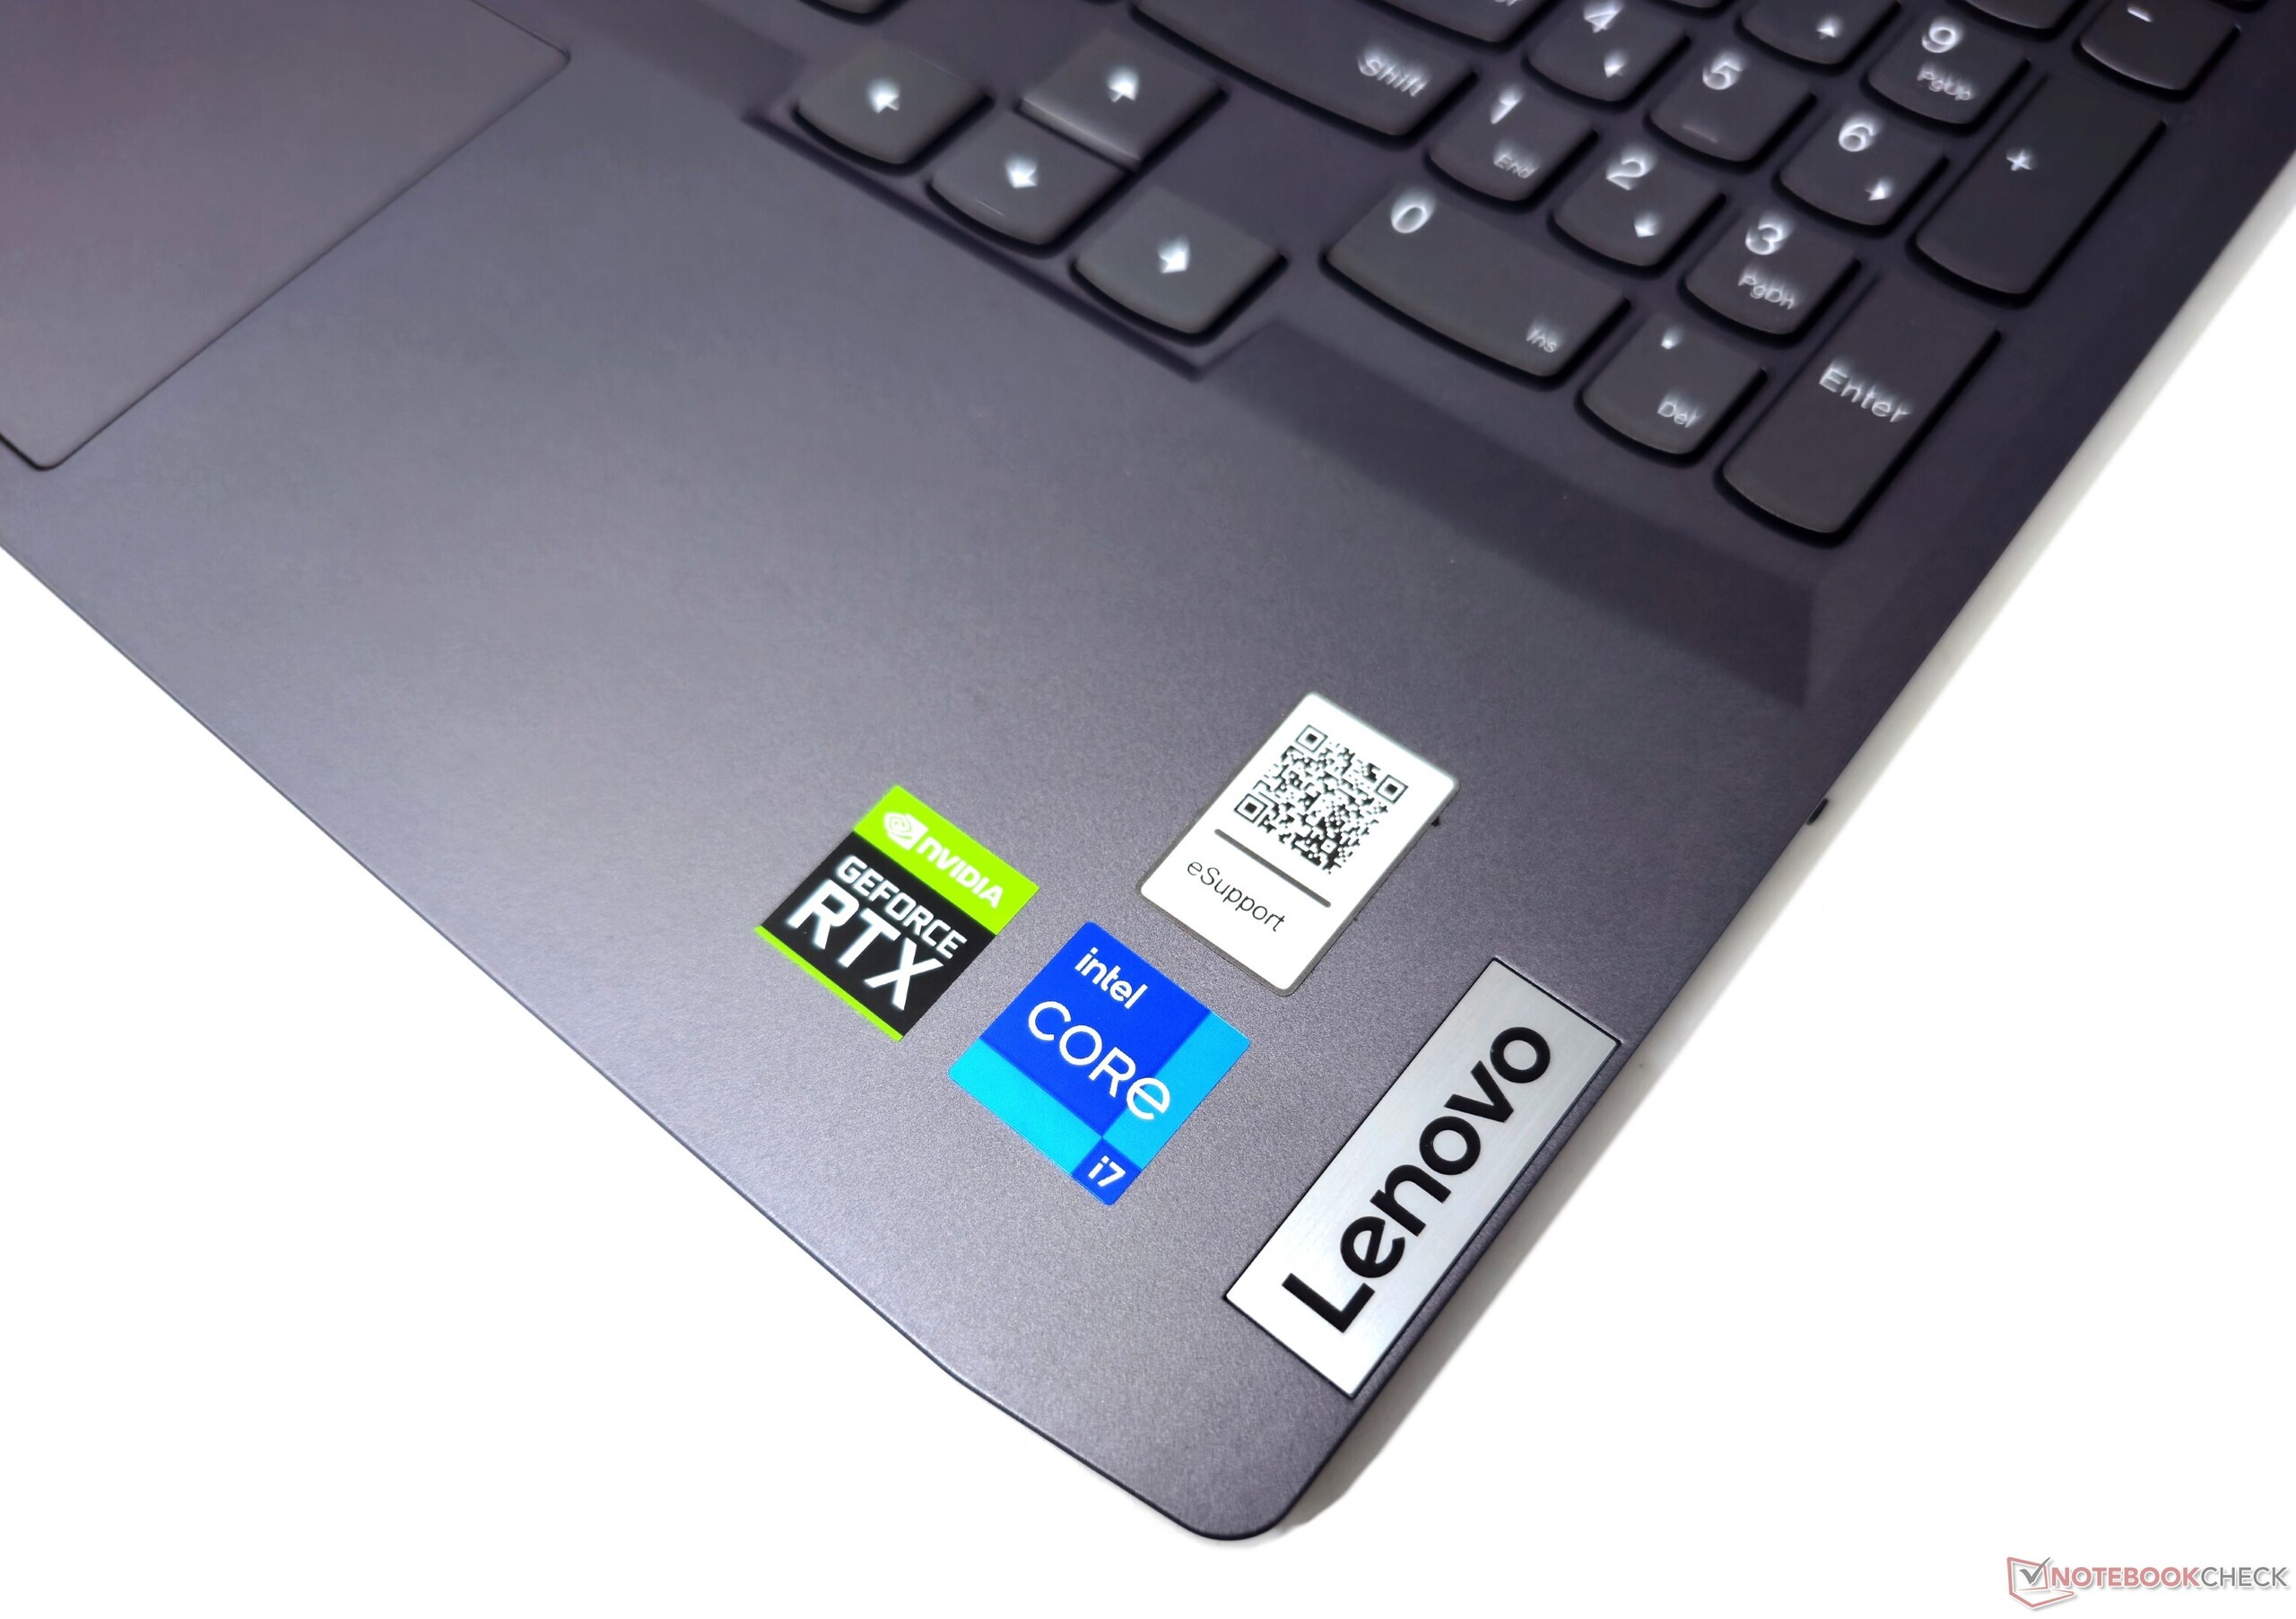
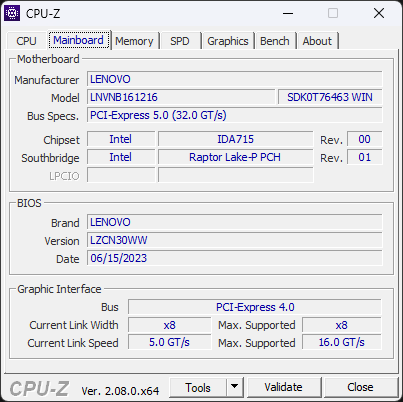
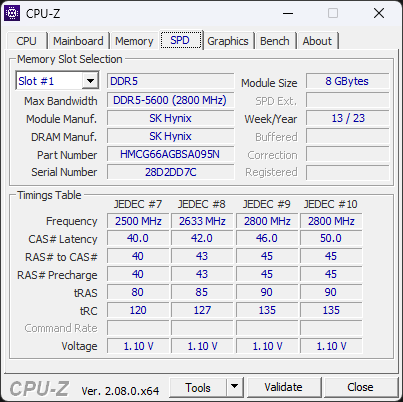
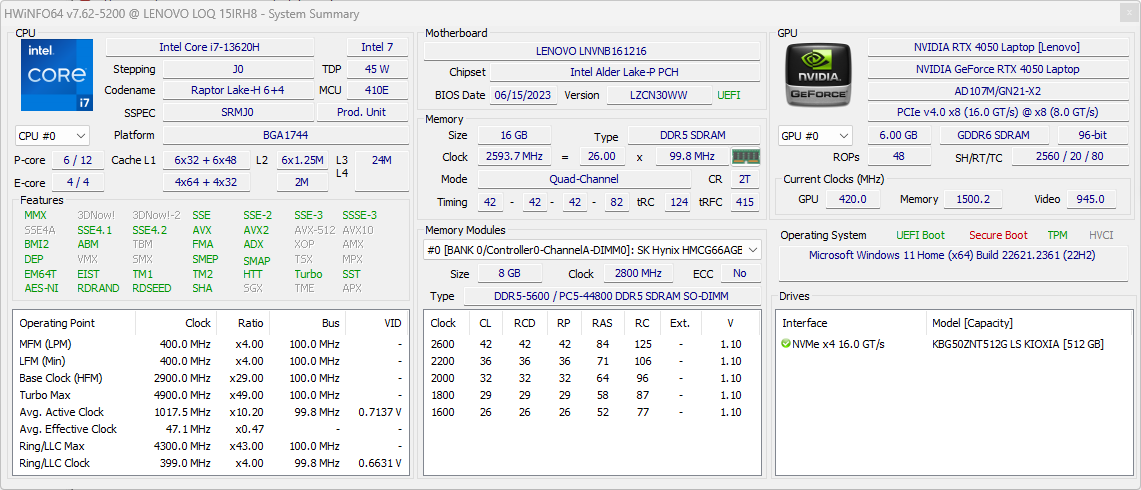
I våra labb finns nu 15-tums LOQ 15IRH8, som drivs av Core i7-13620H och RTX 4050. Vår testmodell är även utrustad med 16 GB DDR5-5200-minne, en 512 GB PCIe Gen4 NVMe SSD och en 165 Hz QHD G-Sync-skärm.
Denna konfiguration i övre mellanklassen kostar 1 01 988 ₹ (1 224 USD) i Indien, medan varianten med 1080p 144 Hz går att få för 97 790 ₹ (1 050 USD).
Potentiella konkurrenter i jämförelse
Gradering | Datum | Modell | Vikt | Höjd | Storlek | Upplösning | Pris |
|---|---|---|---|---|---|---|---|
| 85.9 % v7 (old) | 10/2023 | Lenovo LOQ 15IRH8 Core i7 i7-13620H, GeForce RTX 4050 Laptop GPU | 2.4 kg | 25.2 mm | 15.60" | 2560x1440 | |
| 87.3 % v7 (old) | 09/2023 | Lenovo LOQ 16IRH8 i7-13620H, GeForce RTX 4060 Laptop GPU | 2.7 kg | 25.9 mm | 16.00" | 2560x1600 | |
| 85.7 % v7 (old) | 07/2023 | Lenovo LOQ 15APH8 R7 7840HS, GeForce RTX 4050 Laptop GPU | 2.5 kg | 25.2 mm | 15.60" | 1920x1080 | |
| 82.1 % v7 (old) | 02/2023 | MSI Katana 17 B13VFK i7-13620H, GeForce RTX 4060 Laptop GPU | 2.8 kg | 25.2 mm | 17.30" | 1920x1080 | |
| 89 % v7 (old) | 08/2023 | Lenovo Legion Pro 5 16ARX8 (R5 7645HX, RTX 4050) R5 7645HX, GeForce RTX 4050 Laptop GPU | 2.5 kg | 27.3 mm | 16.00" | 2560x1600 | |
| 85.1 % v7 (old) | 09/2023 | HP Victus 16-r0077ng i7-13700H, GeForce RTX 4070 Laptop GPU | 2.4 kg | 24 mm | 16.10" | 1920x1080 | |
| 84.2 % v7 (old) | 06/2023 | Dell G15 5530 i7-13650HX, GeForce RTX 4060 Laptop GPU | 3 kg | 26.95 mm | 15.60" | 1920x1080 | |
| 86.9 % v7 (old) | 06/2023 | Asus TUF Gaming A16 FA617XS R9 7940HS, Radeon RX 7600S | 2.2 kg | 22.1 mm | 16.00" | 1920x1200 |
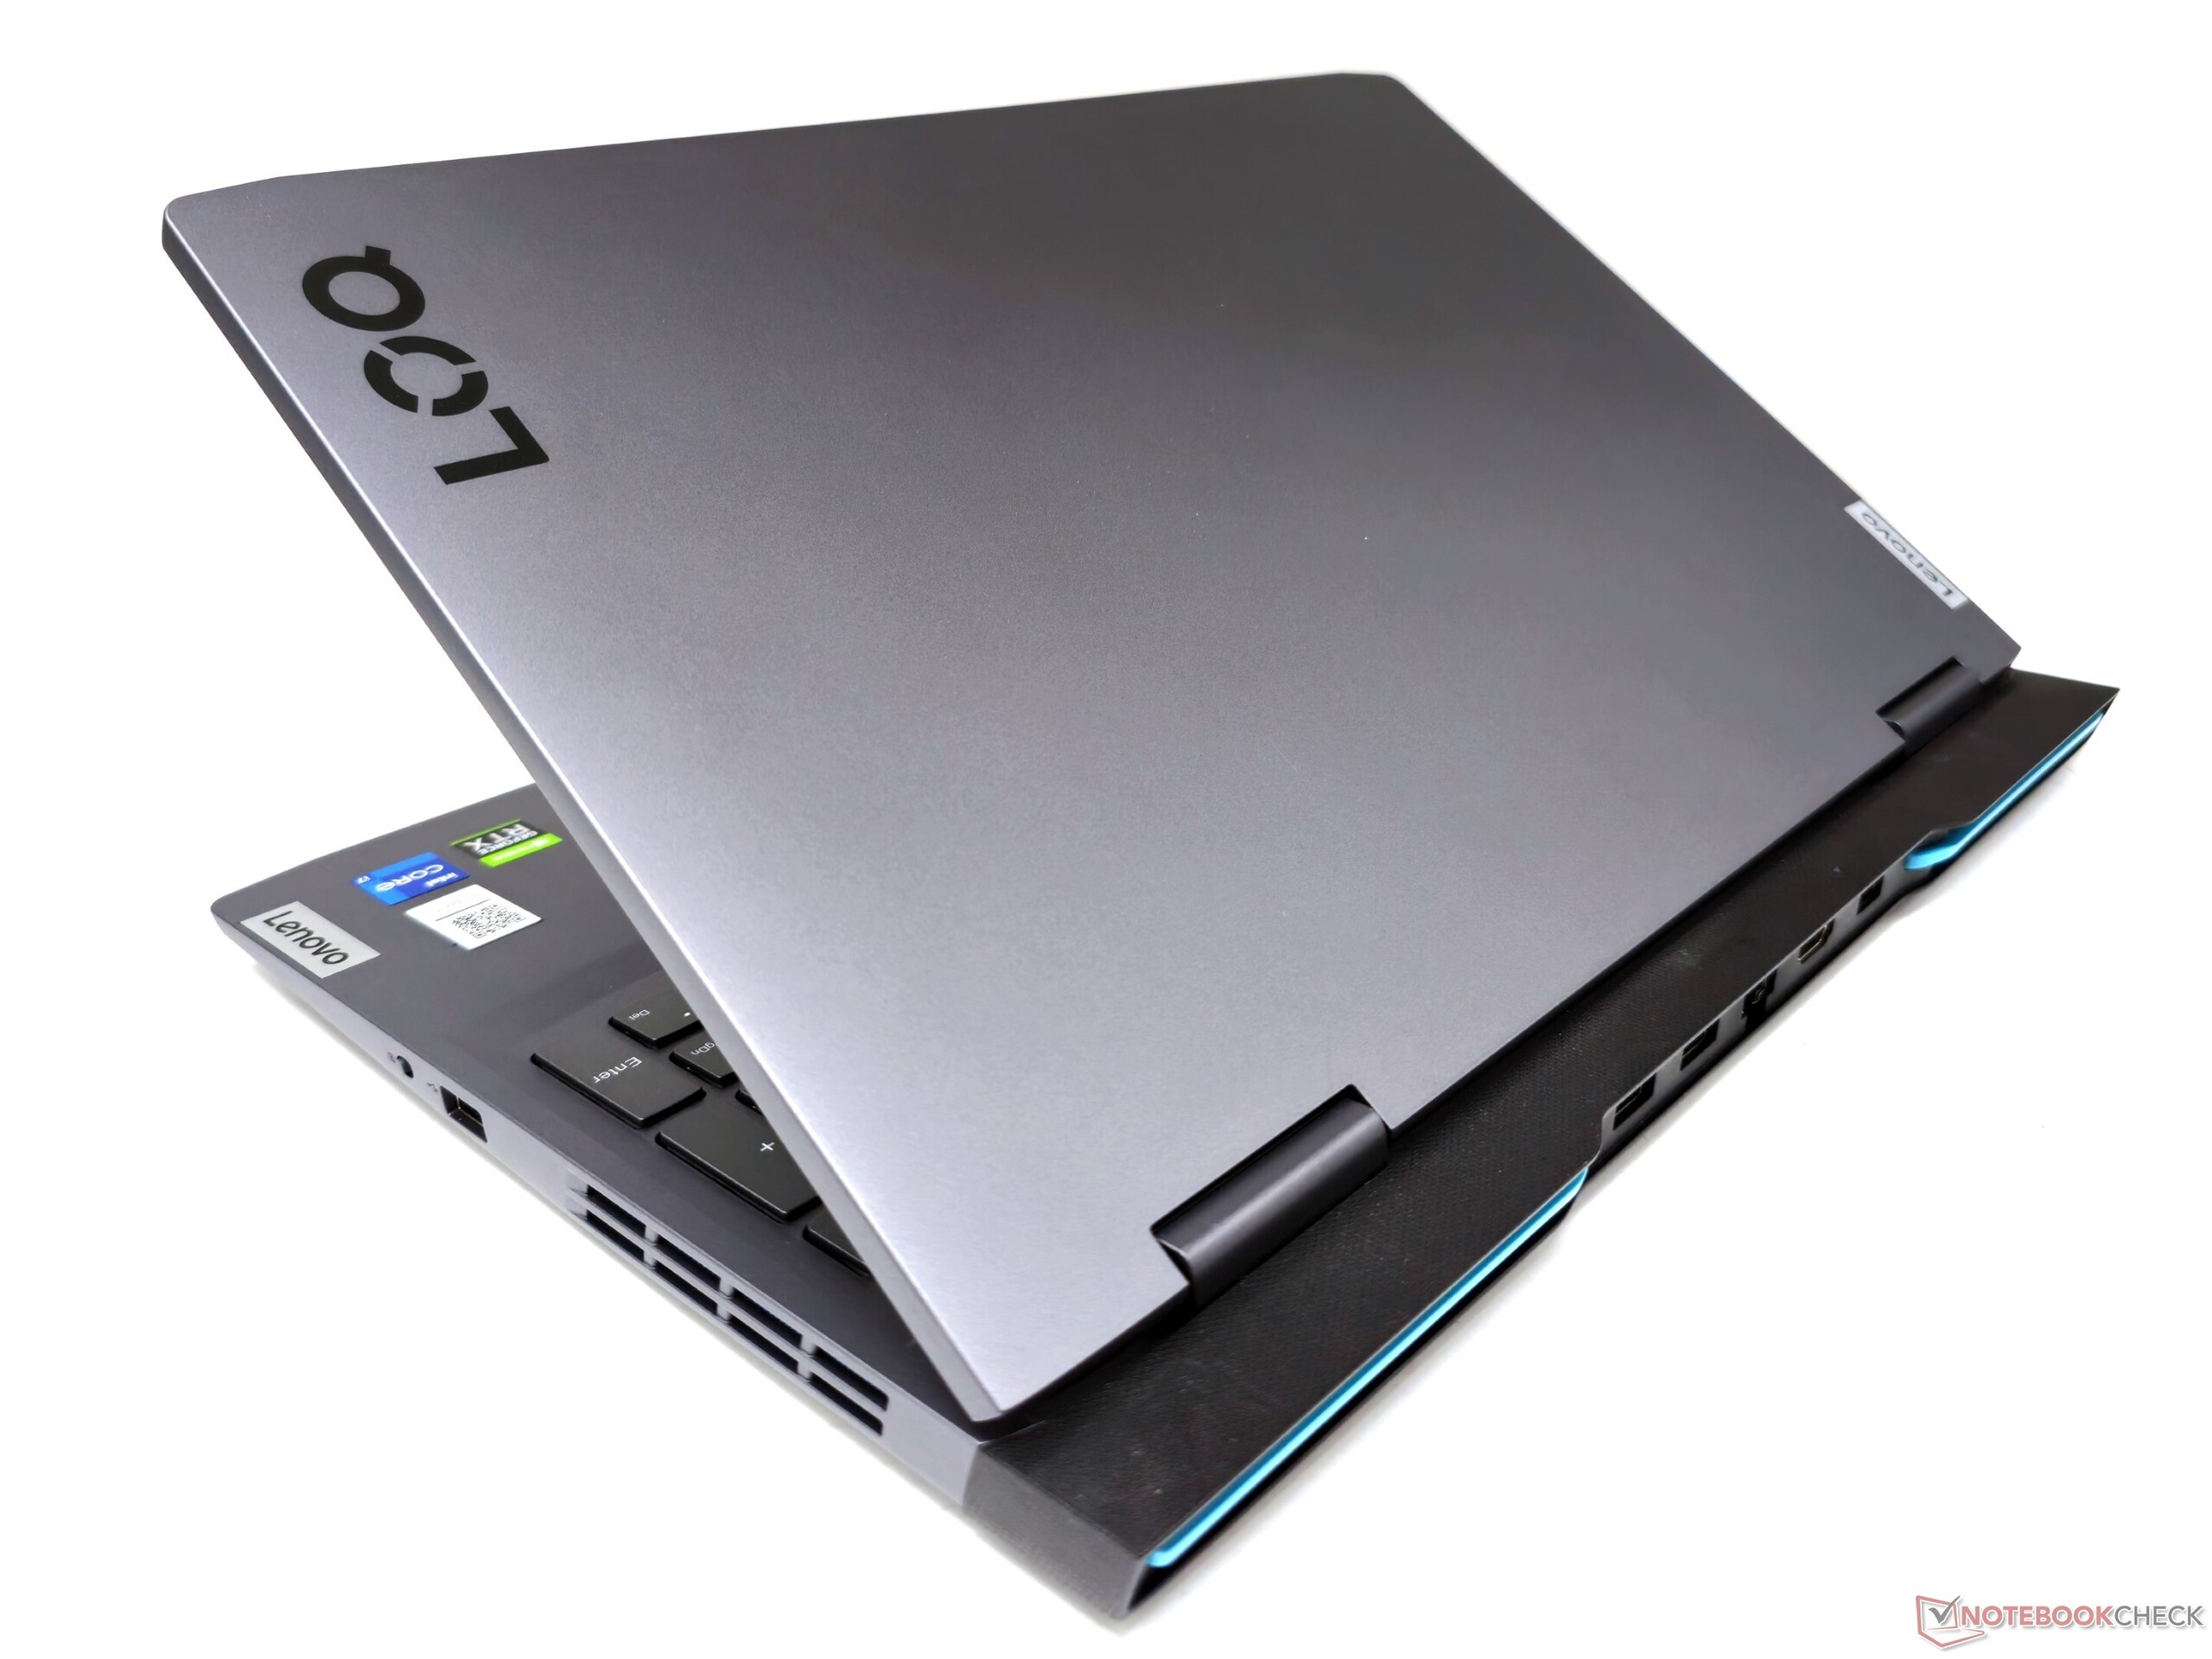
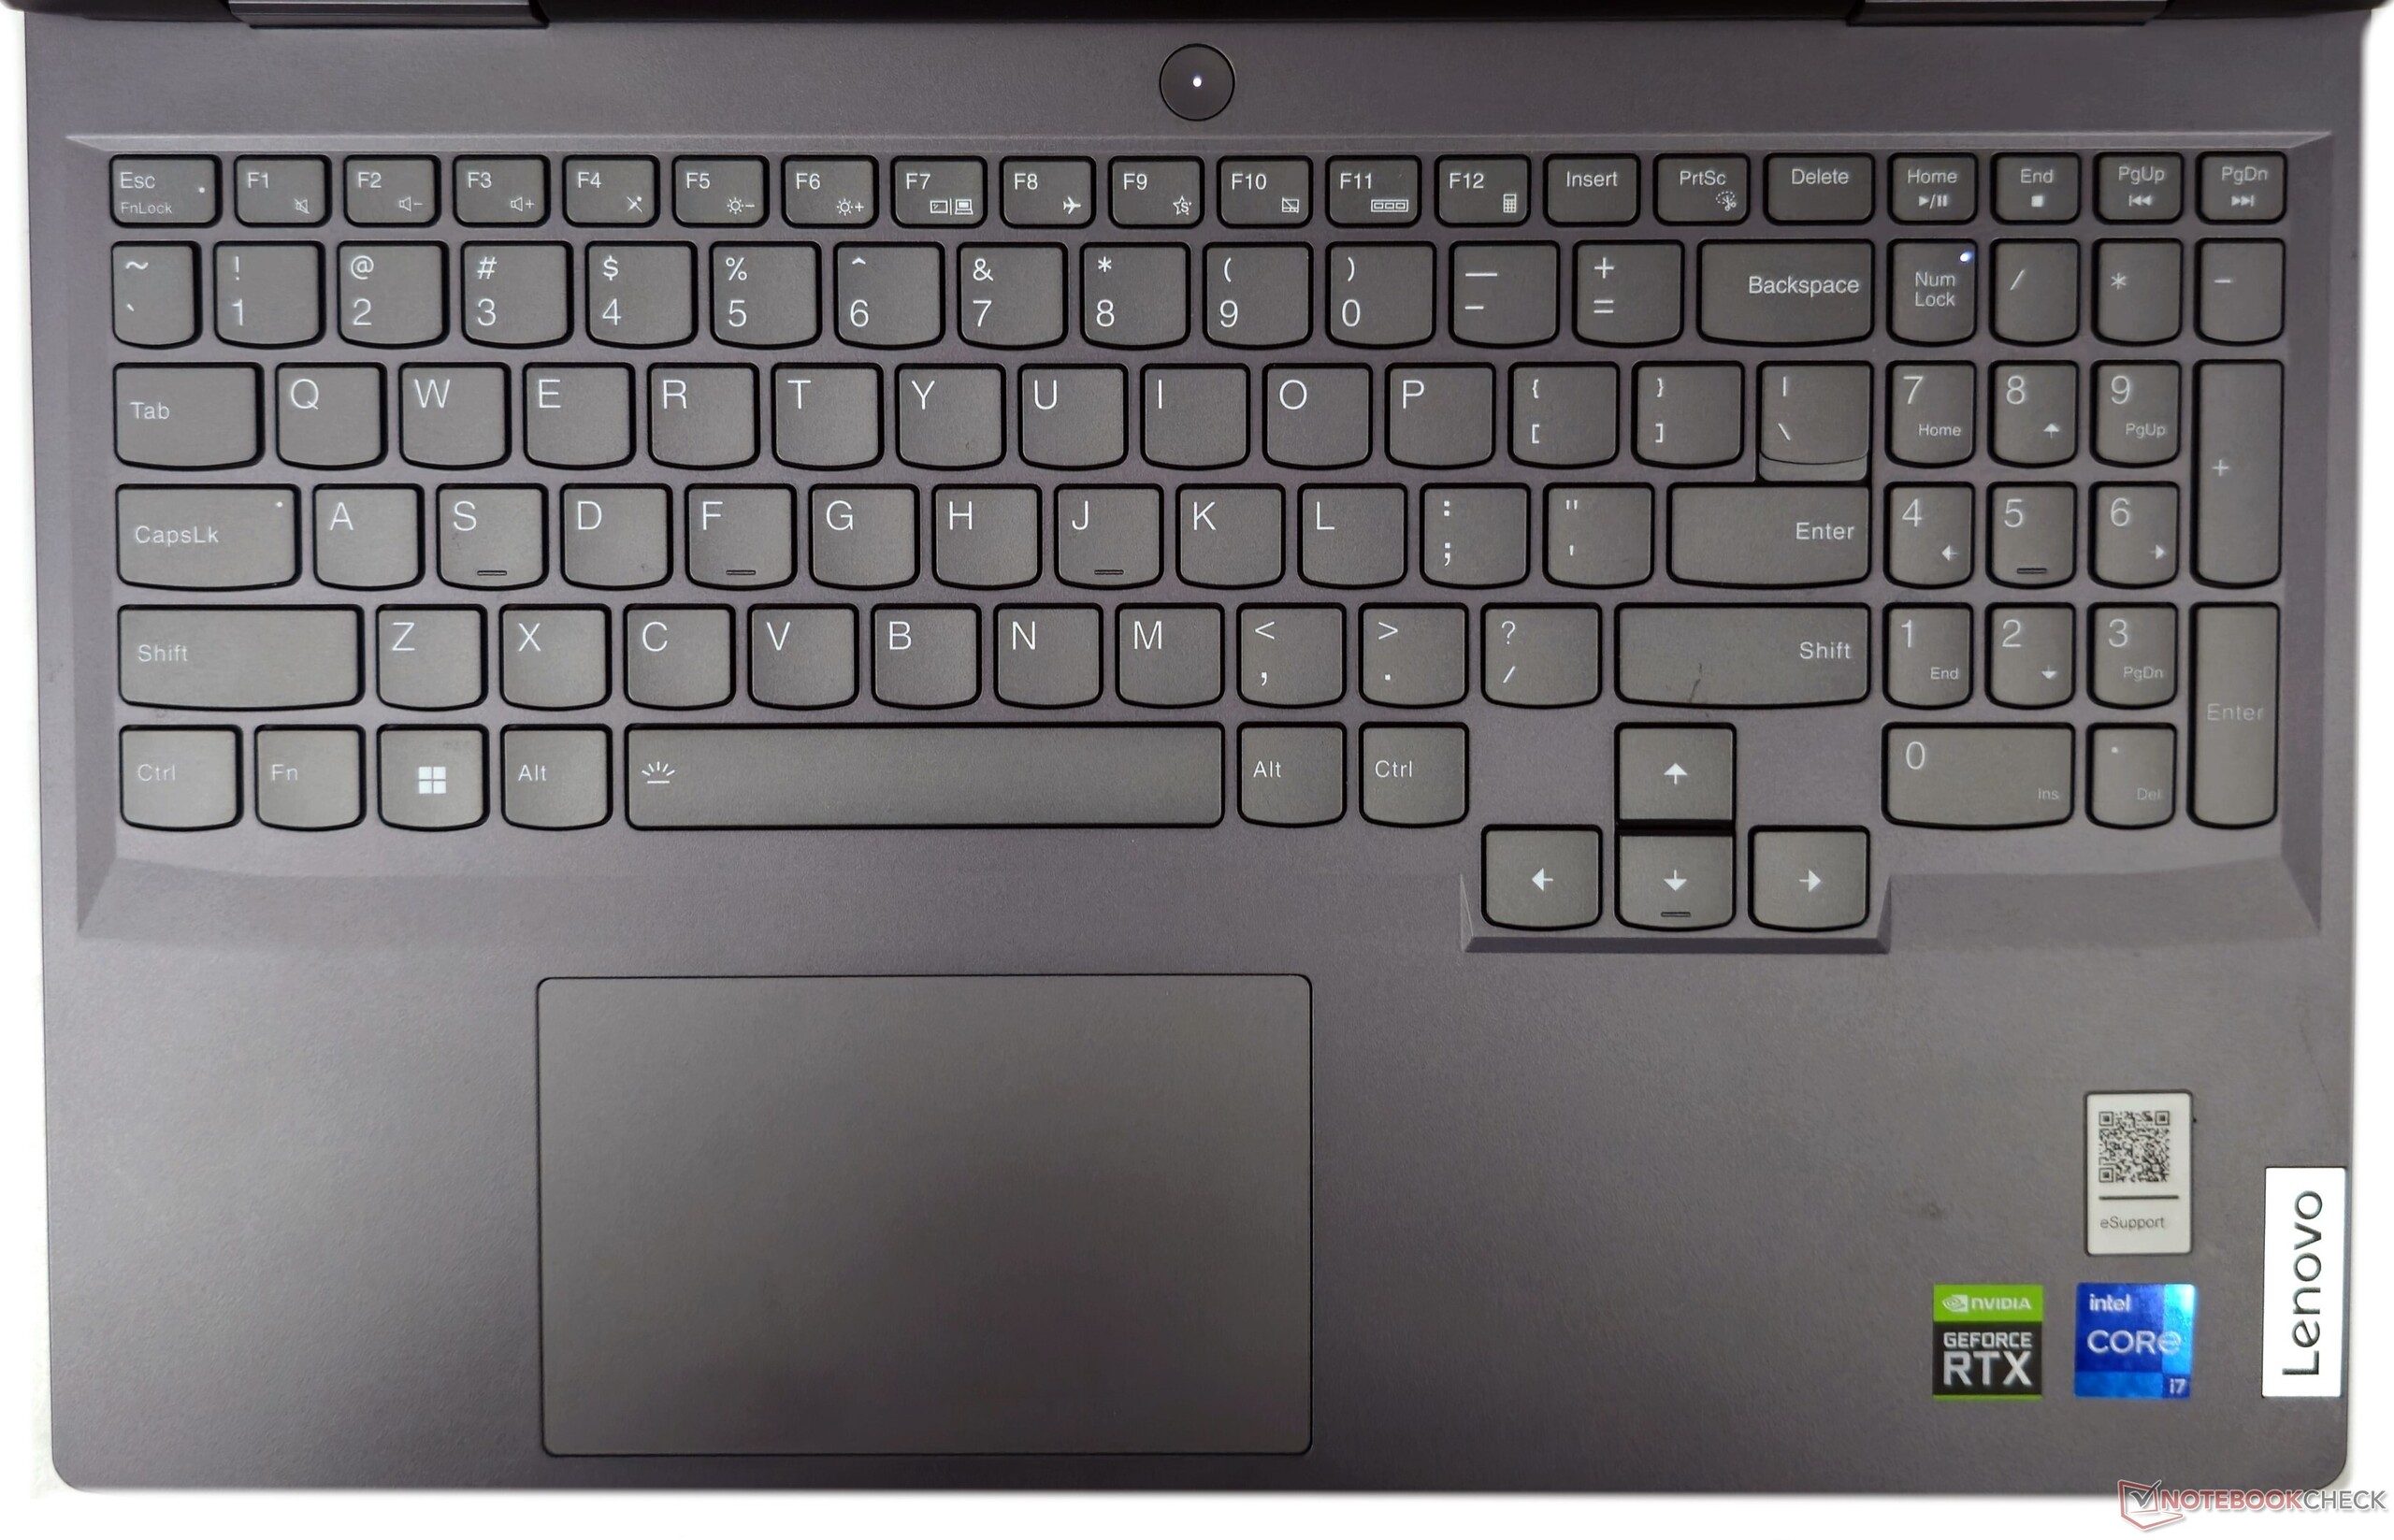
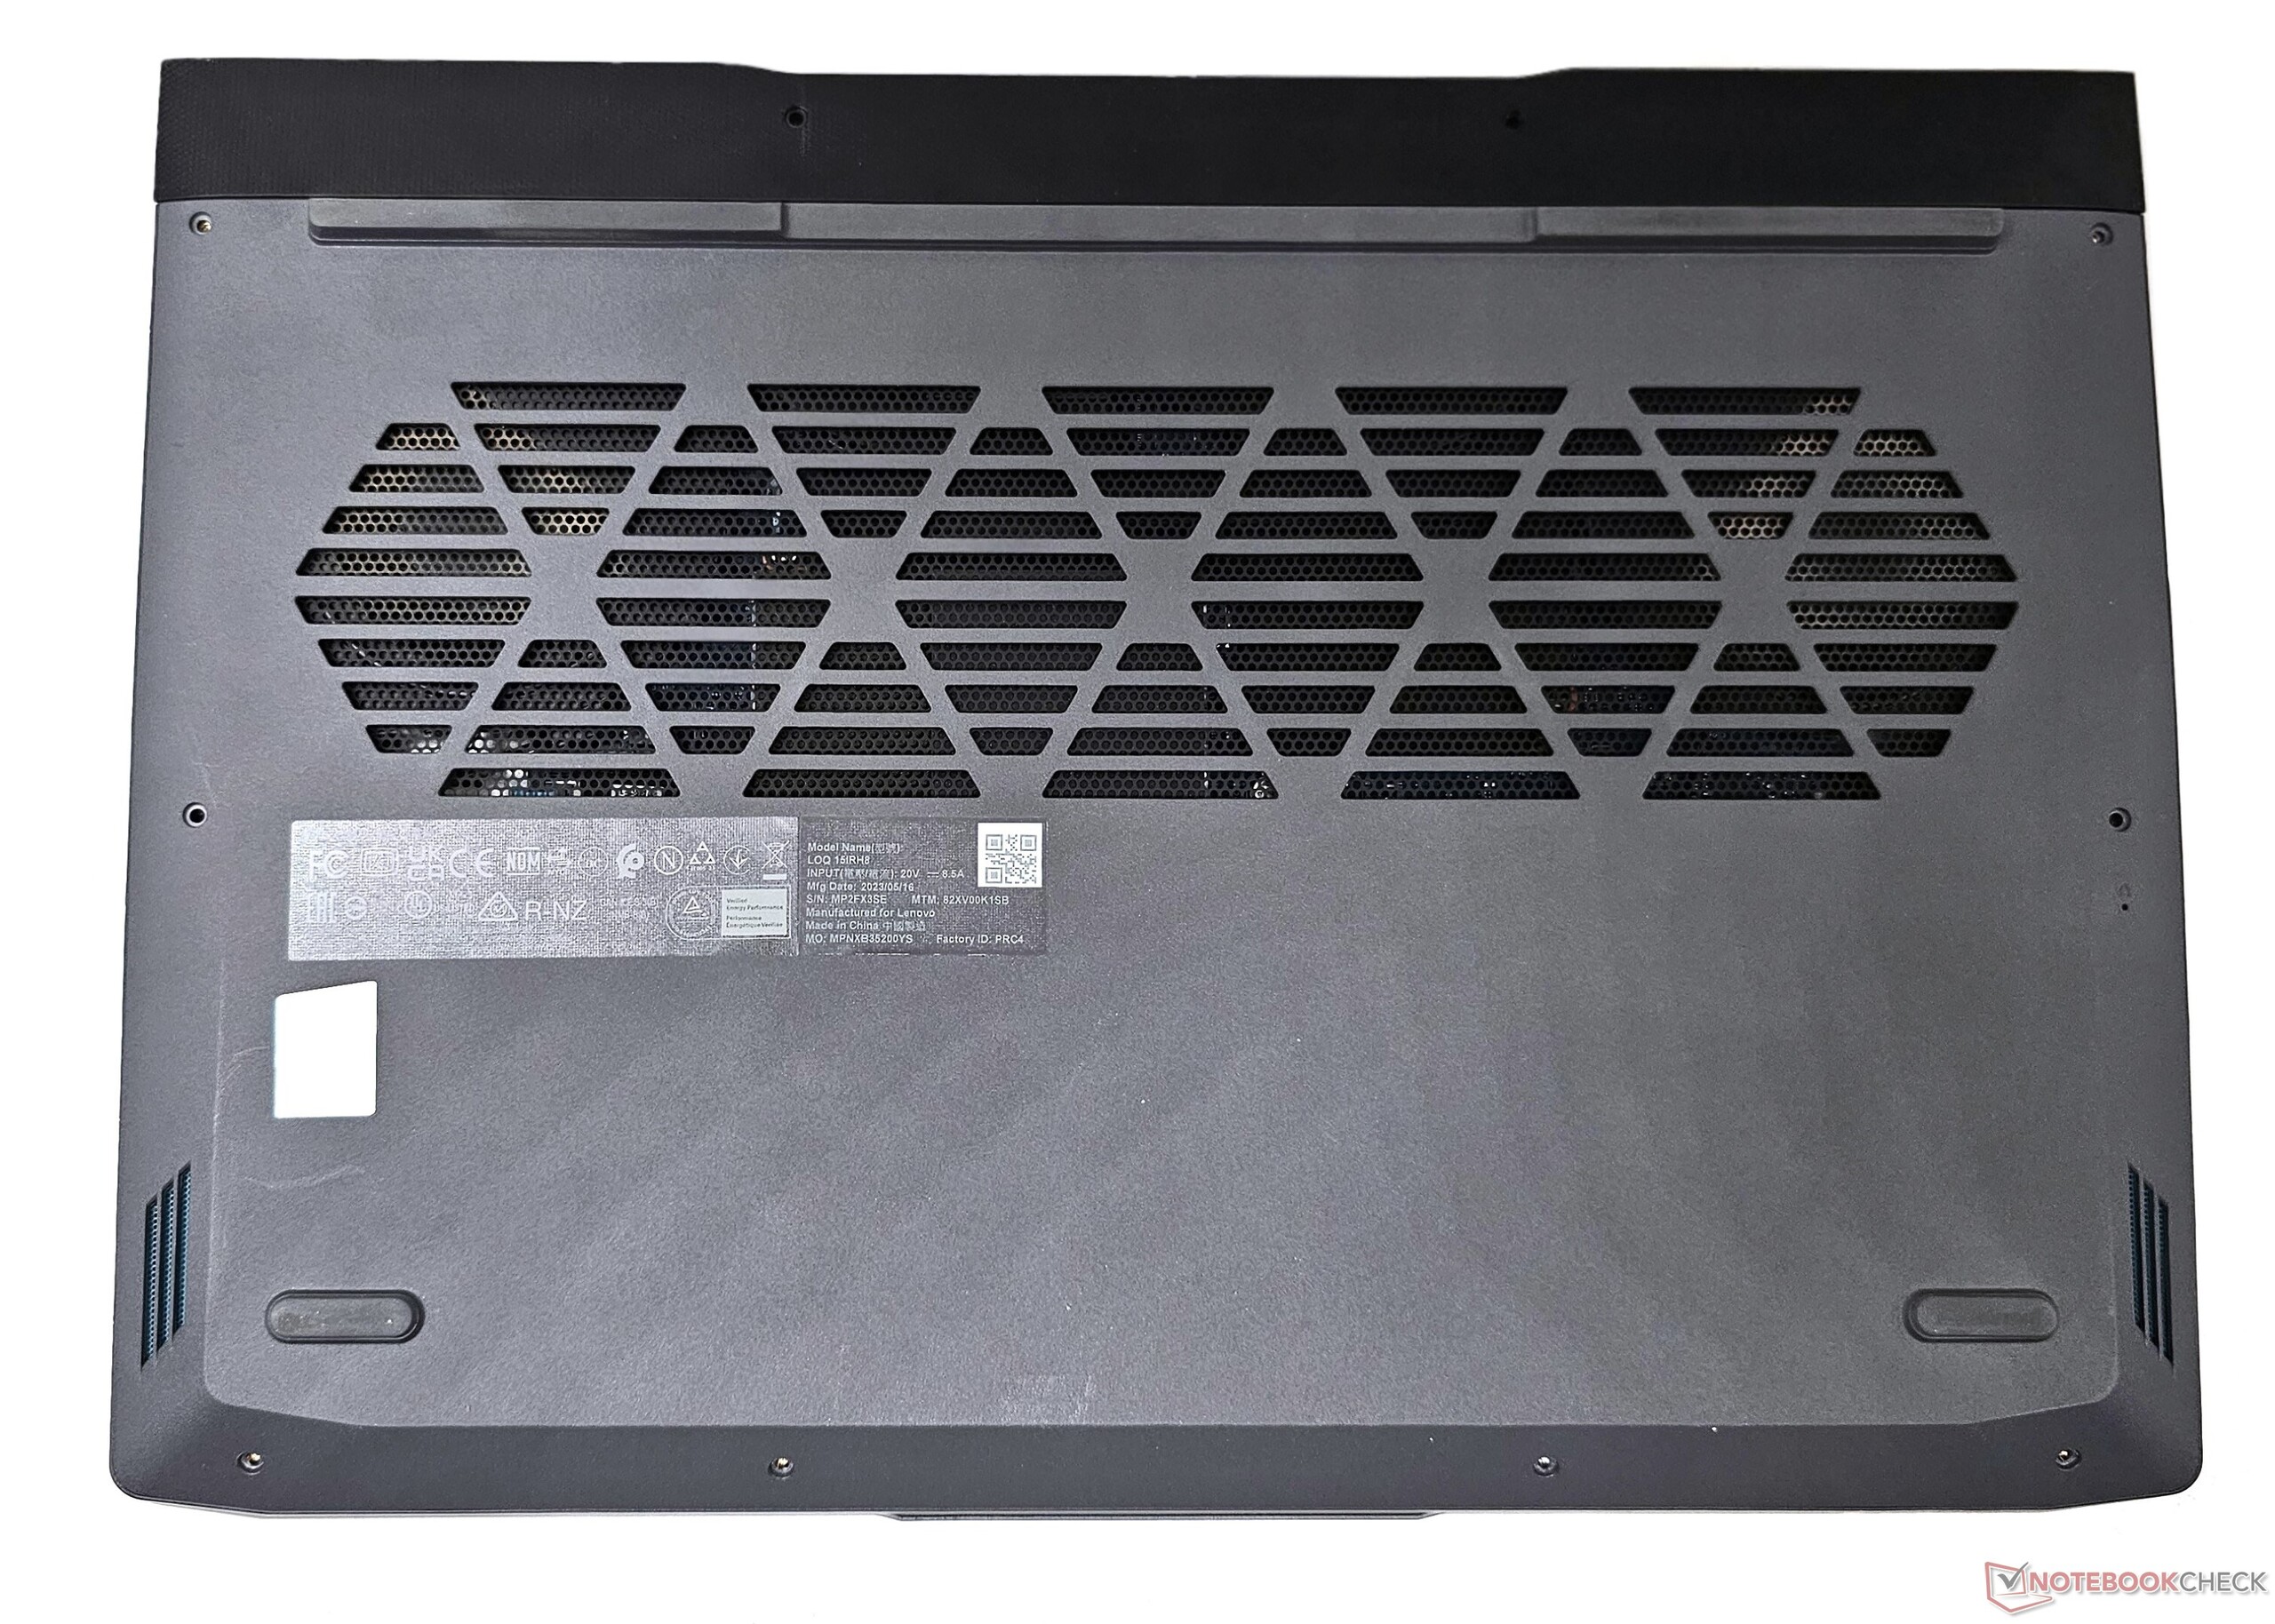
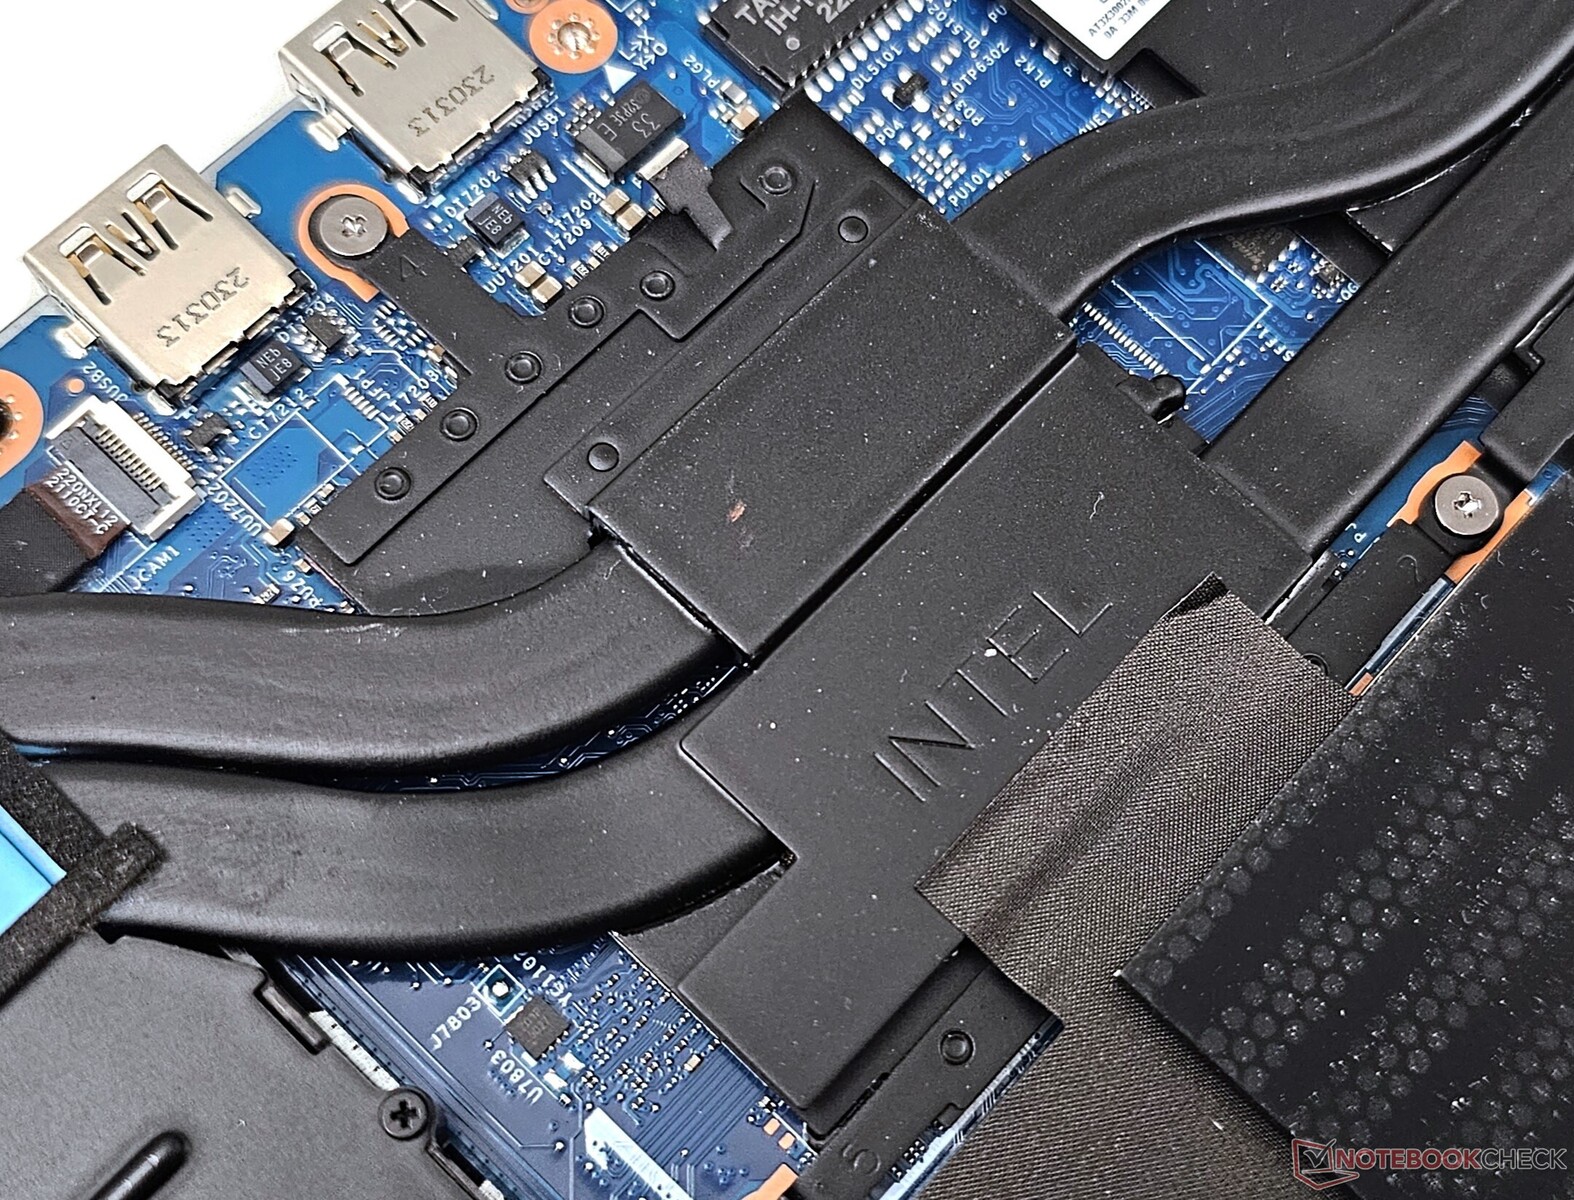
Chassi och inmatningsenheter: Samma plastkonstruktion som AMD-varianten
För mer information om Lenovo LOQ 15IRH8:s chassi, underhåll och inmatningsenheter, vänligen se vår LOQ 15APH8 recension- dessa aspekter är identiska mellan Lenovos Intel- och AMD-baserade LOQ-laptops.
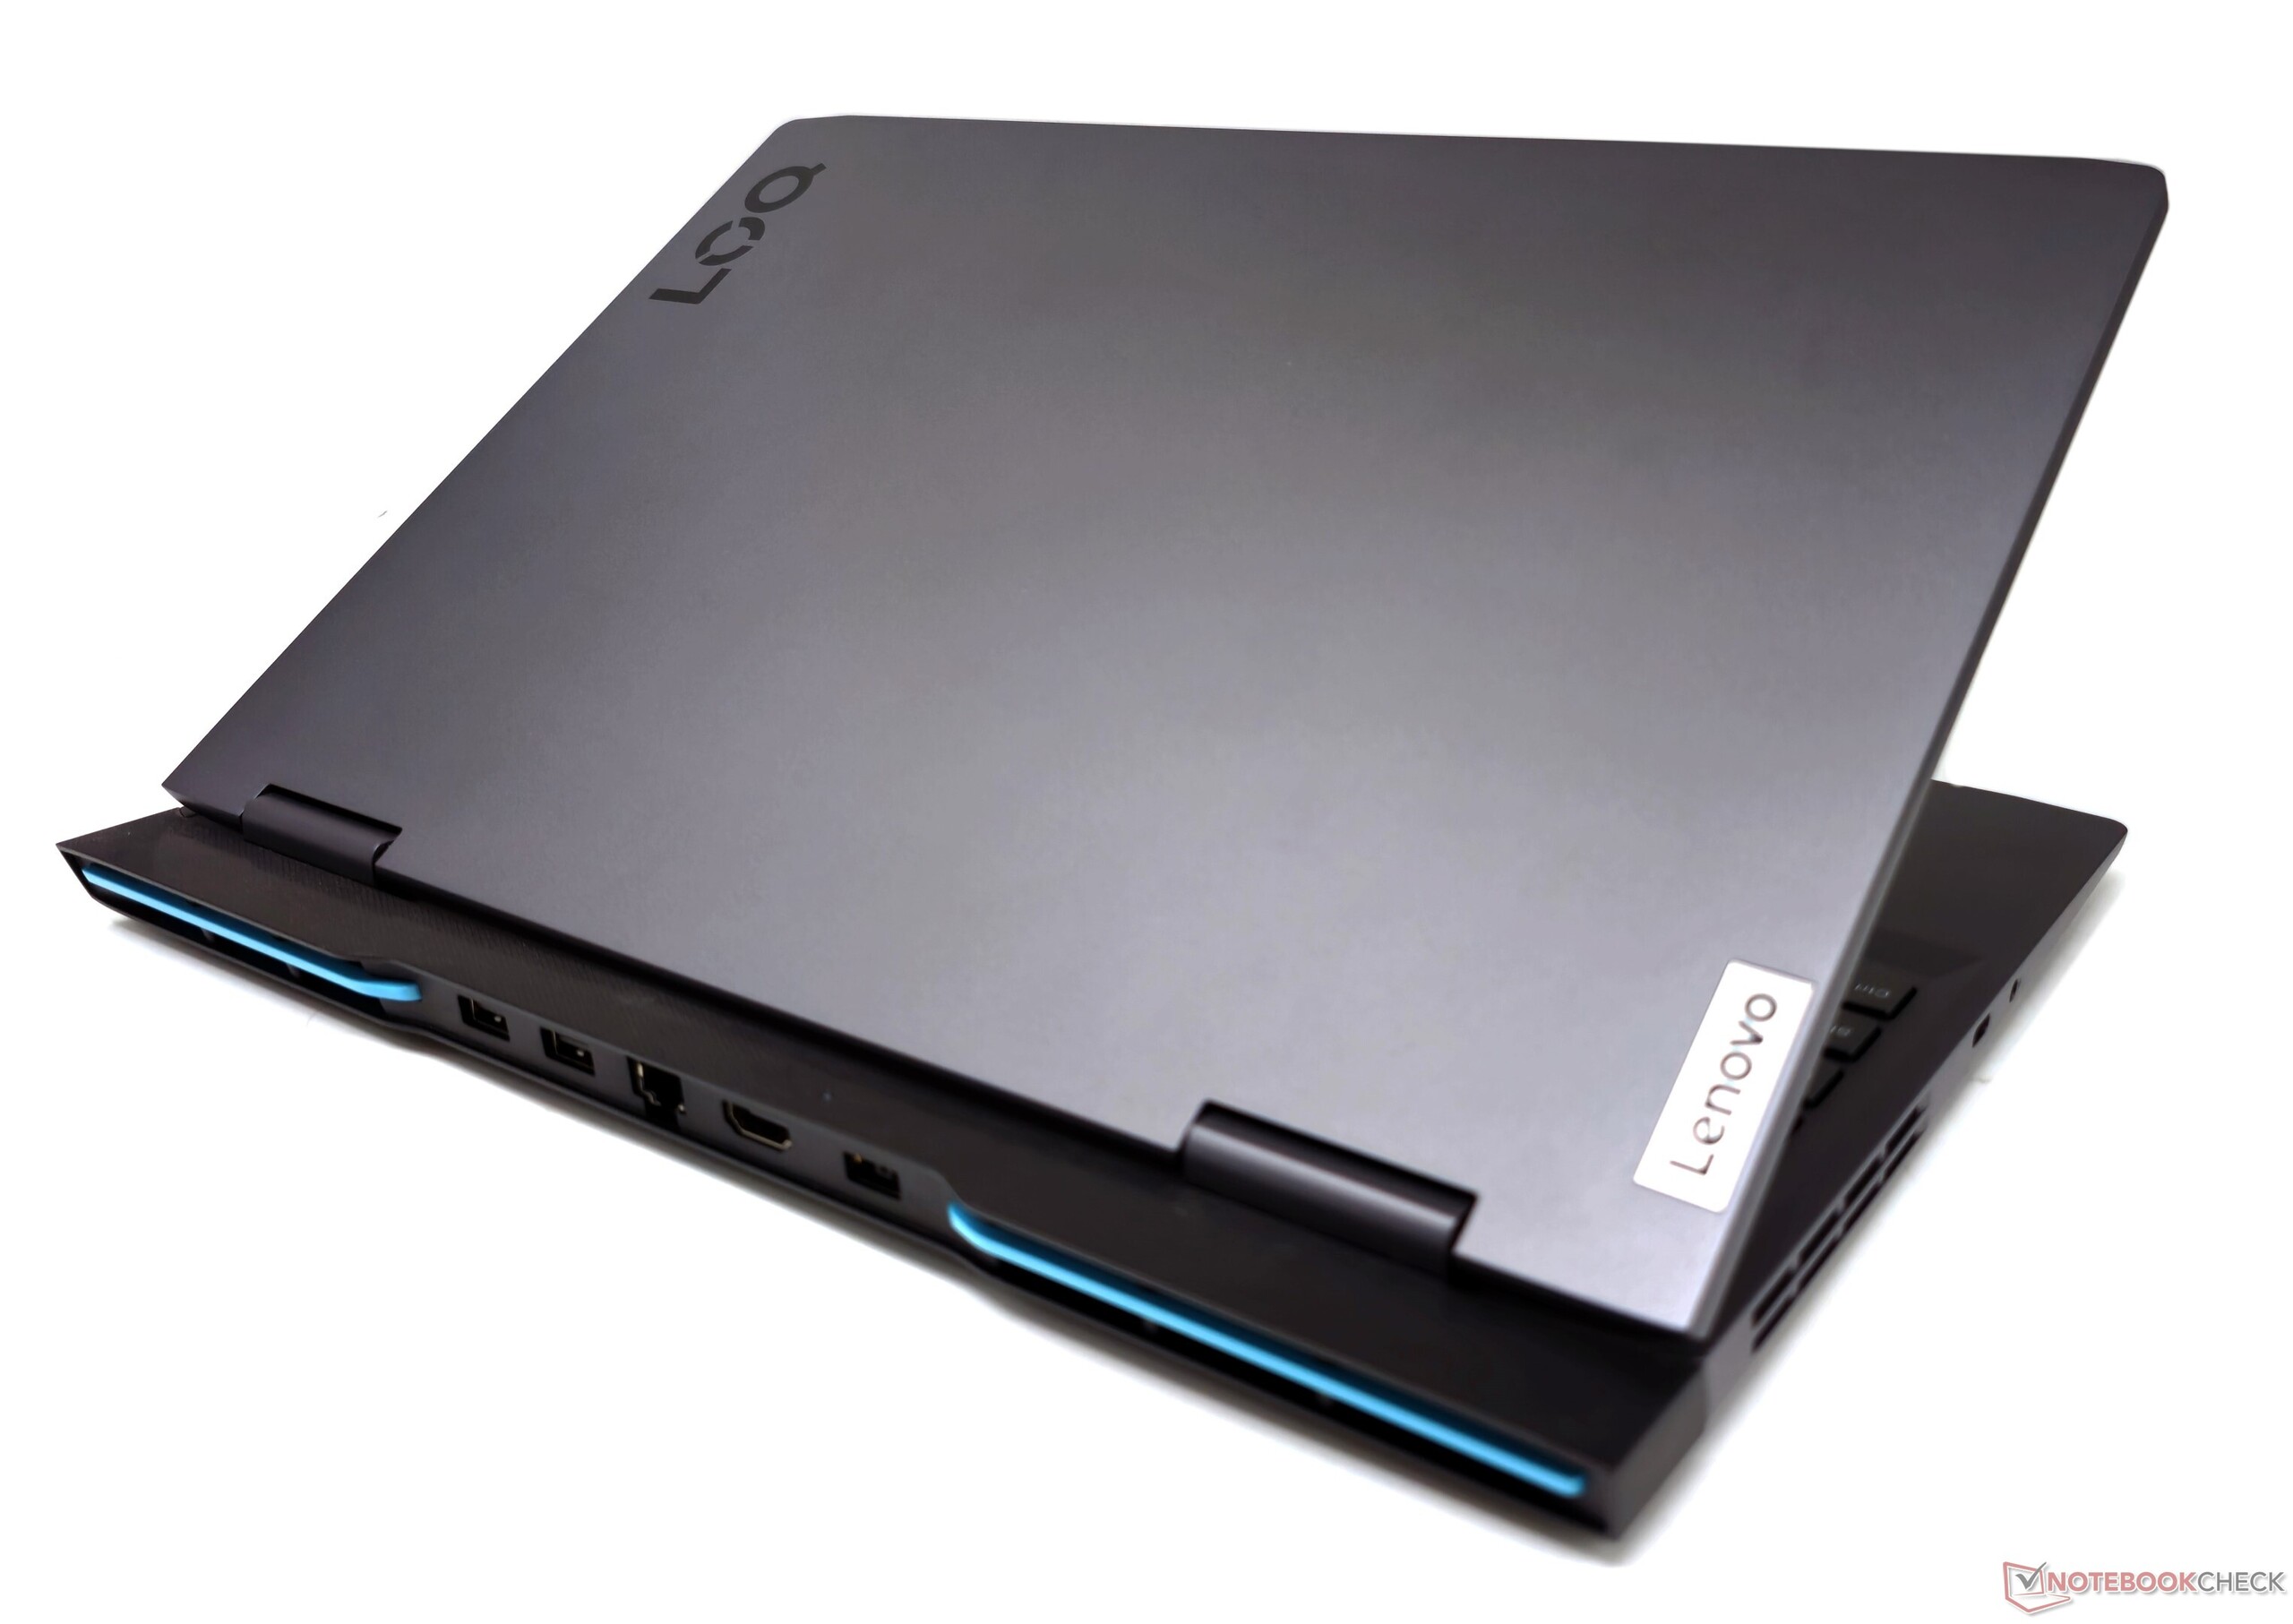
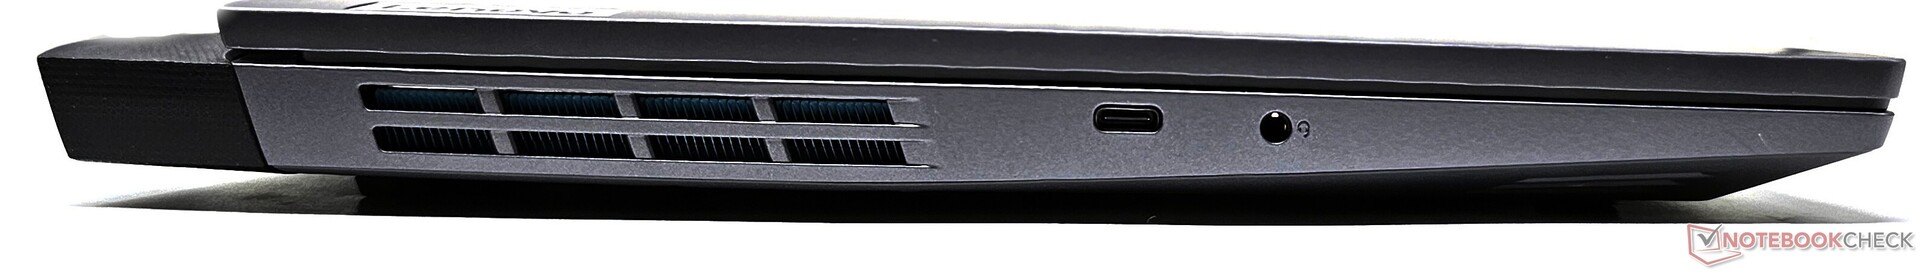
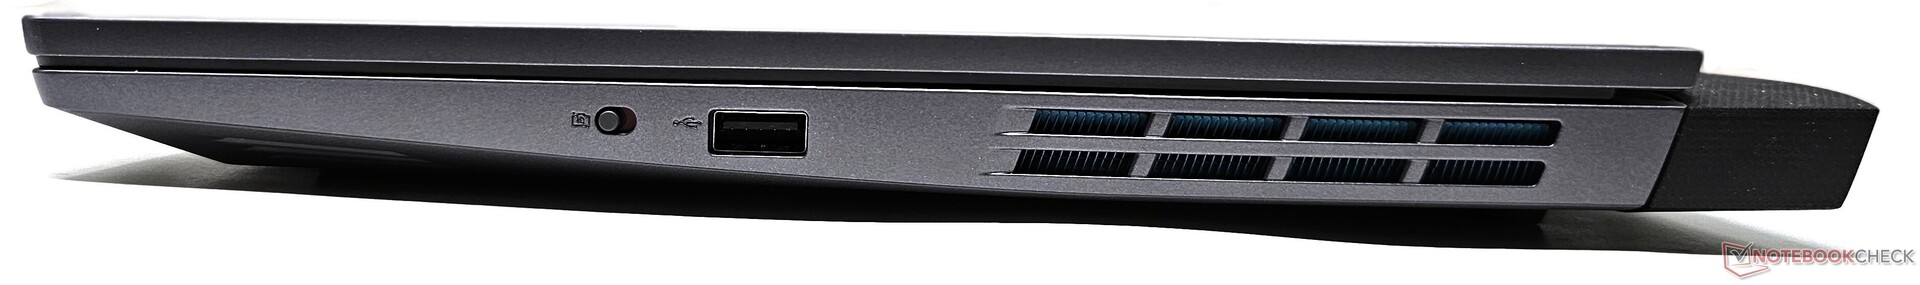
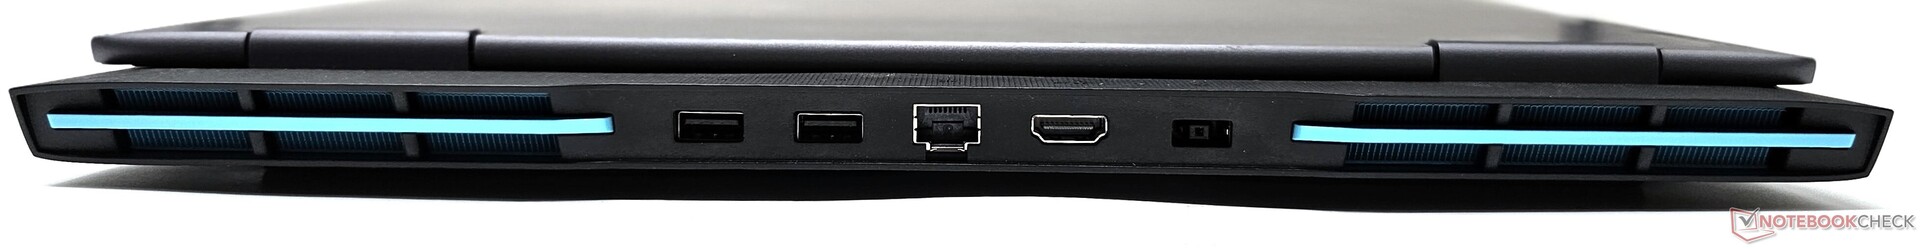
Anslutningsmöjligheter: 140 W USB-C strömförsörjning men ingen Thunderbolt 4
Portval och placering är exakt samma som i den Intel-baserade LOQ 16. Till skillnad från LOQ 15APH8 som använder en USB 2.0-port bland andra USB 3.2-portar, standardiserar Intel-varianterna helt på USB 3.2-anslutning.
Enligt Lenovo är den ensamma USB 3.2 Gen2 Type-C-porten kapabel till 140 W strömförsörjning. Det finns inget USB4- eller Thunderbolt 4-alternativ.
Kommunikation
Trådlös prestanda är på förväntade nivåer för en Realtek Wi-Fi 6-modul. Både sändnings- och mottagningstester visade stabil genomströmning när de testades med vår referensrouter Asus ROG Rapture GT-AXE11000.
| Networking / iperf3 transmit AXE11000 | |
| Lenovo Legion Pro 5 16ARX8 (R5 7645HX, RTX 4050) | |
| Dell G15 5530 | |
| MSI Katana 17 B13VFK | |
| Genomsnitt av klass Gaming (560 - 1862, n=95, senaste 2 åren) | |
| Lenovo LOQ 15IRH8 Core i7 | |
| Lenovo LOQ 15APH8 | |
| Genomsnitt Realtek RTL8852BE (536 - 943, n=70) | |
| Asus TUF Gaming A16 FA617XS | |
| Lenovo LOQ 16IRH8 | |
| HP Victus 16-r0077ng | |
| Networking / iperf3 receive AXE11000 | |
| MSI Katana 17 B13VFK | |
| Lenovo Legion Pro 5 16ARX8 (R5 7645HX, RTX 4050) | |
| Dell G15 5530 | |
| Genomsnitt av klass Gaming (680 - 1745, n=95, senaste 2 åren) | |
| Lenovo LOQ 15IRH8 Core i7 | |
| Asus TUF Gaming A16 FA617XS | |
| Genomsnitt Realtek RTL8852BE (455 - 985, n=71) | |
| Lenovo LOQ 16IRH8 | |
| Lenovo LOQ 15APH8 | |
| HP Victus 16-r0077ng | |
Webbkamera
1080p-webbkameran visar höga avvikelser i alla färger utom vitt. Bildkvaliteten är fortfarande användbar för videosamtal i bra omgivningsljus. En elektronisk kameraslutare finns på enhetens högra sida.


Garanti
I Indien erbjuder Lenovo en ettårig standardgaranti på plats för LOQ 15. Köpare kan dessutom välja flera alternativ för garantiuppgradering och skydd mot oavsiktlig skada direkt från Lenovo.
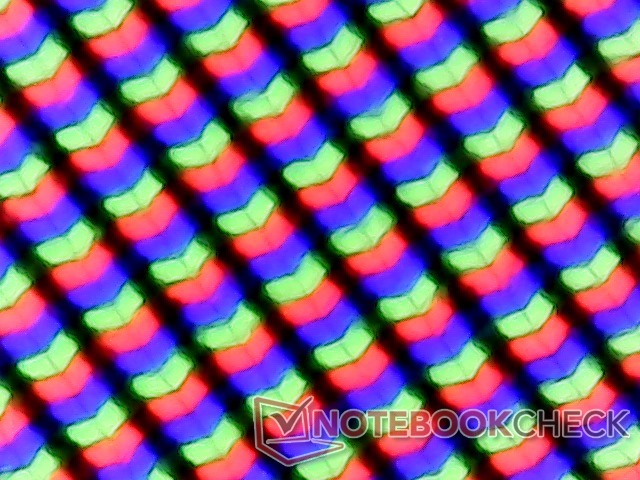
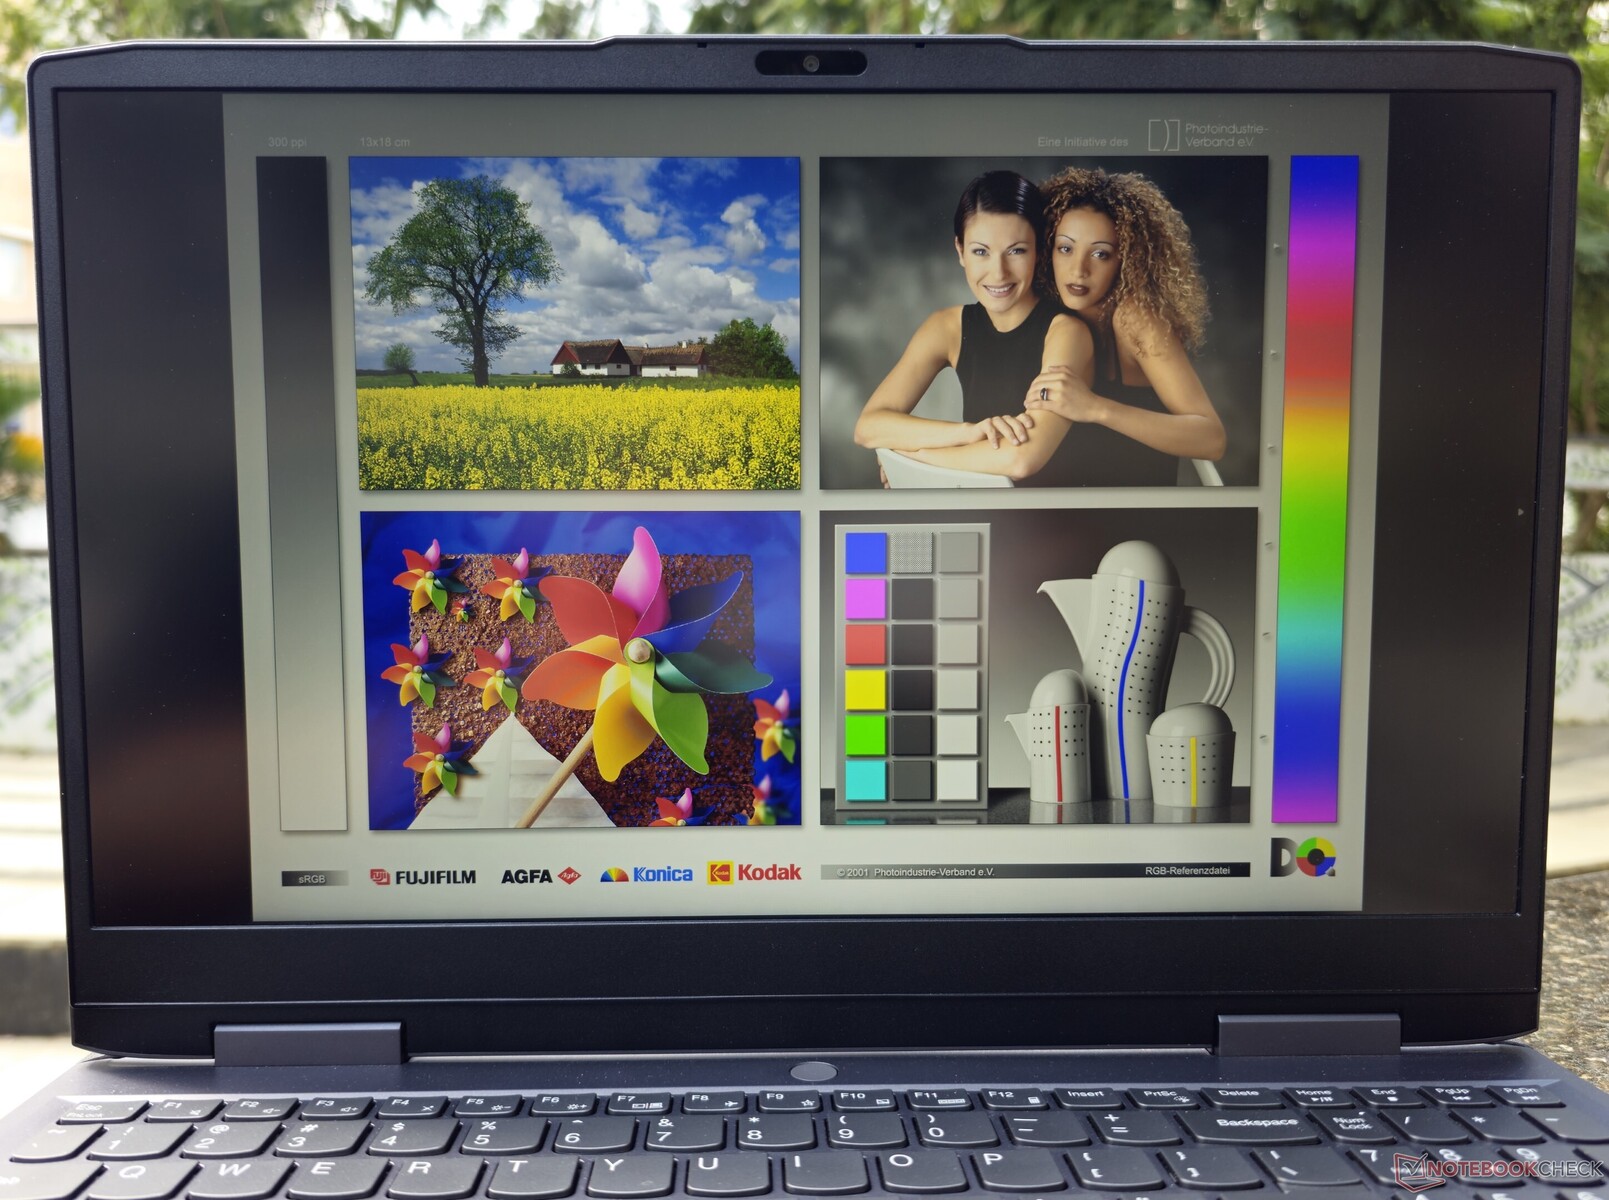
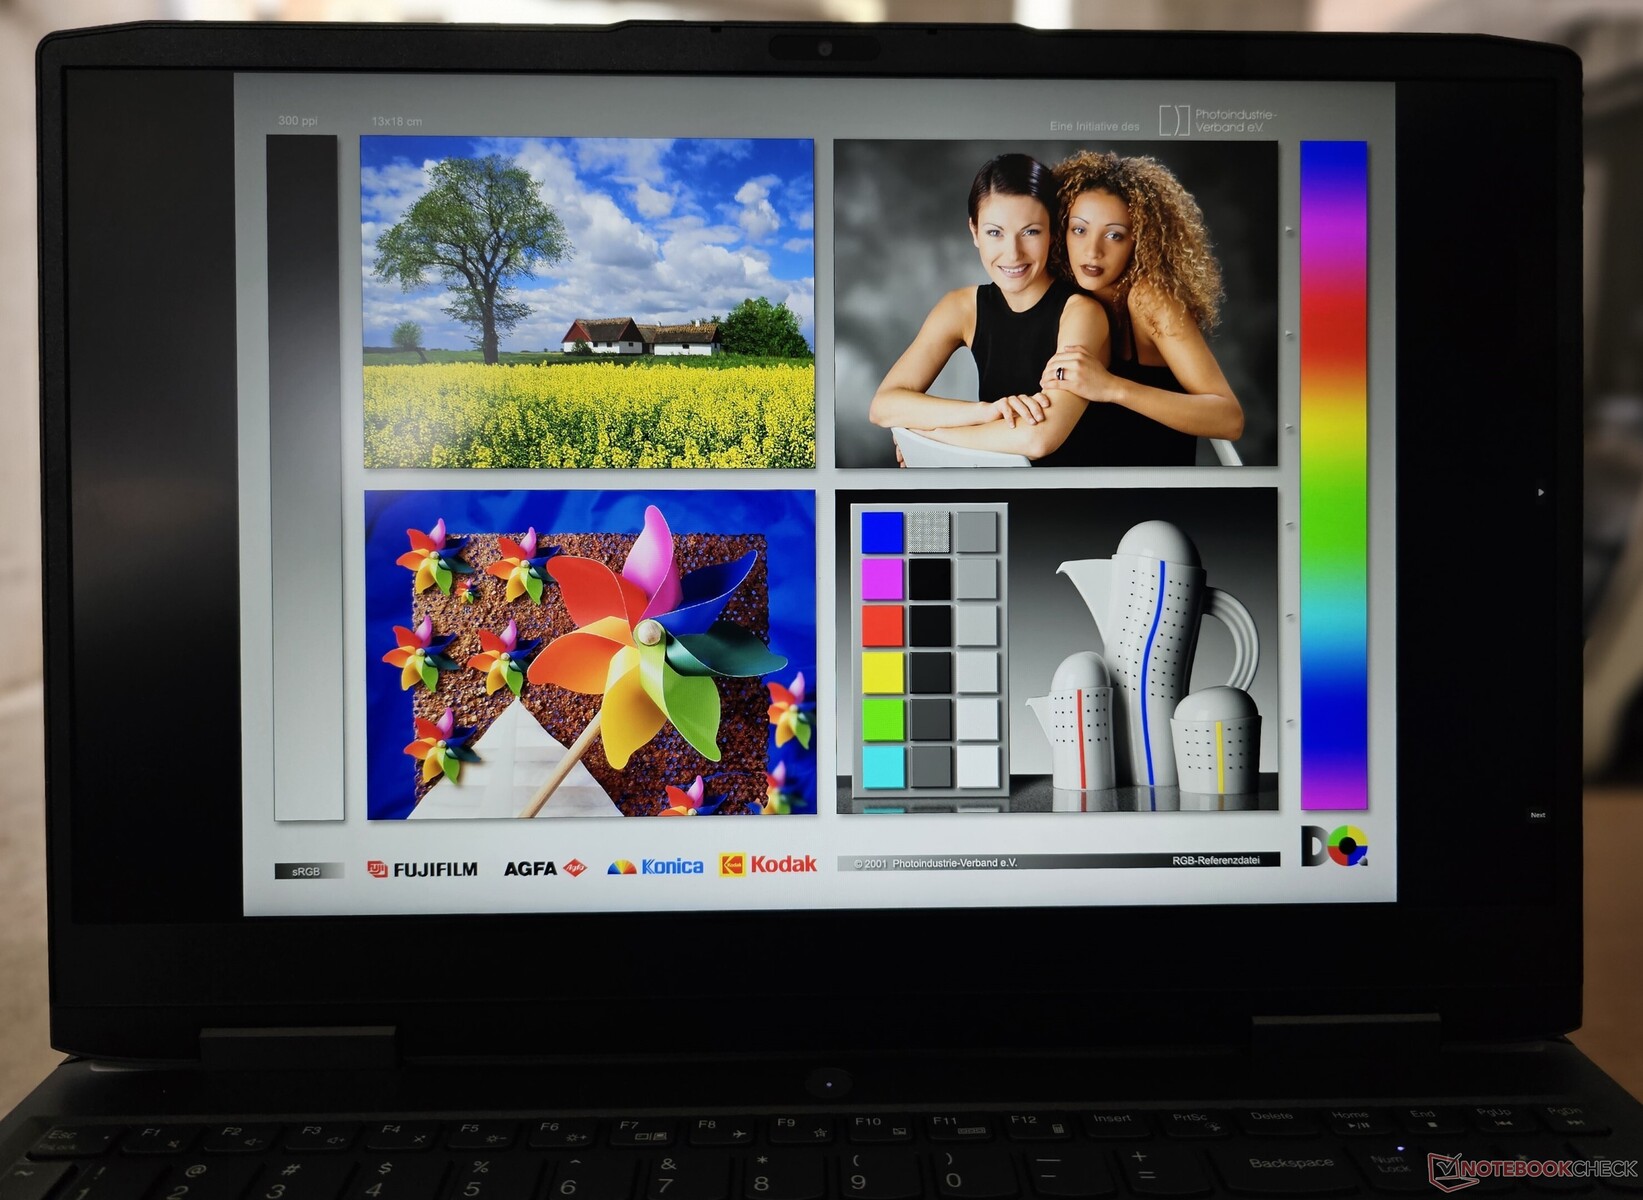
Bildskärm: 165 Hz QHD G-Sync-panel utgör ett betydande uppgraderingsalternativ
Vår LOQ 15-enhet var utrustad med en BOE QHD-panel med en uppdateringsfrekvens på 165 Hz. Panelen har stöd för Nvidia G-Sync i det diskreta GPU-läget. Lenovo anger ljusstyrkan till 350 nits, men vi registrerade upp till 383 nits vid skärmens ljusaste punkt.
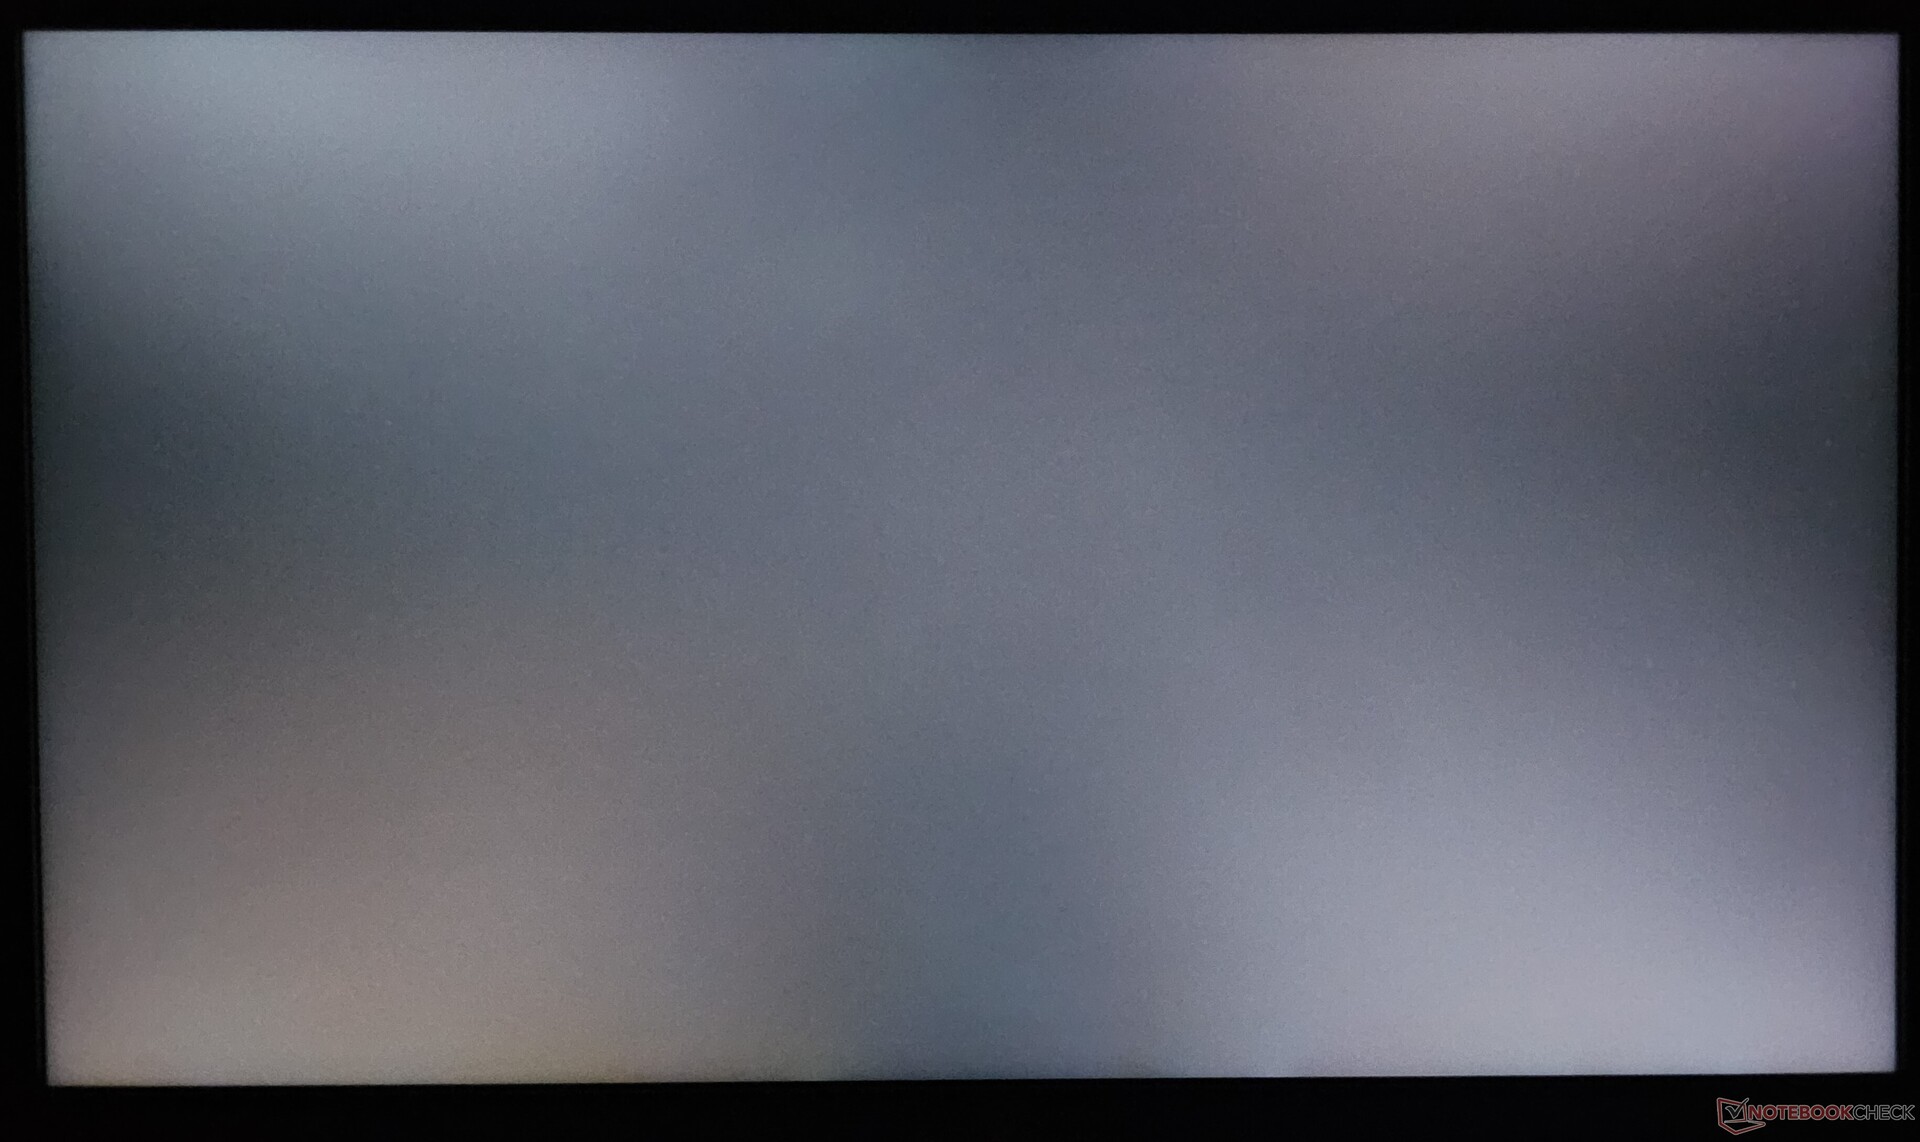
Det finns bakgrundsbelysning i hörnen, men den övergripande ljusstyrkan är bra på 90%. Svartnivåerna och kontrastförhållandet överträffar den AUO-tillverkade QHD+-panelen i LOQ 16IRH8.
| |||||||||||||||||||||||||
Distribution av ljusstyrkan: 90 %
Mitt på batteriet: 372 cd/m²
Kontrast: 1130:1 (Svärta: 0.33 cd/m²)
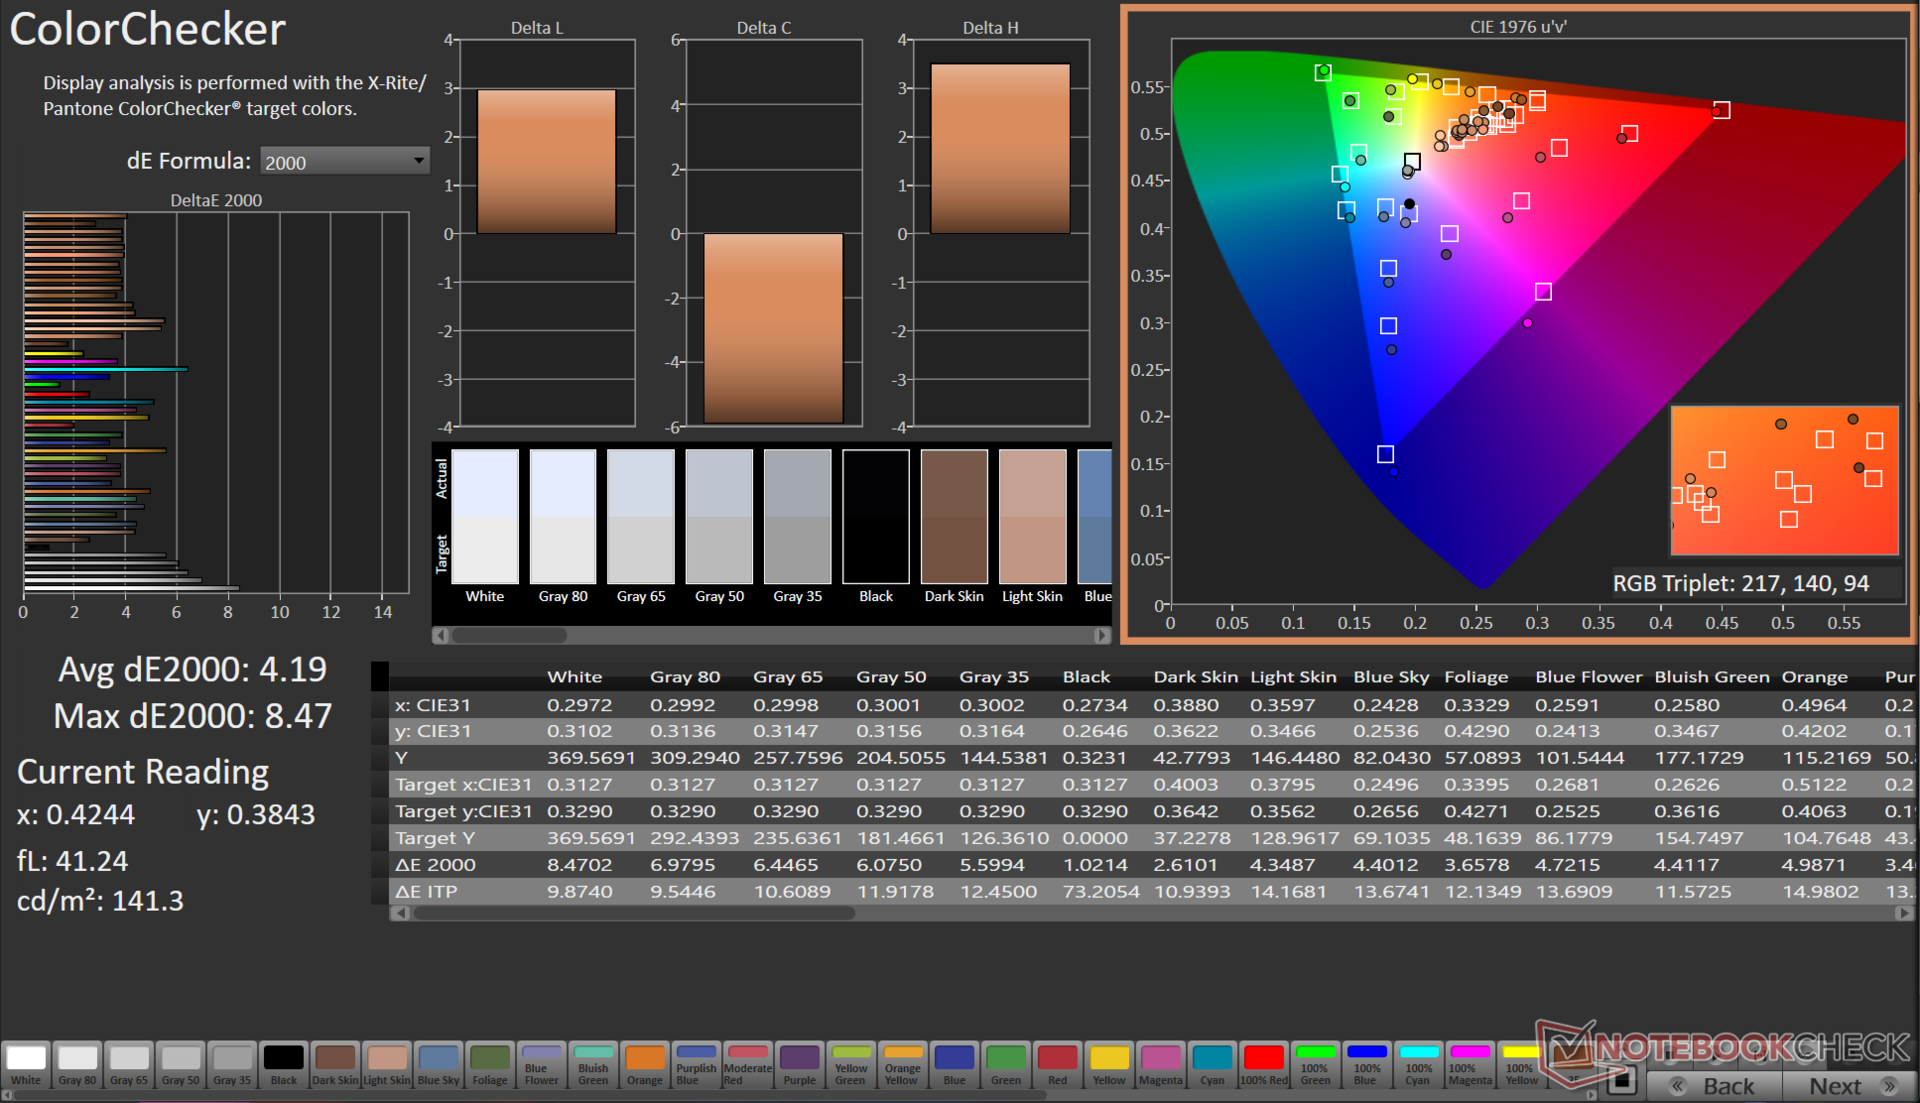
ΔE ColorChecker Calman: 4.19 | ∀{0.5-29.43 Ø4.73}
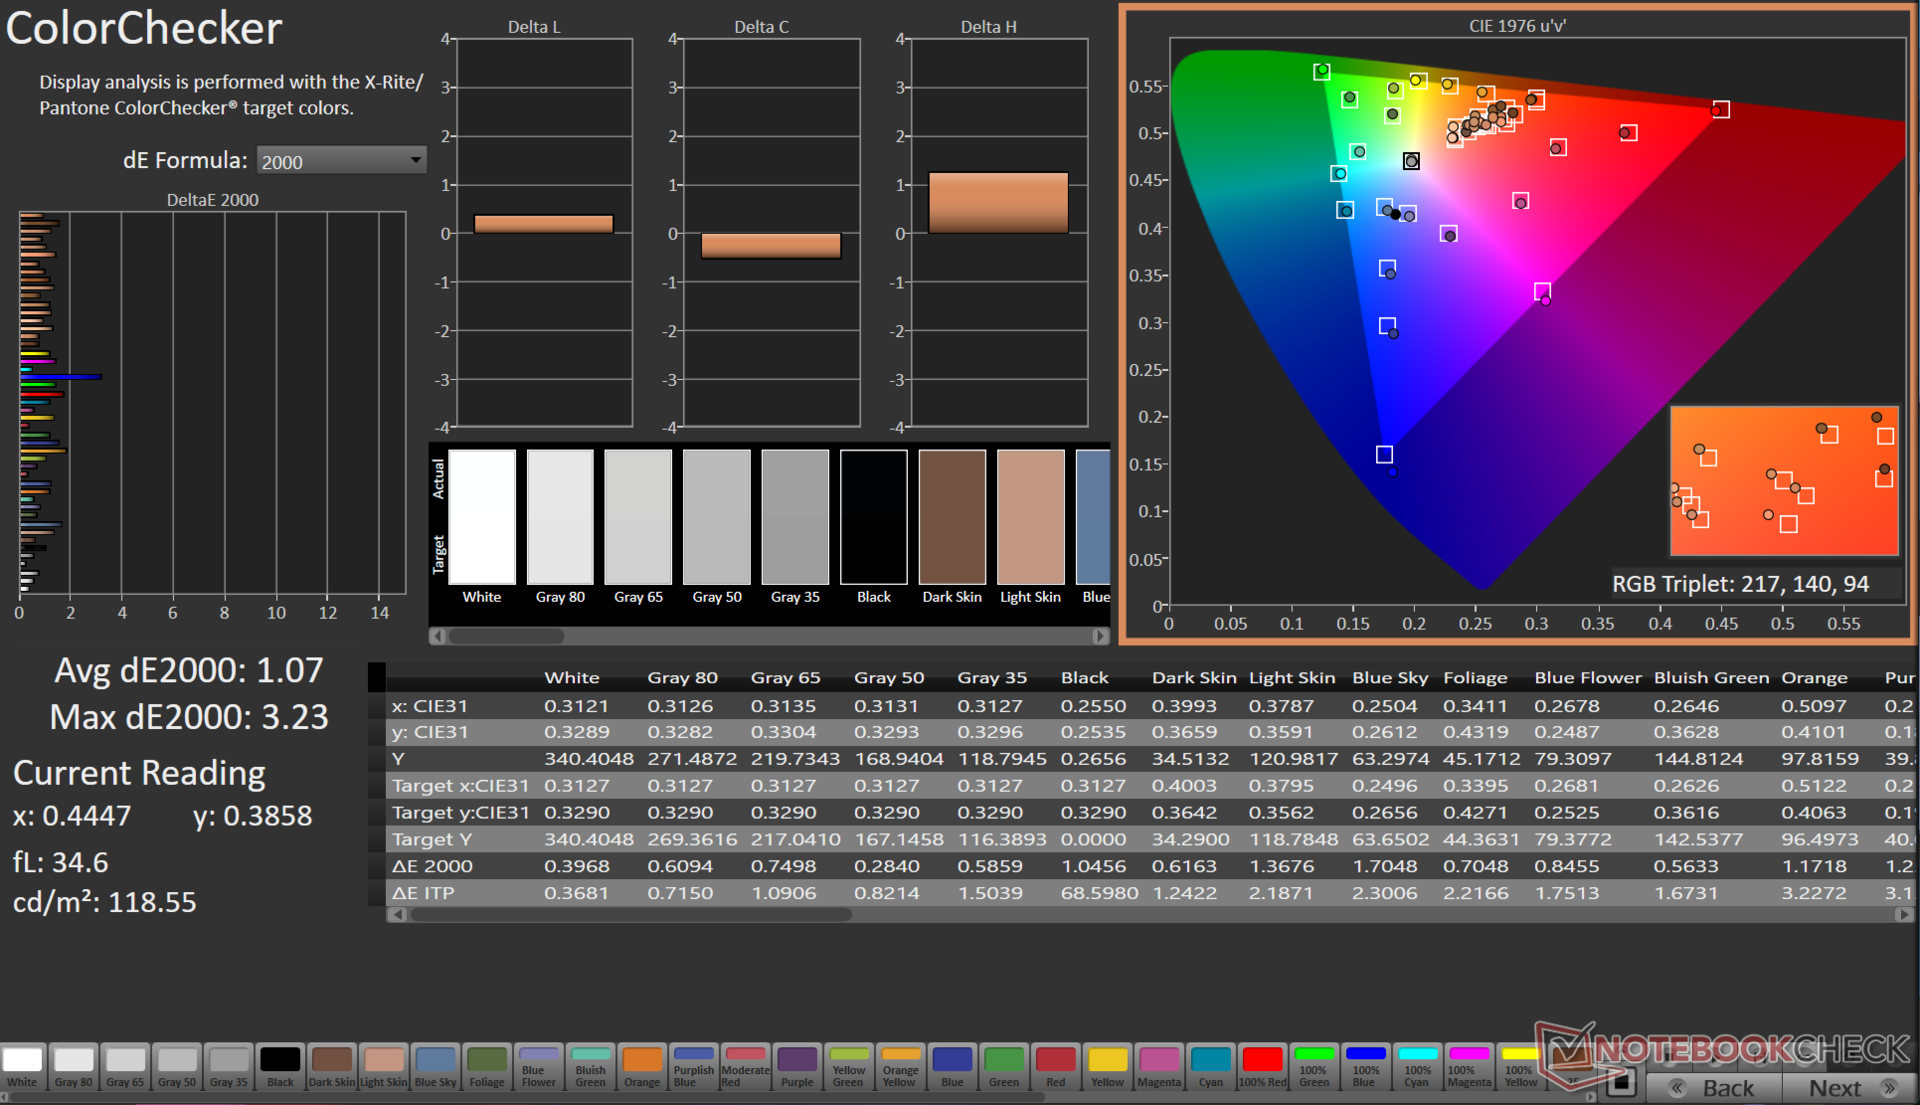
calibrated: 1.07
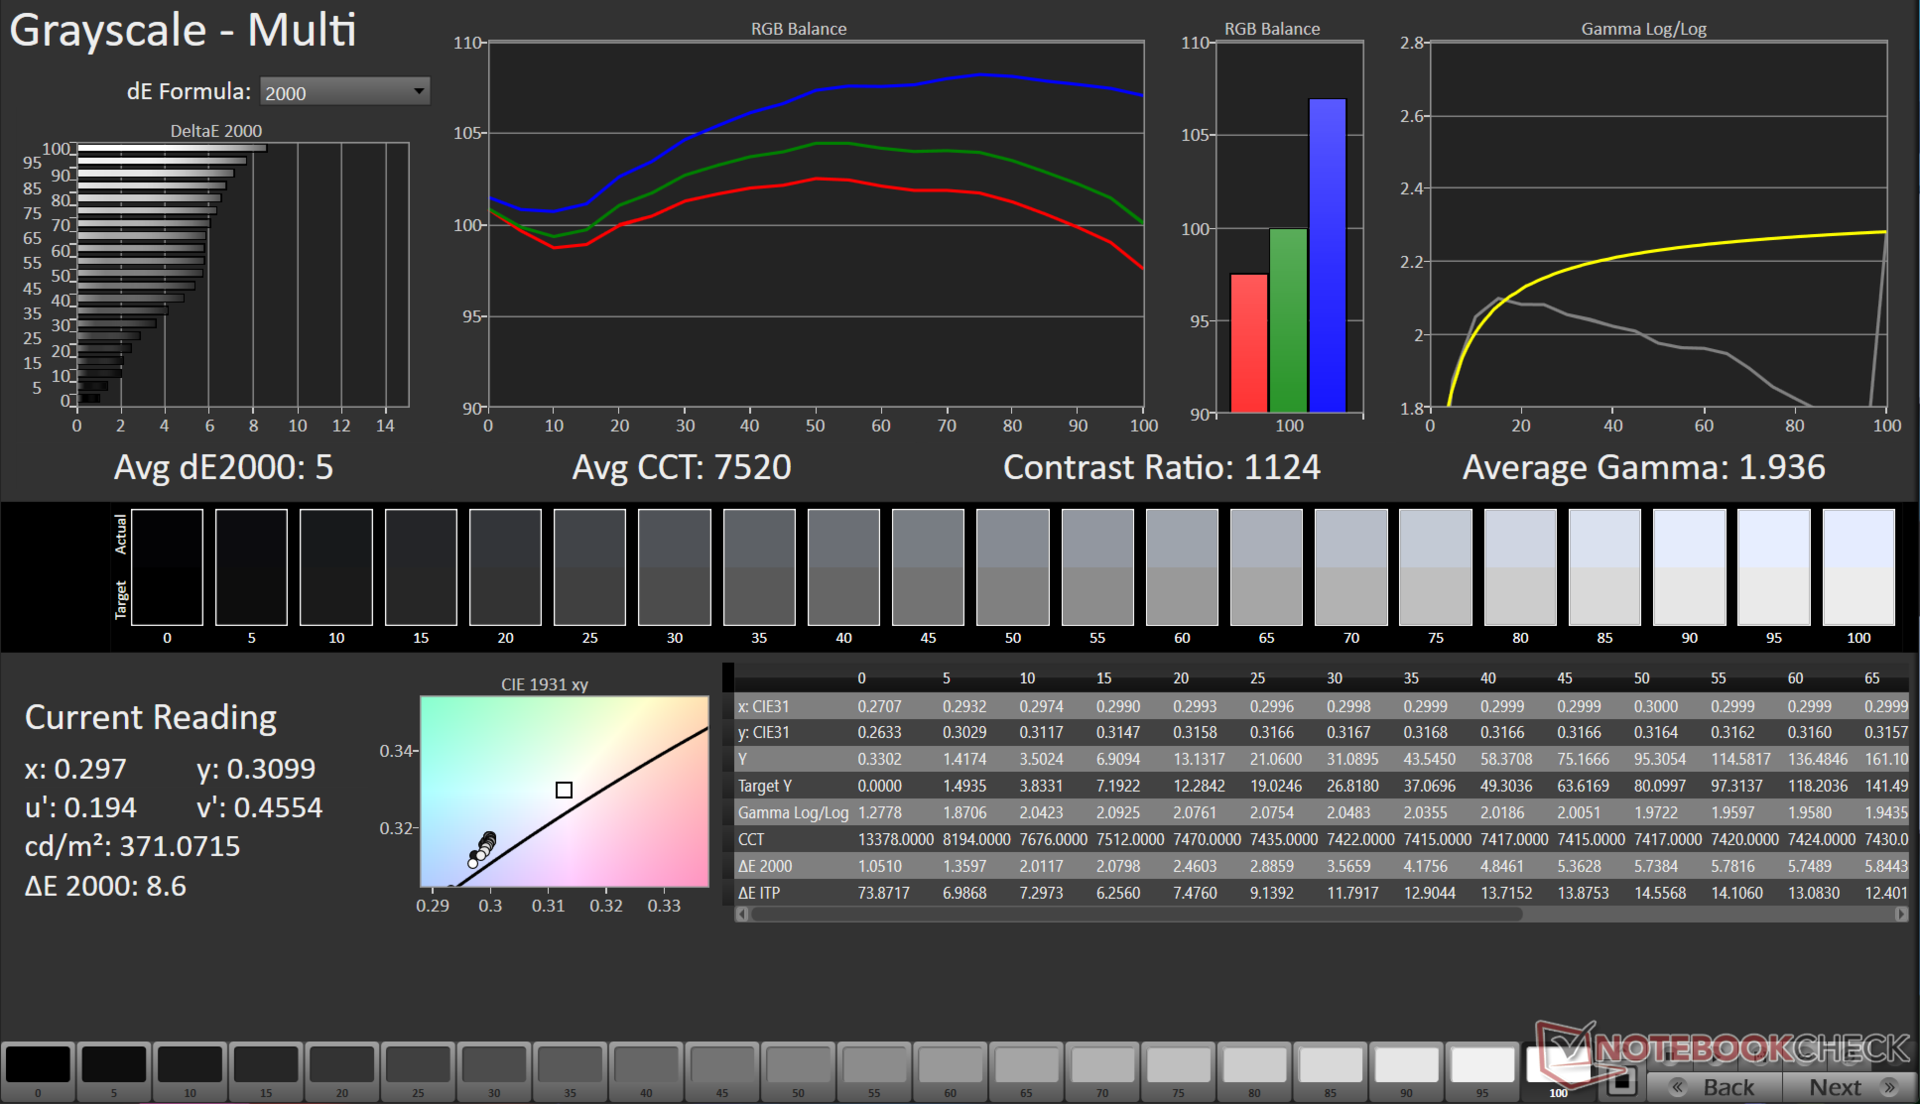
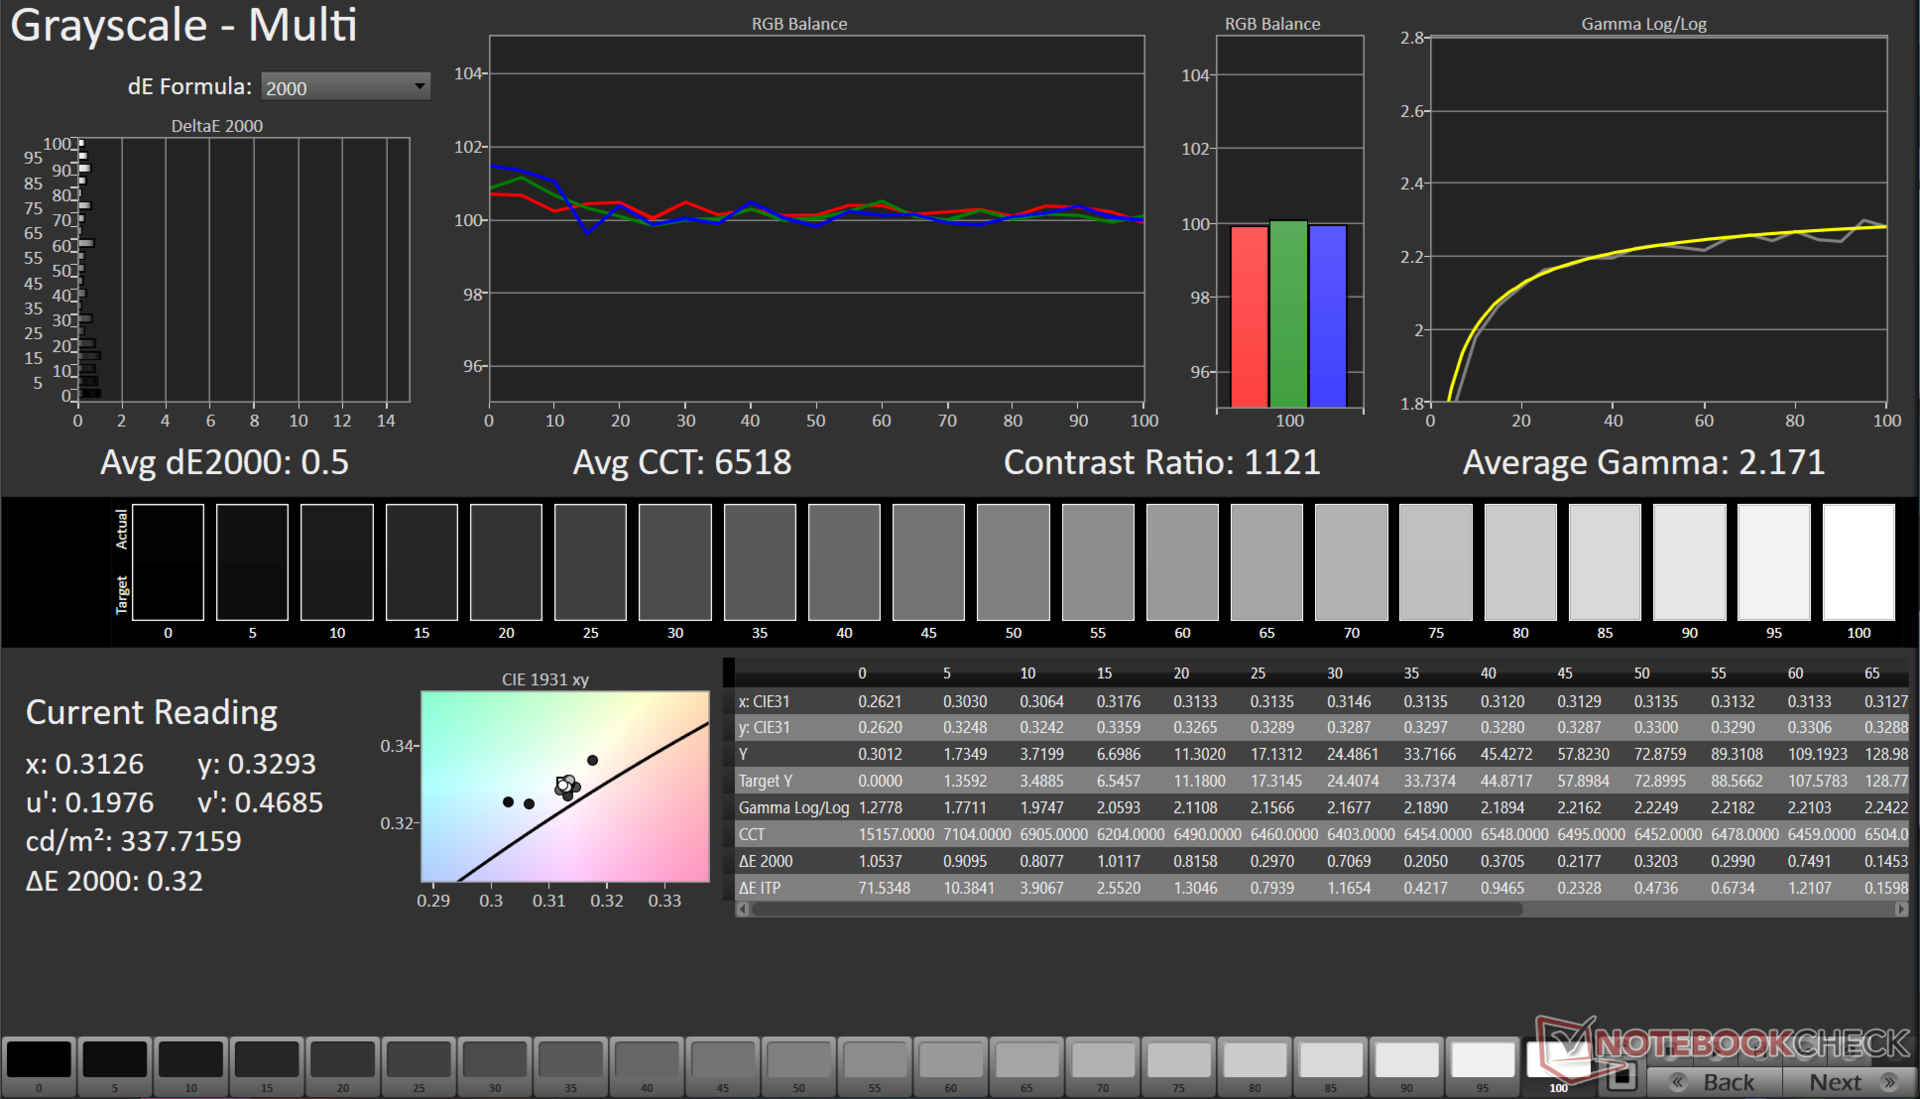
ΔE Greyscale Calman: 5 | ∀{0.09-98 Ø4.97}
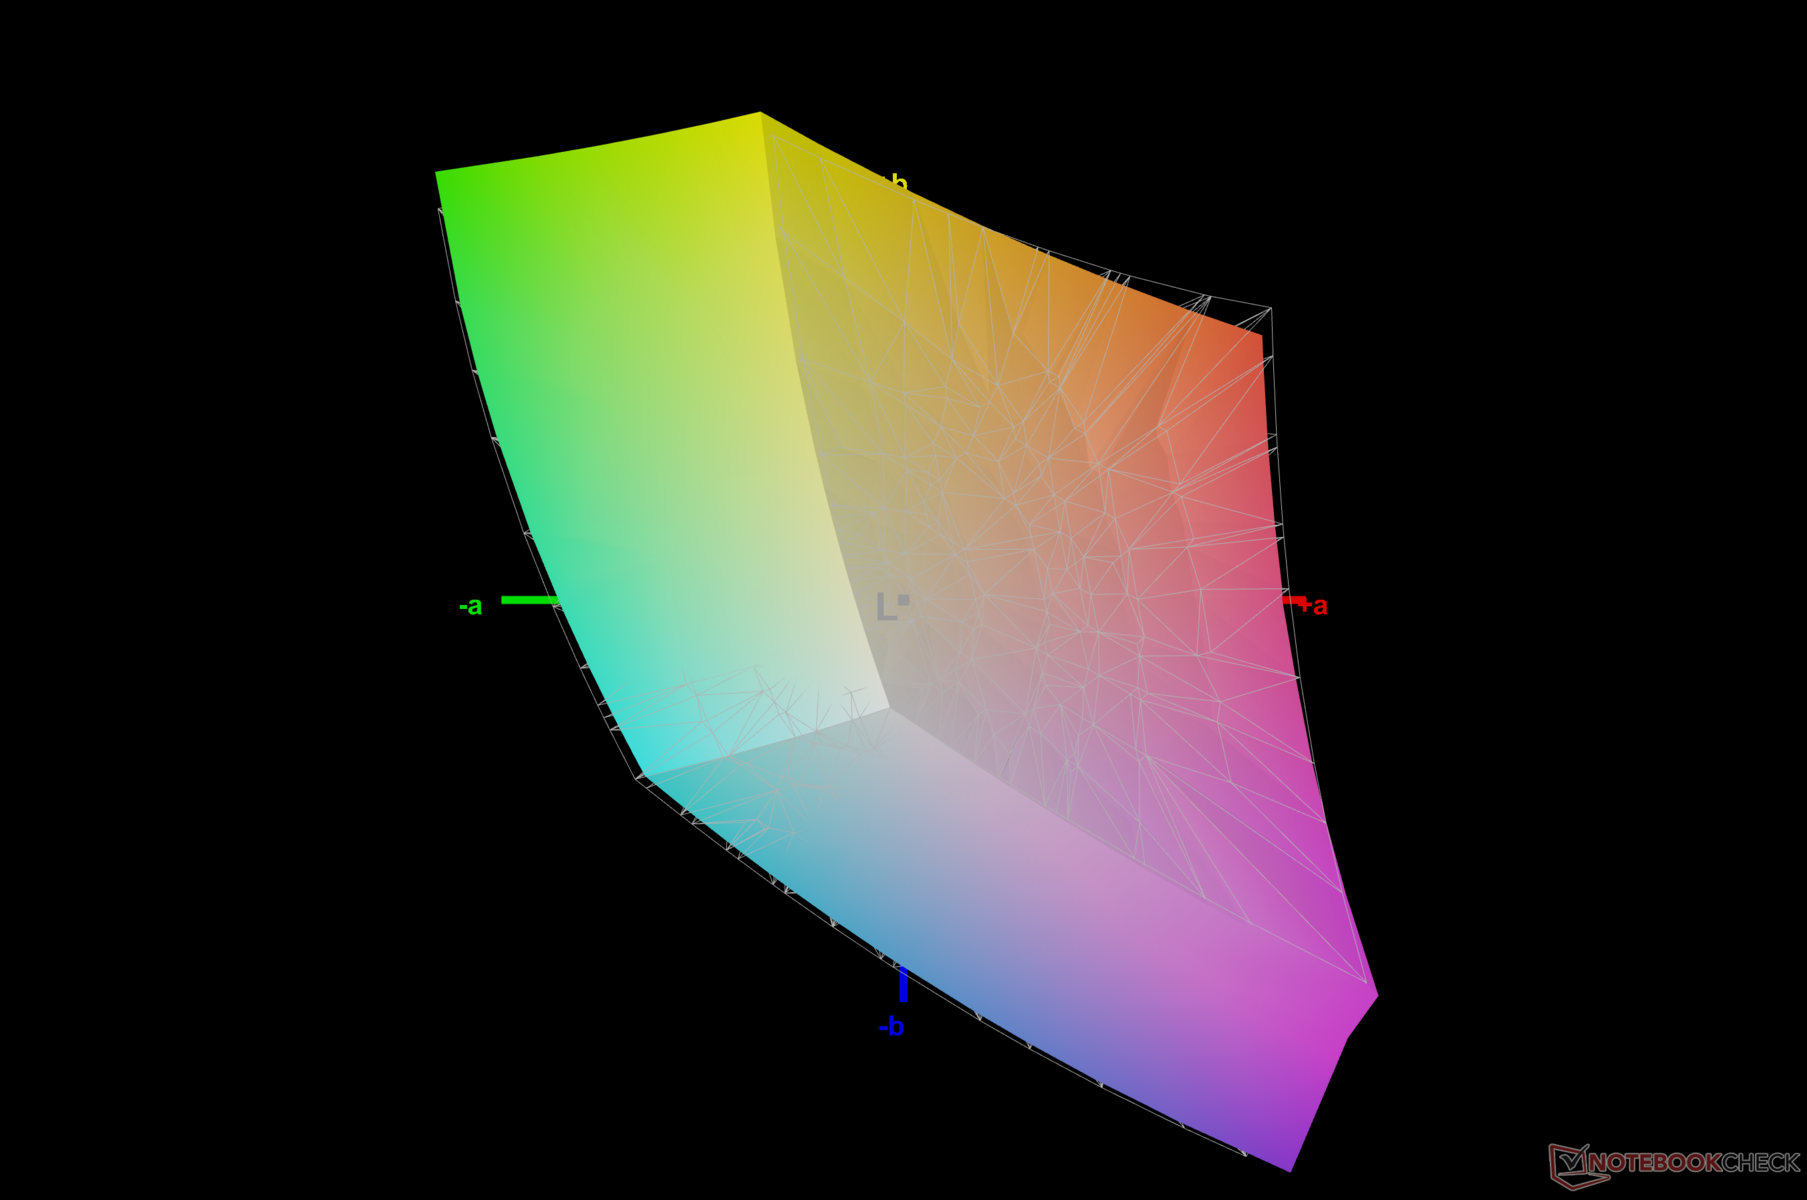
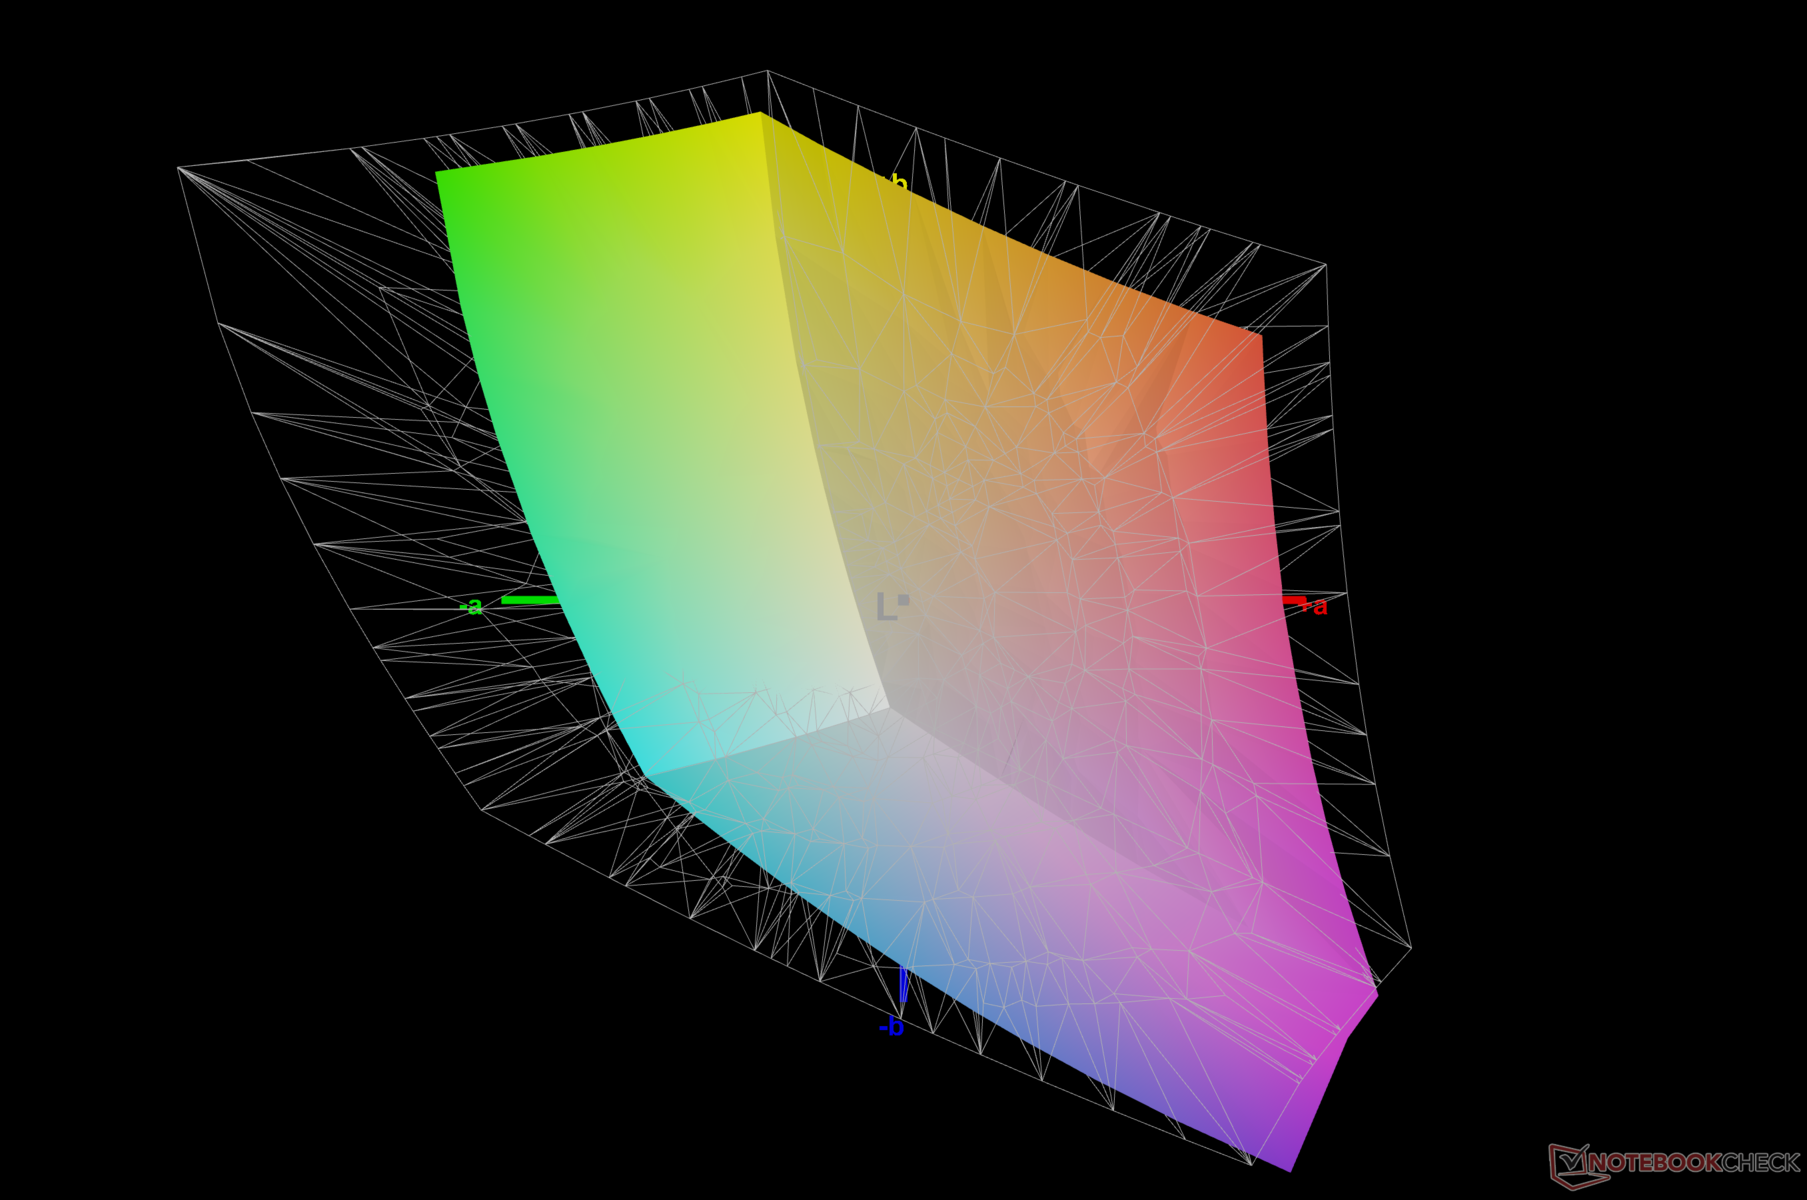
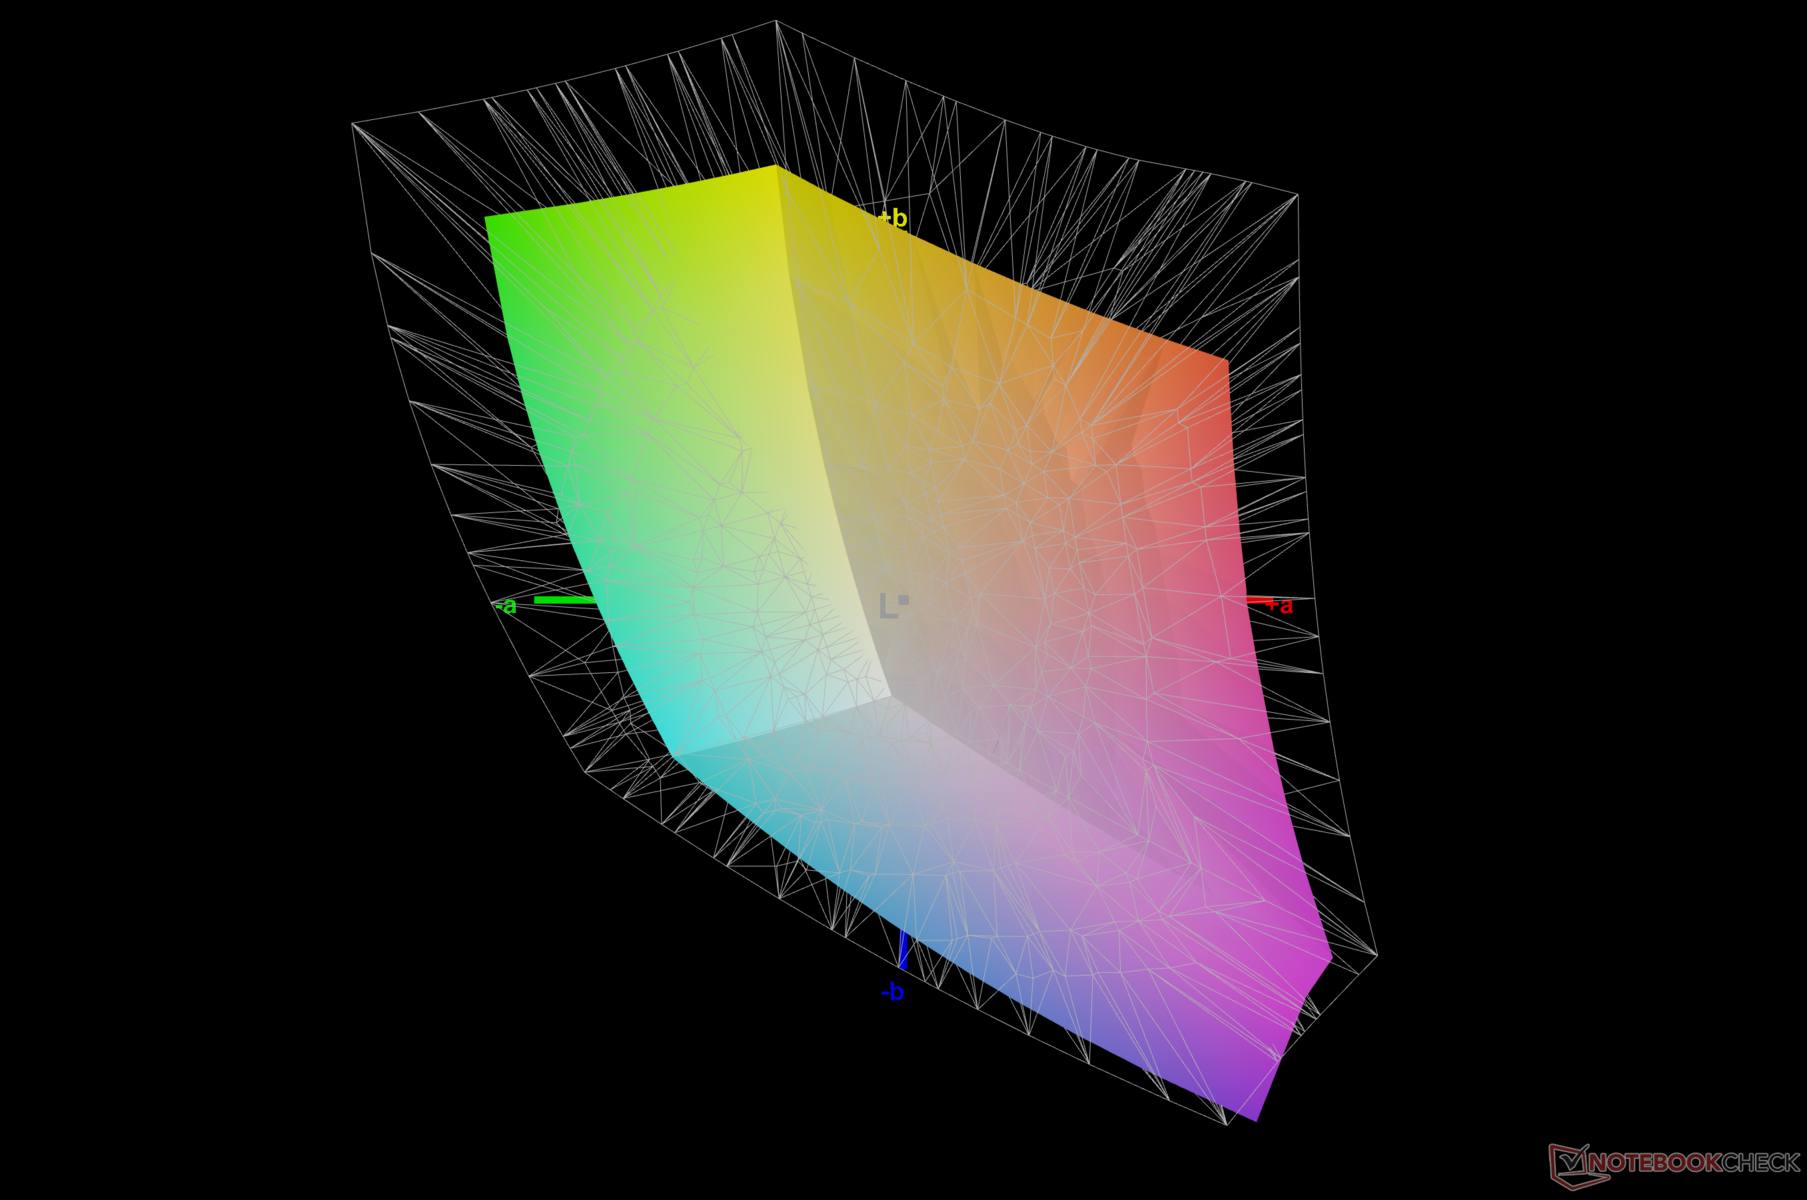
67.7% AdobeRGB 1998 (Argyll 3D)
96.6% sRGB (Argyll 3D)
66.3% Display P3 (Argyll 3D)
Gamma: 1.93
CCT: 7520 K
| Lenovo LOQ 15IRH8 Core i7 BOE CQ NE156QHM-NY4, IPS, 2560x1440, 15.6" | Lenovo LOQ 16IRH8 AUOC1A5 (B160QAN03.L), IPS, 2560x1600, 16" | Lenovo LOQ 15APH8 BOE NJ NE156FHM-NX3, IPS, 1920x1080, 15.6" | MSI Katana 17 B13VFK B173HAN04.9, IPS LED, 1920x1080, 17.3" | Lenovo Legion Pro 5 16ARX8 (R5 7645HX, RTX 4050) CSOT T3 MNG007DA2-2, IPS, 2560x1600, 16" | HP Victus 16-r0077ng CMN162D, IPS, 1920x1080, 16.1" | Dell G15 5530 AUO B156HAN, IPS, 1920x1080, 15.6" | Asus TUF Gaming A16 FA617XS BOE NE160WUM-NX2, IPS, 1920x1200, 16" | |
|---|---|---|---|---|---|---|---|---|
| Display | 5% | -39% | -38% | 6% | 1% | 7% | 3% | |
| Display P3 Coverage (%) | 66.3 | 70.5 6% | 40.2 -39% | 40.8 -38% | 71.6 8% | 66.7 1% | 73.1 10% | 69.3 5% |
| sRGB Coverage (%) | 96.6 | 98.9 2% | 60.2 -38% | 61 -37% | 99.8 3% | 98 1% | 98.4 2% | 97.3 1% |
| AdobeRGB 1998 Coverage (%) | 67.7 | 72.6 7% | 41.5 -39% | 42.2 -38% | 72.9 8% | 69 2% | 74.4 10% | 70.7 4% |
| Response Times | -16% | -473% | -385% | -51% | -82% | 34% | -116% | |
| Response Time Grey 50% / Grey 80% * (ms) | 5 ? | 7.2 ? -44% | 42.7 ? -754% | 33 ? -560% | 12 ? -140% | 13.3 ? -166% | 3.39 ? 32% | 15.6 ? -212% |
| Response Time Black / White * (ms) | 8.41 ? | 7.4 ? 12% | 24.5 ? -191% | 26 ? -209% | 5.2 ? 38% | 8.2 ? 2% | 5.35 ? 36% | 10 ? -19% |
| PWM Frequency (Hz) | 21620 ? | |||||||
| Screen | 17% | -17% | -46% | 20% | 23% | -5% | 20% | |
| Brightness middle (cd/m²) | 373 | 407 9% | 346.2 -7% | 267 -28% | 543 46% | 308 -17% | 320 -14% | 301 -19% |
| Brightness (cd/m²) | 365 | 369 1% | 329 -10% | 256 -30% | 516 41% | 285 -22% | 316 -13% | 294 -19% |
| Brightness Distribution (%) | 90 | 85 -6% | 81 -10% | 93 3% | 87 -3% | 85 -6% | 94 4% | 94 4% |
| Black Level * (cd/m²) | 0.33 | 0.45 -36% | 0.31 6% | 0.21 36% | 0.58 -76% | 0.25 24% | 0.21 36% | 0.21 36% |
| Contrast (:1) | 1130 | 904 -20% | 1117 -1% | 1271 12% | 936 -17% | 1232 9% | 1524 35% | 1433 27% |
| Colorchecker dE 2000 * | 4.19 | 1.43 66% | 4.19 -0% | 4.7 -12% | 1.35 68% | 1.3 69% | 4.55 -9% | 1.79 57% |
| Colorchecker dE 2000 max. * | 8.47 | 3.58 58% | 19.19 -127% | 20.4 -141% | 3.22 62% | 2.76 67% | 9.83 -16% | 3.48 59% |
| Colorchecker dE 2000 calibrated * | 1.07 | 1.07 -0% | 1.66 -55% | 4.5 -321% | 1.31 -22% | 0.92 14% | 1.51 -41% | 1.2 -12% |
| Greyscale dE 2000 * | 5 | 1.13 77% | 2.6 48% | 1.5 70% | 1.03 79% | 1.7 66% | 6.2 -24% | 2.5 50% |
| Gamma | 1.93 114% | 2.5 88% | 2.19 100% | 2.12 104% | 2.38 92% | 2.167 102% | 2.07 106% | 2.265 97% |
| CCT | 7520 86% | 6526 100% | 6749 96% | 6552 99% | 6452 101% | 6767 96% | 6479 100% | 6157 106% |
| Totalt genomsnitt (program/inställningar) | 2% /
9% | -176% /
-87% | -156% /
-92% | -8% /
7% | -19% /
3% | 12% /
3% | -31% /
-3% |
* ... mindre är bättre
Skärmen täcker nästan 97% av sRGB-färgskalan, vilket bör vara tillräckligt bra för de flesta spel och webbinnehåll. Adobe RGB- och Display P3-täckningen är dock bara medelmåttig.
Med detta sagt har QHD-panelen i LOQ 15IRH8 mycket bättre färgegenskaper jämfört med 1080p 144 Hz-panelen i den AMD-drivna LOQ 15APH8.
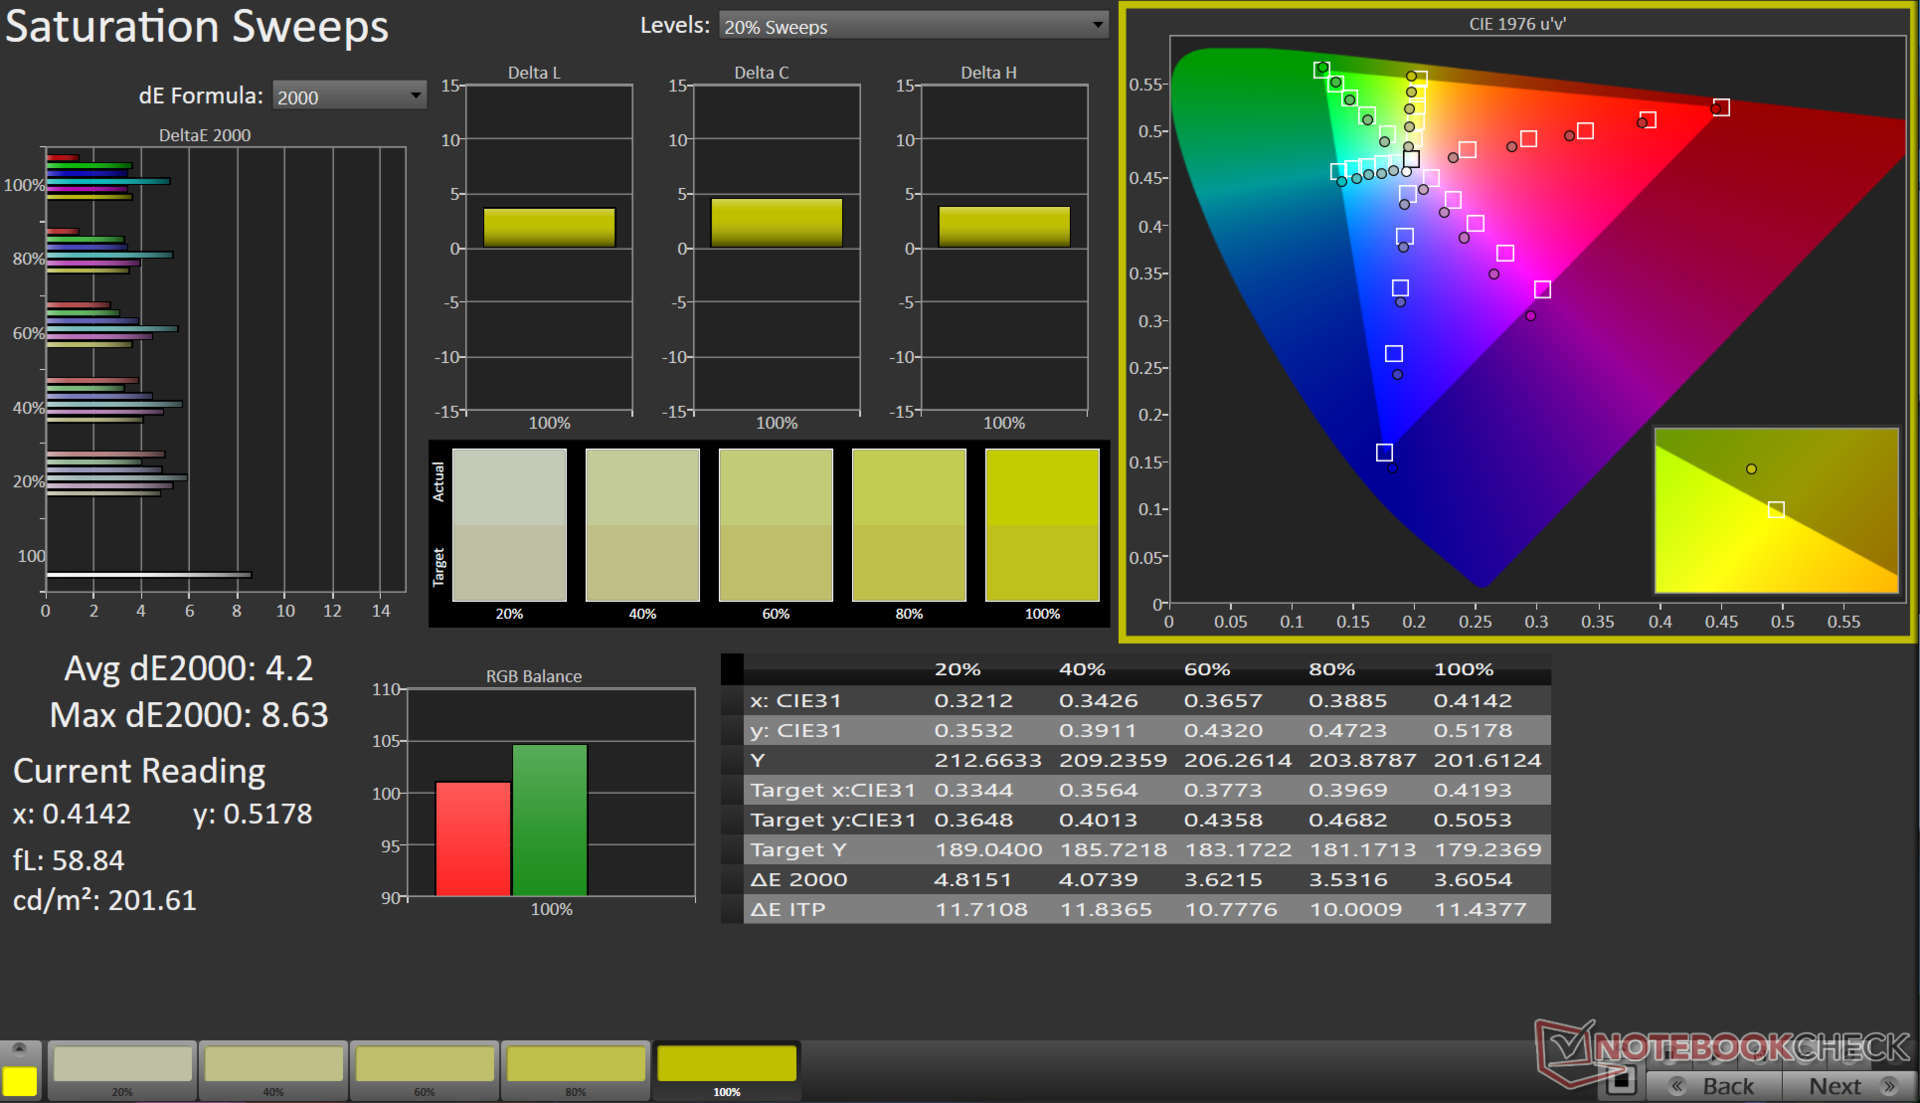
Färgerna i standardutförandet uppvisar stora avvikelser, men vår kalibreringsrutin med X-Rite i1Basic Pro 3 spektrofotometer och Calman Ultimate programvara från Portrait Displays visar betydande förbättringar i gråskala och ColorChecker Delta E-värden.
Panelen har fortfarande problem med att korrekt återge den 100% blå delen av spektrumet.
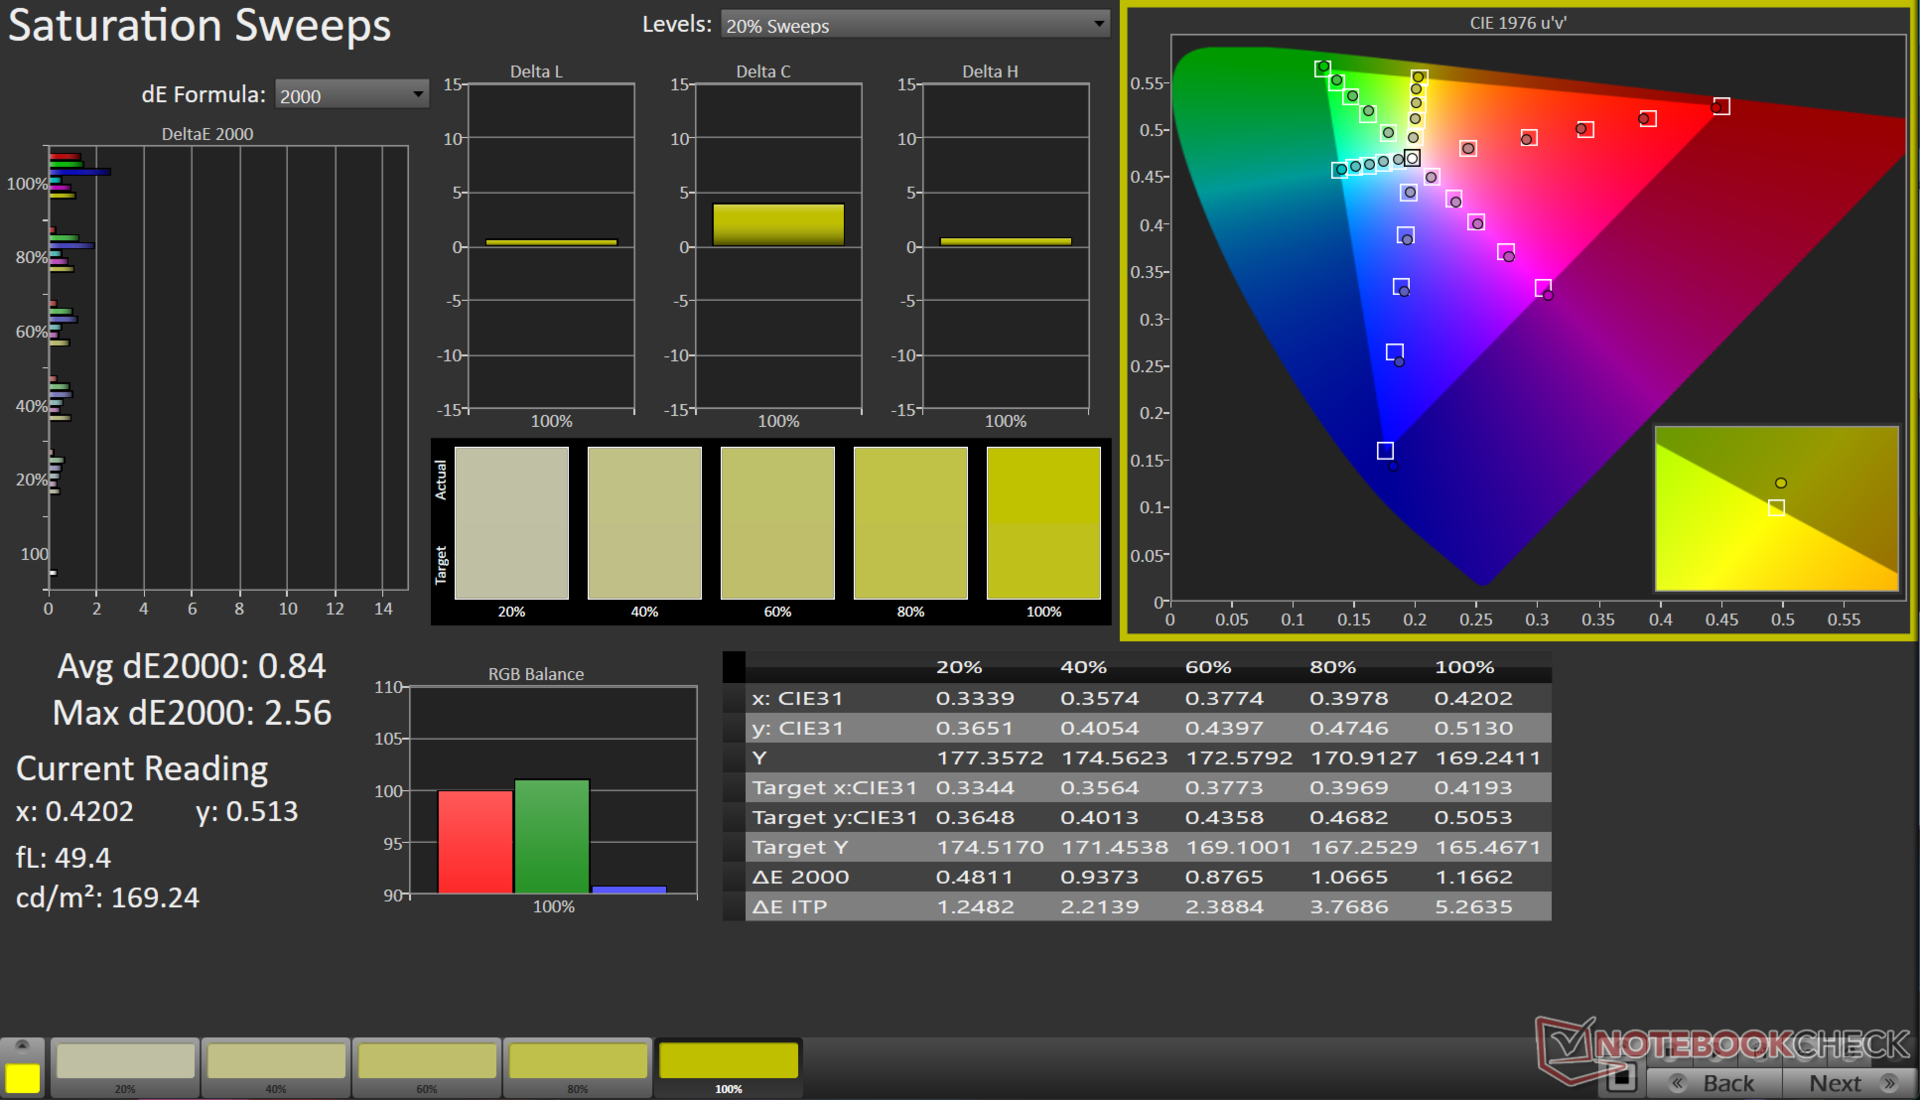
Vår kalibrerade ICC-fil kan laddas ner från länken ovan.
Visa svarstider
| ↔ Svarstid svart till vitt | ||
|---|---|---|
| 8.41 ms ... stiga ↗ och falla ↘ kombinerat | ↗ 3.96 ms stiga | 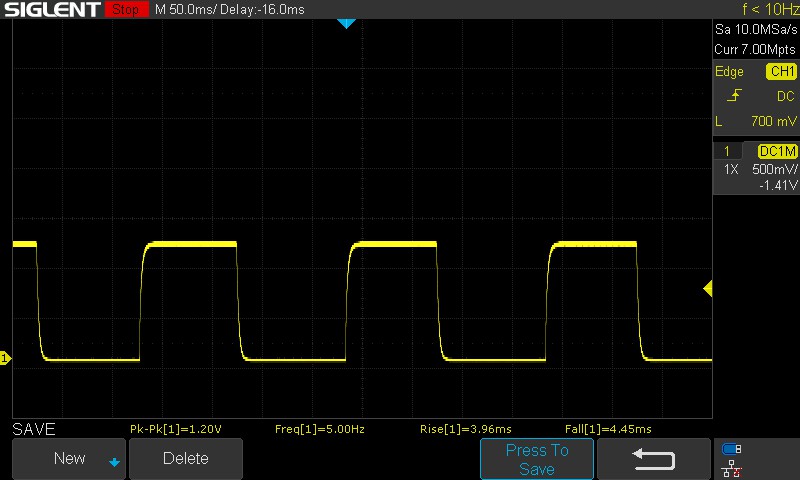 |
| ↘ 4.45 ms hösten | ||
| Skärmen visar snabba svarsfrekvenser i våra tester och bör passa för spel. I jämförelse sträcker sig alla testade enheter från 0.1 (minst) till 240 (maximalt) ms. » 24 % av alla enheter är bättre. Det betyder att den uppmätta svarstiden är bättre än genomsnittet av alla testade enheter (19.9 ms). | ||
| ↔ Svarstid 50 % grått till 80 % grått | ||
| 5 ms ... stiga ↗ och falla ↘ kombinerat | ↗ 2.16 ms stiga | 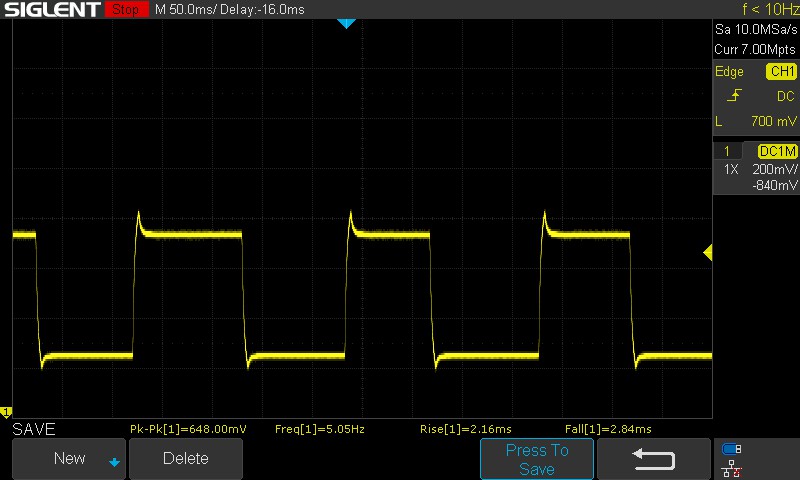 |
| ↘ 2.84 ms hösten | ||
| Skärmen visar väldigt snabba svarsfrekvenser i våra tester och borde vara mycket väl lämpad för fartfyllt spel. I jämförelse sträcker sig alla testade enheter från 0.165 (minst) till 636 (maximalt) ms. » 17 % av alla enheter är bättre. Det betyder att den uppmätta svarstiden är bättre än genomsnittet av alla testade enheter (31.1 ms). | ||
Svarstiderna är en stor förbättring jämfört med 1080p-panelen i LOQ 15APH8. Panelen använder overdrive som standard, vilket bidrar till snabba övergångar på 5 ms från 50% grå till 80% grå. Om du inaktiverar overdrive från Lenovo Vantage-appen ökar den kombinerade svarstiden för 50% grå till 80% grå till 11 ms.
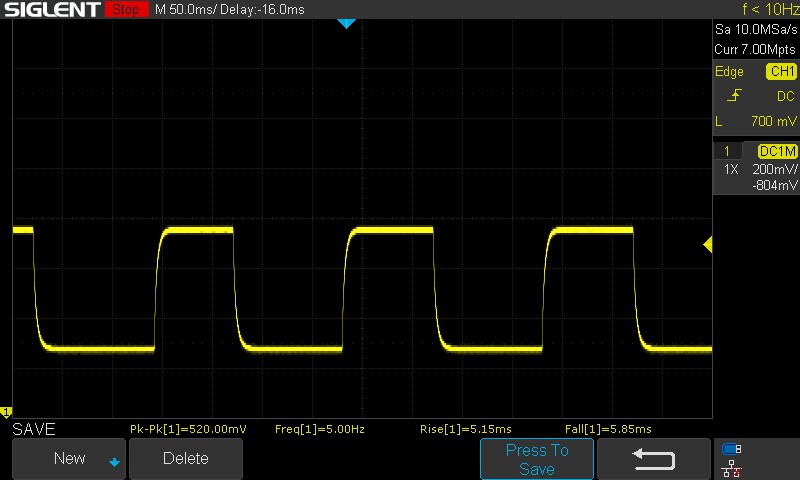
Panelen visar inte PWM-flimmer vid alla testade ljusstyrkenivåer. För mer information, se vår artikel "Varför PWM är en sådan huvudvärk" och även vår PWM-rankningstabell för en jämförelse av uppmätt PWM över alla granskade enheter.
Skärmflimmer / PWM (Puls-Width Modulation)
| Skärmflimmer / PWM upptäcktes inte | ≤ 100 % ljusstyrka inställning | 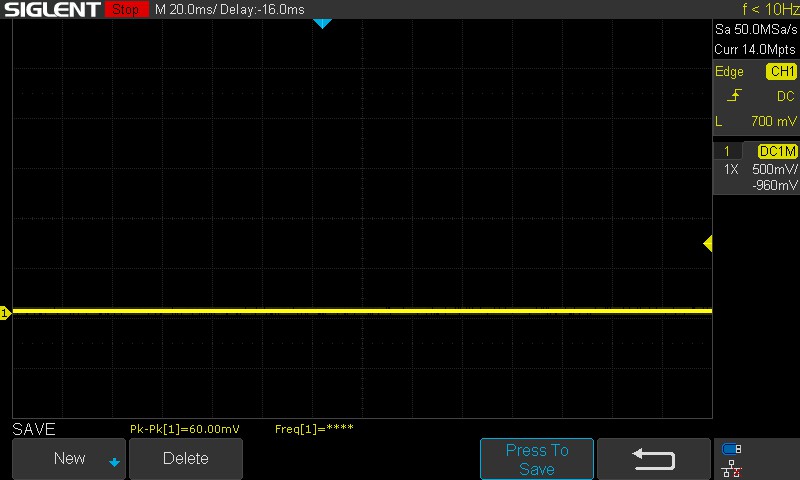 | |
Som jämförelse: 52 % av alla testade enheter använder inte PWM för att dämpa skärmen. Om PWM upptäcktes mättes ett medelvärde av 7794 (minst: 5 - maximum: 343500) Hz. | |||
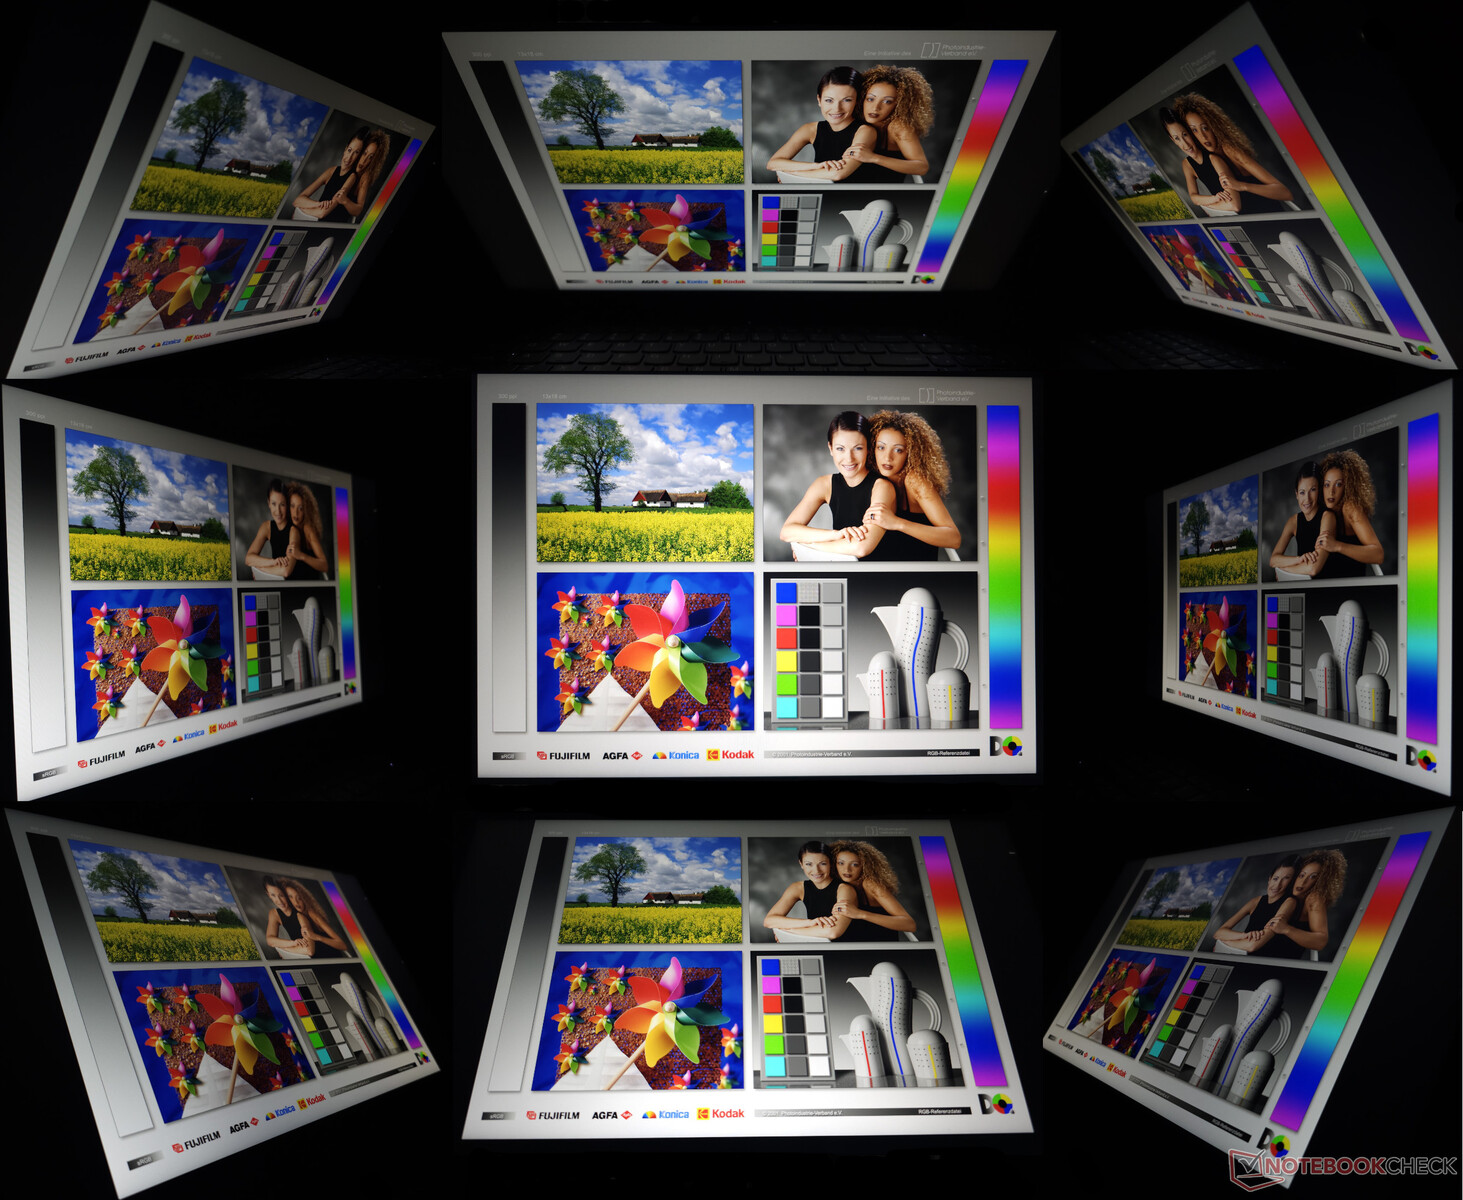
Synligheten utomhus är bra för allmän användning, även om särskilt ljusa soliga dagar kan vara överväldigande för panelen med 350 nits. Betraktningsvinklarna är relativt stabila med minimal ljusstyrka och färgförlust i extrema lägen.
Prestanda: Core i7-13620H kämpar med att sätta upp en stadig show
I Indien erbjuder Lenovo flera LOQ 15-konfigurationsalternativ med både Intel- och AMD-processorer. De Intel-baserade modellerna erbjuder ett val mellan Core i5-12450H och Core i7-13620H Processorer, medan AMD-varianterna har Ryzen 5 7640HS eller Ryzen 7 7840HSdelar. För grafik kan kunderna välja bärbara versioner av RTX 2050, RTX 3050, RTX 4050eller RTX 4060 GPU:er.
För den amerikanska marknaden konfigurerar Lenovo LOQ 15 med antingen Core i7-13700H i kombination med RTX 4050 eller Core i5-13420H i kombination med RTX 2050.

Villkor för testning
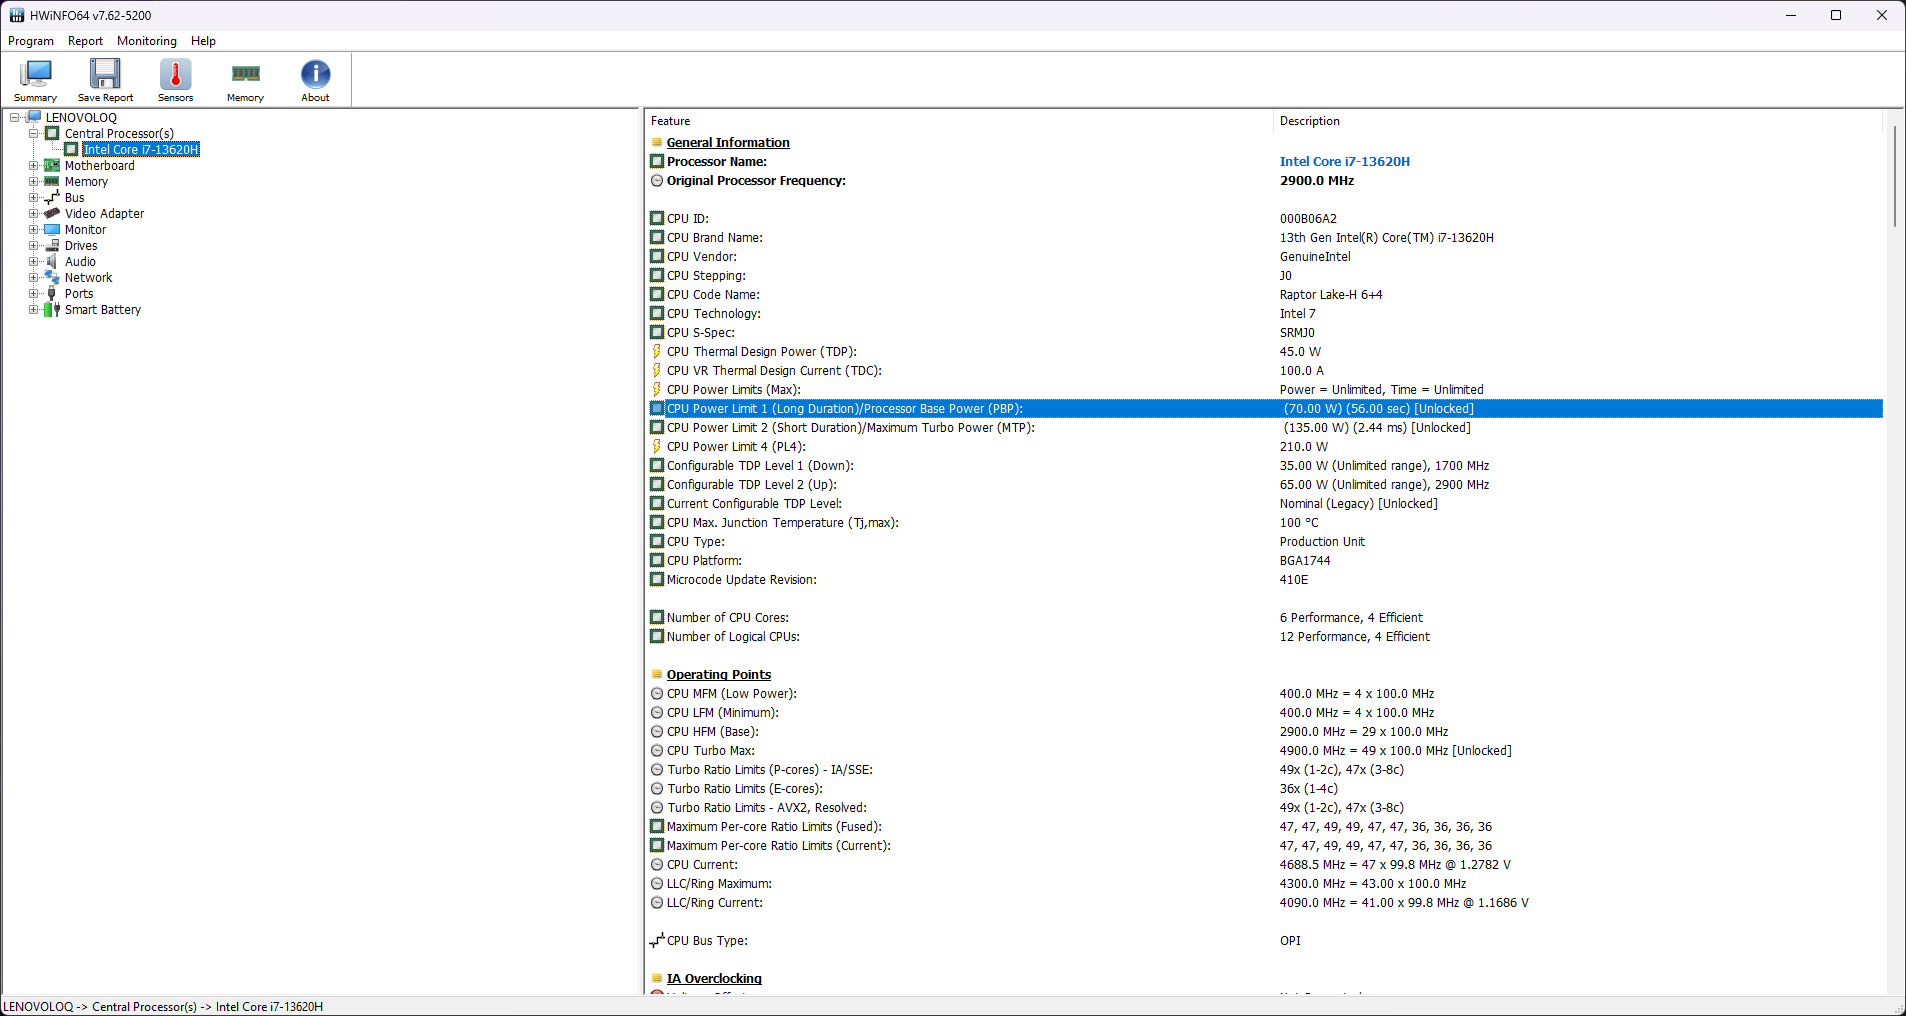
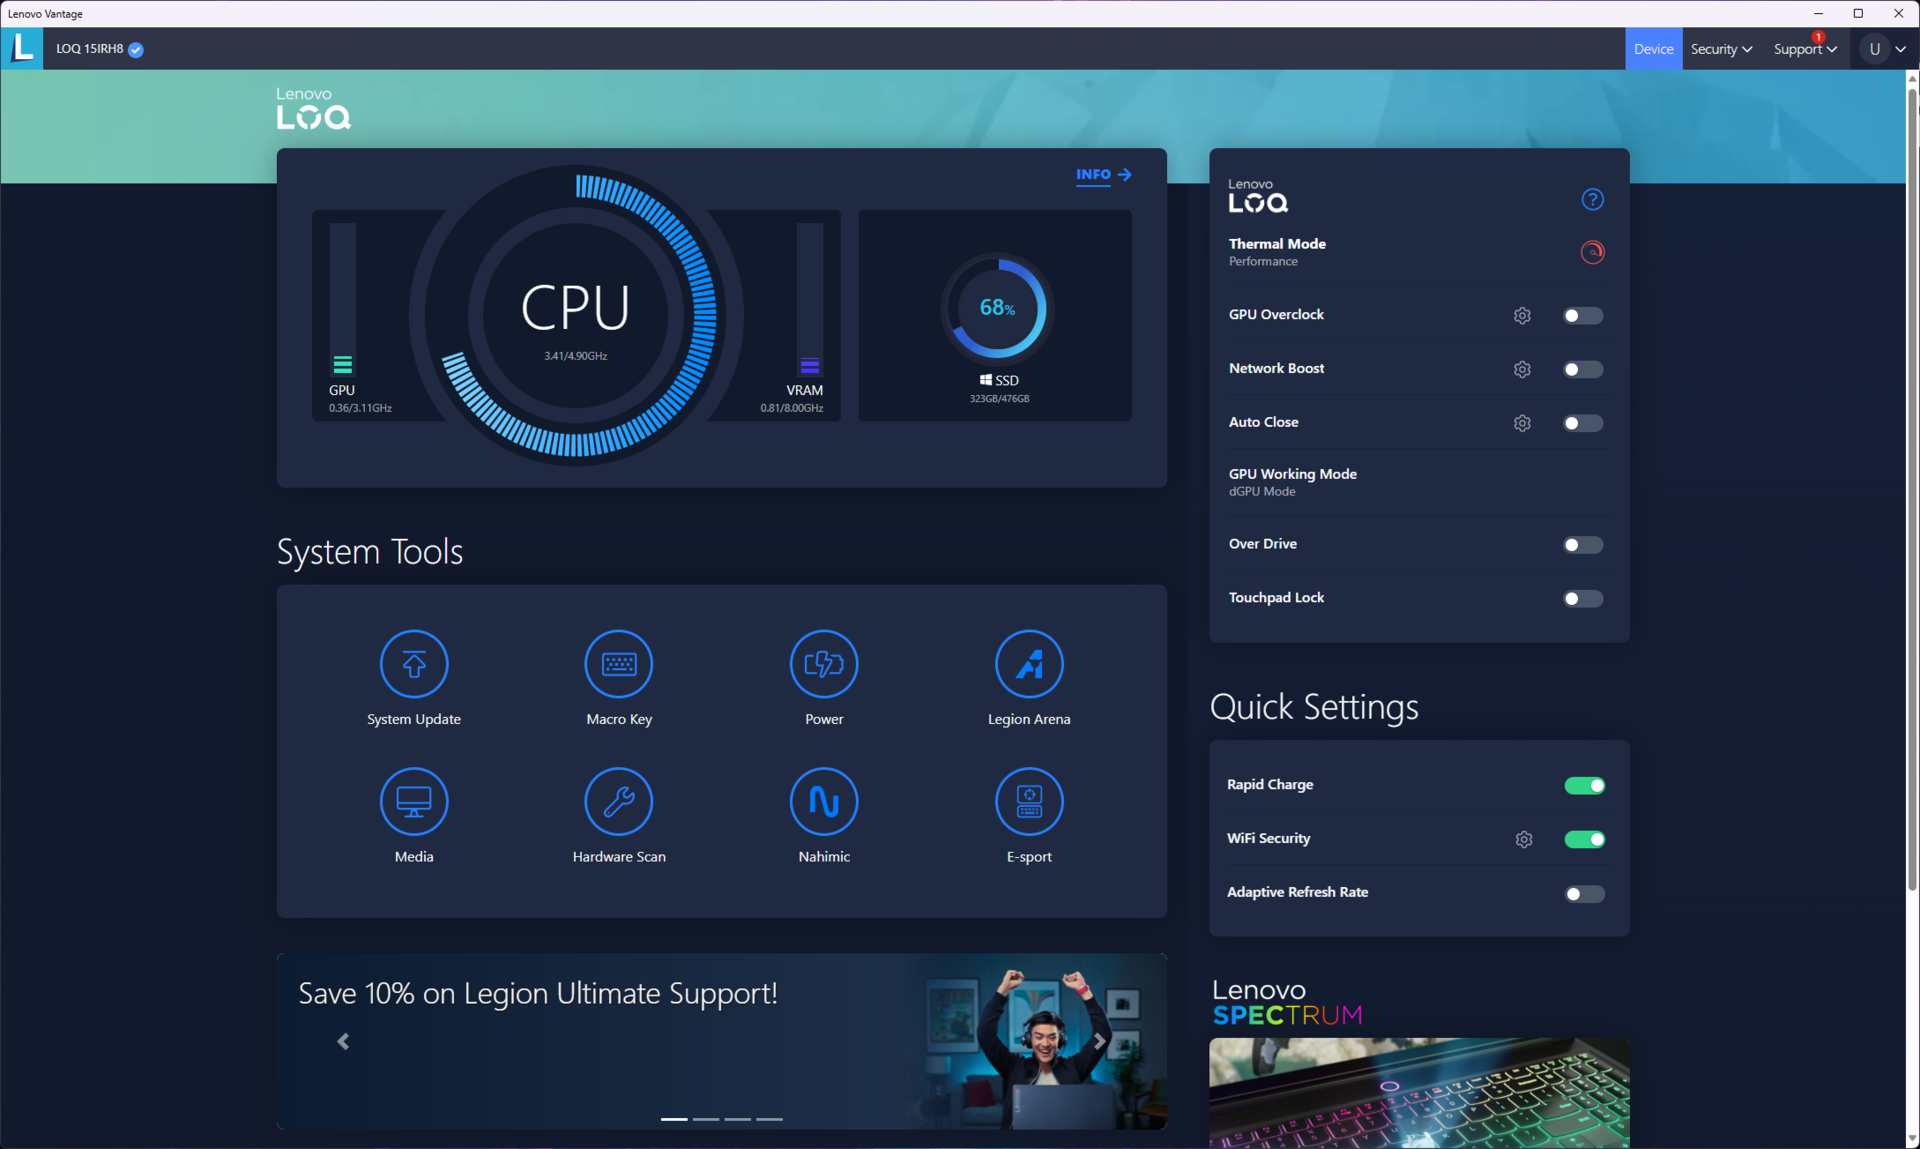
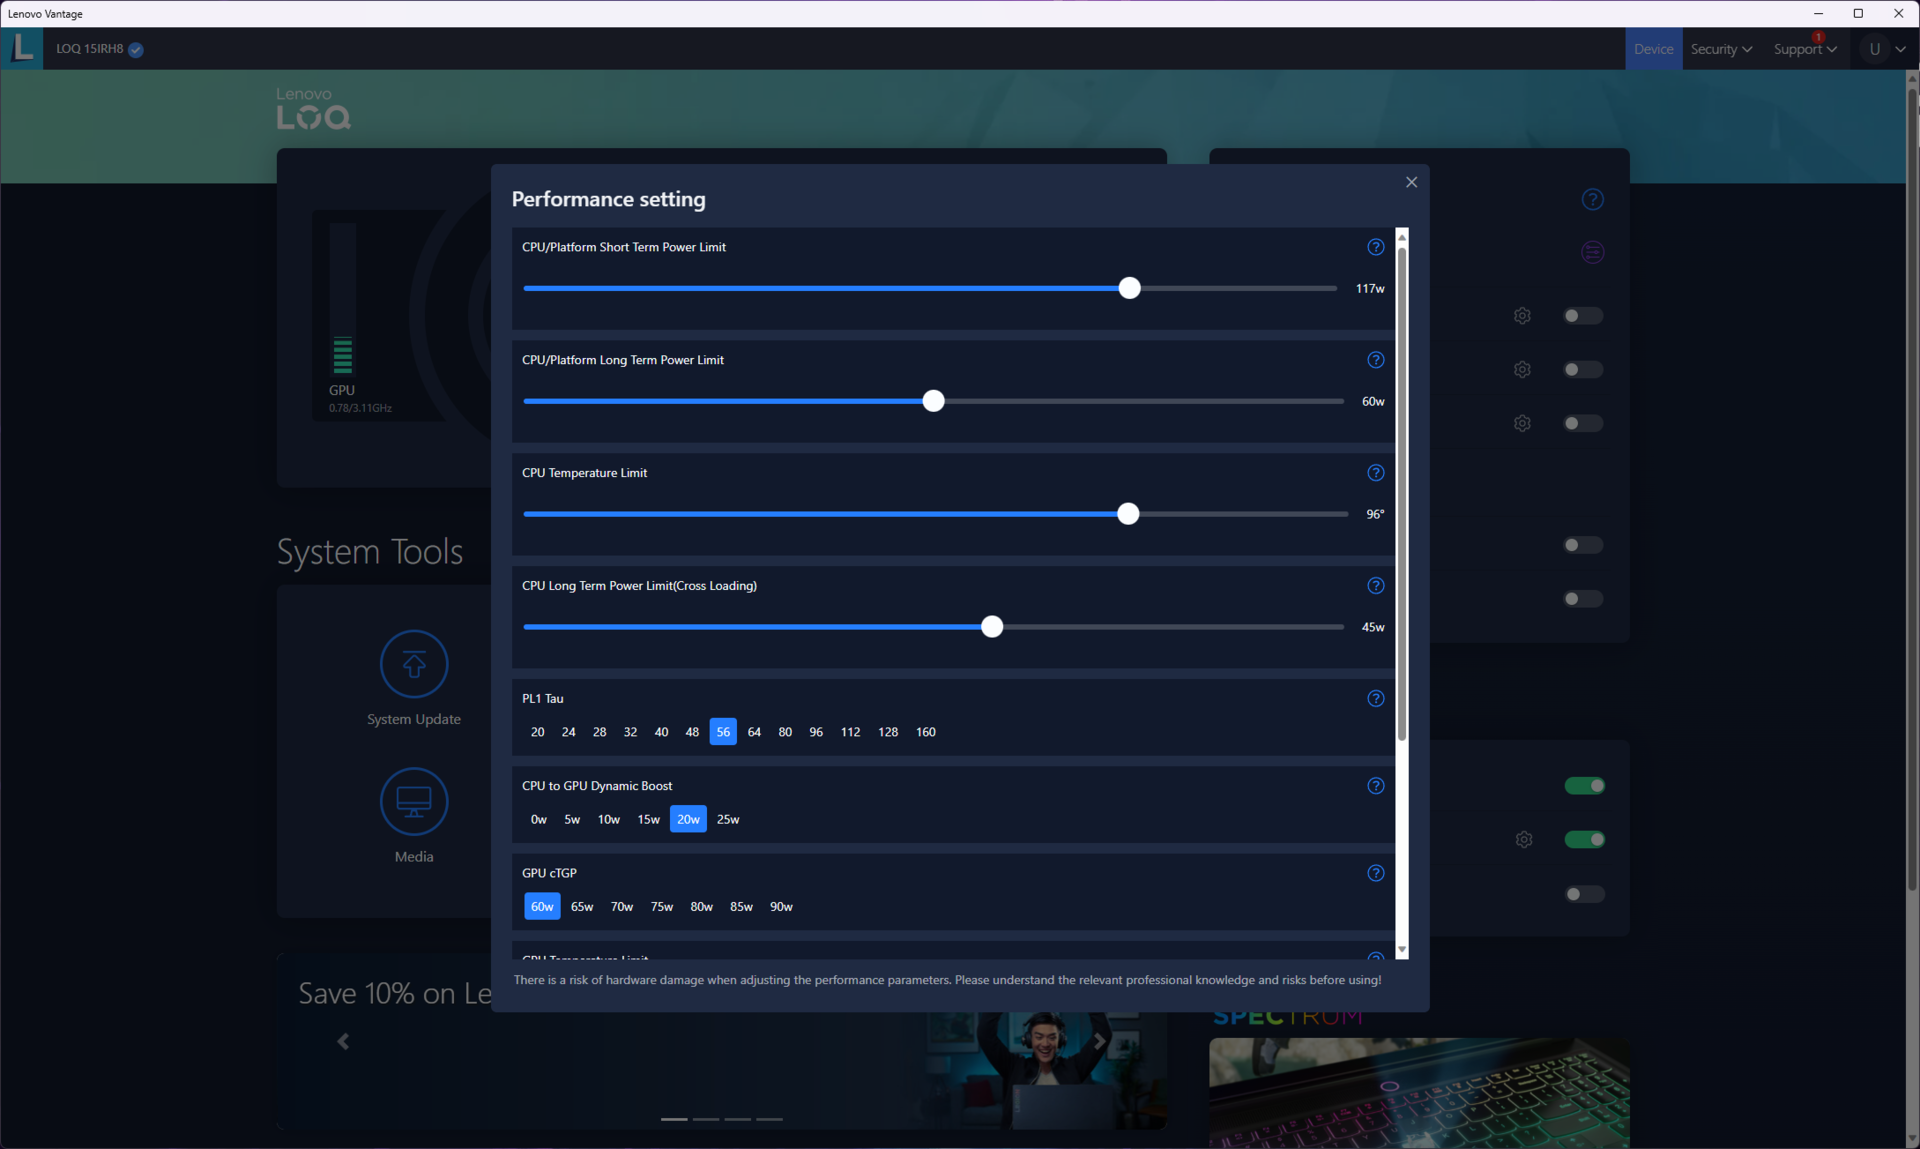
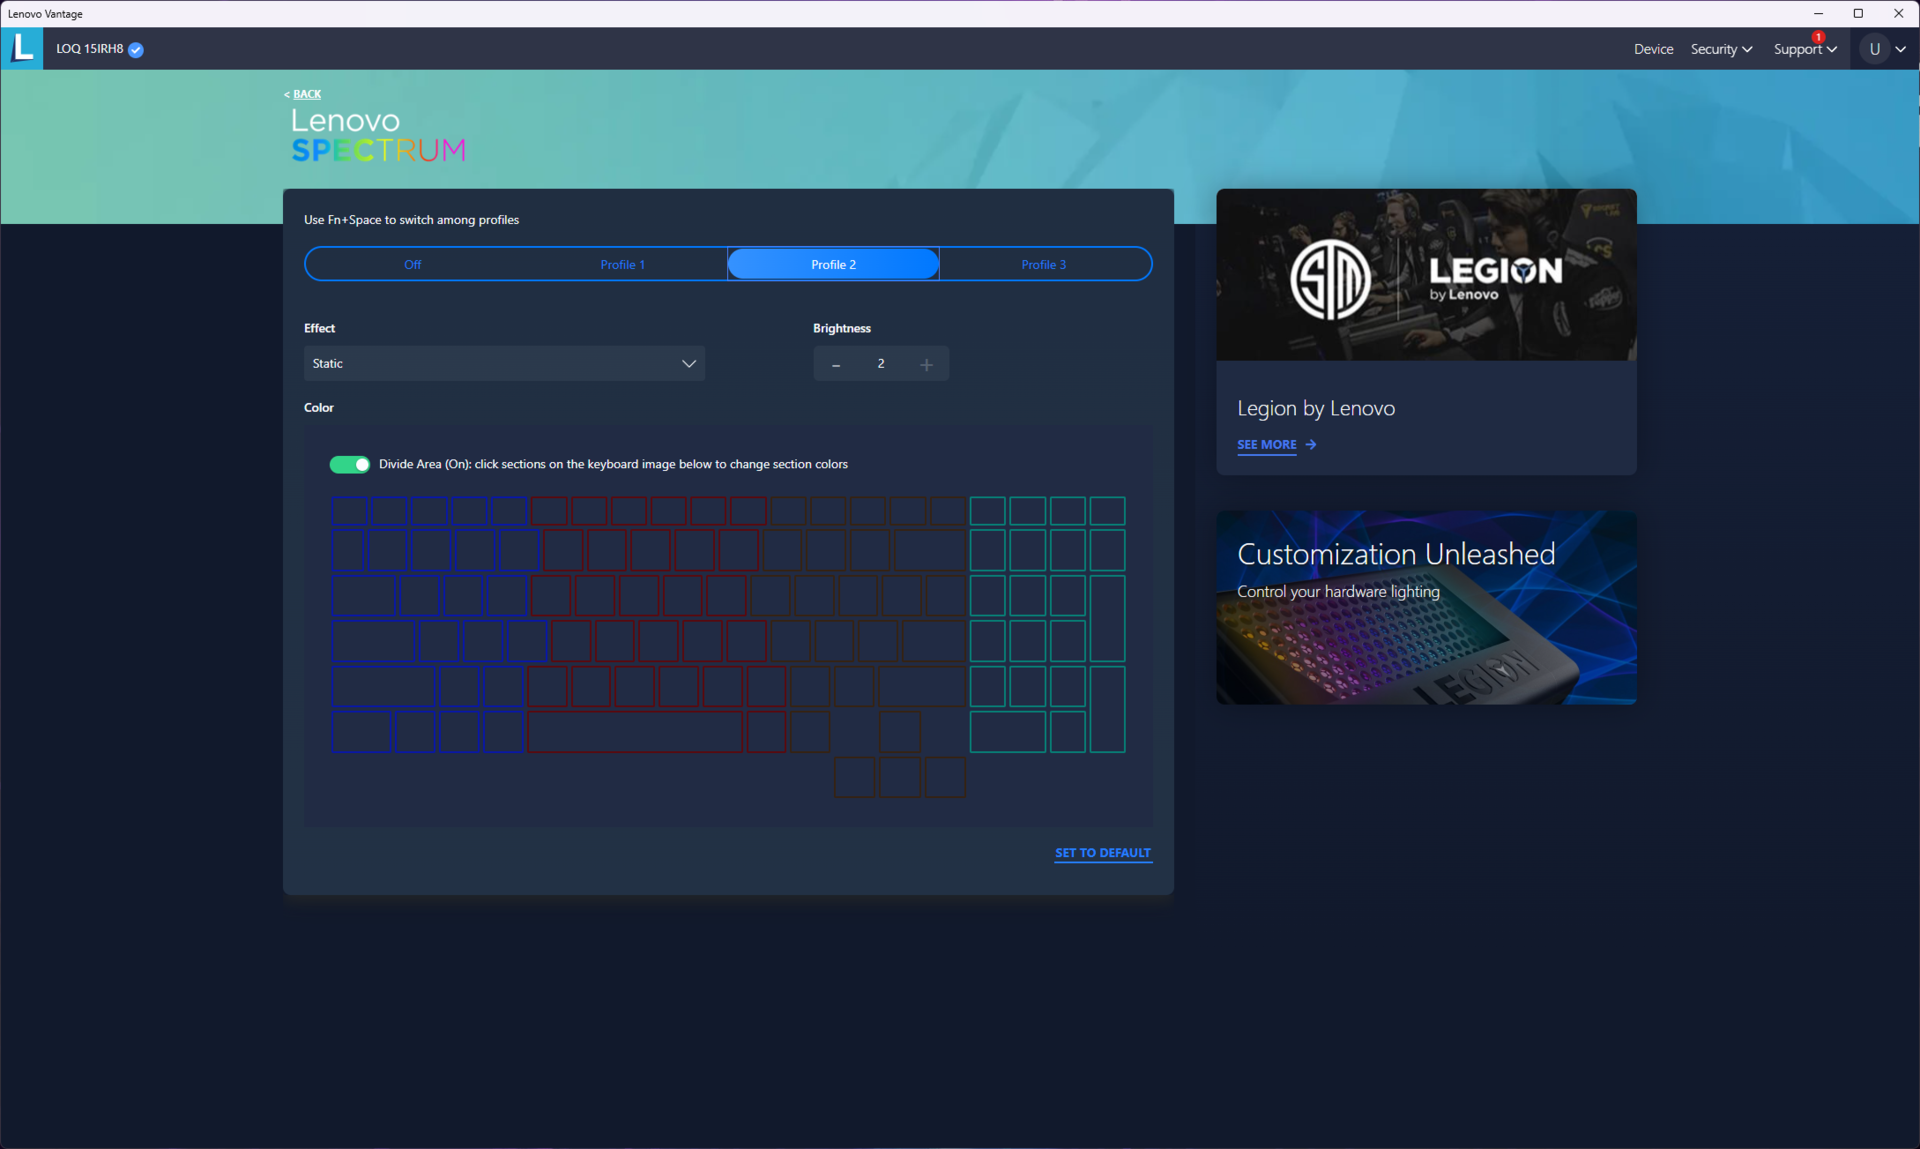
Lenovo Vantage gör det enkelt att ändra kraftprofiler, RGB-effekter och andra egenskaper hos LOQ 15. Appen gör det också möjligt för erfarna användare att ställa in egna effektgränser för CPU, varaktighet, GPU TDP, GPU till CPU Dynamic Boost och temperaturgränser efter önskemål.
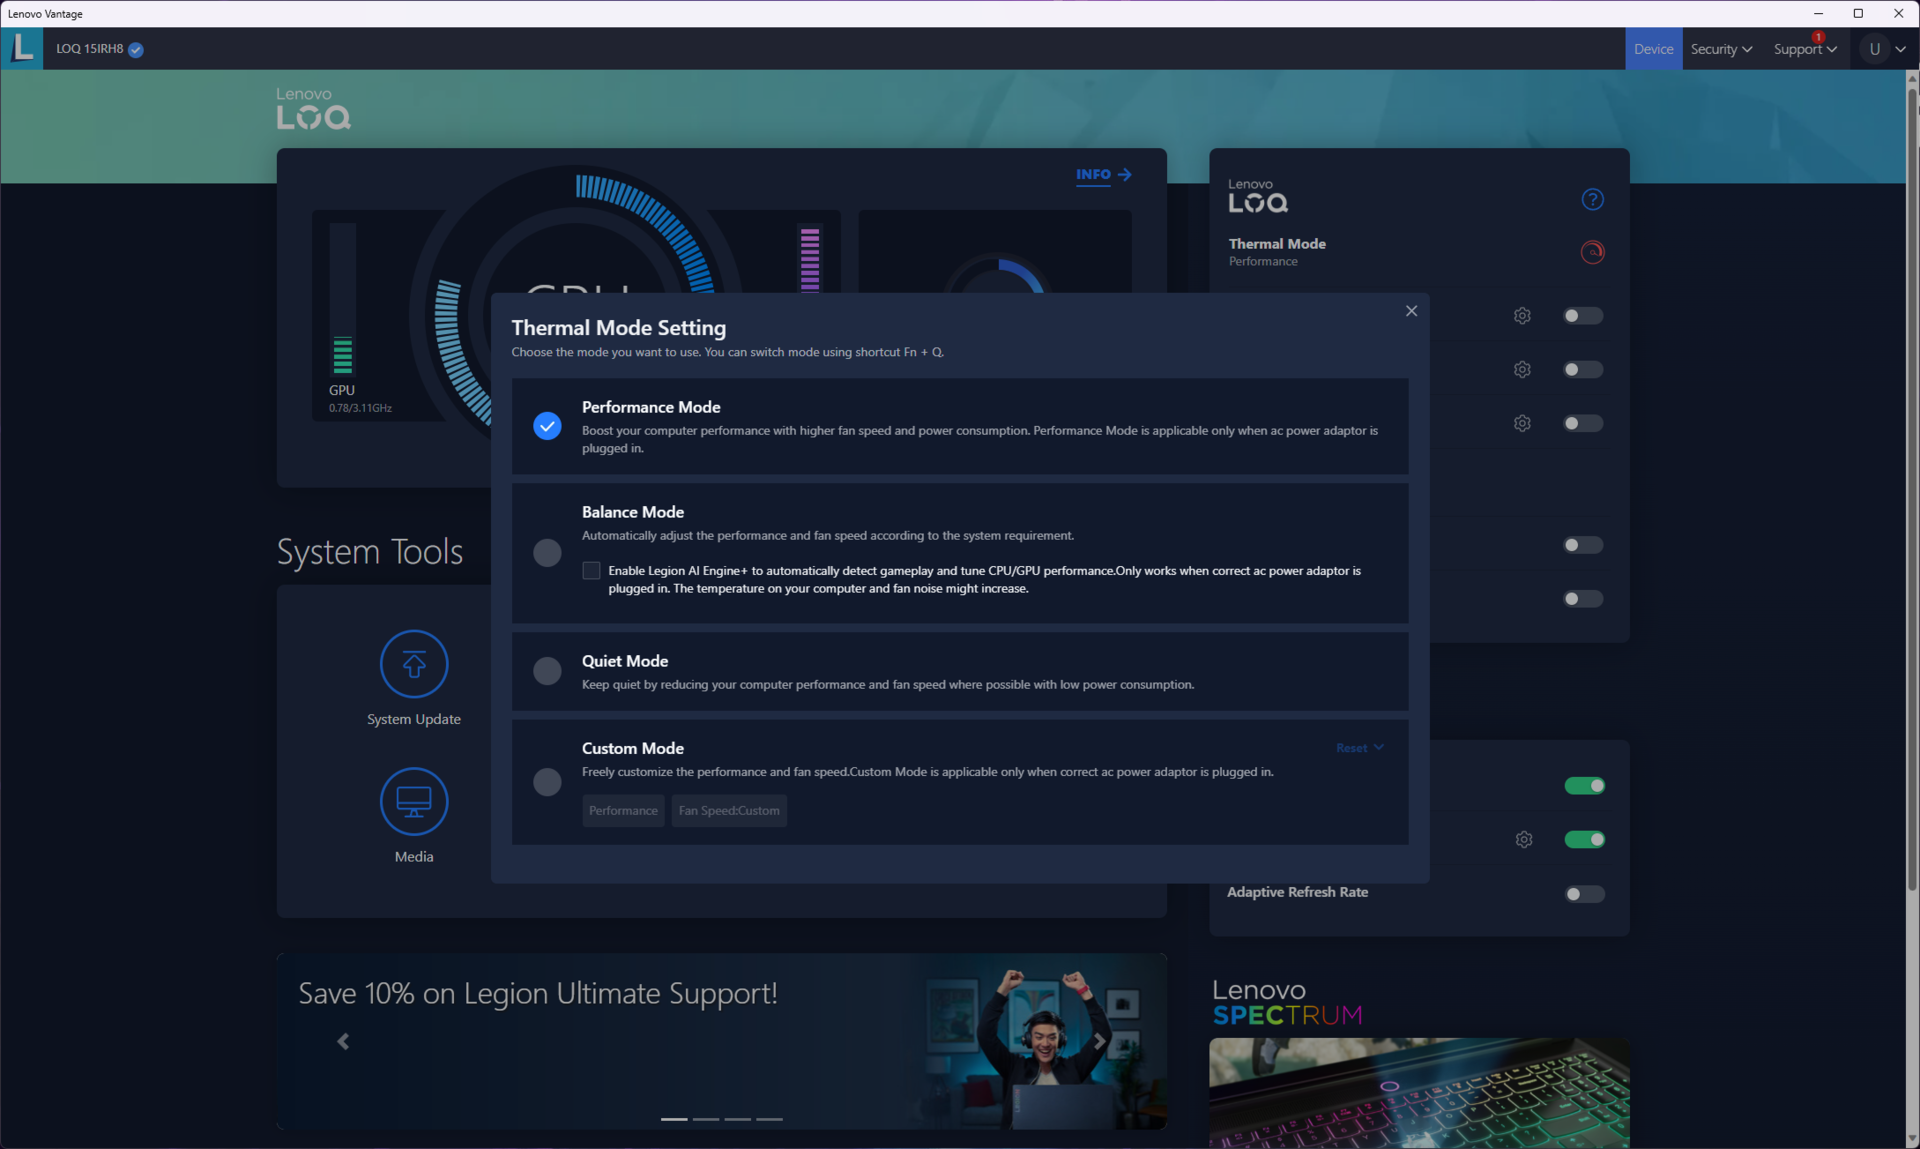
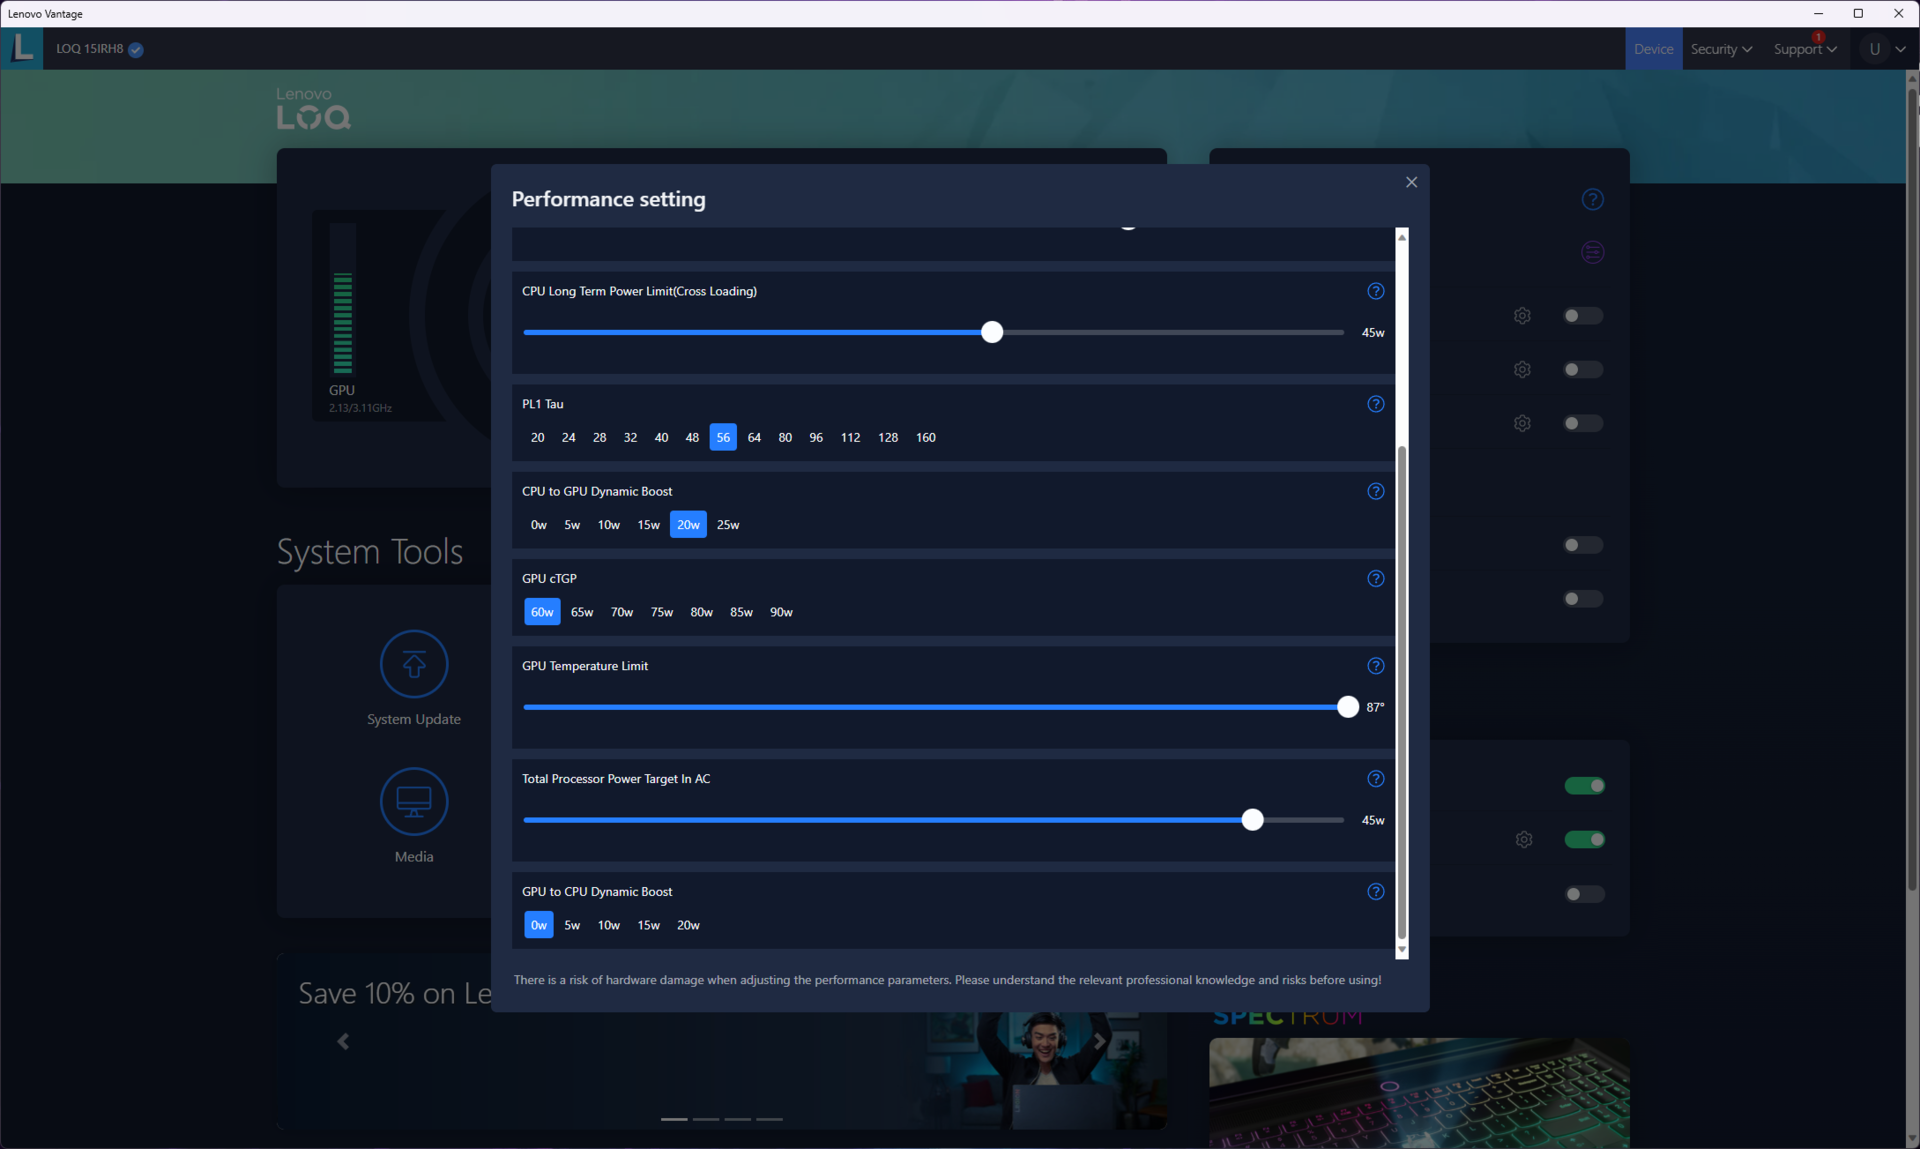
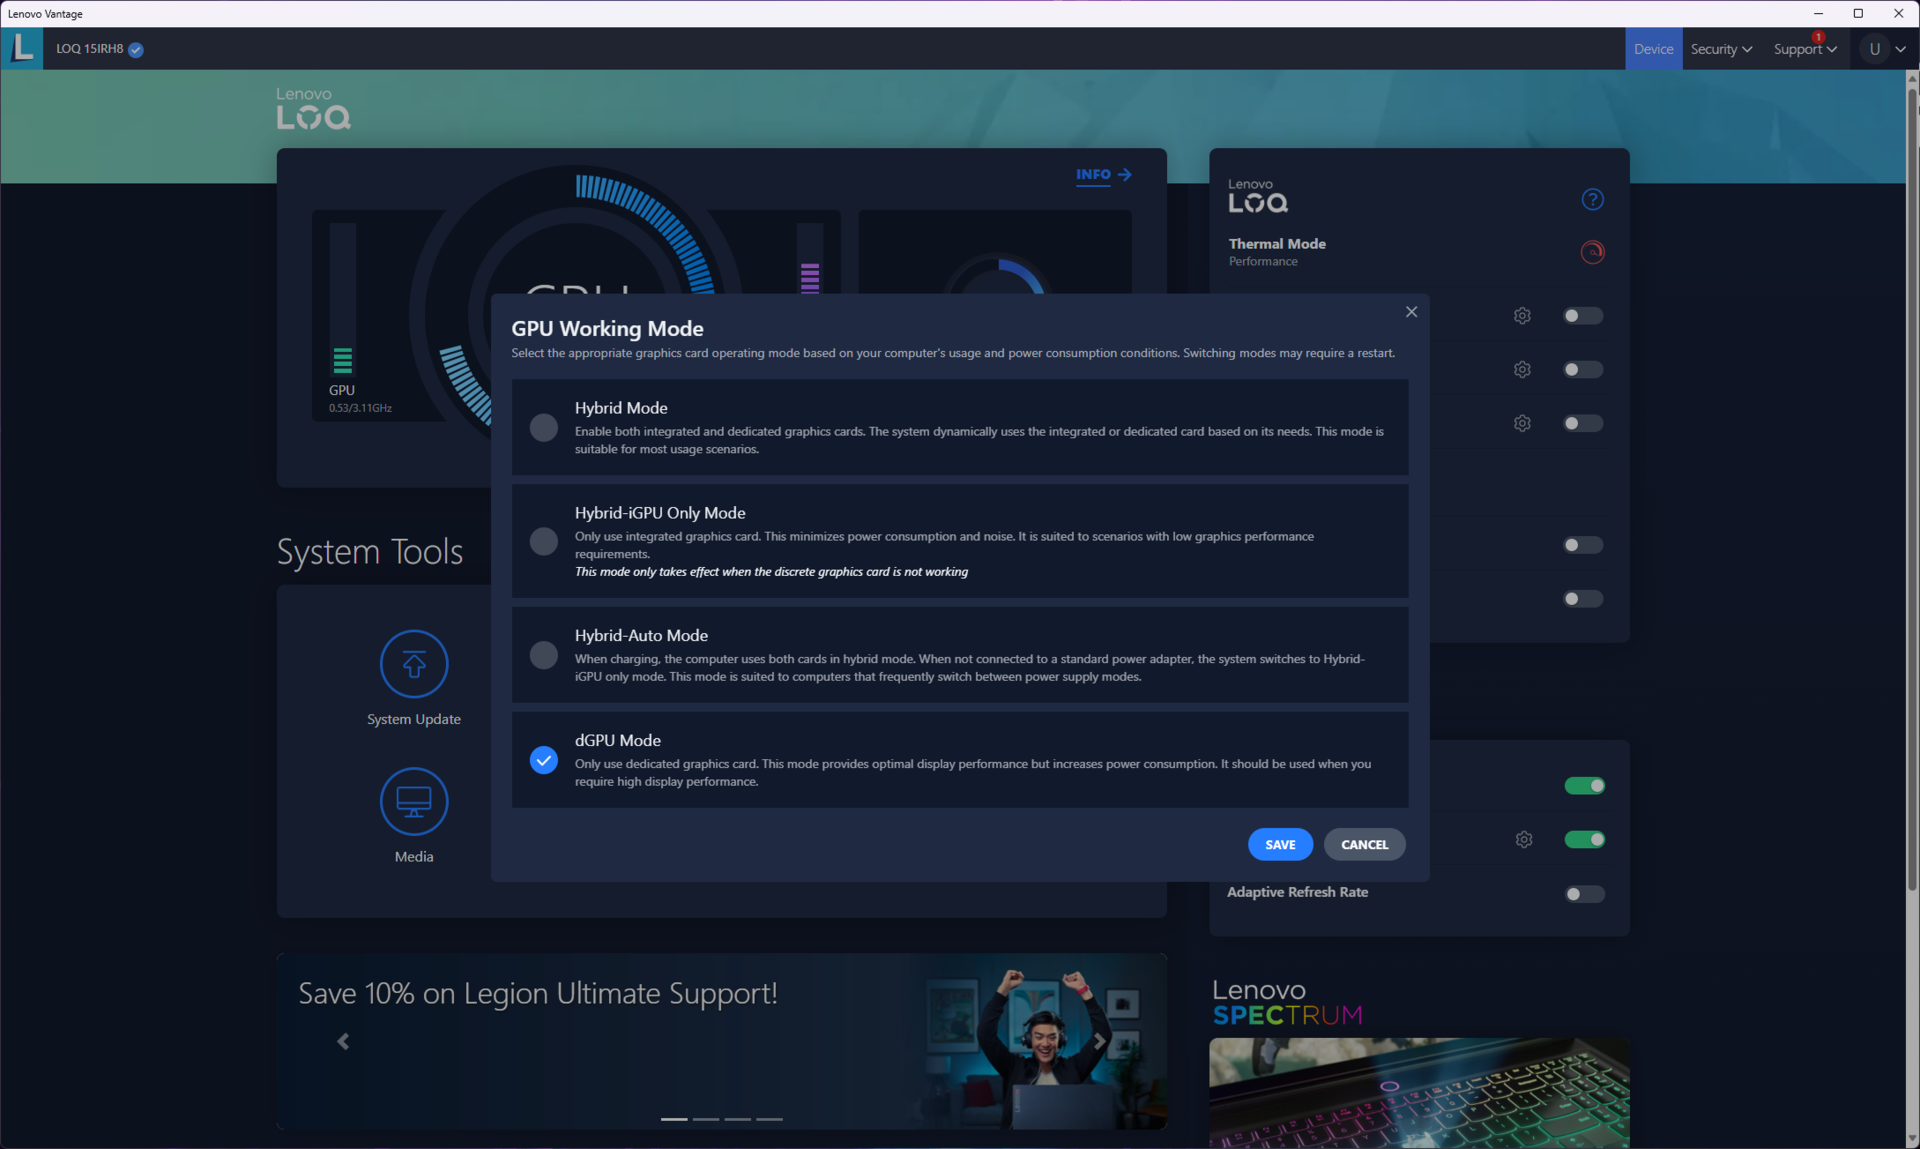
Tabellen nedan visar hur standardprofilerna påverkar PL1 och PL2 för processorn. För våra tester använde vi prestandaprofilen och aktiverade dGPU-läget för att låta Core i7-13620H och RTX 4050 visa sina muskler fullt ut. Batteritesterna kördes i profilen Tyst med GPU:n inställd på Hybrid-läge.
| Prestandaläge | PL1 (PBP) / Tau | PL2 (MTP) / Tau | PL4 | Cinebench R15 Multi score | Cinebench R15 Multi score (30 loopar) |
|---|---|---|---|---|---|
| Tyst | 45 W / 56 s | 55 W / 2,44 ms | 210 W | 1 879 (-17,98%) | 1 412 (-26,34%) |
| Balans | 60 W / 56 s | 117 W / 2,44 ms | 210 W | 2 178 (-4,93%) | 1 657 (-13,56%) |
| Prestanda | 70 W / 56 s | 135 W / 2,44 ms | 210 W | 2 291 (100%) | 1 917 (100%) |
Processor
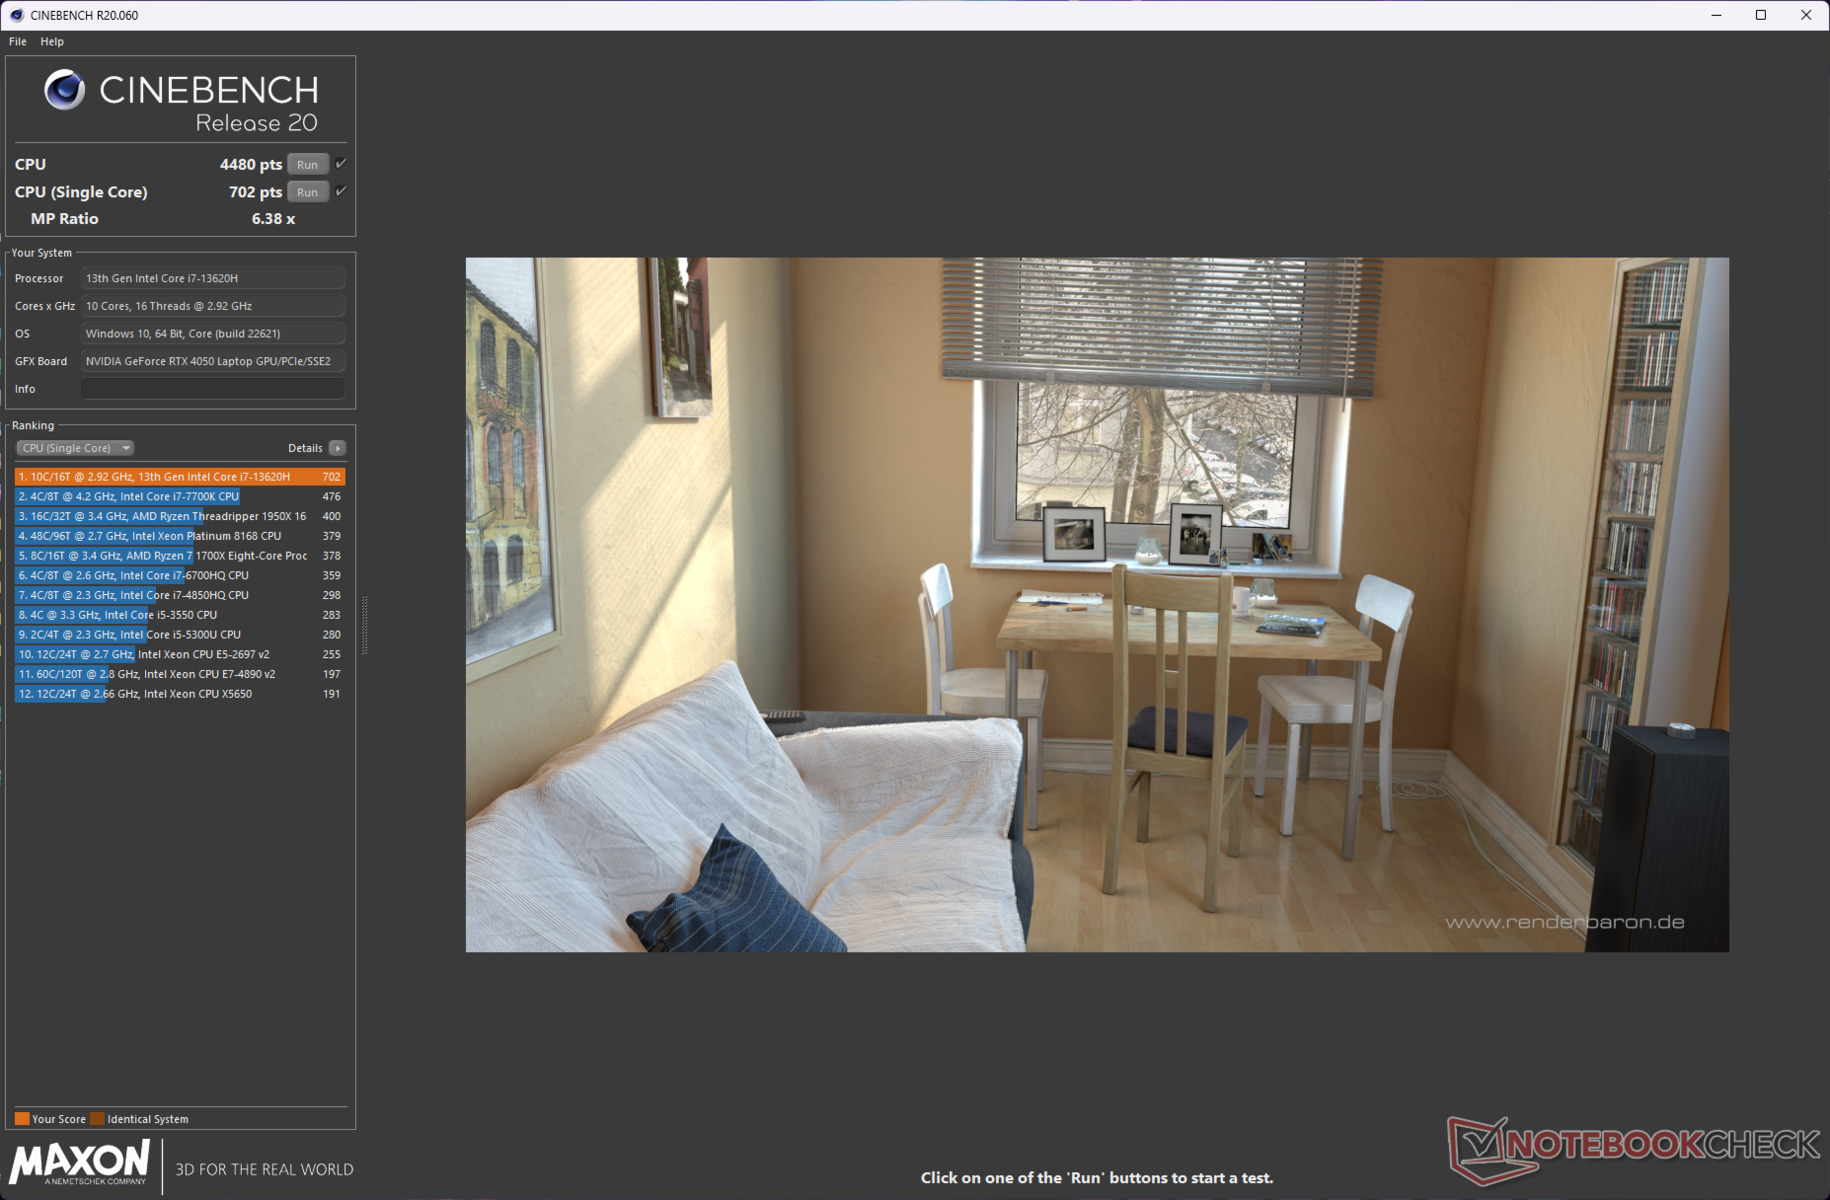
LOQ 15IRH8:s Core i7-13620H ligger efter den Ryzen 7 7840HS-drivna LOQ 15APH8 med så mycket som 16 % i Cinebench multi-core-tester trots samma antal trådar, troligtvis på grund av högre klockfrekvenser i den senare. Vi ser dock en omkastning av roller i Geekbench multi-core. Intel-chipet visar också upp en bra show i de flesta single-core-benchmarks.
LOQ 15IRH8:s chassi och kylning verkar ha problem med att korrekt upprätthålla ett Cinebench R15 multi-core loop-test. Core i7-13620H hittar ett bättre hem i LOQ 16IRH8 där processorns prestanda är mycket stabil.
Cinebench R15 Multi Loop
Cinebench R23: Multi Core | Single Core
Cinebench R20: CPU (Multi Core) | CPU (Single Core)
Cinebench R15: CPU Multi 64Bit | CPU Single 64Bit
Blender: v2.79 BMW27 CPU
7-Zip 18.03: 7z b 4 | 7z b 4 -mmt1
Geekbench 5.5: Multi-Core | Single-Core
HWBOT x265 Benchmark v2.2: 4k Preset
LibreOffice : 20 Documents To PDF
R Benchmark 2.5: Overall mean
| CPU Performance rating | |
| Genomsnitt av klass Gaming | |
| Dell G15 5530 | |
| Asus TUF Gaming A16 FA617XS | |
| Lenovo LOQ 15APH8 | |
| Lenovo LOQ 16IRH8 | |
| Lenovo Legion Pro 5 16ARX8 (R5 7645HX, RTX 4050) | |
| Lenovo LOQ 15IRH8 Core i7 | |
| MSI Katana 17 B13VFK | |
| Genomsnitt Intel Core i7-13620H | |
| HP Victus 16-r0077ng | |
| Cinebench R23 / Multi Core | |
| Genomsnitt av klass Gaming (10488 - 40970, n=112, senaste 2 åren) | |
| Dell G15 5530 | |
| Lenovo LOQ 15APH8 | |
| Asus TUF Gaming A16 FA617XS | |
| MSI Katana 17 B13VFK | |
| HP Victus 16-r0077ng | |
| Lenovo LOQ 16IRH8 | |
| Lenovo LOQ 15IRH8 Core i7 | |
| Genomsnitt Intel Core i7-13620H (10819 - 15496, n=7) | |
| Lenovo Legion Pro 5 16ARX8 (R5 7645HX, RTX 4050) | |
| Cinebench R23 / Single Core | |
| Genomsnitt av klass Gaming (1166 - 2356, n=112, senaste 2 åren) | |
| Lenovo LOQ 16IRH8 | |
| Lenovo LOQ 15IRH8 Core i7 | |
| Dell G15 5530 | |
| Genomsnitt Intel Core i7-13620H (1716 - 1871, n=7) | |
| Lenovo Legion Pro 5 16ARX8 (R5 7645HX, RTX 4050) | |
| MSI Katana 17 B13VFK | |
| Asus TUF Gaming A16 FA617XS | |
| Lenovo LOQ 15APH8 | |
| HP Victus 16-r0077ng | |
| Cinebench R20 / CPU (Multi Core) | |
| Genomsnitt av klass Gaming (4029 - 16108, n=111, senaste 2 åren) | |
| Dell G15 5530 | |
| Lenovo LOQ 15APH8 | |
| Asus TUF Gaming A16 FA617XS | |
| MSI Katana 17 B13VFK | |
| HP Victus 16-r0077ng | |
| Lenovo LOQ 15IRH8 Core i7 | |
| Lenovo LOQ 16IRH8 | |
| Lenovo Legion Pro 5 16ARX8 (R5 7645HX, RTX 4050) | |
| Genomsnitt Intel Core i7-13620H (4214 - 5905, n=7) | |
| Cinebench R20 / CPU (Single Core) | |
| Genomsnitt av klass Gaming (442 - 895, n=111, senaste 2 åren) | |
| Lenovo LOQ 15IRH8 Core i7 | |
| Dell G15 5530 | |
| Lenovo LOQ 16IRH8 | |
| Asus TUF Gaming A16 FA617XS | |
| Lenovo Legion Pro 5 16ARX8 (R5 7645HX, RTX 4050) | |
| Genomsnitt Intel Core i7-13620H (657 - 719, n=7) | |
| Lenovo LOQ 15APH8 | |
| MSI Katana 17 B13VFK | |
| HP Victus 16-r0077ng | |
| Cinebench R15 / CPU Multi 64Bit | |
| Genomsnitt av klass Gaming (1578 - 6271, n=111, senaste 2 åren) | |
| Dell G15 5530 | |
| Lenovo LOQ 15APH8 | |
| Asus TUF Gaming A16 FA617XS | |
| Lenovo LOQ 16IRH8 | |
| MSI Katana 17 B13VFK | |
| HP Victus 16-r0077ng | |
| Lenovo LOQ 15IRH8 Core i7 | |
| Lenovo Legion Pro 5 16ARX8 (R5 7645HX, RTX 4050) | |
| Genomsnitt Intel Core i7-13620H (1681 - 2492, n=7) | |
| Cinebench R15 / CPU Single 64Bit | |
| Genomsnitt av klass Gaming (188.8 - 343, n=111, senaste 2 åren) | |
| Lenovo Legion Pro 5 16ARX8 (R5 7645HX, RTX 4050) | |
| Asus TUF Gaming A16 FA617XS | |
| Lenovo LOQ 15APH8 | |
| Dell G15 5530 | |
| Lenovo LOQ 16IRH8 | |
| Lenovo LOQ 15IRH8 Core i7 | |
| Genomsnitt Intel Core i7-13620H (250 - 269, n=7) | |
| MSI Katana 17 B13VFK | |
| HP Victus 16-r0077ng | |
| Blender / v2.79 BMW27 CPU | |
| Lenovo LOQ 15IRH8 Core i7 | |
| Genomsnitt Intel Core i7-13620H (215 - 297, n=7) | |
| Lenovo Legion Pro 5 16ARX8 (R5 7645HX, RTX 4050) | |
| Lenovo LOQ 16IRH8 | |
| MSI Katana 17 B13VFK | |
| HP Victus 16-r0077ng | |
| Asus TUF Gaming A16 FA617XS | |
| Lenovo LOQ 15APH8 | |
| Dell G15 5530 | |
| Genomsnitt av klass Gaming (80 - 330, n=109, senaste 2 åren) | |
| 7-Zip 18.03 / 7z b 4 | |
| Genomsnitt av klass Gaming (33491 - 148086, n=110, senaste 2 åren) | |
| Dell G15 5530 | |
| Asus TUF Gaming A16 FA617XS | |
| HP Victus 16-r0077ng | |
| MSI Katana 17 B13VFK | |
| Lenovo Legion Pro 5 16ARX8 (R5 7645HX, RTX 4050) | |
| Lenovo LOQ 15APH8 | |
| Lenovo LOQ 16IRH8 | |
| Lenovo LOQ 15IRH8 Core i7 | |
| Genomsnitt Intel Core i7-13620H (45092 - 62324, n=7) | |
| 7-Zip 18.03 / 7z b 4 -mmt1 | |
| Lenovo Legion Pro 5 16ARX8 (R5 7645HX, RTX 4050) | |
| Asus TUF Gaming A16 FA617XS | |
| Genomsnitt av klass Gaming (4199 - 7436, n=110, senaste 2 åren) | |
| Lenovo LOQ 15APH8 | |
| Genomsnitt Intel Core i7-13620H (5648 - 6326, n=7) | |
| Lenovo LOQ 15IRH8 Core i7 | |
| Lenovo LOQ 16IRH8 | |
| Dell G15 5530 | |
| MSI Katana 17 B13VFK | |
| HP Victus 16-r0077ng | |
| Geekbench 5.5 / Multi-Core | |
| Genomsnitt av klass Gaming (6460 - 27010, n=110, senaste 2 åren) | |
| Dell G15 5530 | |
| Lenovo LOQ 16IRH8 | |
| Asus TUF Gaming A16 FA617XS | |
| HP Victus 16-r0077ng | |
| Lenovo LOQ 15IRH8 Core i7 | |
| MSI Katana 17 B13VFK | |
| Genomsnitt Intel Core i7-13620H (8112 - 12223, n=7) | |
| Lenovo Legion Pro 5 16ARX8 (R5 7645HX, RTX 4050) | |
| Lenovo LOQ 15APH8 | |
| Geekbench 5.5 / Single-Core | |
| Genomsnitt av klass Gaming (986 - 2474, n=110, senaste 2 åren) | |
| Asus TUF Gaming A16 FA617XS | |
| Lenovo Legion Pro 5 16ARX8 (R5 7645HX, RTX 4050) | |
| Lenovo LOQ 15IRH8 Core i7 | |
| Dell G15 5530 | |
| Lenovo LOQ 15APH8 | |
| Lenovo LOQ 16IRH8 | |
| Genomsnitt Intel Core i7-13620H (1703 - 1865, n=7) | |
| MSI Katana 17 B13VFK | |
| HP Victus 16-r0077ng | |
| HWBOT x265 Benchmark v2.2 / 4k Preset | |
| Genomsnitt av klass Gaming (11.5 - 44.3, n=110, senaste 2 åren) | |
| Dell G15 5530 | |
| Asus TUF Gaming A16 FA617XS | |
| Lenovo Legion Pro 5 16ARX8 (R5 7645HX, RTX 4050) | |
| Lenovo LOQ 15APH8 | |
| MSI Katana 17 B13VFK | |
| Lenovo LOQ 16IRH8 | |
| Lenovo LOQ 15IRH8 Core i7 | |
| HP Victus 16-r0077ng | |
| Genomsnitt Intel Core i7-13620H (12.2 - 17.7, n=7) | |
| LibreOffice / 20 Documents To PDF | |
| HP Victus 16-r0077ng | |
| MSI Katana 17 B13VFK | |
| Lenovo Legion Pro 5 16ARX8 (R5 7645HX, RTX 4050) | |
| Genomsnitt Intel Core i7-13620H (41.5 - 78.9, n=7) | |
| Genomsnitt av klass Gaming (19 - 88.8, n=110, senaste 2 åren) | |
| Dell G15 5530 | |
| Lenovo LOQ 16IRH8 | |
| Lenovo LOQ 15IRH8 Core i7 | |
| Asus TUF Gaming A16 FA617XS | |
| Lenovo LOQ 15APH8 | |
| R Benchmark 2.5 / Overall mean | |
| HP Victus 16-r0077ng | |
| Genomsnitt Intel Core i7-13620H (0.4438 - 0.4762, n=7) | |
| Lenovo LOQ 15IRH8 Core i7 | |
| Lenovo LOQ 15APH8 | |
| Lenovo LOQ 16IRH8 | |
| MSI Katana 17 B13VFK | |
| Lenovo Legion Pro 5 16ARX8 (R5 7645HX, RTX 4050) | |
| Genomsnitt av klass Gaming (0.3439 - 0.759, n=111, senaste 2 åren) | |
| Dell G15 5530 | |
| Asus TUF Gaming A16 FA617XS | |
* ... mindre är bättre
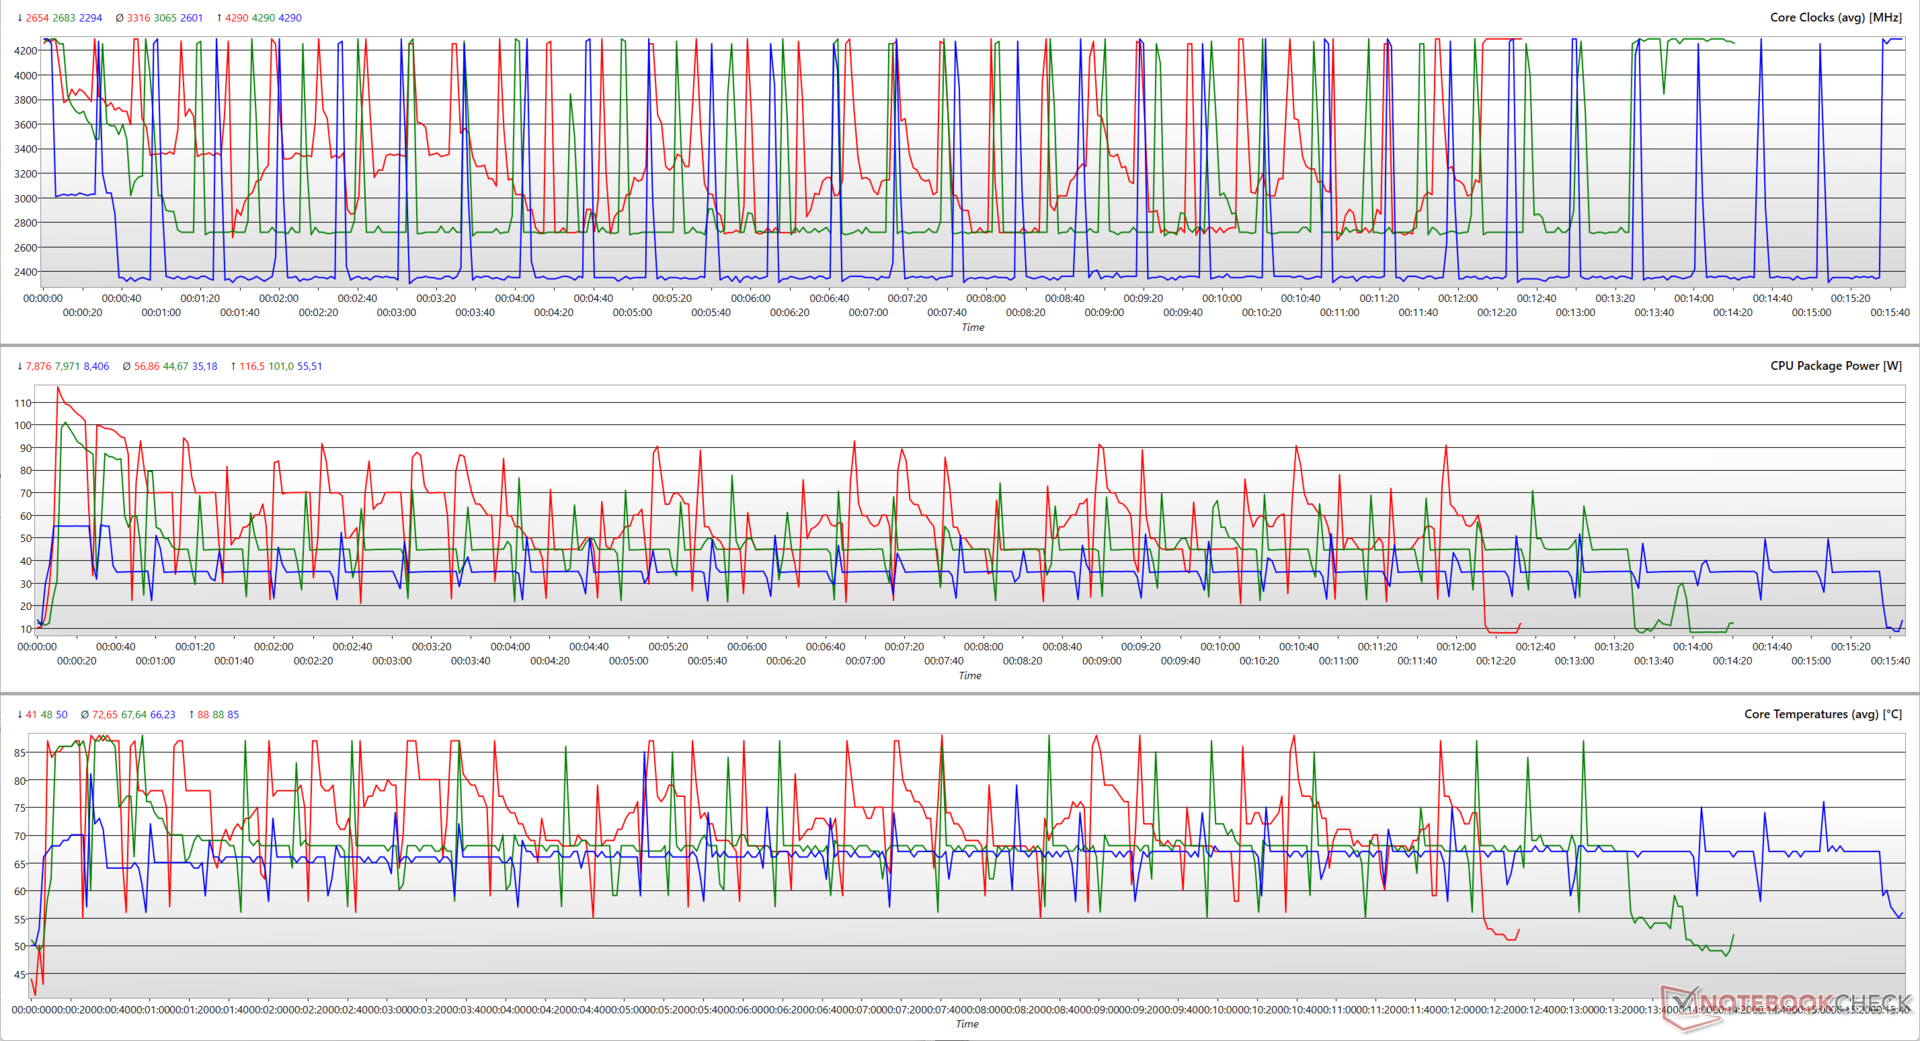
En analys av Cinebench R15 multi-core loop-test visar hur de inbyggda effektprofilerna påverkar olika CPU-parametrar.
Medan Performance-läget är tänkt att låta processorn utnyttja upp till 135 W PL2, ser vi att den bara maxar ut vid 116,5 W. Balance-läget verkar också klara sig med mindre paketström än möjligt (101 W vs 117 W), men här ser vi en mer stabil körning jämfört med Performance.
Det är möjligt att LOQ 15IRH8:s kylsystem kämpar när effektgränsen passerar 116 W, vilket förklarar den dåligt uthålliga prestandan i detta riktmärke.
Cinebench R20 flerkärniga resultat sjunker med 23 % vid batteridrift, även om enkelkärnig prestanda endast drabbas i mindre utsträckning.
AIDA64: FP32 Ray-Trace | FPU Julia | CPU SHA3 | CPU Queen | FPU SinJulia | FPU Mandel | CPU AES | CPU ZLib | FP64 Ray-Trace | CPU PhotoWorxx
| Performance rating | |
| Genomsnitt av klass Gaming | |
| Asus TUF Gaming A16 FA617XS | |
| Lenovo LOQ 15APH8 | |
| Dell G15 5530 | |
| Lenovo Legion Pro 5 16ARX8 (R5 7645HX, RTX 4050) | |
| HP Victus 16-r0077ng | |
| MSI Katana 17 B13VFK | |
| Lenovo LOQ 16IRH8 | |
| Lenovo LOQ 15IRH8 Core i7 | |
| Genomsnitt Intel Core i7-13620H | |
| AIDA64 / FP32 Ray-Trace | |
| Genomsnitt av klass Gaming (10227 - 85542, n=109, senaste 2 åren) | |
| Lenovo LOQ 15APH8 | |
| Asus TUF Gaming A16 FA617XS | |
| Lenovo Legion Pro 5 16ARX8 (R5 7645HX, RTX 4050) | |
| Dell G15 5530 | |
| HP Victus 16-r0077ng | |
| MSI Katana 17 B13VFK | |
| Lenovo LOQ 16IRH8 | |
| Genomsnitt Intel Core i7-13620H (10779 - 13601, n=7) | |
| Lenovo LOQ 15IRH8 Core i7 | |
| AIDA64 / FPU Julia | |
| Genomsnitt av klass Gaming (51376 - 238426, n=109, senaste 2 åren) | |
| Lenovo LOQ 15APH8 | |
| Asus TUF Gaming A16 FA617XS | |
| Lenovo Legion Pro 5 16ARX8 (R5 7645HX, RTX 4050) | |
| Dell G15 5530 | |
| HP Victus 16-r0077ng | |
| MSI Katana 17 B13VFK | |
| Lenovo LOQ 16IRH8 | |
| Lenovo LOQ 15IRH8 Core i7 | |
| Genomsnitt Intel Core i7-13620H (54287 - 67187, n=7) | |
| AIDA64 / CPU SHA3 | |
| Genomsnitt av klass Gaming (2180 - 9817, n=109, senaste 2 åren) | |
| Lenovo LOQ 15APH8 | |
| Asus TUF Gaming A16 FA617XS | |
| Dell G15 5530 | |
| Lenovo Legion Pro 5 16ARX8 (R5 7645HX, RTX 4050) | |
| HP Victus 16-r0077ng | |
| MSI Katana 17 B13VFK | |
| Lenovo LOQ 16IRH8 | |
| Genomsnitt Intel Core i7-13620H (2327 - 2773, n=7) | |
| Lenovo LOQ 15IRH8 Core i7 | |
| AIDA64 / CPU Queen | |
| Asus TUF Gaming A16 FA617XS | |
| Lenovo LOQ 15APH8 | |
| Genomsnitt av klass Gaming (49785 - 173351, n=100, senaste 2 åren) | |
| Dell G15 5530 | |
| Lenovo Legion Pro 5 16ARX8 (R5 7645HX, RTX 4050) | |
| HP Victus 16-r0077ng | |
| Lenovo LOQ 15IRH8 Core i7 | |
| Lenovo LOQ 16IRH8 | |
| MSI Katana 17 B13VFK | |
| Genomsnitt Intel Core i7-13620H (66885 - 78867, n=7) | |
| AIDA64 / FPU SinJulia | |
| Asus TUF Gaming A16 FA617XS | |
| Lenovo LOQ 15APH8 | |
| Genomsnitt av klass Gaming (4424 - 33636, n=109, senaste 2 åren) | |
| Lenovo Legion Pro 5 16ARX8 (R5 7645HX, RTX 4050) | |
| Dell G15 5530 | |
| HP Victus 16-r0077ng | |
| MSI Katana 17 B13VFK | |
| Lenovo LOQ 16IRH8 | |
| Genomsnitt Intel Core i7-13620H (6737 - 8421, n=7) | |
| Lenovo LOQ 15IRH8 Core i7 | |
| AIDA64 / FPU Mandel | |
| Genomsnitt av klass Gaming (25115 - 128721, n=109, senaste 2 åren) | |
| Lenovo LOQ 15APH8 | |
| Asus TUF Gaming A16 FA617XS | |
| Lenovo Legion Pro 5 16ARX8 (R5 7645HX, RTX 4050) | |
| Dell G15 5530 | |
| HP Victus 16-r0077ng | |
| MSI Katana 17 B13VFK | |
| Lenovo LOQ 16IRH8 | |
| Lenovo LOQ 15IRH8 Core i7 | |
| Genomsnitt Intel Core i7-13620H (27242 - 32787, n=7) | |
| AIDA64 / CPU AES | |
| Genomsnitt av klass Gaming (39258 - 247074, n=109, senaste 2 åren) | |
| Asus TUF Gaming A16 FA617XS | |
| Dell G15 5530 | |
| Lenovo LOQ 15APH8 | |
| HP Victus 16-r0077ng | |
| Genomsnitt Intel Core i7-13620H (48646 - 85895, n=7) | |
| MSI Katana 17 B13VFK | |
| Lenovo LOQ 16IRH8 | |
| Lenovo Legion Pro 5 16ARX8 (R5 7645HX, RTX 4050) | |
| Lenovo LOQ 15IRH8 Core i7 | |
| AIDA64 / CPU ZLib | |
| Genomsnitt av klass Gaming (574 - 2531, n=109, senaste 2 åren) | |
| Dell G15 5530 | |
| Lenovo LOQ 15APH8 | |
| Asus TUF Gaming A16 FA617XS | |
| HP Victus 16-r0077ng | |
| Lenovo Legion Pro 5 16ARX8 (R5 7645HX, RTX 4050) | |
| Lenovo LOQ 16IRH8 | |
| MSI Katana 17 B13VFK | |
| Genomsnitt Intel Core i7-13620H (688 - 835, n=7) | |
| Lenovo LOQ 15IRH8 Core i7 | |
| AIDA64 / FP64 Ray-Trace | |
| Genomsnitt av klass Gaming (5509 - 45446, n=109, senaste 2 åren) | |
| Lenovo LOQ 15APH8 | |
| Asus TUF Gaming A16 FA617XS | |
| Lenovo Legion Pro 5 16ARX8 (R5 7645HX, RTX 4050) | |
| Dell G15 5530 | |
| HP Victus 16-r0077ng | |
| MSI Katana 17 B13VFK | |
| Lenovo LOQ 16IRH8 | |
| Genomsnitt Intel Core i7-13620H (5919 - 7364, n=7) | |
| Lenovo LOQ 15IRH8 Core i7 | |
| AIDA64 / CPU PhotoWorxx | |
| Genomsnitt av klass Gaming (12271 - 89891, n=109, senaste 2 åren) | |
| HP Victus 16-r0077ng | |
| Dell G15 5530 | |
| MSI Katana 17 B13VFK | |
| Lenovo LOQ 15IRH8 Core i7 | |
| Lenovo LOQ 16IRH8 | |
| Asus TUF Gaming A16 FA617XS | |
| Lenovo Legion Pro 5 16ARX8 (R5 7645HX, RTX 4050) | |
| Genomsnitt Intel Core i7-13620H (19421 - 34544, n=7) | |
| Lenovo LOQ 15APH8 | |
Kolla in vår dedikerade Intel Core i7-13620H sida för mer information och prestandajämförelser.
Systemets prestanda
LOQ 15IRH8 leder över sin AMD-baserade kusin LOQ 15APH8 med 19% i CrossMark, men båda dessa enheter är praktiskt taget lika i PCMark. Vi observerade inga hack i den dagliga systemprestandan under produktivitets- eller speluppgifter.
CrossMark: Overall | Productivity | Creativity | Responsiveness
AIDA64: Memory Copy | Memory Read | Memory Write | Memory Latency
| PCMark 10 / Score | |
| Genomsnitt av klass Gaming (5828 - 11574, n=95, senaste 2 åren) | |
| Lenovo Legion Pro 5 16ARX8 (R5 7645HX, RTX 4050) | |
| Asus TUF Gaming A16 FA617XS | |
| Lenovo LOQ 15APH8 | |
| Lenovo LOQ 15IRH8 Core i7 | |
| Genomsnitt Intel Core i7-13620H, NVIDIA GeForce RTX 4050 Laptop GPU (n=1) | |
| MSI Katana 17 B13VFK | |
| HP Victus 16-r0077ng | |
| Dell G15 5530 | |
| Lenovo LOQ 16IRH8 | |
| PCMark 10 / Essentials | |
| Lenovo Legion Pro 5 16ARX8 (R5 7645HX, RTX 4050) | |
| Dell G15 5530 | |
| Lenovo LOQ 15IRH8 Core i7 | |
| Genomsnitt Intel Core i7-13620H, NVIDIA GeForce RTX 4050 Laptop GPU (n=1) | |
| Asus TUF Gaming A16 FA617XS | |
| MSI Katana 17 B13VFK | |
| HP Victus 16-r0077ng | |
| Genomsnitt av klass Gaming (8810 - 12600, n=99, senaste 2 åren) | |
| Lenovo LOQ 15APH8 | |
| Lenovo LOQ 16IRH8 | |
| PCMark 10 / Productivity | |
| Lenovo Legion Pro 5 16ARX8 (R5 7645HX, RTX 4050) | |
| Genomsnitt av klass Gaming (6845 - 18766, n=97, senaste 2 åren) | |
| Asus TUF Gaming A16 FA617XS | |
| Dell G15 5530 | |
| Lenovo LOQ 15APH8 | |
| Lenovo LOQ 15IRH8 Core i7 | |
| Genomsnitt Intel Core i7-13620H, NVIDIA GeForce RTX 4050 Laptop GPU (n=1) | |
| MSI Katana 17 B13VFK | |
| HP Victus 16-r0077ng | |
| Lenovo LOQ 16IRH8 | |
| PCMark 10 / Digital Content Creation | |
| Genomsnitt av klass Gaming (7602 - 19657, n=97, senaste 2 åren) | |
| Asus TUF Gaming A16 FA617XS | |
| Lenovo LOQ 15APH8 | |
| Lenovo LOQ 15IRH8 Core i7 | |
| Genomsnitt Intel Core i7-13620H, NVIDIA GeForce RTX 4050 Laptop GPU (n=1) | |
| Lenovo Legion Pro 5 16ARX8 (R5 7645HX, RTX 4050) | |
| HP Victus 16-r0077ng | |
| MSI Katana 17 B13VFK | |
| Lenovo LOQ 16IRH8 | |
| Dell G15 5530 | |
| CrossMark / Overall | |
| Genomsnitt av klass Gaming (1366 - 2409, n=97, senaste 2 åren) | |
| Lenovo LOQ 16IRH8 | |
| Lenovo Legion Pro 5 16ARX8 (R5 7645HX, RTX 4050) | |
| Lenovo LOQ 15IRH8 Core i7 | |
| Genomsnitt Intel Core i7-13620H, NVIDIA GeForce RTX 4050 Laptop GPU (n=1) | |
| MSI Katana 17 B13VFK | |
| Dell G15 5530 | |
| Asus TUF Gaming A16 FA617XS | |
| Lenovo LOQ 15APH8 | |
| CrossMark / Productivity | |
| Lenovo Legion Pro 5 16ARX8 (R5 7645HX, RTX 4050) | |
| Lenovo LOQ 16IRH8 | |
| Genomsnitt av klass Gaming (1386 - 2254, n=97, senaste 2 åren) | |
| Lenovo LOQ 15IRH8 Core i7 | |
| Genomsnitt Intel Core i7-13620H, NVIDIA GeForce RTX 4050 Laptop GPU (n=1) | |
| MSI Katana 17 B13VFK | |
| Dell G15 5530 | |
| Asus TUF Gaming A16 FA617XS | |
| Lenovo LOQ 15APH8 | |
| CrossMark / Creativity | |
| Genomsnitt av klass Gaming (1343 - 2729, n=97, senaste 2 åren) | |
| Dell G15 5530 | |
| Lenovo LOQ 16IRH8 | |
| Lenovo Legion Pro 5 16ARX8 (R5 7645HX, RTX 4050) | |
| MSI Katana 17 B13VFK | |
| Lenovo LOQ 15IRH8 Core i7 | |
| Genomsnitt Intel Core i7-13620H, NVIDIA GeForce RTX 4050 Laptop GPU (n=1) | |
| Asus TUF Gaming A16 FA617XS | |
| Lenovo LOQ 15APH8 | |
| CrossMark / Responsiveness | |
| Lenovo LOQ 16IRH8 | |
| Lenovo Legion Pro 5 16ARX8 (R5 7645HX, RTX 4050) | |
| Lenovo LOQ 15IRH8 Core i7 | |
| Genomsnitt Intel Core i7-13620H, NVIDIA GeForce RTX 4050 Laptop GPU (n=1) | |
| MSI Katana 17 B13VFK | |
| Genomsnitt av klass Gaming (1226 - 2334, n=97, senaste 2 åren) | |
| Dell G15 5530 | |
| Asus TUF Gaming A16 FA617XS | |
| Lenovo LOQ 15APH8 | |
| AIDA64 / Memory Copy | |
| Genomsnitt av klass Gaming (21750 - 129946, n=109, senaste 2 åren) | |
| HP Victus 16-r0077ng | |
| Asus TUF Gaming A16 FA617XS | |
| Dell G15 5530 | |
| Lenovo LOQ 15IRH8 Core i7 | |
| Genomsnitt Intel Core i7-13620H, NVIDIA GeForce RTX 4050 Laptop GPU (n=1) | |
| Lenovo LOQ 16IRH8 | |
| MSI Katana 17 B13VFK | |
| Lenovo Legion Pro 5 16ARX8 (R5 7645HX, RTX 4050) | |
| Lenovo LOQ 15APH8 | |
| AIDA64 / Memory Read | |
| Genomsnitt av klass Gaming (22956 - 118858, n=109, senaste 2 åren) | |
| HP Victus 16-r0077ng | |
| Dell G15 5530 | |
| Lenovo LOQ 16IRH8 | |
| Lenovo LOQ 15IRH8 Core i7 | |
| Genomsnitt Intel Core i7-13620H, NVIDIA GeForce RTX 4050 Laptop GPU (n=1) | |
| MSI Katana 17 B13VFK | |
| Asus TUF Gaming A16 FA617XS | |
| Lenovo Legion Pro 5 16ARX8 (R5 7645HX, RTX 4050) | |
| Lenovo LOQ 15APH8 | |
| AIDA64 / Memory Write | |
| Genomsnitt av klass Gaming (22297 - 135096, n=109, senaste 2 åren) | |
| Asus TUF Gaming A16 FA617XS | |
| HP Victus 16-r0077ng | |
| Dell G15 5530 | |
| Lenovo LOQ 15IRH8 Core i7 | |
| Genomsnitt Intel Core i7-13620H, NVIDIA GeForce RTX 4050 Laptop GPU (n=1) | |
| Lenovo LOQ 16IRH8 | |
| Lenovo Legion Pro 5 16ARX8 (R5 7645HX, RTX 4050) | |
| MSI Katana 17 B13VFK | |
| Lenovo LOQ 15APH8 | |
| AIDA64 / Memory Latency | |
| Lenovo LOQ 15IRH8 Core i7 | |
| Genomsnitt Intel Core i7-13620H, NVIDIA GeForce RTX 4050 Laptop GPU (n=1) | |
| Lenovo LOQ 16IRH8 | |
| Genomsnitt av klass Gaming (75.3 - 259, n=109, senaste 2 åren) | |
| MSI Katana 17 B13VFK | |
| Lenovo LOQ 15APH8 | |
| HP Victus 16-r0077ng | |
| Dell G15 5530 | |
| Asus TUF Gaming A16 FA617XS | |
| Lenovo Legion Pro 5 16ARX8 (R5 7645HX, RTX 4050) | |
* ... mindre är bättre
| PCMark 8 Home Score Accelerated v2 | 5795 poäng | |
| PCMark 8 Work Score Accelerated v2 | 6177 poäng | |
| PCMark 10 Score | 7656 poäng | |
Hjälp | ||
DPC-fördröjning
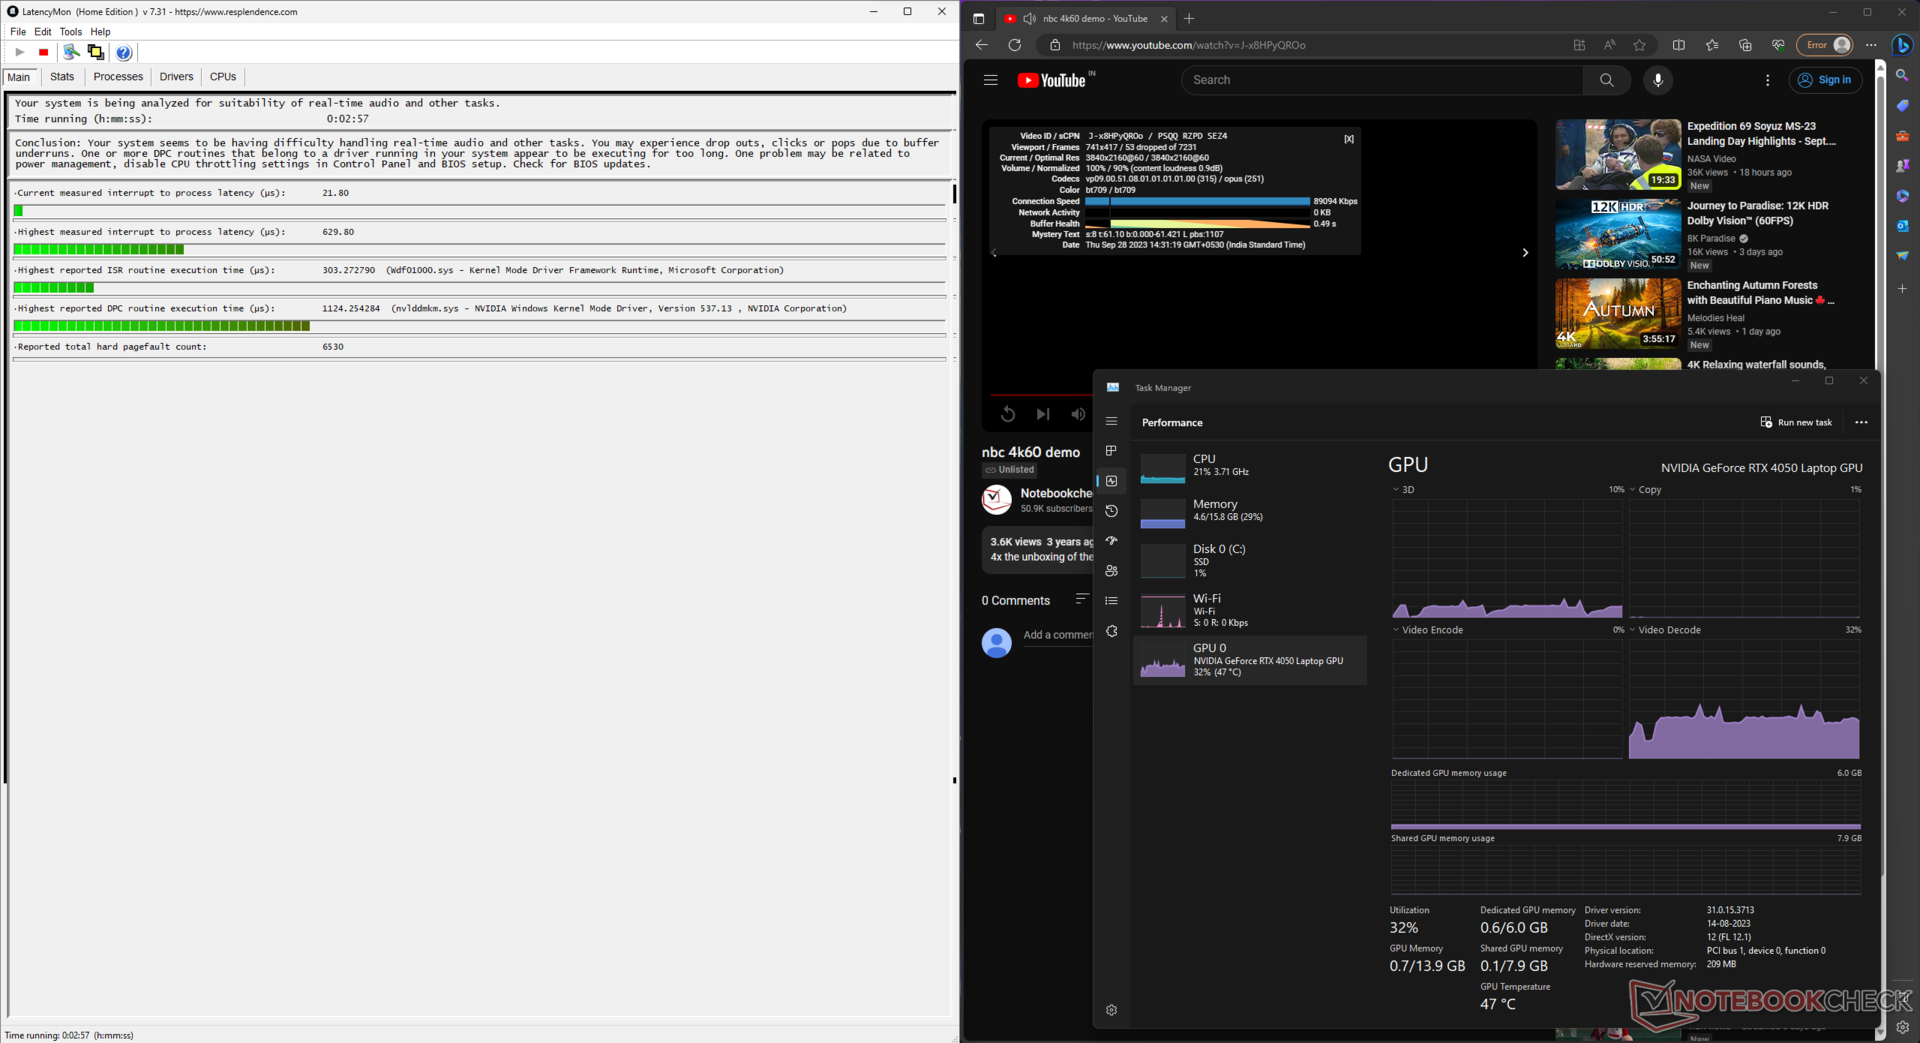
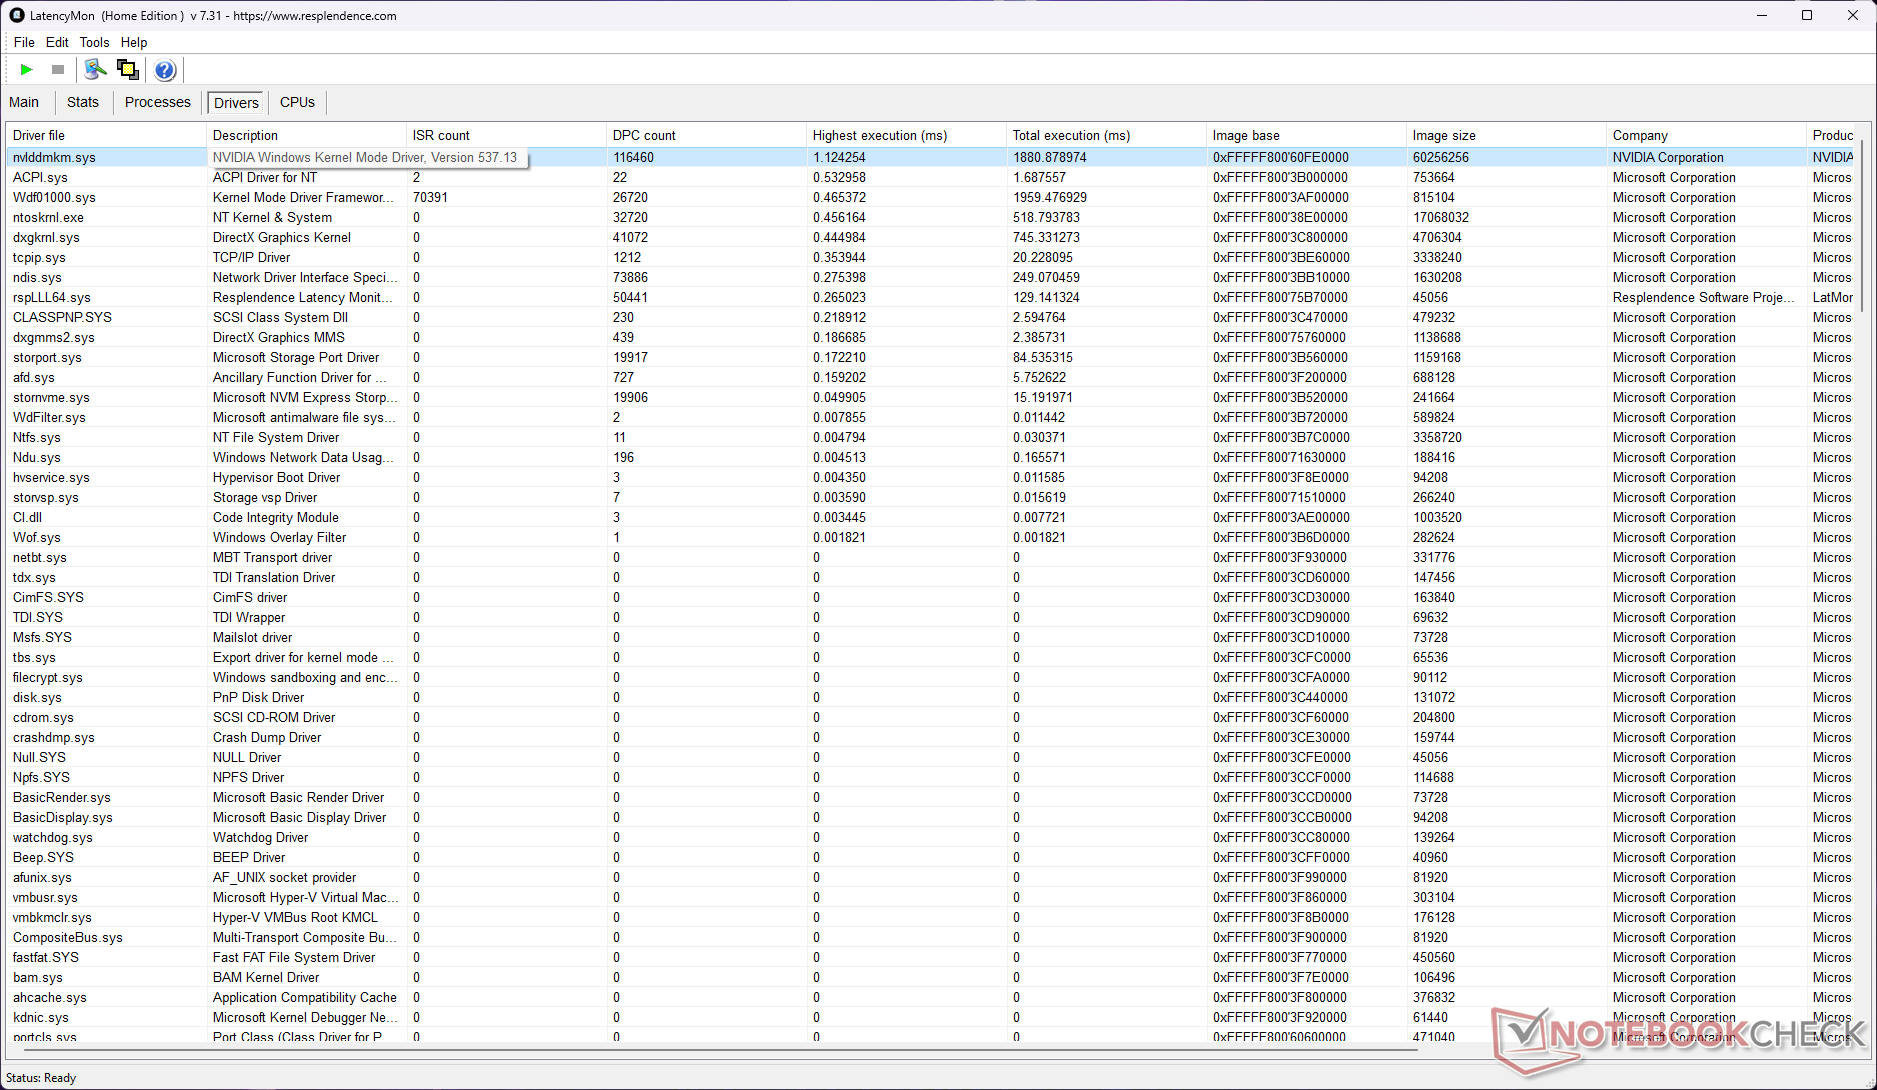
DPC-latens är lite på den högre sidan, men LOQ 15 Core i7 klarar sig mycket bättre jämfört med sina kamrater i testet.
| DPC Latencies / LatencyMon - interrupt to process latency (max), Web, Youtube, Prime95 | |
| Dell G15 5530 | |
| MSI Katana 17 B13VFK | |
| HP Victus 16-r0077ng | |
| Lenovo LOQ 15APH8 | |
| Lenovo LOQ 16IRH8 | |
| Asus TUF Gaming A16 FA617XS | |
| Lenovo Legion Pro 5 16ARX8 (R5 7645HX, RTX 4050) | |
| Lenovo LOQ 15IRH8 Core i7 | |
* ... mindre är bättre
Vår DPC-rankning av latens sida ger en översikt över uppmätt latens för granskade enheter.
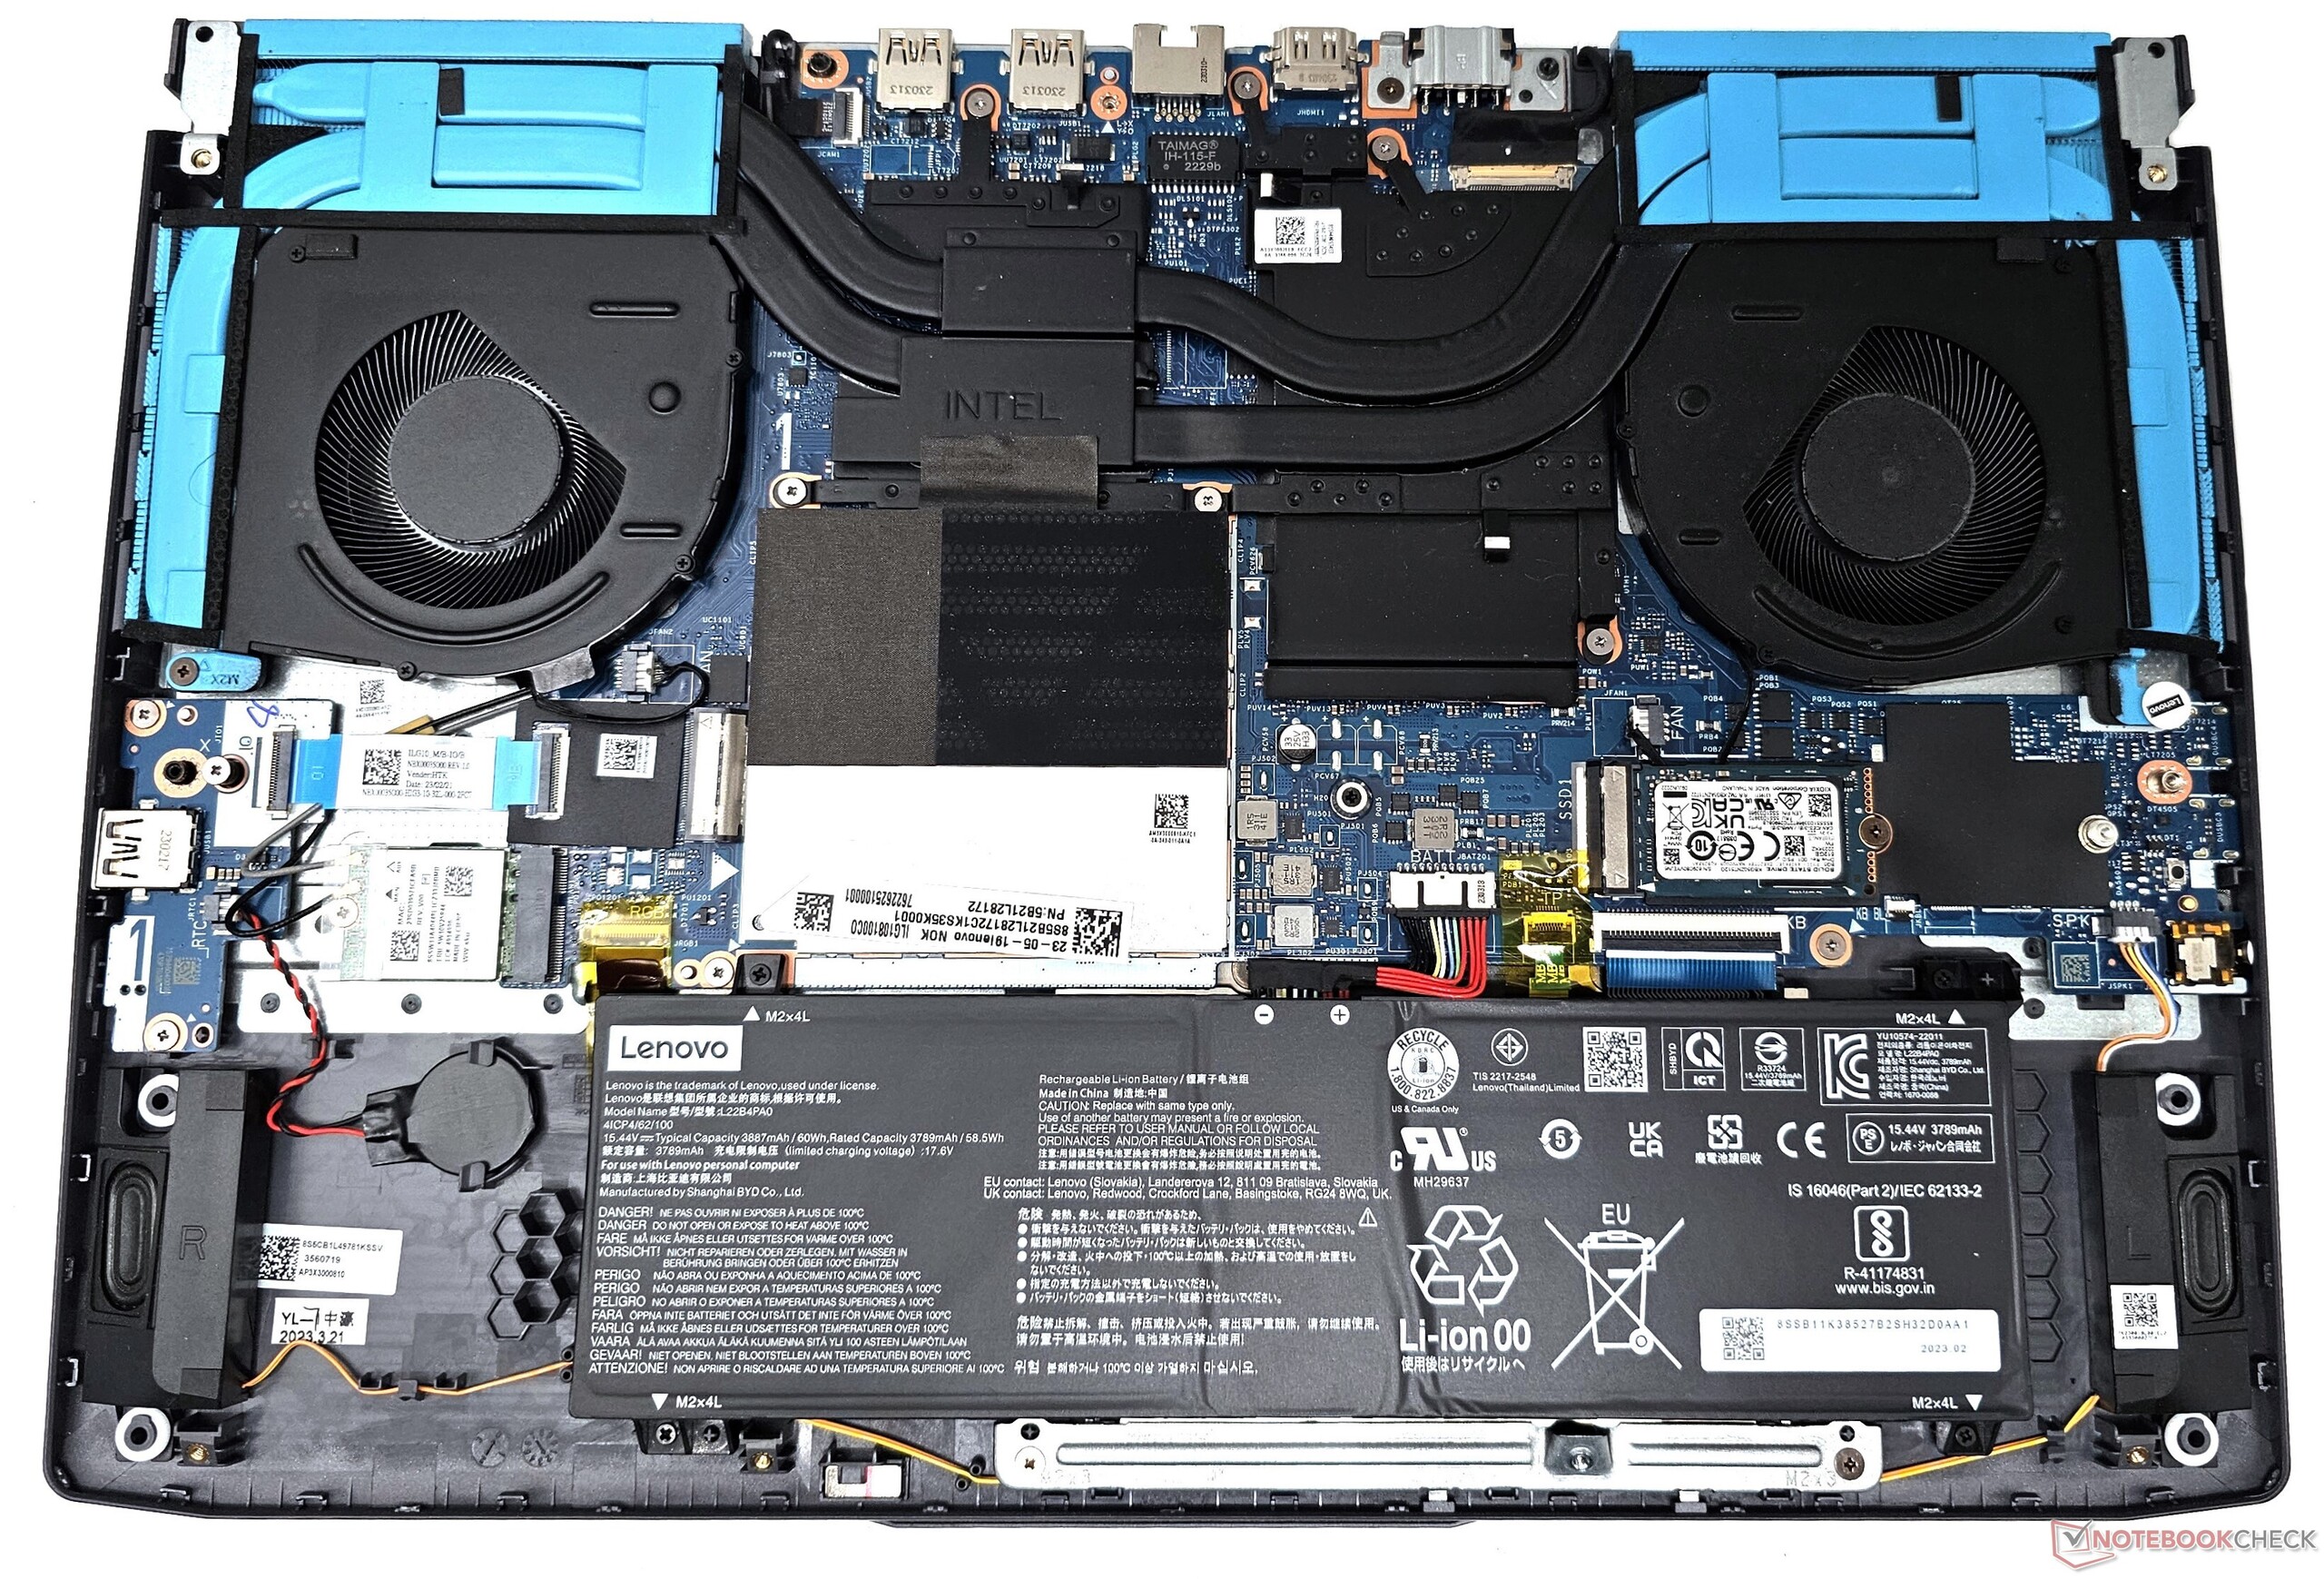
Lagringsenheter
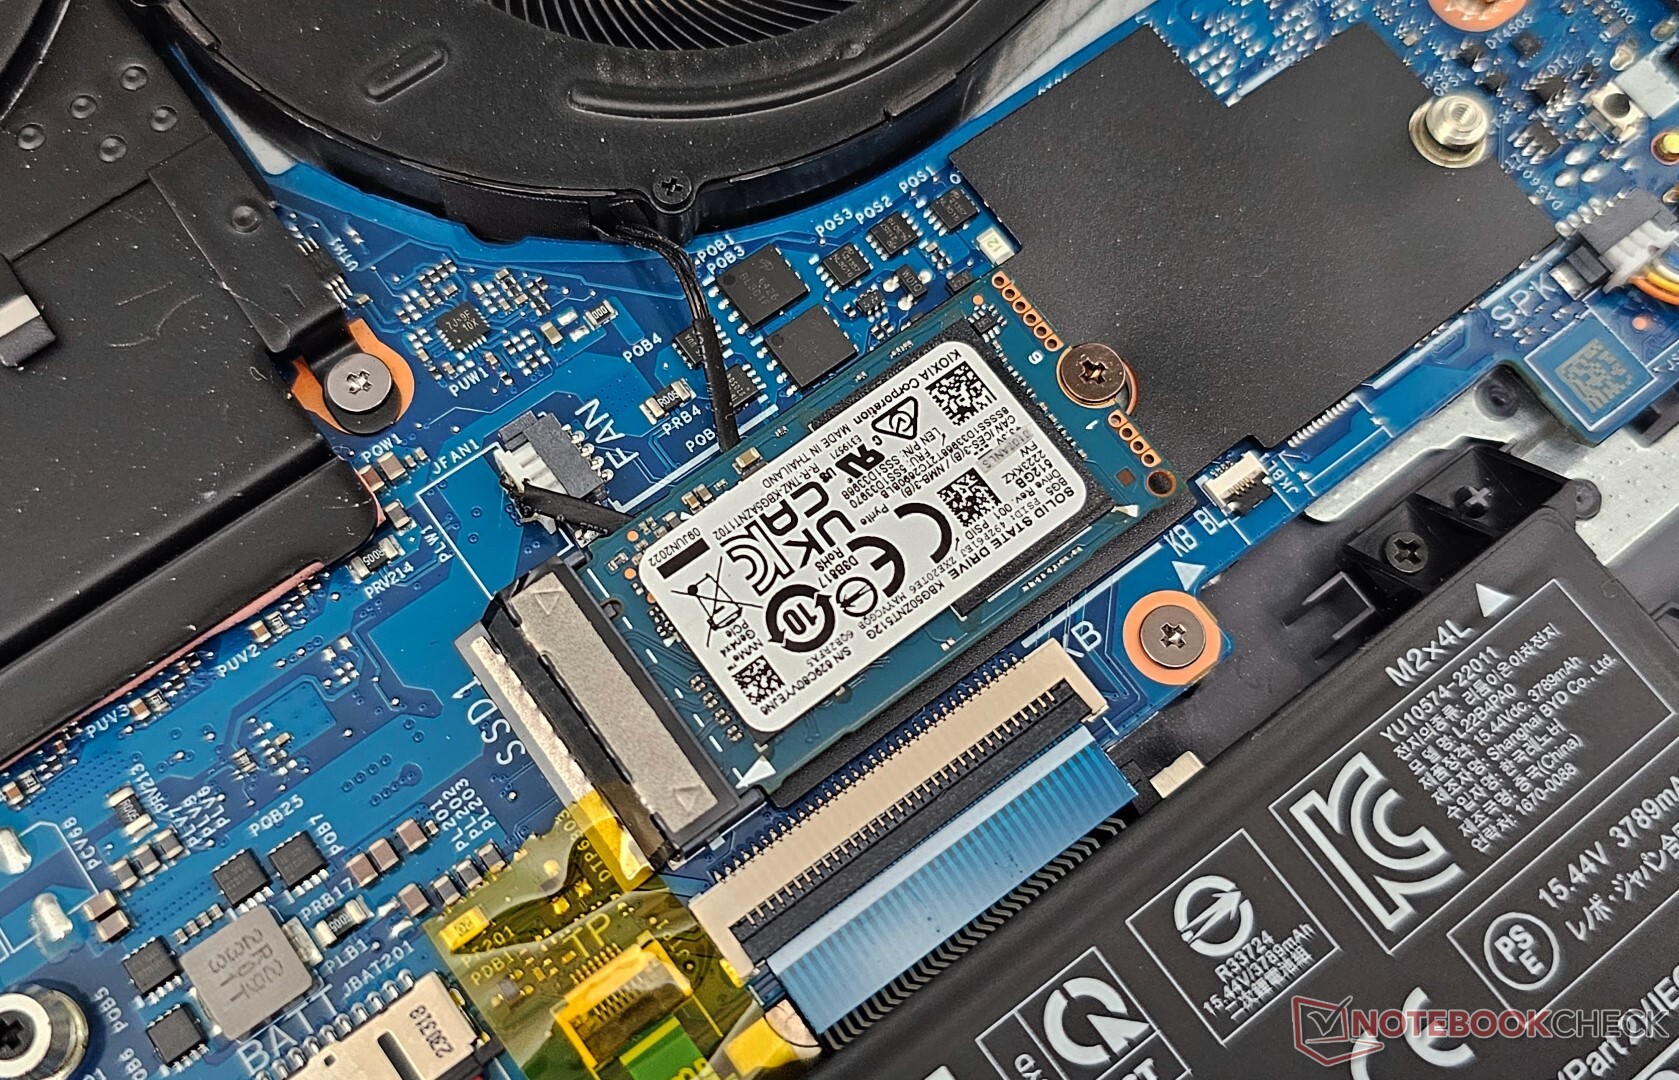
Vår LOQ 15IRH8-enhet är utrustad med en Kioxia 512 GB M.2 2230 PCIe Gen4 NVMe SSD. Du kan ersätta den med en M.2280-enhet med större kapacitet om det behövs. Det finns också en ledig M.2 2280-kortplats tillgänglig för lagringsexpansion.
Den övergripande enhetsprestandan ligger efter Kioxia 1 TB-enheten som finns i HP Victus 16. SSD-enheten kämpar också med att upprätthålla en konsekvent läshastighet eftersom vi ser prestandadippar efter den 25:e körningen i vårt DiskSpd Read Loop-test med ett ködjup på 8.

* ... mindre är bättre
Disk Throttling: DiskSpd Read Loop, Queue Depth 8
Mer information och prestandajämförelser finns i våra HDD- och SSD-riktmärken sida.
GPU-prestanda
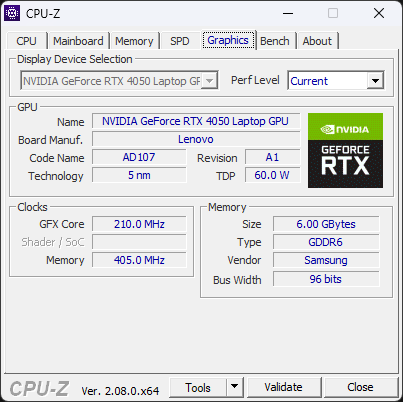
RTX 4050 Laptop GPU i LOQ 15IRH8 är klassad till en 95 W TGP, men den har utrymme att använda mer ström under stress. Vi ser att samma GPU i LOQ 15APH8 är ungefär 6 % snabbare i kumulativa 3DMark-tester.
Intressant nog är denna 95 W RTX 4050 bara en hårsmån bakom 140 W-varianten i Lenovo Legion Pro 5. Den senare kompenserar dock för detta underskott i Blender CUDA-riktmärket.
| 3DMark 11 Performance | 27474 poäng | |
| 3DMark Ice Storm Standard Score | 229274 poäng | |
| 3DMark Cloud Gate Standard Score | 49040 poäng | |
| 3DMark Fire Strike Score | 19230 poäng | |
| 3DMark Fire Strike Extreme Score | 9873 poäng | |
| 3DMark Time Spy Score | 8701 poäng | |
Hjälp | ||
| Blender / v3.3 Classroom OPTIX/RTX | |
| Genomsnitt NVIDIA GeForce RTX 4050 Laptop GPU (25 - 37, n=40) | |
| Lenovo Legion Pro 5 16ARX8 (R5 7645HX, RTX 4050) | |
| Lenovo LOQ 15IRH8 Core i7 | |
| MSI Katana 17 B13VFK | |
| Lenovo LOQ 15APH8 | |
| HP Victus 16-r0077ng | |
| Lenovo LOQ 16IRH8 | |
| Dell G15 5530 | |
| Genomsnitt av klass Gaming (9 - 32, n=111, senaste 2 åren) | |
| Blender / v3.3 Classroom CUDA | |
| Genomsnitt NVIDIA GeForce RTX 4050 Laptop GPU (47 - 68, n=39) | |
| Lenovo LOQ 15IRH8 Core i7 | |
| Lenovo LOQ 15APH8 | |
| Lenovo Legion Pro 5 16ARX8 (R5 7645HX, RTX 4050) | |
| MSI Katana 17 B13VFK | |
| Lenovo LOQ 16IRH8 | |
| Dell G15 5530 | |
| HP Victus 16-r0077ng | |
| Genomsnitt av klass Gaming (15 - 228, n=111, senaste 2 åren) | |
| Blender / v3.3 Classroom CPU | |
| Lenovo LOQ 15IRH8 Core i7 | |
| Genomsnitt NVIDIA GeForce RTX 4050 Laptop GPU (243 - 907, n=40) | |
| Lenovo LOQ 16IRH8 | |
| HP Victus 16-r0077ng | |
| Lenovo Legion Pro 5 16ARX8 (R5 7645HX, RTX 4050) | |
| MSI Katana 17 B13VFK | |
| Asus TUF Gaming A16 FA617XS | |
| Lenovo LOQ 15APH8 | |
| Dell G15 5530 | |
| Genomsnitt av klass Gaming (122 - 565, n=107, senaste 2 åren) | |
* ... mindre är bättre
Spelprestanda
Liknande trender syns även i spelbenchmarks. LOQ 15:s 95 W RTX 4050 och 140 W RTX 4050 i Legion Pro 5 presterar nästan identiska resultat i kumulativa 1080p Ultra-speltester, men den senare datorns högre wattal ger märkbara fördelar i QHD Ultra.
LOQ 15IRH8 är i grunden en 1080p Ultra-spelmaskin. Spelbara framerates kan uppnås i QHD Ultra i något äldre titlar. Spelare som vill ha fler bildrutor i QHD eller 4K måste oundvikligen använda uppskalningstekniker som AMD FSR, Nvidia DLSS eller Intel XeSS beroende på titel.
| The Witcher 3 - 1920x1080 Ultra Graphics & Postprocessing (HBAO+) | |
| Genomsnitt av klass Gaming (95 - 240, n=8, senaste 2 åren) | |
| HP Victus 16-r0077ng | |
| MSI Katana 17 B13VFK | |
| Dell G15 5530 | |
| Lenovo LOQ 16IRH8 | |
| Asus TUF Gaming A16 FA617XS | |
| Lenovo Legion Pro 5 16ARX8 (R5 7645HX, RTX 4050) | |
| Lenovo LOQ 15IRH8 Core i7 | |
| Lenovo LOQ 15APH8 | |
| The Witcher 3 - 2560x1440 Ultra Graphics & Postprocessing (HBAO+) | |
| Genomsnitt av klass Gaming (70 - 199.1, n=6, senaste 2 åren) | |
| Lenovo LOQ 16IRH8 | |
| Lenovo LOQ 15IRH8 Core i7 | |
| Genomsnitt NVIDIA GeForce RTX 4050 Laptop GPU (39 - 61.3, n=8) | |
| Cyberpunk 2077 1.6 | |
| 1920x1080 Ultra Preset | |
| Dell G15 5530 | |
| MSI Katana 17 B13VFK | |
| Lenovo LOQ 15APH8 | |
| Lenovo LOQ 15IRH8 Core i7 | |
| Genomsnitt NVIDIA GeForce RTX 4050 Laptop GPU (44.4 - 79.4, n=14) | |
| 2560x1440 Ultra Preset | |
| MSI Katana 17 B13VFK | |
| Lenovo LOQ 15IRH8 Core i7 | |
| Genomsnitt NVIDIA GeForce RTX 4050 Laptop GPU (27.2 - 43.1, n=10) | |
| 1920x1080 Ray Tracing Ultra Preset (DLSS off) | |
| Dell G15 5530 | |
| Genomsnitt NVIDIA GeForce RTX 4050 Laptop GPU (15.8 - 65.6, n=5) | |
| MSI Katana 17 B13VFK | |
| Lenovo LOQ 15IRH8 Core i7 | |
| F1 22 | |
| 1920x1080 Ultra High Preset AA:T AF:16x | |
| Genomsnitt av klass Gaming (40.1 - 121.2, n=5, senaste 2 åren) | |
| Dell G15 5530 | |
| MSI Katana 17 B13VFK | |
| Lenovo LOQ 15IRH8 Core i7 | |
| Asus TUF Gaming A16 FA617XS | |
| Genomsnitt NVIDIA GeForce RTX 4050 Laptop GPU (10.9 - 56.4, n=24) | |
| 2560x1440 Ultra High Preset AA:T AF:16x | |
| Genomsnitt av klass Gaming (42 - 77.8, n=3, senaste 2 åren) | |
| MSI Katana 17 B13VFK | |
| Lenovo LOQ 15IRH8 Core i7 | |
| Genomsnitt NVIDIA GeForce RTX 4050 Laptop GPU (6.58 - 34, n=14) | |
| F1 23 | |
| 1920x1080 Ultra High Preset AA:T AF:16x | |
| Lenovo Legion Pro 5 16ARX8 (R5 7645HX, RTX 4050) | |
| Genomsnitt av klass Gaming (n=1senaste 2 åren) | |
| Lenovo LOQ 15IRH8 Core i7 | |
| Genomsnitt NVIDIA GeForce RTX 4050 Laptop GPU (25.7 - 60.8, n=14) | |
| 2560x1440 Ultra High Preset AA:T AF:16x | |
| Lenovo Legion Pro 5 16ARX8 (R5 7645HX, RTX 4050) | |
| Lenovo LOQ 15IRH8 Core i7 | |
| Genomsnitt av klass Gaming (n=1senaste 2 åren) | |
| Genomsnitt NVIDIA GeForce RTX 4050 Laptop GPU (16.7 - 40.8, n=11) | |
Witcher 3 FPS-diagram
Medan LOQ 15:s uthålliga CPU-prestanda (eller brist på sådan) höjer ögonbrynen, verkar den bärbara datorns kylning vara tillräcklig för RTX 4050 Laptop GPU, vilket framgår av relativt stabila framerates i The Witcher 3 vid 1080p Ultra.
| låg | med. | hög | ultra | QHD | |
|---|---|---|---|---|---|
| GTA V (2015) | 185.9 | 179.7 | 168.9 | 93.2 | 66 |
| The Witcher 3 (2015) | 390 | 286 | 167.6 | 85.6 | 61.3 |
| Dota 2 Reborn (2015) | 196.3 | 178.3 | 171.1 | 162.2 | |
| Final Fantasy XV Benchmark (2018) | 192.9 | 121.2 | 84 | 60.9 | |
| X-Plane 11.11 (2018) | 159.9 | 139.8 | 110.2 | ||
| Far Cry 5 (2018) | 156 | 135 | 128 | 121 | 83 |
| Strange Brigade (2018) | 475 | 211 | 171.8 | 149.2 | 95.5 |
| Cyberpunk 2077 1.6 (2022) | 103.3 | 85.5 | 72.9 | 67.8 | 41 |
| F1 22 (2022) | 233 | 224 | 172.3 | 55 | 33.9 |
| F1 23 (2023) | 228 | 222 | 158.4 | 44.1 | 34.1 |
Utsläpp: Höga yttemperaturer under belastning
Buller från systemet
LOQ 15IRH8:s fläktljud under tomgång är i stort sett likadant som det vi har sett med LOQ 15 AMD-varianten, men de senare fläktarna är cirka 7% högre under full belastning. Lenovo har begränsat fläktljudnivåerna under vissa tröskelvärden beroende på vald strömprofil, vilket kan ses i tabellen nedan.
Performance-läget hamnar precis under 50 dB(A)-gränsen under belastning. Medan Quiet-läget resulterar i en betydande minskning av CPU-prestandan, bör spel fortfarande vara relativt behagligt jämfört med Performance-profilen.
Ljudnivå
| Låg belastning |
| 29.03 / 29.03 / 29.03 dB(A) |
| Hög belastning |
| 48.7 / 48.7 dB(A) |
 | ||
30 dB tyst 40 dB(A) hörbar 50 dB(A) högt ljud |
||
min: | ||
| Prestandaläge | Tomgång dB(A) | Genomsnittlig belastning dB(A) | Maximal belastning dB(A) | Witcher 3 1080p Ultra dB(A) |
|---|---|---|---|---|
| Tyst | 25,28 | 33,09 | 36,07 | 36,69 / 78 fps |
| Balans | 25,28 | 40,40 | 45,15 | 45,42 / 83 fps |
| Prestanda | 29.03 | 48.72 | 48.71 | 48.52 / 85 fps |
| Lenovo LOQ 15IRH8 Core i7 i7-13620H, GeForce RTX 4050 Laptop GPU | Lenovo LOQ 16IRH8 i7-13620H, GeForce RTX 4060 Laptop GPU | Lenovo LOQ 15APH8 R7 7840HS, GeForce RTX 4050 Laptop GPU | MSI Katana 17 B13VFK i7-13620H, GeForce RTX 4060 Laptop GPU | Lenovo Legion Pro 5 16ARX8 (R5 7645HX, RTX 4050) R5 7645HX, GeForce RTX 4050 Laptop GPU | HP Victus 16-r0077ng i7-13700H, GeForce RTX 4070 Laptop GPU | Dell G15 5530 i7-13650HX, GeForce RTX 4060 Laptop GPU | Asus TUF Gaming A16 FA617XS R9 7940HS, Radeon RX 7600S | |
|---|---|---|---|---|---|---|---|---|
| Noise | 3% | 9% | -6% | 14% | 2% | 12% | 3% | |
| av / miljö * (dB) | 23.69 | 23 3% | 23.1 2% | 24.5 -3% | 23 3% | 25 -6% | 20.41 14% | 25 -6% |
| Idle Minimum * (dB) | 29.03 | 23 21% | 23.1 20% | 24.5 16% | 23 21% | 28 4% | 26.85 8% | 25 14% |
| Idle Average * (dB) | 29.03 | 23 21% | 23.1 20% | 24.5 16% | 23 21% | 29 -0% | 26.85 8% | 26 10% |
| Idle Maximum * (dB) | 29.03 | 27.66 5% | 25.2 13% | 40 -38% | 24.42 16% | 30 -3% | 26.85 8% | 28 4% |
| Load Average * (dB) | 48.7 | 53.62 -10% | 44.3 9% | 48.3 1% | 34.94 28% | 43 12% | 27.65 43% | 43 12% |
| Witcher 3 ultra * (dB) | 48.5 | 53.5 -10% | 45.8 6% | 56 -15% | 43.79 10% | 46 5% | 47.9 1% | 51 -5% |
| Load Maximum * (dB) | 48.7 | 53.5 -10% | 52 -7% | 59.1 -21% | 50 -3% | 48 1% | 47.86 2% | 53 -9% |
* ... mindre är bättre
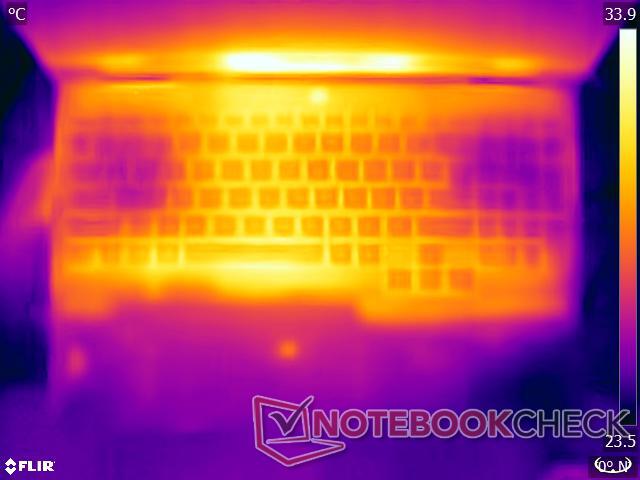
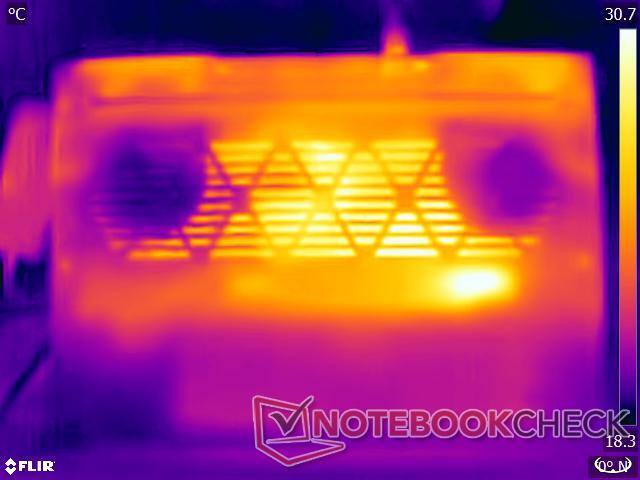
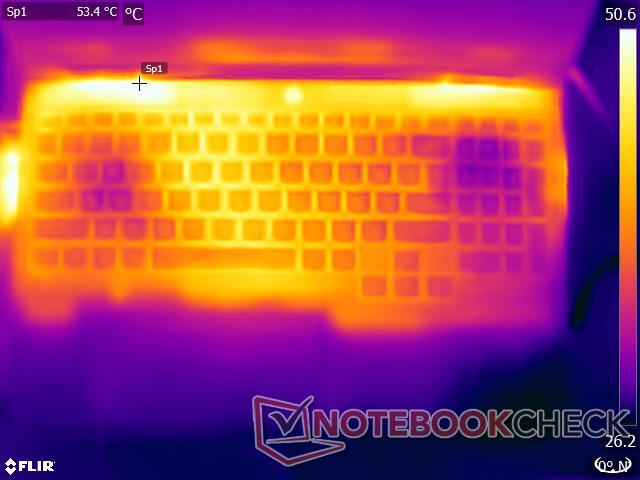
Temperatur
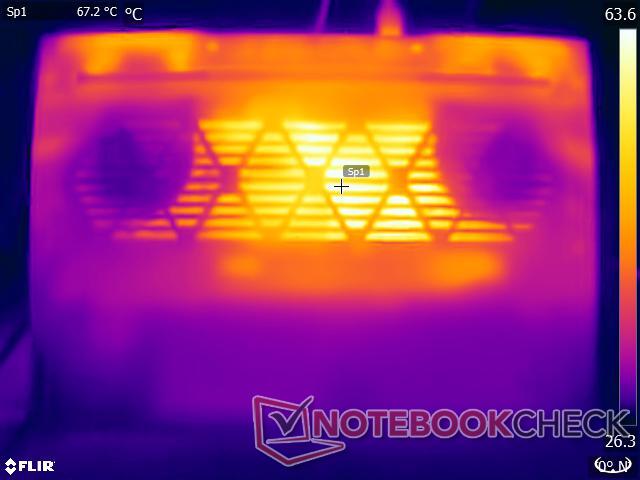
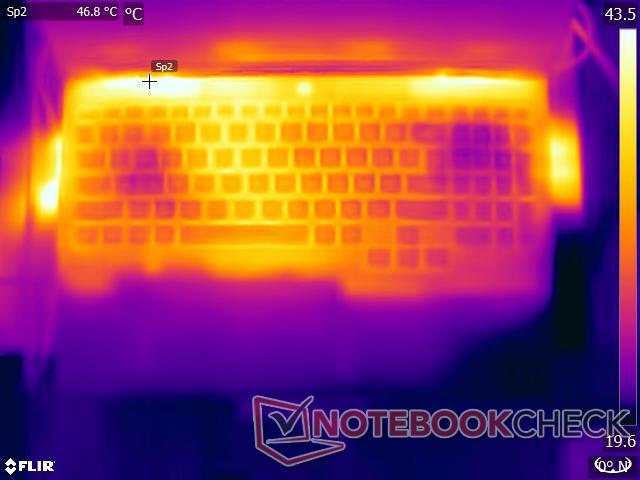
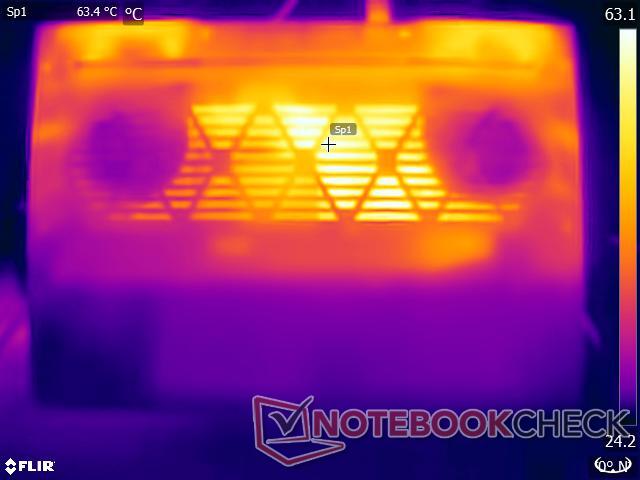
Yttemperaturerna vid belastning i prestandaprofilen kan bli ganska höga, särskilt på undersidan av chassit. Även om våra stresstester representerar extrema scenarier rekommenderar vi inte att du använder den här enheten i knät för något annat än lätt användning.
(-) Den maximala temperaturen på ovansidan är 46.4 °C / 116 F, jämfört med genomsnittet av 40.4 °C / 105 F , allt från 21.2 till 68.8 °C för klassen Gaming.
(-) Botten värms upp till maximalt 59.2 °C / 139 F, jämfört med genomsnittet av 43.2 °C / 110 F
(±) Vid tomgångsbruk är medeltemperaturen för ovansidan 32.7 °C / 91 F, jämfört med enhetsgenomsnittet på 33.9 °C / ### class_avg_f### F.
(-) När du spelar The Witcher 3 är medeltemperaturen för ovansidan 39.4 °C / 103 F, jämfört med enhetsgenomsnittet på 33.9 °C / ## #class_avg_f### F.
(+) Handledsstöden och pekplattan når maximal hudtemperatur (34 °C / 93.2 F) och är därför inte varma.
(-) Medeltemperaturen för handledsstödsområdet på liknande enheter var 28.8 °C / 83.8 F (-5.2 °C / -9.4 F).
| Lenovo LOQ 15IRH8 Core i7 Intel Core i7-13620H, NVIDIA GeForce RTX 4050 Laptop GPU | Lenovo LOQ 16IRH8 Intel Core i7-13620H, NVIDIA GeForce RTX 4060 Laptop GPU | Lenovo LOQ 15APH8 AMD Ryzen 7 7840HS, NVIDIA GeForce RTX 4050 Laptop GPU | MSI Katana 17 B13VFK Intel Core i7-13620H, NVIDIA GeForce RTX 4060 Laptop GPU | Lenovo Legion Pro 5 16ARX8 (R5 7645HX, RTX 4050) AMD Ryzen 5 7645HX, NVIDIA GeForce RTX 4050 Laptop GPU | HP Victus 16-r0077ng Intel Core i7-13700H, NVIDIA GeForce RTX 4070 Laptop GPU | Dell G15 5530 Intel Core i7-13650HX, NVIDIA GeForce RTX 4060 Laptop GPU | Asus TUF Gaming A16 FA617XS AMD Ryzen 9 7940HS, AMD Radeon RX 7600S | |
|---|---|---|---|---|---|---|---|---|
| Heat | 10% | 13% | 11% | 1% | 3% | -3% | 9% | |
| Maximum Upper Side * (°C) | 46.4 | 48 -3% | 44.4 4% | 41.6 10% | 45 3% | 51 -10% | 54 -16% | 53 -14% |
| Maximum Bottom * (°C) | 59.2 | 59 -0% | 52 12% | 43.1 27% | 54 9% | 54 9% | 62.2 -5% | 48 19% |
| Idle Upper Side * (°C) | 34.4 | 28 19% | 28 19% | 32 7% | 36 -5% | 37 -8% | 33.4 3% | 30 13% |
| Idle Bottom * (°C) | 36.2 | 28 23% | 29.6 18% | 35.8 1% | 38 -5% | 29 20% | 33.4 8% | 30 17% |
* ... mindre är bättre
Stresstest
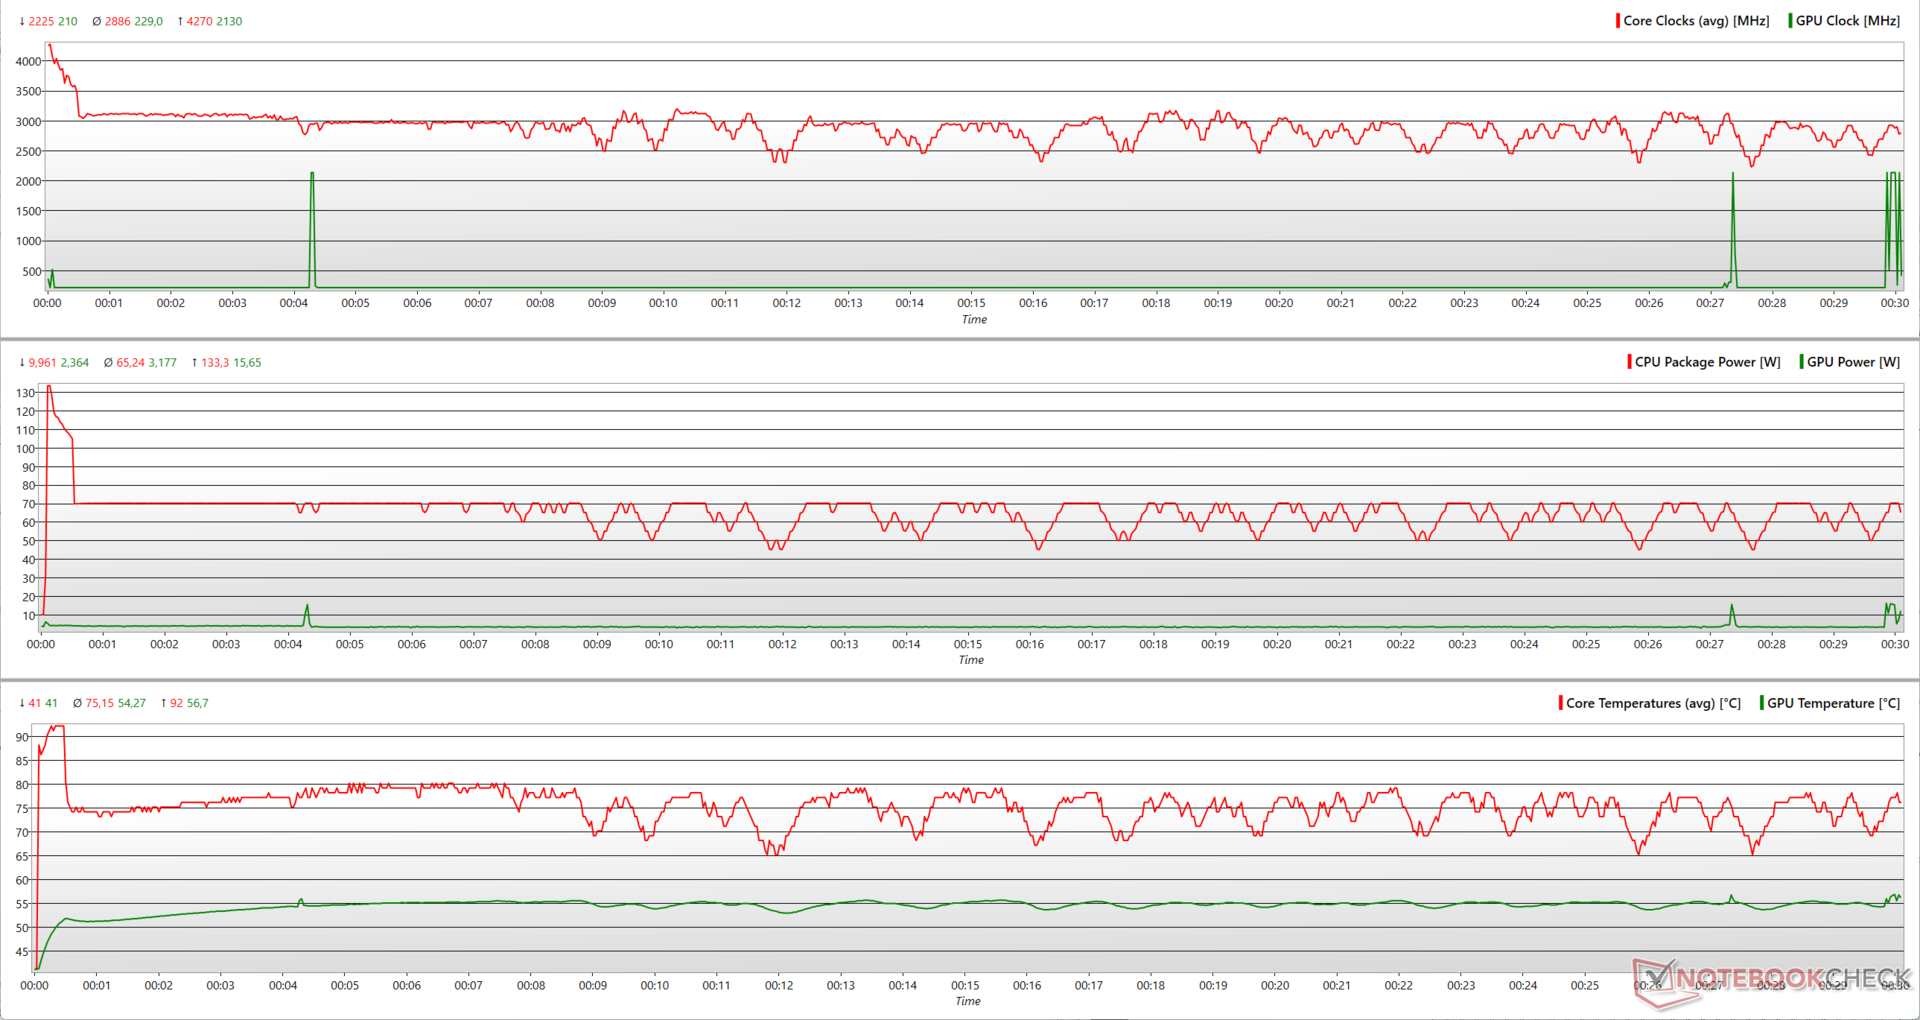
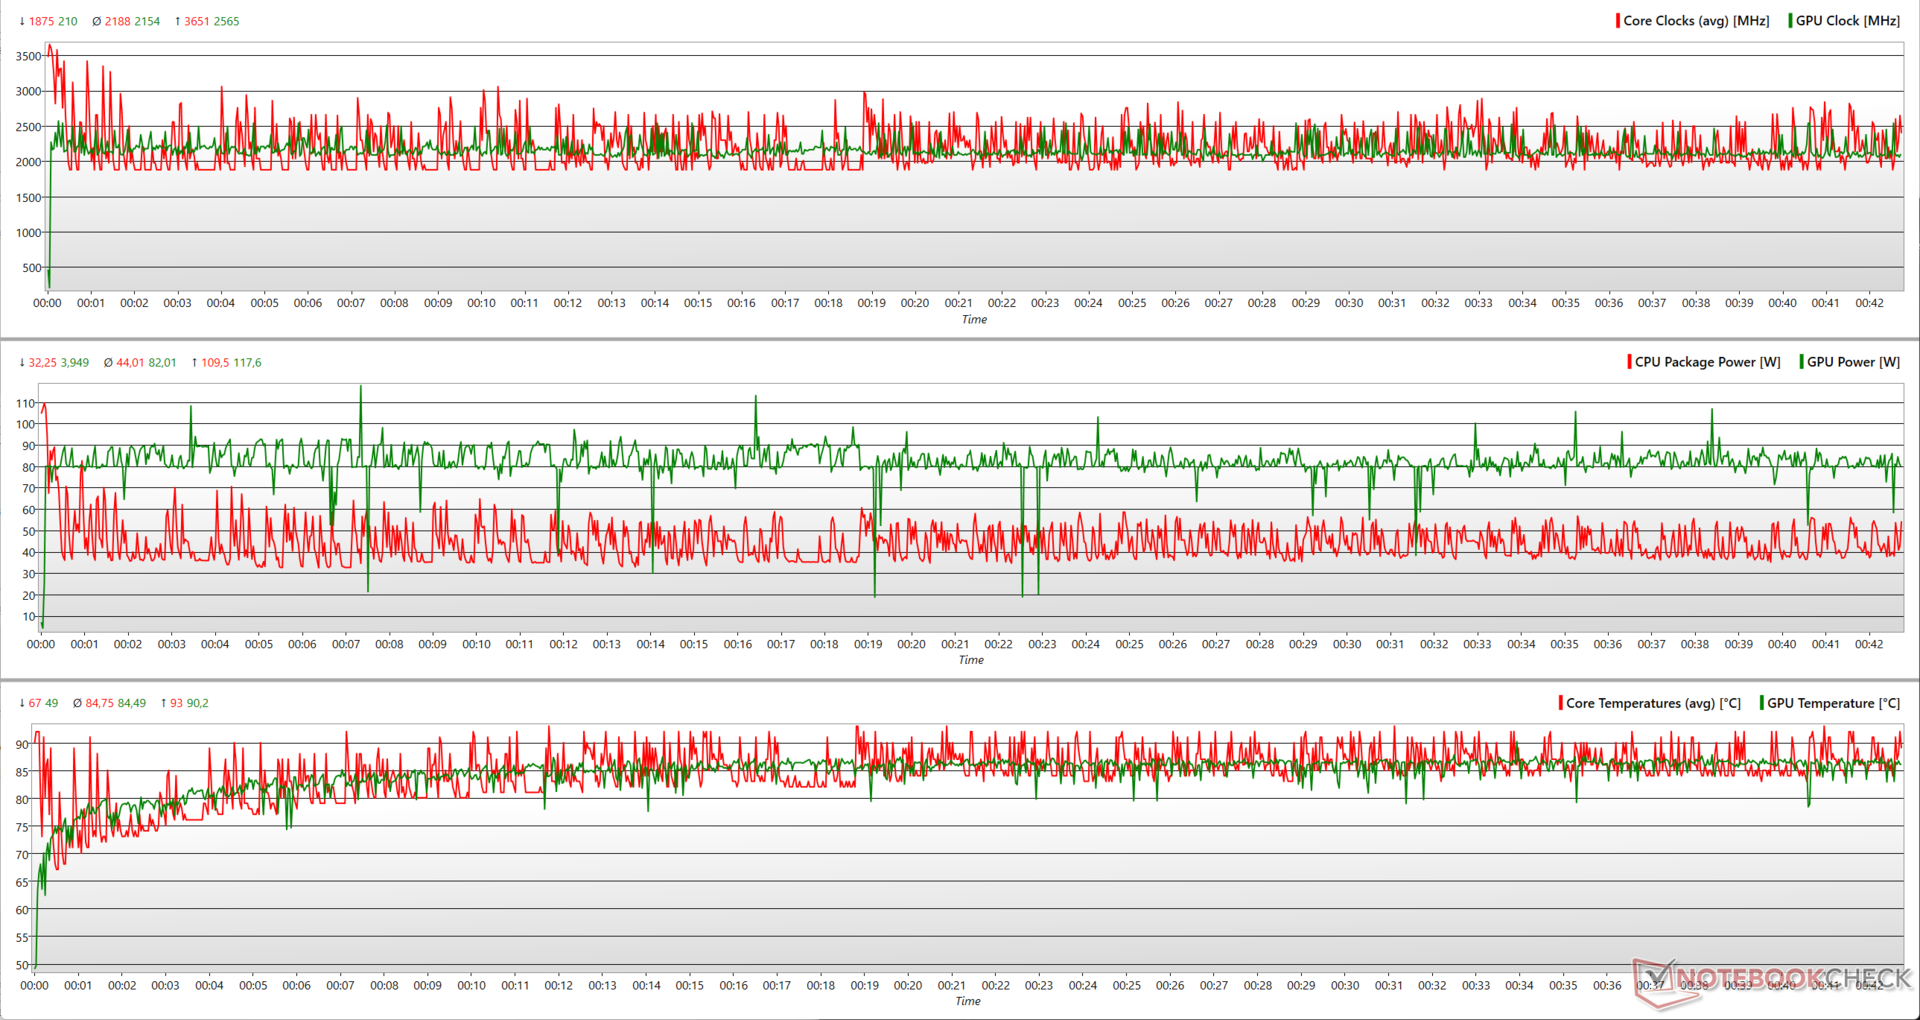
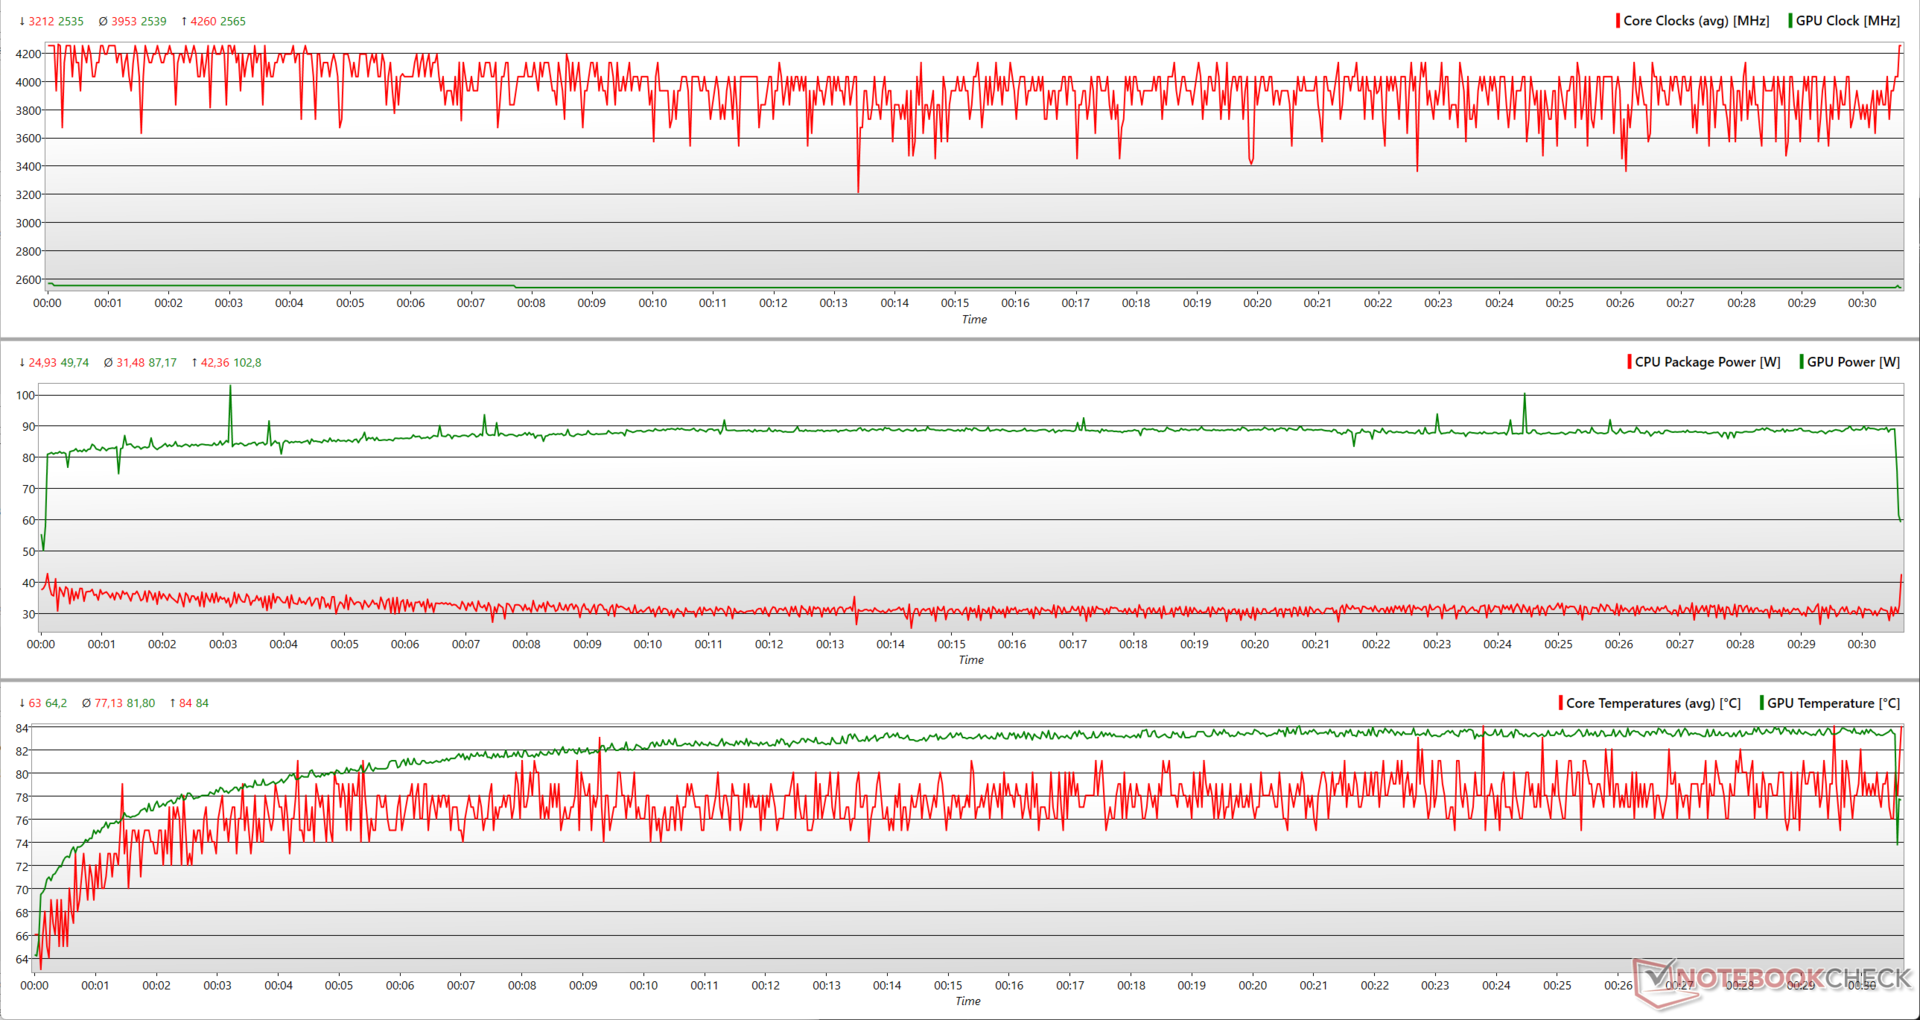
Till skillnad från vad vi har sett med Cinebench R15 multi-core loop-testet tidigare, stressar LOQ 15 med Prime95 in-place stora FFT:er Core i7-13620H att slutligen kunna nå 133 W med en maximal klockfrekvens på 4,27 GHz. Detta är dock kortlivat eftersom processorn slutligen lägger sig på en genomsnittlig paketeffekt på 65 W.
En kombinerad Prime95- och FurMark-stress indikerar att RTX 4050 kan använda upp till 117 W med en maximal klockfrekvens på 2 565 MHz. Core i7-13620H får kämpa med en maximal ökning på 3,6 GHz eftersom den måste dela det termiska och effektmässiga utrymmet med RTX 4050.
| Stresstest | CPU-klocka (GHz) | GPU-klocka (MHz) | Genomsnittlig CPU-temperatur (°C) | Genomsnittlig GPU-temperatur (°C) |
| System Idle | 4,3 | 210 | 37 | 38,4 |
| Prime95 | 4,8 | 210 | 75 | 54,2 |
| Prime95 + FurMark | 3,2 | 2 220 | 77 | 79,7 |
| The Witcher 3 1080p Ultra | 4,8 | 2 535 | 76 | 80,5 |
I stresstestet The Witcher 3 1080p Ultra kan RTX 4050 uppnå samma klockfrekvens på 2 565 MHz men med en mycket lägre maximal TGP på 103 W. Detta ger lite andrum för Core i7-13620H att använda upp till 42 W för en maximal ökning på 4,26 GHz.
Högtalare
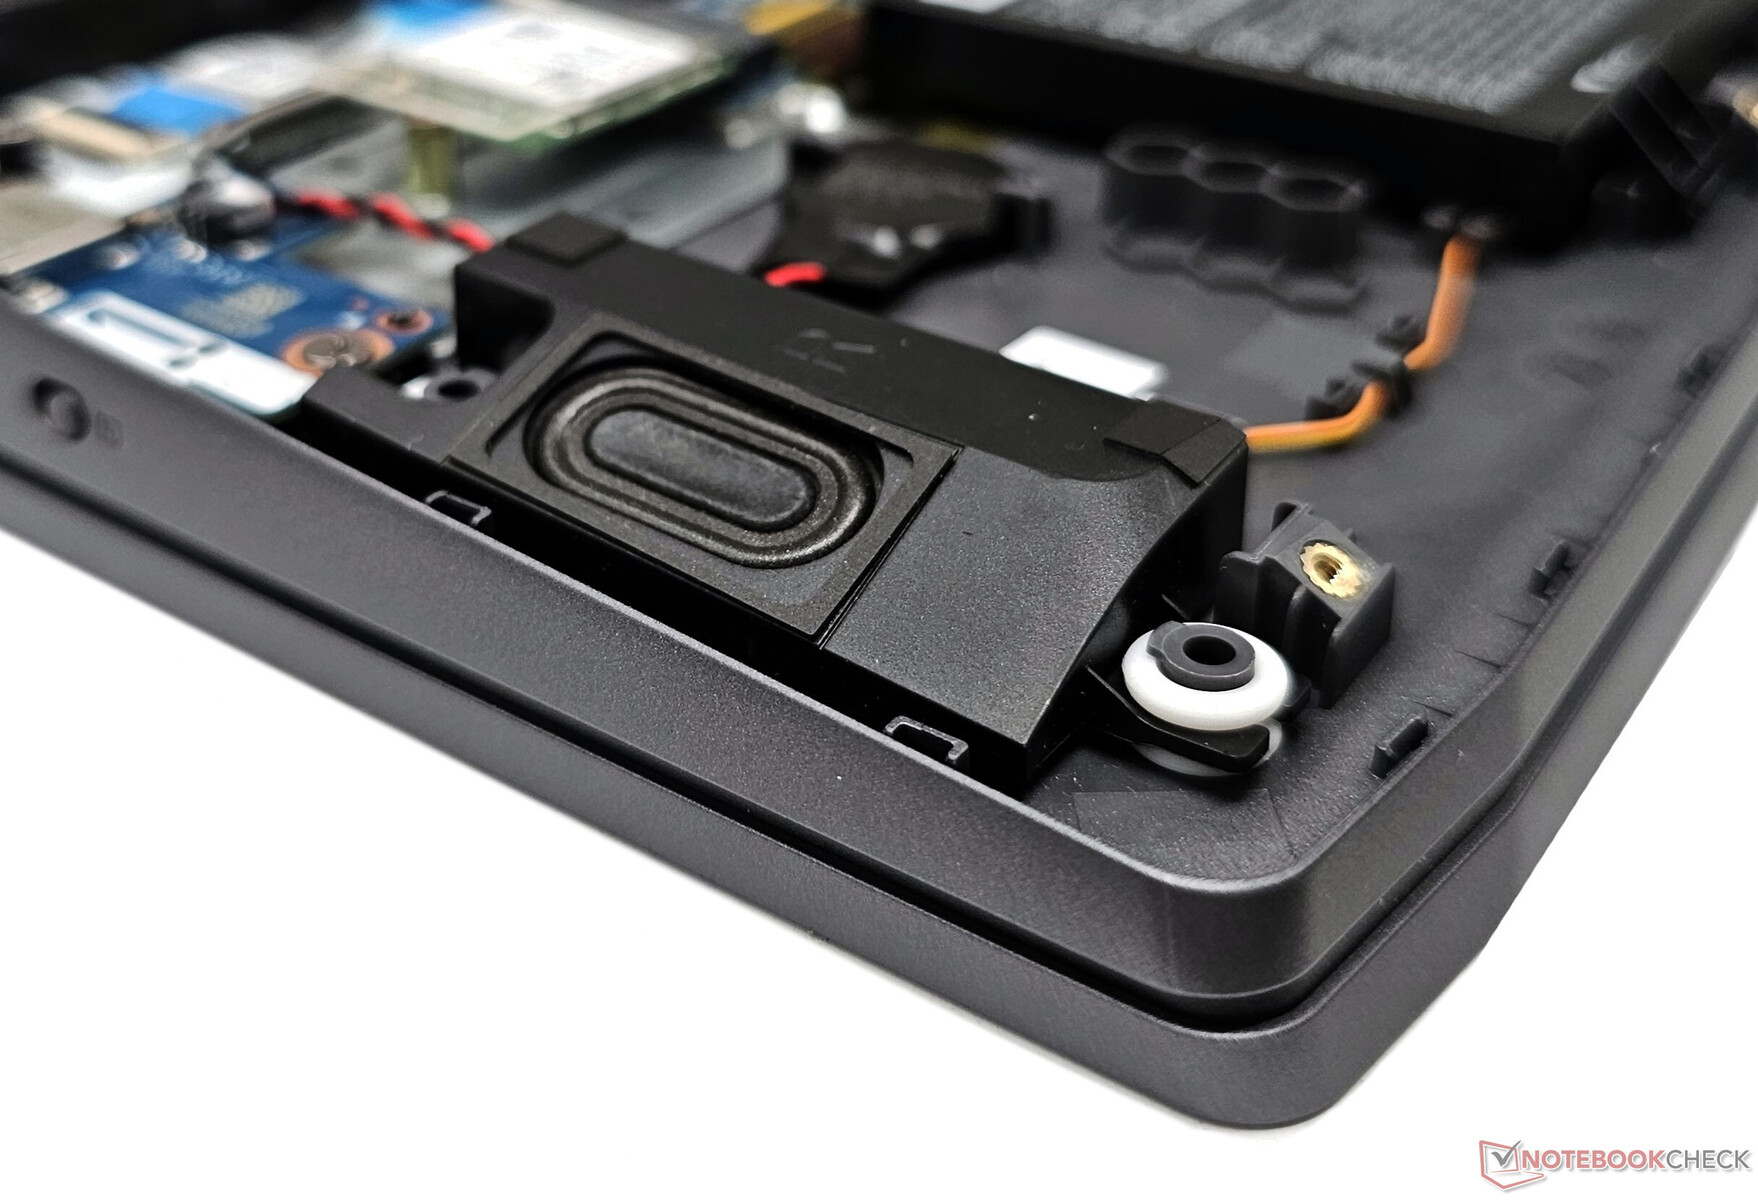
Högtalarna i LOQ 15IRH8 har en hyfsad ljudstyrka. Basen är inte särskilt djup, men mellanregistret och de höga tonerna återges på ett tillfredsställande sätt. Användare kan få en bättre ljudåtergivning via trådbundna högtalare eller Bluetooth 5.2.
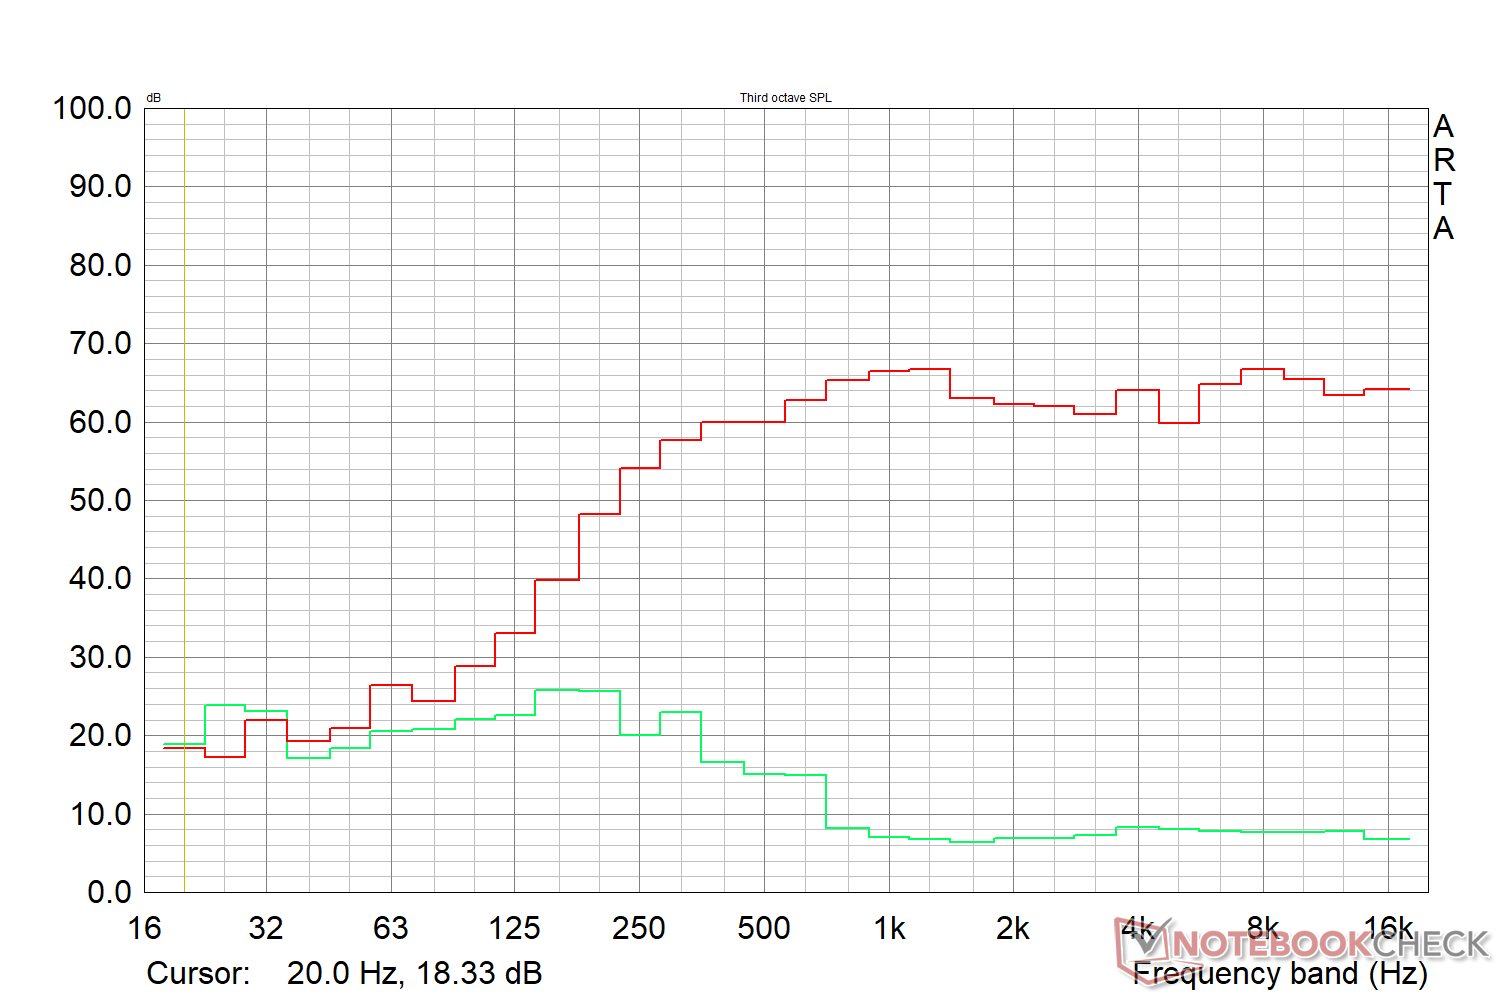
Lenovo LOQ 15IRH8 Core i7 ljudanalys
(±) | högtalarljudstyrkan är genomsnittlig men bra (75.9 dB)
Bas 100 - 315 Hz
(-) | nästan ingen bas - i genomsnitt 18.6% lägre än medianen
(±) | linjäriteten för basen är genomsnittlig (10.2% delta till föregående frekvens)
Mellan 400 - 2000 Hz
(+) | balanserad mellan - endast 2.2% från medianen
(+) | mids är linjära (3.1% delta till föregående frekvens)
Högsta 2 - 16 kHz
(+) | balanserade toppar - endast 2.3% från medianen
(+) | toppar är linjära (4.4% delta till föregående frekvens)
Totalt 100 - 16 000 Hz
(+) | det totala ljudet är linjärt (13.7% skillnad mot median)
Jämfört med samma klass
» 21% av alla testade enheter i den här klassen var bättre, 7% liknande, 72% sämre
» Den bästa hade ett delta på 6%, genomsnittet var 18%, sämst var 132%
Jämfört med alla testade enheter
» 15% av alla testade enheter var bättre, 4% liknande, 81% sämre
» Den bästa hade ett delta på 4%, genomsnittet var 24%, sämst var 134%
Apple MacBook Pro 16 2021 M1 Pro ljudanalys
(+) | högtalare kan spela relativt högt (84.7 dB)
Bas 100 - 315 Hz
(+) | bra bas - bara 3.8% från medianen
(+) | basen är linjär (5.2% delta till föregående frekvens)
Mellan 400 - 2000 Hz
(+) | balanserad mellan - endast 1.3% från medianen
(+) | mids är linjära (2.1% delta till föregående frekvens)
Högsta 2 - 16 kHz
(+) | balanserade toppar - endast 1.9% från medianen
(+) | toppar är linjära (2.7% delta till föregående frekvens)
Totalt 100 - 16 000 Hz
(+) | det totala ljudet är linjärt (4.6% skillnad mot median)
Jämfört med samma klass
» 0% av alla testade enheter i den här klassen var bättre, 0% liknande, 100% sämre
» Den bästa hade ett delta på 5%, genomsnittet var 17%, sämst var 45%
Jämfört med alla testade enheter
» 0% av alla testade enheter var bättre, 0% liknande, 100% sämre
» Den bästa hade ett delta på 4%, genomsnittet var 24%, sämst var 134%
Energihantering: AMD-varianten ser ut att vara mer ekonomisk
Strömförbrukning
Strömförbrukningen under belastning är generellt på den lägre sidan jämfört med konkurrenterna. Trots skillnaderna i displayen är Ryzen 7 7840HS-drivna LOQ 15APH8 cirka 18 % mer ekonomisk i total strömförbrukning än vår Intel-baserade LOQ 15IRH8-enhet.
Den helt AMD-drivna Asus TUF Gaming A16 är den mest sparsamma totalt sett, men belastningsförbrukningen ligger inom jämförbart intervall med LOQ 15IRH8. Strömförbrukningen under maximal belastning överstiger den medföljande laddarens 170 W-klassning.
| Av/Standby | |
| Låg belastning | |
| Hög belastning |
|
Förklaring:
min: | |
| Lenovo LOQ 15IRH8 Core i7 i7-13620H, GeForce RTX 4050 Laptop GPU, IPS, 2560x1440, 15.6" | Lenovo LOQ 16IRH8 i7-13620H, GeForce RTX 4060 Laptop GPU, IPS, 2560x1600, 16" | Lenovo LOQ 15APH8 R7 7840HS, GeForce RTX 4050 Laptop GPU, IPS, 1920x1080, 15.6" | MSI Katana 17 B13VFK i7-13620H, GeForce RTX 4060 Laptop GPU, IPS LED, 1920x1080, 17.3" | Lenovo Legion Pro 5 16ARX8 (R5 7645HX, RTX 4050) R5 7645HX, GeForce RTX 4050 Laptop GPU, IPS, 2560x1600, 16" | HP Victus 16-r0077ng i7-13700H, GeForce RTX 4070 Laptop GPU, IPS, 1920x1080, 16.1" | Dell G15 5530 i7-13650HX, GeForce RTX 4060 Laptop GPU, IPS, 1920x1080, 15.6" | Asus TUF Gaming A16 FA617XS R9 7940HS, Radeon RX 7600S, IPS, 1920x1200, 16" | Genomsnitt NVIDIA GeForce RTX 4050 Laptop GPU | Genomsnitt av klass Gaming | |
|---|---|---|---|---|---|---|---|---|---|---|
| Power Consumption | 6% | 18% | 19% | 15% | 20% | 12% | 31% | 25% | 3% | |
| Idle Minimum * (Watt) | 18.52 | 17.2 7% | 15 19% | 12.2 34% | 13 30% | 8 57% | 8.4 55% | 7 62% | 9.95 ? 46% | 13.2 ? 29% |
| Idle Average * (Watt) | 22.54 | 19.3 14% | 17.7 21% | 14.9 34% | 17.4 23% | 13 42% | 14.98 34% | 10 56% | 15.8 ? 30% | 18.9 ? 16% |
| Idle Maximum * (Watt) | 29.79 | 21.2 29% | 21.5 28% | 15.8 47% | 21.8 27% | 22 26% | 15.56 48% | 15 50% | 20.1 ? 33% | 24.3 ? 18% |
| Load Average * (Watt) | 94.5 | 90 5% | 73.5 22% | 85.22 10% | 96.4 -2% | 86 9% | 96.8 -2% | 86 9% | 88 ? 7% | 108 ? -14% |
| Witcher 3 ultra * (Watt) | 154.4 | 168 -9% | 138.6 10% | 151.1 2% | 125 19% | 141.8 8% | 186 -20% | 160.6 -4% | ||
| Load Maximum * (Watt) | 190.4 | 211 -11% | 176.5 7% | 212.8 -12% | 204 -7% | 233 -22% | 271.42 -43% | 172 10% | 176.3 ? 7% | 254 ? -33% |
* ... mindre är bättre
Power Consumption: The Witcher 3 / Stress test
Power Consumption: External Monitor
Batteritid
Batteritiden liknar vad vi har observerat med LOQ 16IRH8. LOQ 15APH8:s förbättrade strömförbrukning ger en 25% längre batteritid jämfört med LOQ 15IRH8.
Den medföljande 170 W-nätadaptern stöder Rapid Charge-snabbladdning, som kan aktiveras i Lenovo Vantage-appen. Detta gör att enheten kan laddas från noll till 100% på cirka 45 minuter.
| Lenovo LOQ 15IRH8 Core i7 i7-13620H, GeForce RTX 4050 Laptop GPU, 60 Wh | Lenovo LOQ 16IRH8 i7-13620H, GeForce RTX 4060 Laptop GPU, 80 Wh | Lenovo LOQ 15APH8 R7 7840HS, GeForce RTX 4050 Laptop GPU, 60 Wh | MSI Katana 17 B13VFK i7-13620H, GeForce RTX 4060 Laptop GPU, 53.5 Wh | Lenovo Legion Pro 5 16ARX8 (R5 7645HX, RTX 4050) R5 7645HX, GeForce RTX 4050 Laptop GPU, 80 Wh | HP Victus 16-r0077ng i7-13700H, GeForce RTX 4070 Laptop GPU, 83 Wh | Dell G15 5530 i7-13650HX, GeForce RTX 4060 Laptop GPU, 86 Wh | Asus TUF Gaming A16 FA617XS R9 7940HS, Radeon RX 7600S, 90 Wh | Genomsnitt av klass Gaming | |
|---|---|---|---|---|---|---|---|---|---|
| Batteridrifttid | 6% | 25% | -51% | -8% | 20% | 11% | 107% | 27% | |
| H.264 (h) | 6.1 | 6.4 5% | 5.4 -11% | 6.8 11% | 12.4 103% | 8.26 ? 35% | |||
| WiFi v1.3 (h) | 5.9 | 6.3 7% | 7.4 25% | 2.9 -51% | 5.6 -5% | 7.1 20% | 6.5 10% | 12.4 110% | 7.02 ? 19% |
| Load (h) | 1.5 | 1.1 | 1 | 0.8 | 0.9 | 1.47 ? | |||
| Reader / Idle (h) | 9.8 | 20.3 | 8.71 ? | ||||||
| Witcher 3 ultra (h) | 0.8 | 0.8 |
För
Emot
Omdöme: 1080p Ultra-spel som inte kostar skjortan
LOQ 15 Core i7 har en 165 Hz QHD G-Sync-skärm och 1080p webbkamera trots sitt låga pris. QHD-panelen imponerar särskilt med avsevärt förbättrade färger och svarstider jämfört med FHD 144 Hz-alternativet.
Byggkvaliteten lider förståeligt nog av mycket plast. En mer oroande aspekt är att LOQ 15IRH8:s Core i7-13620H kämpar för att upprätthålla sin prestanda till skillnad från vad vi har sett med den AMD Ryzen 7 7840HS-baserade LOQ 15APH8 eller till och med LOQ 16IRH8.
Prestandan är dock tillräcklig för smidiga 1080p-spel, tack vare Intel i7-13620H-processorn och RTX 4050-grafiken som kan utnyttja mer än sin nominella TGP.
Lenovo LOQ 15 Core i7 uppfyller de flesta kraven och förtjänar att övervägas om du är på jakt efter en kapabel bärbar dator för 1080p-spel som kostar runt 1 200 USD eller 1 00,00 USD. Förväntningarna måste dock dämpas när det gäller byggkvalitet och värmeutveckling."
Ett annat område där den Intel-baserade LOQ 15 är en besvikelse är när det gäller värmeutsläpp. Däremot är fläktljudnivåerna hanterbara och det är möjligt att spela 1080p även med lägre effektprofiler.
Att välja mellan de Intel- och AMD-drivna LOQ 15 SKU:erna handlar om prioriteringar. Intel-versionen ger bättre spelprestanda vid 1080p och lägre fläktljud under belastning. Men AMD-varianten har en fördel när det gäller övergripande CPU-prestanda, går svalare, är mer strömeffektiv och har bättre batteritid.
Med detta sagt är båda LOQ 15-varianterna mycket prisvärda jämfört med Legion Pro 5 16. Bärbara datorer som t.ex HP Victus 16 och MSI Katana 17 klarar sig betydligt bättre i diagrammen, men deras prissättning verkar inte stämma överens med den hårdvara som erbjuds i förhållande till LOQ 15.
Pris och tillgänglighet
LOQ 15 Core i7 kostar från 97 790 kr för FHD 144 Hz-varianten och kan köpas direkt från Lenovo India. Webbplatsen listar för närvarande inte tillgängligheten för den testade QHD-varianten.
Amazon India har inte de flesta LOQ 15-varianterna i lager för närvarande förutom LOQ 16IRH8 med en Core i7-13700H och RTX 4060 som är listad på ₹2,25,766.
Lenovo US har också en mängd Intel 13th gen LOQ 15s med flera Nvidia GPU-alternativ. Best Buy erbjuder en LOQ 15 som drivs av Core i5-13420H och RTX 3050-grafik för 650 US-dollar. Amazon US har en variant med RTX 4050 för 1 227 USD. Ett Ryzen 7 7840HS-alternativ med RTX 4050 finns också tillgängligt på Best Buy för 1 240 USD.
Lenovo LOQ 15IRH8 Core i7
- 10/13/2023 v7 (old)
Vaidyanathan Subramaniam
Genomskinlighet
Valet av enheter som ska granskas görs av vår redaktion. Testprovet gavs till författaren som ett lån av tillverkaren eller återförsäljaren för denna recension. Långivaren hade inget inflytande på denna recension och inte heller fick tillverkaren en kopia av denna recension innan publiceringen. Det fanns ingen skyldighet att publicera denna recension. Som ett oberoende medieföretag är Notebookcheck inte föremål för auktoritet från tillverkare, återförsäljare eller förlag.
This is how Notebookcheck is testingEvery year, Notebookcheck independently reviews hundreds of laptops and smartphones using standardized procedures to ensure that all results are comparable. We have continuously developed our test methods for around 20 years and set industry standards in the process. In our test labs, high-quality measuring equipment is utilized by experienced technicians and editors. These tests involve a multi-stage validation process. Our complex rating system is based on hundreds of well-founded measurements and benchmarks, which maintains objectivity.
Price comparison

