Lenovo Legion Slim 7 16 gaming laptop i recension: Övertygande även med AMD Ryzen

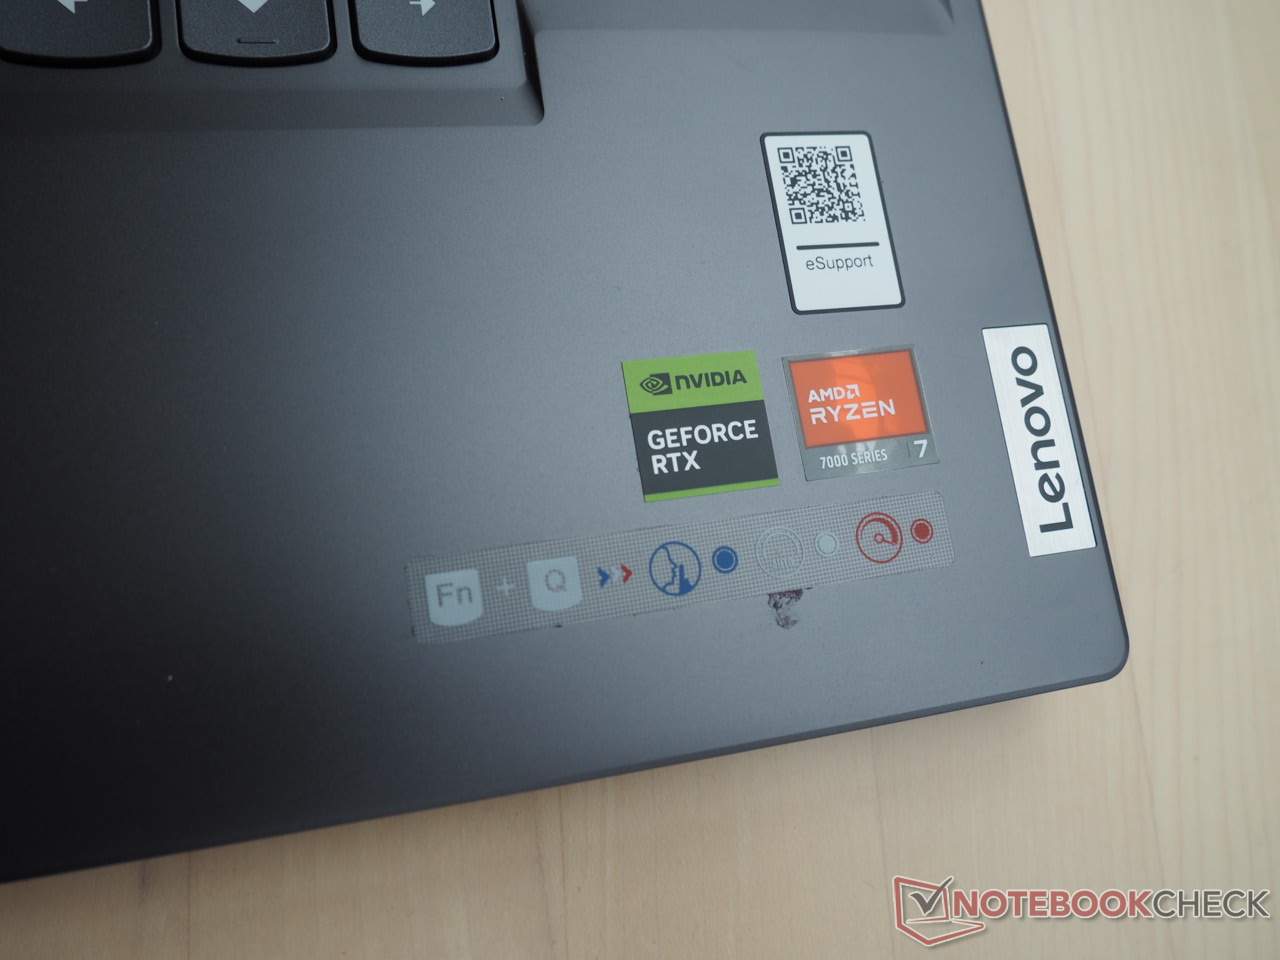
Förutom Intel-processorer erbjuder Lenovo AMD-processorer för Legion Slim 7-serien. Modellen vi testade, 16APH8, har en Ryzen 7 7840HS processor i kombination med en GeForce RTX 4060 GPU, 32 GB DDR5-5600-RAM och en rymlig 1 TB M.2 SSD. Den bärbara datorn har en livfull WQXGA-skärm med en upplösning på 2 560 x 1 600 pixlar, en hög uppdateringsfrekvens på 240 Hz, fabrikskalibrering och HDR-stöd, Windows 11 Home kompletterar produkten. Trots sina imponerande specifikationer kostar 16APH8 cirka 1750 USD, vilket gör den relativt dyr för en bärbar dator utrustad med ett RTX 4060-grafikkort.
Slim 7 möter konkurrens från andra 16-tums bärbara speldatorer med RTX 4060, inklusive modeller som Asus ROG Flow X16 GV601V, Alienware m16 R1, Acer Predator Helios 16 PH16-71-731Q, samt Lenovos egna Legion Pro 5 16IRX8 och Lenovo LOQ 16IRH8 bärbara datorer.
Potentiella konkurrenter i jämförelse
Gradering | Datum | Modell | Vikt | Höjd | Storlek | Upplösning | Pris |
|---|---|---|---|---|---|---|---|
| 90.4 % v7 (old) | 11/2023 | Lenovo Legion Slim 7 16APH8 R7 7840HS, GeForce RTX 4060 Laptop GPU | 2.1 kg | 20 mm | 16.00" | 2560x1600 | |
| 89.7 % v7 (old) | 06/2023 | Asus ROG Flow X16 GV601V i9-13900H, GeForce RTX 4060 Laptop GPU | 2.1 kg | 19.4 mm | 16.00" | 2560x1600 | |
| 88.3 % v7 (old) | 09/2023 | Alienware m16 R1 Intel i7-13700HX, GeForce RTX 4060 Laptop GPU | 3 kg | 25.4 mm | 16.00" | 2560x1600 | |
| 89.5 % v7 (old) | 07/2023 | Acer Predator Helios 16 PH16-71-731Q i7-13700HX, GeForce RTX 4060 Laptop GPU | 2.6 kg | 26.9 mm | 16.00" | 2560x1600 | |
| 87.9 % v7 (old) | 05/2023 | Lenovo Legion Pro 5 16IRX8 i7-13700HX, GeForce RTX 4060 Laptop GPU | 2.5 kg | 26.8 mm | 16.00" | 2560x1600 | |
| 87.3 % v7 (old) | 09/2023 | Lenovo LOQ 16IRH8 i7-13620H, GeForce RTX 4060 Laptop GPU | 2.7 kg | 25.9 mm | 16.00" | 2560x1600 |
Med undantag för några mindre skillnader är höljet detsamma som i Intel-versionen med Core i9-13900H och GeForce RTX 4070 som vi redan har undersökt. Därför kommer vi bara att gå igenom höljet, funktionerna och inmatningsenheterna kortfattat i den här artikeln.
Fall
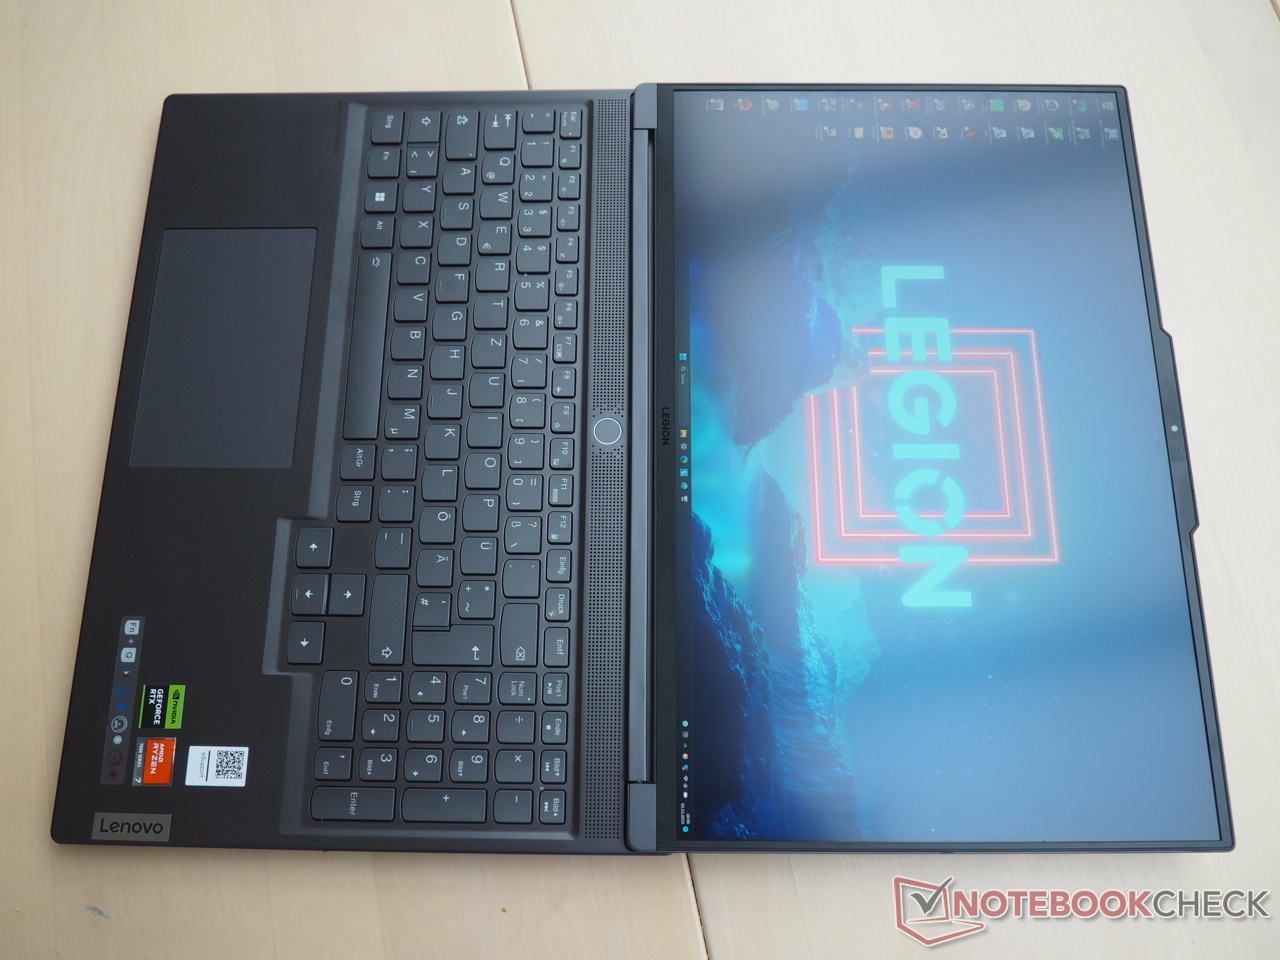
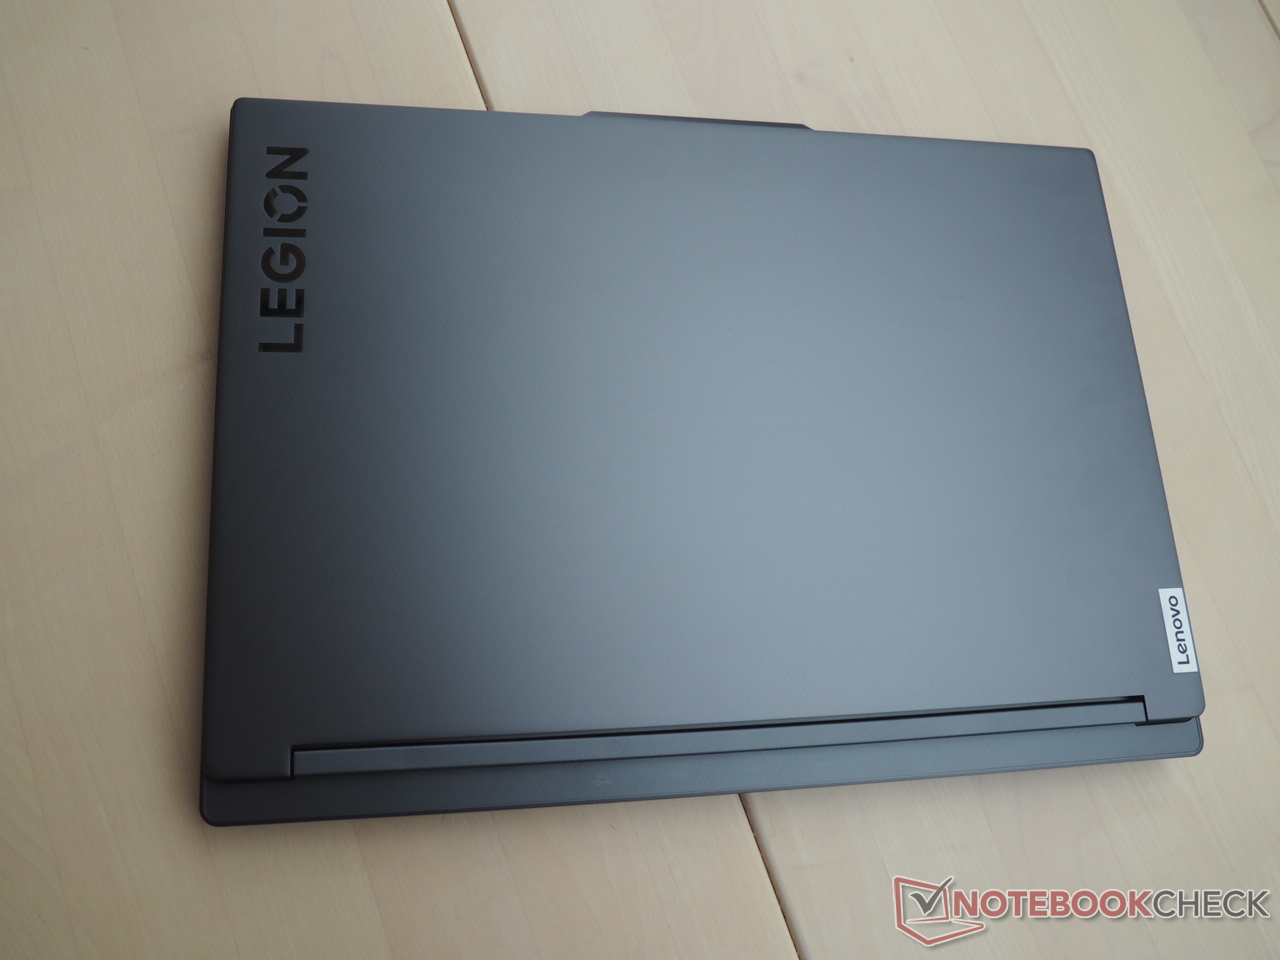
En av de utmärkande egenskaperna är den eleganta kroppen. Den 16 tum stora enheten har en elegant design, förstklassiga material och utmärkt stabilitet. Med en vikt på bara 4,6 lbs hamnar den i den lättare änden av skalan jämfört med sina konkurrenter.
Anslutningsmöjligheter
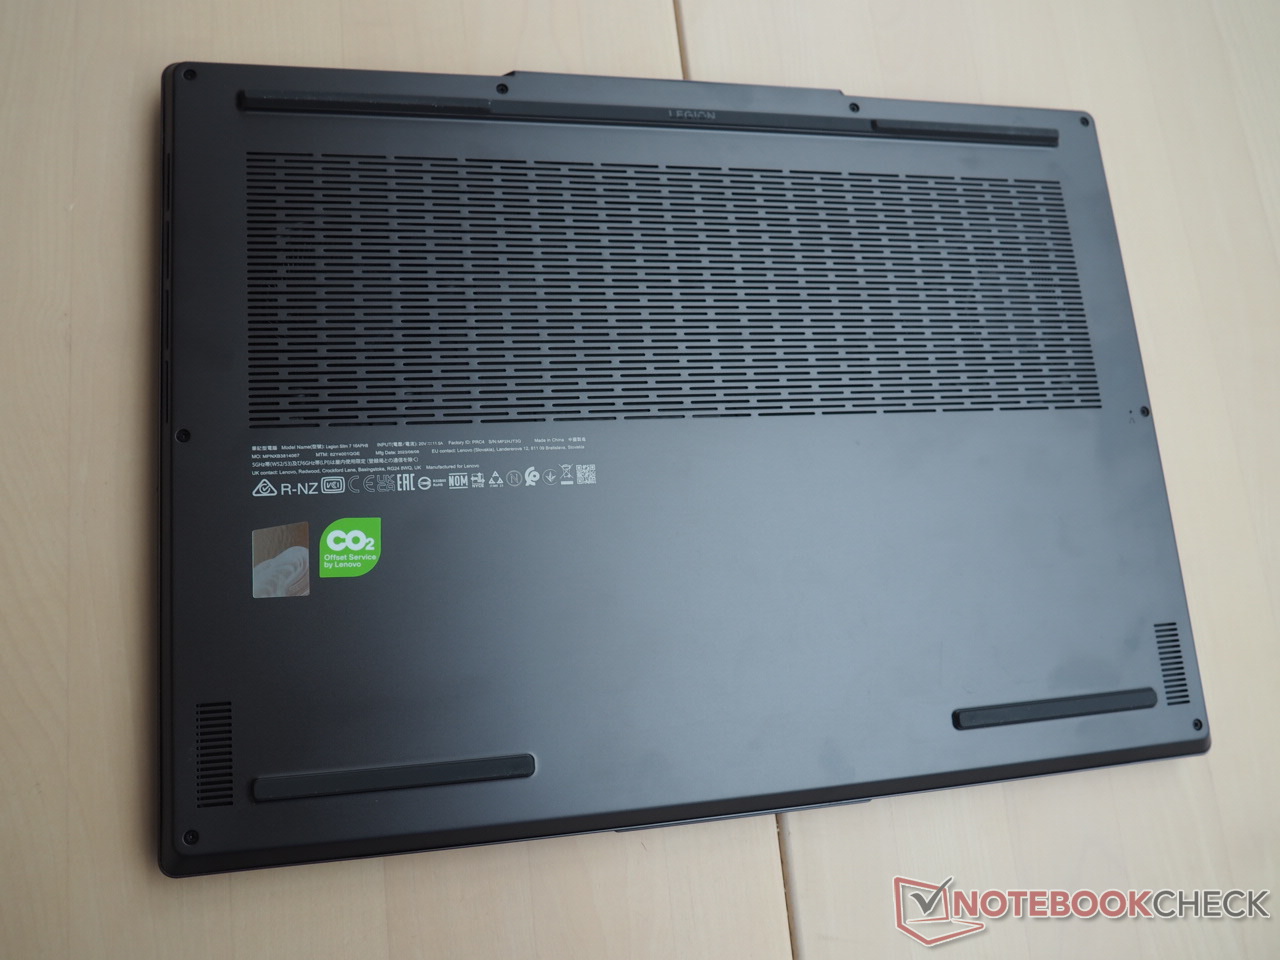
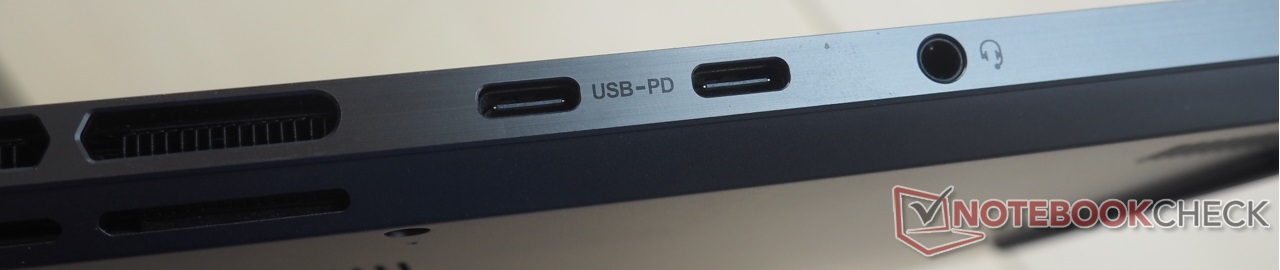
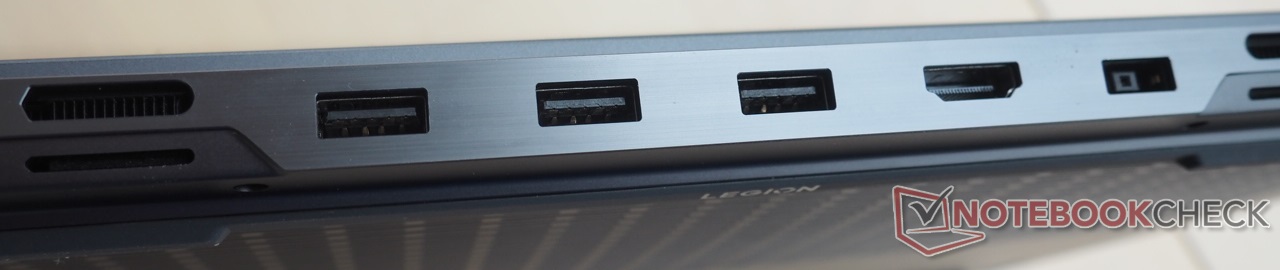
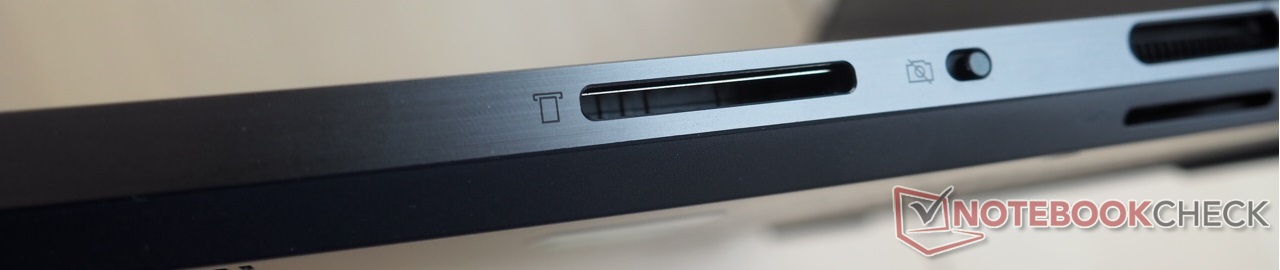
Trots avsaknaden av en RJ45-port erbjuder Slim 7 ett generöst utbud av anslutningar. På höger sida hittar du en kortläsare med medelhög hastighet och en sekretesslucka för en hyfsad webbkamera. På vänster sida finns ett ljuduttag och två USB-portar (1x USB 4, 1x USB 3.2 Gen2), som båda har stöd för DisplayPort 1.4 och 140 watt strömförsörjning. Dessutom finns en HDMI 2.1-port som gör det möjligt att ansluta upp till tre externa bildskärmar. På baksidan finns tre USB 3.2 Gen2-portar och anslutningen för det medföljande 230-watts nätaggregatet.
För trådlös anslutning använder den bärbara datorn ett Wi-Fi 6E-chip (MediaTek RZ616), som presterar något under genomsnittet vid överföring men över genomsnittet vid mottagning.
SD-kortläsare
| SD Card Reader | |
| average JPG Copy Test (av. of 3 runs) | |
| Alienware m16 R1 Intel (AV PRO microSD 128 GB V60) | |
| Genomsnitt av klass Gaming (20.9 - 210, n=54, senaste 2 åren) | |
| Asus ROG Flow X16 GV601V | |
| Lenovo Legion Slim 7 16APH8 (AV PRO microSD 128 GB V60) | |
| Acer Predator Helios 16 PH16-71-731Q | |
| maximum AS SSD Seq Read Test (1GB) | |
| Asus ROG Flow X16 GV601V | |
| Alienware m16 R1 Intel (AV PRO microSD 128 GB V60) | |
| Genomsnitt av klass Gaming (25.5 - 261, n=51, senaste 2 åren) | |
| Acer Predator Helios 16 PH16-71-731Q | |
| Lenovo Legion Slim 7 16APH8 (AV PRO microSD 128 GB V60) | |
Kommunikation
Webbkamera


Inmatningsenheter
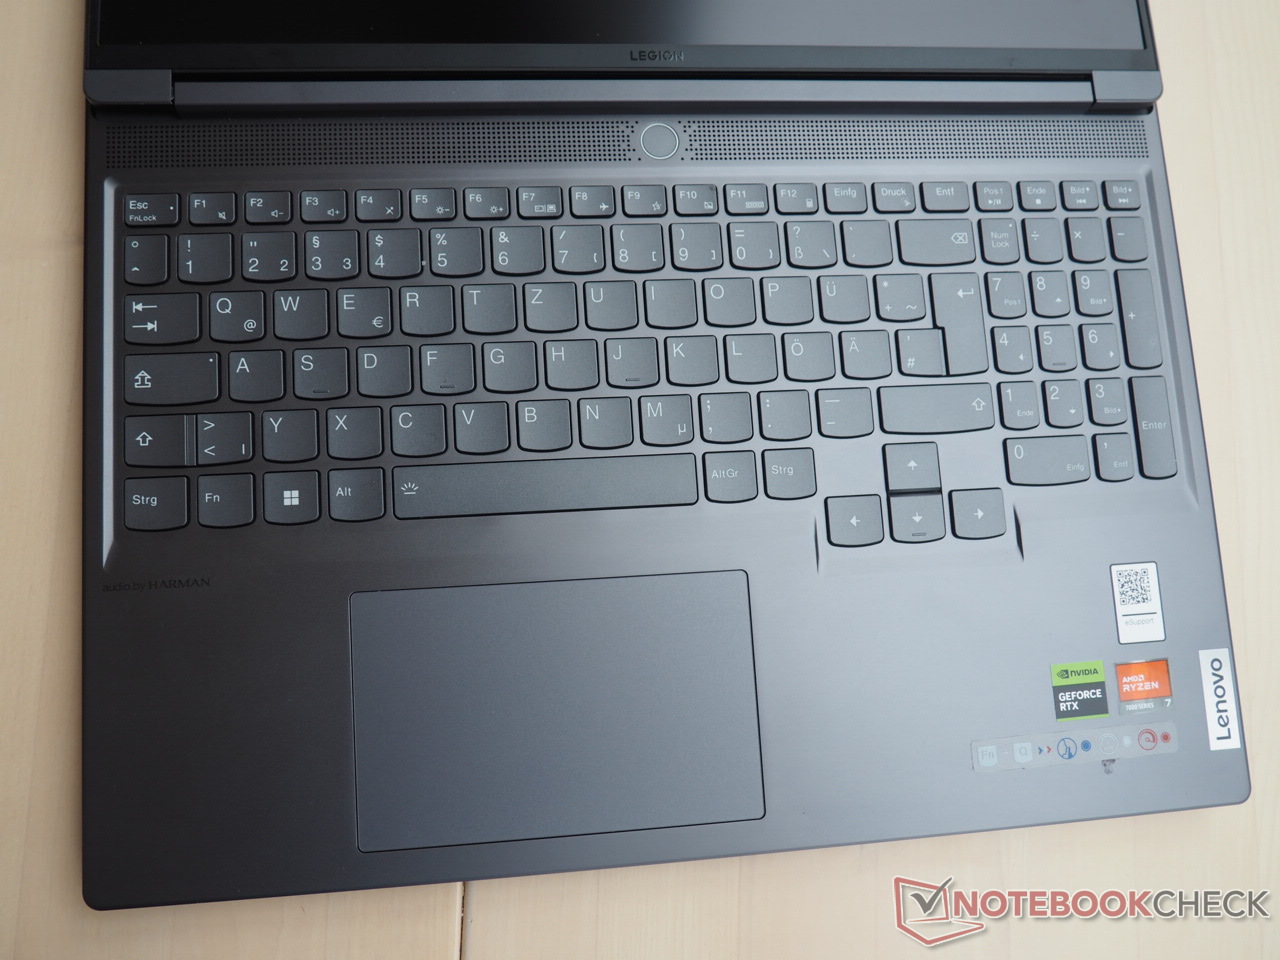
Tangentbordet har inte bara väl tilltagna tangenter, utan även en trevlig layout, en behaglig tangentform och en dedikerad numerisk knappsats. Det känns också bra att skriva på. Musen ersätts av en klickplatta som mäter ca 4,72 x 2,95 tum och som också ger ett trevligt intryck.
Display
Även om Intel-modellen och vår testenhets display har jämförbara grundläggande egenskaper, är de inte identiska. Vår modell hade en BOE-panel märkt NE160QDM-NZ3.
| |||||||||||||||||||||||||
Distribution av ljusstyrkan: 82 %
Mitt på batteriet: 545 cd/m²
Kontrast: 1135:1 (Svärta: 0.48 cd/m²)
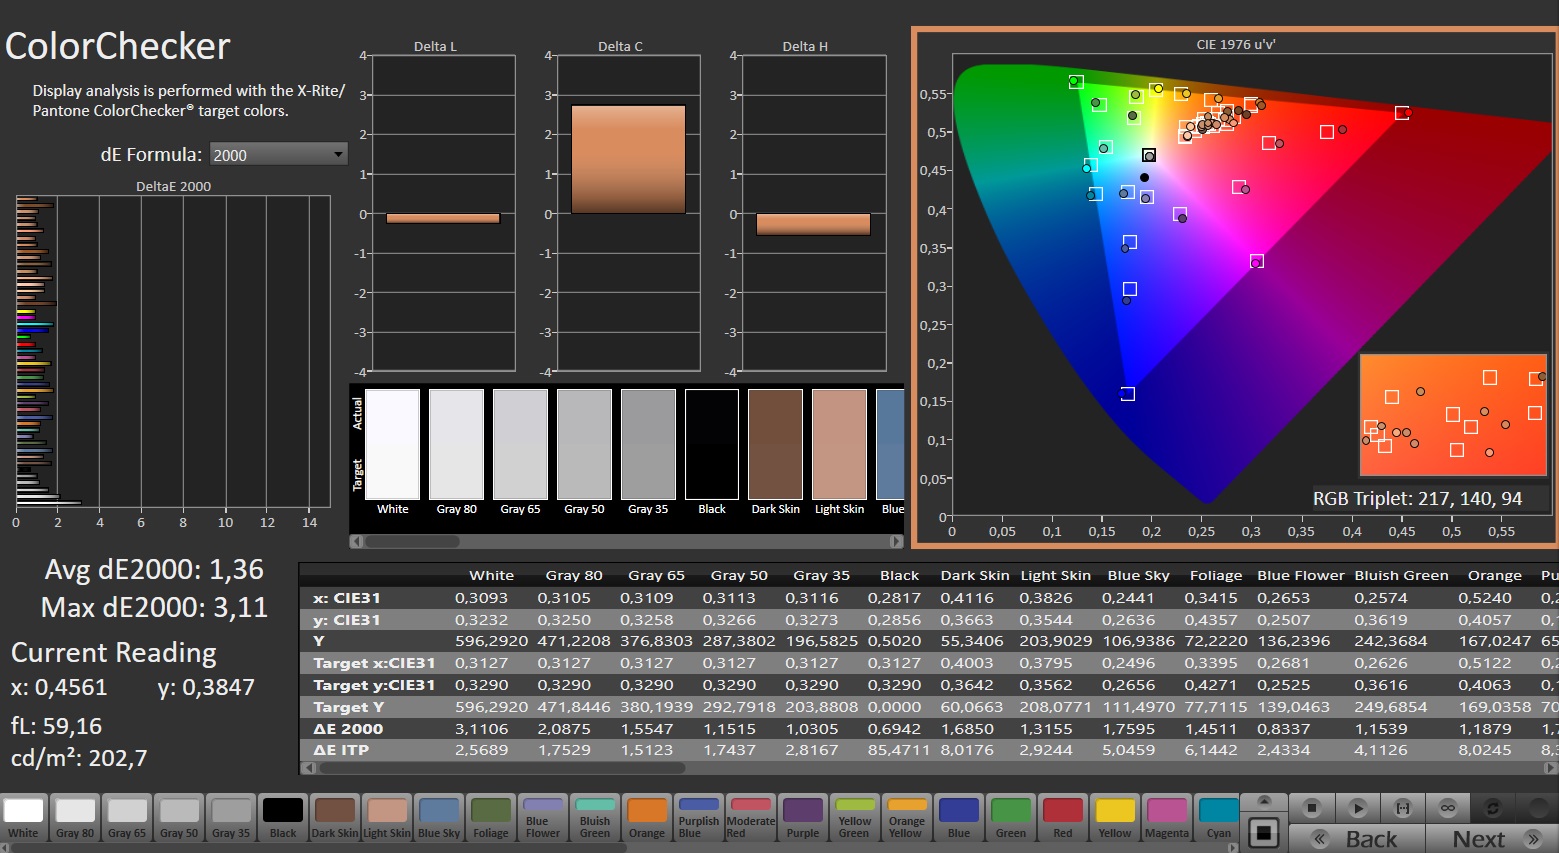
ΔE ColorChecker Calman: 1.36 | ∀{0.5-29.43 Ø4.73}
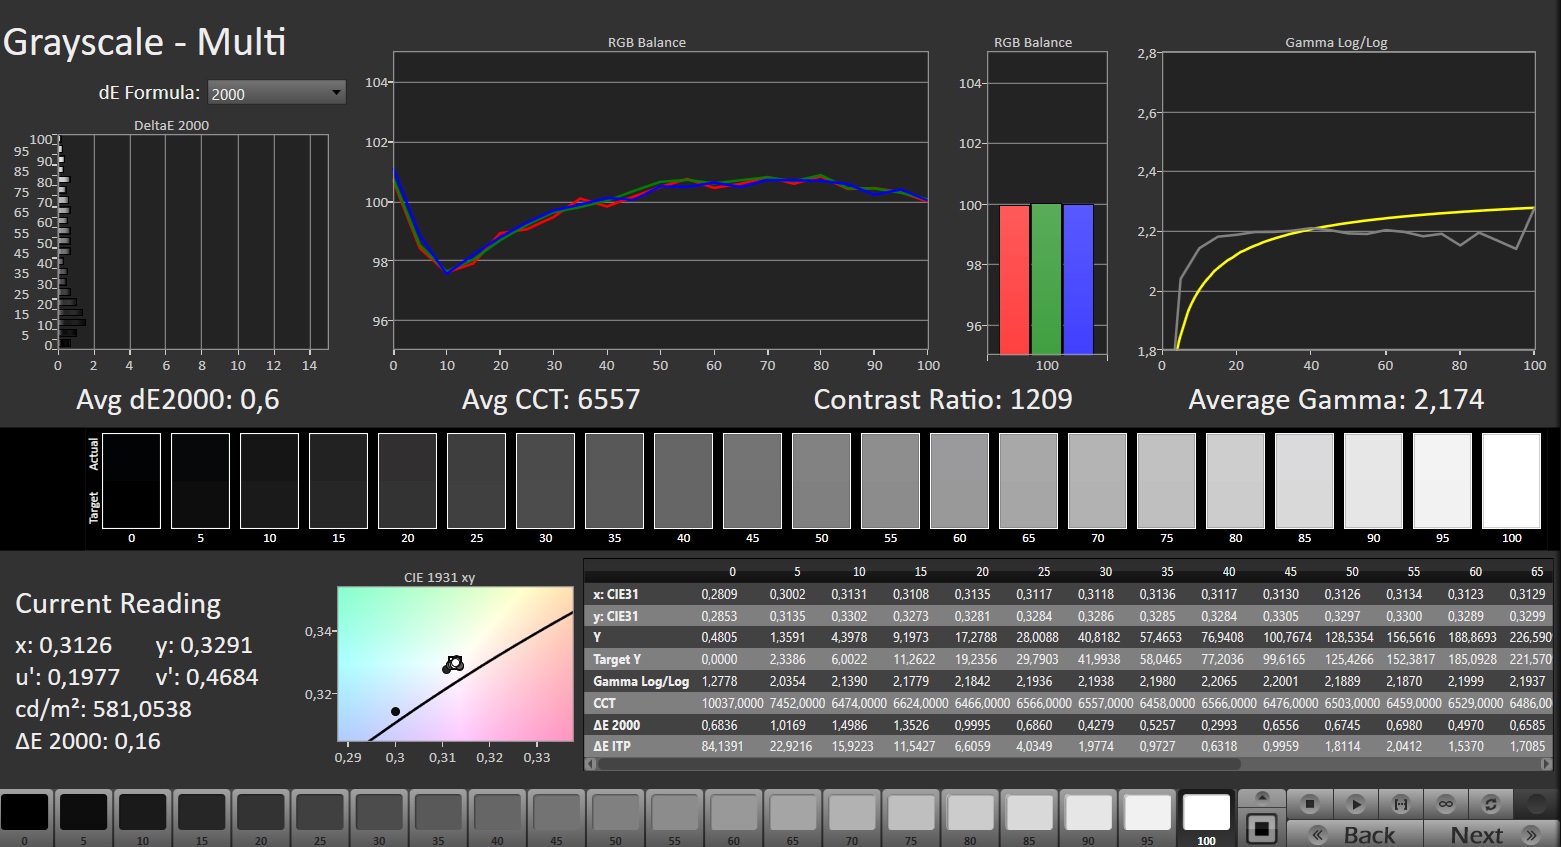
calibrated: 1.04
ΔE Greyscale Calman: 1.4 | ∀{0.09-98 Ø4.97}
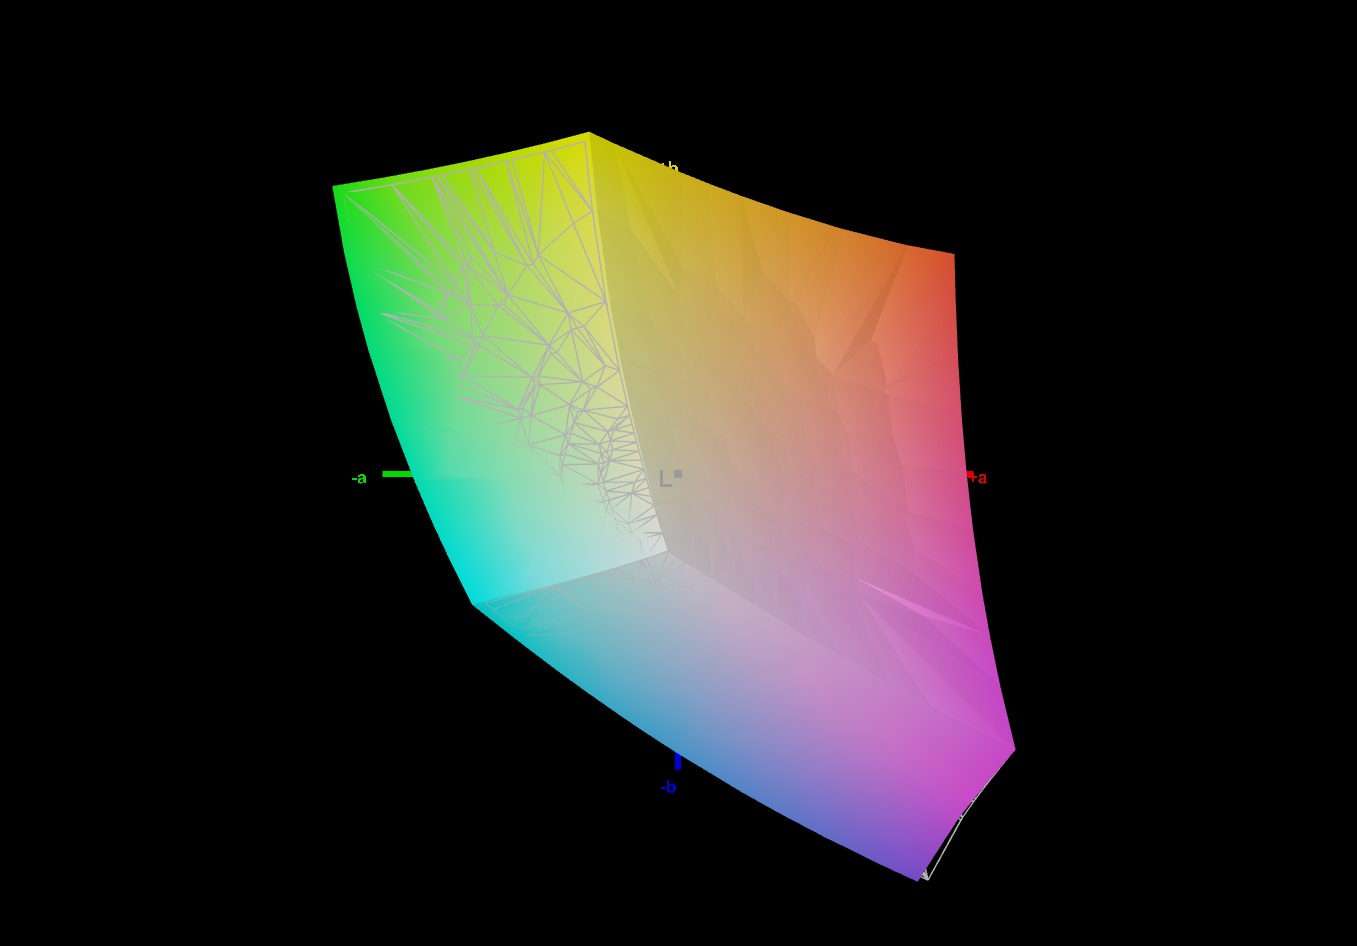
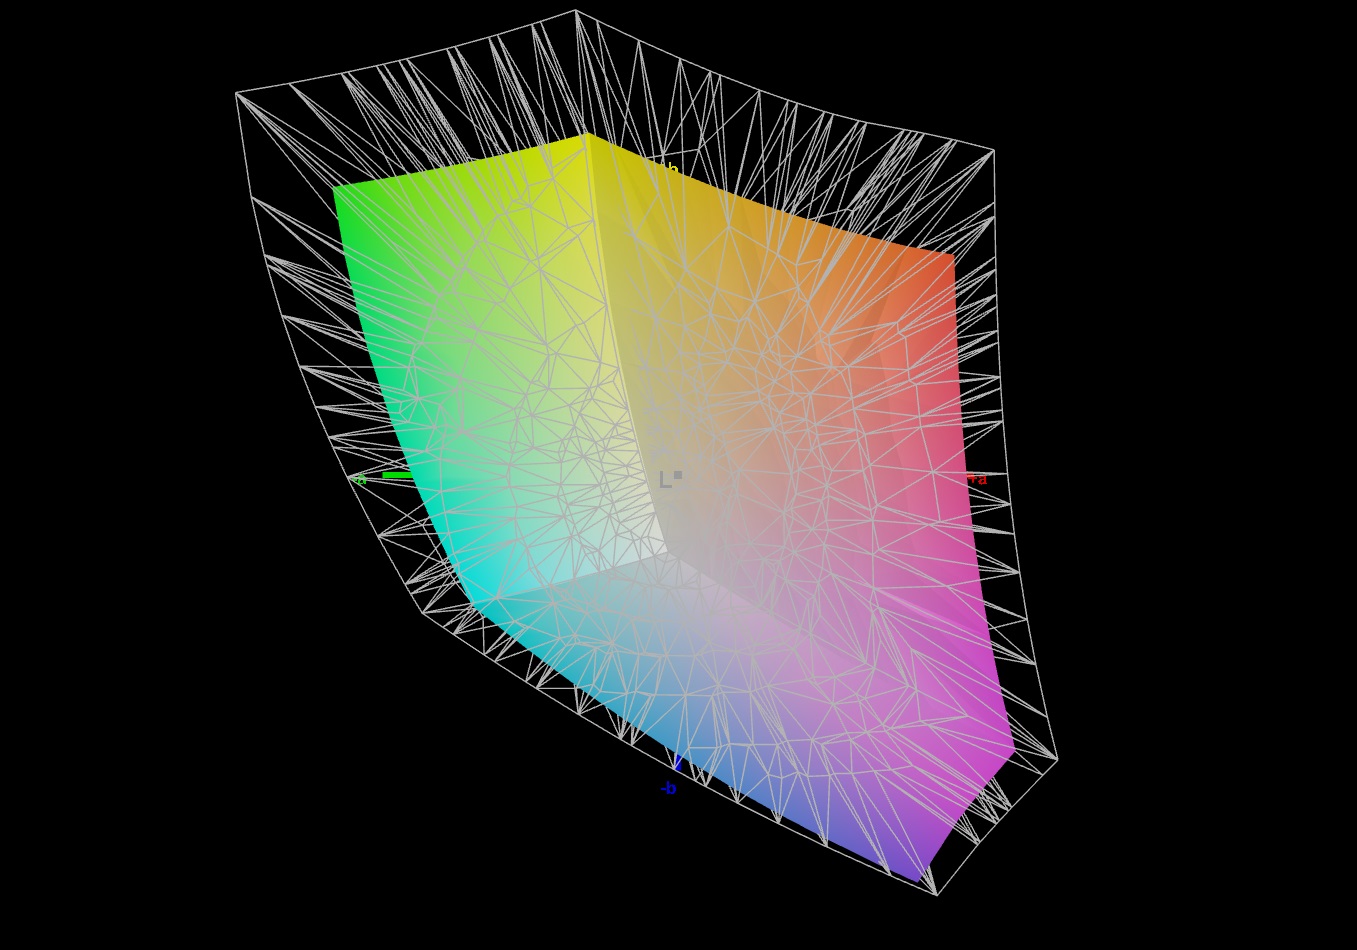
72.4% AdobeRGB 1998 (Argyll 3D)
99.6% sRGB (Argyll 3D)
70.3% Display P3 (Argyll 3D)
Gamma: 2.253
CCT: 6631 K
| Lenovo Legion Slim 7 16APH8 BOE NE160QDM-NZ3, IPS, 2560x1600, 16" | Asus ROG Flow X16 GV601V TMX1603 (TL160ADMP03-0), IPS, 2560x1600, 16" | Alienware m16 R1 Intel BOE NE16NYB, IPS, 2560x1600, 16" | Acer Predator Helios 16 PH16-71-731Q BOE NE160QDM-NZ2, IPS-LED, 2560x1600, 16" | Lenovo Legion Pro 5 16IRX8 AU Optronics B160QAN03.1, IPS, 2560x1600, 16" | Lenovo LOQ 16IRH8 AUOC1A5 (B160QAN03.L), IPS, 2560x1600, 16" | |
|---|---|---|---|---|---|---|
| Display | 18% | -3% | 18% | 0% | -0% | |
| Display P3 Coverage (%) | 70.3 | 96.61 37% | 67.7 -4% | 97.1 38% | 71.2 1% | 70.5 0% |
| sRGB Coverage (%) | 99.6 | 99.92 0% | 97.2 -2% | 100 0% | 98.8 -1% | 98.9 -1% |
| AdobeRGB 1998 Coverage (%) | 72.4 | 84.63 17% | 70 -3% | 84.7 17% | 73.3 1% | 72.6 0% |
| Response Times | 21% | 22% | -8% | -46% | 9% | |
| Response Time Grey 50% / Grey 80% * (ms) | 12.6 ? | 3.8 ? 70% | 4 ? 68% | 13.6 ? -8% | 14.5 ? -15% | 7.2 ? 43% |
| Response Time Black / White * (ms) | 5.9 ? | 7.6 ? -29% | 7.3 ? -24% | 6.4 ? -8% | 10.4 ? -76% | 7.4 ? -25% |
| PWM Frequency (Hz) | ||||||
| Screen | -25% | -32% | -17% | -3% | -7% | |
| Brightness middle (cd/m²) | 545 | 486 -11% | 306 -44% | 511 -6% | 405.7 -26% | 407 -25% |
| Brightness (cd/m²) | 502 | 469 -7% | 302 -40% | 498 -1% | 368 -27% | 369 -26% |
| Brightness Distribution (%) | 82 | 91 11% | 89 9% | 94 15% | 87 6% | 85 4% |
| Black Level * (cd/m²) | 0.48 | 0.39 19% | 0.3 37% | 0.36 25% | 0.38 21% | 0.45 6% |
| Contrast (:1) | 1135 | 1246 10% | 1020 -10% | 1419 25% | 1068 -6% | 904 -20% |
| Colorchecker dE 2000 * | 1.36 | 2.27 -67% | 2.57 -89% | 1.76 -29% | 1.65 -21% | 1.43 -5% |
| Colorchecker dE 2000 max. * | 3.11 | 5.73 -84% | 4.26 -37% | 3.7 -19% | 4.2 -35% | 3.58 -15% |
| Colorchecker dE 2000 calibrated * | 1.04 | 0.6 42% | 0.85 18% | 1.56 -50% | 0.53 49% | 1.07 -3% |
| Greyscale dE 2000 * | 1.4 | 3.36 -140% | 3.3 -136% | 3 -114% | 1.2 14% | 1.13 19% |
| Gamma | 2.253 98% | 2.46 89% | 1.997 110% | 2.33 94% | 2.3 96% | 2.5 88% |
| CCT | 6631 98% | 6625 98% | 6895 94% | 6341 103% | 6453 101% | 6526 100% |
| Totalt genomsnitt (program/inställningar) | 5% /
-9% | -4% /
-18% | -2% /
-8% | -16% /
-8% | 1% /
-3% |
* ... mindre är bättre
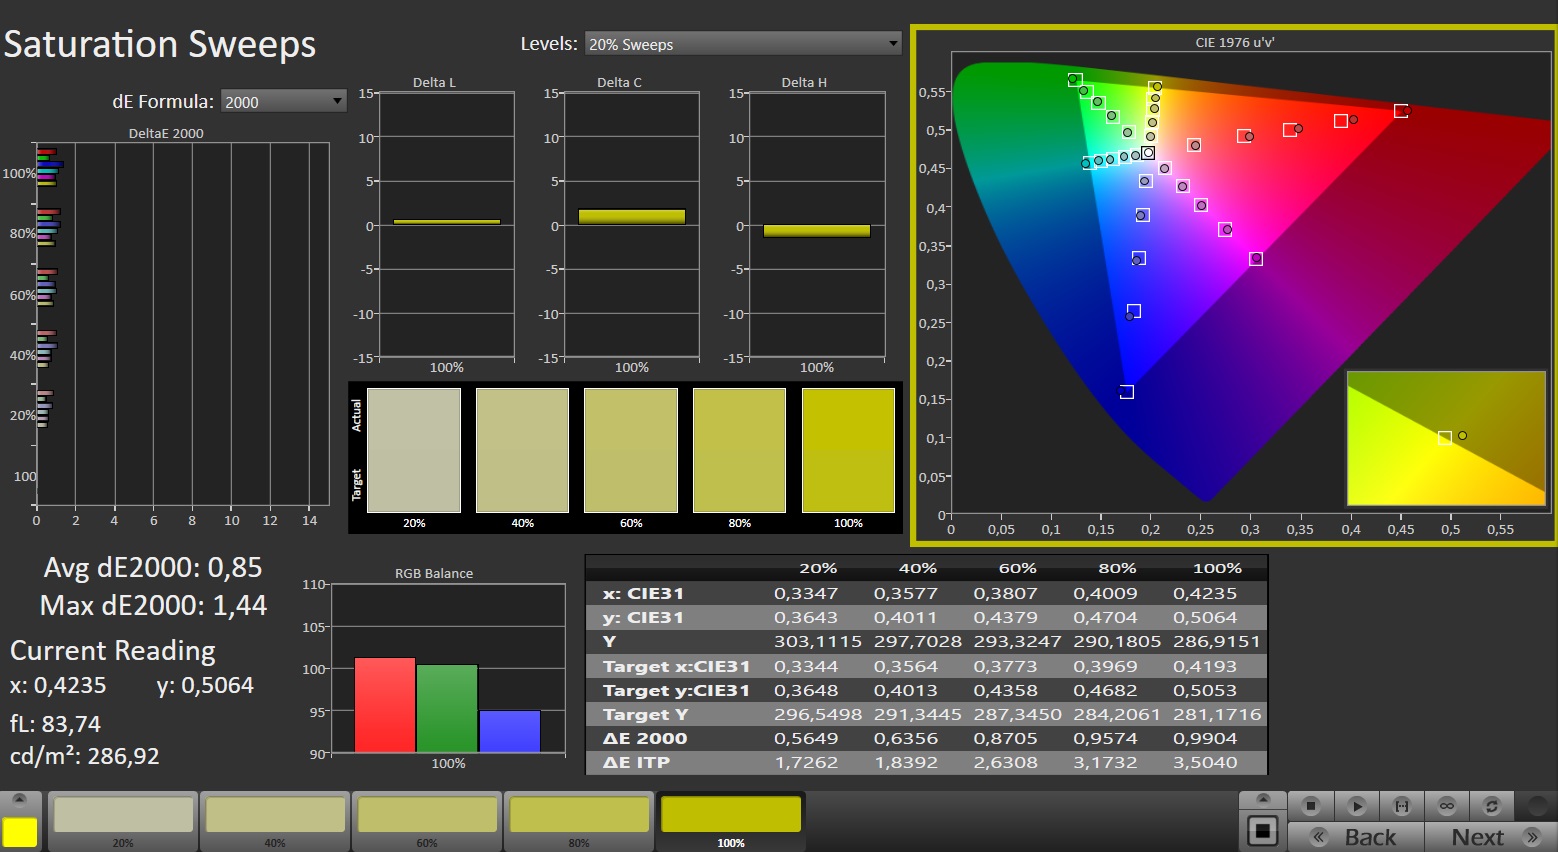
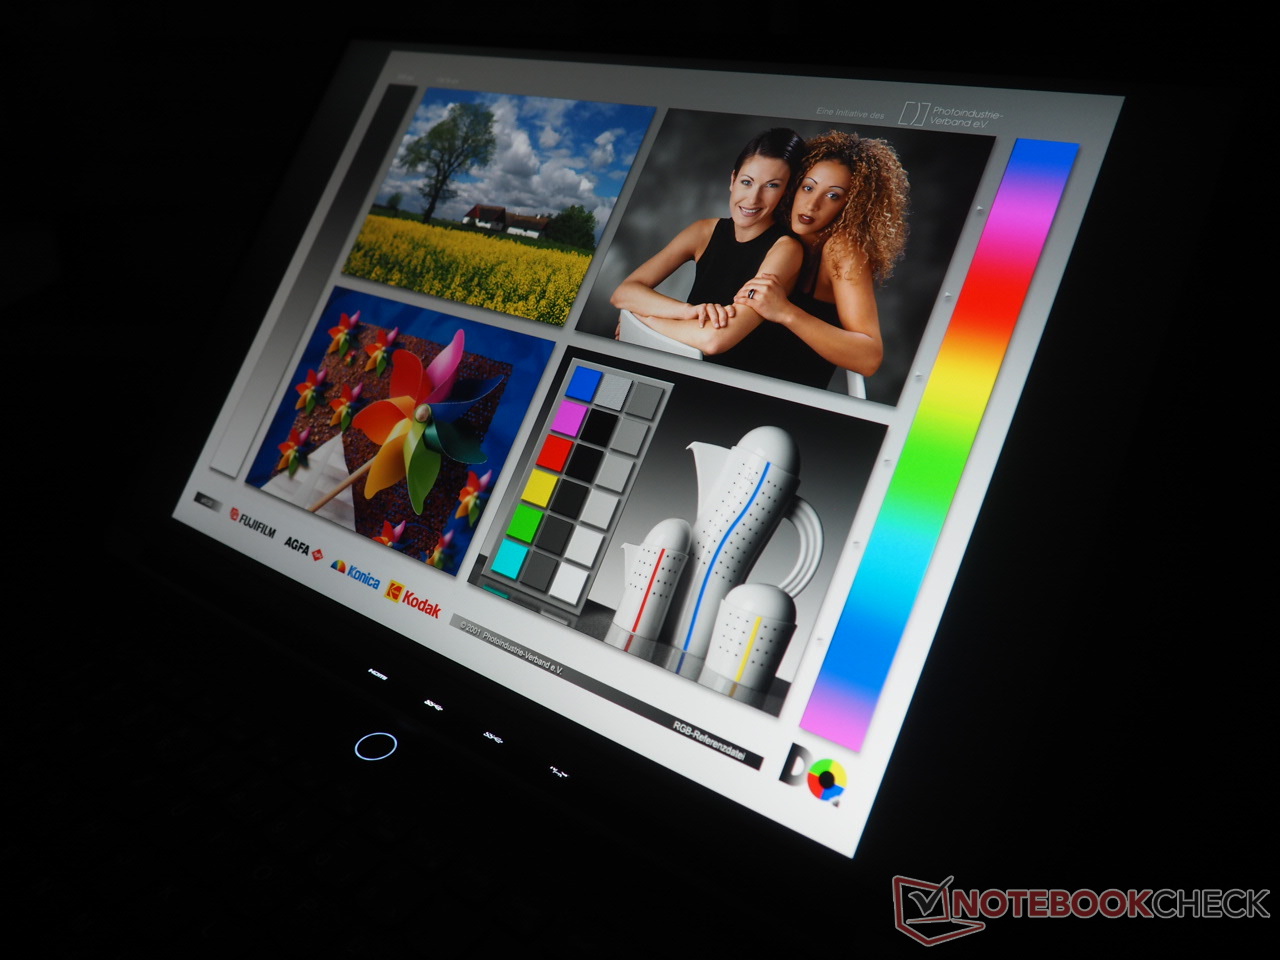
Bortsett från färgrymden, som skulle kunna vara något större med tanke på 70% DCI-P3 och 72% AdobeRGB-täckning (i jämförelse med Alienware m16 och Acer Predator Helios 16), fungerar WQXGA-skärmen mycket bra i nästan alla avseenden. Tack vare fabrikskalibreringen är färgnoggrannheten exceptionell redan från början. Dessutom är svarstiderna för 240 Hz-panelen anständiga och mäter strax under 6 ms för övergångar från svart till vitt och 12 ms för övergångar från grått till grått.
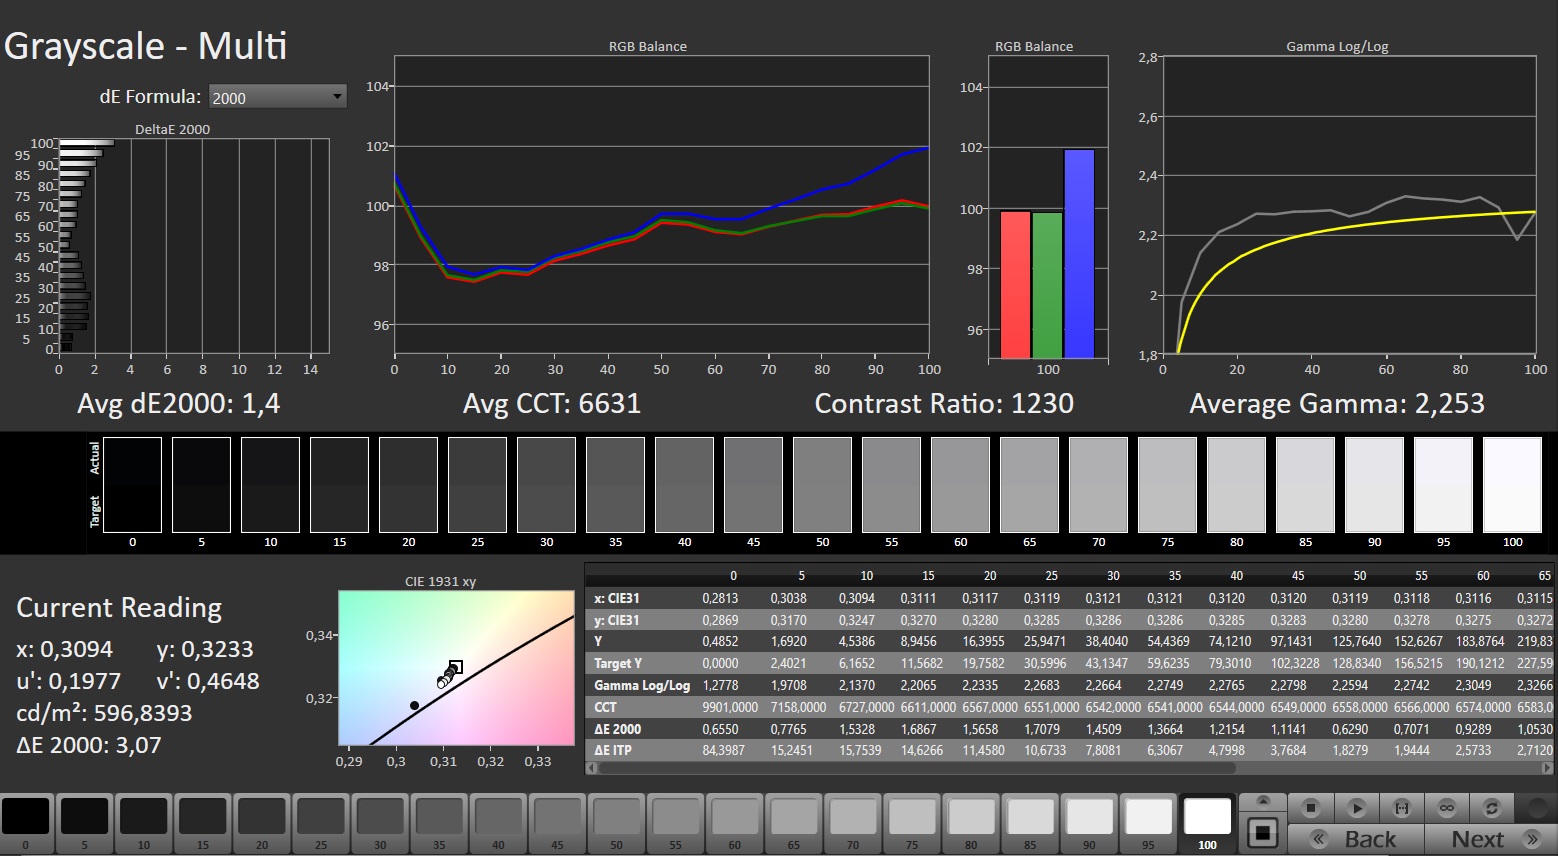

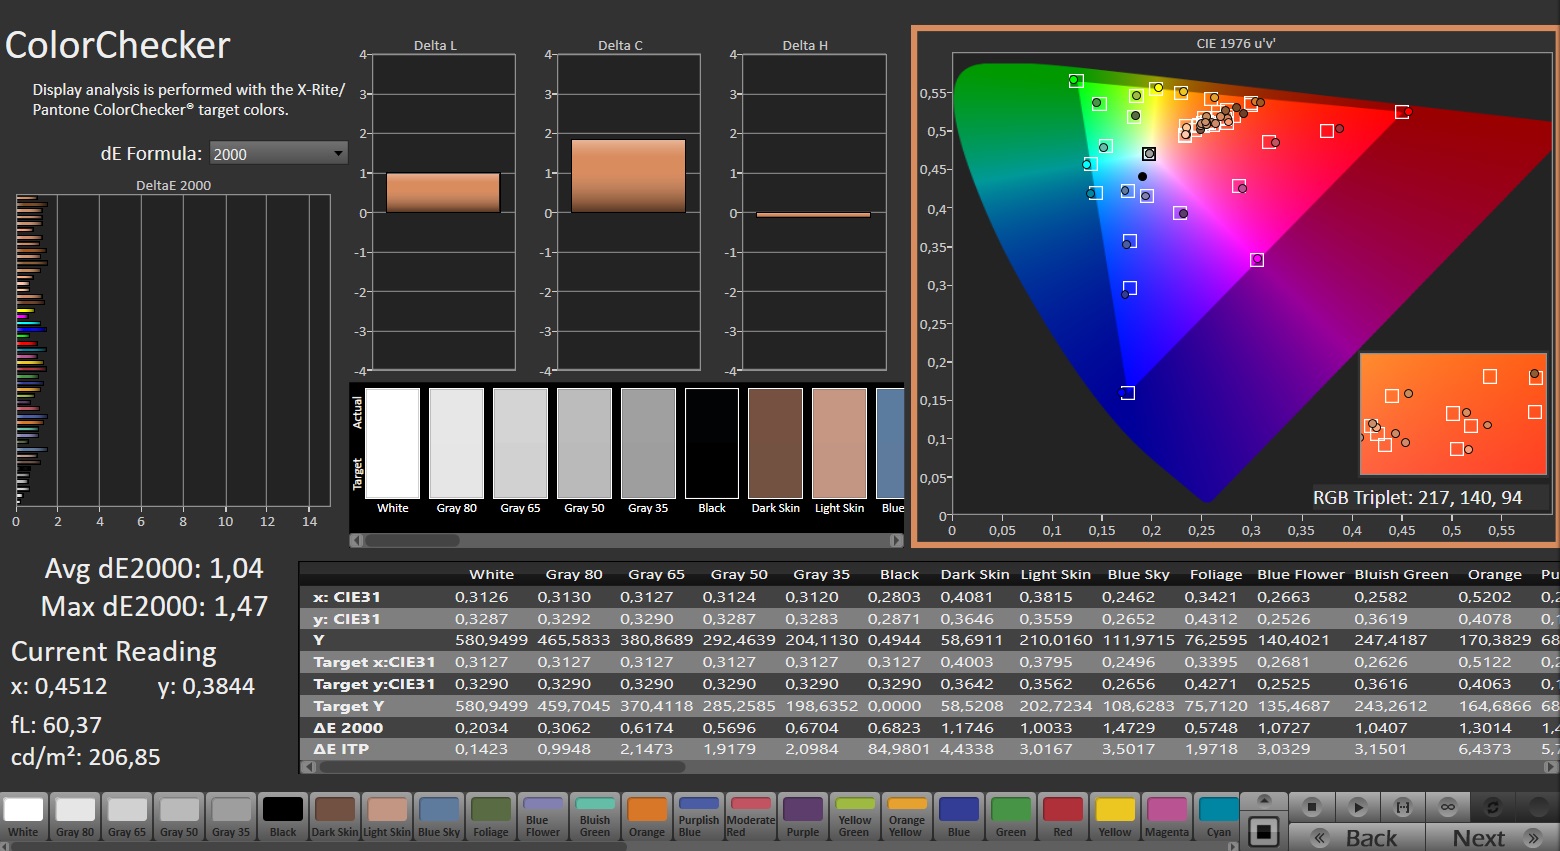
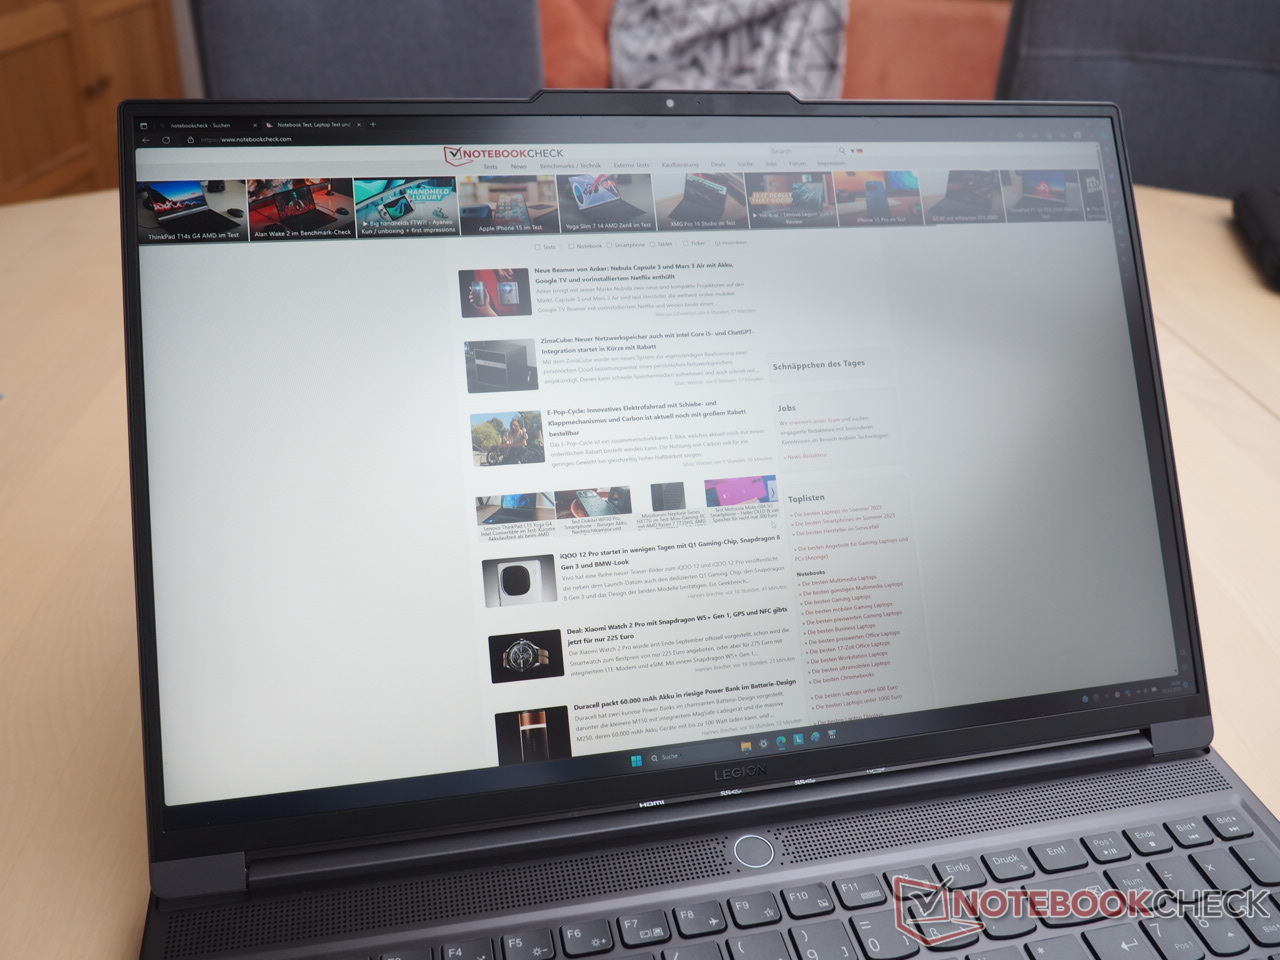
Ljusstyrkan är särskilt anmärkningsvärd: ett medelvärde på 502 cd/m2 är ganska högt för en IPS-skärm och överträffar till och med företagets standarder för SDR-rumsljusstyrka (400 cd/m2). Spelare kommer att uppskatta FreeSync- och GSync-stödet. Trots att den har maximal ljusstyrka i testfältet sticker kontrasten inte ut bland konkurrenterna. Detta beror på det otillfredsställande svartvärdet på 0,48 cd/m².

Betraktningsvinklarna följer den typiska IPS-standarden, vilket framgår av vårt foto. Det fanns inga märkbara problem med skärmflimmer.
Visa svarstider
| ↔ Svarstid svart till vitt | ||
|---|---|---|
| 5.9 ms ... stiga ↗ och falla ↘ kombinerat | ↗ 1.9 ms stiga | 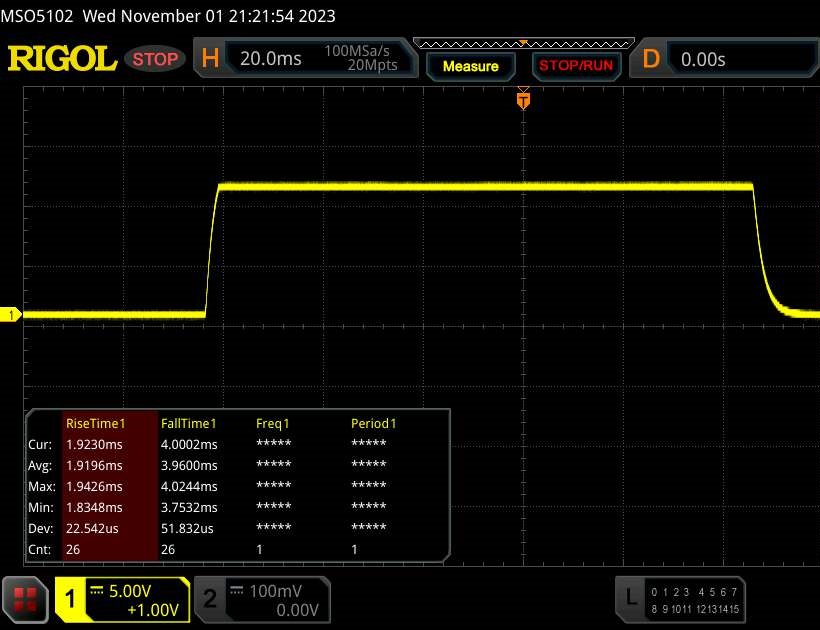 |
| ↘ 4 ms hösten | ||
| Skärmen visar väldigt snabba svarsfrekvenser i våra tester och borde vara mycket väl lämpad för fartfyllt spel. I jämförelse sträcker sig alla testade enheter från 0.1 (minst) till 240 (maximalt) ms. » 18 % av alla enheter är bättre. Det betyder att den uppmätta svarstiden är bättre än genomsnittet av alla testade enheter (19.9 ms). | ||
| ↔ Svarstid 50 % grått till 80 % grått | ||
| 12.6 ms ... stiga ↗ och falla ↘ kombinerat | ↗ 6.1 ms stiga | 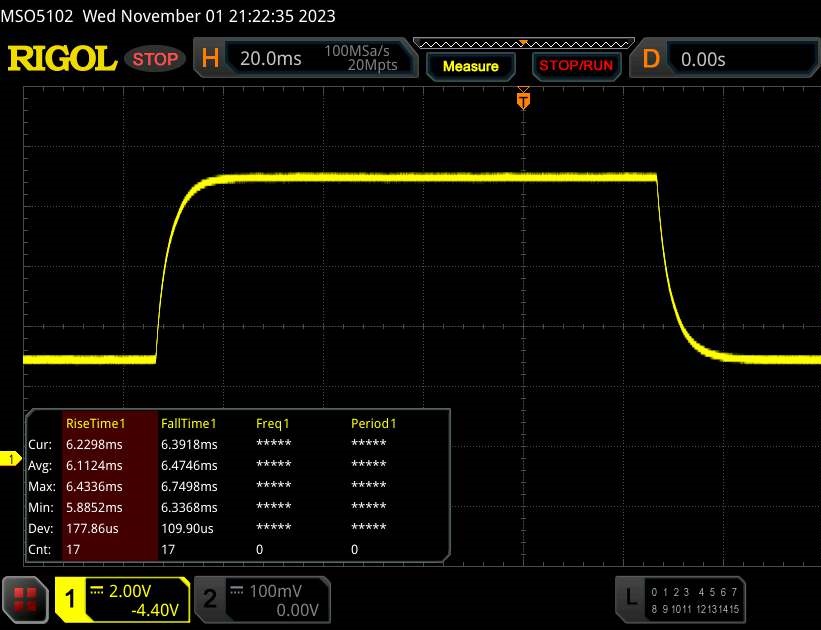 |
| ↘ 6.5 ms hösten | ||
| Skärmen visar bra svarsfrekvens i våra tester, men kan vara för långsam för konkurrenskraftiga spelare. I jämförelse sträcker sig alla testade enheter från 0.165 (minst) till 636 (maximalt) ms. » 26 % av alla enheter är bättre. Det betyder att den uppmätta svarstiden är bättre än genomsnittet av alla testade enheter (31.1 ms). | ||
Skärmflimmer / PWM (Puls-Width Modulation)
| Skärmflimmer / PWM upptäcktes inte | 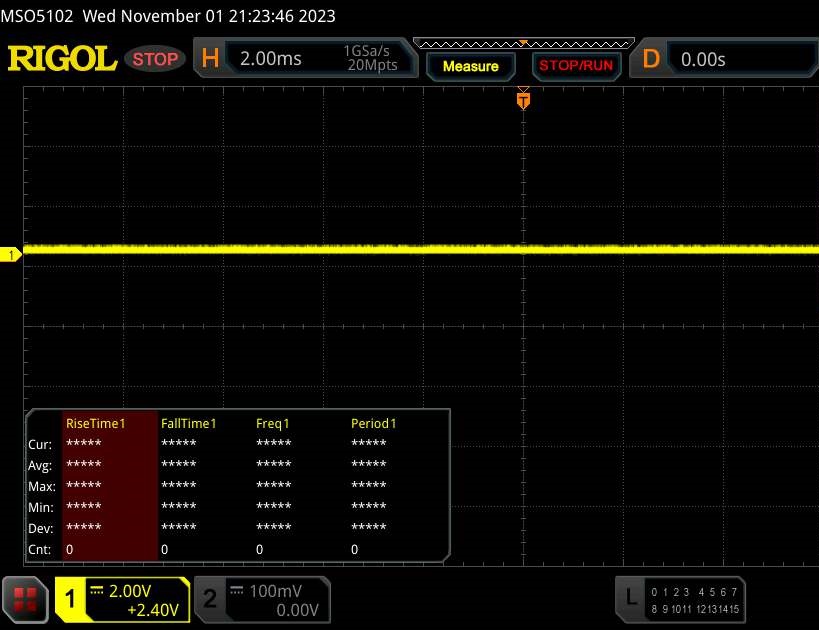 | ||
Som jämförelse: 52 % av alla testade enheter använder inte PWM för att dämpa skärmen. Om PWM upptäcktes mättes ett medelvärde av 7798 (minst: 5 - maximum: 343500) Hz. | |||
Prestanda
GeForce RTX 4060 placerar Legion i mellanklassen av bärbara speldatorer. Med 32 GB RAM-minne och en 1 TB SSD bör det räcka för majoriteten av köparna för tillfället. De som söker högre prestanda kan välja RTX 4070-versionen. Men Lenovo erbjuder för närvarande inte en RTX 4080 eller RTX 4090 för Slim 7.
Villkor för testning
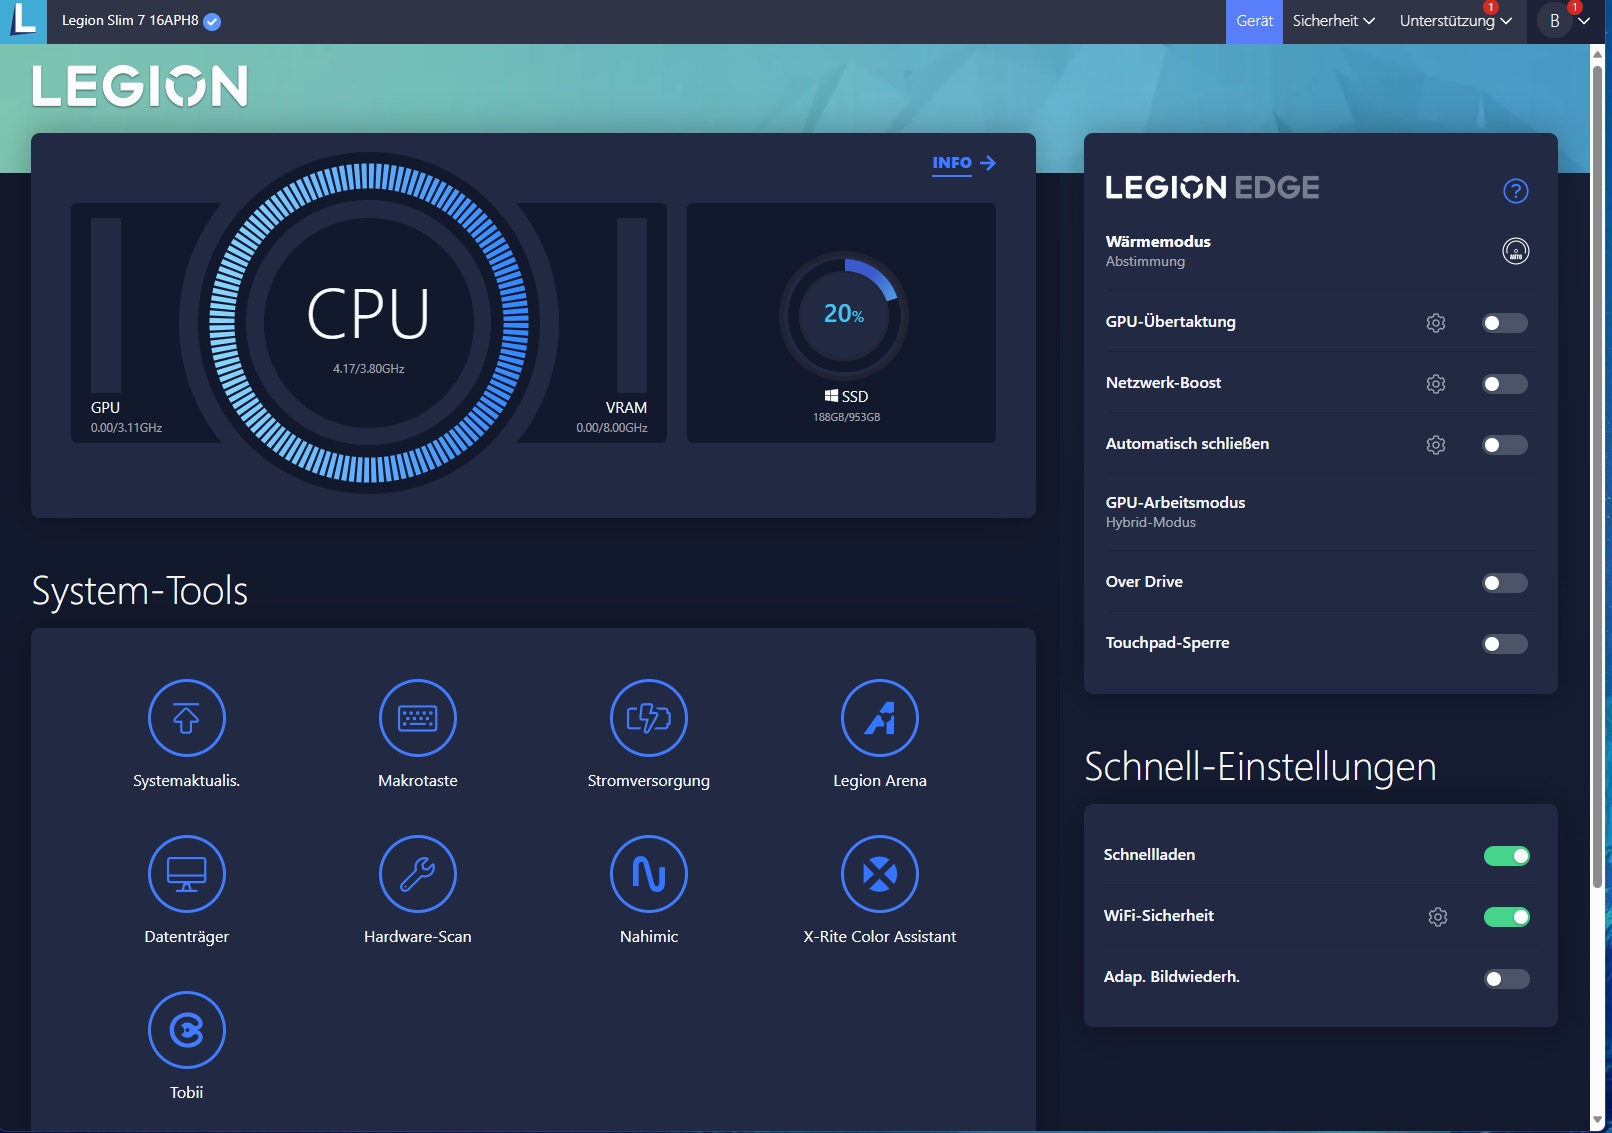
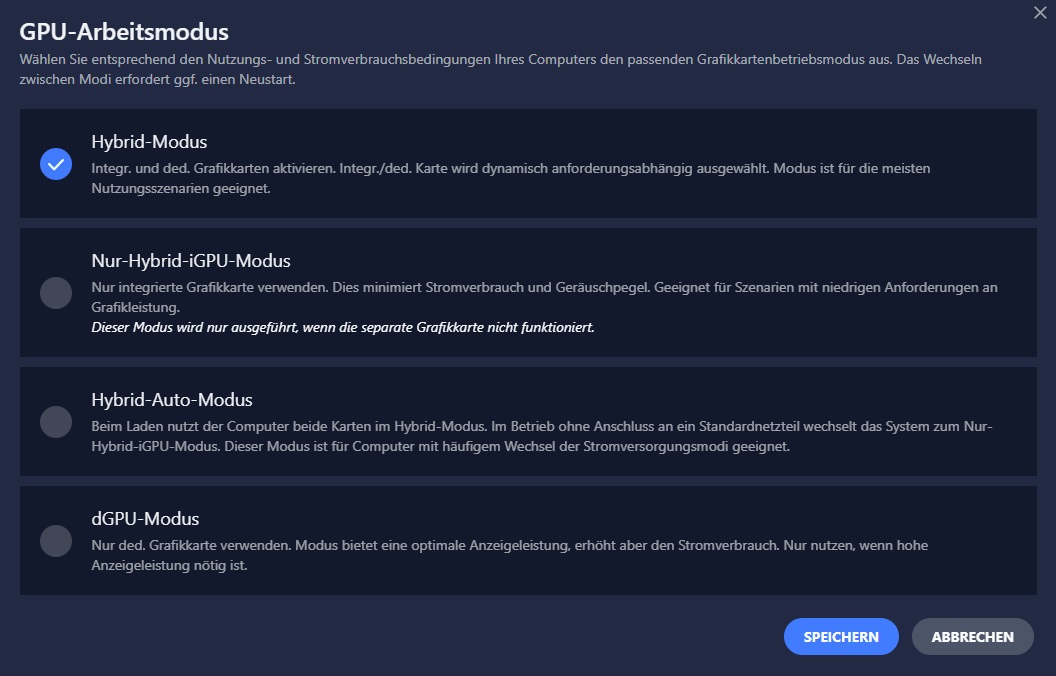
Den förinstallerade Lenovo Vantage-programvaran är anmärkningsvärd för sina omfattande anpassningsmöjligheter. Vid sidan av det termiska läget kan användare också välja GPU-arbetsläge. Eftersom FPS-ökningen i prestandaprofilen inte är proportionell mot den högre volymen (vilket visas i tabellen) utförde vi alla mätningar i profilen Balanserad. Standardgrafikomkopplingen (hybridläge) var alltid på.
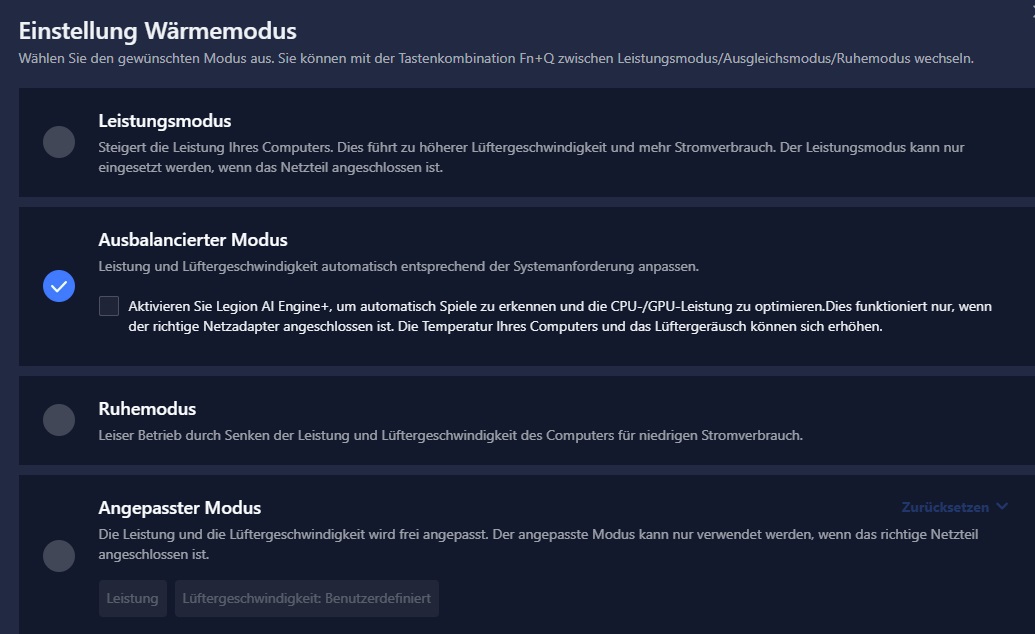
| Tyst | Balanserad | Prestanda | |
|---|---|---|---|
| Buller (Witcher 3, FHD/Ultra) | 36 dB(A) | 47 dB(A) | 52 dB(A) |
| Prestanda (Witcher 3, FHD/Ultra) | ~86 fps | ~98 fps | ~100 fps |
| Effektgräns 1 (HWInfo) | 50 w | 54 w | 100 w |
| Effektgräns 2 (HWInfo) | 60 w | 65 w | 125 w |
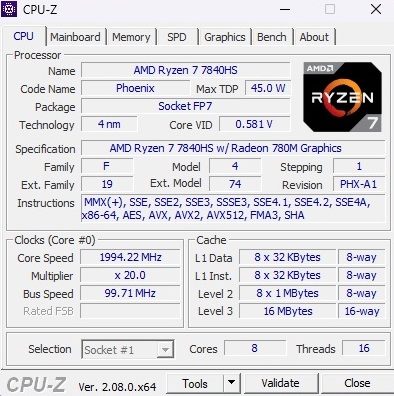
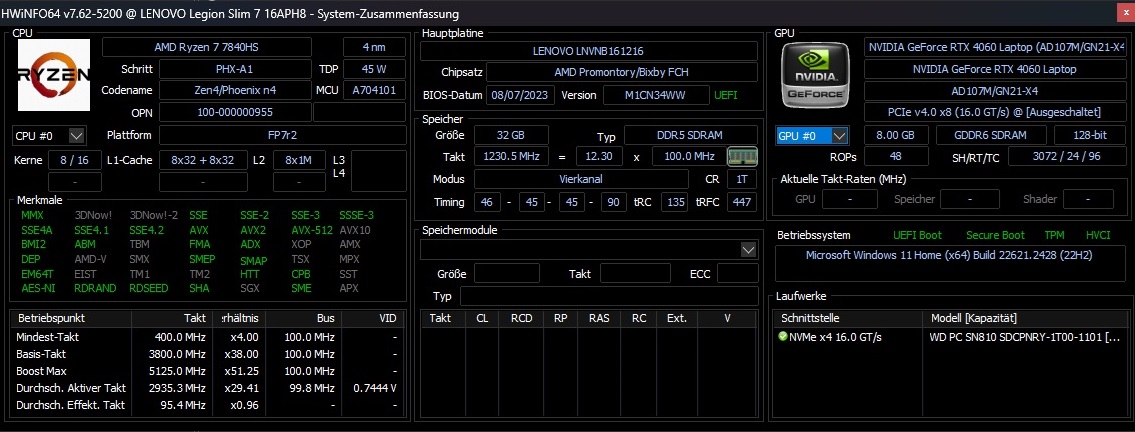
Processor
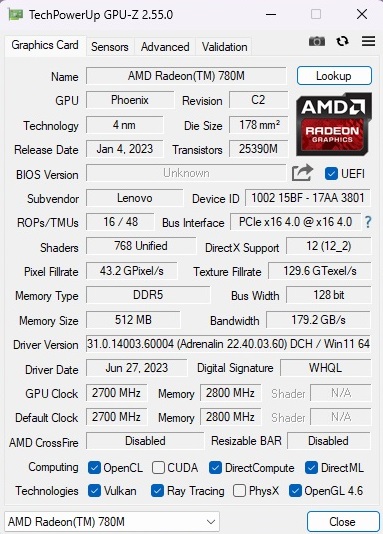
Ryzen 7 7840HS är en åttakärnig processor utrustad med 16 MB L3-cache och möjlighet att hantera upp till 16 trådar samtidigt tack vare SMT. Dessutom har 4 nm-chippet en relativt snabb integrerad GPU, Radeon 780Msom ansvarar för bildberäkningar och visning, för mindre krävande uppgifter som kontorsarbete, videostreaming och webbsurfning. Under benchmarktester ligger CPU-prestandan mellan Core i7-13620H och Core i7-13700HX. En anmärkningsvärd fördel med AMD-processorn är dess konsekventa prestandaförbättring, ett drag som inte är helt tillämpligt eller bara delvis sant för många Intel-motsvarigheter, vilket framgår av riktmärken som Cinebench-loopen.
Cinebench R15 Multi Loop
* ... mindre är bättre
AIDA64: FP32 Ray-Trace | FPU Julia | CPU SHA3 | CPU Queen | FPU SinJulia | FPU Mandel | CPU AES | CPU ZLib | FP64 Ray-Trace | CPU PhotoWorxx
| Performance rating | |
| Genomsnitt av klass Gaming | |
| Genomsnitt AMD Ryzen 7 7840HS | |
| Alienware m16 R1 Intel | |
| Lenovo Legion Slim 7 16APH8 | |
| Acer Predator Helios 16 PH16-71-731Q | |
| Lenovo Legion Pro 5 16IRX8 | |
| Asus ROG Flow X16 GV601V | |
| Lenovo LOQ 16IRH8 | |
| AIDA64 / FP32 Ray-Trace | |
| Genomsnitt av klass Gaming (10227 - 85542, n=109, senaste 2 åren) | |
| Genomsnitt AMD Ryzen 7 7840HS (22845 - 28921, n=21) | |
| Lenovo Legion Slim 7 16APH8 | |
| Lenovo Legion Pro 5 16IRX8 | |
| Alienware m16 R1 Intel | |
| Acer Predator Helios 16 PH16-71-731Q | |
| Asus ROG Flow X16 GV601V | |
| Lenovo LOQ 16IRH8 | |
| AIDA64 / FPU Julia | |
| Genomsnitt av klass Gaming (51376 - 238426, n=109, senaste 2 åren) | |
| Lenovo Legion Slim 7 16APH8 | |
| Genomsnitt AMD Ryzen 7 7840HS (97164 - 123167, n=21) | |
| Lenovo Legion Pro 5 16IRX8 | |
| Alienware m16 R1 Intel | |
| Acer Predator Helios 16 PH16-71-731Q | |
| Asus ROG Flow X16 GV601V | |
| Lenovo LOQ 16IRH8 | |
| AIDA64 / CPU SHA3 | |
| Genomsnitt av klass Gaming (2180 - 9817, n=109, senaste 2 åren) | |
| Alienware m16 R1 Intel | |
| Genomsnitt AMD Ryzen 7 7840HS (4293 - 5155, n=21) | |
| Lenovo Legion Slim 7 16APH8 | |
| Lenovo Legion Pro 5 16IRX8 | |
| Acer Predator Helios 16 PH16-71-731Q | |
| Asus ROG Flow X16 GV601V | |
| Lenovo LOQ 16IRH8 | |
| AIDA64 / CPU Queen | |
| Genomsnitt av klass Gaming (49785 - 173351, n=100, senaste 2 åren) | |
| Lenovo Legion Slim 7 16APH8 | |
| Genomsnitt AMD Ryzen 7 7840HS (102271 - 125820, n=21) | |
| Alienware m16 R1 Intel | |
| Acer Predator Helios 16 PH16-71-731Q | |
| Lenovo Legion Pro 5 16IRX8 | |
| Asus ROG Flow X16 GV601V | |
| Lenovo LOQ 16IRH8 | |
| AIDA64 / FPU SinJulia | |
| Lenovo Legion Slim 7 16APH8 | |
| Genomsnitt AMD Ryzen 7 7840HS (13767 - 15525, n=21) | |
| Genomsnitt av klass Gaming (4424 - 33636, n=109, senaste 2 åren) | |
| Alienware m16 R1 Intel | |
| Lenovo Legion Pro 5 16IRX8 | |
| Acer Predator Helios 16 PH16-71-731Q | |
| Asus ROG Flow X16 GV601V | |
| Lenovo LOQ 16IRH8 | |
| AIDA64 / FPU Mandel | |
| Genomsnitt av klass Gaming (25115 - 128721, n=109, senaste 2 åren) | |
| Lenovo Legion Slim 7 16APH8 | |
| Genomsnitt AMD Ryzen 7 7840HS (52084 - 65812, n=21) | |
| Lenovo Legion Pro 5 16IRX8 | |
| Alienware m16 R1 Intel | |
| Acer Predator Helios 16 PH16-71-731Q | |
| Asus ROG Flow X16 GV601V | |
| Lenovo LOQ 16IRH8 | |
| AIDA64 / CPU AES | |
| Alienware m16 R1 Intel | |
| Acer Predator Helios 16 PH16-71-731Q | |
| Genomsnitt AMD Ryzen 7 7840HS (67389 - 177158, n=21) | |
| Genomsnitt av klass Gaming (39258 - 247074, n=109, senaste 2 åren) | |
| Lenovo Legion Pro 5 16IRX8 | |
| Asus ROG Flow X16 GV601V | |
| Lenovo Legion Slim 7 16APH8 | |
| Lenovo LOQ 16IRH8 | |
| AIDA64 / CPU ZLib | |
| Genomsnitt av klass Gaming (574 - 2531, n=109, senaste 2 åren) | |
| Acer Predator Helios 16 PH16-71-731Q | |
| Alienware m16 R1 Intel | |
| Lenovo Legion Pro 5 16IRX8 | |
| Asus ROG Flow X16 GV601V | |
| Lenovo Legion Slim 7 16APH8 | |
| Genomsnitt AMD Ryzen 7 7840HS (944 - 1123, n=21) | |
| Lenovo LOQ 16IRH8 | |
| AIDA64 / FP64 Ray-Trace | |
| Genomsnitt av klass Gaming (5509 - 45446, n=109, senaste 2 åren) | |
| Genomsnitt AMD Ryzen 7 7840HS (12248 - 15599, n=21) | |
| Lenovo Legion Slim 7 16APH8 | |
| Lenovo Legion Pro 5 16IRX8 | |
| Alienware m16 R1 Intel | |
| Acer Predator Helios 16 PH16-71-731Q | |
| Asus ROG Flow X16 GV601V | |
| Lenovo LOQ 16IRH8 | |
| AIDA64 / CPU PhotoWorxx | |
| Genomsnitt av klass Gaming (12271 - 89891, n=109, senaste 2 åren) | |
| Lenovo Legion Slim 7 16APH8 | |
| Asus ROG Flow X16 GV601V | |
| Genomsnitt AMD Ryzen 7 7840HS (17615 - 41516, n=21) | |
| Lenovo Legion Pro 5 16IRX8 | |
| Alienware m16 R1 Intel | |
| Acer Predator Helios 16 PH16-71-731Q | |
| Lenovo LOQ 16IRH8 | |
Systemets prestanda
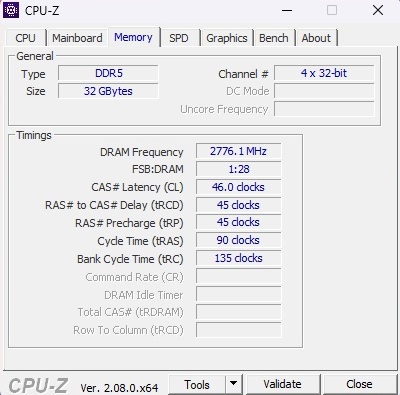
När det gäller systemprestanda konkurrerar Slim 7 enkelt med sina rivaler och får 7 502 poäng i PCMark 10. DDR5-minnet, som är känt för sin exceptionella hastighet, överträffar genomsnittet. Dessutom uppvisar datorn en behaglig och snabb respons i praktiska användningsscenarier.
CrossMark: Overall | Productivity | Creativity | Responsiveness
| PCMark 10 / Score | |
| Genomsnitt av klass Gaming (5828 - 11574, n=95, senaste 2 åren) | |
| Asus ROG Flow X16 GV601V | |
| Genomsnitt AMD Ryzen 7 7840HS, NVIDIA GeForce RTX 4060 Laptop GPU (7502 - 7946, n=4) | |
| Acer Predator Helios 16 PH16-71-731Q | |
| Lenovo Legion Pro 5 16IRX8 | |
| Lenovo Legion Slim 7 16APH8 | |
| Alienware m16 R1 Intel | |
| Lenovo LOQ 16IRH8 | |
| PCMark 10 / Essentials | |
| Asus ROG Flow X16 GV601V | |
| Acer Predator Helios 16 PH16-71-731Q | |
| Lenovo Legion Pro 5 16IRX8 | |
| Genomsnitt AMD Ryzen 7 7840HS, NVIDIA GeForce RTX 4060 Laptop GPU (10441 - 11169, n=4) | |
| Alienware m16 R1 Intel | |
| Genomsnitt av klass Gaming (8810 - 12600, n=99, senaste 2 åren) | |
| Lenovo Legion Slim 7 16APH8 | |
| Lenovo LOQ 16IRH8 | |
| PCMark 10 / Productivity | |
| Acer Predator Helios 16 PH16-71-731Q | |
| Genomsnitt av klass Gaming (6845 - 18766, n=97, senaste 2 åren) | |
| Asus ROG Flow X16 GV601V | |
| Genomsnitt AMD Ryzen 7 7840HS, NVIDIA GeForce RTX 4060 Laptop GPU (9575 - 10273, n=4) | |
| Lenovo Legion Slim 7 16APH8 | |
| Alienware m16 R1 Intel | |
| Lenovo Legion Pro 5 16IRX8 | |
| Lenovo LOQ 16IRH8 | |
| PCMark 10 / Digital Content Creation | |
| Genomsnitt av klass Gaming (7602 - 19657, n=97, senaste 2 åren) | |
| Lenovo Legion Pro 5 16IRX8 | |
| Genomsnitt AMD Ryzen 7 7840HS, NVIDIA GeForce RTX 4060 Laptop GPU (11464 - 12418, n=4) | |
| Lenovo Legion Slim 7 16APH8 | |
| Asus ROG Flow X16 GV601V | |
| Acer Predator Helios 16 PH16-71-731Q | |
| Alienware m16 R1 Intel | |
| Lenovo LOQ 16IRH8 | |
| CrossMark / Overall | |
| Acer Predator Helios 16 PH16-71-731Q | |
| Alienware m16 R1 Intel | |
| Genomsnitt av klass Gaming (1366 - 2409, n=97, senaste 2 åren) | |
| Asus ROG Flow X16 GV601V | |
| Lenovo LOQ 16IRH8 | |
| Genomsnitt AMD Ryzen 7 7840HS, NVIDIA GeForce RTX 4060 Laptop GPU (1800 - 1866, n=3) | |
| Lenovo Legion Pro 5 16IRX8 | |
| CrossMark / Productivity | |
| Acer Predator Helios 16 PH16-71-731Q | |
| Alienware m16 R1 Intel | |
| Lenovo LOQ 16IRH8 | |
| Asus ROG Flow X16 GV601V | |
| Genomsnitt av klass Gaming (1386 - 2254, n=97, senaste 2 åren) | |
| Genomsnitt AMD Ryzen 7 7840HS, NVIDIA GeForce RTX 4060 Laptop GPU (1743 - 1821, n=3) | |
| Lenovo Legion Pro 5 16IRX8 | |
| CrossMark / Creativity | |
| Acer Predator Helios 16 PH16-71-731Q | |
| Alienware m16 R1 Intel | |
| Genomsnitt av klass Gaming (1343 - 2729, n=97, senaste 2 åren) | |
| Asus ROG Flow X16 GV601V | |
| Lenovo LOQ 16IRH8 | |
| Genomsnitt AMD Ryzen 7 7840HS, NVIDIA GeForce RTX 4060 Laptop GPU (1908 - 1966, n=3) | |
| Lenovo Legion Pro 5 16IRX8 | |
| CrossMark / Responsiveness | |
| Acer Predator Helios 16 PH16-71-731Q | |
| Alienware m16 R1 Intel | |
| Lenovo LOQ 16IRH8 | |
| Genomsnitt av klass Gaming (1226 - 2334, n=97, senaste 2 åren) | |
| Asus ROG Flow X16 GV601V | |
| Lenovo Legion Pro 5 16IRX8 | |
| Genomsnitt AMD Ryzen 7 7840HS, NVIDIA GeForce RTX 4060 Laptop GPU (1522 - 1776, n=3) | |
| PCMark 10 Score | 7502 poäng | |
Hjälp | ||
| AIDA64 / Memory Copy | |
| Lenovo Legion Slim 7 16APH8 | |
| Genomsnitt av klass Gaming (21750 - 129946, n=109, senaste 2 åren) | |
| Genomsnitt AMD Ryzen 7 7840HS (30937 - 72158, n=21) | |
| Asus ROG Flow X16 GV601V | |
| Lenovo Legion Pro 5 16IRX8 | |
| Alienware m16 R1 Intel | |
| Acer Predator Helios 16 PH16-71-731Q | |
| Lenovo LOQ 16IRH8 | |
| AIDA64 / Memory Read | |
| Genomsnitt av klass Gaming (22956 - 118858, n=109, senaste 2 åren) | |
| Asus ROG Flow X16 GV601V | |
| Lenovo Legion Pro 5 16IRX8 | |
| Alienware m16 R1 Intel | |
| Acer Predator Helios 16 PH16-71-731Q | |
| Lenovo LOQ 16IRH8 | |
| Lenovo Legion Slim 7 16APH8 | |
| Genomsnitt AMD Ryzen 7 7840HS (30497 - 62147, n=21) | |
| AIDA64 / Memory Write | |
| Lenovo Legion Slim 7 16APH8 | |
| Acer Predator Helios 16 PH16-71-731Q | |
| Genomsnitt AMD Ryzen 7 7840HS (34590 - 93323, n=21) | |
| Genomsnitt av klass Gaming (22297 - 135096, n=109, senaste 2 åren) | |
| Lenovo Legion Pro 5 16IRX8 | |
| Asus ROG Flow X16 GV601V | |
| Alienware m16 R1 Intel | |
| Lenovo LOQ 16IRH8 | |
| AIDA64 / Memory Latency | |
| Lenovo LOQ 16IRH8 | |
| Genomsnitt av klass Gaming (75.3 - 259, n=109, senaste 2 åren) | |
| Genomsnitt AMD Ryzen 7 7840HS (85.1 - 112, n=21) | |
| Asus ROG Flow X16 GV601V | |
| Lenovo Legion Slim 7 16APH8 | |
| Alienware m16 R1 Intel | |
| Acer Predator Helios 16 PH16-71-731Q | |
| Lenovo Legion Pro 5 16IRX8 | |
* ... mindre är bättre
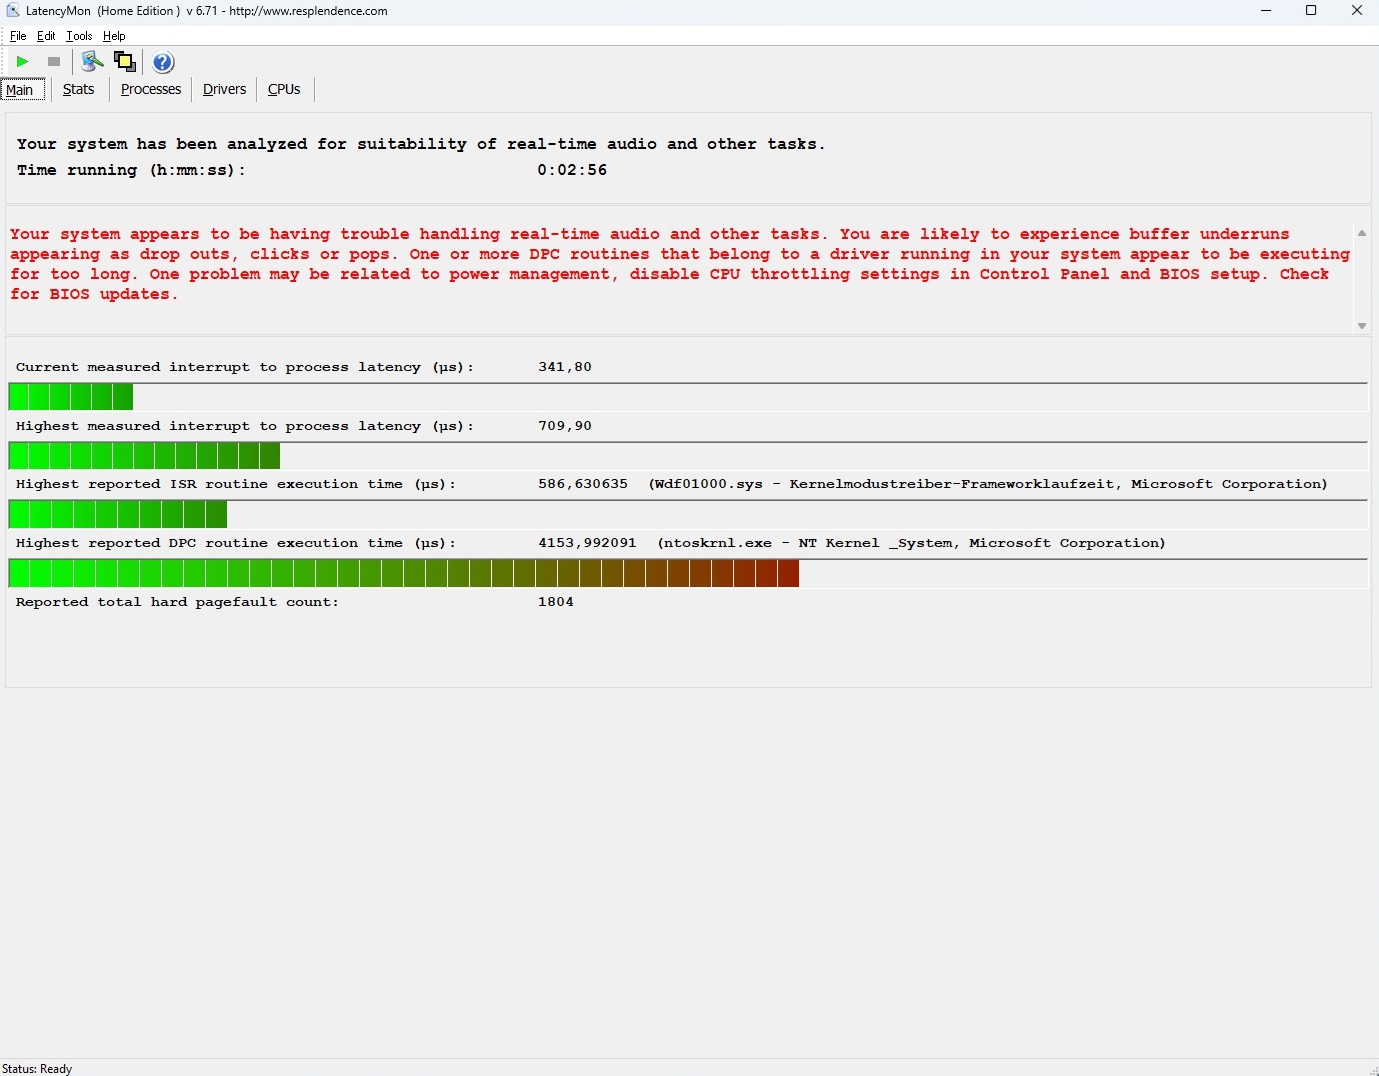
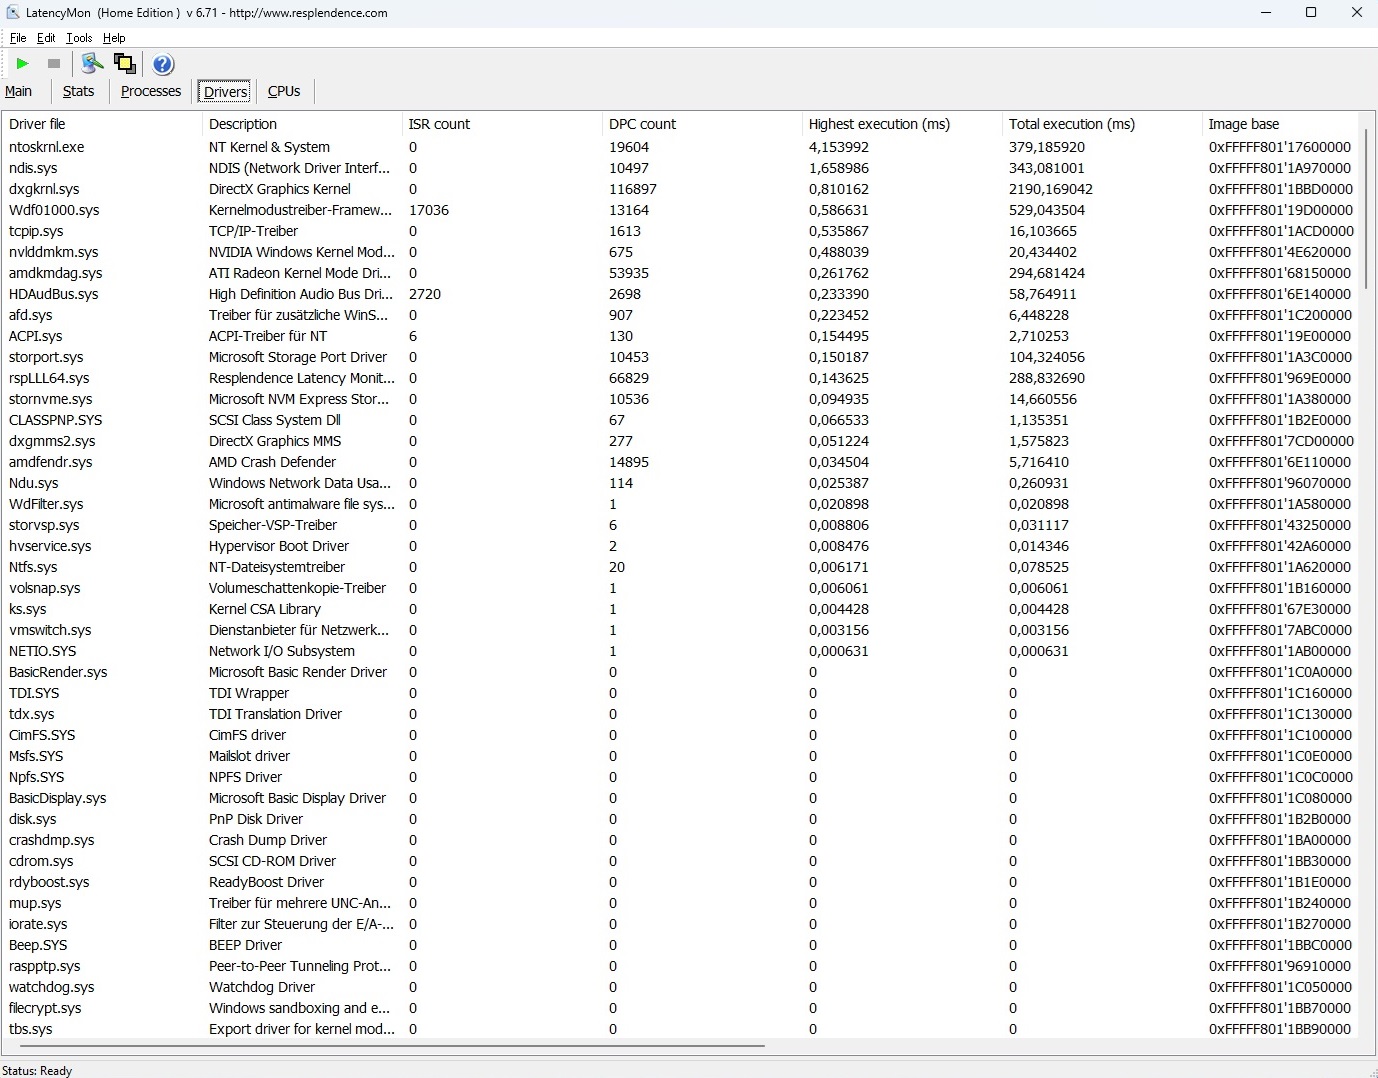
DPC-fördröjning
Även om den har de lägsta latenserna bland 16-tumsenheterna i testet, visar LatencyMon-verktyget möjliga problem med ljud- och videoredigering i realtid.
| DPC Latencies / LatencyMon - interrupt to process latency (max), Web, Youtube, Prime95 | |
| Alienware m16 R1 Intel | |
| Acer Predator Helios 16 PH16-71-731Q | |
| Lenovo LOQ 16IRH8 | |
| Asus ROG Flow X16 GV601V | |
| Lenovo Legion Pro 5 16IRX8 | |
| Lenovo Legion Slim 7 16APH8 | |
* ... mindre är bättre
Lagringsenheter
Den integrerade 1 TB SSD från WDC (modell SN810) ger i allmänhet utmärkt hastighet, men har ibland problem med strypning under långvarig belastning. Dessa problem är dock inte lika allvarliga som de som observerats i Acer Predator Helios 16.

* ... mindre är bättre
Continuous power read: DiskSpd Read Loop, Queue Depth 8
Grafikkort
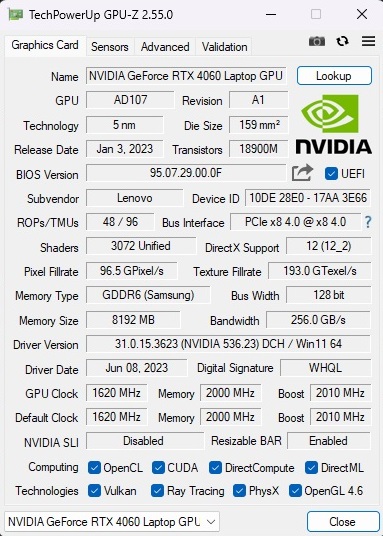
GeForce RTX 4060 är en av de mest populära och framgångsrika GPU:erna för bärbara datorer just nu. Även om denna mellanklassmodell inte är lämplig för UHD-skärmar och kan ha begränsad framtidssäkerhet på grund av sin låga 8 GB GDDR6 VRAM-arkitektur, är dess prestanda för Full HD (FHD) eller Quad HD (QHD) upplösningar ändå anmärkningsvärd.
I syntetiska grafikriktmärken är 3D-prestandan i balanserat läge jämförbar med den genomsnittliga RTX 4060-prestandan hittills, även om den faller något under den för jämförelseenheterna. Noterbart är att Slim 7 inte ens kommer i närheten av att nå den maximala TGP på 140 watt, inklusive Dynamic Boost.
| 3DMark 11 Performance | 30859 poäng | |
| 3DMark Ice Storm Standard Score | 123335 poäng | |
| 3DMark Cloud Gate Standard Score | 60481 poäng | |
| 3DMark Fire Strike Score | 23735 poäng | |
| 3DMark Time Spy Score | 10032 poäng | |
Hjälp | ||
* ... mindre är bättre
Spelprestanda
Benchmarks för spel visar ett liknande mönster. Bortsett från några få mycket krävande spel som Lords of the Fallen eller Alan Wake 2kan de flesta av dem spelas med inbyggd upplösning med höga till maximala inställningar utan problem, även om det inte alltid är garanterat att nå 60 FPS.
| The Witcher 3 - 1920x1080 Ultra Graphics & Postprocessing (HBAO+) | |
| Genomsnitt av klass Gaming (95 - 240, n=8, senaste 2 åren) | |
| Lenovo Legion Pro 5 16IRX8 | |
| Asus ROG Flow X16 GV601V | |
| Alienware m16 R1 Intel | |
| Lenovo LOQ 16IRH8 | |
| Acer Predator Helios 16 PH16-71-731Q | |
| Genomsnitt NVIDIA GeForce RTX 4060 Laptop GPU (77 - 159.7, n=42) | |
| Lenovo Legion Slim 7 16APH8 | |
| Alan Wake 2 | |
| 1920x1080 High Preset | |
| Genomsnitt av klass Gaming (54.6 - 133.2, n=31, senaste 2 åren) | |
| Genomsnitt NVIDIA GeForce RTX 4060 Laptop GPU (53.8 - 64.3, n=3) | |
| XMG Pro 15 E23 | |
| Lenovo Legion Slim 7 16APH8 | |
| 2560x1440 High Preset | |
| Genomsnitt av klass Gaming (31.2 - 93.1, n=33, senaste 2 åren) | |
| XMG Pro 15 E23 | |
| Genomsnitt NVIDIA GeForce RTX 4060 Laptop GPU (33 - 36.7, n=3) | |
| Lenovo Legion Slim 7 16APH8 | |
| Lords of the Fallen | |
| 1920x1080 High Preset | |
| XMG Pro 15 E23 | |
| Genomsnitt NVIDIA GeForce RTX 4060 Laptop GPU (46.7 - 53.9, n=3) | |
| Lenovo Legion Slim 7 16APH8 | |
| 1920x1080 Ultra Preset | |
| XMG Pro 15 E23 | |
| Genomsnitt NVIDIA GeForce RTX 4060 Laptop GPU (32.8 - 38.1, n=3) | |
| Lenovo Legion Slim 7 16APH8 | |
| 2560x1440 Ultra Preset | |
| XMG Pro 15 E23 | |
| Genomsnitt NVIDIA GeForce RTX 4060 Laptop GPU (24.2 - 25.7, n=2) | |
| Lenovo Legion Slim 7 16APH8 | |
| Total War Pharaoh | |
| 1920x1080 High Preset | |
| XMG Pro 15 E23 | |
| Genomsnitt NVIDIA GeForce RTX 4060 Laptop GPU (128 - 149, n=2) | |
| Lenovo Legion Slim 7 16APH8 | |
| Genomsnitt av klass Gaming (47.4 - 200, n=2, senaste 2 åren) | |
| 1920x1080 Ultra Preset | |
| XMG Pro 15 E23 | |
| Genomsnitt NVIDIA GeForce RTX 4060 Laptop GPU (104 - 116, n=2) | |
| Lenovo Legion Slim 7 16APH8 | |
| Genomsnitt av klass Gaming (42.9 - 161.4, n=2, senaste 2 åren) | |
| 2560x1440 Ultra Preset | |
| XMG Pro 15 E23 | |
| Genomsnitt NVIDIA GeForce RTX 4060 Laptop GPU (76 - 81.6, n=2) | |
| Lenovo Legion Slim 7 16APH8 | |
| Genomsnitt av klass Gaming (24.1 - 127.4, n=2, senaste 2 åren) | |
| Assassin's Creed Mirage | |
| 1920x1080 High Preset (Adaptive Quality Off) | |
| XMG Pro 15 E23 | |
| Genomsnitt NVIDIA GeForce RTX 4060 Laptop GPU (76 - 118, n=4) | |
| Lenovo Legion Slim 7 16APH8 | |
| 1920x1080 Ultra High Preset (Adaptive Quality Off) | |
| XMG Pro 15 E23 | |
| Genomsnitt NVIDIA GeForce RTX 4060 Laptop GPU (65 - 93, n=6) | |
| Lenovo Legion Slim 7 16APH8 | |
| 2560x1440 Ultra High Preset (Adaptive Quality Off) | |
| XMG Pro 15 E23 | |
| Genomsnitt NVIDIA GeForce RTX 4060 Laptop GPU (64 - 72, n=5) | |
| Lenovo Legion Slim 7 16APH8 | |
| EA Sports FC 24 | |
| 1920x1080 High Preset | |
| Lenovo Legion Slim 7 16APH8 | |
| XMG Pro 15 E23 | |
| Genomsnitt NVIDIA GeForce RTX 4060 Laptop GPU (142.9 - 155.2, n=3) | |
| 1920x1080 Ultra Preset | |
| XMG Pro 15 E23 | |
| Genomsnitt NVIDIA GeForce RTX 4060 Laptop GPU (136.9 - 138, n=3) | |
| Lenovo Legion Slim 7 16APH8 | |
| Genomsnitt av klass Gaming (n=1senaste 2 åren) | |
| 2560x1440 Ultra Preset | |
| XMG Pro 15 E23 | |
| Genomsnitt NVIDIA GeForce RTX 4060 Laptop GPU (117.5 - 121, n=2) | |
| Lenovo Legion Slim 7 16APH8 | |
Under det 60 minuter långa testet med Den Witcher 3observerades inga avvikelser. Bildhastigheten förblev relativt stabil under hela testperioden.
Witcher 3 FPS chart
| låg | med. | hög | ultra | QHD | |
|---|---|---|---|---|---|
| GTA V (2015) | 172.9 | 166 | 103.2 | ||
| The Witcher 3 (2015) | 98 | ||||
| Dota 2 Reborn (2015) | 161.6 | 159.2 | 140.6 | 134.7 | |
| X-Plane 11.11 (2018) | 116 | 103.5 | 81.6 | ||
| Strange Brigade (2018) | 258 | 208 | 180.8 | ||
| Atomic Heart (2023) | 122.1 | 82.7 | 64.9 | 50.7 | |
| Company of Heroes 3 (2023) | 156 | 122 | 120 | 92 | |
| Sons of the Forest (2023) | 83.8 | 80.2 | 78.8 | 64.2 | |
| Resident Evil 4 Remake (2023) | 98.4 | 92.1 | 64.4 | 55.1 | |
| Armored Core 6 (2023) | 104.5 | 103.1 | 95.6 | 73.2 | |
| Baldur's Gate 3 (2023) | 98.7 | 84.8 | 82.6 | 55.8 | |
| EA Sports FC 24 (2023) | 187.9 | 155.2 | 136.9 | 117.5 | |
| Assassin's Creed Mirage (2023) | 80 | 76 | 65 | 64 | |
| Total War Pharaoh (2023) | 193 | 128 | 104 | 76 | |
| Lords of the Fallen (2023) | 66.4 | 48.2 | 33.2 | 24.2 | |
| Alan Wake 2 (2023) | 58.5 | 53.8 | 33.8 |
Utsläpp
Buller från systemet
Den har de lägsta ljudnivåerna i testfältet, med ljudnivåer från 33 till 49 dB(A) i 3D-läge. För ljudkänsliga spelare rekommenderar vi att du väljer det tysta läget, som ger minimal prestandaförlust samtidigt som arbetsljudet sänks dramatiskt (se tabellen för specifika testförhållanden). Fläktarna är ibland helt tysta i viloläge, och även när de är aktiva hålls det genererade bullret till ett minimum. Det är värt att nämna att vår testenhet inte visade några tecken på att spolen gnisslade.
Ljudnivå
| Låg belastning |
| 25 / 28 / 31 dB(A) |
| Hög belastning |
| 33 / 49 dB(A) |
 | ||
30 dB tyst 40 dB(A) hörbar 50 dB(A) högt ljud |
||
min: | ||
| Lenovo Legion Slim 7 16APH8 R7 7840HS, GeForce RTX 4060 Laptop GPU | Asus ROG Flow X16 GV601V i9-13900H, GeForce RTX 4060 Laptop GPU | Alienware m16 R1 Intel i7-13700HX, GeForce RTX 4060 Laptop GPU | Acer Predator Helios 16 PH16-71-731Q i7-13700HX, GeForce RTX 4060 Laptop GPU | Lenovo Legion Pro 5 16IRX8 i7-13700HX, GeForce RTX 4060 Laptop GPU | Lenovo LOQ 16IRH8 i7-13620H, GeForce RTX 4060 Laptop GPU | |
|---|---|---|---|---|---|---|
| Noise | 3% | -8% | -0% | 4% | -6% | |
| av / miljö * (dB) | 24 | 24 -0% | 25 -4% | 24 -0% | 23 4% | 23 4% |
| Idle Minimum * (dB) | 25 | 24 4% | 25 -0% | 24 4% | 23.1 8% | 23 8% |
| Idle Average * (dB) | 28 | 24 14% | 26 7% | 24 14% | 23.1 17% | 23 18% |
| Idle Maximum * (dB) | 31 | 24 23% | 27 13% | 32.32 -4% | 26.6 14% | 27.66 11% |
| Load Average * (dB) | 33 | 36.71 -11% | 52 -58% | 36.66 -11% | 34.7 -5% | 53.62 -62% |
| Witcher 3 ultra * (dB) | 47 | 50.92 -8% | 51 -9% | 49.06 -4% | 47.6 -1% | 53.5 -14% |
| Load Maximum * (dB) | 49 | 50.92 -4% | 53 -8% | 49.49 -1% | 54.8 -12% | 53.5 -9% |
* ... mindre är bättre
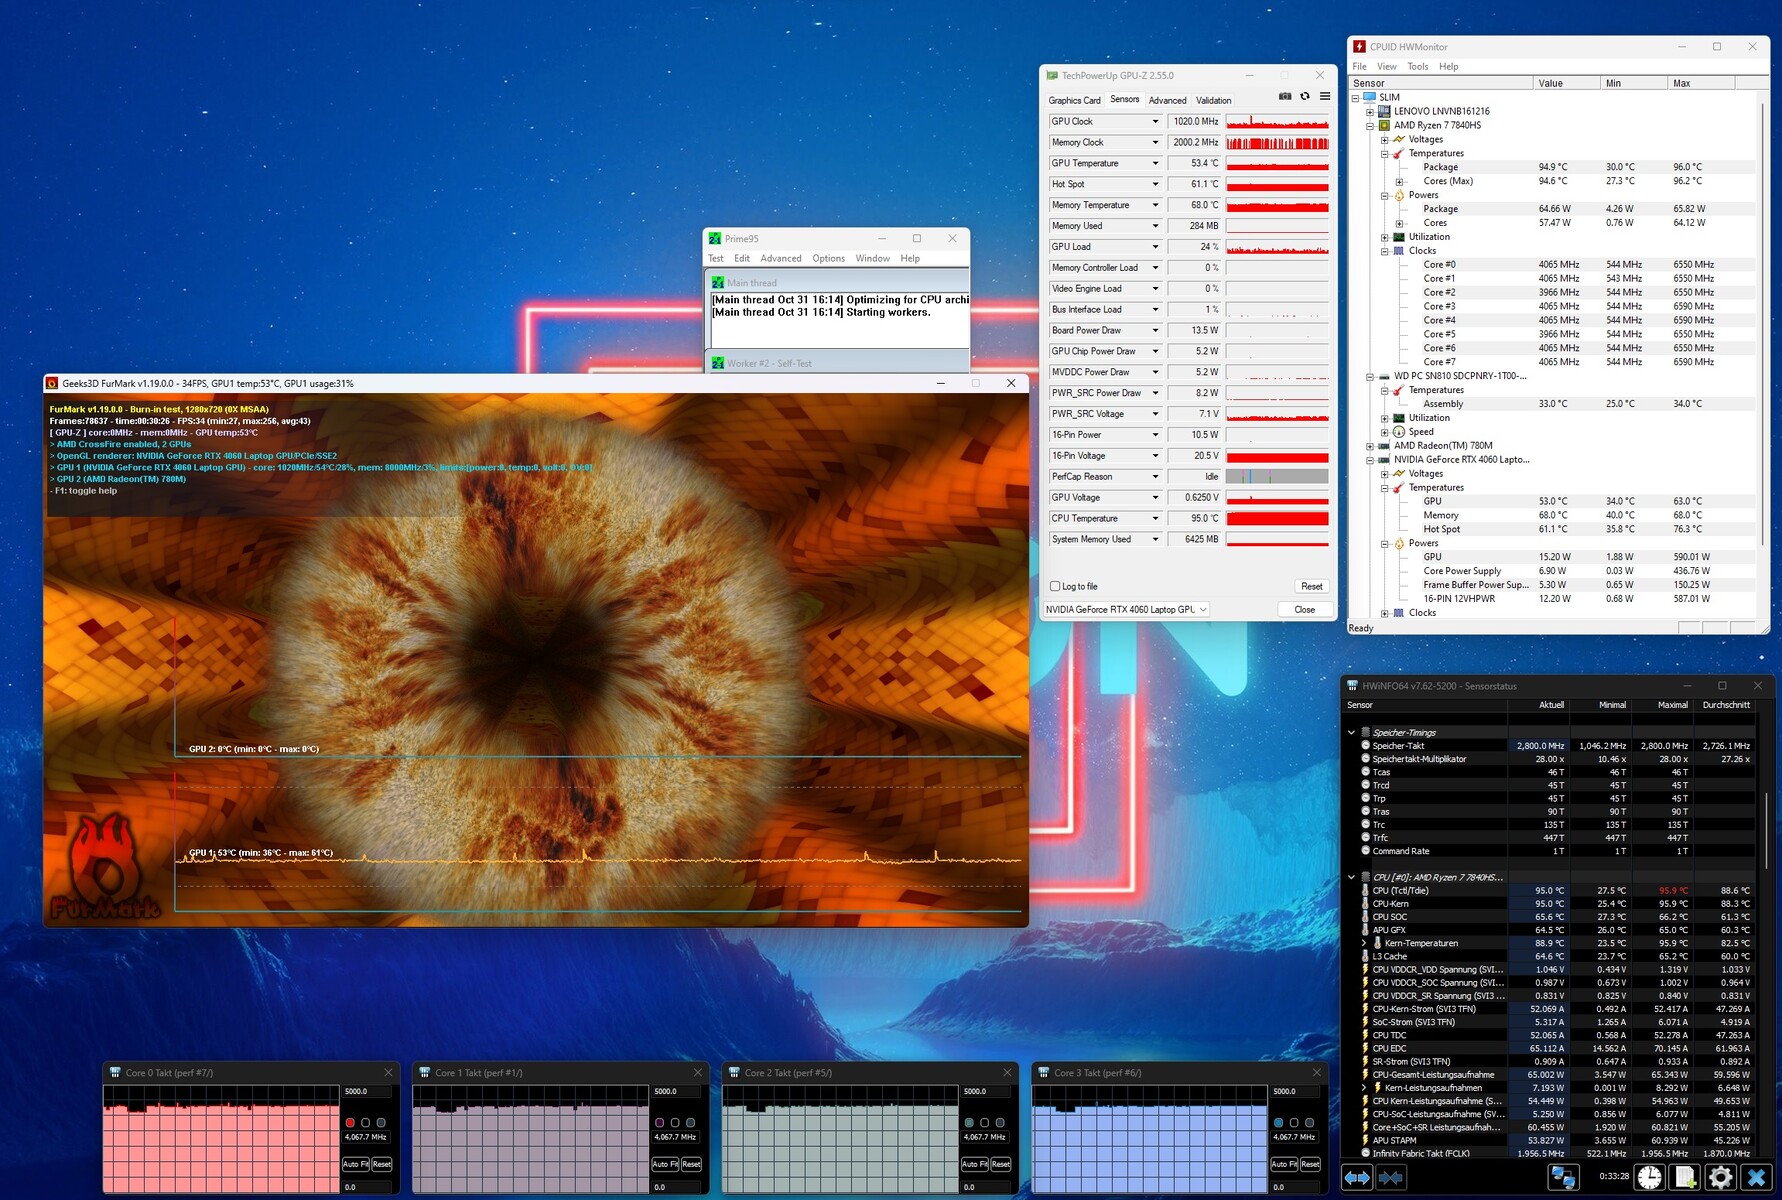
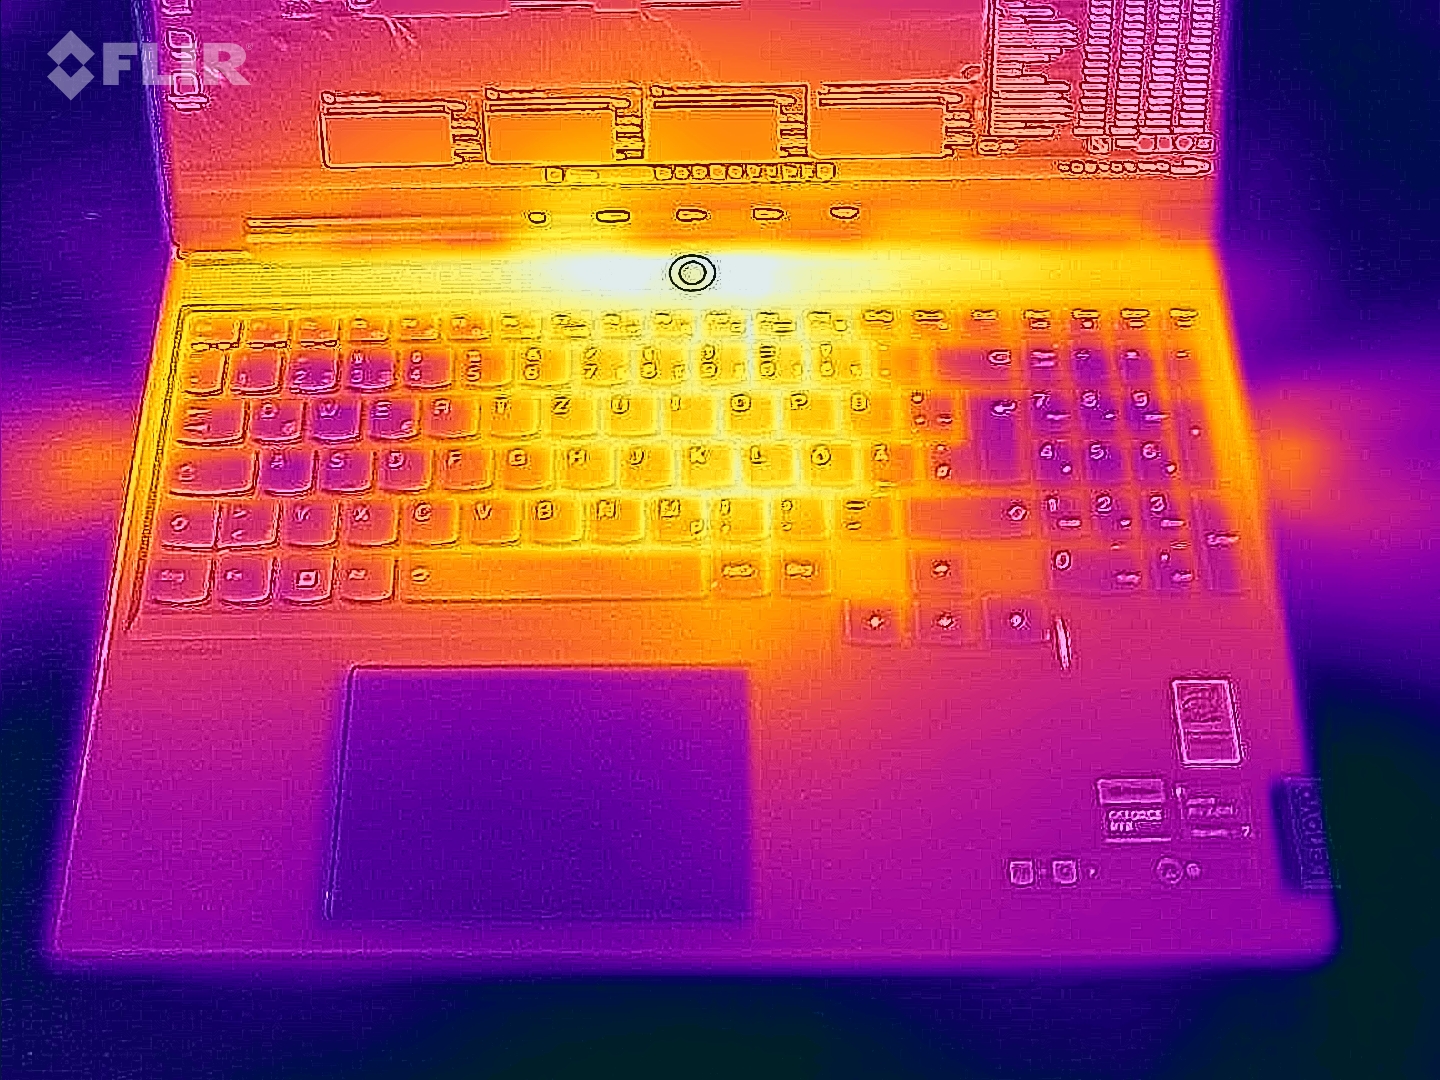
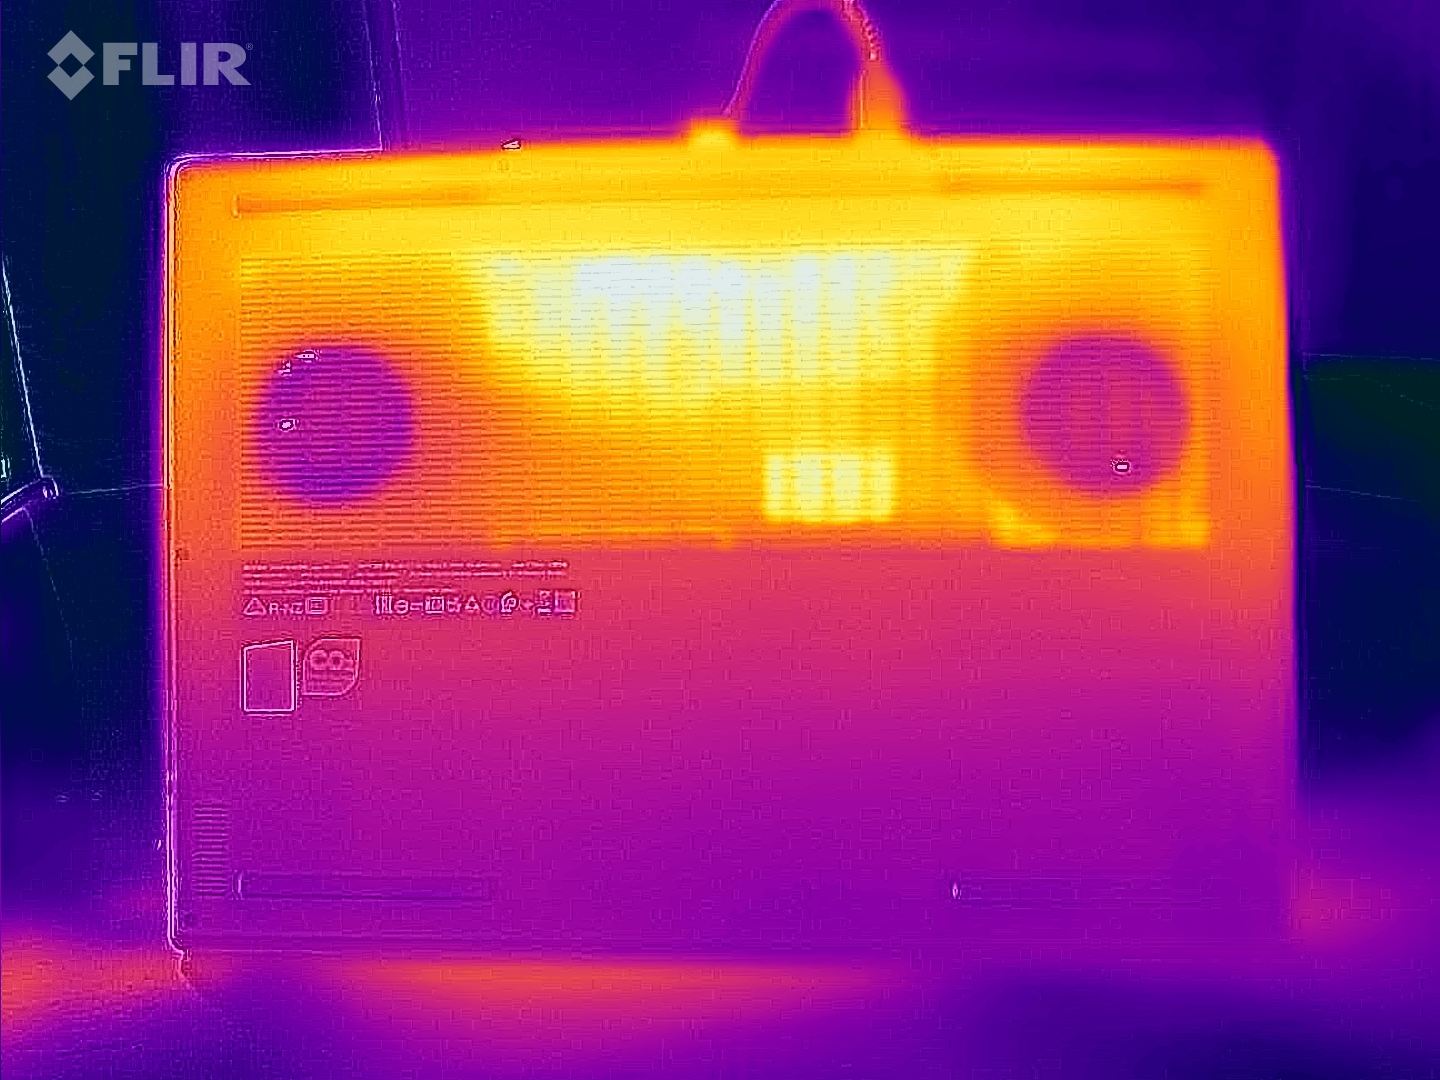
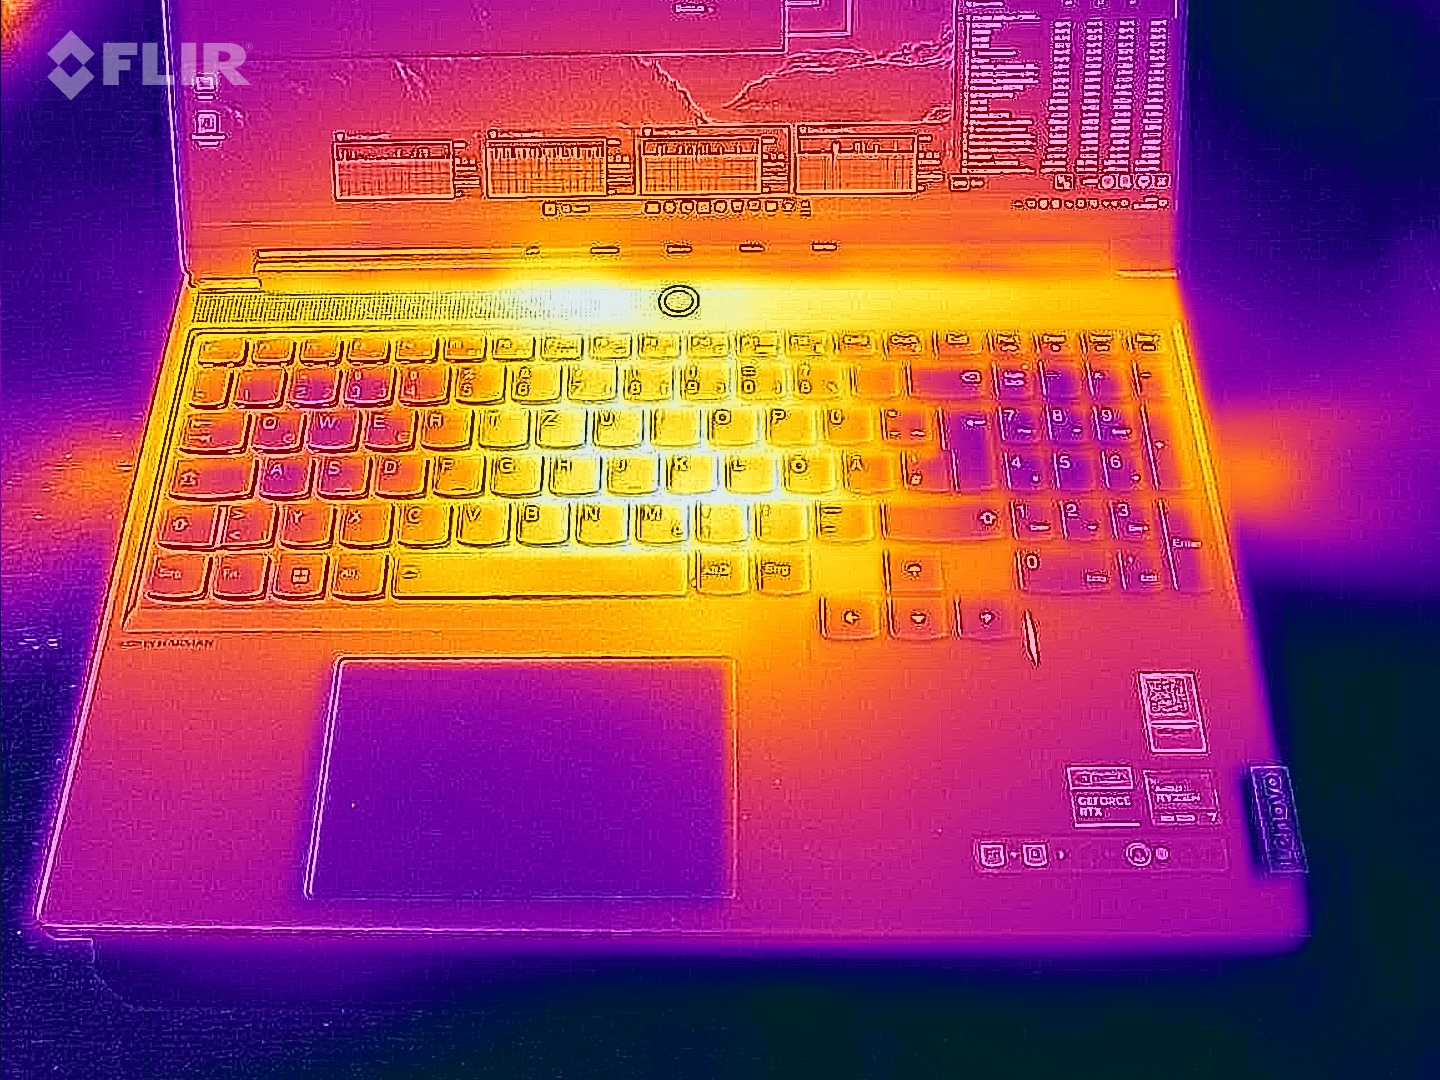
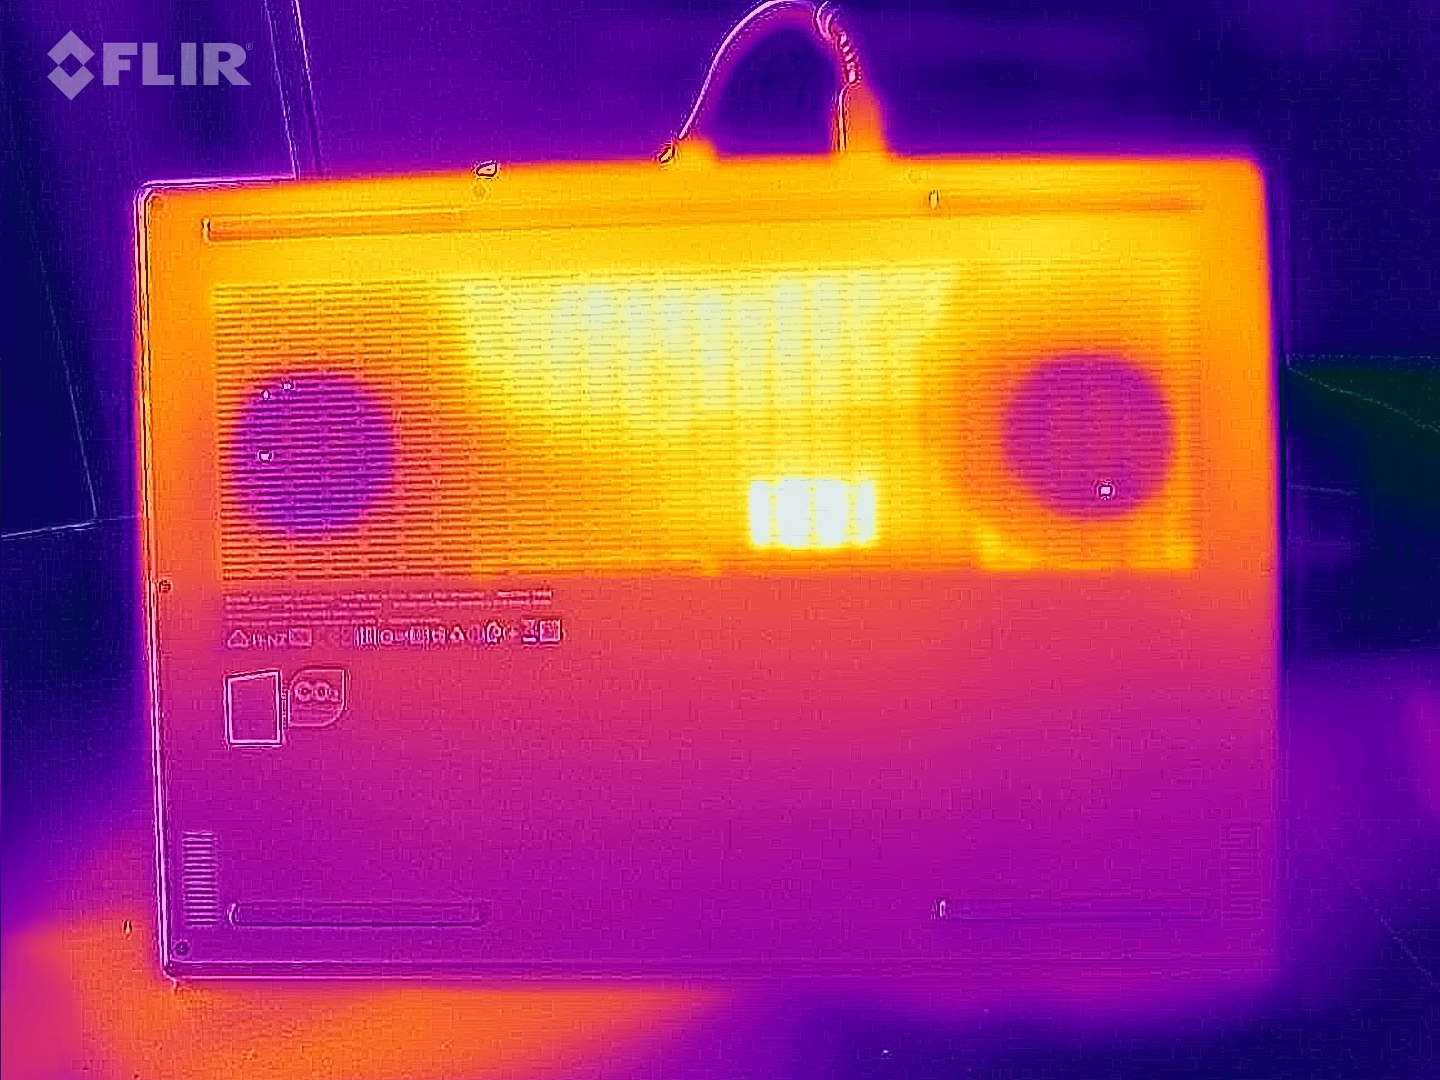
Temperatur
Temperaturen inuti chassit ligger inom mellanområdet och når inte exceptionellt låga eller höga nivåer. Under stresstester med Furmark- och Prime95-verktygen gasade grafikkortet, vilket ledde till att de högsta temperaturerna observerades i spelläge. Efter 60 minuters körning av The Witcher 3 nådde chassit en maxtemperatur på 49°C på ovansidan och 52°C på undersidan, vilket är typiska värden för en bärbar speldator. I viloläge ligger yttemperaturen i genomsnitt på 30°C, vilket indikerar en måttlig värmenivå.
(-) Den maximala temperaturen på ovansidan är 46 °C / 115 F, jämfört med genomsnittet av 40.4 °C / 105 F , allt från 21.2 till 68.8 °C för klassen Gaming.
(-) Botten värms upp till maximalt 46 °C / 115 F, jämfört med genomsnittet av 43.2 °C / 110 F
(+) Vid tomgångsbruk är medeltemperaturen för ovansidan 30.3 °C / 87 F, jämfört med enhetsgenomsnittet på 33.9 °C / ### class_avg_f### F.
(-) När du spelar The Witcher 3 är medeltemperaturen för ovansidan 41.6 °C / 107 F, jämfört med enhetsgenomsnittet på 33.9 °C / ## #class_avg_f### F.
(+) Handledsstöden och pekplattan når maximal hudtemperatur (35 °C / 95 F) och är därför inte varma.
(-) Medeltemperaturen för handledsstödsområdet på liknande enheter var 28.8 °C / 83.8 F (-6.2 °C / -11.2 F).
| Lenovo Legion Slim 7 16APH8 R7 7840HS, GeForce RTX 4060 Laptop GPU | Asus ROG Flow X16 GV601V i9-13900H, GeForce RTX 4060 Laptop GPU | Alienware m16 R1 Intel i7-13700HX, GeForce RTX 4060 Laptop GPU | Acer Predator Helios 16 PH16-71-731Q i7-13700HX, GeForce RTX 4060 Laptop GPU | Lenovo Legion Pro 5 16IRX8 i7-13700HX, GeForce RTX 4060 Laptop GPU | Lenovo LOQ 16IRH8 i7-13620H, GeForce RTX 4060 Laptop GPU | |
|---|---|---|---|---|---|---|
| Heat | 1% | -12% | -13% | 2% | 0% | |
| Maximum Upper Side * (°C) | 46 | 46 -0% | 49 -7% | 41 11% | 42.8 7% | 48 -4% |
| Maximum Bottom * (°C) | 46 | 41 11% | 48 -4% | 66 -43% | 50 -9% | 59 -28% |
| Idle Upper Side * (°C) | 33 | 36 -9% | 40 -21% | 36 -9% | 29.6 10% | 28 15% |
| Idle Bottom * (°C) | 34 | 33 3% | 39 -15% | 37 -9% | 34 -0% | 28 18% |
* ... mindre är bättre
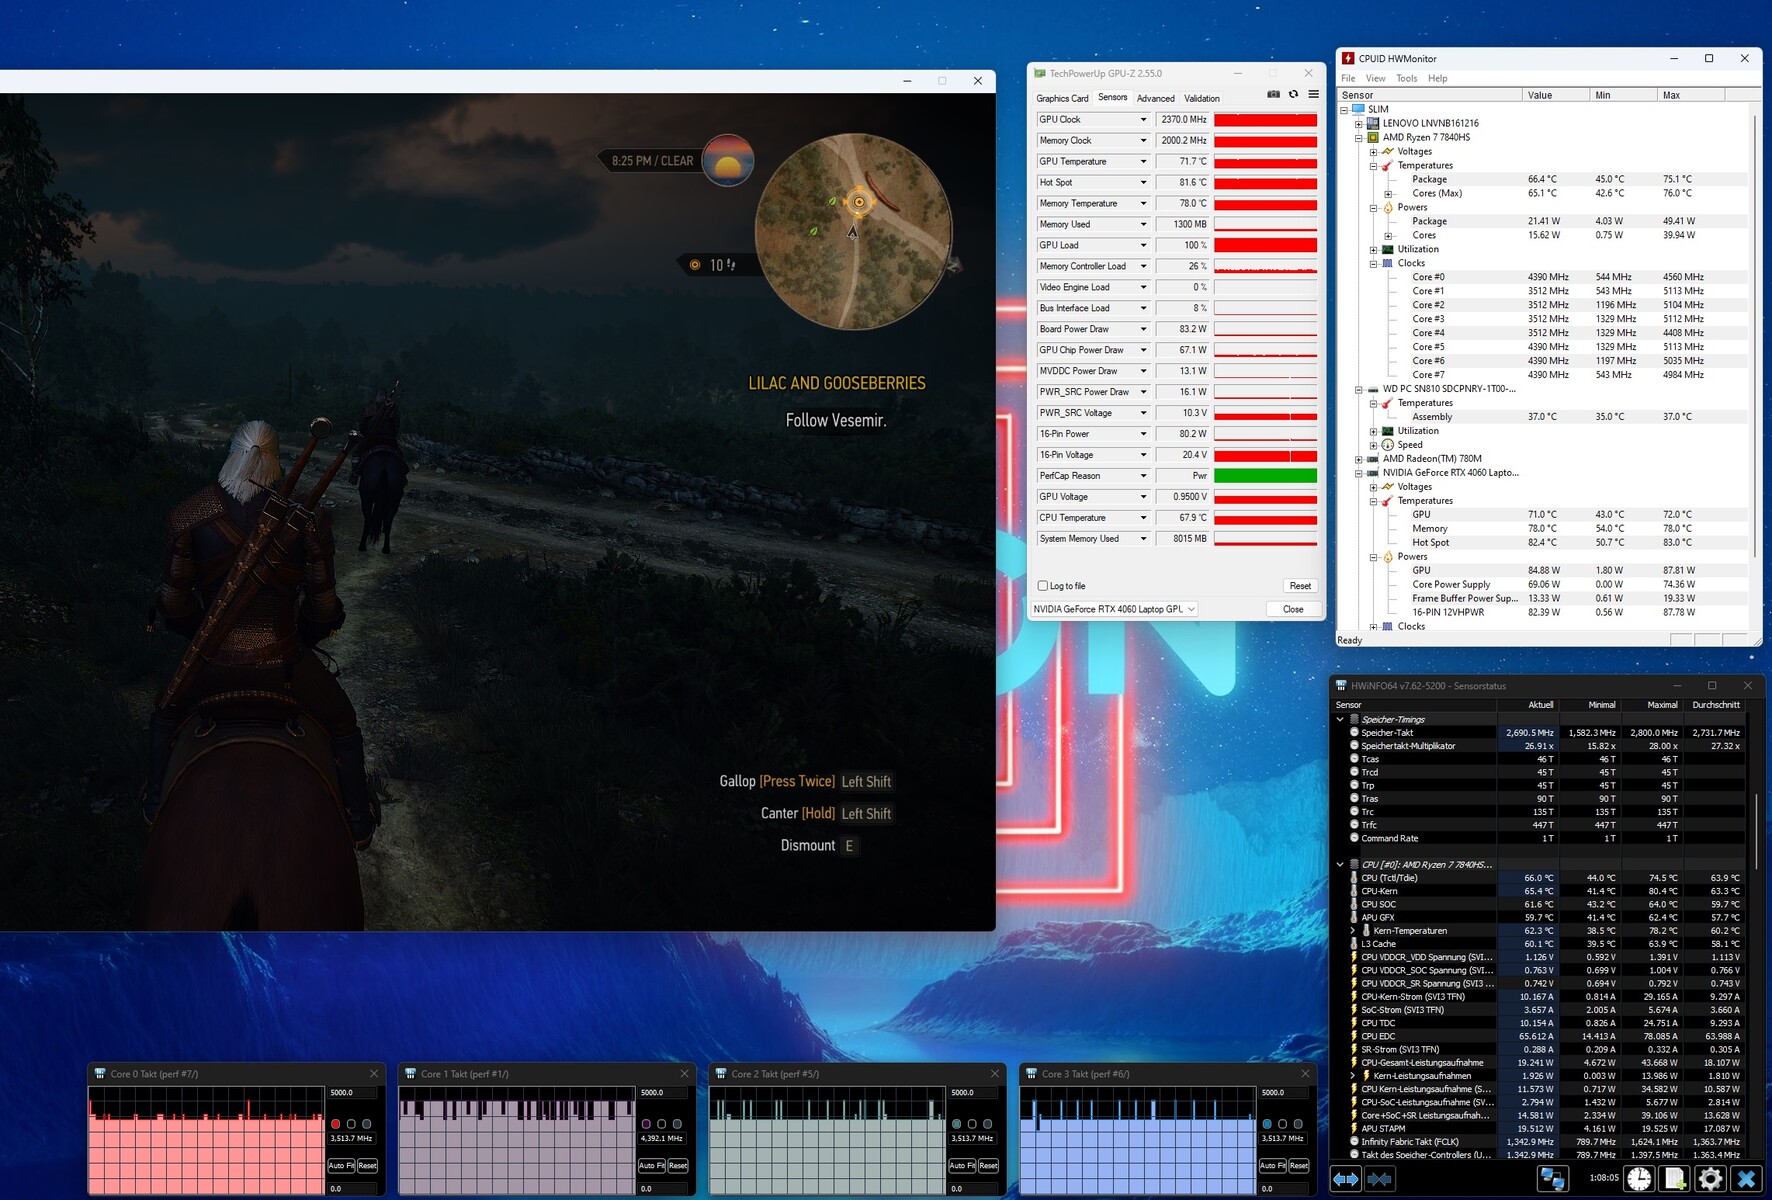
Stresstest
CPU:n blev ganska varm under vårt 60-minuters stresstest. Även om Ryzen 7 7840HS nådde 95°C höll den en konstant temperatur på 4,1 GHz. I spelläget är situationen betydligt mer avslappnad. När vi spelade The Witcher 3 låg CPU-temperaturen på 66°C, medan grafikkortstemperaturen låg kvar i det gröna området på strax under 72°C.
Högtalare
Ljudkvaliteten överträffar den hos de flesta konkurrenter. 2.0-systemet (Harman) producerar ett robust ljud som kan vara behagligt högt om det behövs. I likhet med de flesta bärbara datorer är basen dock något bristfällig.
Lenovo Legion Slim 7 16APH8 ljudanalys
(+) | högtalare kan spela relativt högt (87 dB)
Bas 100 - 315 Hz
(±) | reducerad bas - i genomsnitt 13.8% lägre än medianen
(±) | linjäriteten för basen är genomsnittlig (8.5% delta till föregående frekvens)
Mellan 400 - 2000 Hz
(+) | balanserad mellan - endast 1.1% från medianen
(+) | mids är linjära (2.5% delta till föregående frekvens)
Högsta 2 - 16 kHz
(+) | balanserade toppar - endast 4.1% från medianen
(+) | toppar är linjära (4.8% delta till föregående frekvens)
Totalt 100 - 16 000 Hz
(+) | det totala ljudet är linjärt (9.9% skillnad mot median)
Jämfört med samma klass
» 5% av alla testade enheter i den här klassen var bättre, 2% liknande, 94% sämre
» Den bästa hade ett delta på 6%, genomsnittet var 18%, sämst var 132%
Jämfört med alla testade enheter
» 4% av alla testade enheter var bättre, 1% liknande, 95% sämre
» Den bästa hade ett delta på 4%, genomsnittet var 24%, sämst var 134%
Asus ROG Flow X16 GV601V ljudanalys
(±) | högtalarljudstyrkan är genomsnittlig men bra (77.38 dB)
Bas 100 - 315 Hz
(±) | reducerad bas - i genomsnitt 9.6% lägre än medianen
(±) | linjäriteten för basen är genomsnittlig (9.2% delta till föregående frekvens)
Mellan 400 - 2000 Hz
(+) | balanserad mellan - endast 4.7% från medianen
(±) | linjäriteten för mids är genomsnittlig (7.5% delta till föregående frekvens)
Högsta 2 - 16 kHz
(+) | balanserade toppar - endast 2.2% från medianen
(+) | toppar är linjära (6.1% delta till föregående frekvens)
Totalt 100 - 16 000 Hz
(+) | det totala ljudet är linjärt (12% skillnad mot median)
Jämfört med samma klass
» 12% av alla testade enheter i den här klassen var bättre, 4% liknande, 84% sämre
» Den bästa hade ett delta på 6%, genomsnittet var 18%, sämst var 132%
Jämfört med alla testade enheter
» 9% av alla testade enheter var bättre, 2% liknande, 88% sämre
» Den bästa hade ett delta på 4%, genomsnittet var 24%, sämst var 134%
Energiförvaltning
Strömförbrukning
Strömförbrukningen verkar ibland vara inkonsekvent. Trots aktiv grafikväxling är tomgångsförbrukningen på 33 till 45 watt högre än genomsnittet. I 3DMark 06 är dock strömförbrukningen på cirka 59 watt mycket låg. Dessutom är resultaten från The Witcher 3 (131 watt) och stresstestet (maximalt 177 watt) lägre än konkurrenternas, vilket visar att Zen 4 CPU är energieffektiv, åtminstone under belastning.
| Av/Standby | |
| Låg belastning | |
| Hög belastning |
|
Förklaring:
min: | |
| Lenovo Legion Slim 7 16APH8 R7 7840HS, GeForce RTX 4060 Laptop GPU | Asus ROG Flow X16 GV601V i9-13900H, GeForce RTX 4060 Laptop GPU | Alienware m16 R1 Intel i7-13700HX, GeForce RTX 4060 Laptop GPU | Acer Predator Helios 16 PH16-71-731Q i7-13700HX, GeForce RTX 4060 Laptop GPU | Lenovo Legion Pro 5 16IRX8 i7-13700HX, GeForce RTX 4060 Laptop GPU | Lenovo LOQ 16IRH8 i7-13620H, GeForce RTX 4060 Laptop GPU | Genomsnitt av klass Gaming | |
|---|---|---|---|---|---|---|---|
| Power Consumption | 14% | -7% | -4% | -13% | 8% | 5% | |
| Idle Minimum * (Watt) | 33 | 9.6 71% | 10 70% | 15.9 52% | 24.5 26% | 17.2 48% | 13.2 ? 60% |
| Idle Average * (Watt) | 35 | 16 54% | 14 60% | 20.5 41% | 29.2 17% | 19.3 45% | 18.9 ? 46% |
| Idle Maximum * (Watt) | 45 | 16.9 62% | 21 53% | 20.9 54% | 34.3 24% | 21.2 53% | 24.3 ? 46% |
| Load Average * (Watt) | 59 | 104 -76% | 119 -102% | 106 -80% | 98.7 -67% | 90 -53% | 108 ? -83% |
| Witcher 3 ultra * (Watt) | 131 | 142 -8% | 186.7 -43% | 175 -34% | 178.6 -36% | 168 -28% | |
| Load Maximum * (Watt) | 177 | 214 -21% | 323 -82% | 276 -56% | 249.6 -41% | 211 -19% | 254 ? -44% |
* ... mindre är bättre
Power consumption Witcher 3 / stress test
Power consumption with external monitor
Batteritid
Med tanke på det stora batteriet på 99,9 Wh slår inte drifttiden några rekord. Cirka 7 timmars internetsurfande med sänkt ljusstyrka till 150 cd/m2 är bra, men med tanke på batteristorleken kan det vara betydligt bättre. Ändå säkrar den den andra platsen i testfältet, precis bakom Asus ROG Flow X16.
| Lenovo Legion Slim 7 16APH8 R7 7840HS, GeForce RTX 4060 Laptop GPU, 99.9 Wh | Asus ROG Flow X16 GV601V i9-13900H, GeForce RTX 4060 Laptop GPU, 90 Wh | Alienware m16 R1 Intel i7-13700HX, GeForce RTX 4060 Laptop GPU, 86 Wh | Acer Predator Helios 16 PH16-71-731Q i7-13700HX, GeForce RTX 4060 Laptop GPU, 90 Wh | Lenovo Legion Pro 5 16IRX8 i7-13700HX, GeForce RTX 4060 Laptop GPU, 80 Wh | Lenovo LOQ 16IRH8 i7-13620H, GeForce RTX 4060 Laptop GPU, 80 Wh | Genomsnitt av klass Gaming | |
|---|---|---|---|---|---|---|---|
| Batteridrifttid | 11% | -32% | -21% | -52% | -11% | -1% | |
| WiFi v1.3 (h) | 7.1 | 7.9 11% | 4.8 -32% | 5.6 -21% | 3.4 -52% | 6.3 -11% | 7.02 ? -1% |
| H.264 (h) | 8.9 | 5.6 | 4.8 | 6.4 | 8.26 ? | ||
| Load (h) | 1.5 | 1 | 1.5 | 0.7 | 1.5 | 1.47 ? | |
| Reader / Idle (h) | 6.4 | 6.7 | 8.71 ? | ||||
| Witcher 3 ultra (h) | 1.5 |
För
Emot
Dom

AMD-versionen av den bärbara datorn rekommenderas varmt, precis som sin Intel-motsvarighet.
Synergin mellan Ryzen 7 7840HS och GeForce RTX 4060 ger smidig prestanda, vilket möjliggör höga till maximala inställningar med en upplösning på 2 560 x 1 600 pixlar.
Skärmen på 240 Hz utmärker sig inte bara för sin höga ljusstyrka, utan även för sin synlighet i utomhusmiljöer. Den bärbara datorns hölje utmärker sig i olika avseenden, inklusive anslutningar, stabilitet, design och materialkvalitet. Trots sin storlek på 16 tum är den ganska lätt (4,6 lbs). Den har också väl genomtänkta inmatningsenheter och utmärkt ljudkvalitet.
Även om det finns små brister, såsom något högre strömförbrukning i viloläge och enstaka SSD-strypning över tid, distraherar dessa brister inte avsevärt från den övergripande utmärkta upplevelsen. Den bärbara datorn får därför ett mycket bra helhetsbetyg.
Det är värt att nämna att tävlingen, till exempel Asus ROG Flow X16också ger utmärkt prestanda, men till ett högre pris, vilket gör vårt förslag ännu mer frestande.
Pris och tillgänglighet
Den testade Lenovo Legion Slim 7 16APH8 är tillgänglig för cirka 1750 USD på Amazon.
Lenovo Legion Slim 7 16APH8
- 11/03/2023 v7 (old)
Florian Glaser
Genomskinlighet
Valet av enheter som ska granskas görs av vår redaktion. Testprovet gavs till författaren som ett lån av tillverkaren eller återförsäljaren för denna recension. Långivaren hade inget inflytande på denna recension och inte heller fick tillverkaren en kopia av denna recension innan publiceringen. Det fanns ingen skyldighet att publicera denna recension. Som ett oberoende medieföretag är Notebookcheck inte föremål för auktoritet från tillverkare, återförsäljare eller förlag.
This is how Notebookcheck is testingEvery year, Notebookcheck independently reviews hundreds of laptops and smartphones using standardized procedures to ensure that all results are comparable. We have continuously developed our test methods for around 20 years and set industry standards in the process. In our test labs, high-quality measuring equipment is utilized by experienced technicians and editors. These tests involve a multi-stage validation process. Our complex rating system is based on hundreds of well-founded measurements and benchmarks, which maintains objectivity.
Price comparison

