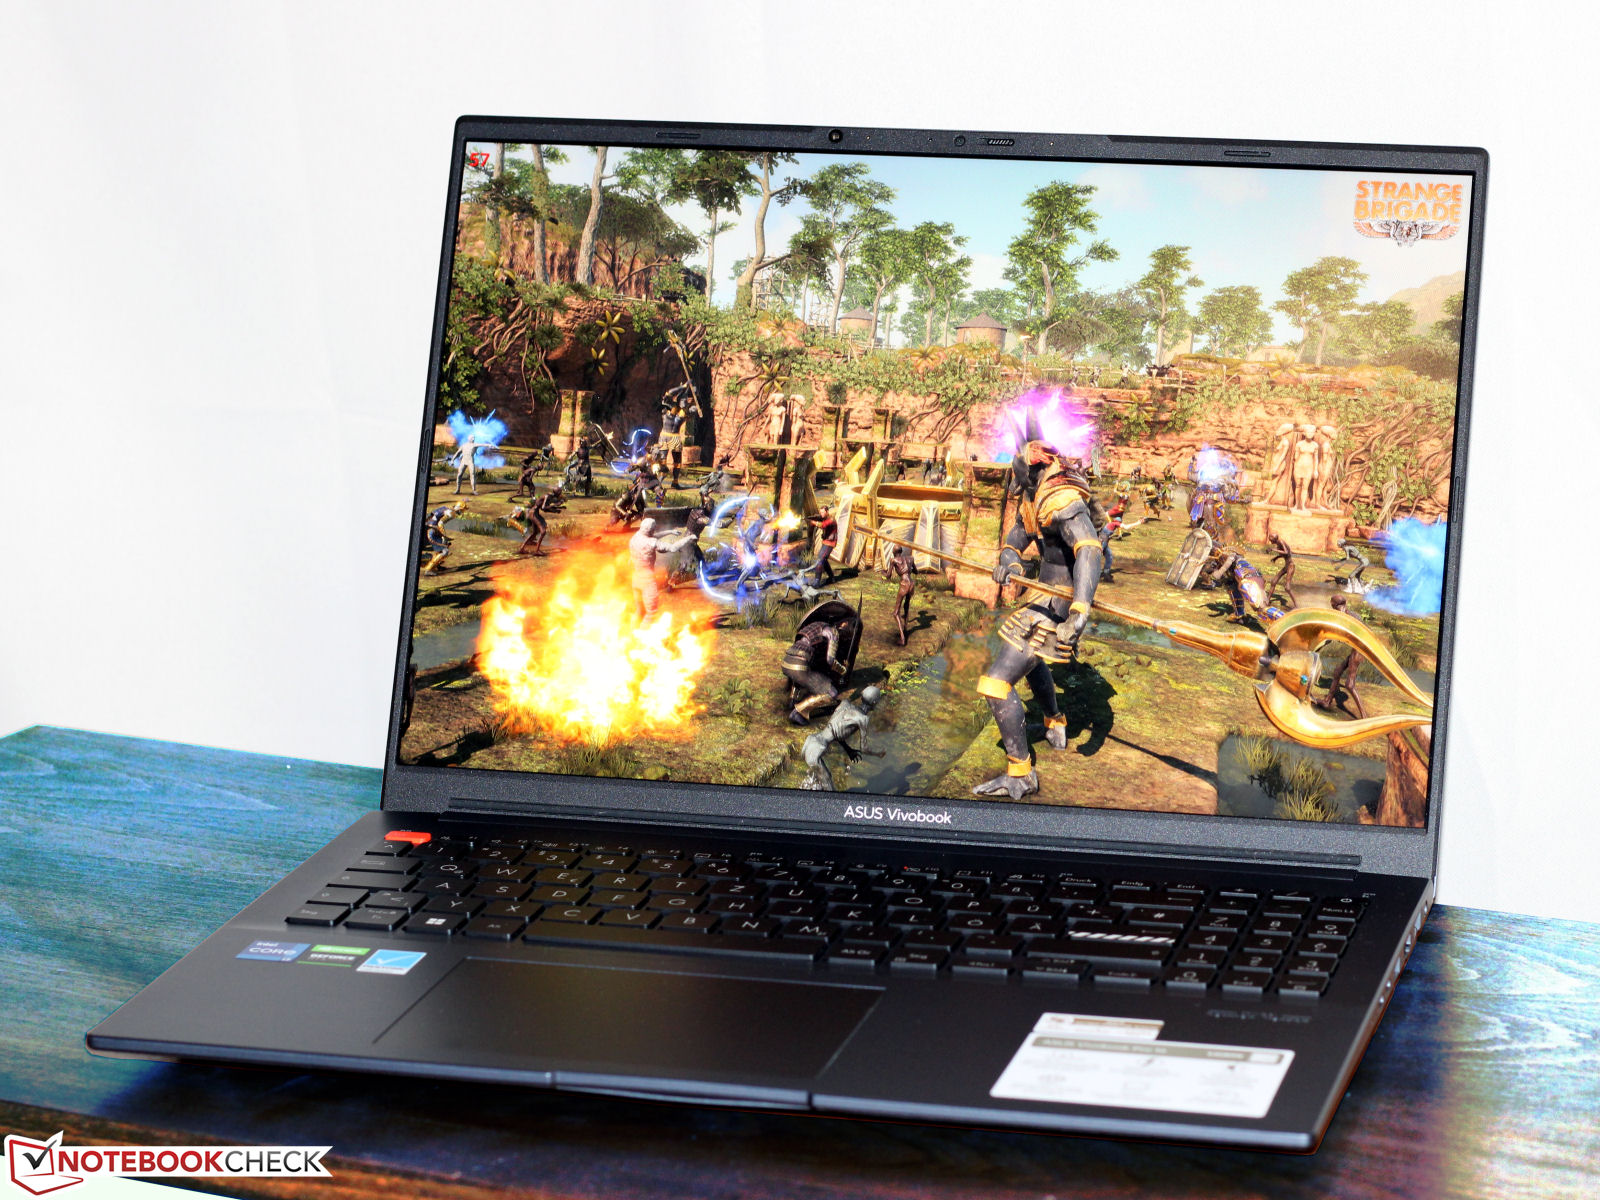
Recension av Asus VivoBook Pro 16: En bärbar multimediebärare med Core i7, RTX 3050 Ti och DCI-P3
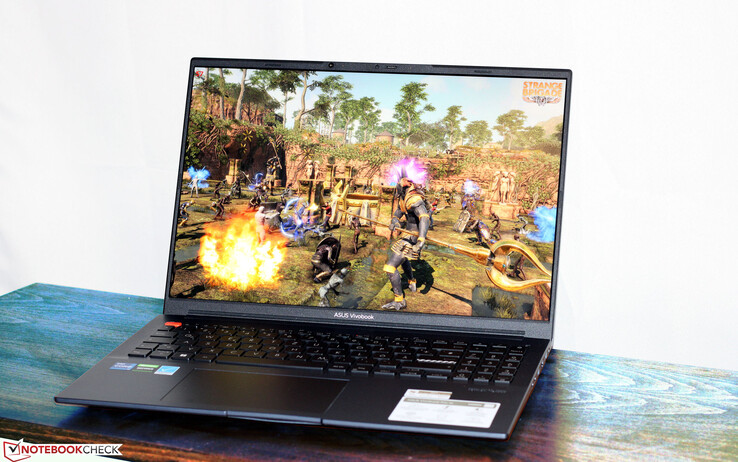
Asus VivoBook är en bärbar 16-tums bärbar dator för spelare och kreativa arbetare. Den bärbara datorn levereras med passande hårdvara: ACore i7-12700H,GeForce RTX 3050 Tioch en ljusstark IPS-skärm i 16:10-format som har bra färgprecision. Den här bärbara datorn liknarVivoBook Pro 16X som vi tidigare testat - men de är inte byggda på samma sätt. Konkurrenter till den här bärbara datorn är t.ex Dell Inspiron 16 Plus 7620, denXMG Fusion 15 (Mid 22)ochAcer Swift X 16.
Potentiella konkurrenter i jämförelse
Gradering | Datum | Modell | Vikt | Höjd | Storlek | Upplösning | Pris |
|---|---|---|---|---|---|---|---|
| 86.3 % v7 (old) | 05/2023 | Asus VivoBook Pro 16 i7-12700H, GeForce RTX 3050 Ti Laptop GPU | 1.9 kg | 20 mm | 16.00" | 2560x1600 | |
| 86.4 % v7 (old) | 11/2022 | Acer Swift X SFX16-52G-77RX i7-1260P, A370M | 1.8 kg | 21.2 mm | 16.00" | 2560x1600 | |
| 87.4 % v7 (old) | 08/2022 | Dell Inspiron 16 Plus 7620 i7-12700H, GeForce RTX 3050 Ti Laptop GPU | 2.1 kg | 18.99 mm | 16.00" | 3072x1920 | |
| 87.4 % v7 (old) | 08/2022 | Schenker XMG Fusion 15 (Mid 22) i7-11800H, GeForce RTX 3070 Laptop GPU | 1.9 kg | 21.65 mm | 15.60" | 2560x1440 |
Case & funktioner - VivoBook med Thunderbolt 4
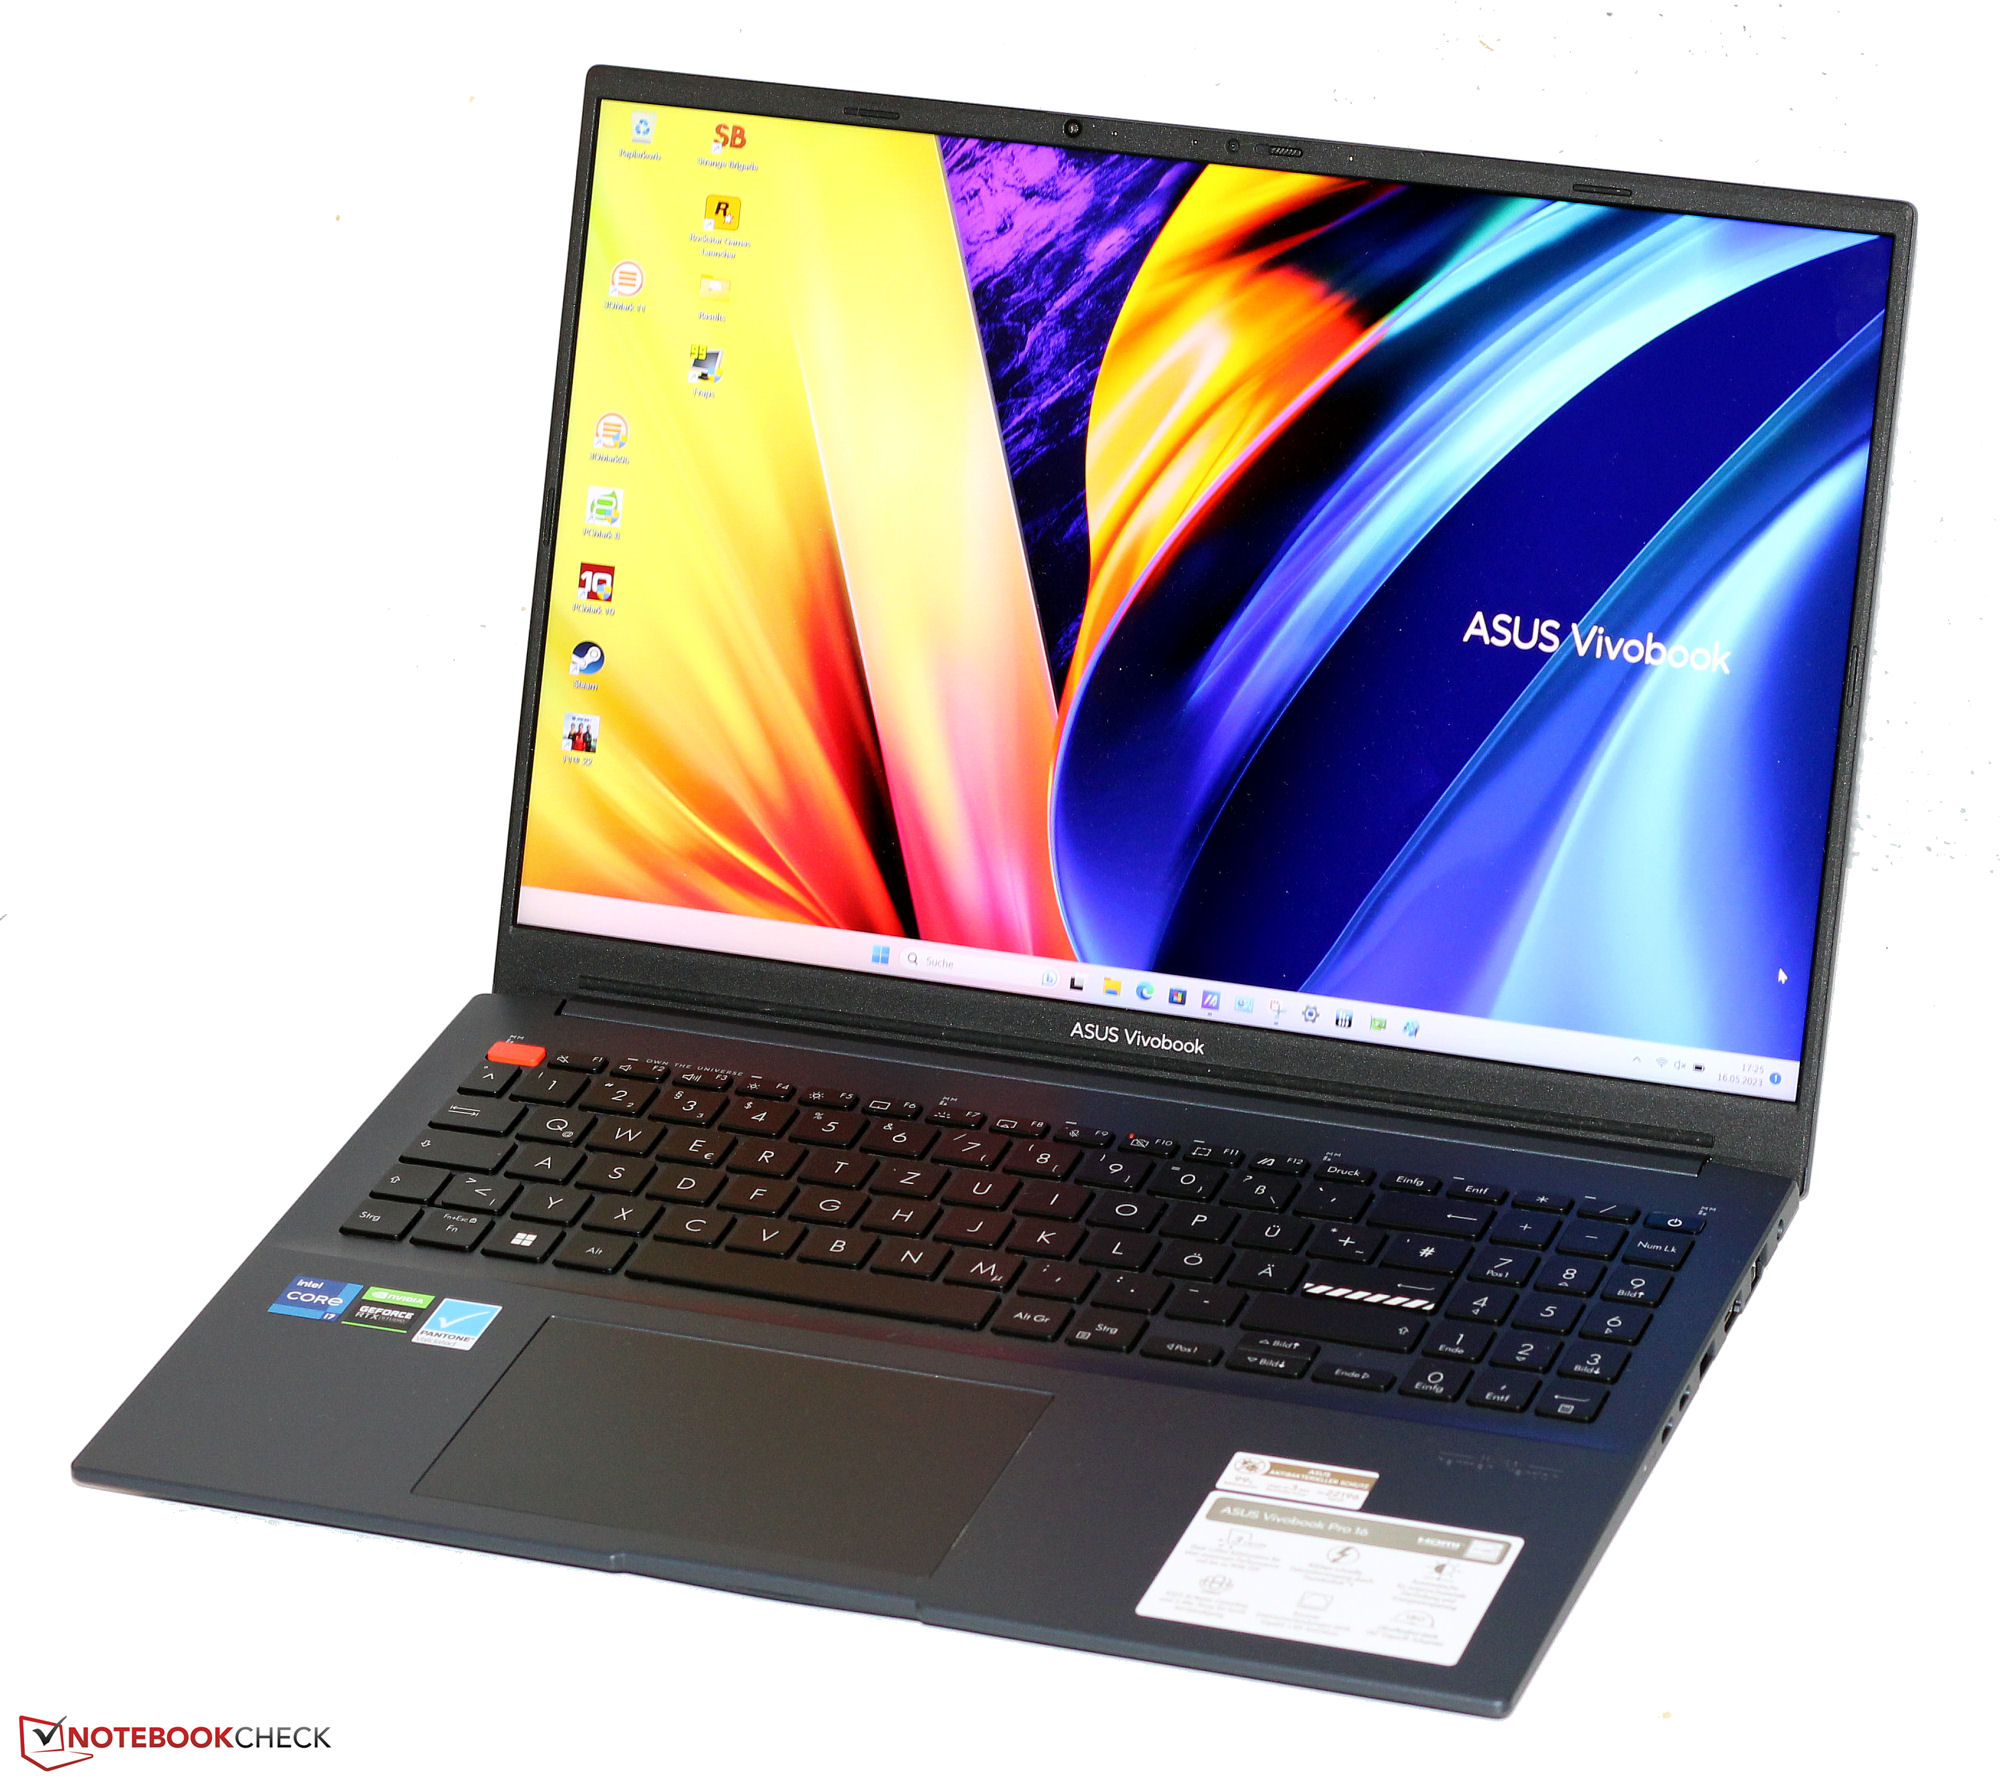
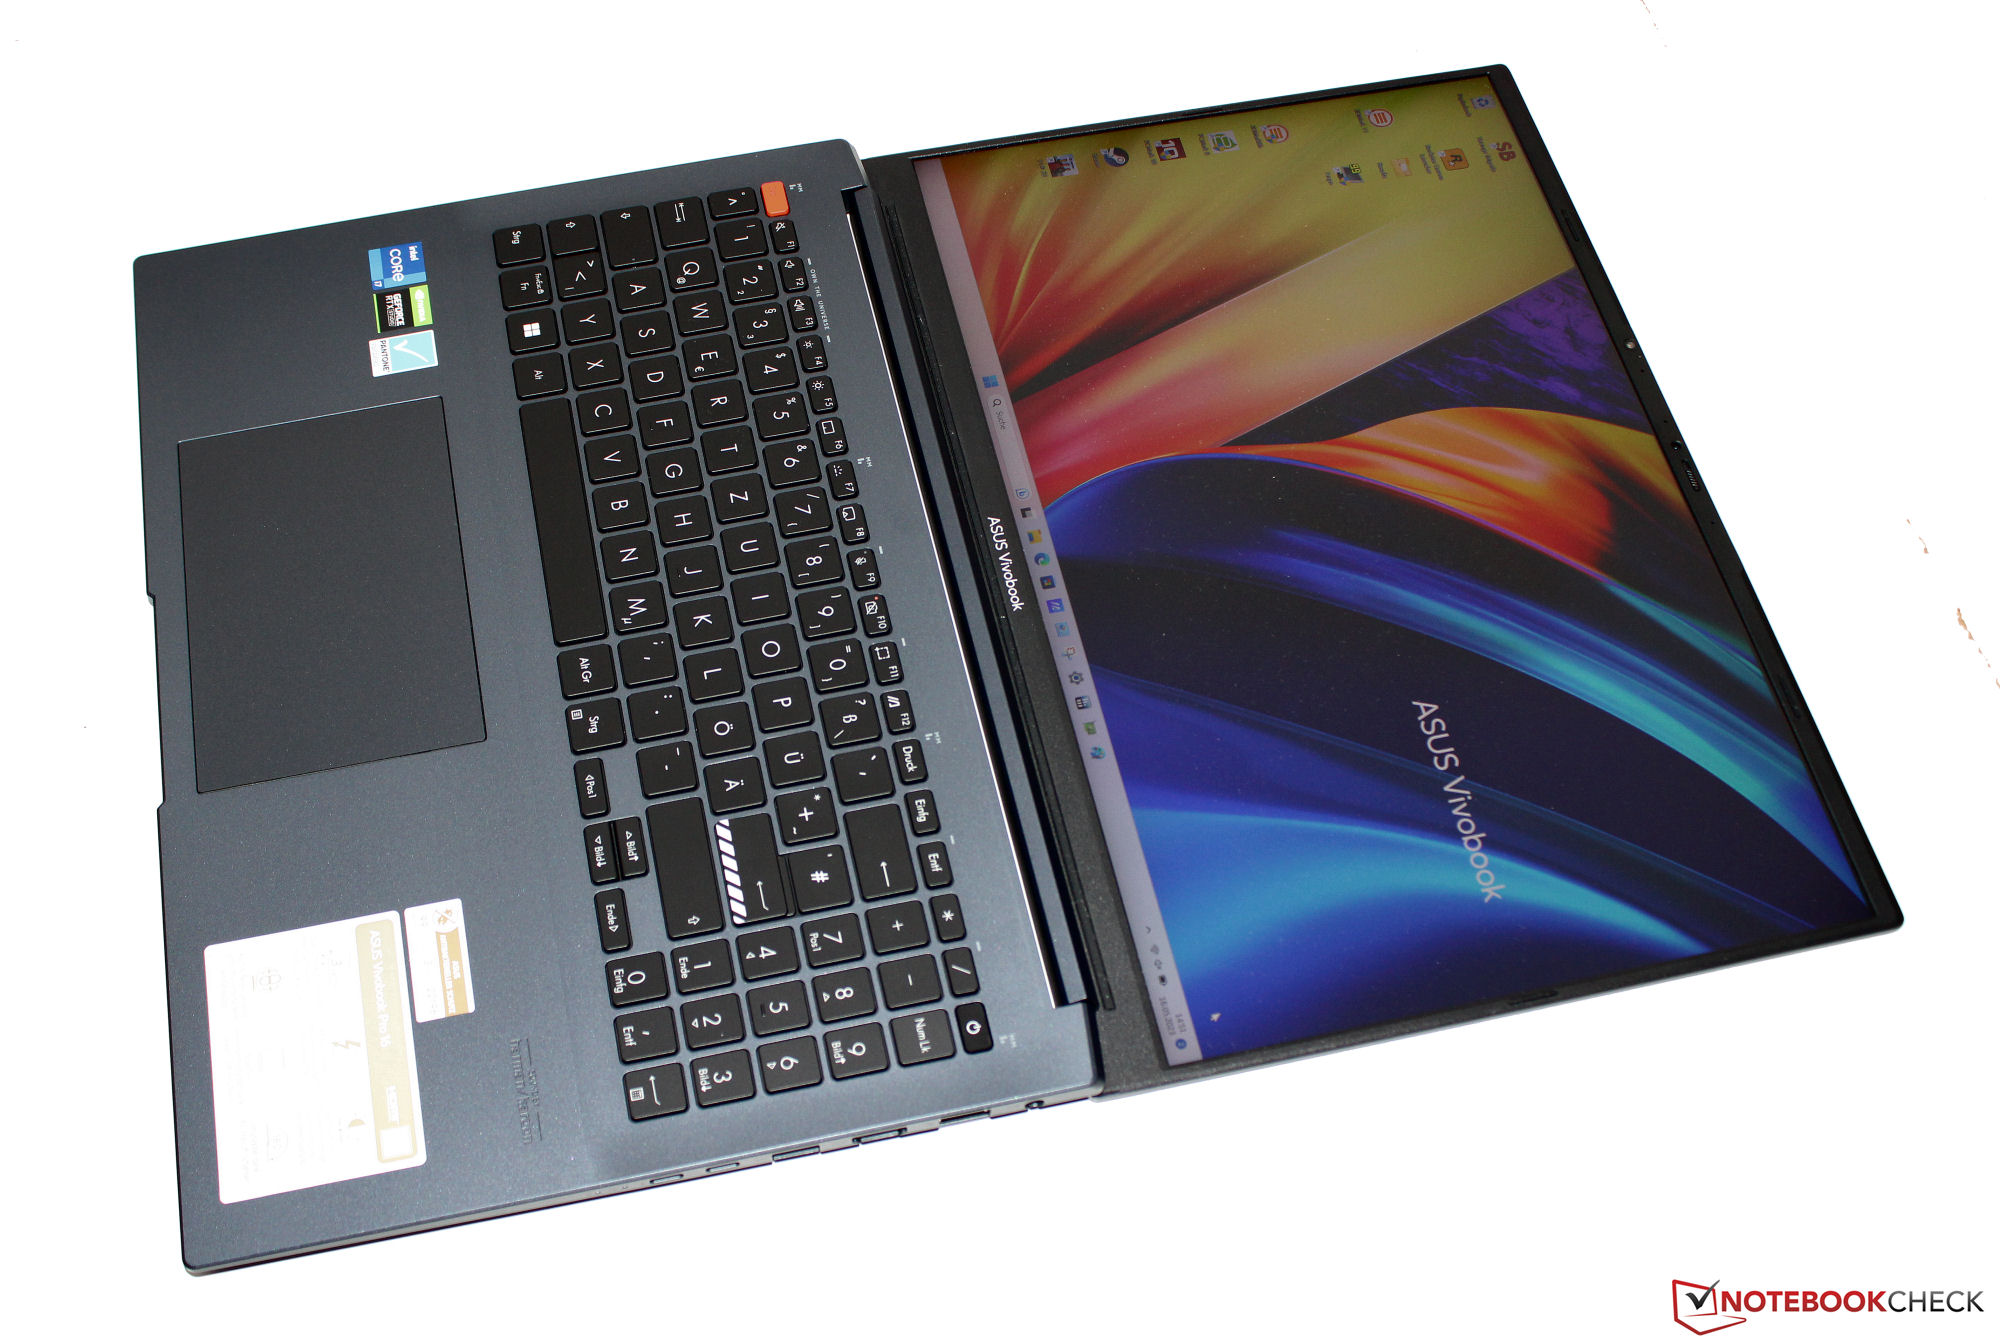
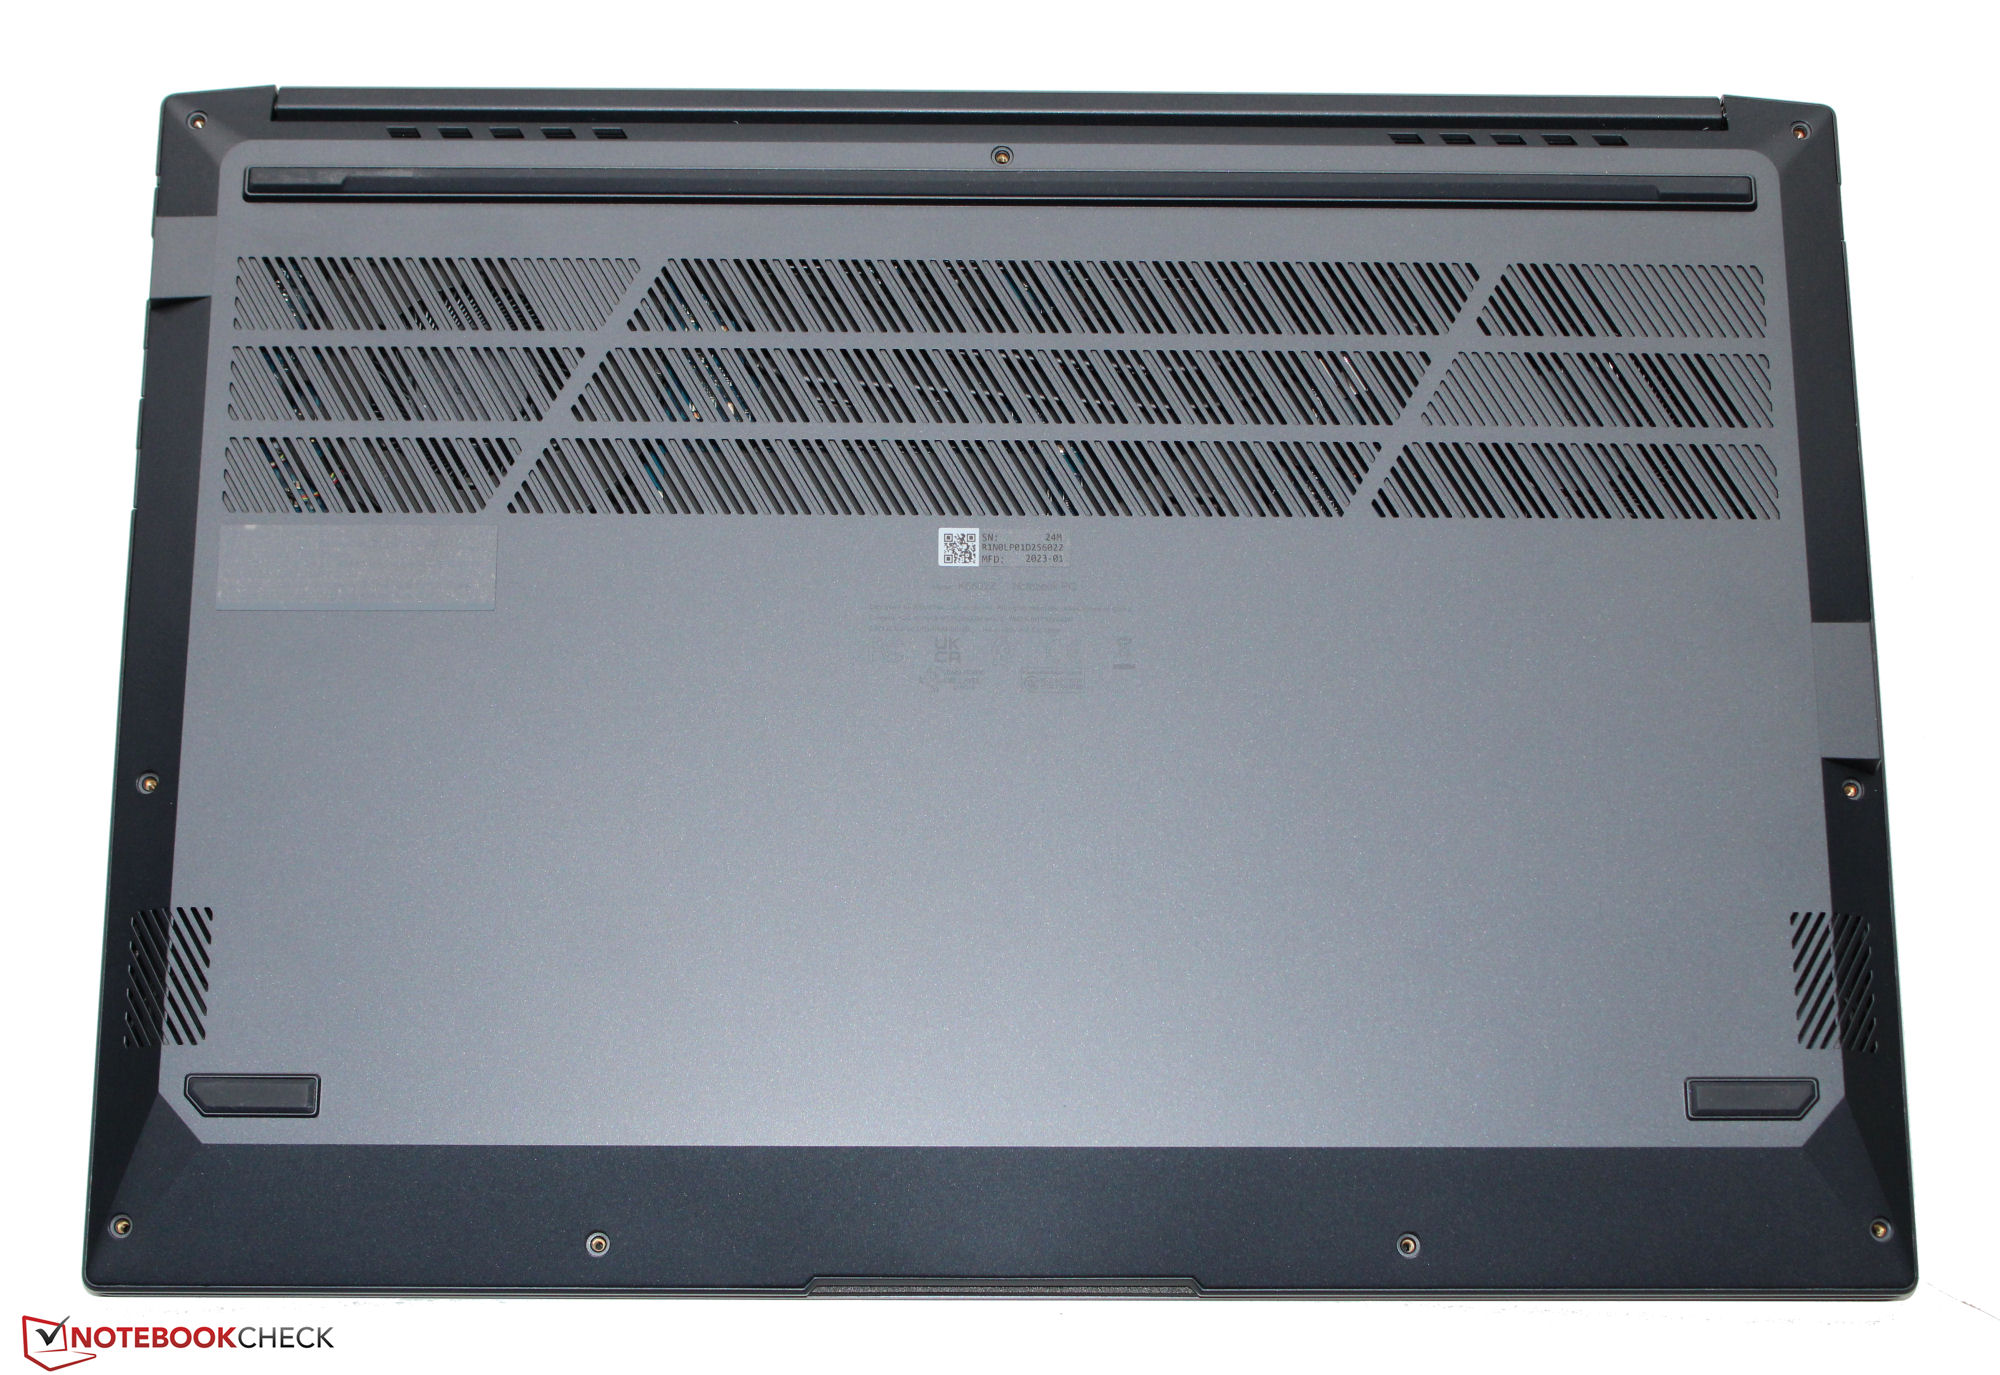
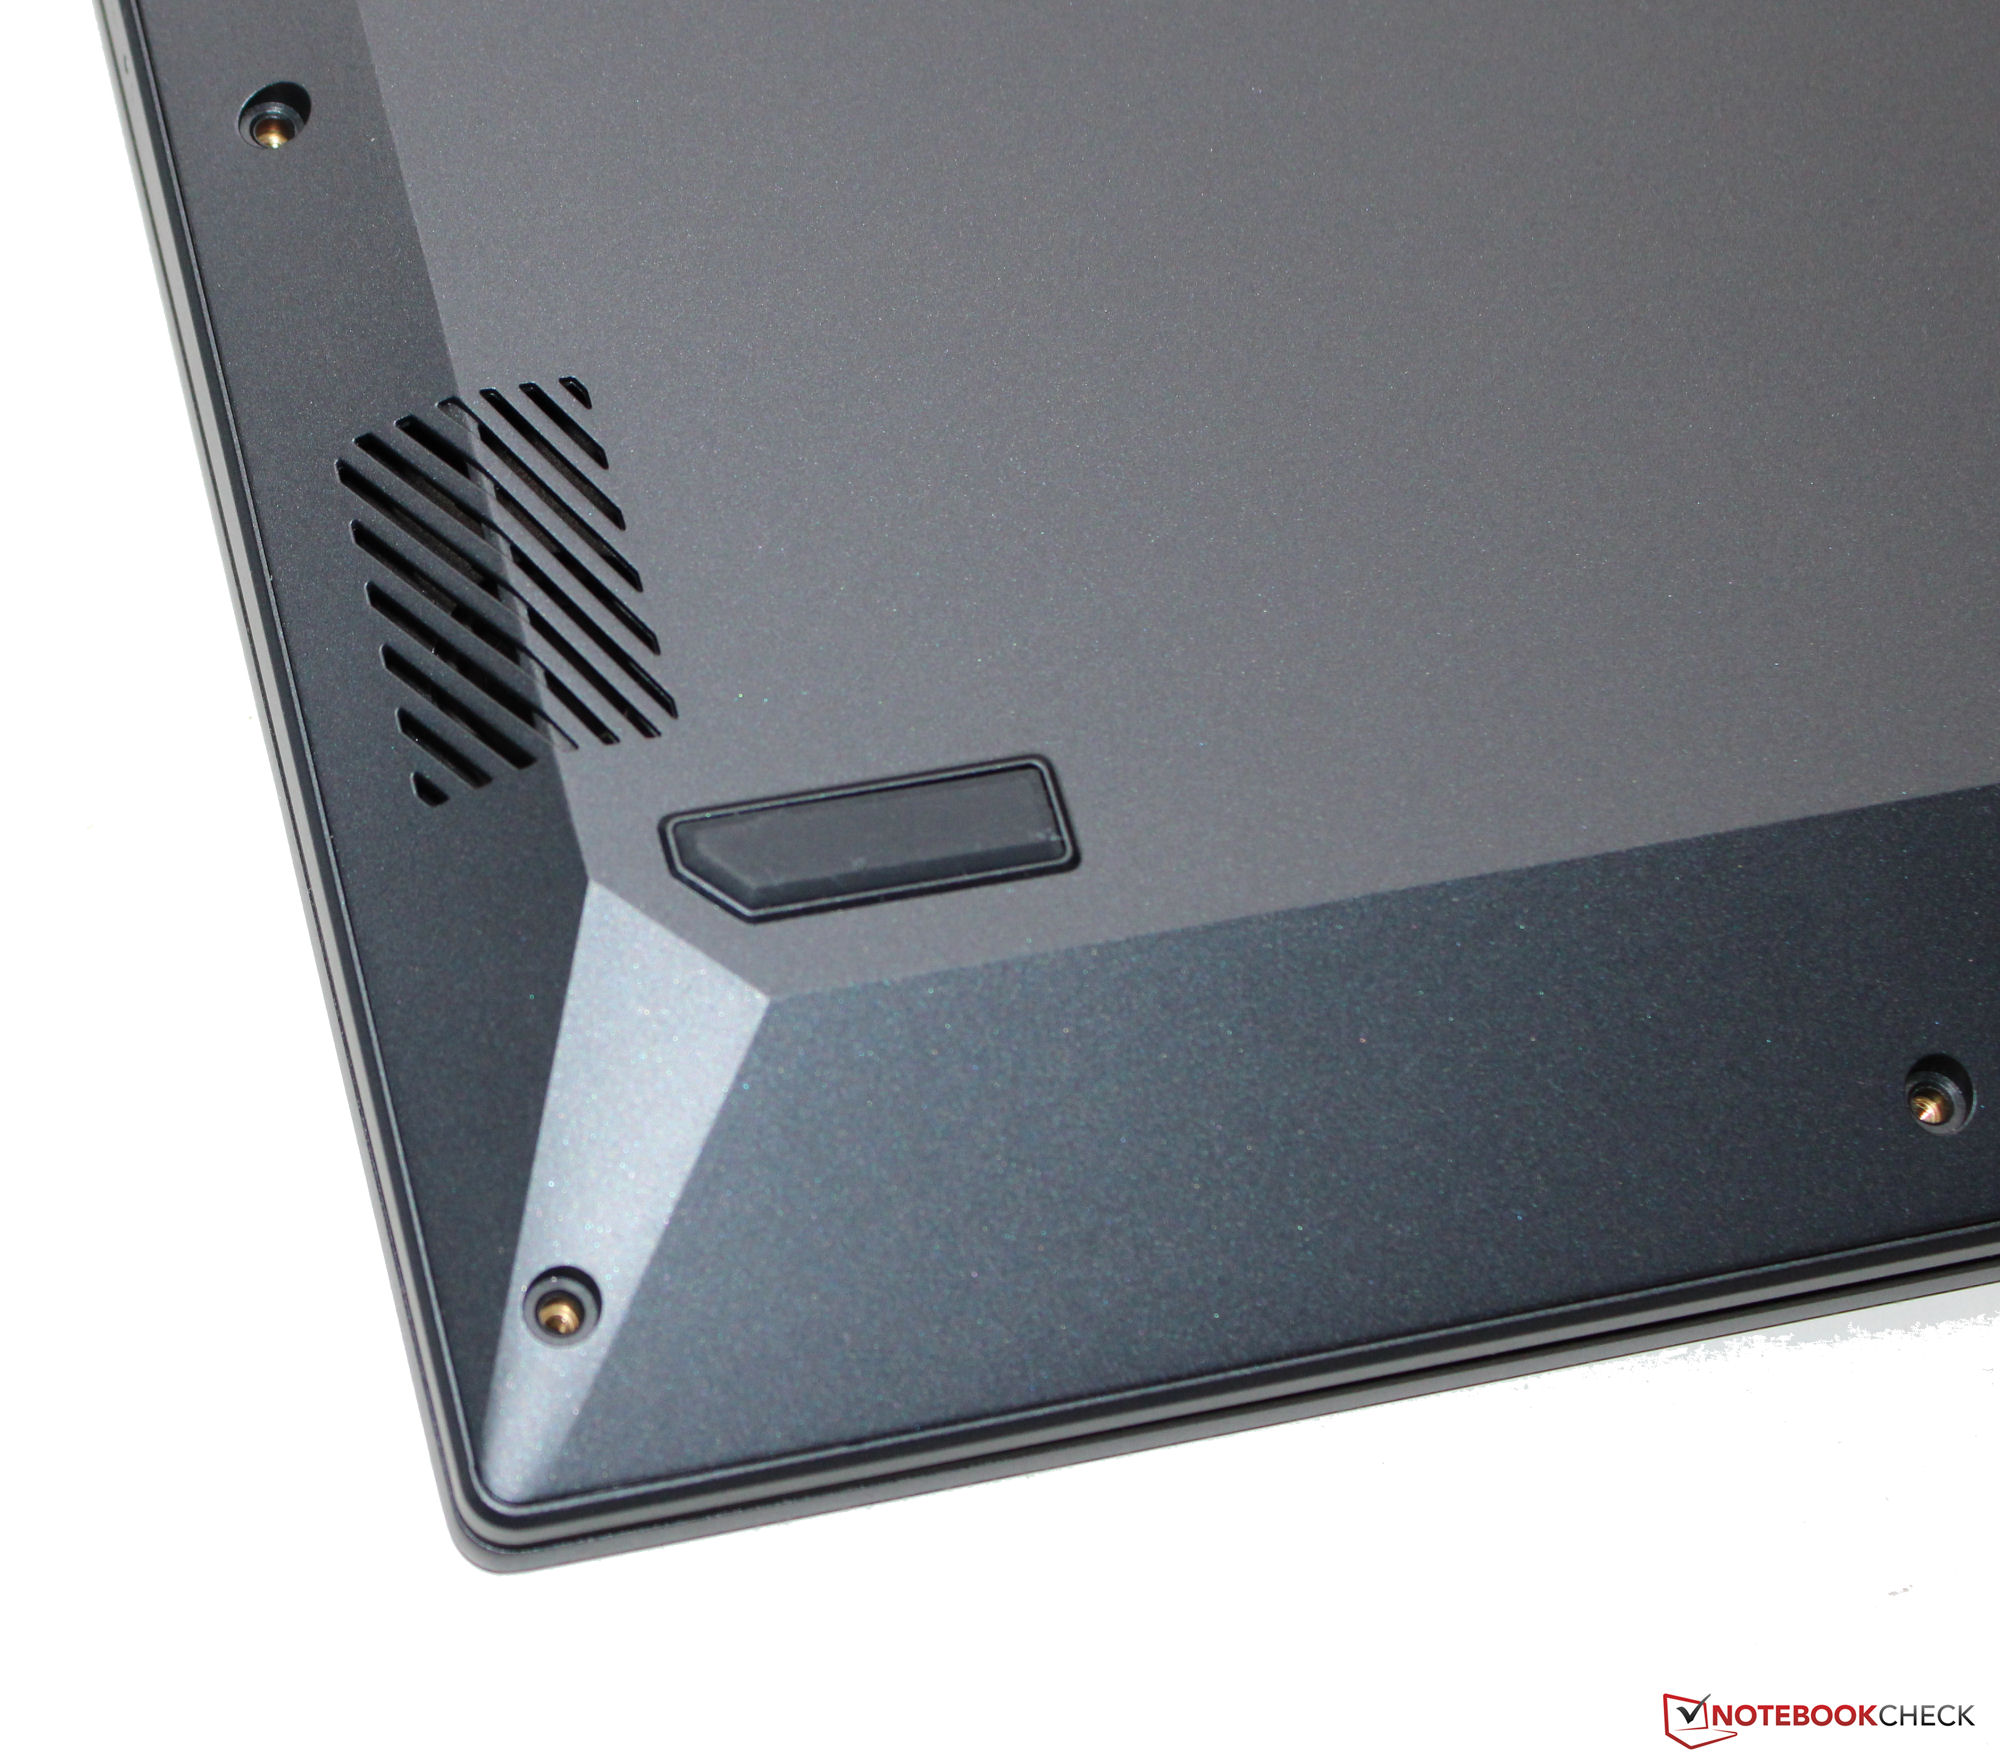
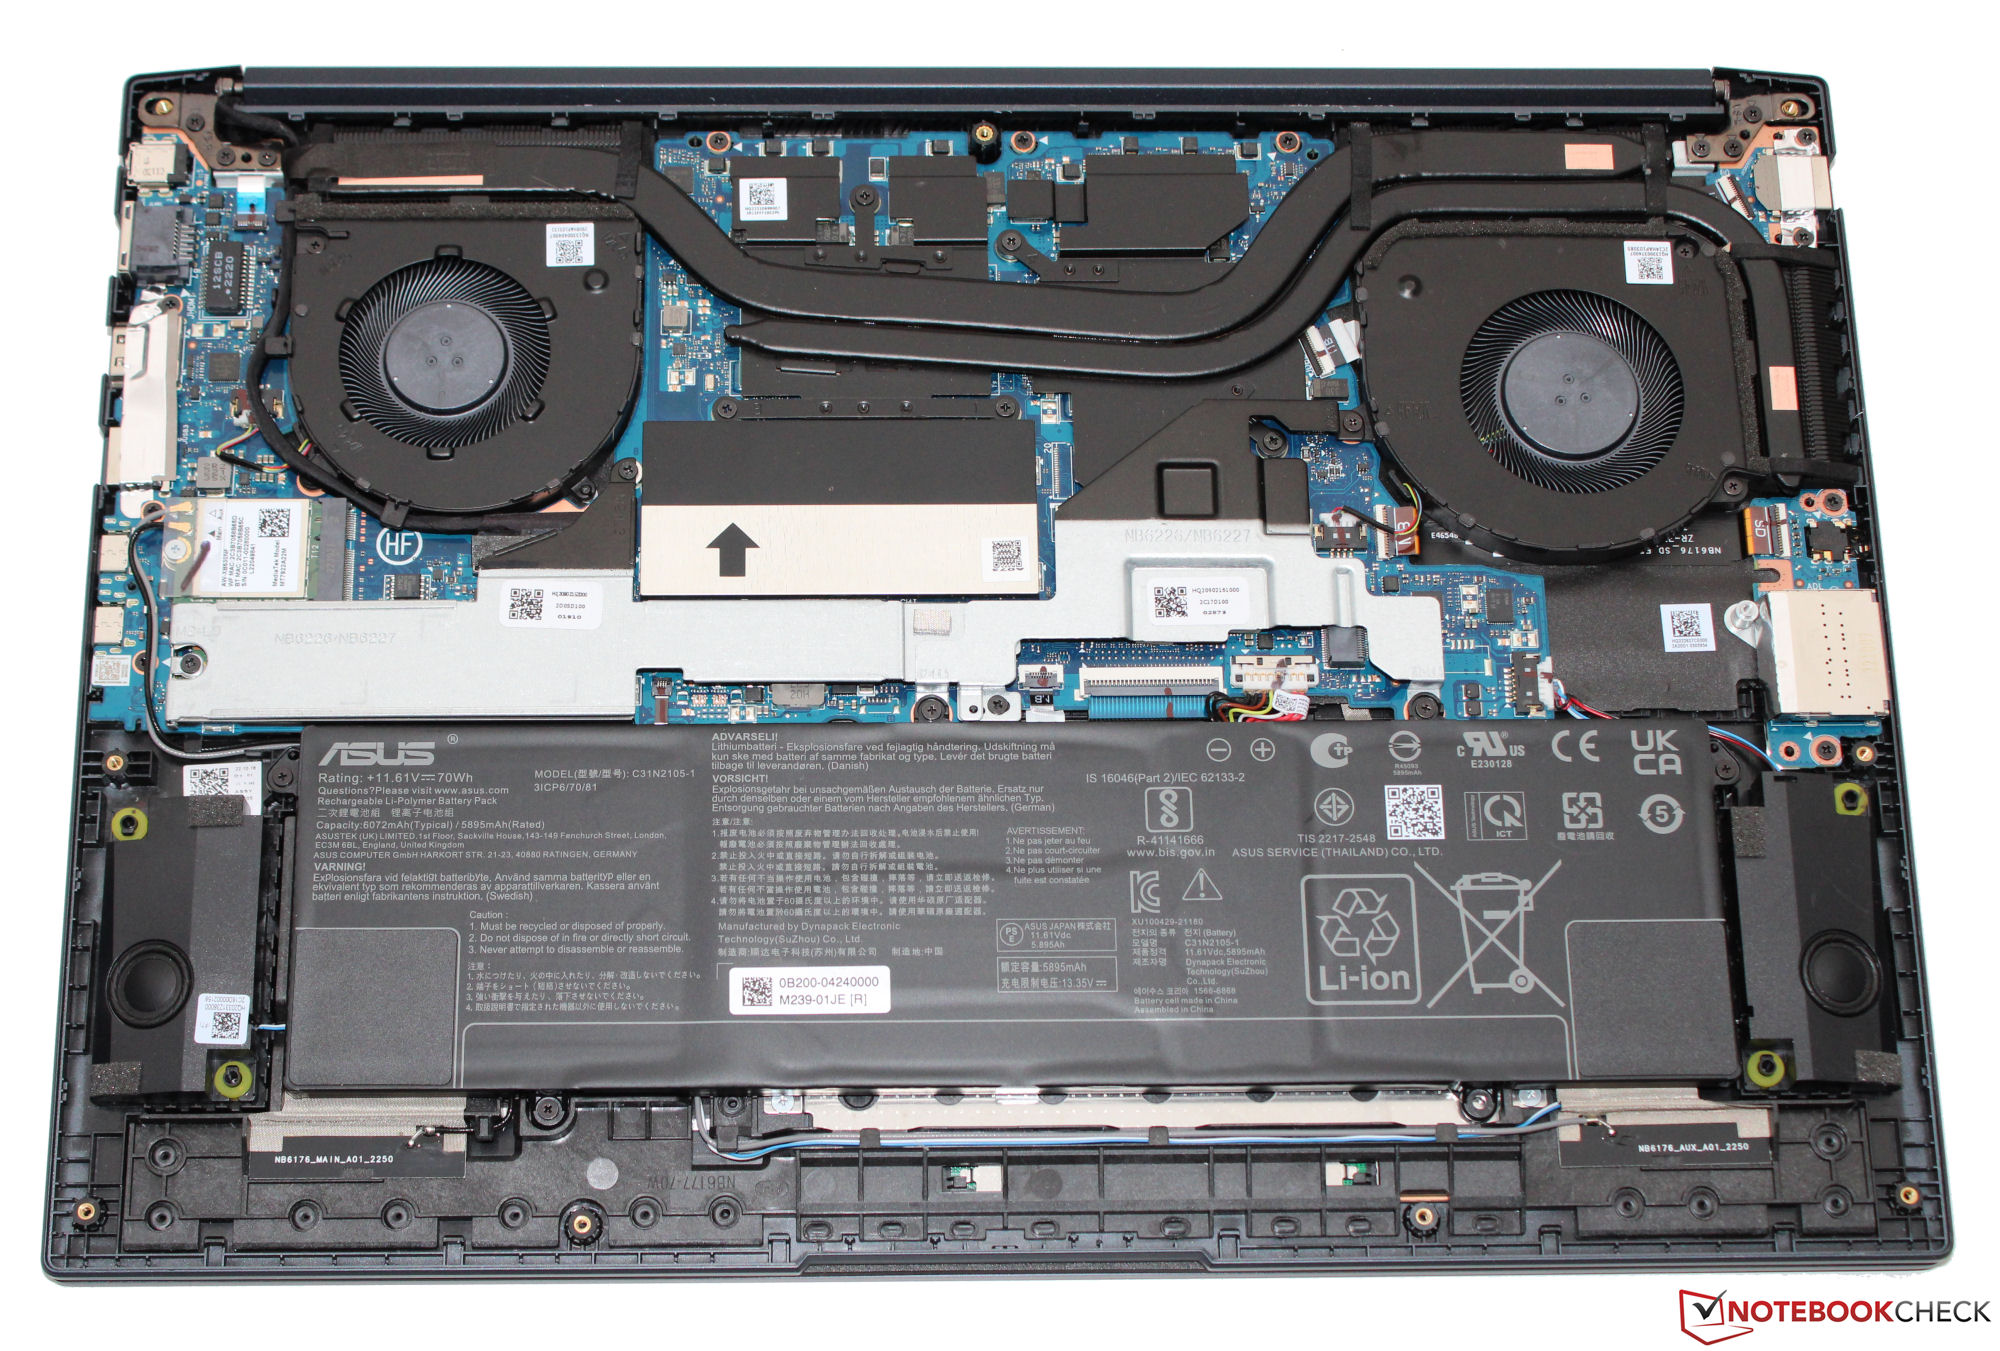
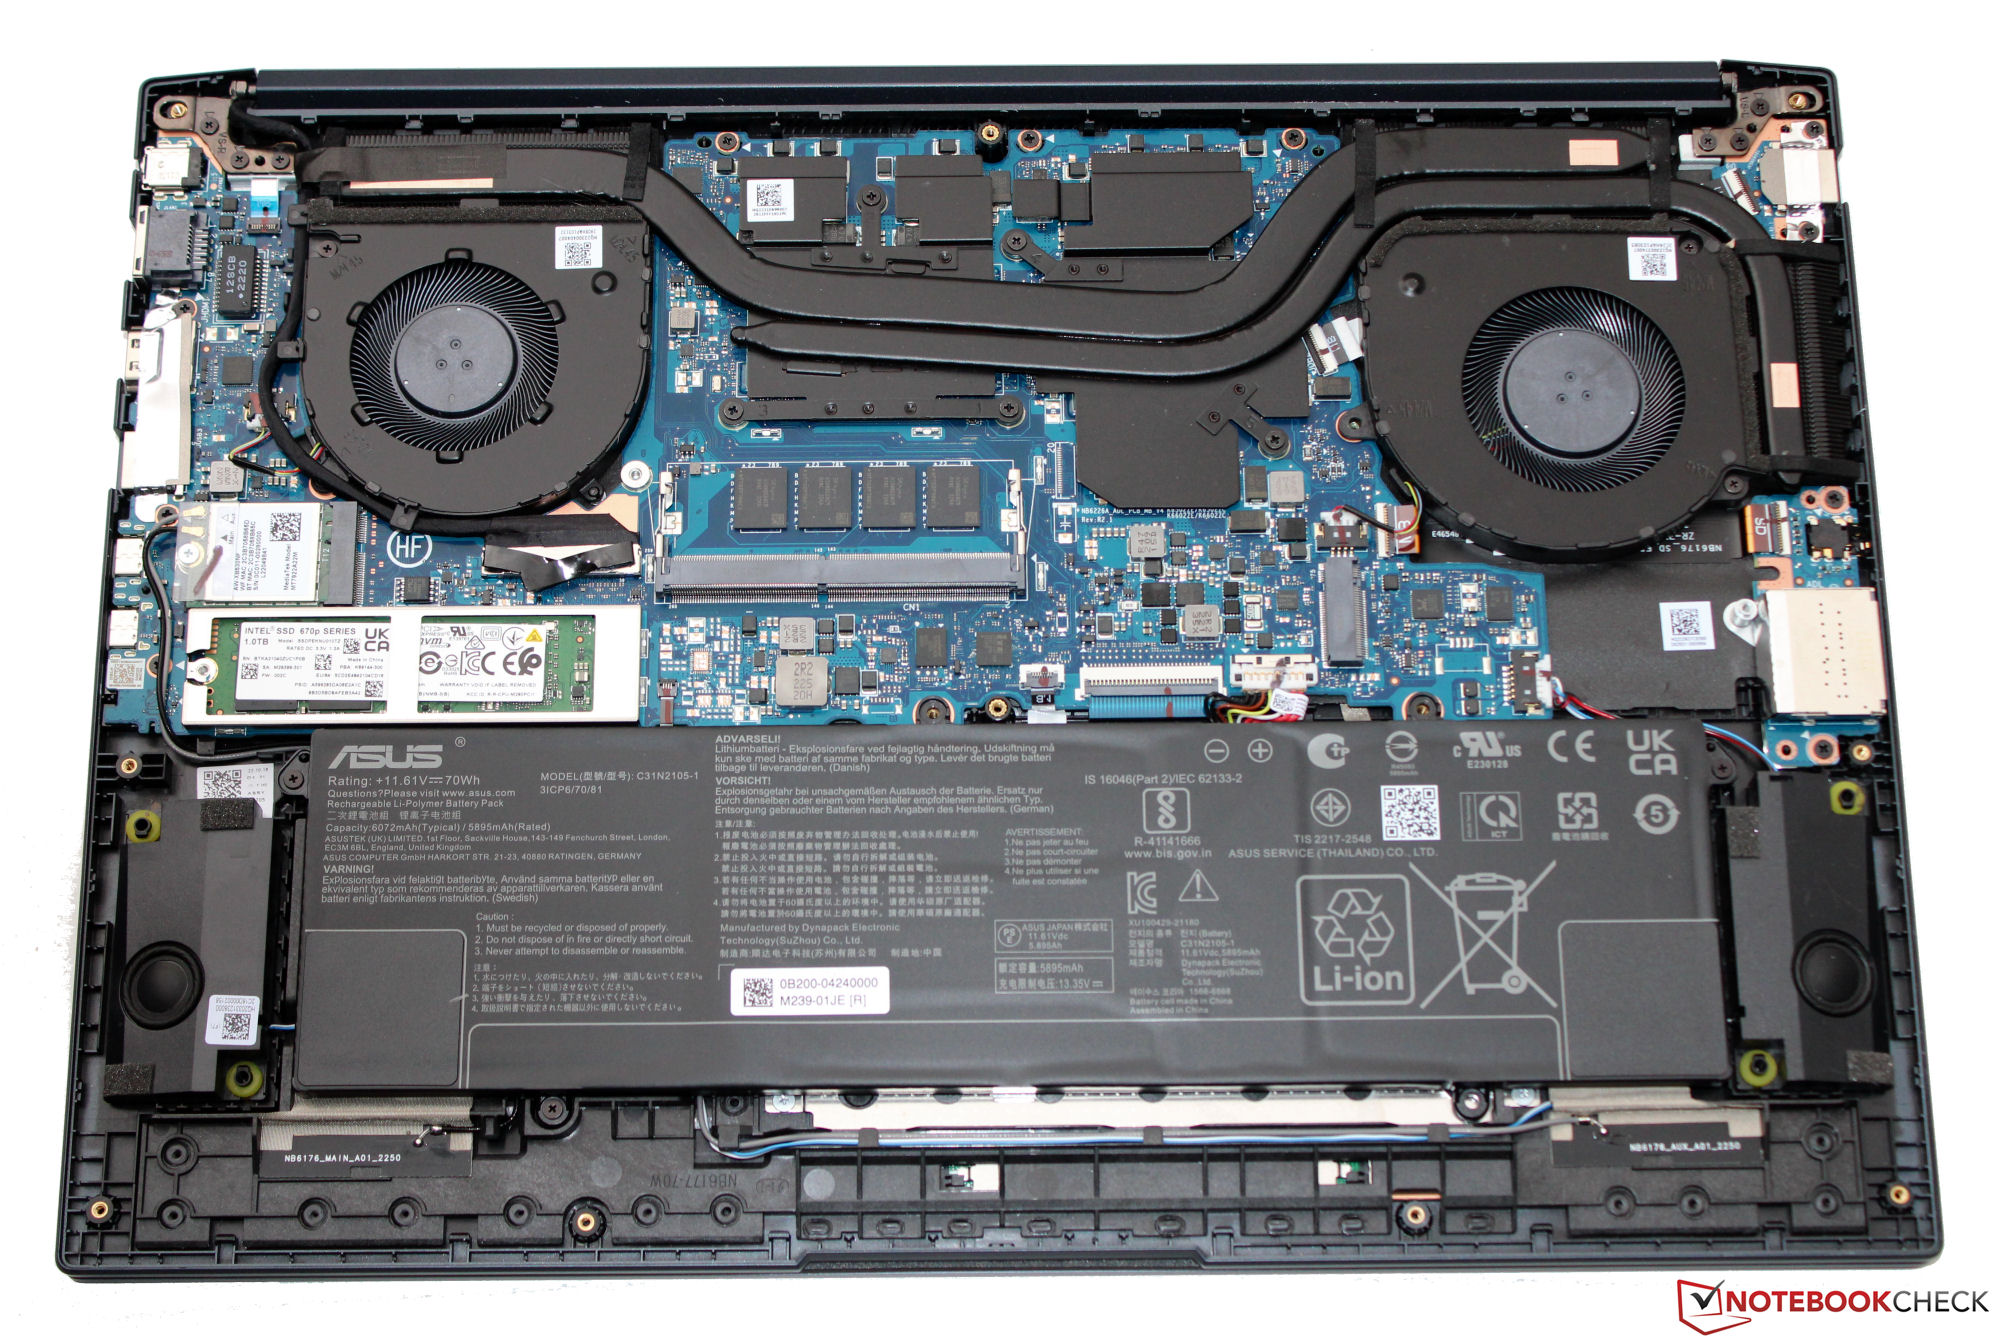
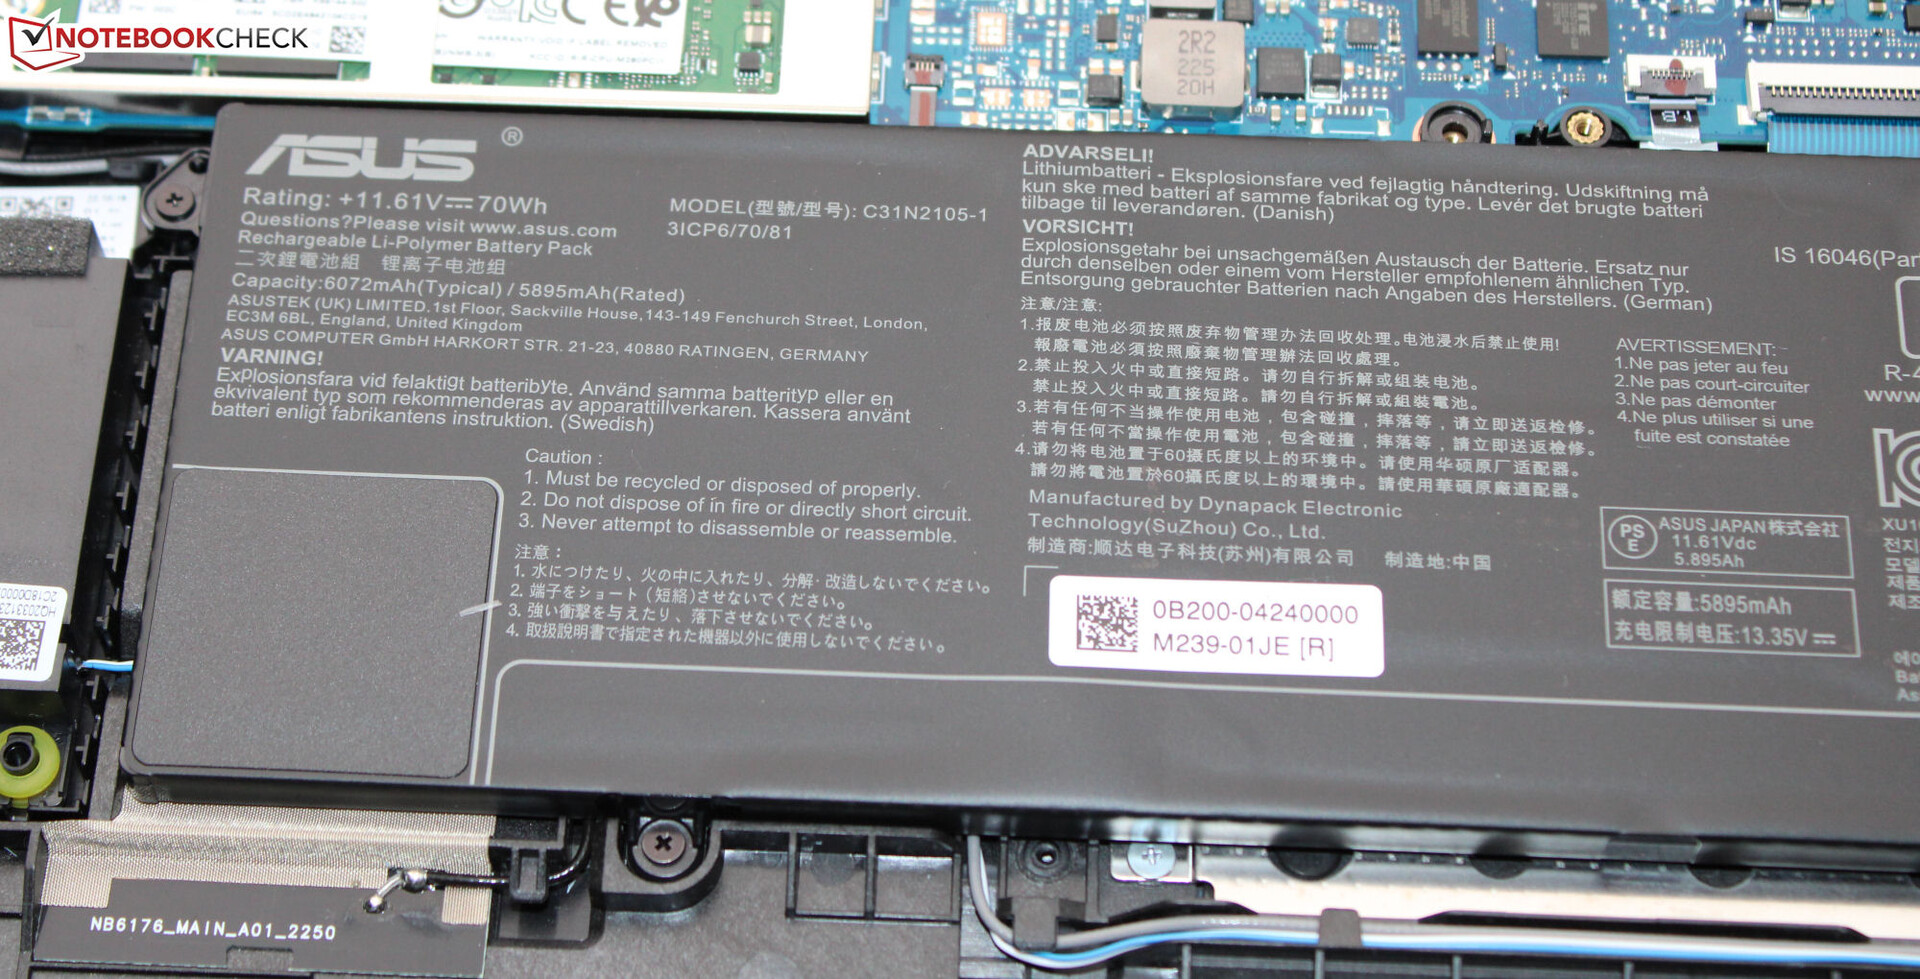
VivoBook är mörkblå (Quiet Blue) i färgen och har släta, matta ytor. Dess basenhet (plast) och lock (aluminiumrygg) kan vridas lite för lätt. Den maximala vinkeln i vilken du kan öppna locket mäter 180 grader. Batteriet (fastskruvat, inte fastlimmat) samt resten av den bärbara datorns inre kan nås när du har tagit bort botten av fodralet.
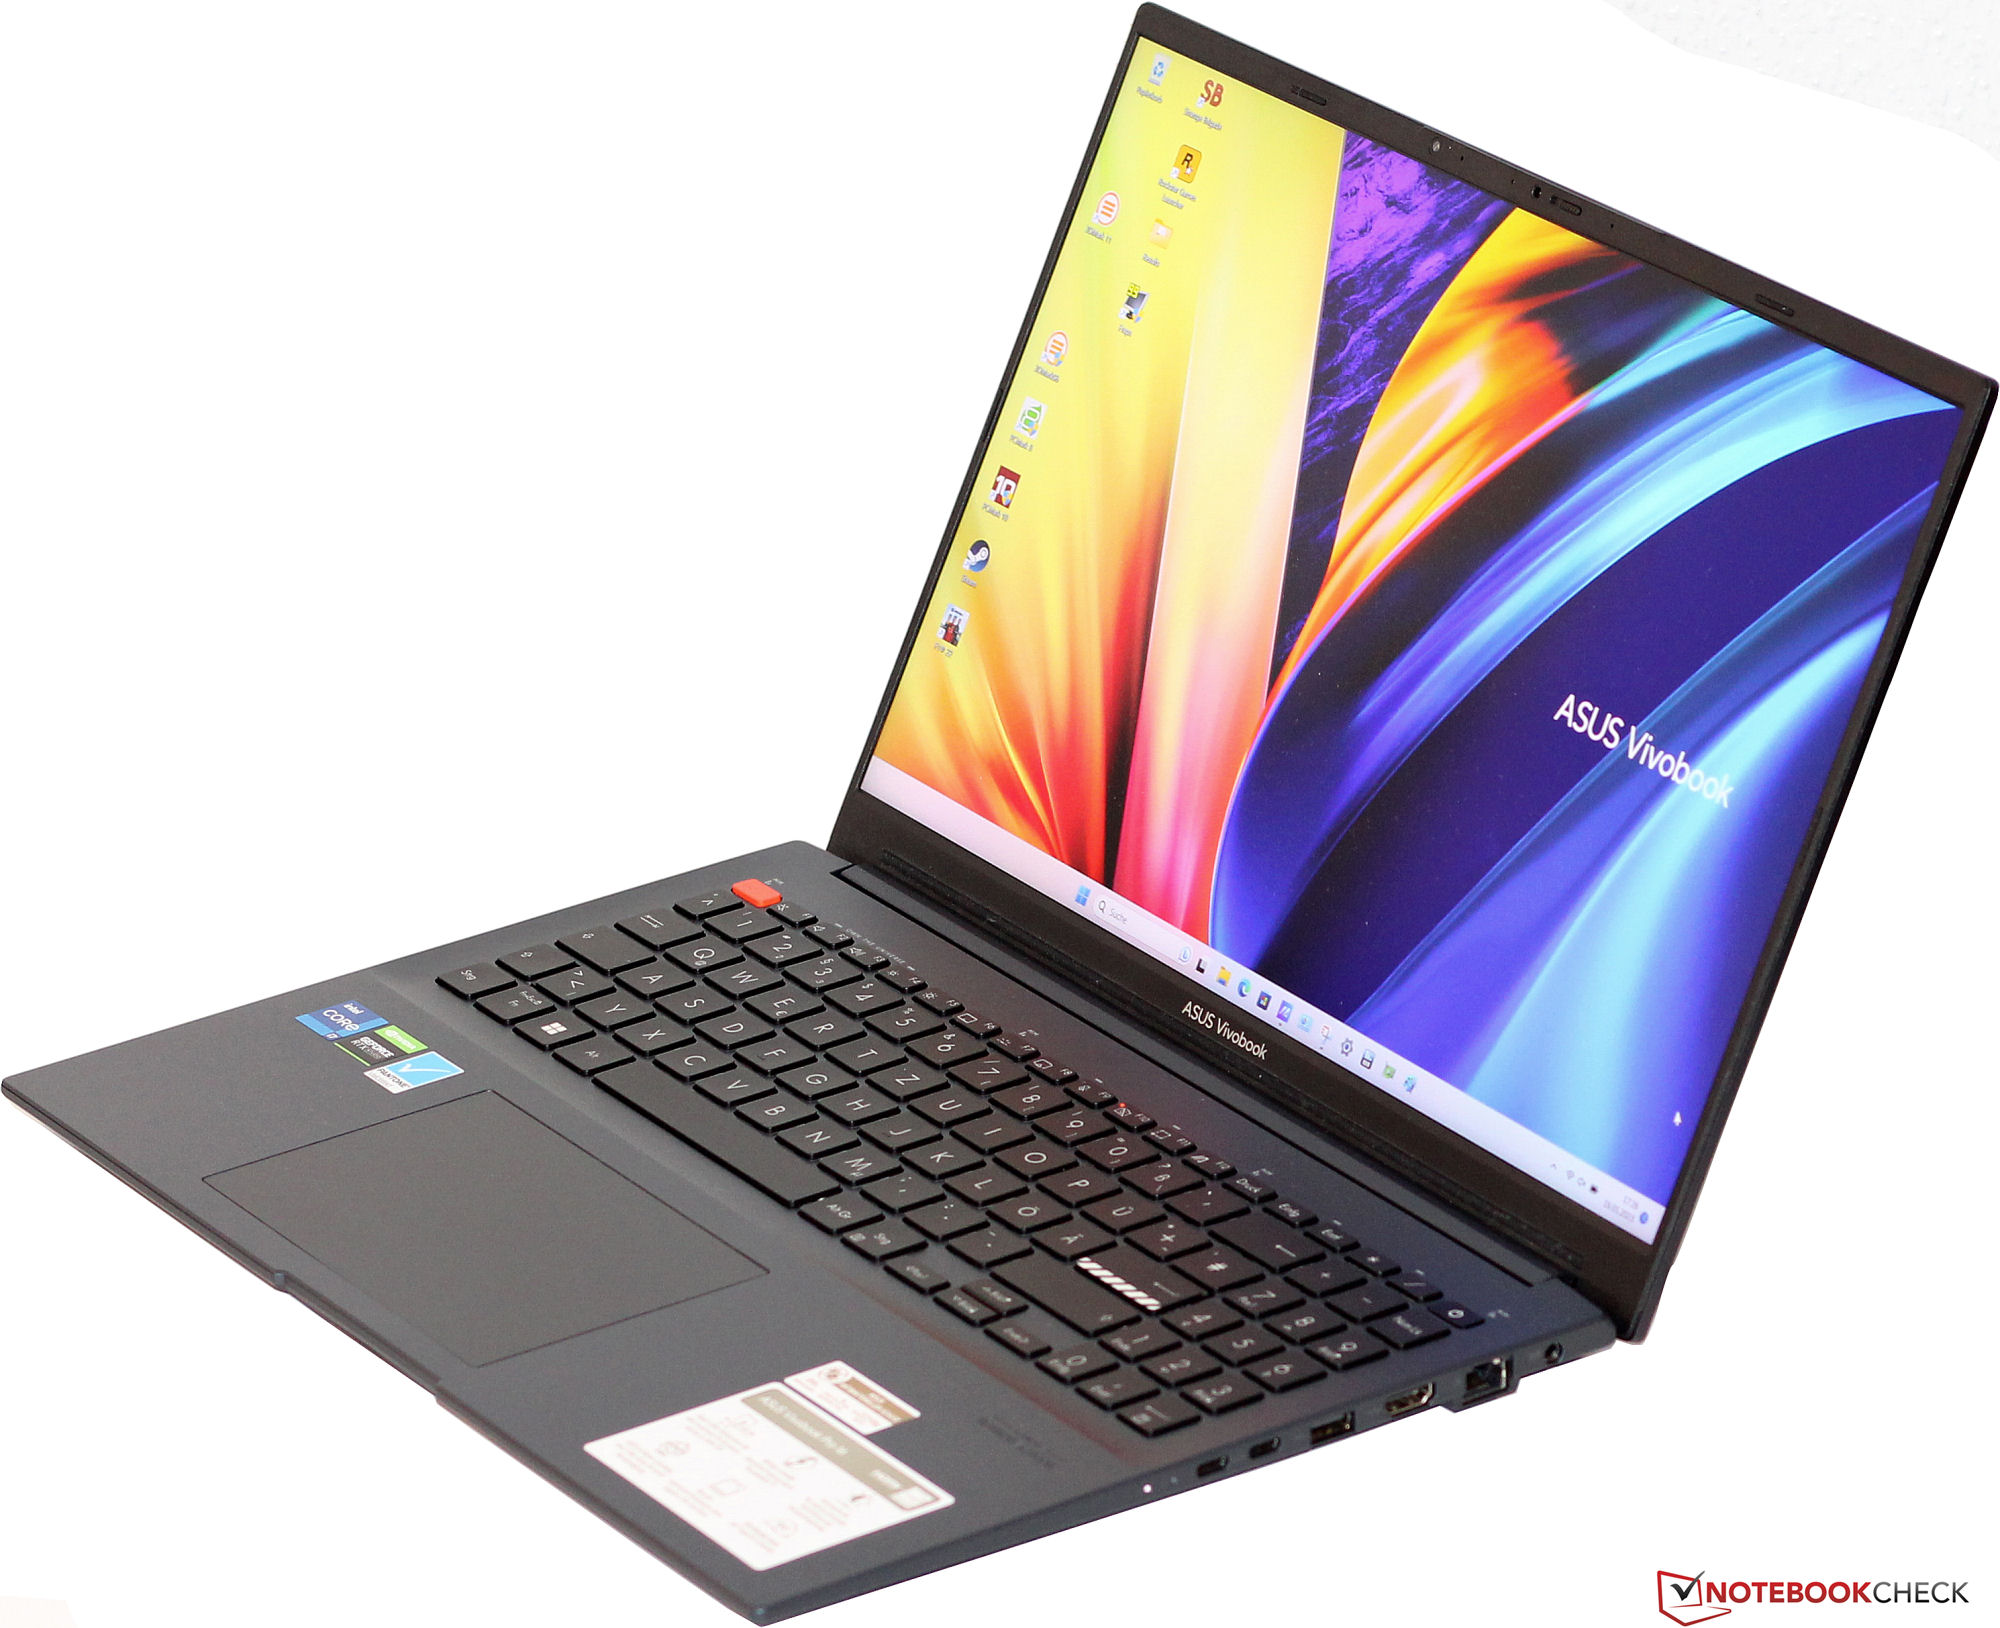
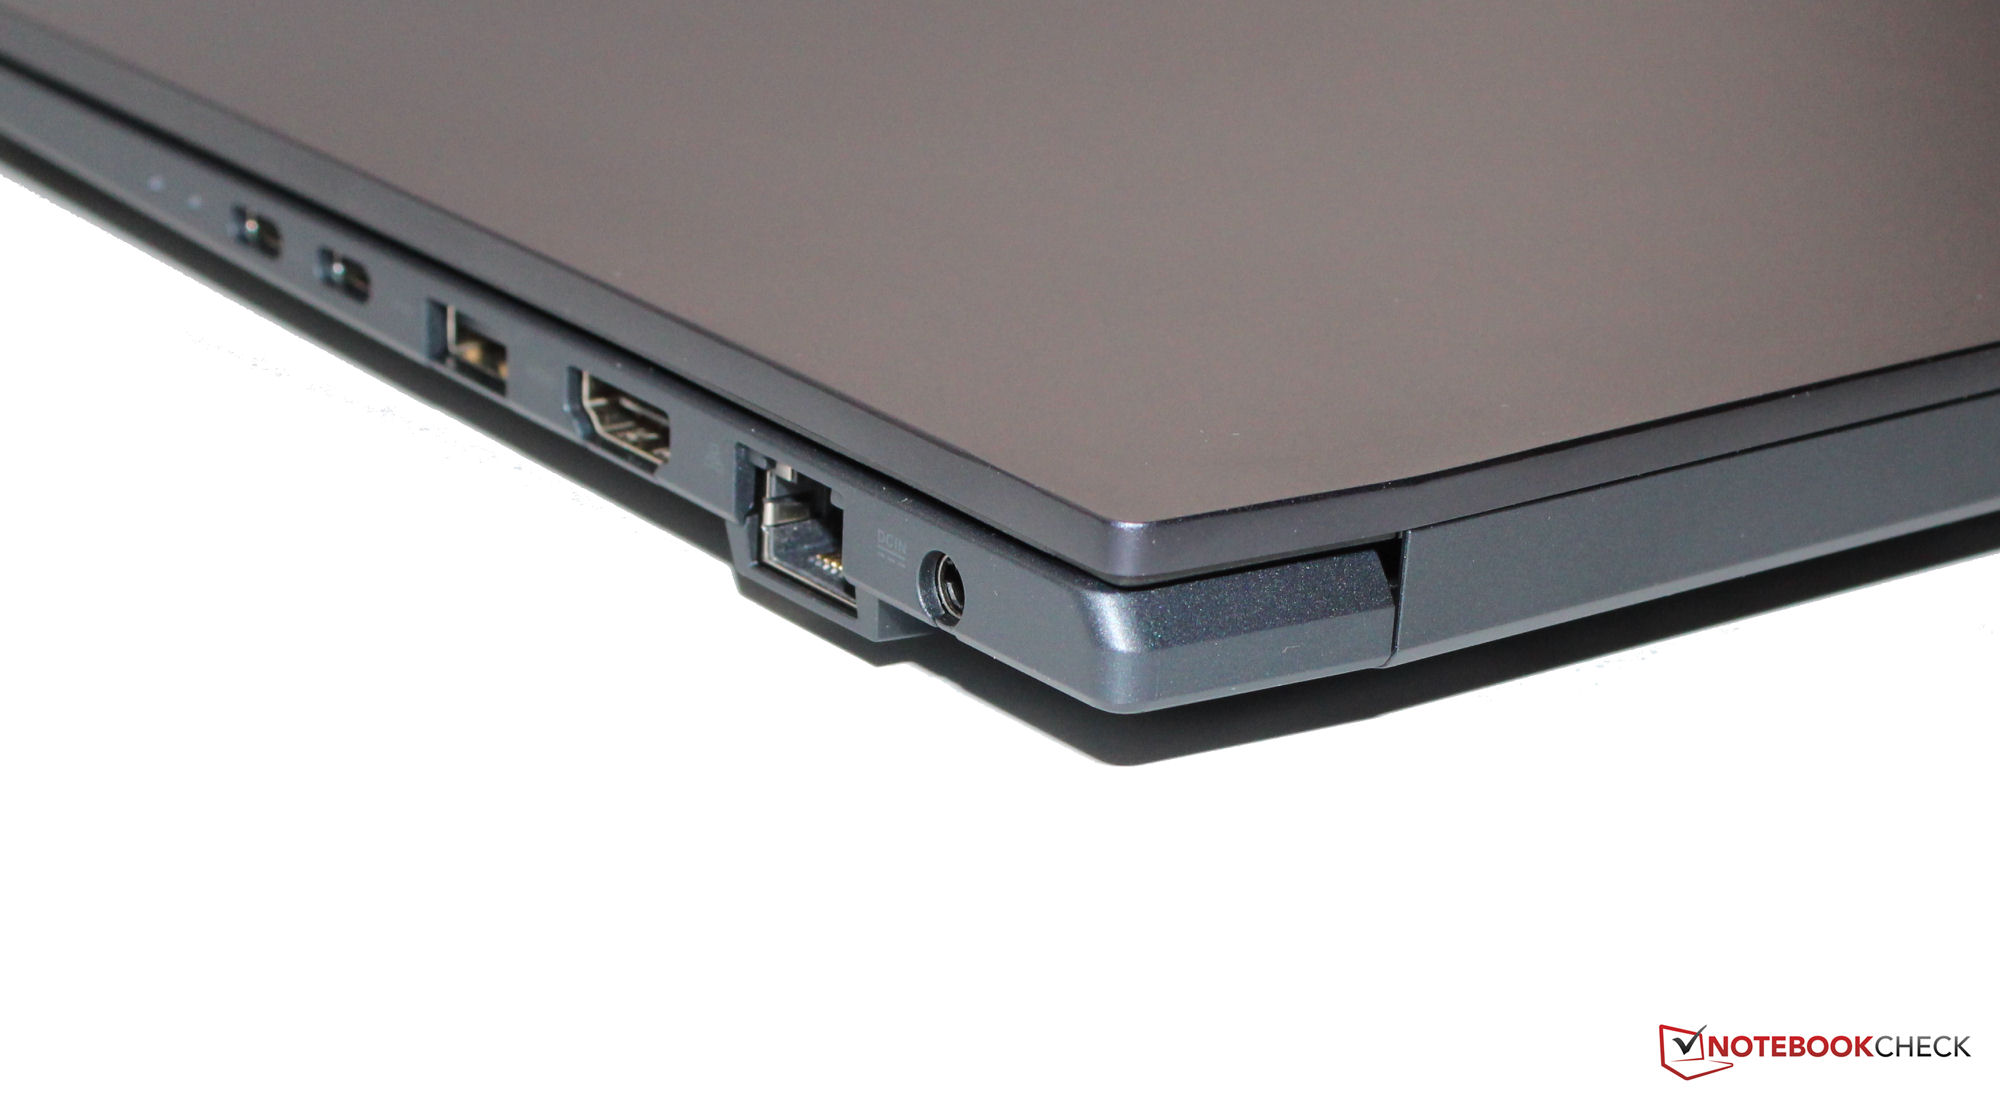
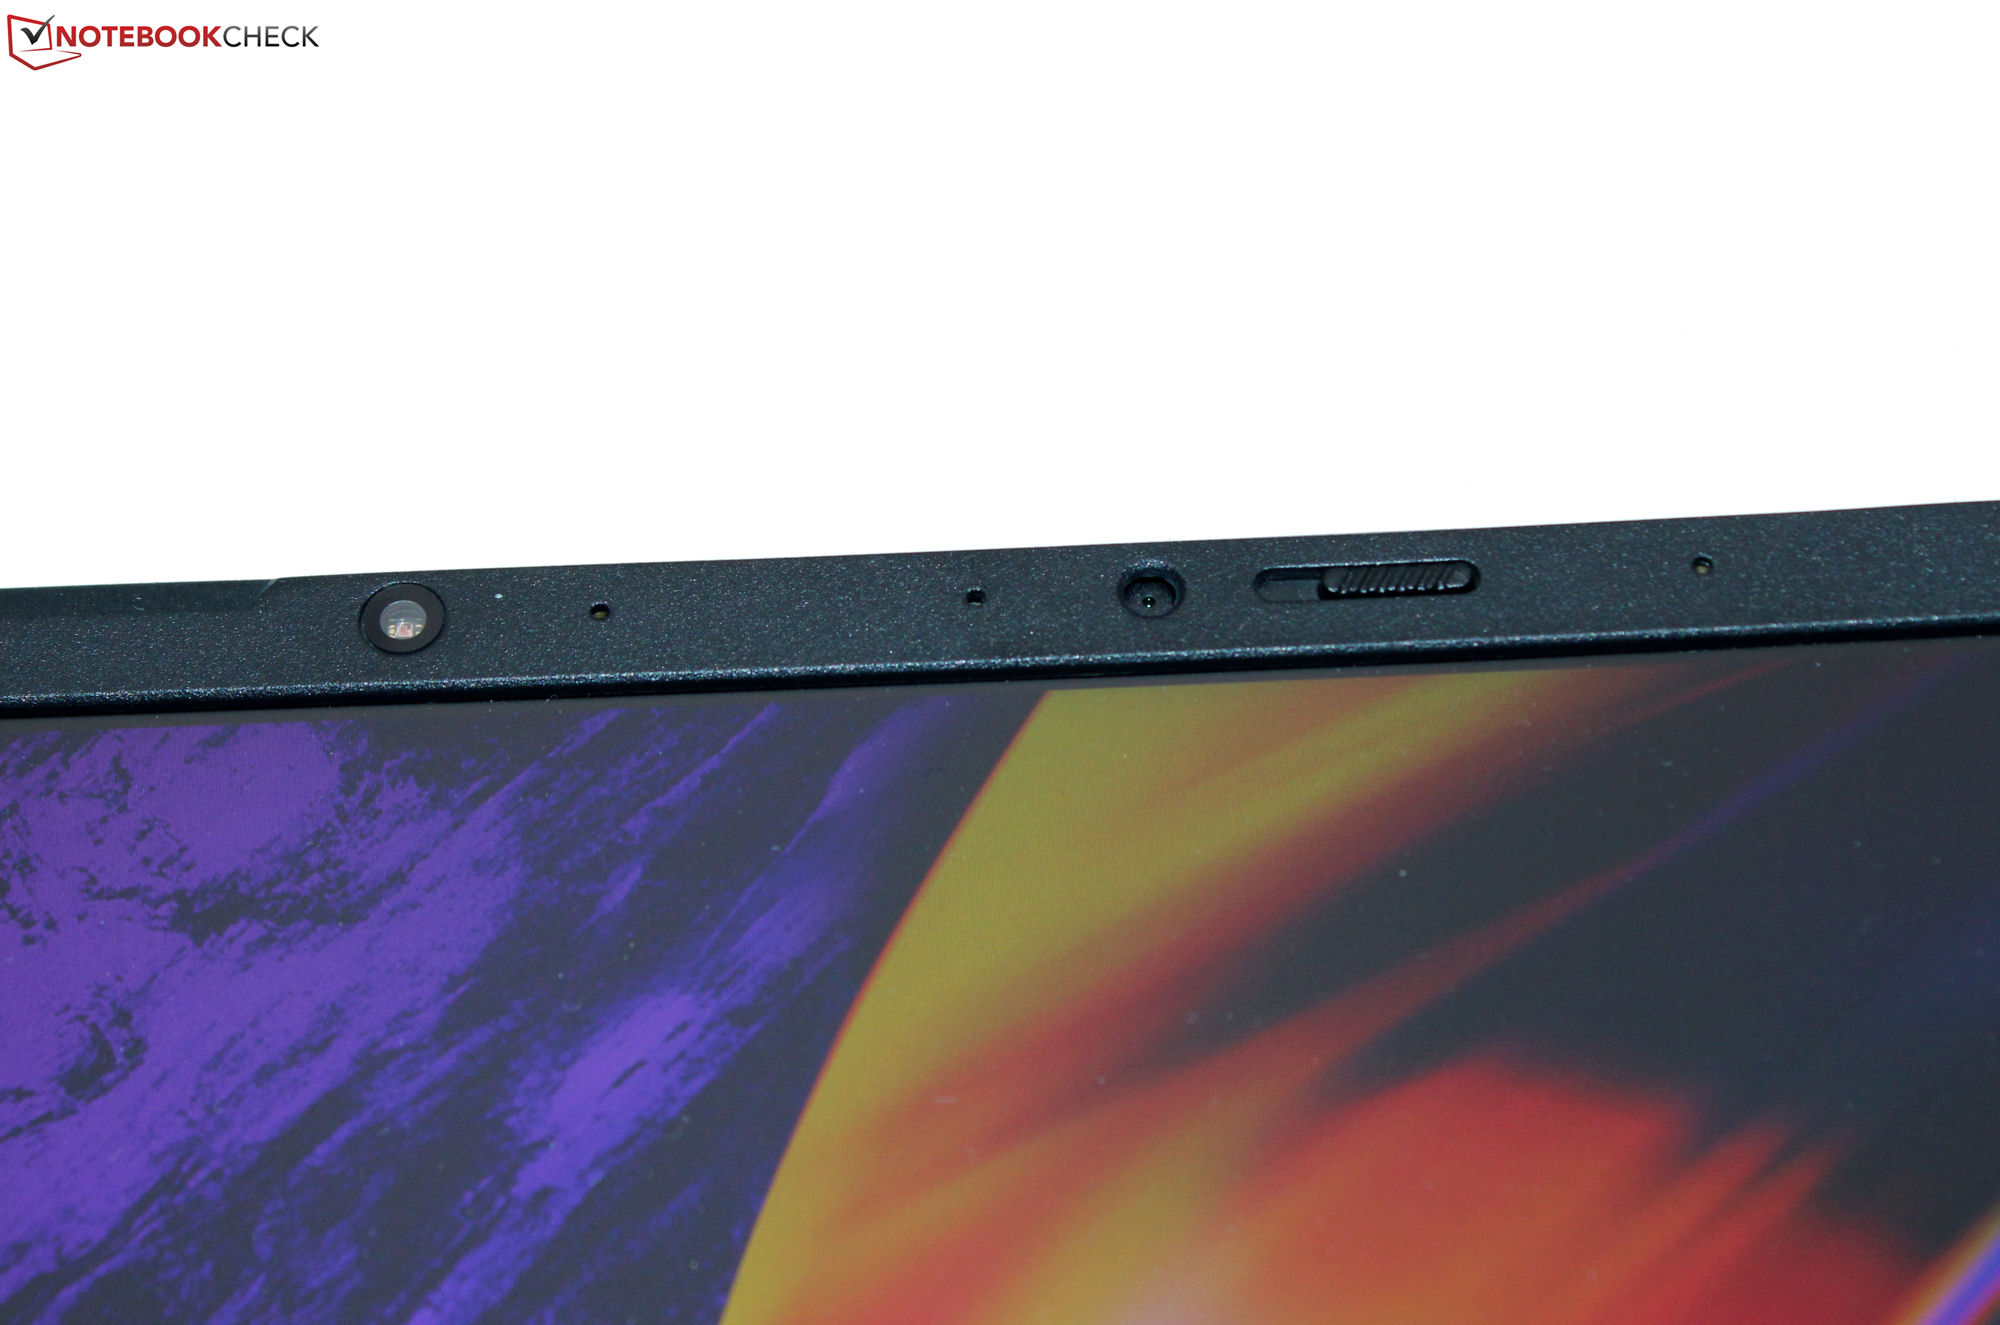
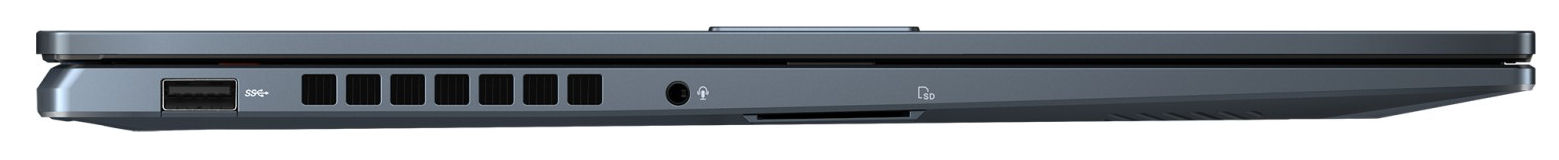
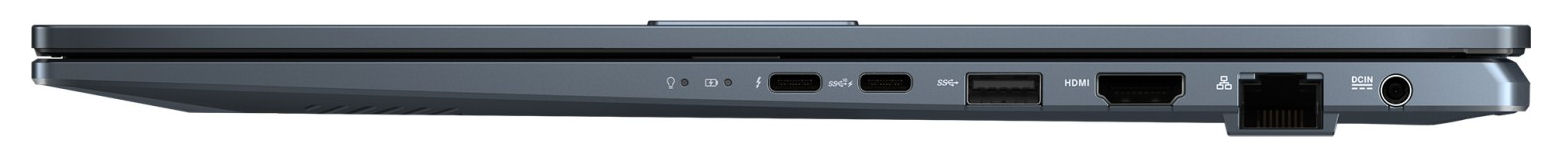
Enheten har två USB-A-portar (USB 3.2 Gen 1) samt två USB-C-portar (1x Thunderbolt 4, 1x USB 3.2 Gen 2). De sistnämnda stöder strömförsörjning och TB4-porten kan även ge ut en DisplayPort-signal. Totalt finns det två videoutgångar (1x DP, 1x HDMI). SD-kortläsaren (referenskort: AV PRO microSD 128 GB V60) levererar ungefär genomsnittliga hastigheter. Positivt: Webbkameran (2,1 MP, max. 1 920 x 1 080 pixlar) har ett mekaniskt skydd.
Under optimala förhållanden (inga WiFi-enheter i närheten, kort avstånd mellan bärbar dator och serverdator) kan du uppnå bra WiFi-datahastigheter. Den bärbara datorn använder ett WiFi 6E-chip (Mediatek MT7922). Trådbundna anslutningar sköts av ett Realtek-chip (RTL 816878111; 1 GBit/s).
| SD Card Reader | |
| average JPG Copy Test (av. of 3 runs) | |
| Genomsnitt av klass Multimedia (23 - 531, n=36, senaste 2 åren) | |
| Schenker XMG Fusion 15 (Mid 22) (AV PRO microSD 128 GB V60) | |
| Asus VivoBook Pro 16 (AV Pro SD microSD 128 GB V60) | |
| Dell Inspiron 16 Plus 7620 (Toshiba Exceria Pro SDXC 64 GB UHS-II) | |
| maximum AS SSD Seq Read Test (1GB) | |
| Genomsnitt av klass Multimedia (37.3 - 1455, n=35, senaste 2 åren) | |
| Asus VivoBook Pro 16 (AV Pro SD microSD 128 GB V60) | |
| Dell Inspiron 16 Plus 7620 (Toshiba Exceria Pro SDXC 64 GB UHS-II) | |


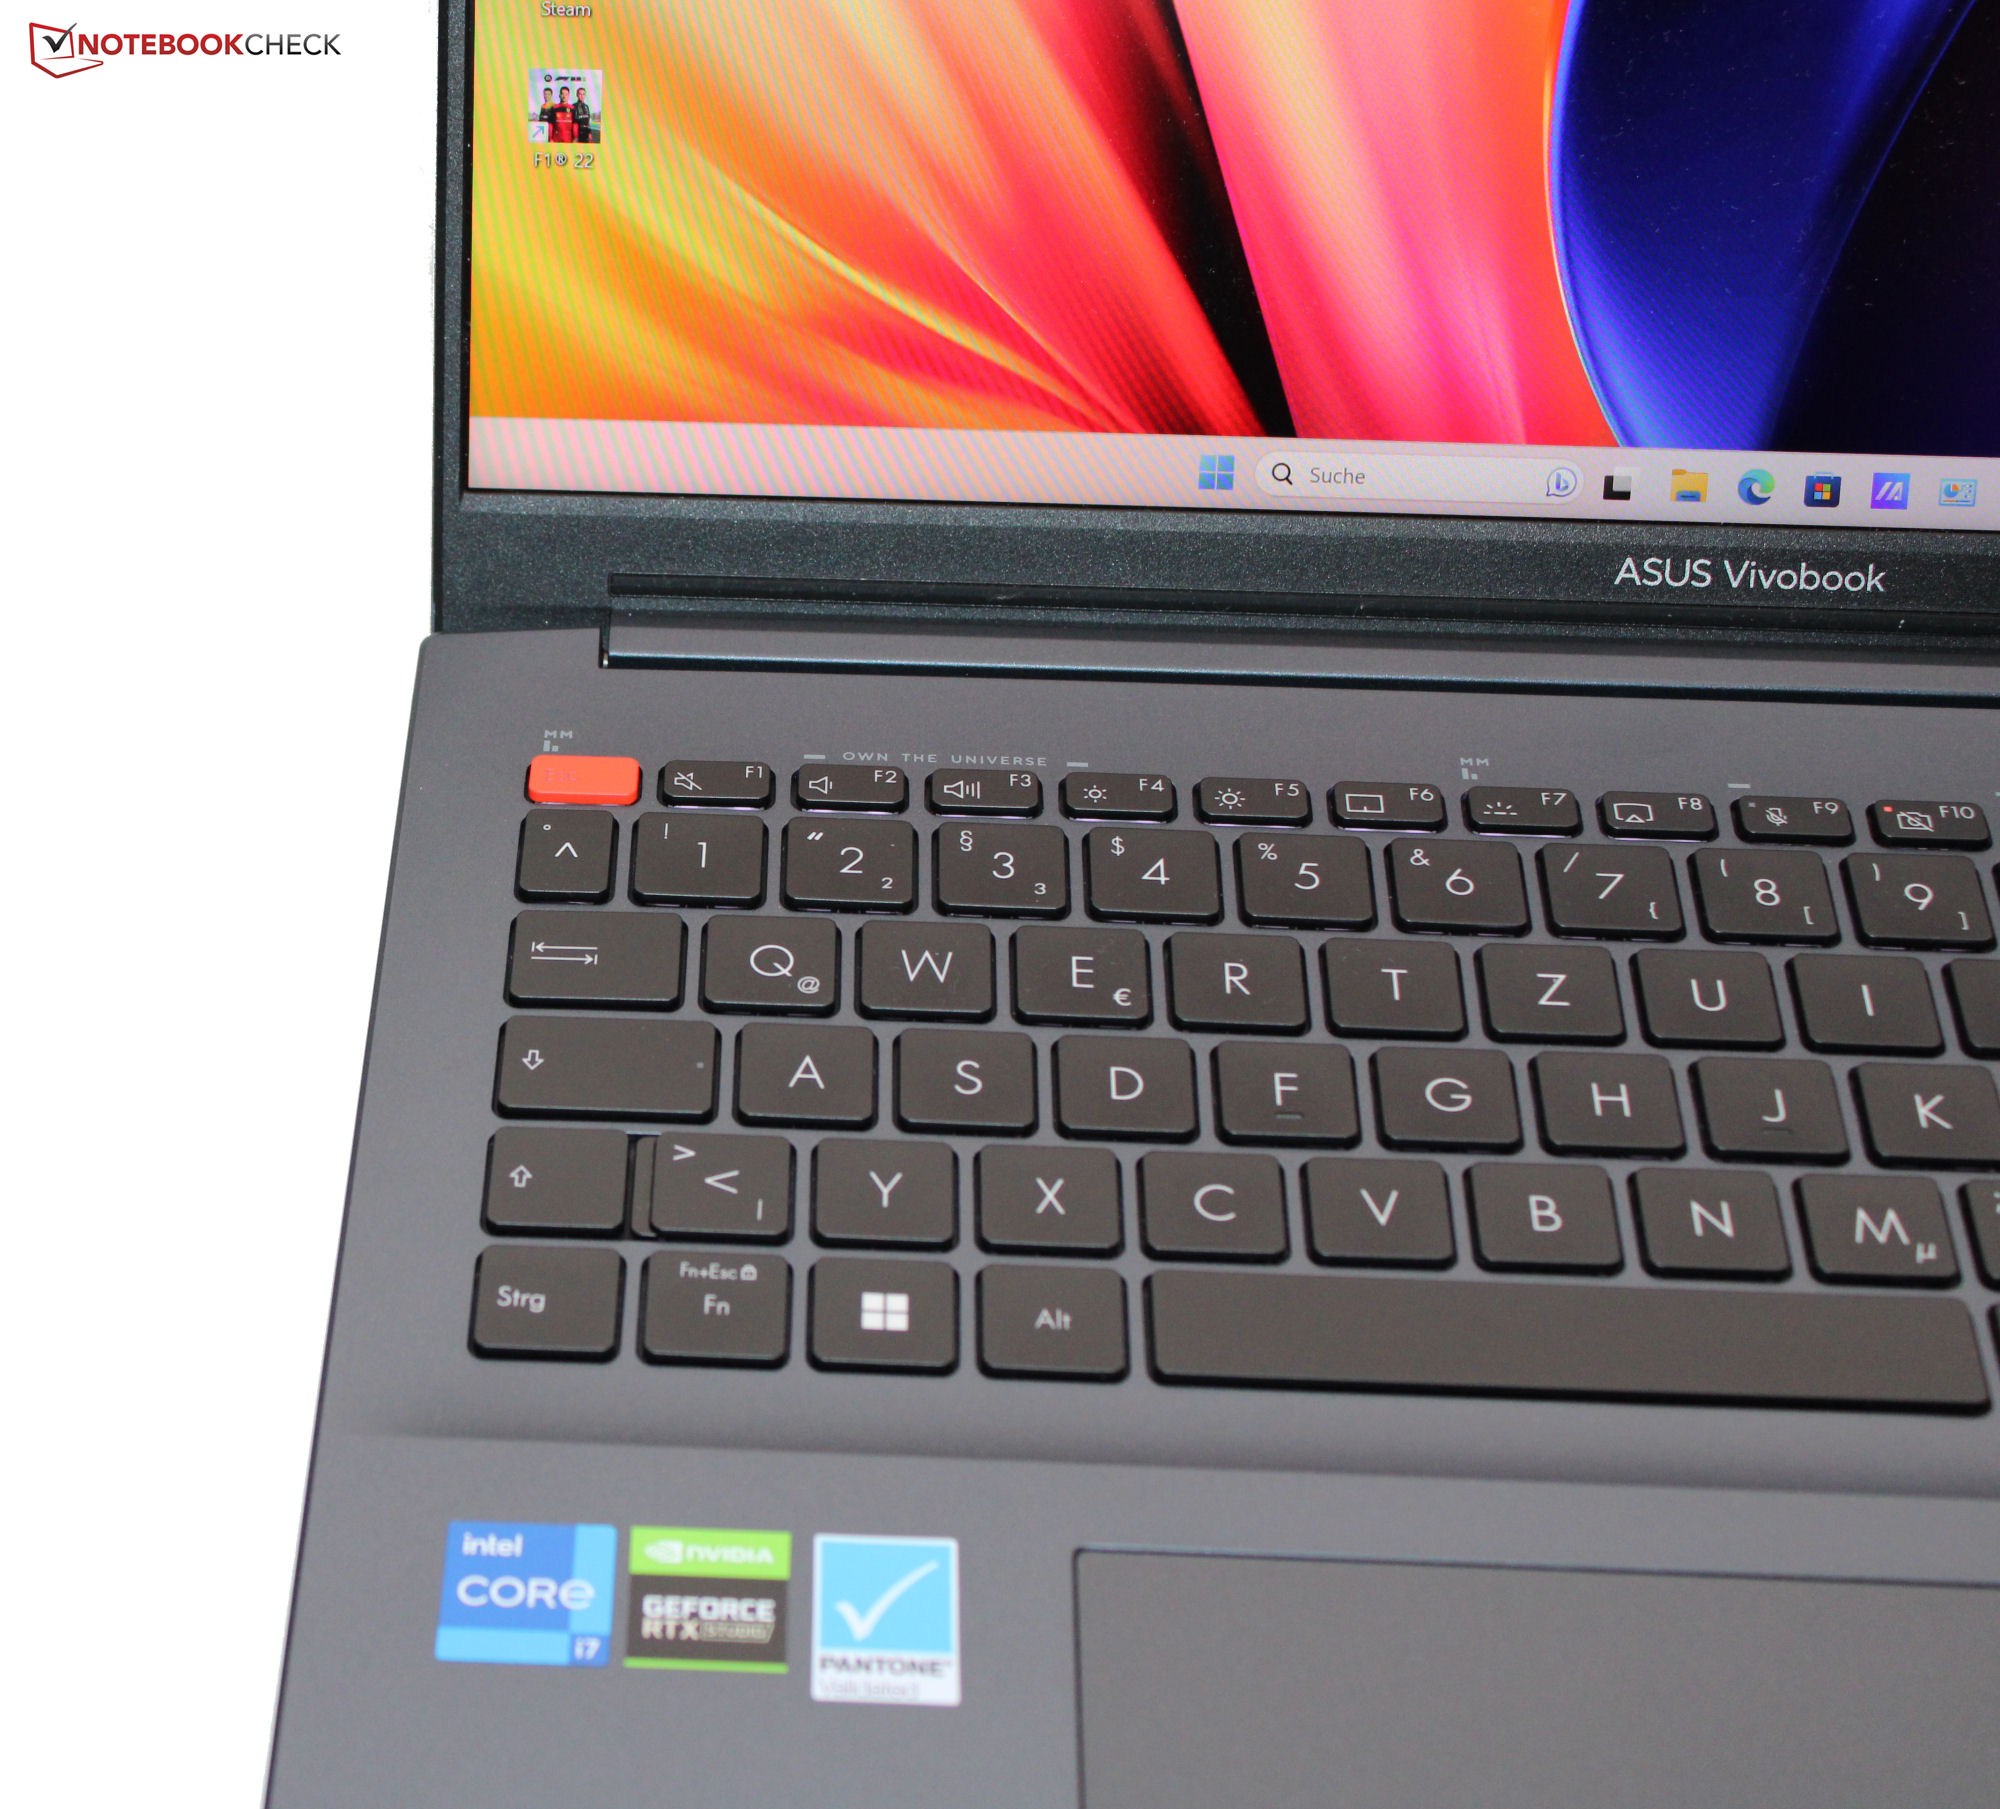
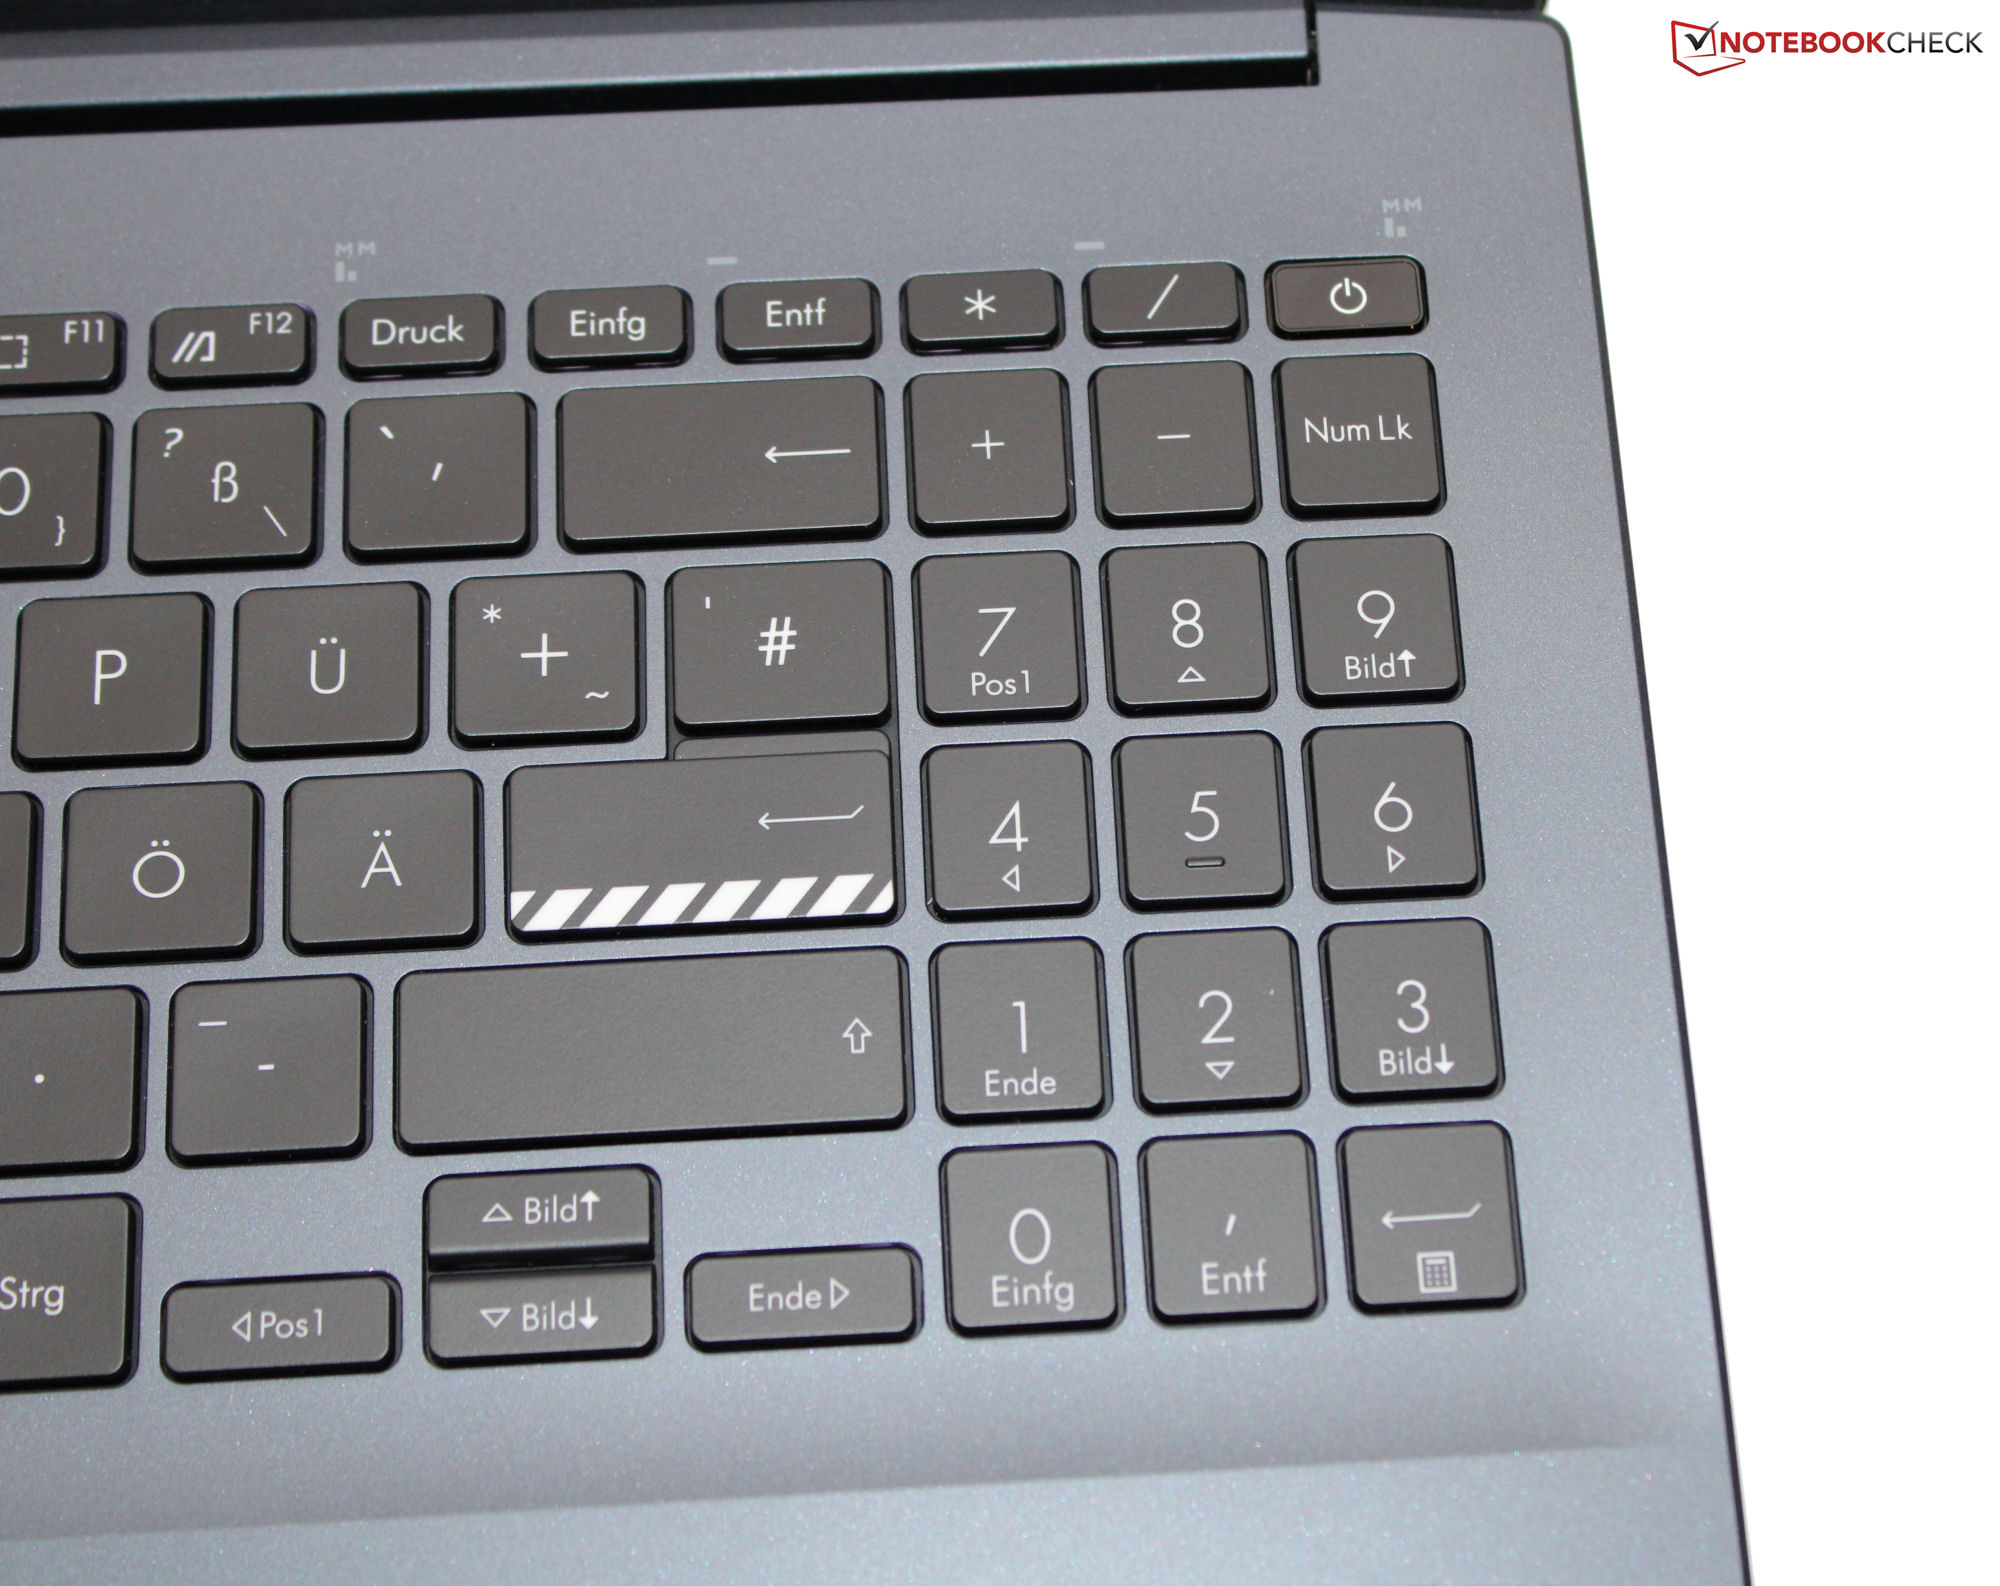
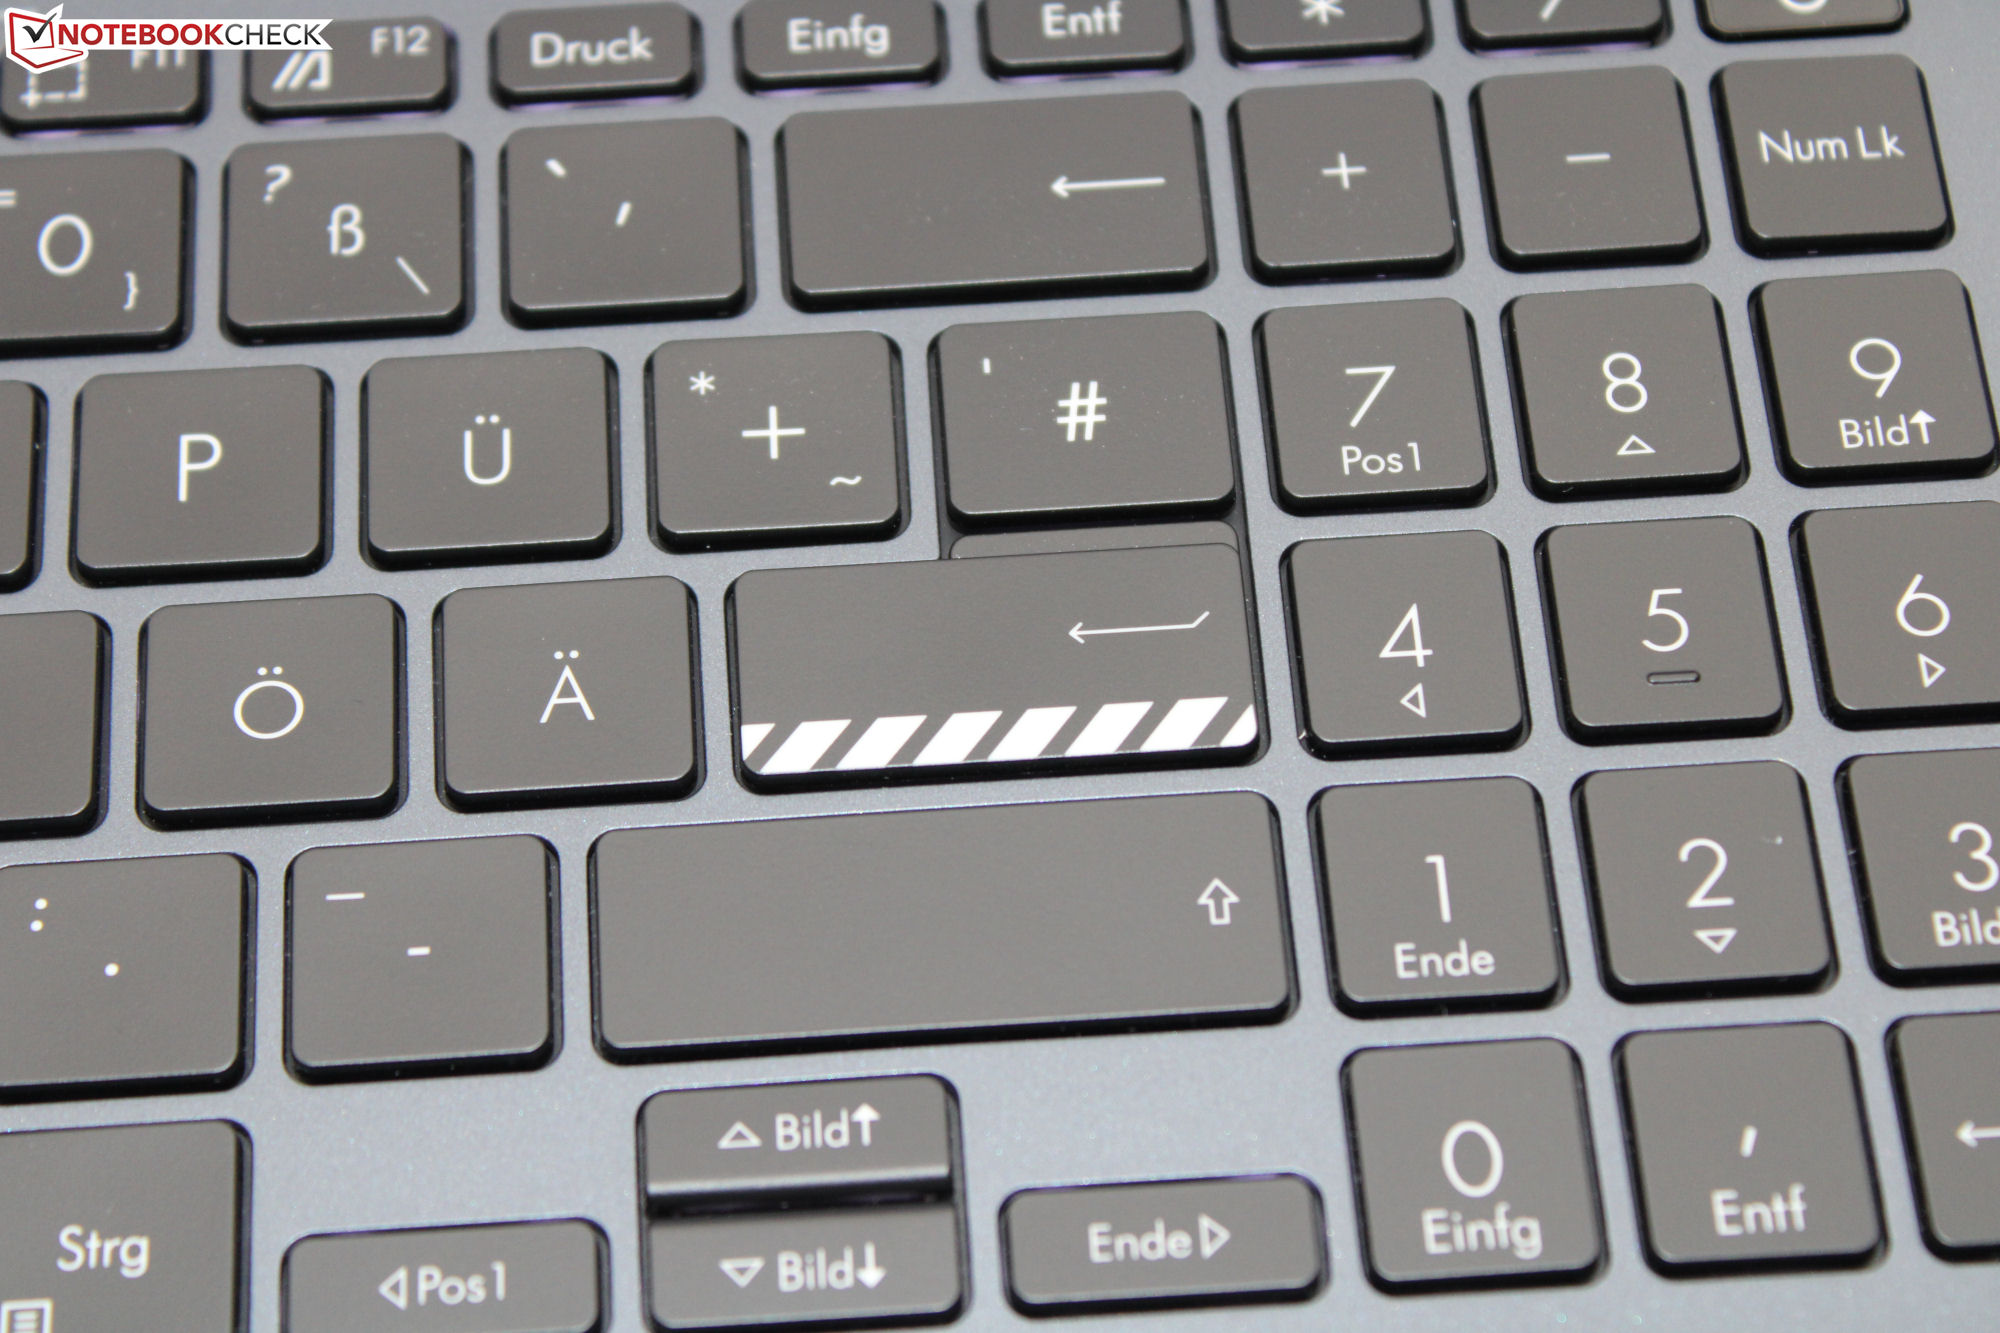
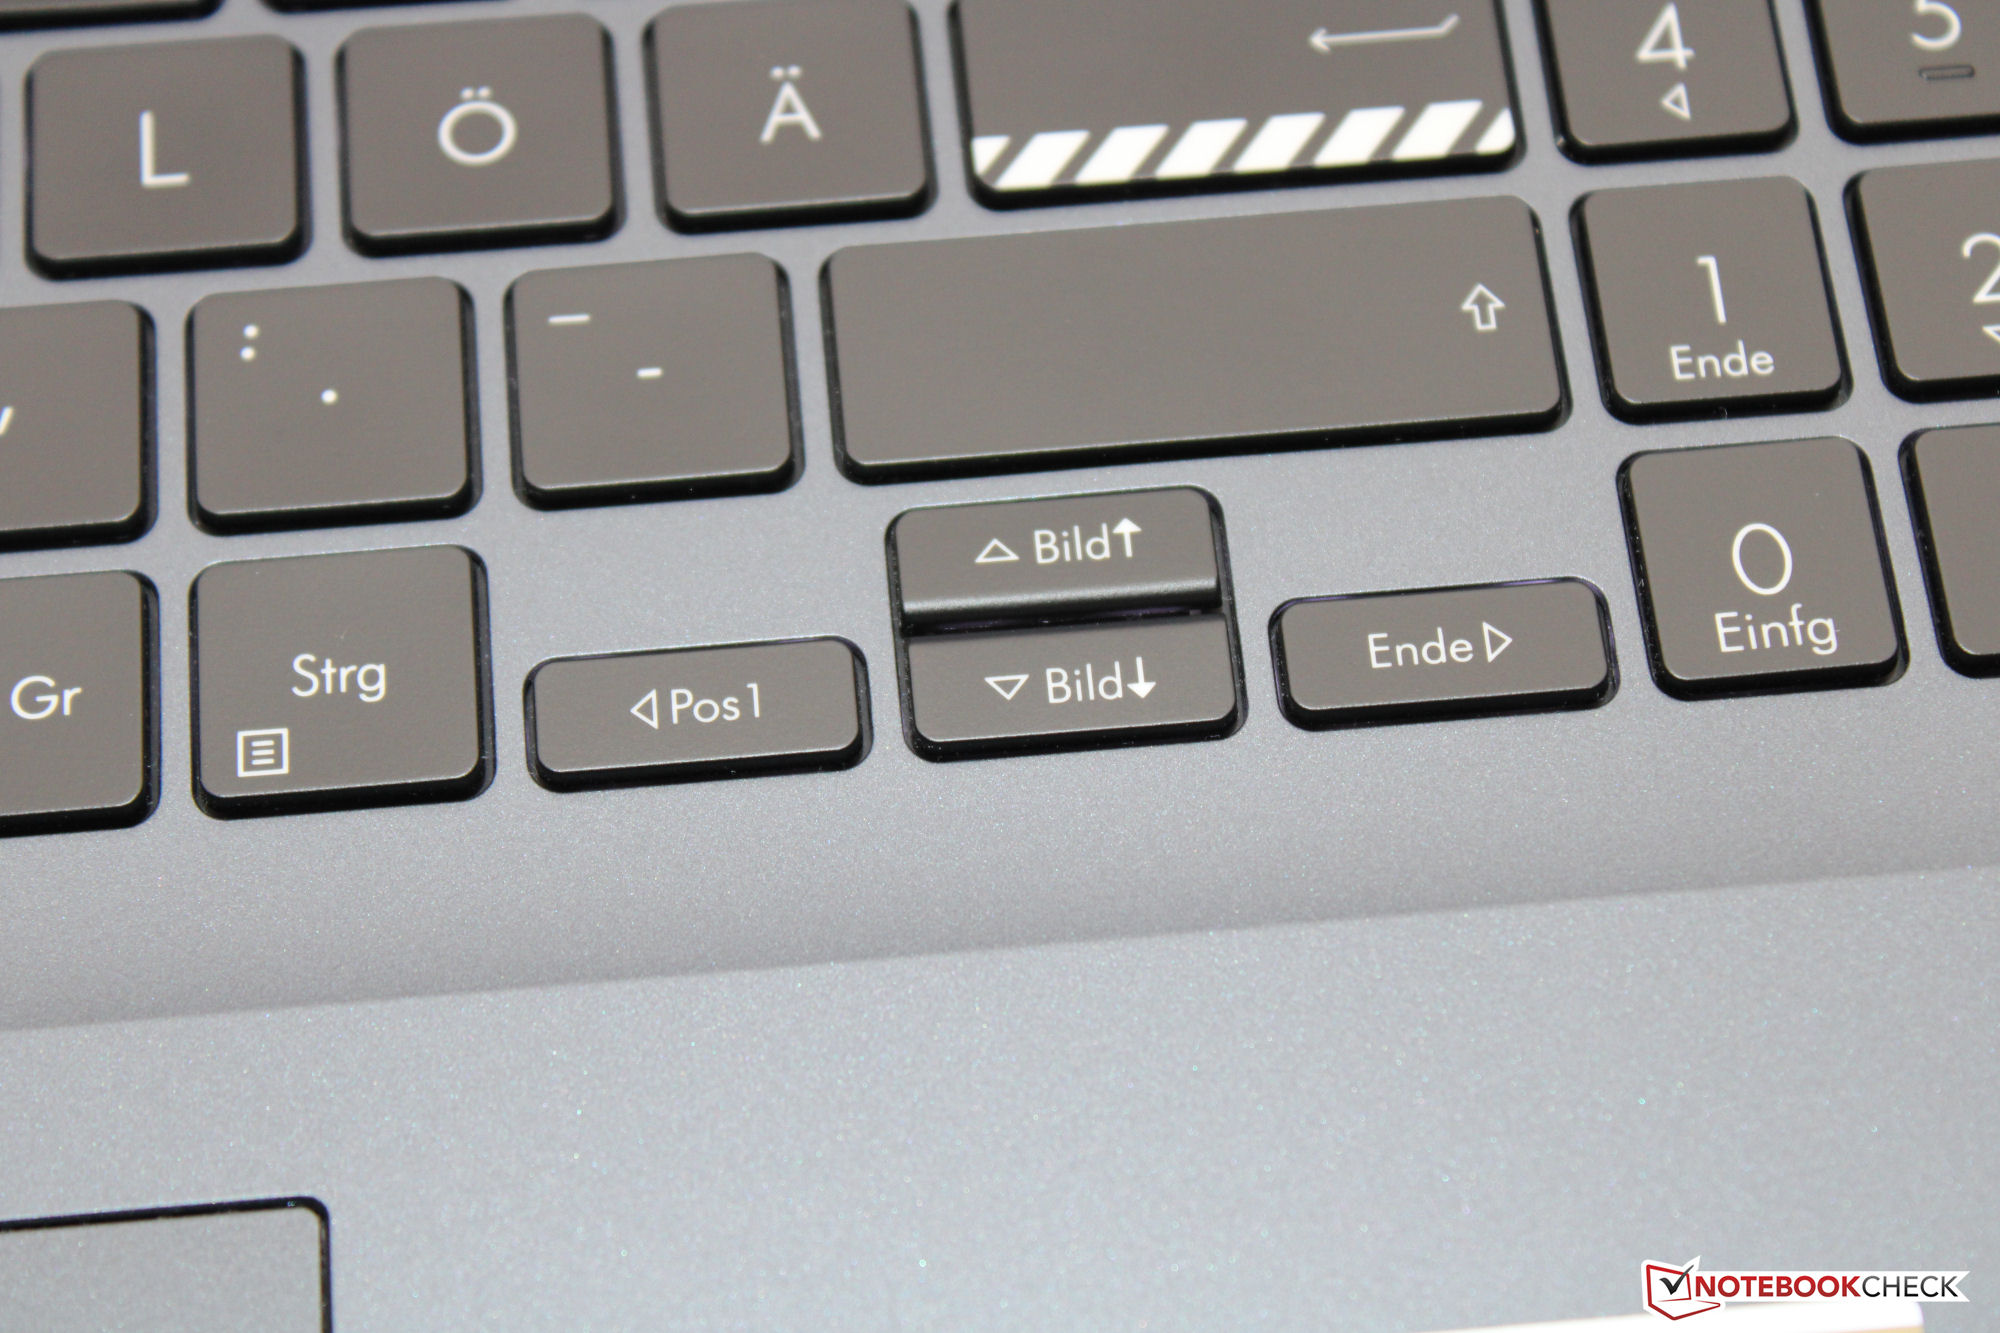
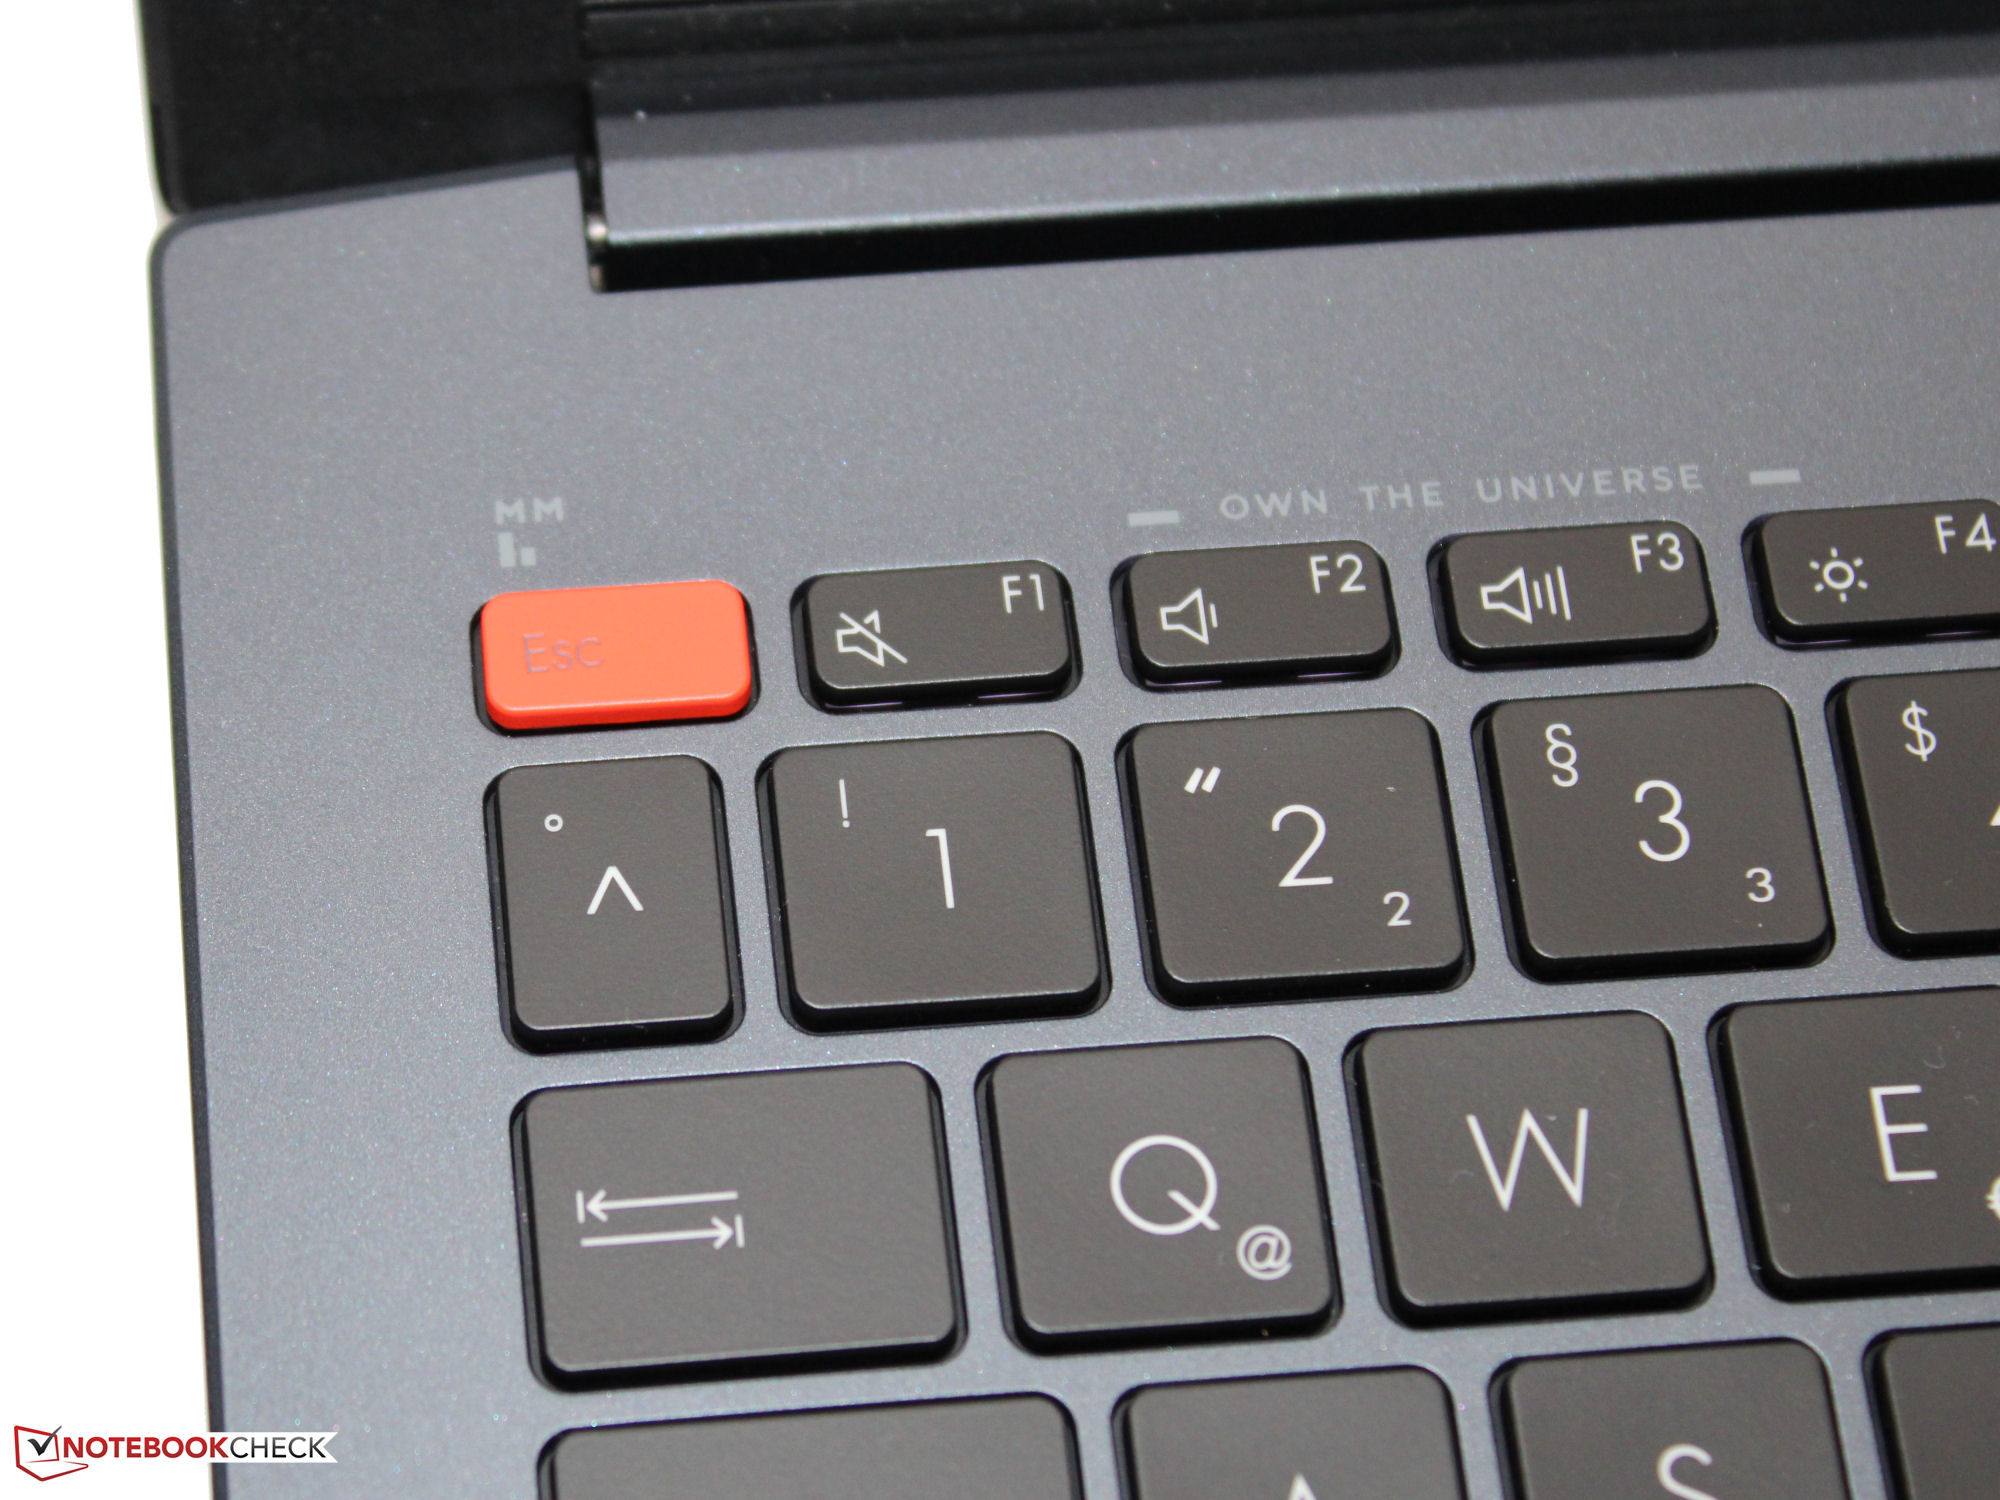
Inmatningsenheter - Asus-datorn med ett belyst tangentbord
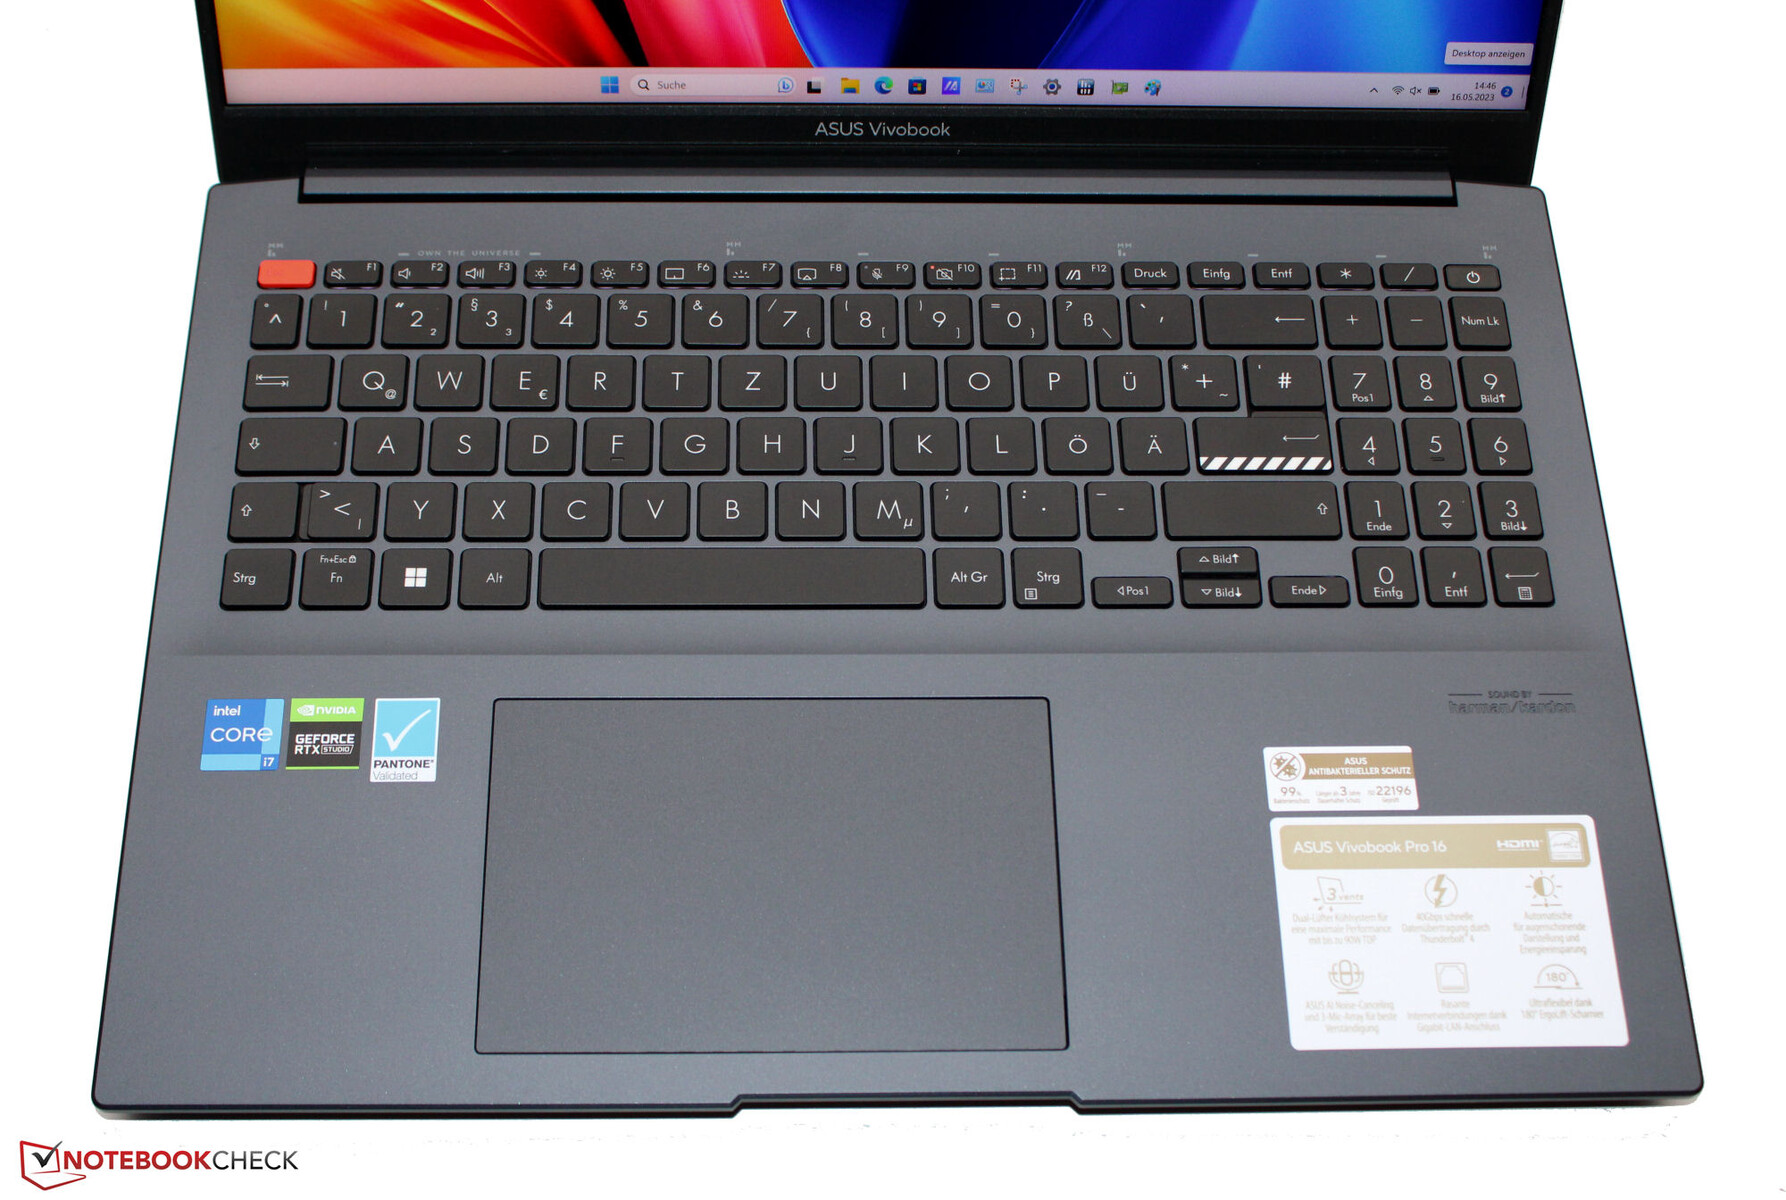
Chiclet-tangentbordets tangenter (delvis böjda och med tre belysningslägen) har ett medelhögt lyft och en tydlig tryckpunkt. De har trevliga nivåer av motstånd - men de skulle kunna kännas lite skarpare. Tangentbordet har en liten eftergift när du skriver - detta är egentligen inget negativt. Allt som allt är Asus bärbara datorers tangentbord bra för vardagligt bruk.
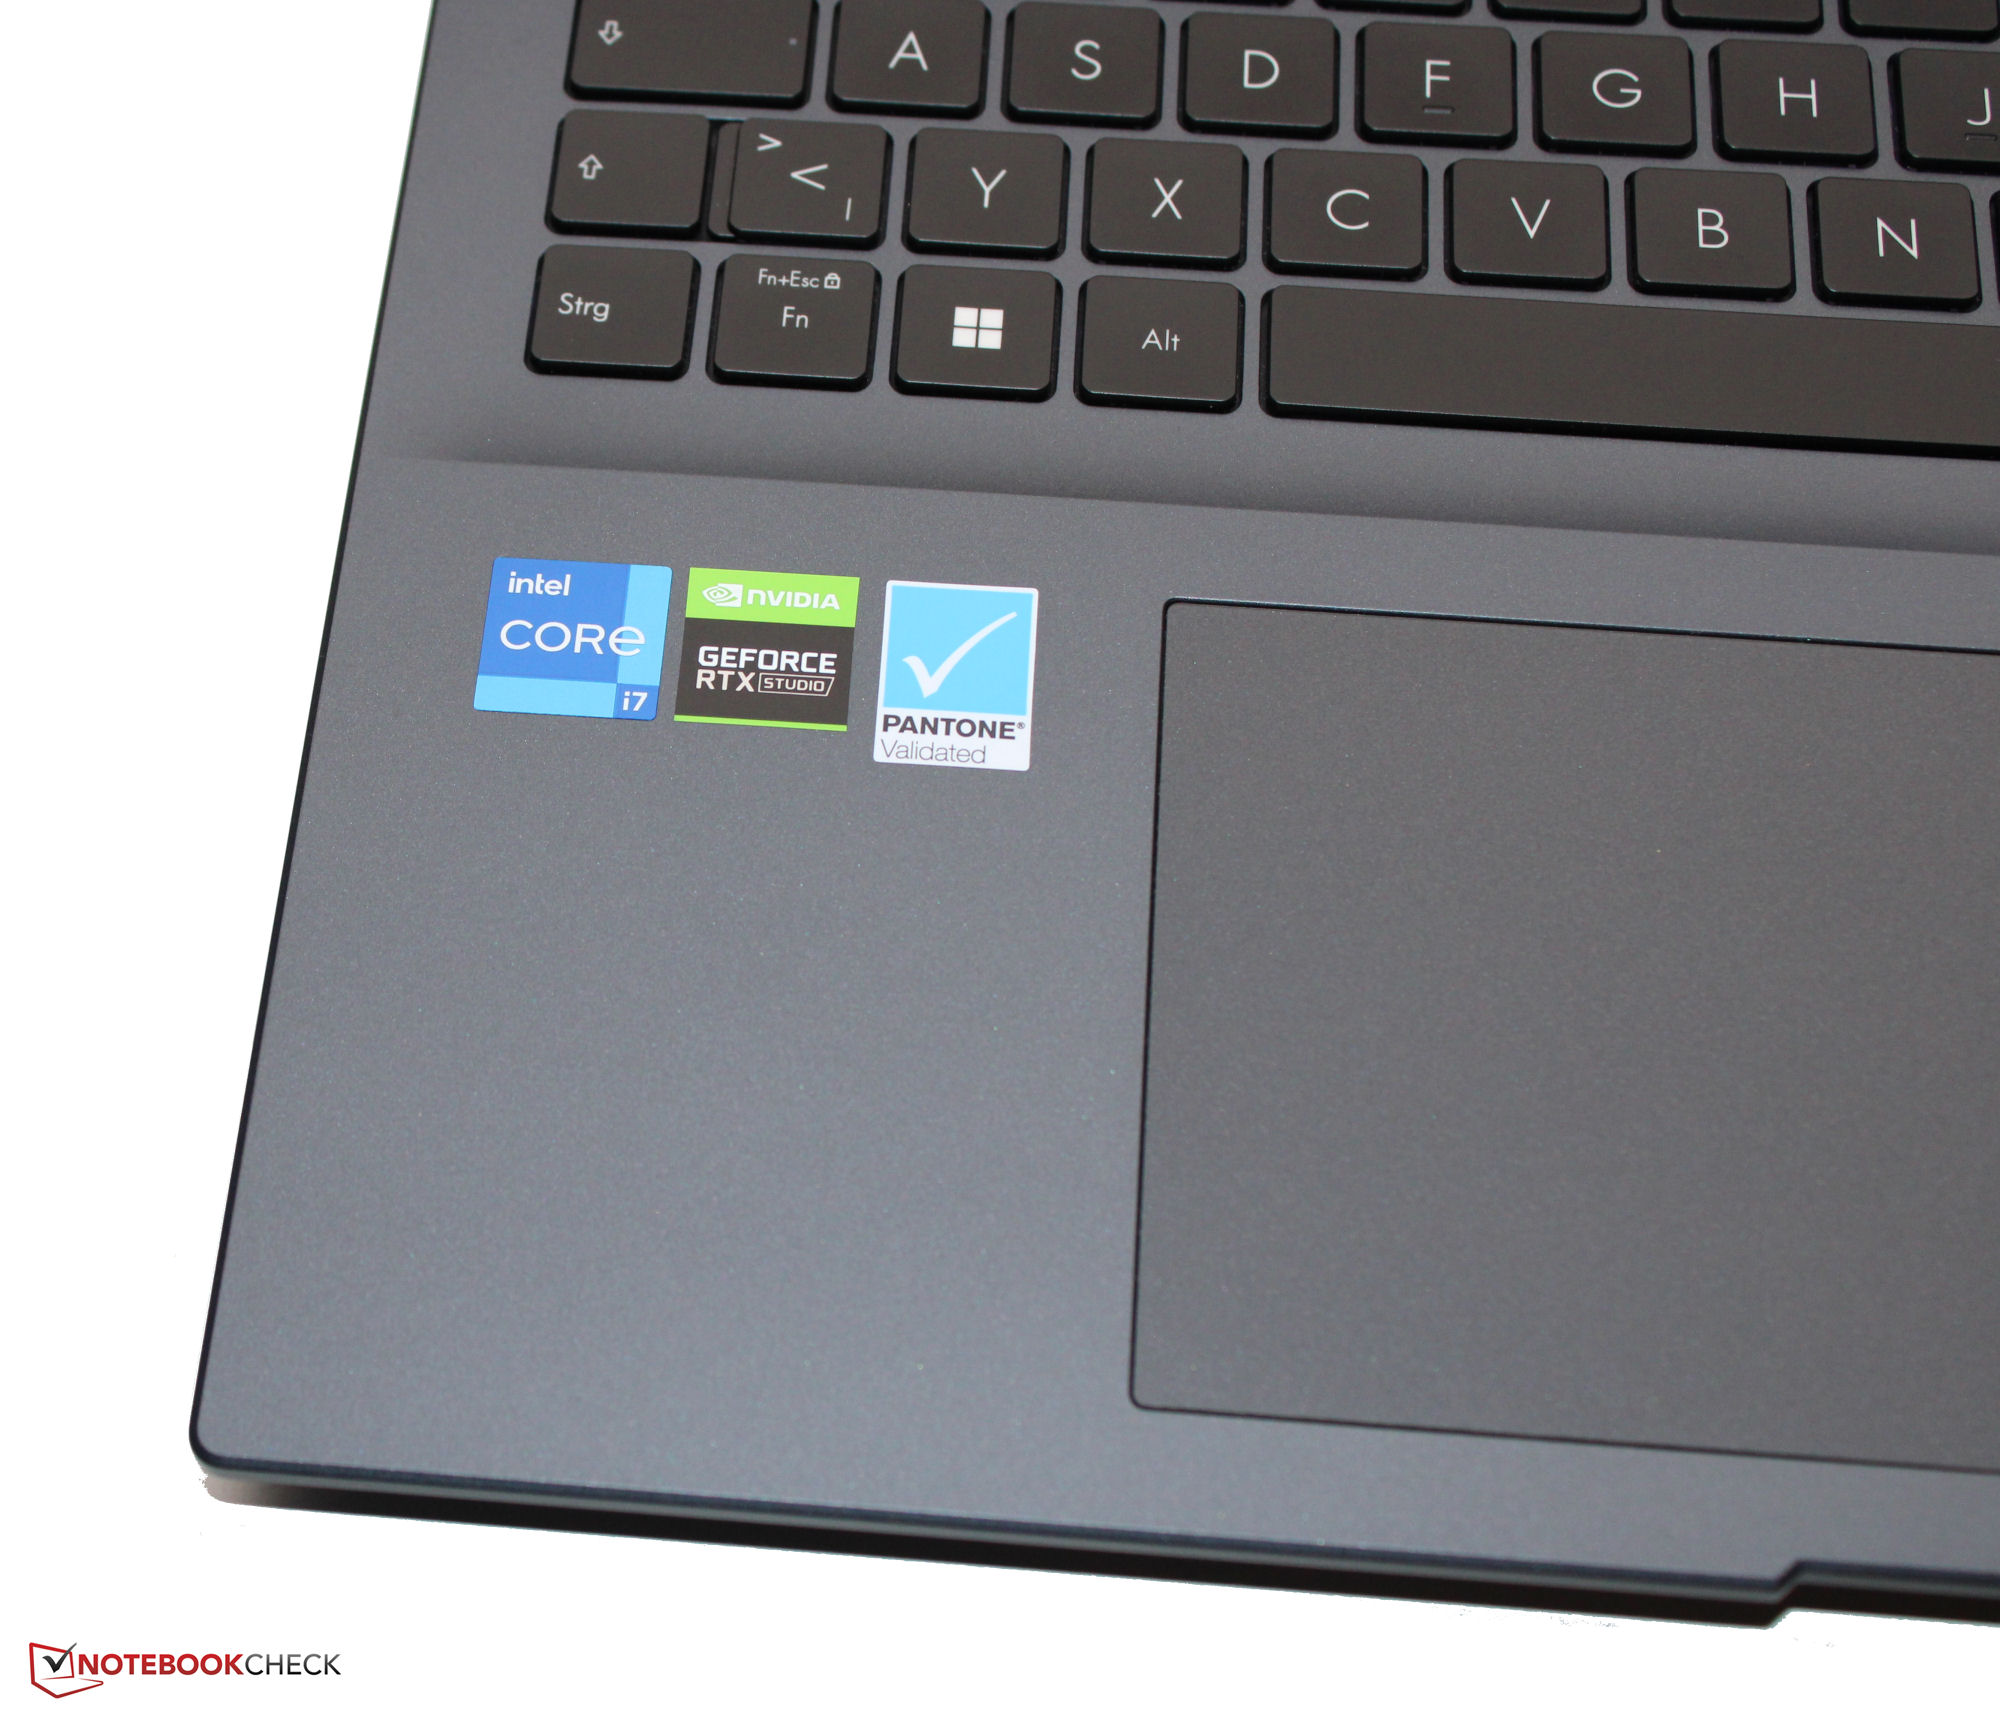
En klickplatta (13 x 8,5 cm) ersätter behovet av en mus och dess släta yta gör att dina fingrar glider bekvämt över den. Det reagerar på inmatningar ända ut till kanterna, har ett minimalt lyft och en tydlig tryckpunkt.
Skärm - 16:10-panel med DCI-P3-täckning

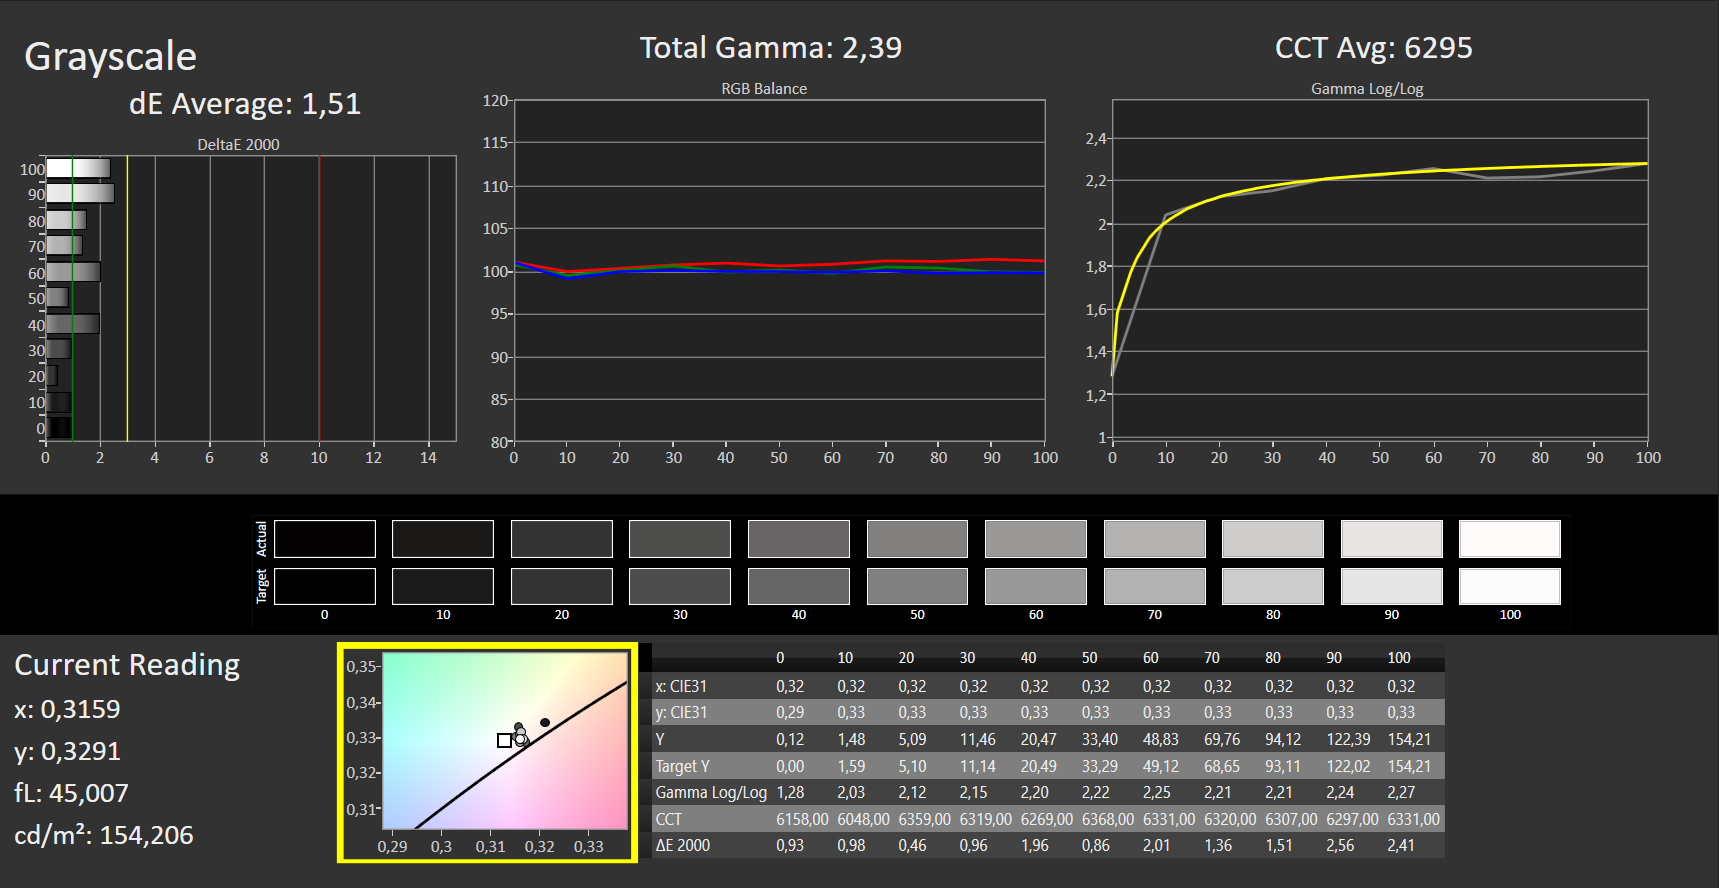
Den snabbt reagerande 120 Hz-panelen i 16:10-format visar inga tecken på PWM-flimmer vid alla ljusstyrkor. Ljusstyrka och kontrast på den matta 16-tumsskärmen (2 560 x 1 600 pixlar) är precis som de ska vara (> 300 cd/m² eller 1 000:1).
| |||||||||||||||||||||||||
Distribution av ljusstyrkan: 87 %
Mitt på batteriet: 509 cd/m²
Kontrast: 1440:1 (Svärta: 0.35 cd/m²)
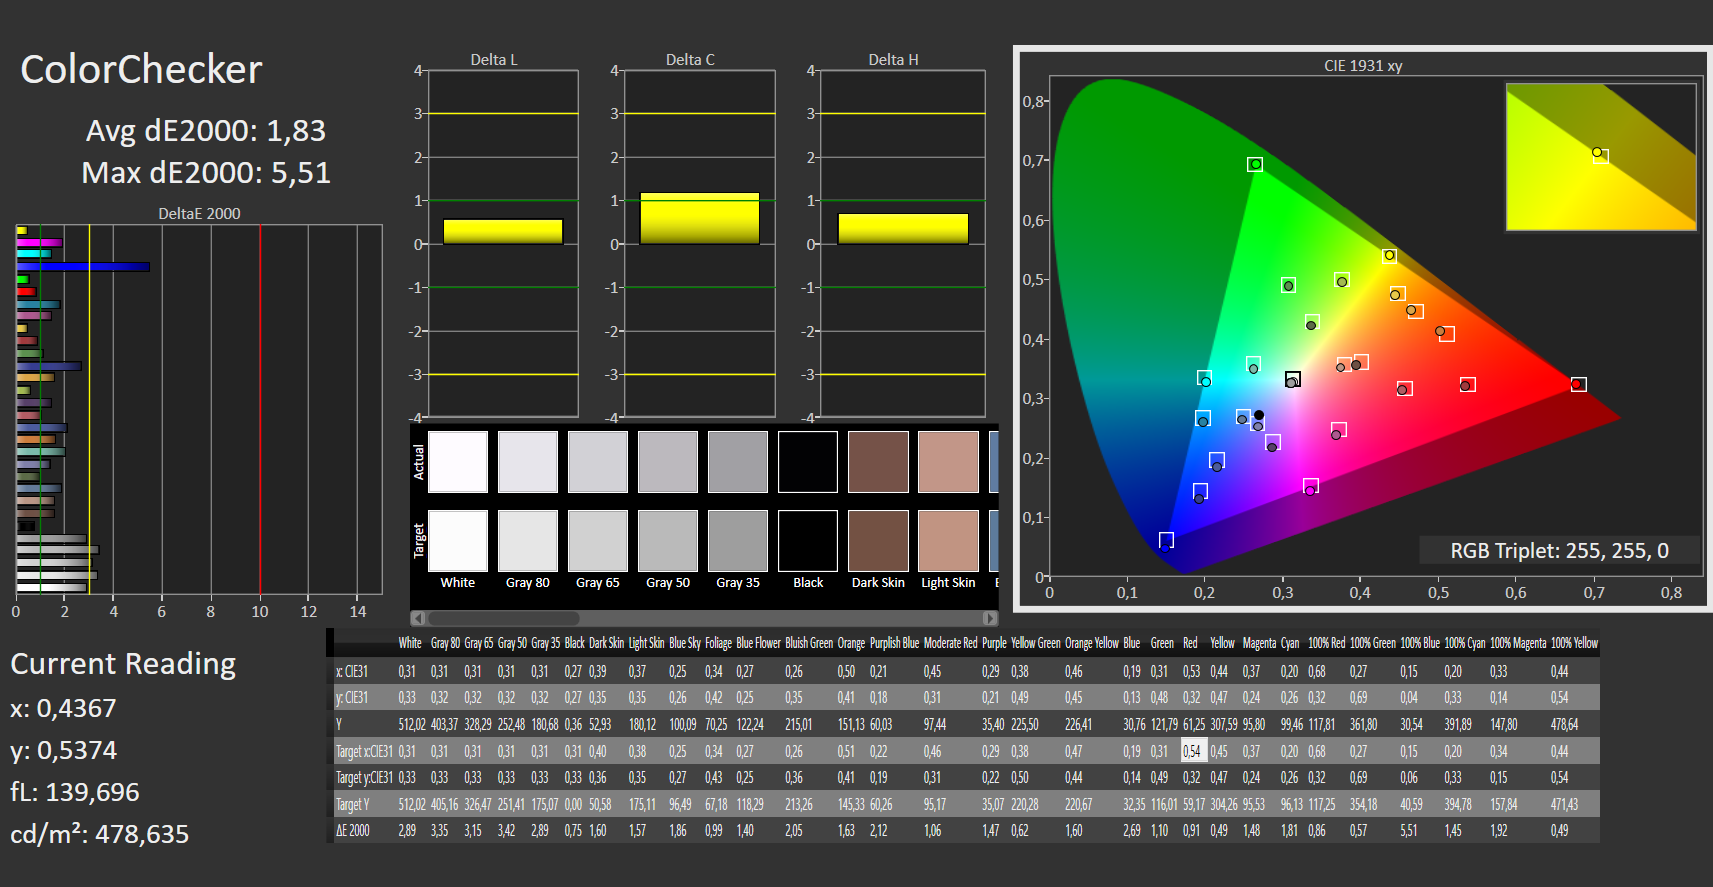
ΔE ColorChecker Calman: 1.83 | ∀{0.5-29.43 Ø4.71}
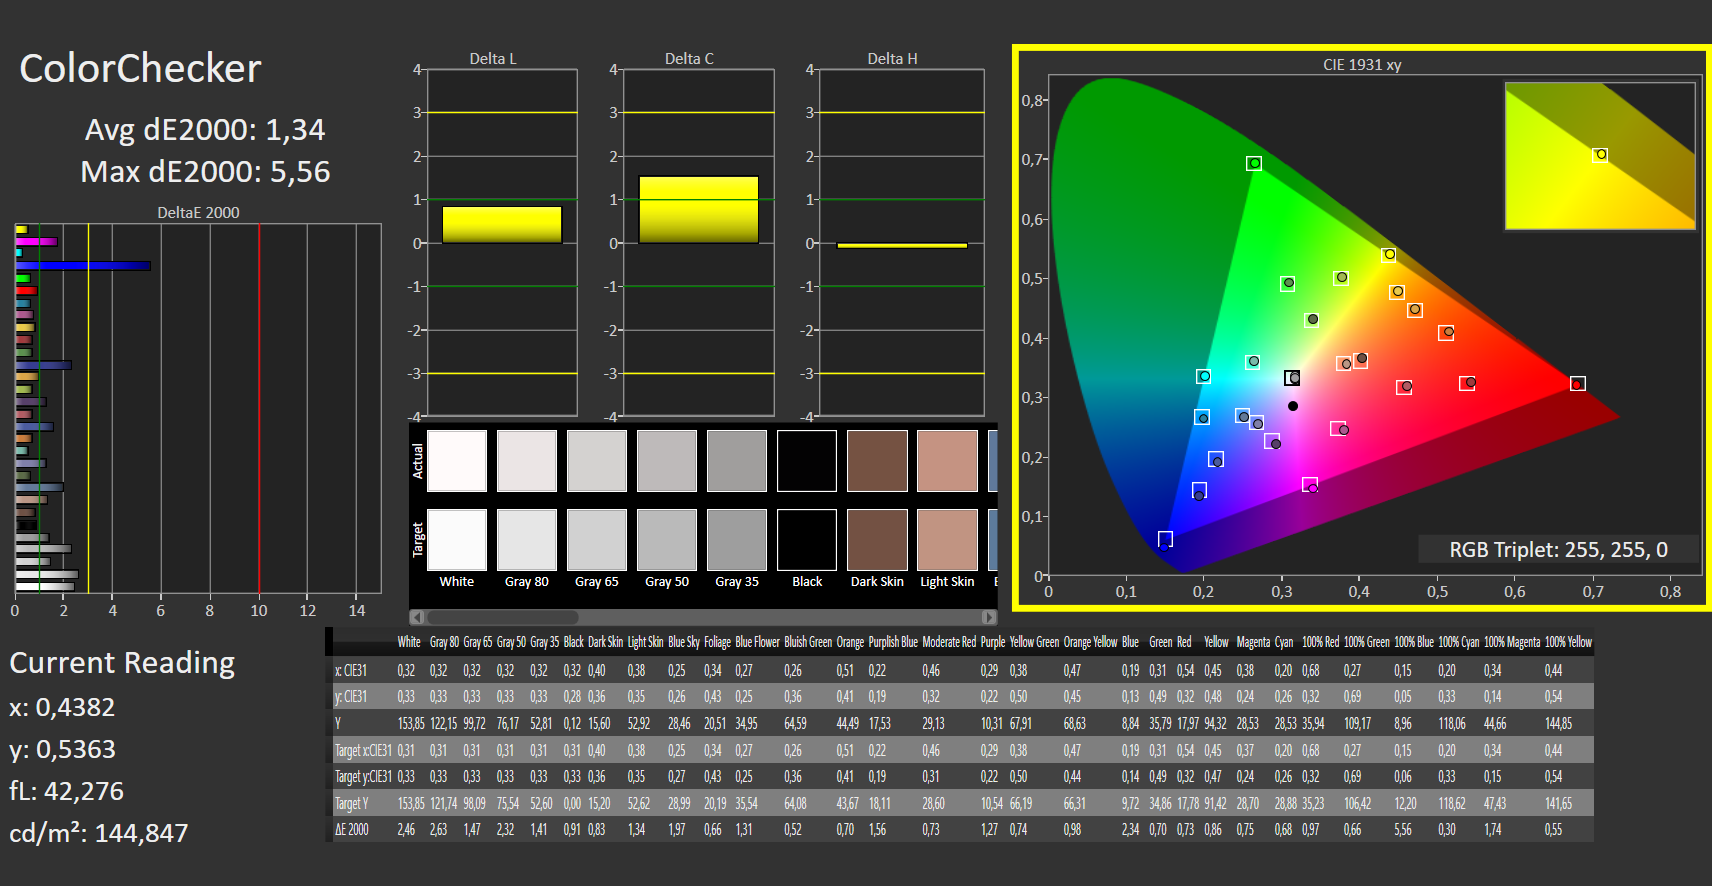
calibrated: 1.34
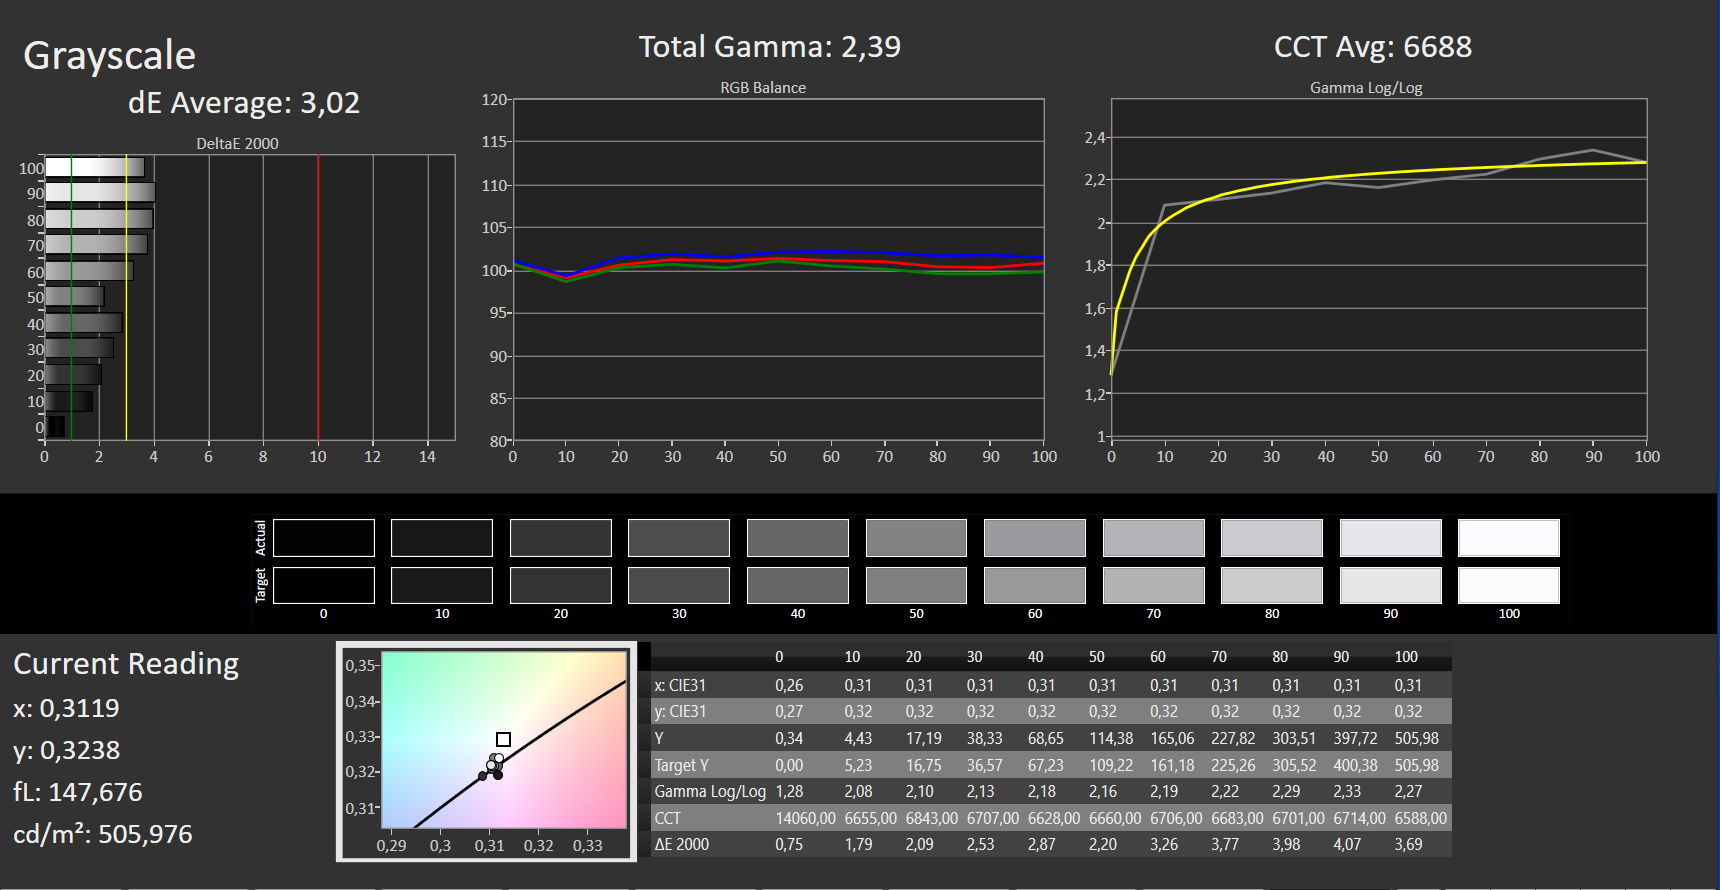
ΔE Greyscale Calman: 3.02 | ∀{0.09-98 Ø4.96}
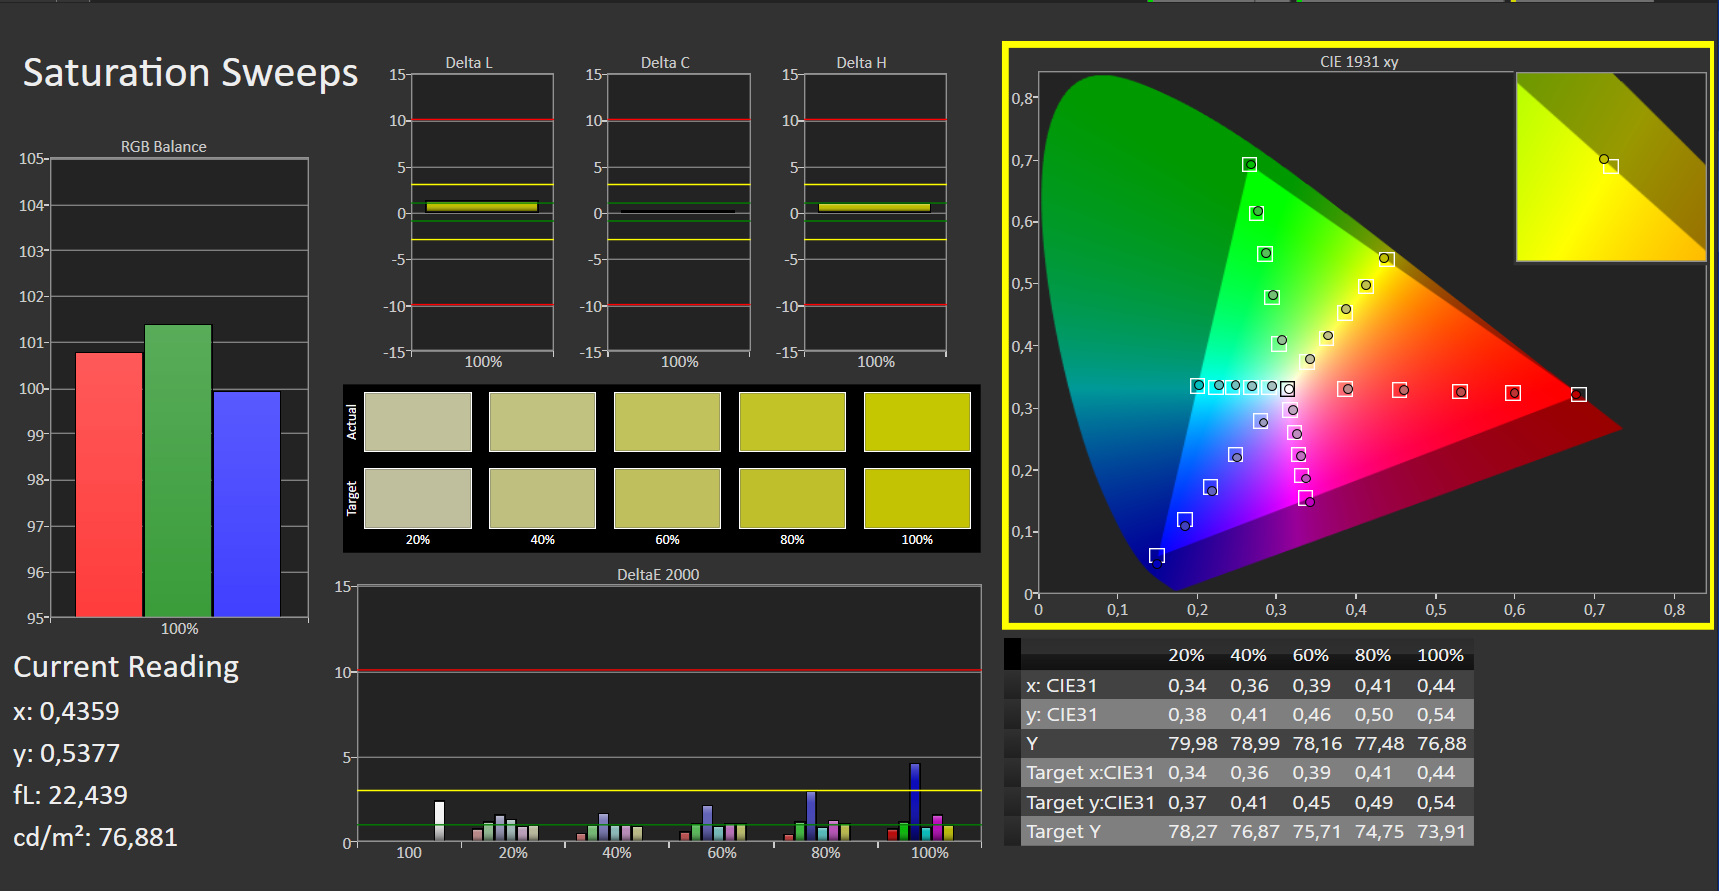
86.1% AdobeRGB 1998 (Argyll 3D)
99.9% sRGB (Argyll 3D)
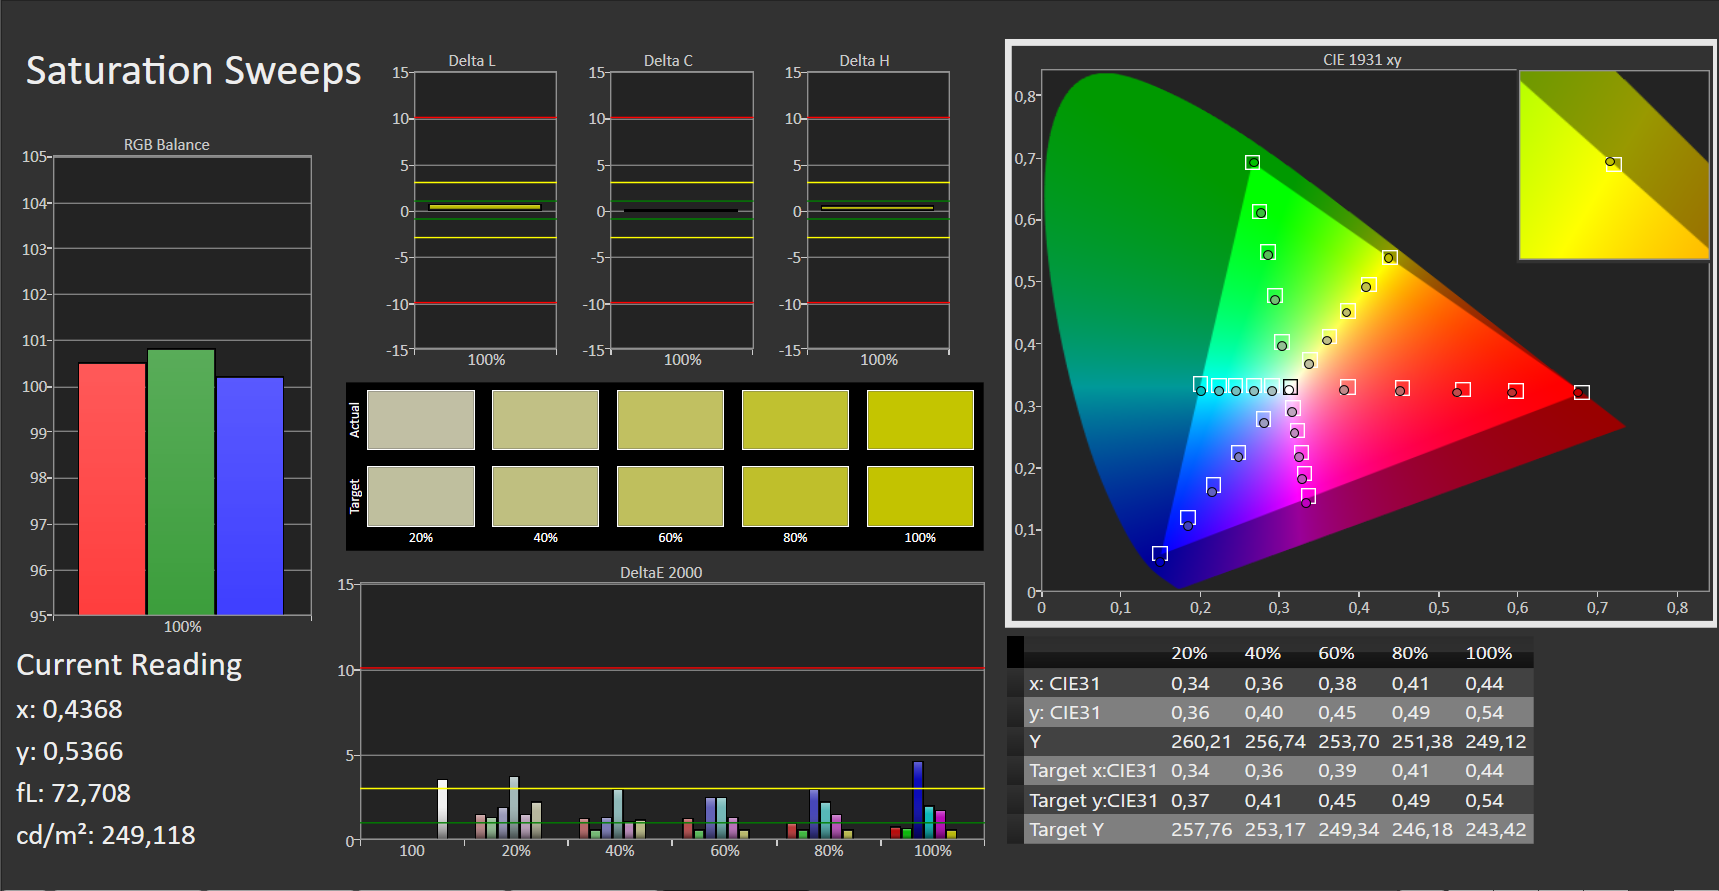
98.5% Display P3 (Argyll 3D)
Gamma: 2.39
CCT: 6688 K
| Asus VivoBook Pro 16 Au Optronics B160QAN02.L, IPS, 2560x1600, 16" | Dell Inspiron 16 Plus 7620 BOE NE16N41, IPS, 3072x1920, 16" | Schenker XMG Fusion 15 (Mid 22) BOE CQ NE156QHM-NY2, IPS, 2560x1440, 15.6" | Acer Swift X SFX16-52G-77RX B160QAN02.M, IPS-LED, 2560x1600, 16" | |
|---|---|---|---|---|
| Display | -14% | -19% | -11% | |
| Display P3 Coverage (%) | 98.5 | 70.8 -28% | 67.3 -32% | 76.4 -22% |
| sRGB Coverage (%) | 99.9 | 99.5 0% | 96.7 -3% | 100 0% |
| AdobeRGB 1998 Coverage (%) | 86.1 | 73.2 -15% | 68.2 -21% | 76.6 -11% |
| Response Times | -1025% | -234% | -819% | |
| Response Time Grey 50% / Grey 80% * (ms) | 2 ? | 38 ? -1800% | 11.6 ? -480% | 33 ? -1550% |
| Response Time Black / White * (ms) | 8 ? | 28 ? -250% | 7 ? 12% | 15 ? -88% |
| PWM Frequency (Hz) | ||||
| Screen | 7% | -32% | -4% | |
| Brightness middle (cd/m²) | 504 | 288.9 -43% | 326 -35% | 411 -18% |
| Brightness (cd/m²) | 465 | 276 -41% | 303 -35% | 378 -19% |
| Brightness Distribution (%) | 87 | 92 6% | 89 2% | 83 -5% |
| Black Level * (cd/m²) | 0.35 | 0.26 26% | 0.33 6% | 0.29 17% |
| Contrast (:1) | 1440 | 1111 -23% | 988 -31% | 1417 -2% |
| Colorchecker dE 2000 * | 1.83 | 1.88 -3% | 2.73 -49% | 2.18 -19% |
| Colorchecker dE 2000 max. * | 5.51 | 4.37 21% | 9.54 -73% | 4.84 12% |
| Colorchecker dE 2000 calibrated * | 1.34 | 0.42 69% | 1.36 -1% | 1.48 -10% |
| Greyscale dE 2000 * | 3.02 | 1.4 54% | 5.2 -72% | 2.68 11% |
| Gamma | 2.39 92% | 2.3 96% | 2.074 106% | 2.43 91% |
| CCT | 6688 97% | 6634 98% | 6911 94% | 6717 97% |
| Totalt genomsnitt (program/inställningar) | -344% /
-145% | -95% /
-58% | -278% /
-122% |
* ... mindre är bättre
Skärmens X Rite Pantone-certifiering innebär att den har en mycket naturlig färgåtergivning: Med avvikelser på cirka 1,8 ger den acceptabla resultat (DeltaE < 3) direkt från förpackningen. Kalibrering av den leder till en mindre avvikelse på 1,3 och mer balanserade gråtoner. Färgnoggrannheten är inget problem: Panelen kan avbilda hela DCI P3-färgrymden och 86 procent av Adobe RGB-rymden.
Visa svarstider
| ↔ Svarstid svart till vitt | ||
|---|---|---|
| 8 ms ... stiga ↗ och falla ↘ kombinerat | ↗ 1 ms stiga |  |
| ↘ 7 ms hösten | ||
| Skärmen visar snabba svarsfrekvenser i våra tester och bör passa för spel. I jämförelse sträcker sig alla testade enheter från 0.1 (minst) till 240 (maximalt) ms. » 22 % av alla enheter är bättre. Det betyder att den uppmätta svarstiden är bättre än genomsnittet av alla testade enheter (19.8 ms). | ||
| ↔ Svarstid 50 % grått till 80 % grått | ||
| 2 ms ... stiga ↗ och falla ↘ kombinerat | ↗ 1 ms stiga |  |
| ↘ 1 ms hösten | ||
| Skärmen visar väldigt snabba svarsfrekvenser i våra tester och borde vara mycket väl lämpad för fartfyllt spel. I jämförelse sträcker sig alla testade enheter från 0.165 (minst) till 636 (maximalt) ms. » 10 % av alla enheter är bättre. Det betyder att den uppmätta svarstiden är bättre än genomsnittet av alla testade enheter (30.9 ms). | ||
Skärmflimmer / PWM (Puls-Width Modulation)
| Skärmflimmer / PWM upptäcktes inte |     | ||
Som jämförelse: 52 % av alla testade enheter använder inte PWM för att dämpa skärmen. Om PWM upptäcktes mättes ett medelvärde av 7741 (minst: 5 - maximum: 343500) Hz. | |||
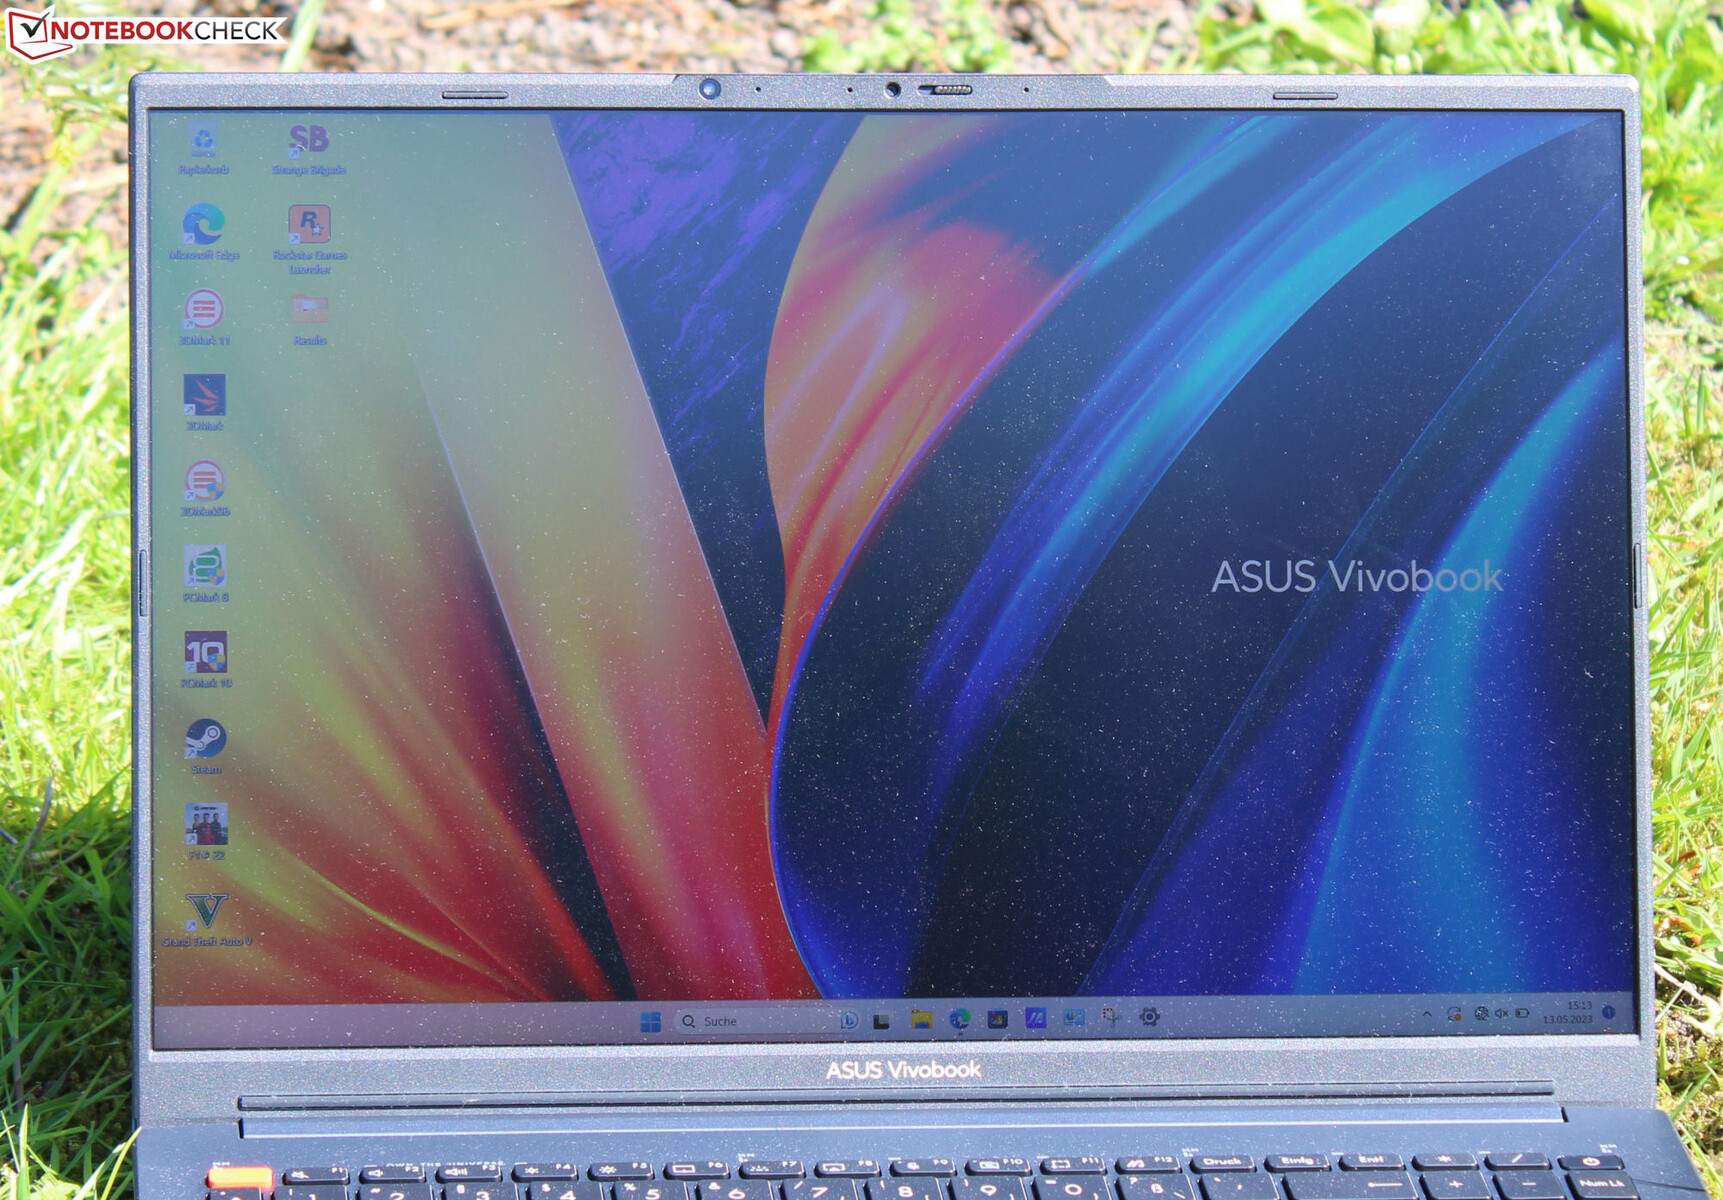
Den stabila IPS-panelen med betraktningsvinkel kan enkelt läsas från alla vinklar. Utomhus är skärmen i allmänhet läsbar så länge solen inte skiner för starkt.
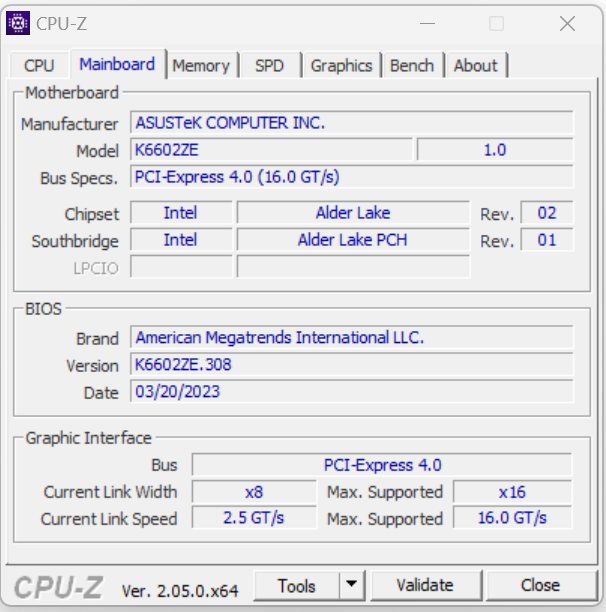
Prestanda - Alder Lake och Ampere
VivoBook Pro 16-serien består av 5 modellserier (se modellnummer) som är baserade på olika CPU- och GPU-generationer. Den nuvarande modellen K6602ZE använder Alder Lake CPU:er och enGeForce-RTX-3050-TgPU. Vår testenhets MRSP är 1 247 dollar. Andra varianter var inte tillgängliga vid testtillfället.
Provningsförhållanden
Du kan växla mellan tre tillverkarspecifika kylningslägen (se tabell) med hjälp av tangentkombinationen "Fn" + "F". Vi använde "standardläge" (benchmarks) och "whisper-läge" (batteritest).
| Prestandaläge | Standardläge | Whisper-läge | |
|---|---|---|---|
| Effektbegränsning 1 (HWInfo) | 80 watt | 50 watt | 28 watt |
| Effektgräns 2 (HWInfo) | 120 watt | 120 watt | 120 watt |
| TGP (Witcher 3) | 65 watt | 50 watt | 25 watt |
Processor
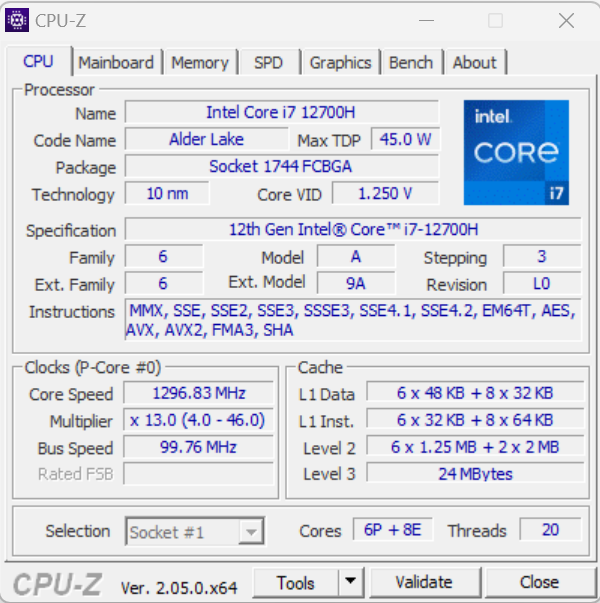
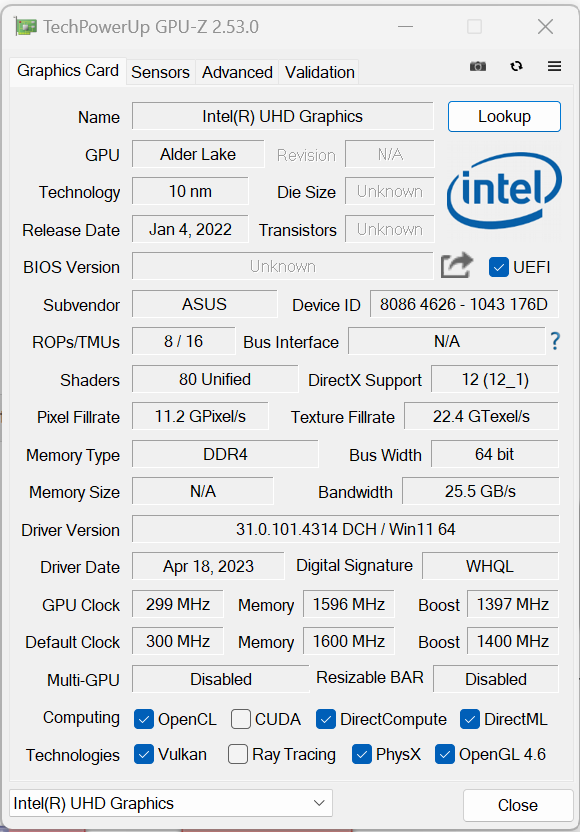
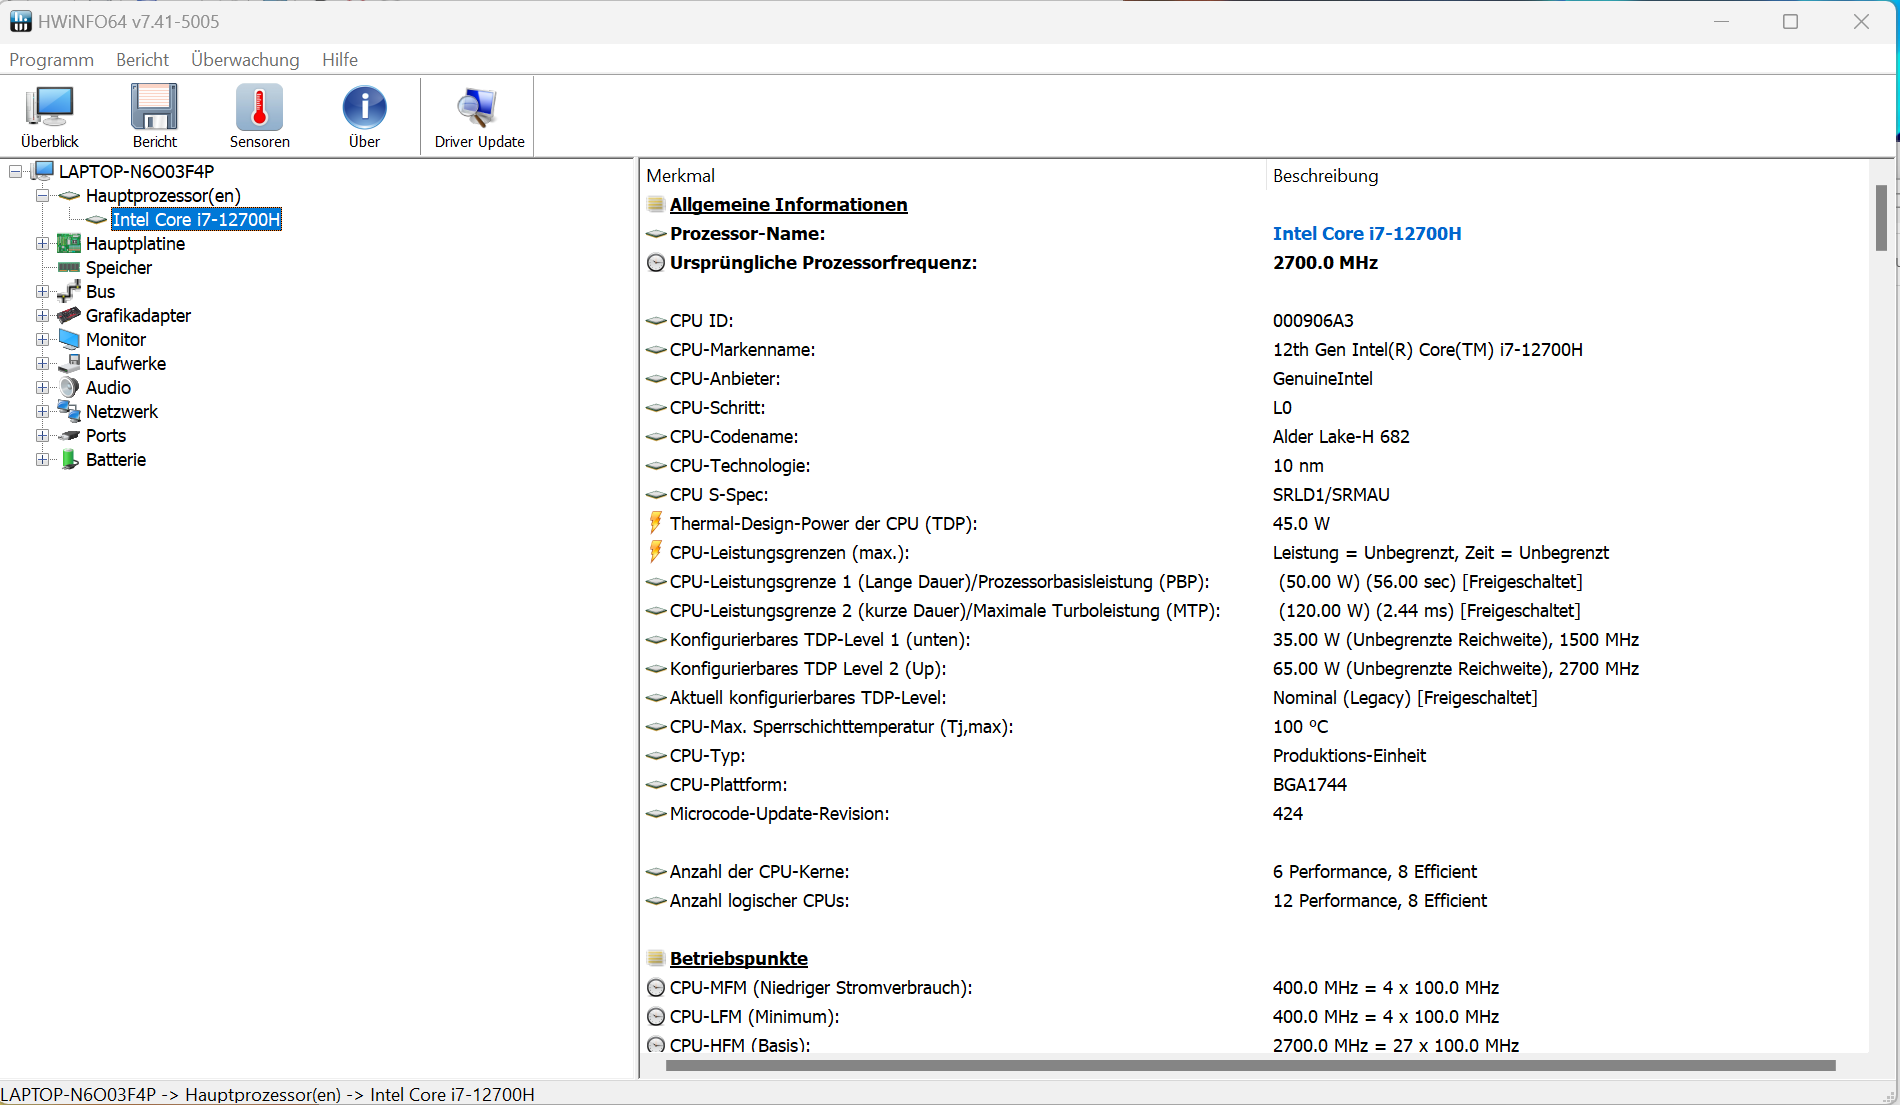
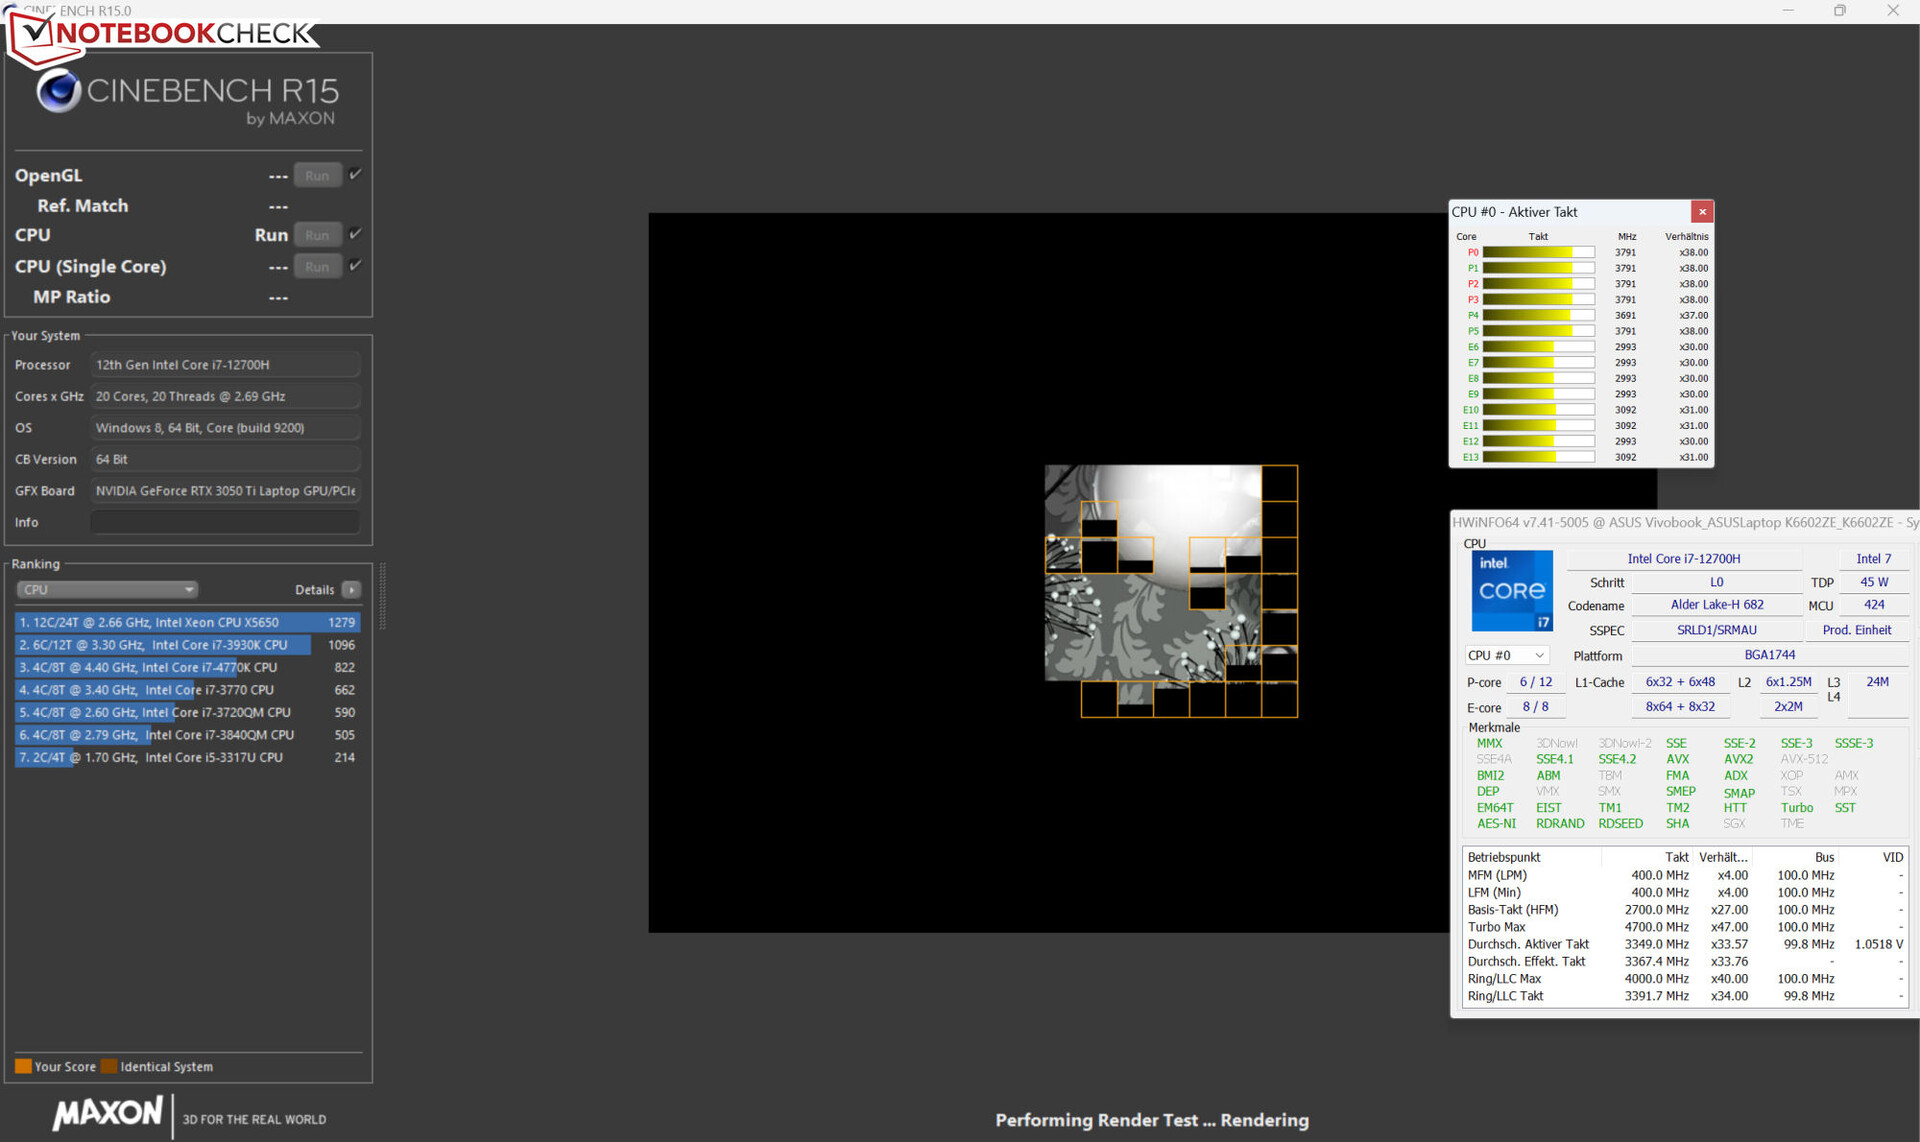
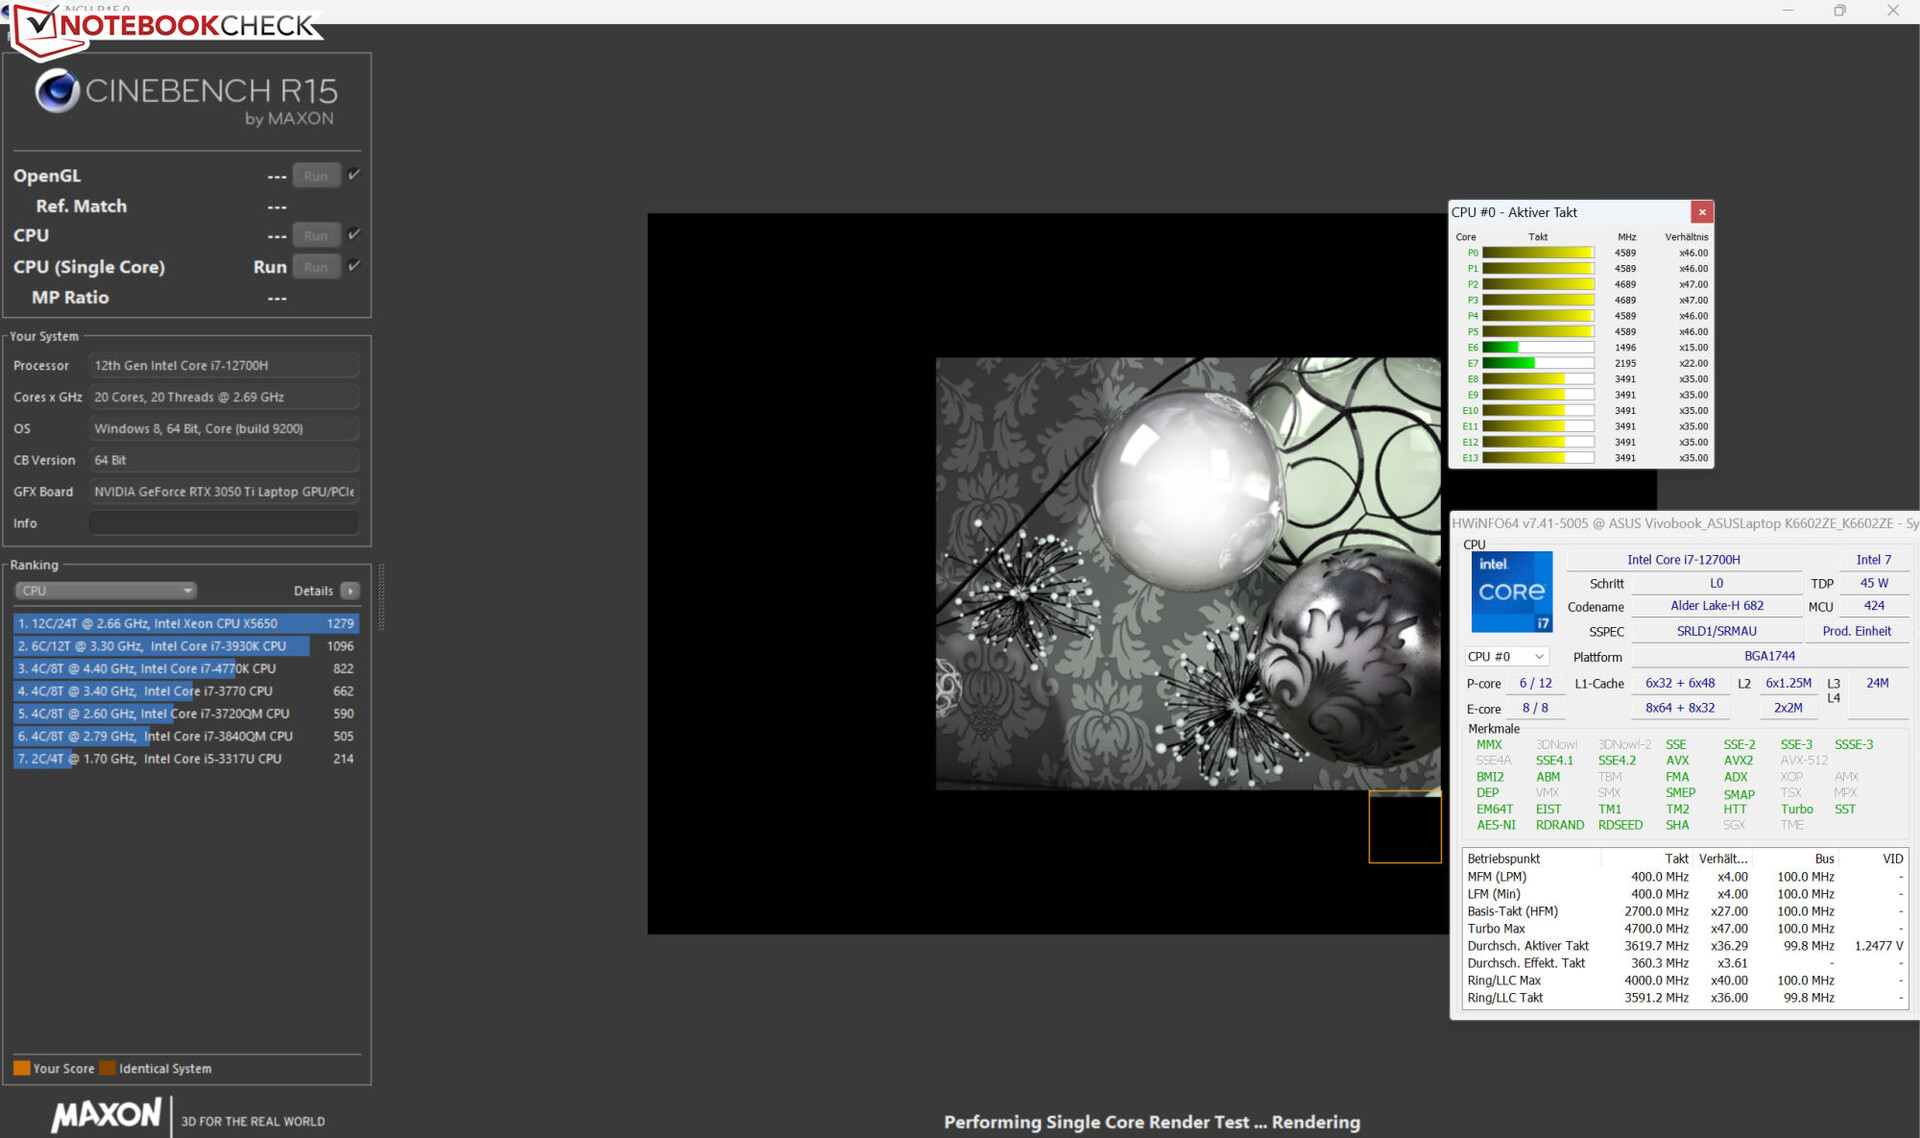
Den bärbara datornsCore-i7-12700Hprocessor (Alder Lake) består av 6 prestandakärnor (hypertrådning, 2,4 - 4,7 GHz) och 8 effektivitetskärnor (ingen hypertrådning, 1,8 - 3,5 GHz). Totalt uppgår detta till 20 logiska CPU-kärnor.
Vi uppmätte de bästa benchmarkresultaten med aktiverat "prestandaläge" - även om avståndet till "standardläge" var minimalt. I vilket fall som helst låg dessa värden under processorns genomsnitt. I batteriläget minskade dess prestanda för entrådiga processer (127 poäng) i större utsträckning än dess prestanda för flertrådiga processer (1 695 poäng).
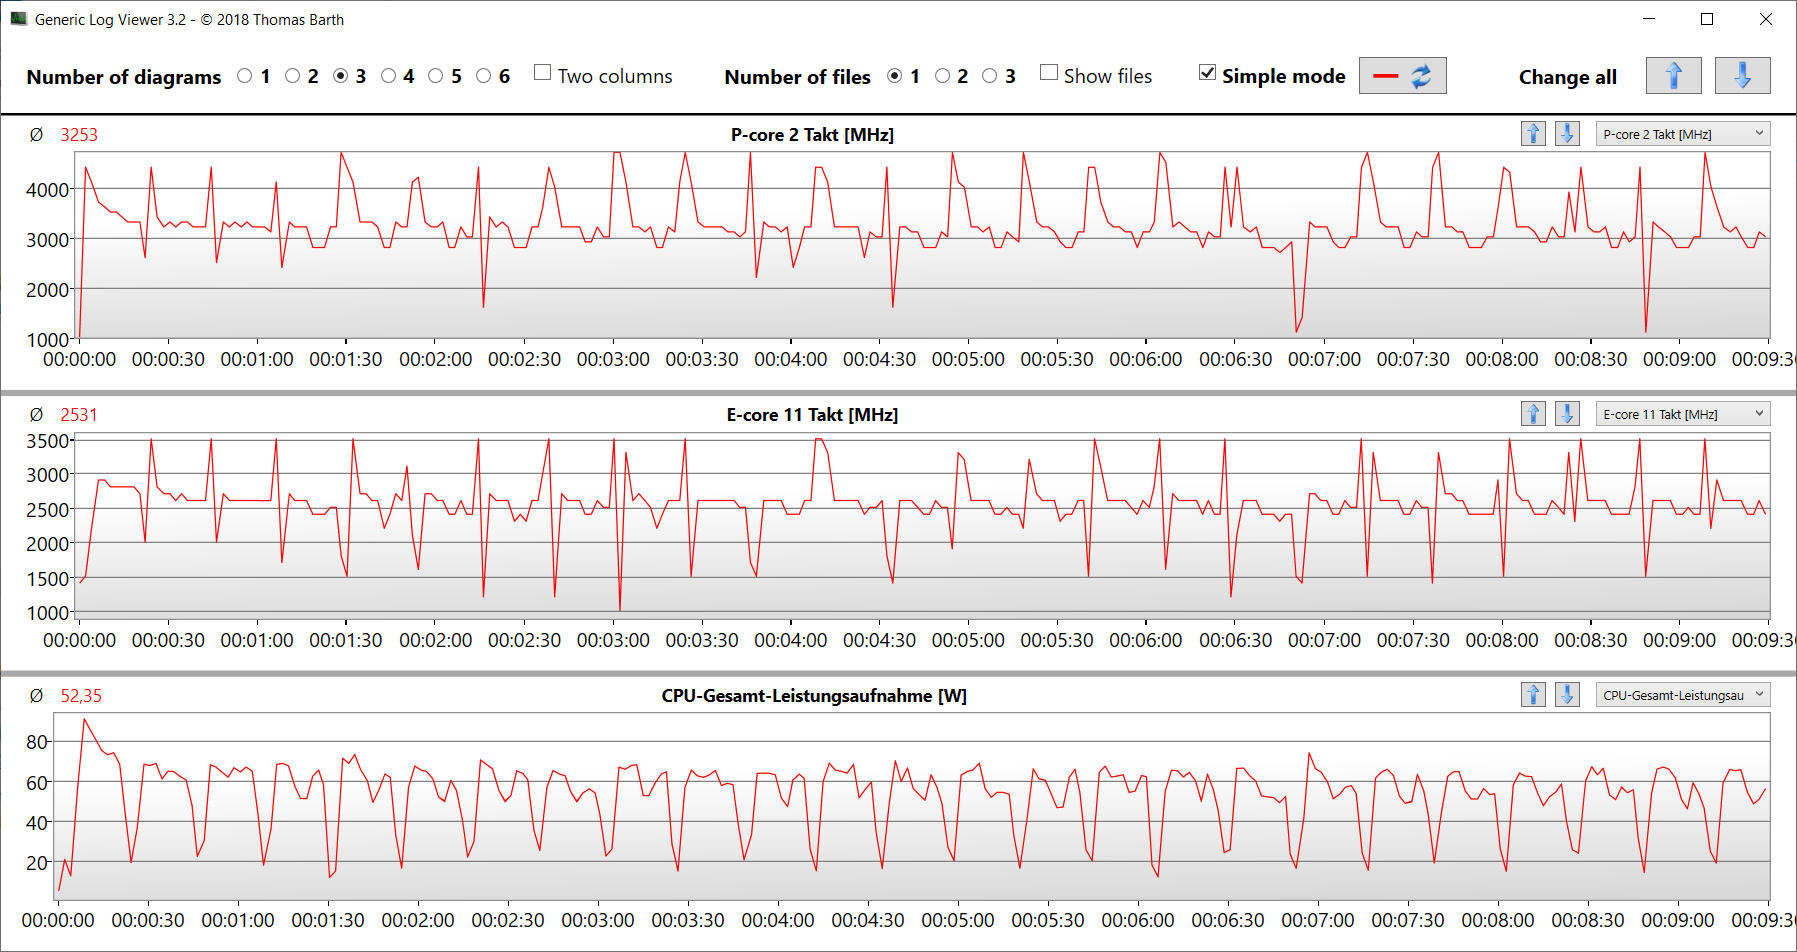
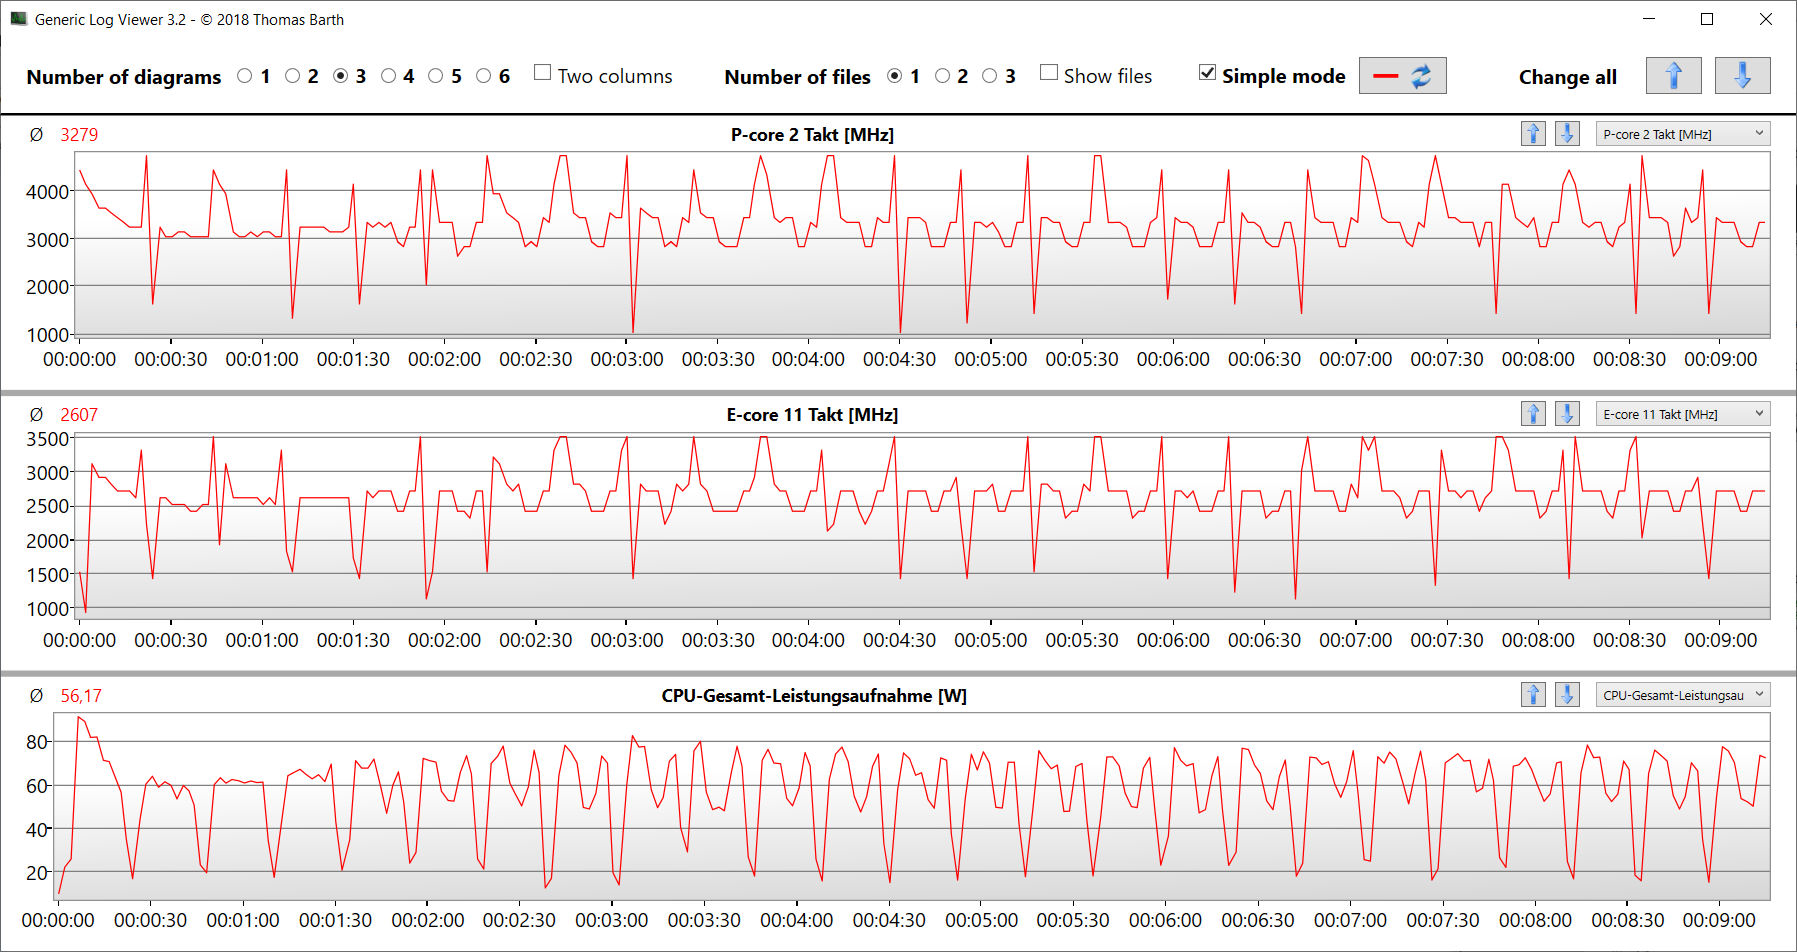
CB15-slingtestet visade: Kontinuerlig belastning av flera trådar ledde till att turboklockfrekvensen sjönk från den första till den fjärde körningen. Därefter förblev hastigheterna konstanta. Användning av "prestandaläge" ledde inte till någon prestandaförbättring.
Cinebench R15 Multi continuous test
| CPU Performance rating - Percent | |
| Genomsnitt av klass Multimedia | |
| Genomsnitt Intel Core i7-12700H | |
| Dell Inspiron 16 Plus 7620 | |
| Asus VivoBook Pro 16 | |
| Acer Swift X SFX16-52G-77RX | |
| Schenker XMG Fusion 15 (Mid 22) | |
* ... mindre är bättre
AIDA64: FP32 Ray-Trace | FPU Julia | CPU SHA3 | CPU Queen | FPU SinJulia | FPU Mandel | CPU AES | CPU ZLib | FP64 Ray-Trace | CPU PhotoWorxx
| Performance rating | |
| Genomsnitt av klass Multimedia | |
| Schenker XMG Fusion 15 (Mid 22) | |
| Asus VivoBook Pro 16 | |
| Dell Inspiron 16 Plus 7620 | |
| Genomsnitt Intel Core i7-12700H | |
| Acer Swift X SFX16-52G-77RX | |
| AIDA64 / FP32 Ray-Trace | |
| Genomsnitt av klass Multimedia (2214 - 50388, n=53, senaste 2 åren) | |
| Asus VivoBook Pro 16 (v6.75.6100) | |
| Dell Inspiron 16 Plus 7620 (v6.70.6000) | |
| Schenker XMG Fusion 15 (Mid 22) (v6.70.6000) | |
| Genomsnitt Intel Core i7-12700H (2585 - 17957, n=64) | |
| Acer Swift X SFX16-52G-77RX (v6.70.6000) | |
| AIDA64 / FPU Julia | |
| Genomsnitt av klass Multimedia (12867 - 201874, n=53, senaste 2 åren) | |
| Asus VivoBook Pro 16 (v6.75.6100) | |
| Dell Inspiron 16 Plus 7620 (v6.70.6000) | |
| Schenker XMG Fusion 15 (Mid 22) (v6.70.6000) | |
| Genomsnitt Intel Core i7-12700H (12439 - 90760, n=64) | |
| Acer Swift X SFX16-52G-77RX (v6.70.6000) | |
| AIDA64 / CPU SHA3 | |
| Schenker XMG Fusion 15 (Mid 22) (v6.70.6000) | |
| Genomsnitt av klass Multimedia (626 - 8623, n=53, senaste 2 åren) | |
| Asus VivoBook Pro 16 (v6.75.6100) | |
| Genomsnitt Intel Core i7-12700H (833 - 4242, n=64) | |
| Dell Inspiron 16 Plus 7620 (v6.70.6000) | |
| Acer Swift X SFX16-52G-77RX (v6.70.6000) | |
| AIDA64 / CPU Queen | |
| Asus VivoBook Pro 16 (v6.75.6100) | |
| Genomsnitt Intel Core i7-12700H (57923 - 103202, n=63) | |
| Dell Inspiron 16 Plus 7620 (v6.70.6000) | |
| Schenker XMG Fusion 15 (Mid 22) | |
| Acer Swift X SFX16-52G-77RX (v6.70.6000) | |
| Genomsnitt av klass Multimedia (13483 - 181505, n=40, senaste 2 åren) | |
| AIDA64 / FPU SinJulia | |
| Genomsnitt Intel Core i7-12700H (3249 - 9939, n=64) | |
| Asus VivoBook Pro 16 (v6.75.6100) | |
| Schenker XMG Fusion 15 (Mid 22) (v6.70.6000) | |
| Dell Inspiron 16 Plus 7620 (v6.70.6000) | |
| Genomsnitt av klass Multimedia (886 - 28794, n=53, senaste 2 åren) | |
| Acer Swift X SFX16-52G-77RX (v6.70.6000) | |
| AIDA64 / FPU Mandel | |
| Genomsnitt av klass Multimedia (6395 - 105740, n=53, senaste 2 åren) | |
| Schenker XMG Fusion 15 (Mid 22) (v6.70.6000) | |
| Asus VivoBook Pro 16 (v6.75.6100) | |
| Dell Inspiron 16 Plus 7620 (v6.70.6000) | |
| Genomsnitt Intel Core i7-12700H (7135 - 44760, n=64) | |
| Acer Swift X SFX16-52G-77RX (v6.70.6000) | |
| AIDA64 / CPU AES | |
| Schenker XMG Fusion 15 (Mid 22) (v6.70.6000) | |
| Genomsnitt Intel Core i7-12700H (31839 - 144360, n=64) | |
| Asus VivoBook Pro 16 (v6.75.6100) | |
| Dell Inspiron 16 Plus 7620 (v6.70.6000) | |
| Genomsnitt av klass Multimedia (8171 - 126790, n=53, senaste 2 åren) | |
| Acer Swift X SFX16-52G-77RX (v6.70.6000) | |
| AIDA64 / CPU ZLib | |
| Dell Inspiron 16 Plus 7620 (v6.70.6000) | |
| Genomsnitt Intel Core i7-12700H (305 - 1171, n=64) | |
| Genomsnitt av klass Multimedia (143.8 - 2022, n=53, senaste 2 åren) | |
| Asus VivoBook Pro 16 (v6.75.6100) | |
| Schenker XMG Fusion 15 (Mid 22) (v6.70.6000) | |
| Acer Swift X SFX16-52G-77RX (v6.70.6000) | |
| AIDA64 / FP64 Ray-Trace | |
| Genomsnitt av klass Multimedia (1014 - 26875, n=53, senaste 2 åren) | |
| Asus VivoBook Pro 16 (v6.75.6100) | |
| Schenker XMG Fusion 15 (Mid 22) (v6.70.6000) | |
| Dell Inspiron 16 Plus 7620 (v6.70.6000) | |
| Genomsnitt Intel Core i7-12700H (1437 - 9692, n=64) | |
| Acer Swift X SFX16-52G-77RX (v6.70.6000) | |
| AIDA64 / CPU PhotoWorxx | |
| Genomsnitt av klass Multimedia (8187 - 88154, n=53, senaste 2 åren) | |
| Acer Swift X SFX16-52G-77RX (v6.70.6000) | |
| Dell Inspiron 16 Plus 7620 (v6.70.6000) | |
| Genomsnitt Intel Core i7-12700H (12863 - 52207, n=64) | |
| Schenker XMG Fusion 15 (Mid 22) (v6.70.6000) | |
| Asus VivoBook Pro 16 (v6.75.6100) | |
Systemprestanda
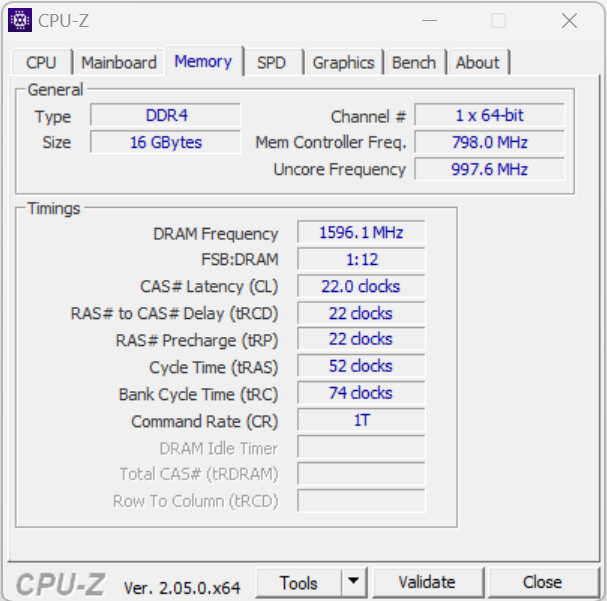
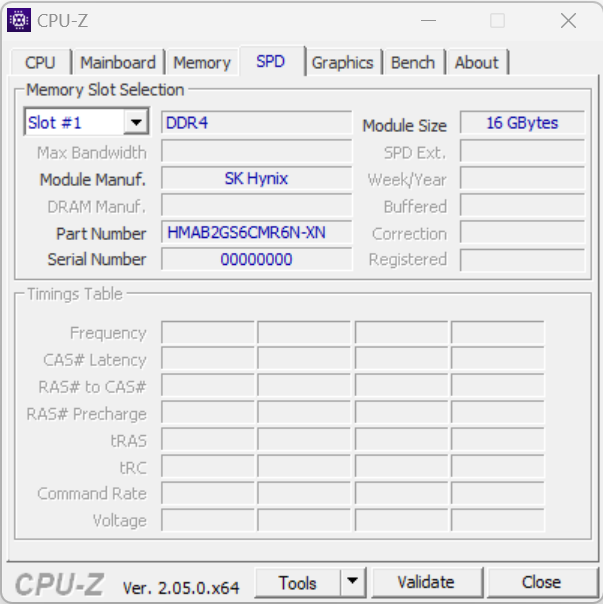
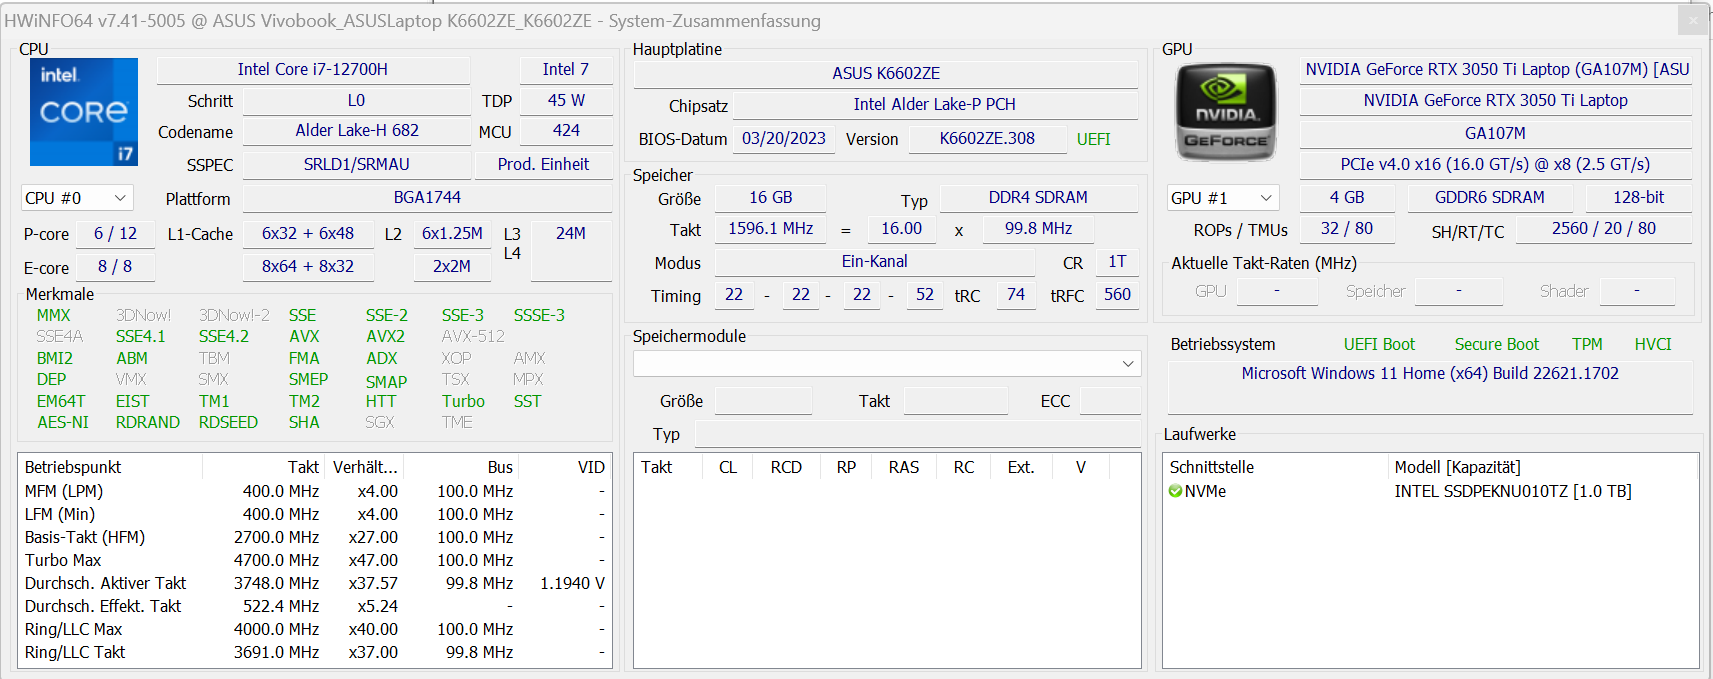
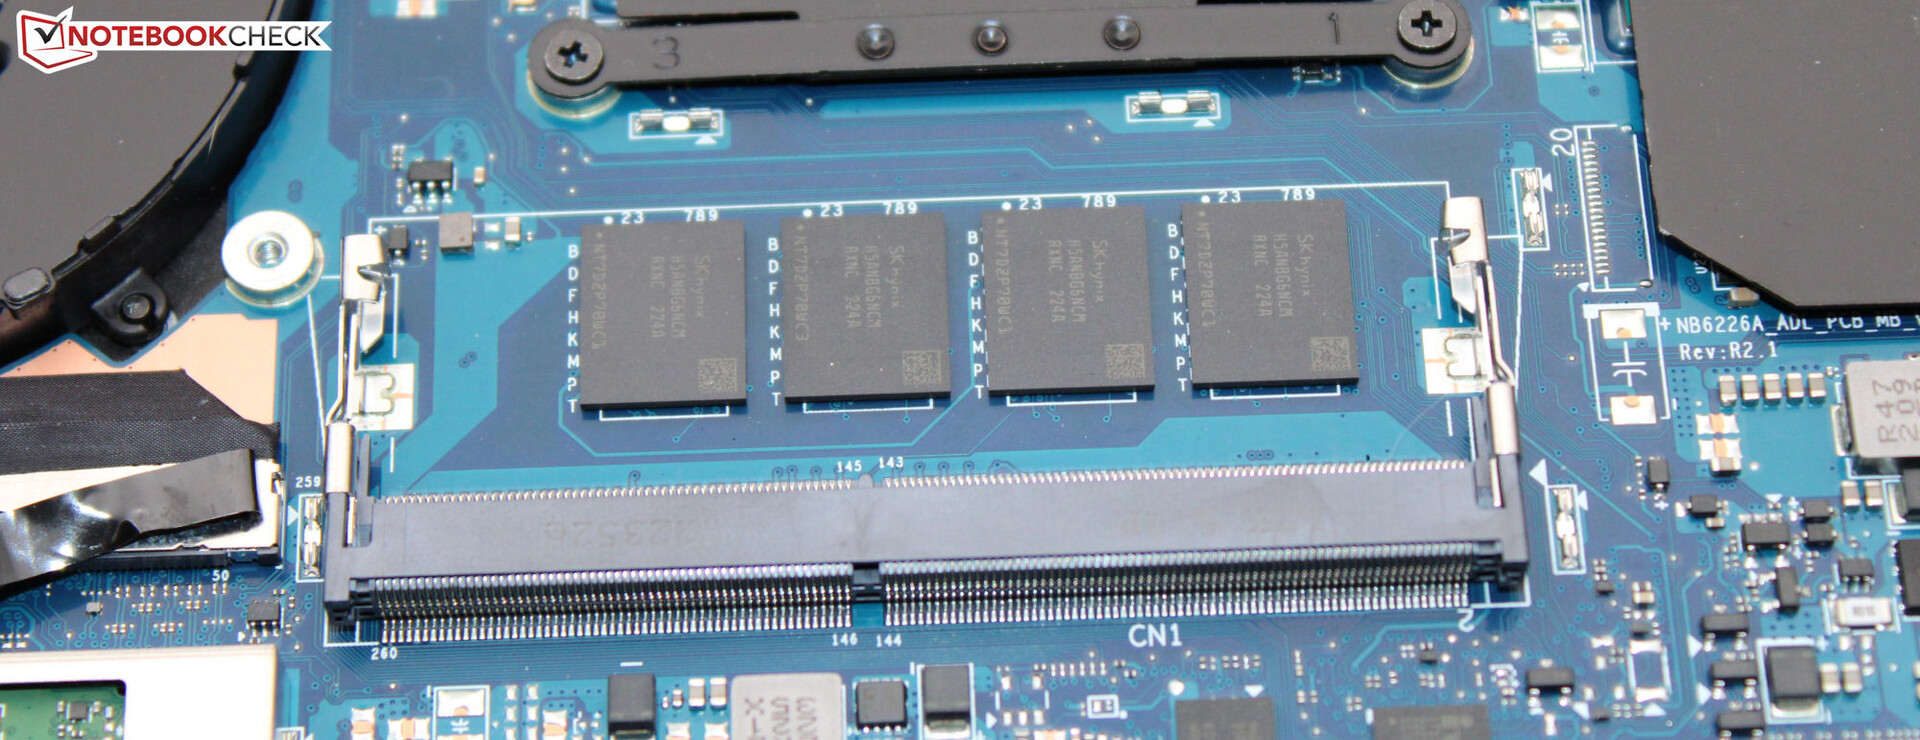
Det smidigt fungerande systemet klarar spel, streaming och rendering. En del av processorkraften ligger outnyttjad, eftersom RAM-minnet (16 GB, DDR4-3200, inbyggt) endast körs i enkanaligt läge. Om man installerar en minnesmodul (= dubbla kanallägen aktiva) skulle detta problem lösas - och det skulle också öka datahastigheterna till liknande nivåer jämfört med konkurrenterna med samma lagringsutrymme.
CrossMark: Overall | Productivity | Creativity | Responsiveness
| PCMark 10 / Score | |
| Genomsnitt av klass Multimedia (4325 - 10386, n=51, senaste 2 åren) | |
| Dell Inspiron 16 Plus 7620 | |
| Genomsnitt Intel Core i7-12700H, NVIDIA GeForce RTX 3050 Ti Laptop GPU (6623 - 7075, n=5) | |
| Asus VivoBook Pro 16 | |
| Schenker XMG Fusion 15 (Mid 22) | |
| Acer Swift X SFX16-52G-77RX | |
| PCMark 10 / Essentials | |
| Acer Swift X SFX16-52G-77RX | |
| Genomsnitt av klass Multimedia (8025 - 11664, n=50, senaste 2 åren) | |
| Genomsnitt Intel Core i7-12700H, NVIDIA GeForce RTX 3050 Ti Laptop GPU (9540 - 10970, n=5) | |
| Dell Inspiron 16 Plus 7620 | |
| Schenker XMG Fusion 15 (Mid 22) | |
| Asus VivoBook Pro 16 | |
| PCMark 10 / Productivity | |
| Genomsnitt av klass Multimedia (7323 - 18233, n=50, senaste 2 åren) | |
| Dell Inspiron 16 Plus 7620 | |
| Genomsnitt Intel Core i7-12700H, NVIDIA GeForce RTX 3050 Ti Laptop GPU (8530 - 9555, n=5) | |
| Asus VivoBook Pro 16 | |
| Schenker XMG Fusion 15 (Mid 22) | |
| Acer Swift X SFX16-52G-77RX | |
| PCMark 10 / Digital Content Creation | |
| Genomsnitt av klass Multimedia (3651 - 16240, n=50, senaste 2 åren) | |
| Dell Inspiron 16 Plus 7620 | |
| Asus VivoBook Pro 16 | |
| Genomsnitt Intel Core i7-12700H, NVIDIA GeForce RTX 3050 Ti Laptop GPU (8855 - 9542, n=5) | |
| Acer Swift X SFX16-52G-77RX | |
| Schenker XMG Fusion 15 (Mid 22) | |
| CrossMark / Overall | |
| Genomsnitt av klass Multimedia (866 - 2728, n=59, senaste 2 åren) | |
| Dell Inspiron 16 Plus 7620 | |
| Acer Swift X SFX16-52G-77RX | |
| Genomsnitt Intel Core i7-12700H, NVIDIA GeForce RTX 3050 Ti Laptop GPU (1654 - 1872, n=5) | |
| Asus VivoBook Pro 16 | |
| Schenker XMG Fusion 15 (Mid 22) | |
| CrossMark / Productivity | |
| Genomsnitt av klass Multimedia (931 - 2489, n=59, senaste 2 åren) | |
| Acer Swift X SFX16-52G-77RX | |
| Asus VivoBook Pro 16 | |
| Genomsnitt Intel Core i7-12700H, NVIDIA GeForce RTX 3050 Ti Laptop GPU (1595 - 1792, n=5) | |
| Dell Inspiron 16 Plus 7620 | |
| Schenker XMG Fusion 15 (Mid 22) | |
| CrossMark / Creativity | |
| Genomsnitt av klass Multimedia (907 - 3465, n=59, senaste 2 åren) | |
| Dell Inspiron 16 Plus 7620 | |
| Genomsnitt Intel Core i7-12700H, NVIDIA GeForce RTX 3050 Ti Laptop GPU (1699 - 1993, n=5) | |
| Acer Swift X SFX16-52G-77RX | |
| Asus VivoBook Pro 16 | |
| Schenker XMG Fusion 15 (Mid 22) | |
| CrossMark / Responsiveness | |
| Asus VivoBook Pro 16 | |
| Acer Swift X SFX16-52G-77RX | |
| Schenker XMG Fusion 15 (Mid 22) | |
| Genomsnitt Intel Core i7-12700H, NVIDIA GeForce RTX 3050 Ti Laptop GPU (1383 - 1768, n=5) | |
| Genomsnitt av klass Multimedia (605 - 2024, n=59, senaste 2 åren) | |
| Dell Inspiron 16 Plus 7620 | |
| PCMark 8 Home Score Accelerated v2 | 4565 poäng | |
| PCMark 8 Work Score Accelerated v2 | 5386 poäng | |
| PCMark 10 Score | 6652 poäng | |
Hjälp | ||
| AIDA64 / Memory Copy | |
| Genomsnitt av klass Multimedia (11299 - 132135, n=53, senaste 2 åren) | |
| Acer Swift X SFX16-52G-77RX | |
| Dell Inspiron 16 Plus 7620 | |
| Genomsnitt Intel Core i7-12700H (25615 - 80511, n=64) | |
| Schenker XMG Fusion 15 (Mid 22) | |
| Asus VivoBook Pro 16 | |
| AIDA64 / Memory Read | |
| Genomsnitt av klass Multimedia (11624 - 174586, n=53, senaste 2 åren) | |
| Acer Swift X SFX16-52G-77RX | |
| Dell Inspiron 16 Plus 7620 | |
| Genomsnitt Intel Core i7-12700H (25586 - 79442, n=64) | |
| Schenker XMG Fusion 15 (Mid 22) | |
| Asus VivoBook Pro 16 | |
| AIDA64 / Memory Write | |
| Genomsnitt av klass Multimedia (11755 - 134998, n=53, senaste 2 åren) | |
| Acer Swift X SFX16-52G-77RX | |
| Dell Inspiron 16 Plus 7620 | |
| Genomsnitt Intel Core i7-12700H (23679 - 88660, n=64) | |
| Schenker XMG Fusion 15 (Mid 22) | |
| Asus VivoBook Pro 16 | |
| AIDA64 / Memory Latency | |
| Genomsnitt av klass Multimedia (7 - 535, n=52, senaste 2 åren) | |
| Acer Swift X SFX16-52G-77RX | |
| Dell Inspiron 16 Plus 7620 | |
| Schenker XMG Fusion 15 (Mid 22) | |
| Asus VivoBook Pro 16 | |
| Genomsnitt Intel Core i7-12700H (76.2 - 133.9, n=62) | |
* ... mindre är bättre
DPC-fördröjning
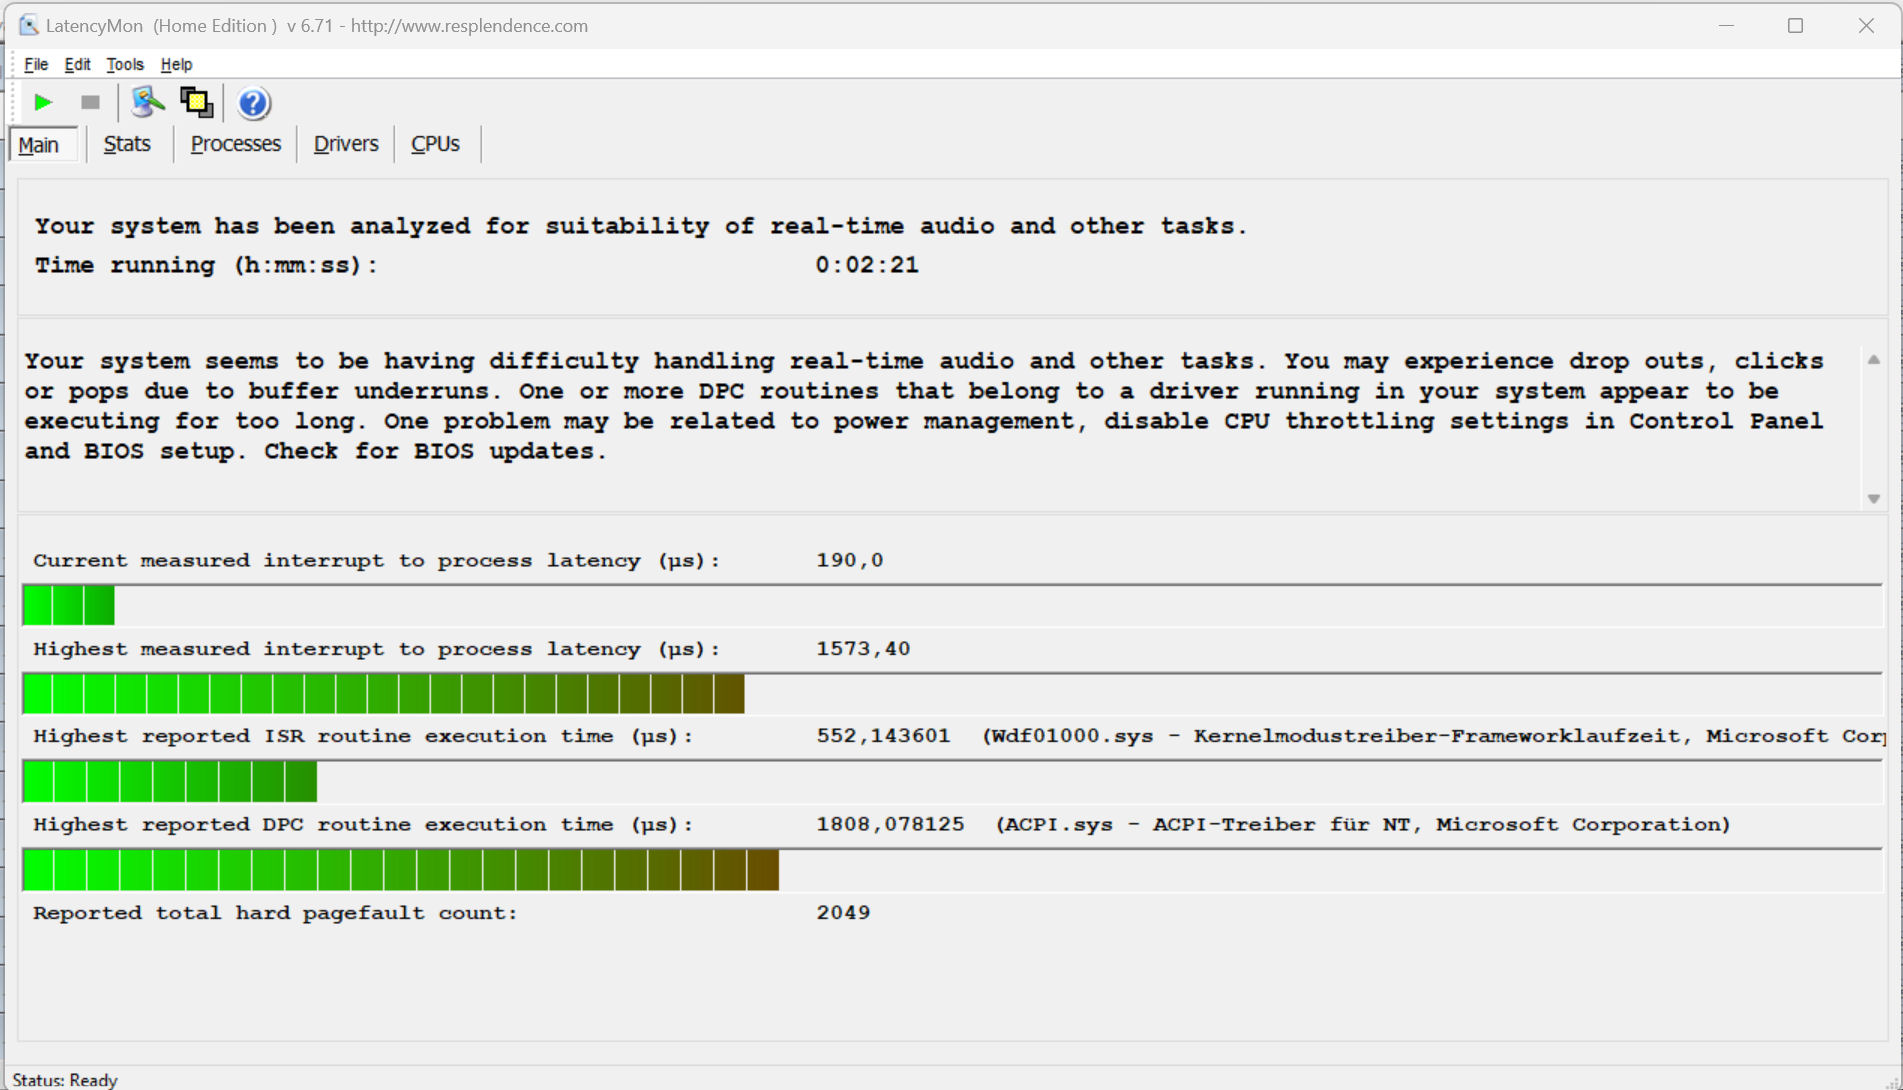
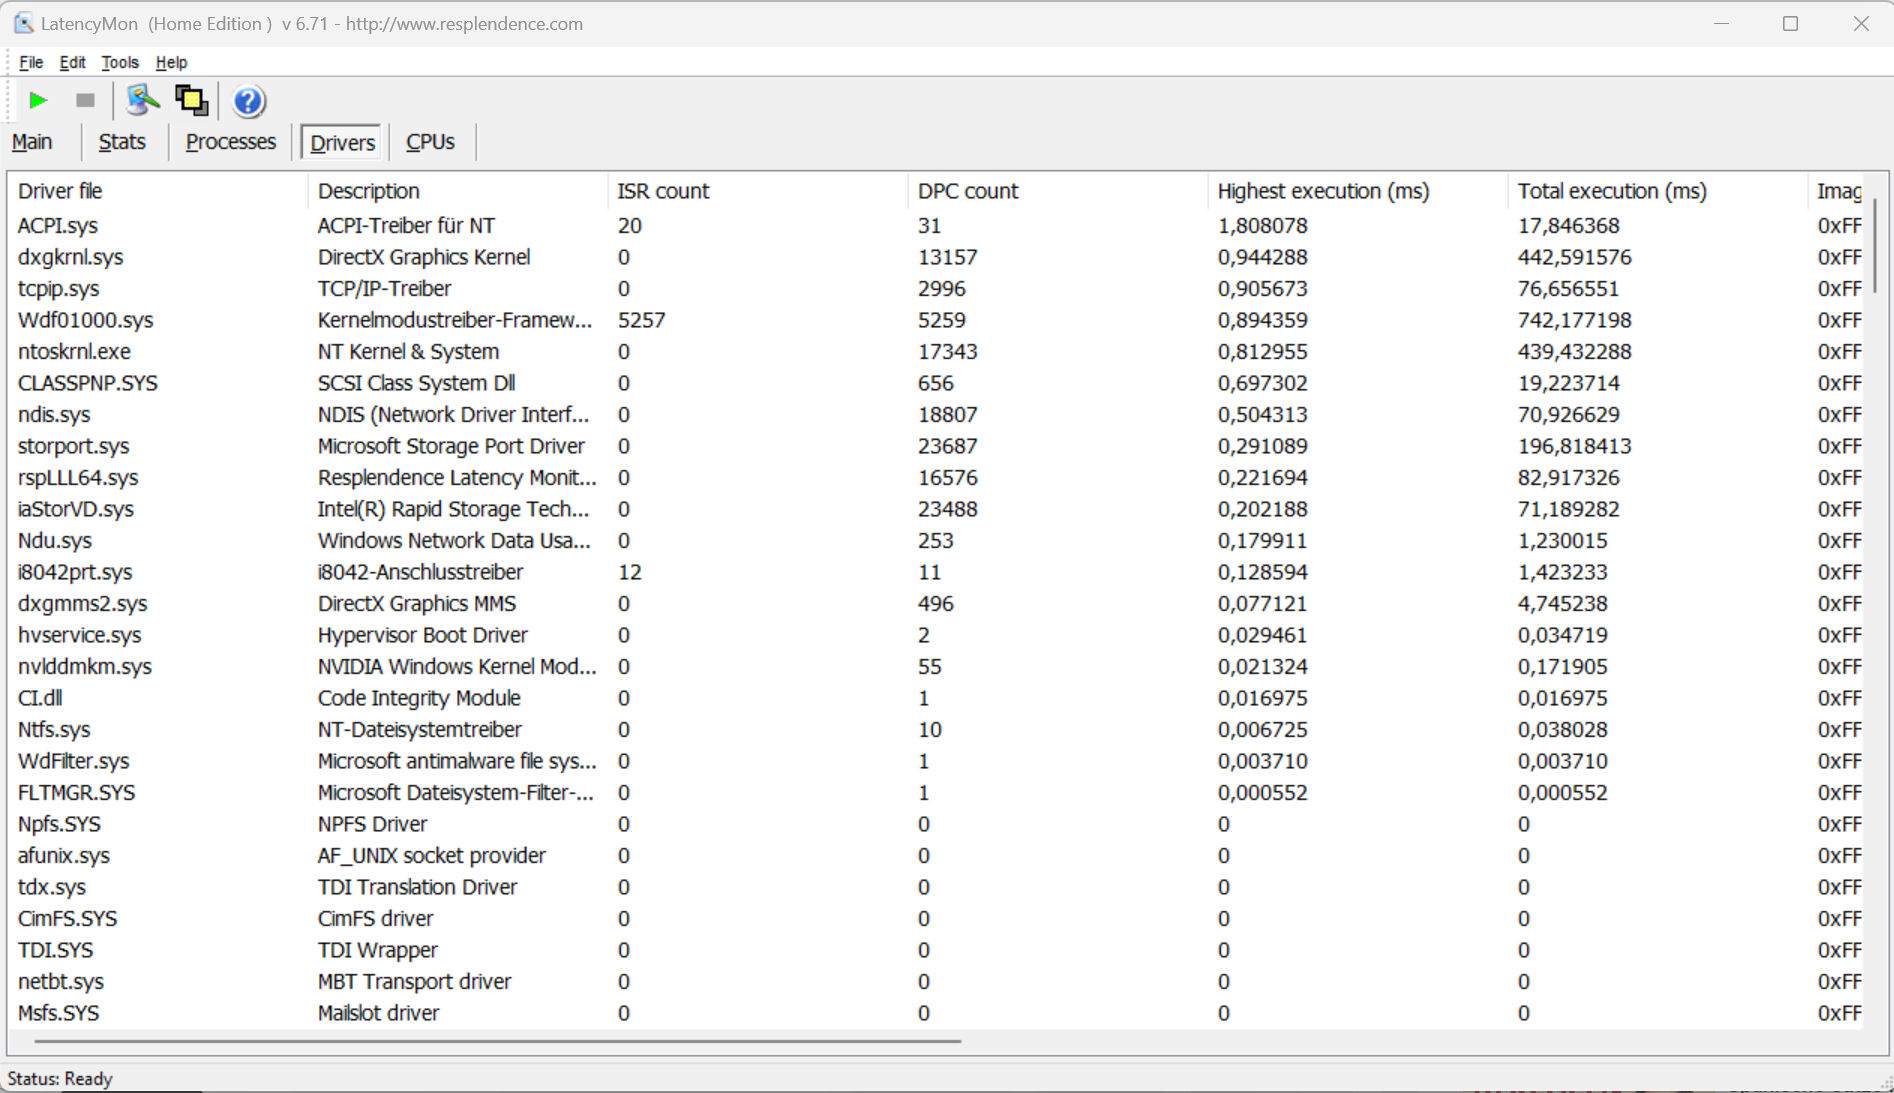
Det standardiserade testet för övervakning av latens (webbsurfning, uppspelning av 4k-video, Prime95 hög belastning) visade på vissa avvikelser. Systemet verkar inte vara lämpligt för video- och ljudredigering i realtid. Framtida programuppdateringar kan leda till förbättringar eller till och med försämringar.
| DPC Latencies / LatencyMon - interrupt to process latency (max), Web, Youtube, Prime95 | |
| Schenker XMG Fusion 15 (Mid 22) | |
| Asus VivoBook Pro 16 | |
| Dell Inspiron 16 Plus 7620 | |
| Acer Swift X SFX16-52G-77RX | |
* ... mindre är bättre
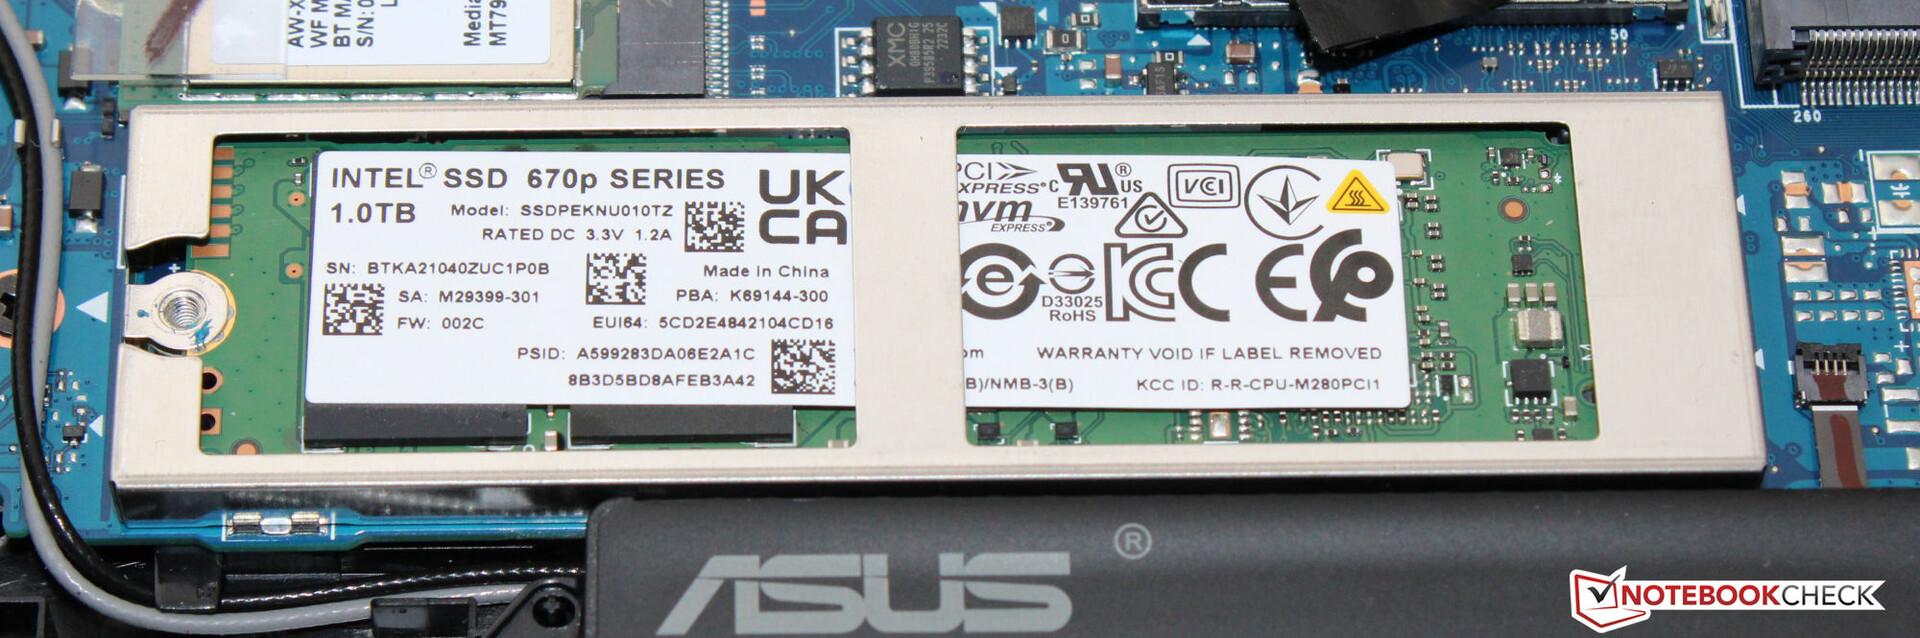
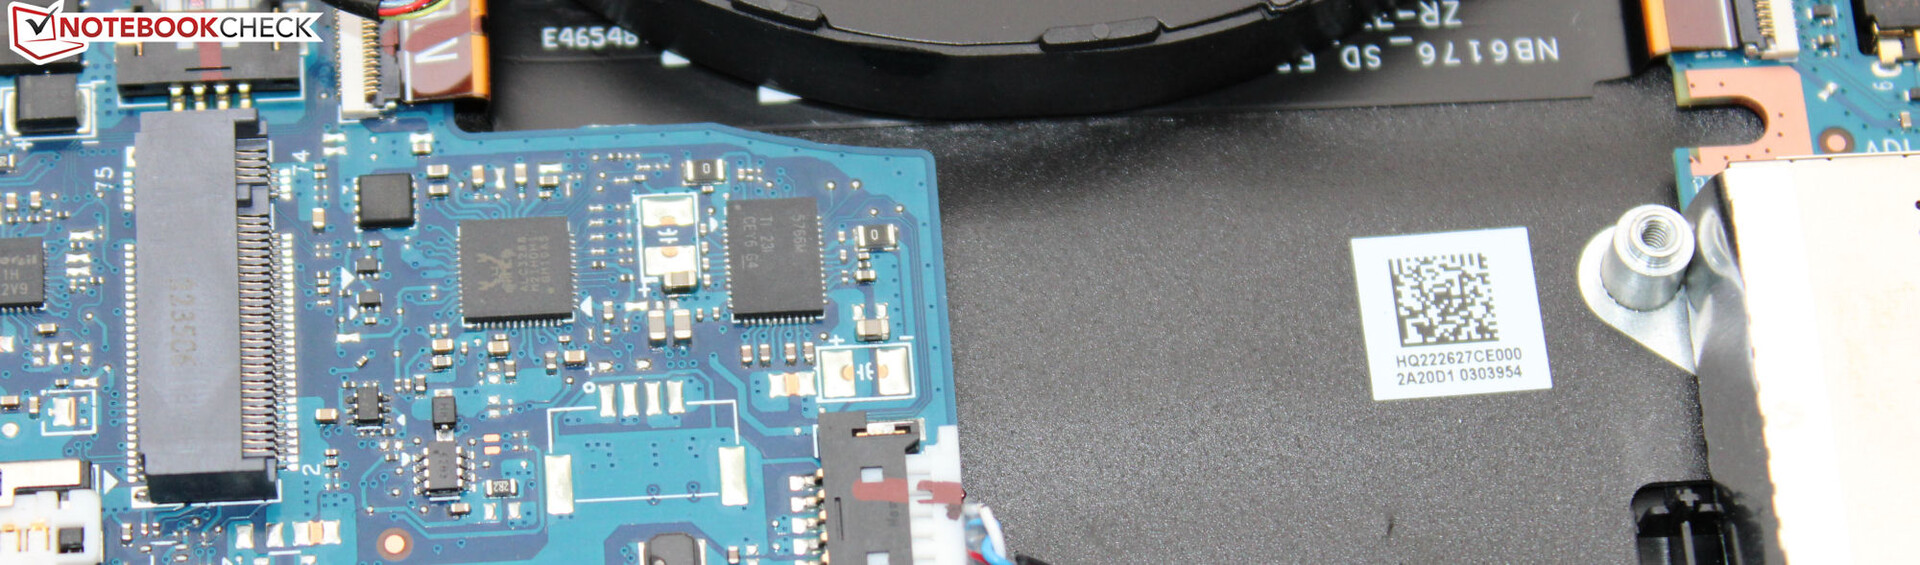
Lagringsenheter
Asus har utrustat den bärbara datorn med en PCIe-3 SSD (M.2-2280) från Intel med en kapacitet på 1 TB. Den levererar bra datahastigheter men kan inte klassas som en SSD-elit. Datorn erbjuder utrymme för en andra SSD.

* ... mindre är bättre
reading continuous performance: DiskSpd Read Loop, Queue Depth 8
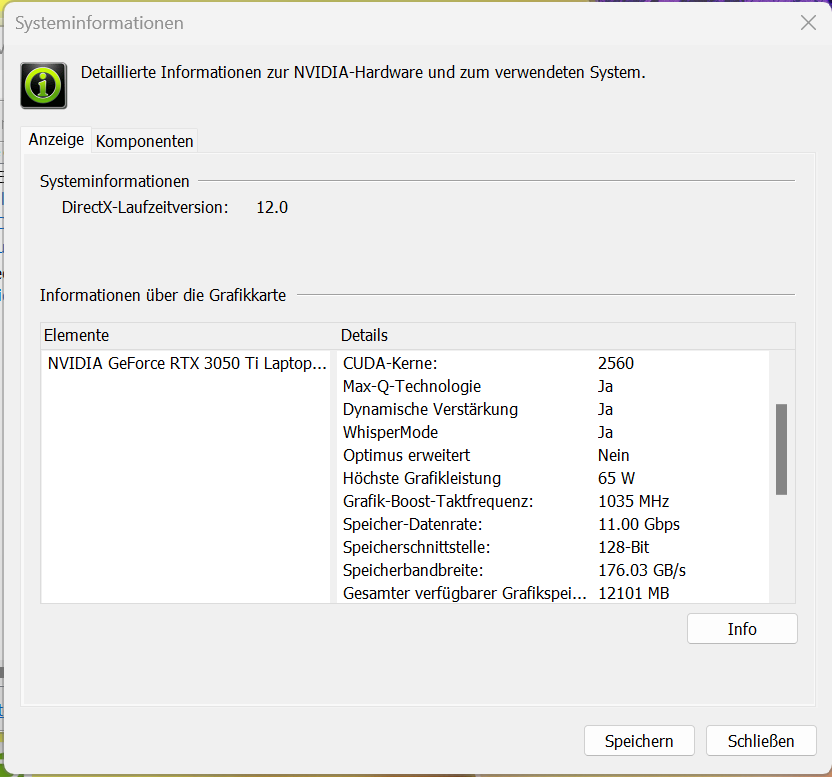
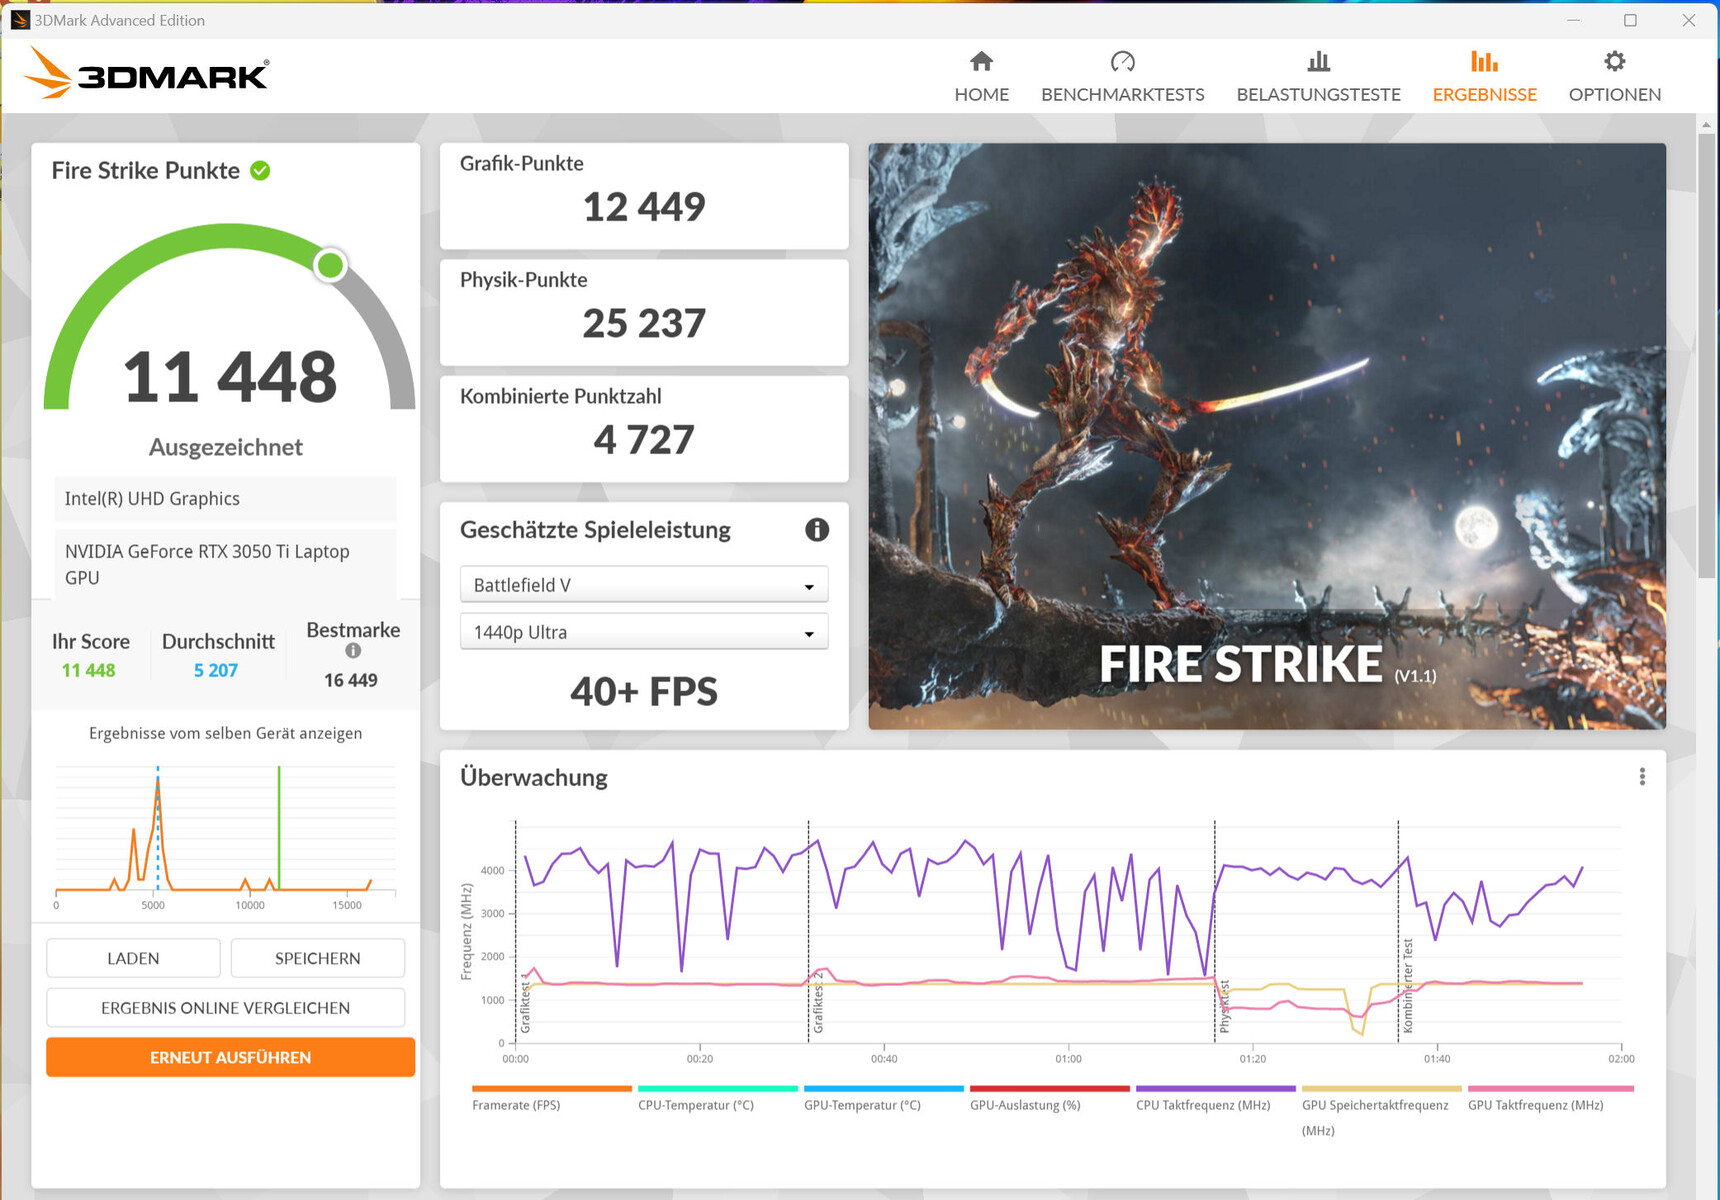
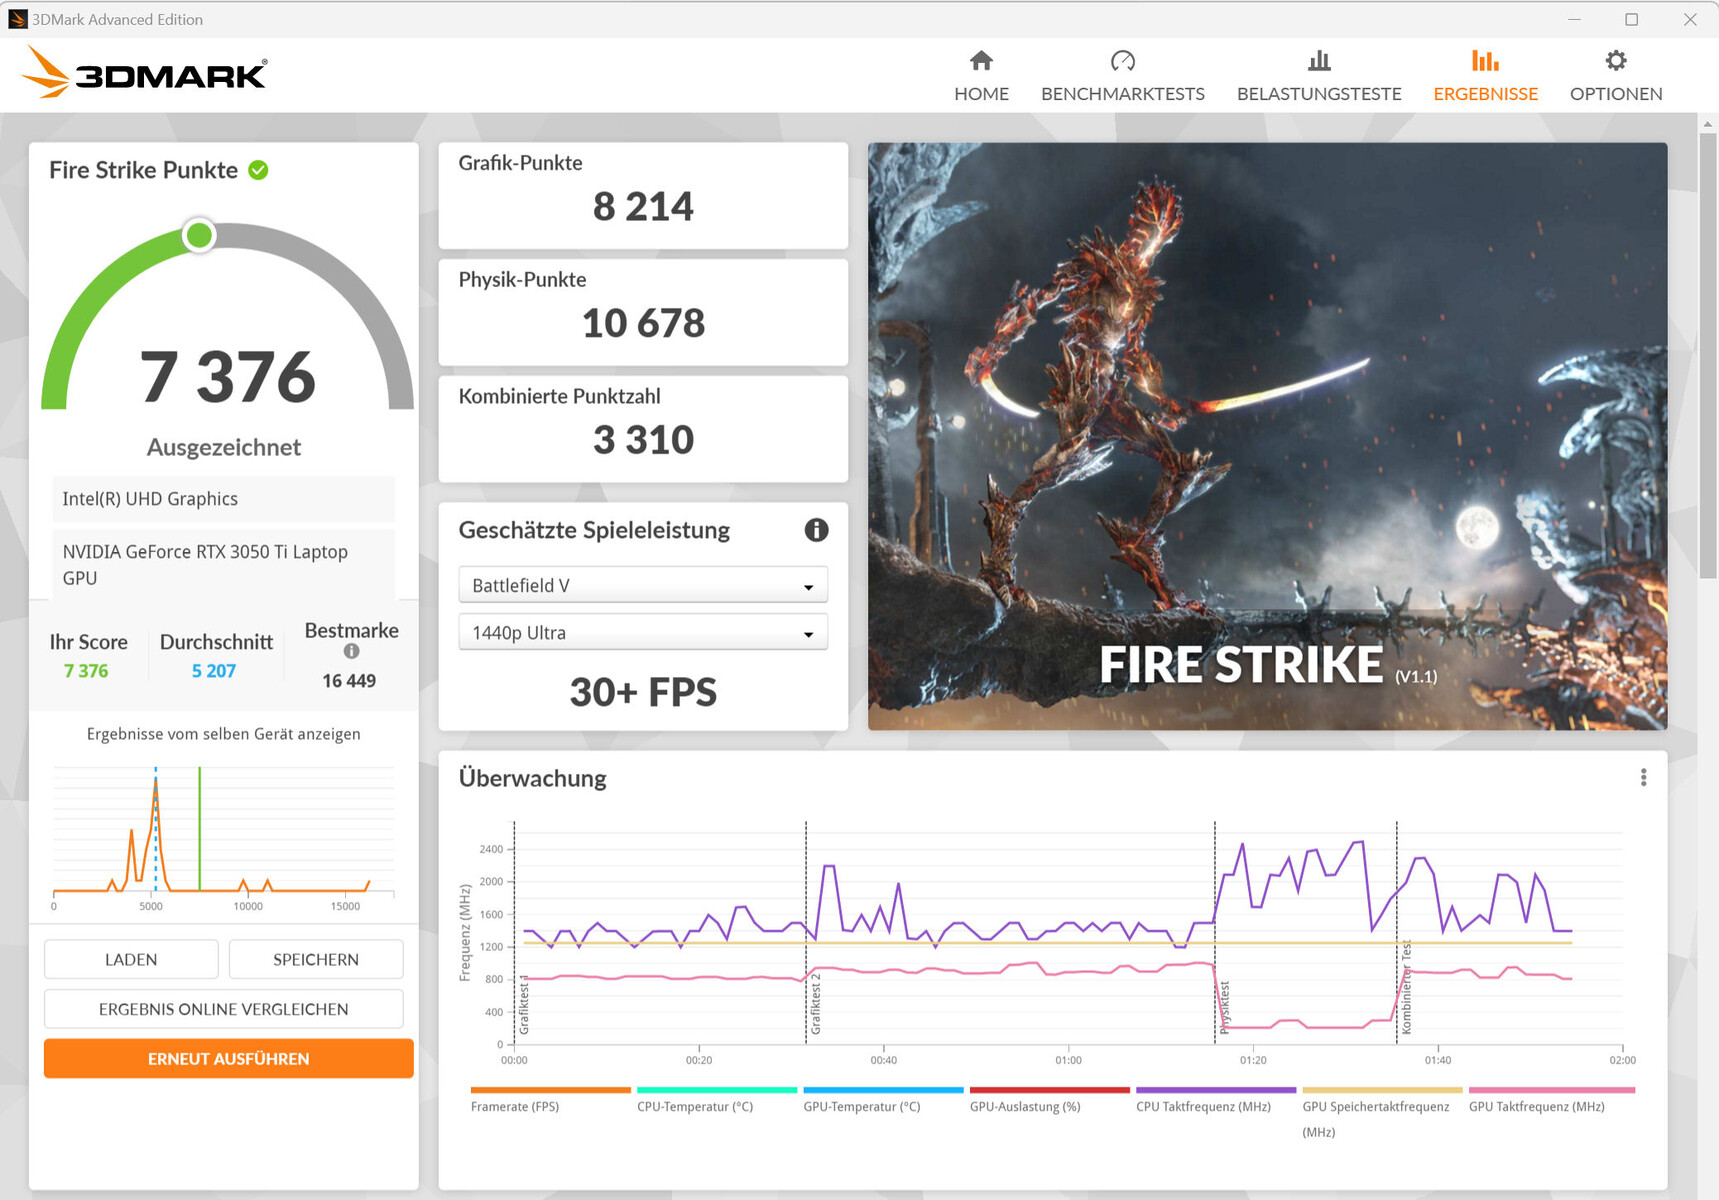
Grafikkort
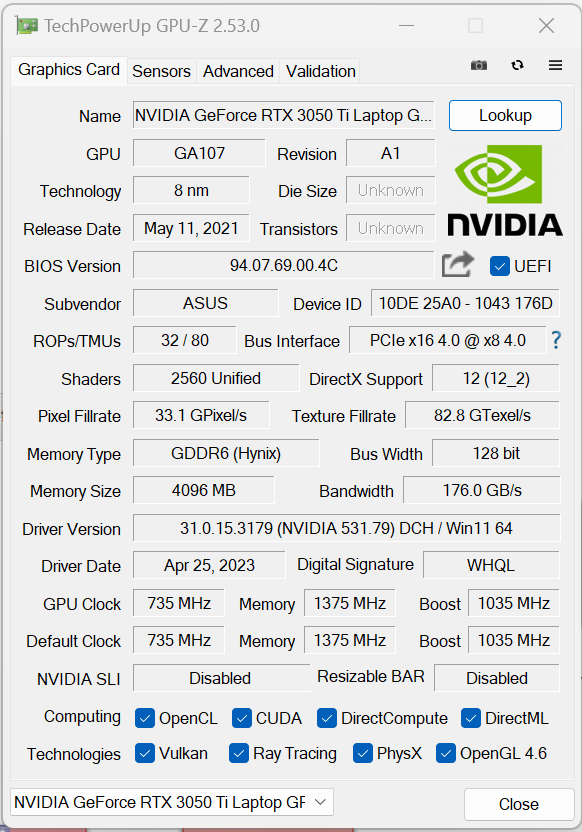
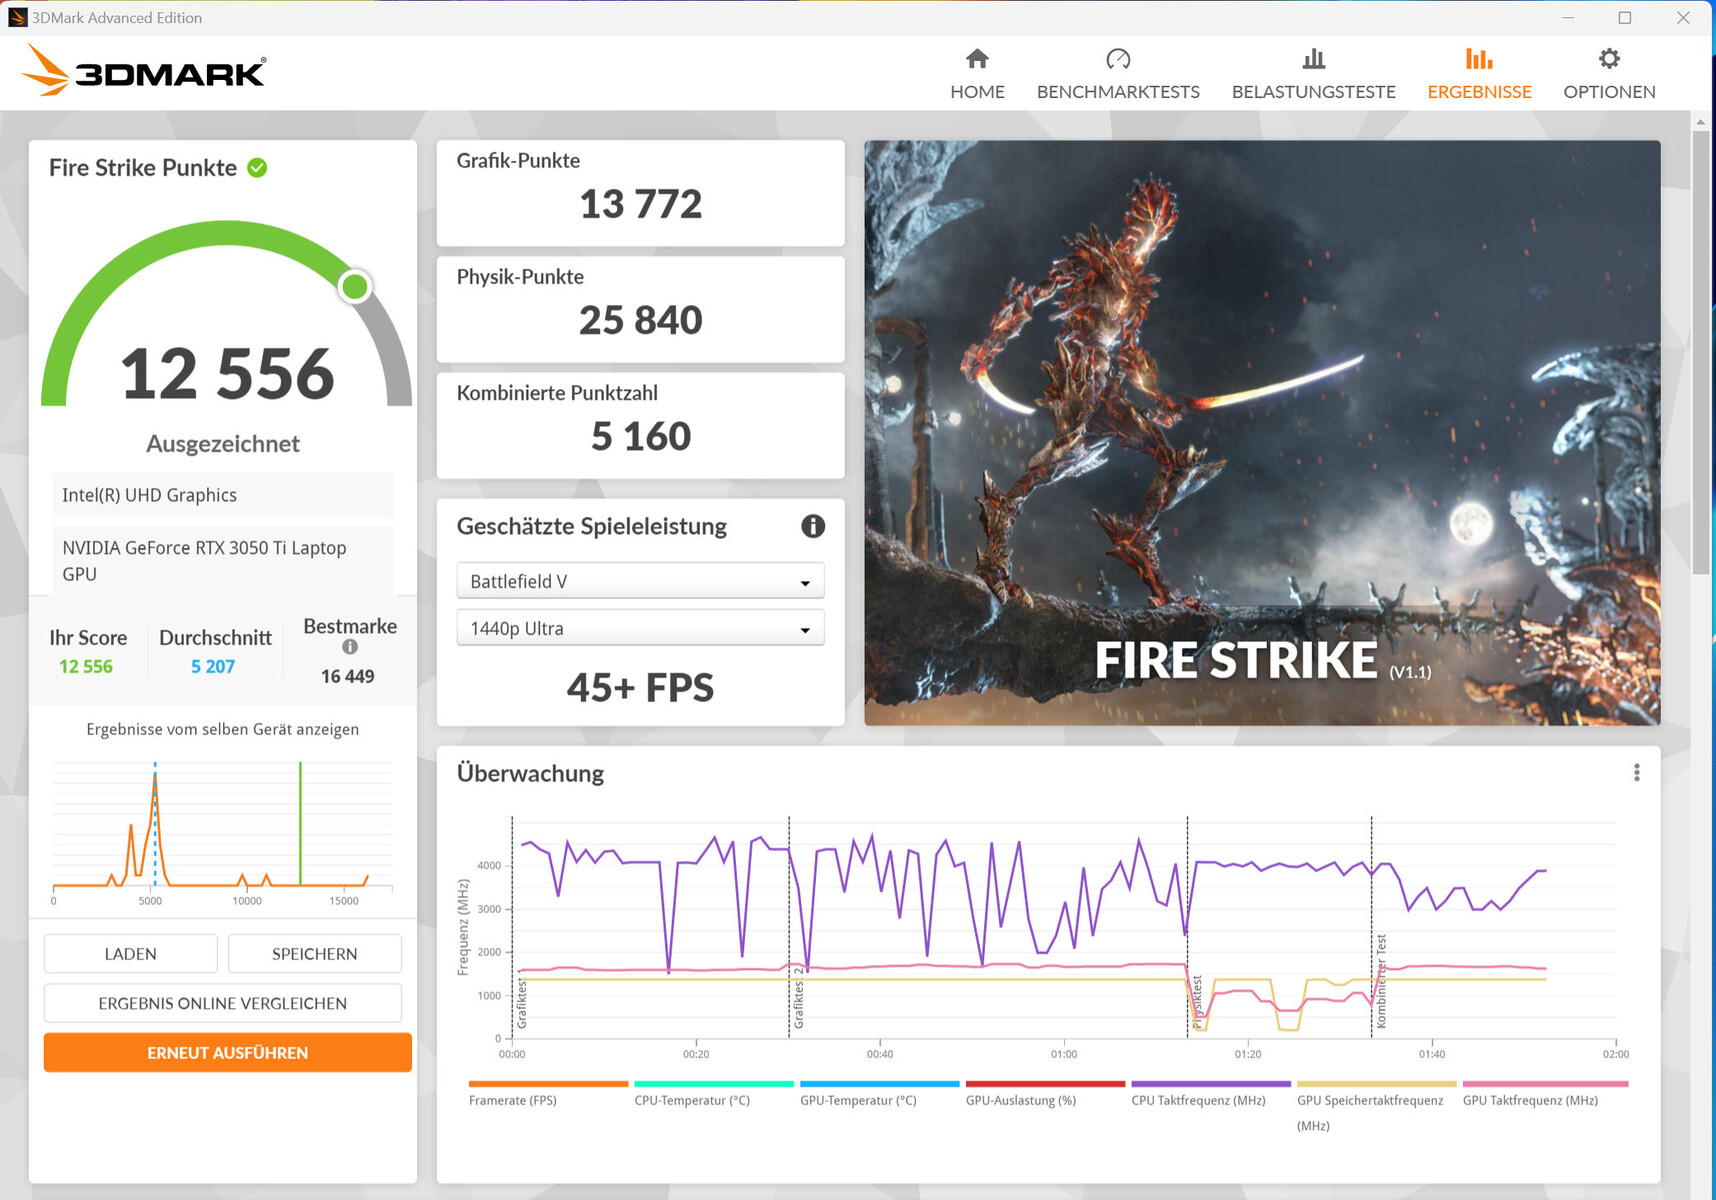
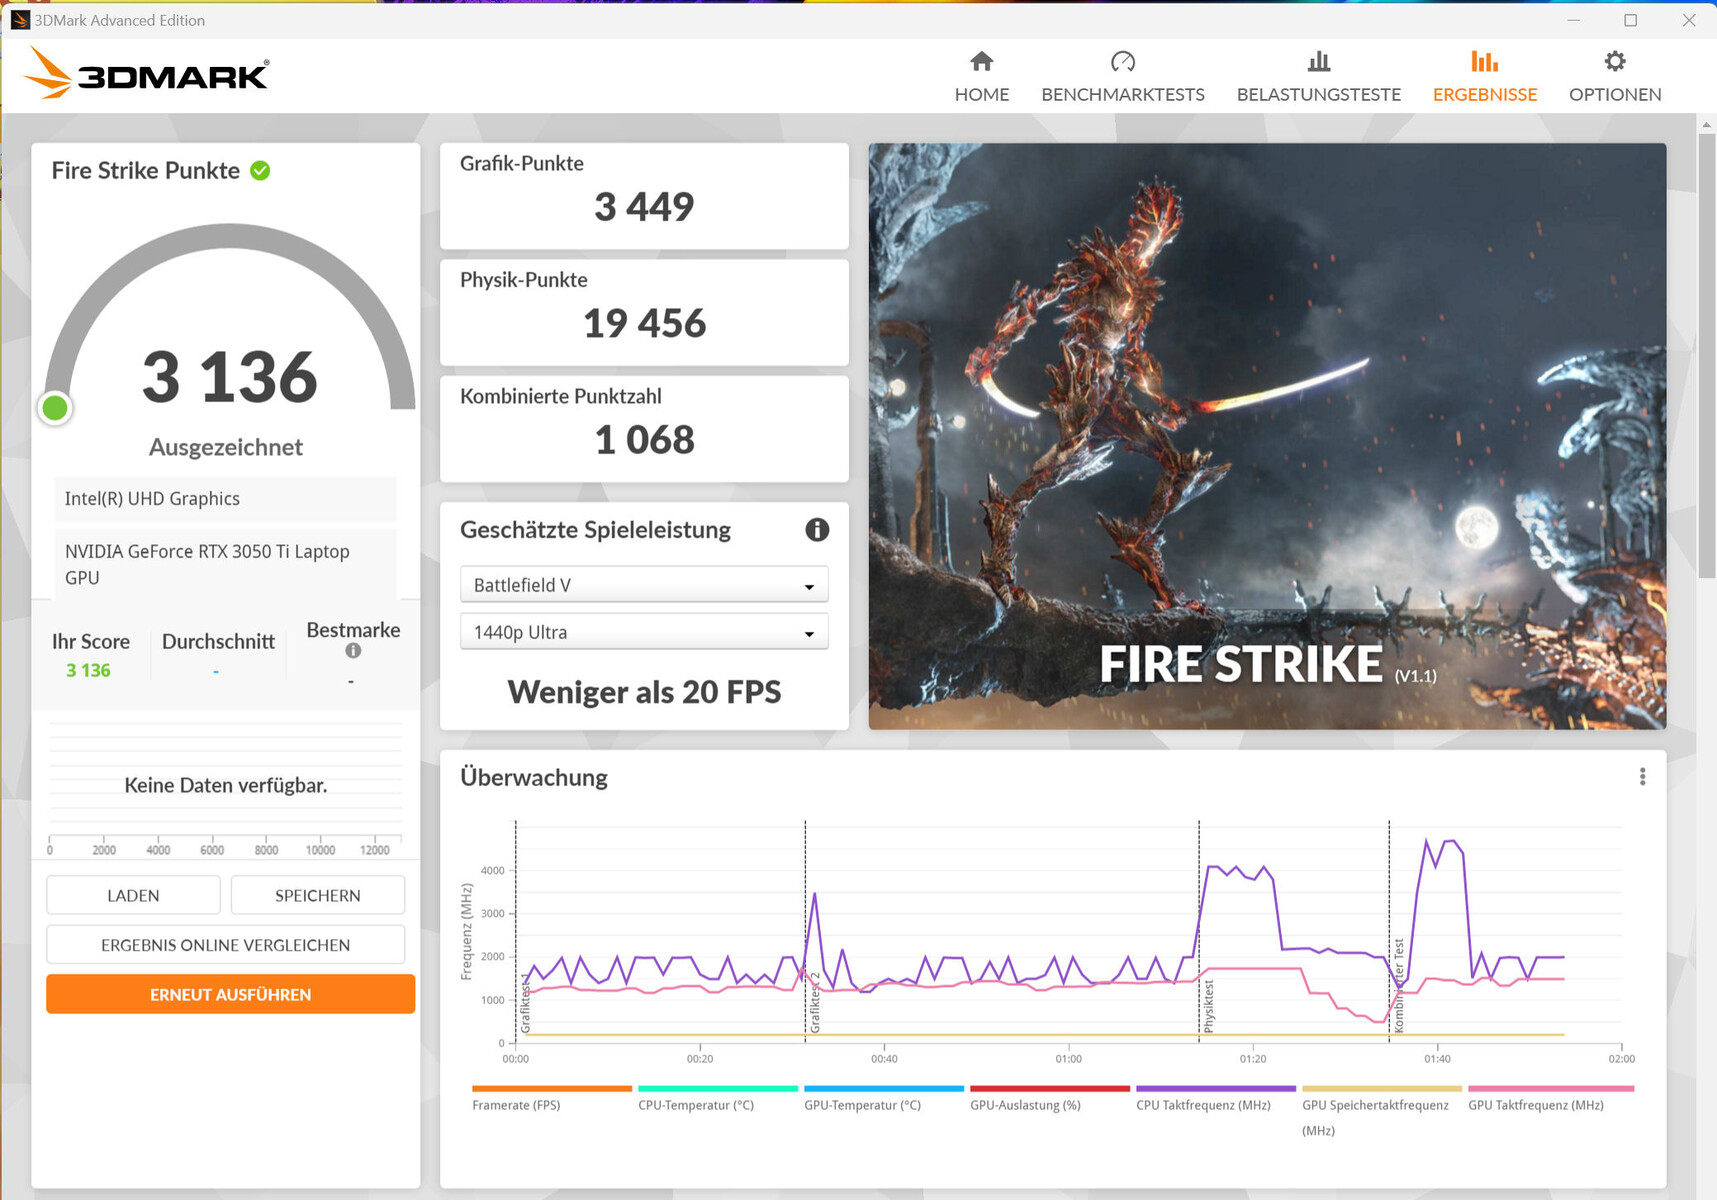
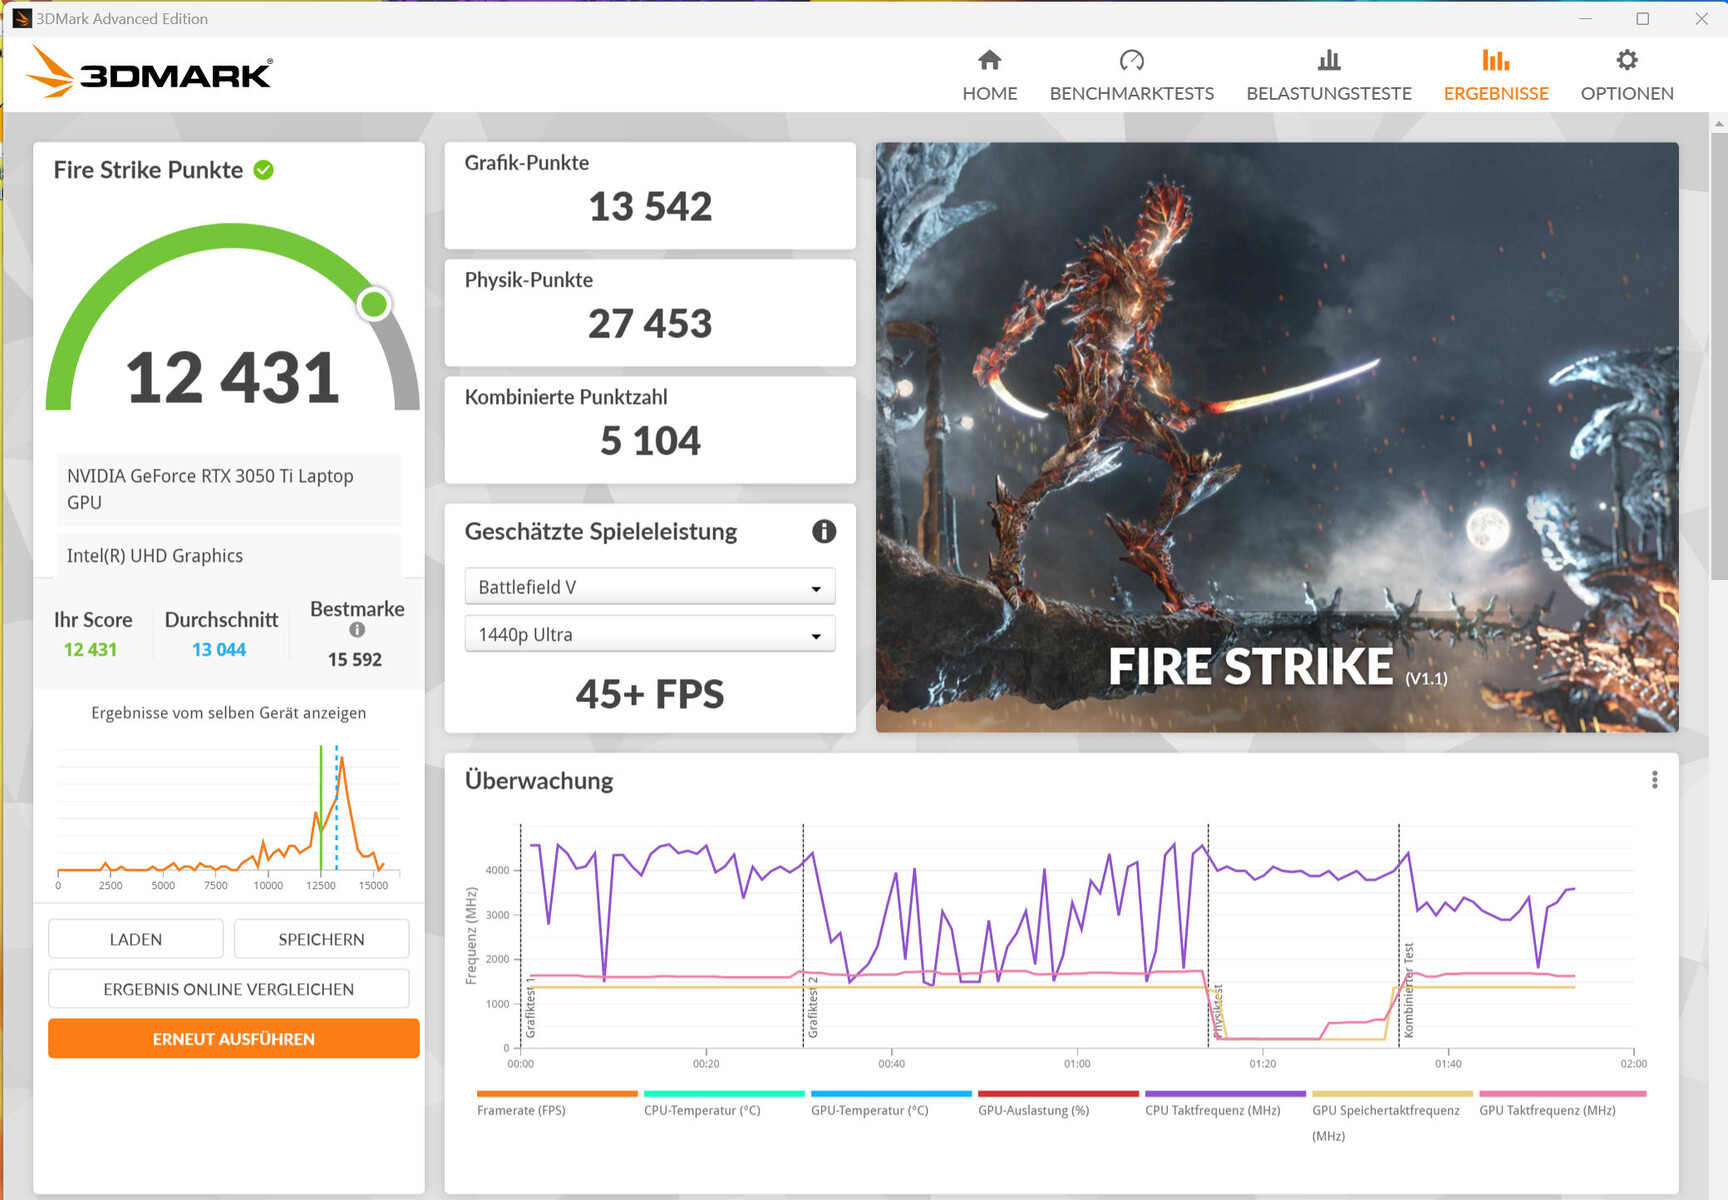
Våra benchmarks och speltester visade att GeForce RTX 3050 TigPU för bärbar dator (TGP: 65 watt) ligger strax under GPU:ns genomsnitt ("standardläge"). Användning av "prestandaläge" ledde till 10 till 15 procent högre hastigheter - enligt Witcher 3 -testet var TGP uttömd. Användning av dGPU-läge (via appen MyAsus) ledde inte till någon förbättring av prestandan.
Datorn tillåter FHD-spel med låga till höga inställningar och HD-spel med låga till medelhöga inställningar (whisper-läge). Det sistnämnda sänkte TGP till 25 watt, vilket resulterade i lägre ljudemissioner.
| 3DMark 06 Standard Score | 45370 poäng | |
| 3DMark 11 Performance | 16180 poäng | |
| 3DMark Cloud Gate Standard Score | 45033 poäng | |
| 3DMark Fire Strike Score | 11448 poäng | |
| 3DMark Time Spy Score | 4969 poäng | |
Hjälp | ||
| Geekbench 6.0 | |
| GPU Vulkan 6.0 | |
| Asus VivoBook Pro 16 | |
| Genomsnitt NVIDIA GeForce RTX 3050 Ti Laptop GPU (n=1) | |
| GPU OpenCL 6.0 | |
| Asus VivoBook Pro 16 | |
| Genomsnitt NVIDIA GeForce RTX 3050 Ti Laptop GPU (n=1) | |
| V-Ray Benchmark Next 4.10 | |
| GPU | |
| Schenker XMG Fusion 15 (Mid 22) (v4.10.07 ) | |
| Genomsnitt av klass Multimedia (32 - 1191, n=52, senaste 2 åren) | |
| Genomsnitt NVIDIA GeForce RTX 3050 Ti Laptop GPU (171 - 216, n=22) | |
| Asus VivoBook Pro 16 (v4.10.07 ) | |
| Acer Swift X SFX16-52G-77RX (v4.10.07 ) | |
| CPU | |
| Genomsnitt av klass Multimedia (4772 - 35165, n=52, senaste 2 åren) | |
| Asus VivoBook Pro 16 (v4.10.07 ) | |
| Acer Swift X SFX16-52G-77RX (v4.10.07 ) | |
| Schenker XMG Fusion 15 (Mid 22) (v4.10.07 ) | |
| Genomsnitt NVIDIA GeForce RTX 3050 Ti Laptop GPU (5796 - 16665, n=22) | |
* ... mindre är bättre
| The Witcher 3 - 1920x1080 Ultra Graphics & Postprocessing (HBAO+) | |
| Schenker XMG Fusion 15 (Mid 22) | |
| Dell Inspiron 16 Plus 7620 | |
| Genomsnitt NVIDIA GeForce RTX 3050 Ti Laptop GPU (19 - 58.5, n=29) | |
| Asus VivoBook Pro 16 | |
| Genomsnitt av klass Multimedia (11 - 107, n=5, senaste 2 åren) | |
| Acer Swift X SFX16-52G-77RX | |
| Final Fantasy XV Benchmark - 1920x1080 High Quality | |
| Schenker XMG Fusion 15 (Mid 22) (1.3) | |
| Genomsnitt av klass Multimedia (7.61 - 144.4, n=56, senaste 2 åren) | |
| Dell Inspiron 16 Plus 7620 (1.3) | |
| Genomsnitt NVIDIA GeForce RTX 3050 Ti Laptop GPU (23.5 - 106, n=24) | |
| Asus VivoBook Pro 16 (1.3) | |
| Acer Swift X SFX16-52G-77RX (1.3) | |
| Strange Brigade - 1920x1080 ultra AA:ultra AF:16 | |
| Schenker XMG Fusion 15 (Mid 22) (1.47.22.14 D3D12) | |
| Genomsnitt av klass Multimedia (13.3 - 303, n=55, senaste 2 åren) | |
| Dell Inspiron 16 Plus 7620 (1.47.22.14 D3D12) | |
| Genomsnitt NVIDIA GeForce RTX 3050 Ti Laptop GPU (34.8 - 101.3, n=25) | |
| Asus VivoBook Pro 16 (1.47.22.14 D3D12) | |
| Acer Swift X SFX16-52G-77RX (1.47.22.14 D3D12) | |
Witcher 3 FPS diagram
| låg | med. | hög | ultra | QHD | |
|---|---|---|---|---|---|
| GTA V (2015) | 175.1 | 170.9 | 111.9 | 53.8 | 39 |
| The Witcher 3 (2015) | 218.5 | 150.8 | 87.6 | 47.1 | |
| Dota 2 Reborn (2015) | 134.6 | 118.9 | 108.5 | 101.6 | |
| Final Fantasy XV Benchmark (2018) | 112.7 | 65 | 46.2 | 32 | |
| X-Plane 11.11 (2018) | 125.4 | 110.2 | 90.5 | ||
| Strange Brigade (2018) | 241 | 121.2 | 98.3 | 84.5 | 61 |
| Doom Eternal (2020) | 188.1 | 120 | |||
| Flight Simulator 2020 (2020) | 99 | 52.1 | 38.4 | 26.4 | 19.6 |
| F1 22 (2022) | 127.5 | 115.3 | 73.1 | 24.3 | 17.4 |
| FIFA 23 (2022) | 78.2 | ||||
| Uncharted Legacy of Thieves Collection (2022) | 48.4 | 30.5 | 20.6 | 20 | 14.1 |
| Call of Duty Modern Warfare 2 2022 (2022) | 63 | 58 | 44 | 36 | |
| Spider-Man Miles Morales (2022) | 66.6 | 53.6 | 44.8 | 36.8 | 26.3 |
| The Callisto Protocol (2022) | 82.5 | 62.2 | 58.3 | 31.7 | 21.4 |
| Need for Speed Unbound (2022) | 73.9 | 62.6 | 35.5 | 27.9 | 15.6 |
| High On Life (2023) | 104.7 | 77.5 | 60.3 | 50.8 | 31.8 |
| The Witcher 3 v4 (2023) | 88.4 | 75.6 | 36.8 | 32.4 | 19.6 |
| Dead Space Remake (2023) | 37.2 | 35.1 | 28.2 | 24.6 | 9.81 |
| Hogwarts Legacy (2023) | 63.9 | 50 | 40.2 | 32.8 | 25 |
| Returnal (2023) | 52 | 50 | 45 | 34 | 27 |
| Atomic Heart (2023) | 94.3 | 71.4 | 41.6 | 32.3 | 24.5 |
| Company of Heroes 3 (2023) | 106.2 | 91.1 | 68.4 | 68.5 | 48.8 |
| Sons of the Forest (2023) | 54.9 | 38.8 | 35.4 | 33.3 | 25.6 |
| Resident Evil 4 Remake (2023) | 74.6 | 47.4 | 41 | 8.97 | 7.82 |
| The Last of Us (2023) | 44.9 | 32.9 | 25.6 | ||
| Dead Island 2 (2023) | 95.7 | 75.7 | 64.1 | 58 | 45.9 |
| Star Wars Jedi Survivor (2023) | 36.9 | 31 | 28.9 | 25.8 | 15.4 |
Utsläpp och ström - Asus-datorn är bullrig
Bullerutsläpp
I tomgångsläge och vid daglig användning (kontor, internet) arbetar den bärbara datorn i allmänhet tyst - ibland till och med ljudlöst. Vid full belastning uppmätte vi ljudemissioner på upp till 61,5 dB(A) ("prestandaläge") - alldeles för högt. Att använda "standardläge" ledde till ett mer balanserat förhållande mellan buller och prestanda - trots detta gjorde kylaren en hel del oväsen.
"Whisper mode" kommer förmodligen att vara de flesta användares förstahandsval - det gör precis vad det står på plåten. Fläktarna körs med låga hastigheter även vid belastning och är knappt hörbara - på bekostnad av processorkraften. Spelande är fortfarande möjligt, men endast i HD.
Ljudnivå
| Låg belastning |
| 25.2 / 25.2 / 25.2 dB(A) |
| Hög belastning |
| 55.1 / 61.5 dB(A) |
 | ||
30 dB tyst 40 dB(A) hörbar 50 dB(A) högt ljud |
||
min: | ||
| Asus VivoBook Pro 16 GeForce RTX 3050 Ti Laptop GPU, i7-12700H, Intel SSD 670p SSDPEKNU010TZ | Dell Inspiron 16 Plus 7620 GeForce RTX 3050 Ti Laptop GPU, i7-12700H, Kioxia BG5 KBG50ZNS512G | Schenker XMG Fusion 15 (Mid 22) GeForce RTX 3070 Laptop GPU, i7-11800H, Samsung SSD 980 Pro 1TB MZ-V8P1T0BW | Acer Swift X SFX16-52G-77RX A370M, i7-1260P, WDC PC SN810 1TB | |
|---|---|---|---|---|
| Noise | 3% | 0% | 8% | |
| av / miljö * (dB) | 25.2 | 23.3 8% | 26 -3% | 25 1% |
| Idle Minimum * (dB) | 25.2 | 25.7 -2% | 26 -3% | 25 1% |
| Idle Average * (dB) | 25.2 | 26.1 -4% | 28 -11% | 25 1% |
| Idle Maximum * (dB) | 25.2 | 30.6 -21% | 31 -23% | 25 1% |
| Load Average * (dB) | 55.1 | 46.2 16% | 45 18% | 44.7 19% |
| Load Maximum * (dB) | 61.5 | 49.4 20% | 48 22% | 45.6 26% |
| Witcher 3 ultra * (dB) | 49.2 | 46 |
* ... mindre är bättre
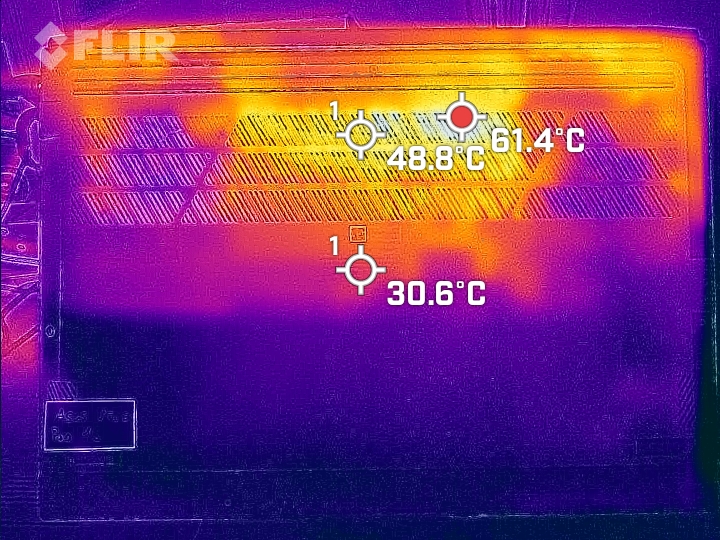
Temperatur
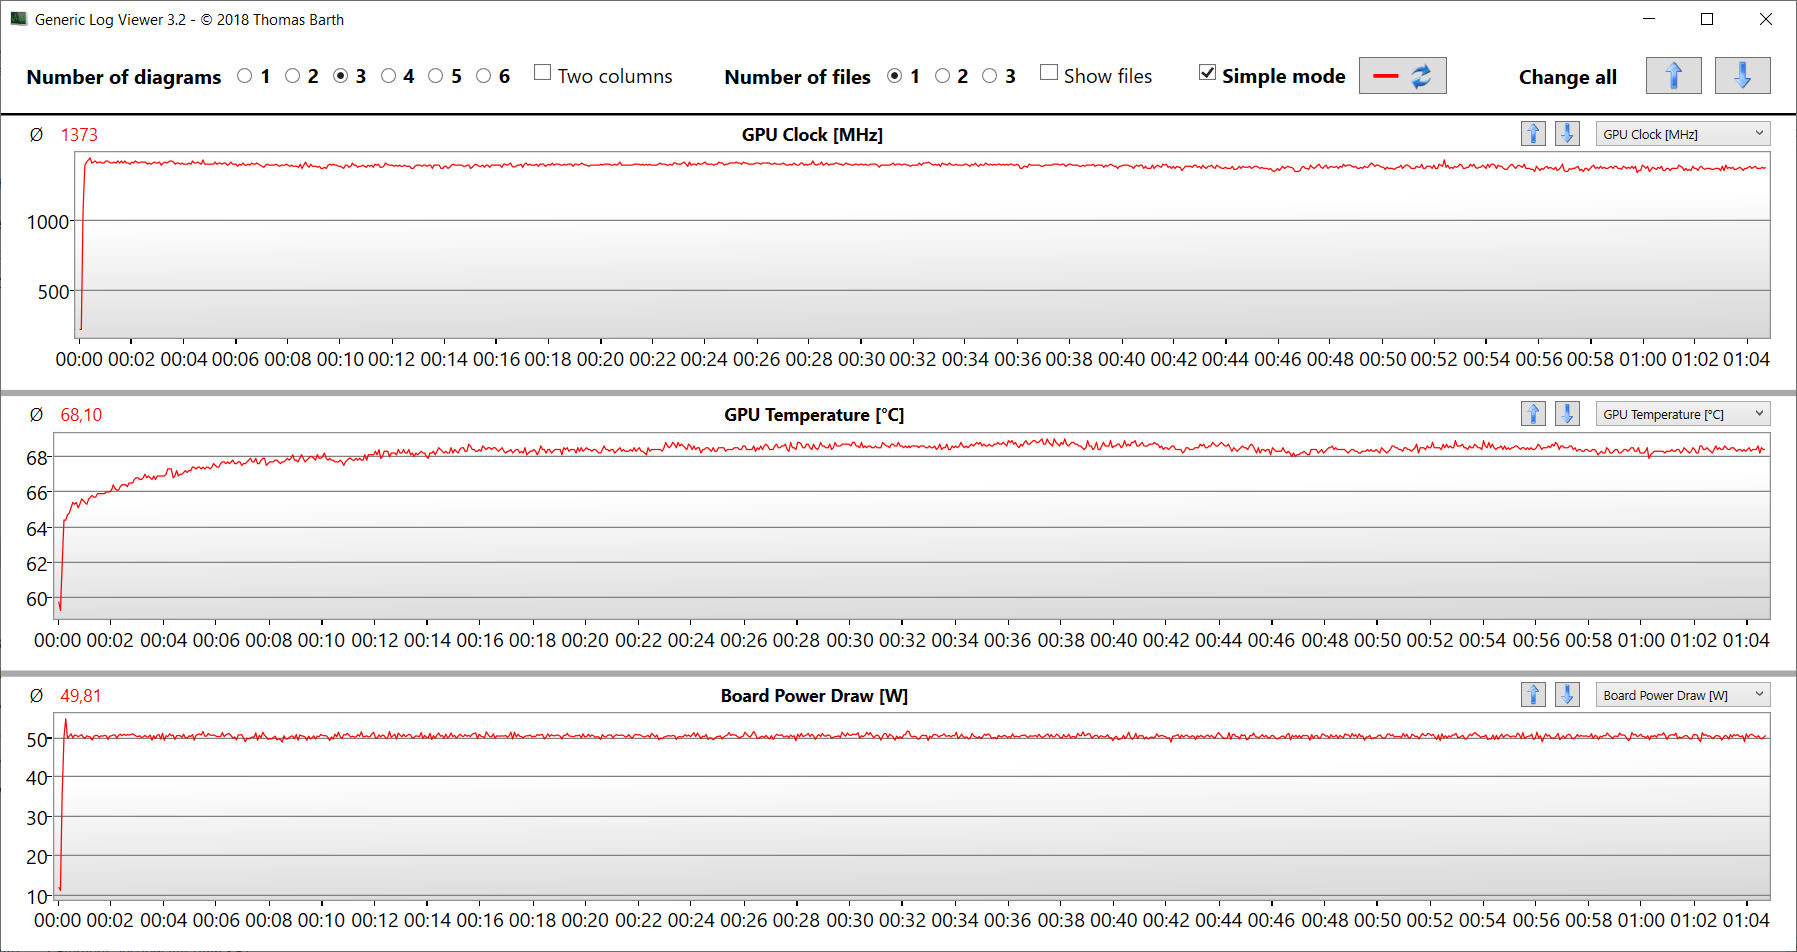
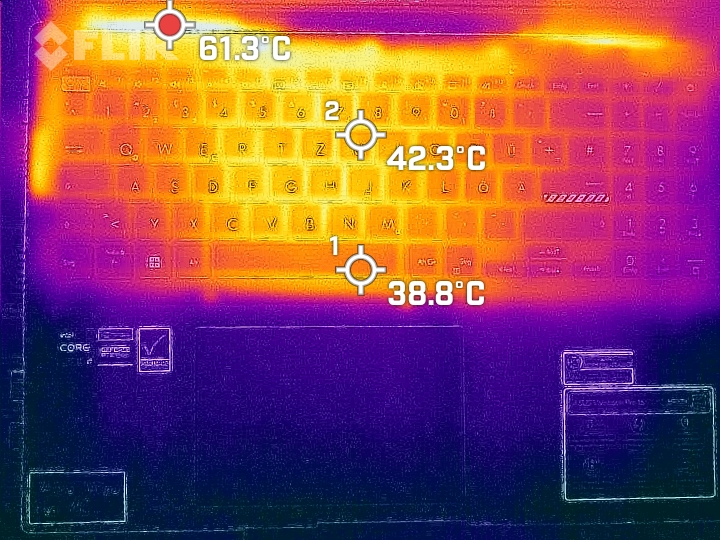
Vid belastning nådde den bärbara datorn ganska höga temperaturer, men i genomsnitt var temperaturen måttlig. Detta innebär att vi uppmätte högst 55,5 °C under vårt stresstest. Vid daglig användning befinner sig dock temperaturerna i allmänhet inom ett acceptabelt intervall.
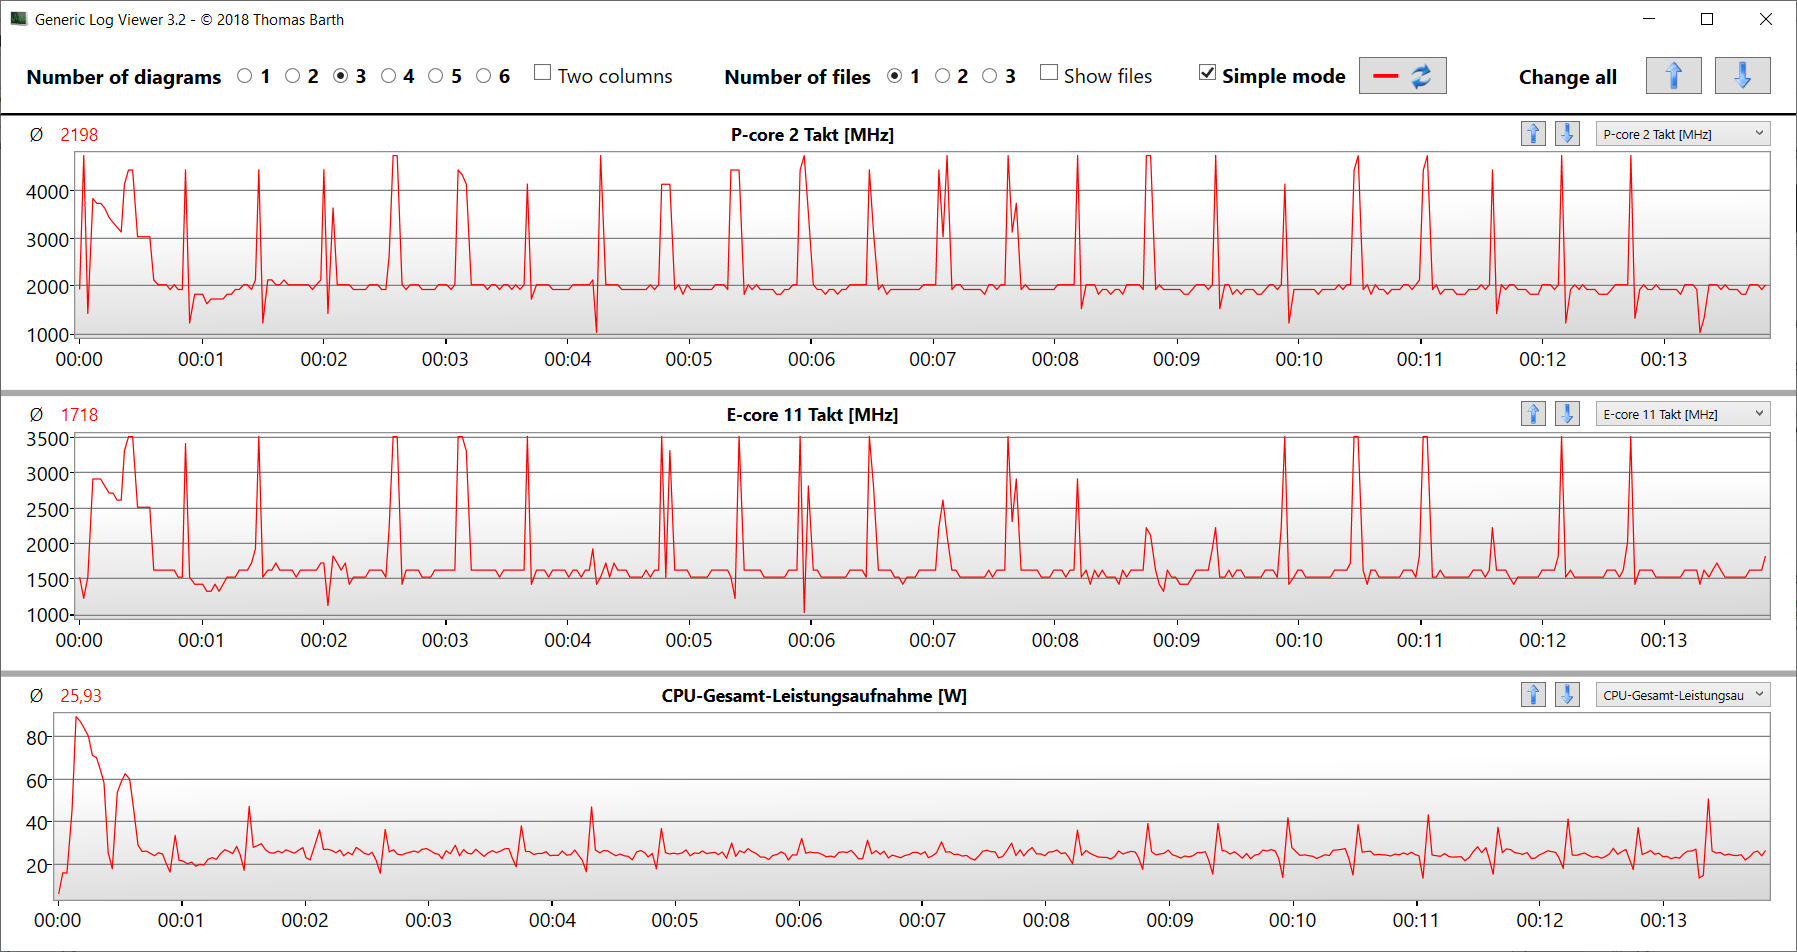
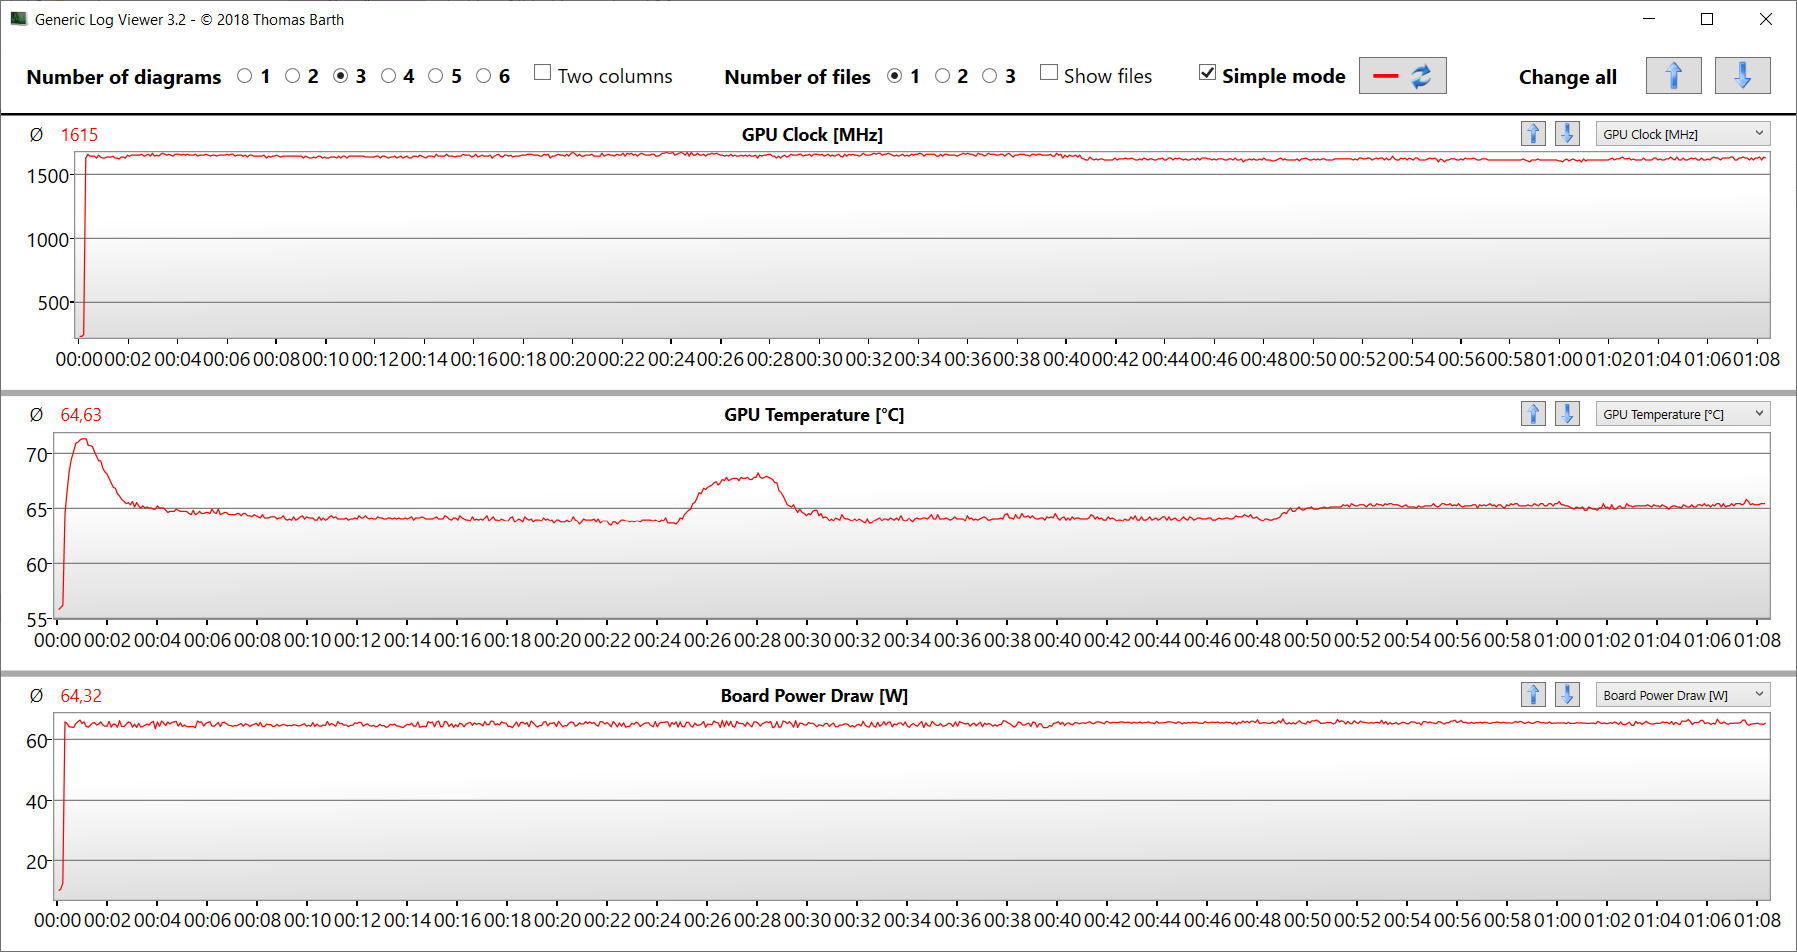
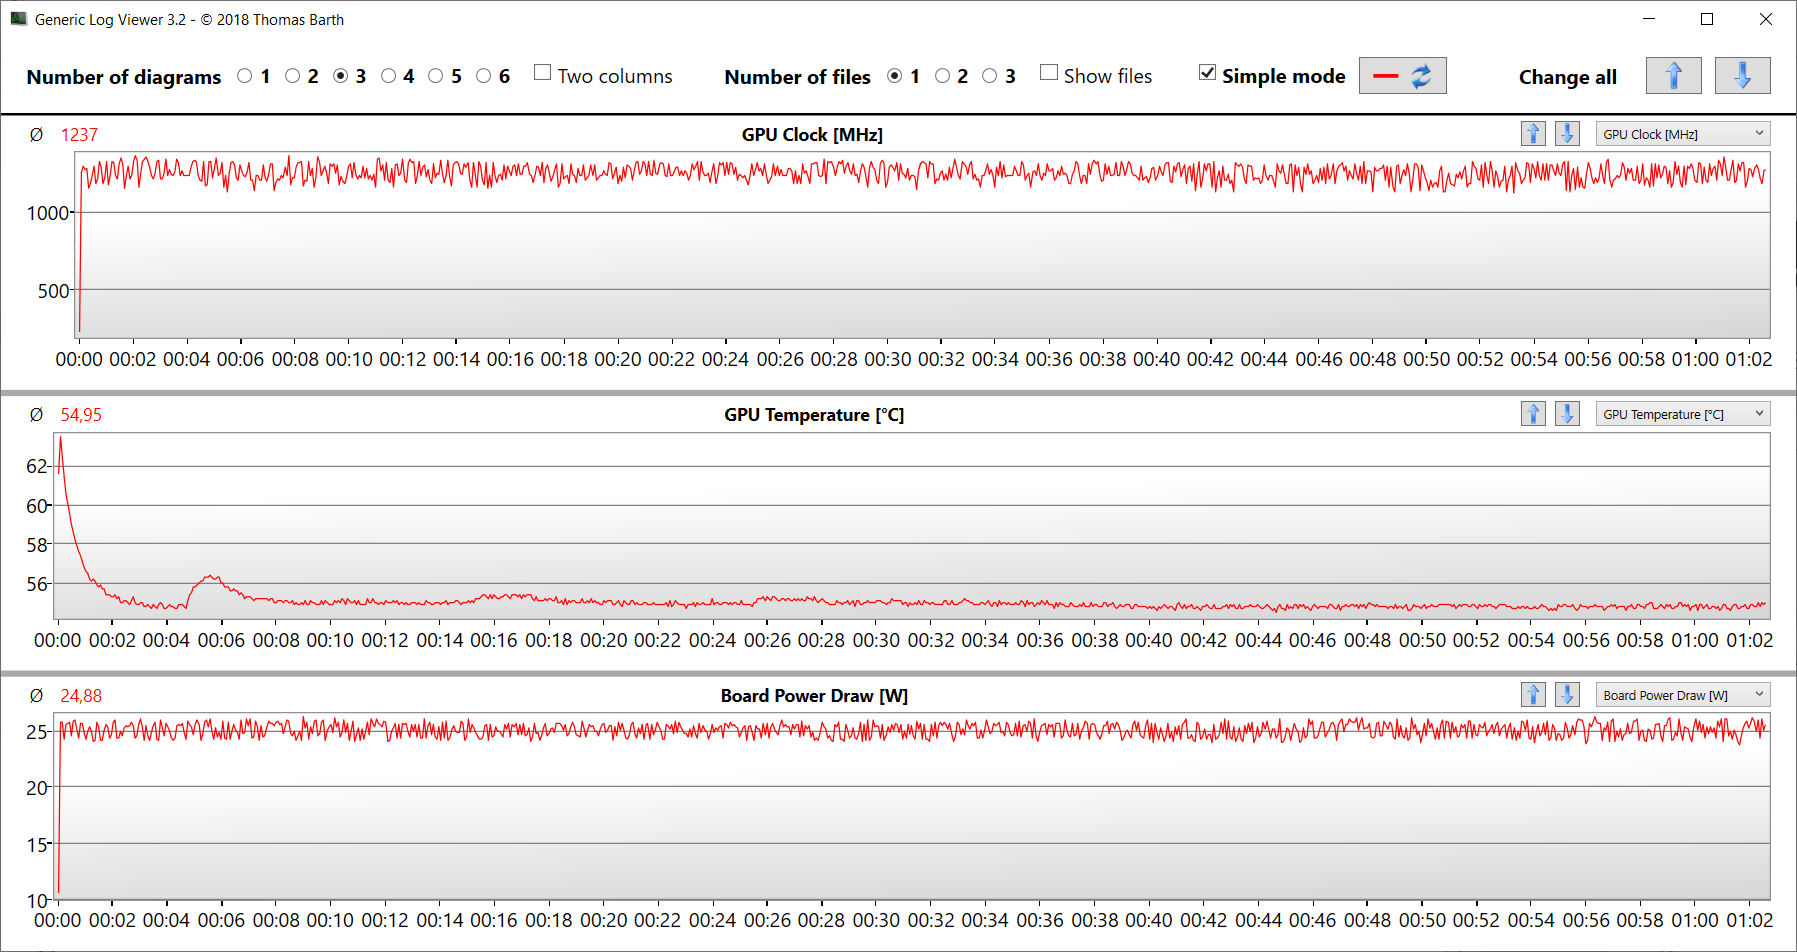
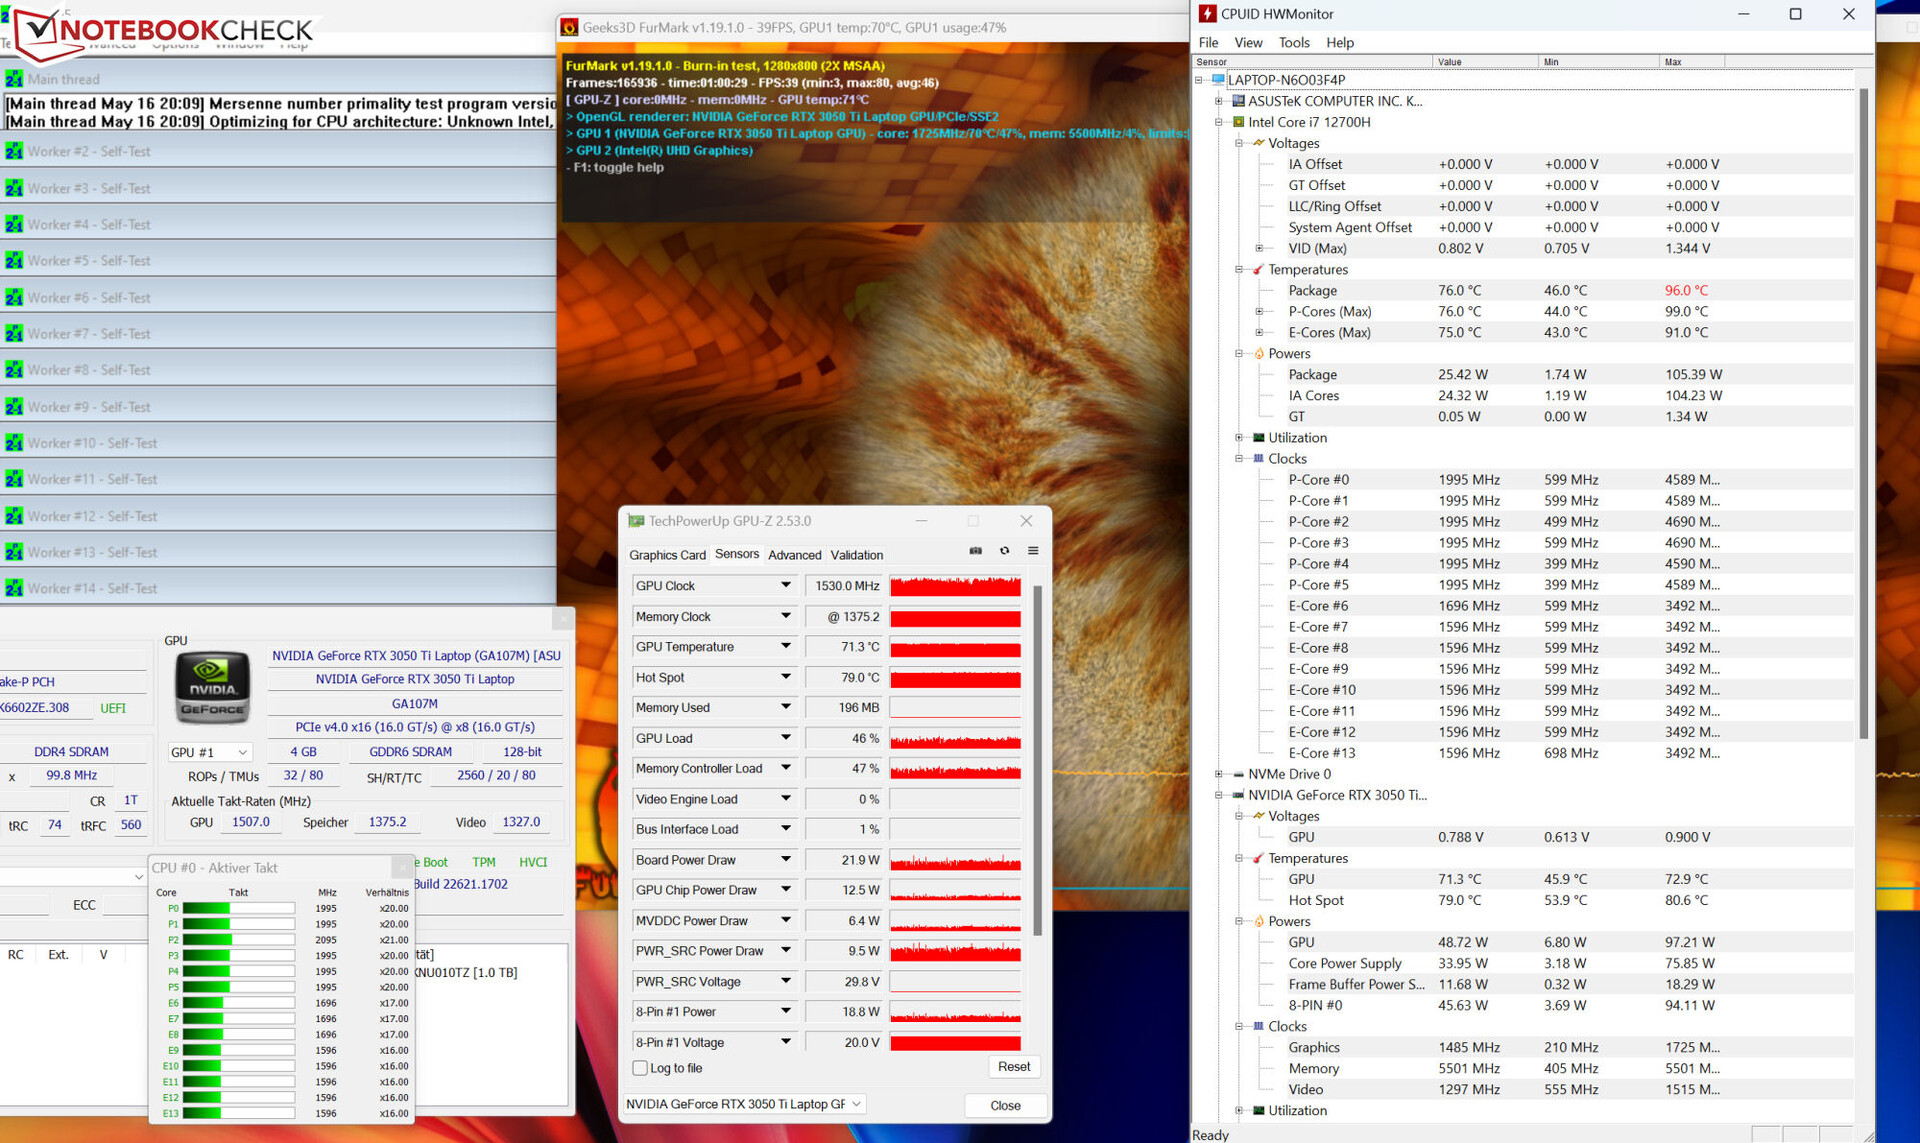
Stresstestet (Prime95 och Furmark i kontinuerlig användning) simulerar ett extremt scenario för att testa hur stabilt systemet förblir vid full belastning. Processorn inledde stresstestet med genomsnittliga klockfrekvenser (P: 3,2 - 3,3 GHz; E: 2,7 GHz) och grafikkärnan hade en frekvens på 1,1 - 1,4 GHz. Medan CPU-klockfrekvenserna sjönk under testets gång, steg GPU-klockfrekvenserna med en liten bit.
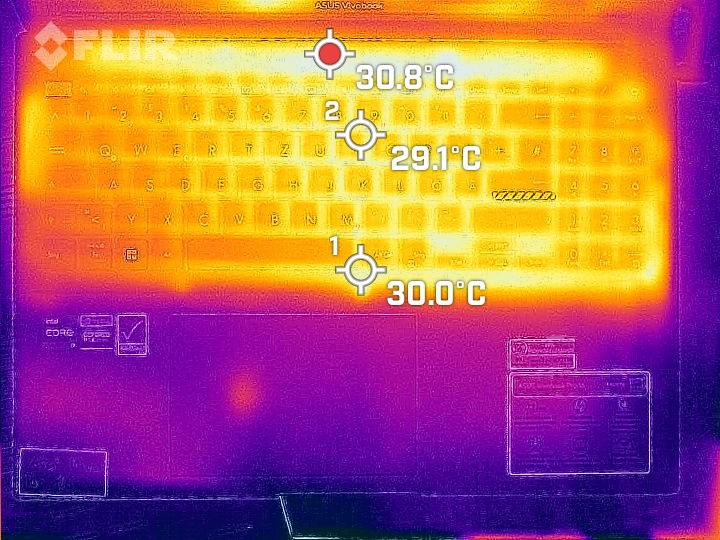
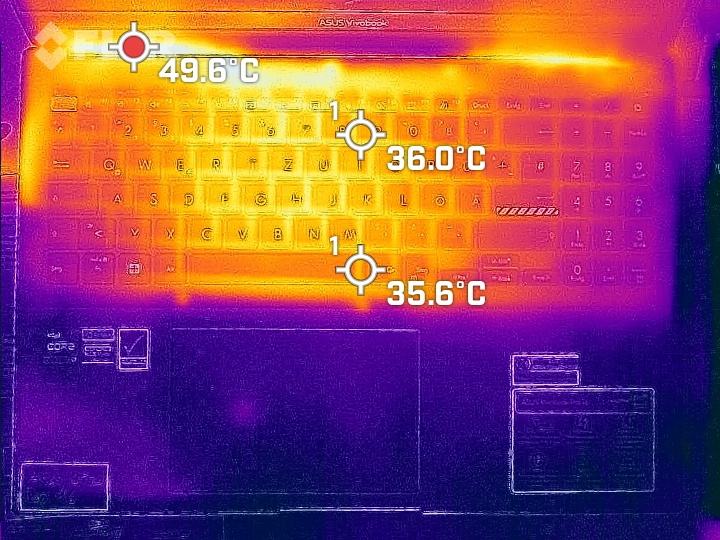
(±) Den maximala temperaturen på ovansidan är 44.2 °C / 112 F, jämfört med genomsnittet av 36.8 °C / 98 F , allt från 21 till 71 °C för klassen Multimedia.
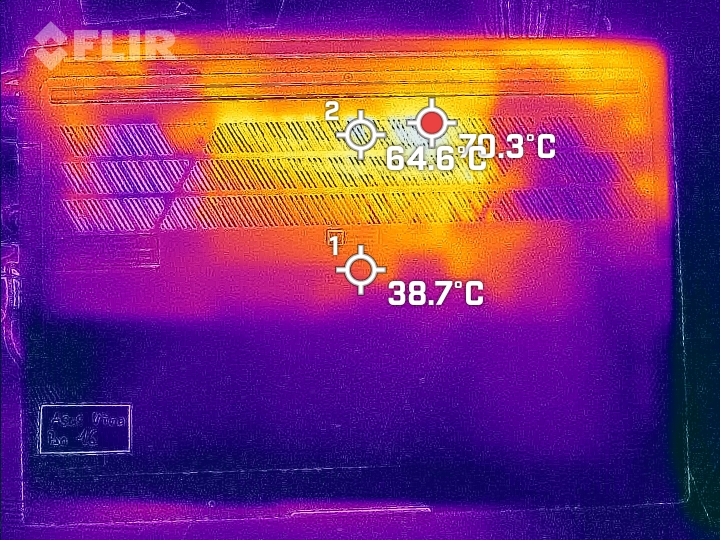
(-) Botten värms upp till maximalt 53 °C / 127 F, jämfört med genomsnittet av 39.1 °C / 102 F
(+) Vid tomgångsbruk är medeltemperaturen för ovansidan 27.9 °C / 82 F, jämfört med enhetsgenomsnittet på 31.3 °C / ### class_avg_f### F.
(±) När du spelar The Witcher 3 är medeltemperaturen för ovansidan 33.3 °C / 92 F, jämfört med enhetsgenomsnittet på 31.3 °C / ## #class_avg_f### F.
(+) Handledsstöden och pekplattan är kallare än hudtemperaturen med maximalt 23.7 °C / 74.7 F och är därför svala att ta på.
(+) Medeltemperaturen för handledsstödsområdet på liknande enheter var 28.7 °C / 83.7 F (+5 °C / 9 F).
| Asus VivoBook Pro 16 Intel Core i7-12700H, NVIDIA GeForce RTX 3050 Ti Laptop GPU | Dell Inspiron 16 Plus 7620 Intel Core i7-12700H, NVIDIA GeForce RTX 3050 Ti Laptop GPU | Schenker XMG Fusion 15 (Mid 22) Intel Core i7-11800H, NVIDIA GeForce RTX 3070 Laptop GPU | Acer Swift X SFX16-52G-77RX Intel Core i7-1260P, Intel Arc A370M | |
|---|---|---|---|---|
| Heat | 10% | -13% | 3% | |
| Maximum Upper Side * (°C) | 44.2 | 46 -4% | 52 -18% | 49.4 -12% |
| Maximum Bottom * (°C) | 53 | 45.8 14% | 63 -19% | 55.5 -5% |
| Idle Upper Side * (°C) | 32.1 | 29.2 9% | 37 -15% | 28.4 12% |
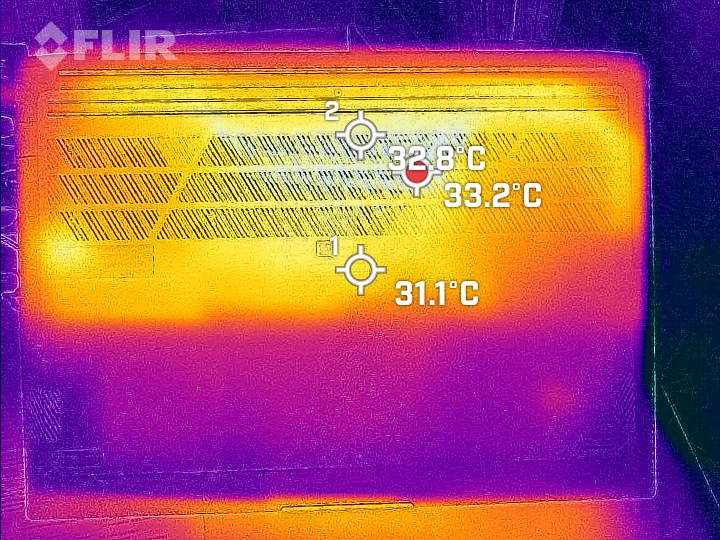
| Idle Bottom * (°C) | 38.4 | 31 19% | 38 1% | 32.6 15% |
* ... mindre är bättre
Högtalare
Stereohögtalarna ger ett hyfsat ljud, men knappt någon bas.
Asus VivoBook Pro 16 ljudanalys
(+) | högtalare kan spela relativt högt (88.5 dB)
Bas 100 - 315 Hz
(-) | nästan ingen bas - i genomsnitt 20.8% lägre än medianen
(±) | linjäriteten för basen är genomsnittlig (12.8% delta till föregående frekvens)
Mellan 400 - 2000 Hz
(+) | balanserad mellan - endast 2.2% från medianen
(+) | mids är linjära (4.7% delta till föregående frekvens)
Högsta 2 - 16 kHz
(±) | högre toppar - i genomsnitt 7.4% högre än medianen
(+) | toppar är linjära (5.9% delta till föregående frekvens)
Totalt 100 - 16 000 Hz
(±) | linjäriteten för det totala ljudet är genomsnittlig (16.2% skillnad mot median)
Jämfört med samma klass
» 41% av alla testade enheter i den här klassen var bättre, 7% liknande, 51% sämre
» Den bästa hade ett delta på 5%, genomsnittet var 17%, sämst var 45%
Jämfört med alla testade enheter
» 26% av alla testade enheter var bättre, 6% liknande, 68% sämre
» Den bästa hade ett delta på 4%, genomsnittet var 23%, sämst var 134%
Dell Inspiron 16 Plus 7620 ljudanalys
(+) | högtalare kan spela relativt högt (87.8 dB)
Bas 100 - 315 Hz
(-) | nästan ingen bas - i genomsnitt 22.2% lägre än medianen
(±) | linjäriteten för basen är genomsnittlig (9.7% delta till föregående frekvens)
Mellan 400 - 2000 Hz
(+) | balanserad mellan - endast 3.3% från medianen
(+) | mids är linjära (5.3% delta till föregående frekvens)
Högsta 2 - 16 kHz
(+) | balanserade toppar - endast 2.5% från medianen
(+) | toppar är linjära (4.7% delta till föregående frekvens)
Totalt 100 - 16 000 Hz
(+) | det totala ljudet är linjärt (13.4% skillnad mot median)
Jämfört med samma klass
» 28% av alla testade enheter i den här klassen var bättre, 5% liknande, 68% sämre
» Den bästa hade ett delta på 5%, genomsnittet var 17%, sämst var 45%
Jämfört med alla testade enheter
» 14% av alla testade enheter var bättre, 4% liknande, 82% sämre
» Den bästa hade ett delta på 4%, genomsnittet var 23%, sämst var 134%
Effektförbrukning
Den bärbara datorn uppvisade ingen anmärkningsvärd energiförbrukning. De värden vi mätte ligger på en normal nivå för den installerade maskinvaran. Testet Witcher 3 kördes med konstant energiförbrukning. Dess strömförsörjning (150 watt) är tillräckligt stor.
| Av/Standby | |
| Låg belastning | |
| Hög belastning |
|
Förklaring:
min: | |
| Asus VivoBook Pro 16 i7-12700H, GeForce RTX 3050 Ti Laptop GPU, Intel SSD 670p SSDPEKNU010TZ, IPS, 2560x1600, 16" | Dell Inspiron 16 Plus 7620 i7-12700H, GeForce RTX 3050 Ti Laptop GPU, Kioxia BG5 KBG50ZNS512G, IPS, 3072x1920, 16" | Schenker XMG Fusion 15 (Mid 22) i7-11800H, GeForce RTX 3070 Laptop GPU, Samsung SSD 980 Pro 1TB MZ-V8P1T0BW, IPS, 2560x1440, 15.6" | Acer Swift X SFX16-52G-77RX i7-1260P, A370M, WDC PC SN810 1TB, IPS-LED, 2560x1600, 16" | Genomsnitt NVIDIA GeForce RTX 3050 Ti Laptop GPU | Genomsnitt av klass Multimedia | |
|---|---|---|---|---|---|---|
| Power Consumption | 12% | -26% | 42% | 10% | 33% | |
| Idle Minimum * (Watt) | 8.7 | 6.8 22% | 12 -38% | 3.7 57% | 8.2 ? 6% | 5.62 ? 35% |
| Idle Average * (Watt) | 13.1 | 9.6 27% | 17 -30% | 7.6 42% | 12.6 ? 4% | 10.2 ? 22% |
| Idle Maximum * (Watt) | 18.3 | 17 7% | 24 -31% | 11.1 39% | 17.2 ? 6% | 12.5 ? 32% |
| Load Average * (Watt) | 116 | 117.5 -1% | 106 9% | 70 40% | 92 ? 21% | 65 ? 44% |
| Witcher 3 ultra * (Watt) | 117.6 | 113.1 4% | 159.9 -36% | 68.8 41% | ||
| Load Maximum * (Watt) | 162 | 137.4 15% | 208 -28% | 108 33% | 139.1 ? 14% | 111.9 ? 31% |
* ... mindre är bättre
power consumption Witcher 3 / stress test
Power consumption with external monitor
Batteriets livslängd
Den 16-tums bärbara datorn klarade en drifttid på 7:14 timmar i vårt praktiska WLAN-test (kartläggning av belastningen när du ringer upp webbplatser via ett skript) - ett hyggligt, men inte fantastiskt värde. Inom jämförelsefältet tar VivoBook sista platsen.
För
Emot
Bedömning - En multimedial allrounder med en imponerande skärm
Video- och fotoredigering, streaming, rendering och spel: Allt detta hör till VivoBook Pro 16:s främsta styrkor. DessCore 7-12700HochGeForce RTX 3050 Ti bärbar datorlevererar all nödvändig kraft - båda komponenterna körs konsekvent med höga klockfrekvenser. Fast den används inte riktigt till sin fulla potential, eftersom RAM-minnet endast körs i enkanaligt läge.
Asus VivoBook Pro 16 är en bärbar dator som passar spelare och kreatörer som inte lägger alltför stor vikt vid att ha den senaste hårdvaran.
Den bärbara datorn värms bara upp lite vid belastning, men den kan bli väldigt högljudd - eller för högljudd till och med. Positivt: Det finns ett whisper-läge som kan sänka de ljudemissioner som den bärbara datorn producerar på bekostnad av dess prestanda - vilket åtminstone kan möjliggöra lite mer avslappnat arbete.
Den kompakta byggnaden, den relativt låga vikten (1,9 kg) och hyggliga driftstider (WLAN: 7:15 h) gör VivoBook till en ganska mobil enhet. Positivt: Batteriet kan laddas med en USB-C-strömförsörjning (minst 65 watt, 20 V) - båda USB-C-portarna stöder strömförsörjning. Du behöver alltså inte fortsätta använda den medföljande proprietära strömförsörjningen.
Vårt testexemplar har ingen OLED-skärm, men den är allmänt tillgänglig inom VivoBook Pro 16-serien. Du bör inte missa den: Den installerade IPS-skärmen (16 tum, 2 560 x 1 600 pixlar) i 16:10-format imponerar med sin ljusstyrka, goda kontrast, stabila betraktningsvinklar, korta reaktionstider, bra färgskildring och utmärkt färgrymdstäckning.
alternativt kan du ta en titt påDell Inspiron 16 Plus 7620: Med jämförbar prestanda erbjuder den betydligt bättre körtider. Ett budgetvänligt alternativ ärAcer Swift X 16, som ger lägre grafikprestanda - men den kan erbjuda mycket bra körtider och ett pris på cirka 1 000 dollar.
Pris och tillgänglighet
Den version av Asus VivoBook Pro 16 som vi testade kan köpas på Amazon för 1 247 dollar.
Asus VivoBook Pro 16
- 05/22/2023 v7 (old)
Sascha Mölck
Genomskinlighet
Valet av enheter som ska granskas görs av vår redaktion. Testprovet gavs till författaren som ett lån av tillverkaren eller återförsäljaren för denna recension. Långivaren hade inget inflytande på denna recension och inte heller fick tillverkaren en kopia av denna recension innan publiceringen. Det fanns ingen skyldighet att publicera denna recension. Som ett oberoende medieföretag är Notebookcheck inte föremål för auktoritet från tillverkare, återförsäljare eller förlag.
This is how Notebookcheck is testingEvery year, Notebookcheck independently reviews hundreds of laptops and smartphones using standardized procedures to ensure that all results are comparable. We have continuously developed our test methods for around 20 years and set industry standards in the process. In our test labs, high-quality measuring equipment is utilized by experienced technicians and editors. These tests involve a multi-stage validation process. Our complex rating system is based on hundreds of well-founded measurements and benchmarks, which maintains objectivity.
Price comparison

