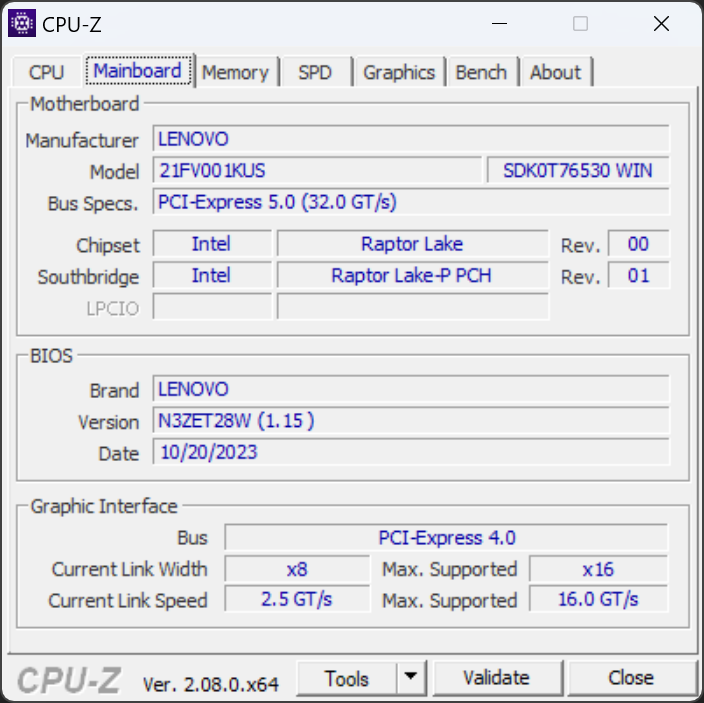
Lenovo ThinkPad P1 G6 recension: 80 W GeForce RTX 4080 för ultratunn arbetsstation

Vi har nyligen granskat ThinkPad P1 G6 med Core i9-13900H-processor, RTX 2000 GPU och 1600p IPS-skärm och fann att det var en mycket konkurrenskraftig 16-tums arbetsstation. Den här gången är vi redo att testa en annan konfiguration med Core i7-13800H, GeForce RTX 4080 GPU och 2400p OLED-skärm för att se hur de olika specifikationerna kan påverka prestanda, batteritid, intern hårdvara och mycket mer.
Observera att ThinkPad P1 16-serien inte ska förväxlas med ThinkPad P16-serien som består av större och tyngre modeller med snabbare Core HX-serie-alternativ.
Fler recensioner av Lenovo:
Potentiella konkurrenter i jämförelse
Gradering | Datum | Modell | Vikt | Höjd | Storlek | Upplösning | Pris |
|---|---|---|---|---|---|---|---|
| 90.1 % v7 (old) | 12/2023 | Lenovo ThinkPad P1 G6 21FV001KUS i7-13800H, GeForce RTX 4080 Laptop GPU | 1.9 kg | 17.5 mm | 16.00" | 3480x2400 | |
| 91.7 % v7 (old) | 10/2023 | Lenovo ThinkPad P1 G6-21FV000DGE i9-13900H, RTX 2000 Ada Generation Laptop | 1.9 kg | 17.5 mm | 16.00" | 2560x1600 | |
| 89.8 % v7 (old) | 11/2021 | Lenovo ThinkPad P1 G4-20Y4S0KS00 i7-11850H, GeForce RTX 3070 Laptop GPU | 2 kg | 17.7 mm | 16.00" | 3840x2400 | |
| 91 % v7 (old) | 02/2023 | Lenovo ThinkPad P16 G1 RTX A5500 i9-12950HX, RTX A5500 Laptop GPU | 3 kg | 30.23 mm | 16.00" | 3840x2400 | |
| 89 % v7 (old) | 08/2023 | Dell Precision 5000 5680 i9-13900H, RTX 5000 Ada Generation Laptop | 2.3 kg | 22.17 mm | 16.00" | 3840x2400 | |
| 92.3 % v7 (old) | 09/2023 | HP ZBook Fury 16 G10 i9-13950HX, RTX 5000 Ada Generation Laptop | 2.6 kg | 28.5 mm | 16.00" | 3840x2400 |
SD-kortläsare
| SD Card Reader | |
| average JPG Copy Test (av. of 3 runs) | |
| Dell Precision 5000 5680 (Toshiba Exceria Pro SDXC 64 GB UHS-II) | |
| Lenovo ThinkPad P1 G6 21FV001KUS (Toshiba Exceria Pro SDXC 64 GB UHS-II) | |
| HP ZBook Fury 16 G10 (Toshiba Exceria Pro SDXC 64 GB UHS-II) | |
| Lenovo ThinkPad P1 G6-21FV000DGE (Angelbird AV Pro V60) | |
| Lenovo ThinkPad P16 G1 RTX A5500 (Toshiba Exceria Pro SDXC 64 GB UHS-II) | |
| maximum AS SSD Seq Read Test (1GB) | |
| Dell Precision 5000 5680 (Toshiba Exceria Pro SDXC 64 GB UHS-II) | |
| Lenovo ThinkPad P1 G6 21FV001KUS (Toshiba Exceria Pro SDXC 64 GB UHS-II) | |
| HP ZBook Fury 16 G10 (Toshiba Exceria Pro SDXC 64 GB UHS-II) | |
| Lenovo ThinkPad P1 G6-21FV000DGE (Angelbird AV Pro V60) | |
| Lenovo ThinkPad P16 G1 RTX A5500 (Toshiba Exceria Pro SDXC 64 GB UHS-II) | |
Kommunikation
Medan mottagningshastigheterna är stabila tenderar sändningshastigheterna att vara långsammare och med fler fluktuationer än förväntat, även efter upprepade tester.
Webbkamera
Enheten har konfigurerats med en 5 MP 1440p-webbkamera jämfört med 2 MP 1080p-webbkameran i vår ursprungliga RTX 2000-drivna recension för att ge en skarpare bild.
IR och en fysisk slutare ingår som standard.


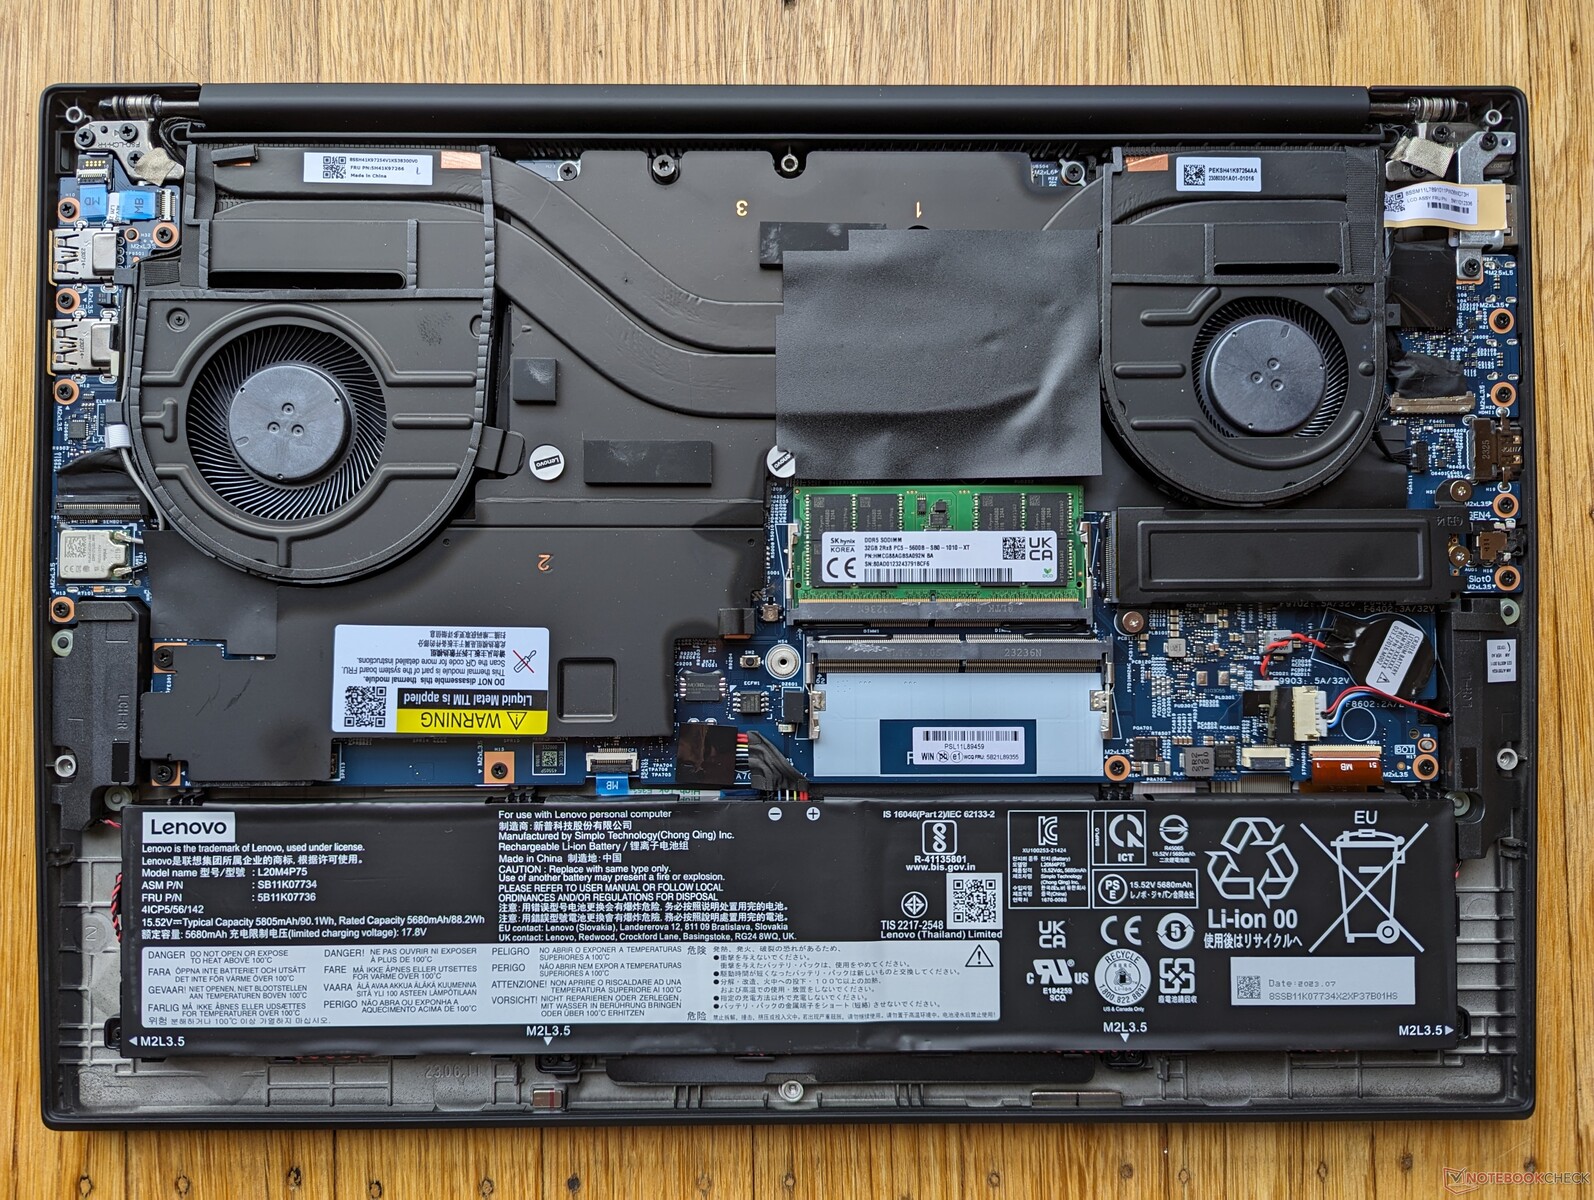
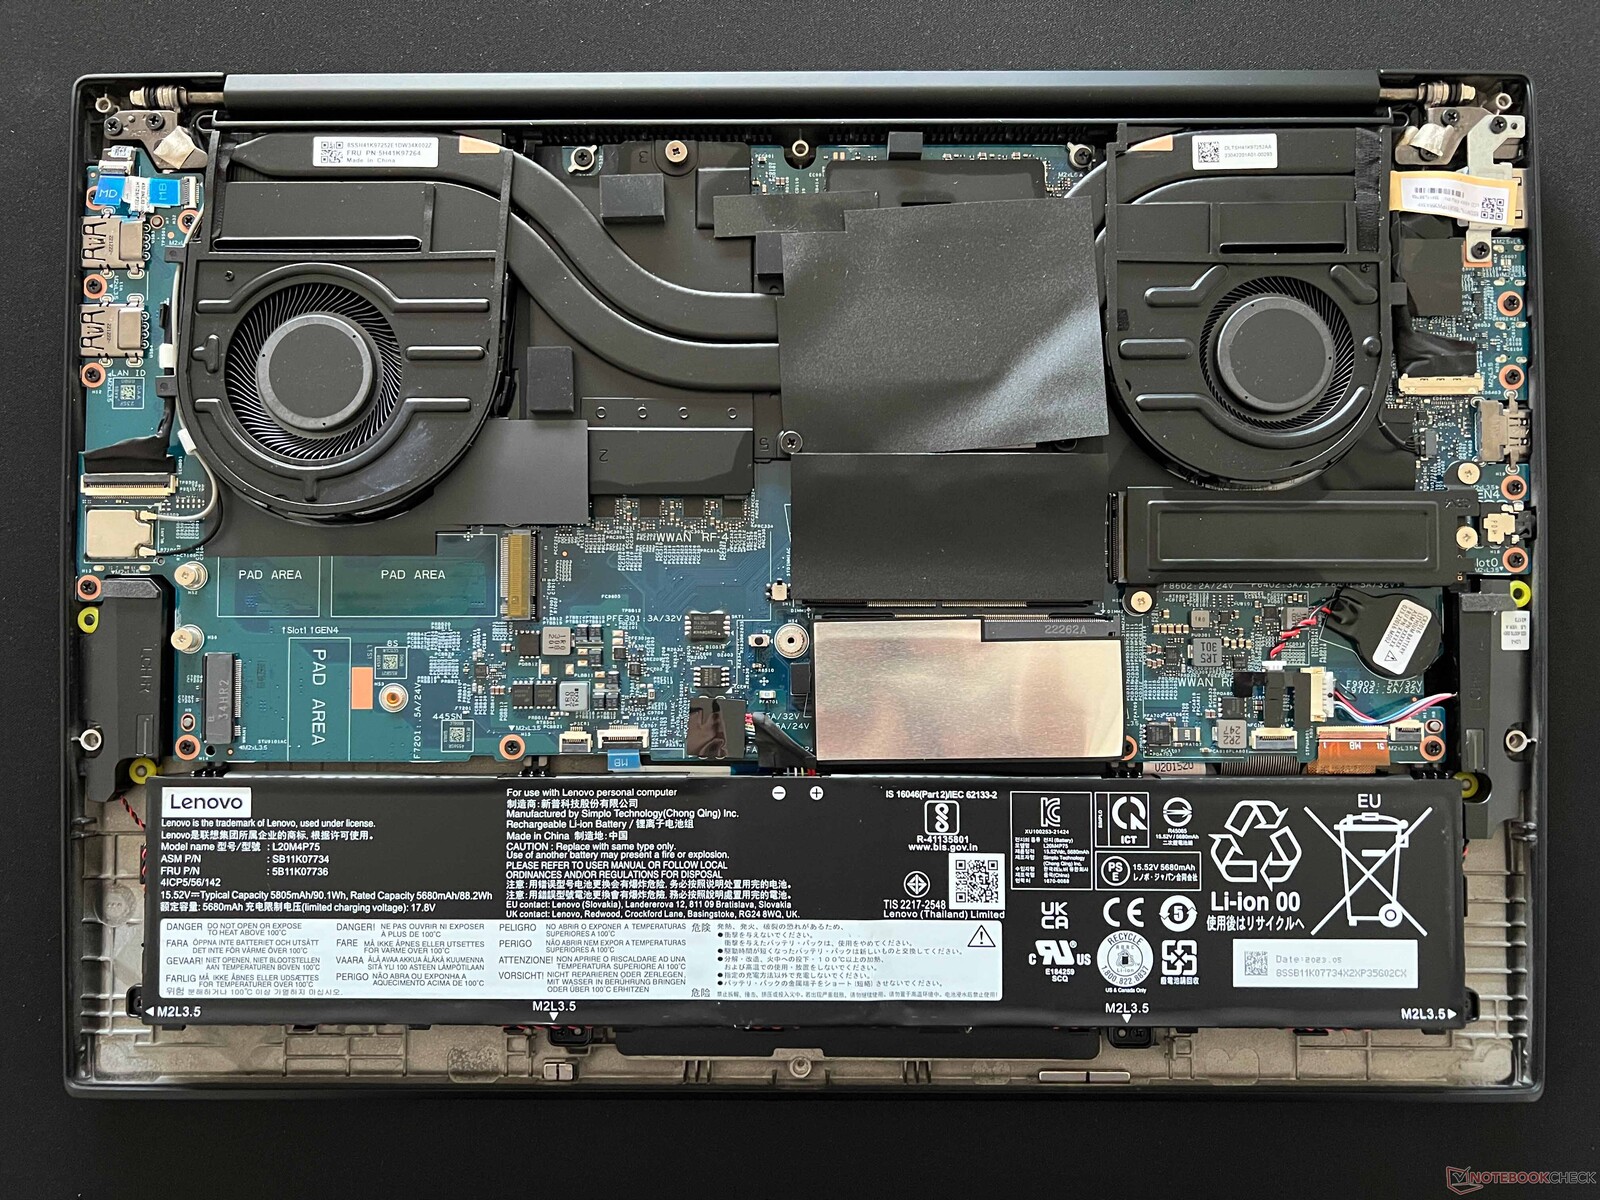
Underhåll
Jämfört med ThinkPad P1 G6 RTX 2000-konfigurationen har RTX 4080-konfigurationen en utökad kyllösning med en större fläkt för att kunna hantera den mer krävande GPU:n. Tyvärr kommer detta på bekostnad av två expansionsplatser, vilket framgår av jämförelsebilderna nedan.
Tillbehör och garanti
Det finns inga extra tillbehör i lådan förutom den vanliga nätadaptern och pappersarbete. En besvikelse är att den begränsade standardgarantin endast är 12 månader om den köps i USA, jämfört med 36 månader för många Dell Precision -modeller.
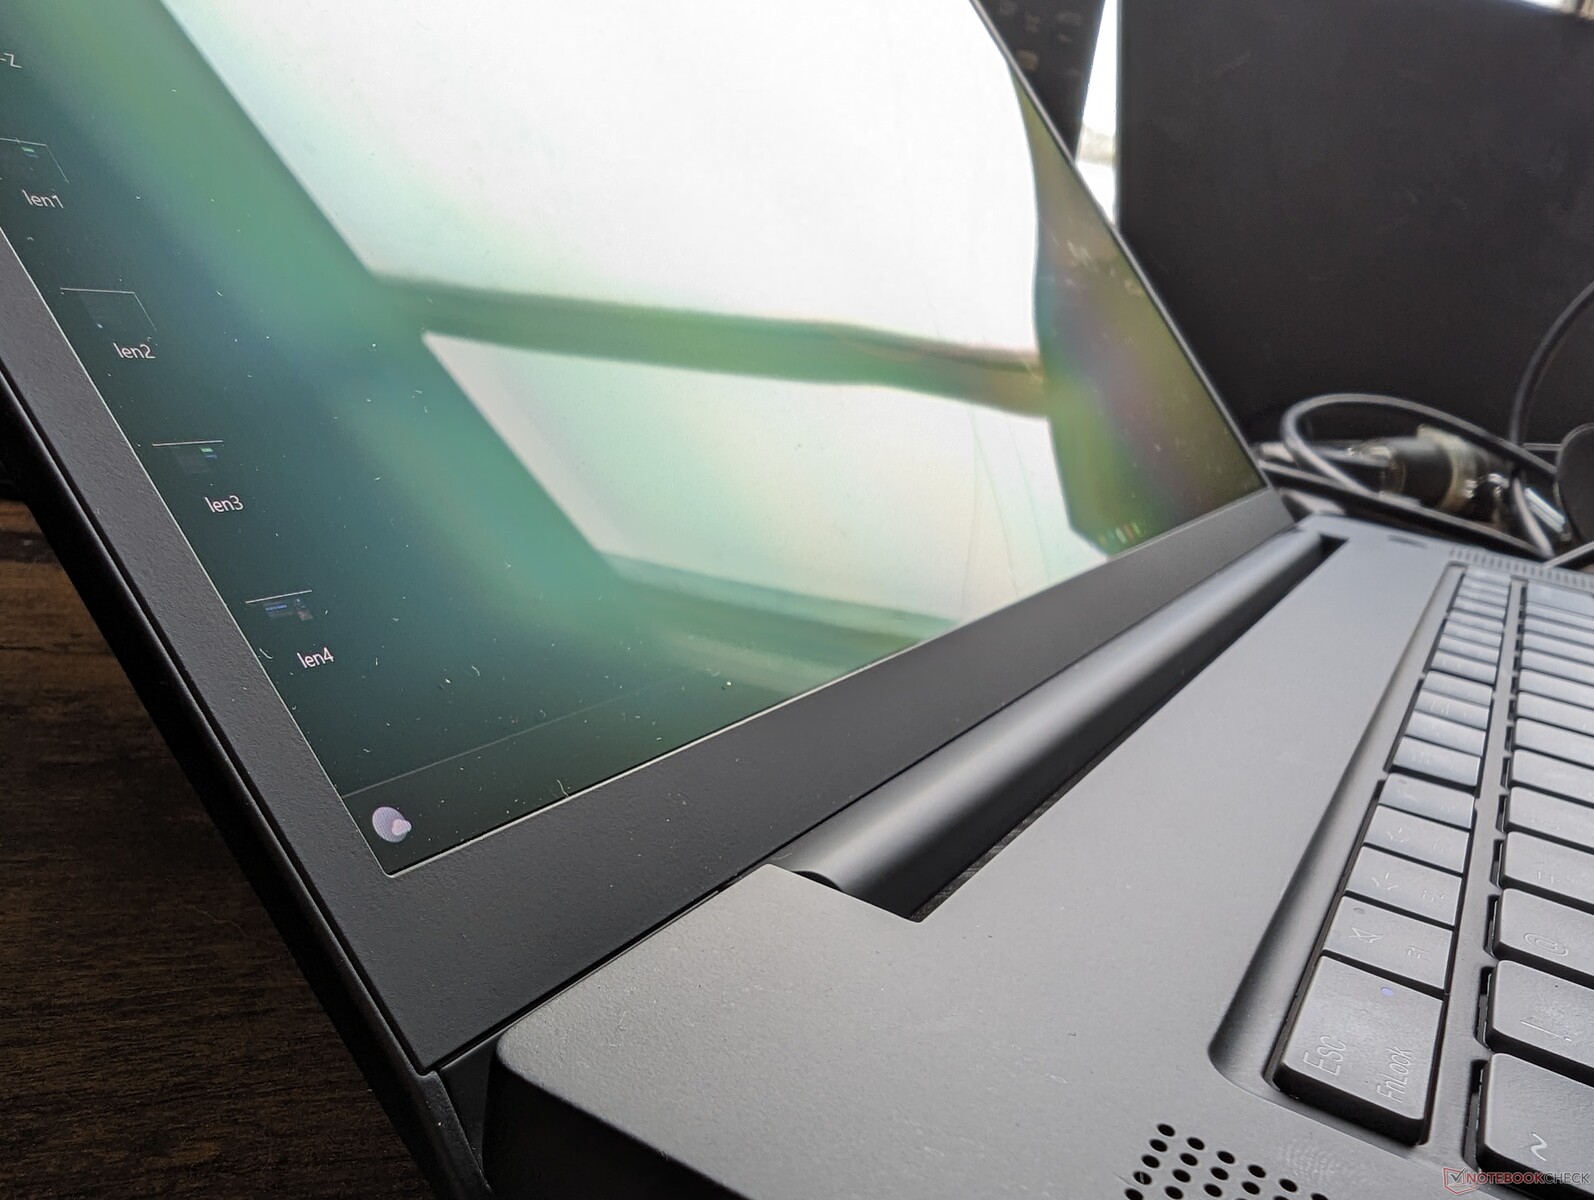
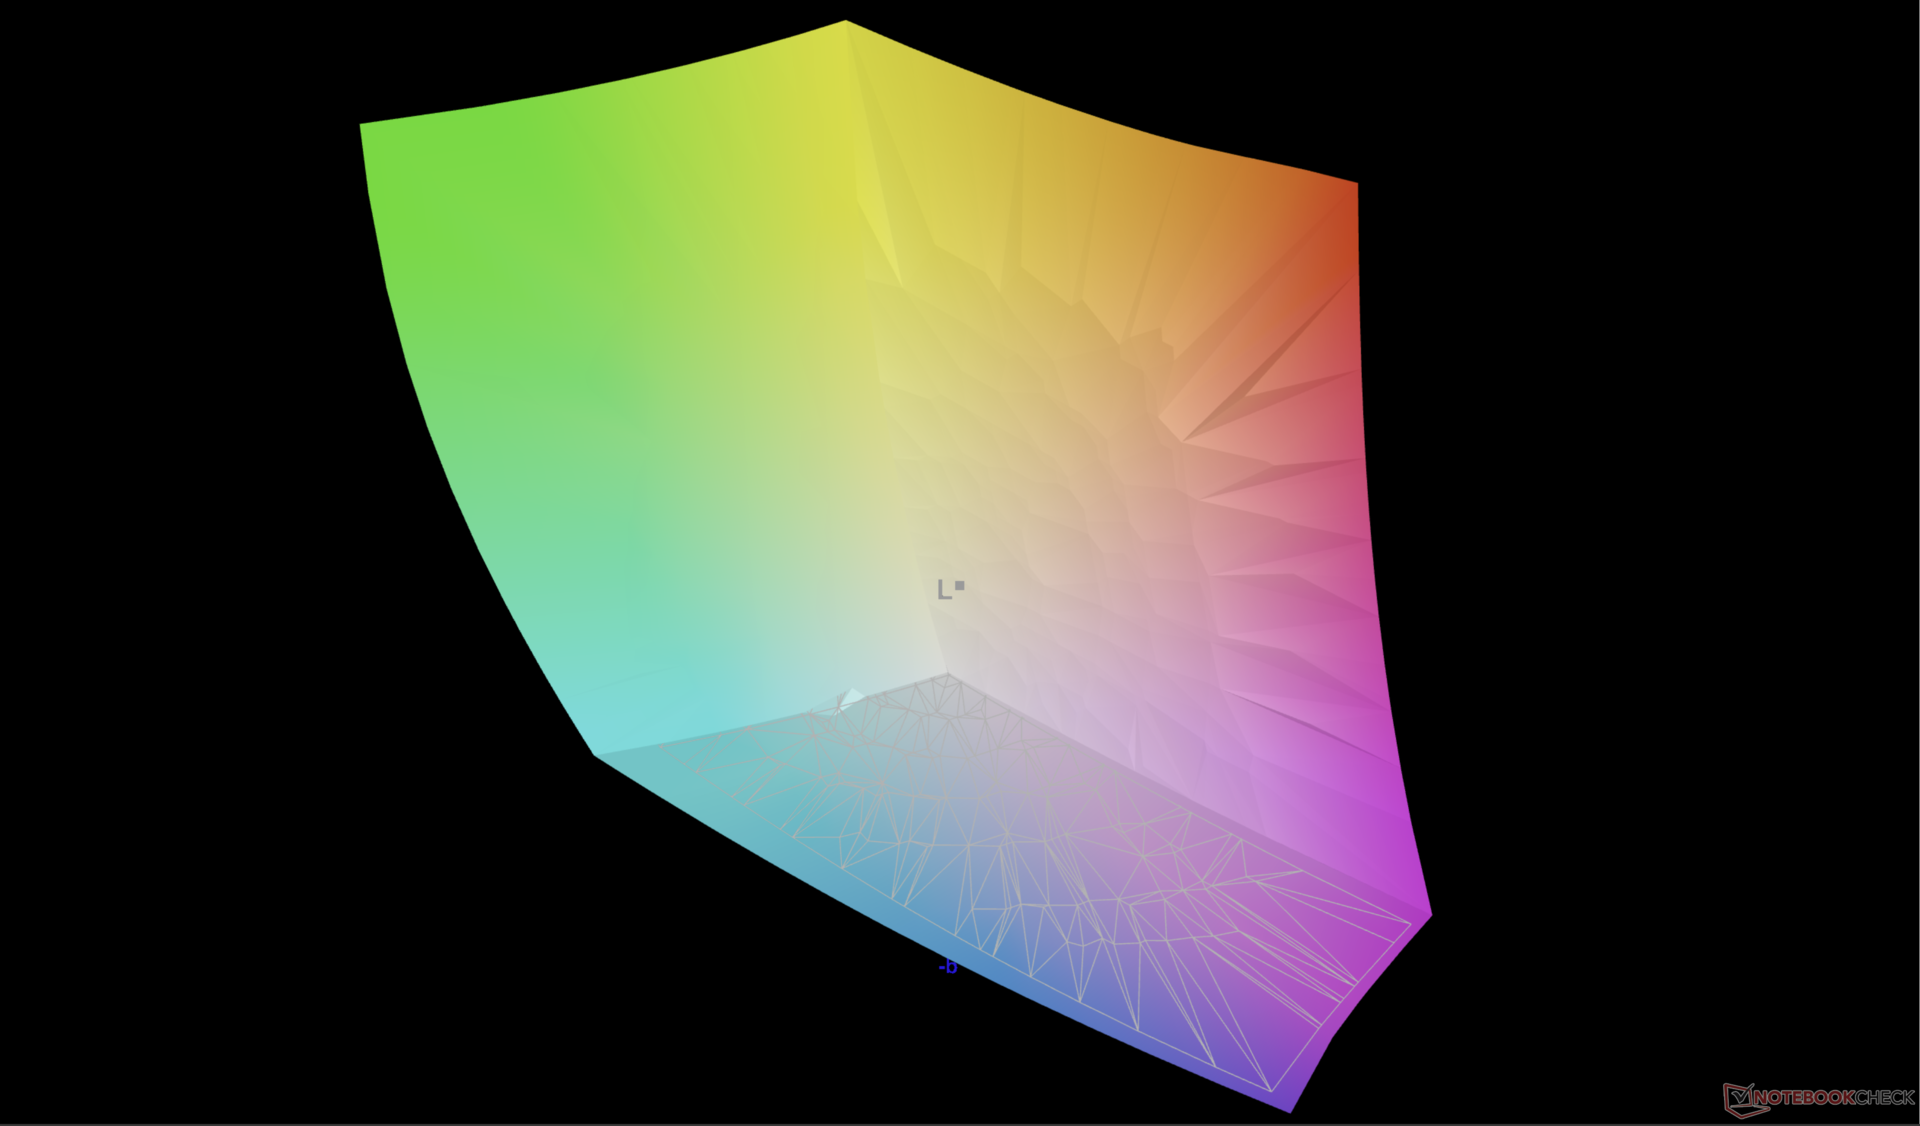
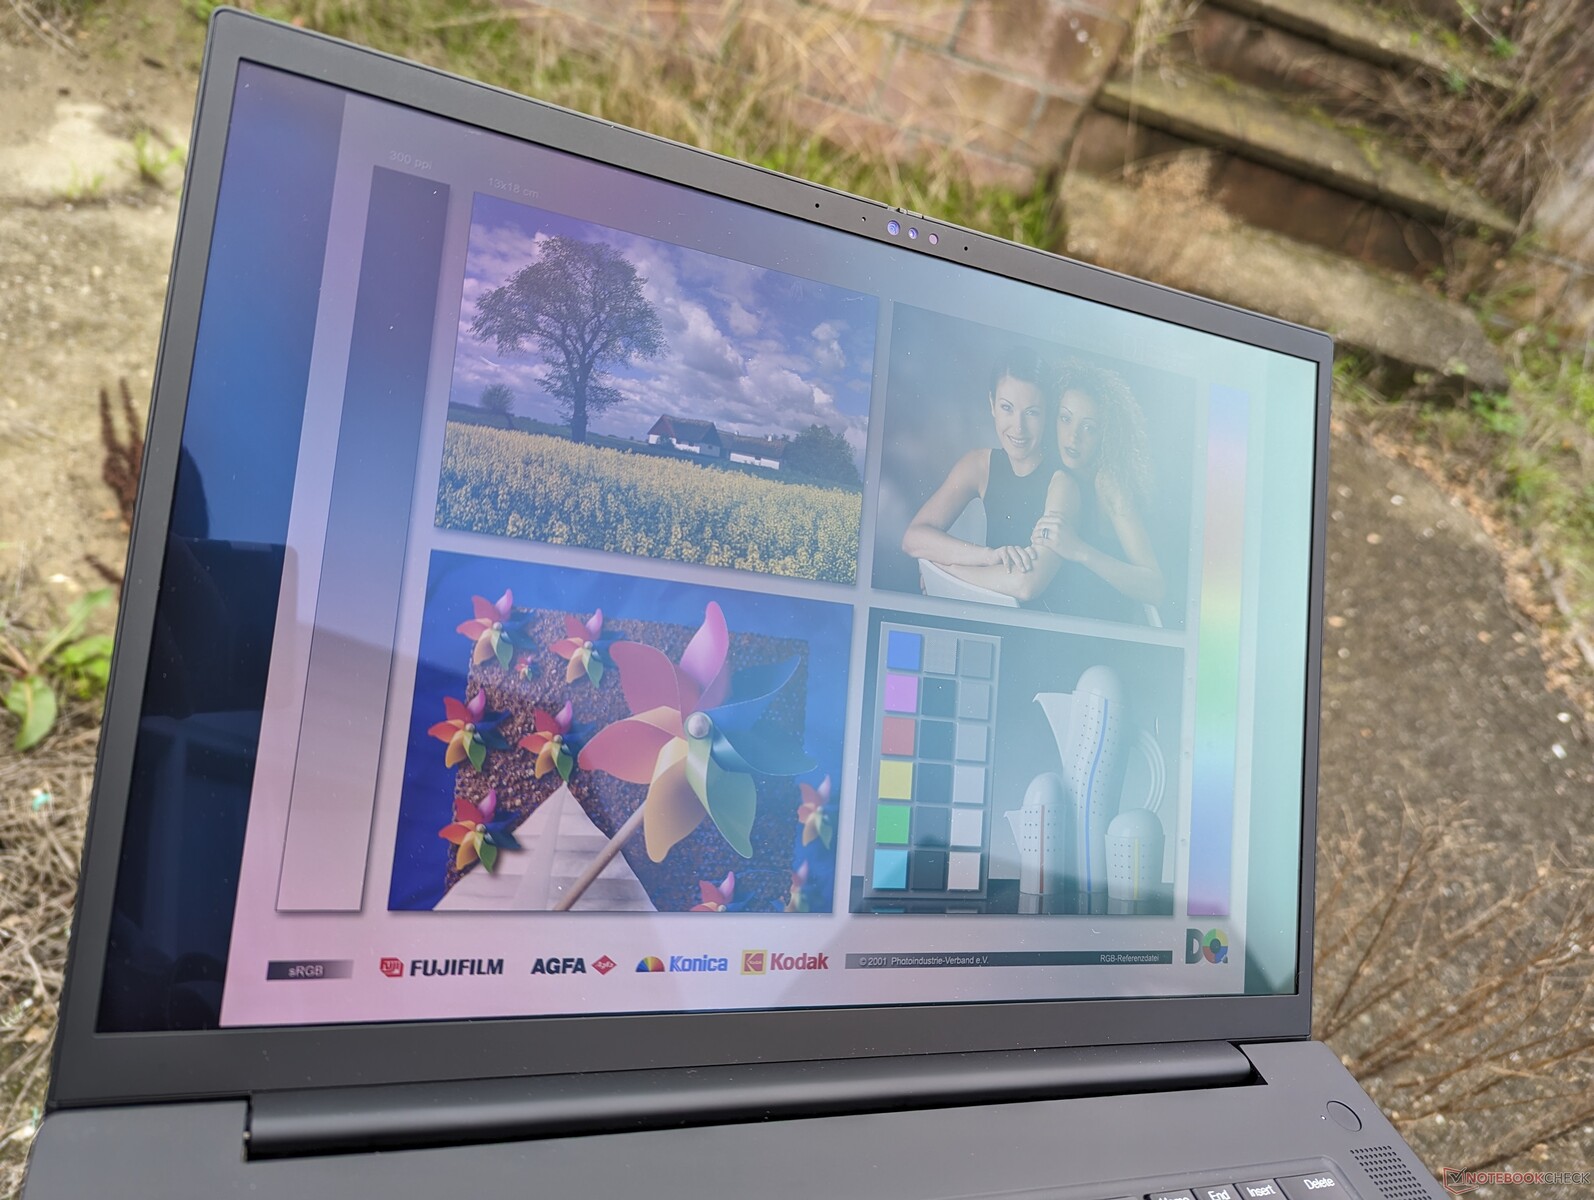
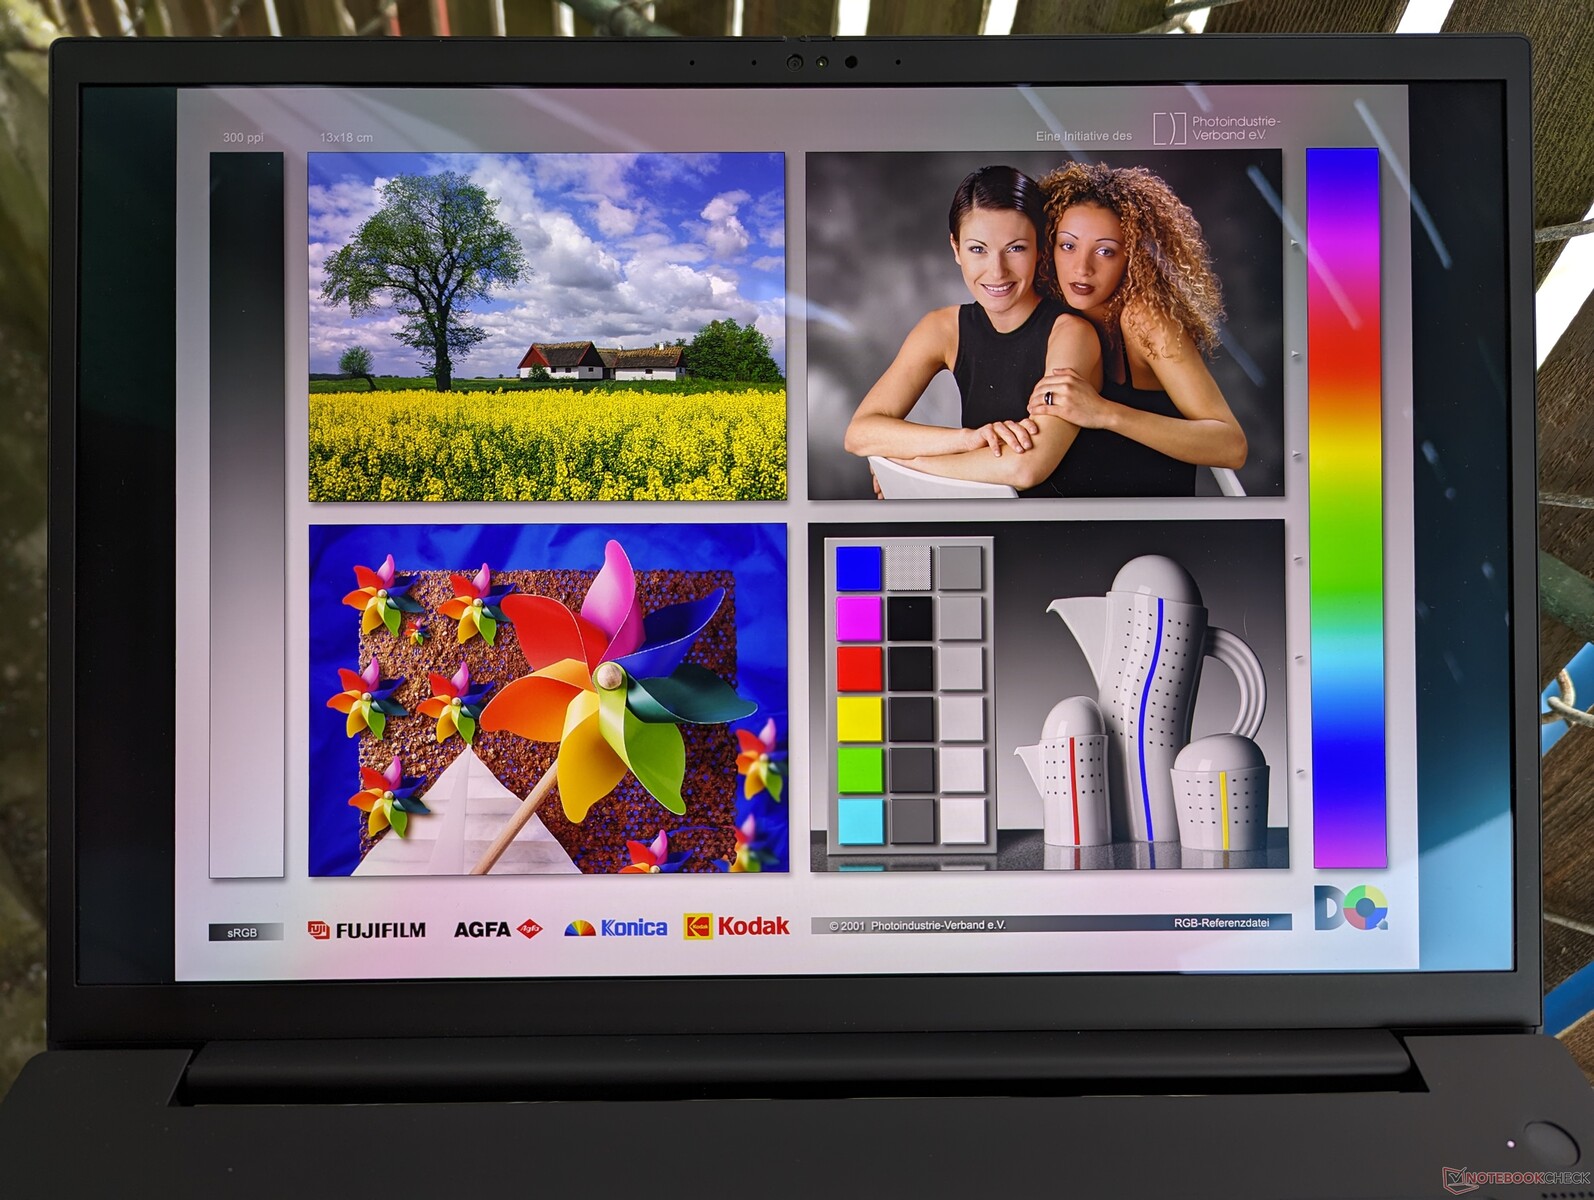
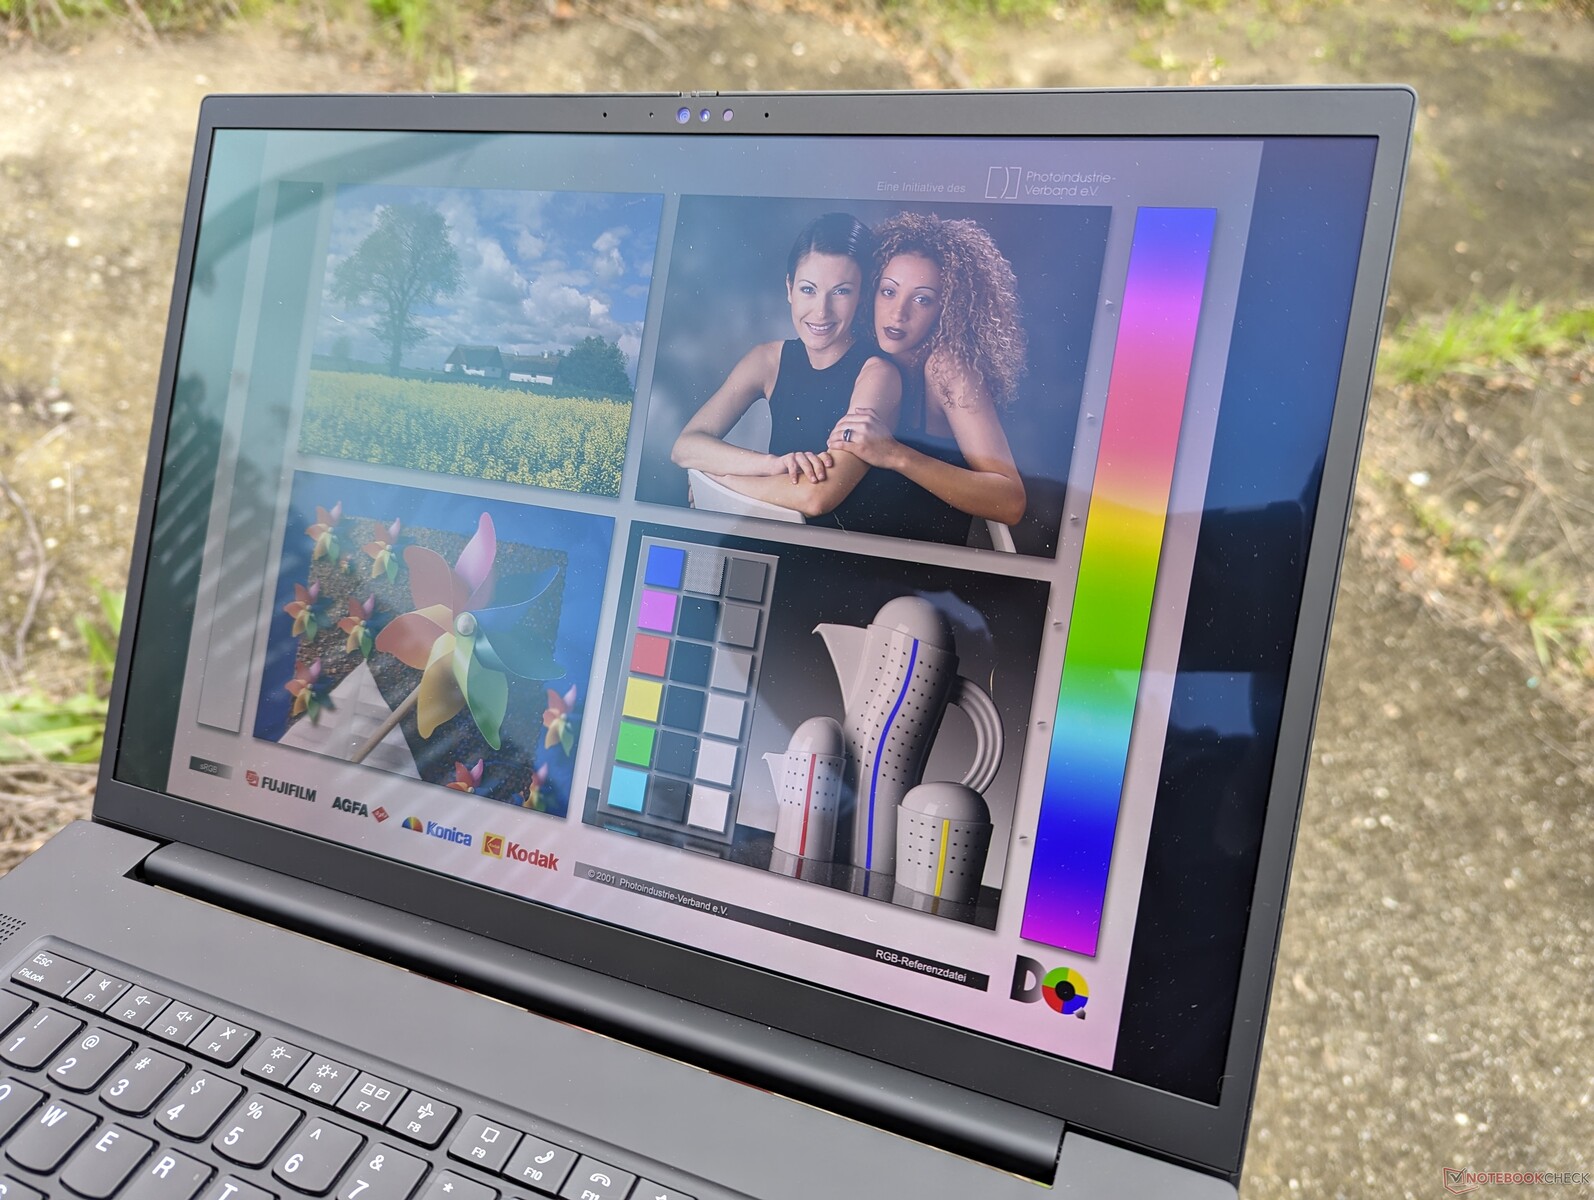
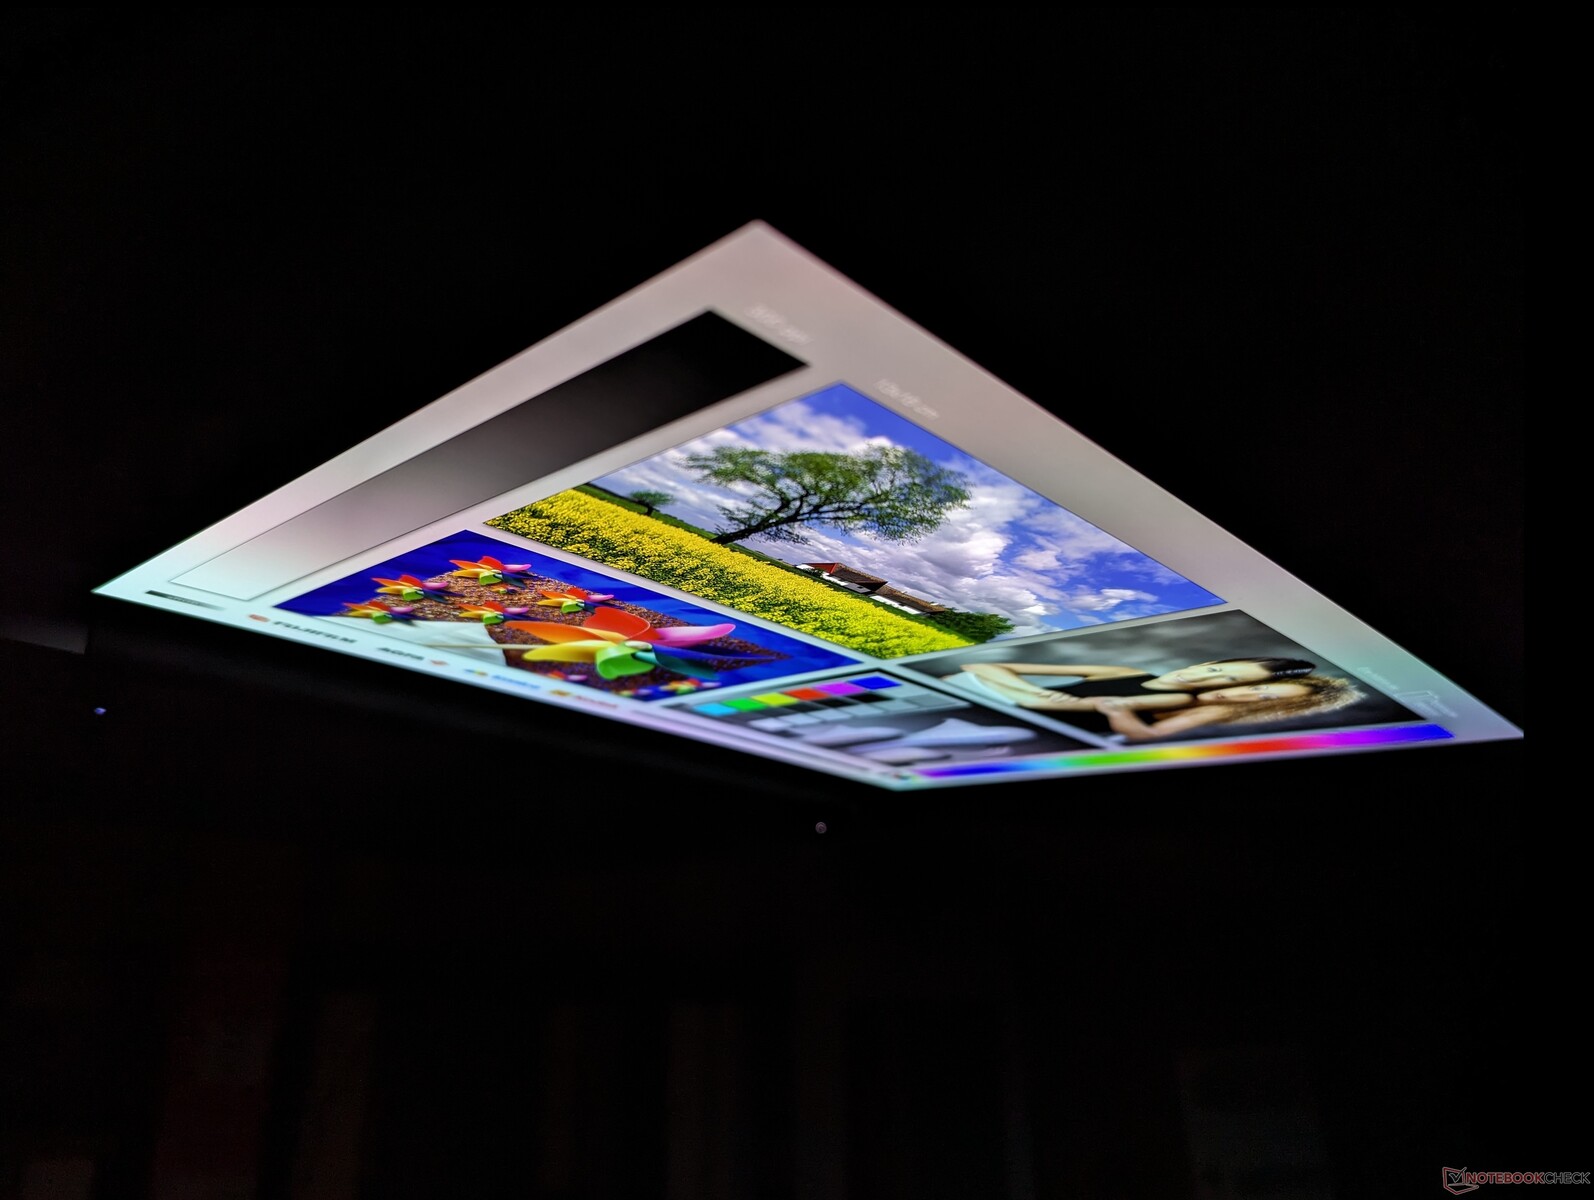
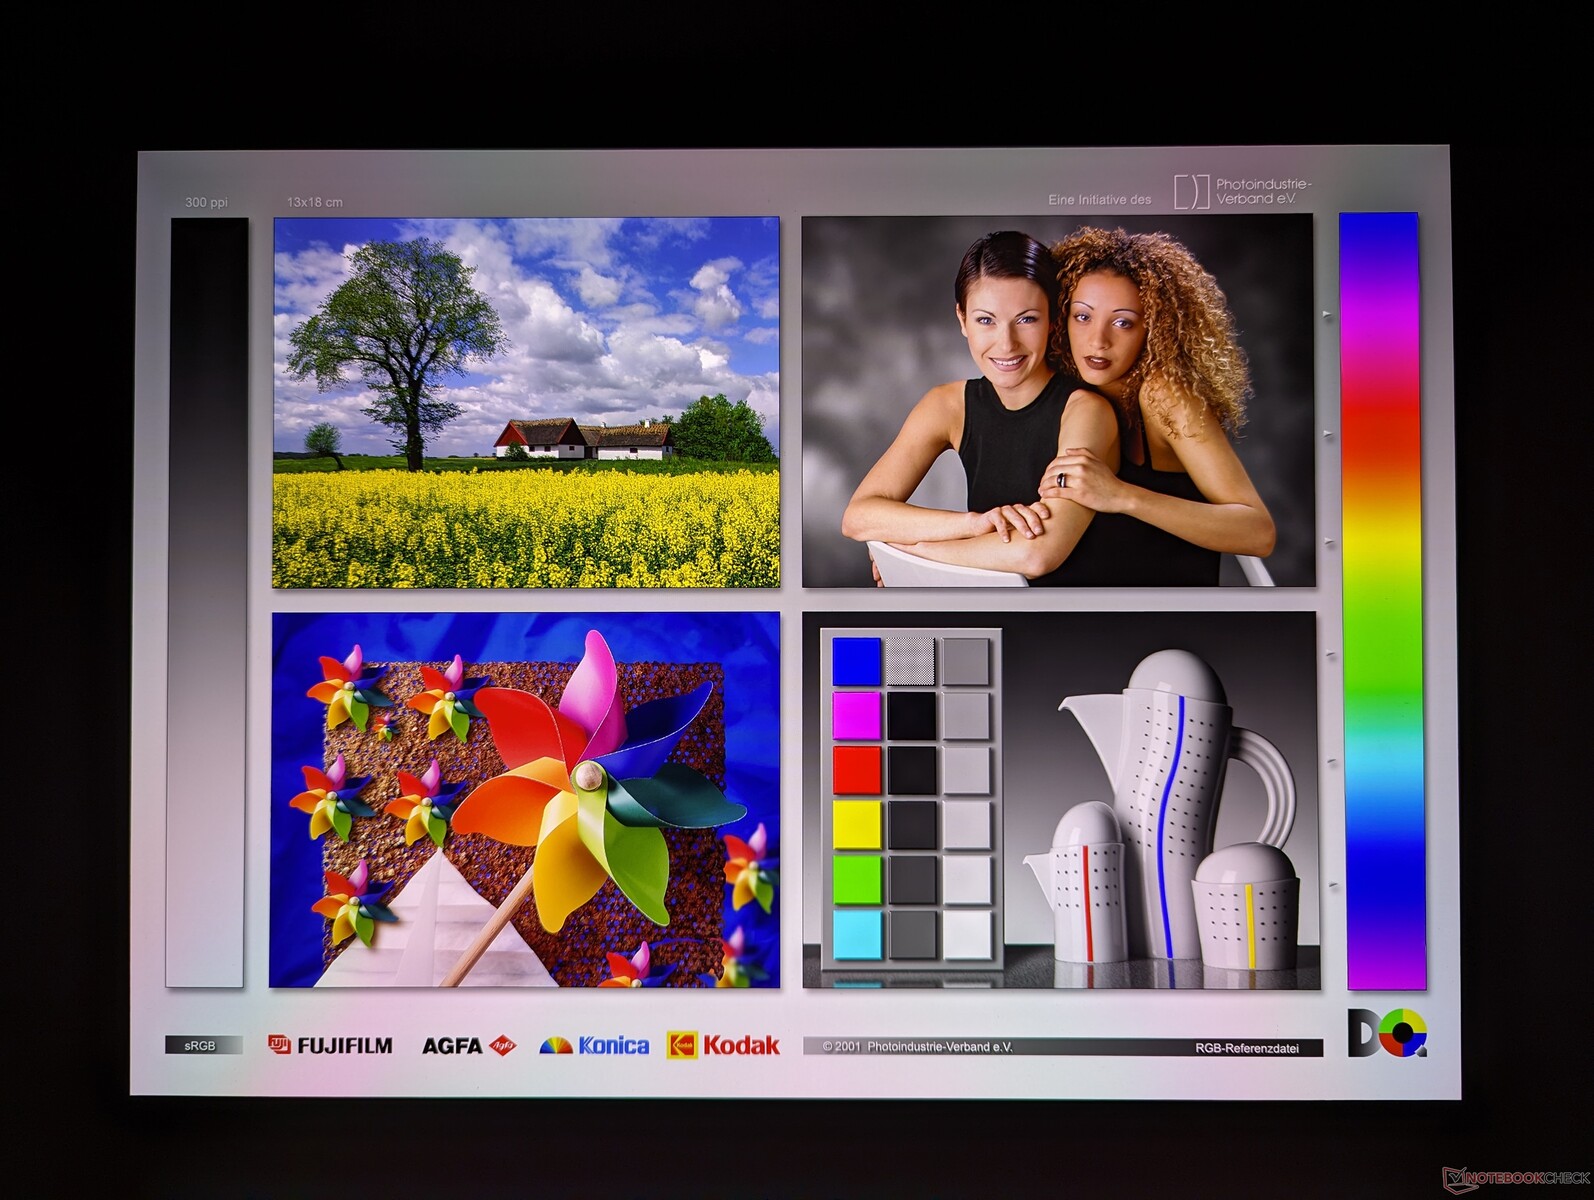
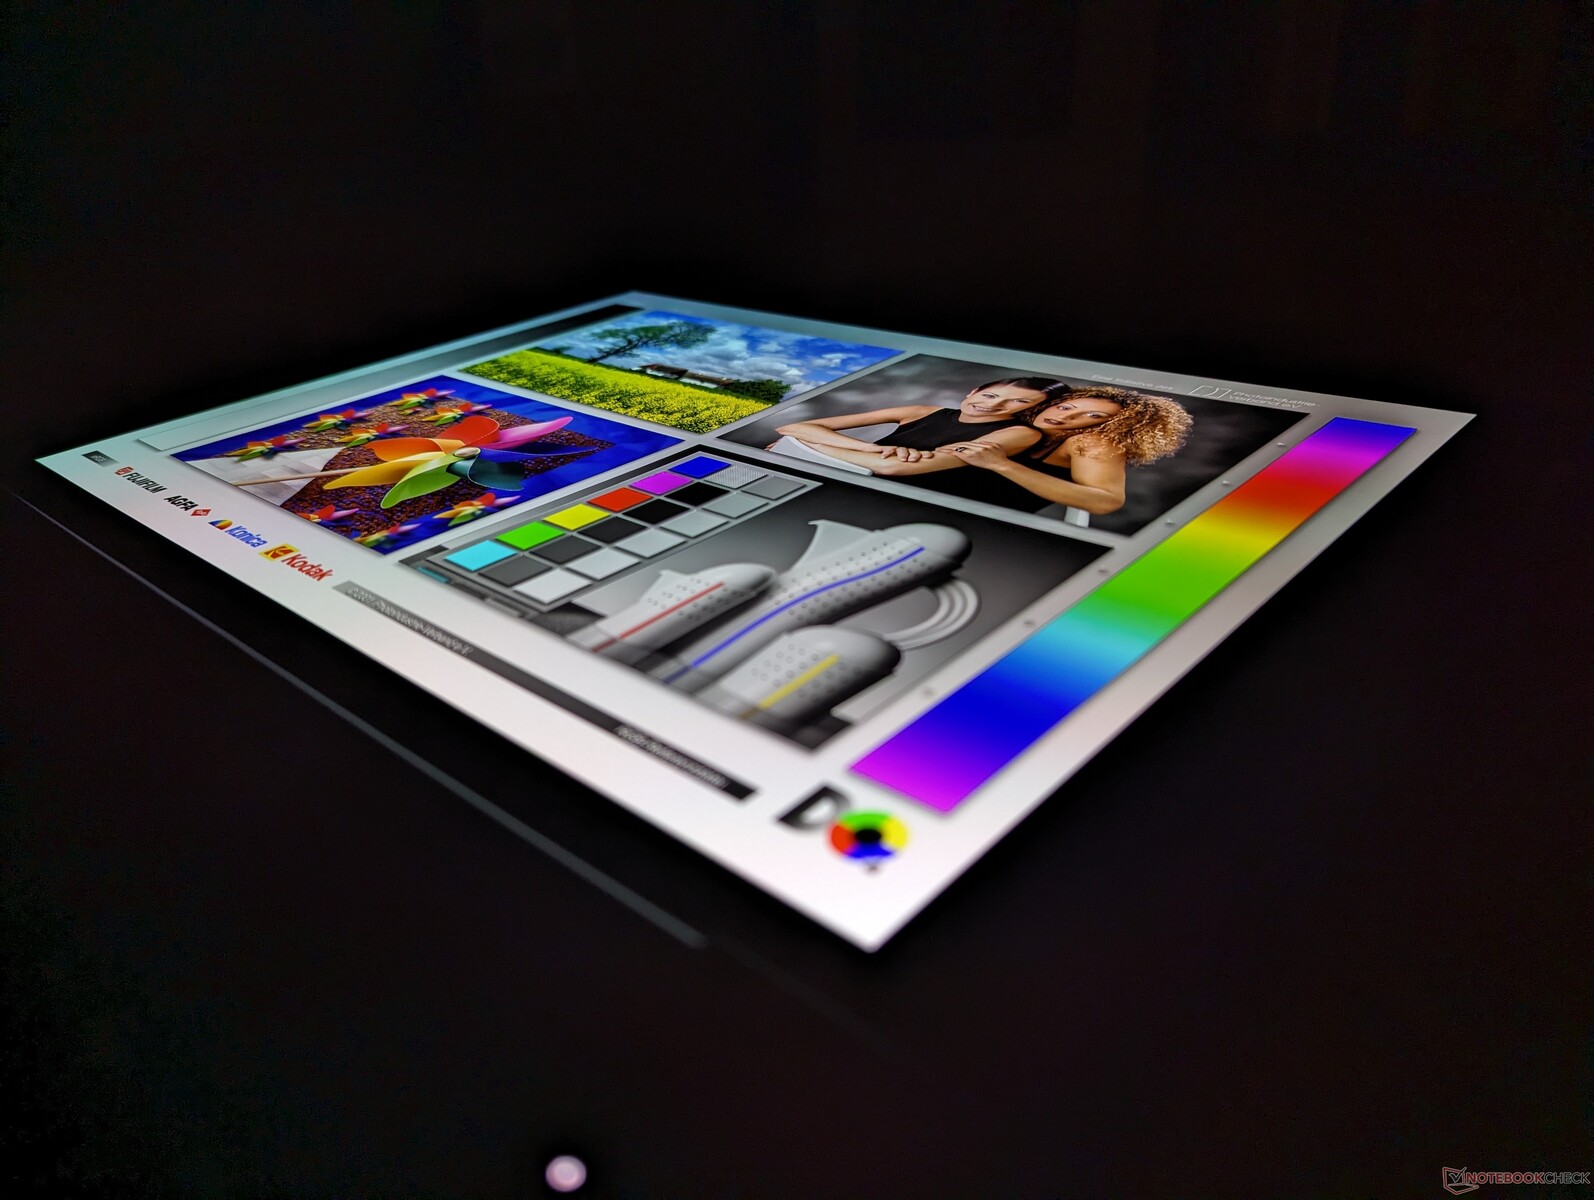
Display - HDR400 med DCI-P3 färger
4K OLED-panelen erbjuder överlägsna färger, snabbare svarstider, pekskärmsfunktionalitet och en tätare inbyggd upplösning än 2K IPS-panelen på vår tidigare RTX 2000-drivna konfiguration. Dessa fördelar kommer dock på bekostnad av en långsammare inbyggd uppdateringsfrekvens på endast 60 Hz och en svagare maximal ljusstyrka, vilket framgår av vår tabell nedan. Således kan IPS-panelen vara att föredra beroende på din applikation. Det är synd att Lenovo inte erbjuder 120 Hz OLED-alternativ a la Vivobook Pro 16X.

| |||||||||||||||||||||||||
Distribution av ljusstyrkan: 98 %
Mitt på batteriet: 375.1 cd/m²
Kontrast: ∞:1 (Svärta: 0 cd/m²)
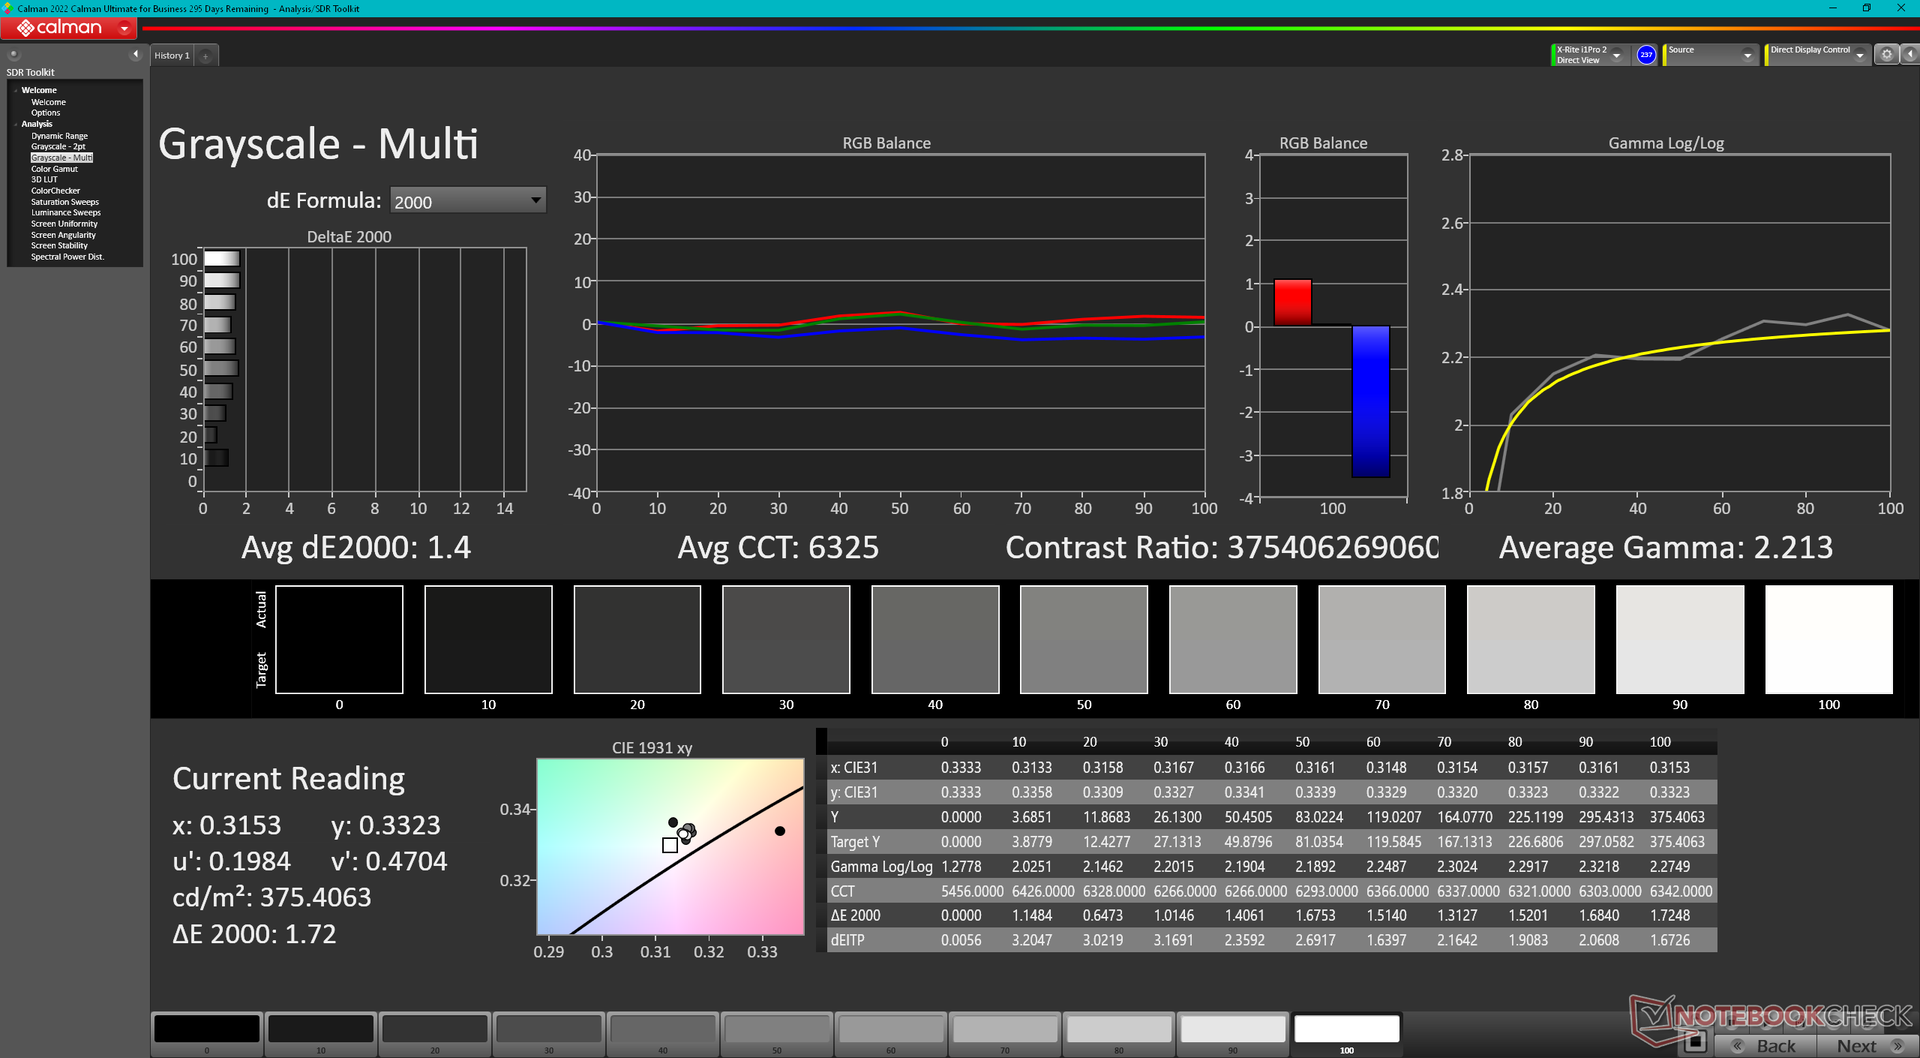
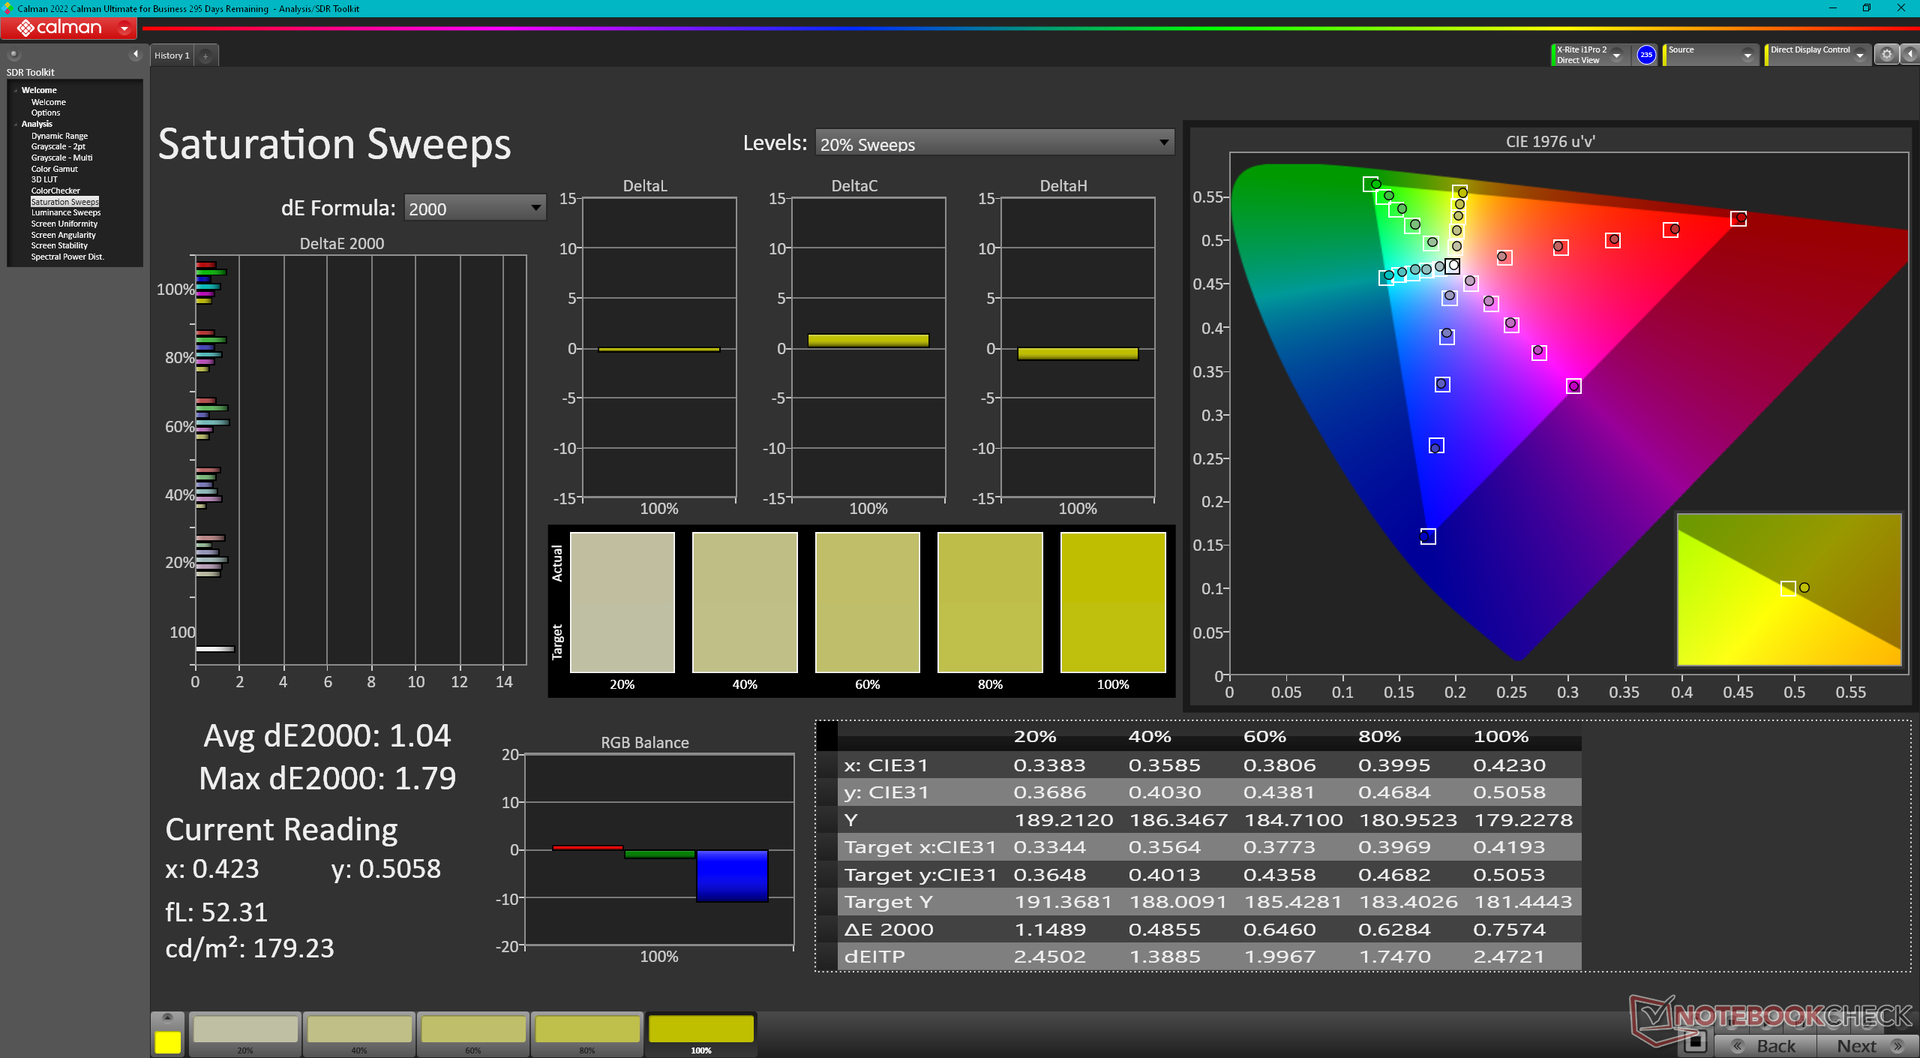
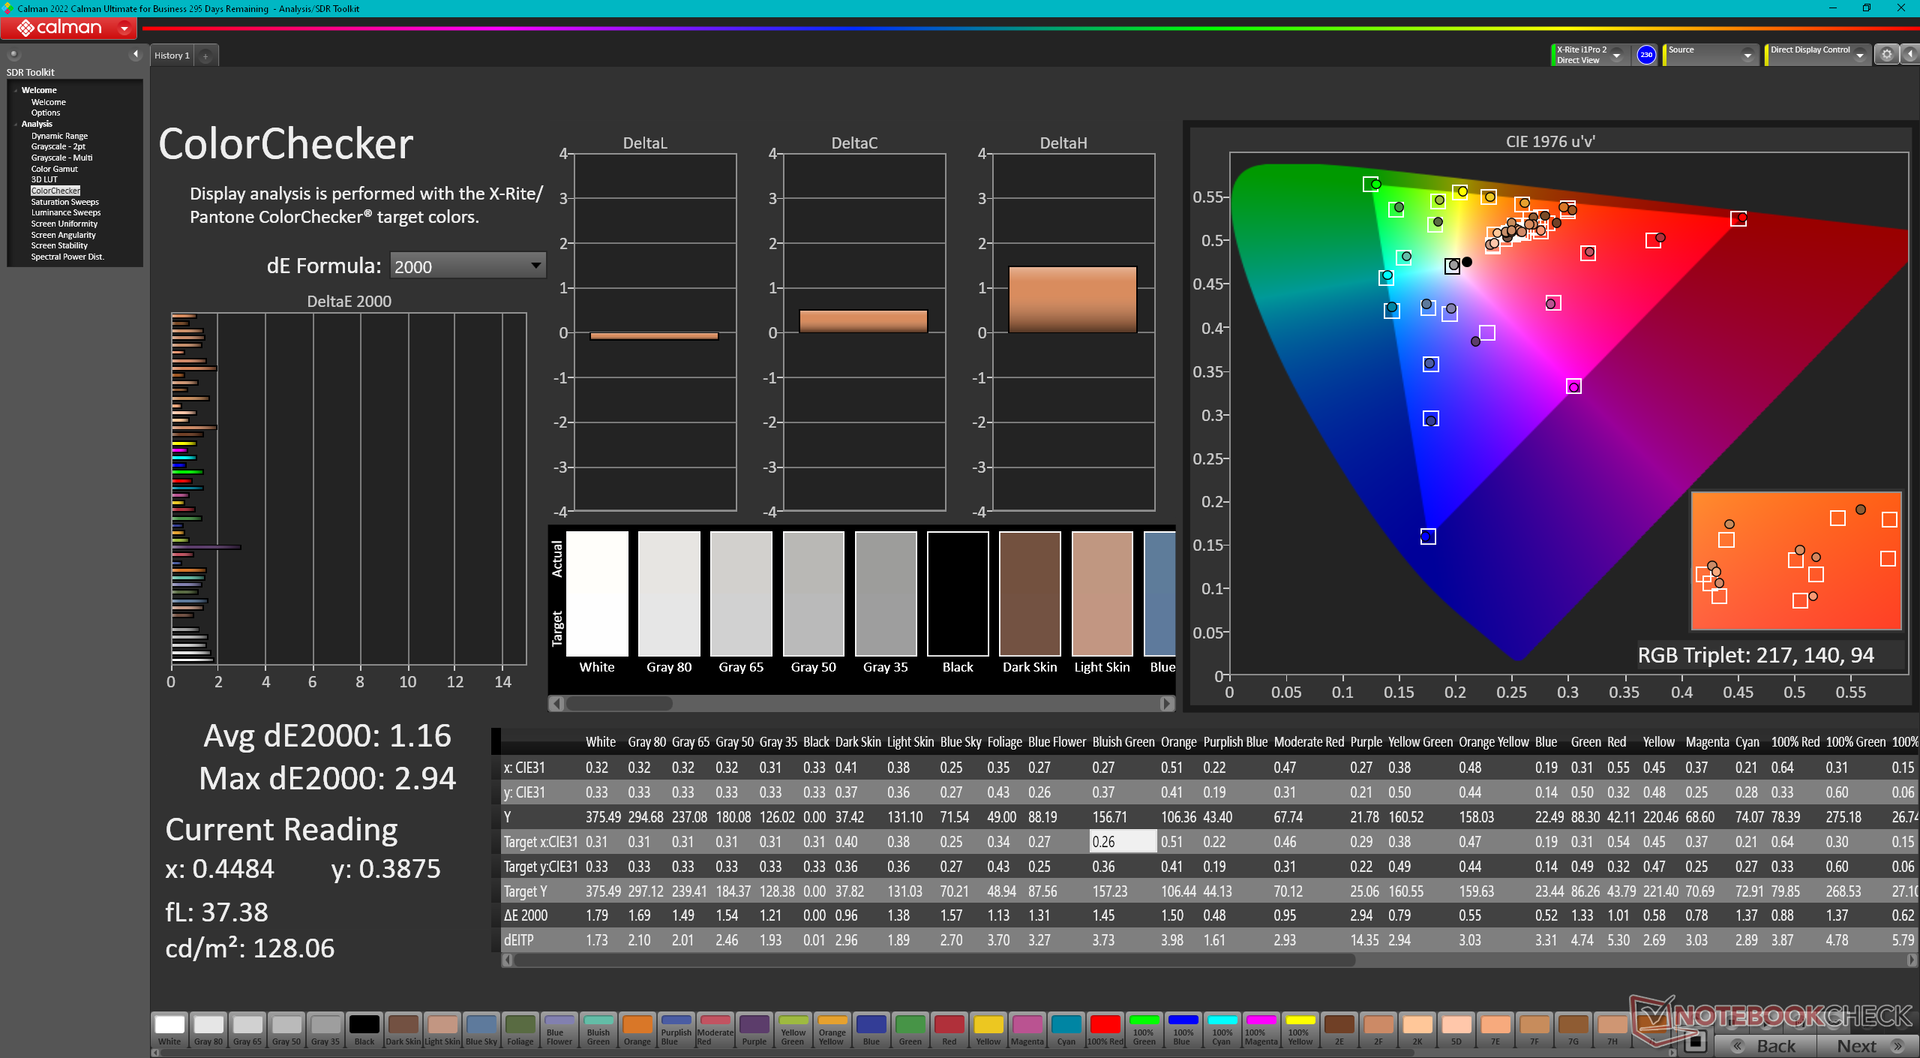
ΔE ColorChecker Calman: 1.16 | ∀{0.5-29.43 Ø4.71}
ΔE Greyscale Calman: 1.4 | ∀{0.09-98 Ø4.96}
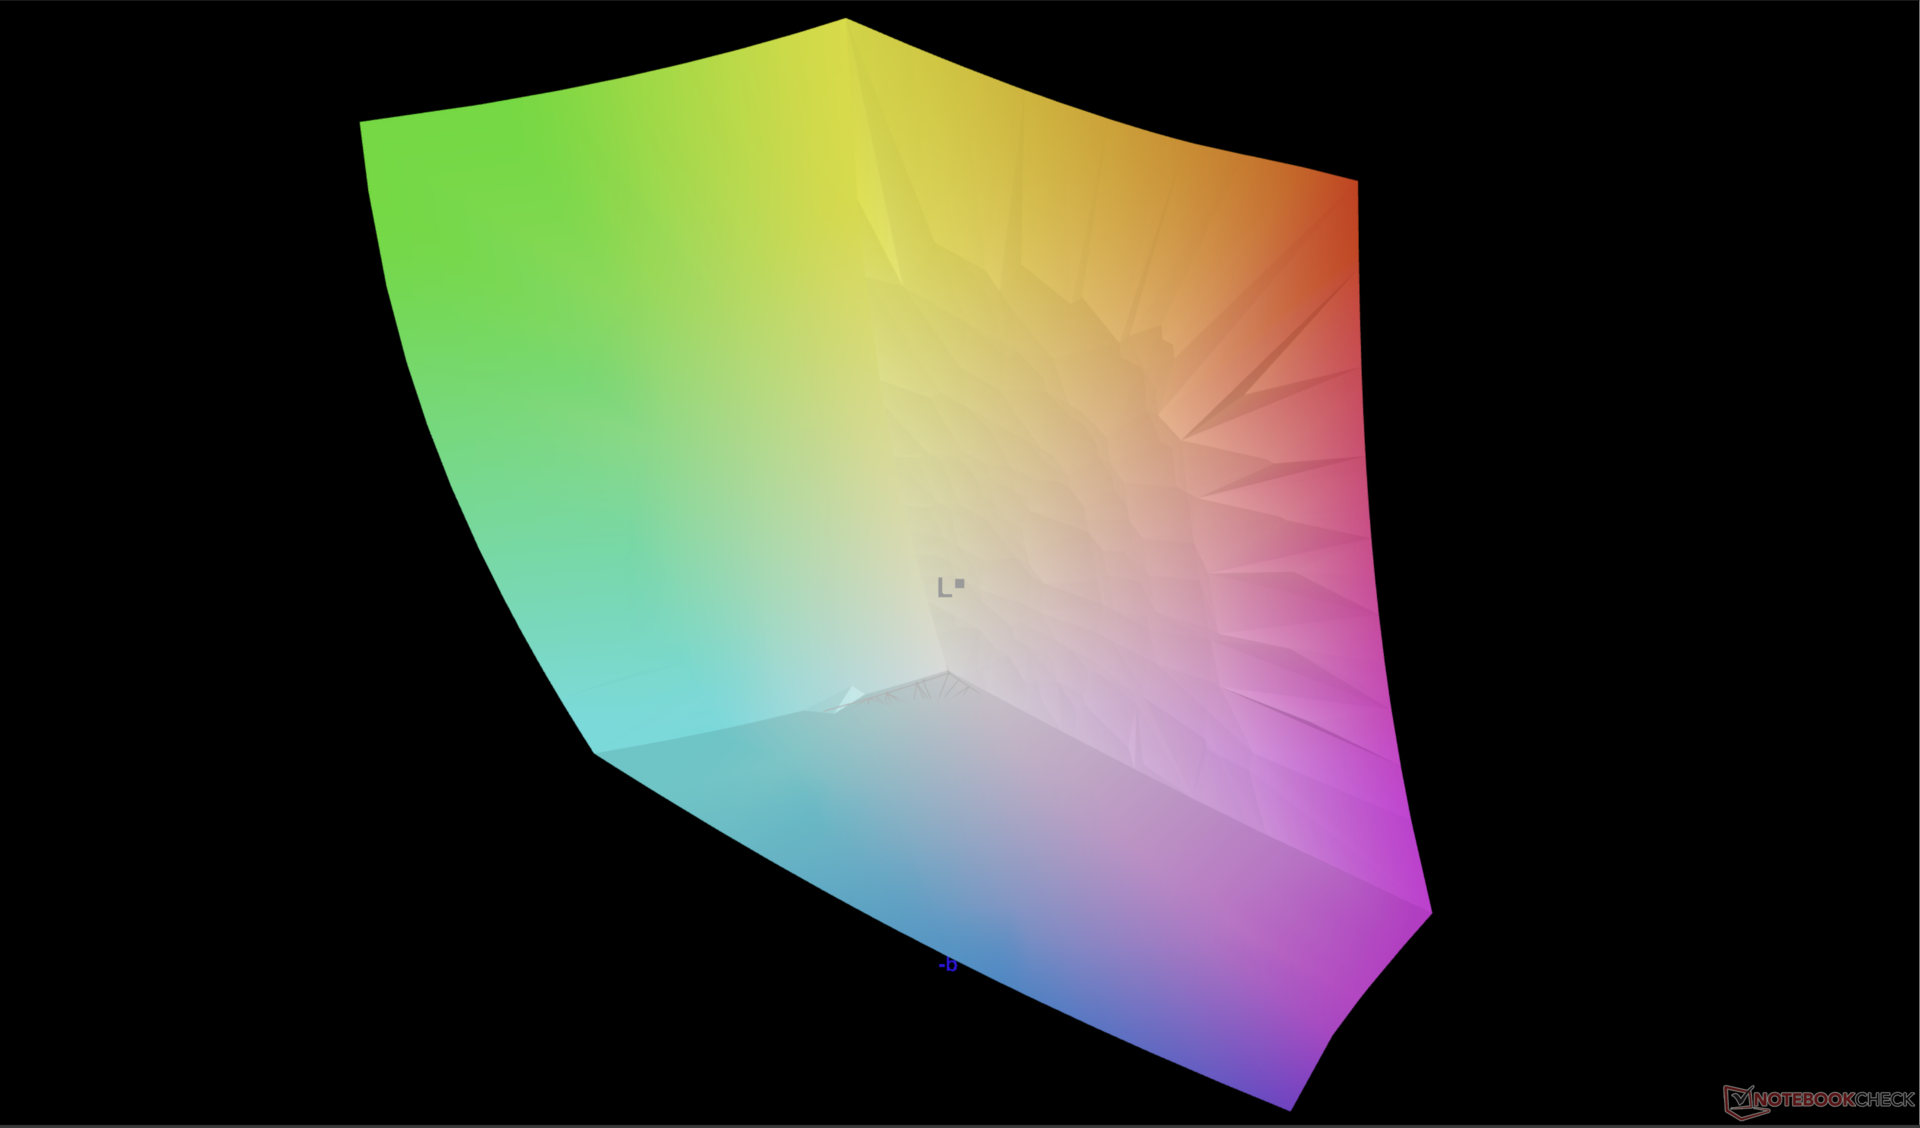
97.9% AdobeRGB 1998 (Argyll 3D)
100% sRGB (Argyll 3D)
99.8% Display P3 (Argyll 3D)
Gamma: 2.2
CCT: 6325 K
| Lenovo ThinkPad P1 G6 21FV001KUS Samsung ATNA60YV04-0, OLED, 3480x2400, 16" | Lenovo ThinkPad P1 G6-21FV000DGE NE160QDM-NY1, IPS, 2560x1600, 16" | Lenovo ThinkPad P1 G4-20Y4S0KS00 LP160UQ1-SPB1, IPS LED, 3840x2400, 16" | Lenovo ThinkPad P16 G1 RTX A5500 LP160UQ1-SPB1, IPS, 3840x2400, 16" | Dell Precision 5000 5680 Samsung 160YV03, OLED, 3840x2400, 16" | HP ZBook Fury 16 G10 AUO87A8, IPS, 3840x2400, 16" | |
|---|---|---|---|---|---|---|
| Display | -21% | -5% | -7% | 0% | -5% | |
| Display P3 Coverage (%) | 99.8 | 68.1 -32% | 85.7 -14% | 82.9 -17% | 99.9 0% | 98 -2% |
| sRGB Coverage (%) | 100 | 97.5 -2% | 99.4 -1% | 98.9 -1% | 100 0% | 99.9 0% |
| AdobeRGB 1998 Coverage (%) | 97.9 | 70.2 -28% | 98.9 1% | 95.9 -2% | 97.5 0% | 86.2 -12% |
| Response Times | -583% | -2435% | -2313% | -1% | -530% | |
| Response Time Grey 50% / Grey 80% * (ms) | 1.69 ? | 13.7 ? -711% | 55.2 ? -3166% | 45.6 ? -2598% | 1.68 ? 1% | 11.9 ? -604% |
| Response Time Black / White * (ms) | 1.73 ? | 9.6 ? -455% | 31.2 ? -1703% | 36.8 ? -2027% | 1.77 ? -2% | 9.6 ? -455% |
| PWM Frequency (Hz) | 60 ? | 60 ? | ||||
| Screen | 12% | -22% | -27% | -81% | -14% | |
| Brightness middle (cd/m²) | 375.1 | 521 39% | 630 68% | 601.9 60% | 345.7 -8% | 514.6 37% |
| Brightness (cd/m²) | 379 | 484 28% | 622 64% | 569 50% | 349 -8% | 495 31% |
| Brightness Distribution (%) | 98 | 89 -9% | 90 -8% | 77 -21% | 98 0% | 90 -8% |
| Black Level * (cd/m²) | 0.36 | 0.41 | 0.47 | 0.46 | ||
| Colorchecker dE 2000 * | 1.16 | 1.2 -3% | 2.2 -90% | 2.45 -111% | 3.59 -209% | 2.4 -107% |
| Colorchecker dE 2000 max. * | 2.94 | 2.5 15% | 5 -70% | 4.46 -52% | 7.02 -139% | 4.86 -65% |
| Greyscale dE 2000 * | 1.4 | 1.4 -0% | 2.7 -93% | 2.6 -86% | 3.1 -121% | 1 29% |
| Gamma | 2.2 100% | 2.25 98% | 2.26 97% | 2.3 96% | 2.13 103% | 2.3 96% |
| CCT | 6325 103% | 6682 97% | 6886 94% | 6805 96% | 6448 101% | 6553 99% |
| Contrast (:1) | 1447 | 1537 | 1281 | 1119 | ||
| Colorchecker dE 2000 calibrated * | 1 | 1 | 0.99 | 0.4 | ||
| Totalt genomsnitt (program/inställningar) | -197% /
-105% | -821% /
-456% | -782% /
-437% | -27% /
-44% | -183% /
-105% |
* ... mindre är bättre
Skärmen är förkalibrerad med genomsnittliga deltaE-värden för gråskala och färg på bara 1,4 respektive 1,16. Ytterligare kalibrering är därför inte nödvändig för de flesta användare.
Visa svarstider
| ↔ Svarstid svart till vitt | ||
|---|---|---|
| 1.73 ms ... stiga ↗ och falla ↘ kombinerat | ↗ 0.77 ms stiga | 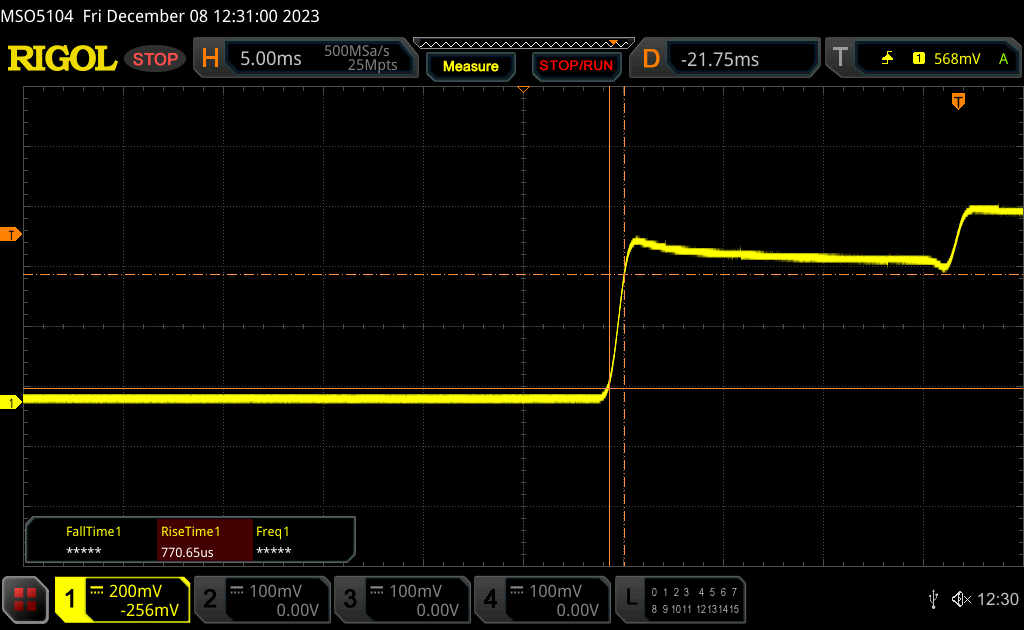 |
| ↘ 0.96 ms hösten | ||
| Skärmen visar väldigt snabba svarsfrekvenser i våra tester och borde vara mycket väl lämpad för fartfyllt spel. I jämförelse sträcker sig alla testade enheter från 0.1 (minst) till 240 (maximalt) ms. » 10 % av alla enheter är bättre. Det betyder att den uppmätta svarstiden är bättre än genomsnittet av alla testade enheter (19.8 ms). | ||
| ↔ Svarstid 50 % grått till 80 % grått | ||
| 1.69 ms ... stiga ↗ och falla ↘ kombinerat | ↗ 0.89 ms stiga | 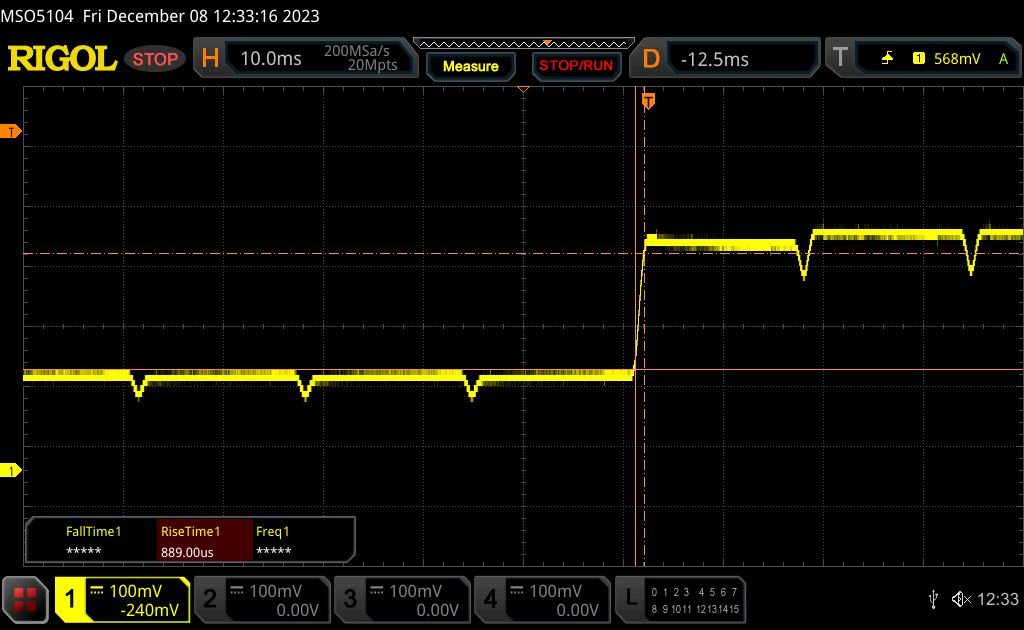 |
| ↘ 0.8 ms hösten | ||
| Skärmen visar väldigt snabba svarsfrekvenser i våra tester och borde vara mycket väl lämpad för fartfyllt spel. I jämförelse sträcker sig alla testade enheter från 0.165 (minst) till 636 (maximalt) ms. » 9 % av alla enheter är bättre. Det betyder att den uppmätta svarstiden är bättre än genomsnittet av alla testade enheter (31 ms). | ||
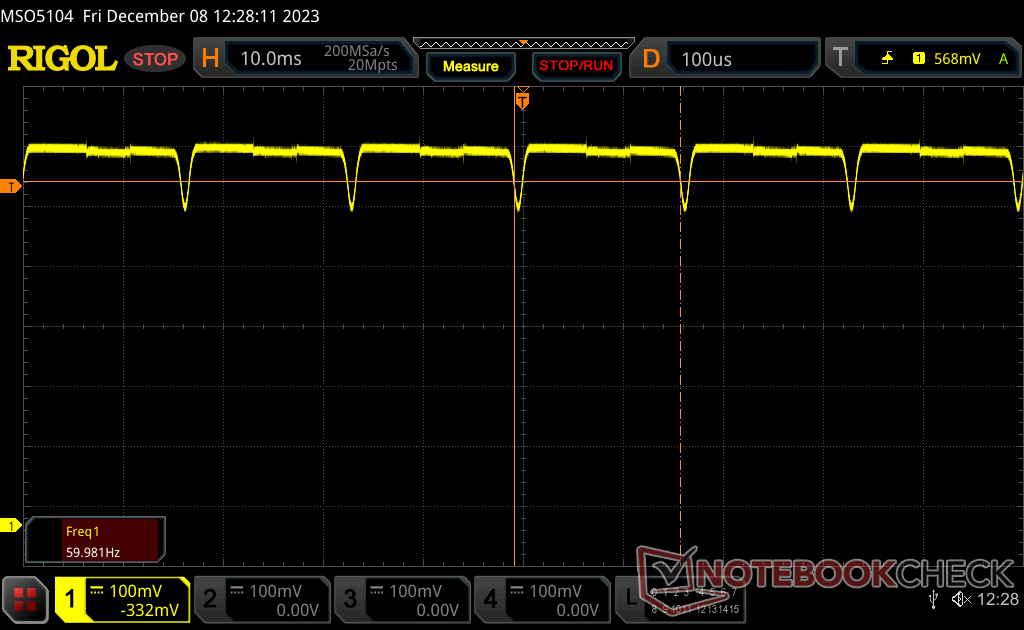
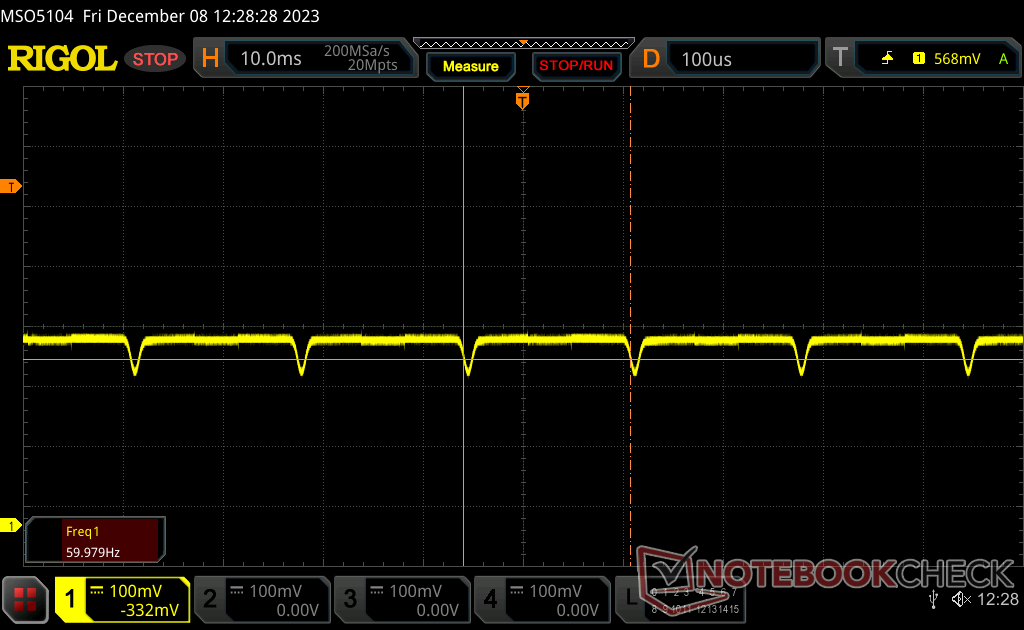
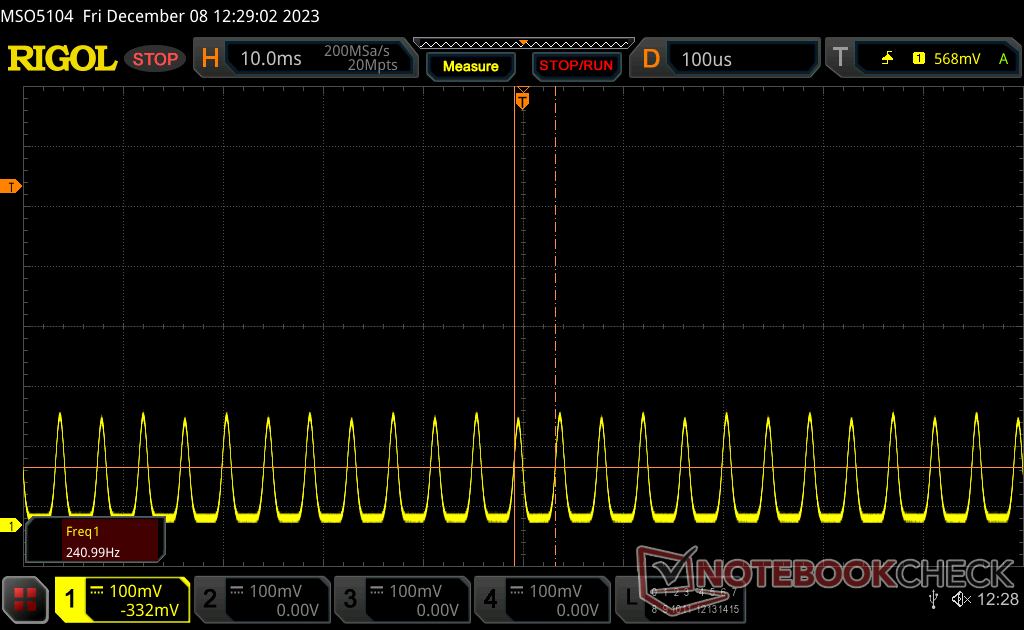
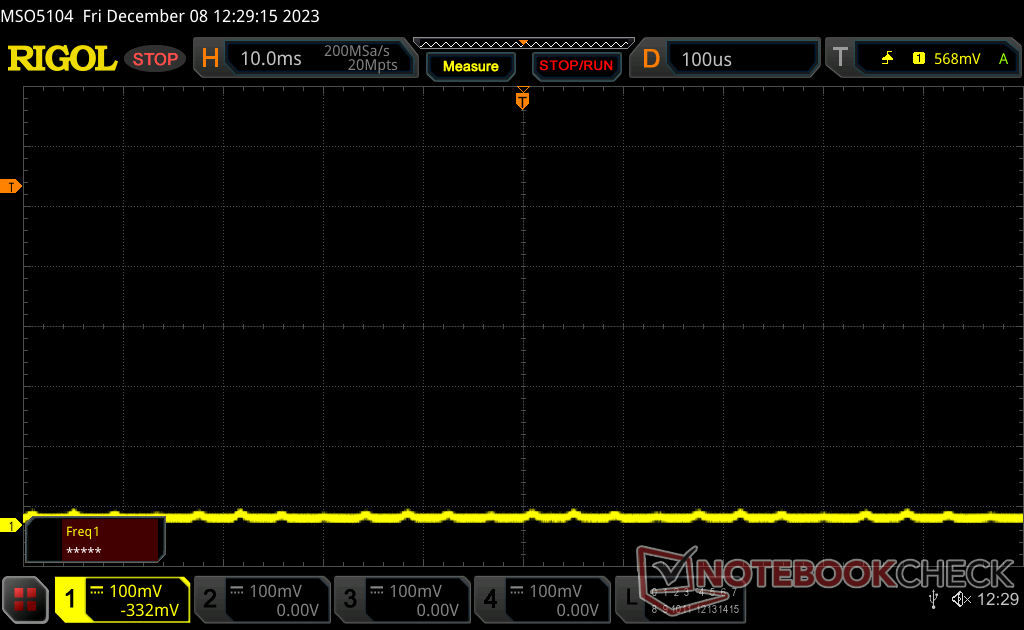
Skärmflimmer / PWM (Puls-Width Modulation)
| Skärmflimmer / PWM upptäckt | 60 Hz | ≤ 100 % ljusstyrka inställning | 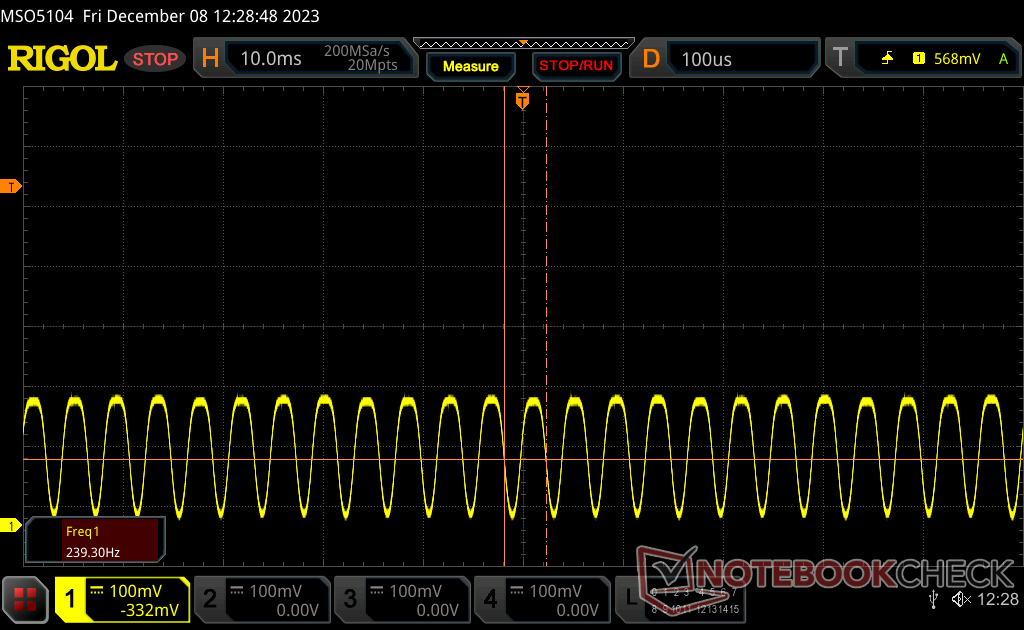 |
Displayens bakgrundsbelysning flimrar vid 60 Hz (i värsta fall, t.ex. med PWM) Flimrande upptäckt vid en ljusstyrkeinställning på 100 % och lägre. Det ska inte finnas något flimmer eller PWM över denna ljusstyrkeinställning. Frekvensen för 60 Hz är mycket låg, så flimmer kan orsaka ögon- och huvudvärk efter långvarig användning. Som jämförelse: 52 % av alla testade enheter använder inte PWM för att dämpa skärmen. Om PWM upptäcktes mättes ett medelvärde av 7754 (minst: 5 - maximum: 343500) Hz. | |||
Pulsbreddsmodulering förekommer på alla ljusstyrkenivåer, vilket man kan förvänta sig av en OLED-panel. Vi kan detektera en frekvens på 239 Hz från 0 till 57 procent ljusstyrka och 60 Hz från 58 till 100 procent ljusstyrka.
Prestanda
Villkor för testning
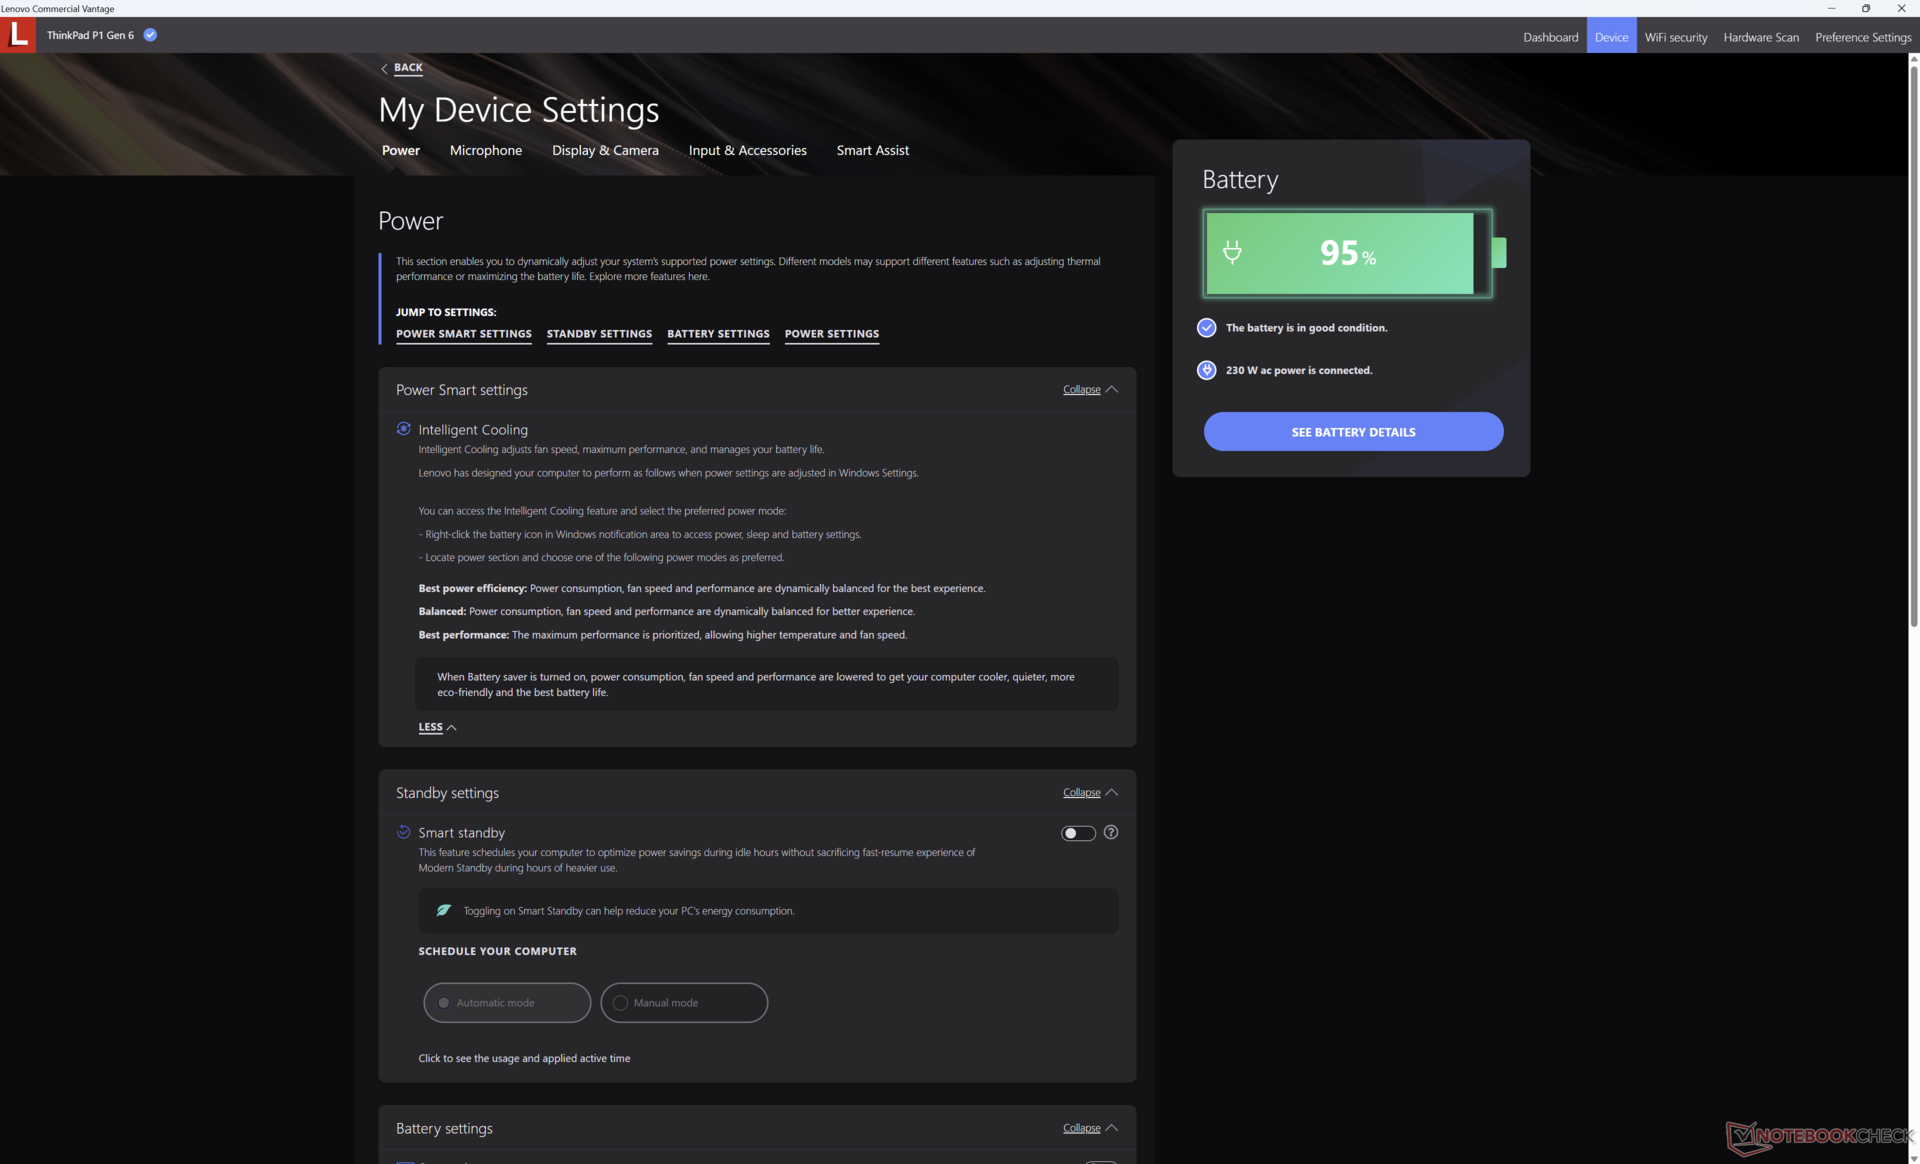
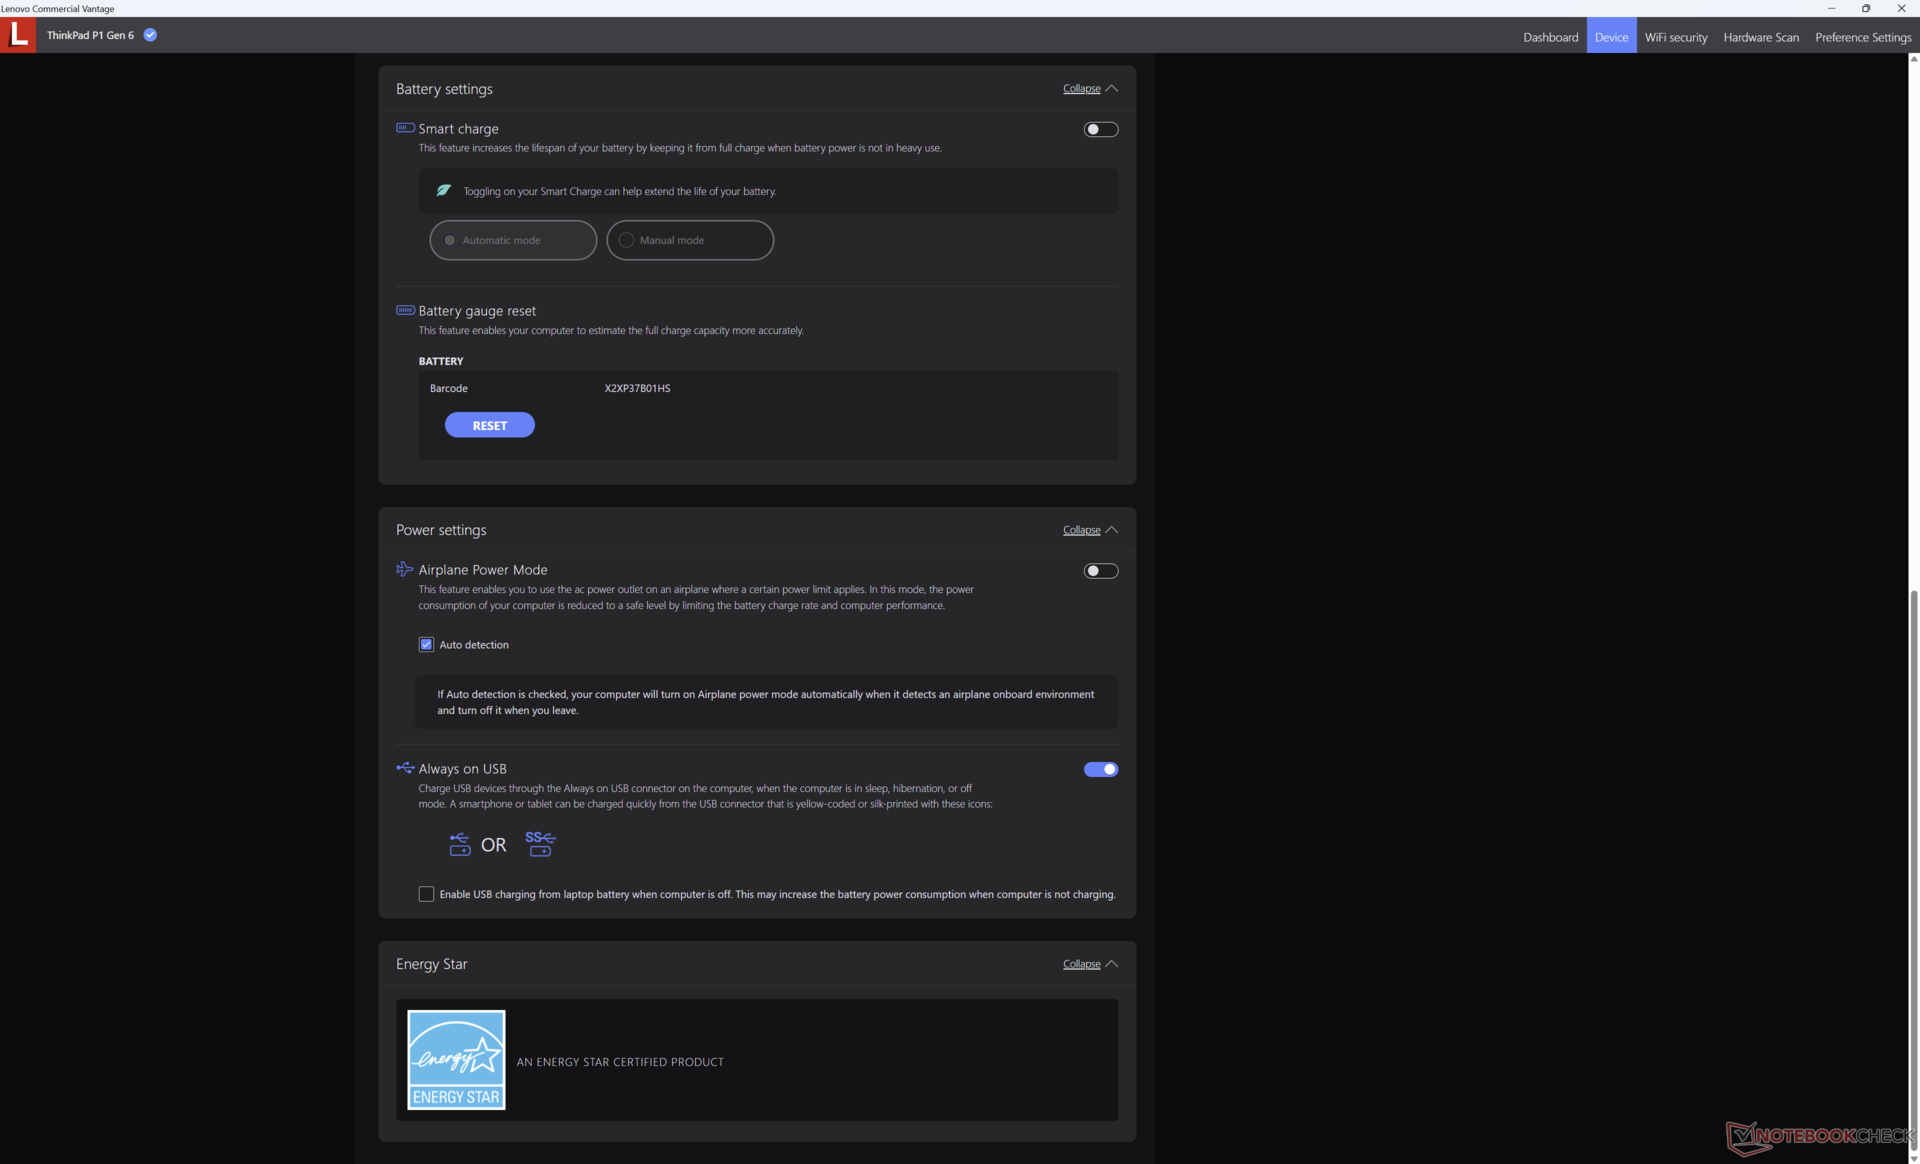
Vi ställde in Windows på prestandaläge innan vi körde riktmärkena nedan. Lenovo Vantage innehåller inga specialiserade energiprofiler för att hålla saker enkla.
Endast Optimus 1.0 stöds utan Advanced Optimus eller MUX-alternativ, vilket är lite av en besvikelse med tanke på den avancerade RTX 4080 GPU.
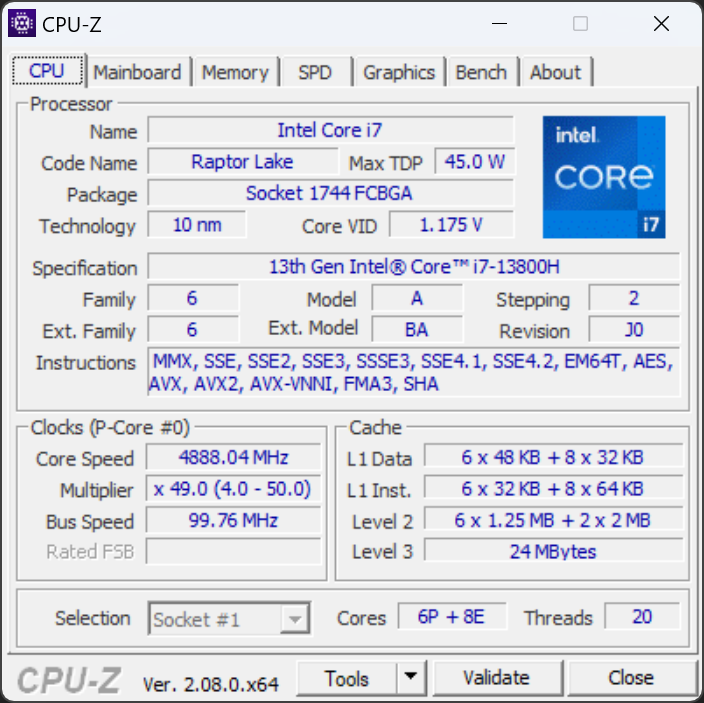
Processor
Core Core i7-13800H i vår enhet är bara 3 till 5 procent långsammare än Core i9-13900H även efter att man tagit hänsyn till eventuell strypning. Denna skillnad är i princip försumbar för de allra flesta användare. Köpare på jakt efter mer påtagliga prestandaförbättringar bör istället överväga ThinkPad P16-serien som levereras med Core HX-seriens processorer.
Cinebench R15 Multi Loop
Cinebench R23: Multi Core | Single Core
Cinebench R20: CPU (Multi Core) | CPU (Single Core)
Cinebench R15: CPU Multi 64Bit | CPU Single 64Bit
Blender: v2.79 BMW27 CPU
7-Zip 18.03: 7z b 4 | 7z b 4 -mmt1
Geekbench 5.5: Multi-Core | Single-Core
HWBOT x265 Benchmark v2.2: 4k Preset
LibreOffice : 20 Documents To PDF
R Benchmark 2.5: Overall mean
| Cinebench R20 / CPU (Multi Core) | |
| Asus ProArt Studiobook 16 OLED H7604 | |
| HP ZBook Fury 16 G10 | |
| MSI Raider GE68 HX 13VG, i7-13700HX | |
| Lenovo ThinkPad P16 G1 RTX A5500 | |
| Dell Precision 5000 5680 | |
| Lenovo ThinkPad P1 G6-21FV000DGE | |
| Gigabyte Aero 16 YE5 | |
| Lenovo ThinkPad P1 G6 21FV001KUS | |
| Genomsnitt Intel Core i7-13800H (n=1) | |
| Lenovo ThinkPad X1 Extreme G4-20Y5CTO1WW (3050 Ti) | |
| Lenovo ThinkPad P1 G4-20Y4S0KS00 | |
| LG Gram 2in1 16 16T90R - G.AA78G | |
| Lenovo ThinkPad E16 G1-21JUS08X00 | |
| Lenovo ThinkPad E16 G1 Core i5-1335U | |
| Cinebench R20 / CPU (Single Core) | |
| HP ZBook Fury 16 G10 | |
| Asus ProArt Studiobook 16 OLED H7604 | |
| Lenovo ThinkPad P1 G6-21FV000DGE | |
| Dell Precision 5000 5680 | |
| Lenovo ThinkPad P1 G6 21FV001KUS | |
| Genomsnitt Intel Core i7-13800H (n=1) | |
| Lenovo ThinkPad P16 G1 RTX A5500 | |
| MSI Raider GE68 HX 13VG, i7-13700HX | |
| Gigabyte Aero 16 YE5 | |
| Lenovo ThinkPad E16 G1 Core i5-1335U | |
| LG Gram 2in1 16 16T90R - G.AA78G | |
| Lenovo ThinkPad P1 G4-20Y4S0KS00 | |
| Lenovo ThinkPad X1 Extreme G4-20Y5CTO1WW (3050 Ti) | |
| Lenovo ThinkPad E16 G1-21JUS08X00 | |
| Cinebench R15 / CPU Single 64Bit | |
| Asus ProArt Studiobook 16 OLED H7604 | |
| HP ZBook Fury 16 G10 | |
| Dell Precision 5000 5680 | |
| Lenovo ThinkPad P1 G6-21FV000DGE | |
| Lenovo ThinkPad P1 G6 21FV001KUS | |
| Genomsnitt Intel Core i7-13800H (n=1) | |
| Gigabyte Aero 16 YE5 | |
| Lenovo ThinkPad P16 G1 RTX A5500 | |
| MSI Raider GE68 HX 13VG, i7-13700HX | |
| LG Gram 2in1 16 16T90R - G.AA78G | |
| Lenovo ThinkPad E16 G1 Core i5-1335U | |
| Lenovo ThinkPad P1 G4-20Y4S0KS00 | |
| Lenovo ThinkPad E16 G1-21JUS08X00 | |
| Lenovo ThinkPad X1 Extreme G4-20Y5CTO1WW (3050 Ti) | |
| 7-Zip 18.03 / 7z b 4 -mmt1 | |
| Asus ProArt Studiobook 16 OLED H7604 | |
| HP ZBook Fury 16 G10 | |
| Lenovo ThinkPad P1 G6-21FV000DGE | |
| Lenovo ThinkPad P1 G6 21FV001KUS | |
| Genomsnitt Intel Core i7-13800H (n=1) | |
| Dell Precision 5000 5680 | |
| Gigabyte Aero 16 YE5 | |
| Lenovo ThinkPad P16 G1 RTX A5500 | |
| MSI Raider GE68 HX 13VG, i7-13700HX | |
| Lenovo ThinkPad P1 G4-20Y4S0KS00 | |
| Lenovo ThinkPad X1 Extreme G4-20Y5CTO1WW (3050 Ti) | |
| Lenovo ThinkPad E16 G1-21JUS08X00 | |
| Lenovo ThinkPad E16 G1 Core i5-1335U | |
| LG Gram 2in1 16 16T90R - G.AA78G | |
| HWBOT x265 Benchmark v2.2 / 4k Preset | |
| Asus ProArt Studiobook 16 OLED H7604 | |
| HP ZBook Fury 16 G10 | |
| MSI Raider GE68 HX 13VG, i7-13700HX | |
| Lenovo ThinkPad P16 G1 RTX A5500 | |
| Dell Precision 5000 5680 | |
| Lenovo ThinkPad P1 G6 21FV001KUS | |
| Genomsnitt Intel Core i7-13800H (n=1) | |
| Lenovo ThinkPad P1 G6-21FV000DGE | |
| Gigabyte Aero 16 YE5 | |
| Lenovo ThinkPad P1 G4-20Y4S0KS00 | |
| Lenovo ThinkPad X1 Extreme G4-20Y5CTO1WW (3050 Ti) | |
| Lenovo ThinkPad E16 G1-21JUS08X00 | |
| LG Gram 2in1 16 16T90R - G.AA78G | |
| Lenovo ThinkPad E16 G1 Core i5-1335U | |
| LibreOffice / 20 Documents To PDF | |
| LG Gram 2in1 16 16T90R - G.AA78G | |
| MSI Raider GE68 HX 13VG, i7-13700HX | |
| Lenovo ThinkPad E16 G1 Core i5-1335U | |
| Lenovo ThinkPad E16 G1-21JUS08X00 | |
| Lenovo ThinkPad P1 G6-21FV000DGE | |
| Lenovo ThinkPad P1 G4-20Y4S0KS00 | |
| Lenovo ThinkPad P1 G6 21FV001KUS | |
| Genomsnitt Intel Core i7-13800H (n=1) | |
| Asus ProArt Studiobook 16 OLED H7604 | |
| HP ZBook Fury 16 G10 | |
| Lenovo ThinkPad X1 Extreme G4-20Y5CTO1WW (3050 Ti) | |
| Dell Precision 5000 5680 | |
| Lenovo ThinkPad P16 G1 RTX A5500 | |
| Gigabyte Aero 16 YE5 | |
| R Benchmark 2.5 / Overall mean | |
| LG Gram 2in1 16 16T90R - G.AA78G | |
| Lenovo ThinkPad X1 Extreme G4-20Y5CTO1WW (3050 Ti) | |
| Lenovo ThinkPad P1 G4-20Y4S0KS00 | |
| Lenovo ThinkPad E16 G1-21JUS08X00 | |
| Lenovo ThinkPad P16 G1 RTX A5500 | |
| MSI Raider GE68 HX 13VG, i7-13700HX | |
| Lenovo ThinkPad P1 G6-21FV000DGE | |
| Gigabyte Aero 16 YE5 | |
| Dell Precision 5000 5680 | |
| Lenovo ThinkPad P1 G6 21FV001KUS | |
| Genomsnitt Intel Core i7-13800H (n=1) | |
| HP ZBook Fury 16 G10 | |
| Asus ProArt Studiobook 16 OLED H7604 | |
Cinebench R23: Multi Core | Single Core
Cinebench R20: CPU (Multi Core) | CPU (Single Core)
Cinebench R15: CPU Multi 64Bit | CPU Single 64Bit
Blender: v2.79 BMW27 CPU
7-Zip 18.03: 7z b 4 | 7z b 4 -mmt1
Geekbench 5.5: Multi-Core | Single-Core
HWBOT x265 Benchmark v2.2: 4k Preset
LibreOffice : 20 Documents To PDF
R Benchmark 2.5: Overall mean
* ... mindre är bättre
AIDA64: FP32 Ray-Trace | FPU Julia | CPU SHA3 | CPU Queen | FPU SinJulia | FPU Mandel | CPU AES | CPU ZLib | FP64 Ray-Trace | CPU PhotoWorxx
| Performance rating | |
| HP ZBook Fury 16 G10 | |
| Lenovo ThinkPad P16 G1 RTX A5500 | |
| Lenovo ThinkPad P1 G6 21FV001KUS | |
| Genomsnitt Intel Core i7-13800H | |
| Dell Precision 5000 5680 | |
| Lenovo ThinkPad P1 G6-21FV000DGE | |
| Lenovo ThinkPad P1 G4-20Y4S0KS00 -9! | |
| AIDA64 / FP32 Ray-Trace | |
| HP ZBook Fury 16 G10 | |
| Lenovo ThinkPad P16 G1 RTX A5500 | |
| Lenovo ThinkPad P1 G6 21FV001KUS | |
| Genomsnitt Intel Core i7-13800H (n=1) | |
| Lenovo ThinkPad P1 G6-21FV000DGE | |
| Dell Precision 5000 5680 | |
| AIDA64 / FPU Julia | |
| HP ZBook Fury 16 G10 | |
| Lenovo ThinkPad P16 G1 RTX A5500 | |
| Lenovo ThinkPad P1 G6 21FV001KUS | |
| Genomsnitt Intel Core i7-13800H (n=1) | |
| Lenovo ThinkPad P1 G6-21FV000DGE | |
| Dell Precision 5000 5680 | |
| AIDA64 / CPU SHA3 | |
| HP ZBook Fury 16 G10 | |
| Lenovo ThinkPad P16 G1 RTX A5500 | |
| Lenovo ThinkPad P1 G6 21FV001KUS | |
| Genomsnitt Intel Core i7-13800H (n=1) | |
| Lenovo ThinkPad P1 G6-21FV000DGE | |
| Dell Precision 5000 5680 | |
| AIDA64 / CPU Queen | |
| HP ZBook Fury 16 G10 | |
| Dell Precision 5000 5680 | |
| Lenovo ThinkPad P1 G6-21FV000DGE | |
| Lenovo ThinkPad P1 G6 21FV001KUS | |
| Genomsnitt Intel Core i7-13800H (n=1) | |
| Lenovo ThinkPad P16 G1 RTX A5500 | |
| AIDA64 / FPU SinJulia | |
| HP ZBook Fury 16 G10 | |
| Lenovo ThinkPad P16 G1 RTX A5500 | |
| Lenovo ThinkPad P1 G6 21FV001KUS | |
| Genomsnitt Intel Core i7-13800H (n=1) | |
| Lenovo ThinkPad P1 G6-21FV000DGE | |
| Dell Precision 5000 5680 | |
| AIDA64 / FPU Mandel | |
| HP ZBook Fury 16 G10 | |
| Lenovo ThinkPad P16 G1 RTX A5500 | |
| Lenovo ThinkPad P1 G6 21FV001KUS | |
| Genomsnitt Intel Core i7-13800H (n=1) | |
| Lenovo ThinkPad P1 G6-21FV000DGE | |
| Dell Precision 5000 5680 | |
| AIDA64 / CPU AES | |
| HP ZBook Fury 16 G10 | |
| Lenovo ThinkPad P16 G1 RTX A5500 | |
| Lenovo ThinkPad P1 G6 21FV001KUS | |
| Genomsnitt Intel Core i7-13800H (n=1) | |
| Lenovo ThinkPad P1 G6-21FV000DGE | |
| Dell Precision 5000 5680 | |
| AIDA64 / CPU ZLib | |
| HP ZBook Fury 16 G10 | |
| Lenovo ThinkPad P16 G1 RTX A5500 | |
| Lenovo ThinkPad P1 G6 21FV001KUS | |
| Genomsnitt Intel Core i7-13800H (n=1) | |
| Lenovo ThinkPad P1 G6-21FV000DGE | |
| Dell Precision 5000 5680 | |
| Lenovo ThinkPad P1 G4-20Y4S0KS00 | |
| AIDA64 / FP64 Ray-Trace | |
| HP ZBook Fury 16 G10 | |
| Lenovo ThinkPad P16 G1 RTX A5500 | |
| Lenovo ThinkPad P1 G6 21FV001KUS | |
| Genomsnitt Intel Core i7-13800H (n=1) | |
| Lenovo ThinkPad P1 G6-21FV000DGE | |
| Dell Precision 5000 5680 | |
| AIDA64 / CPU PhotoWorxx | |
| Dell Precision 5000 5680 | |
| Lenovo ThinkPad P16 G1 RTX A5500 | |
| HP ZBook Fury 16 G10 | |
| Lenovo ThinkPad P1 G6-21FV000DGE | |
| Lenovo ThinkPad P1 G6 21FV001KUS | |
| Genomsnitt Intel Core i7-13800H (n=1) | |
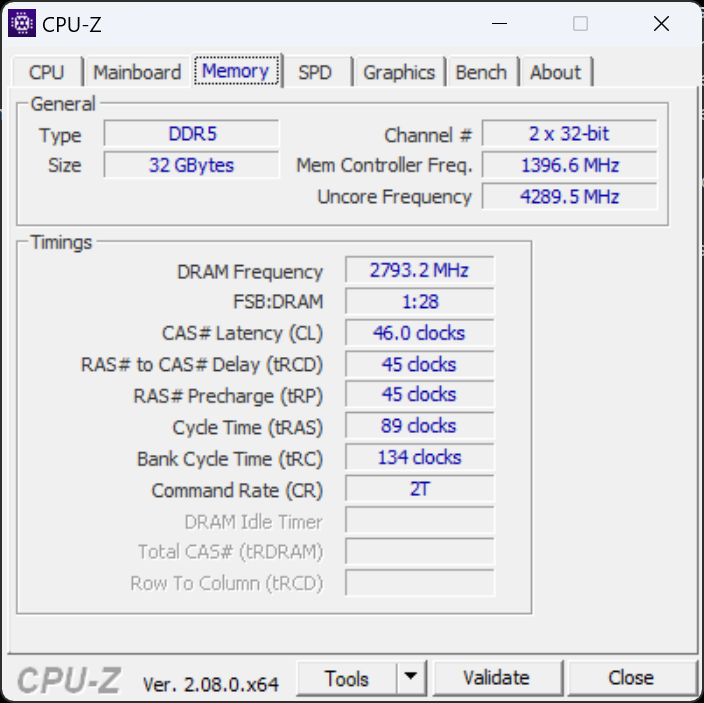
Systemets prestanda
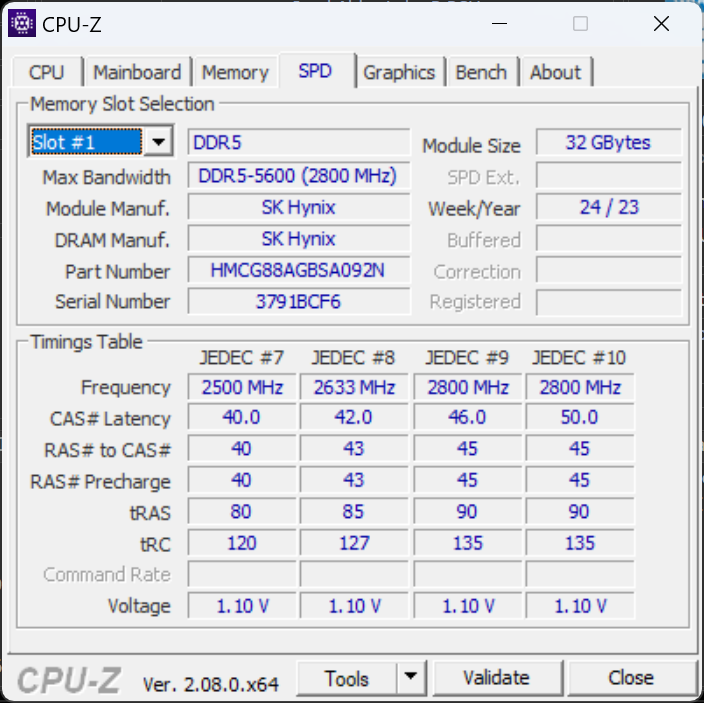
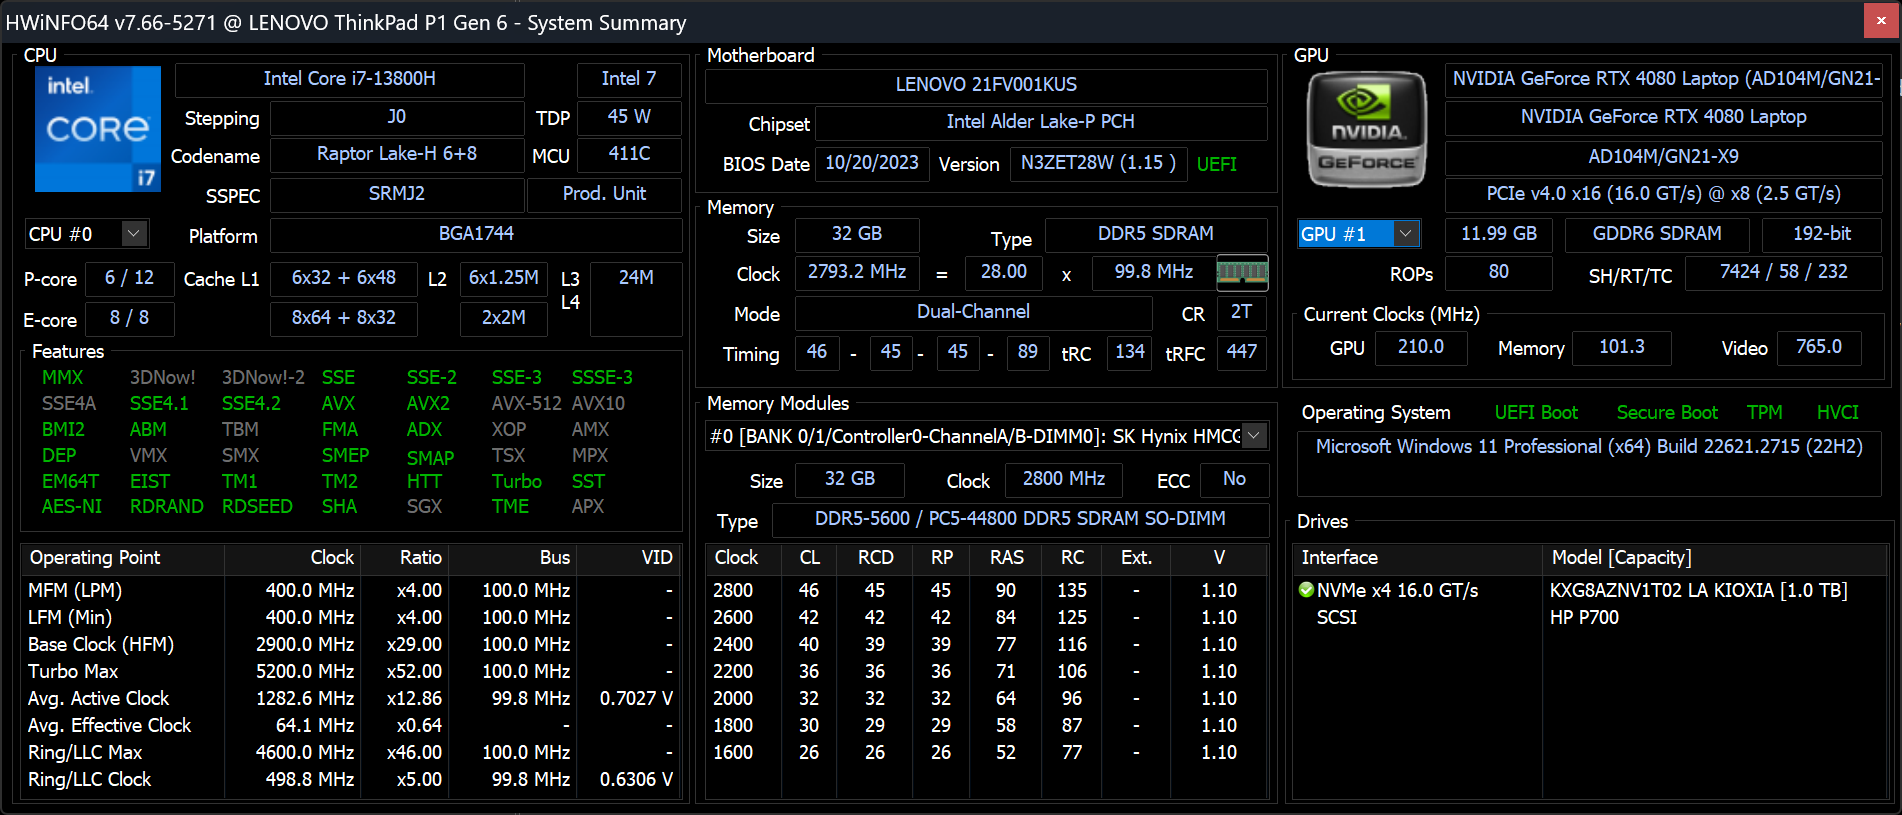
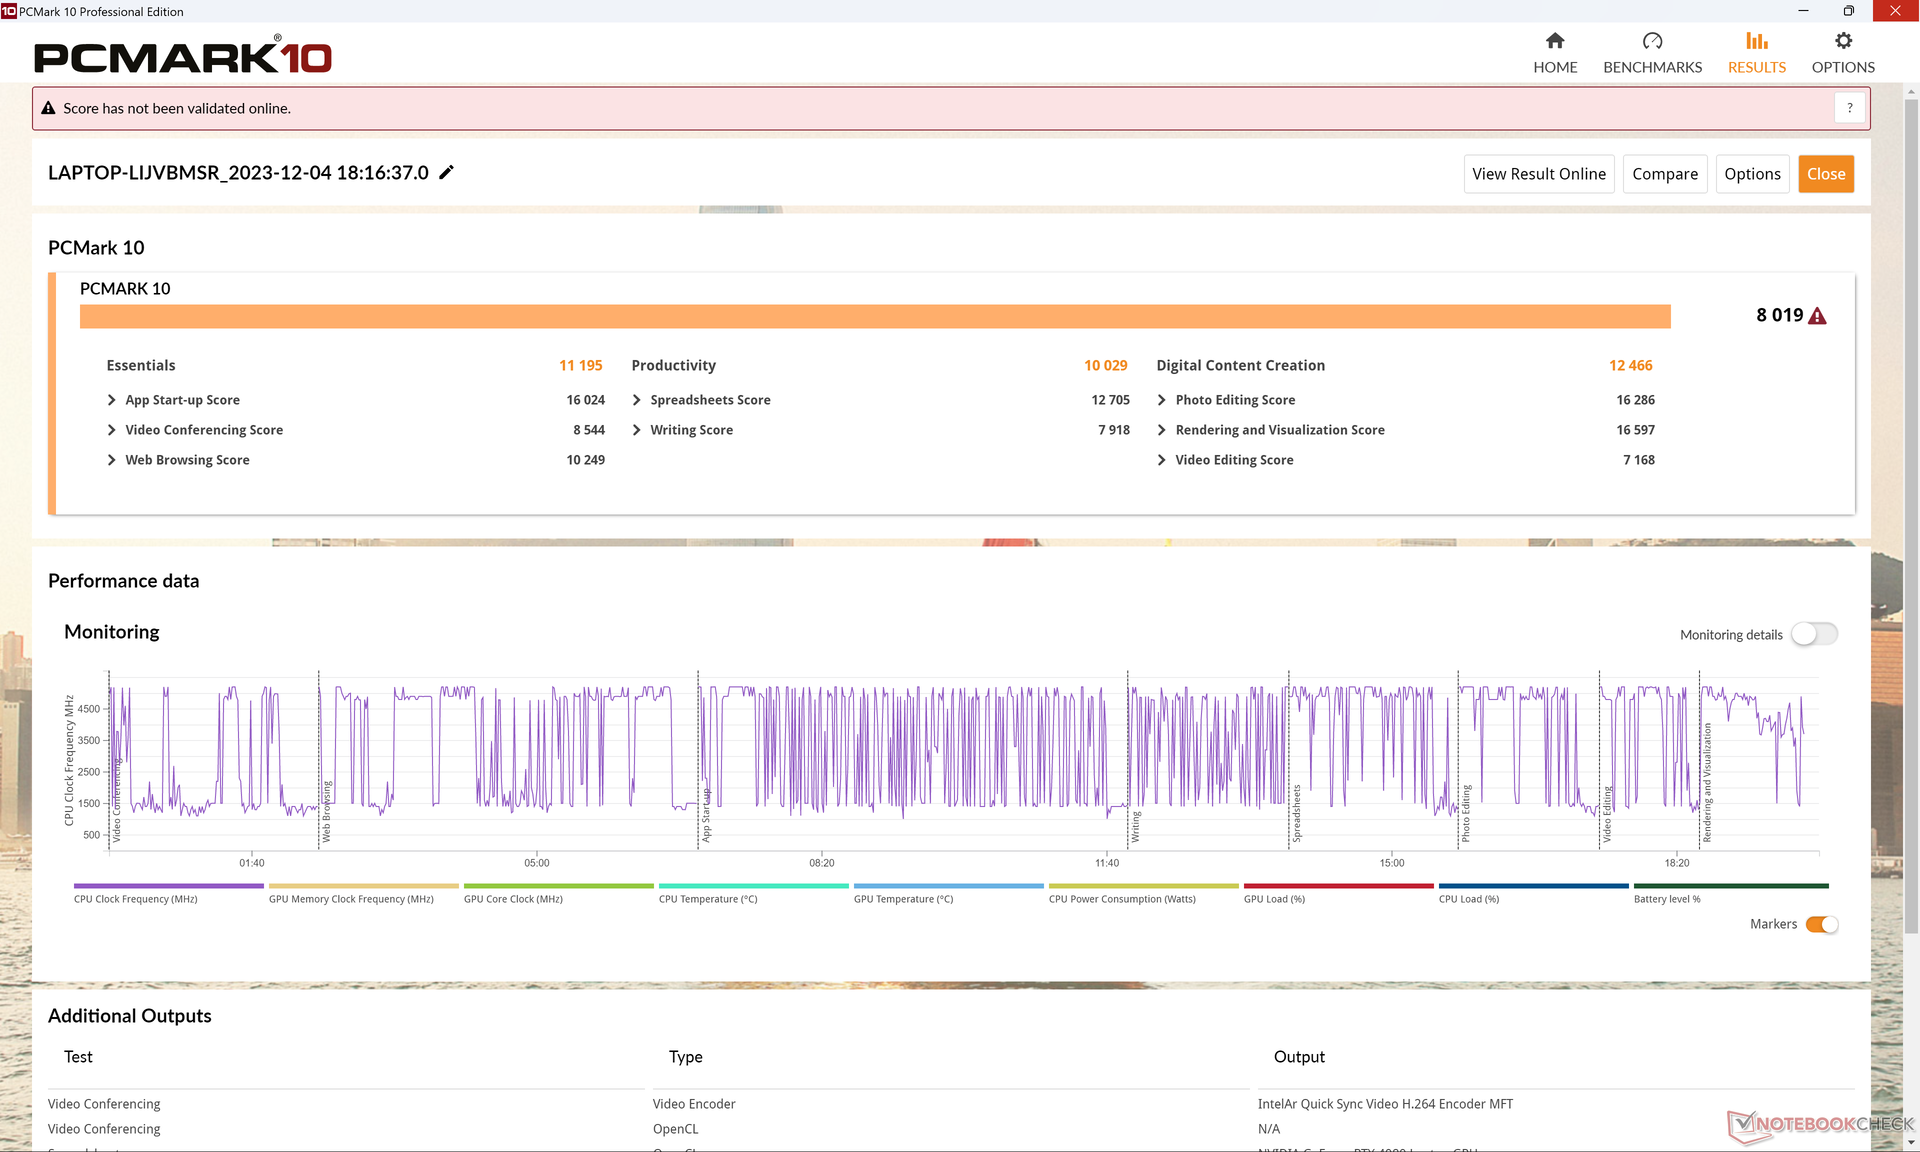
PCMark-resultaten är jämförbara om inte något snabbare än den RTX 2000-drivna ThinkPad P1 G6-konfigurationen, vilket främst beror på den snabbare RTX 4080 GPU:n. Observera att minnesprestandan är långsam eftersom vår enhet har konfigurerats med bara en RAM-modul i enkanalsläge istället för två.
CrossMark: Overall | Productivity | Creativity | Responsiveness
WebXPRT 3: Overall
WebXPRT 4: Overall
Mozilla Kraken 1.1: Total
| PCMark 10 / Score | |
| Dell Precision 5000 5680 | |
| HP ZBook Fury 16 G10 | |
| Lenovo ThinkPad P1 G6 21FV001KUS | |
| Genomsnitt Intel Core i7-13800H, NVIDIA GeForce RTX 4080 Laptop GPU (n=1) | |
| Lenovo ThinkPad P1 G6-21FV000DGE | |
| Lenovo ThinkPad P16 G1 RTX A5500 | |
| Lenovo ThinkPad P1 G4-20Y4S0KS00 | |
| PCMark 10 / Essentials | |
| Dell Precision 5000 5680 | |
| Lenovo ThinkPad P1 G6 21FV001KUS | |
| Genomsnitt Intel Core i7-13800H, NVIDIA GeForce RTX 4080 Laptop GPU (n=1) | |
| Lenovo ThinkPad P1 G6-21FV000DGE | |
| HP ZBook Fury 16 G10 | |
| Lenovo ThinkPad P16 G1 RTX A5500 | |
| Lenovo ThinkPad P1 G4-20Y4S0KS00 | |
| PCMark 10 / Productivity | |
| Dell Precision 5000 5680 | |
| Lenovo ThinkPad P1 G6 21FV001KUS | |
| Genomsnitt Intel Core i7-13800H, NVIDIA GeForce RTX 4080 Laptop GPU (n=1) | |
| Lenovo ThinkPad P1 G6-21FV000DGE | |
| Lenovo ThinkPad P16 G1 RTX A5500 | |
| HP ZBook Fury 16 G10 | |
| Lenovo ThinkPad P1 G4-20Y4S0KS00 | |
| PCMark 10 / Digital Content Creation | |
| HP ZBook Fury 16 G10 | |
| Dell Precision 5000 5680 | |
| Lenovo ThinkPad P1 G6 21FV001KUS | |
| Genomsnitt Intel Core i7-13800H, NVIDIA GeForce RTX 4080 Laptop GPU (n=1) | |
| Lenovo ThinkPad P1 G6-21FV000DGE | |
| Lenovo ThinkPad P1 G4-20Y4S0KS00 | |
| Lenovo ThinkPad P16 G1 RTX A5500 | |
| CrossMark / Overall | |
| Dell Precision 5000 5680 | |
| HP ZBook Fury 16 G10 | |
| Lenovo ThinkPad P16 G1 RTX A5500 | |
| Lenovo ThinkPad P1 G6-21FV000DGE | |
| Lenovo ThinkPad P1 G6 21FV001KUS | |
| Genomsnitt Intel Core i7-13800H, NVIDIA GeForce RTX 4080 Laptop GPU (n=1) | |
| Lenovo ThinkPad P1 G4-20Y4S0KS00 | |
| CrossMark / Productivity | |
| HP ZBook Fury 16 G10 | |
| Dell Precision 5000 5680 | |
| Lenovo ThinkPad P1 G6-21FV000DGE | |
| Lenovo ThinkPad P16 G1 RTX A5500 | |
| Lenovo ThinkPad P1 G6 21FV001KUS | |
| Genomsnitt Intel Core i7-13800H, NVIDIA GeForce RTX 4080 Laptop GPU (n=1) | |
| Lenovo ThinkPad P1 G4-20Y4S0KS00 | |
| CrossMark / Creativity | |
| Lenovo ThinkPad P16 G1 RTX A5500 | |
| Dell Precision 5000 5680 | |
| HP ZBook Fury 16 G10 | |
| Lenovo ThinkPad P1 G6 21FV001KUS | |
| Genomsnitt Intel Core i7-13800H, NVIDIA GeForce RTX 4080 Laptop GPU (n=1) | |
| Lenovo ThinkPad P1 G6-21FV000DGE | |
| Lenovo ThinkPad P1 G4-20Y4S0KS00 | |
| CrossMark / Responsiveness | |
| HP ZBook Fury 16 G10 | |
| Lenovo ThinkPad P1 G6-21FV000DGE | |
| Dell Precision 5000 5680 | |
| Lenovo ThinkPad P1 G6 21FV001KUS | |
| Genomsnitt Intel Core i7-13800H, NVIDIA GeForce RTX 4080 Laptop GPU (n=1) | |
| Lenovo ThinkPad P1 G4-20Y4S0KS00 | |
| Lenovo ThinkPad P16 G1 RTX A5500 | |
| WebXPRT 3 / Overall | |
| Dell Precision 5000 5680 | |
| HP ZBook Fury 16 G10 | |
| Lenovo ThinkPad P1 G6-21FV000DGE | |
| Lenovo ThinkPad P16 G1 RTX A5500 | |
| Lenovo ThinkPad P1 G6 21FV001KUS | |
| Genomsnitt Intel Core i7-13800H, NVIDIA GeForce RTX 4080 Laptop GPU (n=1) | |
| Lenovo ThinkPad P1 G4-20Y4S0KS00 | |
| WebXPRT 4 / Overall | |
| Lenovo ThinkPad P1 G6-21FV000DGE | |
| HP ZBook Fury 16 G10 | |
| Dell Precision 5000 5680 | |
| Lenovo ThinkPad P1 G6 21FV001KUS | |
| Genomsnitt Intel Core i7-13800H, NVIDIA GeForce RTX 4080 Laptop GPU (n=1) | |
| Lenovo ThinkPad P16 G1 RTX A5500 | |
| Mozilla Kraken 1.1 / Total | |
| Lenovo ThinkPad P1 G4-20Y4S0KS00 | |
| Lenovo ThinkPad P16 G1 RTX A5500 | |
| Lenovo ThinkPad P1 G6 21FV001KUS | |
| Genomsnitt Intel Core i7-13800H, NVIDIA GeForce RTX 4080 Laptop GPU (n=1) | |
| Dell Precision 5000 5680 | |
| Lenovo ThinkPad P1 G6-21FV000DGE | |
| HP ZBook Fury 16 G10 | |
* ... mindre är bättre
| PCMark 10 Score | 8019 poäng | |
Hjälp | ||
| AIDA64 / Memory Copy | |
| Dell Precision 5000 5680 | |
| Lenovo ThinkPad P16 G1 RTX A5500 | |
| HP ZBook Fury 16 G10 | |
| Lenovo ThinkPad P1 G6-21FV000DGE | |
| Lenovo ThinkPad P1 G6 21FV001KUS | |
| Genomsnitt Intel Core i7-13800H (n=1) | |
| AIDA64 / Memory Read | |
| Dell Precision 5000 5680 | |
| Lenovo ThinkPad P16 G1 RTX A5500 | |
| HP ZBook Fury 16 G10 | |
| Lenovo ThinkPad P1 G6 21FV001KUS | |
| Genomsnitt Intel Core i7-13800H (n=1) | |
| Lenovo ThinkPad P1 G6-21FV000DGE | |
| AIDA64 / Memory Write | |
| Dell Precision 5000 5680 | |
| Lenovo ThinkPad P16 G1 RTX A5500 | |
| HP ZBook Fury 16 G10 | |
| Lenovo ThinkPad P1 G6 21FV001KUS | |
| Genomsnitt Intel Core i7-13800H (n=1) | |
| Lenovo ThinkPad P1 G6-21FV000DGE | |
| AIDA64 / Memory Latency | |
| HP ZBook Fury 16 G10 | |
| Dell Precision 5000 5680 | |
| Lenovo ThinkPad P16 G1 RTX A5500 | |
| Lenovo ThinkPad P1 G6 21FV001KUS | |
| Genomsnitt Intel Core i7-13800H (n=1) | |
| Lenovo ThinkPad P1 G6-21FV000DGE | |
| Lenovo ThinkPad P1 G4-20Y4S0KS00 | |
* ... mindre är bättre
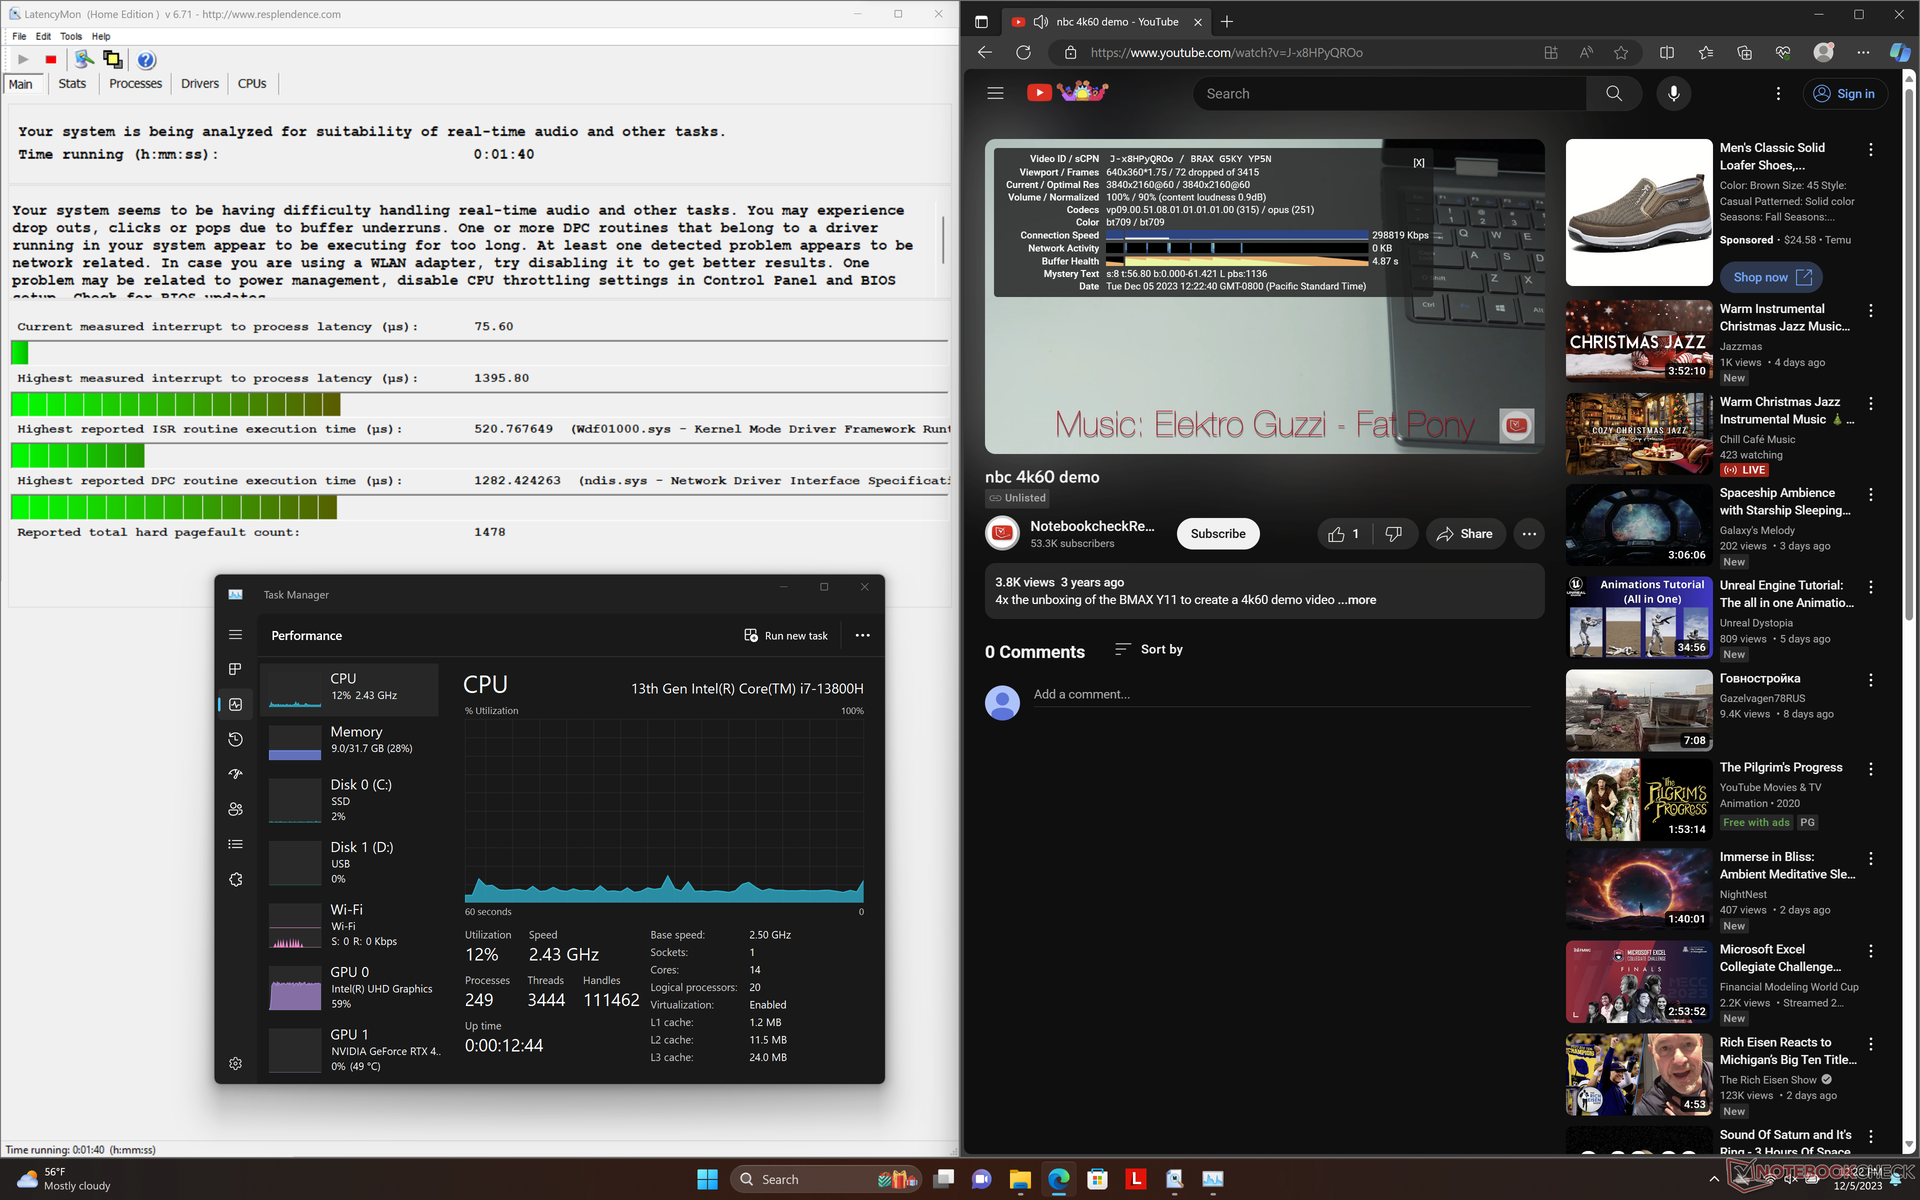
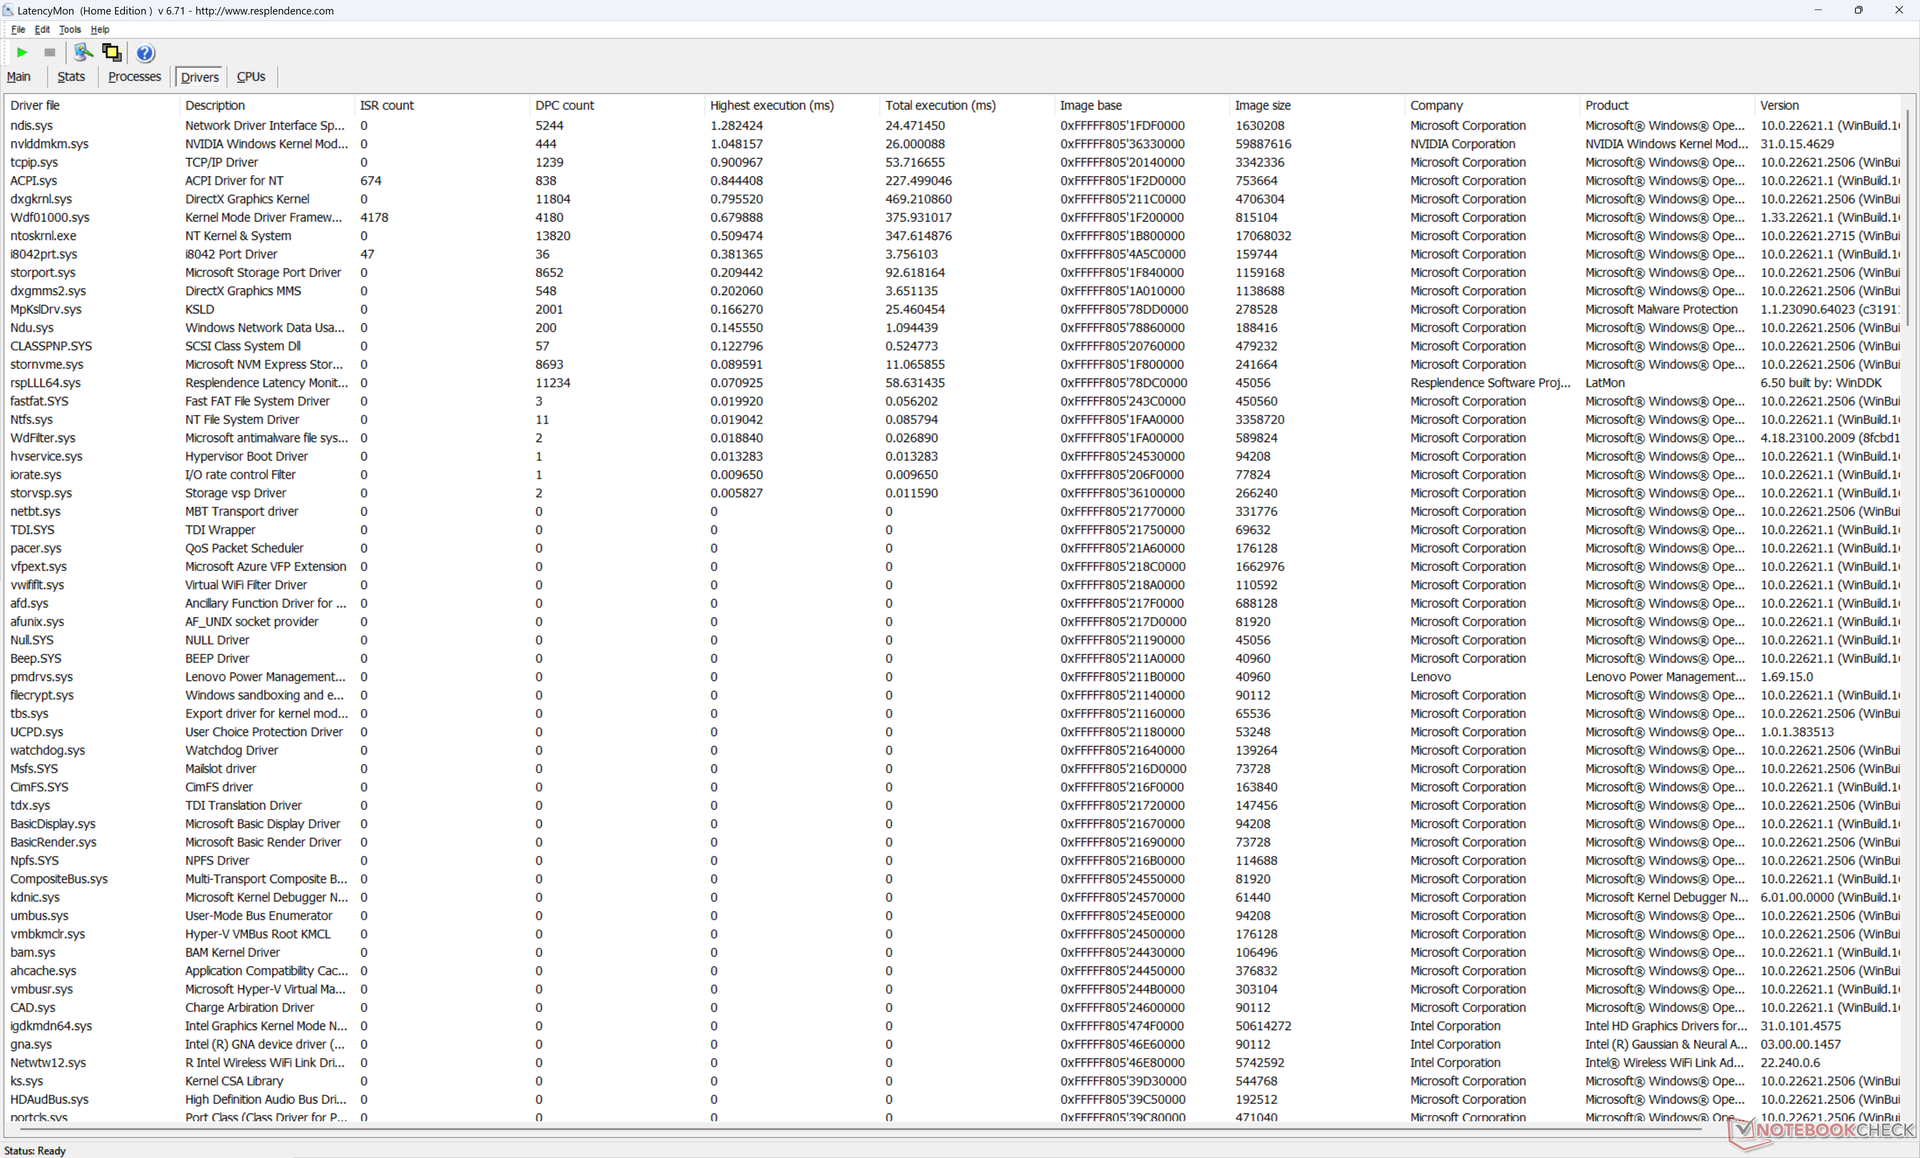
DPC-fördröjning
LatencyMon avslöjar DPC-problem när flera webbläsarflikar öppnas på vår hemsida och 75 tappade bildrutor när en en minut lång 4K60-video spelas upp. Det senare är särskilt nedslående med tanke på modellens pris och professionella aspekt. Det tyder också på drivrutinsproblem eller dålig hantering av bakgrundsapplikationer som kan avbryta det fönster som är i fokus.
| DPC Latencies / LatencyMon - interrupt to process latency (max), Web, Youtube, Prime95 | |
| HP ZBook Fury 16 G10 | |
| Lenovo ThinkPad P1 G6-21FV000DGE | |
| Dell Precision 5000 5680 | |
| Lenovo ThinkPad P16 G1 RTX A5500 | |
| Lenovo ThinkPad P1 G6 21FV001KUS | |
| Lenovo ThinkPad P1 G4-20Y4S0KS00 | |
* ... mindre är bättre
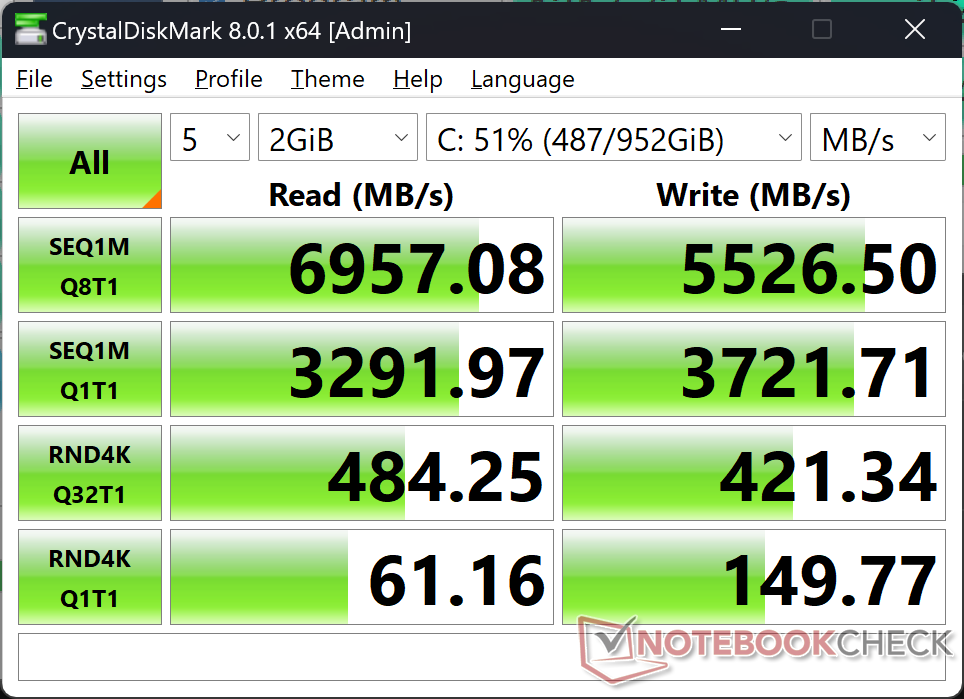
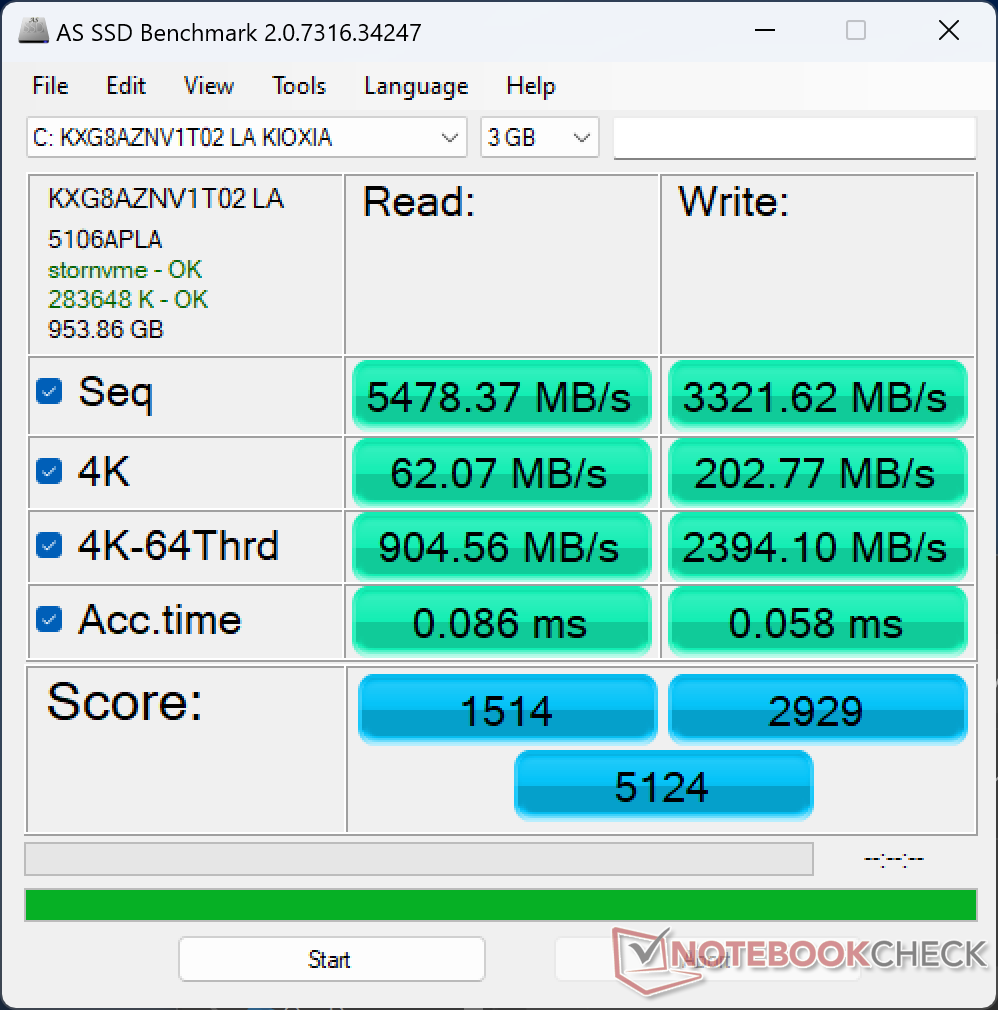
Lagringsenheter
Vår testenhet levereras med Kioxia XG8 KXG8AZNV1T02 istället för SK Hynix PC711 på vår ursprungliga ThinkPad P1 G6. Den övergripande prestandan är i allmänhet långsammare, särskilt när man skriver data, men läshastigheterna är ändå utmärkta med bara en liten strypning efter cirka 3 minuters stress.
Observera att vissa konfigurationer av ThinkPad P1 G6 kan stödja mer än en intern M.2 SSD. Denna specifika testkonfiguration kan dock endast stödja en enhet.

* ... mindre är bättre
Disk Throttling: DiskSpd Read Loop, Queue Depth 8
GPU-prestanda
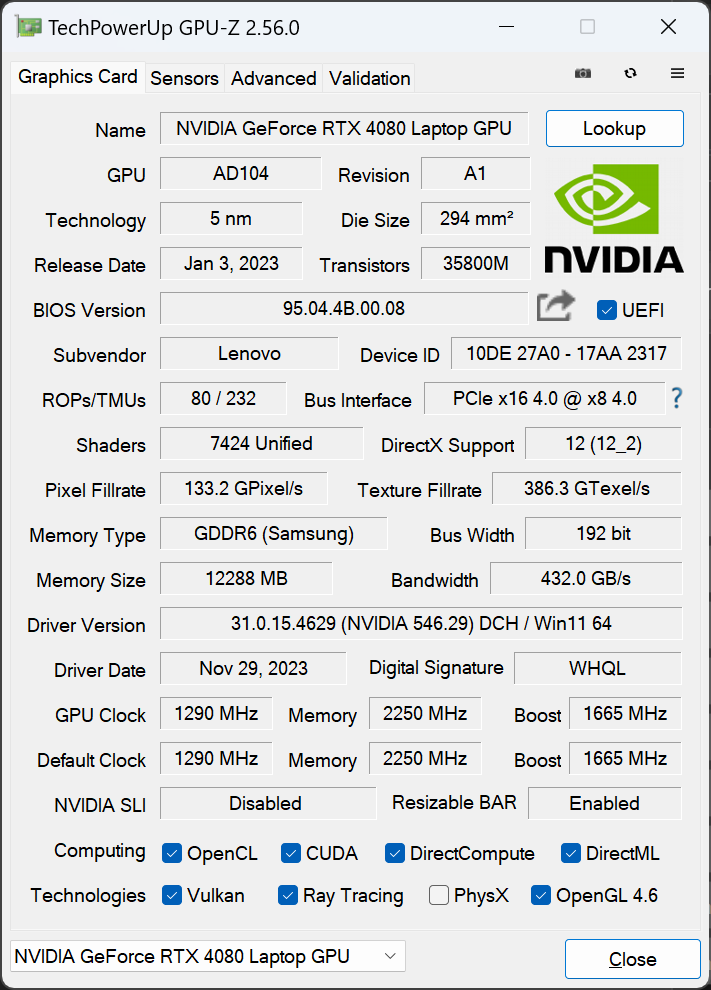
Nvidia Control Panel listar en maximal grafisk effekt på 105 W. I verkligheten kan vi dock bara nå en maximal effekt på 80 W enligt GPU-Z. Den övergripande prestandan är därefter 15 till 20 procent långsammare än den genomsnittliga bärbara datorn i vår databas med samma mobila GeForce RTX 4080 GPU eftersom just denna GPU oftare körs vid högre effekttoppar.
Oavsett vilket är grafikprestandan fortfarande långt före RTX 2000 i de flesta benchmarks förutom Specviewperf Siemens NX och Medical-testerna. För snabbare prestanda erbjuder Lenovo RTX 5000 i den högsta konfigurationen.
Att köra i läget Balanced istället för Performance påverkar GPU-prestandan medan processorn i stort sett inte påverkas, vilket framgår av våra Fire Strike resultat i tabellen nedan.
| Kraftprofil | Fysikresultat | Poäng för grafik | Kombinerat resultat |
| Prestanda-läge | 29543 | 33402 | 12423 |
| Balanserat läge | 30978 (-0%) | 25806 (-23%) | 9616 (-23%) |
| Batteridrift | 21163 (-28%) | 18870 (-44%) | 4960 (-60%) |
| 3DMark Performance rating - Percent | |
| Razer Blade 16 Early 2023 RTX 4090 -34! | |
| HP ZBook Fury 16 G10 -1! | |
| Lenovo ThinkPad P16 G1 RTX A5500 -1! | |
| Genomsnitt NVIDIA GeForce RTX 4080 Laptop GPU -1! | |
| Lenovo ThinkPad P1 G6 21FV001KUS -1! | |
| Lenovo ThinkPad P1 G6-21FV000DGE -17! | |
| Asus ProArt Studiobook 16 OLED H7604 -17! | |
| Gigabyte Aero 16 YE5 -2! | |
| Lenovo ThinkPad P1 G4-20Y4S0KS00 -11! | |
| Lenovo ThinkPad X1 Extreme G4-20Y5CTO1WW (3050 Ti) -36! | |
| LG Gram 2in1 16 16T90R - G.AA78G -36! | |
| 3DMark 11 Performance | 38087 poäng | |
| 3DMark Fire Strike Score | 28105 poäng | |
| 3DMark Time Spy Score | 13863 poäng | |
Hjälp | ||
* ... mindre är bättre
| F1 22 | |
| 1920x1080 Ultra High Preset AA:T AF:16x | |
| Genomsnitt NVIDIA GeForce RTX 4080 Laptop GPU (72.3 - 124.2, n=15) | |
| HP ZBook Fury 16 G10 | |
| Lenovo ThinkPad P1 G6 21FV001KUS | |
| Asus ProArt Studiobook 16 OLED H7604 | |
| Lenovo ThinkPad P1 G6-21FV000DGE | |
| 2560x1440 Ultra High Preset AA:T AF:16x | |
| Genomsnitt NVIDIA GeForce RTX 4080 Laptop GPU (55.4 - 79, n=13) | |
| HP ZBook Fury 16 G10 | |
| Lenovo ThinkPad P1 G6 21FV001KUS | |
| Asus ProArt Studiobook 16 OLED H7604 | |
| Lenovo ThinkPad P1 G6-21FV000DGE | |
| 3840x2160 Ultra High Preset AA:T AF:16x | |
| Genomsnitt NVIDIA GeForce RTX 4080 Laptop GPU (25.8 - 39.8, n=10) | |
| HP ZBook Fury 16 G10 | |
| Lenovo ThinkPad P1 G6 21FV001KUS | |
| Tiny Tina's Wonderlands | |
| 1920x1080 Badass Preset (DX12) | |
| Genomsnitt NVIDIA GeForce RTX 4080 Laptop GPU (112.9 - 167.1, n=9) | |
| HP ZBook Fury 16 G10 | |
| Lenovo ThinkPad P1 G6 21FV001KUS | |
| 2560x1440 Badass Preset (DX12) | |
| Genomsnitt NVIDIA GeForce RTX 4080 Laptop GPU (85 - 114.8, n=9) | |
| HP ZBook Fury 16 G10 | |
| Lenovo ThinkPad P1 G6 21FV001KUS | |
| 3840x2160 Badass Preset (DX12) | |
| Genomsnitt NVIDIA GeForce RTX 4080 Laptop GPU (46.4 - 60.9, n=9) | |
| HP ZBook Fury 16 G10 | |
| Lenovo ThinkPad P1 G6 21FV001KUS | |
| Baldur's Gate 3 | |
| 1920x1080 Ultra Preset AA:T | |
| Genomsnitt NVIDIA GeForce RTX 4080 Laptop GPU (111.8 - 181.2, n=7) | |
| Lenovo ThinkPad P1 G6 21FV001KUS | |
| Apple MacBook Pro 16 2023 M3 Pro | |
| 2560x1440 Ultra Preset AA:T | |
| Genomsnitt NVIDIA GeForce RTX 4080 Laptop GPU (88.3 - 129.3, n=7) | |
| Lenovo ThinkPad P1 G6 21FV001KUS | |
| 3840x2160 Ultra Preset AA:T | |
| Genomsnitt NVIDIA GeForce RTX 4080 Laptop GPU (48.8 - 68.4, n=5) | |
| Lenovo ThinkPad P1 G6 21FV001KUS | |
| Cyberpunk 2077 | |
| 1920x1080 Ultra Preset (FSR off) | |
| Genomsnitt NVIDIA GeForce RTX 4080 Laptop GPU (83.9 - 127.1, n=15) | |
| Lenovo ThinkPad P1 G6 21FV001KUS | |
| Apple MacBook Pro 16 2023 M3 Pro | |
| LG Gram 2in1 16 16T90R - G.AA78G | |
| 2560x1440 Ultra Preset (FSR off) | |
| Genomsnitt NVIDIA GeForce RTX 4080 Laptop GPU (56.2 - 86.3, n=15) | |
| Lenovo ThinkPad P1 G6 21FV001KUS | |
| 3840x2160 Ultra Preset (FSR off) | |
| Genomsnitt NVIDIA GeForce RTX 4080 Laptop GPU (25.8 - 39.8, n=8) | |
| Lenovo ThinkPad P1 G6 21FV001KUS | |
| 3840x2160 Ray Tracing Ultra Preset + DLSS3 Quality + FG | |
| Genomsnitt NVIDIA GeForce RTX 4080 Laptop GPU (48.4 - 58.5, n=4) | |
| Lenovo ThinkPad P1 G6 21FV001KUS | |
Bildfrekvensen vid tomgångskörning på Witcher 3 skulle vara stabil hela tiden förutom vid ett tillfälle då prestandan sjönk till 90 FPS, vilket visas i diagrammet nedan. Den plötsliga minskningen beror sannolikt på dålig hantering av bakgrundsapplikationer.
Witcher 3 FPS Chart
| låg | med. | hög | ultra | QHD | 4K | |
|---|---|---|---|---|---|---|
| GTA V (2015) | 120.3 | 106.4 | 120.3 | |||
| The Witcher 3 (2015) | 130.4 | 78.5 | ||||
| Dota 2 Reborn (2015) | 191.8 | 169 | 155.8 | 147.3 | 144.6 | |
| Final Fantasy XV Benchmark (2018) | 135.3 | 102.6 | 61.5 | |||
| X-Plane 11.11 (2018) | 171.1 | 150.8 | 118.6 | 103 | ||
| Far Cry 5 (2018) | 149 | 126 | 71 | |||
| Tiny Tina's Wonderlands (2022) | 118.6 | 85 | 46.4 | |||
| F1 22 (2022) | 202 | 81.5 | 55.4 | 29.7 | ||
| Baldur's Gate 3 (2023) | 124.8 | 88.7 | 48.8 | |||
| Cyberpunk 2077 (2023) | 103.8 | 90.9 | 59.9 | 25.8 |
Utsläpp
Buller från systemet
Fläktljudet är högre än på den RTX 2000-drivna konfigurationen när krävande belastningar körs. Vid körning av Witcher 3, till exempel, skulle fläktljudet variera mellan 47 och 55 dB(A) jämfört med bara 41 till 48 dB(A) på den mindre konfigurationen. I övrigt gör systemet ett utmärkt jobb med att vara tyst under långa perioder när man kör enklare processer som webbläsare eller videostreaming.
Ljudnivå
| Låg belastning |
| 22.5 / 22.5 / 22.5 dB(A) |
| Hög belastning |
| 28.7 / 54.4 dB(A) |
 | ||
30 dB tyst 40 dB(A) hörbar 50 dB(A) högt ljud |
||
min: | ||
| Lenovo ThinkPad P1 G6 21FV001KUS GeForce RTX 4080 Laptop GPU, i7-13800H, Kioxia XG8 KXG8AZNV1T02 | Lenovo ThinkPad P1 G6-21FV000DGE RTX 2000 Ada Generation Laptop, i9-13900H, SK Hynix PC711 1TB HFS001TDE9X084N | Lenovo ThinkPad P1 G4-20Y4S0KS00 GeForce RTX 3070 Laptop GPU, i7-11850H, Samsung PM9A1 MZVL21T0HCLR | Lenovo ThinkPad P16 G1 RTX A5500 RTX A5500 Laptop GPU, i9-12950HX, WDC PC SN810 2TB | Dell Precision 5000 5680 RTX 5000 Ada Generation Laptop, i9-13900H, 2x SK hynix PC801 HFS512GEJ9X101N RAID 0 | HP ZBook Fury 16 G10 RTX 5000 Ada Generation Laptop, i9-13950HX, SK hynix PC801 HFS001TEJ9X101N | |
|---|---|---|---|---|---|---|
| Noise | -11% | -9% | -2% | -5% | -7% | |
| av / miljö * (dB) | 22.5 | 24.5 -9% | 23.8 -6% | 23.1 -3% | 22.8 -1% | 22.9 -2% |
| Idle Minimum * (dB) | 22.5 | 24.5 -9% | 23.8 -6% | 23.1 -3% | 23 -2% | 22.9 -2% |
| Idle Average * (dB) | 22.5 | 24.5 -9% | 23.8 -6% | 23.1 -3% | 23 -2% | 22.9 -2% |
| Idle Maximum * (dB) | 22.5 | 24.5 -9% | 28.3 -26% | 23.1 -3% | 23 -2% | 28.5 -27% |
| Load Average * (dB) | 28.7 | 48 -67% | 38.6 -34% | 28.9 -1% | 37.2 -30% | 40.6 -41% |
| Witcher 3 ultra * (dB) | 47.5 | 40.7 14% | 47.4 -0% | 51.6 -9% | 51 -7% | 44.1 7% |
| Load Maximum * (dB) | 54.4 | 48 12% | 47.4 13% | 51.4 6% | 51 6% | 45.8 16% |
* ... mindre är bättre
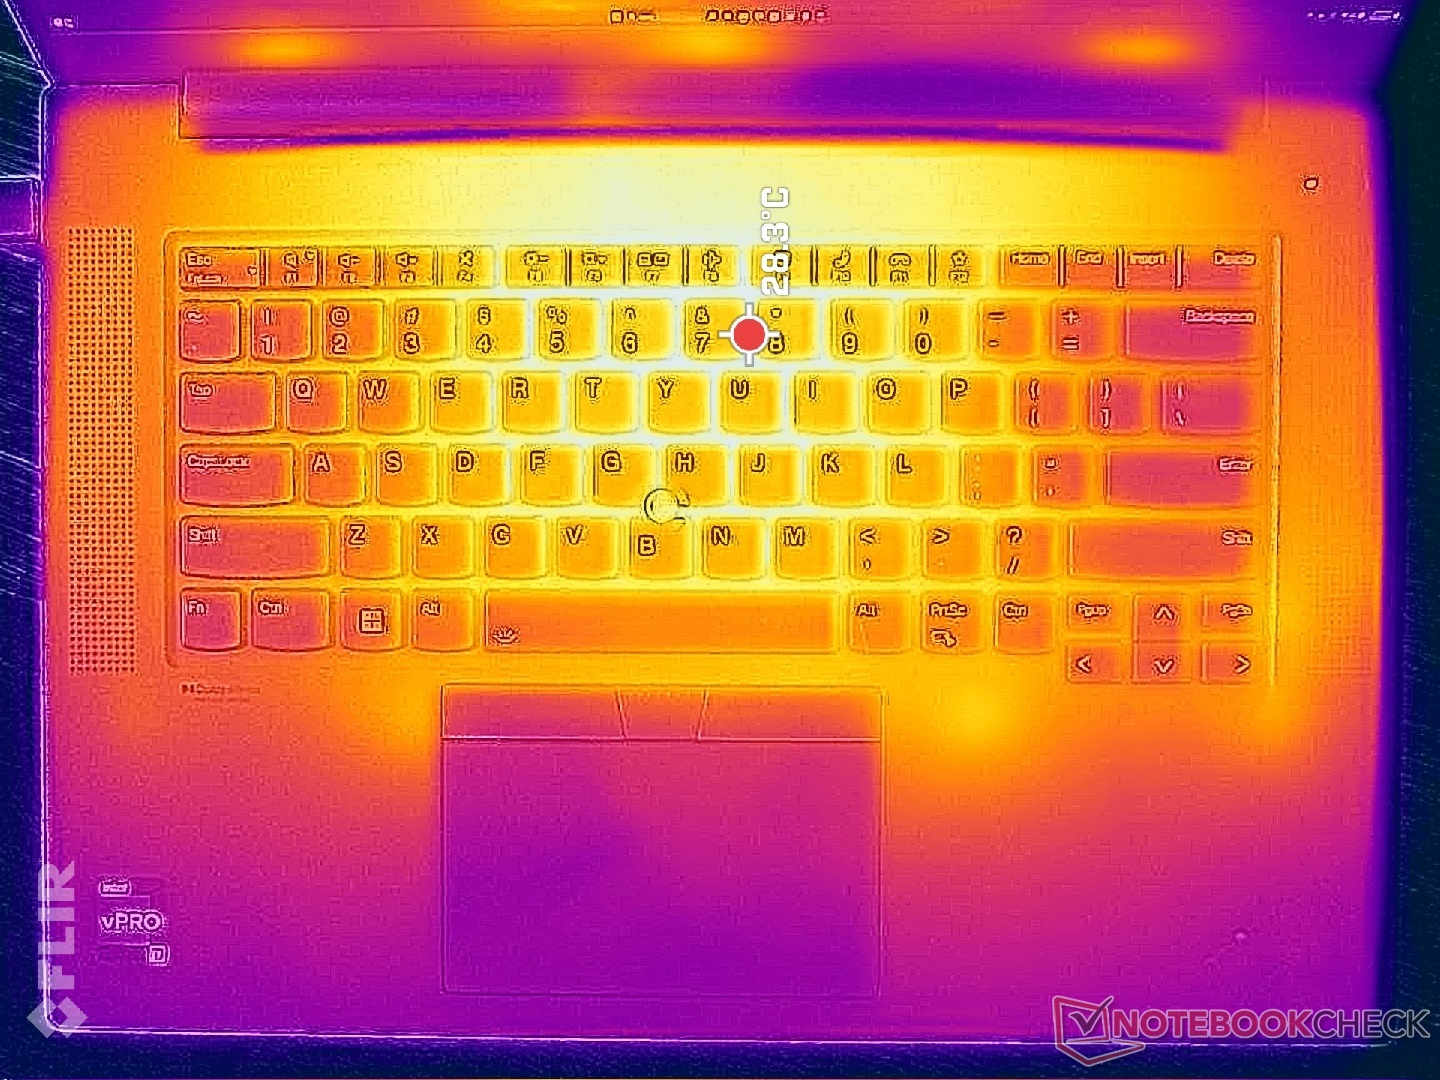
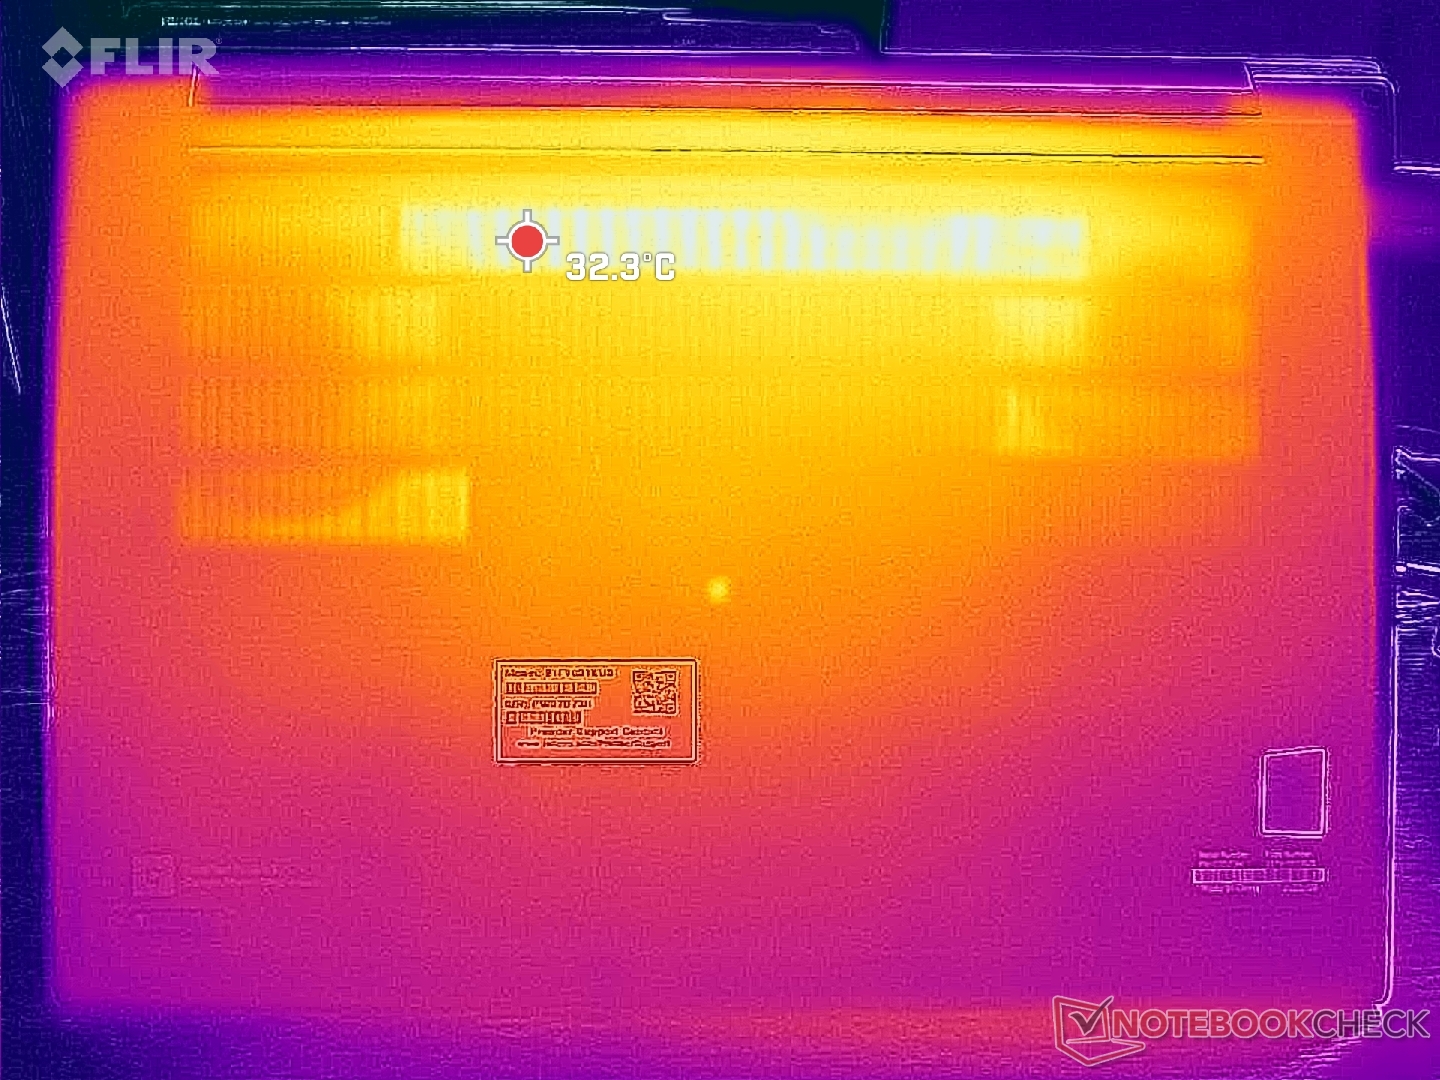
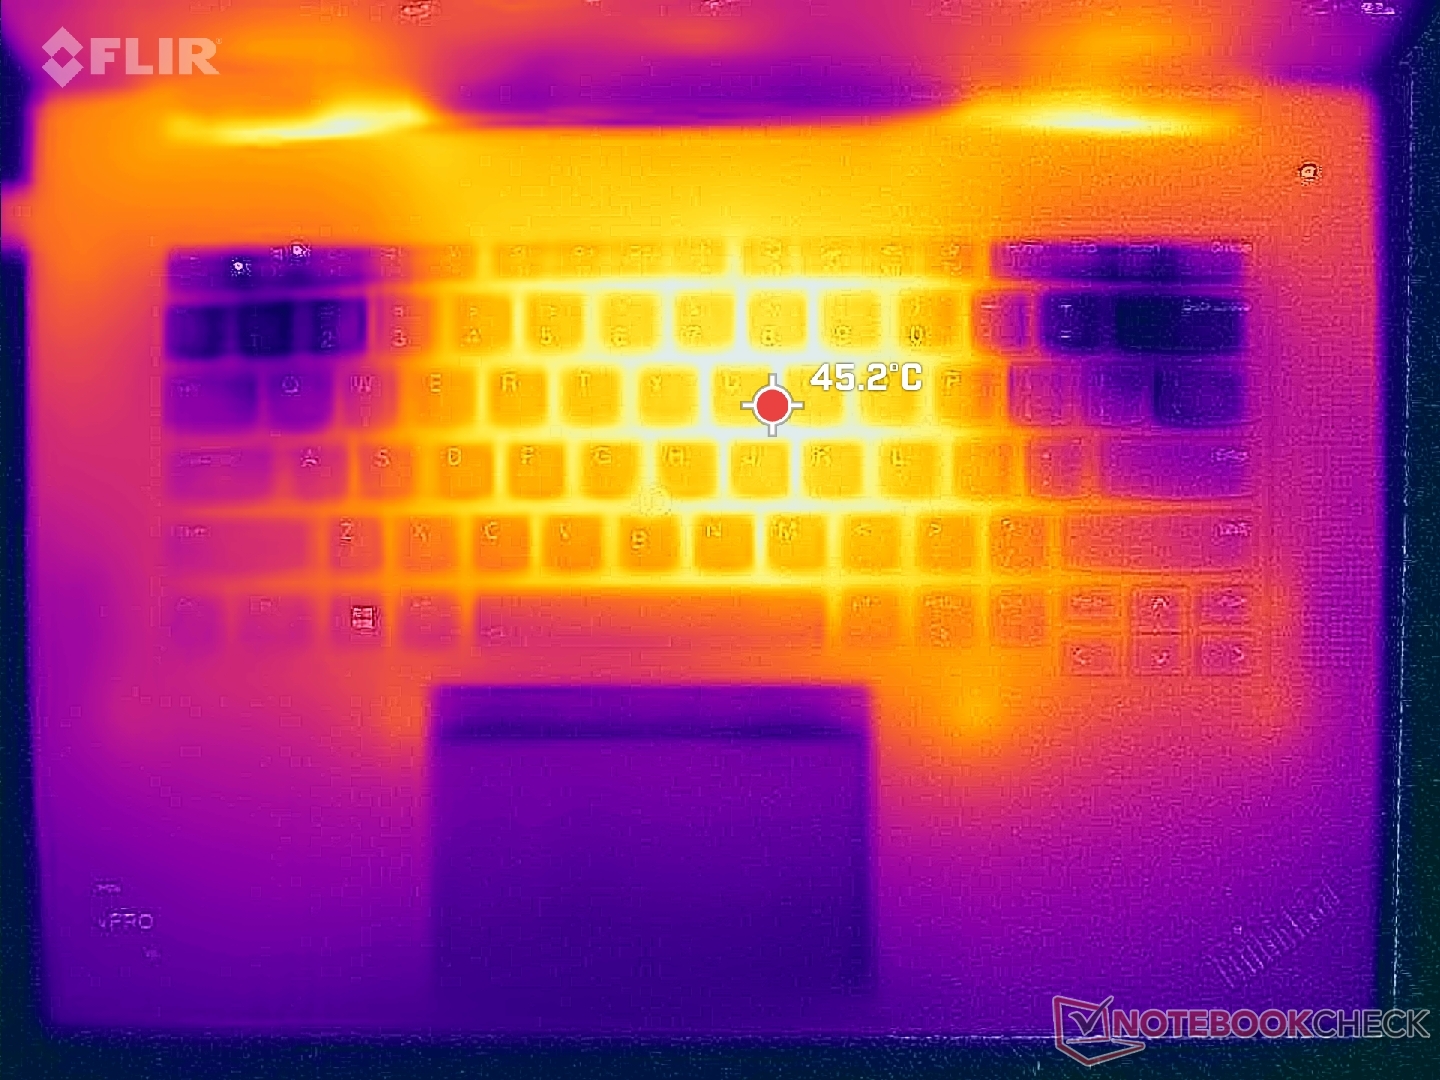
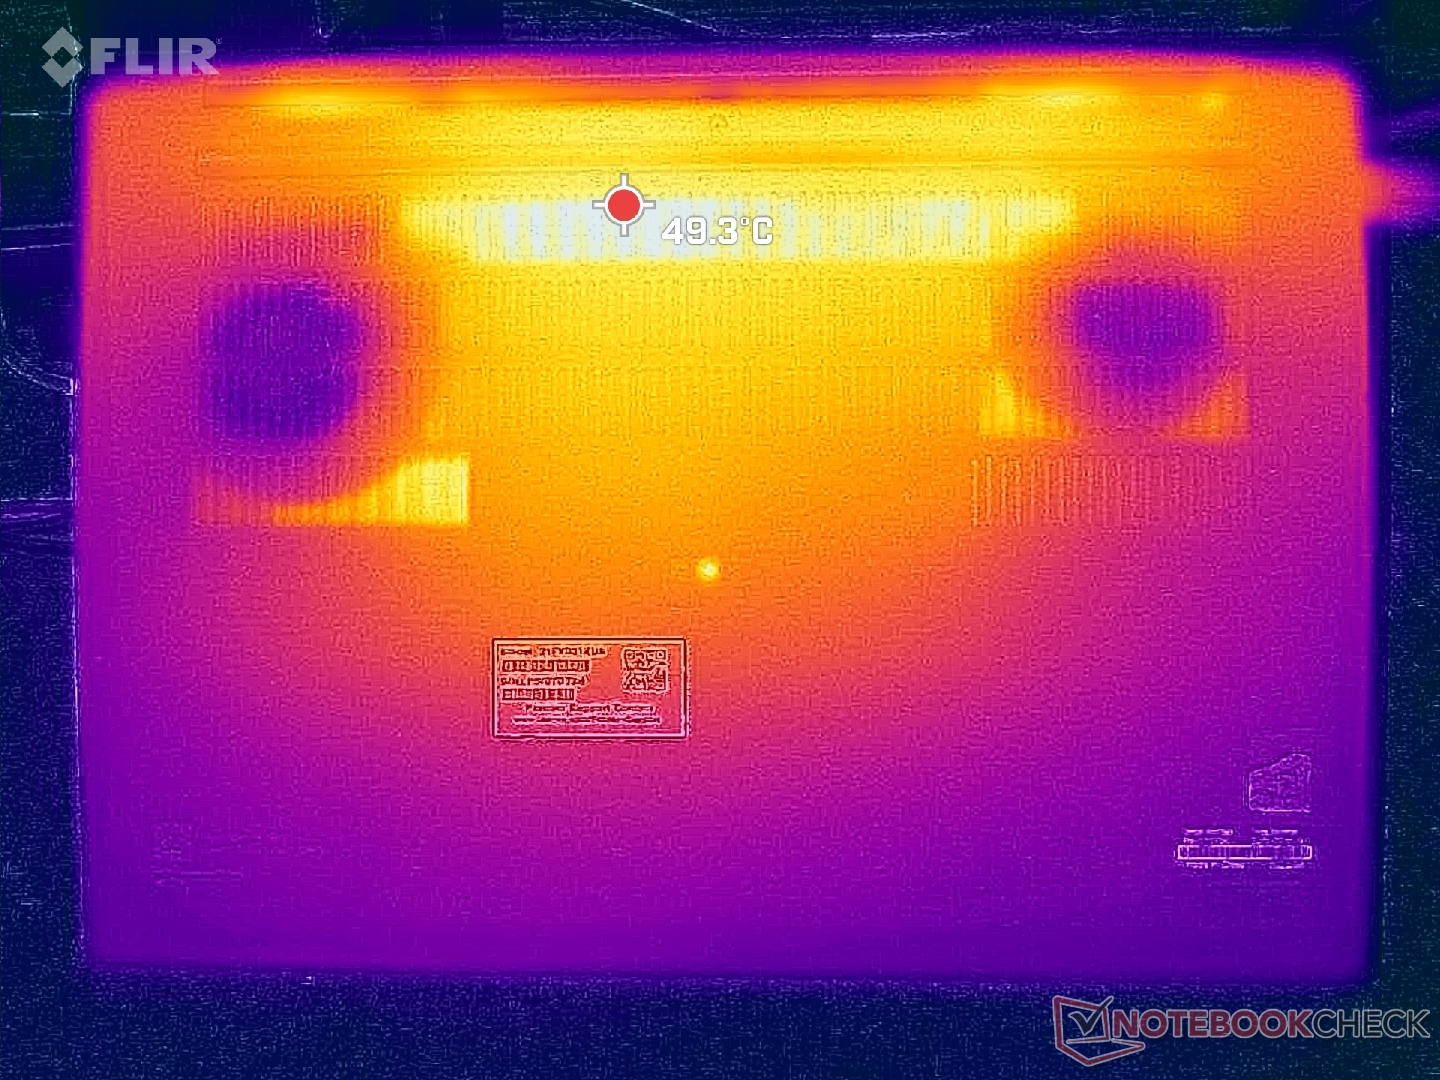
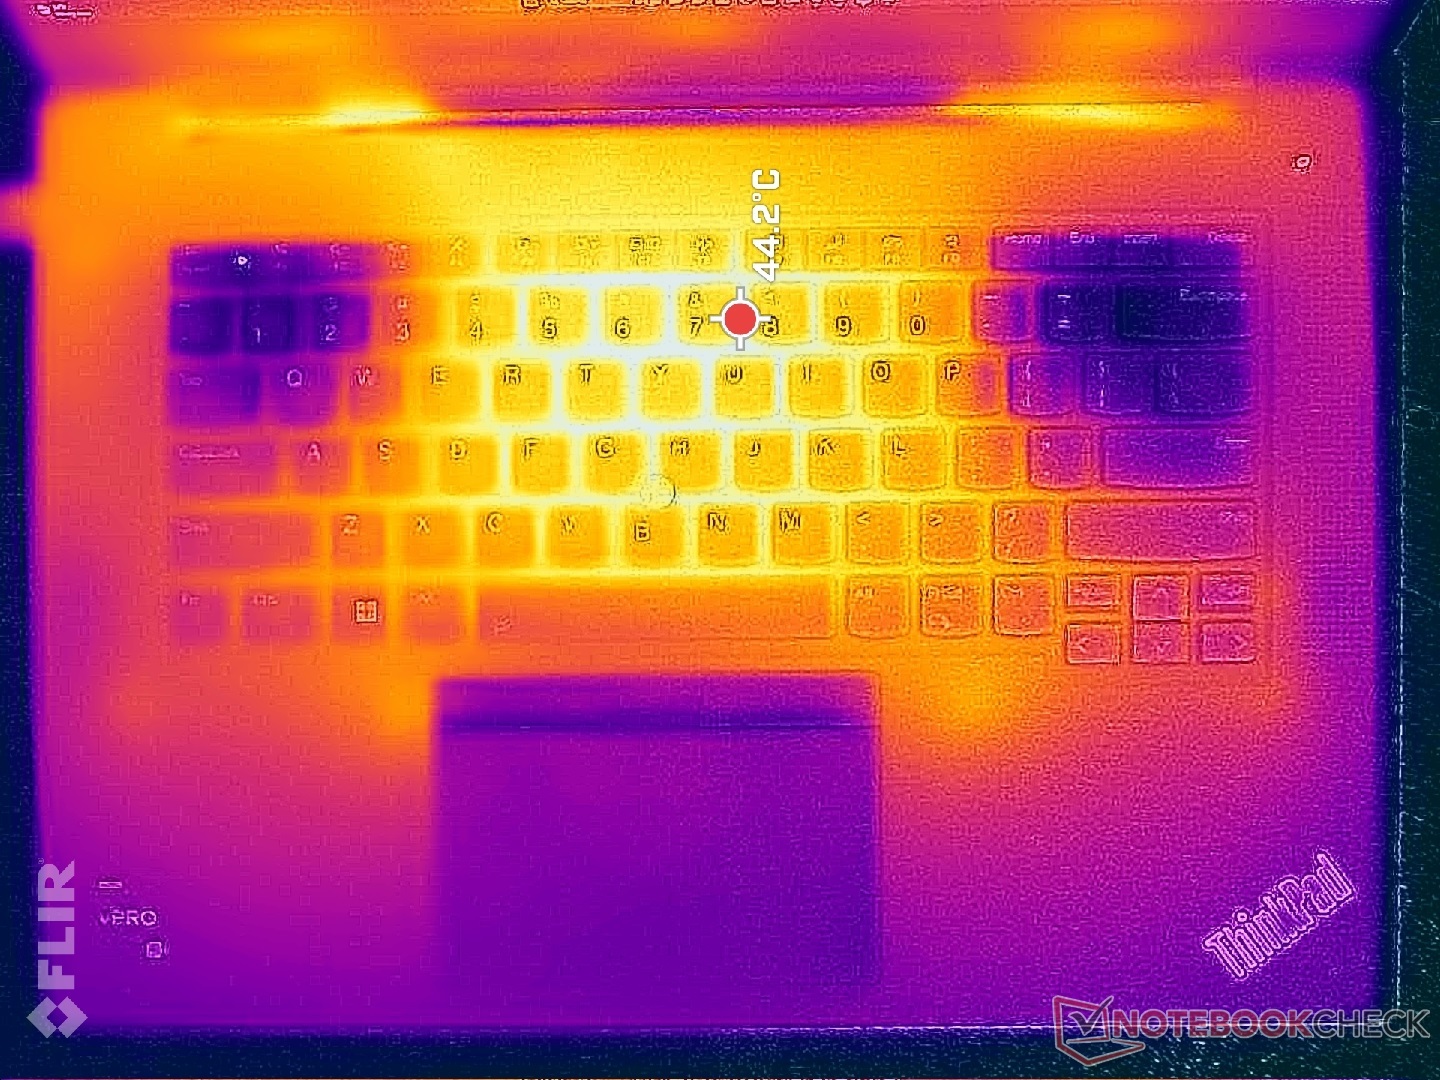
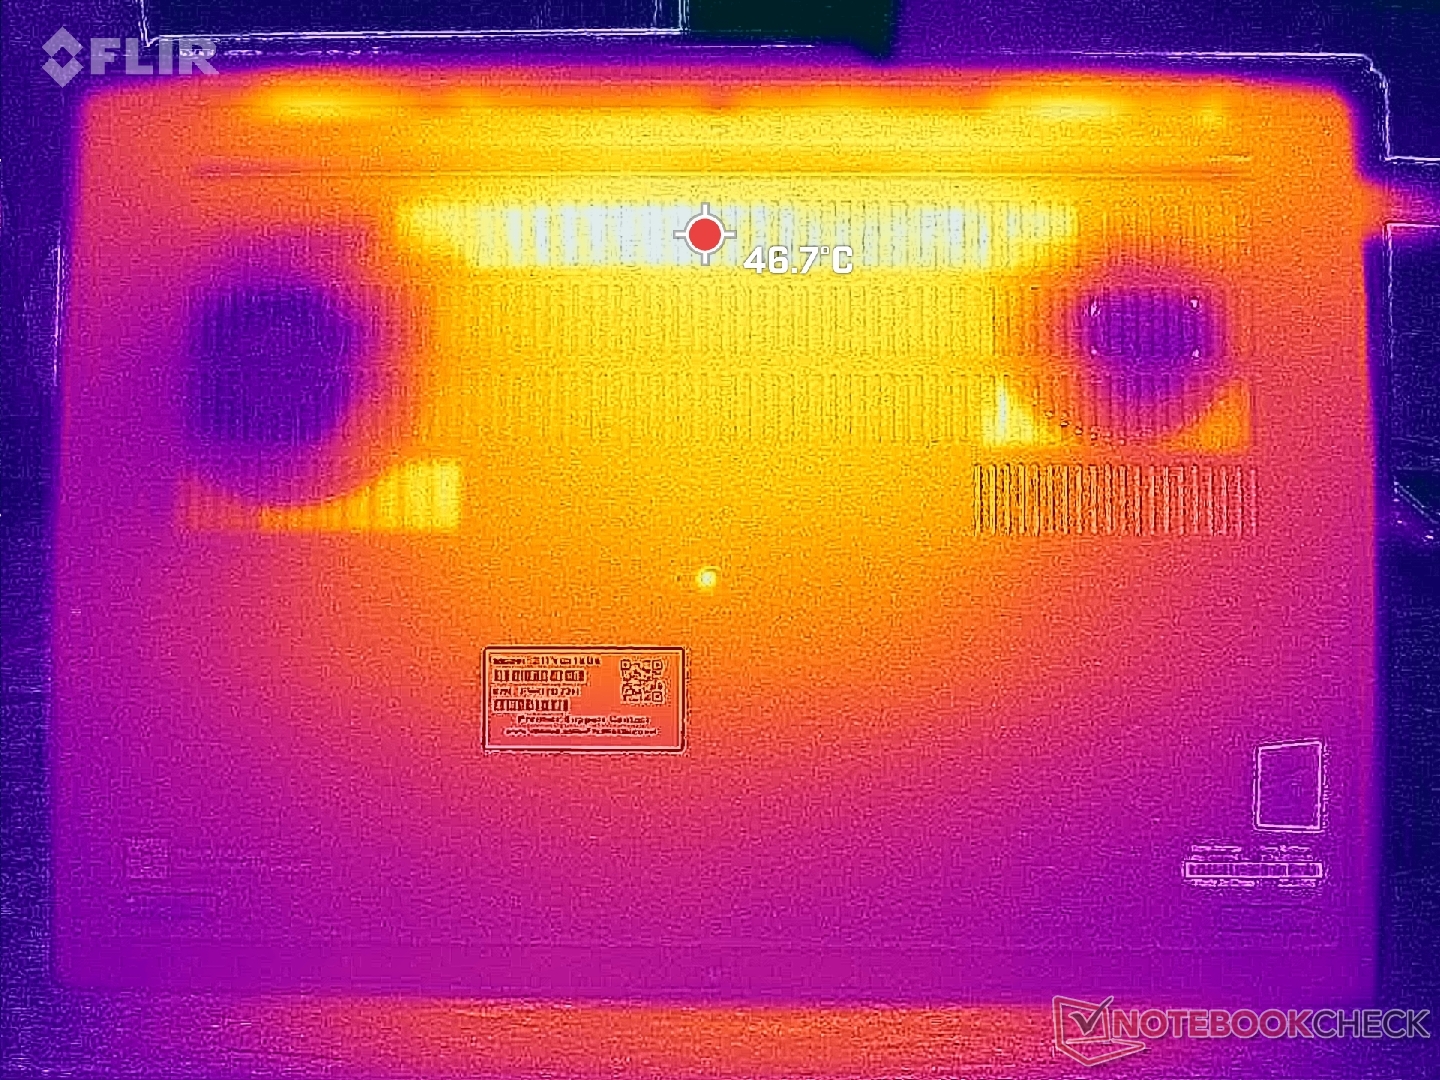
Temperatur
Yttemperaturerna kan bli ganska varma även när datorn bara går på tomgång eftersom fläktarna tenderar att vara slöa tills mycket högre belastningar introduceras. Hot spots på tangentbordet och undersidan kan bli 45 C respektive 49 C, jämfört med 51 C och 32 C på konkurrerande Dell Precision 5680.
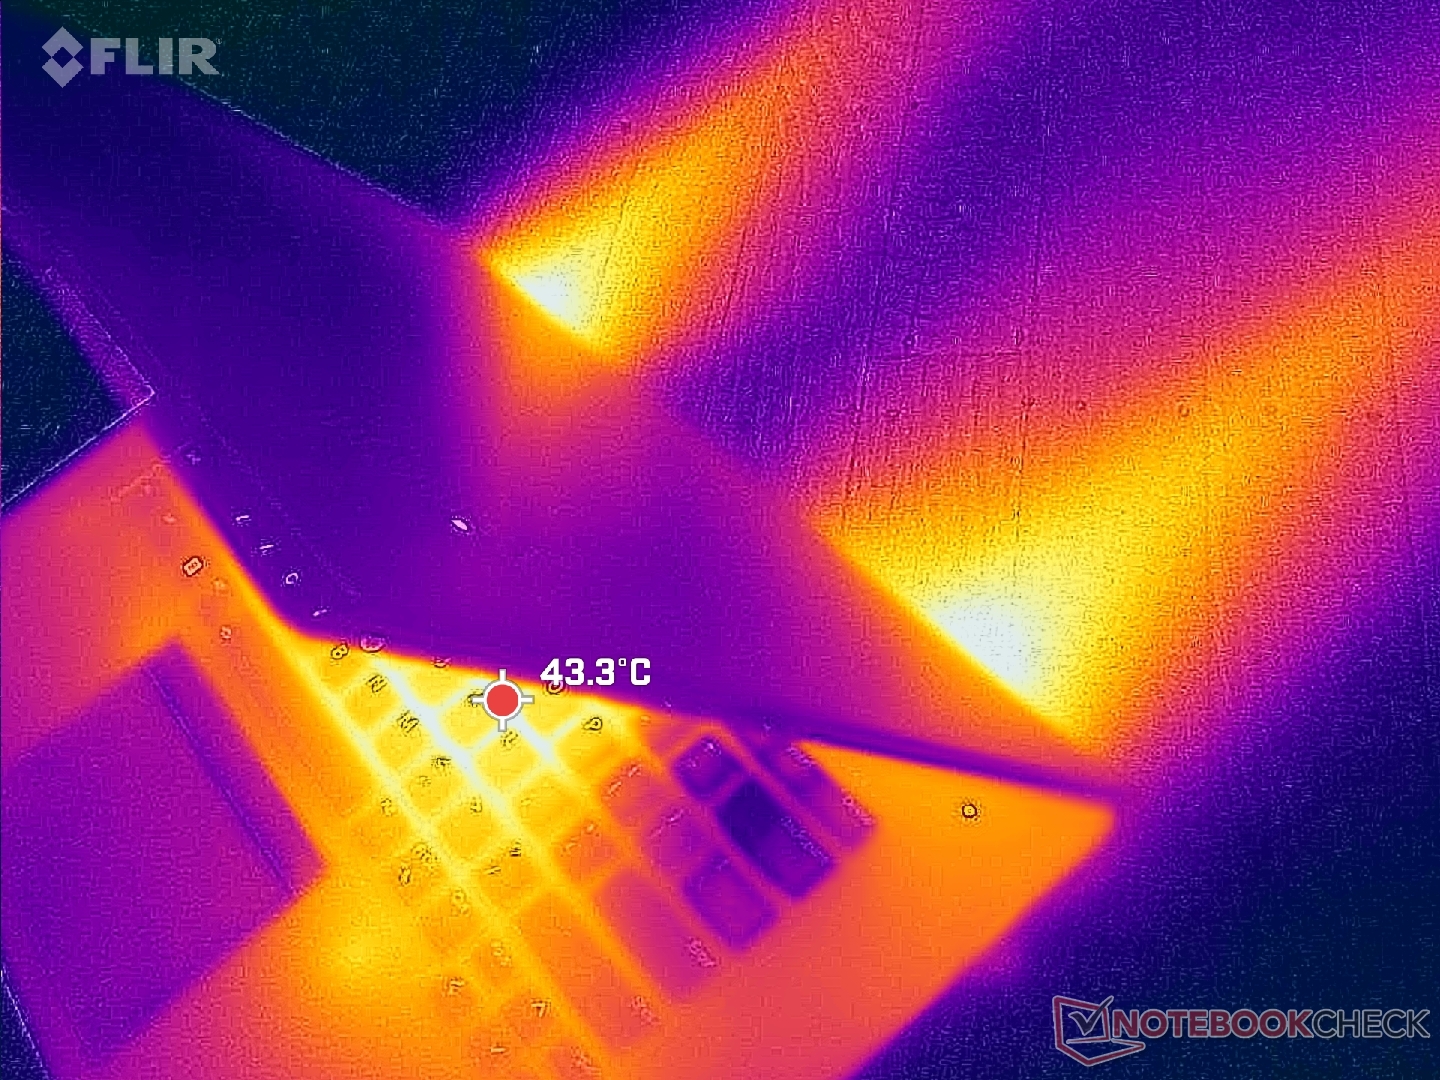
(±) Den maximala temperaturen på ovansidan är 42 °C / 108 F, jämfört med genomsnittet av 38.2 °C / 101 F , allt från 22.2 till 69.8 °C för klassen Workstation.
(-) Botten värms upp till maximalt 45.2 °C / 113 F, jämfört med genomsnittet av 41.1 °C / 106 F
(+) Vid tomgångsbruk är medeltemperaturen för ovansidan 29 °C / 84 F, jämfört med enhetsgenomsnittet på 32 °C / ### class_avg_f### F.
(±) När du spelar The Witcher 3 är medeltemperaturen för ovansidan 36.1 °C / 97 F, jämfört med enhetsgenomsnittet på 32 °C / ## #class_avg_f### F.
(+) Handledsstöden och pekplattan är kallare än hudtemperaturen med maximalt 30.8 °C / 87.4 F och är därför svala att ta på.
(-) Medeltemperaturen för handledsstödsområdet på liknande enheter var 27.8 °C / 82 F (-3 °C / -5.4 F).
| Lenovo ThinkPad P1 G6 21FV001KUS Intel Core i7-13800H, NVIDIA GeForce RTX 4080 Laptop GPU | Lenovo ThinkPad P1 G6-21FV000DGE Intel Core i9-13900H, NVIDIA RTX 2000 Ada Generation Laptop | Lenovo ThinkPad P1 G4-20Y4S0KS00 Intel Core i7-11850H, NVIDIA GeForce RTX 3070 Laptop GPU | Lenovo ThinkPad P16 G1 RTX A5500 Intel Core i9-12950HX, NVIDIA RTX A5500 Laptop GPU | Dell Precision 5000 5680 Intel Core i9-13900H, NVIDIA RTX 5000 Ada Generation Laptop | HP ZBook Fury 16 G10 Intel Core i9-13950HX, NVIDIA RTX 5000 Ada Generation Laptop | |
|---|---|---|---|---|---|---|
| Heat | 1% | -1% | -4% | 3% | -2% | |
| Maximum Upper Side * (°C) | 42 | 47.1 -12% | 51 -21% | 44.8 -7% | 50.2 -20% | 44.8 -7% |
| Maximum Bottom * (°C) | 45.2 | 56.5 -25% | 53.5 -18% | 49.8 -10% | 32 29% | 50 -11% |
| Idle Upper Side * (°C) | 33 | 28.1 15% | 28.8 13% | 30.6 7% | 37.4 -13% | 34.4 -4% |
| Idle Bottom * (°C) | 37 | 27.6 25% | 29.3 21% | 38.6 -4% | 31.2 16% | 31.8 14% |
* ... mindre är bättre
Stresstest
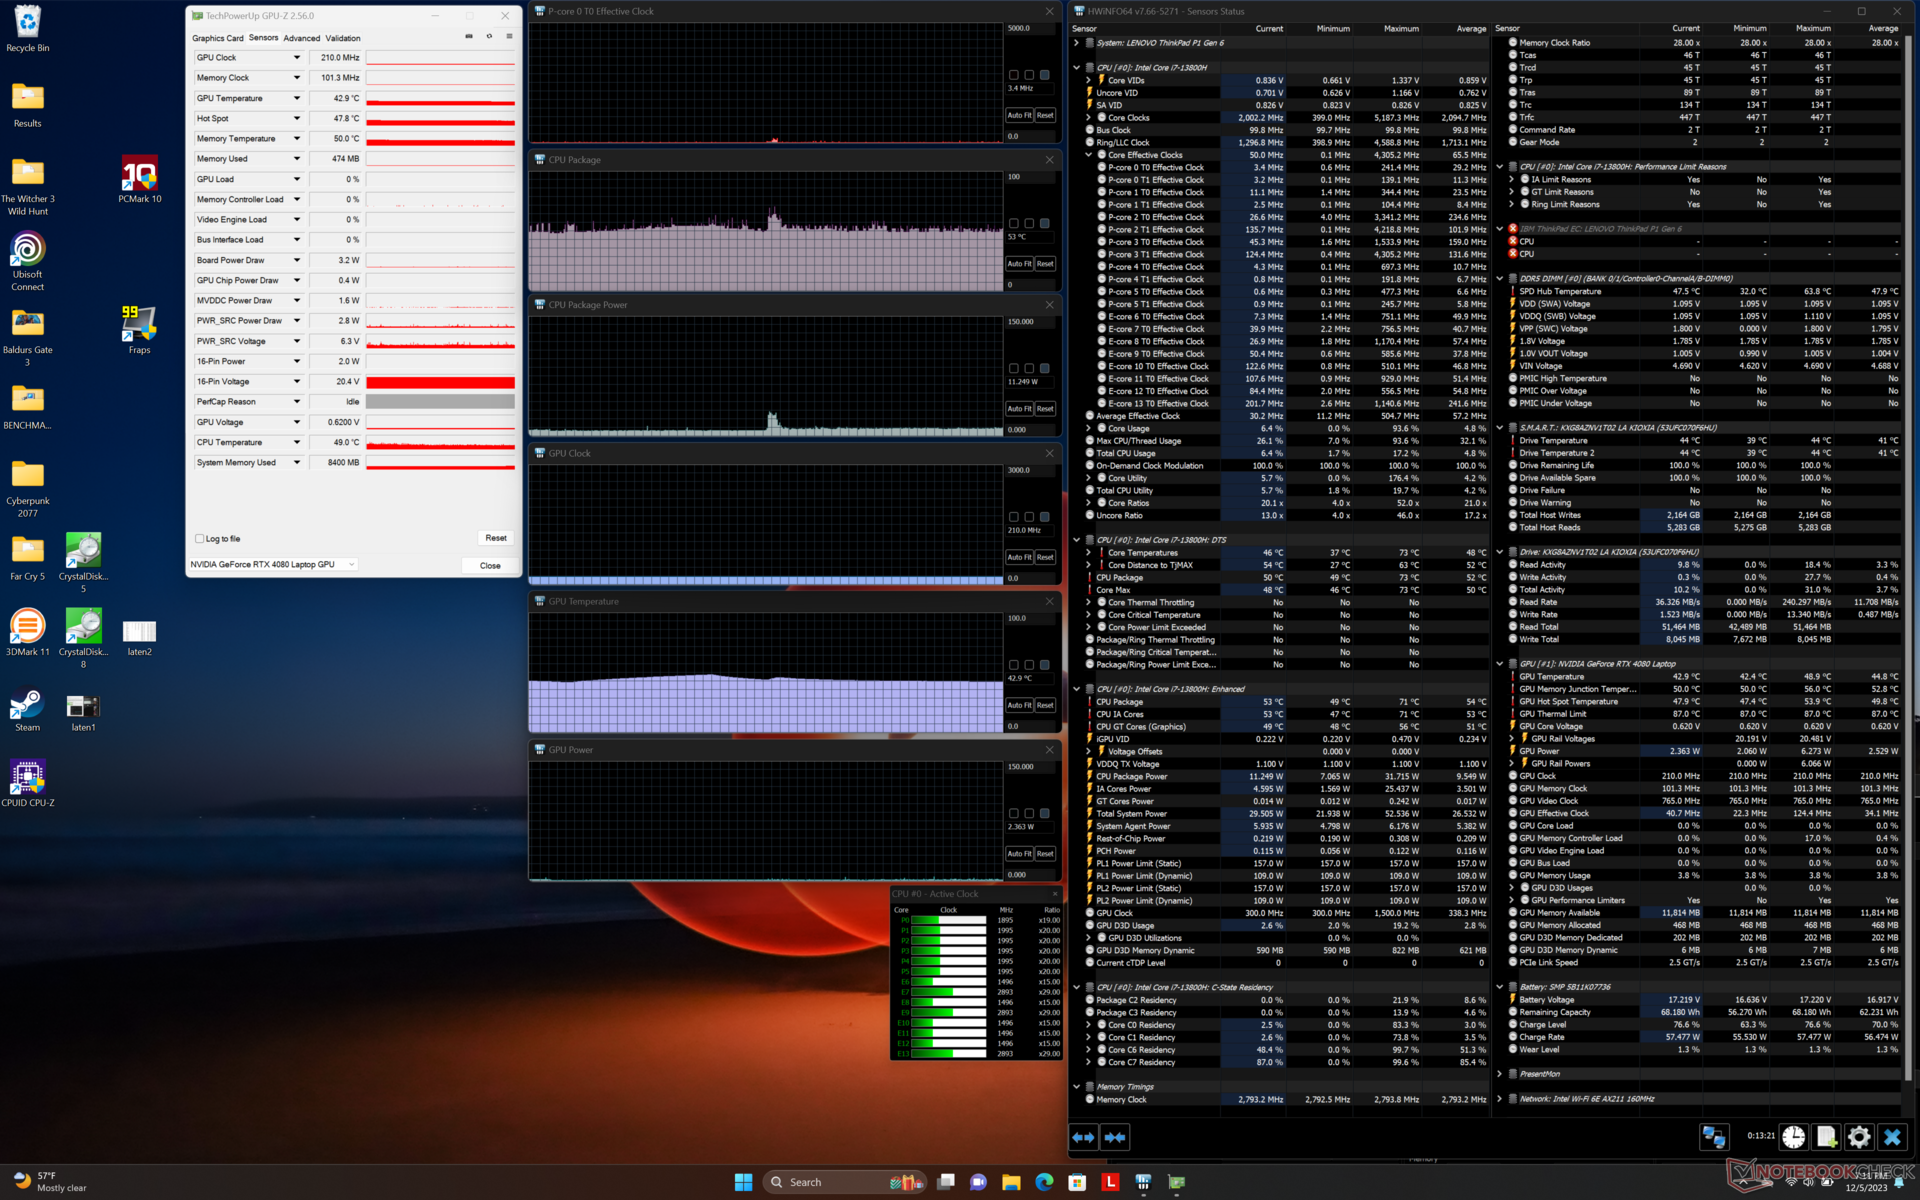
Under Prime95-belastningen ökade processorn till 4,1 GHz och 111 W under bara de första sekunderna innan den sjönk och stabiliserades vid 75 W och intervallet 2,5 till 3,1 GHz. Framför allt stabiliserades kärntemperaturen vid mycket varma 97 C, vilket tyder på att processorn pressar kylningslösningen till det yttersta för att maximera Turbo Boost-potentialen.
Grafikprestandan försämras om man kör i balanserat läge istället för prestandaläget som nämnts ovan. Till exempel skulle GPU:n stabiliseras vid 1890 MHz, 79 W och 77 C när den körs Witcher 3 i läget Prestanda jämfört med bara 1470 MHz, 52 W och 67 C i läget Balanserat.
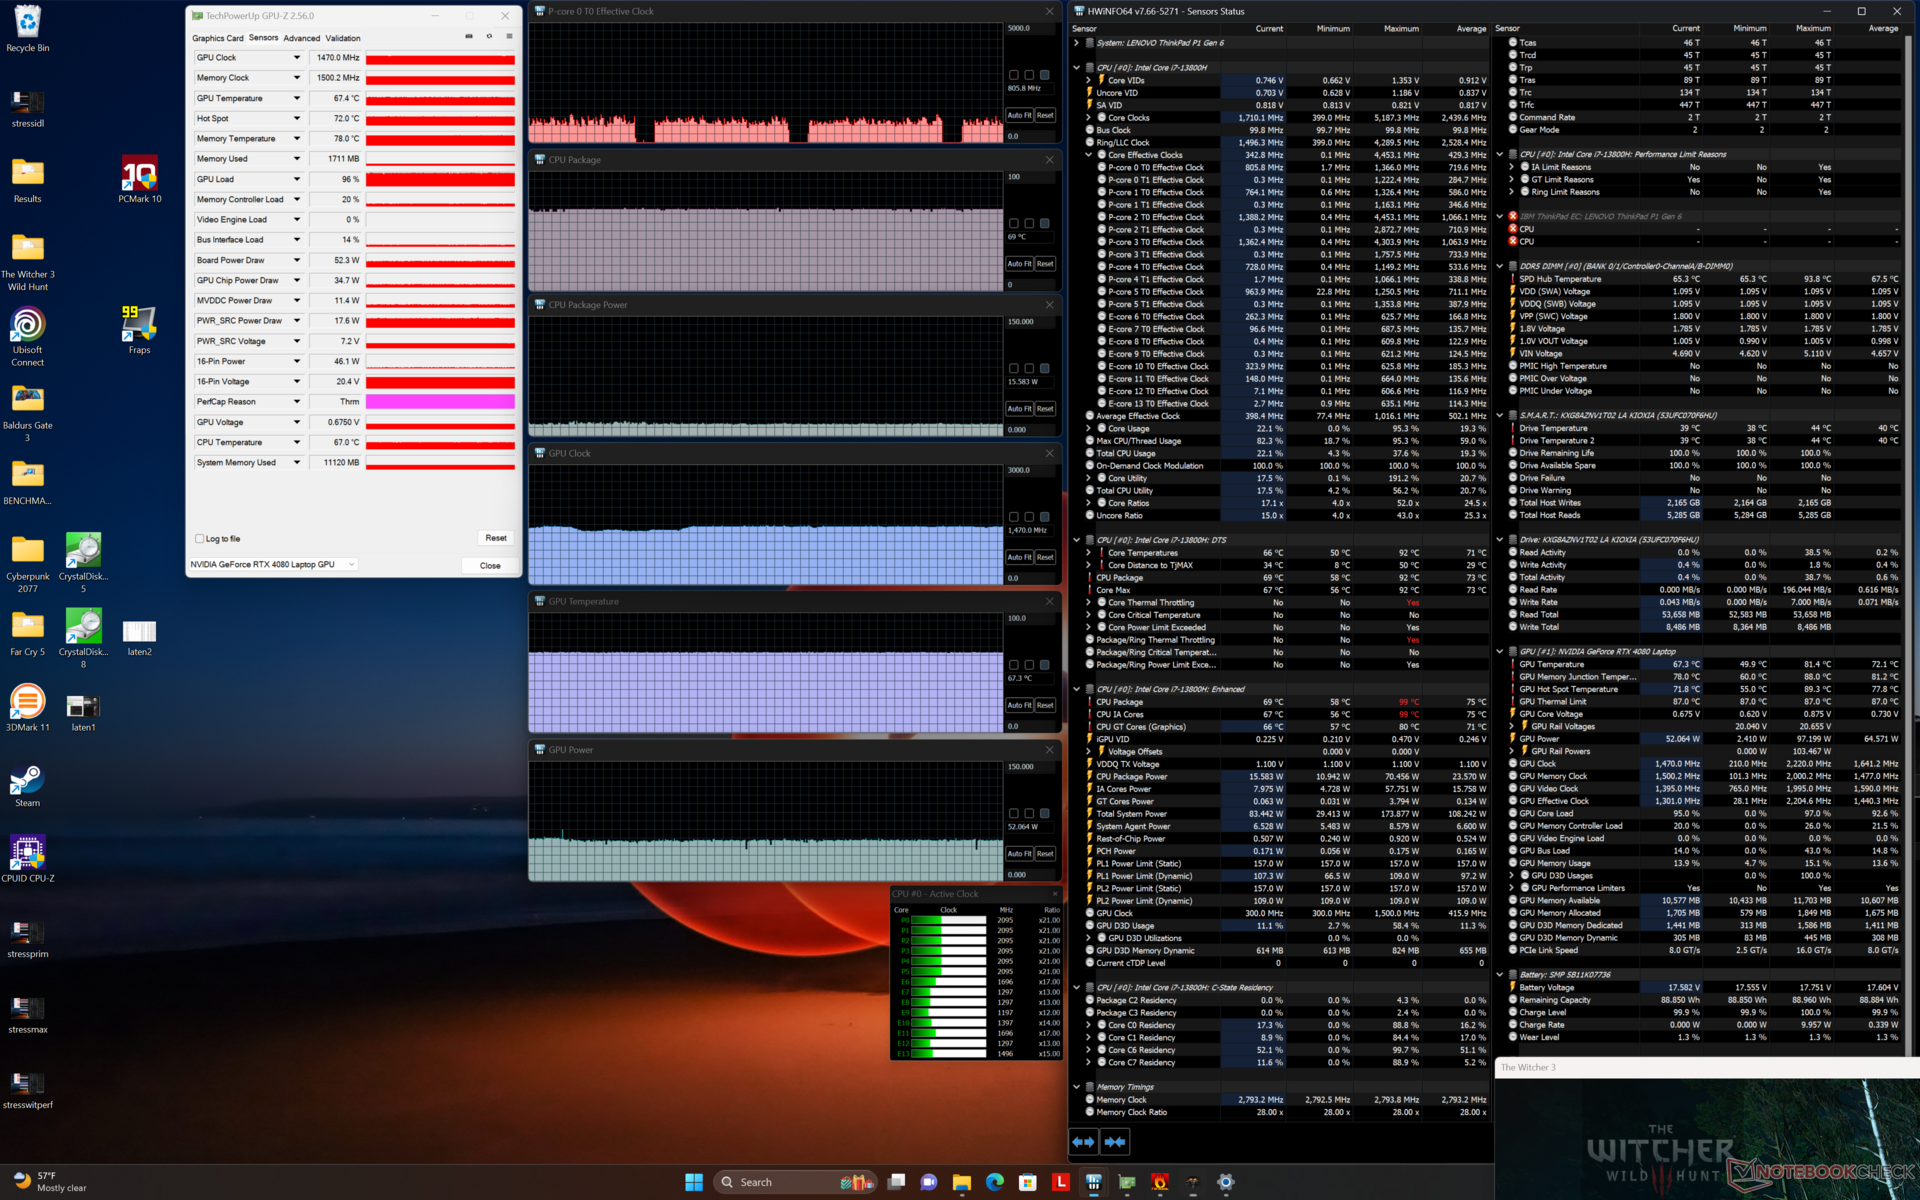
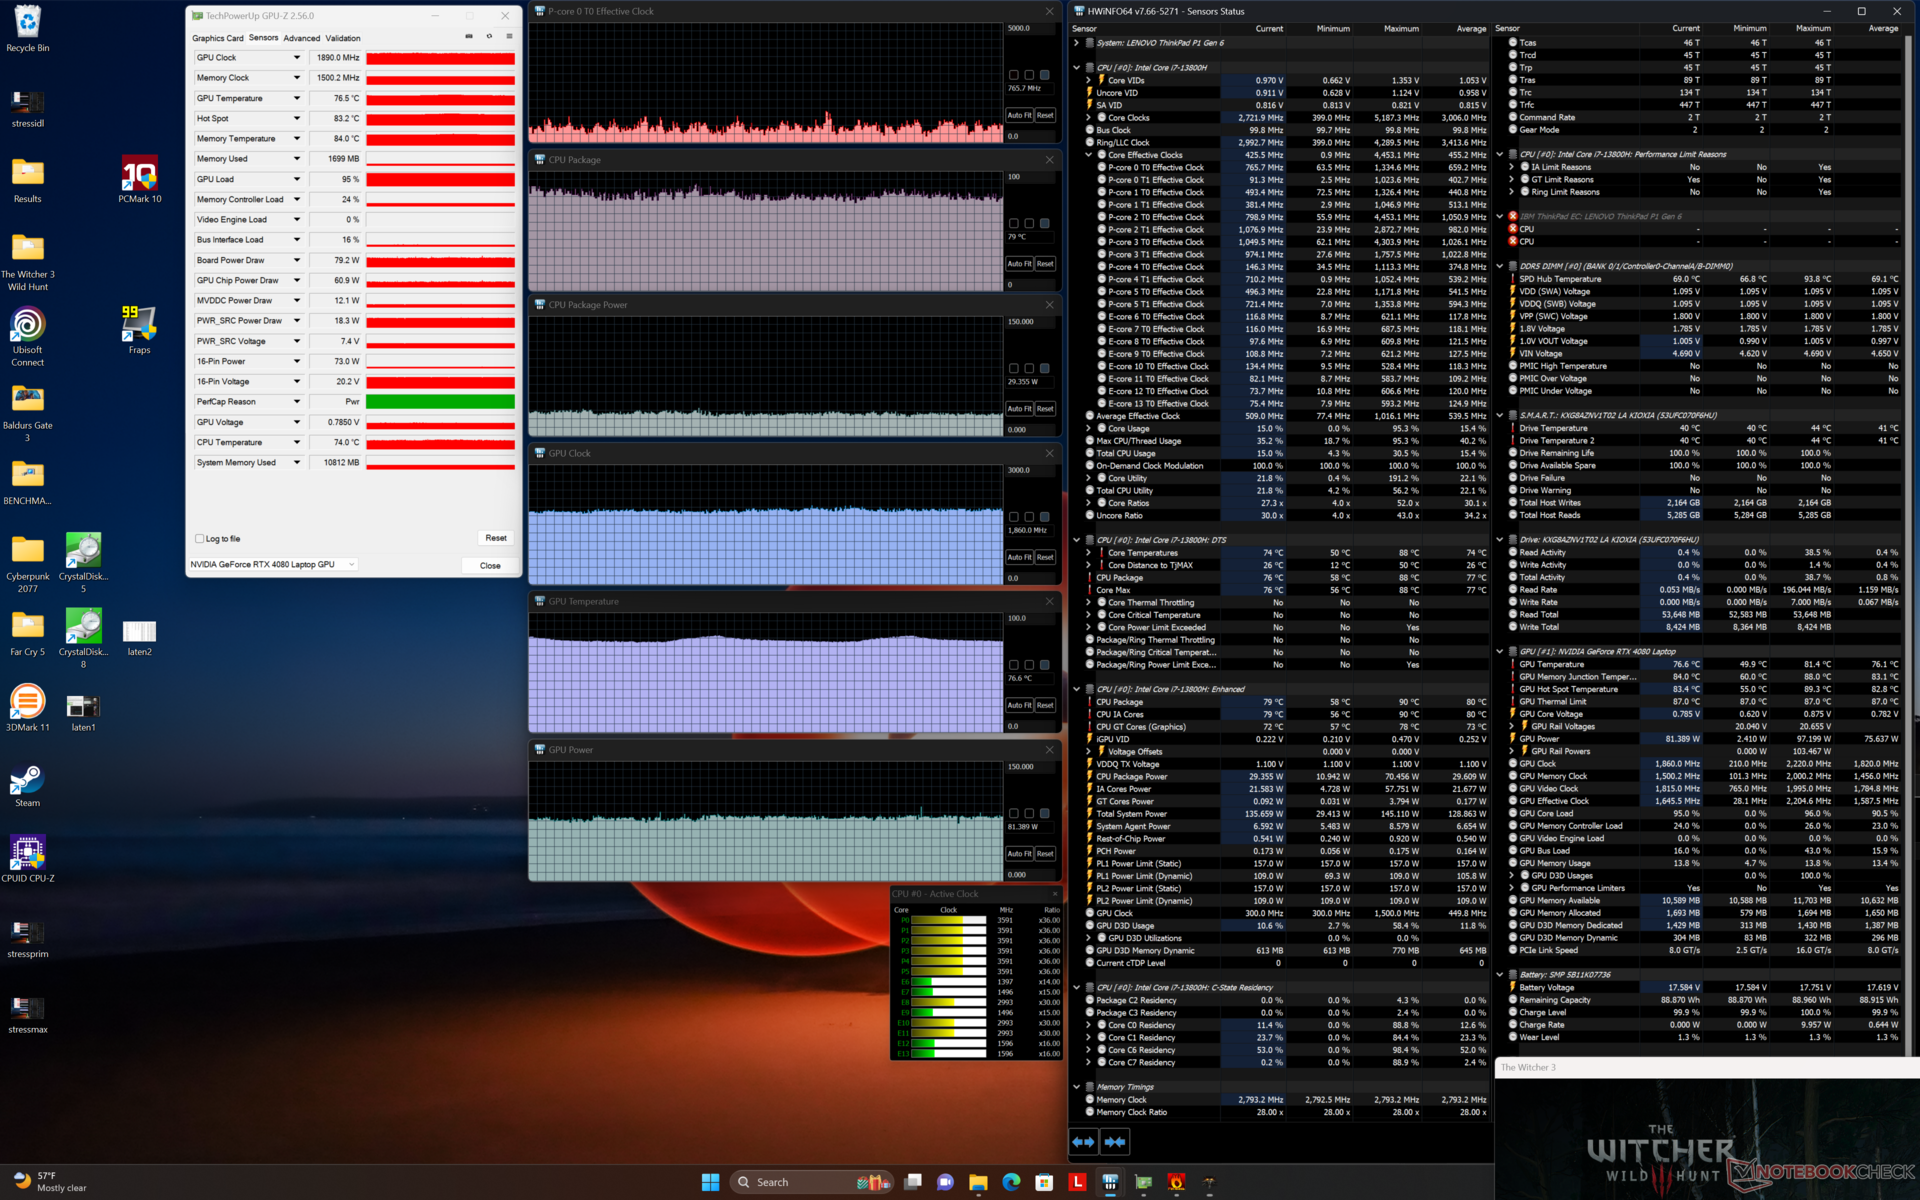
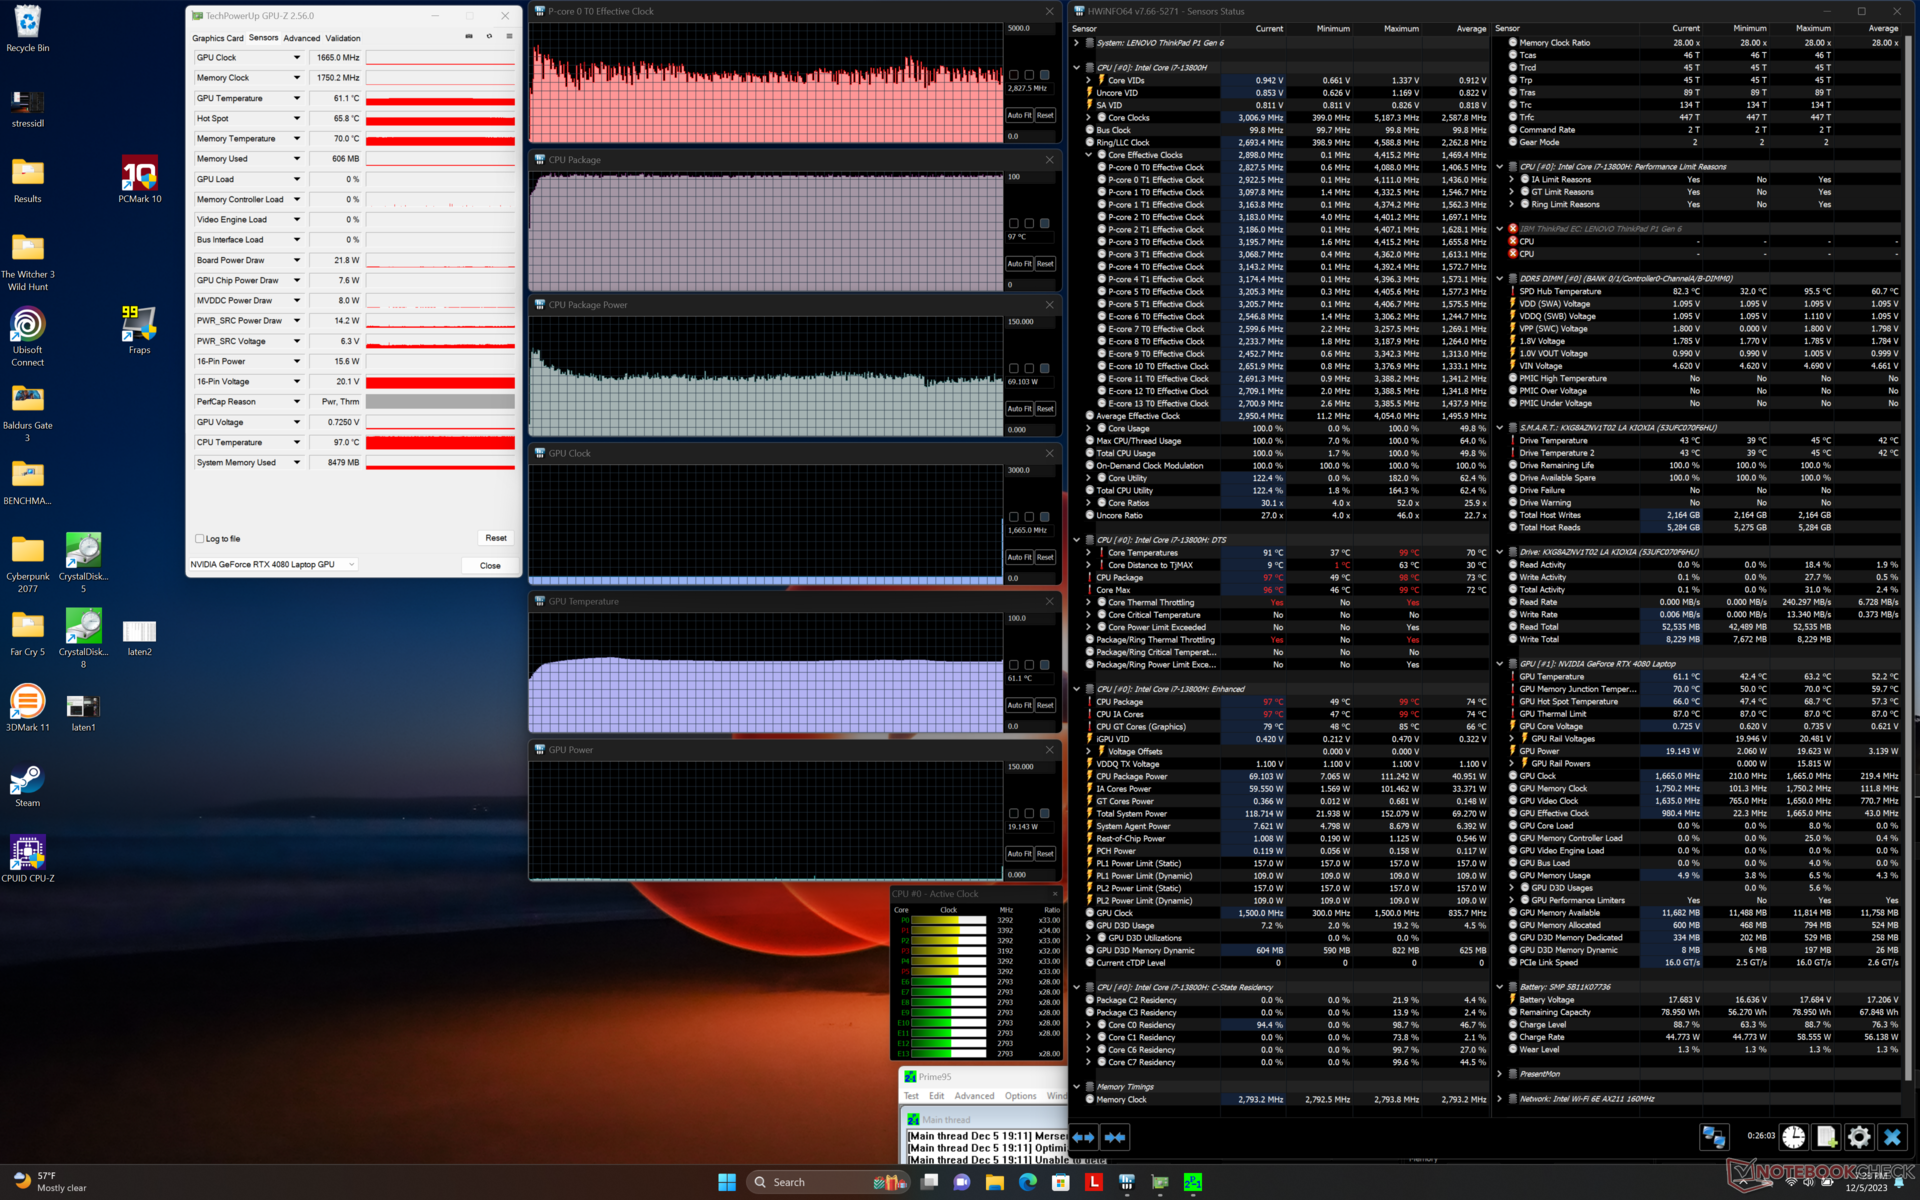
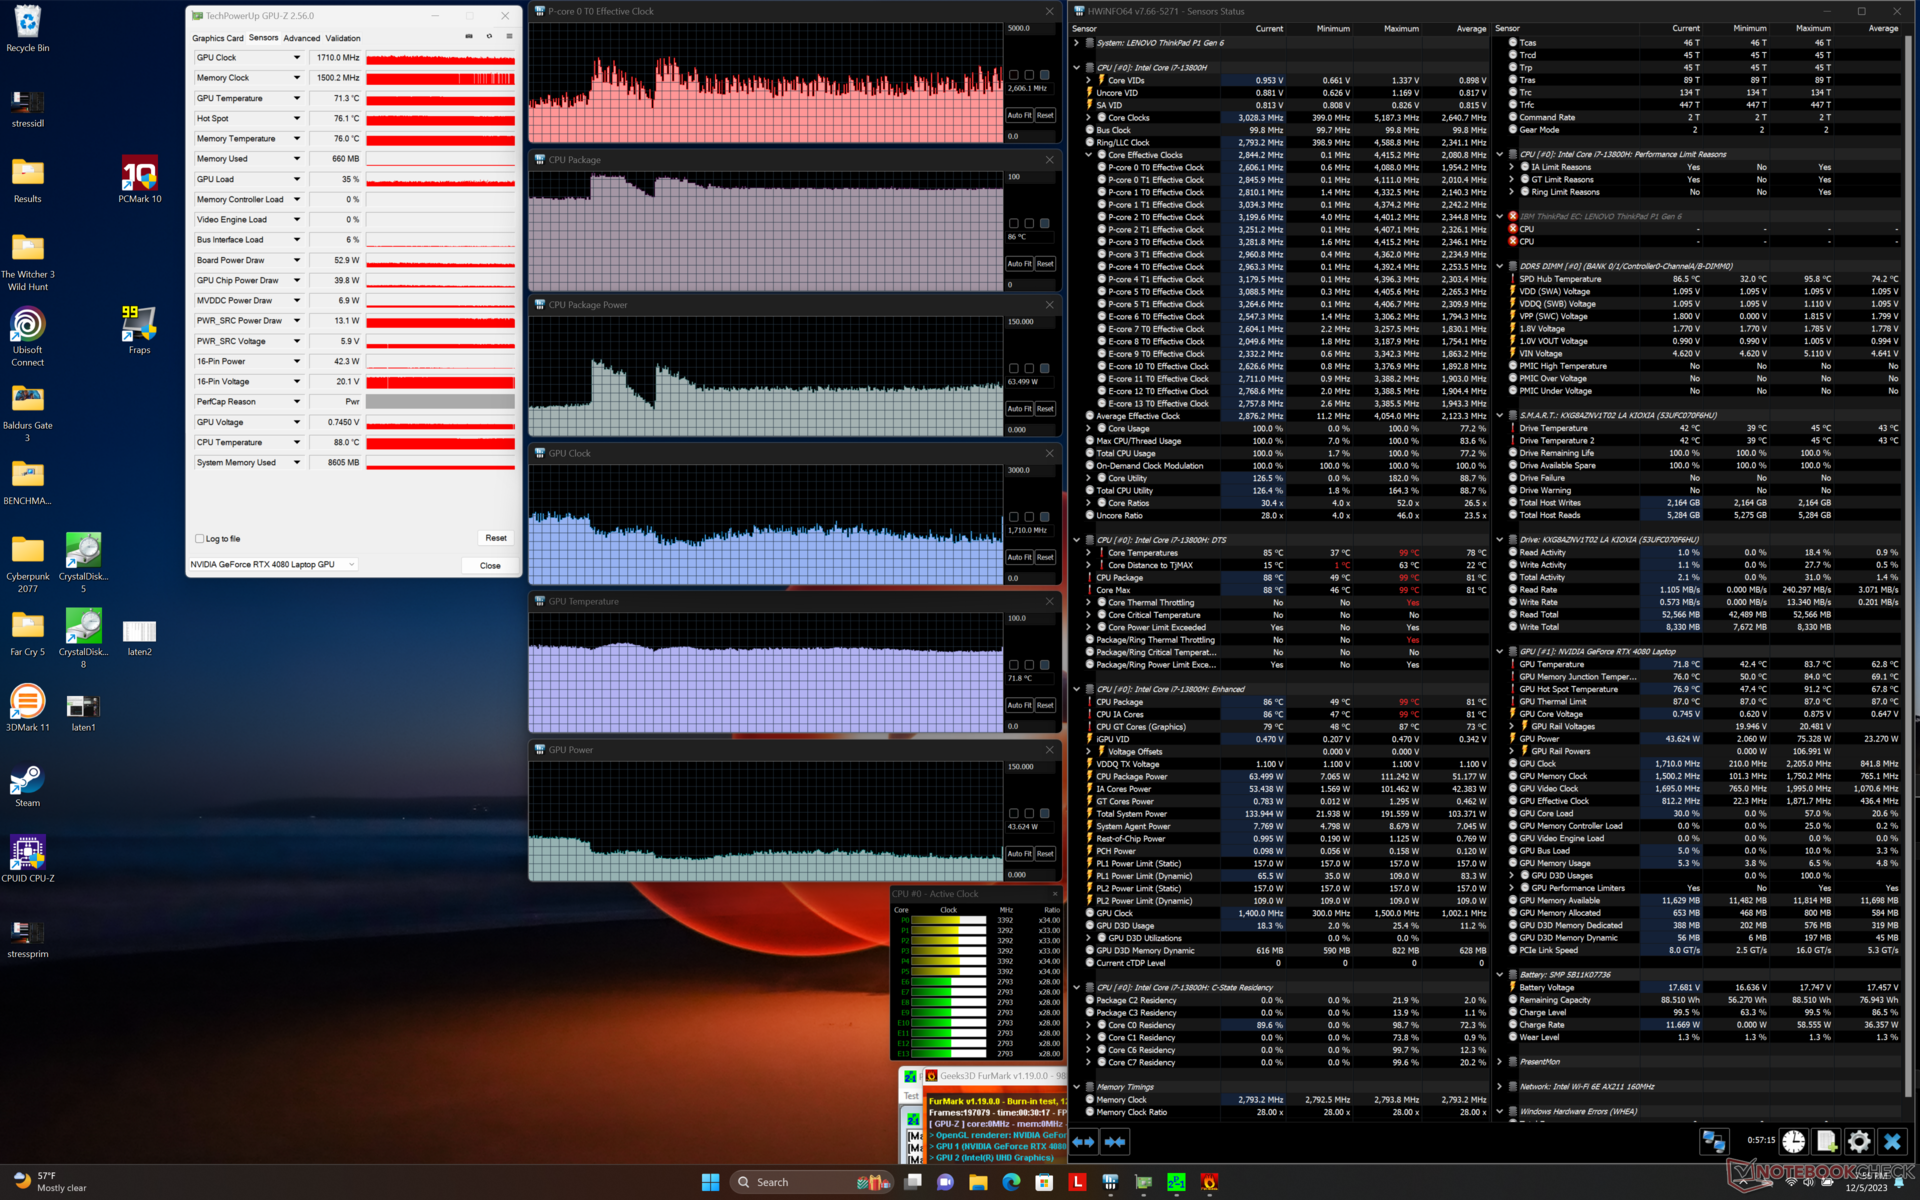
| CPU-klocka (GHz) | GPU-klocka (MHz) | Genomsnittlig CPU-temperatur (°C) | Genomsnittlig GPU-temperatur (°C) | |
| System i viloläge | -- | -- | 53 | 43 |
| Prime95 Stress | -- | -- | 2.5 - 3.1 | 97 |
| Prime95 + FurMark Stress | ~2.1 - 3.1 | ~1071 | 86 | 72 |
| Witcher 3 Stress (balanserat läge) | 0,8 | 1470 | 69 | 67 |
| Witcher 3 Stress (Performance mode) | ~0,8 | 1890 | 79 | 77 |
Högtalare
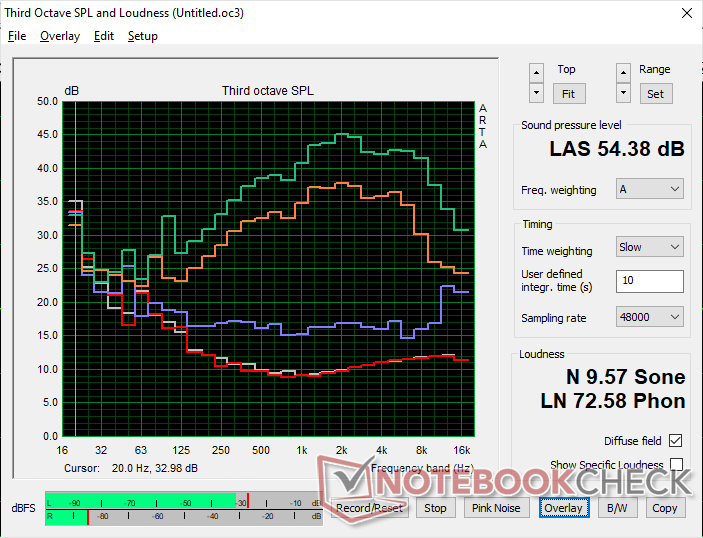
Lenovo ThinkPad P1 G6 21FV001KUS ljudanalys
(+) | högtalare kan spela relativt högt (85.2 dB)
Bas 100 - 315 Hz
(±) | reducerad bas - i genomsnitt 8% lägre än medianen
(±) | linjäriteten för basen är genomsnittlig (10.2% delta till föregående frekvens)
Mellan 400 - 2000 Hz
(±) | högre mellan - i genomsnitt 7.7% högre än median
(+) | mids är linjära (4.7% delta till föregående frekvens)
Högsta 2 - 16 kHz
(+) | balanserade toppar - endast 4.2% från medianen
(+) | toppar är linjära (6.2% delta till föregående frekvens)
Totalt 100 - 16 000 Hz
(+) | det totala ljudet är linjärt (13.2% skillnad mot median)
Jämfört med samma klass
» 23% av alla testade enheter i den här klassen var bättre, 6% liknande, 71% sämre
» Den bästa hade ett delta på 7%, genomsnittet var 17%, sämst var 35%
Jämfört med alla testade enheter
» 13% av alla testade enheter var bättre, 3% liknande, 84% sämre
» Den bästa hade ett delta på 4%, genomsnittet var 23%, sämst var 134%
Apple MacBook Pro 16 2021 M1 Pro ljudanalys
(+) | högtalare kan spela relativt högt (84.7 dB)
Bas 100 - 315 Hz
(+) | bra bas - bara 3.8% från medianen
(+) | basen är linjär (5.2% delta till föregående frekvens)
Mellan 400 - 2000 Hz
(+) | balanserad mellan - endast 1.3% från medianen
(+) | mids är linjära (2.1% delta till föregående frekvens)
Högsta 2 - 16 kHz
(+) | balanserade toppar - endast 1.9% från medianen
(+) | toppar är linjära (2.7% delta till föregående frekvens)
Totalt 100 - 16 000 Hz
(+) | det totala ljudet är linjärt (4.6% skillnad mot median)
Jämfört med samma klass
» 0% av alla testade enheter i den här klassen var bättre, 0% liknande, 100% sämre
» Den bästa hade ett delta på 5%, genomsnittet var 17%, sämst var 45%
Jämfört med alla testade enheter
» 0% av alla testade enheter var bättre, 0% liknande, 100% sämre
» Den bästa hade ett delta på 4%, genomsnittet var 23%, sämst var 134%
Energiförvaltning
Strömförbrukning
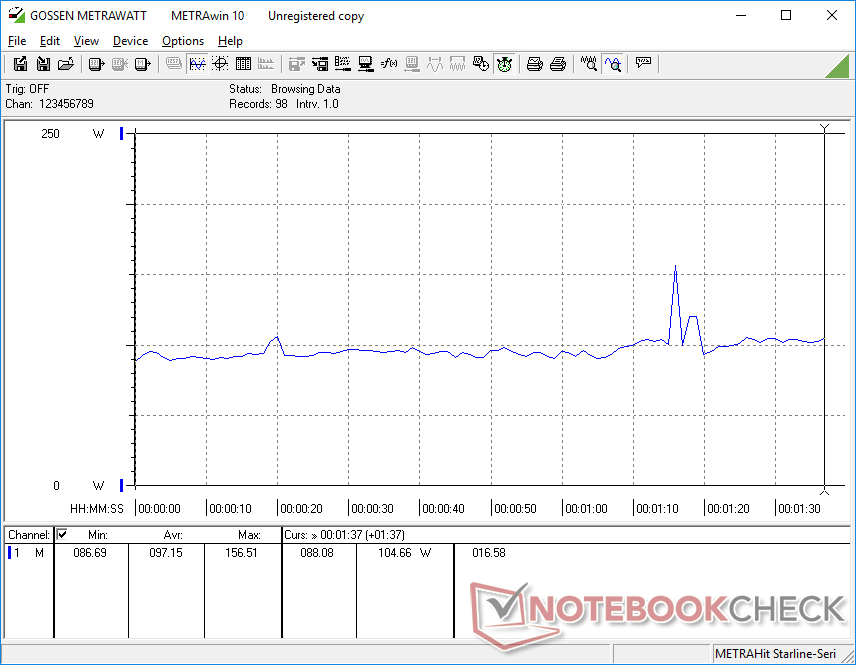
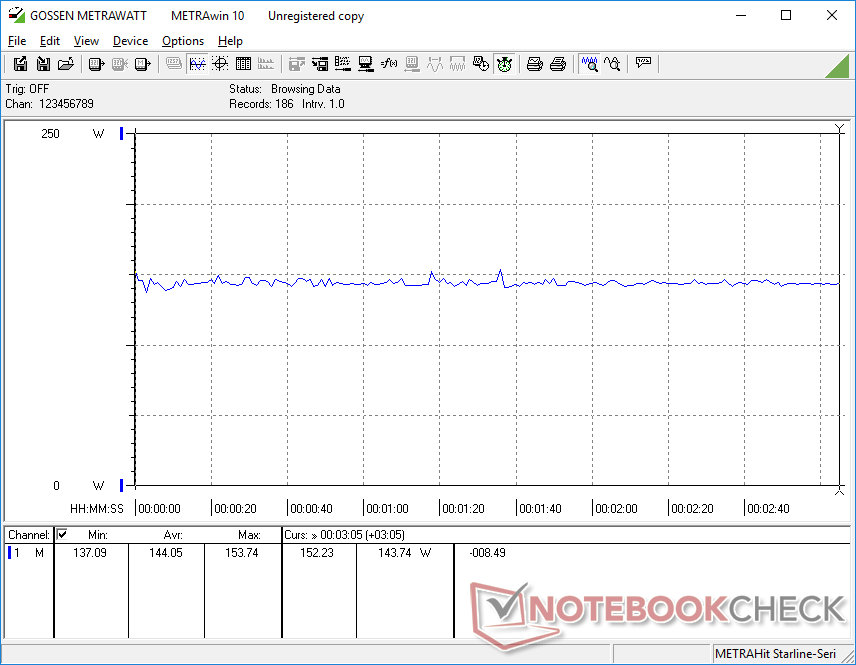
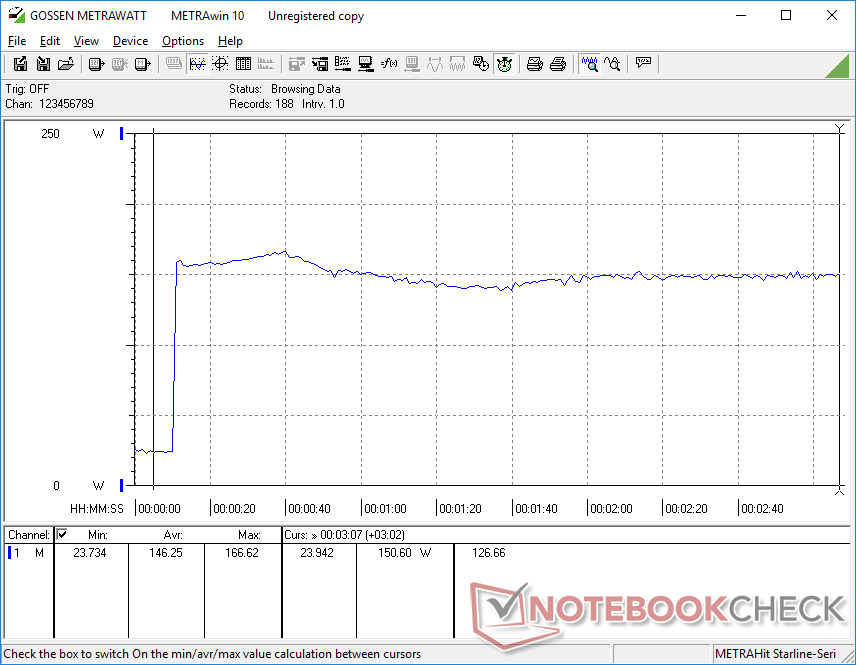
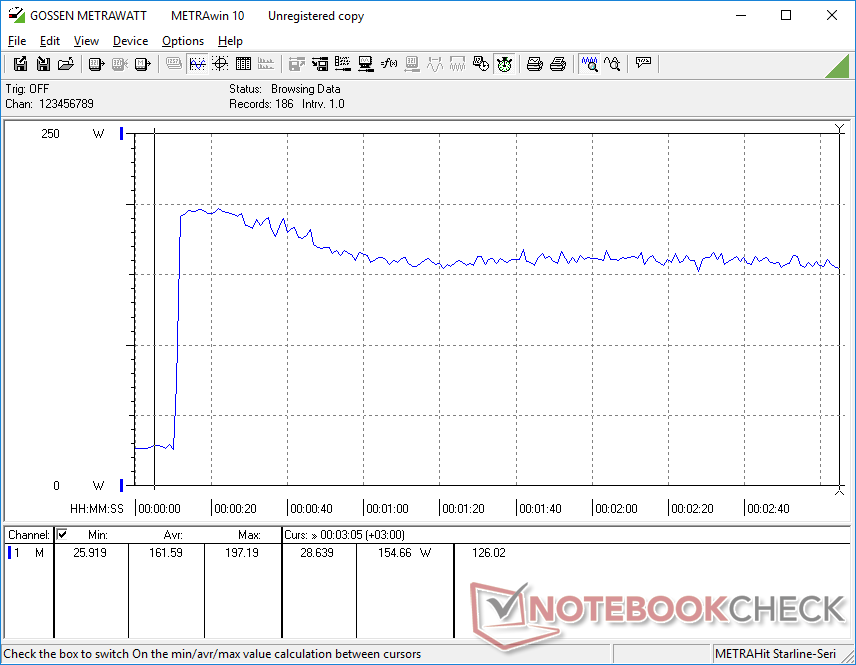
Vår testenhet är generellt mer krävande än den mindre RTX 2000-drivna konfigurationen, vilket förklarar den kortare batteritiden i nästa avsnitt. Att köra Witcher 3 för att representera krävande belastningar, skulle till exempel förbruka 37 procent mer ström.
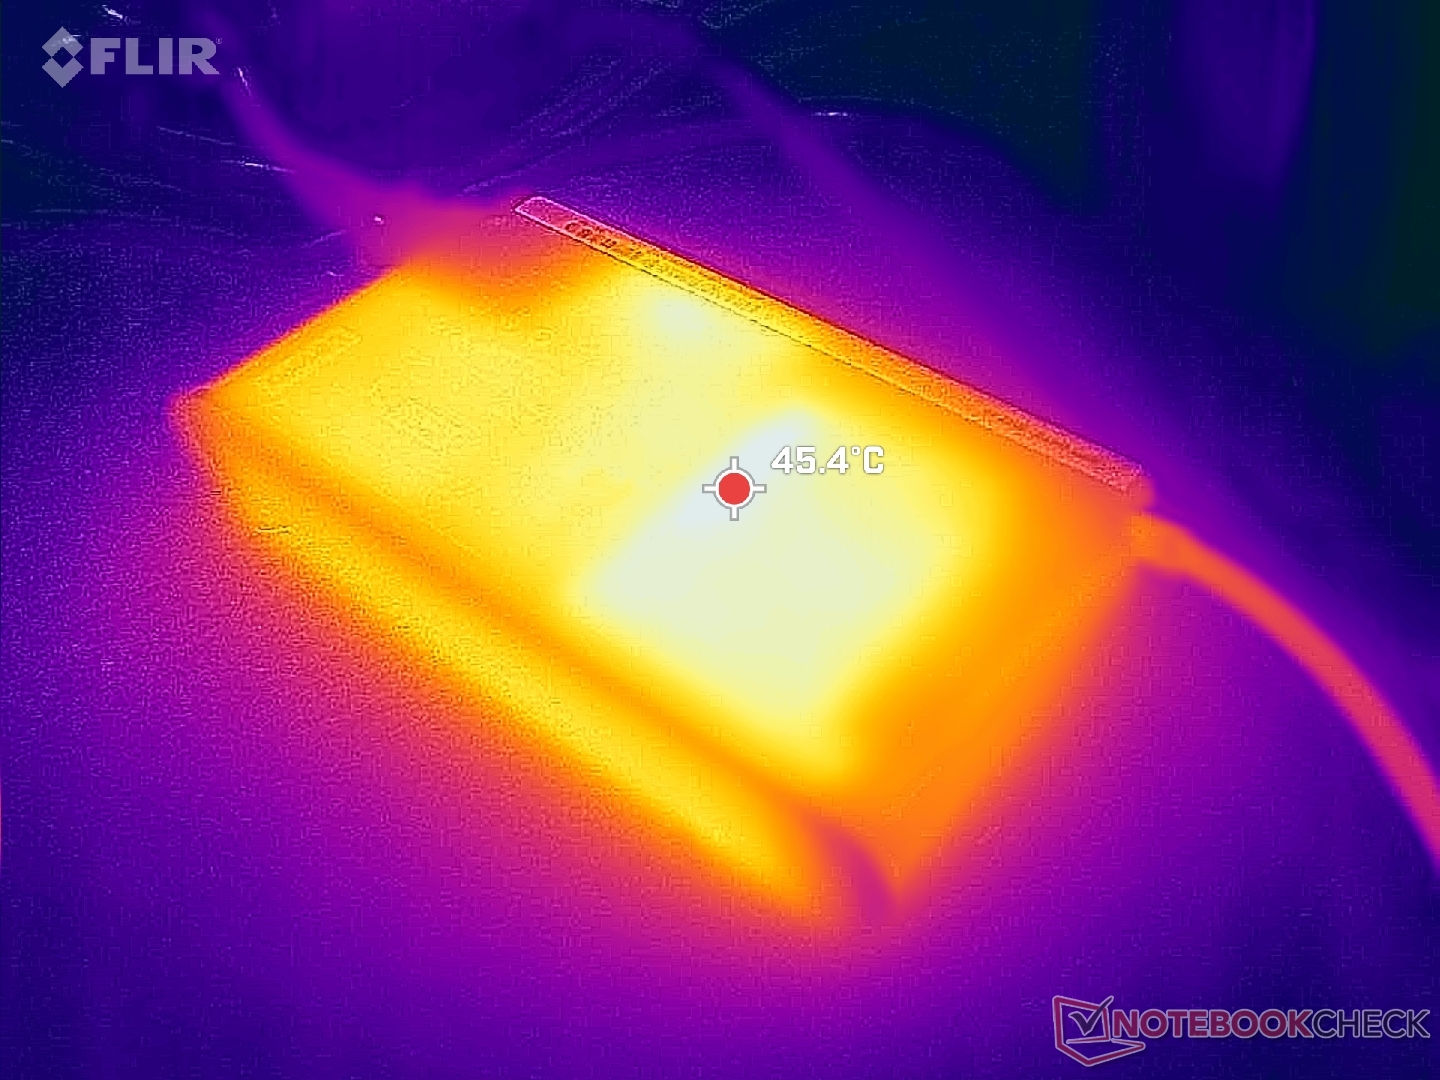
Vi kan registrera en maximal förbrukning på 197 W från den medelstora (~17 x 8,8 x 2,5 cm) 230 W AC-adaptern när CPU och GPU vardera utnyttjas till 100 procent.
| Av/Standby | |
| Låg belastning | |
| Hög belastning |
|
Förklaring:
min: | |
| Lenovo ThinkPad P1 G6 21FV001KUS i7-13800H, GeForce RTX 4080 Laptop GPU, Kioxia XG8 KXG8AZNV1T02, OLED, 3480x2400, 16" | Lenovo ThinkPad P1 G6-21FV000DGE i9-13900H, RTX 2000 Ada Generation Laptop, SK Hynix PC711 1TB HFS001TDE9X084N, IPS, 2560x1600, 16" | Lenovo ThinkPad P1 G4-20Y4S0KS00 i7-11850H, GeForce RTX 3070 Laptop GPU, Samsung PM9A1 MZVL21T0HCLR, IPS LED, 3840x2400, 16" | Lenovo ThinkPad P16 G1 RTX A5500 i9-12950HX, RTX A5500 Laptop GPU, WDC PC SN810 2TB, IPS, 3840x2400, 16" | Dell Precision 5000 5680 i9-13900H, RTX 5000 Ada Generation Laptop, 2x SK hynix PC801 HFS512GEJ9X101N RAID 0, OLED, 3840x2400, 16" | HP ZBook Fury 16 G10 i9-13950HX, RTX 5000 Ada Generation Laptop, SK hynix PC801 HFS001TEJ9X101N, IPS, 3840x2400, 16" | |
|---|---|---|---|---|---|---|
| Power Consumption | 5% | -15% | -51% | 0% | -46% | |
| Idle Minimum * (Watt) | 8 | 8.3 -4% | 8.1 -1% | 7.5 6% | 8 -0% | 15.3 -91% |
| Idle Average * (Watt) | 9.5 | 14.5 -53% | 20.2 -113% | 20.1 -112% | 10.4 -9% | 18.2 -92% |
| Idle Maximum * (Watt) | 23.7 | 15.3 35% | 21.9 8% | 40 -69% | 30.5 -29% | 28 -18% |
| Load Average * (Watt) | 97.2 | 91.8 6% | 88.2 9% | 137 -41% | 75.4 22% | 137.9 -42% |
| Witcher 3 ultra * (Watt) | 144 | 104.7 27% | 149 -3% | 208 -44% | 134 7% | 189.4 -32% |
| Load Maximum * (Watt) | 197.2 | 164.5 17% | 170.6 13% | 285.9 -45% | 175 11% | 202 -2% |
* ... mindre är bättre
Power Consumption Witcher 3 / Stresstest
Power Consumption external Monitor
Batteritid
Körtiderna är betydligt kortare än på den RTX 2000-drivna konfigurationen med över hälften på grund av den mer krävande OLED-skärmen och snabbare GPU. Vi kan bara klocka in drygt 4 timmars WLAN-surfning i verkligheten även när vi använder den balanserade strömprofilen.
| Lenovo ThinkPad P1 G6 21FV001KUS i7-13800H, GeForce RTX 4080 Laptop GPU, 90 Wh | Lenovo ThinkPad P1 G6-21FV000DGE i9-13900H, RTX 2000 Ada Generation Laptop, 90 Wh | Lenovo ThinkPad P1 G4-20Y4S0KS00 i7-11850H, GeForce RTX 3070 Laptop GPU, 90 Wh | Lenovo ThinkPad P16 G1 RTX A5500 i9-12950HX, RTX A5500 Laptop GPU, 94 Wh | Dell Precision 5000 5680 i9-13900H, RTX 5000 Ada Generation Laptop, 98 Wh | HP ZBook Fury 16 G10 i9-13950HX, RTX 5000 Ada Generation Laptop, 95 Wh | |
|---|---|---|---|---|---|---|
| Batteridrifttid | 126% | 67% | 38% | 136% | 74% | |
| WiFi v1.3 (h) | 4.2 | 9.5 126% | 7 67% | 5.8 38% | 9.9 136% | 7.3 74% |
| H.264 (h) | 11.2 | 7.2 | ||||
| Load (h) | 1.1 | 1.2 | 1.7 | |||
| Reader / Idle (h) | 17.9 |
För
Emot
Slutsats - Snabbare prestanda på bekostnad av batteritiden
ThinkPad P1 G6 erbjuder ett brett utbud av konfigurationsnivåer, inklusive IPS, OLED, Core i7, Core i9 och GeForce RTX eller RTX Ada GPU-alternativ. Baserat på vår tid med två mycket olika konfigurationer har de två processoralternativen (Core i7-13800H vs. Core i9-13900H) minimala skillnader mellan dem, vilket innebär att det skulle vara klokt att välja den billigare Core i7 och sedan spendera de extra dollarna någon annanstans.
När det gäller skärmen är det en kamp mellan 1600p IPS och 2400p OLED. Den förstnämnda erbjuder en snabbare inbyggd uppdateringsfrekvens och en ljusare maximal ljusstyrka medan den senare erbjuder pekskärm, DCI-P3-färger, minimal spökbild och HDR400-stöd. Framtida modeller kan komma att innehålla 120 Hz OLED-paneler, vilket blir allt vanligare på modeller som Asus VivoBook.
ThinkPad P1 G6 erbjuder hög prestanda per volym, men på bekostnad av batteritid, högljudda fläktar och begränsade uppgraderingar jämfört med de mindre konfigurationerna.
Att konfigurera snabbare GPU-alternativ som RTX 5000 eller vår RTX 4080 istället för RTX 2000 medför vissa nackdelar. Interna lagringsuppgraderingar blir mer begränsade, fläktljudet blir högre under belastning och batteritiden får sig en märkbar törn. Vi måste också nämna bildhastigheten vid videostreaming och det relativt låga 80 W TGP-taket. Trots detta är ThinkPad P1 G6 en av de snabbaste mobila arbetsstationerna i sin storlek och vikt. För något som är rimligt snabbare måste du överväga den klumpigare ThinkPad P16-serien istället.
Pris och tillgänglighet
Lenovo levererar nu ThinkPad P1 G6 i flera konfigurationer från $1680 USD för baskonfigurationen Core i7/RTX A1000/1200p IPS upp till $2700 och uppåt om den konfigureras med RTX 4080.
Lenovo ThinkPad P1 G6 21FV001KUS
- 12/08/2023 v7 (old)
Allen Ngo
Genomskinlighet
Valet av enheter som ska granskas görs av vår redaktion. Testprovet gavs till författaren som ett lån av tillverkaren eller återförsäljaren för denna recension. Långivaren hade inget inflytande på denna recension och inte heller fick tillverkaren en kopia av denna recension innan publiceringen. Det fanns ingen skyldighet att publicera denna recension. Som ett oberoende medieföretag är Notebookcheck inte föremål för auktoritet från tillverkare, återförsäljare eller förlag.
This is how Notebookcheck is testingEvery year, Notebookcheck independently reviews hundreds of laptops and smartphones using standardized procedures to ensure that all results are comparable. We have continuously developed our test methods for around 20 years and set industry standards in the process. In our test labs, high-quality measuring equipment is utilized by experienced technicians and editors. These tests involve a multi-stage validation process. Our complex rating system is based on hundreds of well-founded measurements and benchmarks, which maintains objectivity.
Price comparison

