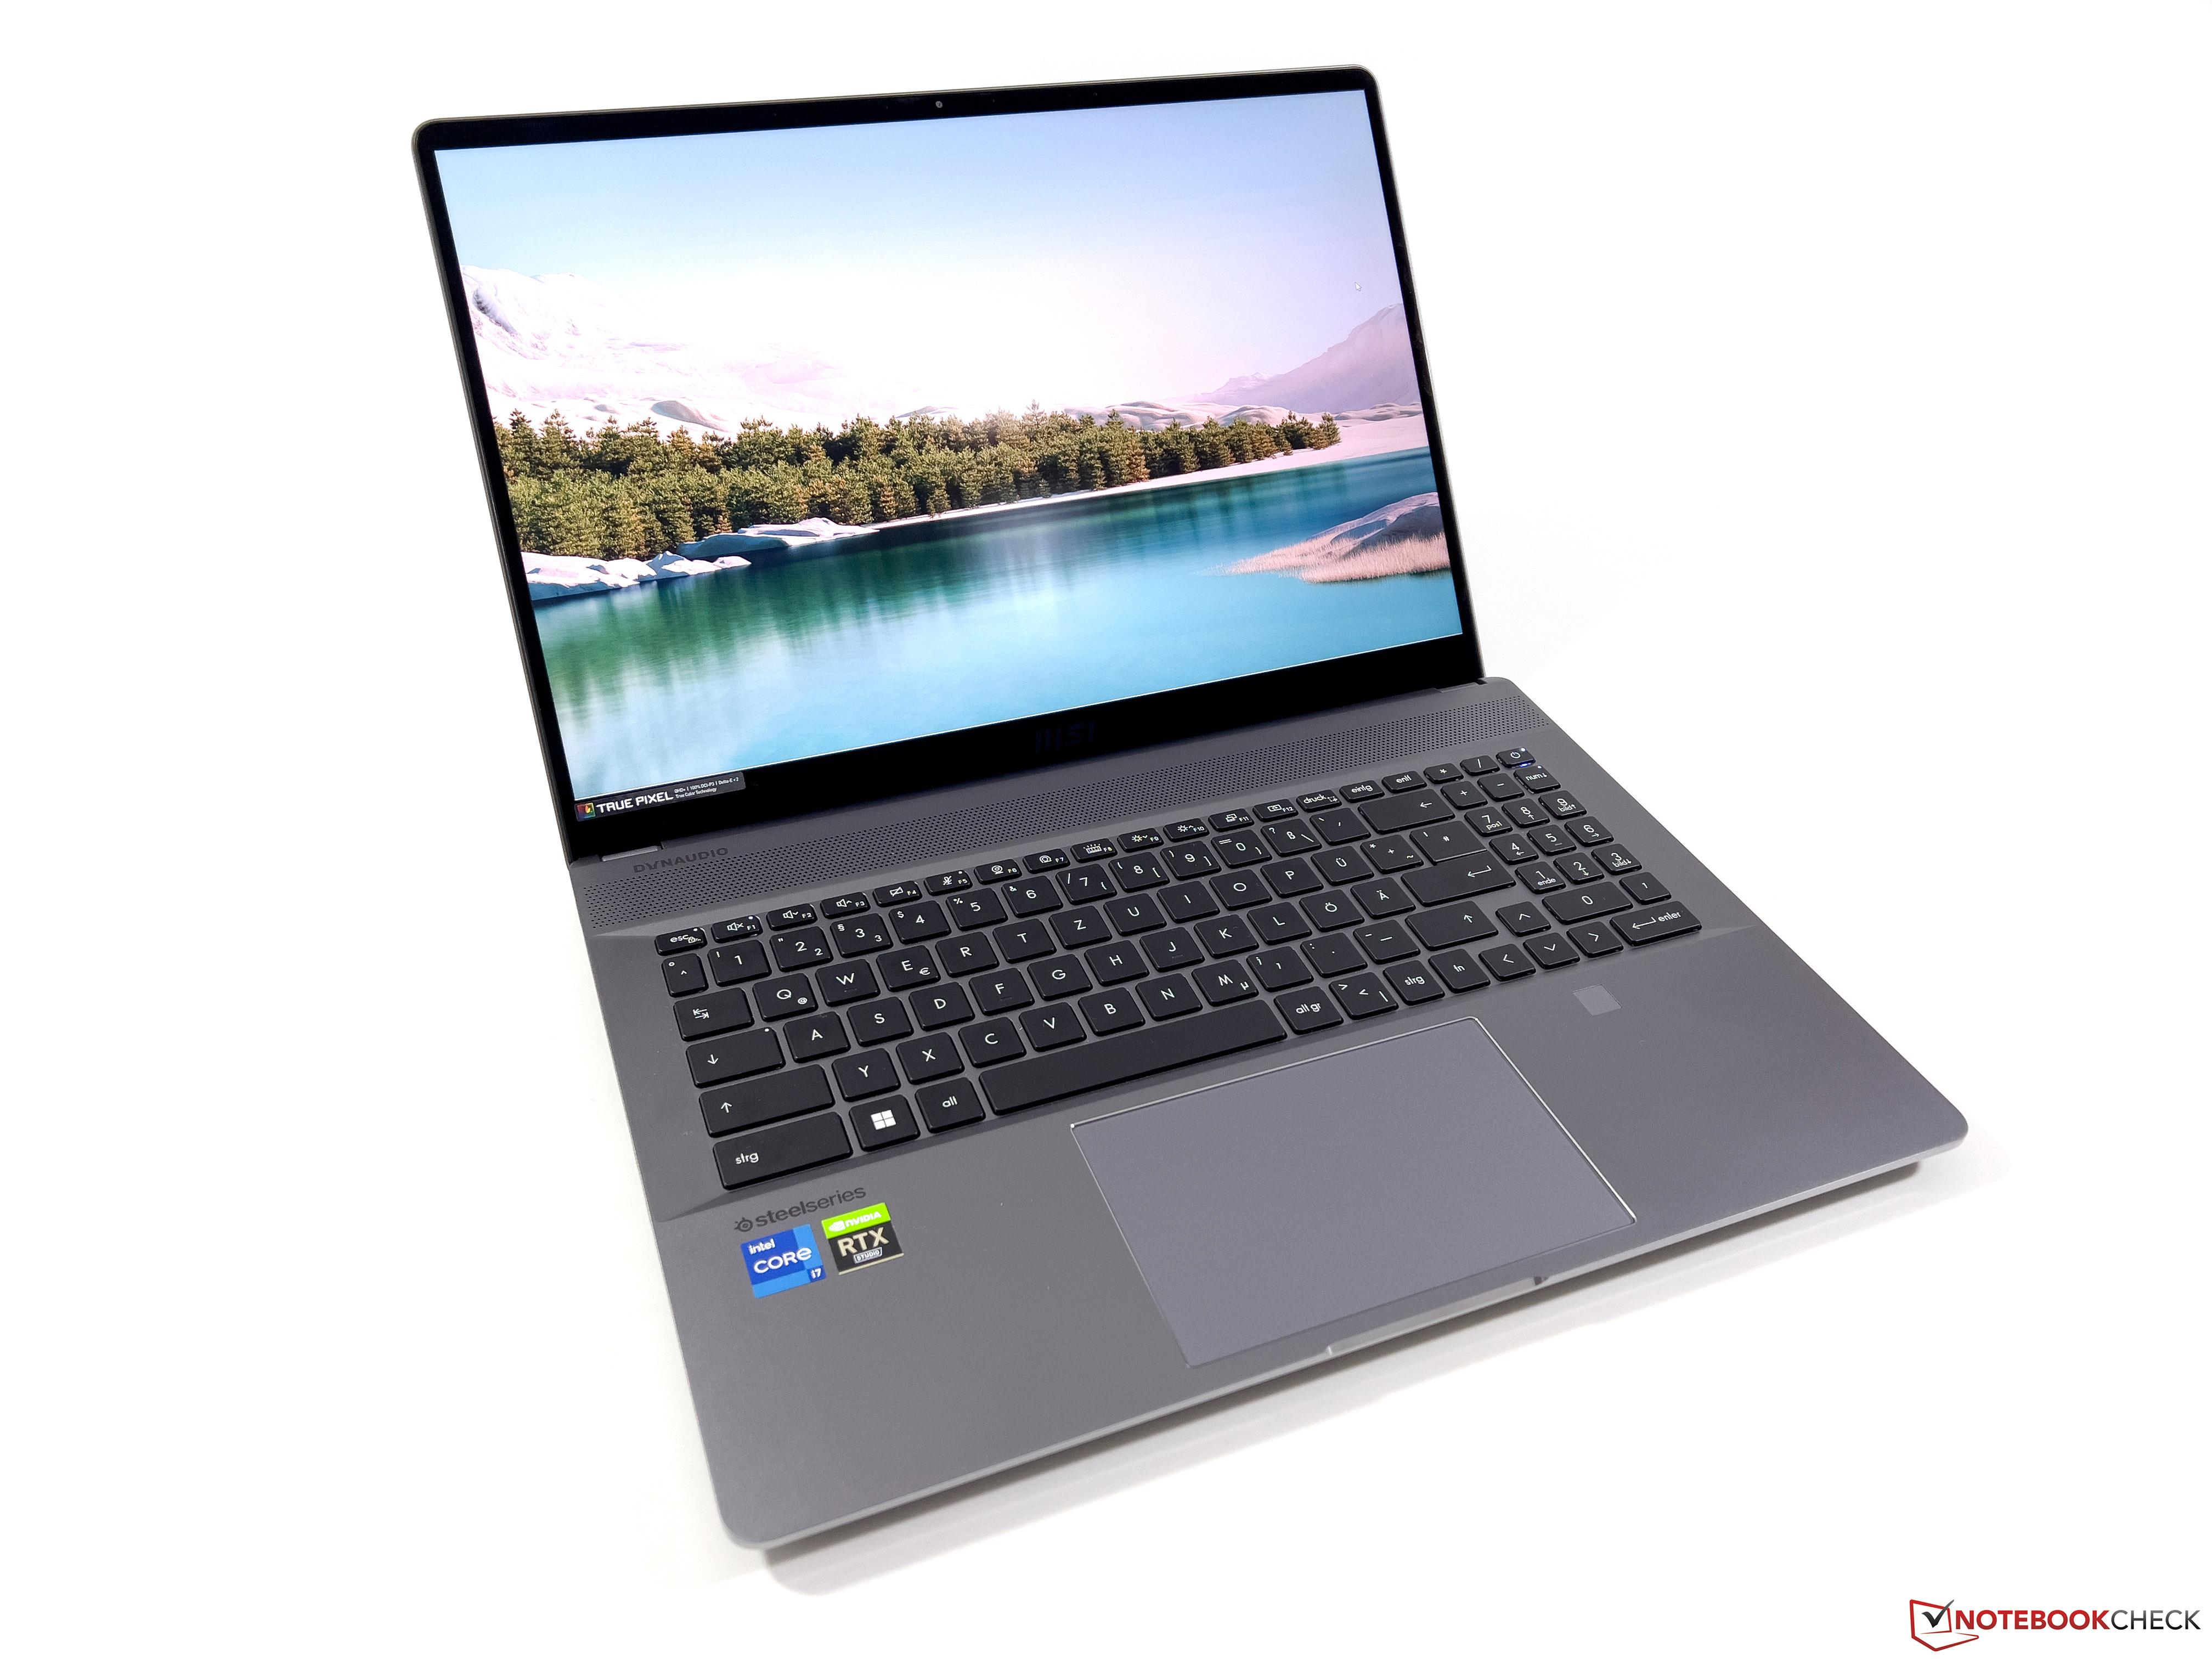
MSI CreatorPro Z16P laptop recension - Mobil arbetsstation med temperaturproblem
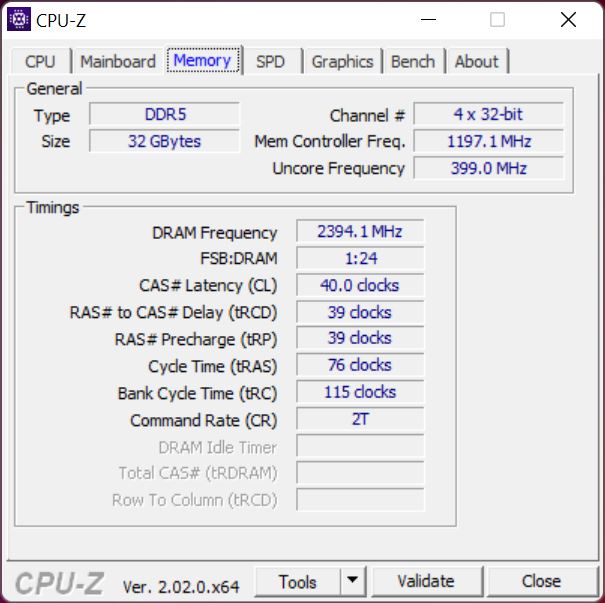
Vi har redan testatCreator Z16P från MSIutförligt, vilket är en slimmad 16-tums bärbar dator för innehållsskapare. Tillverkaren erbjuder dock även enheten med professionella GPU:er från Nvidia med namnet "CreatorPro Z16P", som vi granskar idag. Vi testar konfigurationen märkt "B12UKST-078" för 3 499 euro (~3 620 dollar), som kombinerar en Intel Core i7-12700HmedNvidia RTX A3000. Dessutom finns det 32 GB RAM och en stor, 1 TB stor SSD samt en 16-tums IPS-skärm med WQHD-upplösning och 165 Hz uppdateringsfrekvens. I det här testet koncentrerar vi oss främst på prestandan. Du kan hitta detaljerad information om höljet, utrustningen, inmatningsenheterna och högtalarna i vårt test av Creator Z16P:
Potentiella konkurrenter i jämförelse
Gradering | Datum | Modell | Vikt | Höjd | Storlek | Upplösning | Pris |
|---|---|---|---|---|---|---|---|
| 84.3 % v7 (old) | 11/2022 | MSI CreatorPro Z16P B12UKST i7-12700H, RTX A3000 Laptop GPU | 2.4 kg | 19 mm | 16.00" | 2560x1600 | |
| 90.1 % v7 (old) | 11/2022 | HP ZBook Studio 16 G9 62U04EA i7-12800H, RTX A2000 Laptop GPU | 1.8 kg | 19 mm | 16.00" | 3840x2400 | |
| 89.8 % v7 (old) | 11/2021 | Lenovo ThinkPad P1 G4-20Y4S0KS00 i7-11850H, GeForce RTX 3070 Laptop GPU | 2 kg | 17.7 mm | 16.00" | 3840x2400 | |
| 88.3 % v7 (old) | 12/2021 | Dell Precision 5000 5560 i7-11850H, RTX A2000 Laptop GPU | 2 kg | 18 mm | 15.60" | 3840x2400 | |
| 83.7 % v7 (old) | 06/2022 | MSI Creator Z16P B12UHST i9-12900H, GeForce RTX 3080 Ti Laptop GPU | 2.4 kg | 20.4 mm | 16.00" | 2560x1600 |
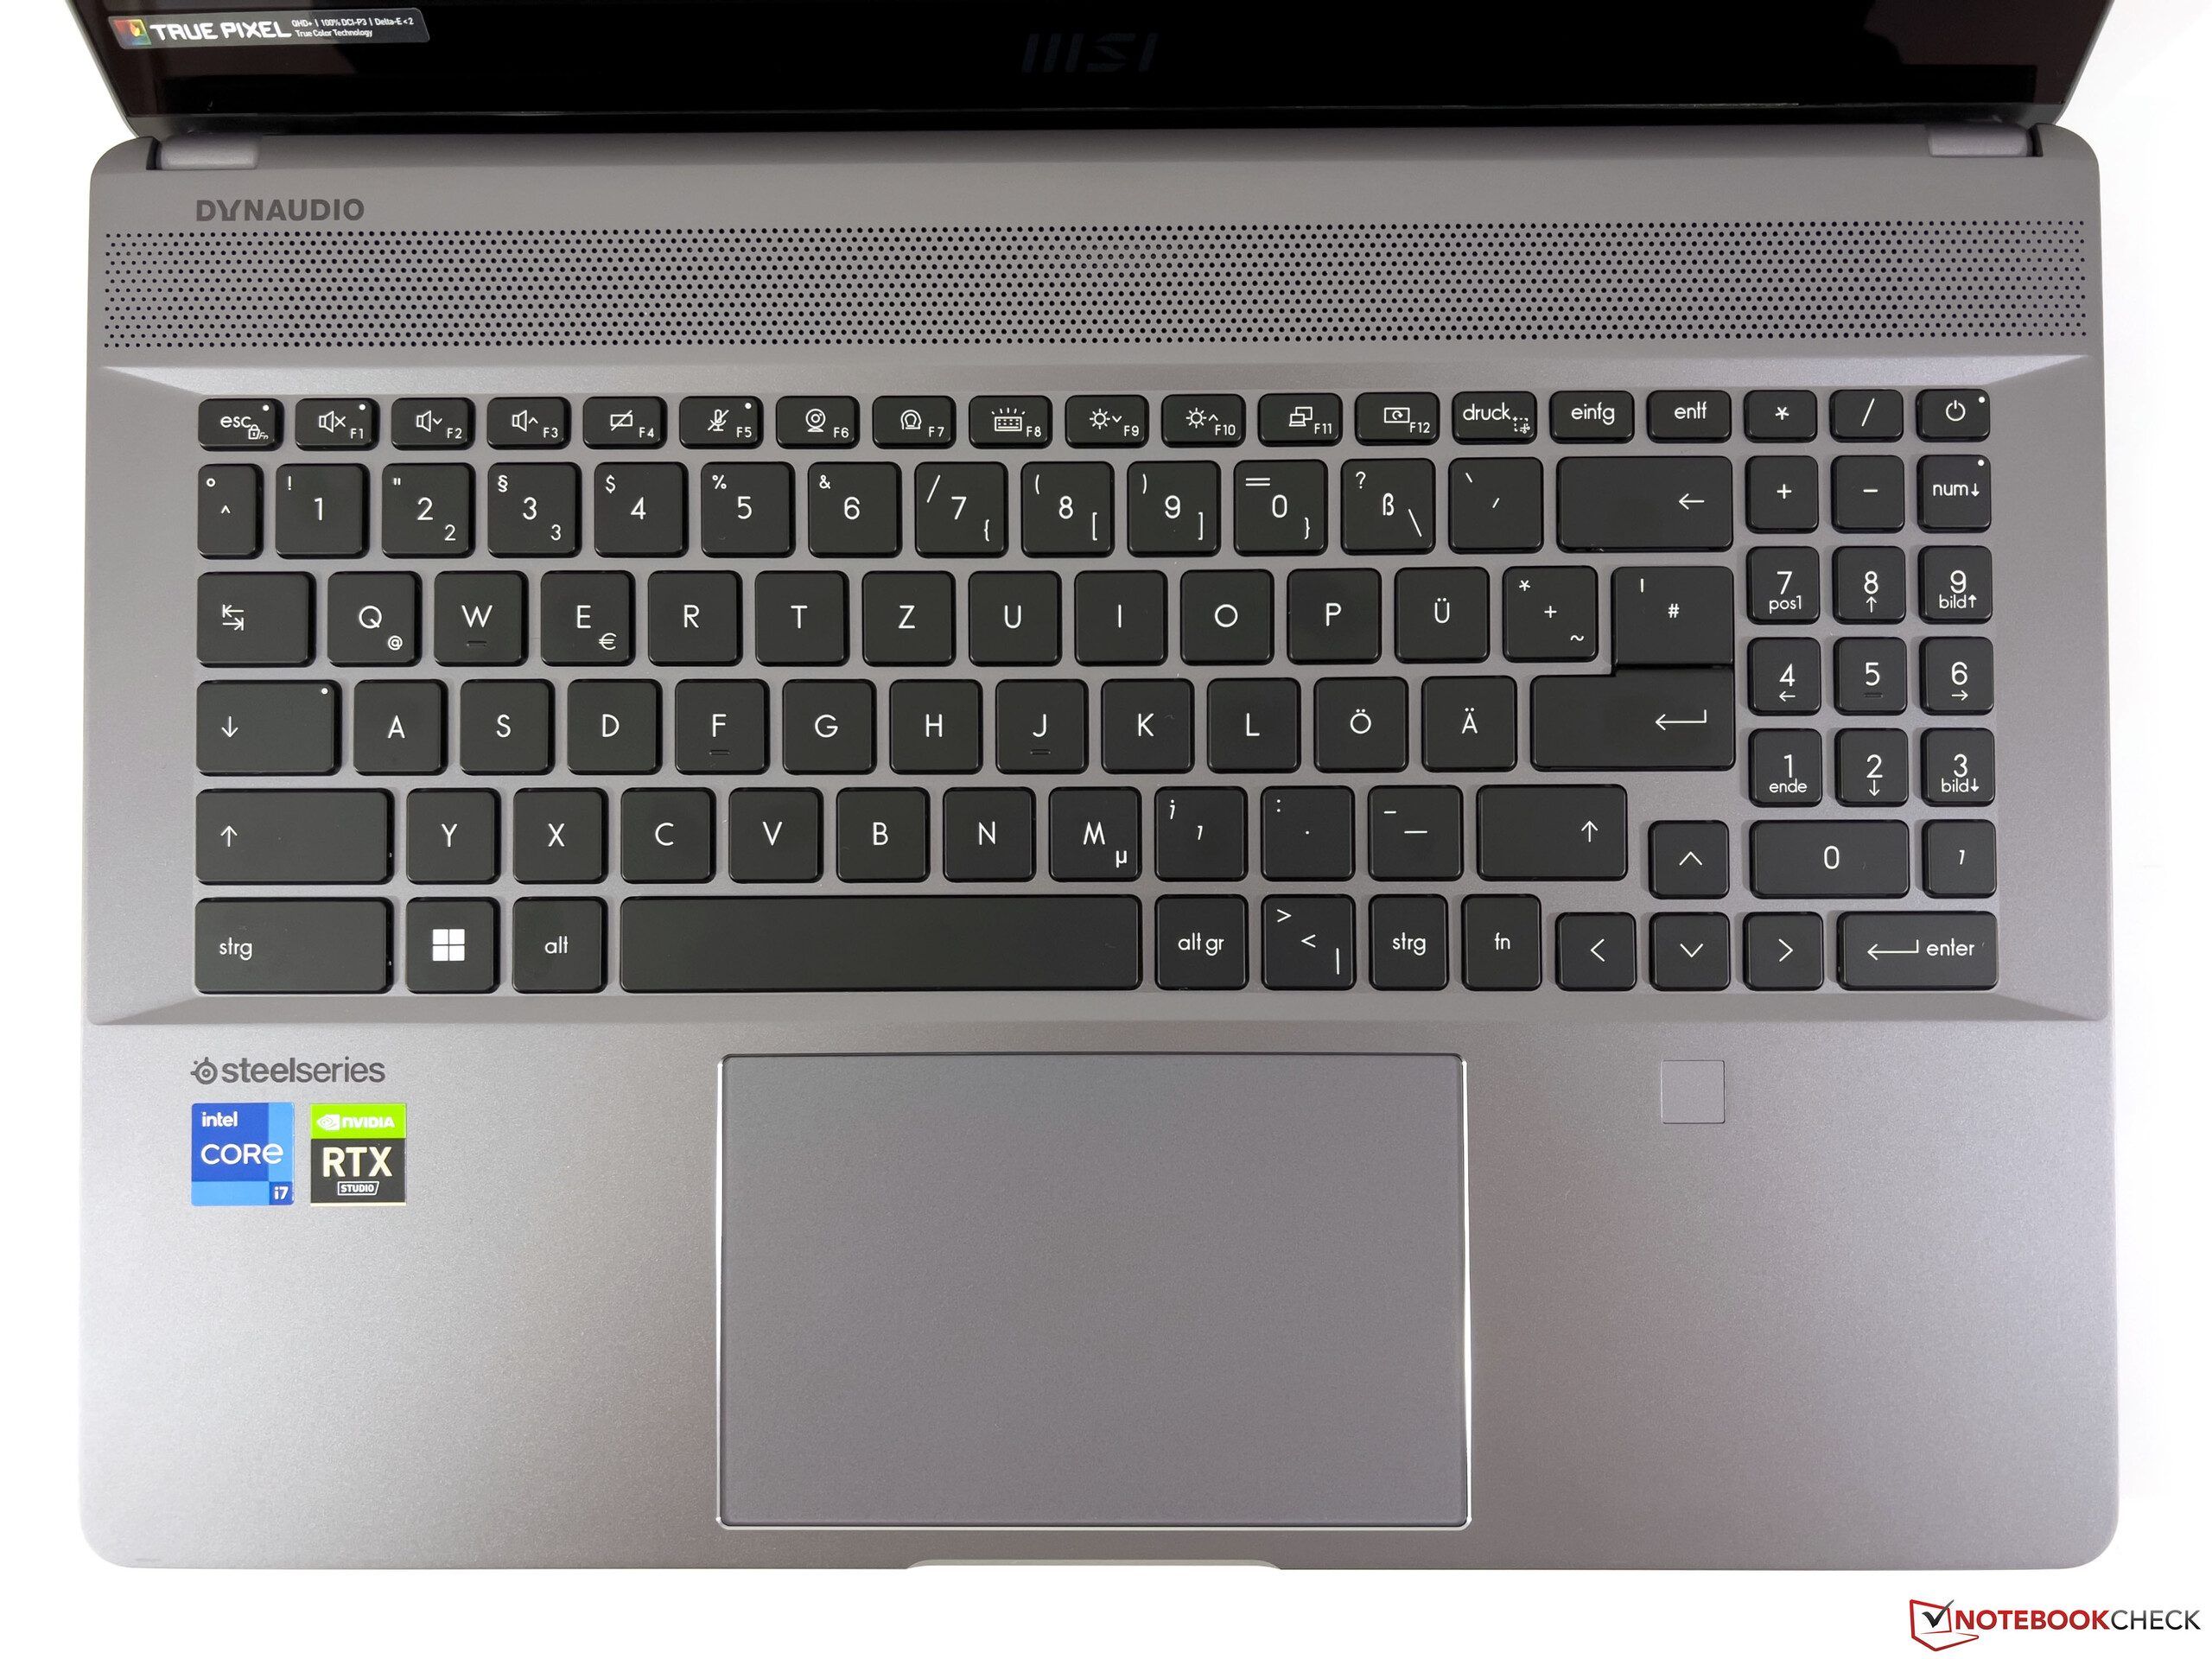
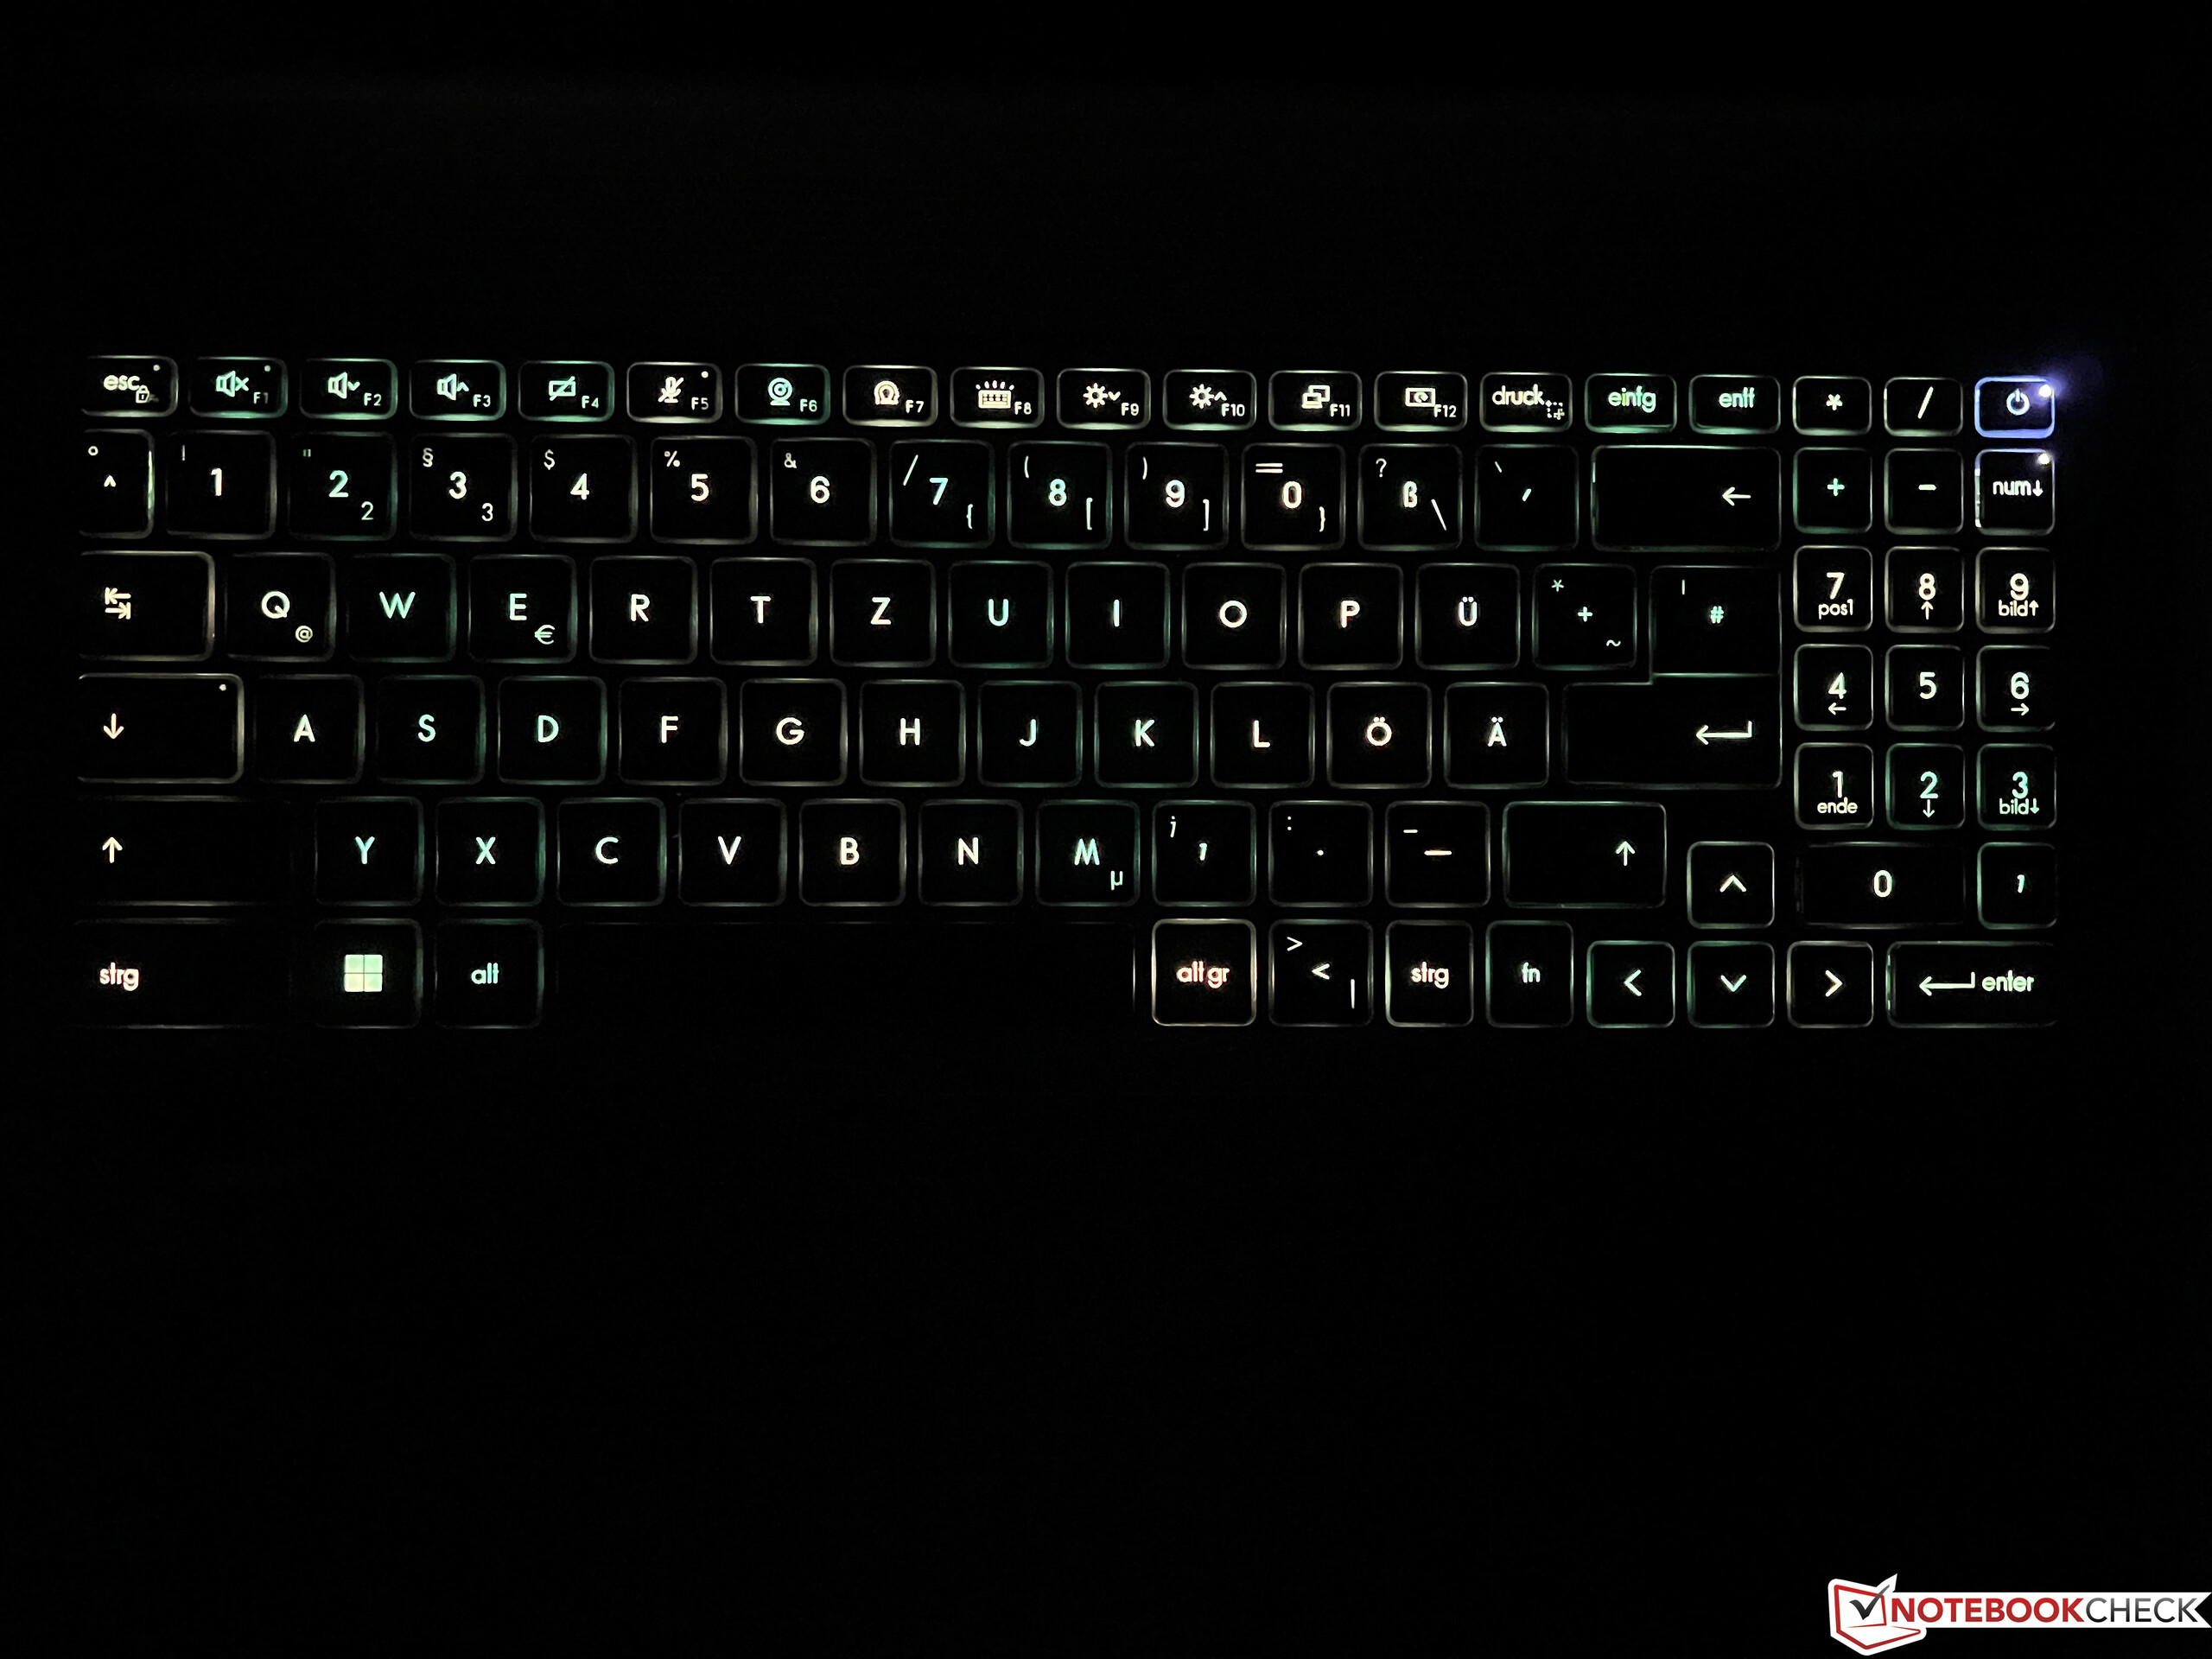
Hölje, utrustning och inmatningsenheter
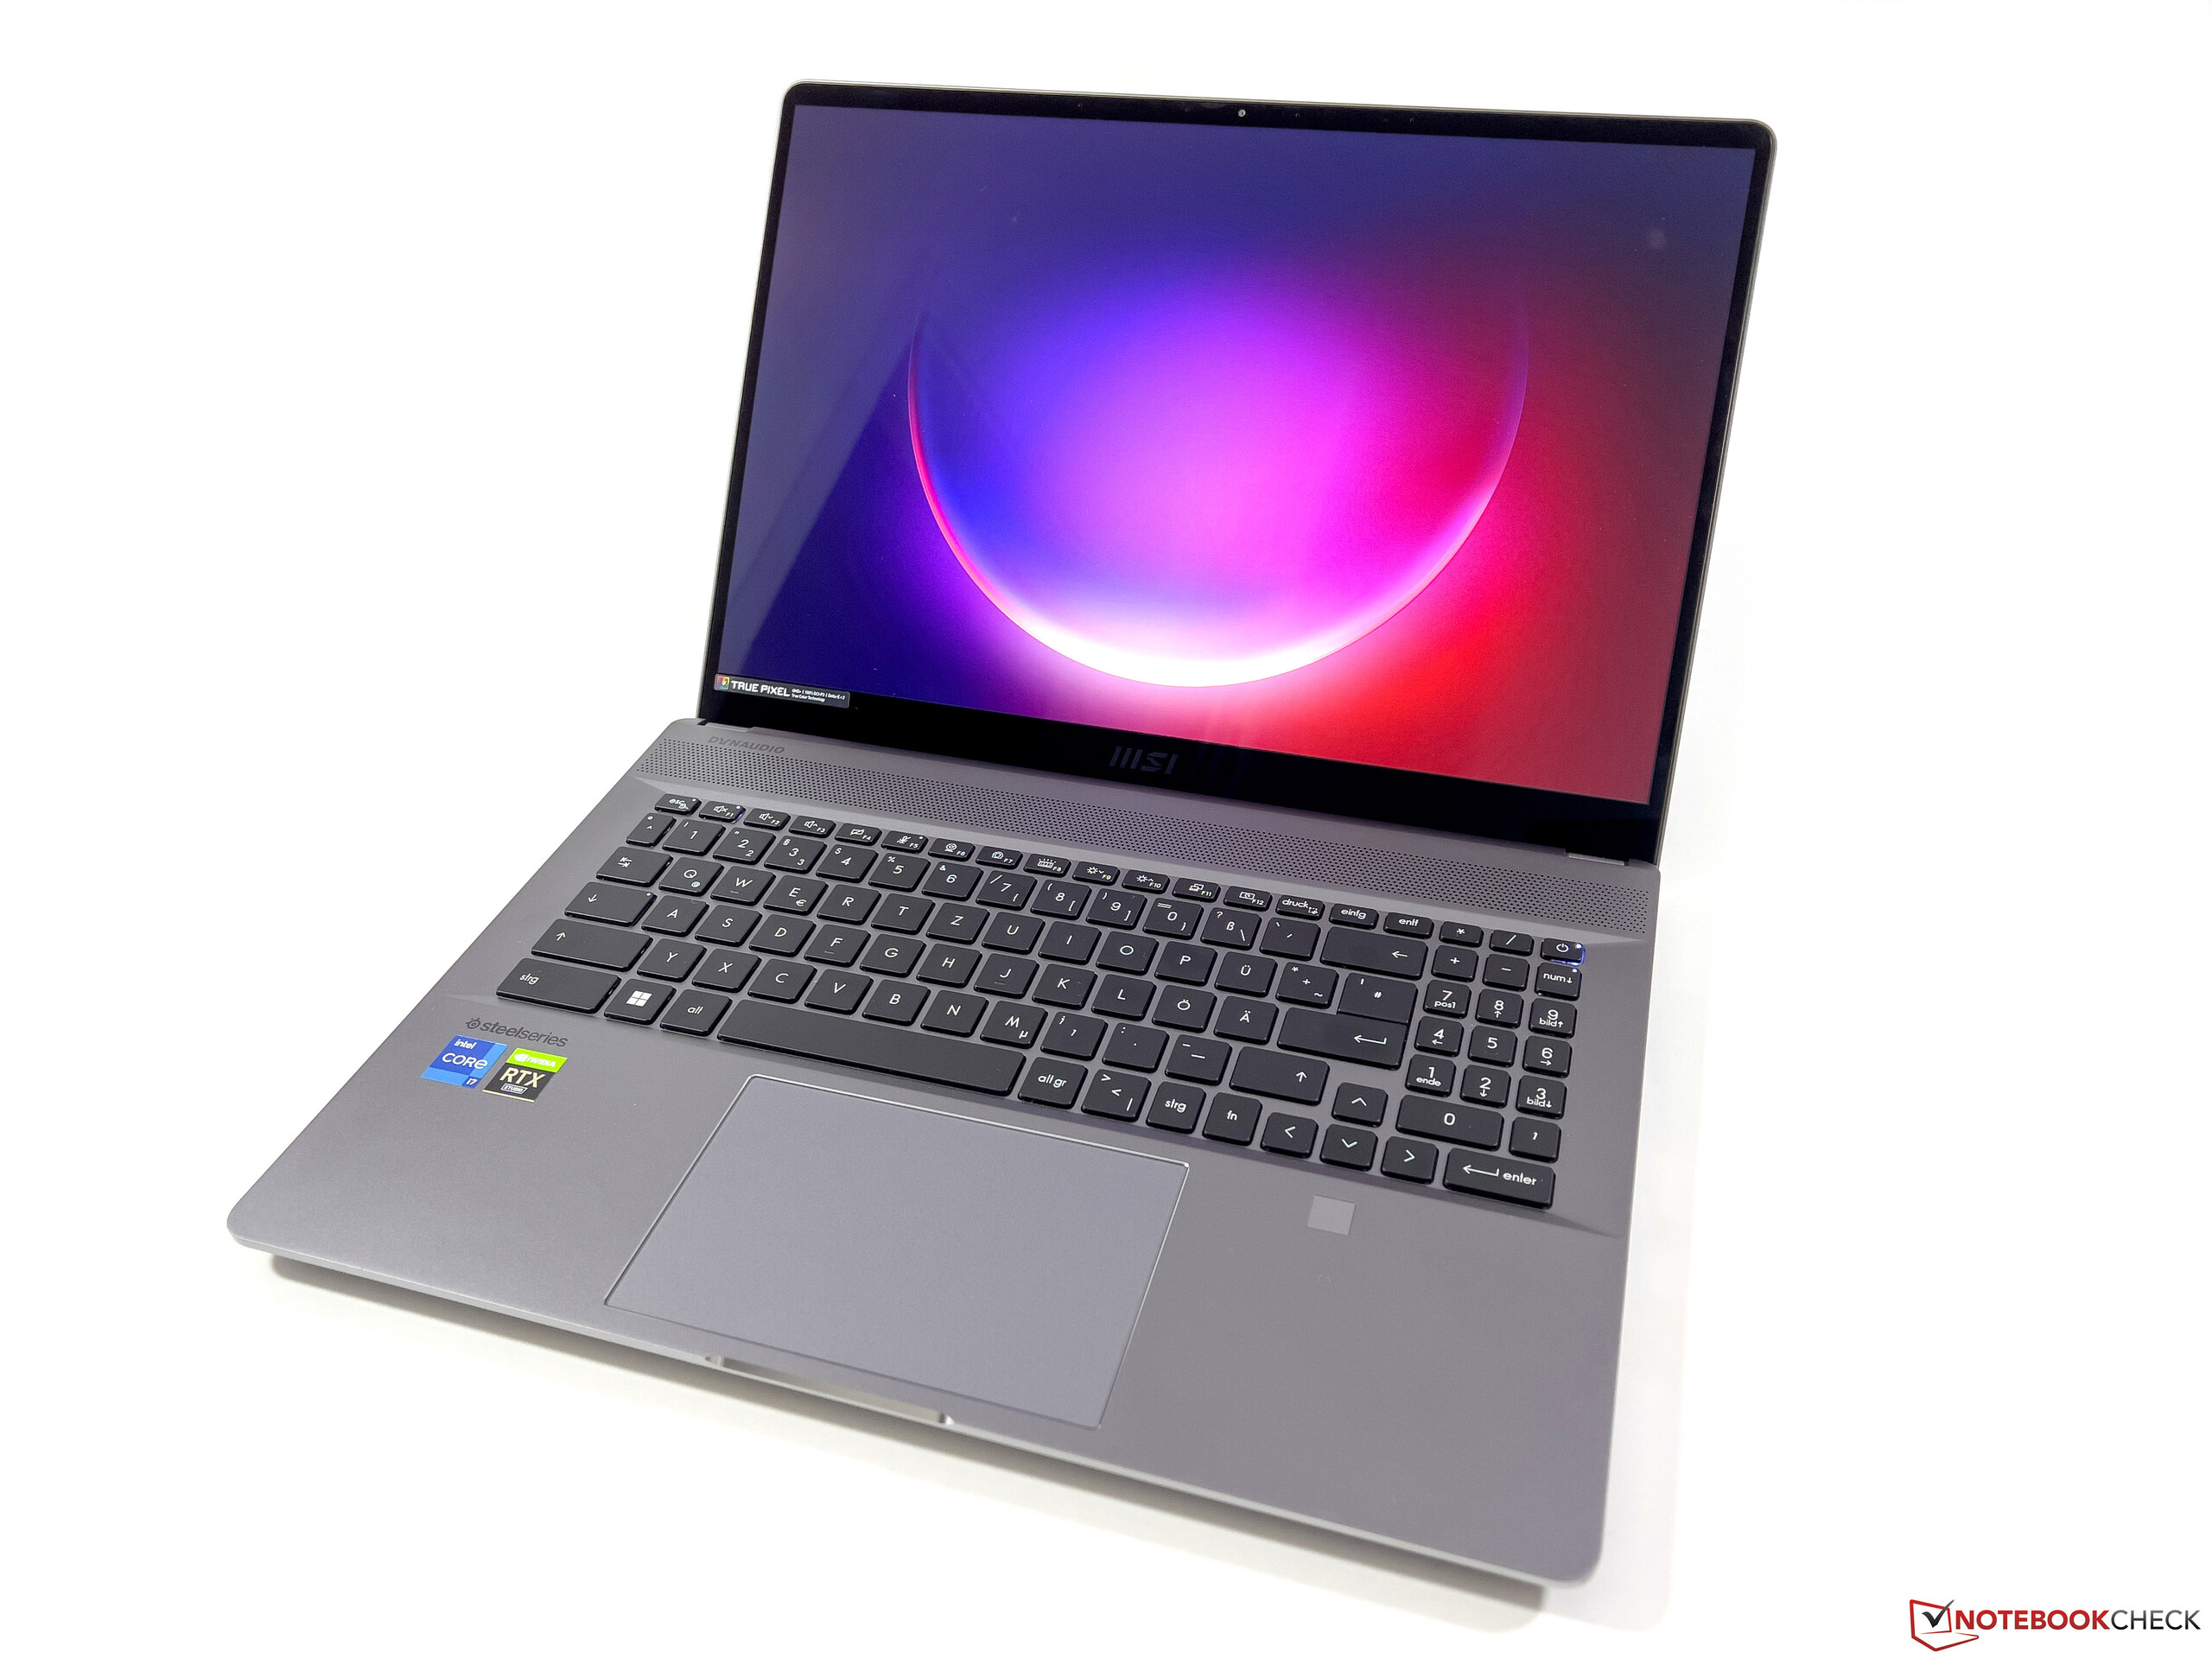
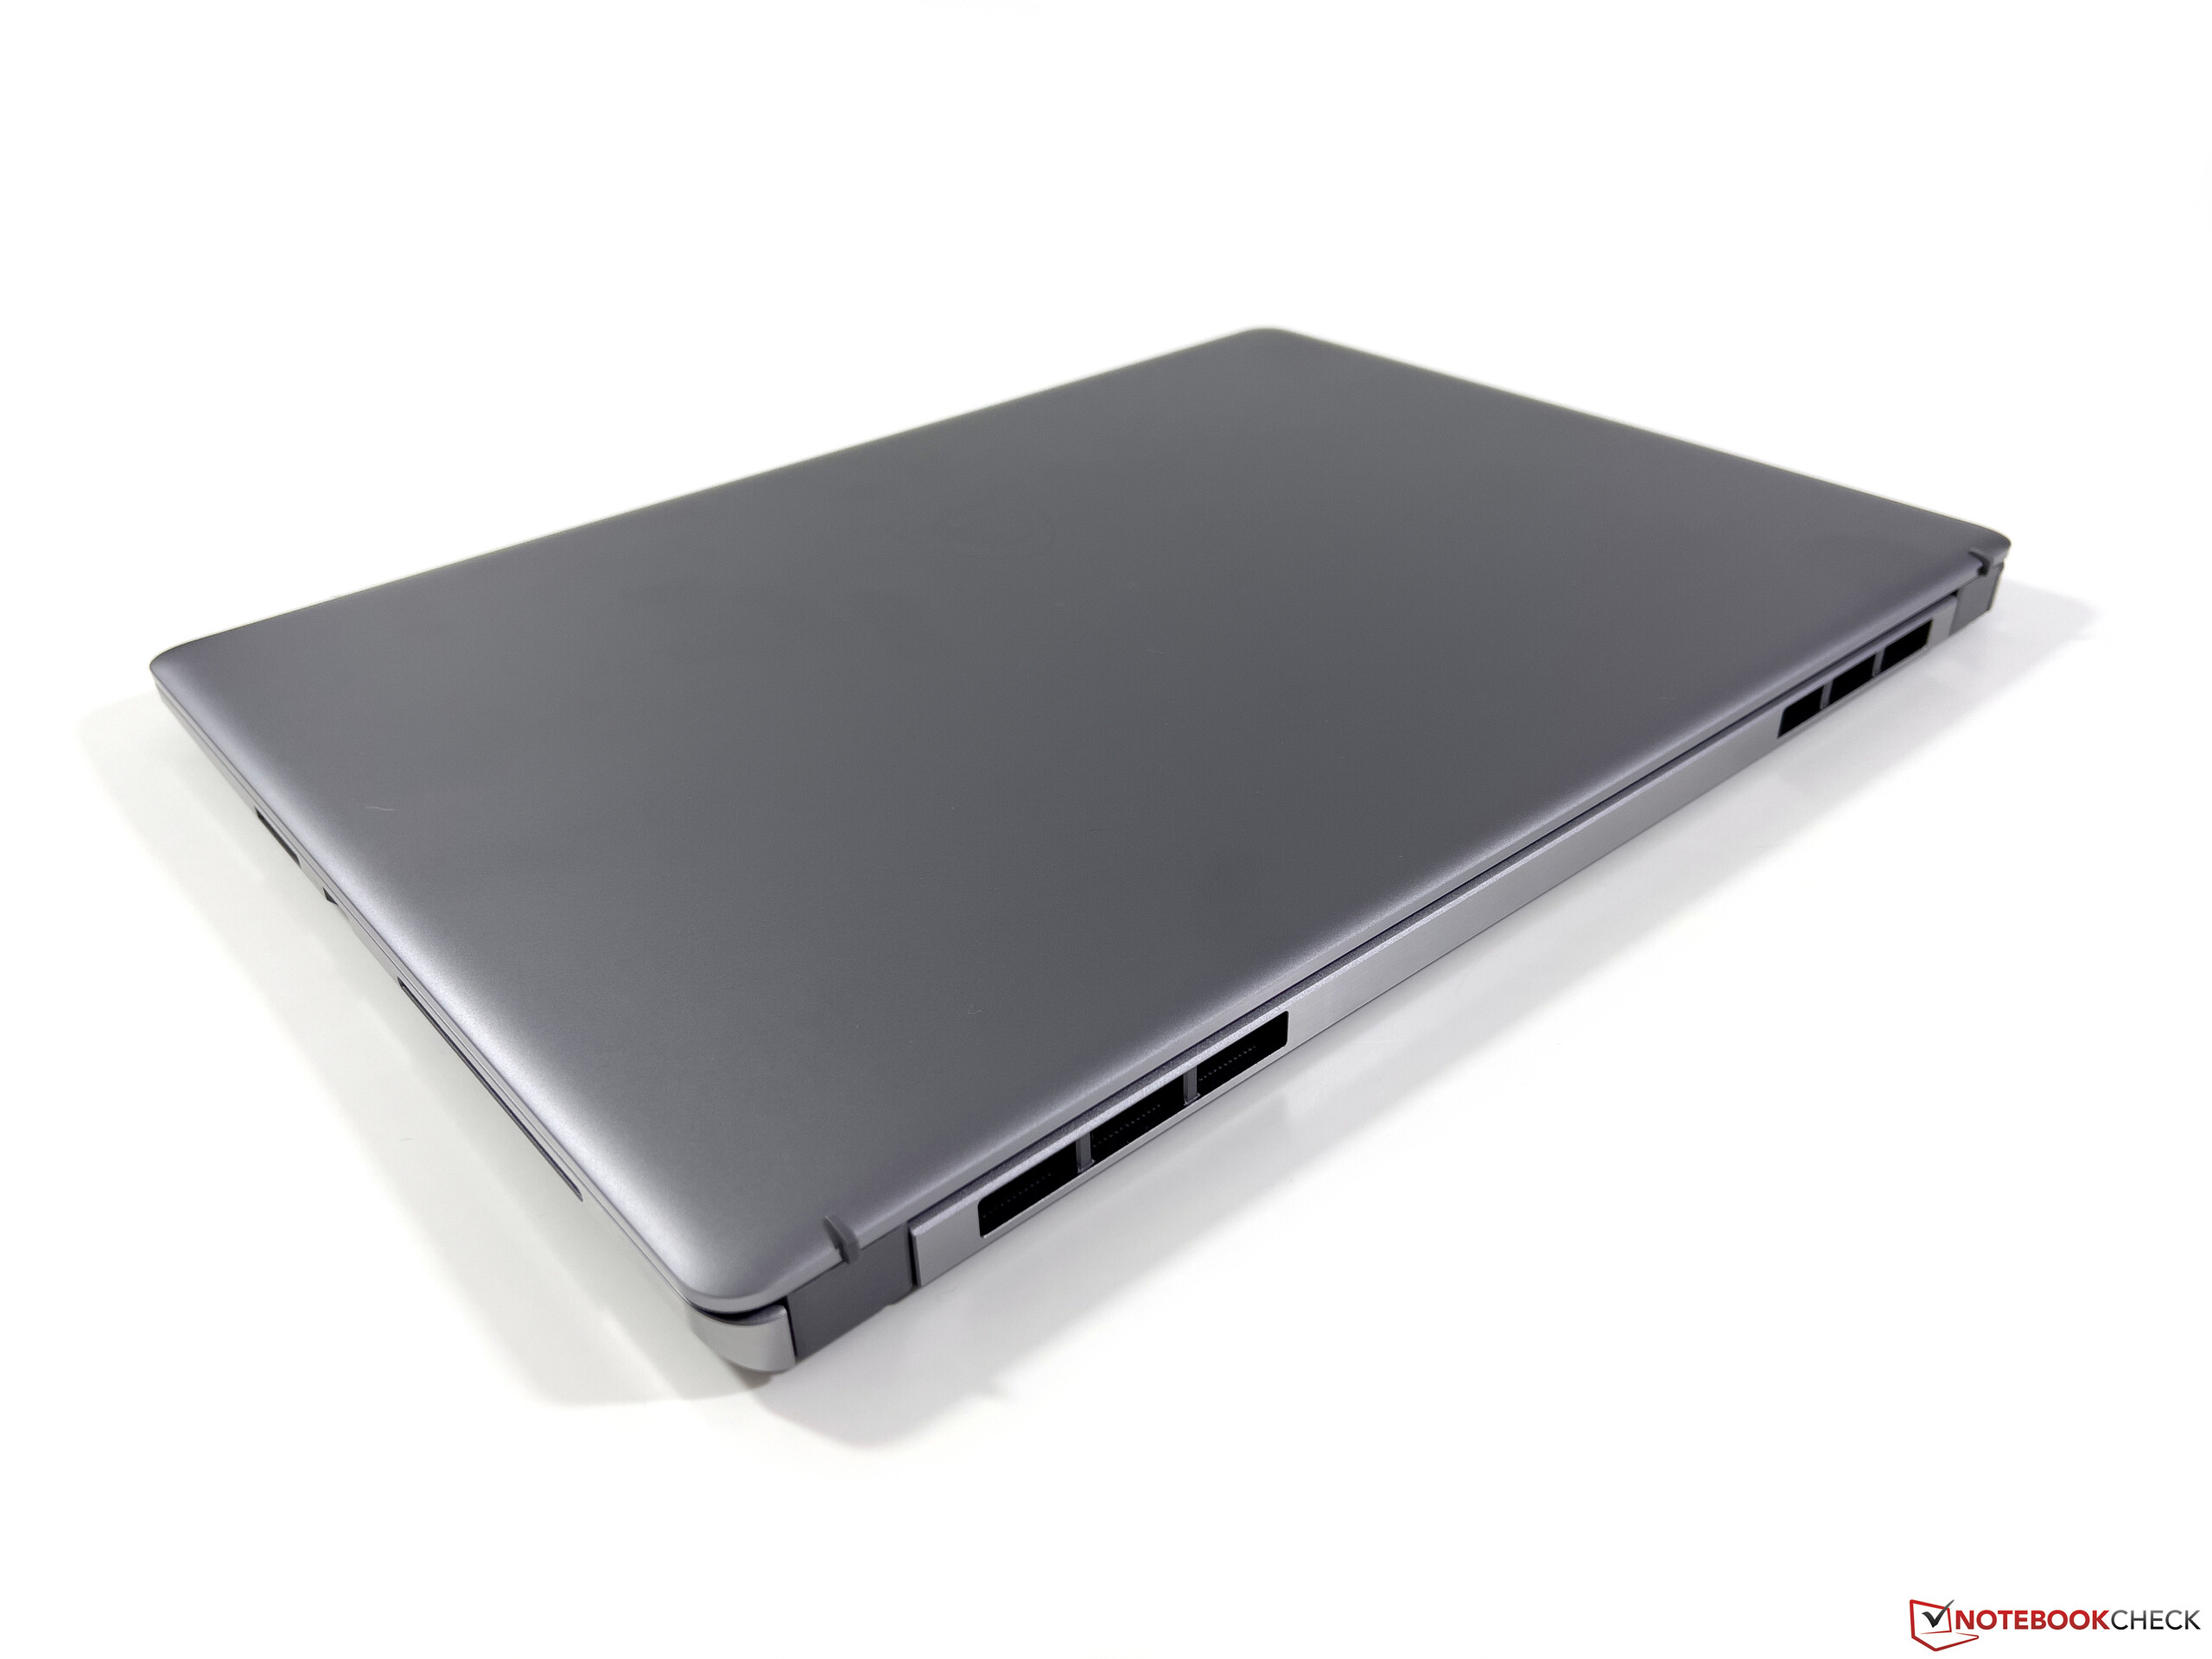
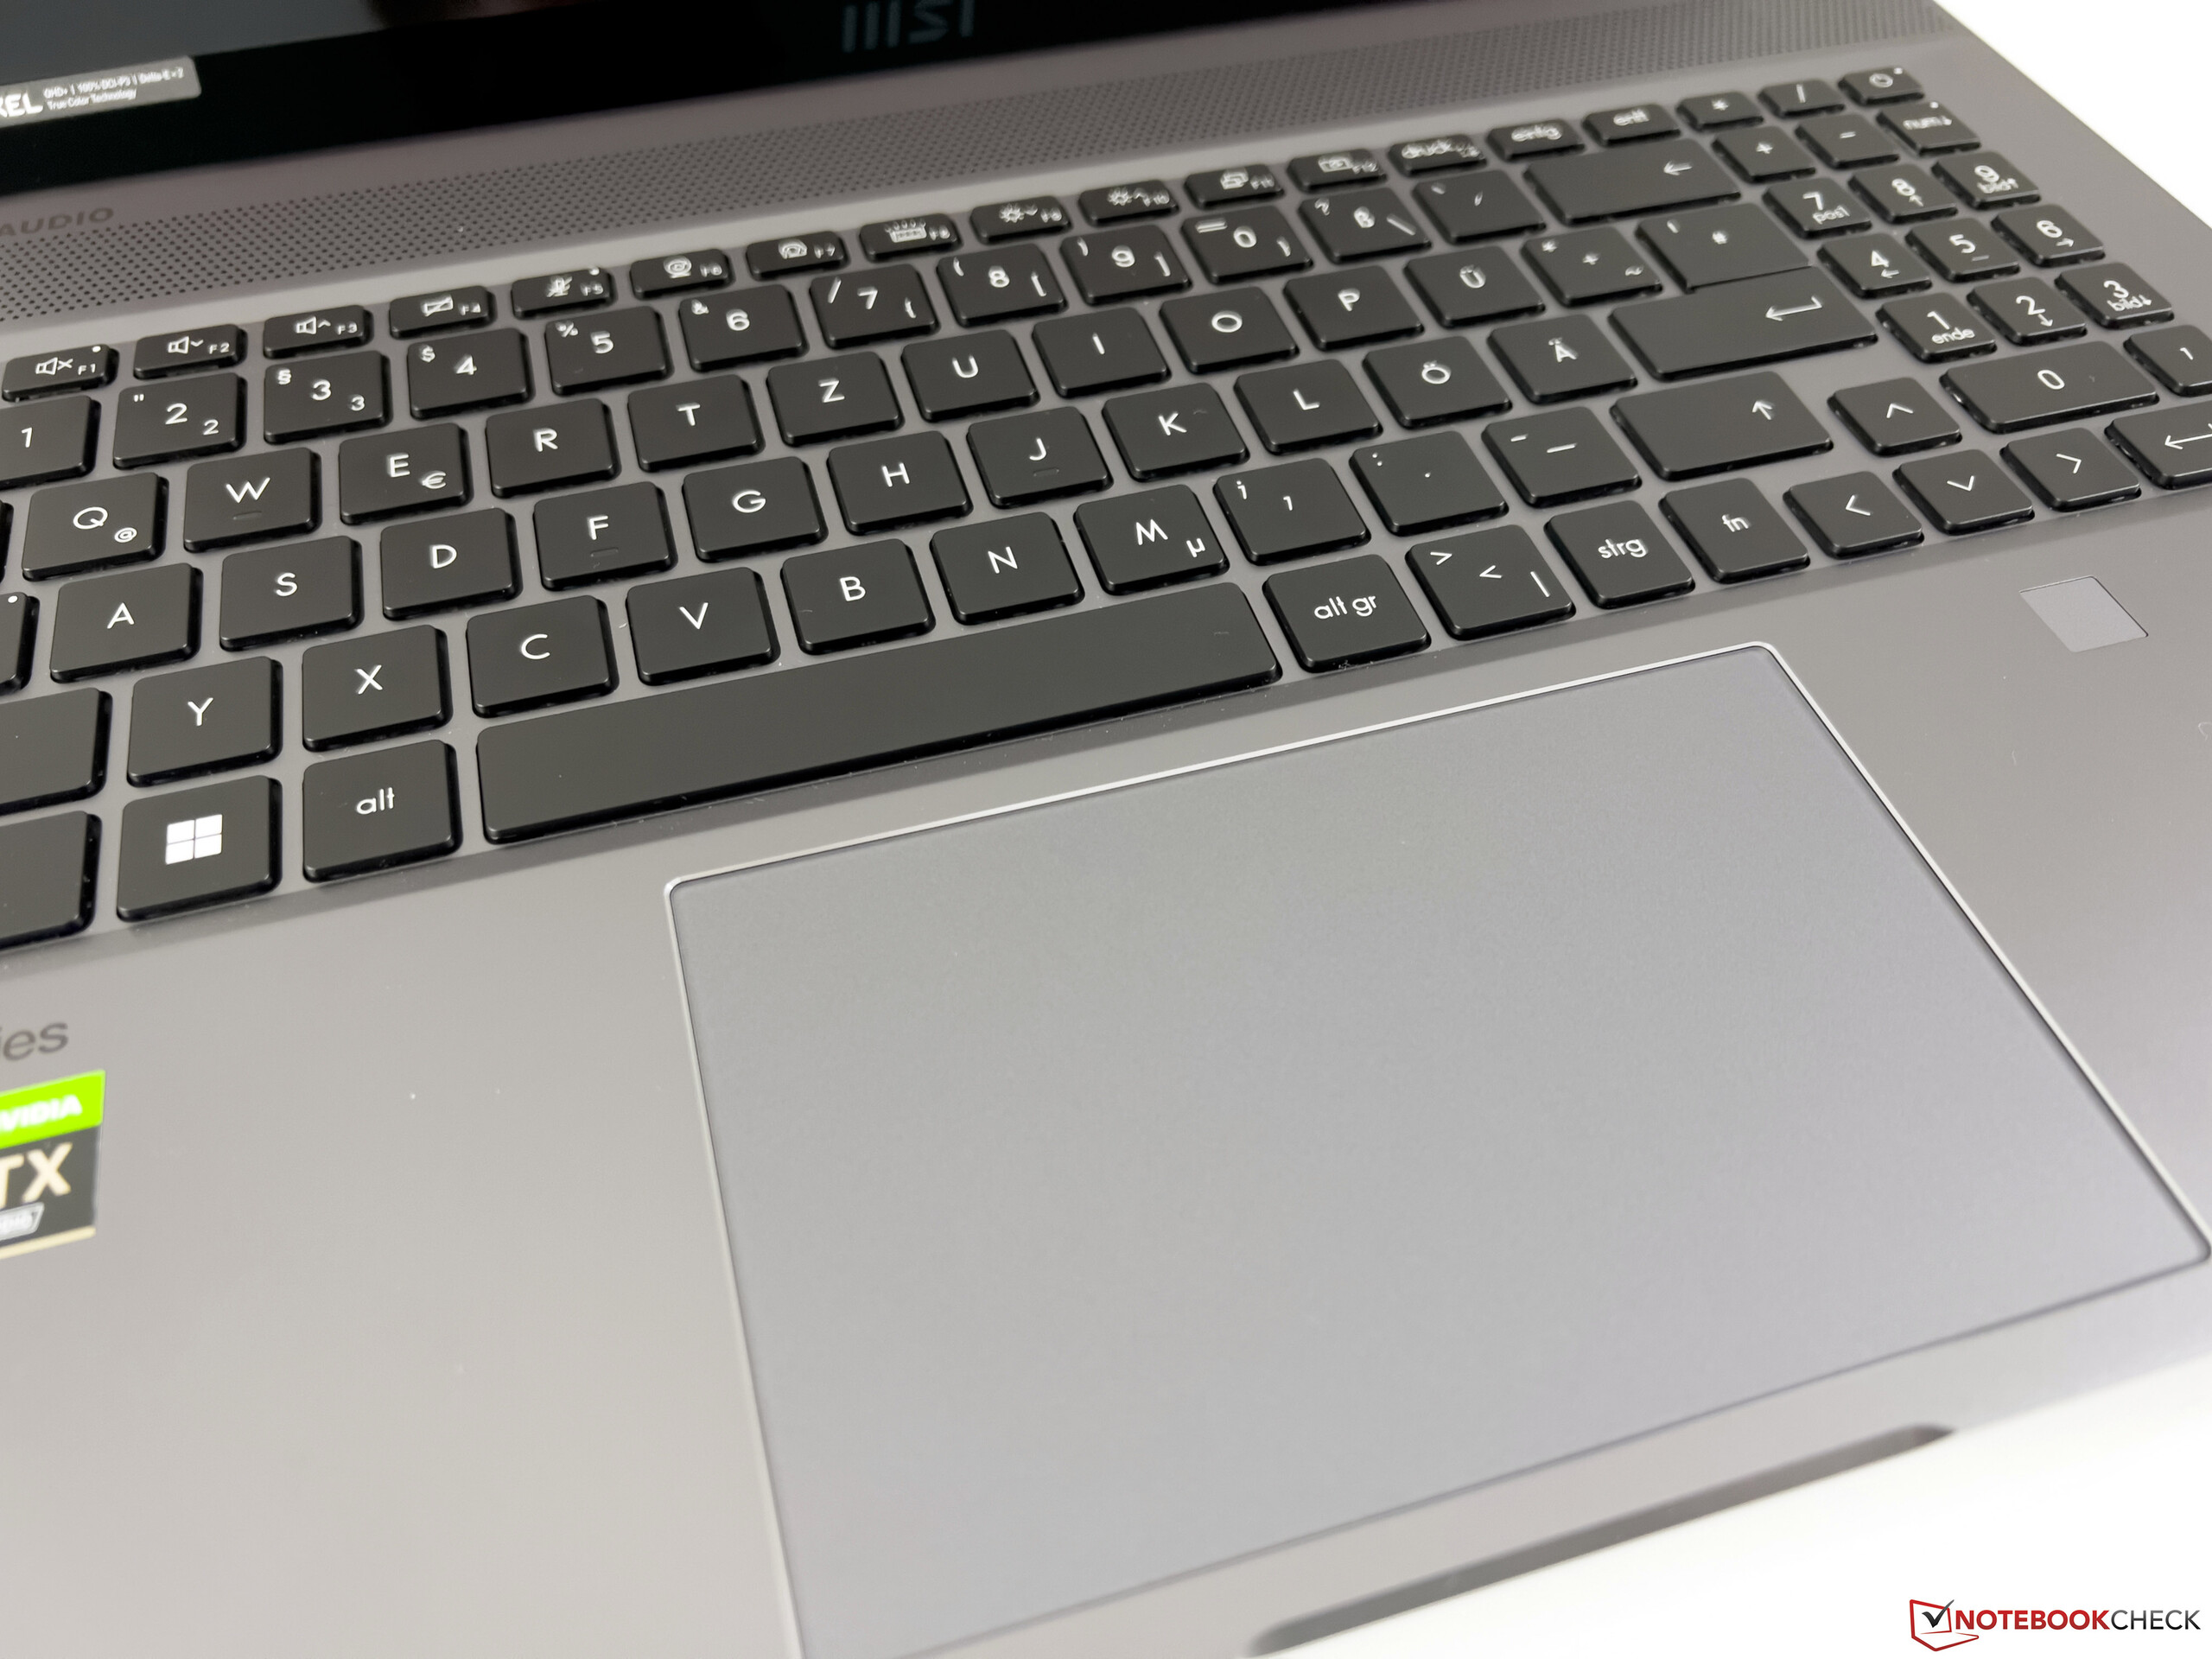
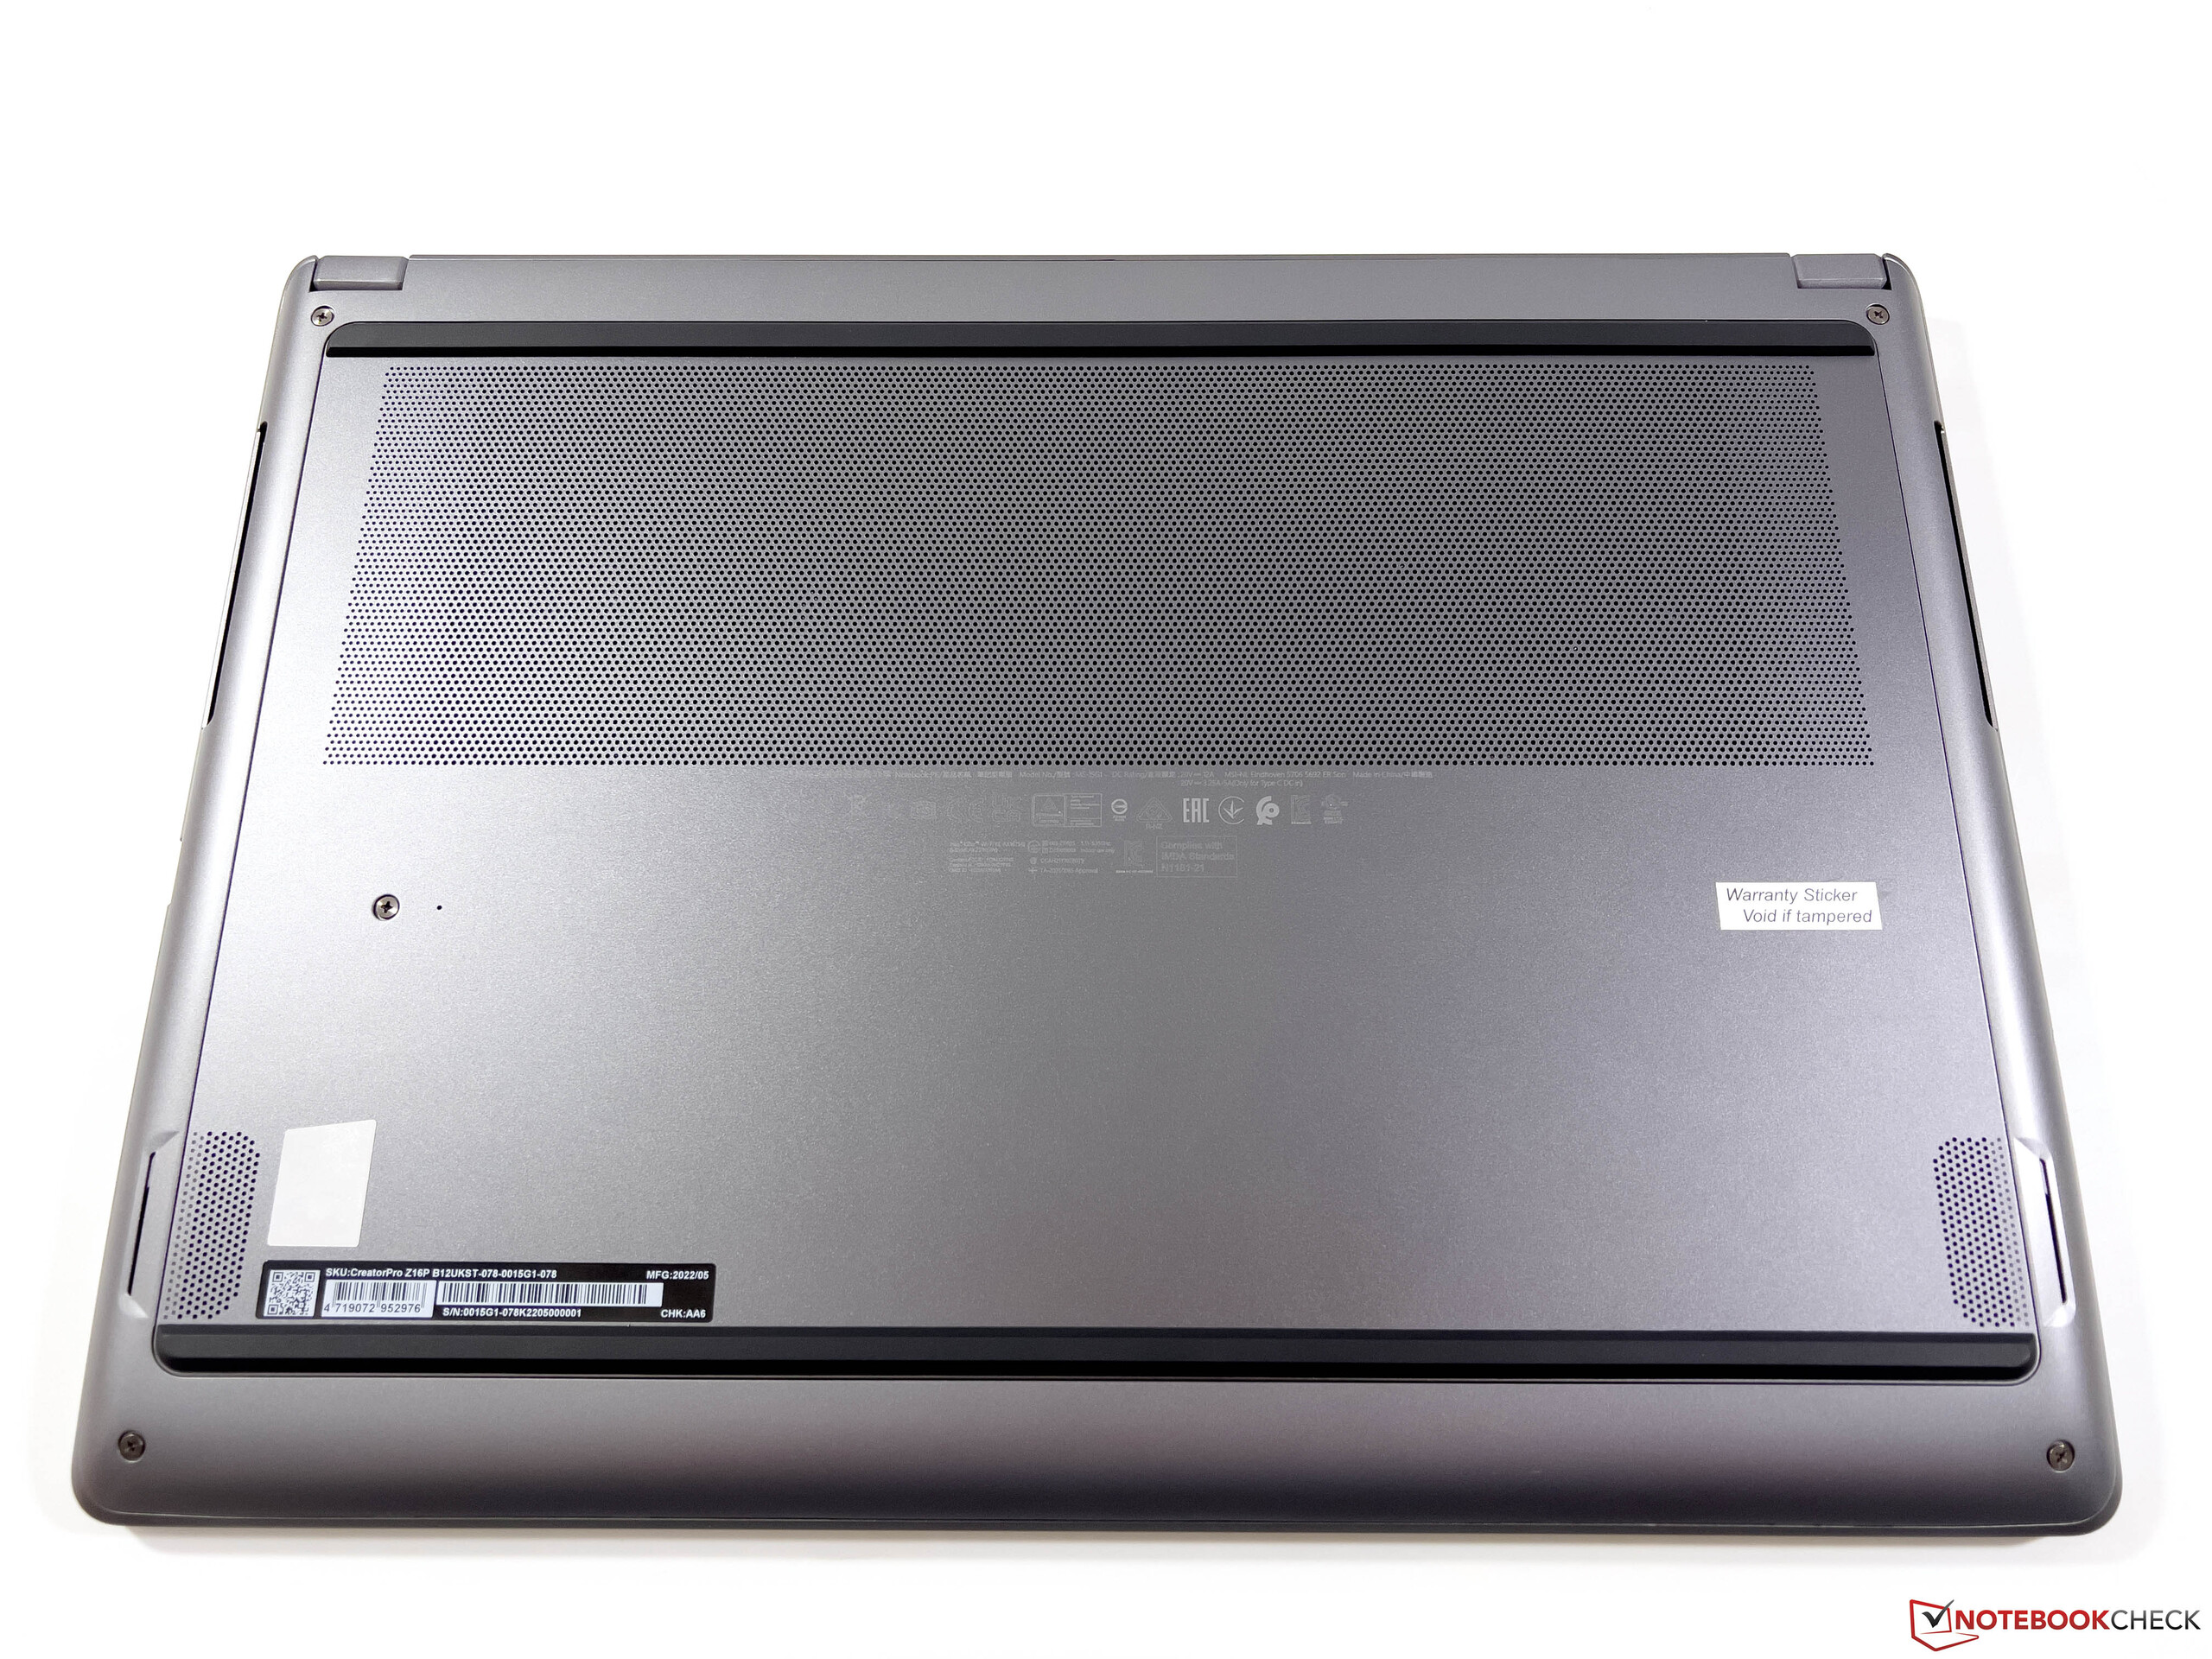
Höljet till CreatorPro Z16P skiljer sig inte från det till CreatorPro Z16P vanliga Creator Z16P, vilket naturligtvis även omfattar anslutningar och inmatningsenheter. Du bör inte stöta på några problem med det mörkgrå (Lunar Gray) höljet ens på kontoret, så länge du håller dig tillbaka med tangentbordsbelysningen, där färgen kan konfigureras individuellt för varje tangent. Själva tangentbordet erbjuder en mycket bekväm skrivupplevelse och gynnas av ett långt tangenttryck. I detta avseende kan CreatorPro till och med hålla jämna steg med bra bärbara datorer för företag. ClickPad fungerar också utan några problem.
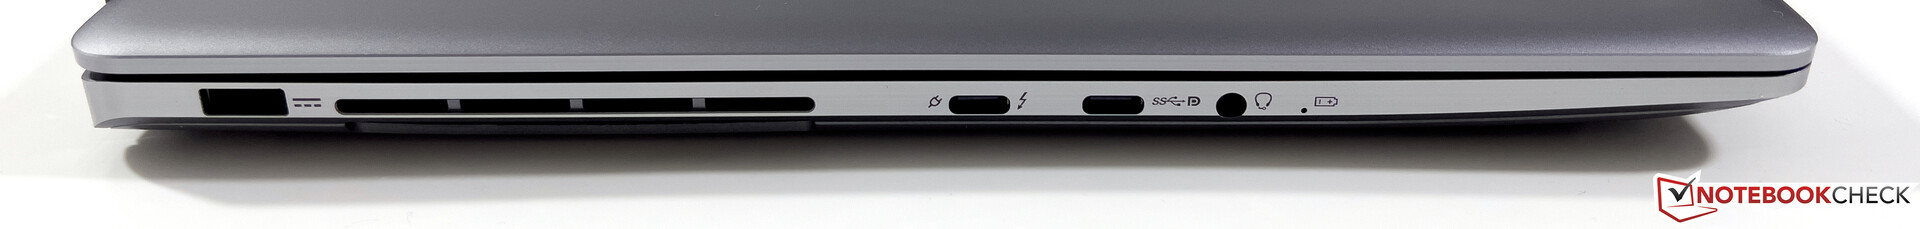
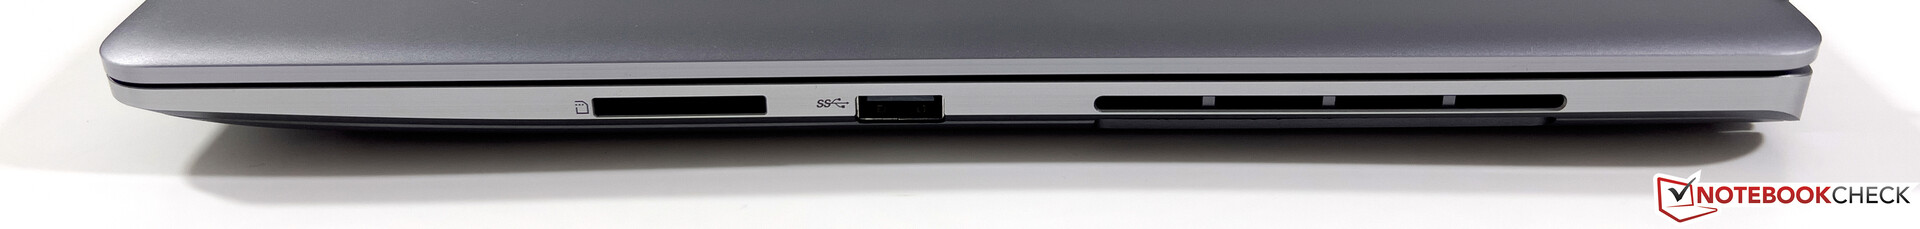
När det gäller anslutningarna får du totalt tre USB-portar, varav en av dem inkluderar Thunderbolt 4, och en fullstor SD-kortläsare. Däremot får du nöja dig med en dedikerad grafikutgång. På grund av kylningen finns alla anslutningar utom strömporten i de främre områdena på båda sidorna, vilket är mindre än optimalt i vardaglig drift.
| SD Card Reader | |
| average JPG Copy Test (av. of 3 runs) | |
| Dell Precision 5000 5560 (AV Pro V60) | |
| Genomsnitt av klass Workstation (49.6 - 681, n=14, senaste 2 åren) | |
| MSI CreatorPro Z16P B12UKST (AV Pro V60) | |
| MSI Creator Z16P B12UHST (AV PRO microSD 128 GB V60) | |
| HP ZBook Studio 16 G9 62U04EA (Angelbird AV PRO V60) | |
| maximum AS SSD Seq Read Test (1GB) | |
| Genomsnitt av klass Workstation (87.6 - 1455, n=14, senaste 2 åren) | |
| Dell Precision 5000 5560 (AV Pro V60) | |
| MSI CreatorPro Z16P B12UKST (AV Pro V60) | |
| HP ZBook Studio 16 G9 62U04EA (Angelbird AV PRO V60) | |
| Networking | |
| MSI CreatorPro Z16P B12UKST | |
| iperf3 receive AXE11000 6GHz | |
| iperf3 transmit AXE11000 6GHz | |
| HP ZBook Studio 16 G9 62U04EA | |
| iperf3 receive AXE11000 6GHz | |
| iperf3 transmit AXE11000 6GHz | |
| Dell Precision 5000 5560 | |
| iperf3 transmit AX12 | |
| iperf3 receive AX12 | |
| MSI Creator Z16P B12UHST | |
| iperf3 receive AXE11000 | |
| Lenovo ThinkPad P1 G4-20Y4Z9DVUS | |
| iperf3 transmit AX12 | |
| iperf3 receive AX12 | |


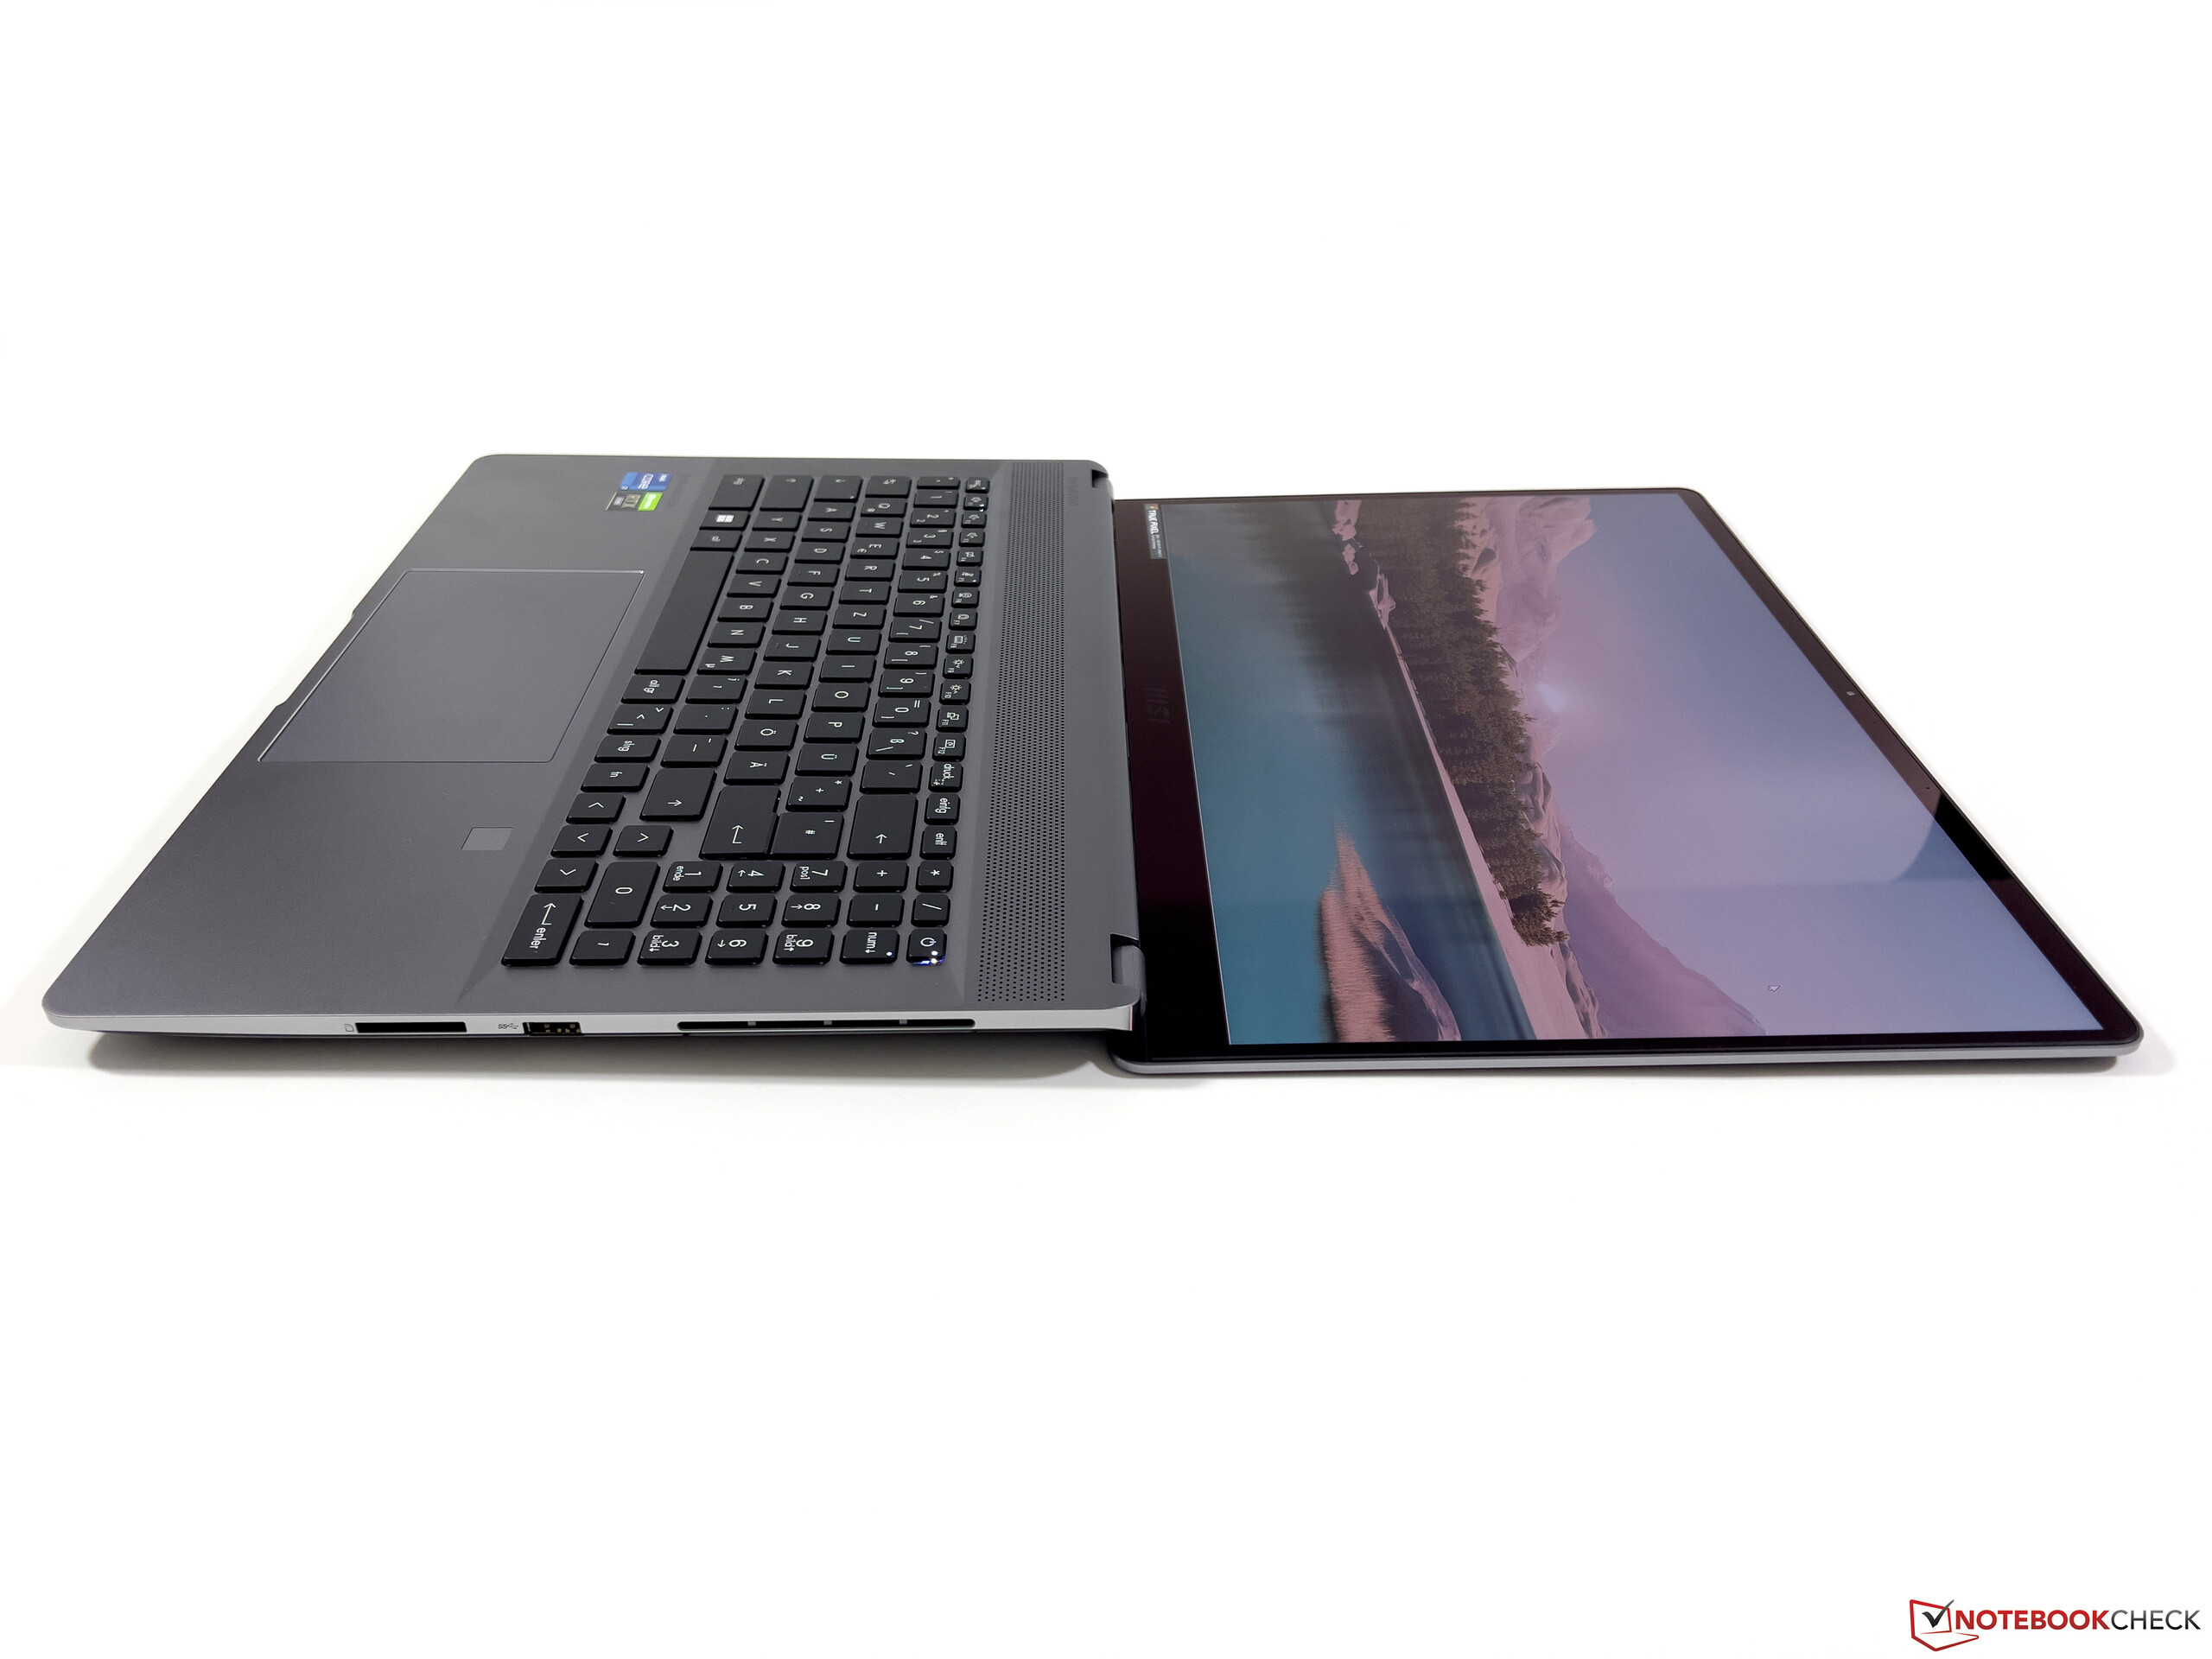
Skärm - TrueColor med 165 Hz
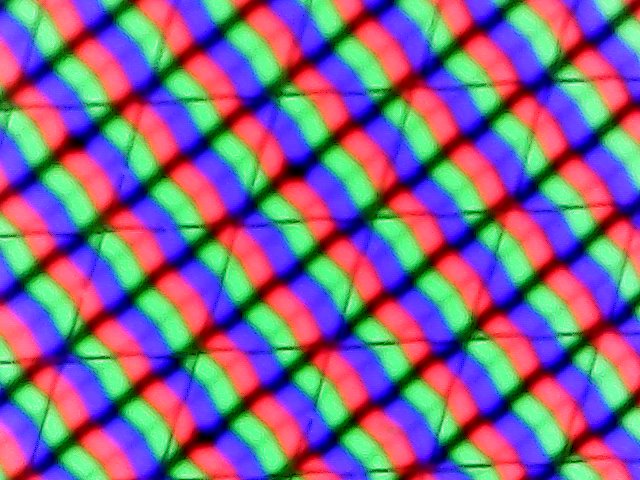
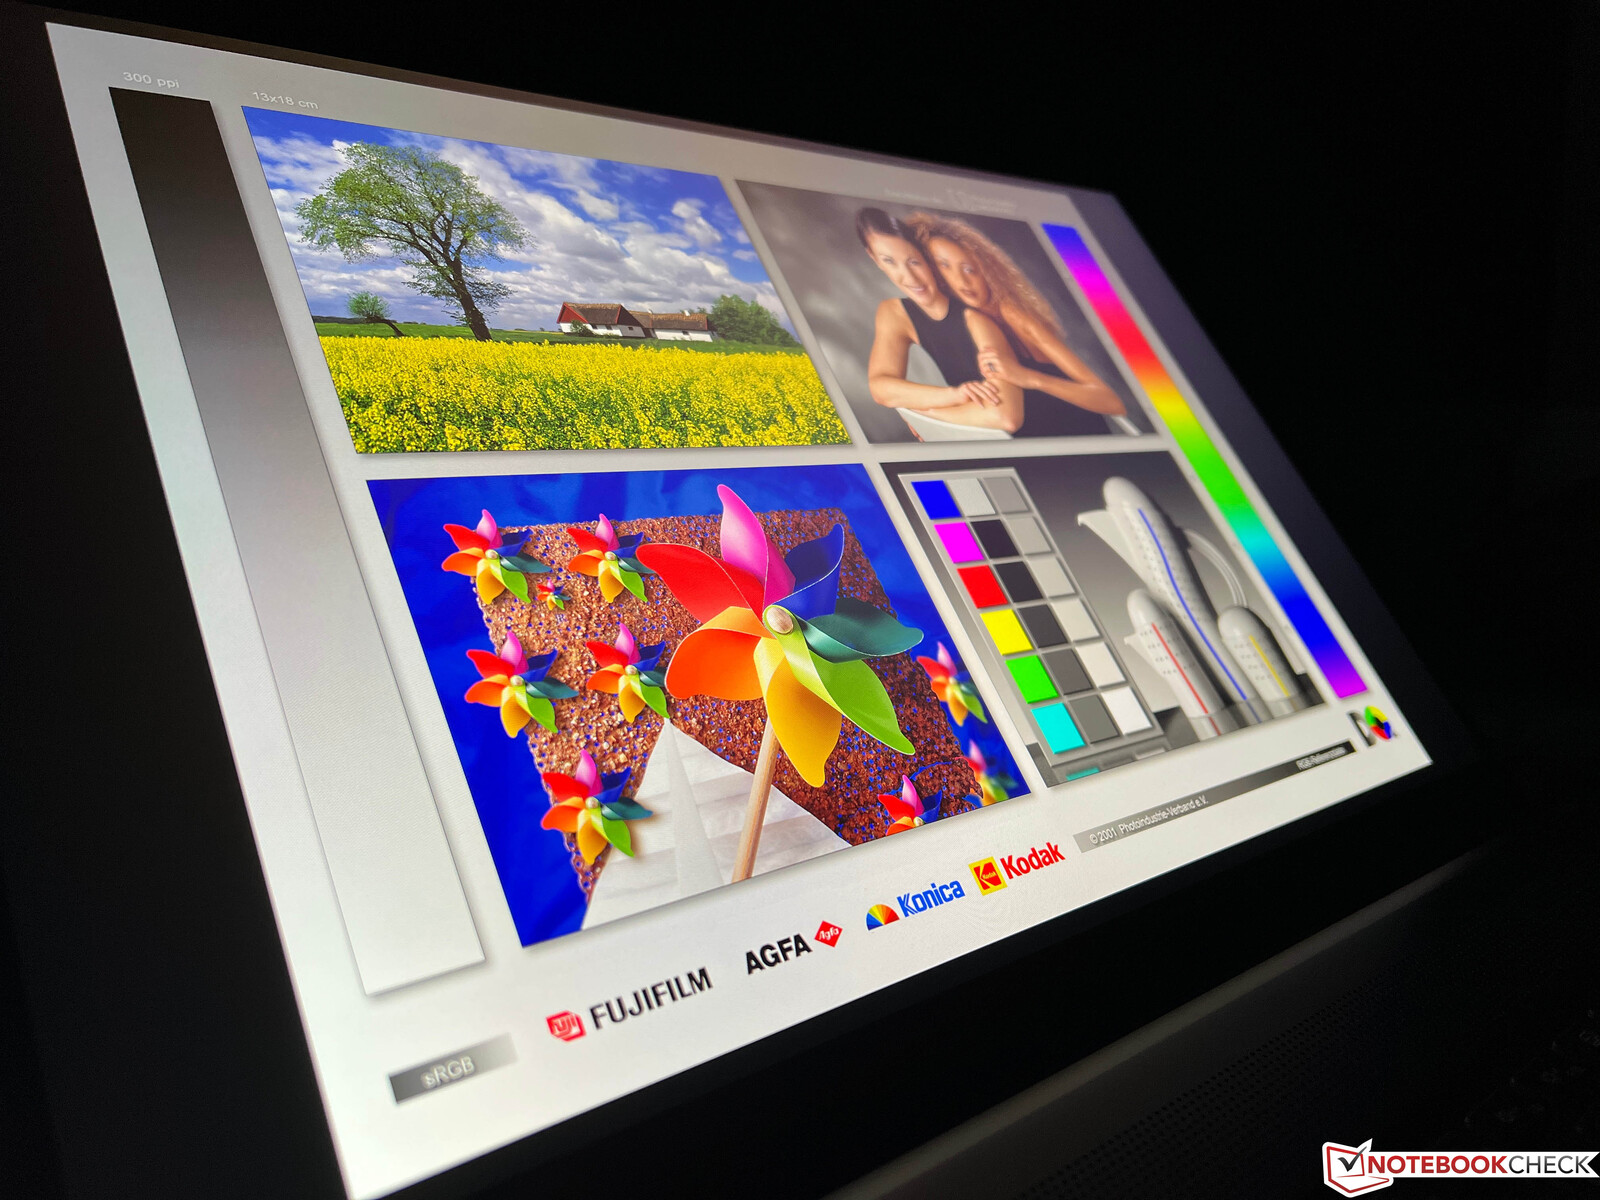
Vi kan också vara kortfattade i avsnittet Display, eftersom det inte heller finns några skillnader till den vanliga Creator Z16Phär. Även om utformningen av den reflekterande TrueColor WQHD-panelen (2560 x 1600 pixlar, IPS) i 16:10-formatet är mer inriktad på en publik av innehållsskapare är den subjektiva bildkvaliteten helt enkelt mycket bra, och andra användare kommer också att ha mycket glädje av panelen.
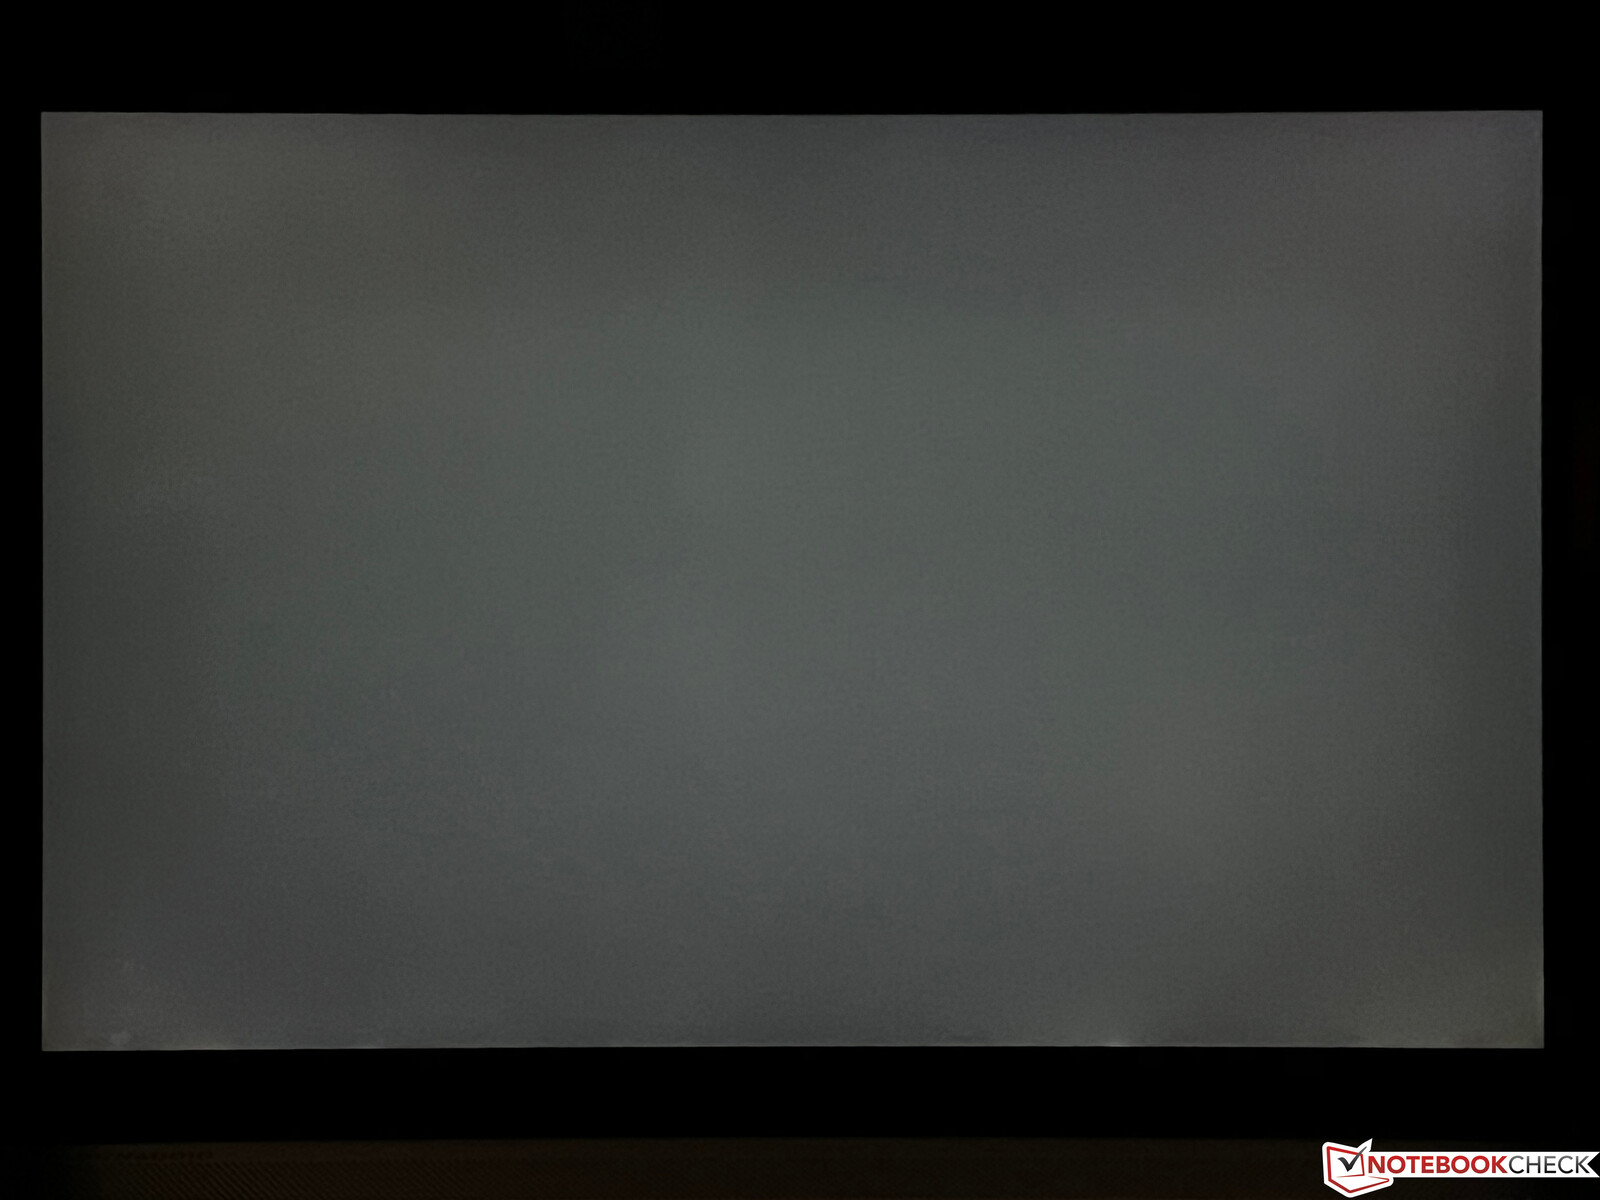
I våra mätningar levererar panelen hyggliga värden (genomsnittlig ljusstyrka ~390 cd/m²), även om kontrastförhållandet på ~1 100:1 fortfarande kunde ha varit lite bättre och svartvärdet kunde ha varit lägre. Svarstiderna för 165-Hz-panelen är utmärkta, och detsamma gäller för stabiliteten i betraktningsvinklarna. Ljushalos kommer inte att vara något större problem, och PWM används inte heller.
| |||||||||||||||||||||||||
Distribution av ljusstyrkan: 88 %
Mitt på batteriet: 408 cd/m²
Kontrast: 1131:1 (Svärta: 0.36 cd/m²)
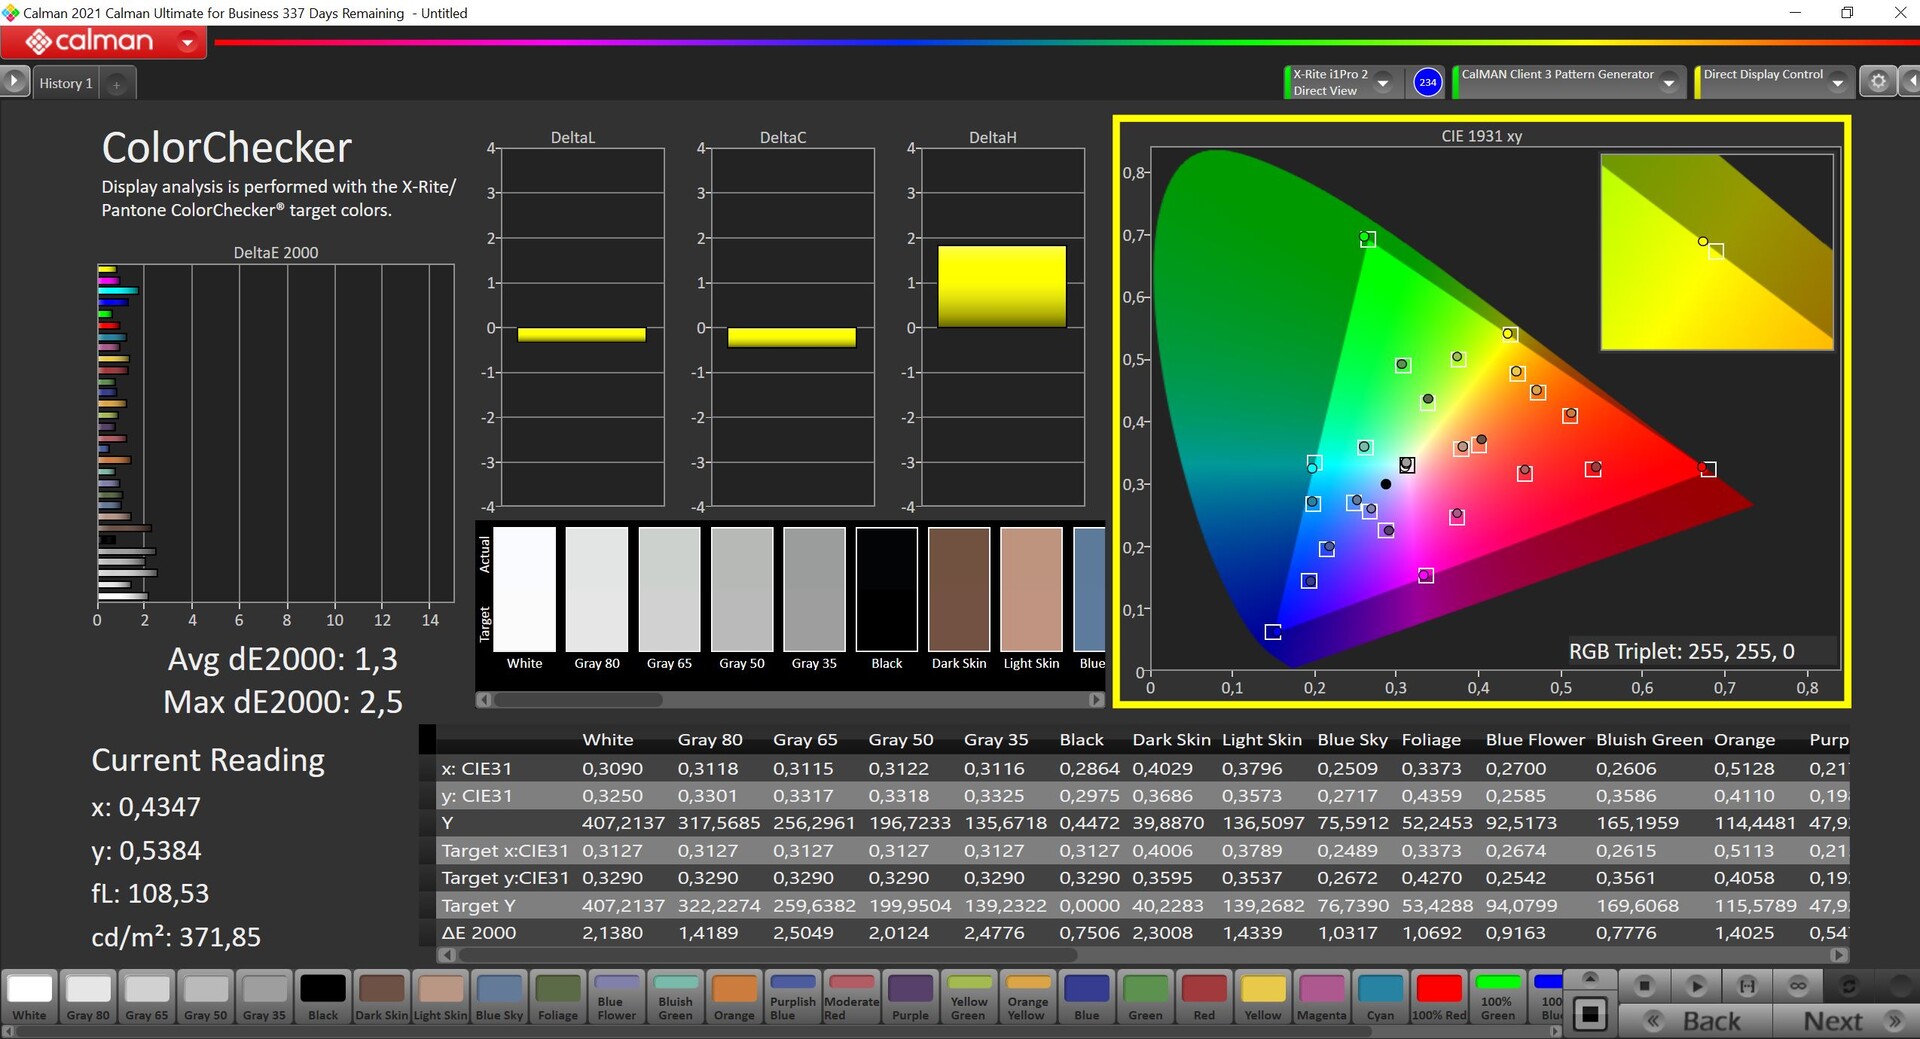
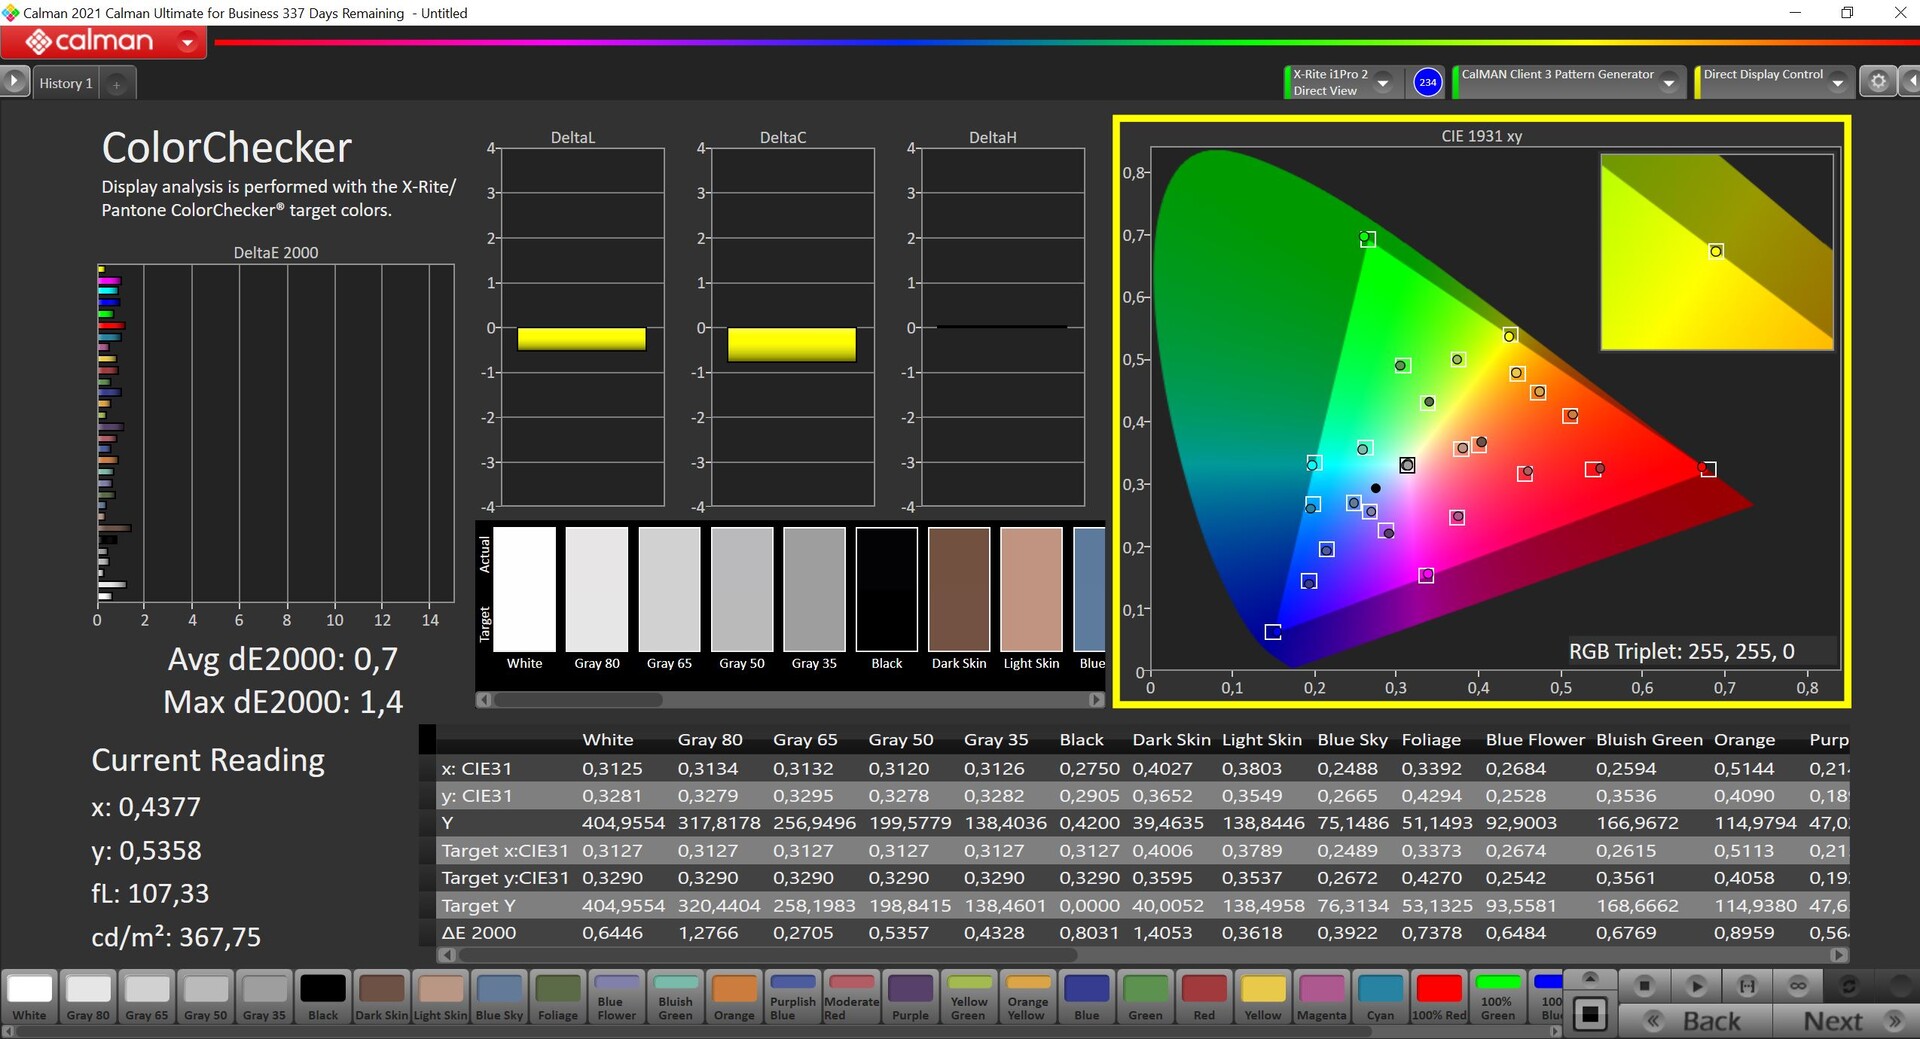
ΔE ColorChecker Calman: 1.3 | ∀{0.5-29.43 Ø4.71}
calibrated: 0.7
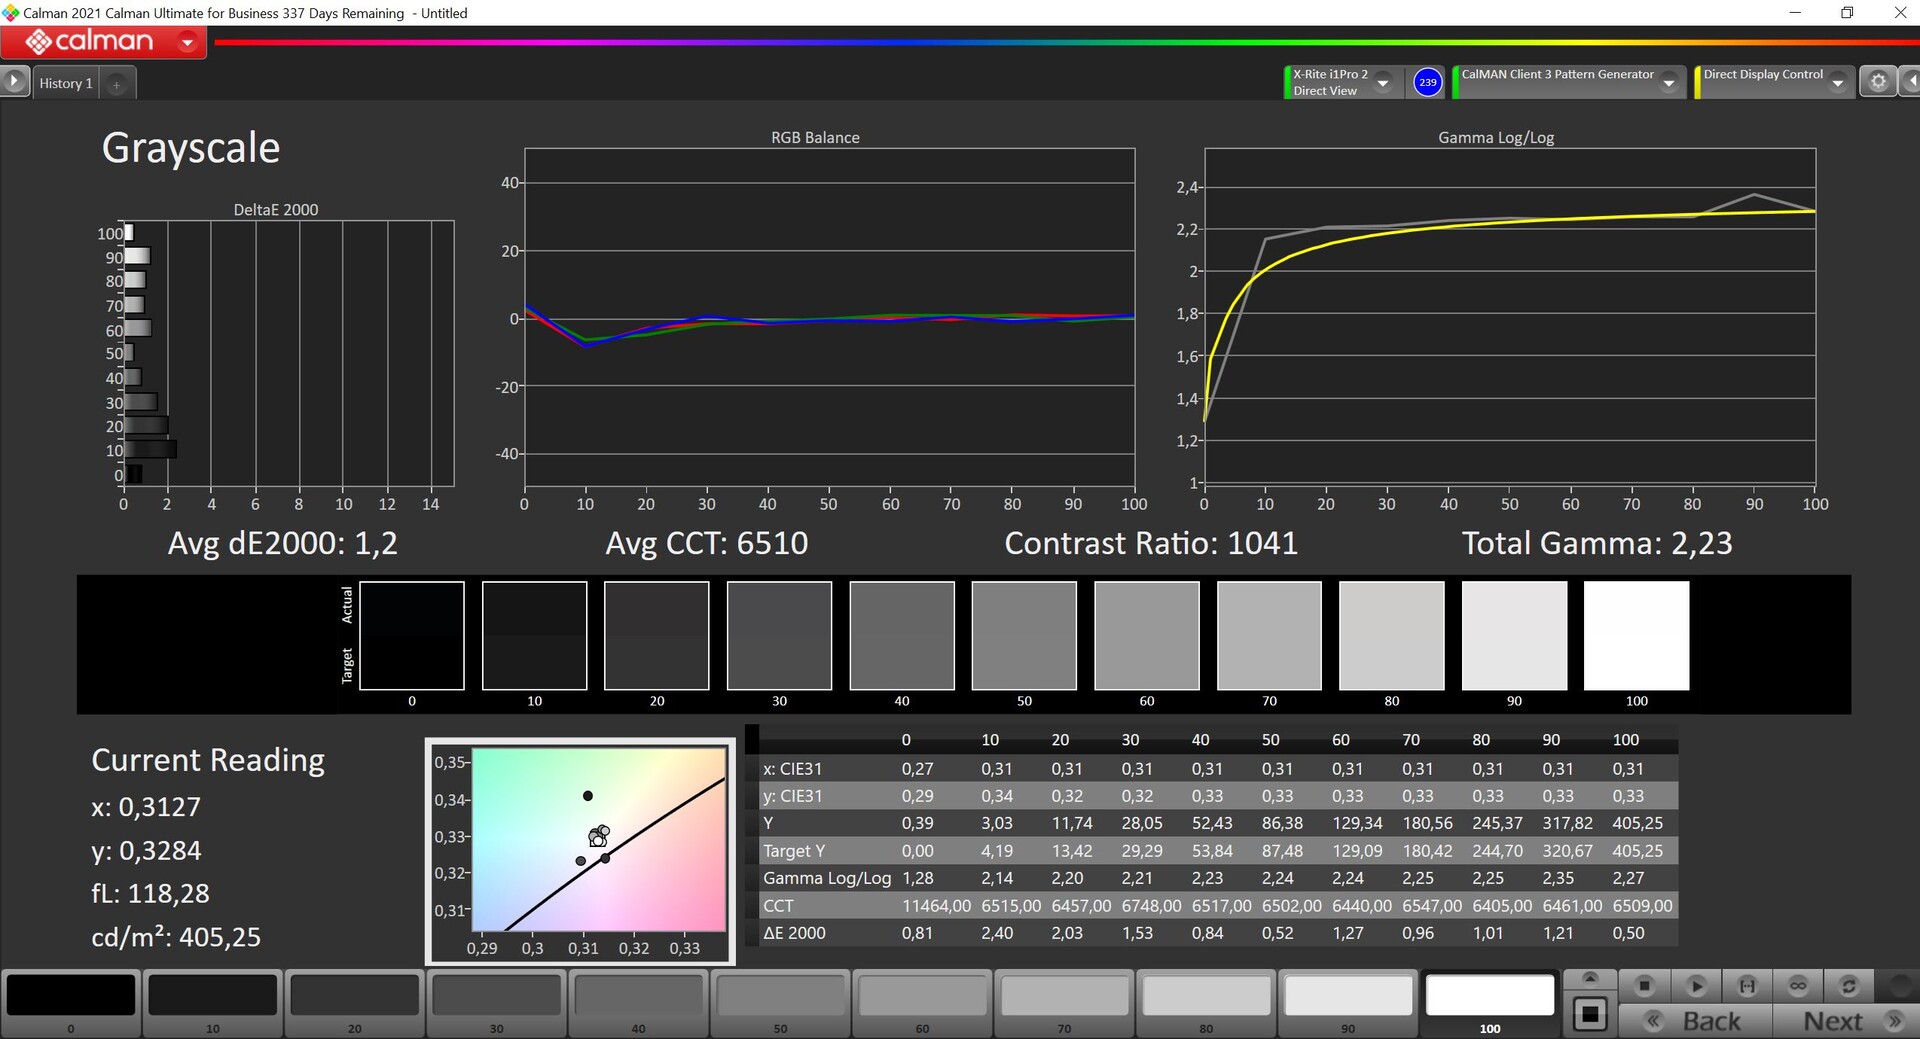
ΔE Greyscale Calman: 2.1 | ∀{0.09-98 Ø4.96}
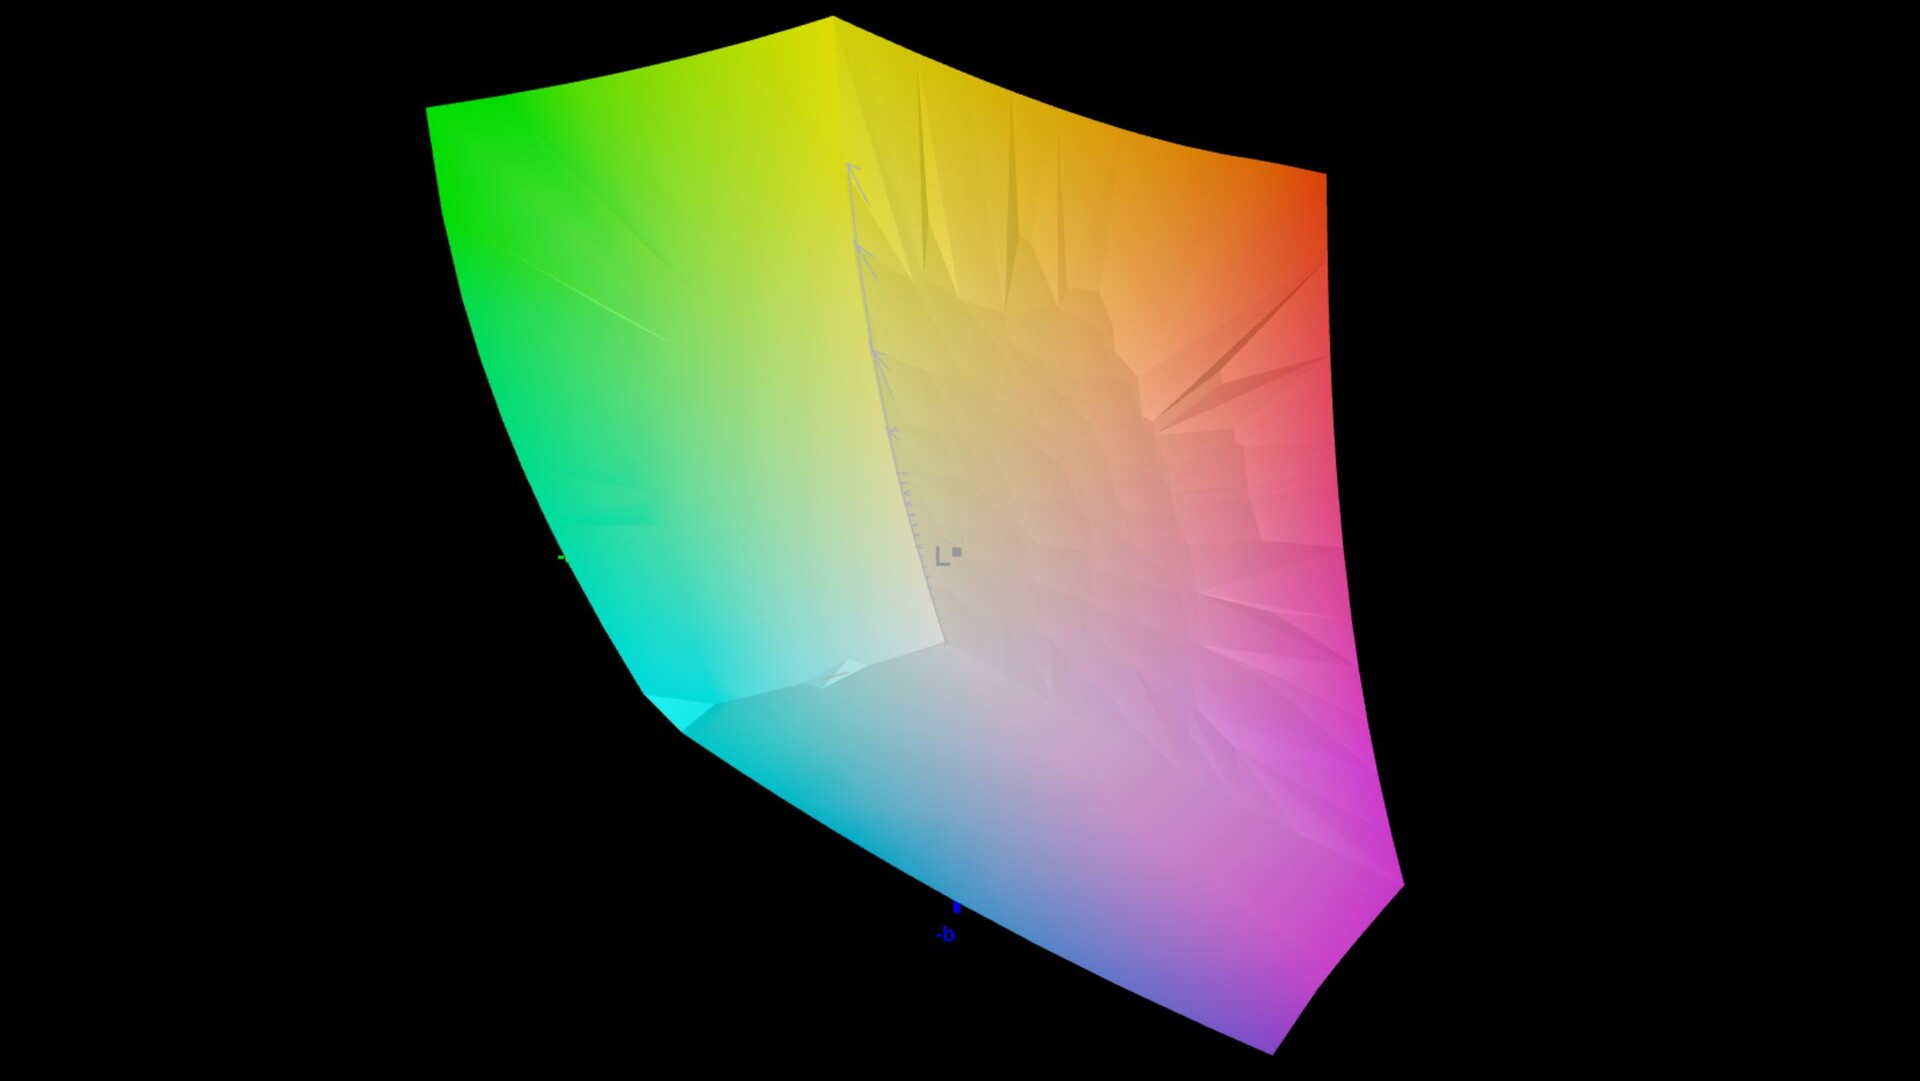
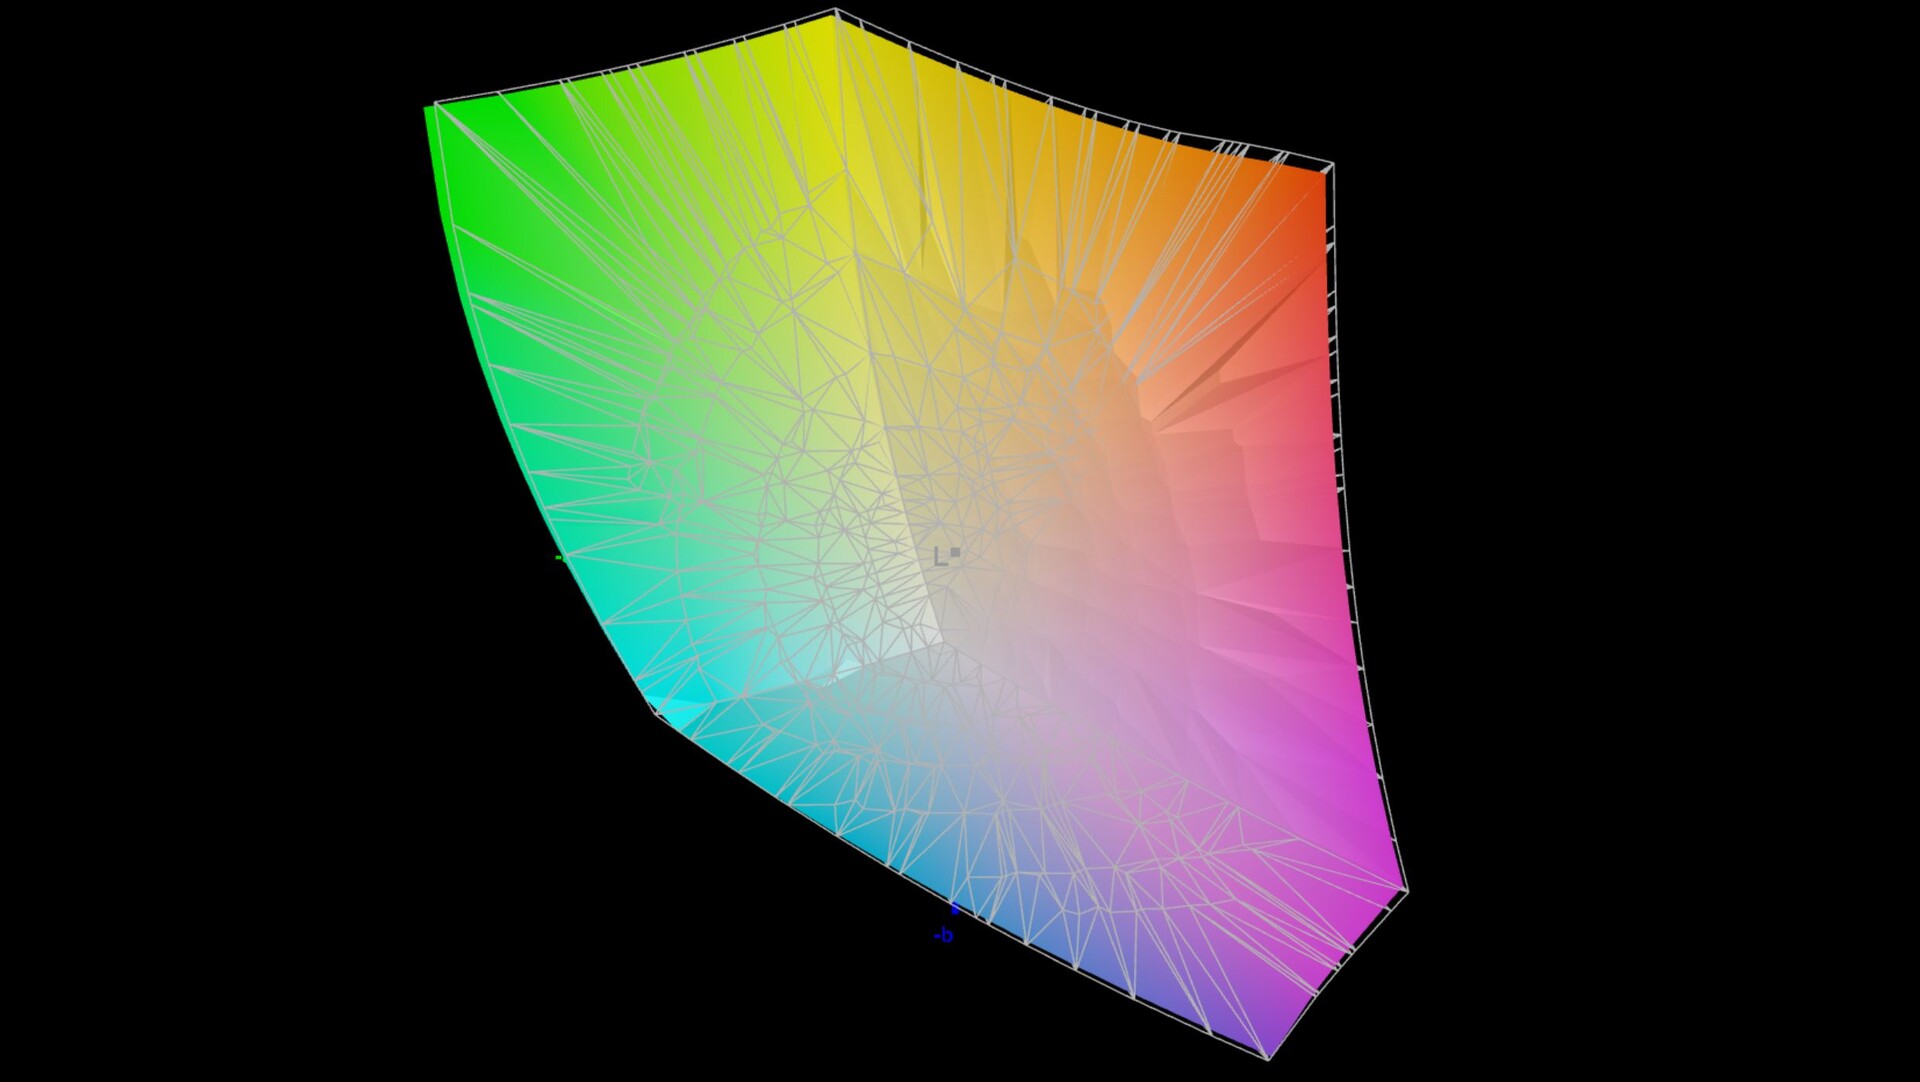
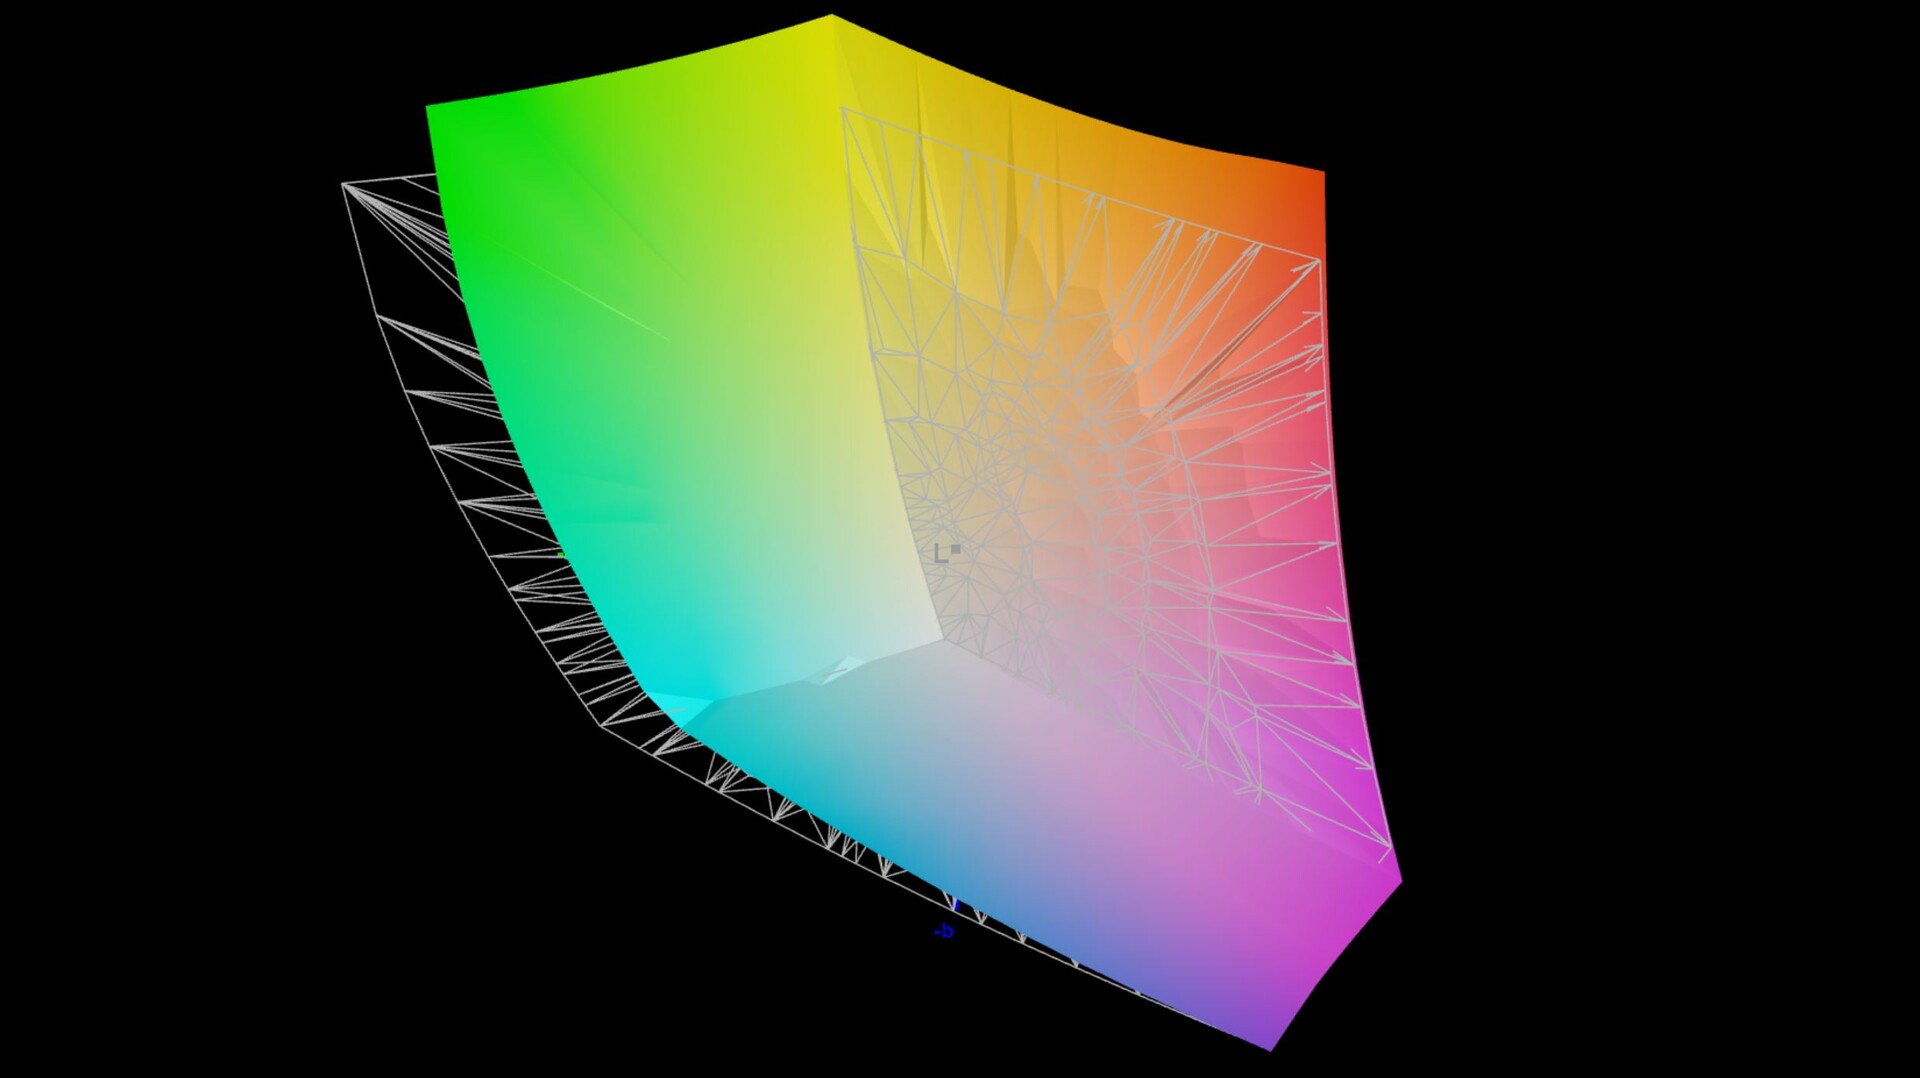
87.4% AdobeRGB 1998 (Argyll 3D)
99.9% sRGB (Argyll 3D)
97.6% Display P3 (Argyll 3D)
Gamma: 2.26
CCT: 6437 K
| MSI CreatorPro Z16P B12UKST B160QAN02.N, IPS, 2560x1600, 16" | HP ZBook Studio 16 G9 62U04EA BOE0A52, IPS, 3840x2400, 16" | Lenovo ThinkPad P1 G4-20Y4S0KS00 LP160UQ1-SPB1, IPS LED, 3840x2400, 16" | Dell Precision 5000 5560 Sharp LQ156R1, IPS, 3840x2400, 15.6" | MSI Creator Z16P B12UHST AUOD298, IPS True Pixel (~100% DCI-P3), 2560x1600, 16" | |
|---|---|---|---|---|---|
| Display | -0% | 0% | 4% | -0% | |
| Display P3 Coverage (%) | 97.6 | 97.5 0% | 85.7 -12% | 94.9 -3% | 97.6 0% |
| sRGB Coverage (%) | 99.9 | 99.9 0% | 99.4 -1% | 100 0% | 99.9 0% |
| AdobeRGB 1998 Coverage (%) | 87.4 | 86.3 -1% | 98.9 13% | 100 14% | 86.8 -1% |
| Response Times | -1% | -327% | -290% | 7% | |
| Response Time Grey 50% / Grey 80% * (ms) | 12.8 ? | 15.3 ? -20% | 55.2 ? -331% | 47.2 ? -269% | 12.9 ? -1% |
| Response Time Black / White * (ms) | 7.4 ? | 6.1 ? 18% | 31.2 ? -322% | 30.4 ? -311% | 6.4 ? 14% |
| PWM Frequency (Hz) | |||||
| Screen | 11% | -11% | -59% | -25% | |
| Brightness middle (cd/m²) | 407 | 554 36% | 630 55% | 501.5 23% | 428 5% |
| Brightness (cd/m²) | 388 | 516 33% | 622 60% | 467 20% | 394 2% |
| Brightness Distribution (%) | 88 | 84 -5% | 90 2% | 83 -6% | 86 -2% |
| Black Level * (cd/m²) | 0.36 | 0.47 -31% | 0.41 -14% | 0.44 -22% | 0.42 -17% |
| Contrast (:1) | 1131 | 1179 4% | 1537 36% | 1140 1% | 1019 -10% |
| Colorchecker dE 2000 * | 1.3 | 1 23% | 2.2 -69% | 4.73 -264% | 1.67 -28% |
| Colorchecker dE 2000 max. * | 2.5 | 2.4 4% | 5 -100% | 8.45 -238% | 5.71 -128% |
| Colorchecker dE 2000 calibrated * | 0.7 | 0.6 14% | 1 -43% | 0.51 27% | 0.71 -1% |
| Greyscale dE 2000 * | 2.1 | 1.6 24% | 2.7 -29% | 3.6 -71% | 3.1 -48% |
| Gamma | 2.26 97% | 2.29 96% | 2.26 97% | 2.08 106% | 2.195 100% |
| CCT | 6437 101% | 6458 101% | 6886 94% | 6447 101% | 6498 100% |
| Totalt genomsnitt (program/inställningar) | 3% /
7% | -113% /
-54% | -115% /
-79% | -6% /
-15% |
* ... mindre är bättre
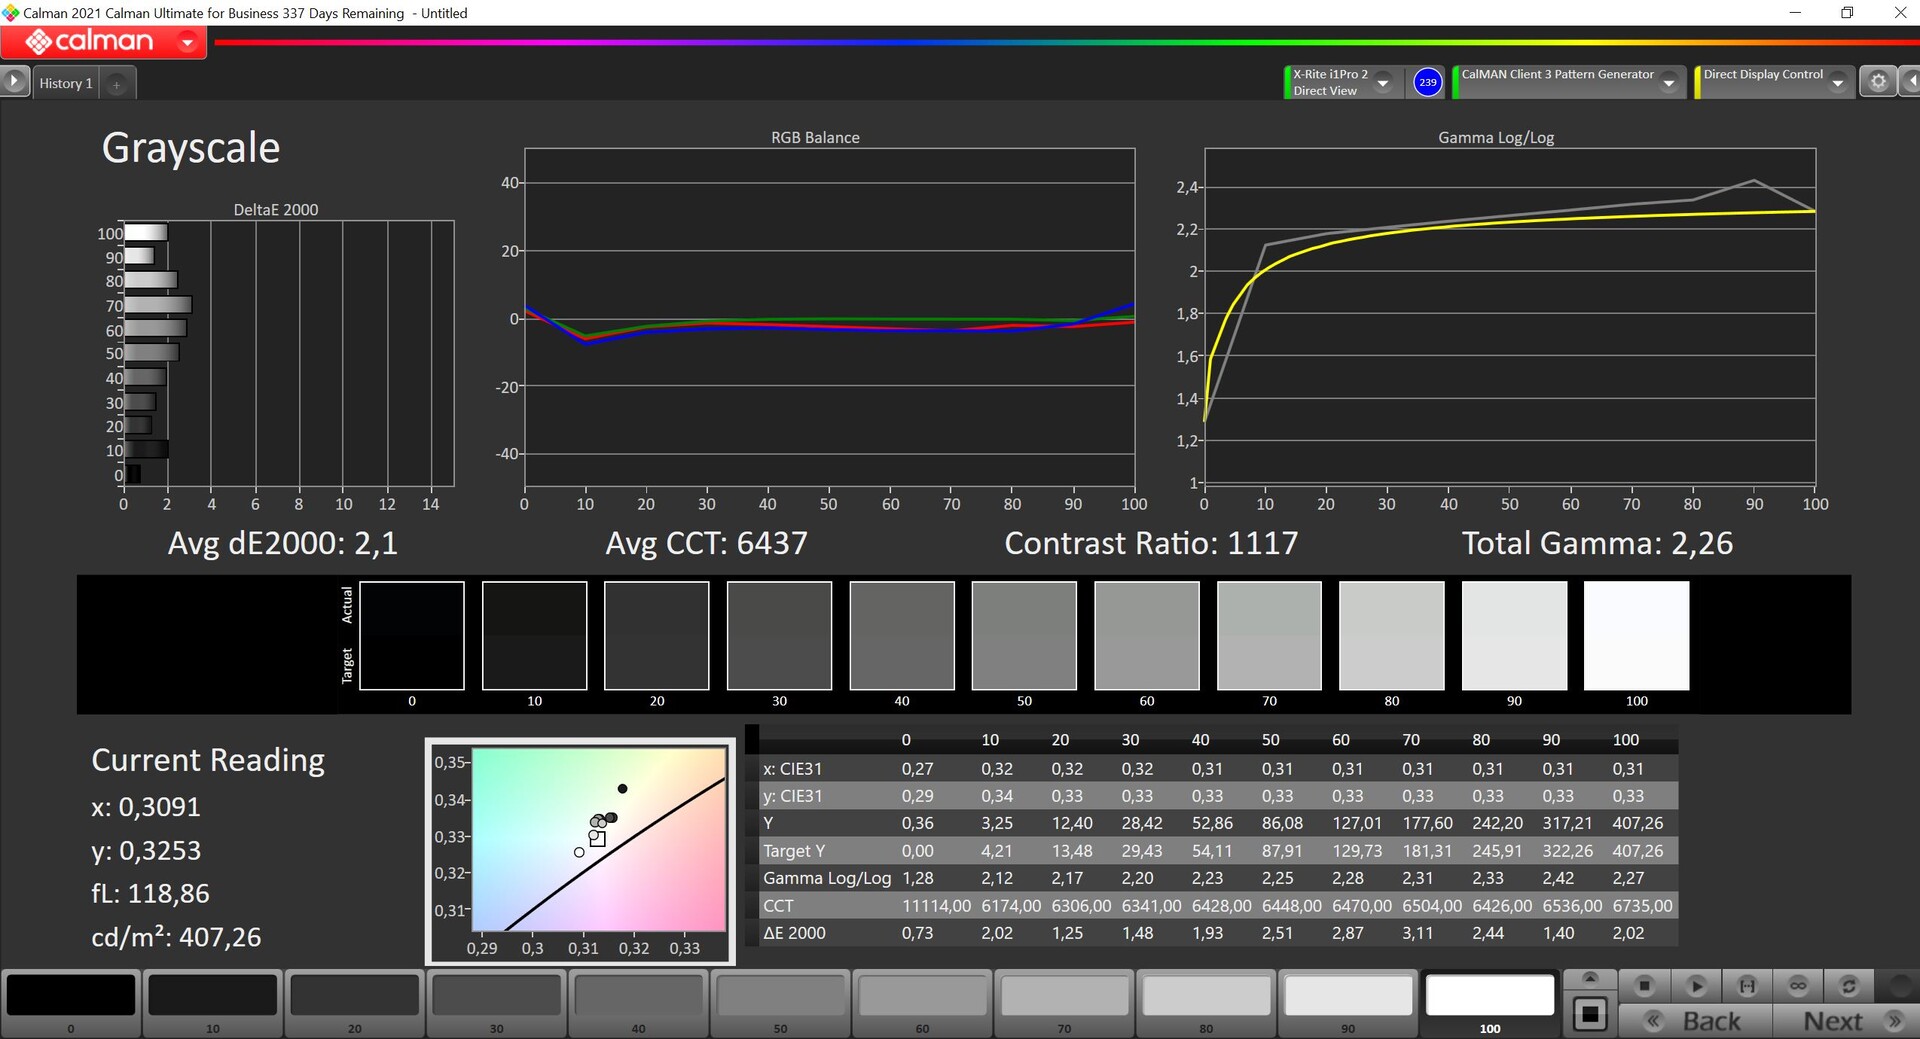
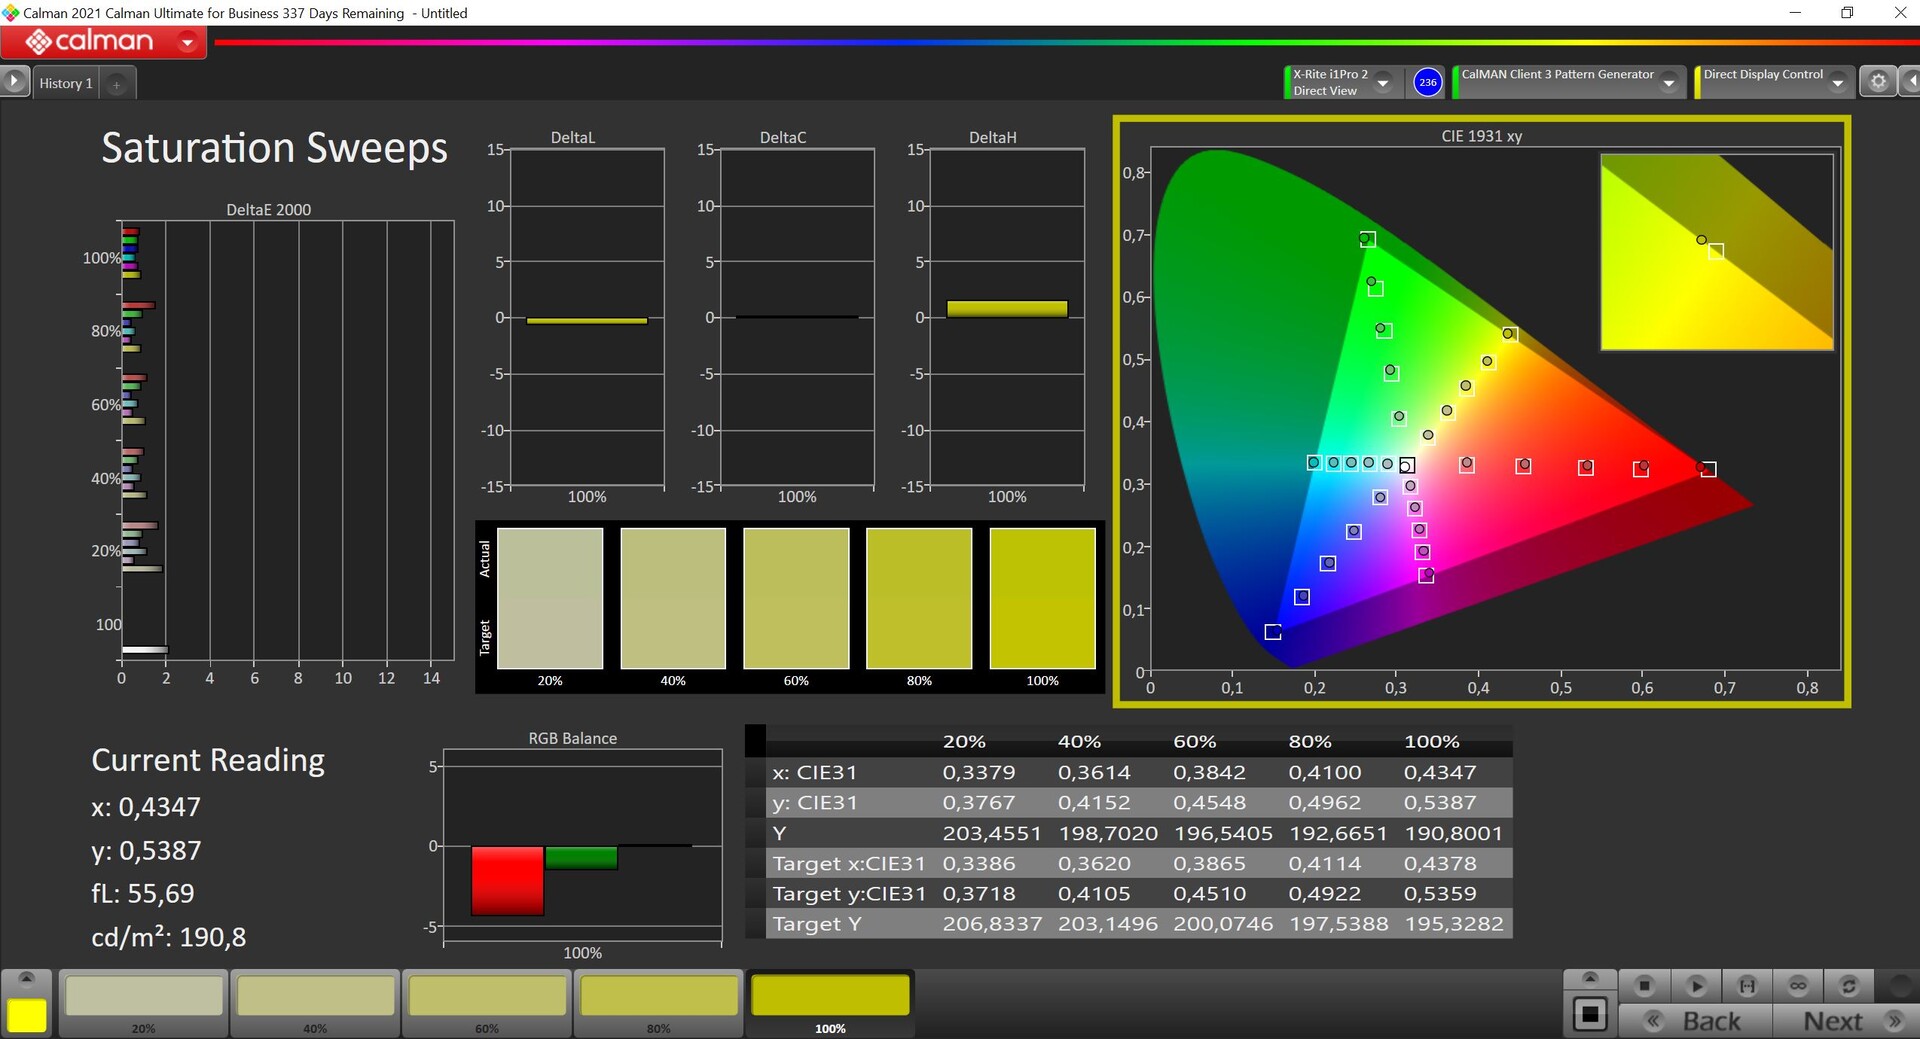
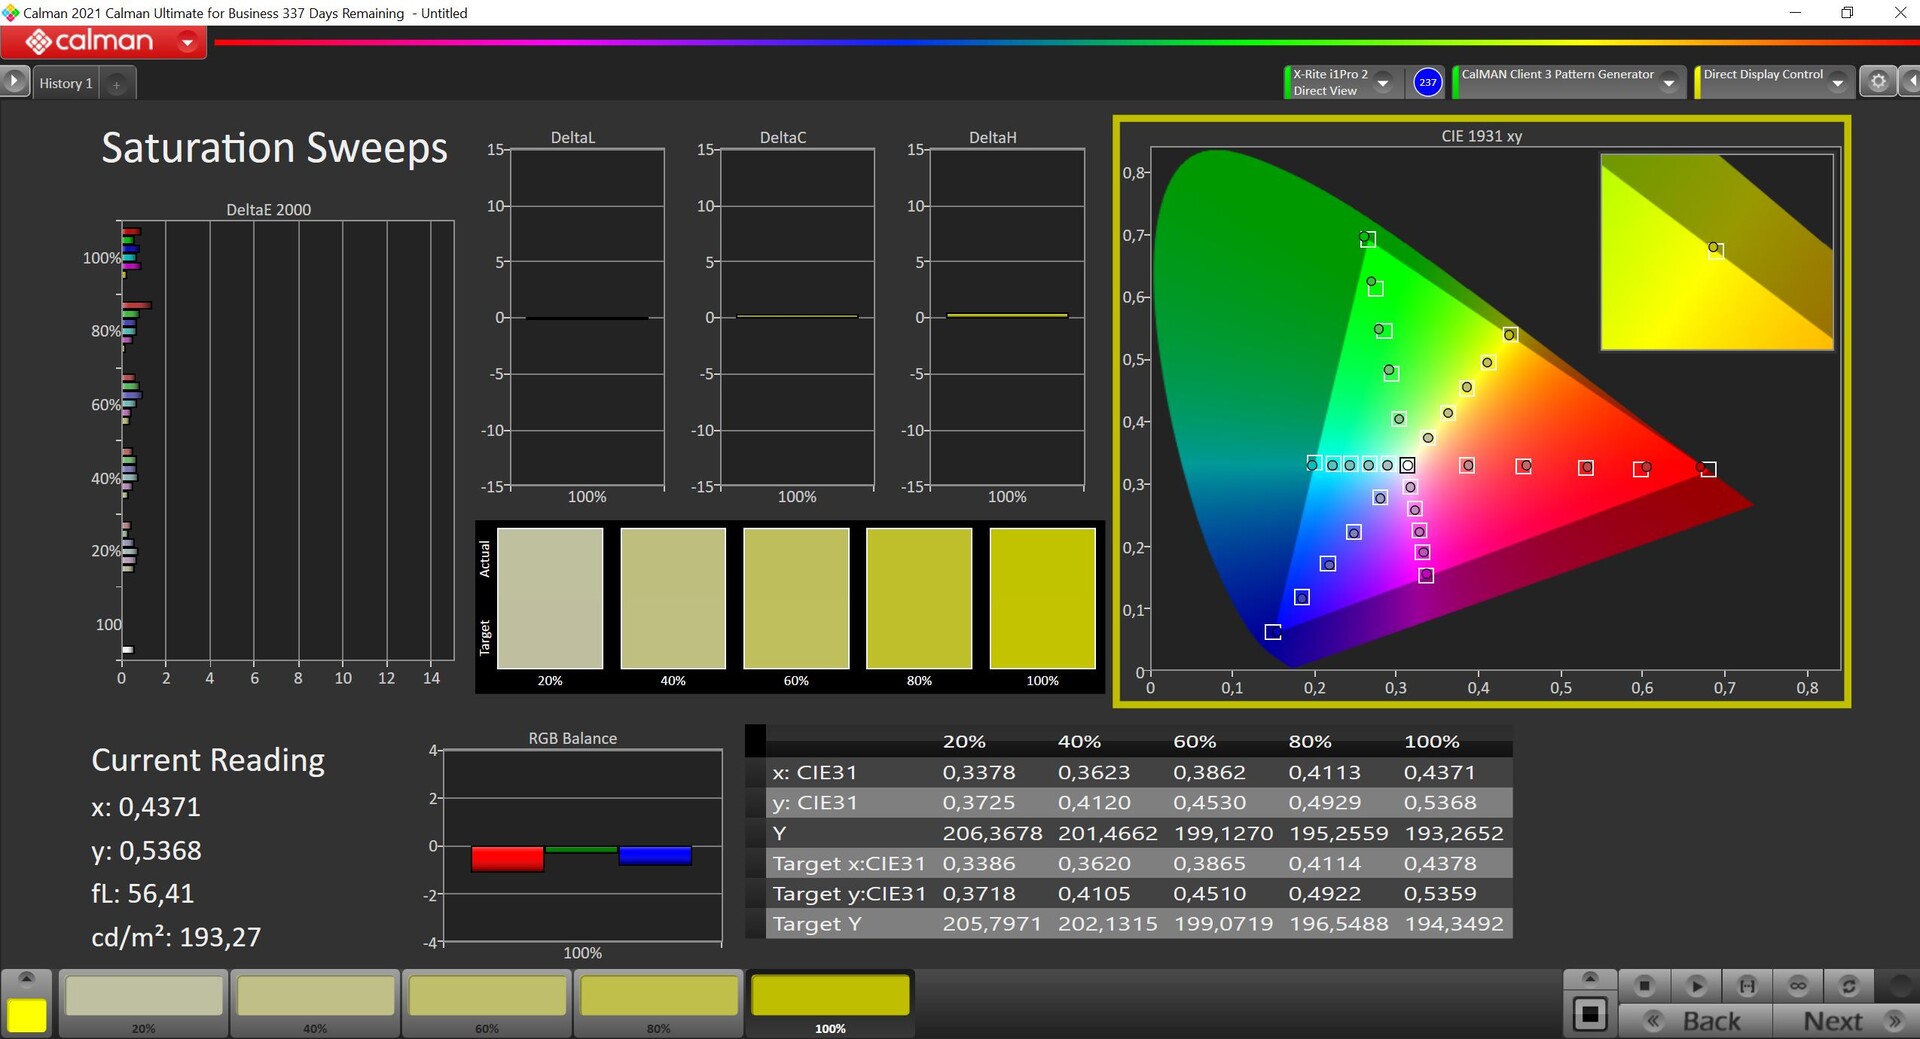
Vår analys med den professionella CalMAN-programvaran (X-Rite i1 Pro 2) visar att panelen är mycket välkalibrerad redan vid leveransen, och den DeltaE-avvikelse på mindre än 2 som MSI uppger jämfört med DCI-P3-referensfärgrymden är korrekt. Avvikelsen är också mycket liten i gråskala, och det finns ingen färgton. Vi kan förbättra avvikelserna ytterligare med vår egen kalibrering (finns att ladda ner gratis från länken längre upp), men det är egentligen inte nödvändigt.
Med TrueColor-programvaran kan du också byta färgrymd, om du till exempel vill arbeta i sRGB-färgrymden. Dessutom kan du med programvaran kalibrera skärmen, och i detta avseende erbjuder CreatorPro Z16P till och med vissa fördelar jämfört med vissa arbetsstationer (t.ex HP:s ZBook-modeller med DreamColor-panelersom vid det här laget inte längre erbjuder någon programvara för bildskärmar).
Visa svarstider
| ↔ Svarstid svart till vitt | ||
|---|---|---|
| 7.4 ms ... stiga ↗ och falla ↘ kombinerat | ↗ 3.4 ms stiga | 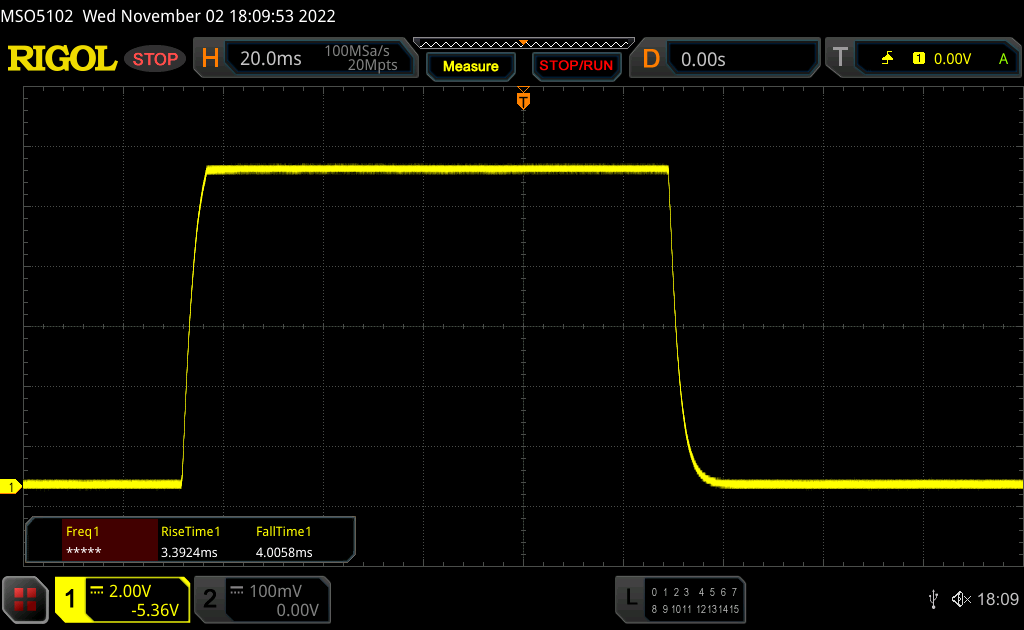 |
| ↘ 4 ms hösten | ||
| Skärmen visar väldigt snabba svarsfrekvenser i våra tester och borde vara mycket väl lämpad för fartfyllt spel. I jämförelse sträcker sig alla testade enheter från 0.1 (minst) till 240 (maximalt) ms. » 22 % av alla enheter är bättre. Det betyder att den uppmätta svarstiden är bättre än genomsnittet av alla testade enheter (19.8 ms). | ||
| ↔ Svarstid 50 % grått till 80 % grått | ||
| 12.8 ms ... stiga ↗ och falla ↘ kombinerat | ↗ 6.2 ms stiga | 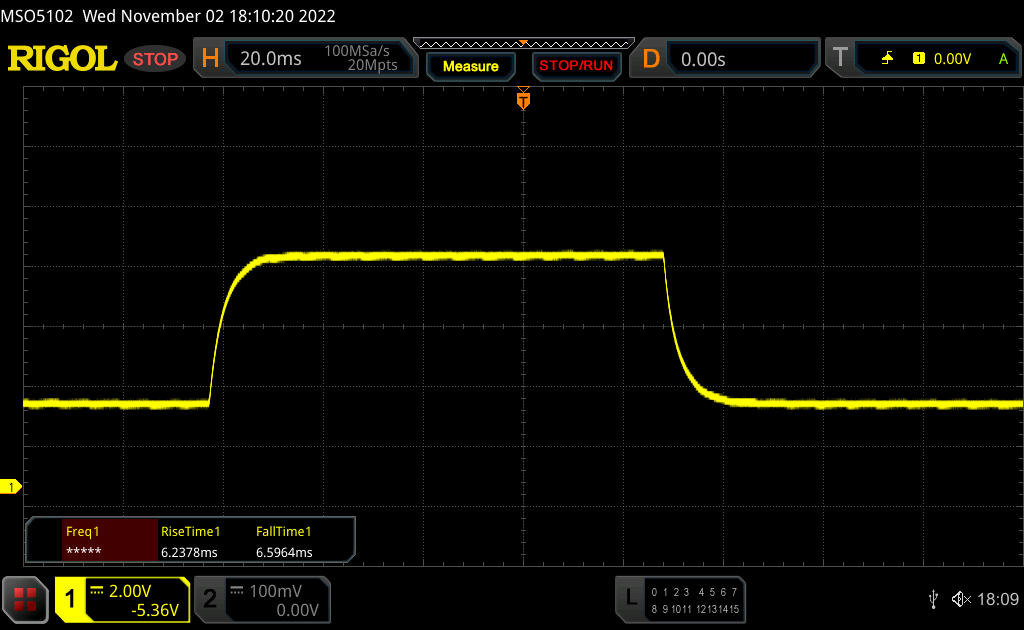 |
| ↘ 6.6 ms hösten | ||
| Skärmen visar bra svarsfrekvens i våra tester, men kan vara för långsam för konkurrenskraftiga spelare. I jämförelse sträcker sig alla testade enheter från 0.165 (minst) till 636 (maximalt) ms. » 26 % av alla enheter är bättre. Det betyder att den uppmätta svarstiden är bättre än genomsnittet av alla testade enheter (31 ms). | ||
Skärmflimmer / PWM (Puls-Width Modulation)
| Skärmflimmer / PWM upptäcktes inte | 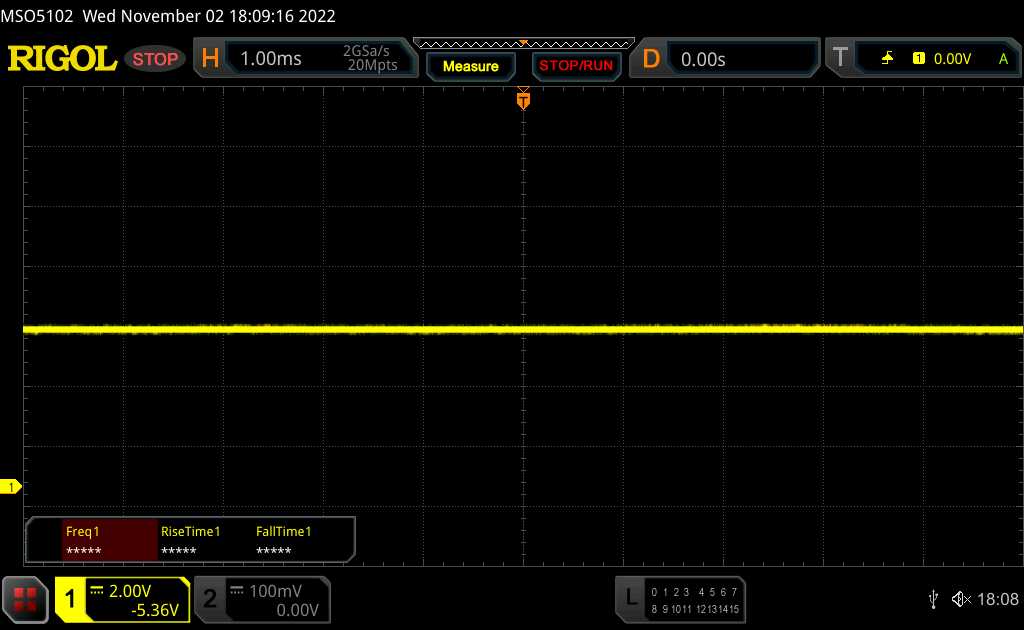 | ||
Som jämförelse: 52 % av alla testade enheter använder inte PWM för att dämpa skärmen. Om PWM upptäcktes mättes ett medelvärde av 7754 (minst: 5 - maximum: 343500) Hz. | |||
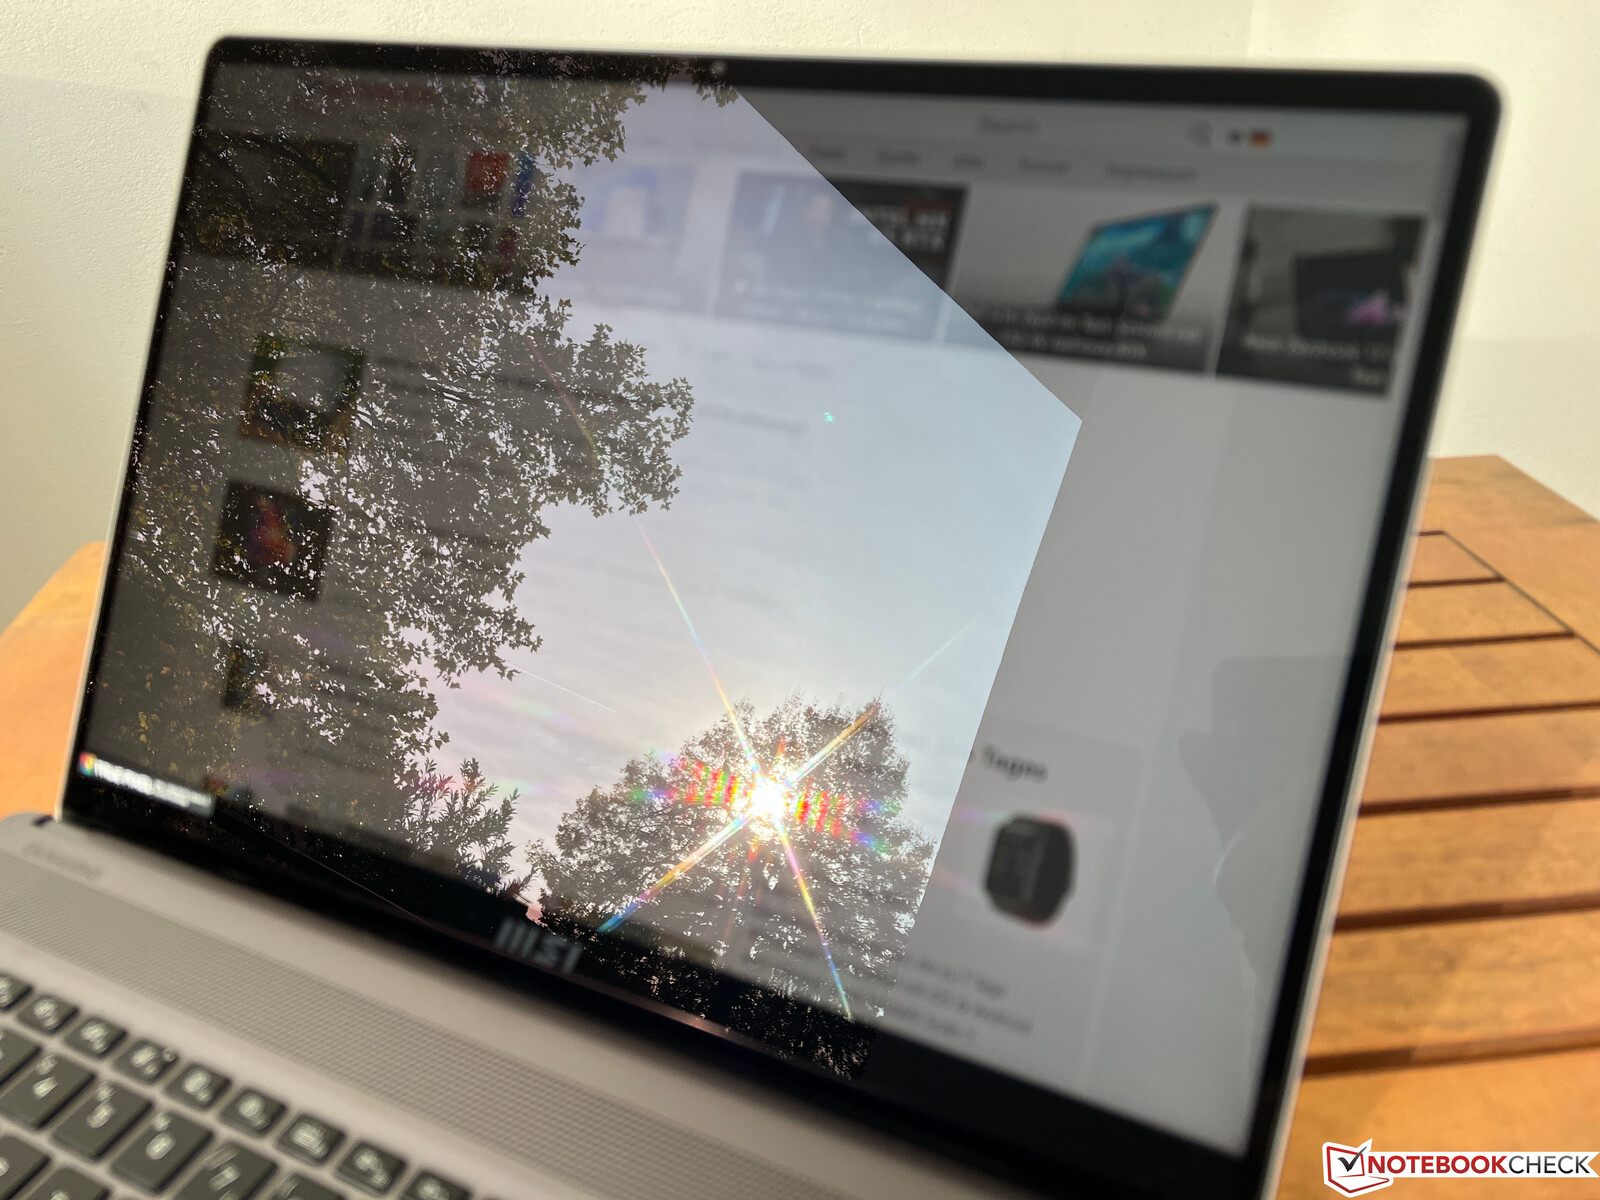
Även om den reflekterande skärmytan bidrar till bildkvaliteten gör den naturligtvis också att det blir svårare att använda den utomhus. Så länge du kan undvika reflektioner från ljuskällor eller ljusa områden kan innehållet fortfarande kännas igen ganska lätt, men de som ibland gillar att arbeta mobilt eller som arbetar i skiftande ljusförhållanden skulle vara bättre betjänta av en matt skärm.

Prestanda - MSI använder Intel Alder Lake och Nvidia Studio
Testförhållanden
Förutom Windows-inställningarna erbjuder MSI också egna strömprofiler i den förinstallerade CenterPro-programvaran och även ett Smart Auto AI-läge, som styr prestandan oberoende av belastningen. Under våra tester fick vi resultat som varierade i delar med strömprofilerna. Bäst resultat fick vi med läget Performance, även om det även här fanns vissa variationer.
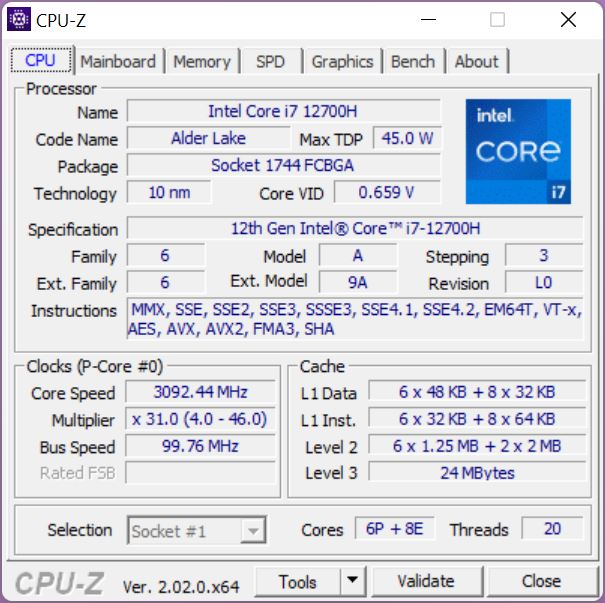
Processor - Core i7-12700H
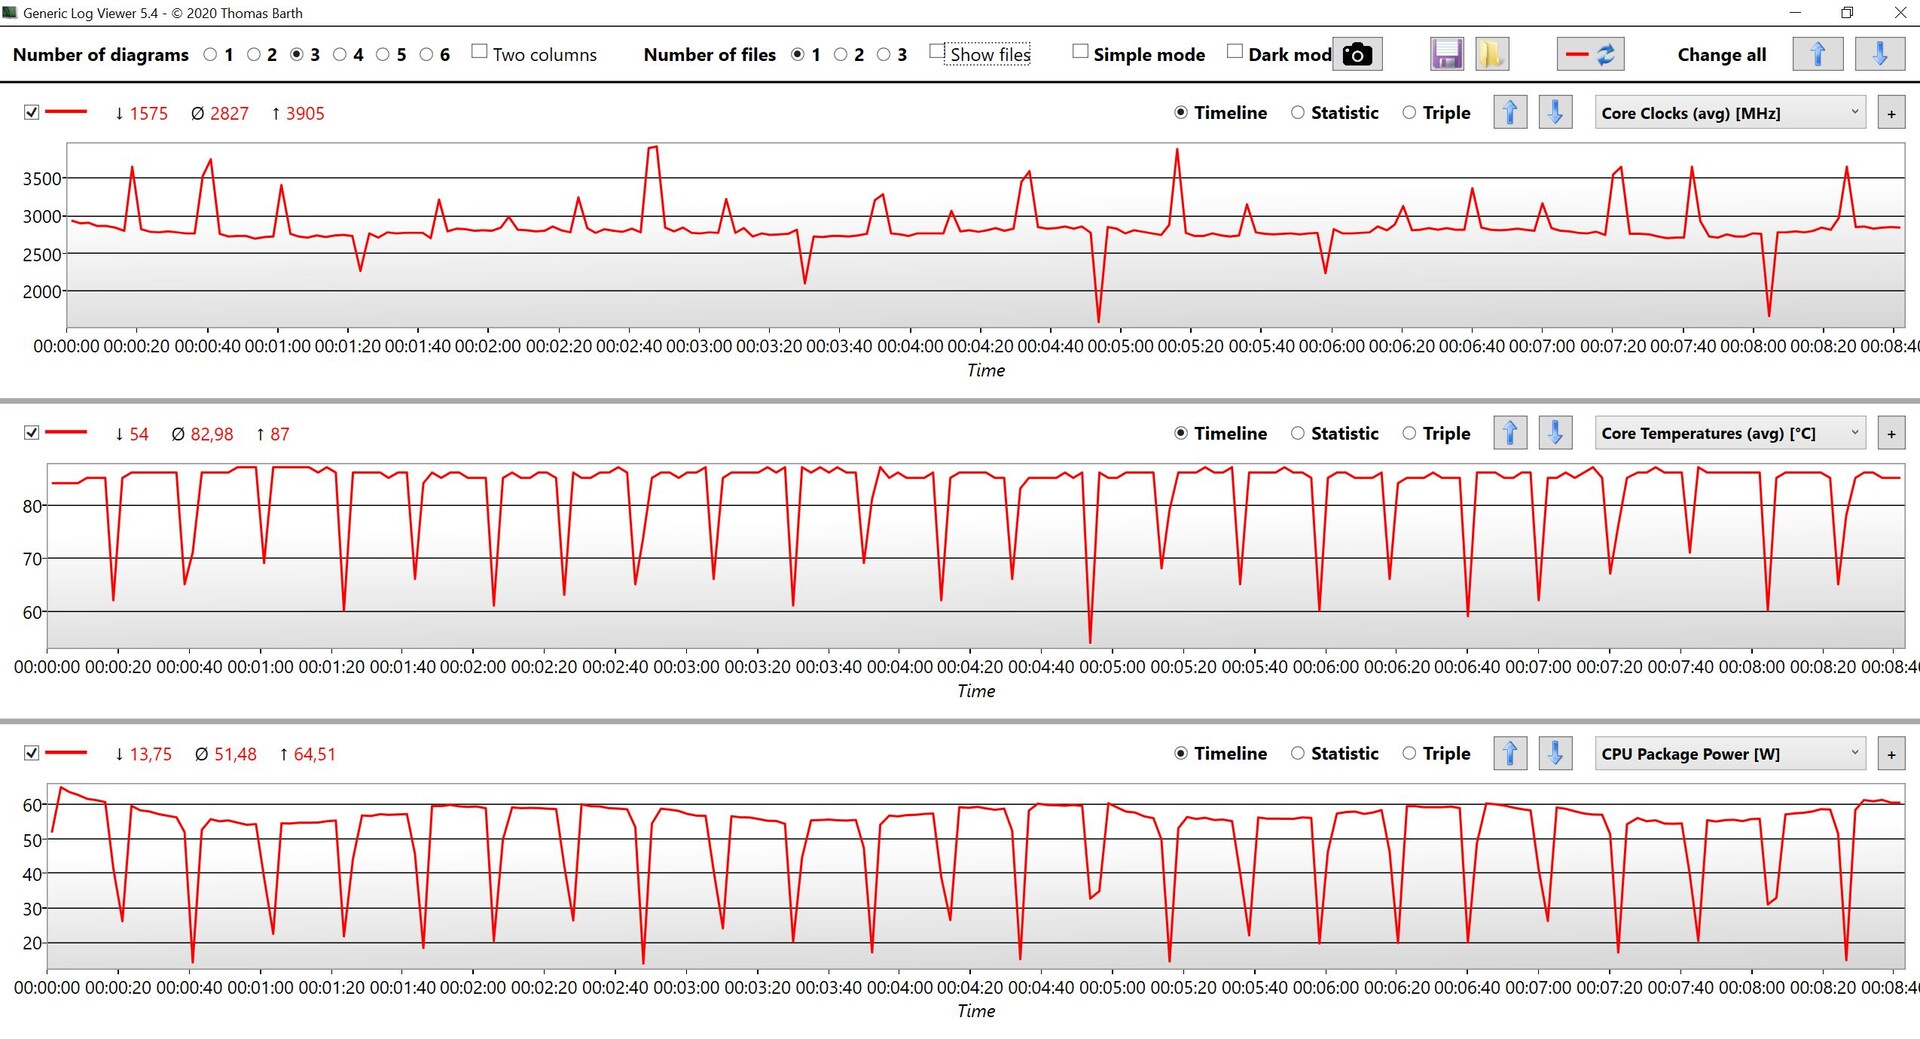
Intel Core i7-12700Hanvänds för närvarande i många bärbara datorer och erbjuder mycket bra prestanda med sina 6 prestandakärnor och 8 effektivitetskärnor, men det kan finnas stora skillnader beroende på TDP-konfigurationen. I CreatorPro Z16P är värdena valda ganska konservativt och de är inte alltid stabila. Ibland tillåts processorn förbruka upp till 76 watt, men i Cinebench-slingan är det bara 55-60 watt. MSI borde ta ett nytt försök med detta och tillåta reproducerbara resultat.
I alla CPU-benchmarks är prestandan dock mycket bra överlag, och placerar sig bara minimalt bakom HP ZBook Studio 16 G9med Core i7-12800H. Den vanliga Creator Z16P i konfigurationen med Core i9-12900H är i genomsnitt cirka 9 % snabbare. Vid batteridrift begränsas processorns strömförbrukning till 45 watt, vilket resulterar i en prestandaförlust på cirka 25 % i flerkärniga tester. Du kan hitta ytterligare CPU-jämförelser i vårt avsnitt om mobila processorer.
Cinebench R15 Multi Constant Load Test
Cinebench R23: Multi Core | Single Core
Cinebench R20: CPU (Multi Core) | CPU (Single Core)
Cinebench R15: CPU Multi 64Bit | CPU Single 64Bit
Blender: v2.79 BMW27 CPU
7-Zip 18.03: 7z b 4 | 7z b 4 -mmt1
Geekbench 5.5: Multi-Core | Single-Core
HWBOT x265 Benchmark v2.2: 4k Preset
LibreOffice : 20 Documents To PDF
R Benchmark 2.5: Overall mean
| CPU Performance rating | |
| Genomsnitt av klass Workstation | |
| MSI Creator Z16P B12UHST | |
| HP ZBook Studio 16 G9 62U04EA | |
| MSI CreatorPro Z16P B12UKST | |
| Genomsnitt Intel Core i7-12700H | |
| Lenovo ThinkPad P1 G4-20Y4S0KS00 | |
| Dell Precision 5000 5560 -2! | |
| Cinebench R23 / Multi Core | |
| Genomsnitt av klass Workstation (14621 - 38520, n=23, senaste 2 åren) | |
| MSI Creator Z16P B12UHST | |
| MSI CreatorPro Z16P B12UKST | |
| HP ZBook Studio 16 G9 62U04EA | |
| Genomsnitt Intel Core i7-12700H (4032 - 19330, n=64) | |
| Lenovo ThinkPad P1 G4-20Y4S0KS00 | |
| Dell Precision 5000 5560 | |
| Cinebench R23 / Single Core | |
| Genomsnitt av klass Workstation (1712 - 2228, n=23, senaste 2 åren) | |
| MSI Creator Z16P B12UHST | |
| HP ZBook Studio 16 G9 62U04EA | |
| Genomsnitt Intel Core i7-12700H (778 - 1826, n=63) | |
| MSI CreatorPro Z16P B12UKST | |
| Lenovo ThinkPad P1 G4-20Y4S0KS00 | |
| Dell Precision 5000 5560 | |
| Cinebench R20 / CPU (Multi Core) | |
| Genomsnitt av klass Workstation (5760 - 15043, n=23, senaste 2 åren) | |
| MSI Creator Z16P B12UHST | |
| MSI CreatorPro Z16P B12UKST | |
| HP ZBook Studio 16 G9 62U04EA | |
| Genomsnitt Intel Core i7-12700H (1576 - 7407, n=64) | |
| Lenovo ThinkPad P1 G4-20Y4S0KS00 | |
| Dell Precision 5000 5560 | |
| Cinebench R20 / CPU (Single Core) | |
| Genomsnitt av klass Workstation (671 - 857, n=23, senaste 2 åren) | |
| MSI Creator Z16P B12UHST | |
| HP ZBook Studio 16 G9 62U04EA | |
| Genomsnitt Intel Core i7-12700H (300 - 704, n=64) | |
| MSI CreatorPro Z16P B12UKST | |
| Lenovo ThinkPad P1 G4-20Y4S0KS00 | |
| Dell Precision 5000 5560 | |
| Cinebench R15 / CPU Multi 64Bit | |
| Genomsnitt av klass Workstation (2489 - 5810, n=23, senaste 2 åren) | |
| MSI Creator Z16P B12UHST | |
| HP ZBook Studio 16 G9 62U04EA | |
| Genomsnitt Intel Core i7-12700H (1379 - 2916, n=70) | |
| MSI CreatorPro Z16P B12UKST | |
| Lenovo ThinkPad P1 G4-20Y4S0KS00 | |
| Dell Precision 5000 5560 | |
| Cinebench R15 / CPU Single 64Bit | |
| Genomsnitt av klass Workstation (191.4 - 328, n=23, senaste 2 åren) | |
| MSI Creator Z16P B12UHST | |
| HP ZBook Studio 16 G9 62U04EA | |
| Genomsnitt Intel Core i7-12700H (113 - 263, n=65) | |
| MSI CreatorPro Z16P B12UKST | |
| Lenovo ThinkPad P1 G4-20Y4S0KS00 | |
| Dell Precision 5000 5560 | |
| Blender / v2.79 BMW27 CPU | |
| Dell Precision 5000 5560 | |
| Lenovo ThinkPad P1 G4-20Y4S0KS00 | |
| Genomsnitt Intel Core i7-12700H (168 - 732, n=63) | |
| MSI CreatorPro Z16P B12UKST | |
| HP ZBook Studio 16 G9 62U04EA | |
| MSI Creator Z16P B12UHST | |
| Genomsnitt av klass Workstation (91 - 222, n=23, senaste 2 åren) | |
| 7-Zip 18.03 / 7z b 4 | |
| Genomsnitt av klass Workstation (60489 - 116969, n=23, senaste 2 åren) | |
| MSI Creator Z16P B12UHST | |
| HP ZBook Studio 16 G9 62U04EA | |
| MSI CreatorPro Z16P B12UKST | |
| Genomsnitt Intel Core i7-12700H (22844 - 73067, n=63) | |
| Lenovo ThinkPad P1 G4-20Y4S0KS00 | |
| Dell Precision 5000 5560 | |
| 7-Zip 18.03 / 7z b 4 -mmt1 | |
| Genomsnitt av klass Workstation (5126 - 6960, n=23, senaste 2 åren) | |
| MSI Creator Z16P B12UHST | |
| HP ZBook Studio 16 G9 62U04EA | |
| MSI CreatorPro Z16P B12UKST | |
| Lenovo ThinkPad P1 G4-20Y4S0KS00 | |
| Dell Precision 5000 5560 | |
| Genomsnitt Intel Core i7-12700H (2743 - 5972, n=63) | |
| Geekbench 5.5 / Multi-Core | |
| Genomsnitt av klass Workstation (11542 - 25554, n=23, senaste 2 åren) | |
| MSI Creator Z16P B12UHST | |
| HP ZBook Studio 16 G9 62U04EA | |
| MSI CreatorPro Z16P B12UKST | |
| Genomsnitt Intel Core i7-12700H (5144 - 13745, n=64) | |
| Lenovo ThinkPad P1 G4-20Y4S0KS00 | |
| Geekbench 5.5 / Single-Core | |
| Genomsnitt av klass Workstation (1783 - 2183, n=23, senaste 2 åren) | |
| MSI Creator Z16P B12UHST | |
| HP ZBook Studio 16 G9 62U04EA | |
| MSI CreatorPro Z16P B12UKST | |
| Genomsnitt Intel Core i7-12700H (803 - 1851, n=64) | |
| Lenovo ThinkPad P1 G4-20Y4S0KS00 | |
| HWBOT x265 Benchmark v2.2 / 4k Preset | |
| Genomsnitt av klass Workstation (17.8 - 40.5, n=23, senaste 2 åren) | |
| HP ZBook Studio 16 G9 62U04EA | |
| MSI CreatorPro Z16P B12UKST | |
| MSI Creator Z16P B12UHST | |
| Genomsnitt Intel Core i7-12700H (4.67 - 21.8, n=64) | |
| Lenovo ThinkPad P1 G4-20Y4S0KS00 | |
| Dell Precision 5000 5560 | |
| LibreOffice / 20 Documents To PDF | |
| Dell Precision 5000 5560 | |
| Genomsnitt av klass Workstation (37.1 - 74.7, n=23, senaste 2 åren) | |
| Genomsnitt Intel Core i7-12700H (34.2 - 95.3, n=63) | |
| Lenovo ThinkPad P1 G4-20Y4S0KS00 | |
| HP ZBook Studio 16 G9 62U04EA | |
| MSI Creator Z16P B12UHST | |
| MSI CreatorPro Z16P B12UKST | |
| R Benchmark 2.5 / Overall mean | |
| Dell Precision 5000 5560 | |
| Lenovo ThinkPad P1 G4-20Y4S0KS00 | |
| Genomsnitt Intel Core i7-12700H (0.4441 - 1.052, n=63) | |
| MSI CreatorPro Z16P B12UKST | |
| HP ZBook Studio 16 G9 62U04EA | |
| Genomsnitt av klass Workstation (0.3825 - 0.603, n=23, senaste 2 åren) | |
| MSI Creator Z16P B12UHST | |
* ... mindre är bättre
AIDA64: FP32 Ray-Trace | FPU Julia | CPU SHA3 | CPU Queen | FPU SinJulia | FPU Mandel | CPU AES | CPU ZLib | FP64 Ray-Trace | CPU PhotoWorxx
| Performance rating | |
| Genomsnitt av klass Workstation | |
| MSI CreatorPro Z16P B12UKST | |
| HP ZBook Studio 16 G9 62U04EA | |
| Lenovo ThinkPad P1 G4-20Y4Z9DVUS | |
| MSI Creator Z16P B12UHST | |
| Genomsnitt Intel Core i7-12700H | |
| AIDA64 / FP32 Ray-Trace | |
| Genomsnitt av klass Workstation (16730 - 61611, n=23, senaste 2 åren) | |
| Lenovo ThinkPad P1 G4-20Y4Z9DVUS | |
| HP ZBook Studio 16 G9 62U04EA | |
| MSI CreatorPro Z16P B12UKST | |
| Genomsnitt Intel Core i7-12700H (2585 - 17957, n=64) | |
| MSI Creator Z16P B12UHST | |
| AIDA64 / FPU Julia | |
| Genomsnitt av klass Workstation (89597 - 186971, n=23, senaste 2 åren) | |
| HP ZBook Studio 16 G9 62U04EA | |
| MSI CreatorPro Z16P B12UKST | |
| Lenovo ThinkPad P1 G4-20Y4Z9DVUS | |
| Genomsnitt Intel Core i7-12700H (12439 - 90760, n=64) | |
| MSI Creator Z16P B12UHST | |
| AIDA64 / CPU SHA3 | |
| Genomsnitt av klass Workstation (4178 - 8975, n=23, senaste 2 åren) | |
| Lenovo ThinkPad P1 G4-20Y4Z9DVUS | |
| HP ZBook Studio 16 G9 62U04EA | |
| MSI CreatorPro Z16P B12UKST | |
| Genomsnitt Intel Core i7-12700H (833 - 4242, n=64) | |
| MSI Creator Z16P B12UHST | |
| AIDA64 / CPU Queen | |
| Genomsnitt av klass Workstation (60778 - 144411, n=23, senaste 2 åren) | |
| HP ZBook Studio 16 G9 62U04EA | |
| MSI Creator Z16P B12UHST | |
| MSI CreatorPro Z16P B12UKST | |
| Genomsnitt Intel Core i7-12700H (57923 - 103202, n=63) | |
| Lenovo ThinkPad P1 G4-20Y4Z9DVUS | |
| AIDA64 / FPU SinJulia | |
| Genomsnitt av klass Workstation (8165 - 29343, n=23, senaste 2 åren) | |
| MSI Creator Z16P B12UHST | |
| Lenovo ThinkPad P1 G4-20Y4Z9DVUS | |
| HP ZBook Studio 16 G9 62U04EA | |
| MSI CreatorPro Z16P B12UKST | |
| Genomsnitt Intel Core i7-12700H (3249 - 9939, n=64) | |
| AIDA64 / FPU Mandel | |
| Genomsnitt av klass Workstation (44497 - 98153, n=23, senaste 2 åren) | |
| HP ZBook Studio 16 G9 62U04EA | |
| Lenovo ThinkPad P1 G4-20Y4Z9DVUS | |
| MSI CreatorPro Z16P B12UKST | |
| Genomsnitt Intel Core i7-12700H (7135 - 44760, n=64) | |
| MSI Creator Z16P B12UHST | |
| AIDA64 / CPU AES | |
| MSI CreatorPro Z16P B12UKST | |
| Genomsnitt av klass Workstation (73133 - 187841, n=23, senaste 2 åren) | |
| MSI Creator Z16P B12UHST | |
| Lenovo ThinkPad P1 G4-20Y4Z9DVUS | |
| Genomsnitt Intel Core i7-12700H (31839 - 144360, n=64) | |
| HP ZBook Studio 16 G9 62U04EA | |
| AIDA64 / CPU ZLib | |
| Genomsnitt av klass Workstation (929 - 2148, n=23, senaste 2 åren) | |
| MSI Creator Z16P B12UHST | |
| HP ZBook Studio 16 G9 62U04EA | |
| MSI CreatorPro Z16P B12UKST | |
| Genomsnitt Intel Core i7-12700H (305 - 1171, n=64) | |
| Lenovo ThinkPad P1 G4-20Y4Z9DVUS | |
| AIDA64 / FP64 Ray-Trace | |
| Genomsnitt av klass Workstation (8545 - 32891, n=23, senaste 2 åren) | |
| HP ZBook Studio 16 G9 62U04EA | |
| Lenovo ThinkPad P1 G4-20Y4Z9DVUS | |
| MSI CreatorPro Z16P B12UKST | |
| Genomsnitt Intel Core i7-12700H (1437 - 9692, n=64) | |
| MSI Creator Z16P B12UHST | |
| AIDA64 / CPU PhotoWorxx | |
| Genomsnitt av klass Workstation (37151 - 93684, n=23, senaste 2 åren) | |
| MSI CreatorPro Z16P B12UKST | |
| MSI Creator Z16P B12UHST | |
| HP ZBook Studio 16 G9 62U04EA | |
| Genomsnitt Intel Core i7-12700H (12863 - 52207, n=64) | |
| Lenovo ThinkPad P1 G4-20Y4Z9DVUS | |
Systemets prestanda
Det är inte särskilt förvånande att det inte finns några problem alls med den grundläggande systemprestandan. I våra tester är den bärbara datorn alltid mycket lyhörd, och benchmarkresultaten är också mycket bra.
CrossMark: Overall | Productivity | Creativity | Responsiveness
| PCMark 10 / Score | |
| Genomsnitt av klass Workstation (6563 - 10409, n=19, senaste 2 åren) | |
| MSI Creator Z16P B12UHST | |
| Lenovo ThinkPad P1 G4-20Y4S0KS00 | |
| MSI CreatorPro Z16P B12UKST | |
| Genomsnitt Intel Core i7-12700H, NVIDIA RTX A3000 Laptop GPU (n=1) | |
| Dell Precision 5000 5560 | |
| HP ZBook Studio 16 G9 62U04EA | |
| PCMark 10 / Essentials | |
| MSI Creator Z16P B12UHST | |
| Lenovo ThinkPad P1 G4-20Y4S0KS00 | |
| Dell Precision 5000 5560 | |
| MSI CreatorPro Z16P B12UKST | |
| Genomsnitt Intel Core i7-12700H, NVIDIA RTX A3000 Laptop GPU (n=1) | |
| Genomsnitt av klass Workstation (9622 - 11157, n=19, senaste 2 åren) | |
| HP ZBook Studio 16 G9 62U04EA | |
| PCMark 10 / Productivity | |
| Genomsnitt av klass Workstation (8789 - 20616, n=19, senaste 2 åren) | |
| MSI Creator Z16P B12UHST | |
| MSI CreatorPro Z16P B12UKST | |
| Genomsnitt Intel Core i7-12700H, NVIDIA RTX A3000 Laptop GPU (n=1) | |
| Dell Precision 5000 5560 | |
| Lenovo ThinkPad P1 G4-20Y4S0KS00 | |
| HP ZBook Studio 16 G9 62U04EA | |
| PCMark 10 / Digital Content Creation | |
| Genomsnitt av klass Workstation (8108 - 15631, n=19, senaste 2 åren) | |
| MSI Creator Z16P B12UHST | |
| Lenovo ThinkPad P1 G4-20Y4S0KS00 | |
| MSI CreatorPro Z16P B12UKST | |
| Genomsnitt Intel Core i7-12700H, NVIDIA RTX A3000 Laptop GPU (n=1) | |
| HP ZBook Studio 16 G9 62U04EA | |
| Dell Precision 5000 5560 | |
| CrossMark / Overall | |
| MSI CreatorPro Z16P B12UKST | |
| Genomsnitt Intel Core i7-12700H, NVIDIA RTX A3000 Laptop GPU (n=1) | |
| Genomsnitt av klass Workstation (1307 - 2267, n=22, senaste 2 åren) | |
| HP ZBook Studio 16 G9 62U04EA | |
| Lenovo ThinkPad P1 G4-20Y4S0KS00 | |
| CrossMark / Productivity | |
| MSI CreatorPro Z16P B12UKST | |
| Genomsnitt Intel Core i7-12700H, NVIDIA RTX A3000 Laptop GPU (n=1) | |
| Genomsnitt av klass Workstation (1130 - 2122, n=22, senaste 2 åren) | |
| HP ZBook Studio 16 G9 62U04EA | |
| Lenovo ThinkPad P1 G4-20Y4S0KS00 | |
| CrossMark / Creativity | |
| Genomsnitt av klass Workstation (1657 - 2725, n=22, senaste 2 åren) | |
| HP ZBook Studio 16 G9 62U04EA | |
| MSI CreatorPro Z16P B12UKST | |
| Genomsnitt Intel Core i7-12700H, NVIDIA RTX A3000 Laptop GPU (n=1) | |
| Lenovo ThinkPad P1 G4-20Y4S0KS00 | |
| CrossMark / Responsiveness | |
| MSI CreatorPro Z16P B12UKST | |
| Genomsnitt Intel Core i7-12700H, NVIDIA RTX A3000 Laptop GPU (n=1) | |
| Genomsnitt av klass Workstation (993 - 2096, n=22, senaste 2 åren) | |
| HP ZBook Studio 16 G9 62U04EA | |
| Lenovo ThinkPad P1 G4-20Y4S0KS00 | |
| PCMark 10 Score | 7086 poäng | |
Hjälp | ||
| AIDA64 / Memory Copy | |
| Genomsnitt av klass Workstation (56003 - 164795, n=23, senaste 2 åren) | |
| MSI Creator Z16P B12UHST | |
| MSI CreatorPro Z16P B12UKST | |
| HP ZBook Studio 16 G9 62U04EA | |
| Genomsnitt Intel Core i7-12700H (25615 - 80511, n=64) | |
| Lenovo ThinkPad P1 G4-20Y4Z9DVUS | |
| AIDA64 / Memory Read | |
| Genomsnitt av klass Workstation (55795 - 121563, n=23, senaste 2 åren) | |
| MSI Creator Z16P B12UHST | |
| MSI CreatorPro Z16P B12UKST | |
| HP ZBook Studio 16 G9 62U04EA | |
| Genomsnitt Intel Core i7-12700H (25586 - 79442, n=64) | |
| Lenovo ThinkPad P1 G4-20Y4Z9DVUS | |
| AIDA64 / Memory Write | |
| Genomsnitt av klass Workstation (55663 - 214520, n=23, senaste 2 åren) | |
| MSI CreatorPro Z16P B12UKST | |
| MSI Creator Z16P B12UHST | |
| HP ZBook Studio 16 G9 62U04EA | |
| Genomsnitt Intel Core i7-12700H (23679 - 88660, n=64) | |
| Lenovo ThinkPad P1 G4-20Y4Z9DVUS | |
| AIDA64 / Memory Latency | |
| Genomsnitt av klass Workstation (84.5 - 165.2, n=23, senaste 2 åren) | |
| MSI CreatorPro Z16P B12UKST | |
| MSI Creator Z16P B12UHST | |
| HP ZBook Studio 16 G9 62U04EA | |
| Lenovo ThinkPad P1 G4-20Y4Z9DVUS | |
| Genomsnitt Intel Core i7-12700H (76.2 - 133.9, n=62) | |
* ... mindre är bättre
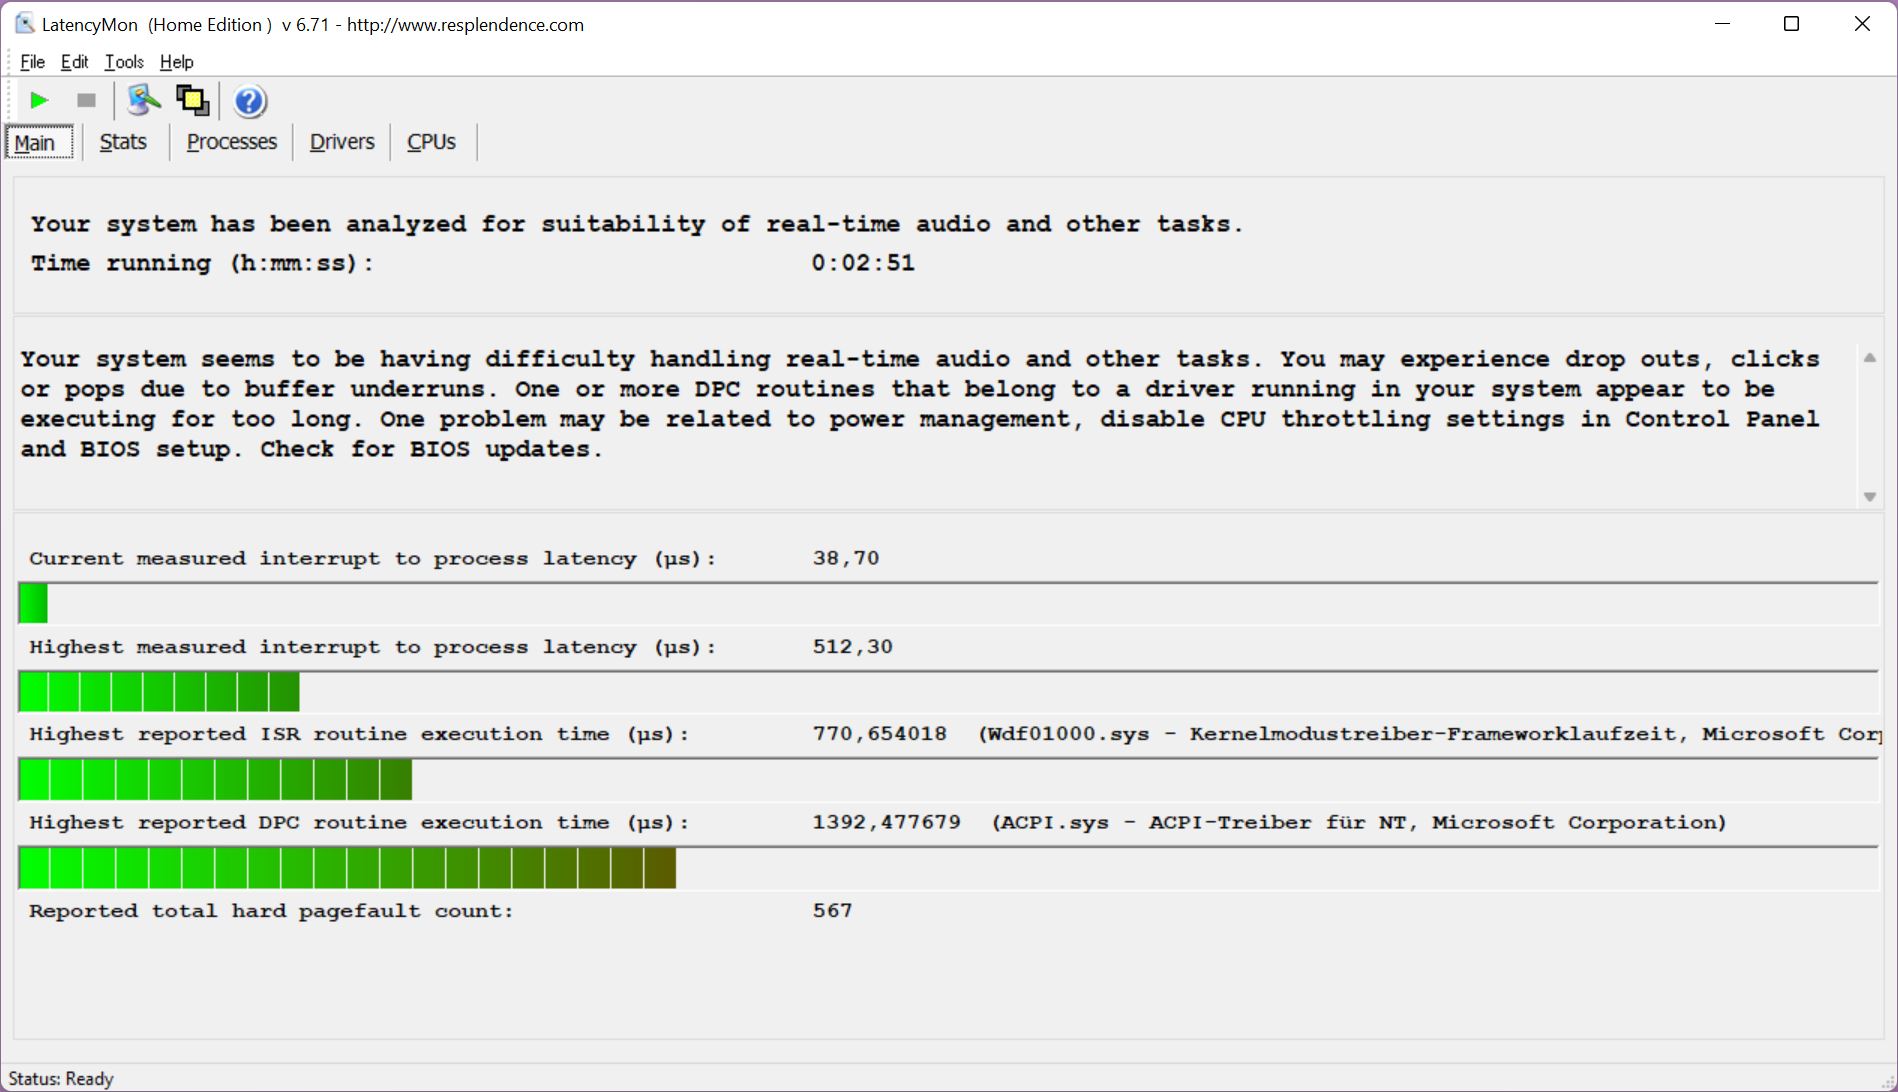
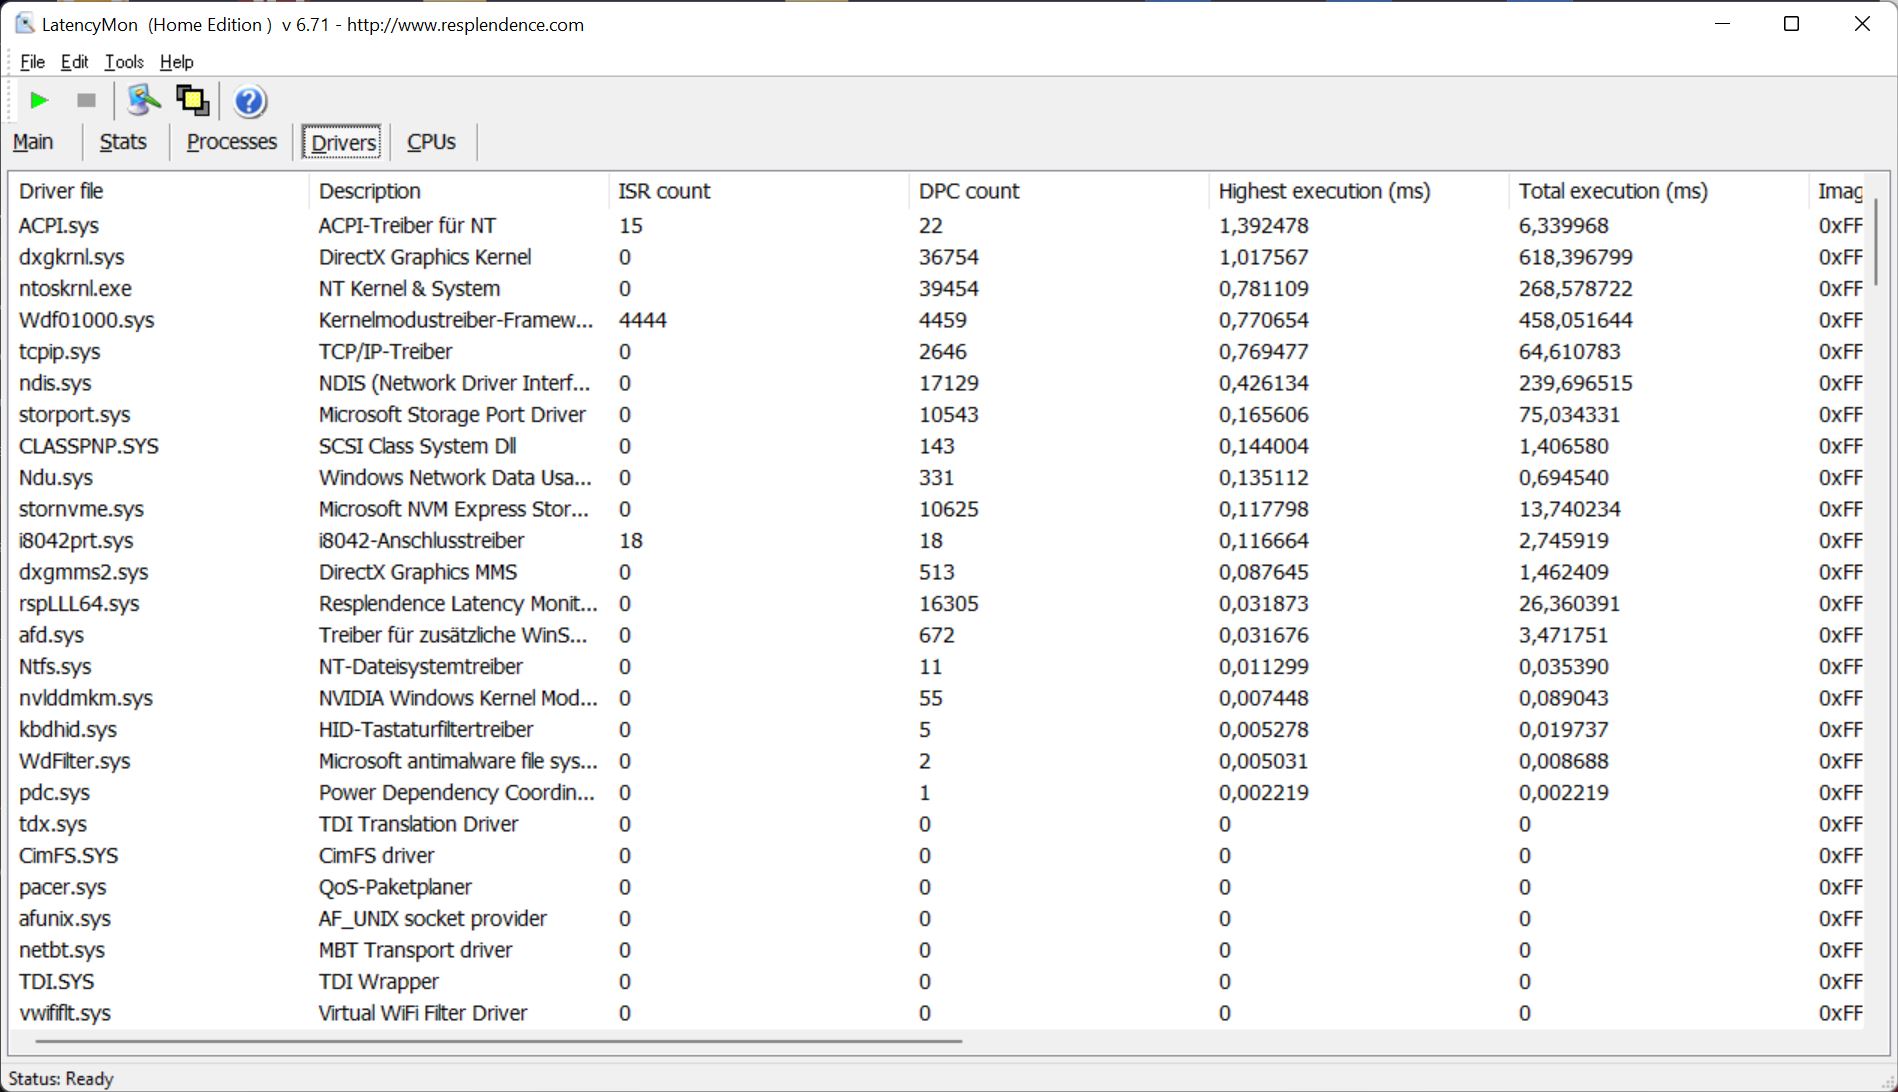
DPC-latenstider
Med BIOS vid tidpunkten för vår testning uppvisar testenheten inga begränsningar i vårt latenthetstest (surfning på Internet, 4K YouTube-återgivning, CPU-belastning). Även om en av drivrutinerna orsakar en liten avvikelse bör det inte vara några problem att använda ljudprogram i realtid.
| DPC Latencies / LatencyMon - interrupt to process latency (max), Web, Youtube, Prime95 | |
| HP ZBook Studio 16 G9 62U04EA | |
| MSI Creator Z16P B12UHST | |
| Dell Precision 5000 5560 | |
| Lenovo ThinkPad P1 G4-20Y4S0KS00 | |
| MSI CreatorPro Z16P B12UKST | |
* ... mindre är bättre
Lagringslösning
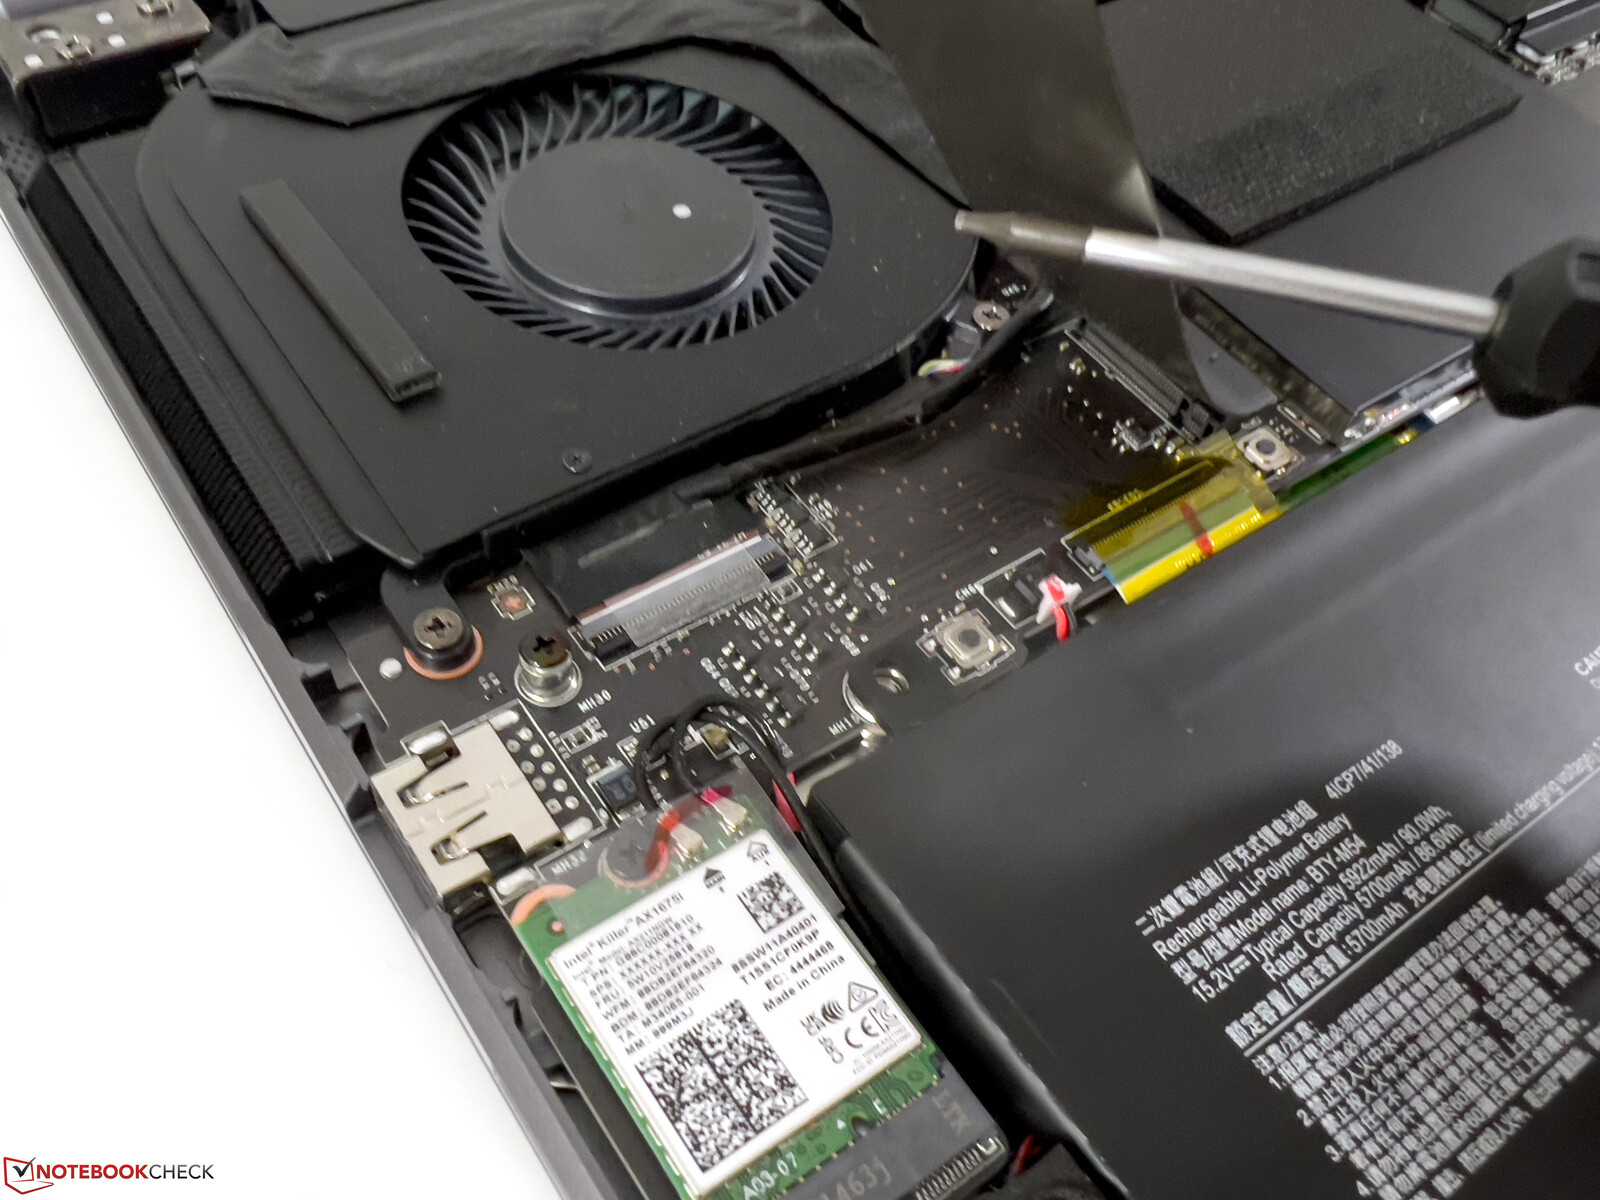
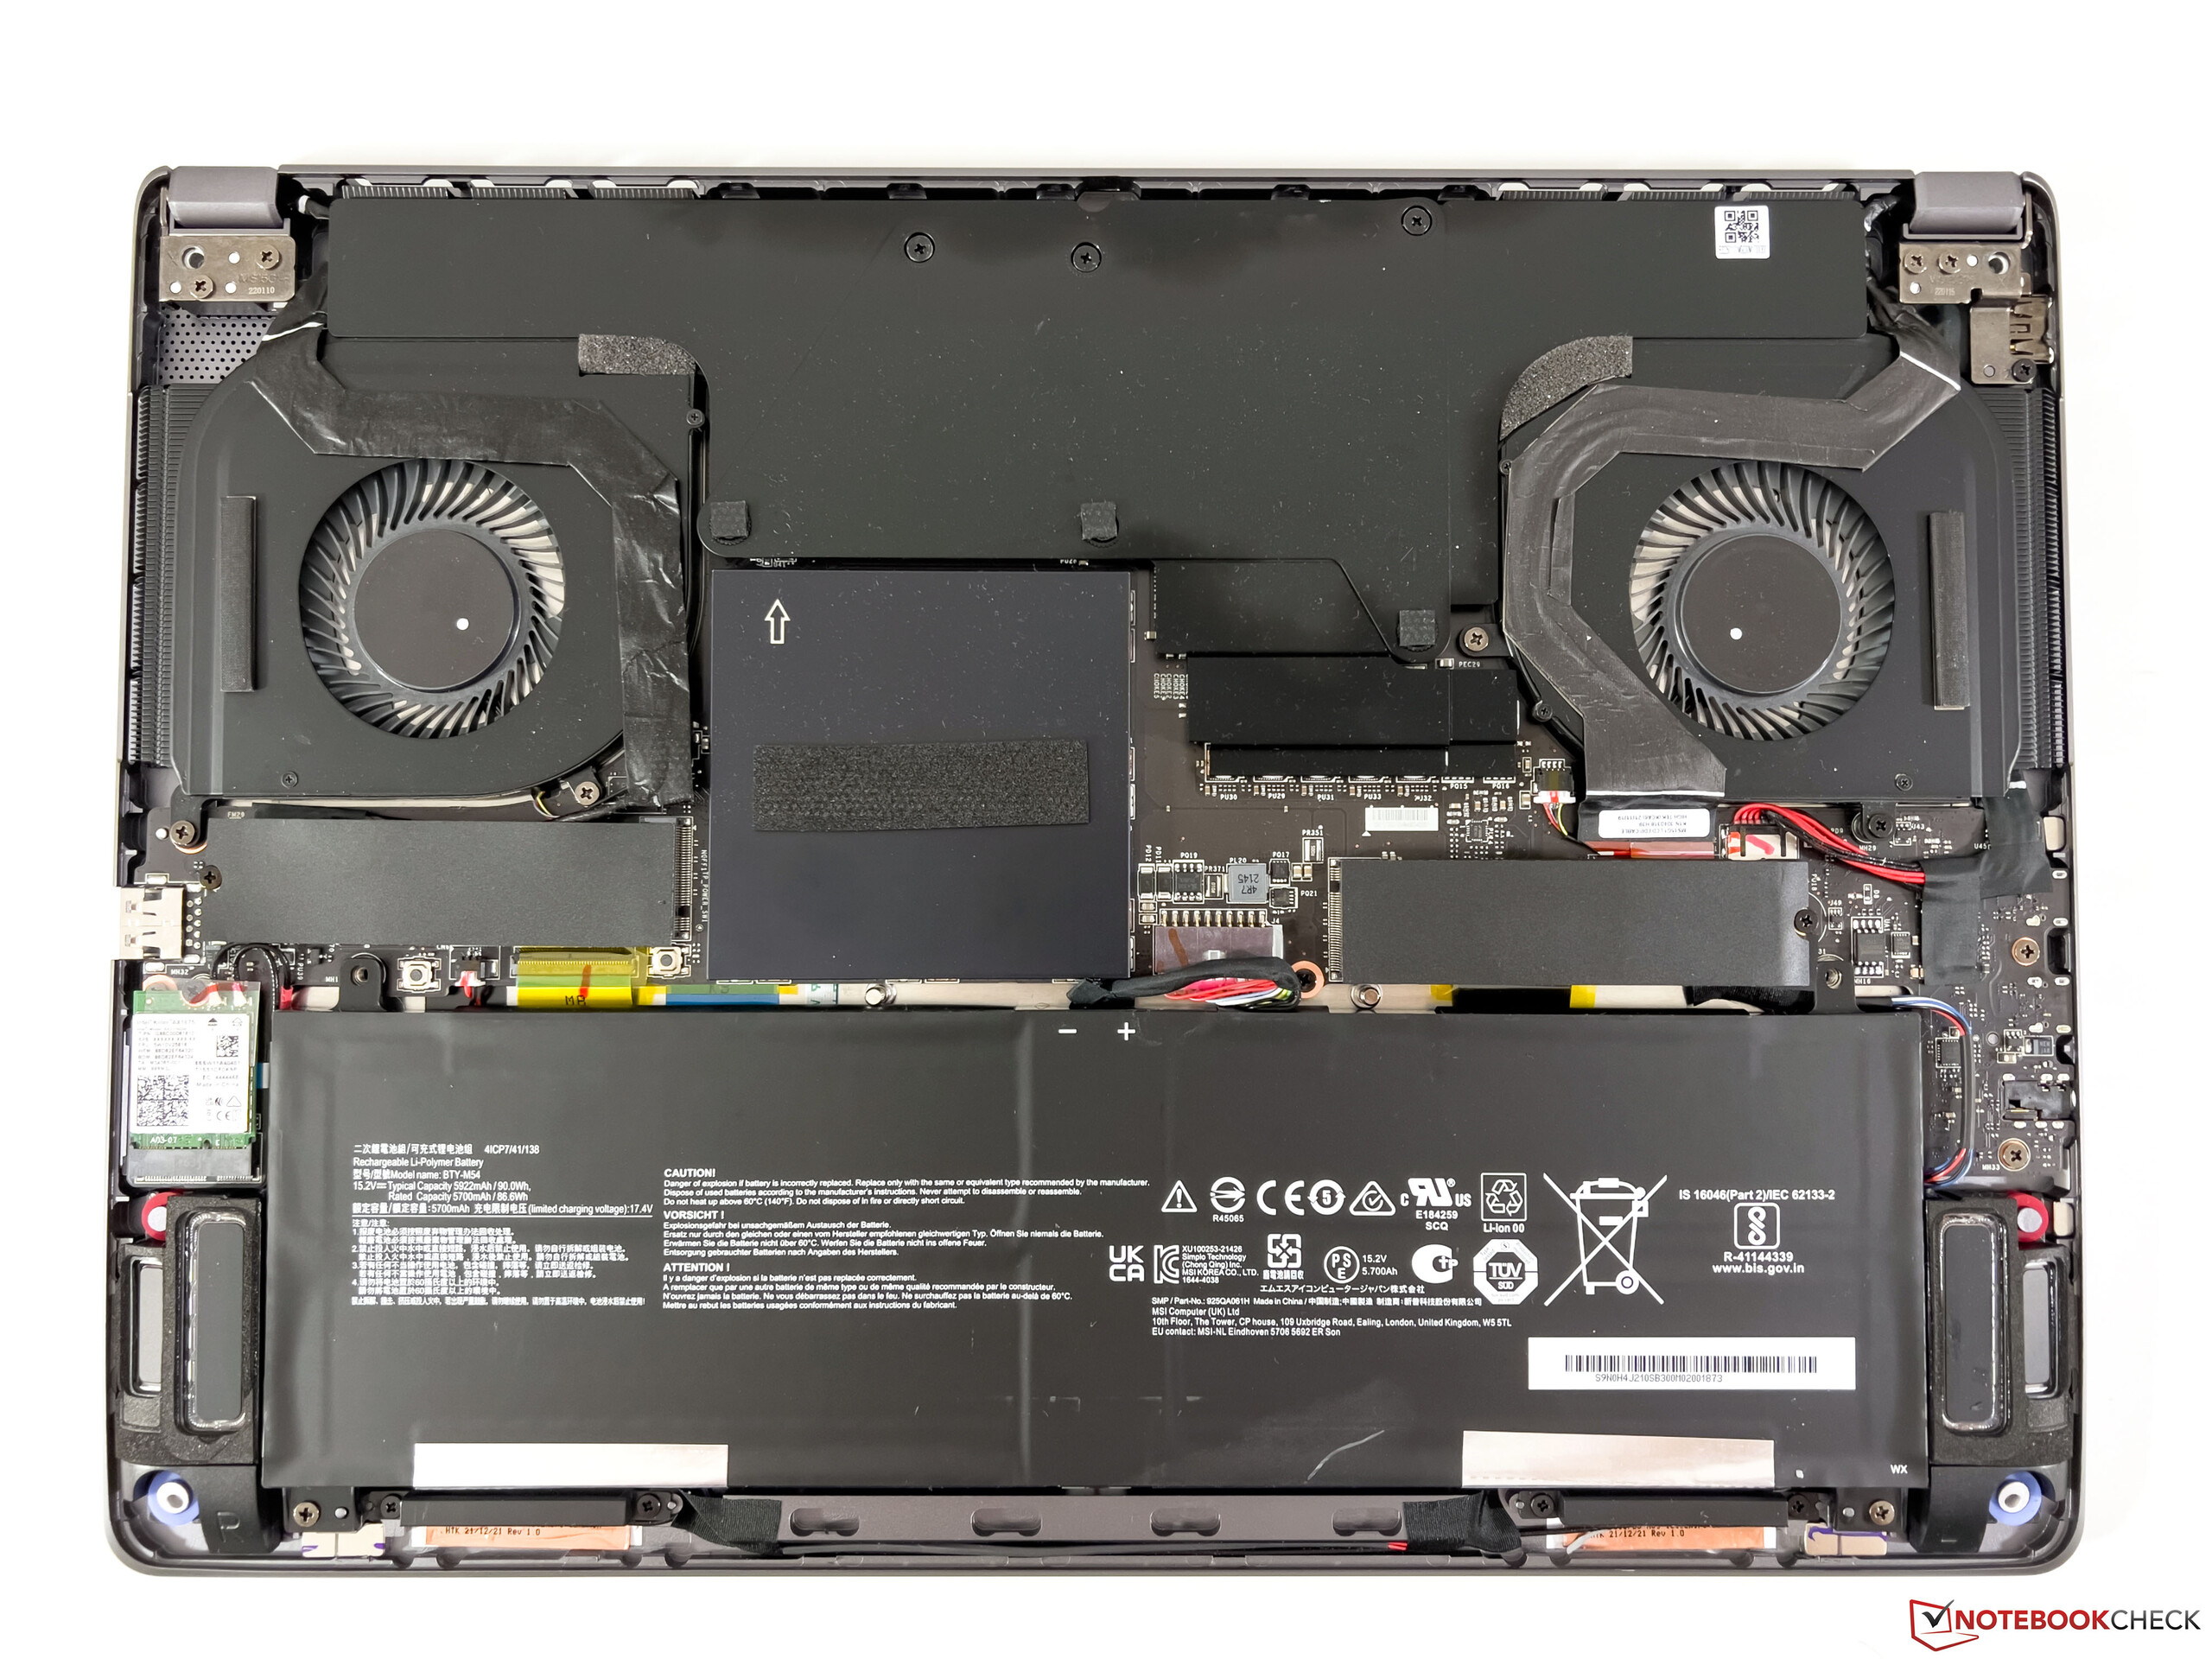
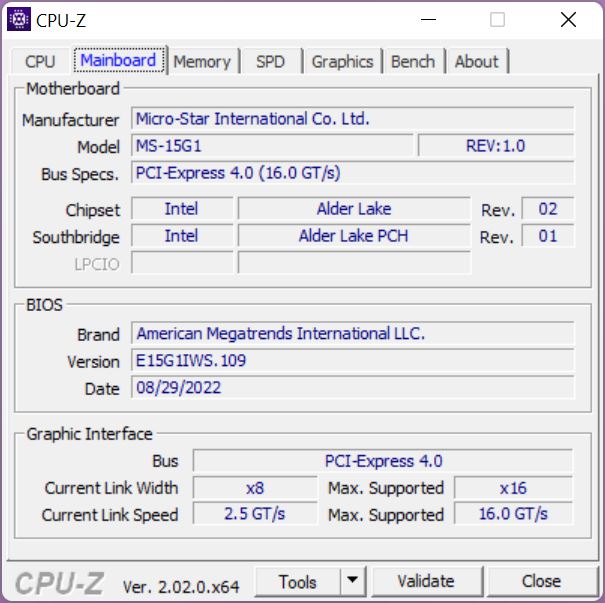
MSI CreatorPro Z16P har två platser för M.2-2280 SSD-diskar med det snabba PCIe 4.0-gränssnittet. Vår testenhet är utrustad med den snabba PM9A1 från Samsung (OEM-version av 980 Pro). Dess lagringskapacitet är 1 TB, varav 870 GB är tillgängliga för användaren efter första uppstarten. Överföringshastigheten är mycket hög, men på grund av temperaturproblem förblir prestandan inte stabil, utan sjunker från mer än 6 till cirka 4 GB/s efter några minuter. Detta är dock fortfarande snabbt och det bör inte finnas några begränsningar i praktiken. Du kan hitta ytterligare SSD-jämförelser här.

* ... mindre är bättre
Disk Throttling: DiskSpd Read Loop, Queue Depth 8
Grafikkort - Nvidia RTX A3000
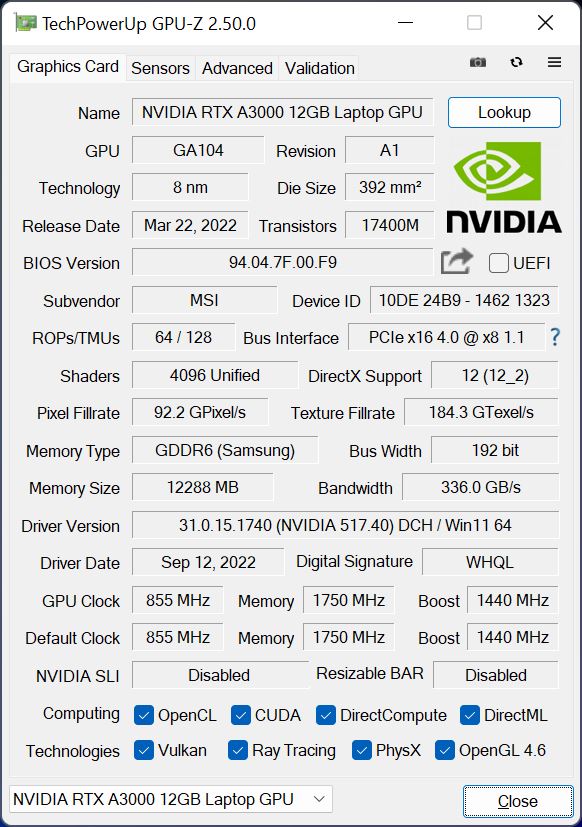
Vår testenhet är utrustad med en professionell Nvidia RTX A3000som fick en uppgradering från 6 till 12 GB GDDR6-VRAM år 2022. Det finns många tekniska likheter med konsumentens GeForce RTX 3060, men RTX A3000 erbjuder ytterligare 256 CUDA-kärnor. Det här är versionen med en TGP på 80 watt, med ytterligare 10 watt dynamisk boost som kan användas av processorn
Grafikprestandan faller helt inom målet för RTX A3000, och vi ser också en betydande fördel för den mindre RTX A2000 i ZBook Studio 16 G9. När det gäller ren prestanda är RTX 3070 eller 3080 TigPU:er för konsumentbrukare är naturligtvis snabbare, men de professionella testerna visar också på fördelen med drivrutinscertifieringarna. MSI klarar 3DMark Time Spy stresstestet med 97,9 %.
Däremot visar spelbenchmarks en något annorlunda bild, eftersom prestandan sjunker efter några minuter här, vilket du också tydligt kan se i vårt The Witcher 3 -test. Vi kunde observera ett liknande beteende i Creator Z16Pmed RTX 3080 Ti, även om det inte finns någon egentlig teknisk orsak till detta, och vi misstänker återigen vissa problem med prestandaprofilerna som de skyldiga här
Vid batteridrift tillåts RTX A3000 förbruka maximalt 40 watt, vilket leder till en betydande prestandaförlust på 75 %. Du kan hitta ytterligare GPU-jämförelser här.
| 3DMark 11 Performance | 24865 poäng | |
| 3DMark Fire Strike Score | 18097 poäng | |
| 3DMark Time Spy Score | 7703 poäng | |
Hjälp | ||
| Blender / v3.3 Classroom OPTIX/RTX | |
| HP ZBook Firefly 14 G9-6B8A2EA | |
| Dell Precision 5000 5470 | |
| HP Envy 16 h0112nr | |
| HP ZBook Studio 16 G9 62U04EA | |
| Dell Precision 7670 | |
| MSI CreatorPro Z16P B12UKST | |
| Genomsnitt NVIDIA RTX A3000 Laptop GPU (n=1) | |
| Genomsnitt av klass Workstation (10 - 43, n=17, senaste 2 åren) | |
| Blender / v3.3 Classroom CUDA | |
| HP ZBook Firefly 14 G9-6B8A2EA | |
| Dell Precision 5000 5470 | |
| HP ZBook Studio 16 G9 62U04EA | |
| HP Envy 16 h0112nr | |
| Dell Precision 7670 | |
| MSI CreatorPro Z16P B12UKST | |
| Genomsnitt NVIDIA RTX A3000 Laptop GPU (n=1) | |
| Genomsnitt av klass Workstation (16 - 74, n=17, senaste 2 åren) | |
| Blender / v3.3 Classroom CPU | |
| HP ZBook Firefly 14 G9-6B8A2EA | |
| HP Envy 16 h0112nr | |
| Dell Precision 5000 5470 | |
| Dell Precision 7670 | |
| MSI CreatorPro Z16P B12UKST | |
| Genomsnitt NVIDIA RTX A3000 Laptop GPU (n=1) | |
| HP ZBook Studio 16 G9 62U04EA | |
| Genomsnitt av klass Workstation (148 - 364, n=23, senaste 2 åren) | |
* ... mindre är bättre
The Witcher 3 FPS Chart
| låg | med. | hög | ultra | QHD | |
|---|---|---|---|---|---|
| GTA V (2015) | 185.8 | 182.5 | 168.5 | 95.3 | 71.3 |
| The Witcher 3 (2015) | 381 | 262 | 151 | 59.6 | |
| Dota 2 Reborn (2015) | 182 | 166.8 | 155.8 | 147.1 | |
| Final Fantasy XV Benchmark (2018) | 176 | 83.8 | 64.3 | 45.6 | |
| X-Plane 11.11 (2018) | 142.1 | 120.7 | 97.5 | ||
| Far Cry 5 (2018) | 170 | 128 | 117 | 108 | 76 |
| Strange Brigade (2018) | 344 | 152 | 121 | 108 | 85 |
| F1 2021 (2021) | 334 | 187 | 151.1 | 77.5 | 56.3 |
| Cyberpunk 2077 1.6 (2022) | 77 | 66 | 53 | 43 | 27 |
| F1 22 (2022) | 181 | 167.5 | 120.9 | 39 | 26.2 |
Utsläpp och energihantering
Bullernivåer
De två fläktarna i CreatorPro Z16P är alltid igång, men du kan bara höra deras surrande när du håller örat direkt mot höljet i ett tyst rum. I daglig drift drar du också nytta av den defensiva fläktkurvan, eftersom det tar cirka 30 sekunder även vid full belastning innan de blir högre. Vid spelande mäter vi då runt 44 och vid full belastning 47 dB(A), där surret är tydligt hörbart utan att vara stötande. Vi hör inga andra elektroniska ljud som till exempel spolens gnissel.
Ljudnivå
| Låg belastning |
| 27.1 / 27.1 / 27.1 dB(A) |
| Hög belastning |
| 42.9 / 47 dB(A) |
 | ||
30 dB tyst 40 dB(A) hörbar 50 dB(A) högt ljud |
||
min: | ||
| MSI CreatorPro Z16P B12UKST RTX A3000 Laptop GPU, i7-12700H, Samsung PM9A1 MZVL21T0HCLR | HP ZBook Studio 16 G9 62U04EA RTX A2000 Laptop GPU, i7-12800H, Micron 3400 1TB MTFDKBA1T0TFH | Lenovo ThinkPad P1 G4-20Y4S0KS00 GeForce RTX 3070 Laptop GPU, i7-11850H, Samsung PM9A1 MZVL21T0HCLR | Dell Precision 5000 5560 RTX A2000 Laptop GPU, i7-11850H, Samsung PM9A1 MZVL22T0HBLB | MSI Creator Z16P B12UHST GeForce RTX 3080 Ti Laptop GPU, i9-12900H, Samsung PM9A1 MZVL22T0HBLB | |
|---|---|---|---|---|---|
| Noise | 2% | 3% | 15% | -4% | |
| av / miljö * (dB) | 24.1 | 24 -0% | 23.8 1% | 23.4 3% | 26 -8% |
| Idle Minimum * (dB) | 27.1 | 24 11% | 23.8 12% | 23.6 13% | 27 -0% |
| Idle Average * (dB) | 27.1 | 27.7 -2% | 23.8 12% | 23.6 13% | 29 -7% |
| Idle Maximum * (dB) | 27.1 | 27.7 -2% | 28.3 -4% | 23.6 13% | 31 -14% |
| Load Average * (dB) | 42.9 | 39.8 7% | 38.6 10% | 25.8 40% | 43 -0% |
| Witcher 3 ultra * (dB) | 44 | 44.3 -1% | 47.4 -8% | 40.1 9% | 43 2% |
| Load Maximum * (dB) | 47 | 47.7 -1% | 47.4 -1% | 41.4 12% | 46 2% |
* ... mindre är bättre
Temperaturer
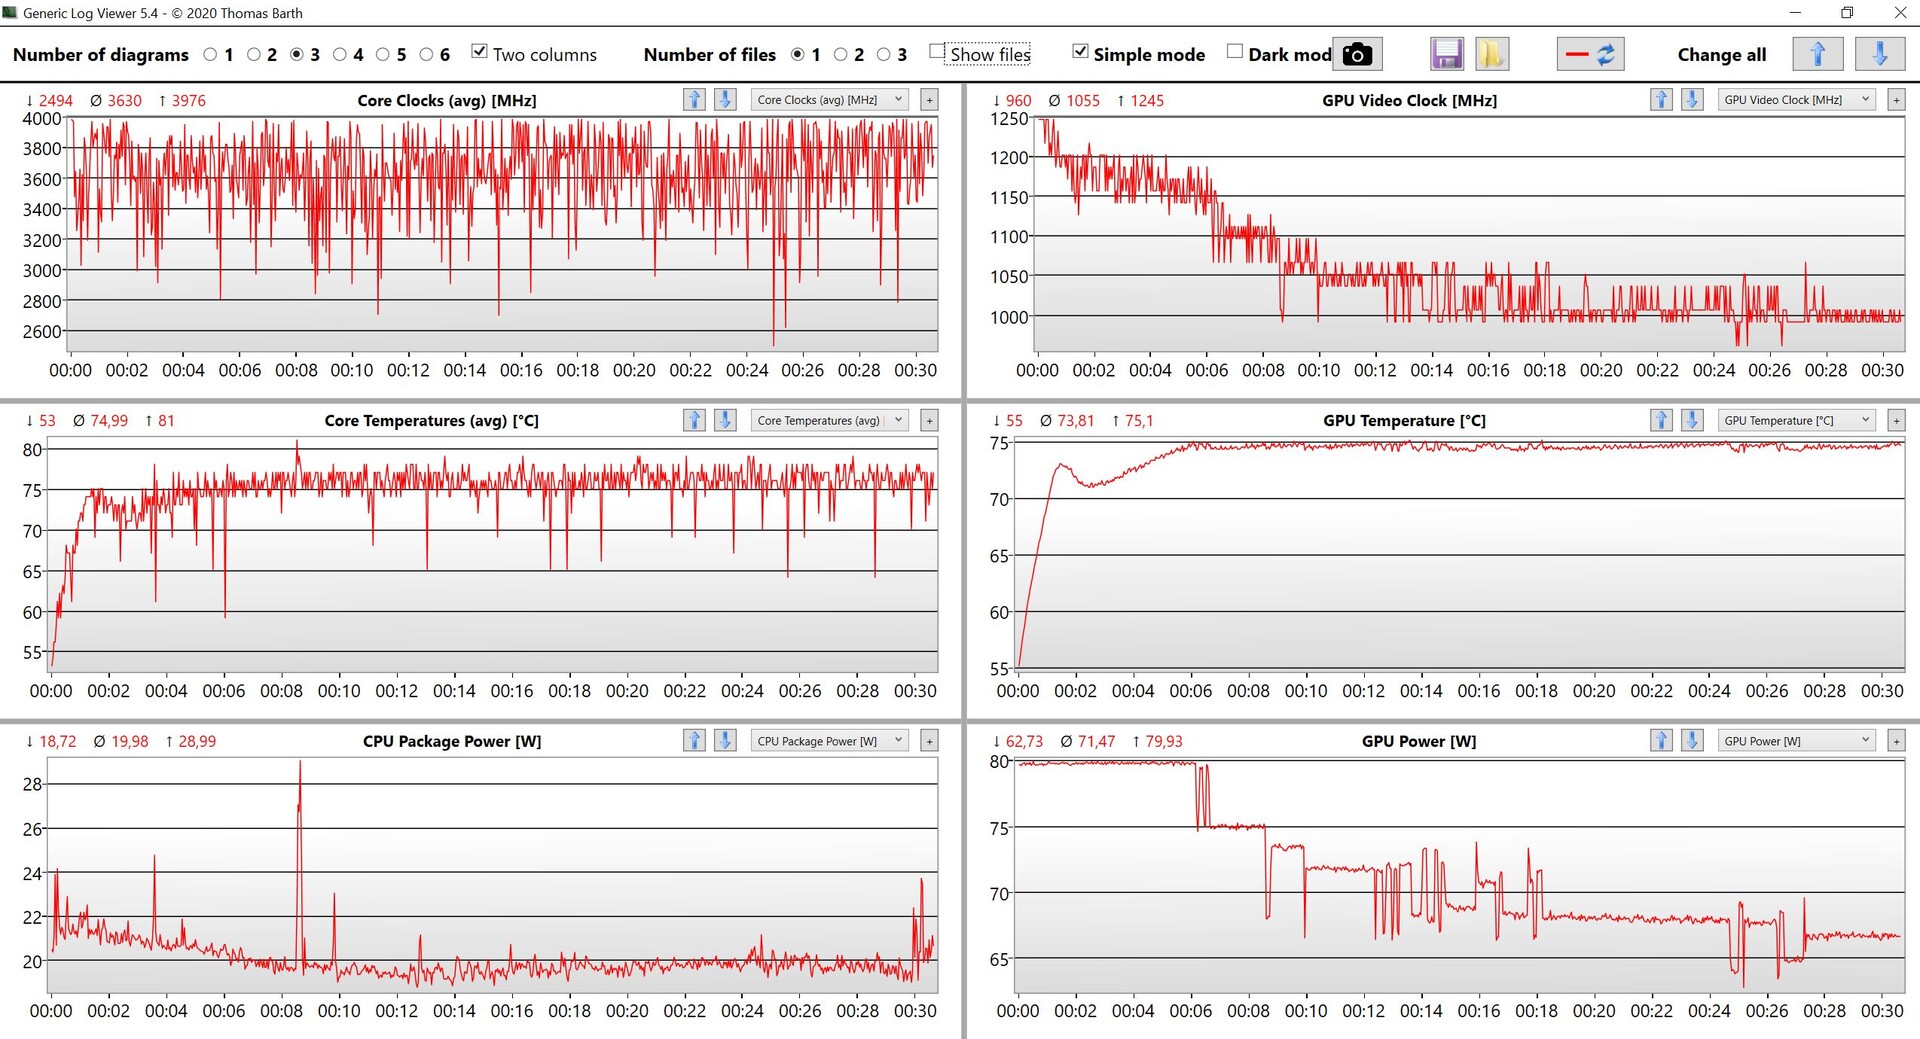
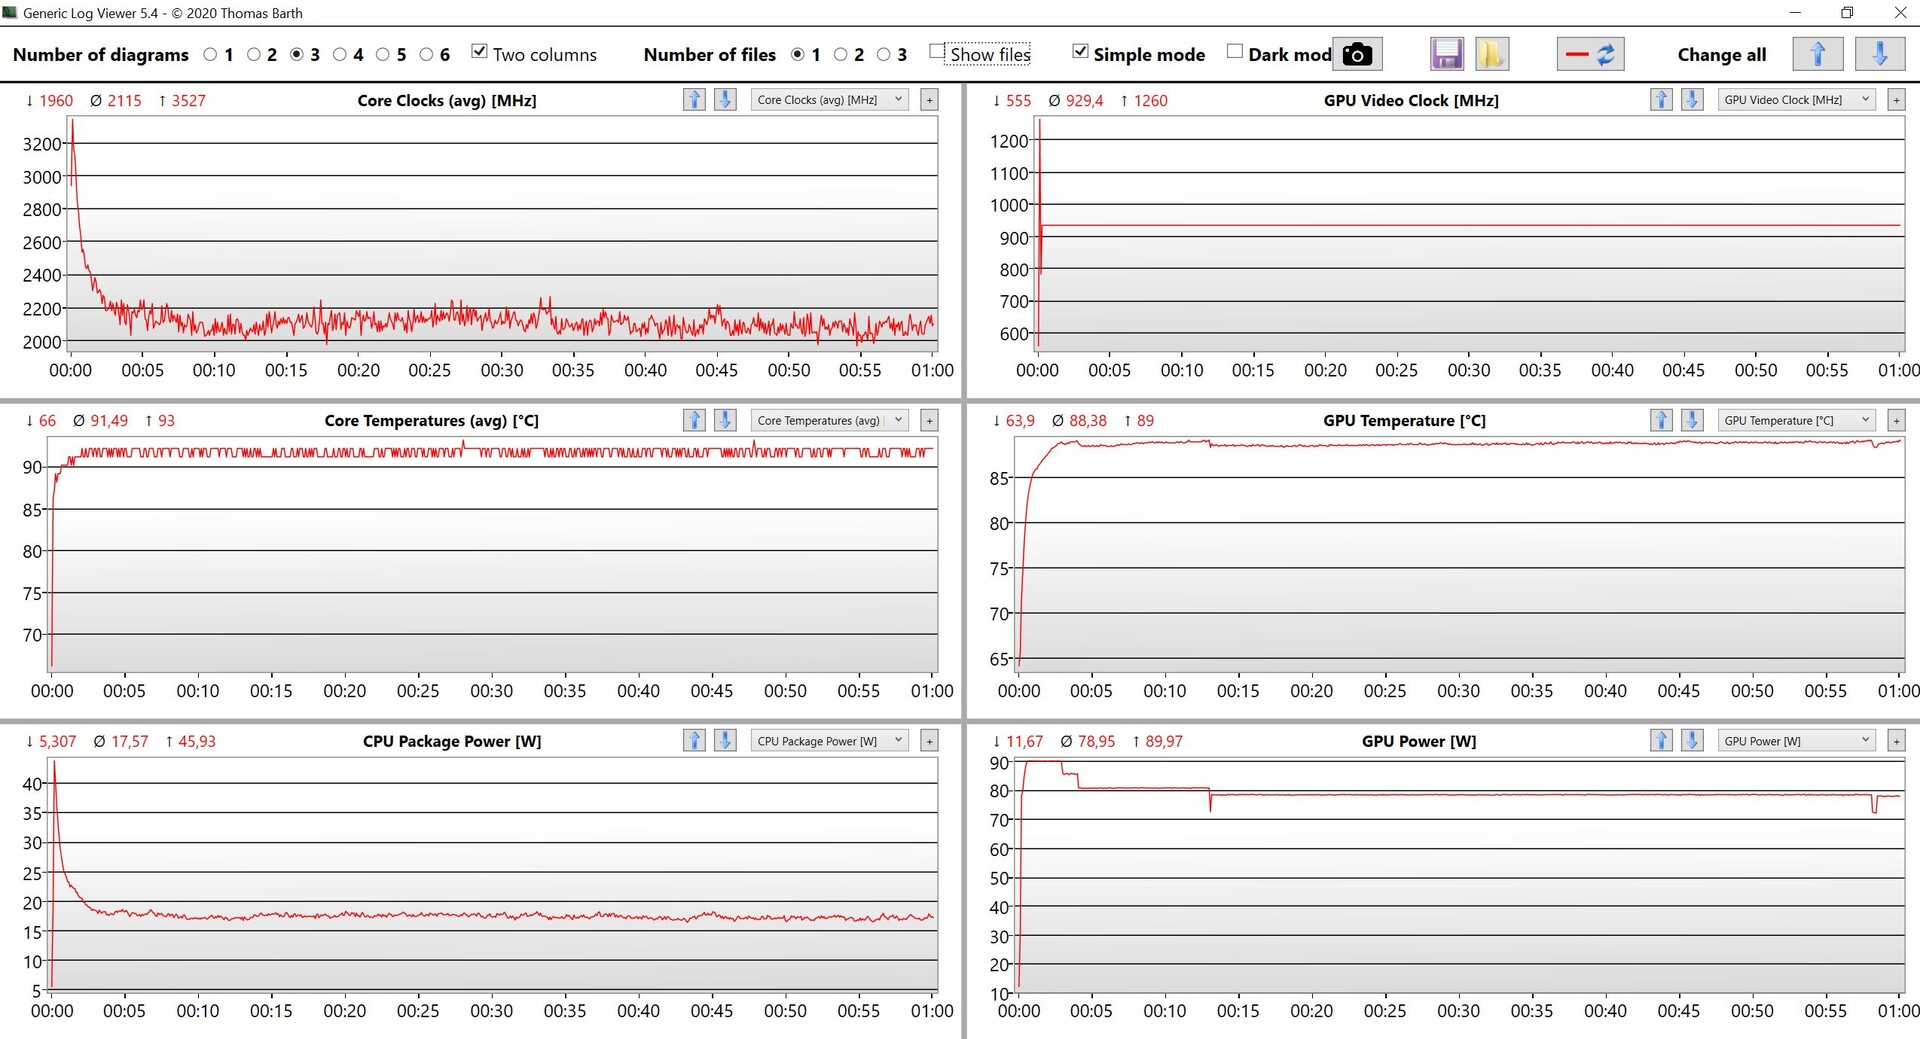
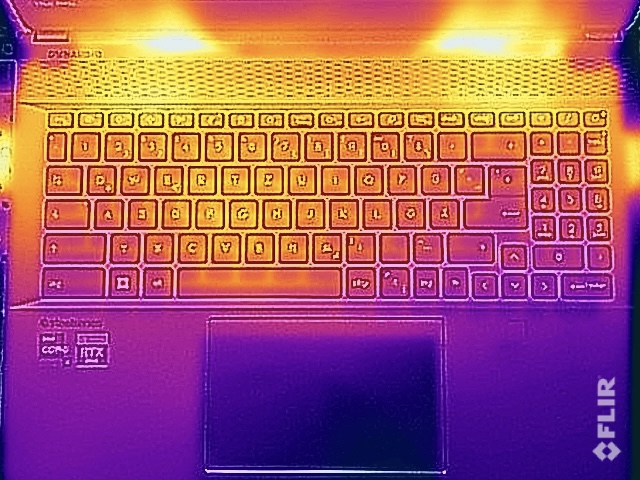
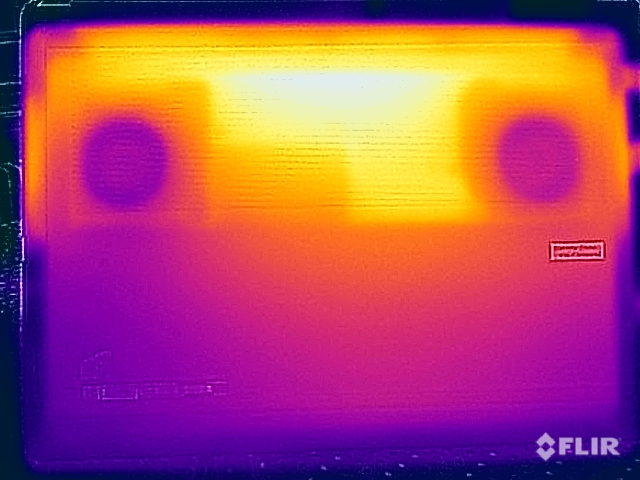
Temperaturutvecklingen var redan ett stort problem i vårt land testenhet av Creator Z16Pmed Core i9 och RTX 3080 Ti. CreatorPro med den svagare Core i7 och RTX A3000 klarar sig något bättre men förblir ändå problematisk, trots att den också använder ett kylsystem med ångkammare. Subjektivt sett ökar problemet också på grund av metallhöljet. Med mindre krävande uppgifter finns det inga begränsningar, men redan efter några korta belastningsfaser på bara några minuter värms toppen av basenheten upp mycket kraftigt och det blir faktiskt obekvämt att använda tangentbordet. Dessutom bör du under inga omständigheter köra enheten i knät under belastning, eftersom vi mäter nästan 70 °C vid fallets undersida. Kylsystemet är helt enkelt för svagt överlag, även för de långsammare komponenterna.
Stresstestet visar att systemet ger företräde åt GPU:n, som förblir ganska stabil vid cirka 80 watt, medan CPU:n sjunker under 20 watt. Det finns ingen prestandaåtergivning efter stresstestet.
(-) Den maximala temperaturen på ovansidan är 56.3 °C / 133 F, jämfört med genomsnittet av 38.2 °C / 101 F , allt från 22.2 till 69.8 °C för klassen Workstation.
(-) Botten värms upp till maximalt 68.3 °C / 155 F, jämfört med genomsnittet av 41.1 °C / 106 F
(+) Vid tomgångsbruk är medeltemperaturen för ovansidan 24.1 °C / 75 F, jämfört med enhetsgenomsnittet på 32 °C / ### class_avg_f### F.
(-) När du spelar The Witcher 3 är medeltemperaturen för ovansidan 44 °C / 111 F, jämfört med enhetsgenomsnittet på 32 °C / ## #class_avg_f### F.
(±) Handledsstöden och pekplattan kan bli väldigt varma vid beröring med maximalt 38.2 °C / 100.8 F.
(-) Medeltemperaturen för handledsstödsområdet på liknande enheter var 27.8 °C / 82 F (-10.4 °C / -18.8 F).
| MSI CreatorPro Z16P B12UKST Intel Core i7-12700H, NVIDIA RTX A3000 Laptop GPU | HP ZBook Studio 16 G9 62U04EA Intel Core i7-12800H, NVIDIA RTX A2000 Laptop GPU | Lenovo ThinkPad P1 G4-20Y4S0KS00 Intel Core i7-11850H, NVIDIA GeForce RTX 3070 Laptop GPU | Dell Precision 5000 5560 Intel Core i7-11850H, NVIDIA RTX A2000 Laptop GPU | MSI Creator Z16P B12UHST Intel Core i9-12900H, NVIDIA GeForce RTX 3080 Ti Laptop GPU | |
|---|---|---|---|---|---|
| Heat | 6% | 1% | -6% | -12% | |
| Maximum Upper Side * (°C) | 56.3 | 38.7 31% | 51 9% | 48.2 14% | 67 -19% |
| Maximum Bottom * (°C) | 68.3 | 53.4 22% | 53.5 22% | 42.6 38% | 69 -1% |
| Idle Upper Side * (°C) | 25.2 | 27.3 -8% | 28.8 -14% | 34.8 -38% | 29 -15% |
| Idle Bottom * (°C) | 25.9 | 31.6 -22% | 29.3 -13% | 35.2 -36% | 29 -12% |
* ... mindre är bättre
Högtalare
MSI CreatorPro Z16P B12UKST ljudanalys
(+) | högtalare kan spela relativt högt (83.3 dB)
Bas 100 - 315 Hz
(-) | nästan ingen bas - i genomsnitt 18.7% lägre än medianen
(±) | linjäriteten för basen är genomsnittlig (7% delta till föregående frekvens)
Mellan 400 - 2000 Hz
(+) | balanserad mellan - endast 3% från medianen
(+) | mids är linjära (6.8% delta till föregående frekvens)
Högsta 2 - 16 kHz
(+) | balanserade toppar - endast 4.6% från medianen
(+) | toppar är linjära (6.4% delta till föregående frekvens)
Totalt 100 - 16 000 Hz
(±) | linjäriteten för det totala ljudet är genomsnittlig (15.2% skillnad mot median)
Jämfört med samma klass
» 33% av alla testade enheter i den här klassen var bättre, 10% liknande, 57% sämre
» Den bästa hade ett delta på 7%, genomsnittet var 17%, sämst var 35%
Jämfört med alla testade enheter
» 22% av alla testade enheter var bättre, 4% liknande, 74% sämre
» Den bästa hade ett delta på 4%, genomsnittet var 23%, sämst var 134%
HP ZBook Studio 16 G9 62U04EA ljudanalys
(±) | högtalarljudstyrkan är genomsnittlig men bra (81.6 dB)
Bas 100 - 315 Hz
(±) | reducerad bas - i genomsnitt 8.7% lägre än medianen
(±) | linjäriteten för basen är genomsnittlig (10.4% delta till föregående frekvens)
Mellan 400 - 2000 Hz
(+) | balanserad mellan - endast 3.7% från medianen
(+) | mids är linjära (4.6% delta till föregående frekvens)
Högsta 2 - 16 kHz
(+) | balanserade toppar - endast 2.7% från medianen
(+) | toppar är linjära (3.5% delta till föregående frekvens)
Totalt 100 - 16 000 Hz
(+) | det totala ljudet är linjärt (10.6% skillnad mot median)
Jämfört med samma klass
» 9% av alla testade enheter i den här klassen var bättre, 5% liknande, 87% sämre
» Den bästa hade ett delta på 7%, genomsnittet var 17%, sämst var 35%
Jämfört med alla testade enheter
» 6% av alla testade enheter var bättre, 1% liknande, 93% sämre
» Den bästa hade ett delta på 4%, genomsnittet var 23%, sämst var 134%
Effektförbrukning
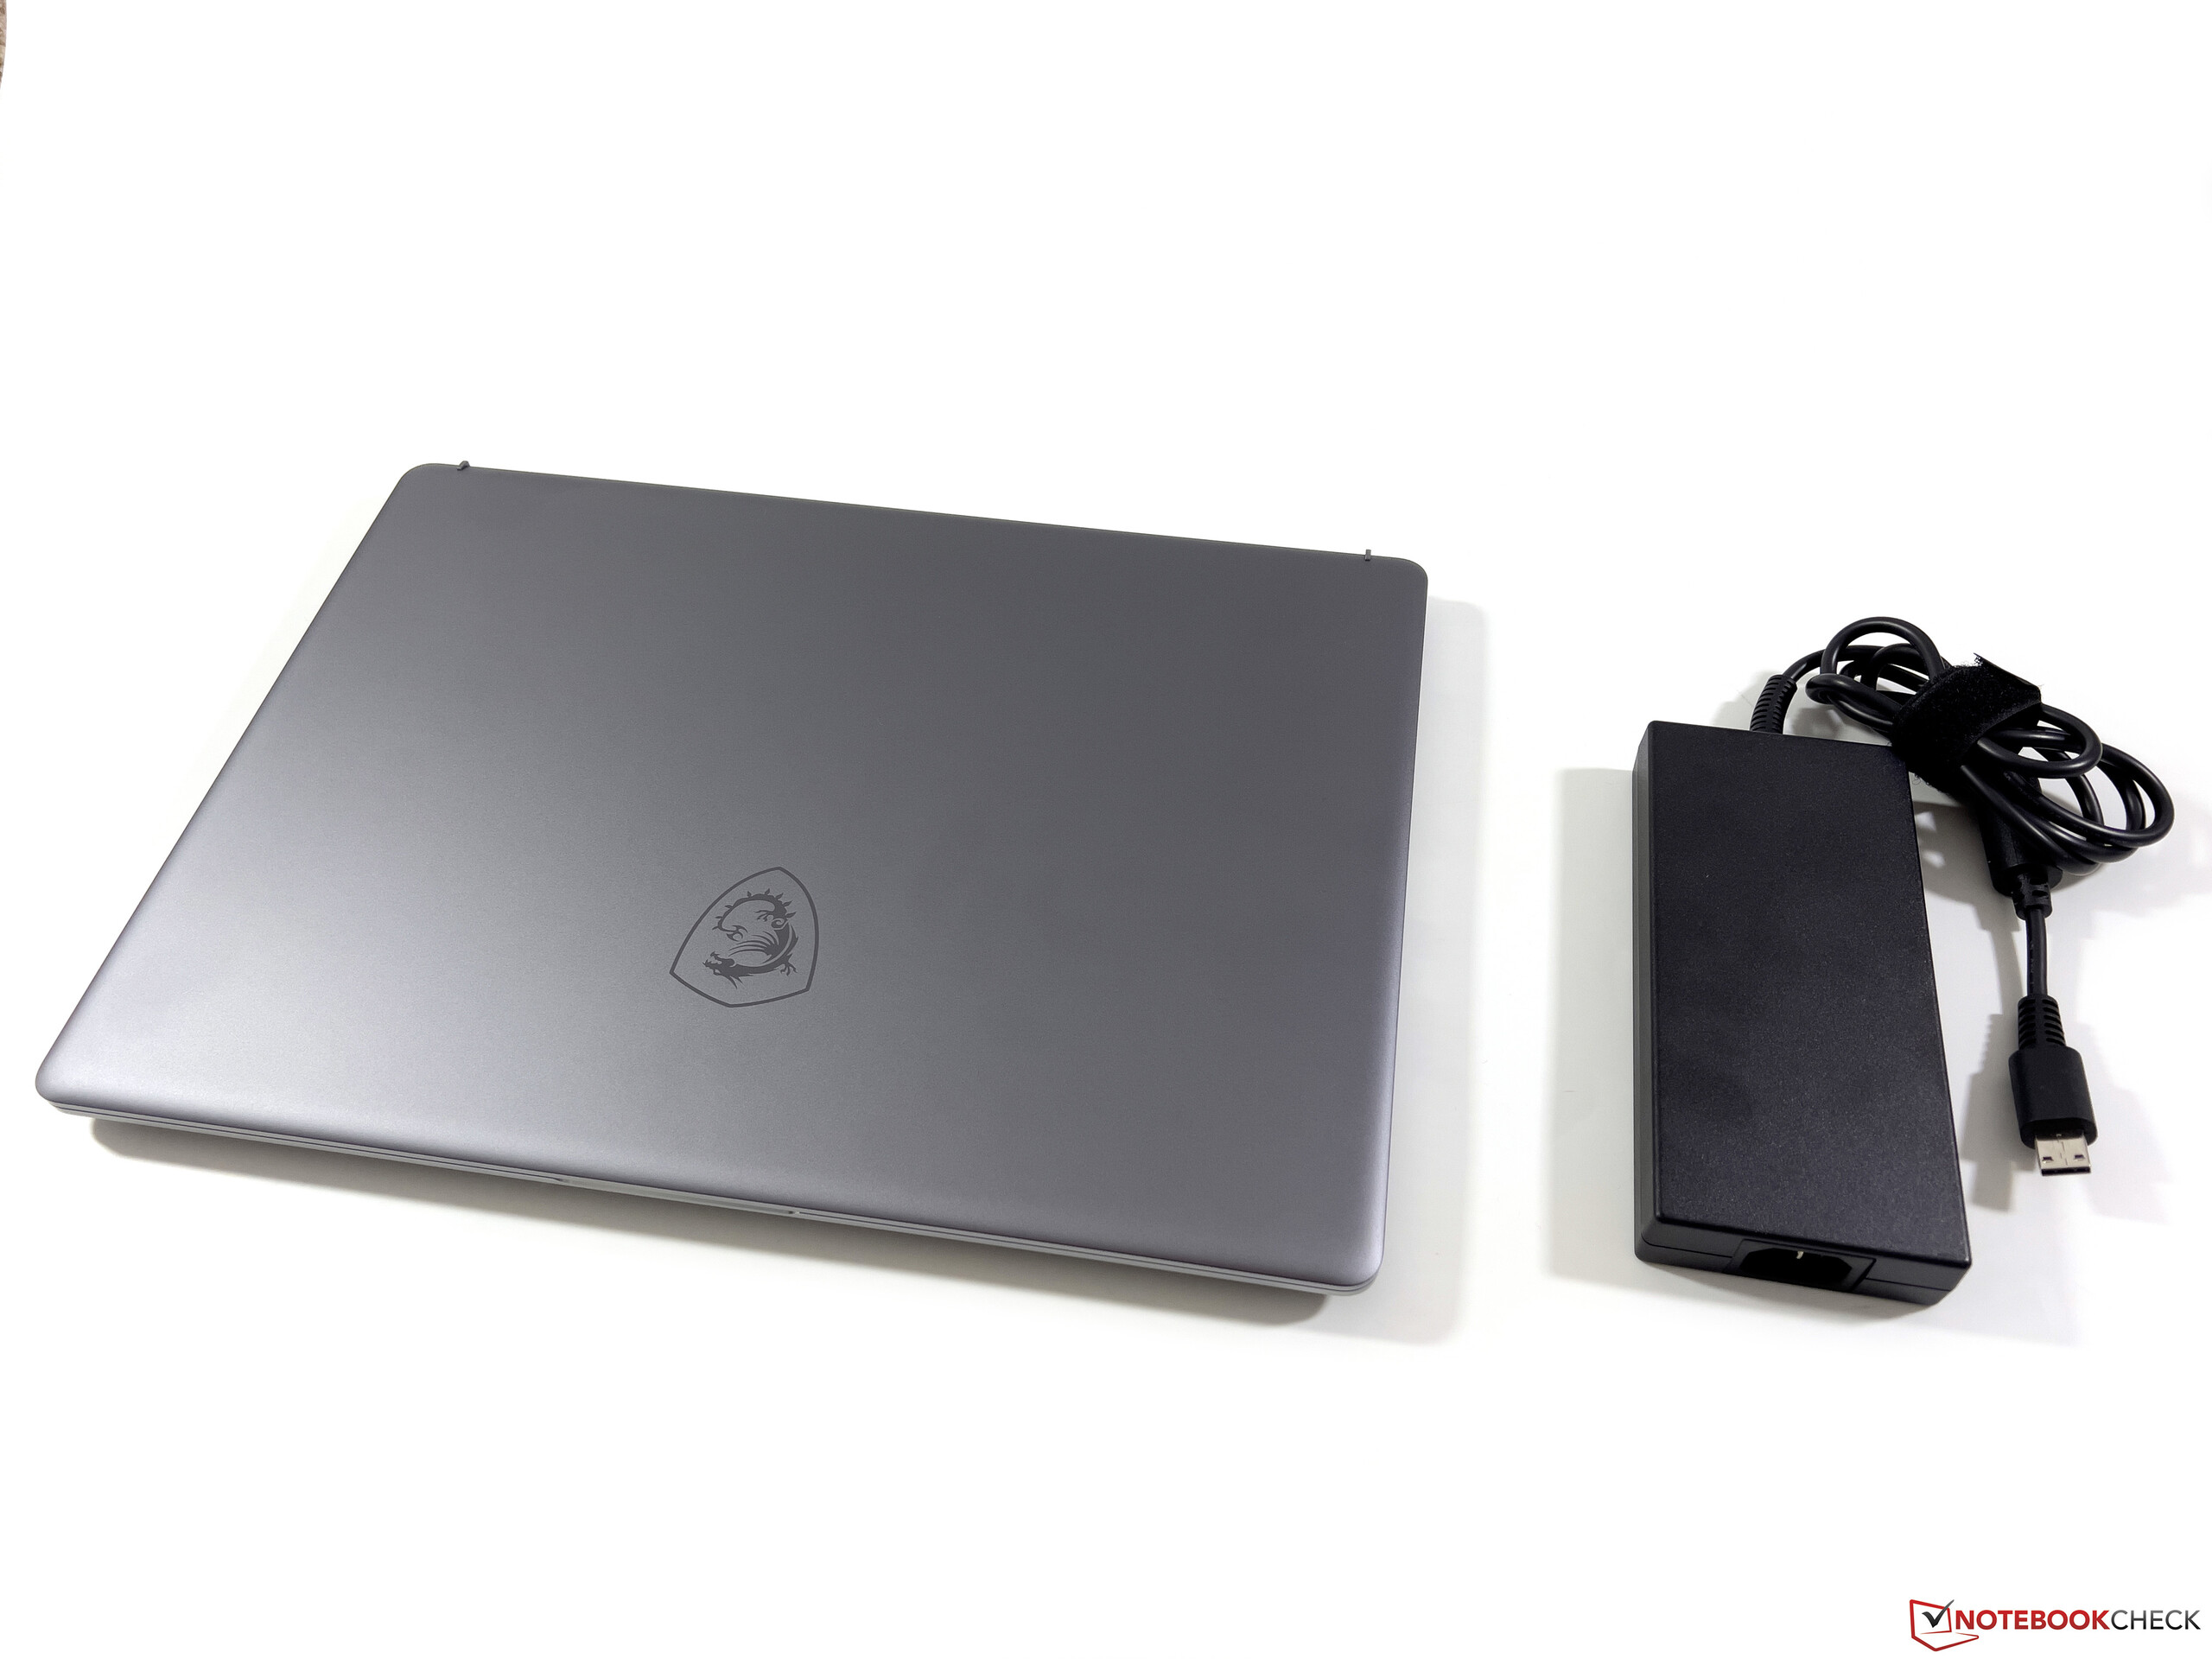
Våra mätningar av konsumtionen visar nu på överraskningar. De kraftfulla komponenterna, inklusive WQHD-panelen, behöver helt enkelt ström, och vi mäter redan nästan 17 watt vid full ljusstyrka på skärmen under tomgång. Under belastning ökar värdena sedan betydligt högre, och vi mäter omkring 150 watt under spelande. Under stresstestet finns det en kort belastningstopp på nästan 180 watt, men även här planar värdet snabbt ut till cirka 157 watt. Som redan med Creator Z16Psyskonmodell, inkluderar MSI ett rejält 240-watts nätaggregat med CreatorPro, även om det i vår konfiguration hade varit helt tillräckligt med ett mer kompakt 200-watts nätaggregat (eller till och med bara 180 watt).
| Av/Standby | |
| Låg belastning | |
| Hög belastning |
|
Förklaring:
min: | |
Power Consumption The Witcher 3 / Stress Test
Power Consumption With External Monitor
Batteritid
Mobila arbetsstationer har sällan lång batteritid, särskilt inte konfigurationer med högupplösta skärmar. Även om 90-Wh-batteriet i CreatorPro Z16P är mycket stort, mäter vi ändå bara knappt 6 timmar i vårt WLAN-test vid 150 cd/m², vilket motsvarar 39 % av den maximala ljusstyrkan. Vid full ljusstyrka räcker det till och med bara cirka 4,5 timmar
Med den bärbara datorn påslagen tar en full laddningsprocess 142 minuter, men 65 % av kapaciteten nås redan efter nästan 37 minuter och cirka 80 % efter 54 minuter. Laddningskurvan planar ut betydligt först därefter.
För
Emot
Slutsats - Kylningen av CreatorPro Z16P är överväldigad
Det professionella grafikkortet gör MSI Creator Z16P till CreatorPro Z16P, men det finns inga andra skillnader. Så det är inte förvånande att enheterna också delar fördelar och nackdelar. Till fördelarna hör definitivt det bra höljet, den fantastiska skärmen och även det bra tangentbordet. Men det finns också en del problem, eftersom komponenternas prestanda inte alltid var tillförlitliga (trots att vi använde profilen Highest Performance). Temperaturutvecklingen är också fortfarande ett massivt problem. Att använda tangentbordet blir obekvämt redan efter korta belastningsfaser, och vid längre belastningar kunde vi mäta yttemperaturer som var högre än 65 °C (149°F)
Prestandan hos MSI CreatorPro Z16P är inte alltid stabil och yttemperaturerna blir för höga under belastning. Att använda tangentbordet blir obekvämt redan efter några minuter.
På det hela taget har vi lite svårt att rekommendera MSI CreatorPro Z16P som arbetsstation. Även om det finns en del positiva aspekter är problemen med prestandan och de extrema yttemperaturerna inga bra kvalifikationer för en arbetsstation. Den nyligen testade HP ZBook Studio 16 G9kunde lämna ett betydligt bättre intryck överlag och finns dessutom med kraftfullare GPU:er. Vi kommer även att testa de andra aktuella arbetsstationsmodellerna från konkurrenterna under de kommande veckorna.
Pris och tillgänglighet
En toppkonfiguration av MSI CreatorPro Z16P med Intel Core i9-12900H, RTX A5500, 64 GB RAM, 1 TB SSD och QHD+-skärm finns på Amazon för 4862 kr.
MSI CreatorPro Z16P B12UKST
- 11/14/2022 v7 (old)
Andreas Osthoff
Price comparison

