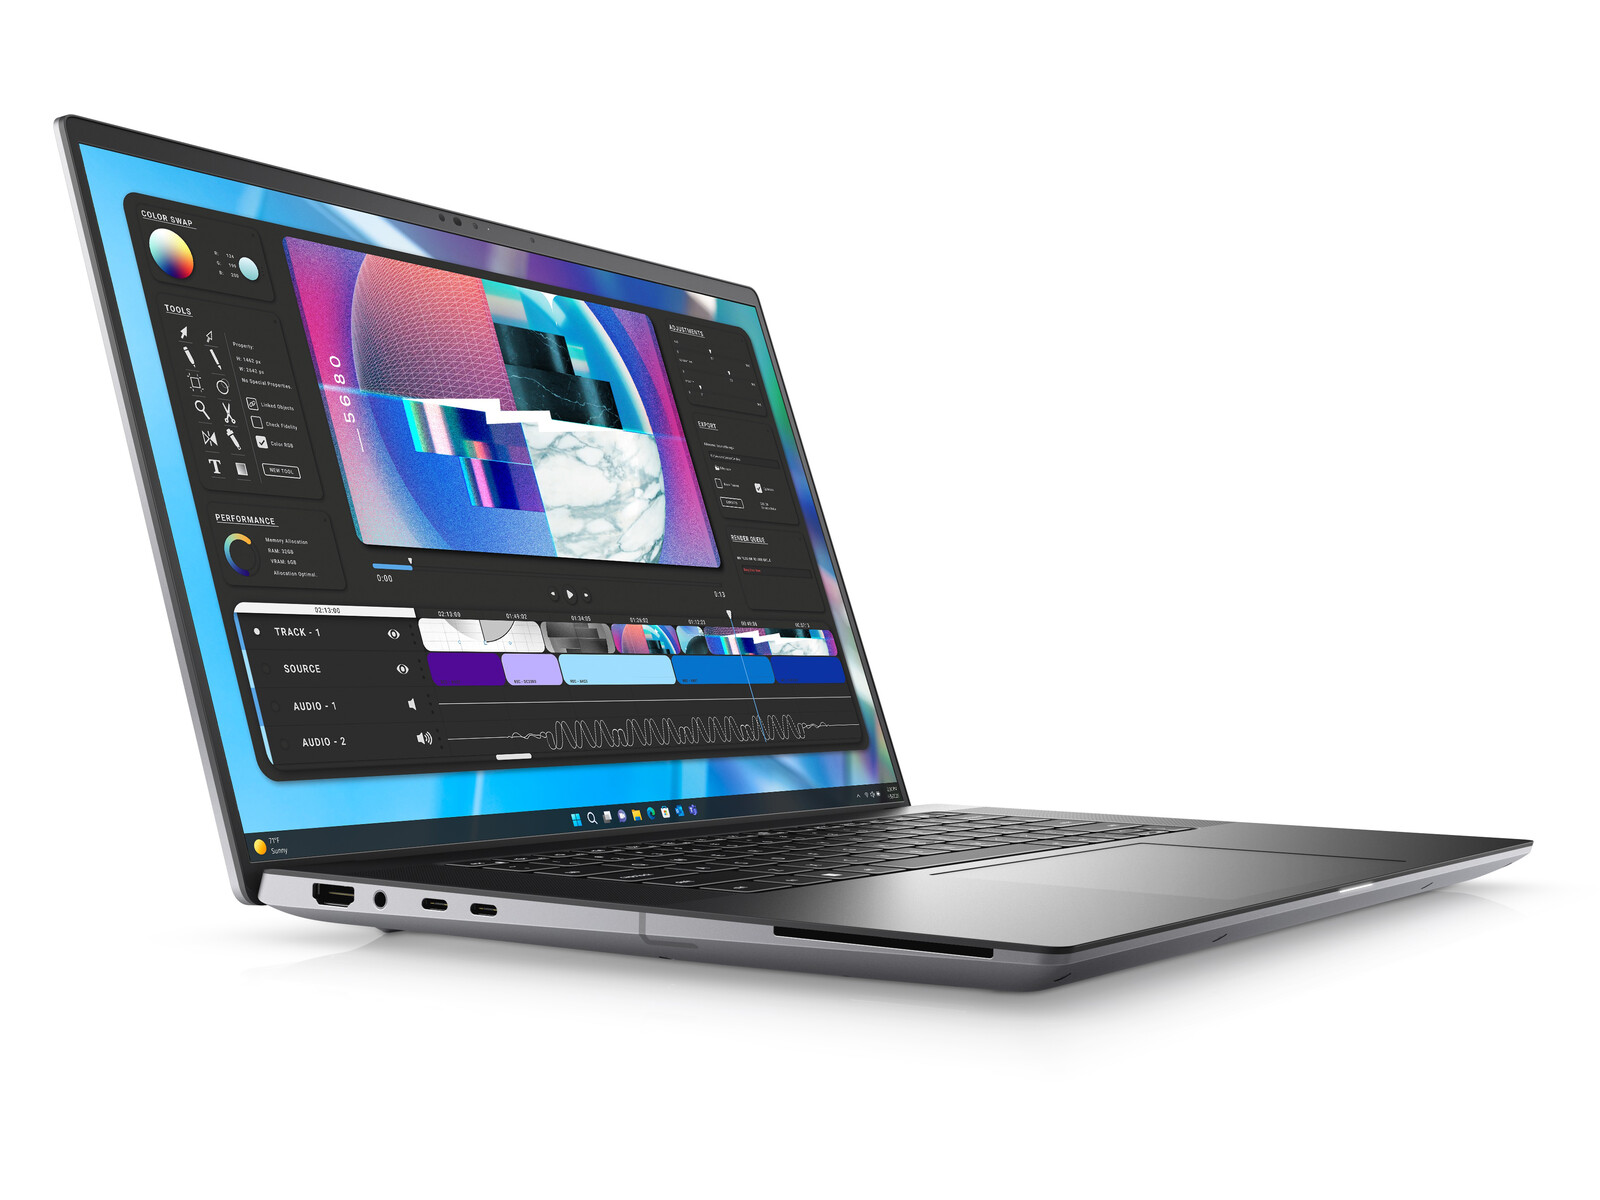
Dell Precision 5680 recension: Ada Lovelace dominerar på arbetsstationer

Precision 5680 är den första 16-tumsmodellen i Precision 5000-serien och kompletterar den befintliga 14-tums Precision 5470, 15-tums Precision 5560och 17-tums Precision 5750. Det är en avancerad mobil arbetsstation som är tunnare och lättare än en Precision 7000-modell men med färre integrerade extrafunktioner.
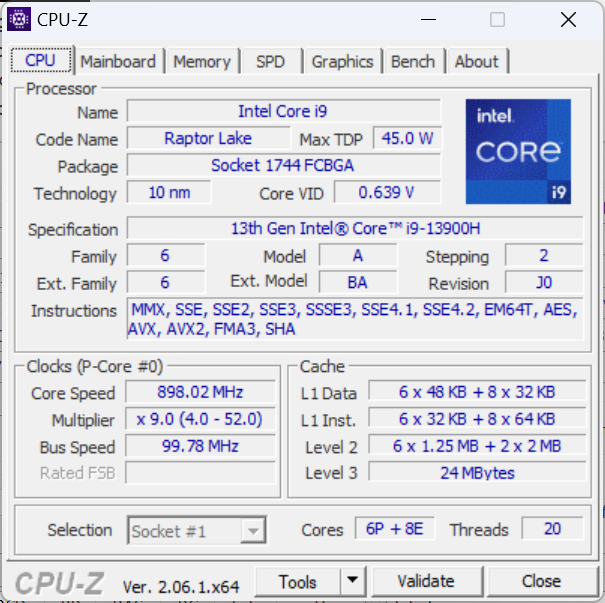
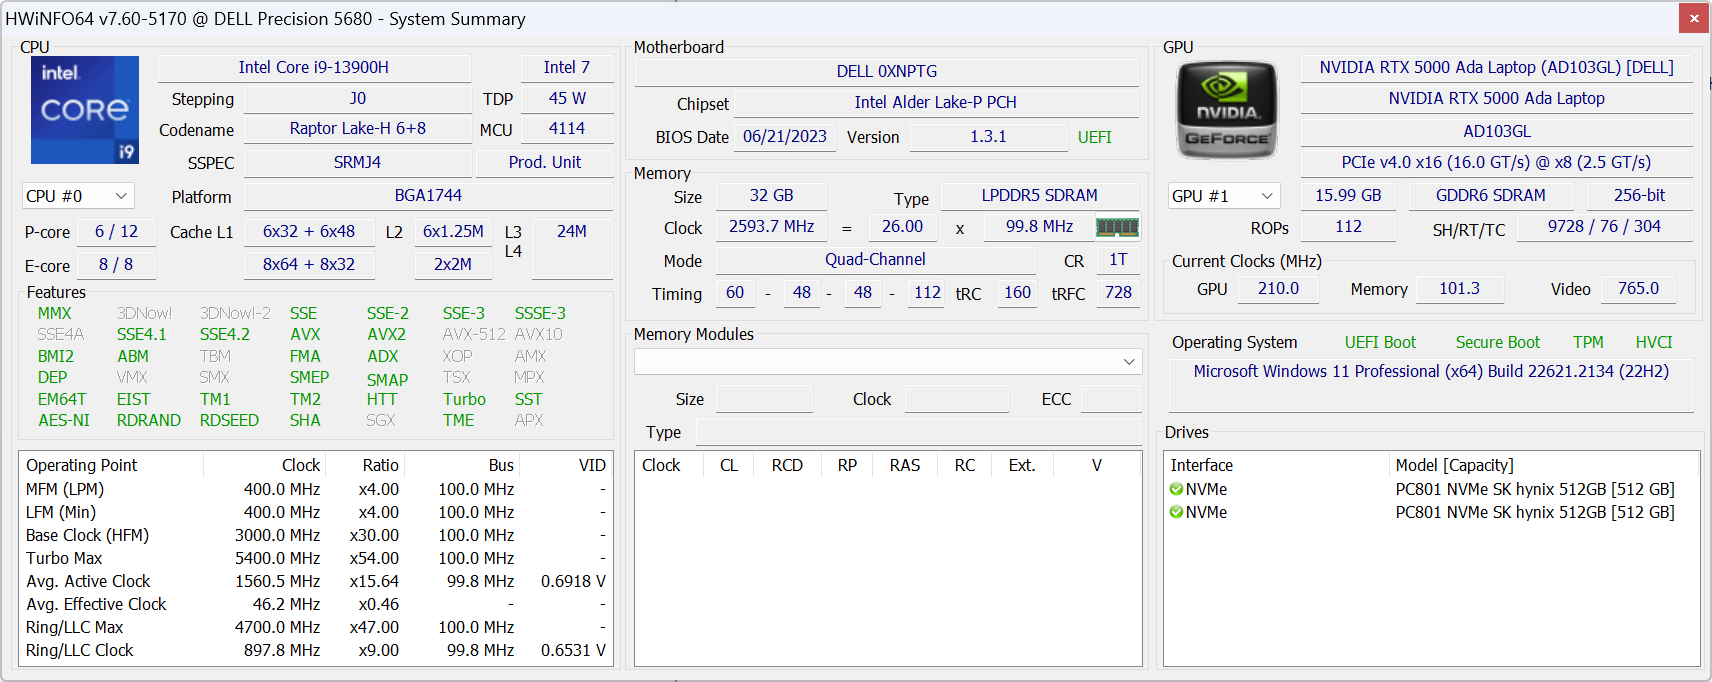
Vår testenhet är en avancerad konfiguration med 13:e generationens Raptor Lake-H Core i9-13900H CPU, 75 W Nvidia RTX 5000 GPU och 2400p OLED-pekskärm för cirka 6500 USD. Mindre SKU:er finns tillgängliga med Core i5-13600H, ingen diskret GPU och 1200p IPS-skärm för ett lägre startpris på ca 2490 USD.
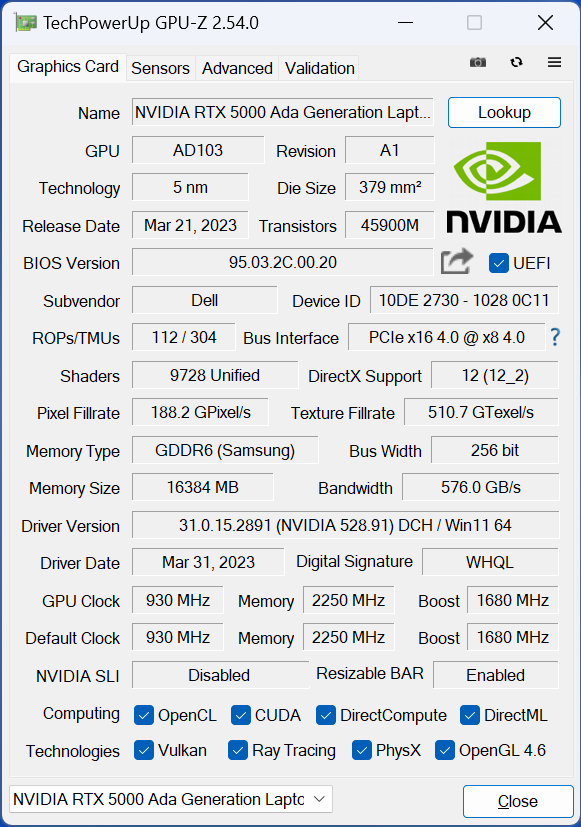
Detta råkar också vara en av de första arbetsstationerna som levereras med RTX 5000 Ada Lovelace mobil GPU, som inte bör förväxlas med den Turing-baserade Quadro RTX 5000 eller Ampere-baserade RTX A5000.
Konkurrenter inom detta område inkluderar andra 16-tums arbetsstationer somHP ZBook Fury 16 G9,Lenovo ThinkPad P16 G1,MSI CreatorPro Z16Peller Asus ProArt StudioBook 16-serien.
Fler recensioner av Dell:
Potentiella konkurrenter i jämförelse
Gradering | Datum | Modell | Vikt | Höjd | Storlek | Upplösning | Pris |
|---|---|---|---|---|---|---|---|
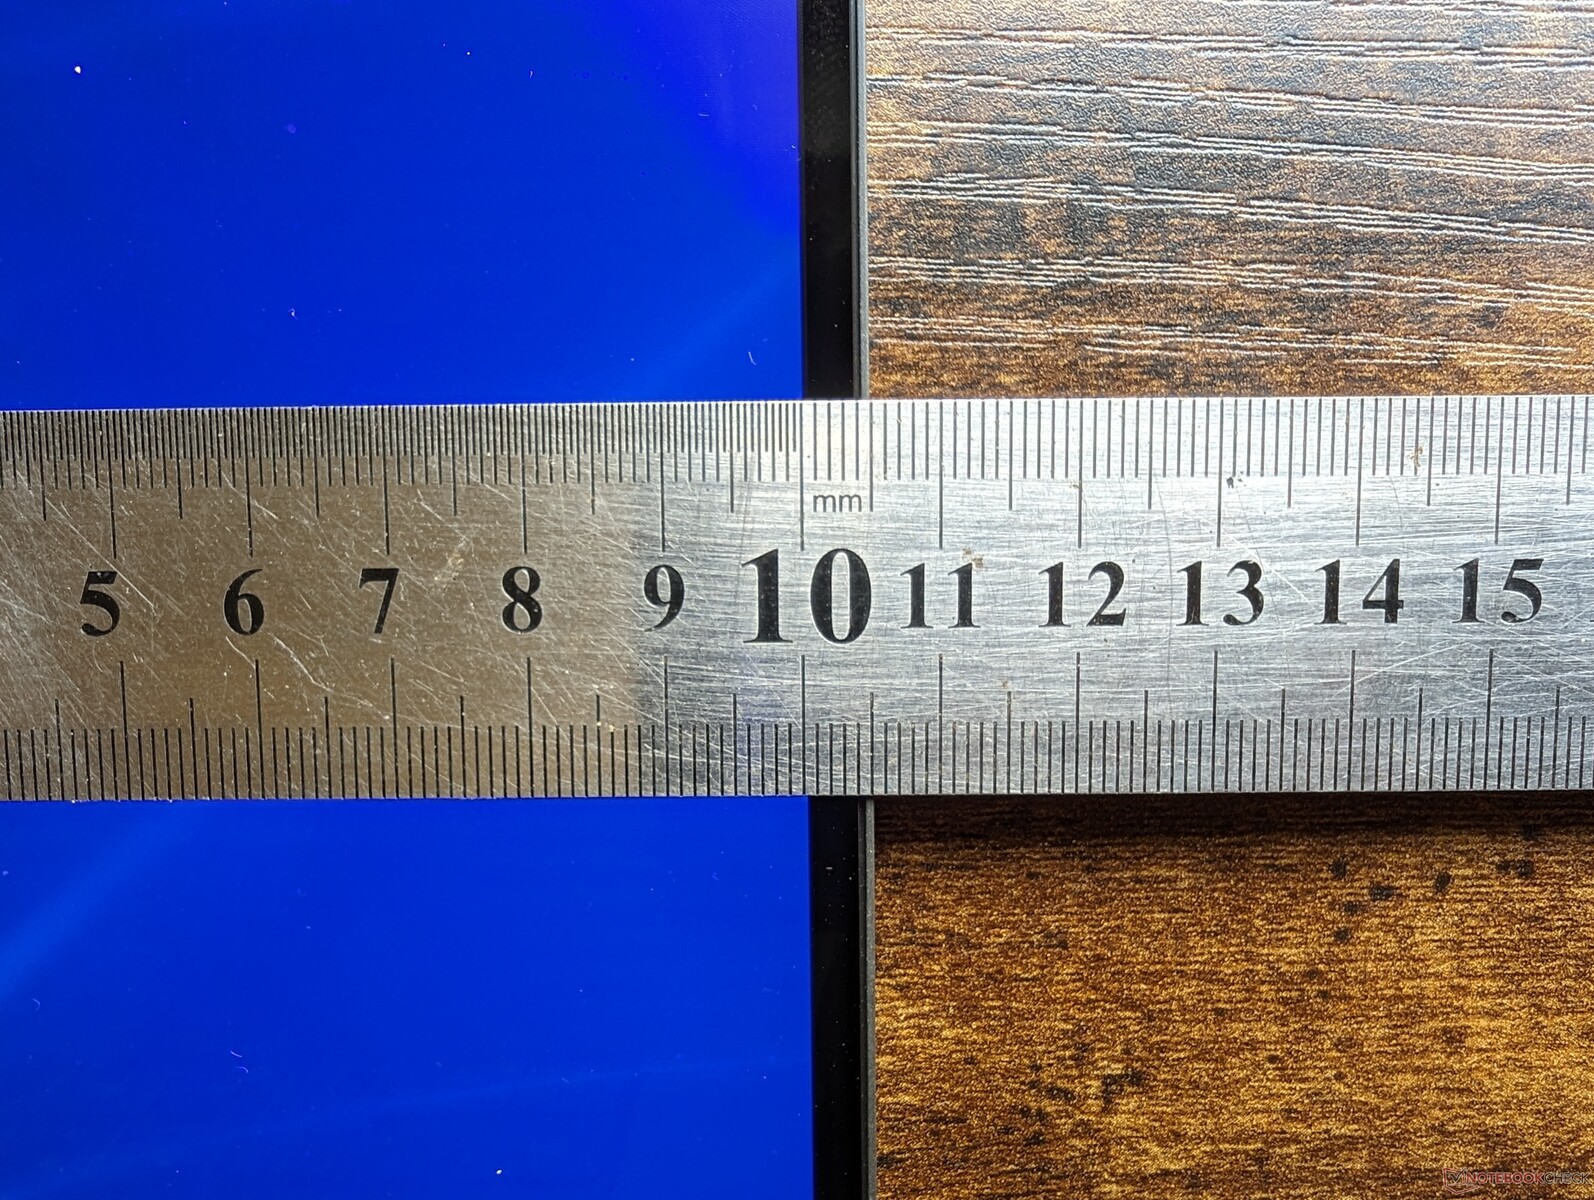
| 89 % v7 (old) | 08/2023 | Dell Precision 5000 5680 i9-13900H, RTX 5000 Ada Generation Laptop | 2.3 kg | 22.17 mm | 16.00" | 3840x2400 | |
| 89.1 % v7 (old) | 12/2022 | Dell Precision 7000 7670 Performance i9-12950HX, RTX A5500 Laptop GPU | 2.8 kg | 25.95 mm | 16.00" | 3840x2400 | |
| 91 % v7 (old) | 06/2023 | HP ZBook Fury 16 G9 i9-12950HX, RTX A5500 Laptop GPU | 2.6 kg | 28.5 mm | 16.00" | 3840x2400 | |
| 91 % v7 (old) | 02/2023 | Lenovo ThinkPad P16 G1 RTX A5500 i9-12950HX, RTX A5500 Laptop GPU | 3 kg | 30.23 mm | 16.00" | 3840x2400 | |
| 84.3 % v7 (old) | 11/2022 | MSI CreatorPro Z16P B12UKST i7-12700H, RTX A3000 Laptop GPU | 2.4 kg | 19 mm | 16.00" | 2560x1600 | |
| 89.6 % v7 (old) | 01/2023 | Asus ExpertBook B6 Flip B6602FC2 i9-12950HX, RTX A2000 Laptop GPU | 2.8 kg | 27.2 mm | 16.00" | 2560x1600 |
Fodral - XPS Roots
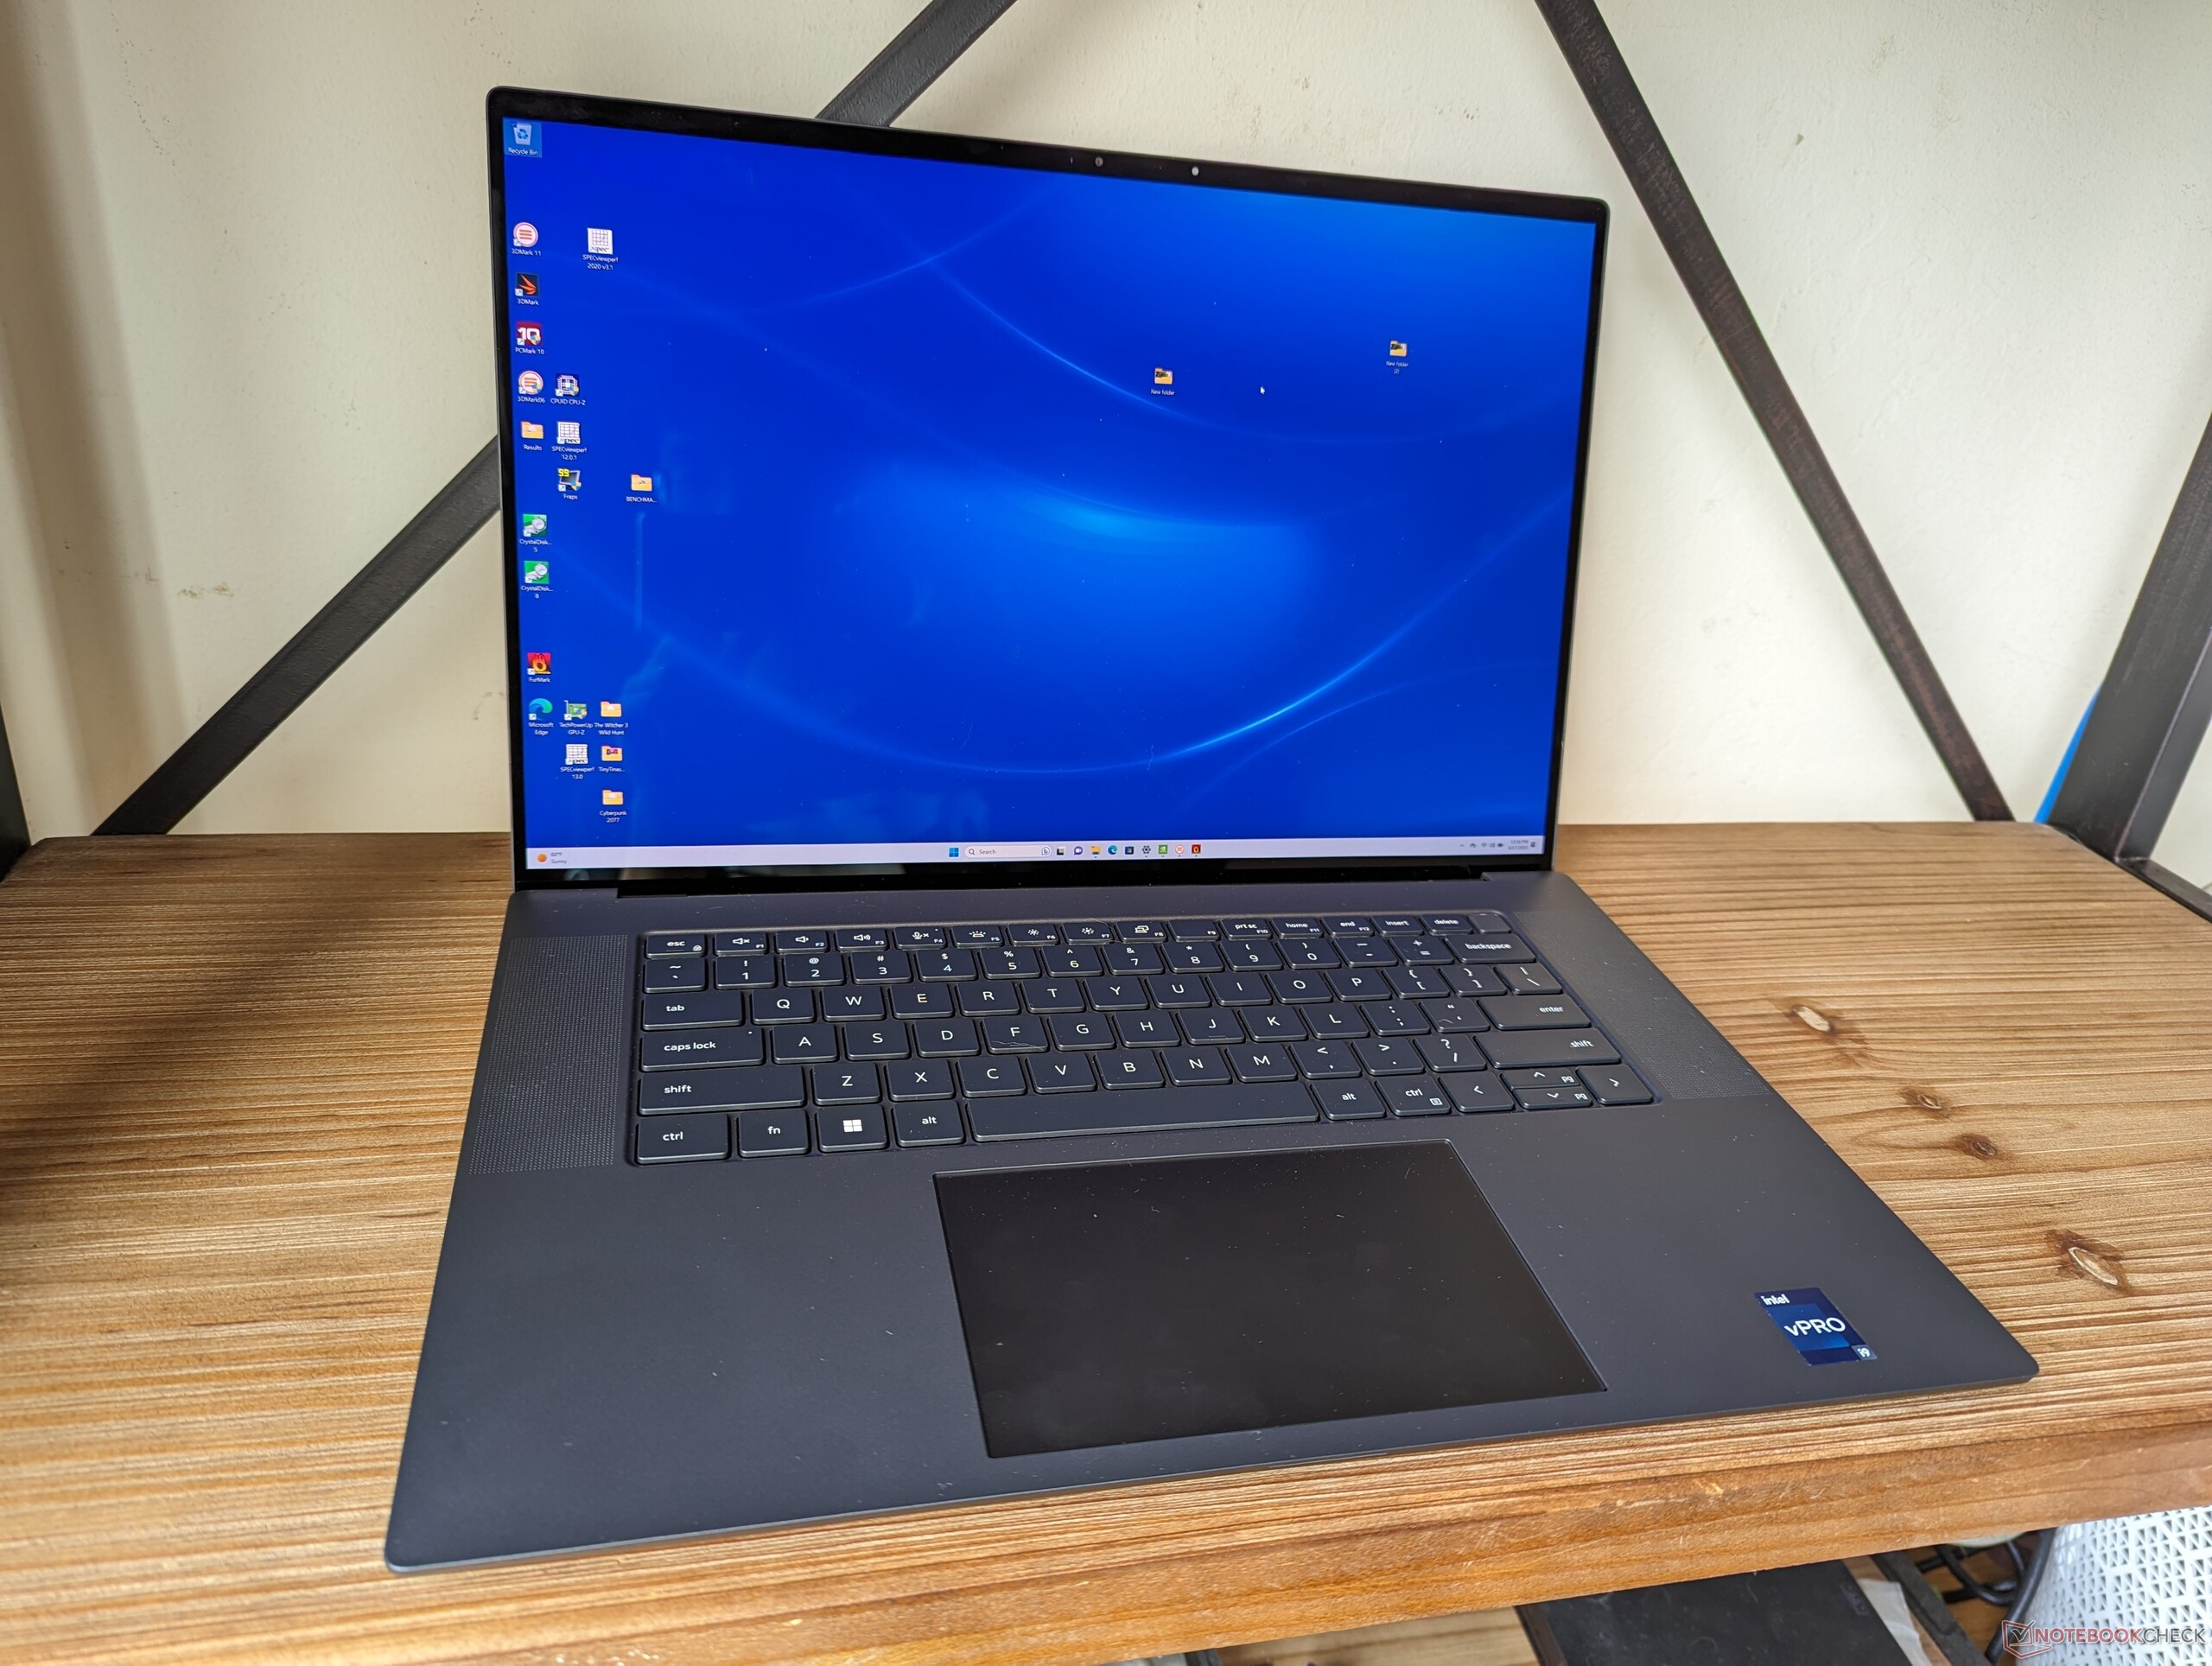
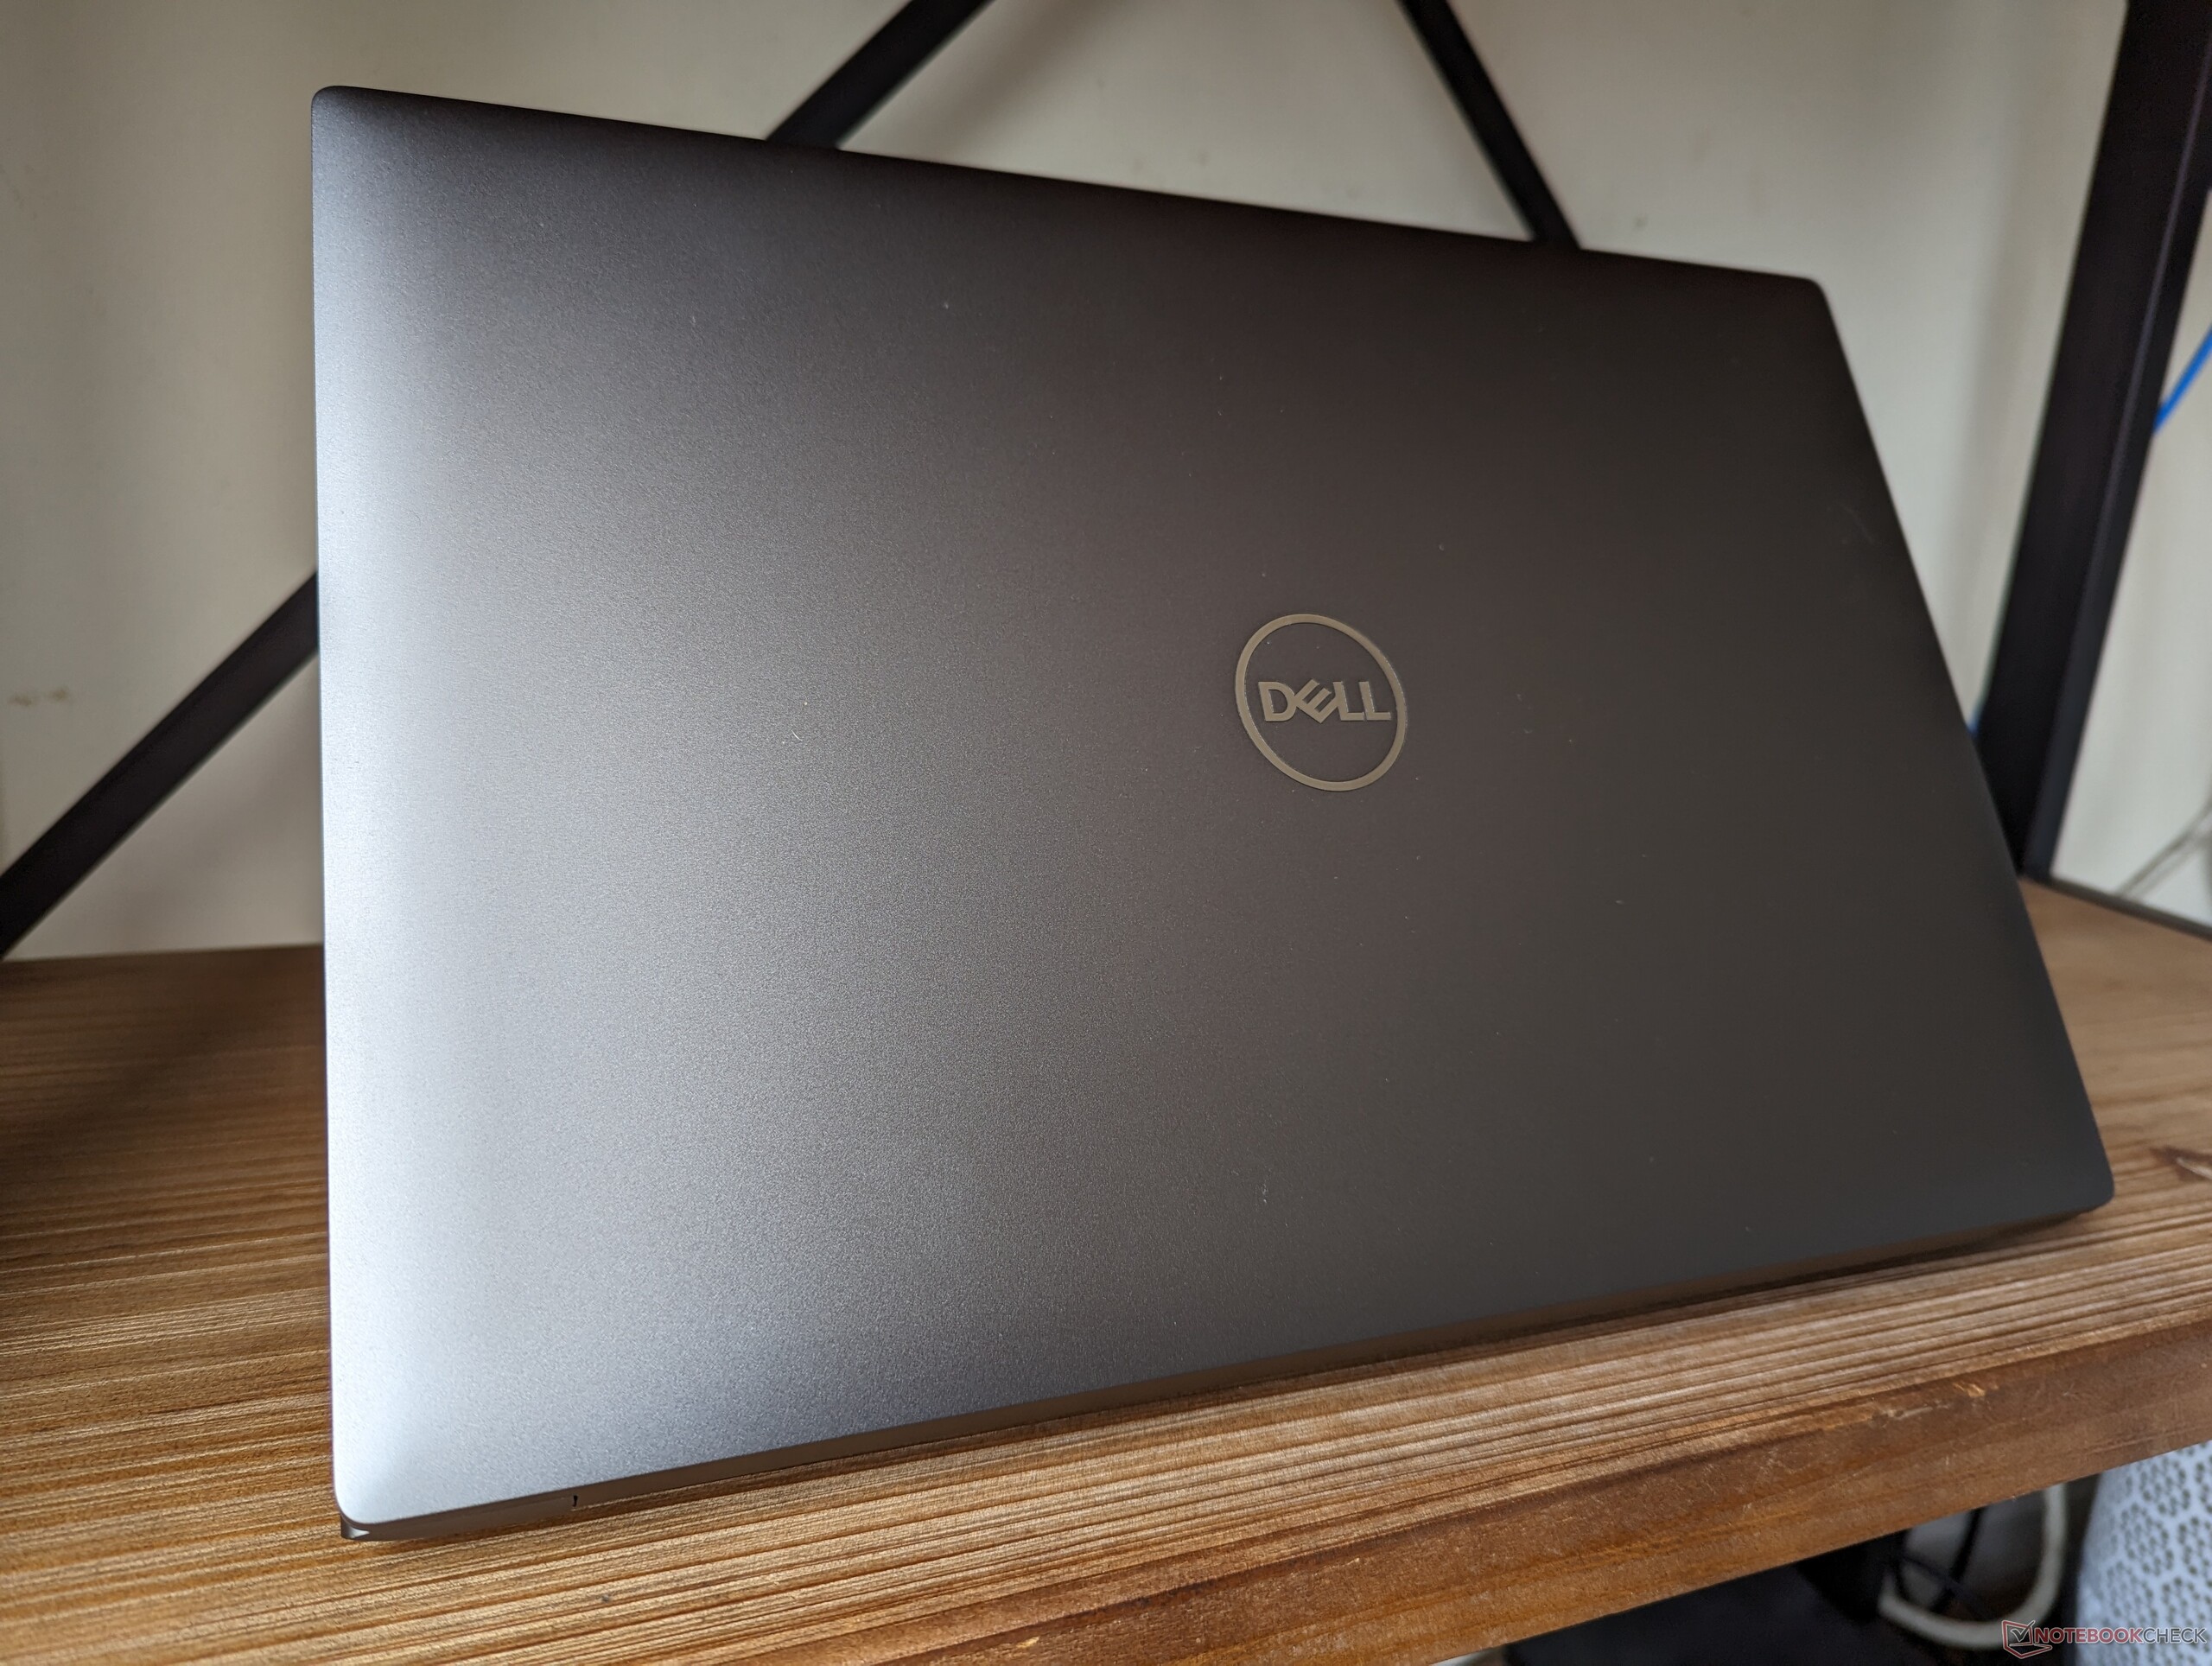
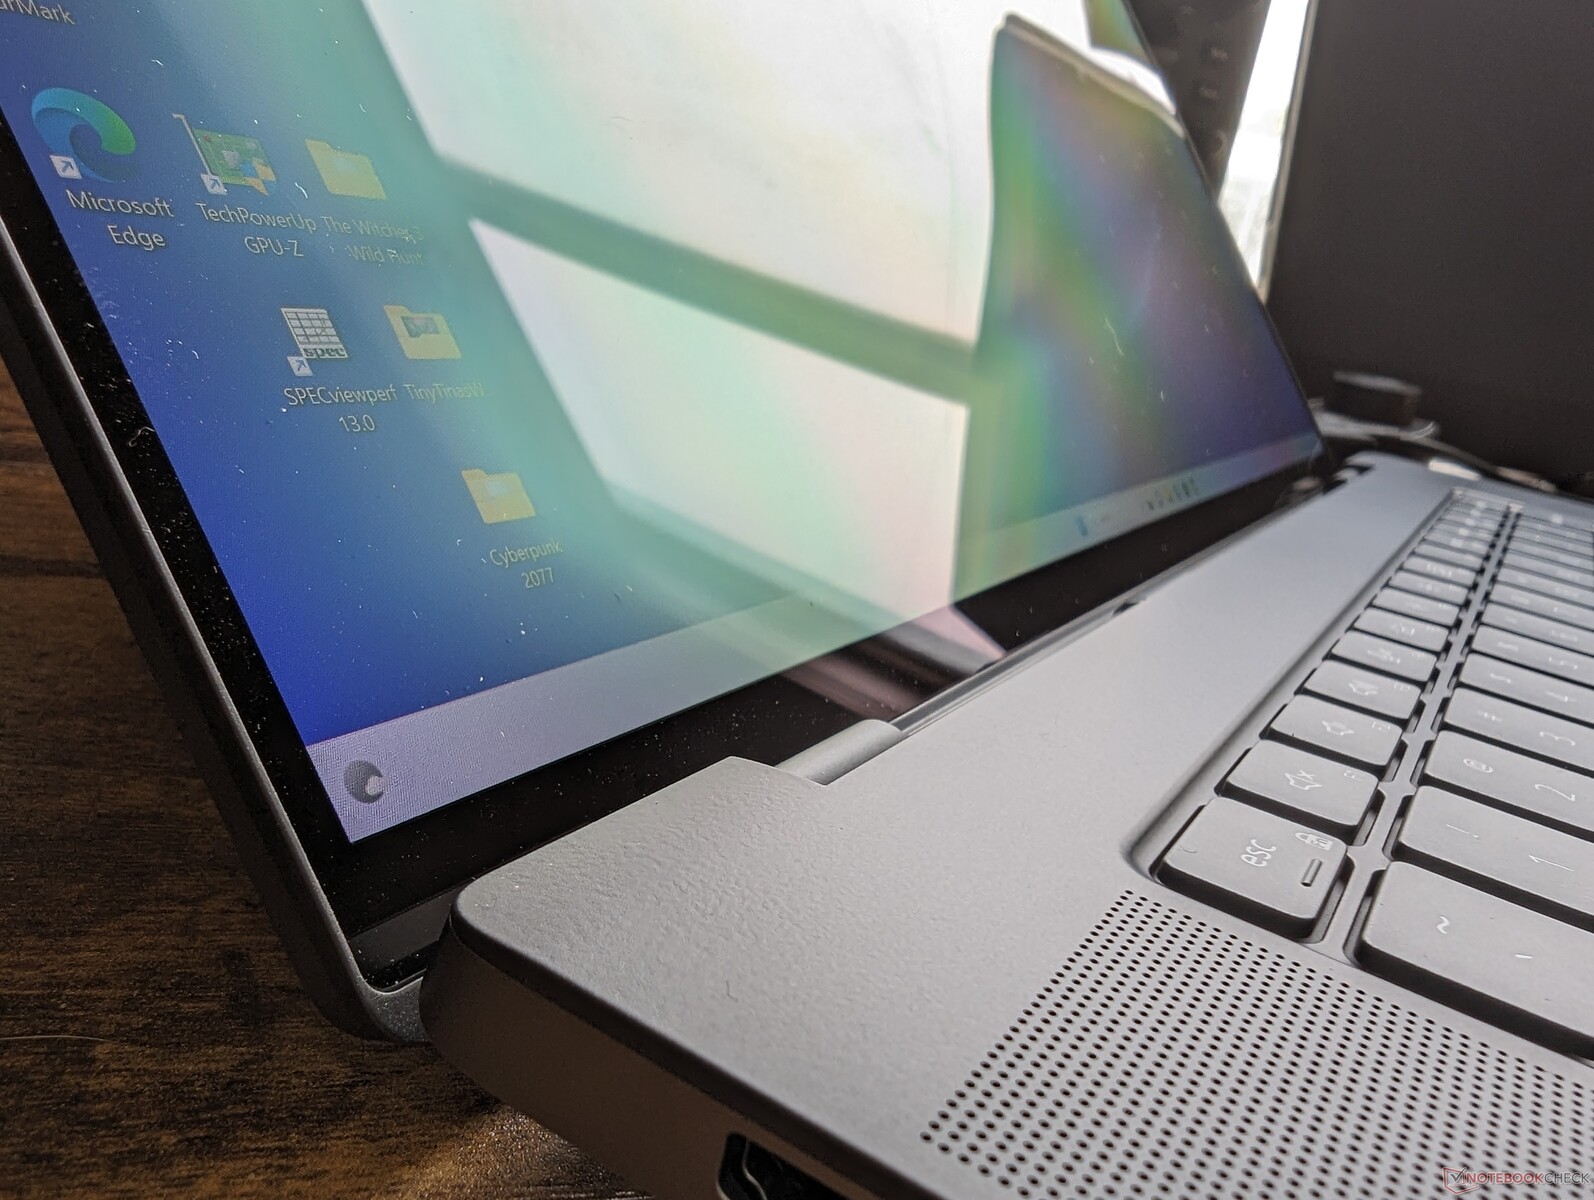
Inspirationen till designen på Precision 5680 är uppenbar eftersom den i princip är 16-tumsversionen av 15-tums XPS 15 och 17-tums XPS 17. Om du har erfarenhet av en XPS-modell tidigare bör Precision 5680 kännas omedelbart bekant. Den föregår till synes en hypotetisk "XPS 16" och vi skulle inte bli förvånade om vi inom en snar framtid får se en sådan modell med ett chassi baserat på Precision 5680.
Byggkvaliteten kan jämföras med alternativ som ZBook Fury 16 G9 ellerCreatorPro Z16P som också består mestadels av metalllegeringar för starka första intryck.
Med sina 2,3 kg är Precision 5680 en av de lättaste 16-tums arbetsstationerna på marknaden med god marginal. CreatorPro Z16P ochHP ZBook Fury 16 G9är till exempel cirka 100 g respektive 300 g tyngre, samtidigt som de också är större i fotavtryck än vår Dell. Precision 5680 är förvånansvärt portabel med tanke på dess prestanda.
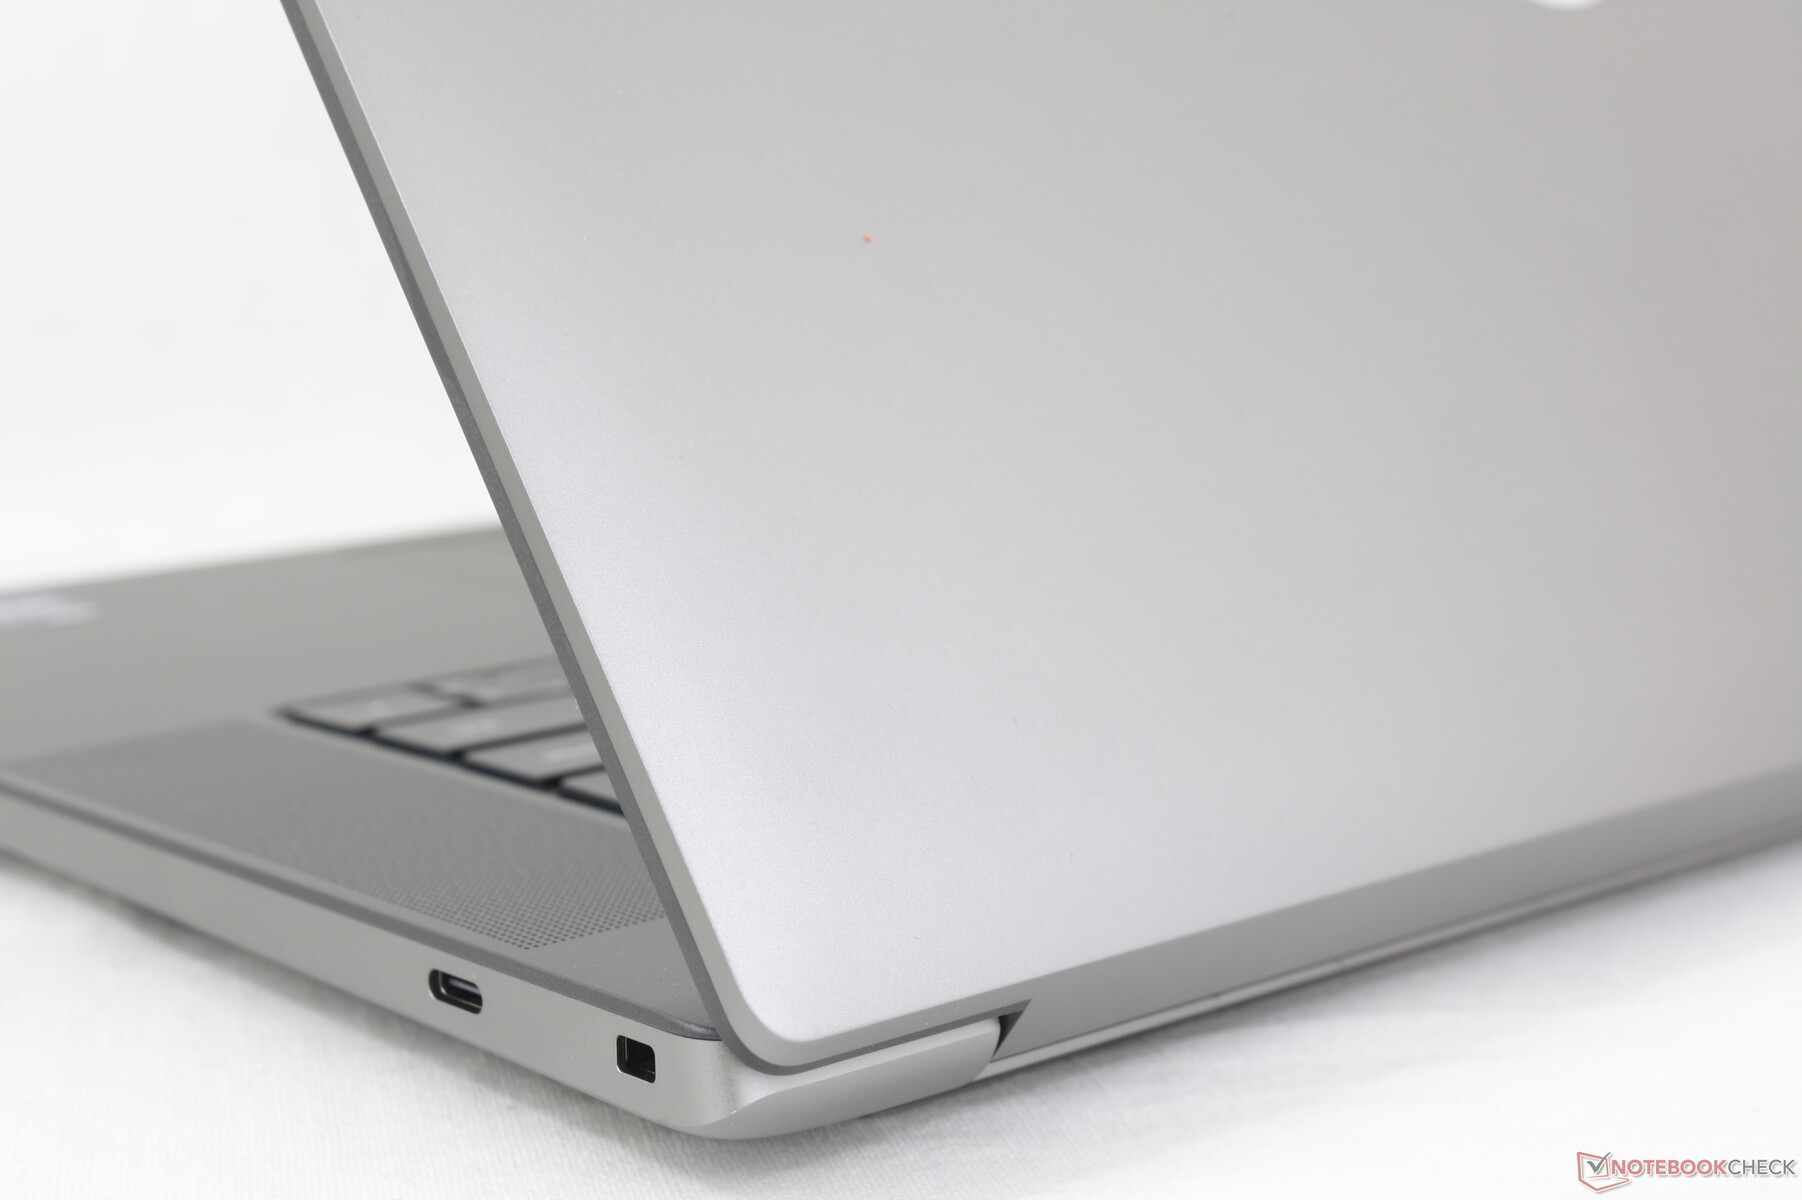
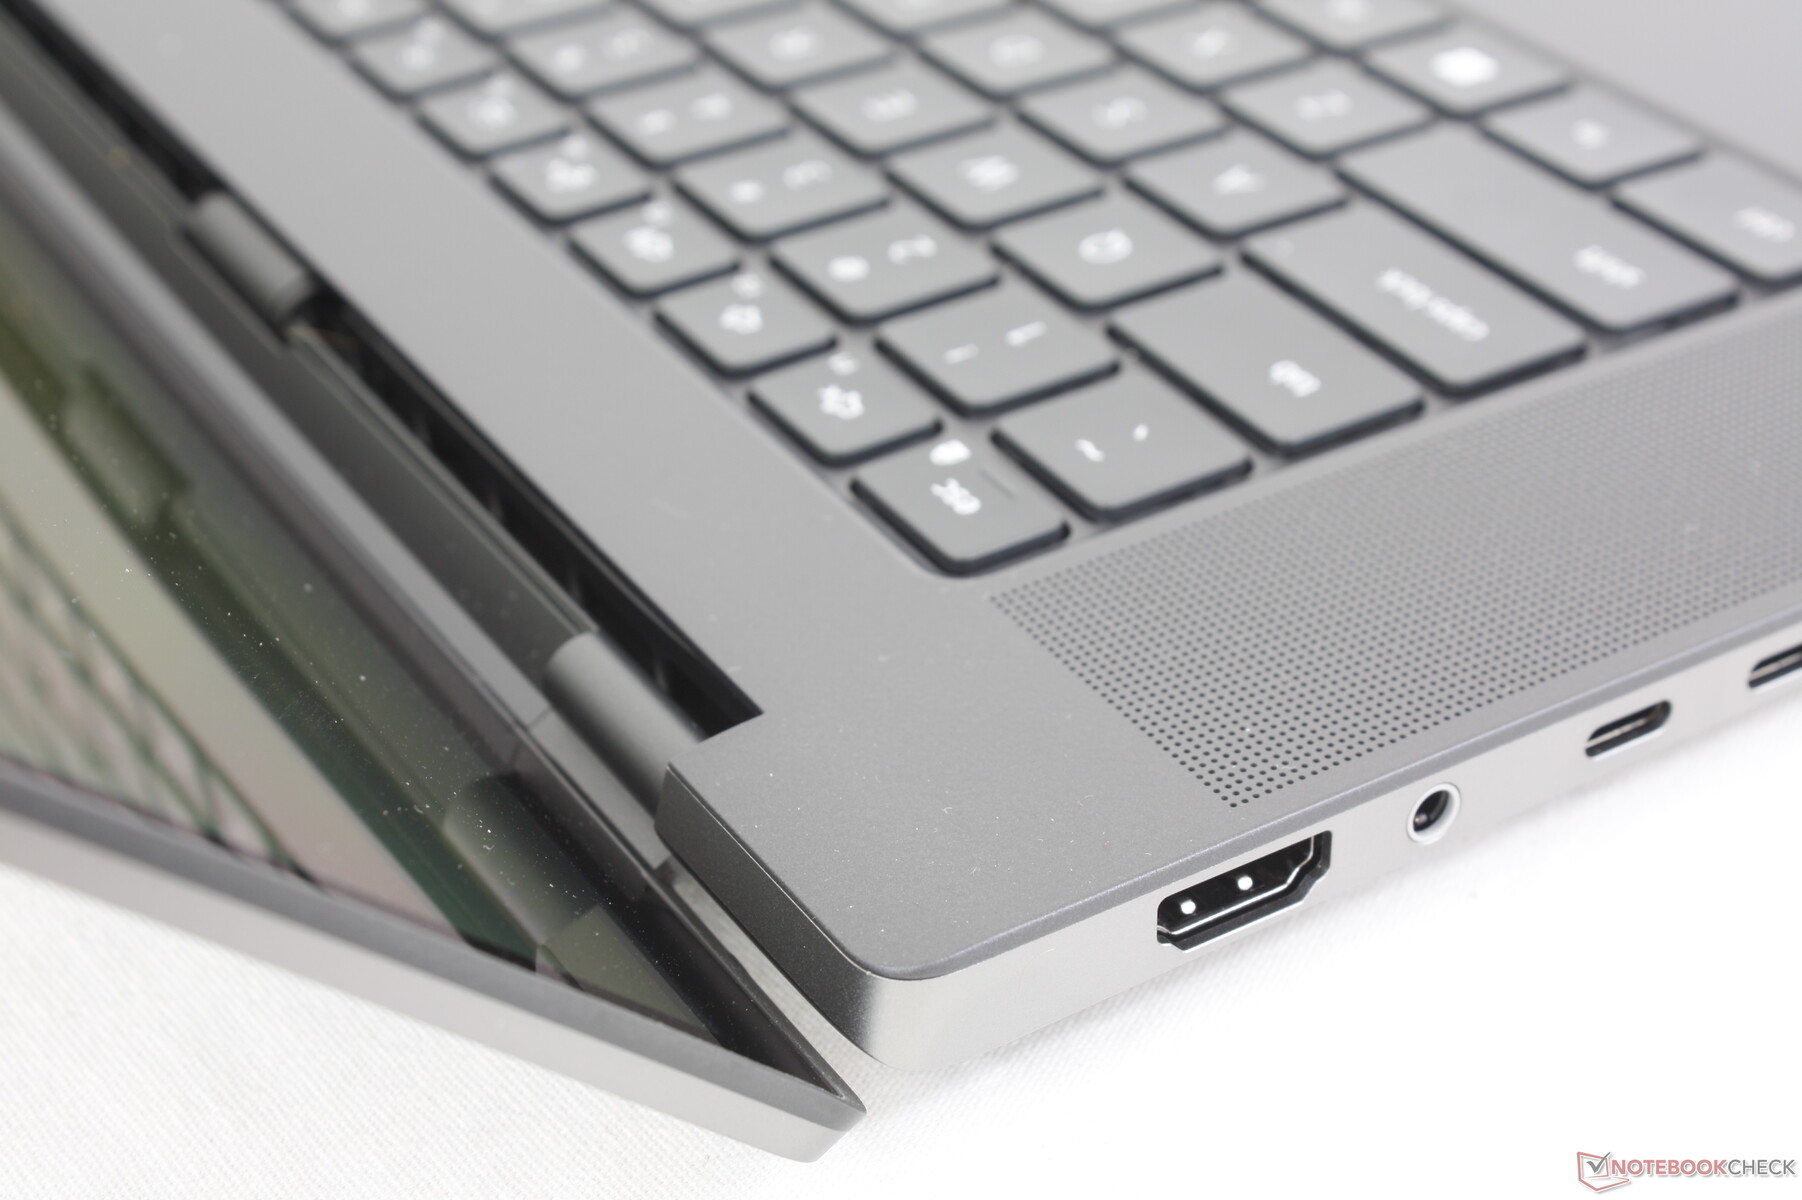
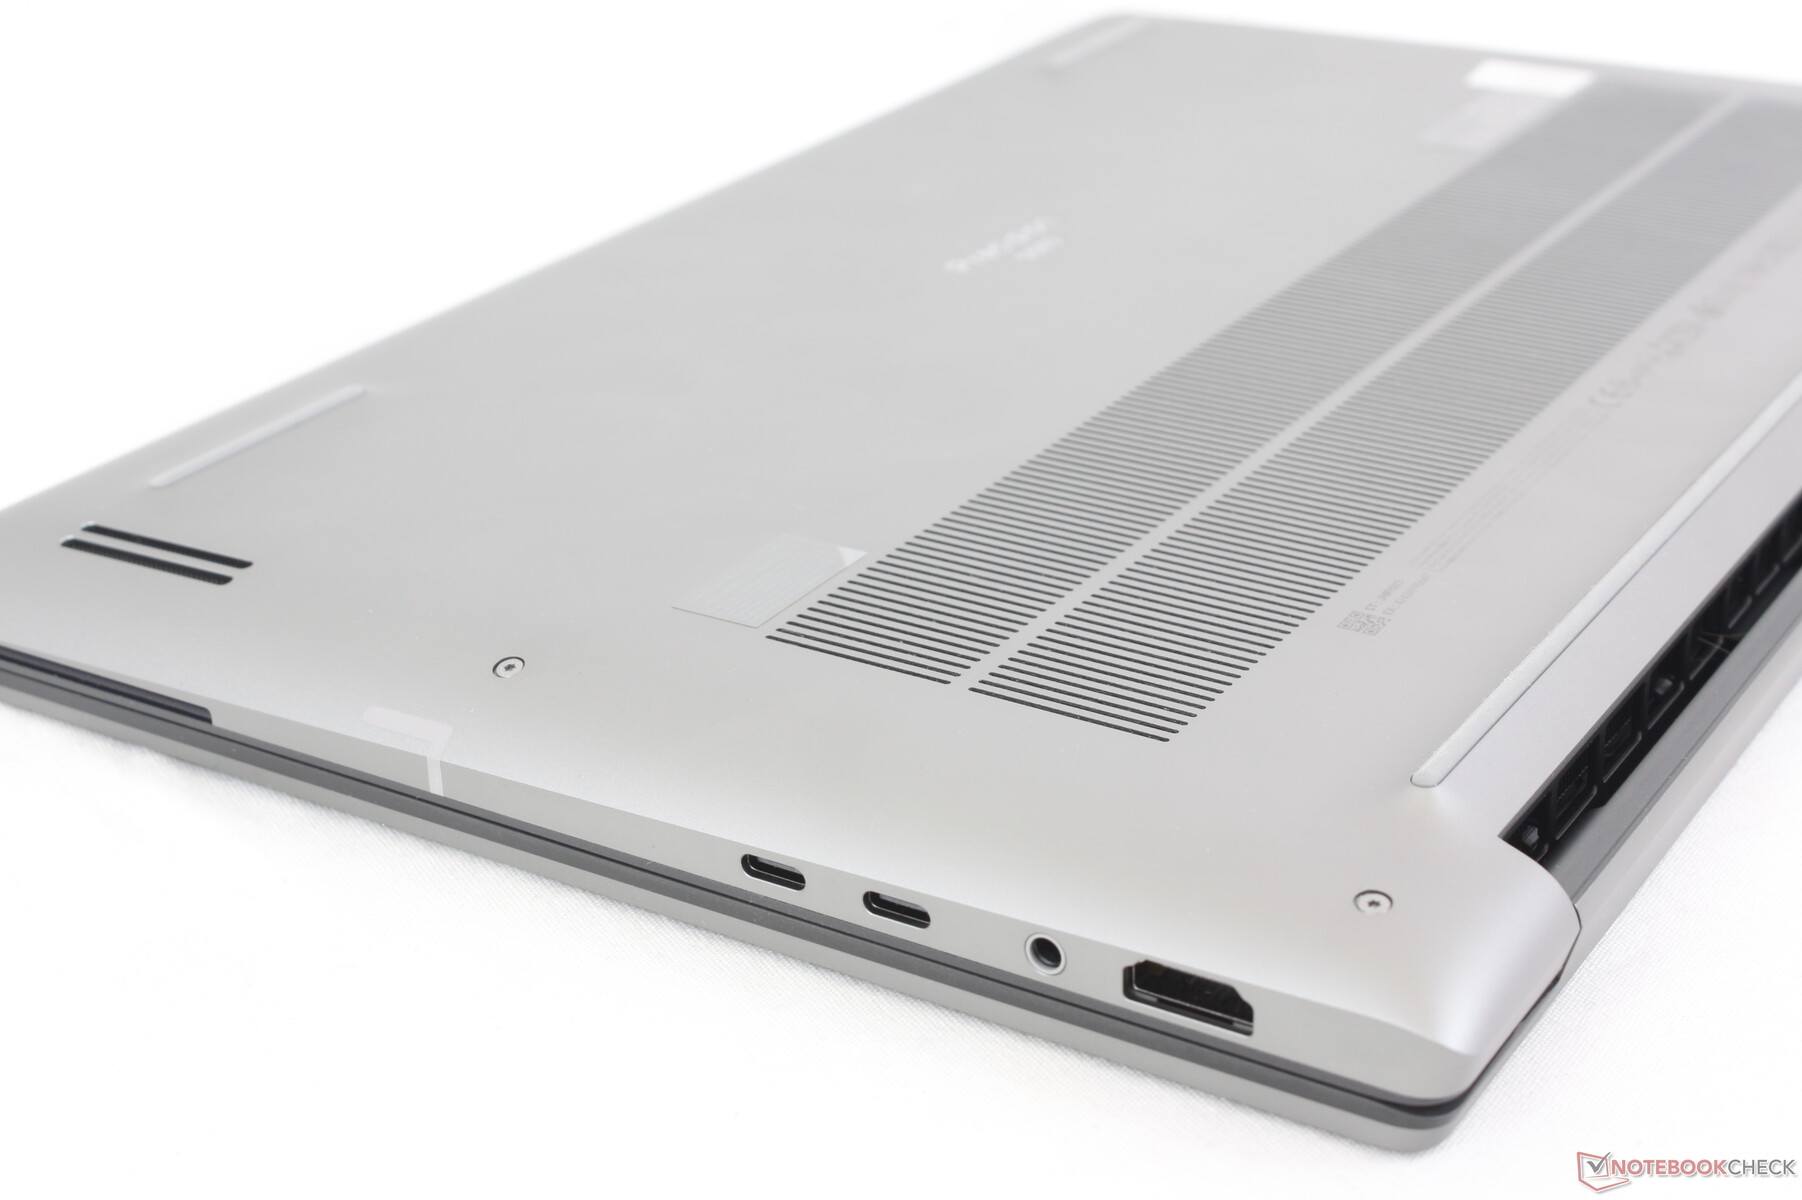
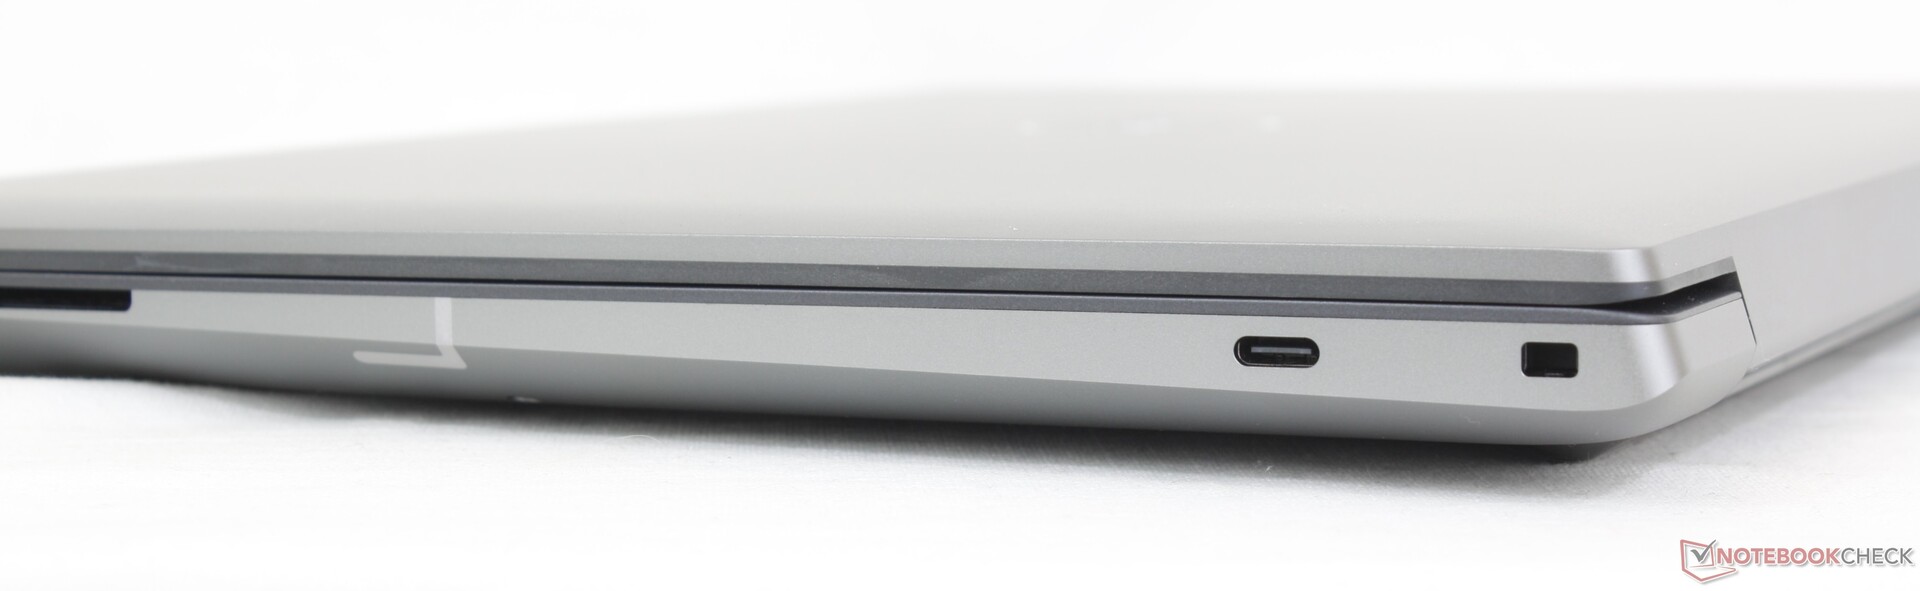
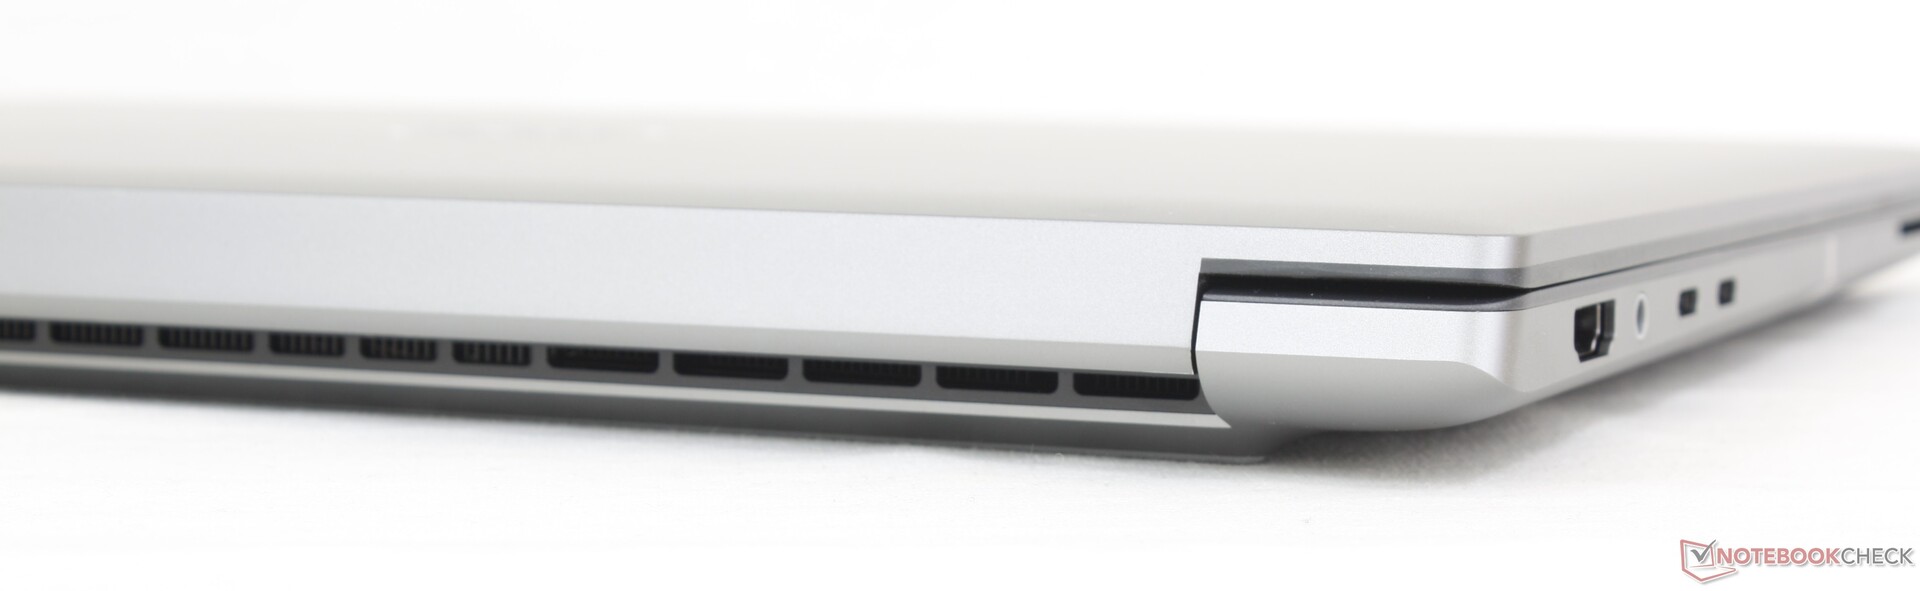
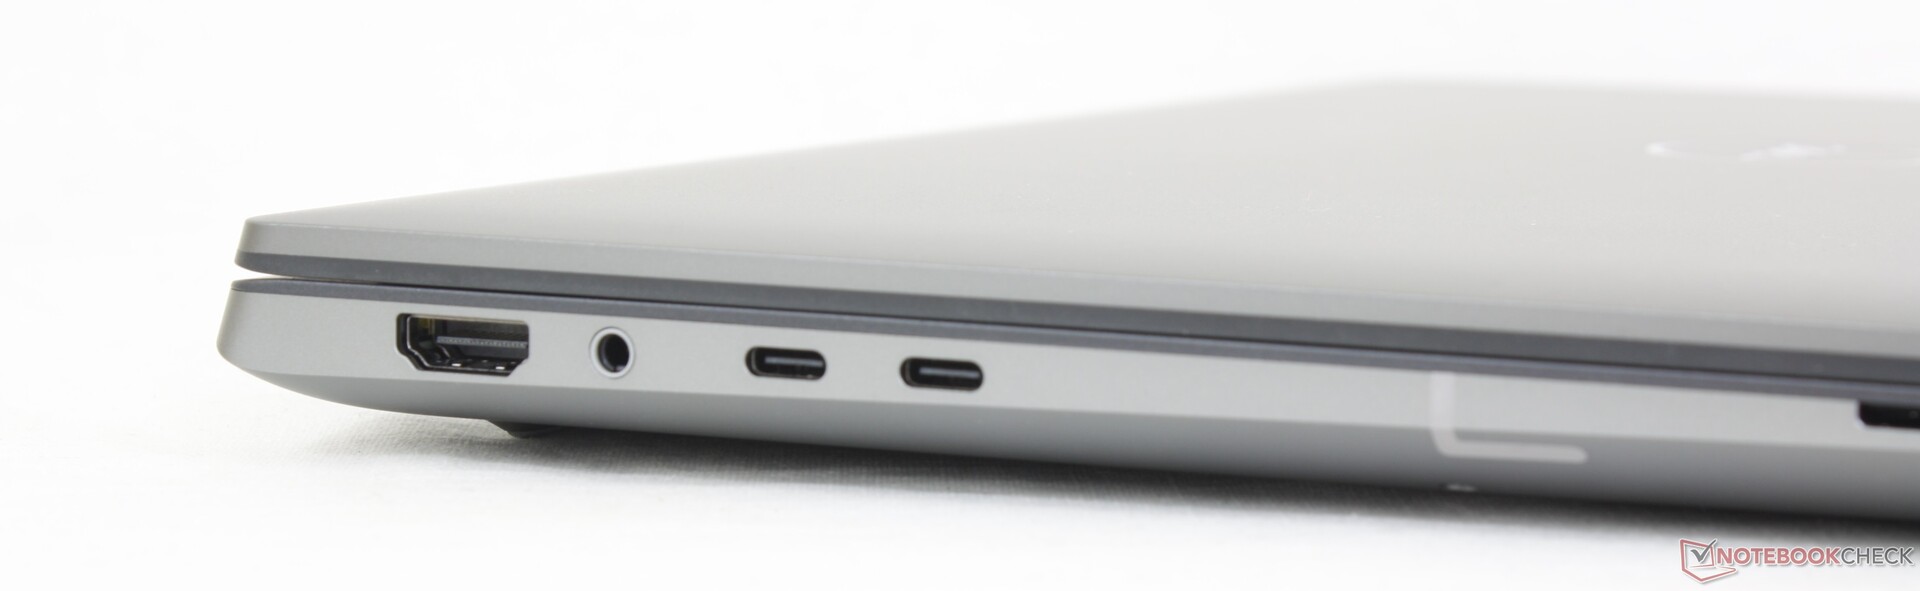
Anslutningsmöjligheter - inte mycket för en arbetsstation
Portalternativen är framåtblickande på gott och ont. Det är bättre i den meningen att varje port är mycket mångsidig när det gäller adaptrar och kringutrustning, men det är också sämre i den meningen att det inte finns några stapelportar som USB i full storlek eller RJ-45. Alternativ som ThinkPad P1 G4 eller ExpertBook B6 Flip erbjuder alla ett bredare utbud av portar än vår Dell. Var beredd på att förlita dig på adaptrar eller dockningsstationer när du använder Precision 5680 som ett resultat.
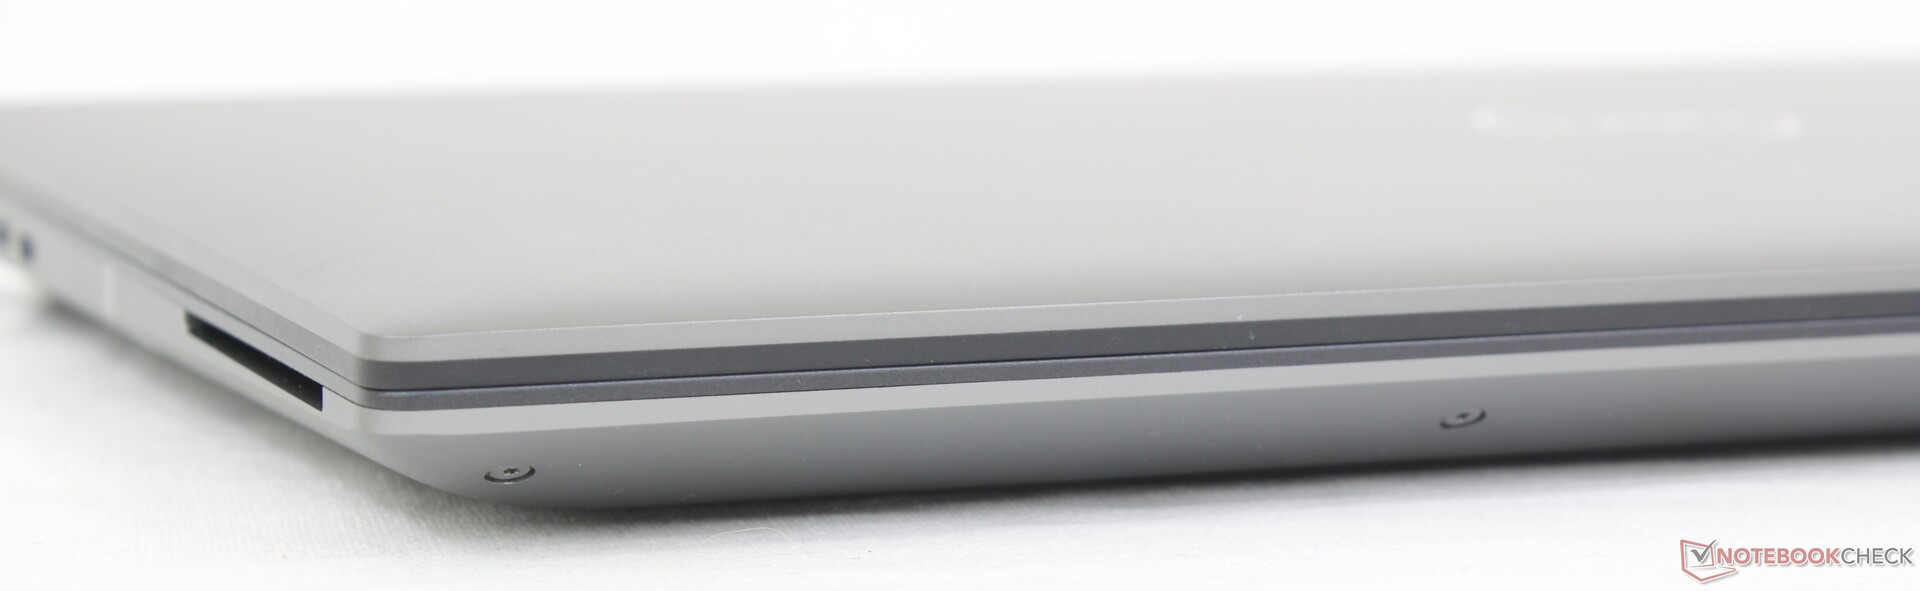
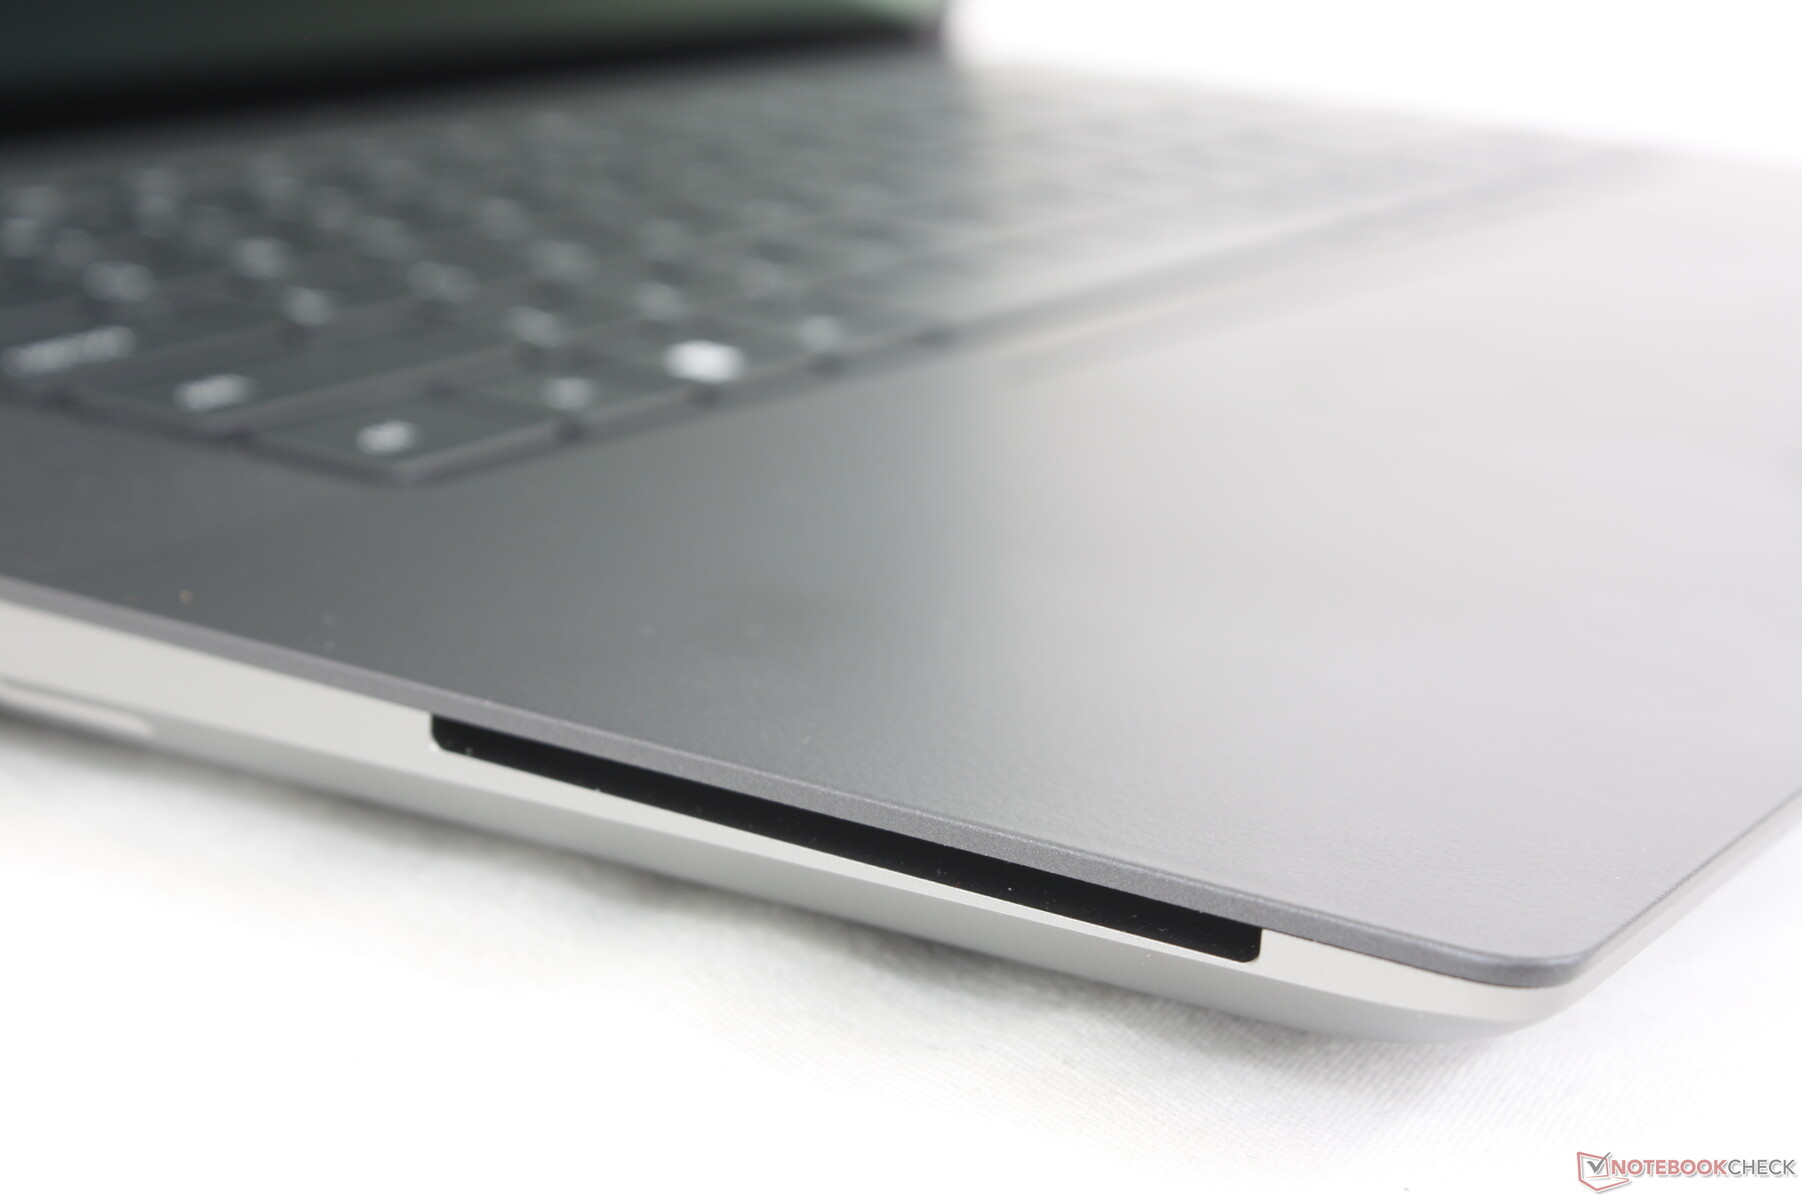
SD-kortläsare
XPS- och Precision -modellerna har några av de snabbaste integrerade SD-kortläsarna och detta fortsätter att gälla för vår Precision 5680. Läshastigheterna är över 2x snabbare än på ZBook Fury 16 G9 eller ThinkPad P16 G1 och det skulle bara ta 5 till 6 sekunder att överföra 1 GB data från vårt UHS-II-testkort till skrivbordet.
| SD Card Reader | |
| average JPG Copy Test (av. of 3 runs) | |
| Dell Precision 5000 5680 (Toshiba Exceria Pro SDXC 64 GB UHS-II) | |
| Dell Precision 7000 7670 Performance (Toshiba Exceria Pro SDXC 64 GB UHS-II) | |
| MSI CreatorPro Z16P B12UKST (AV Pro V60) | |
| HP ZBook Fury 16 G9 (PNY EliteX-PRO60) | |
| Lenovo ThinkPad P16 G1 RTX A5500 (Toshiba Exceria Pro SDXC 64 GB UHS-II) | |
| maximum AS SSD Seq Read Test (1GB) | |
| Dell Precision 7000 7670 Performance (Toshiba Exceria Pro SDXC 64 GB UHS-II) | |
| Dell Precision 5000 5680 (Toshiba Exceria Pro SDXC 64 GB UHS-II) | |
| HP ZBook Fury 16 G9 (PNY EliteX-PRO60) | |
| MSI CreatorPro Z16P B12UKST (AV Pro V60) | |
| Lenovo ThinkPad P16 G1 RTX A5500 (Toshiba Exceria Pro SDXC 64 GB UHS-II) | |
Kommunikation
En Intel AX211 är standard för Wi-Fi 6E och Bluetooth 5.3-anslutning. Överföringshastigheterna var stabila när de kopplades till vårt Asus AXE11000 6GHz-nätverk.
WAN-alternativ stöds tyvärr inte till skillnad från den konkurrerande ZBook Fury 16 G9.
Webbkamera
Dell har förbättrat webbkameran från 1 MP på Precision 5550 till 2 MP på vår Precision 5680. Trots detta är det irriterande att det fortfarande inte finns någon integrerad sekretesslucka.


Underhåll
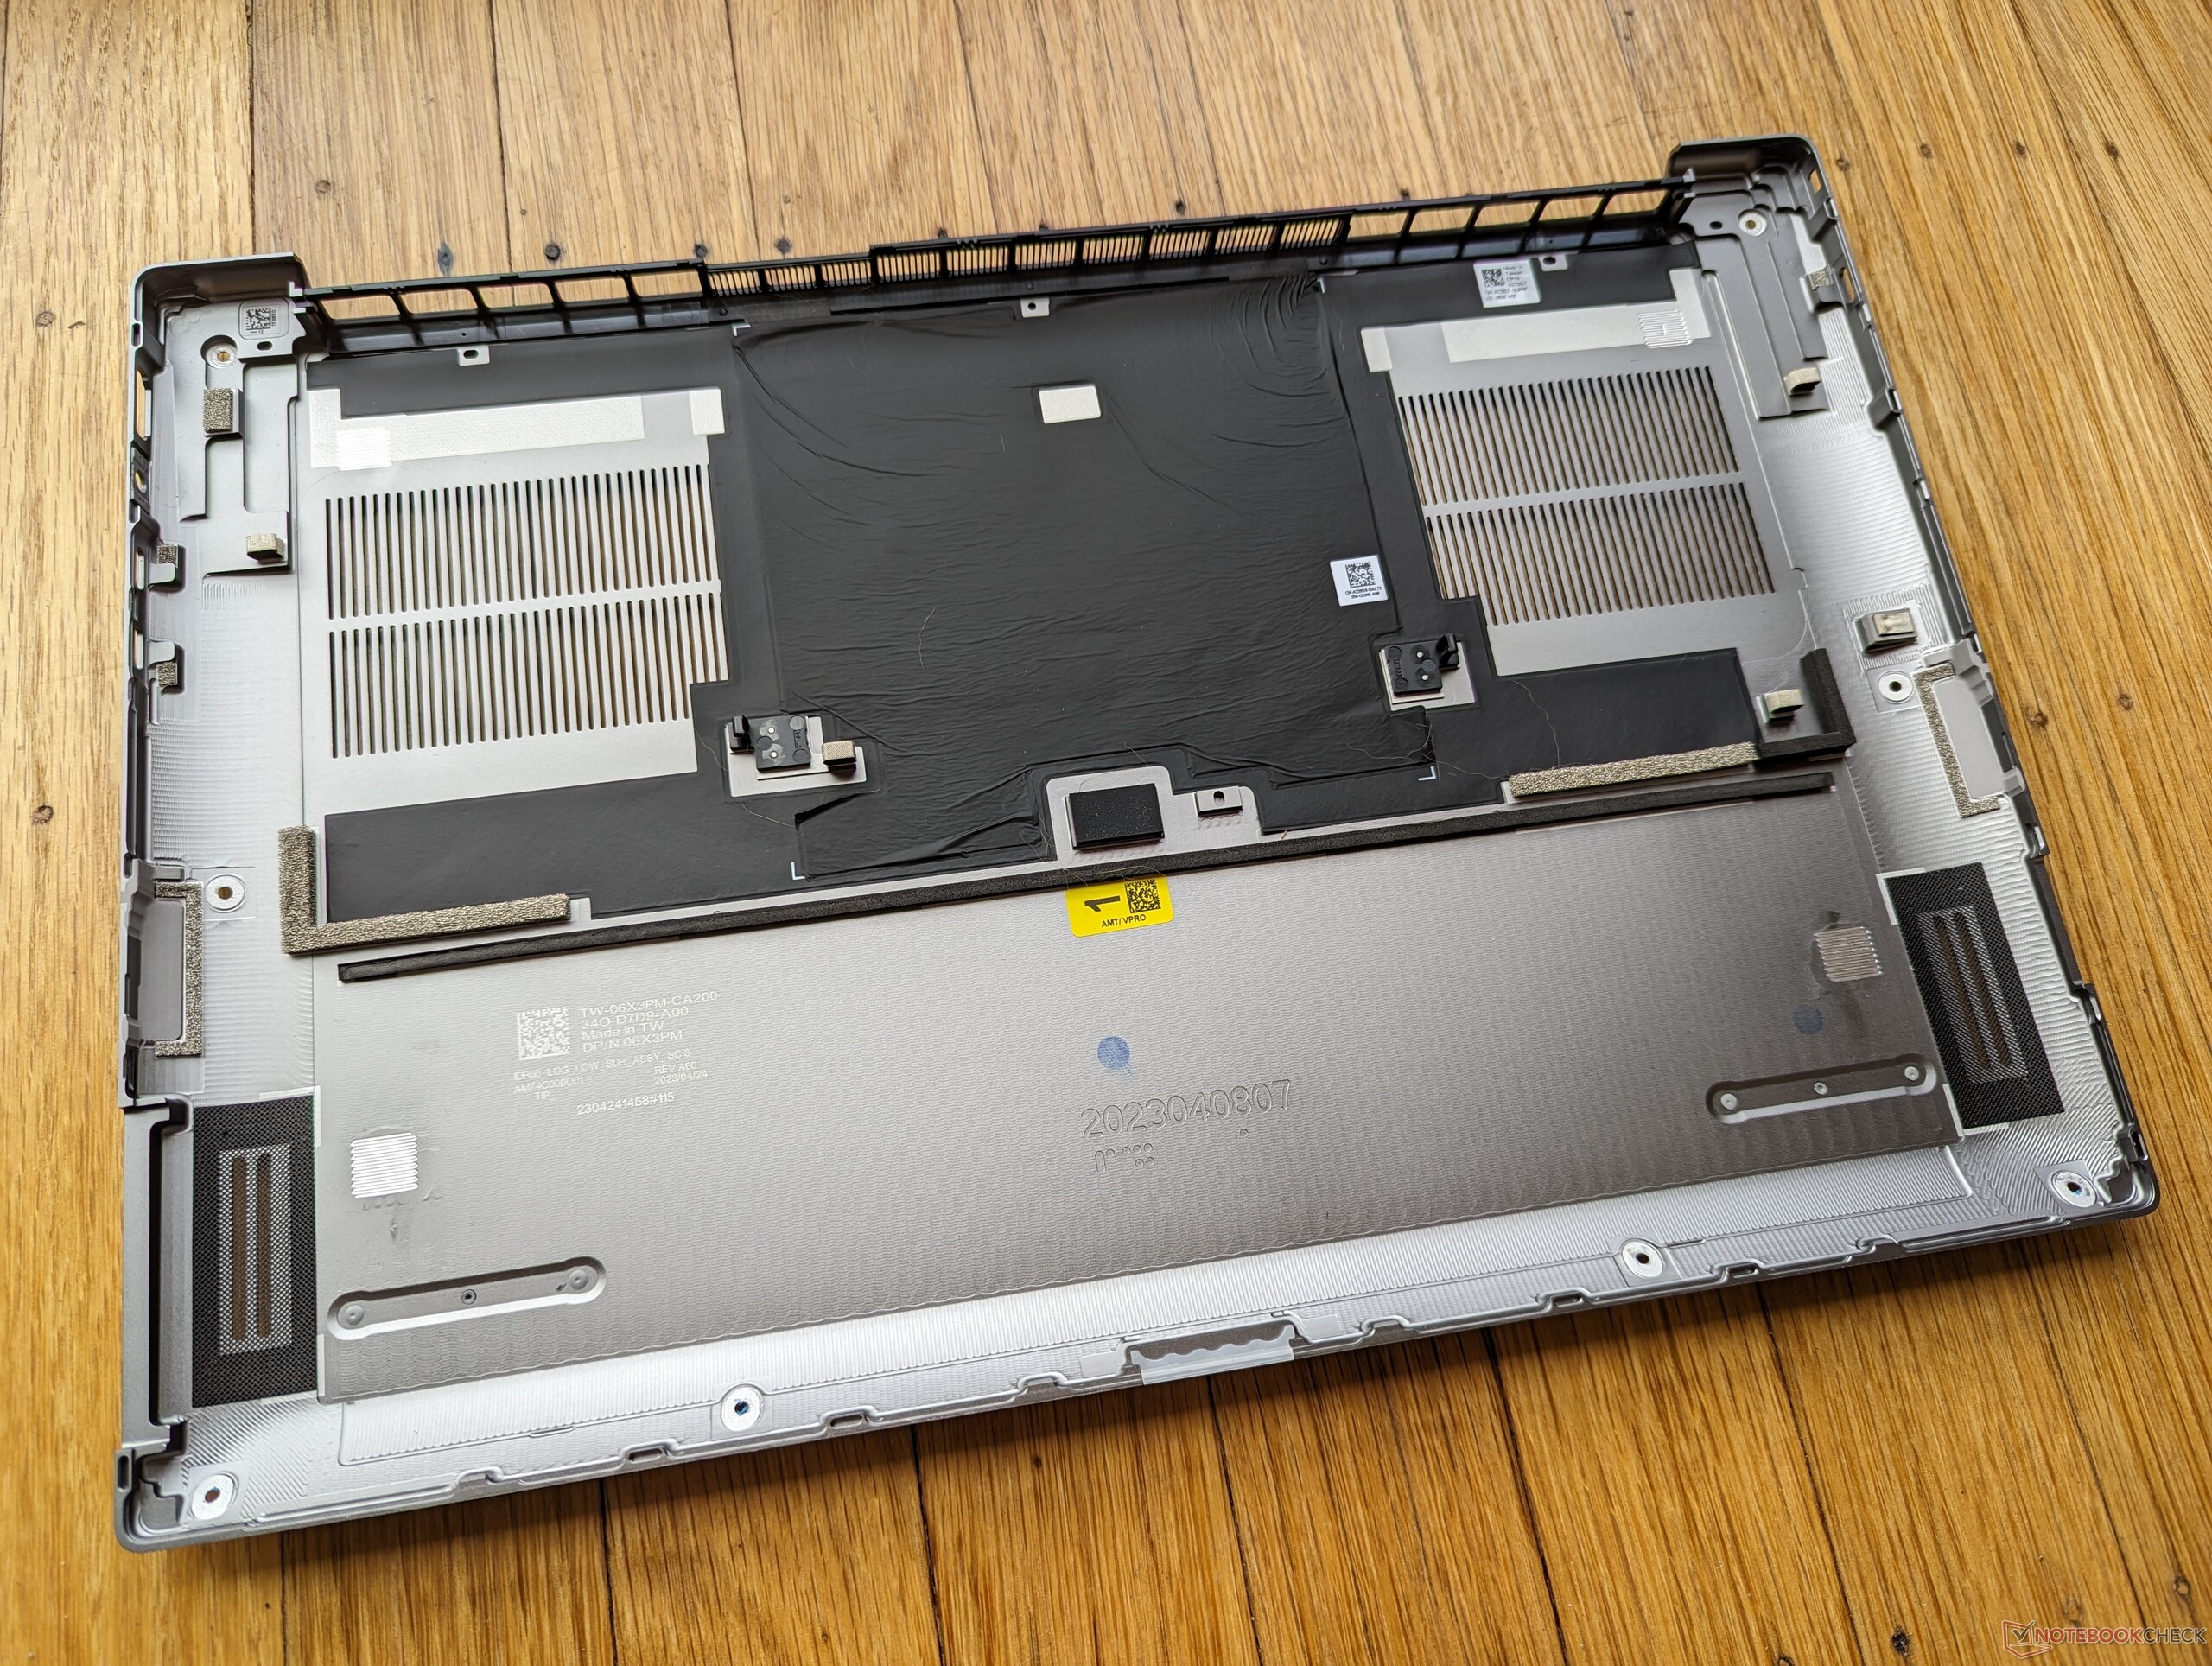
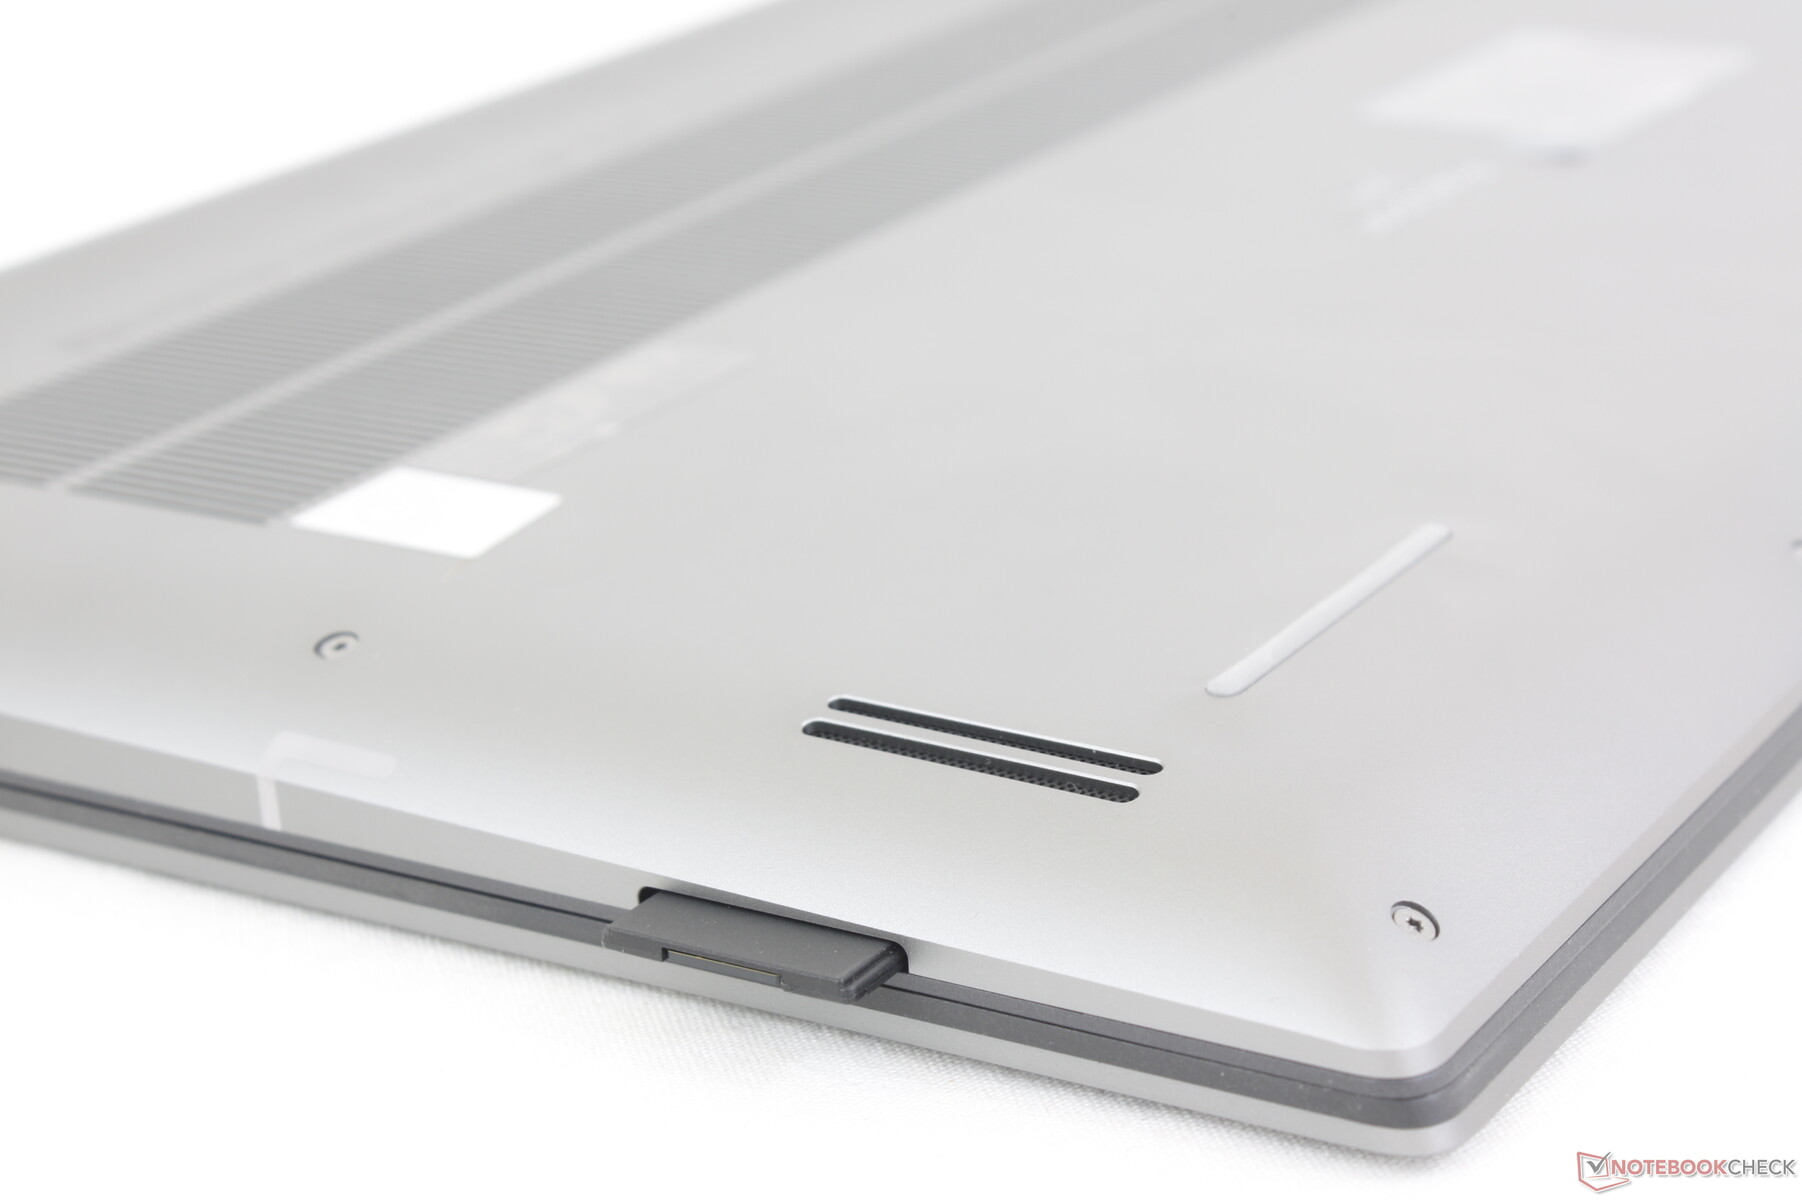
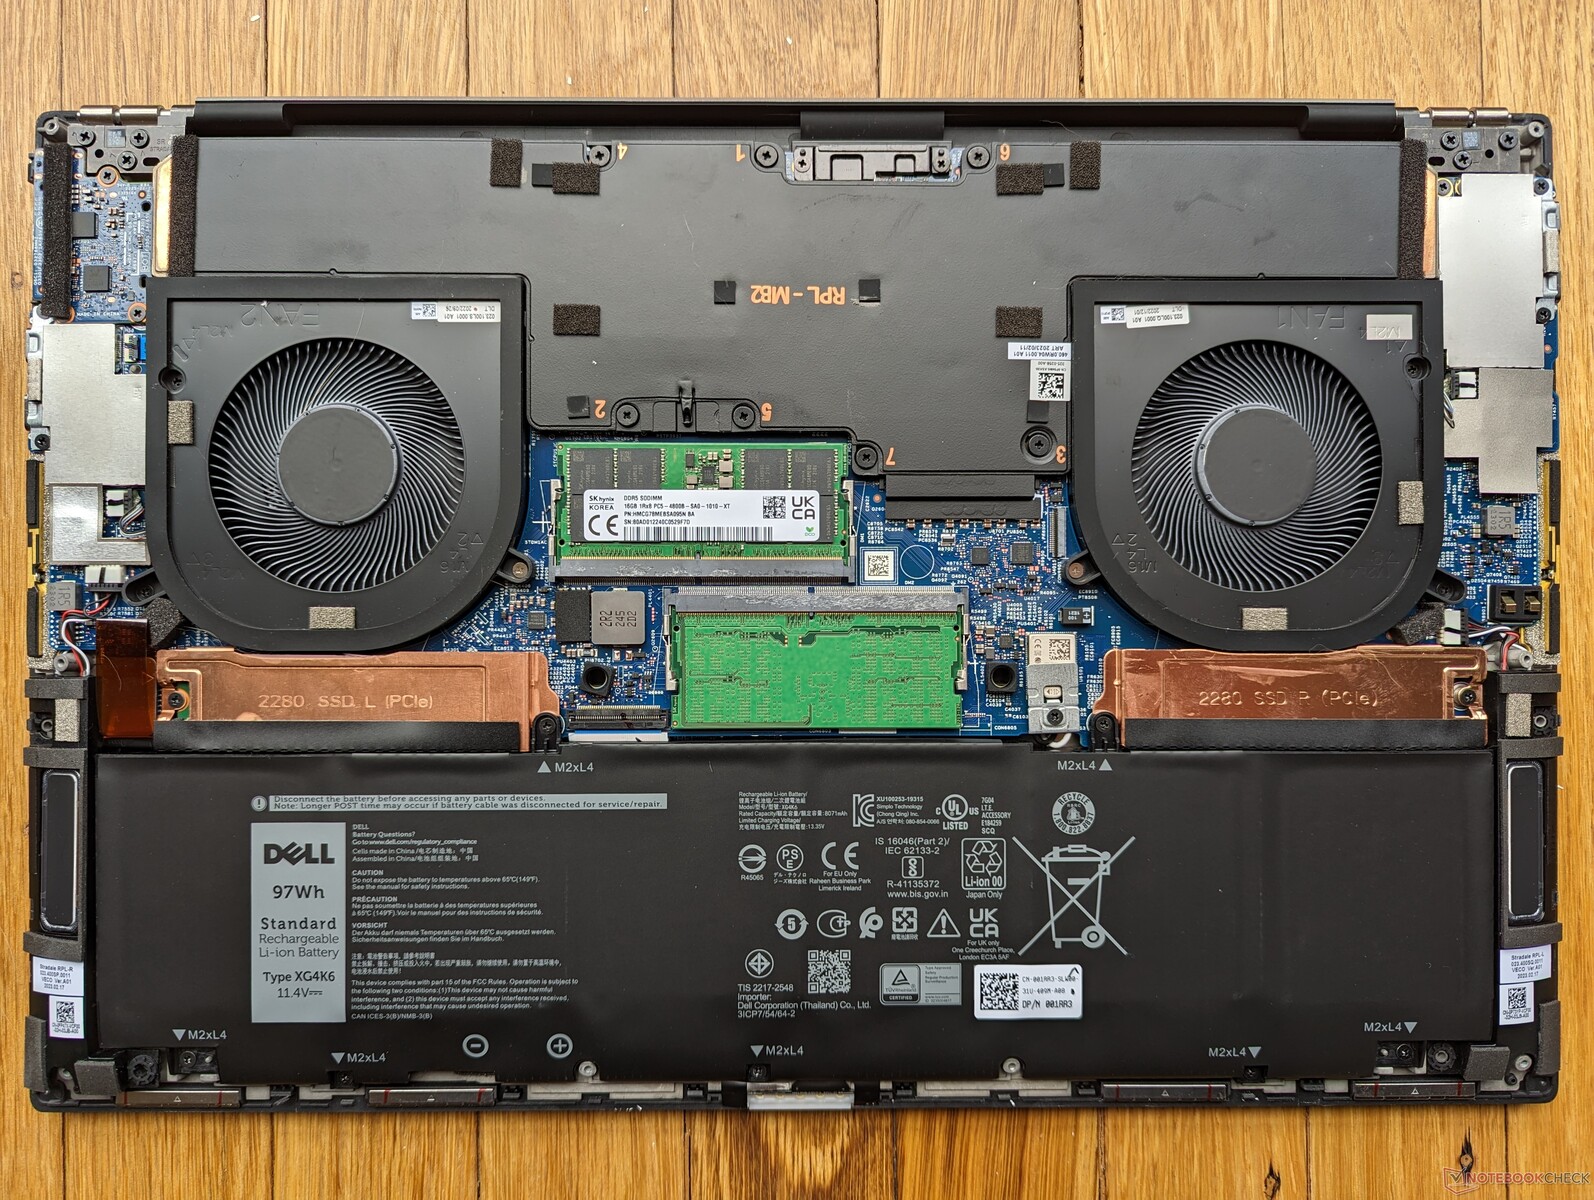
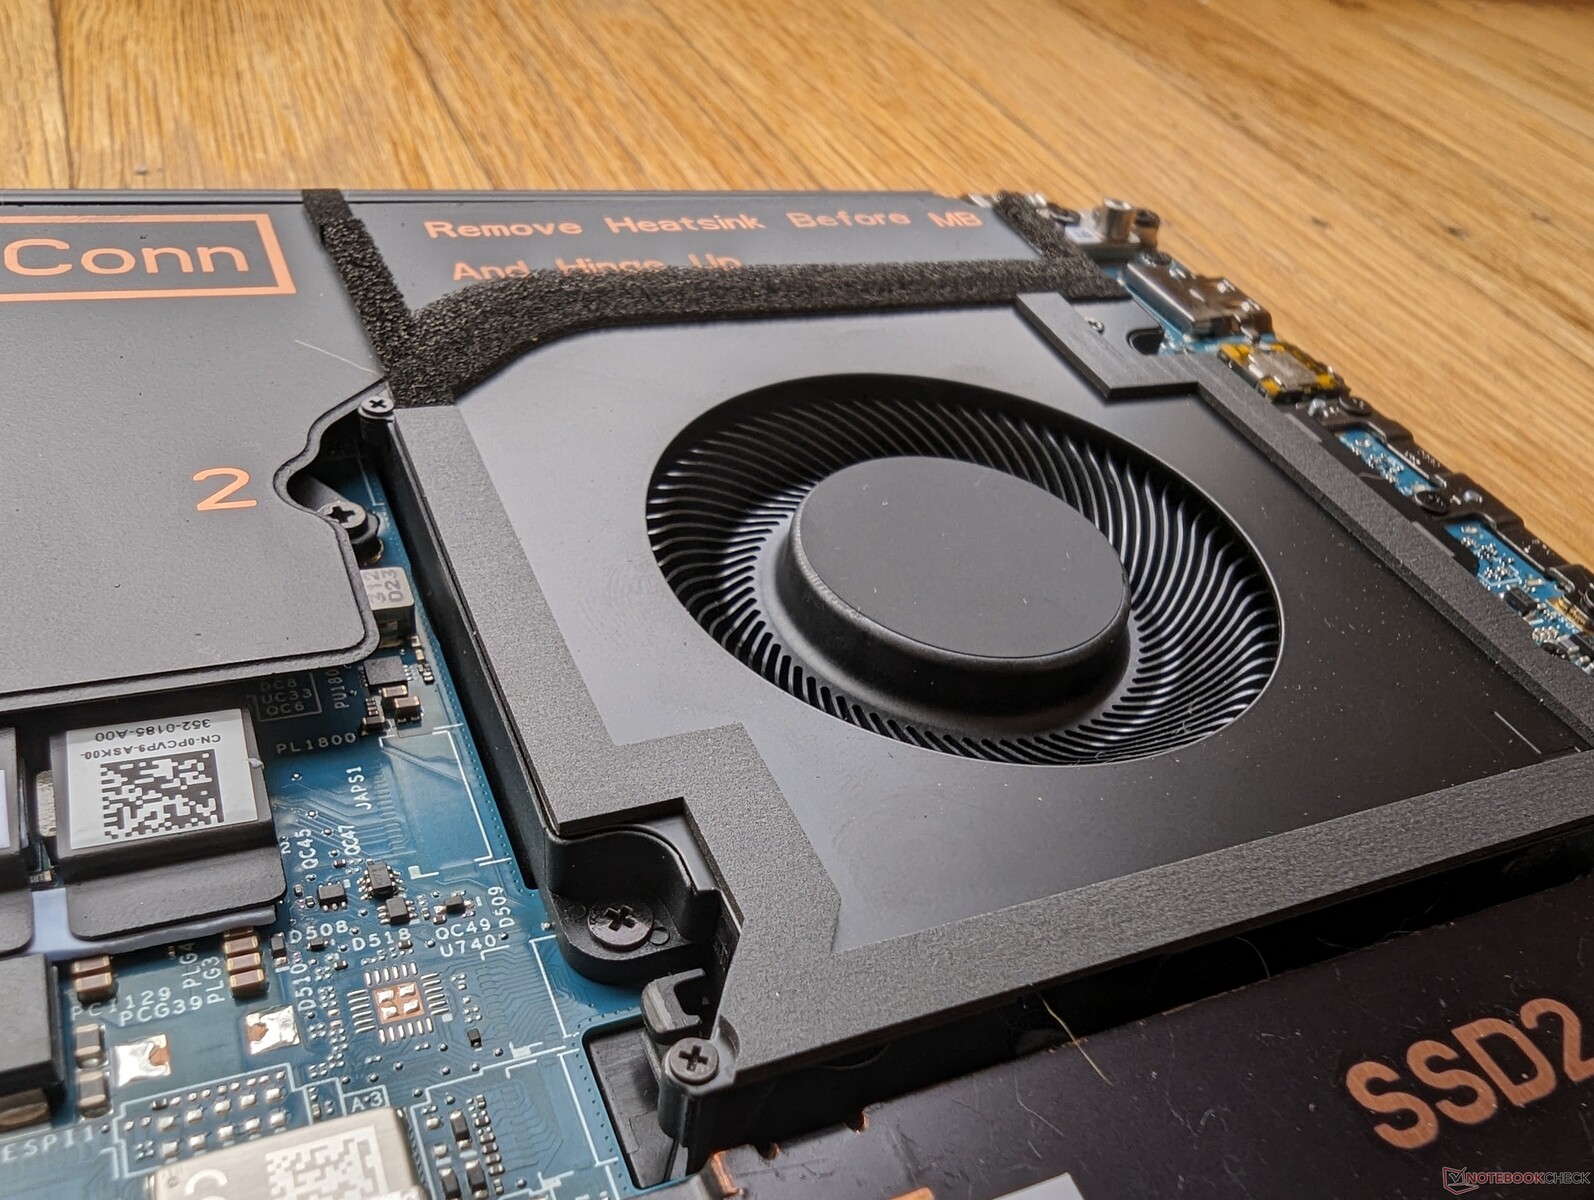
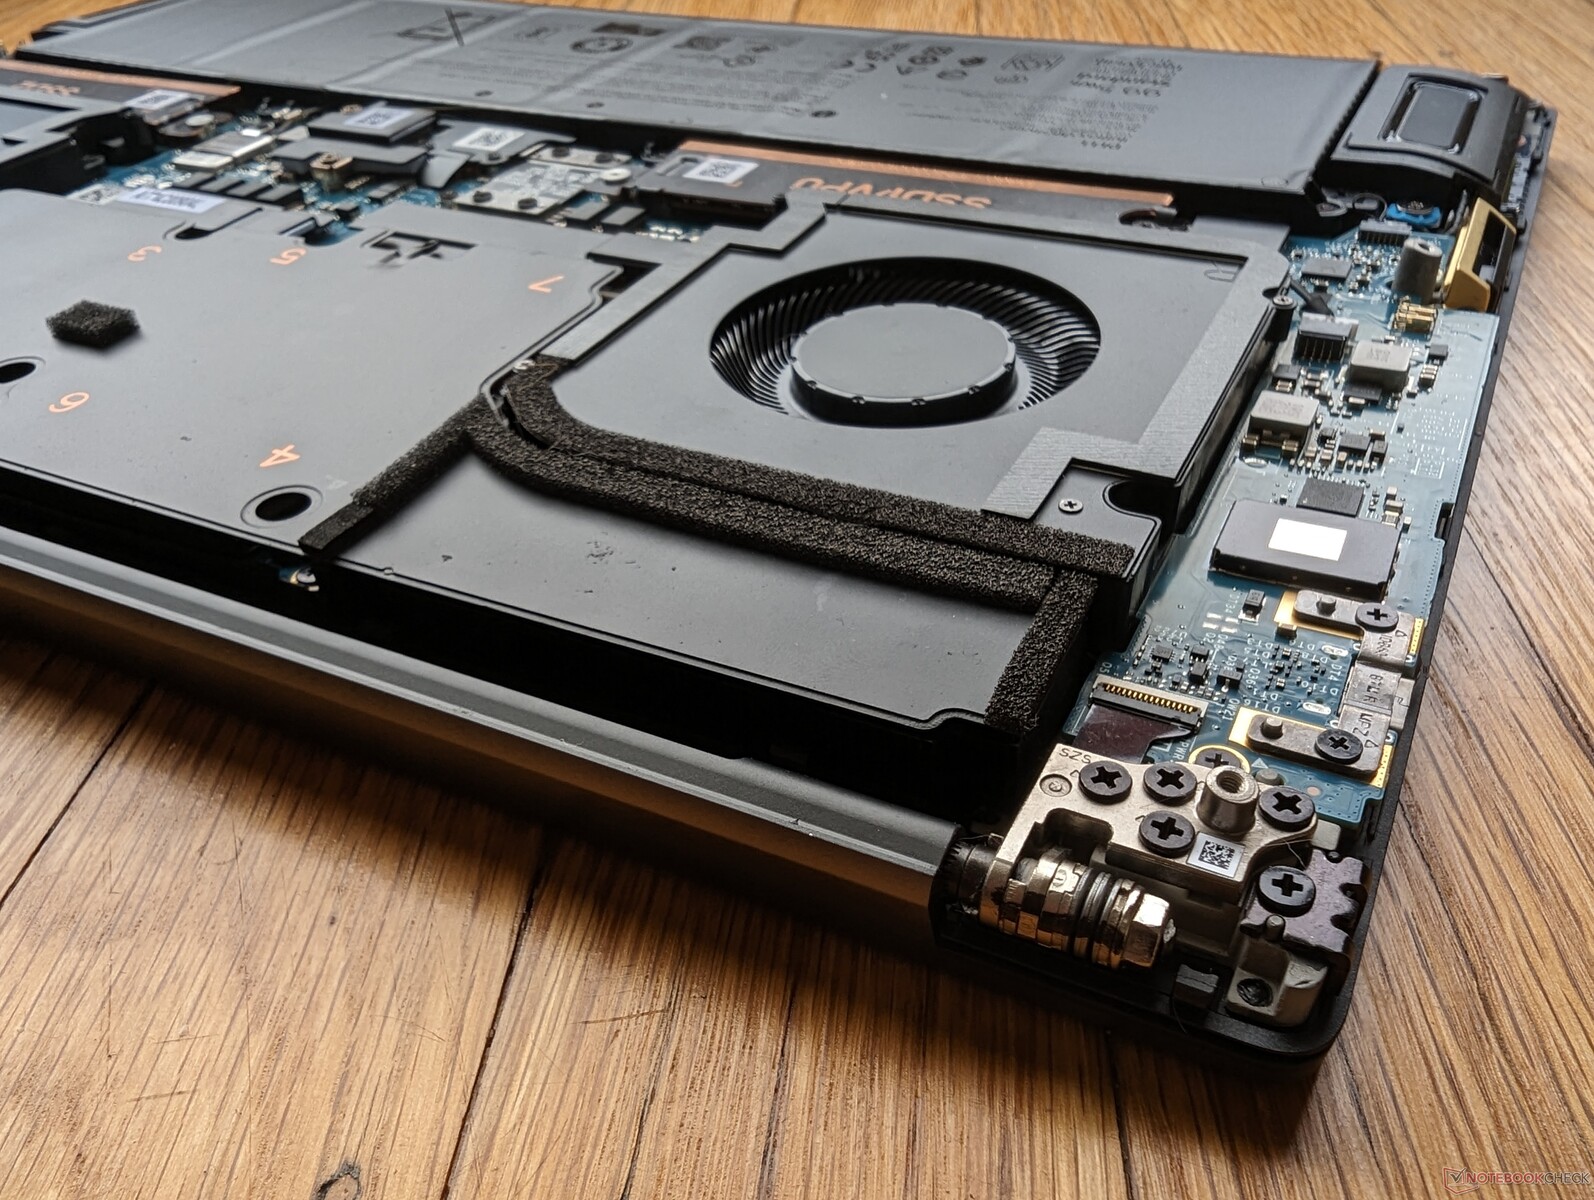
Bottenpanelen är något svårare att ta bort än väntat eftersom metallplattans kanter är både vassa och ordentligt låsta, ungefär som på XPS 15 eller XPS 17. En Torx-skruv och en platt kant rekommenderas vid service av systemet.
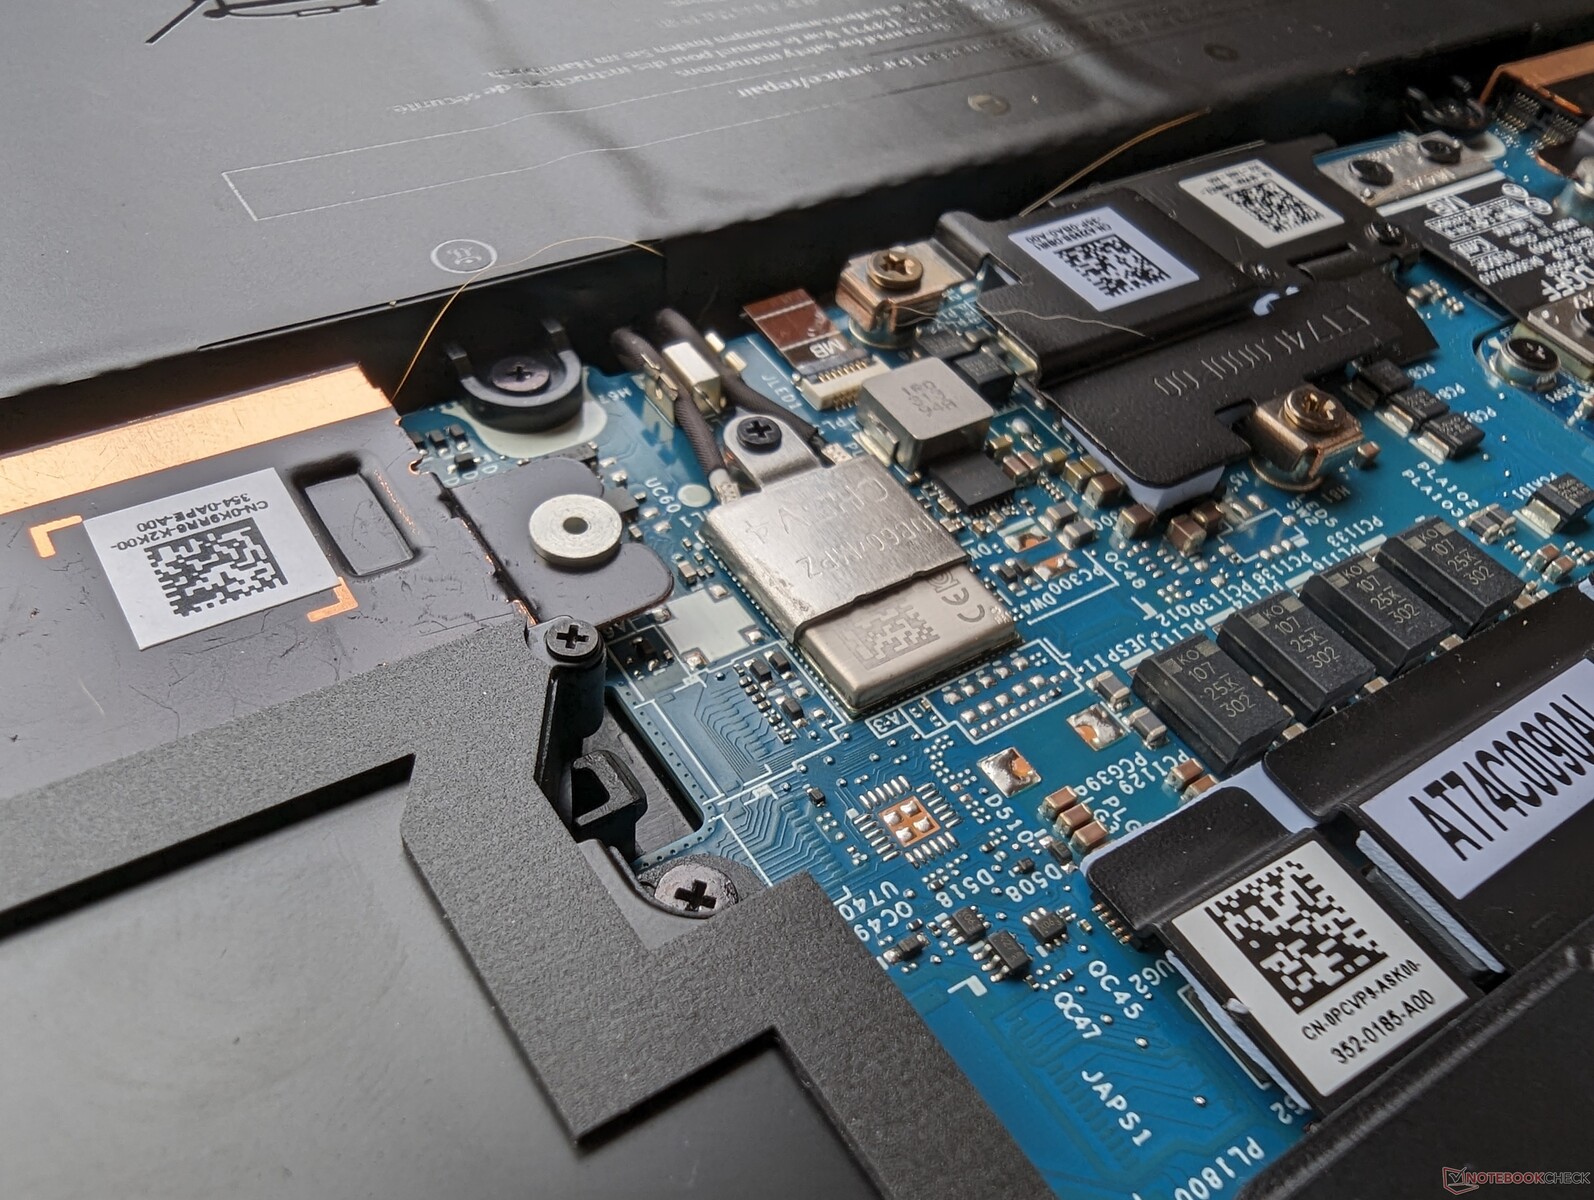
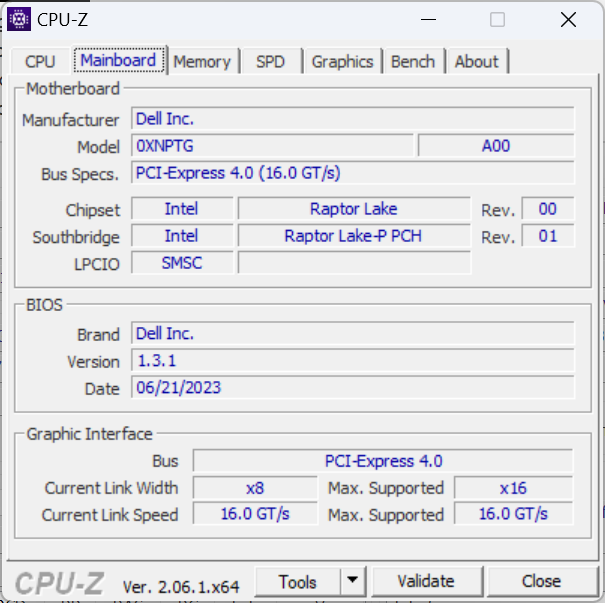
Både WLAN- och RAM-modulerna är lödda till skillnad från de flesta andra arbetsstationer i den här skärmstorleken. Både de högintegrerade modulerna och de begränsade portalternativen är troliga nackdelar med den annars eleganta designen och relativt låga vikten.
Tillbehör och garanti
I förpackningen ingår en liten USB-C till USB-A-adapter för att kompensera för det faktum att det inte finns några USB-portar i full storlek på systemet.
En treårig begränsad tillverkargaranti med reparation på plats gäller vid köp i USA.
Inmatningsenheter - något annorlunda än XPS
Tangentbord
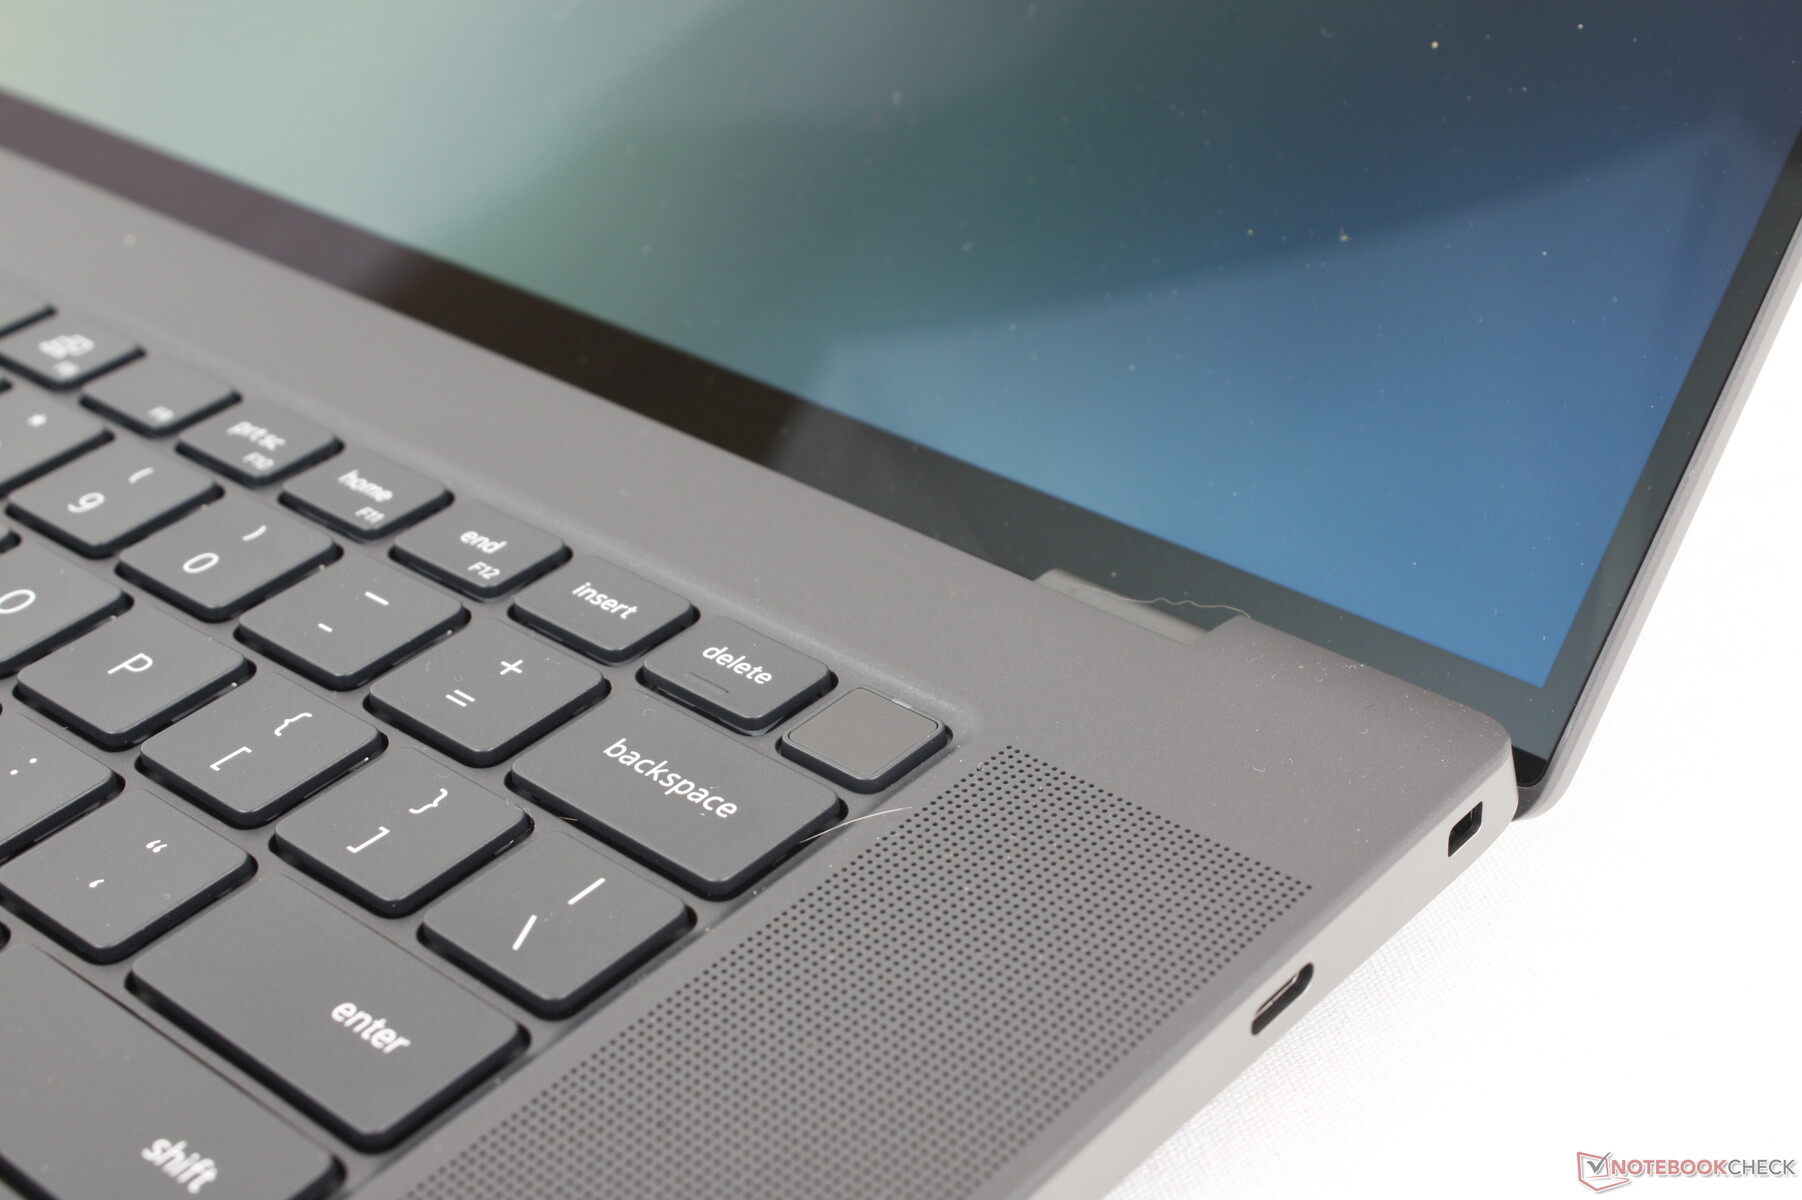
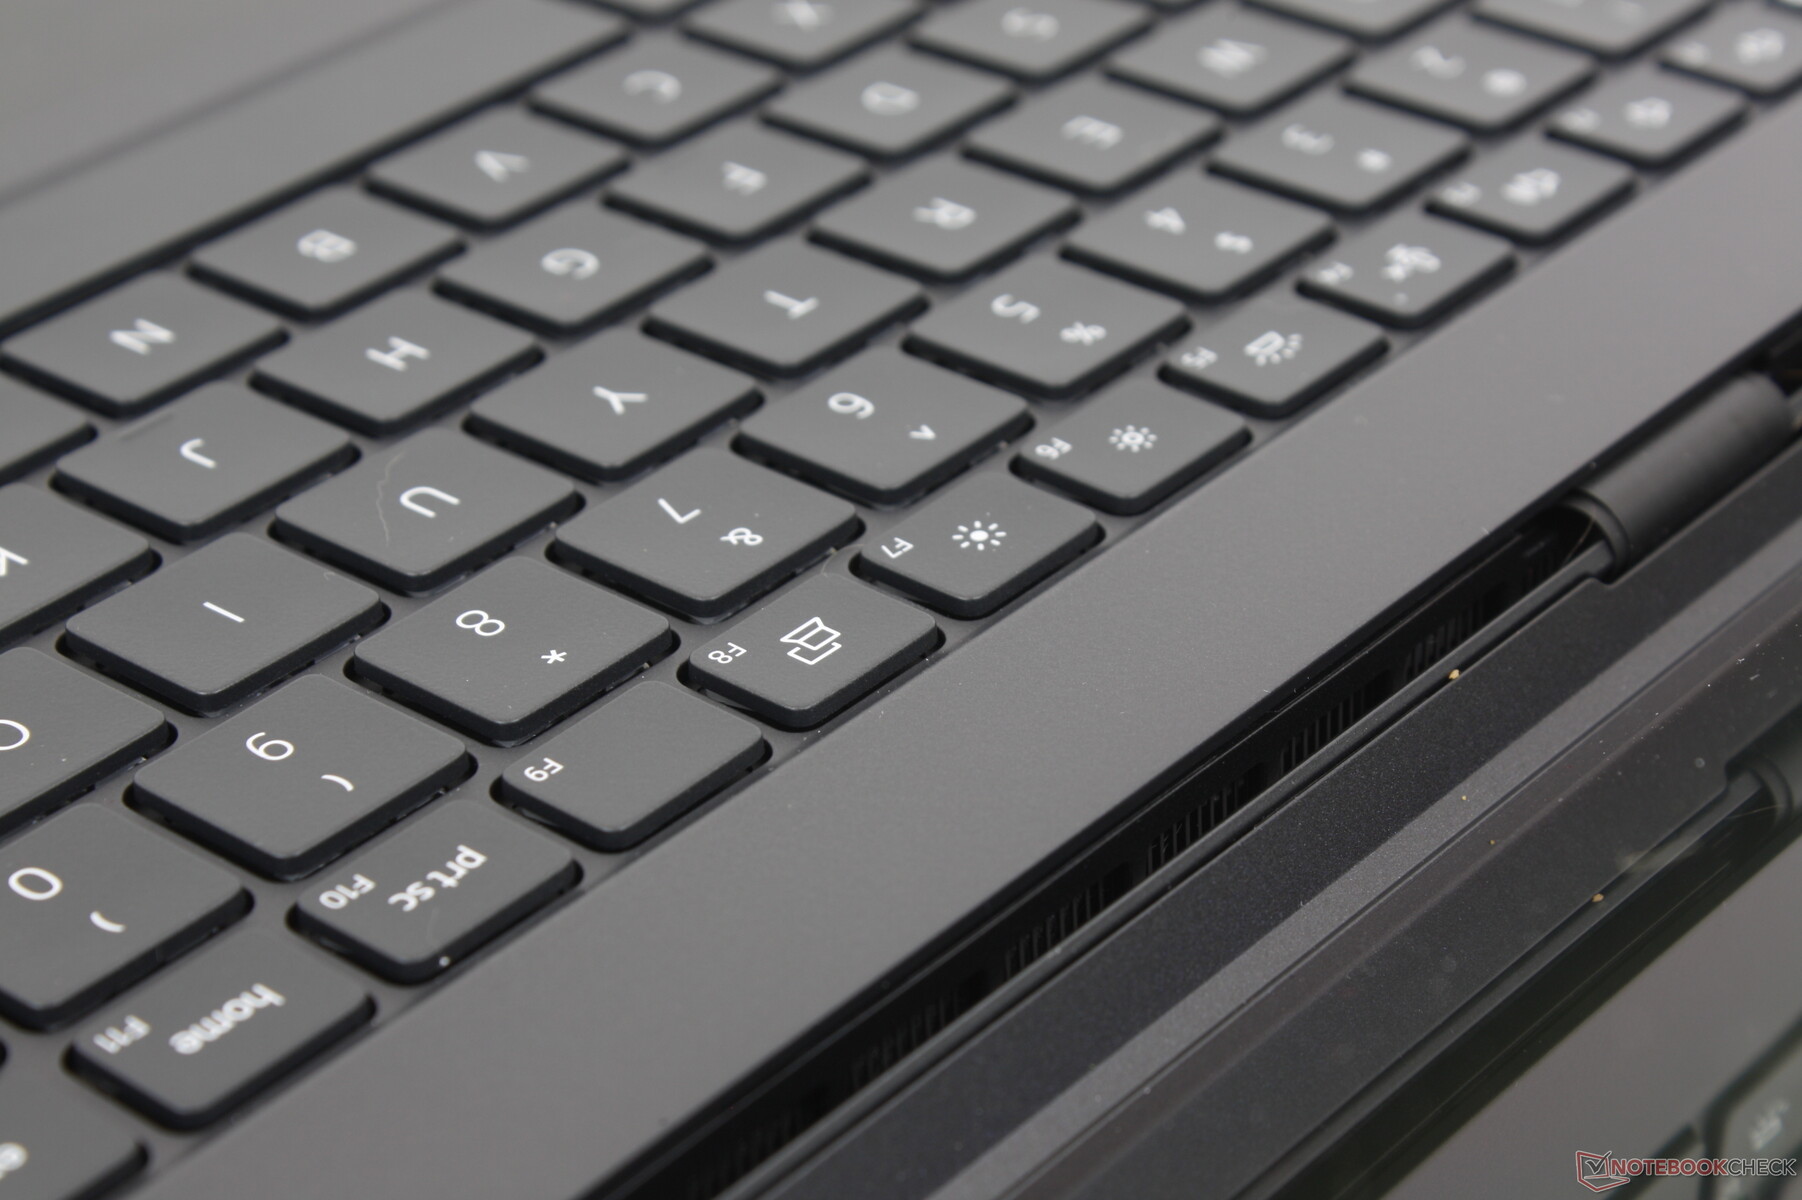
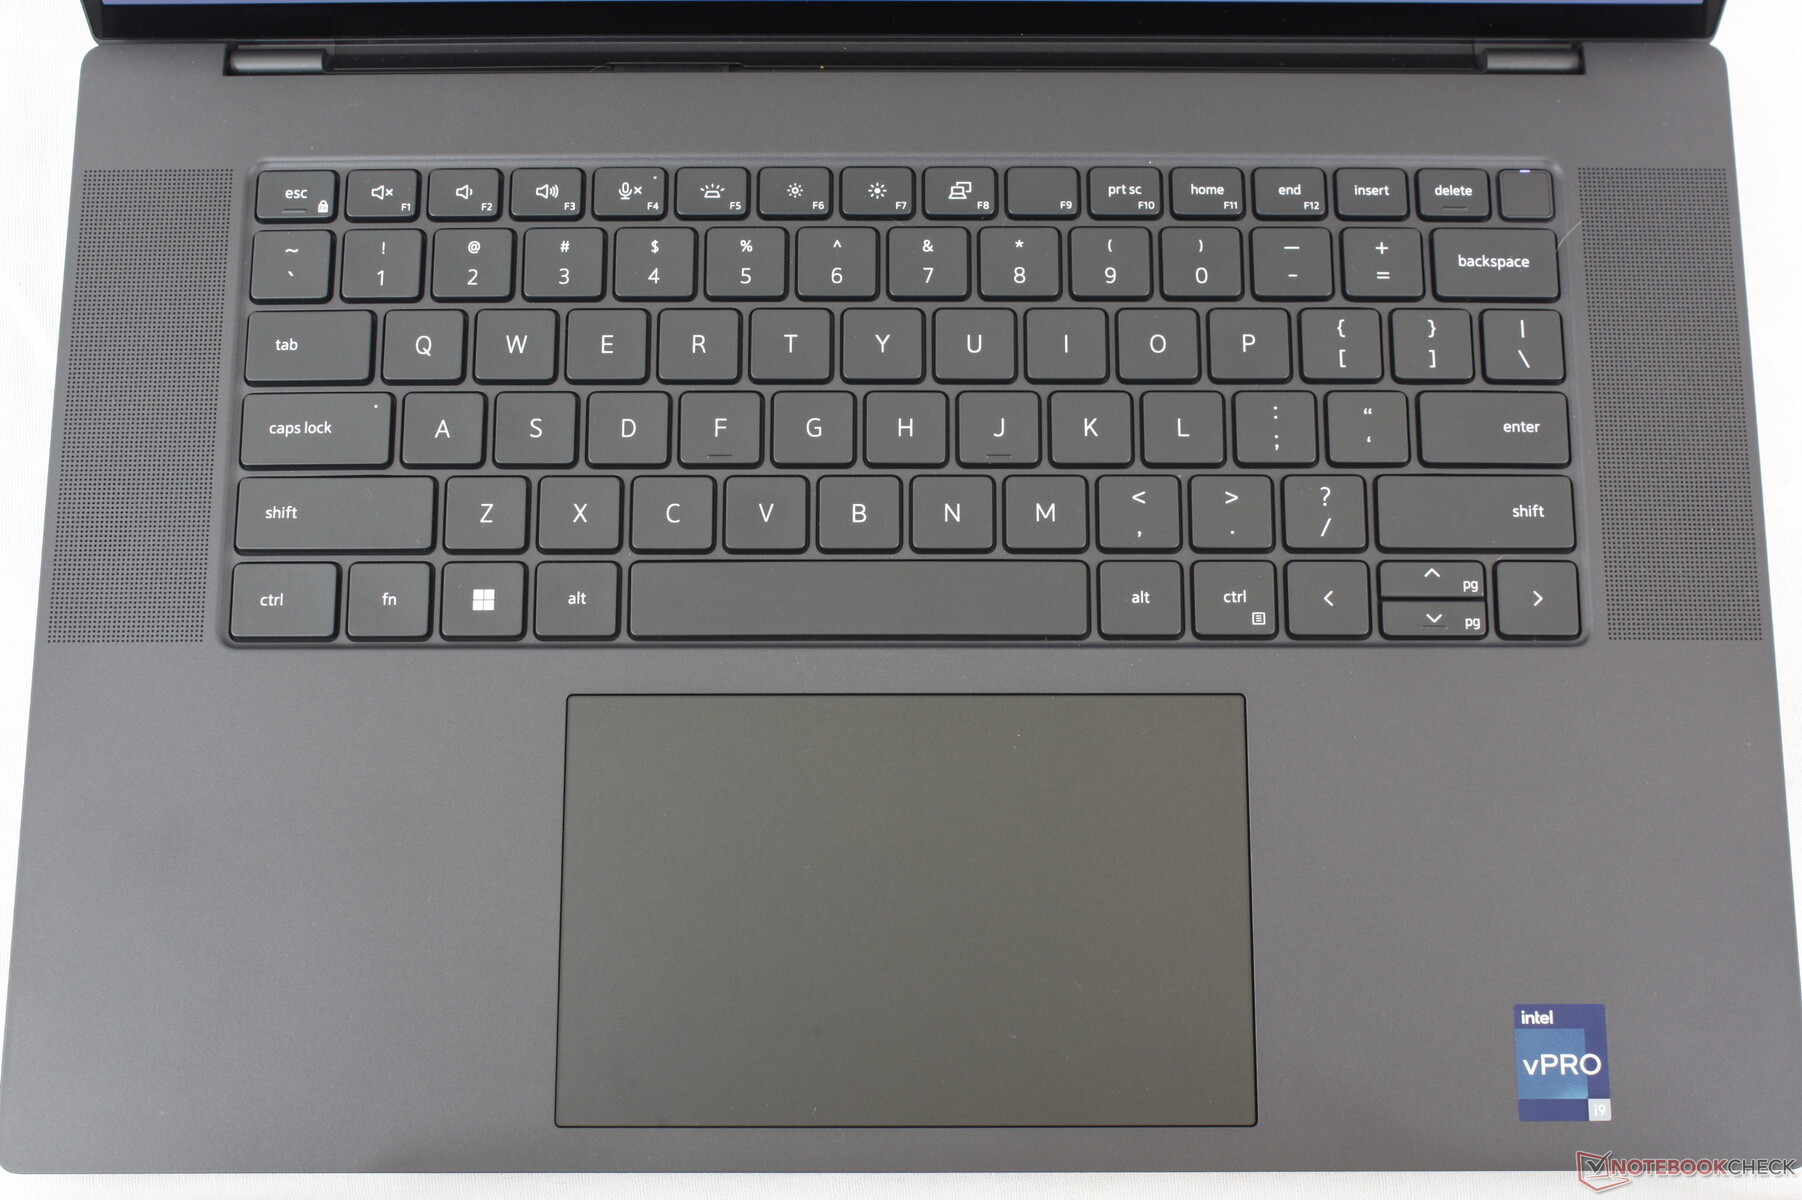
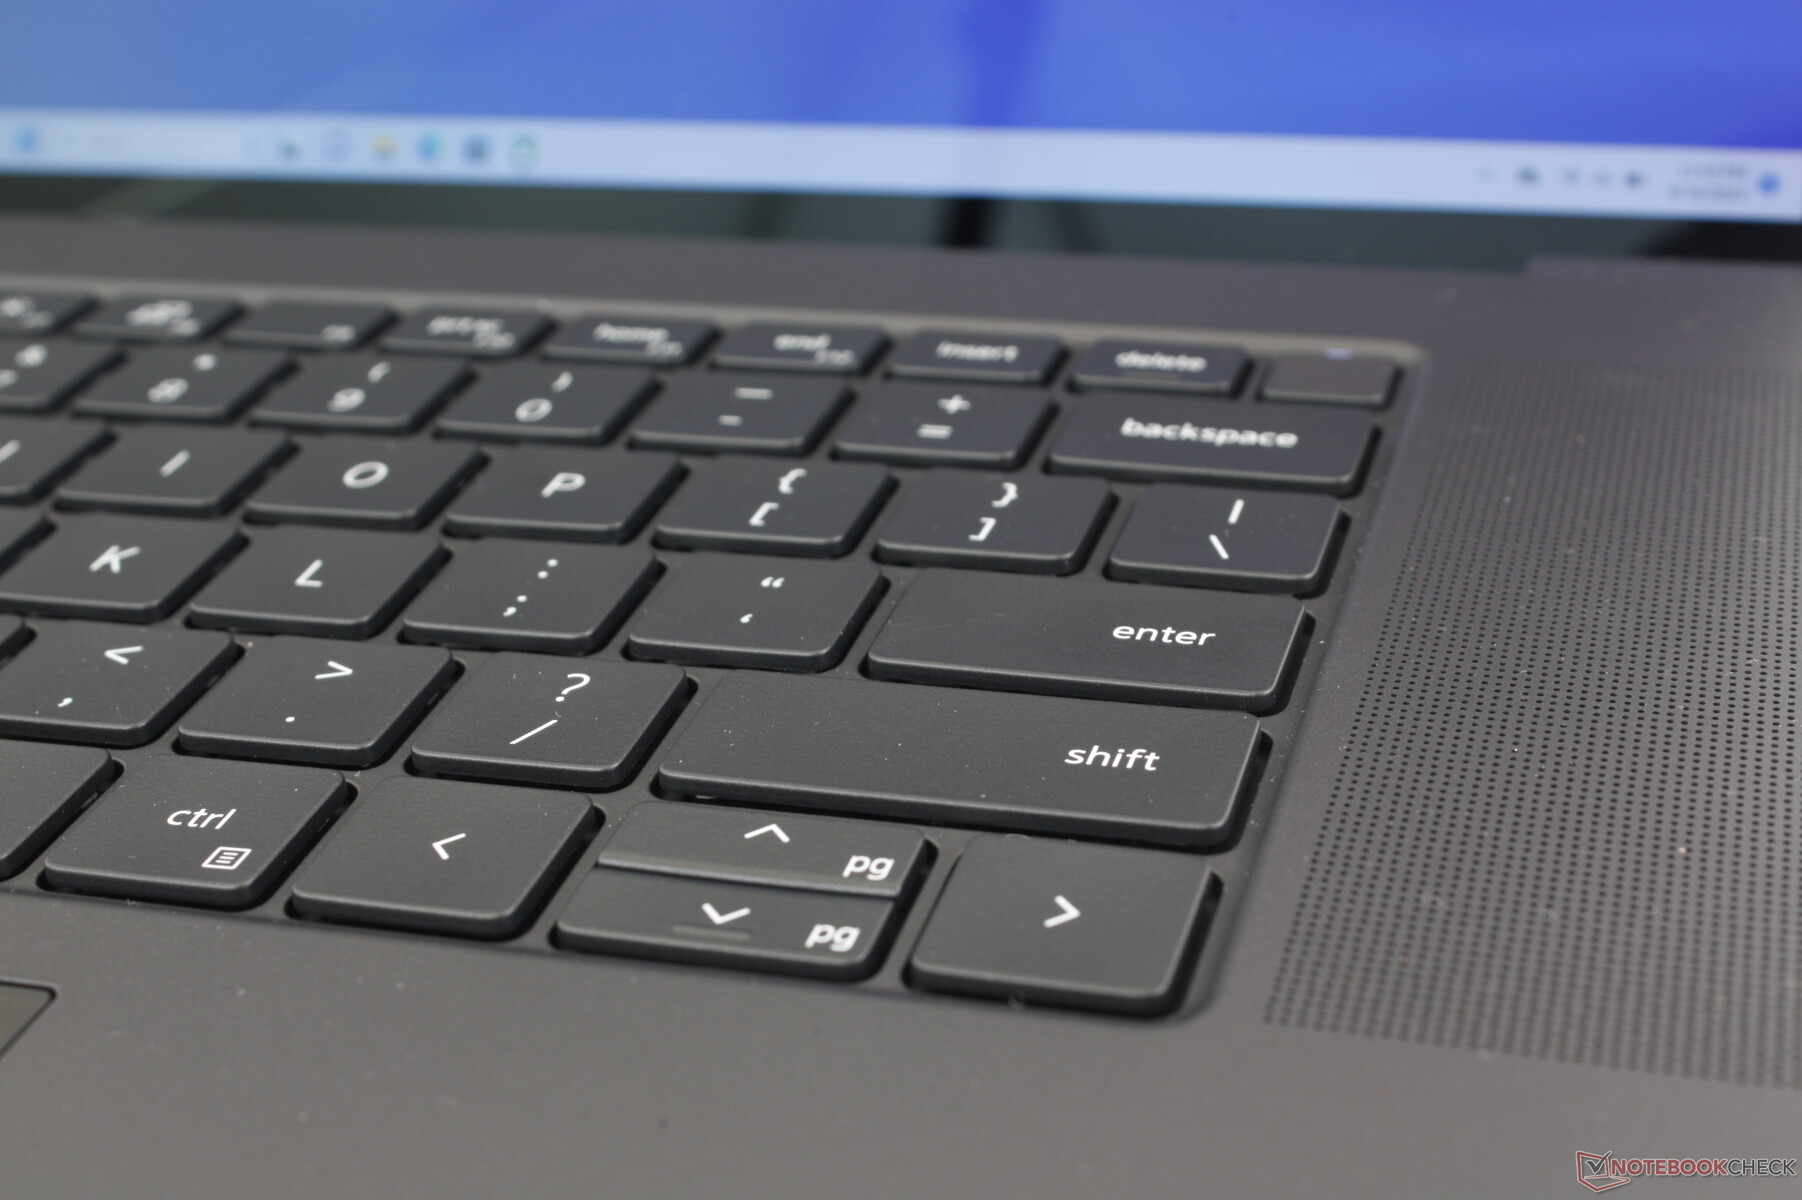
Tangentbordet kan vid första anblicken se identiskt ut med tangentbordet på XPS 15 eller Precision 5550, men det finns ett par viktiga förändringar. För det första är den översta raden av funktionstangenter nu större eftersom vissa XPS 15-ägare har klagat på att de är för smala. Och för det andra är några av tangenterna längs kanterna nu något kortare, inklusive Backspace, Enter, Shift, Tab, Ctrl och Shift-tangenterna. I övrigt är skrivupplevelsen densamma och ger en välbekant XPS-känsla.
Pekplatta
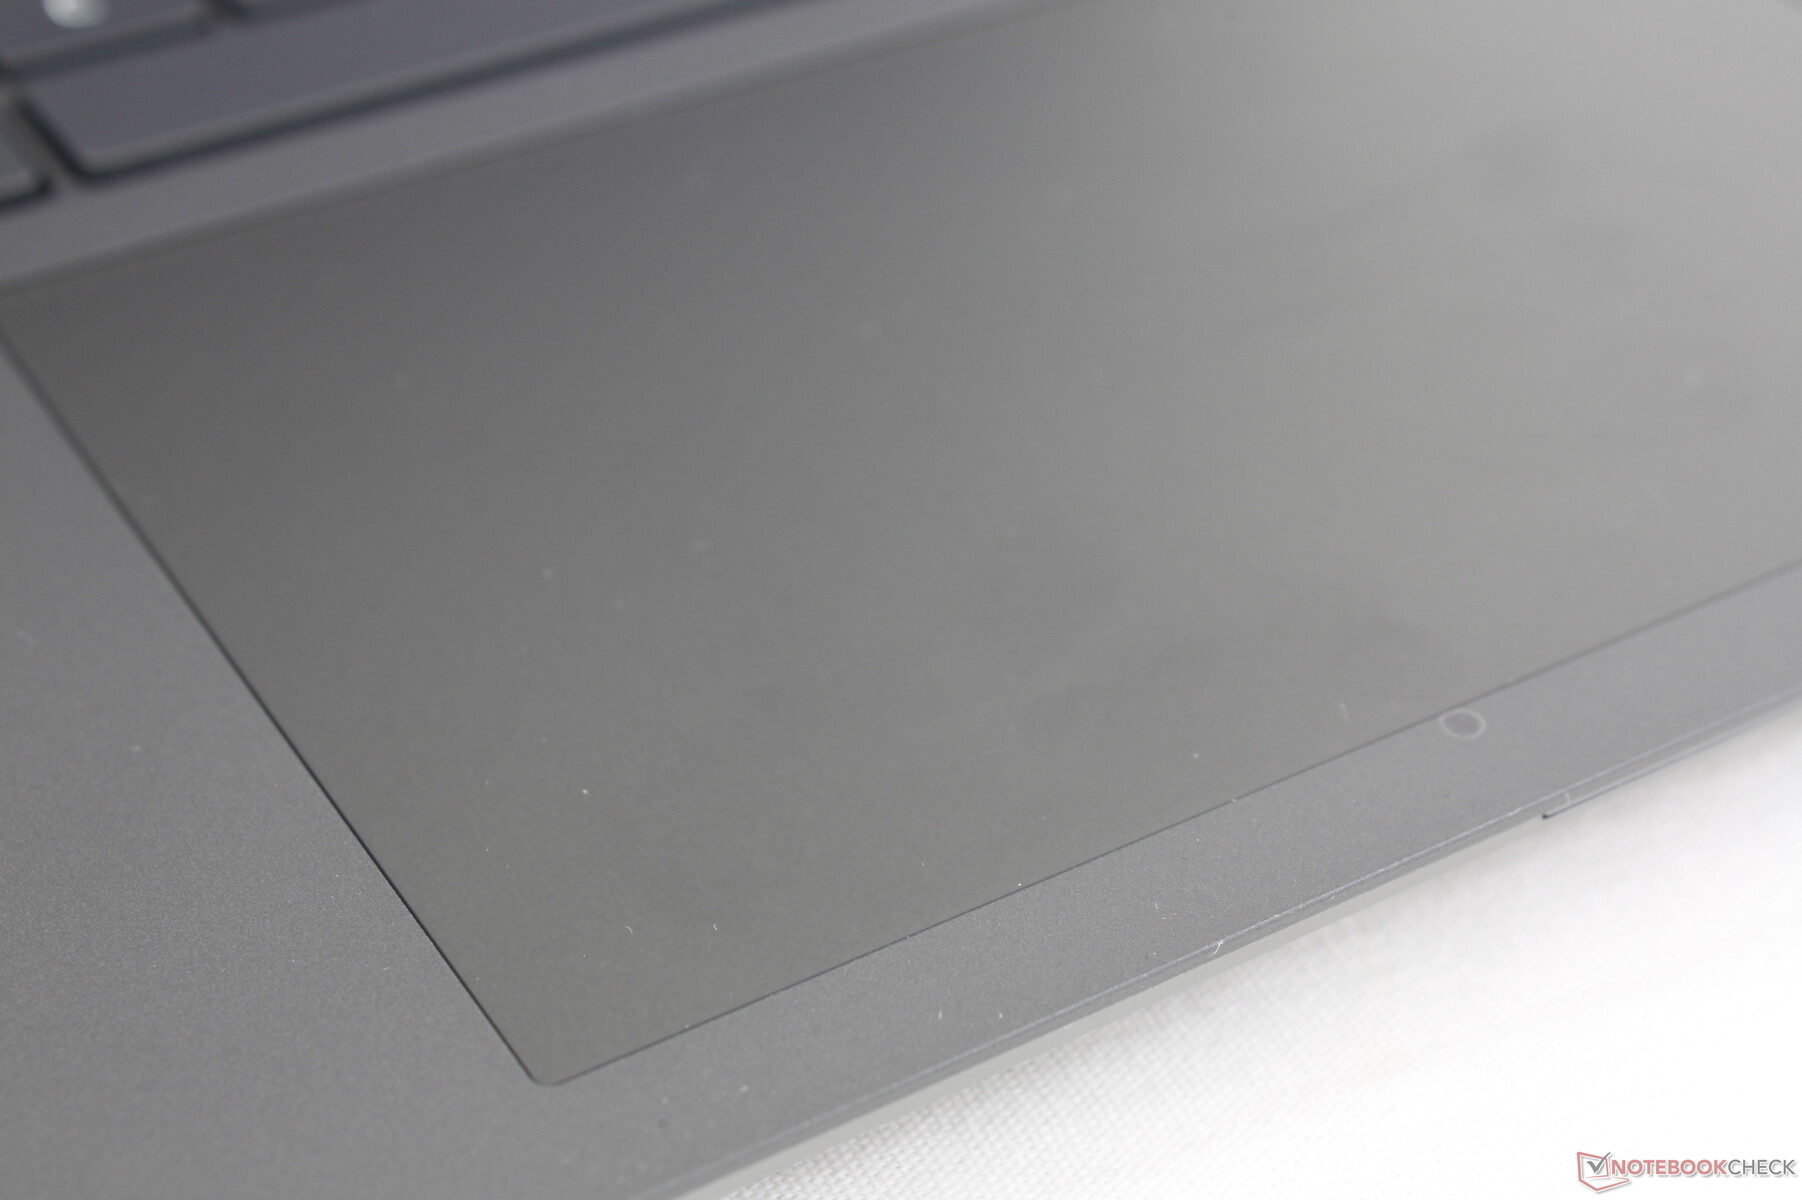
Klickplattan är faktiskt mindre än klickplattan på 15-tums Precision 5550 (13,7 x 8,5 cm vs. 15,1 x 9 cm) trots vår större skärmstorlek. Trots detta känns den fortfarande rymlig med mjuka och pålitliga glidegenskaper, ungefär som på en XPS 15.
Tyvärr är återkopplingen när du klickar på den haptiska klickplattan nästan obefintlig. Faktum är att det nästan inte finns någon rörelse eller hörbar feedback alls. En mus rekommenderas starkt för mer exakta drag-och-släpp-åtgärder.

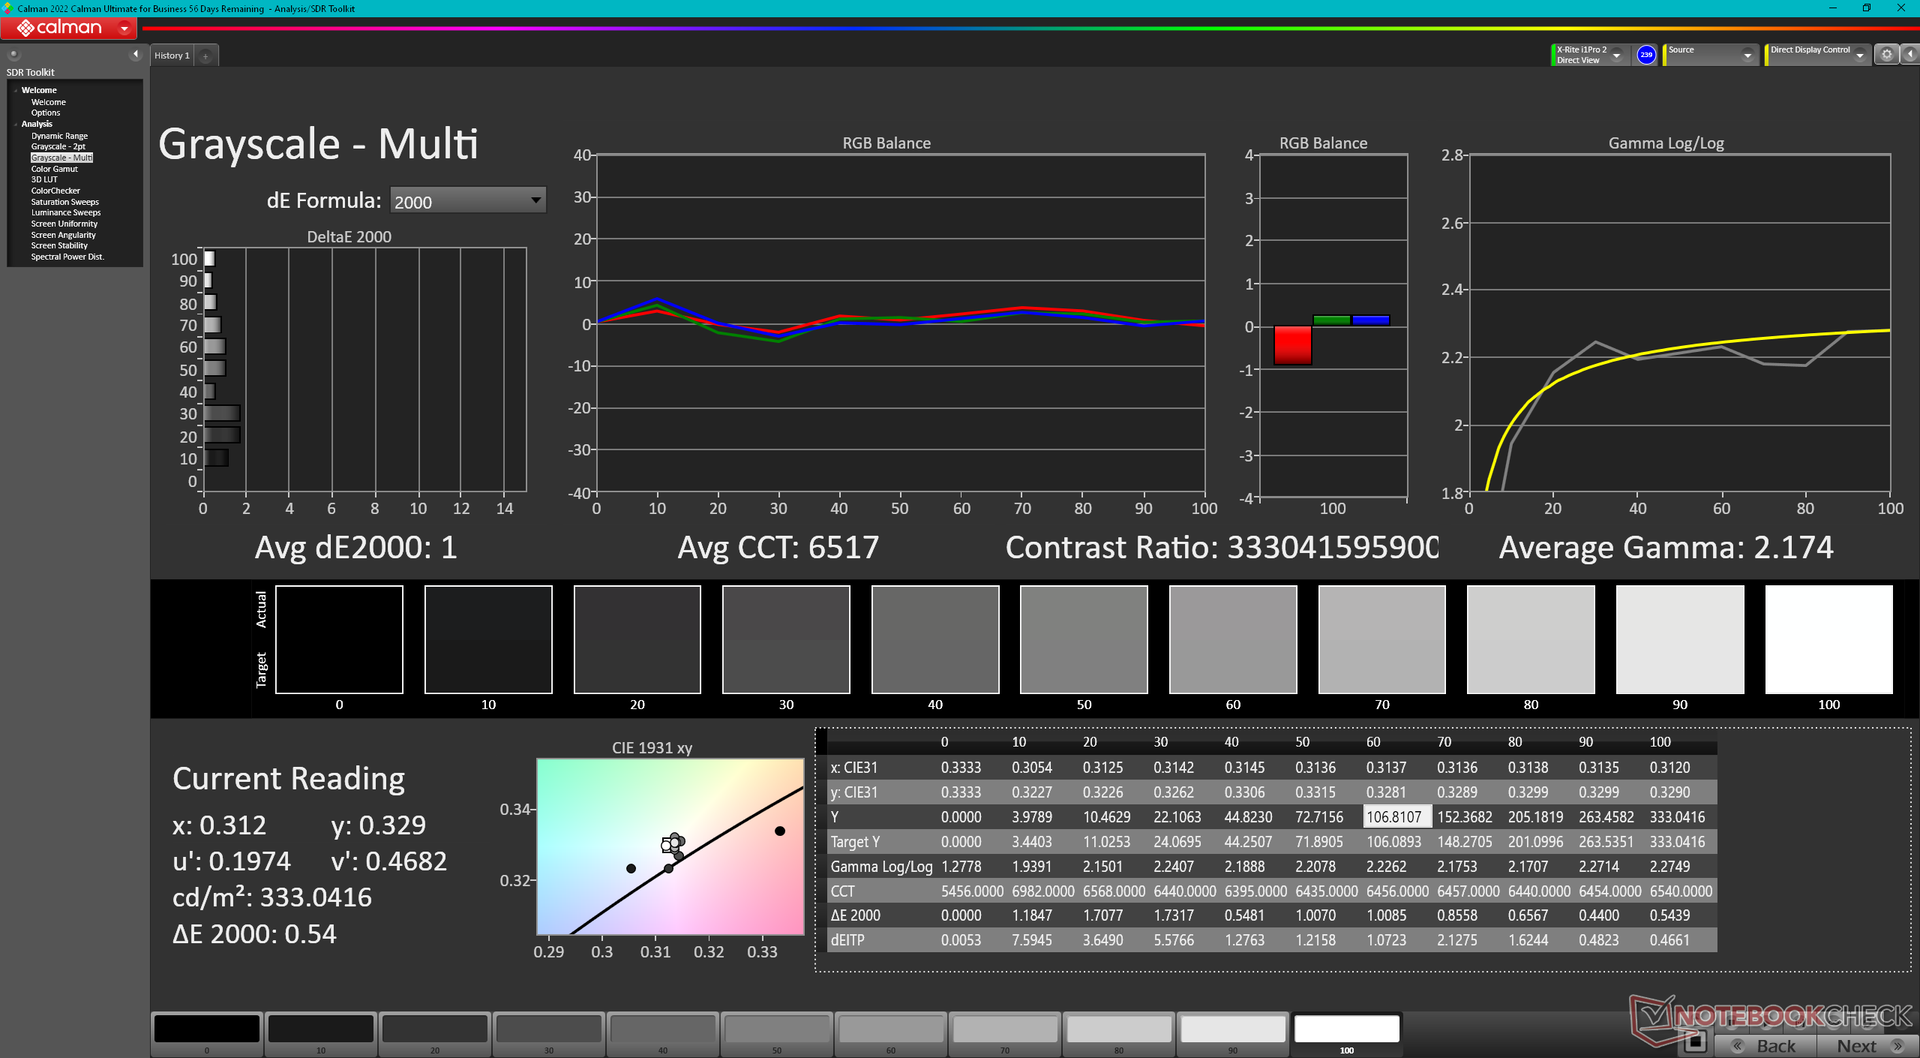
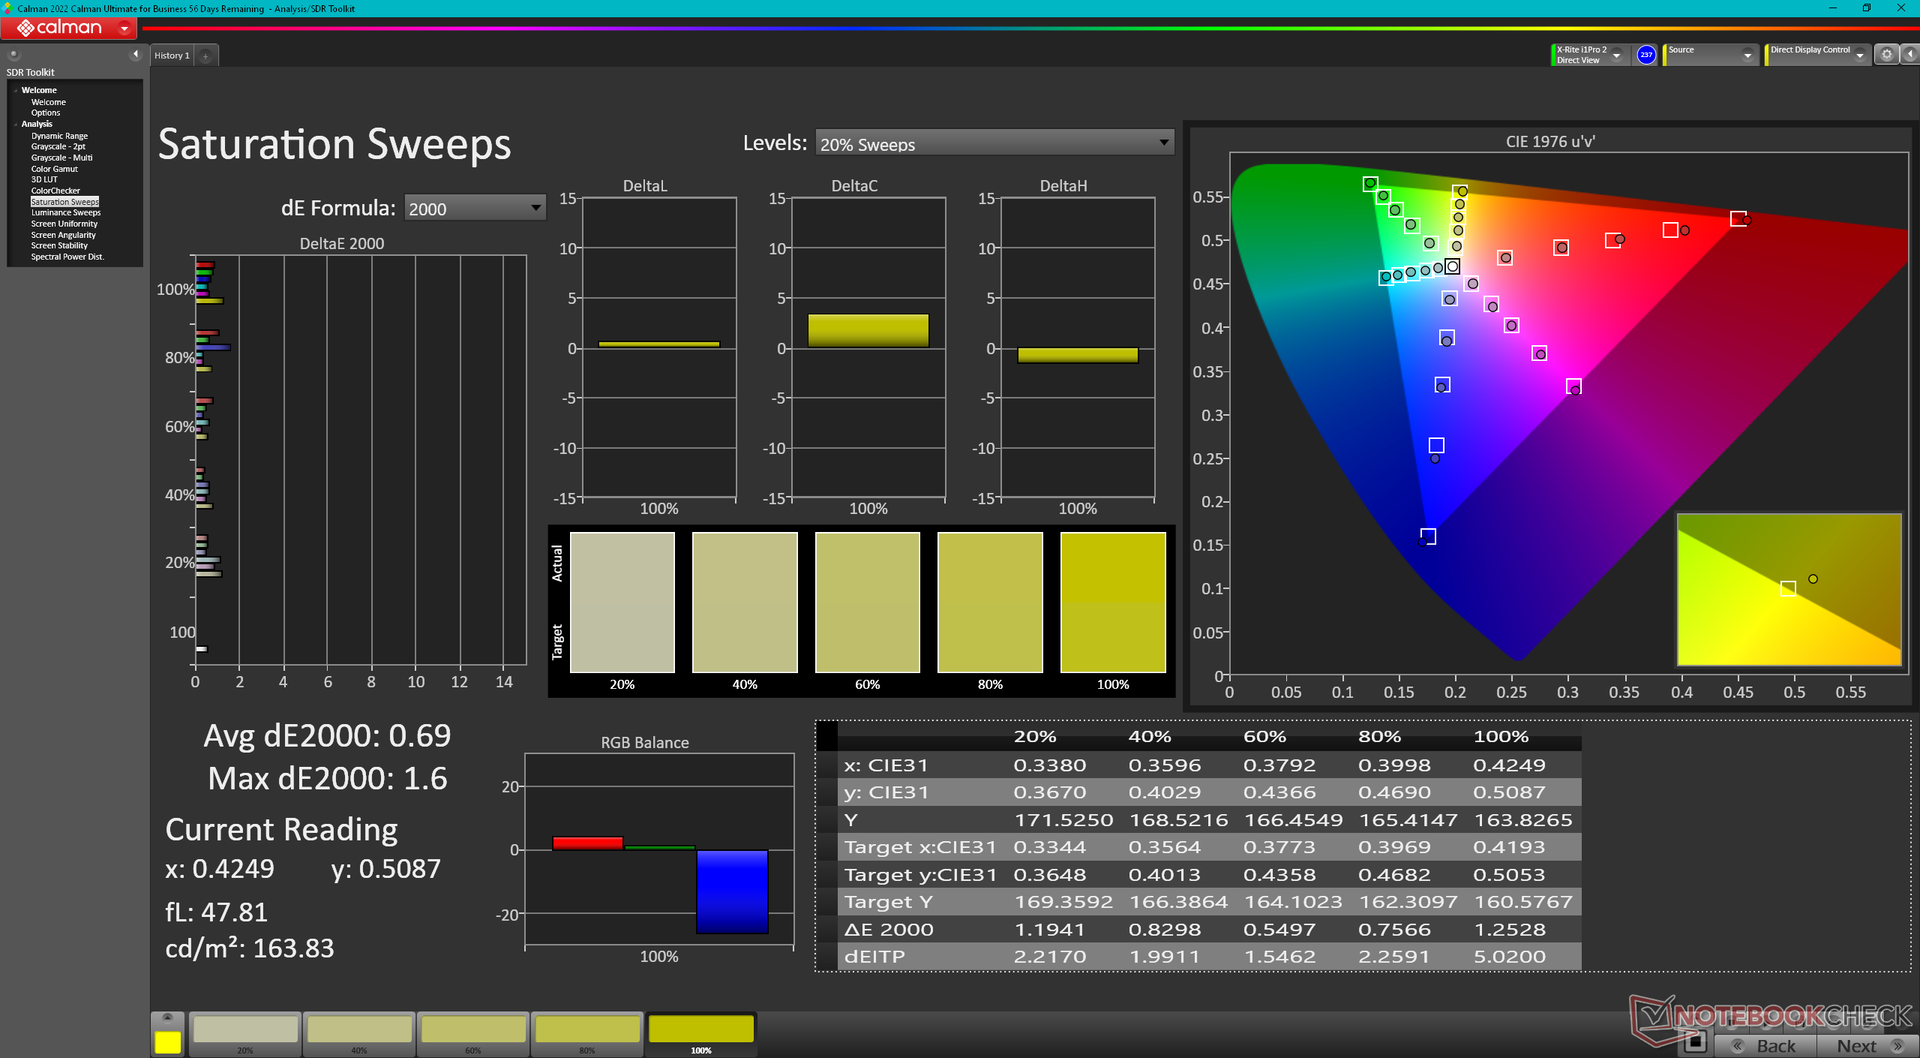
Display
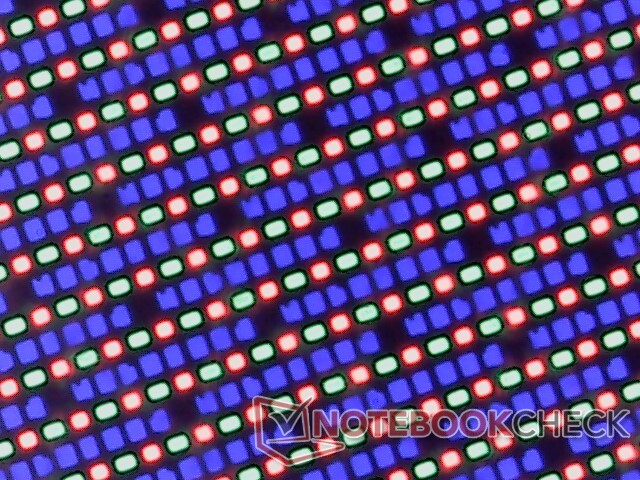
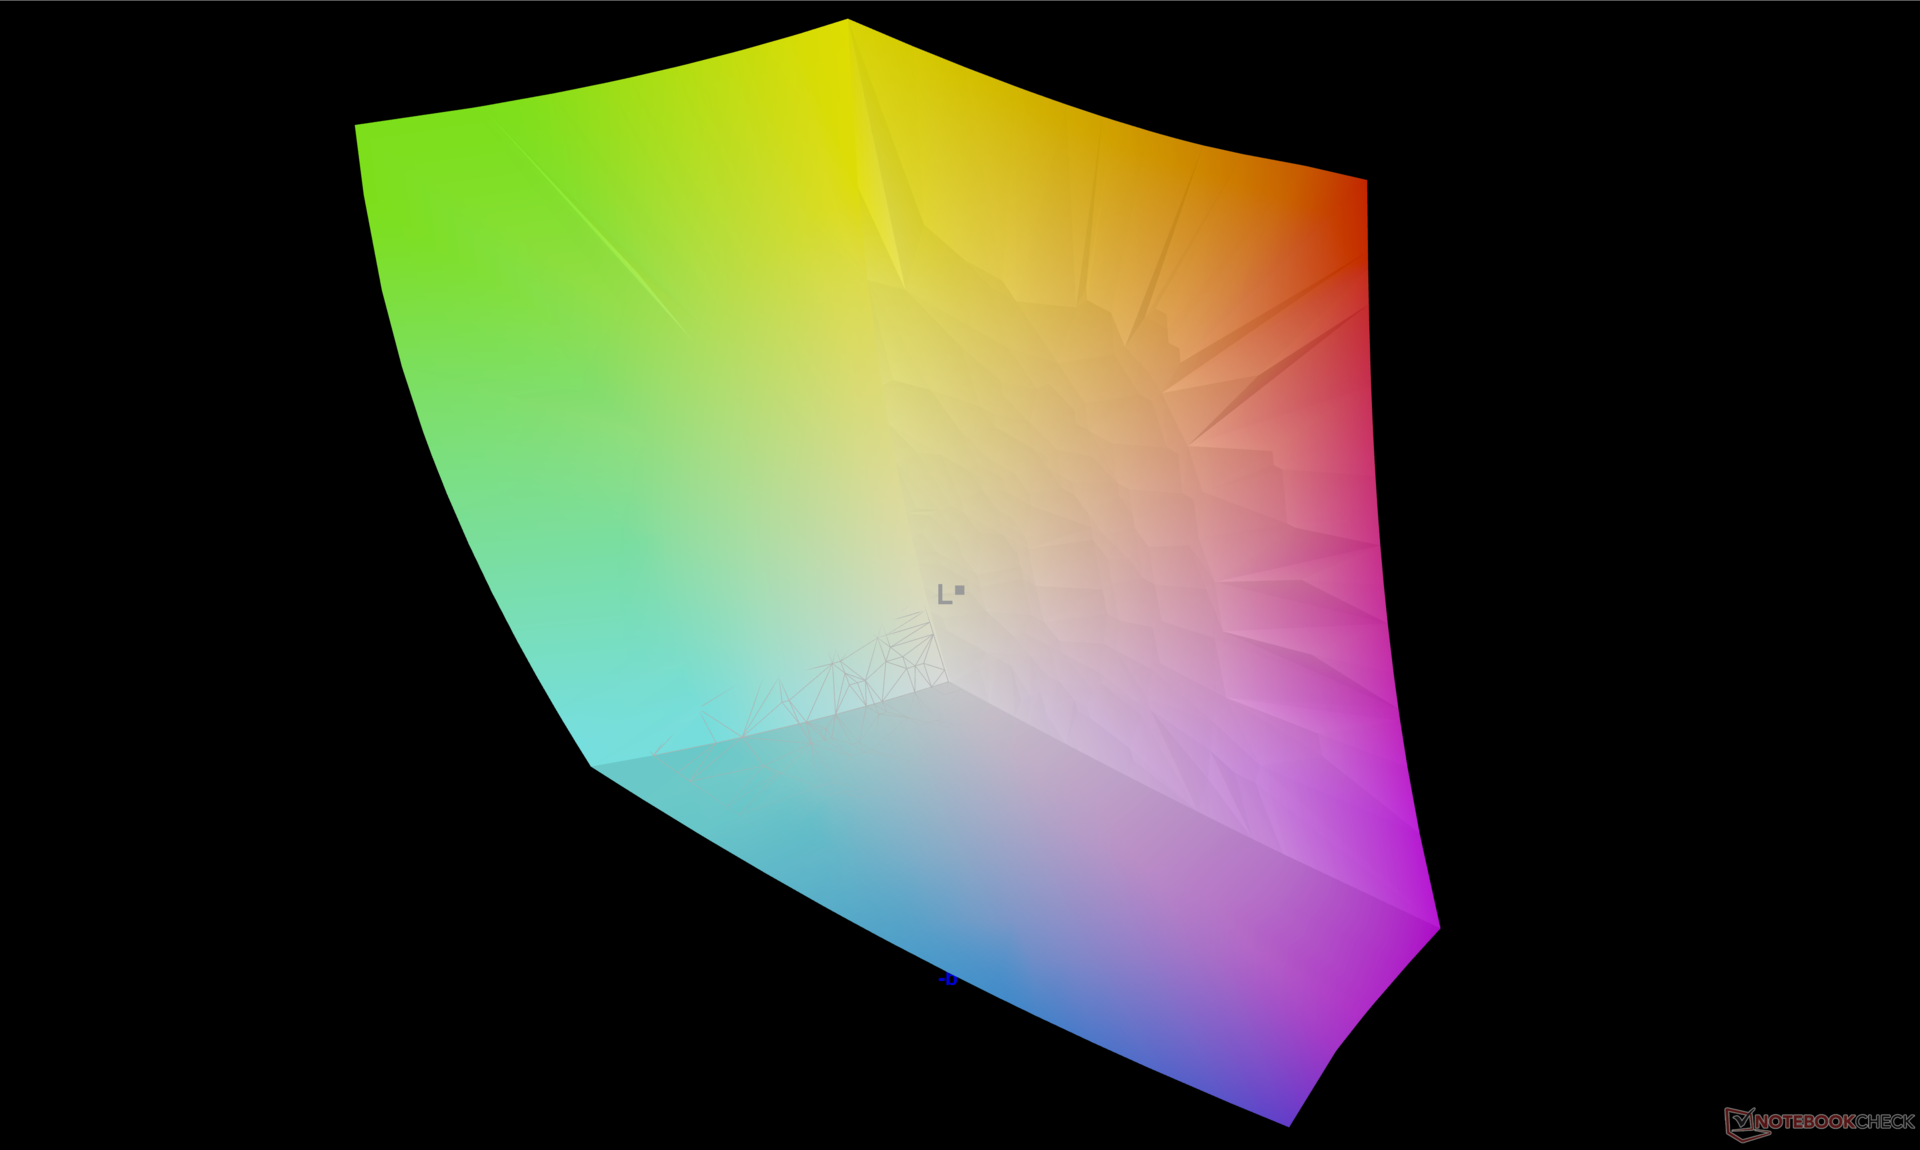
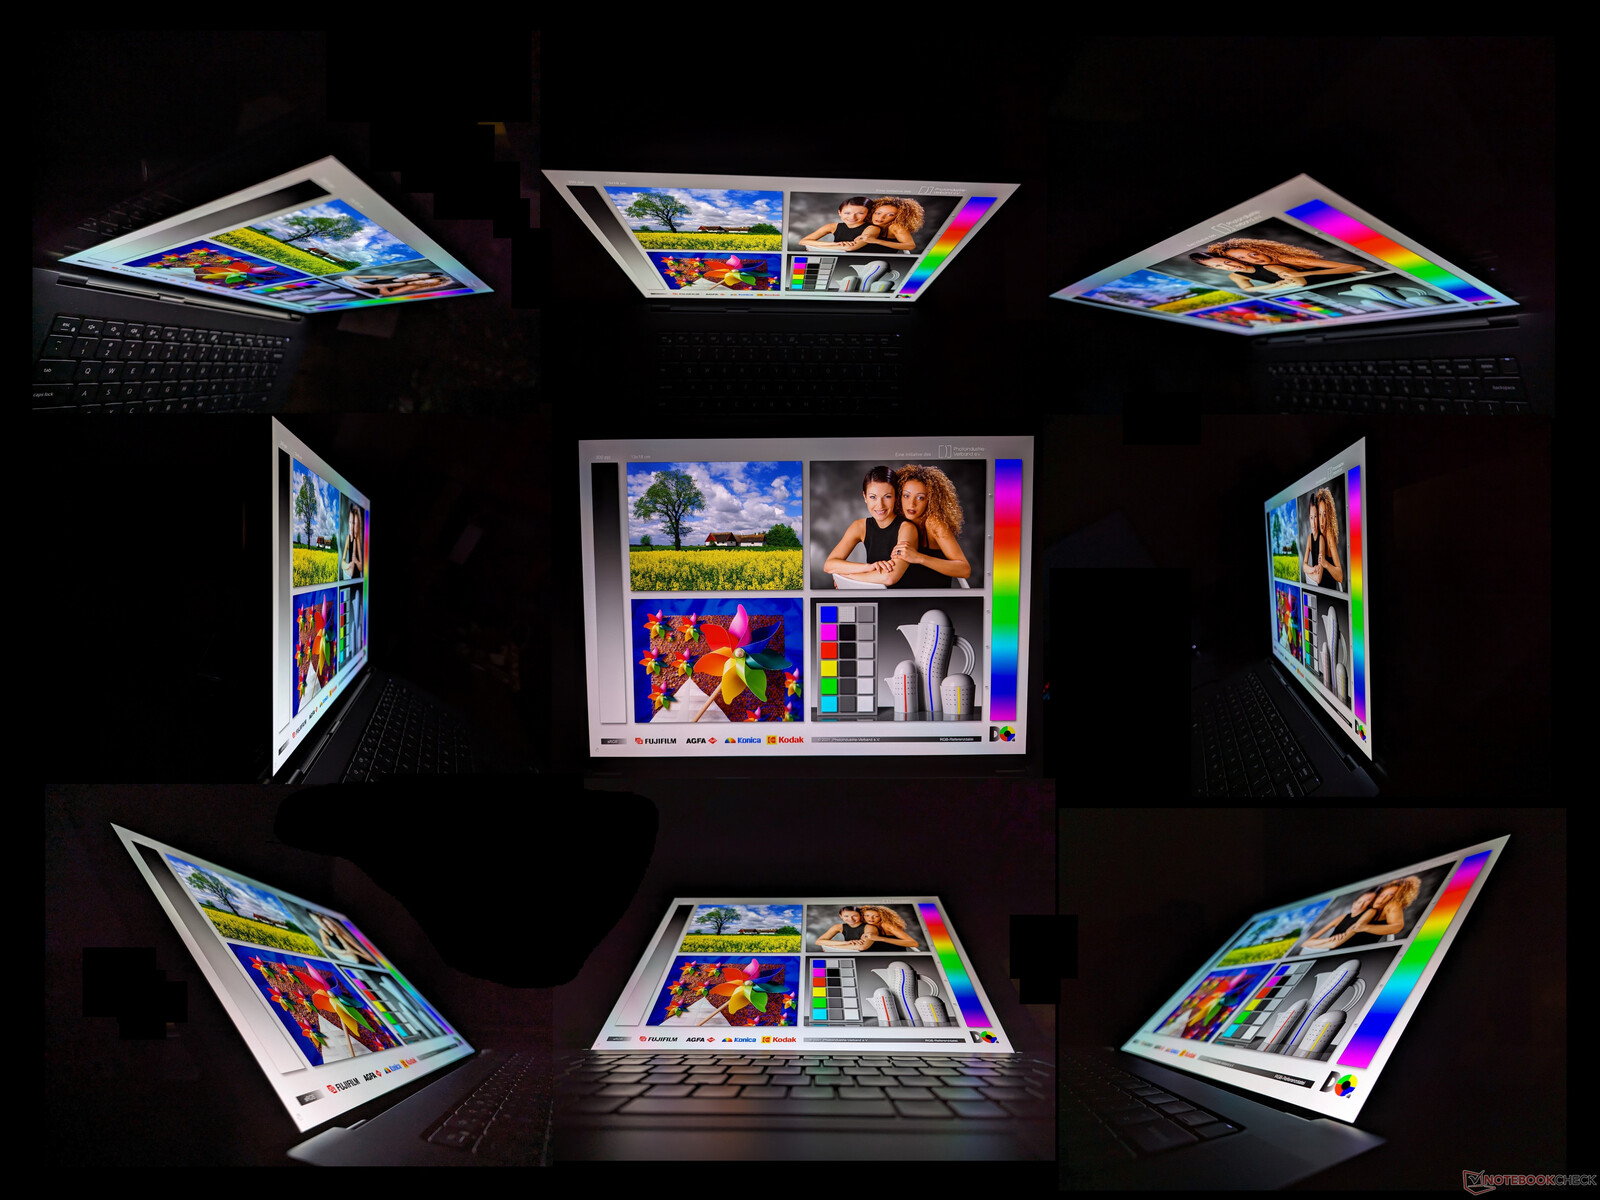
Dell använder samma Samsung 160YV03 OLED-panel för både sin 16-tums Precision 5680 och 16-tums Precision 7670. Således erbjuder båda modellerna samma visuella upplevelse tack vare deras liknande svarstider, fullständiga DCI-P3-färger och jämna ljusstyrka, vilket framgår av jämförelsetabellen nedan. Förhoppningsvis kan vi se några alternativ med högre uppdateringsfrekvens inom en snar framtid.
| |||||||||||||||||||||||||
Distribution av ljusstyrkan: 98 %
Mitt på batteriet: 345.7 cd/m²
Kontrast: ∞:1 (Svärta: 0 cd/m²)
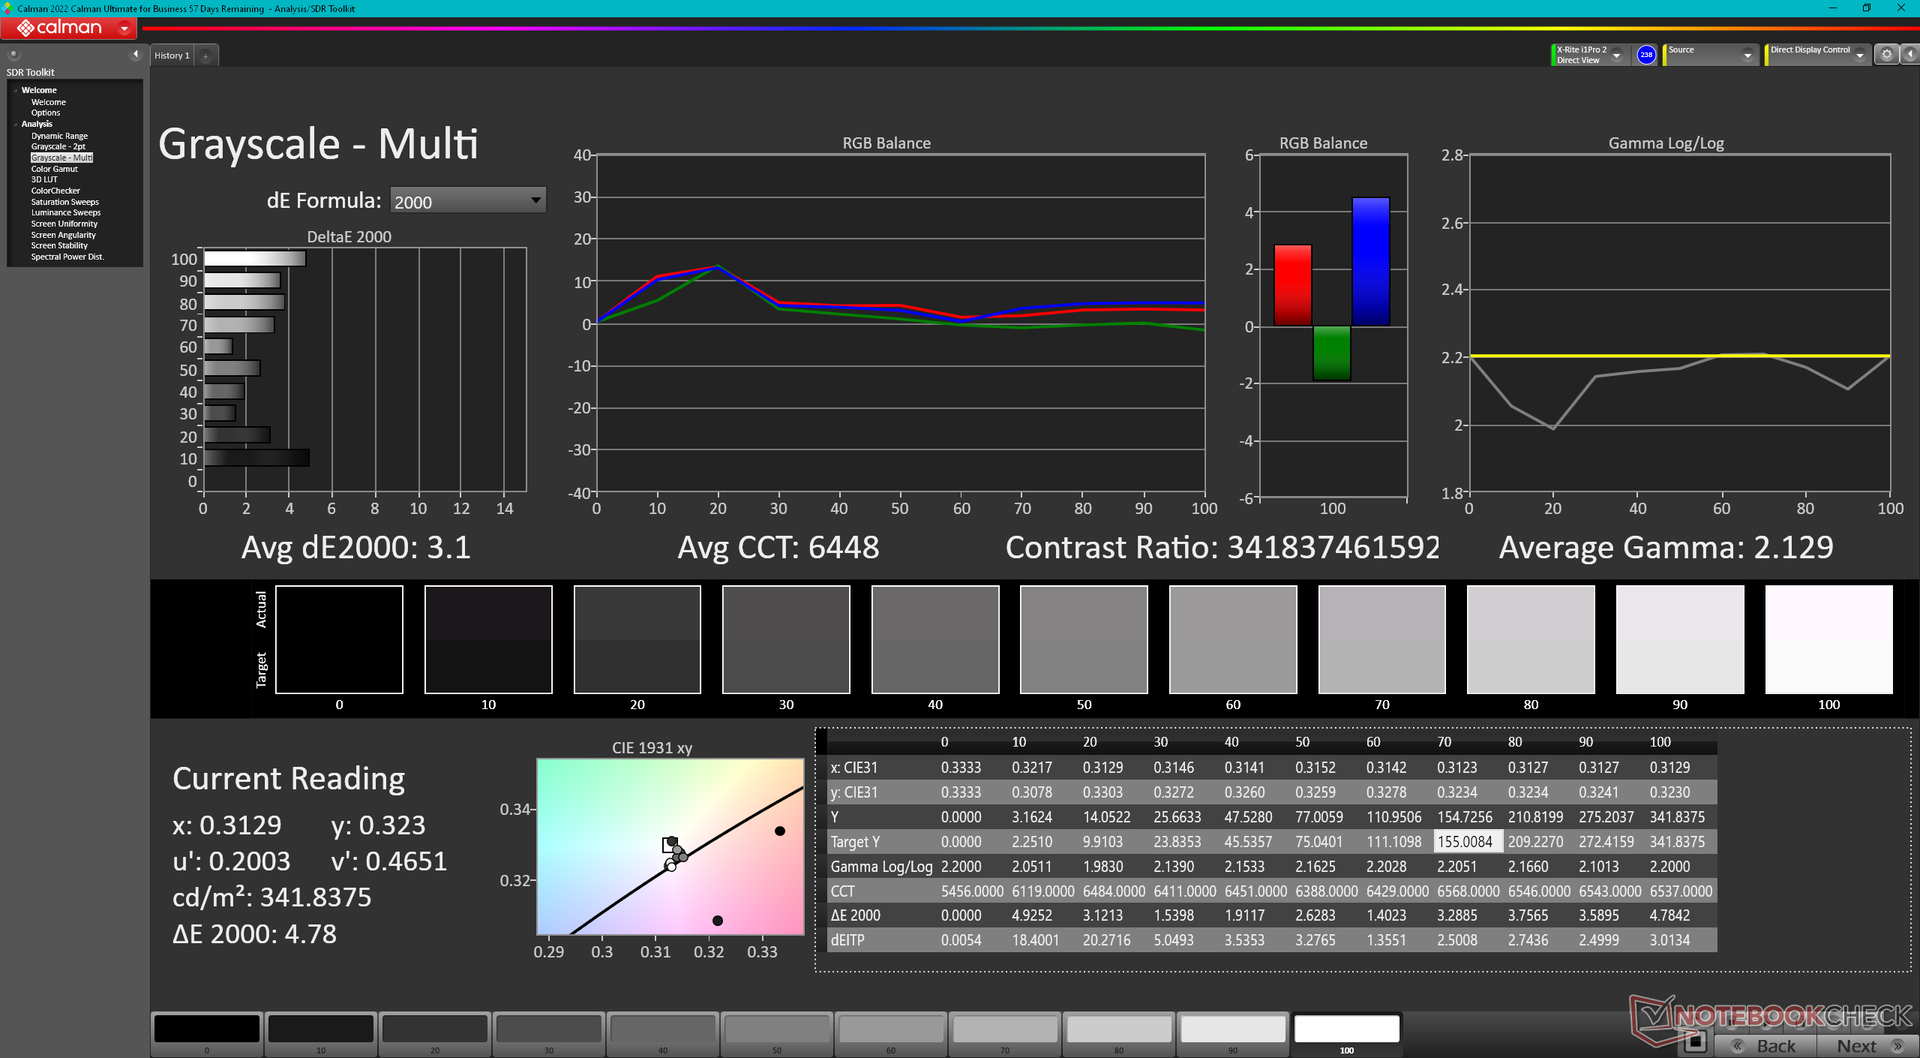
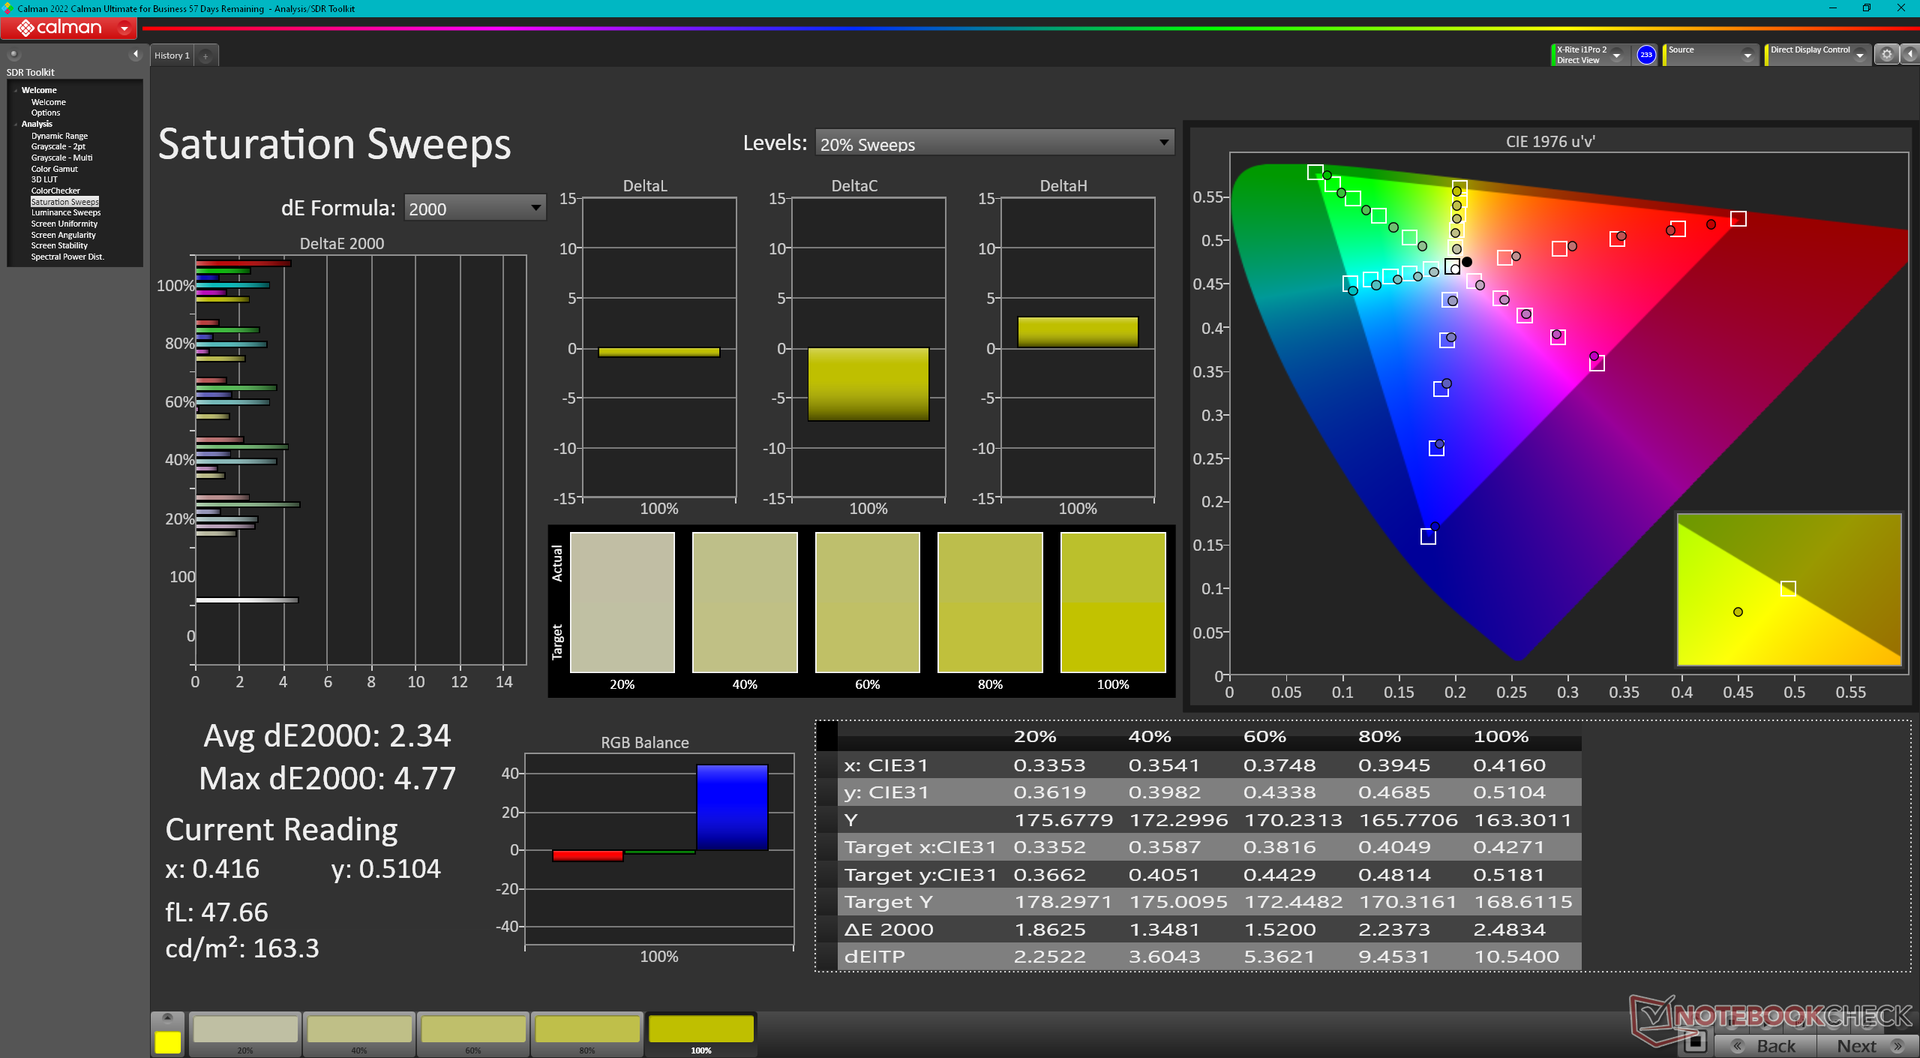
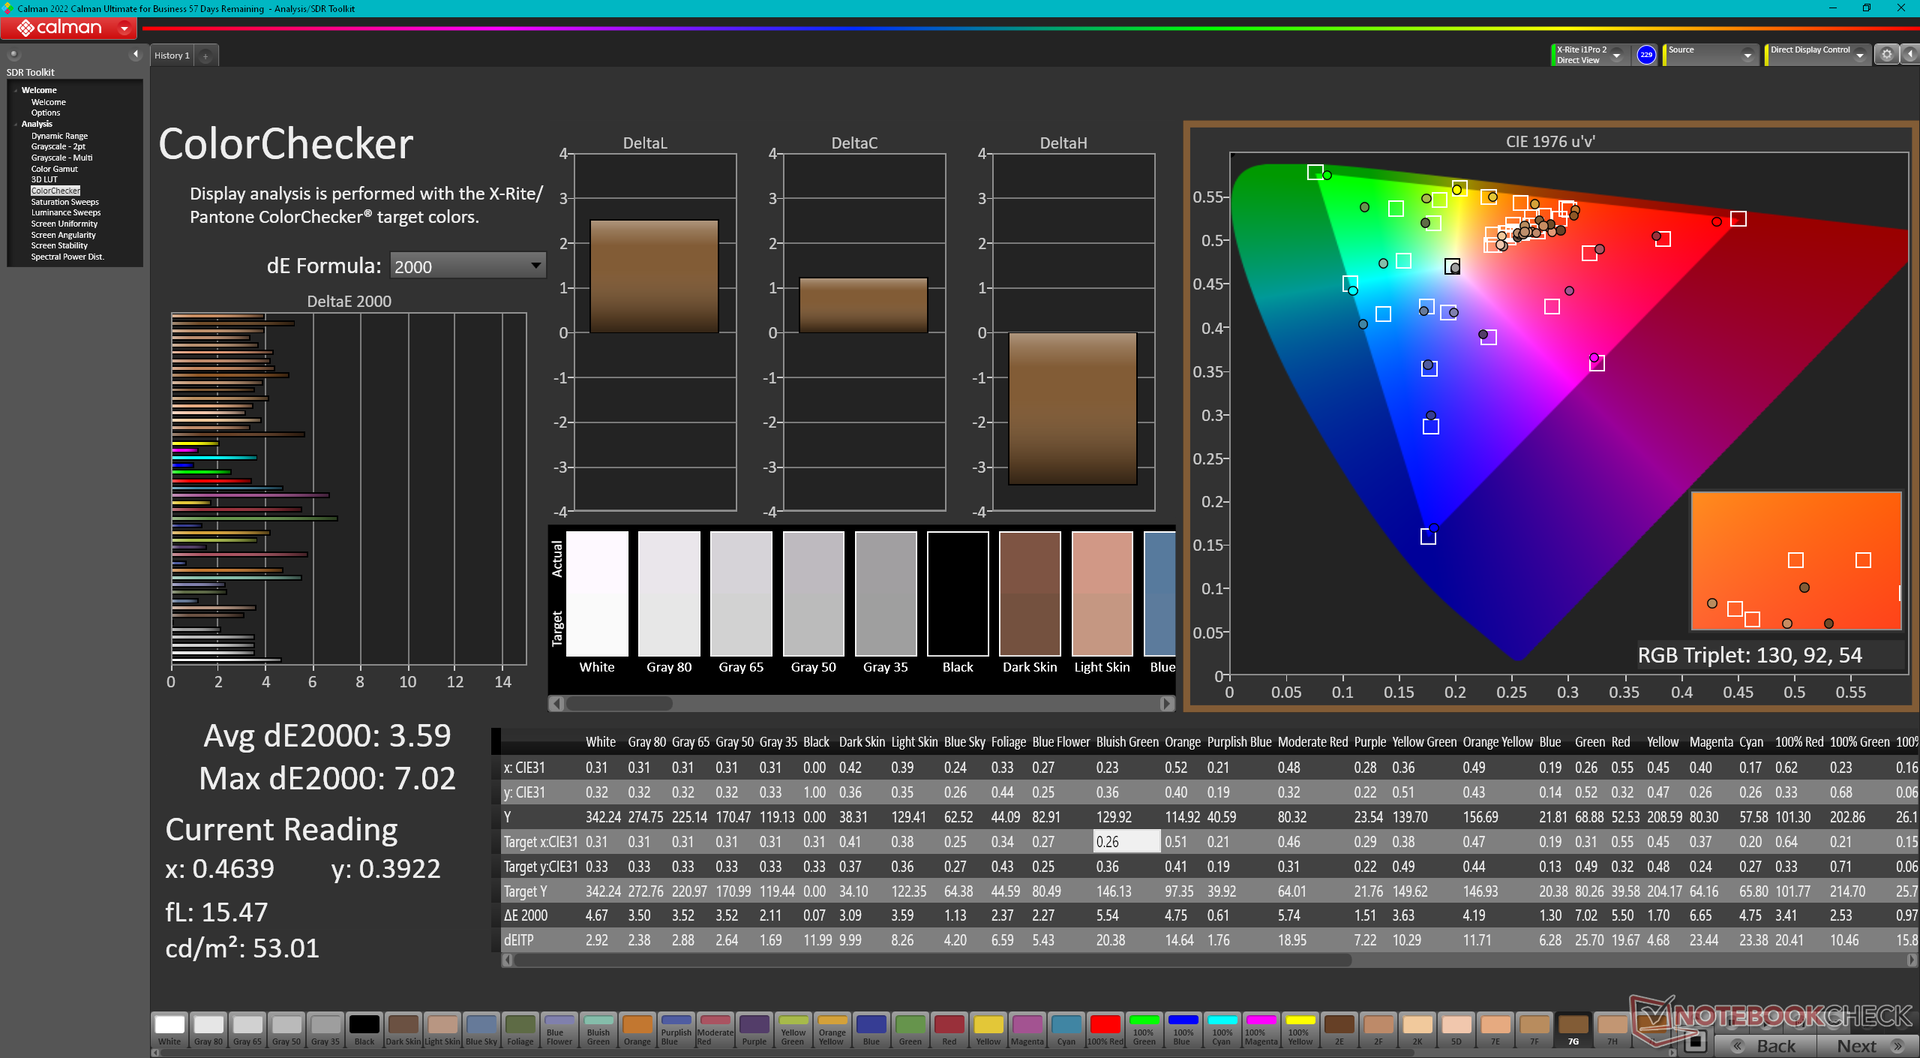
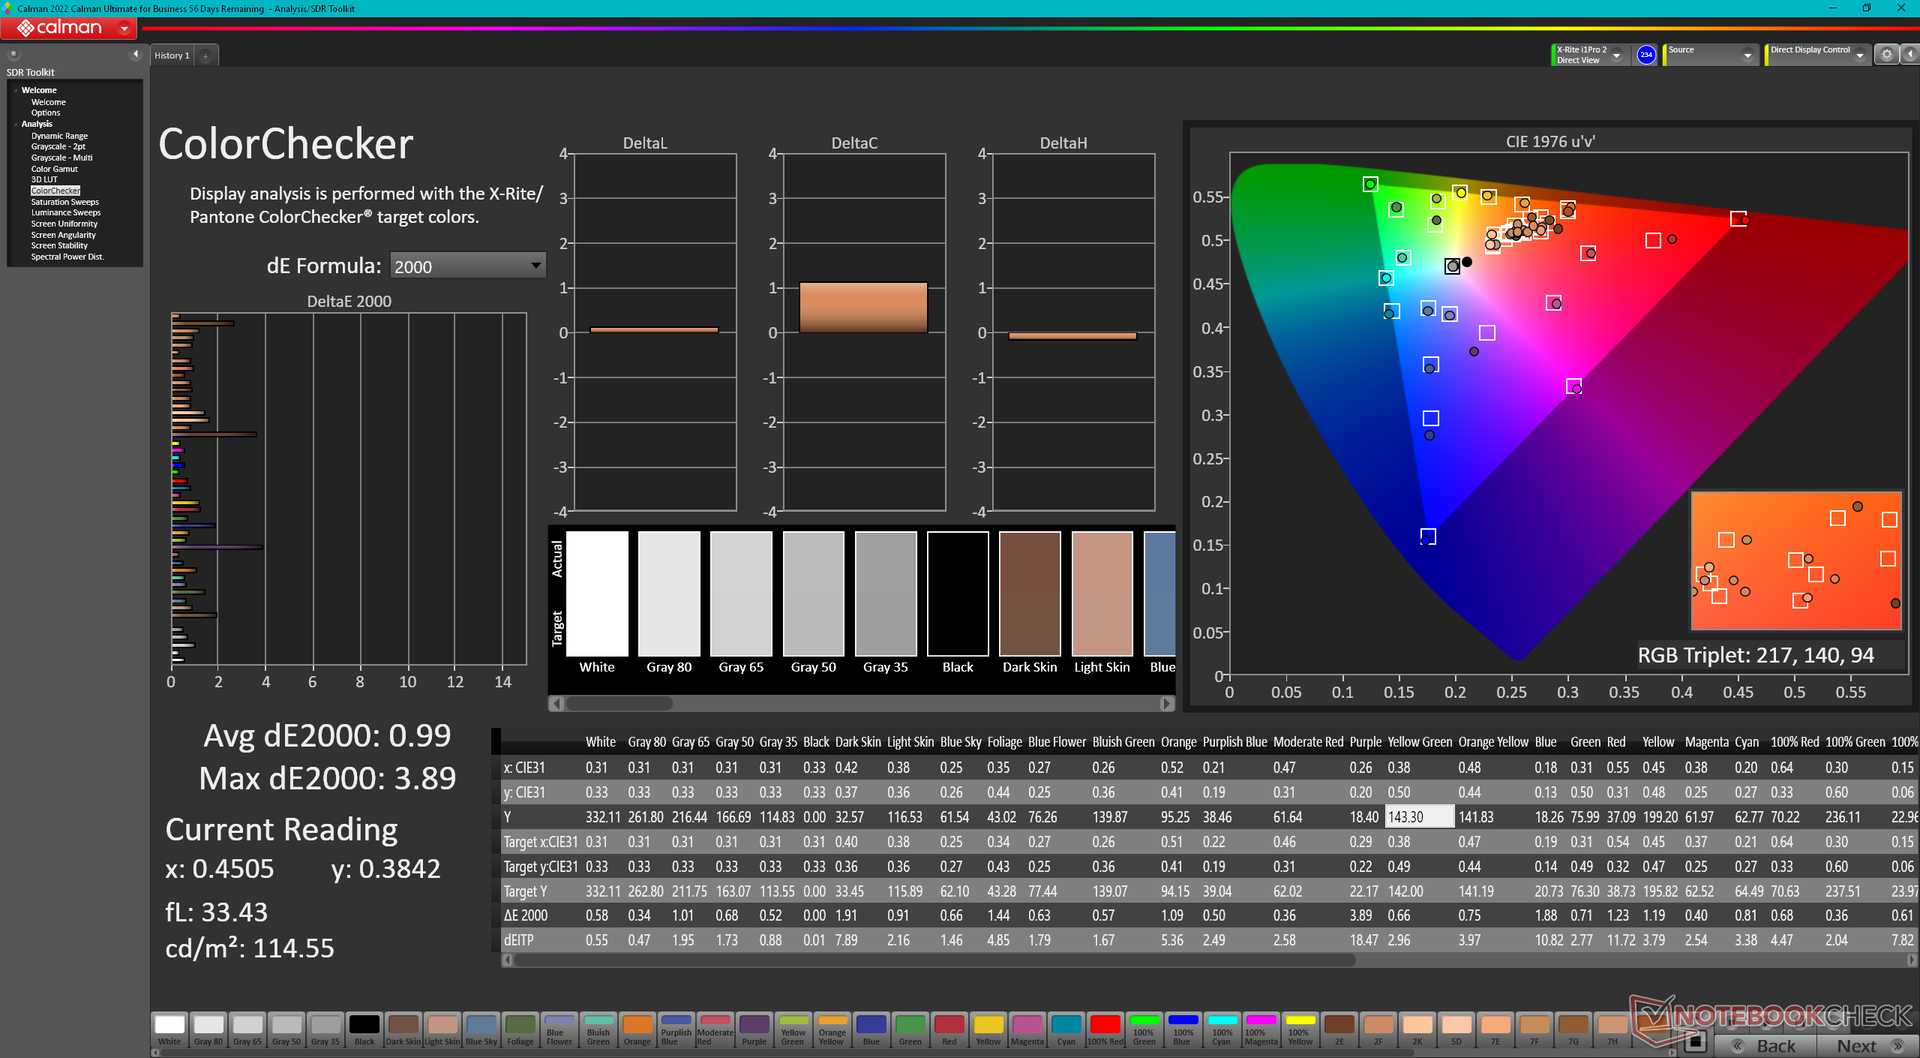
ΔE ColorChecker Calman: 3.59 | ∀{0.5-29.43 Ø4.71}
calibrated: 0.99
ΔE Greyscale Calman: 3.1 | ∀{0.09-98 Ø4.96}
97.5% AdobeRGB 1998 (Argyll 3D)
100% sRGB (Argyll 3D)
99.9% Display P3 (Argyll 3D)
Gamma: 2.13
CCT: 6448 K
| Dell Precision 5000 5680 Samsung 160YV03, OLED, 3840x2400, 16" | Dell Precision 7000 7670 Performance Samsung 160YV03, OLED, 3840x2400, 16" | HP ZBook Fury 16 G9 BOE0A52, IPS, 3840x2400, 16" | Lenovo ThinkPad P16 G1 RTX A5500 LP160UQ1-SPB1, IPS, 3840x2400, 16" | MSI CreatorPro Z16P B12UKST B160QAN02.N, IPS, 2560x1600, 16" | Asus ExpertBook B6 Flip B6602FC2 AU Optronics Model: AUOE495, IPS, 2560x1600, 16" | |
|---|---|---|---|---|---|---|
| Display | 0% | -5% | -7% | -4% | -5% | |
| Display P3 Coverage (%) | 99.9 | 99.9 0% | 97.4 -3% | 82.9 -17% | 97.6 -2% | 97.9 -2% |
| sRGB Coverage (%) | 100 | 100 0% | 99.9 0% | 98.9 -1% | 99.9 0% | 99.89 0% |
| AdobeRGB 1998 Coverage (%) | 97.5 | 98.1 1% | 86.3 -11% | 95.9 -2% | 87.4 -10% | 85.52 -12% |
| Response Times | -9% | -551% | -2297% | -490% | -1452% | |
| Response Time Grey 50% / Grey 80% * (ms) | 1.68 ? | 1.84 ? -10% | 13.7 ? -715% | 45.6 ? -2614% | 12.8 ? -662% | 36 ? -2043% |
| Response Time Black / White * (ms) | 1.77 ? | 1.92 ? -8% | 8.6 ? -386% | 36.8 ? -1979% | 7.4 ? -318% | 17 ? -860% |
| PWM Frequency (Hz) | 60 ? | 59.52 ? | ||||
| Screen | -5% | -33% | 33% | 30% | -6% | |
| Brightness middle (cd/m²) | 345.7 | 325.2 -6% | 530.5 53% | 601.9 74% | 407 18% | 440 27% |
| Brightness (cd/m²) | 349 | 328 -6% | 476 36% | 569 63% | 388 11% | 418 20% |
| Brightness Distribution (%) | 98 | 97 -1% | 83 -15% | 77 -21% | 88 -10% | 82 -16% |
| Black Level * (cd/m²) | 0.57 | 0.47 | 0.36 | 0.3 | ||
| Colorchecker dE 2000 * | 3.59 | 4.59 -28% | 2.26 37% | 2.45 32% | 1.3 64% | 2.81 22% |
| Colorchecker dE 2000 max. * | 7.02 | 7.65 -9% | 4.46 36% | 2.5 64% | 4.62 34% | |
| Colorchecker dE 2000 calibrated * | 0.99 | 4.73 -378% | 0.7 29% | 2.99 -202% | ||
| Greyscale dE 2000 * | 3.1 | 2.5 19% | 1 68% | 2.6 16% | 2.1 32% | 0.91 71% |
| Gamma | 2.13 103% | 2.1 105% | 2.28 96% | 2.3 96% | 2.26 97% | 2.2 100% |
| CCT | 6448 101% | 6541 99% | 6543 99% | 6805 96% | 6437 101% | 6600 98% |
| Contrast (:1) | 931 | 1281 | 1131 | 1467 | ||
| Totalt genomsnitt (program/inställningar) | -5% /
-4% | -196% /
-119% | -757% /
-401% | -155% /
-65% | -488% /
-247% |
* ... mindre är bättre
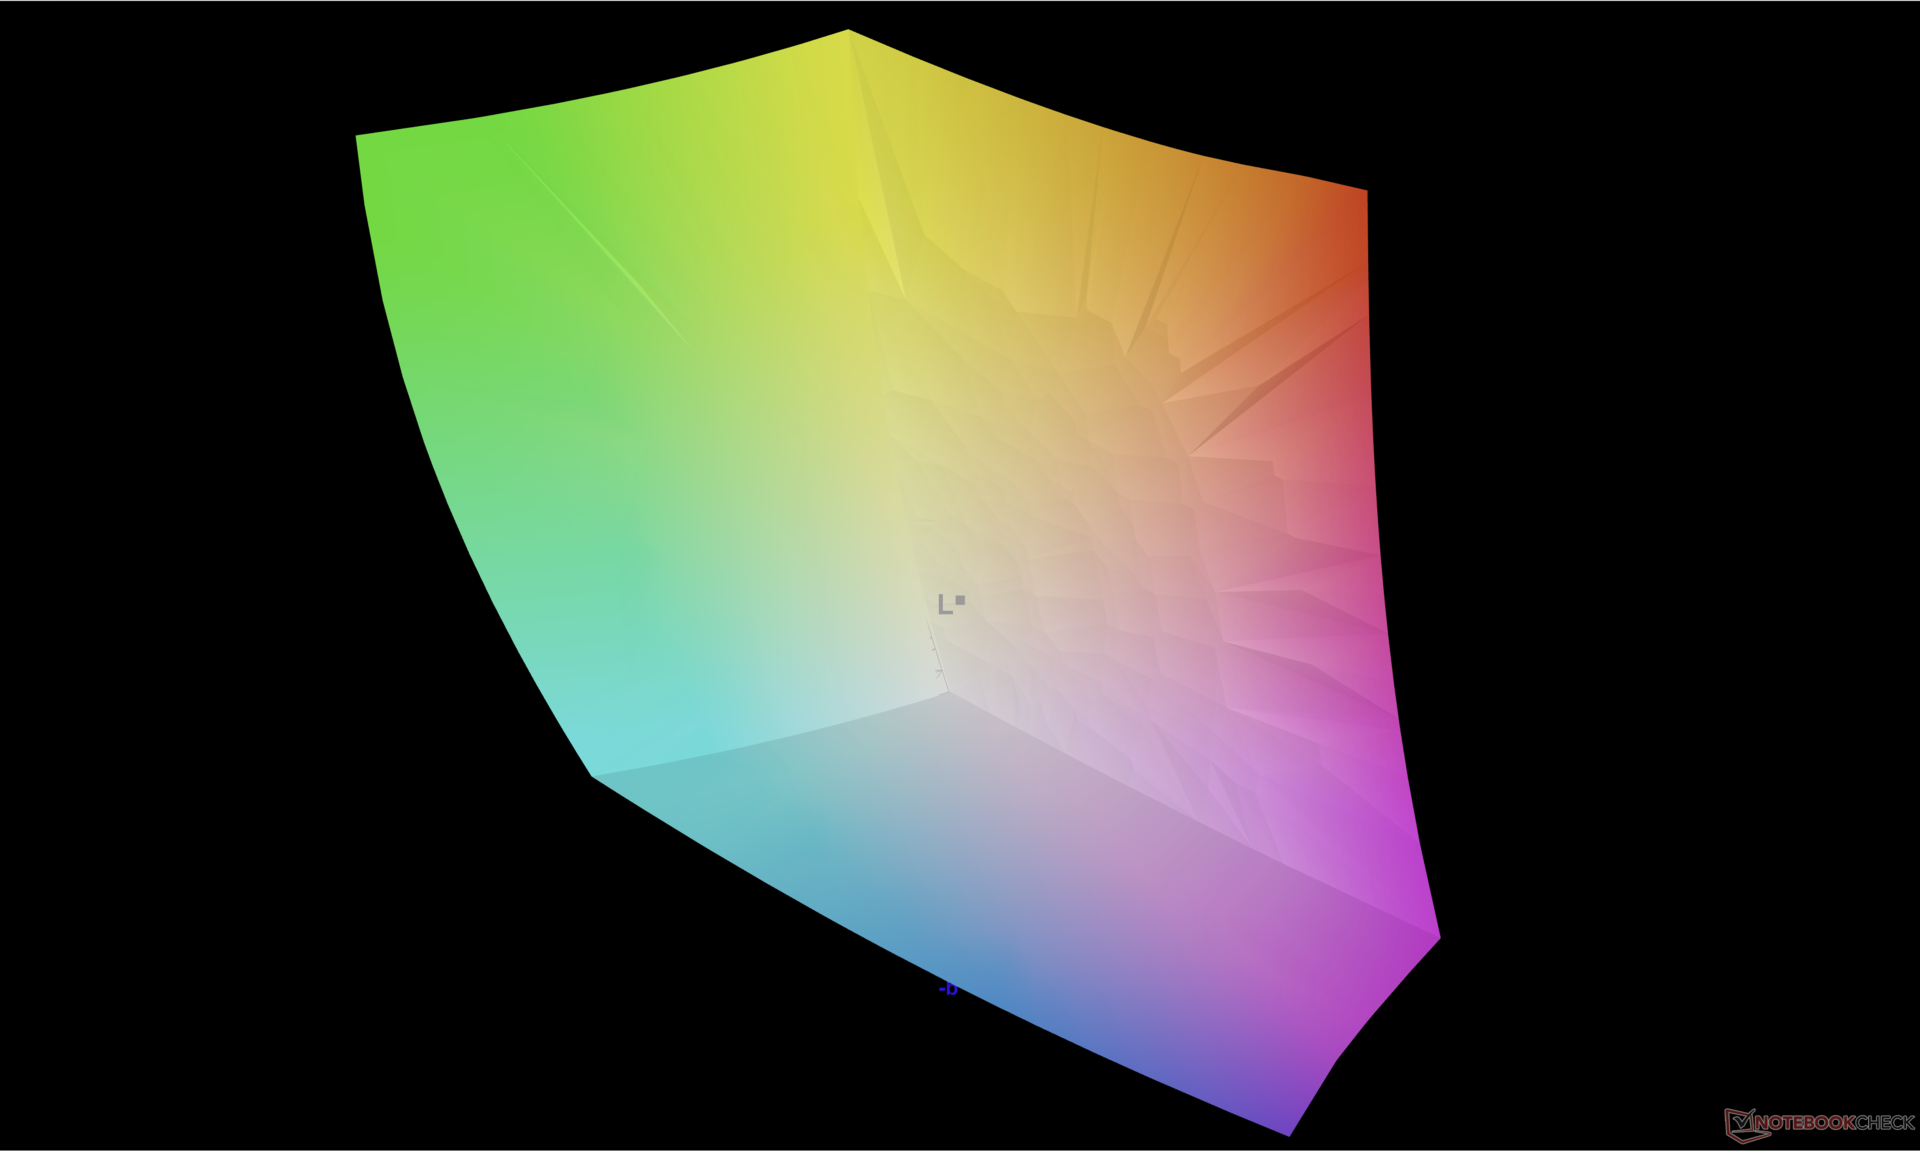
Bildskärmen är hyfsat kalibrerad med genomsnittliga deltaE-värden på mellan 3 och 4. Vår kalibrerade ICM-profil finns tillgänglig för gratis nedladdning ovan.
Visa svarstider
| ↔ Svarstid svart till vitt | ||
|---|---|---|
| 1.77 ms ... stiga ↗ och falla ↘ kombinerat | ↗ 0.8 ms stiga | 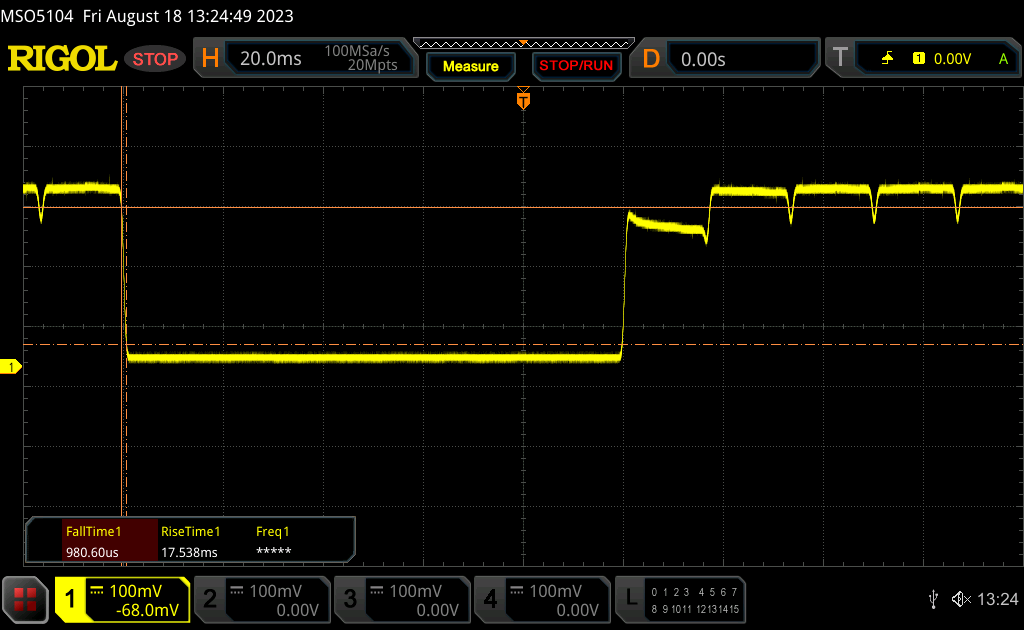 |
| ↘ 0.97 ms hösten | ||
| Skärmen visar väldigt snabba svarsfrekvenser i våra tester och borde vara mycket väl lämpad för fartfyllt spel. I jämförelse sträcker sig alla testade enheter från 0.1 (minst) till 240 (maximalt) ms. » 10 % av alla enheter är bättre. Det betyder att den uppmätta svarstiden är bättre än genomsnittet av alla testade enheter (19.8 ms). | ||
| ↔ Svarstid 50 % grått till 80 % grått | ||
| 1.68 ms ... stiga ↗ och falla ↘ kombinerat | ↗ 0.97 ms stiga | 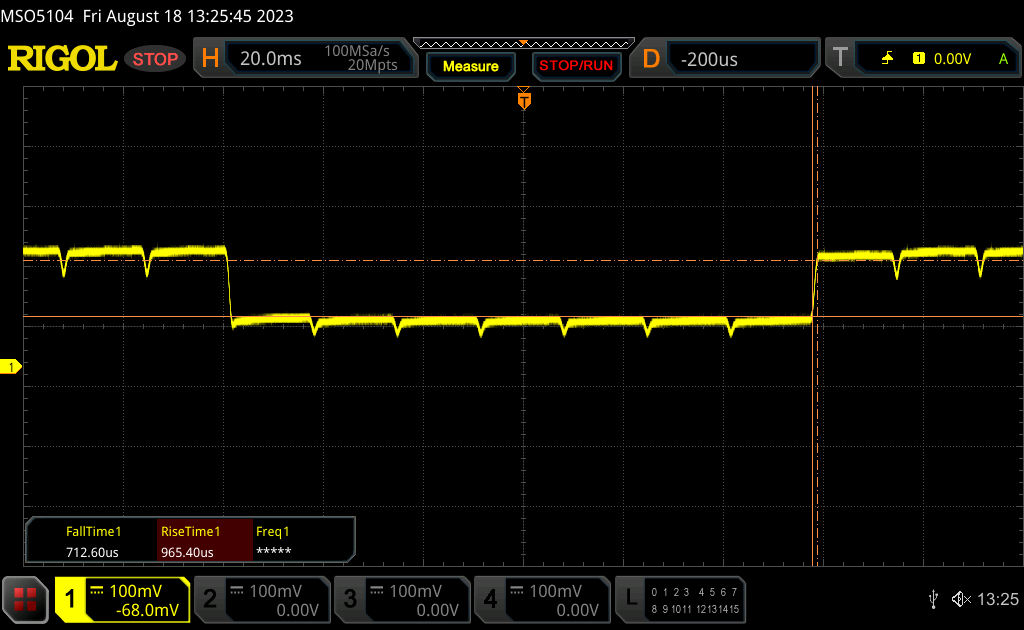 |
| ↘ 0.71 ms hösten | ||
| Skärmen visar väldigt snabba svarsfrekvenser i våra tester och borde vara mycket väl lämpad för fartfyllt spel. I jämförelse sträcker sig alla testade enheter från 0.165 (minst) till 636 (maximalt) ms. » 9 % av alla enheter är bättre. Det betyder att den uppmätta svarstiden är bättre än genomsnittet av alla testade enheter (31 ms). | ||
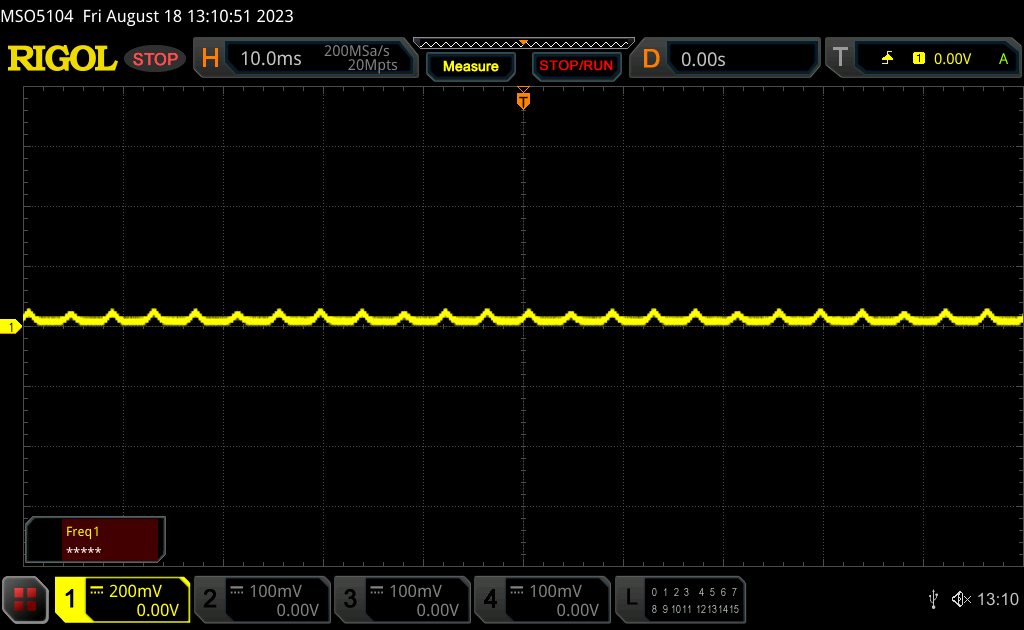
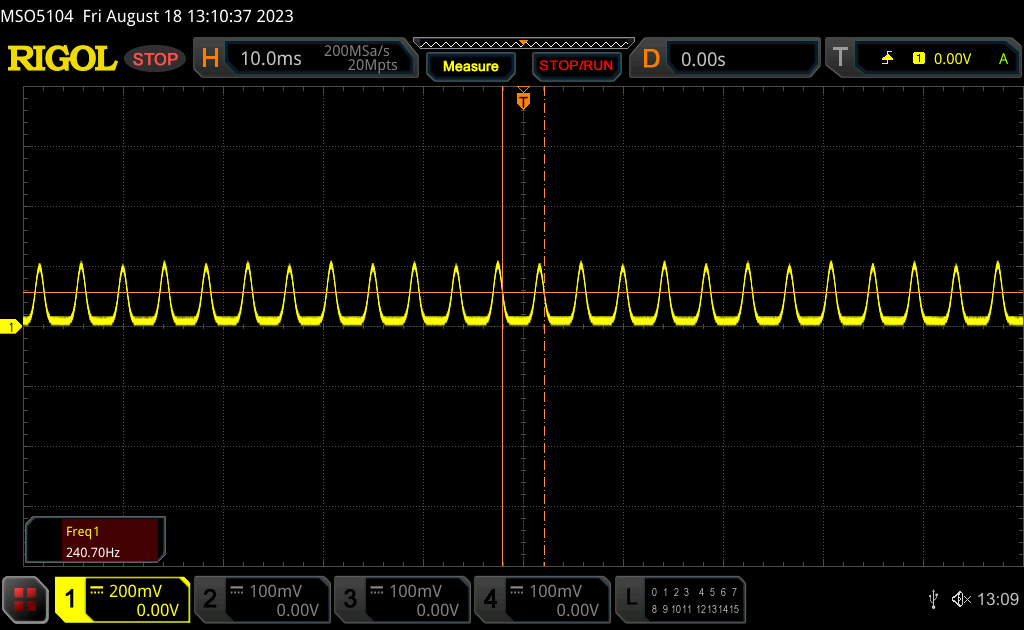
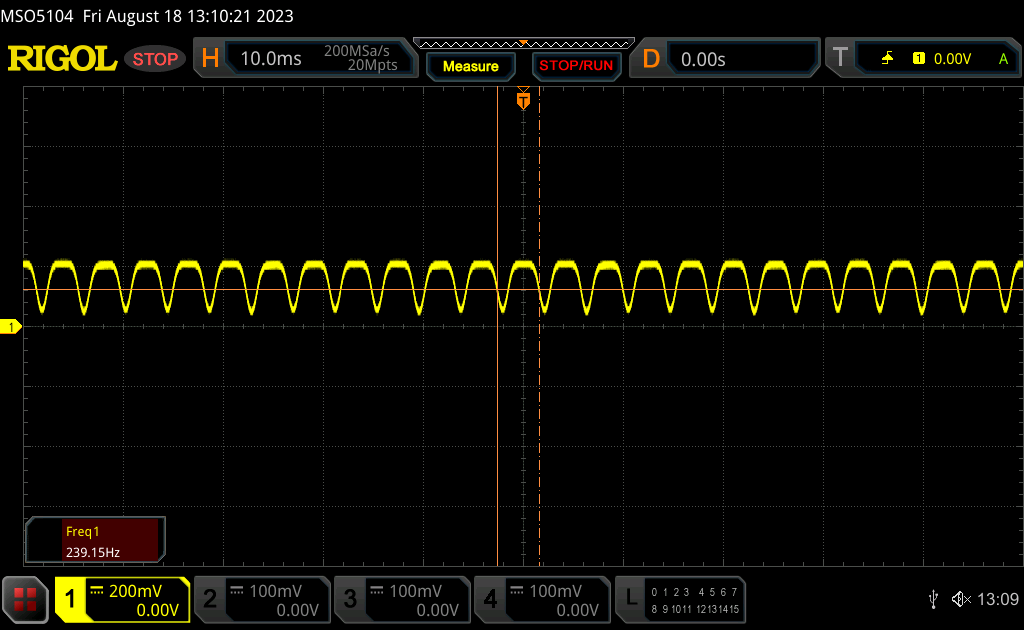
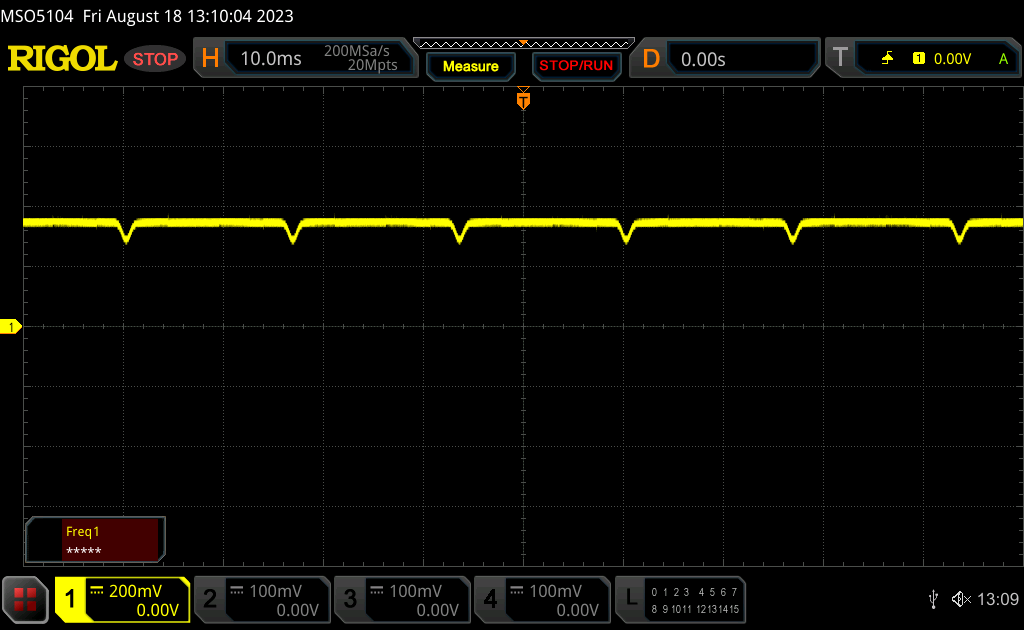
Skärmflimmer / PWM (Puls-Width Modulation)
| Skärmflimmer / PWM upptäckt | 60 Hz | ≤ 100 % ljusstyrka inställning | 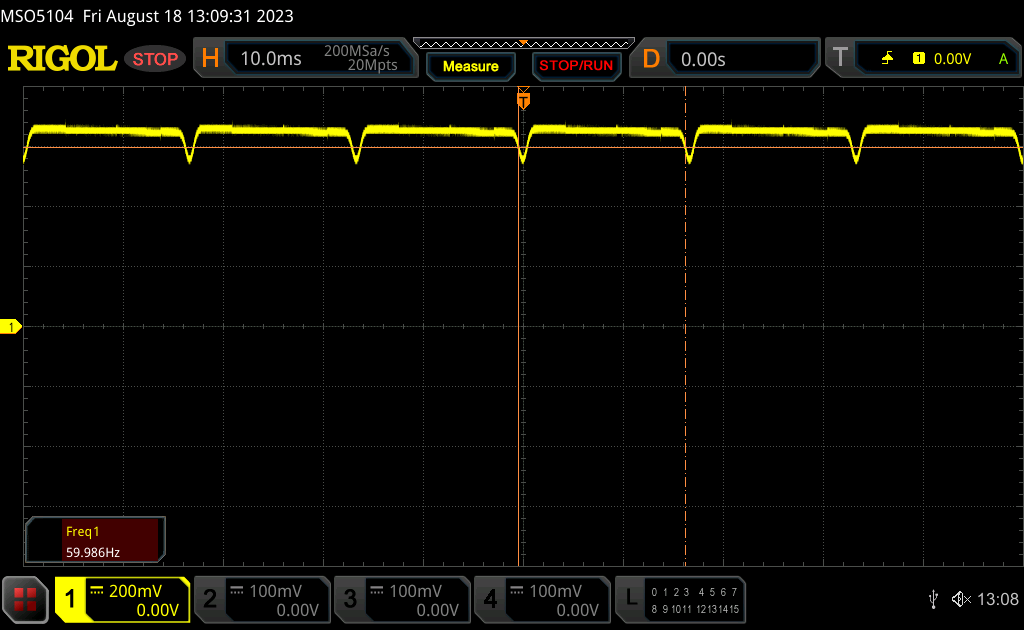 |
Displayens bakgrundsbelysning flimrar vid 60 Hz (i värsta fall, t.ex. med PWM) Flimrande upptäckt vid en ljusstyrkeinställning på 100 % och lägre. Det ska inte finnas något flimmer eller PWM över denna ljusstyrkeinställning. Frekvensen för 60 Hz är mycket låg, så flimmer kan orsaka ögon- och huvudvärk efter långvarig användning. Som jämförelse: 52 % av alla testade enheter använder inte PWM för att dämpa skärmen. Om PWM upptäcktes mättes ett medelvärde av 7754 (minst: 5 - maximum: 343500) Hz. | |||
Flimmer förekommer vid alla ljusstyrkor, precis som på smartphones och andra bärbara datorer med OLED-paneler. Frekvensen ligger stabilt på 239 Hz från 0 till 54 procents ljusstyrka och 60 Hz från 55 till 100 procents ljusstyrka.
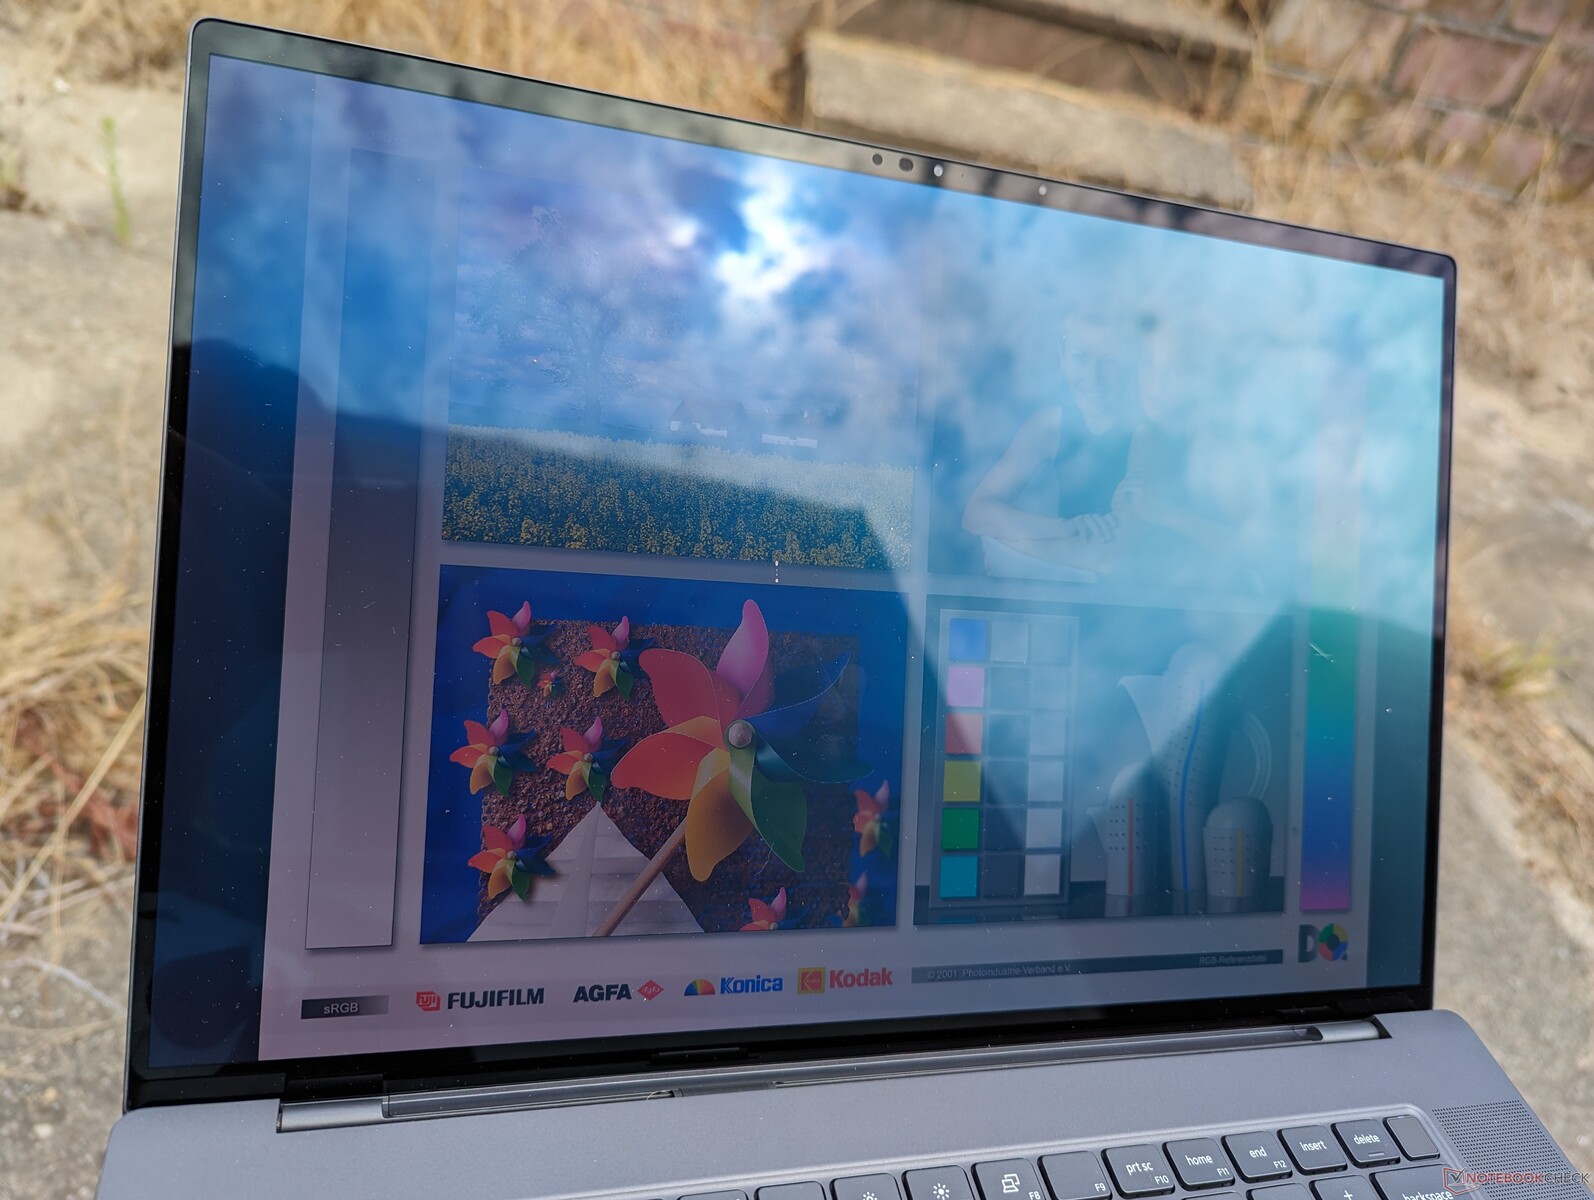
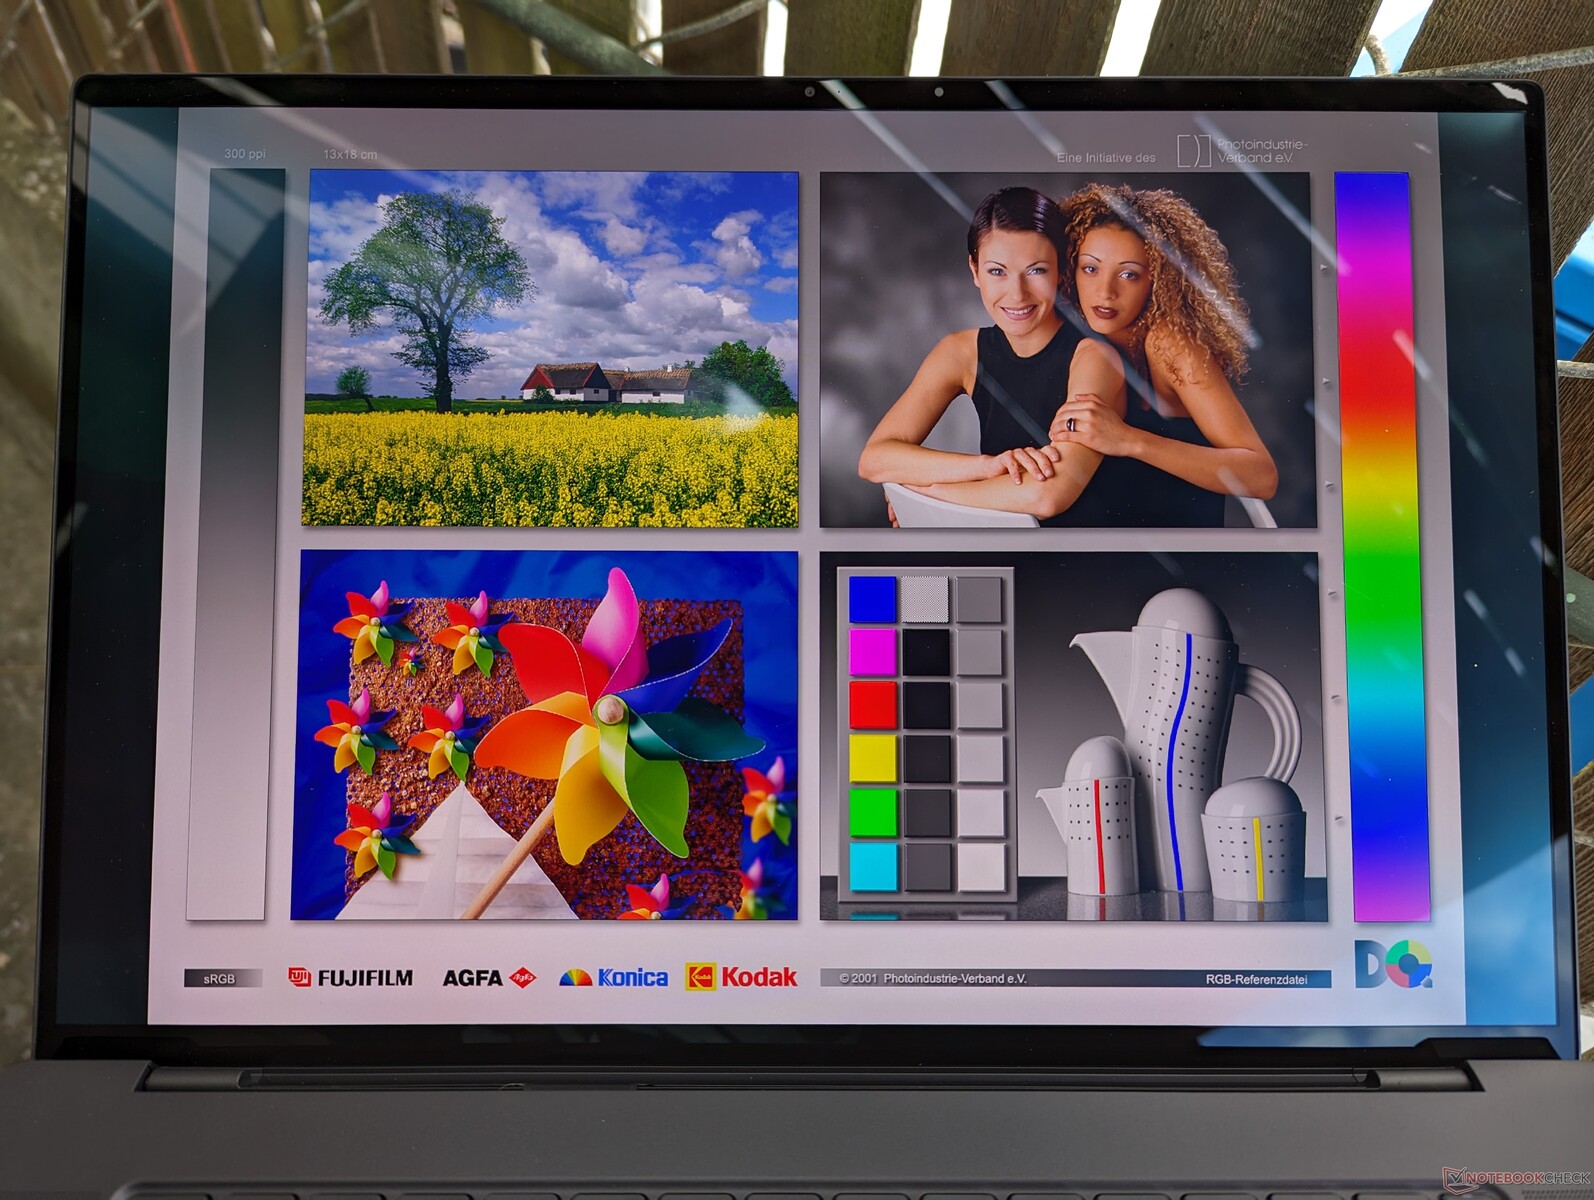
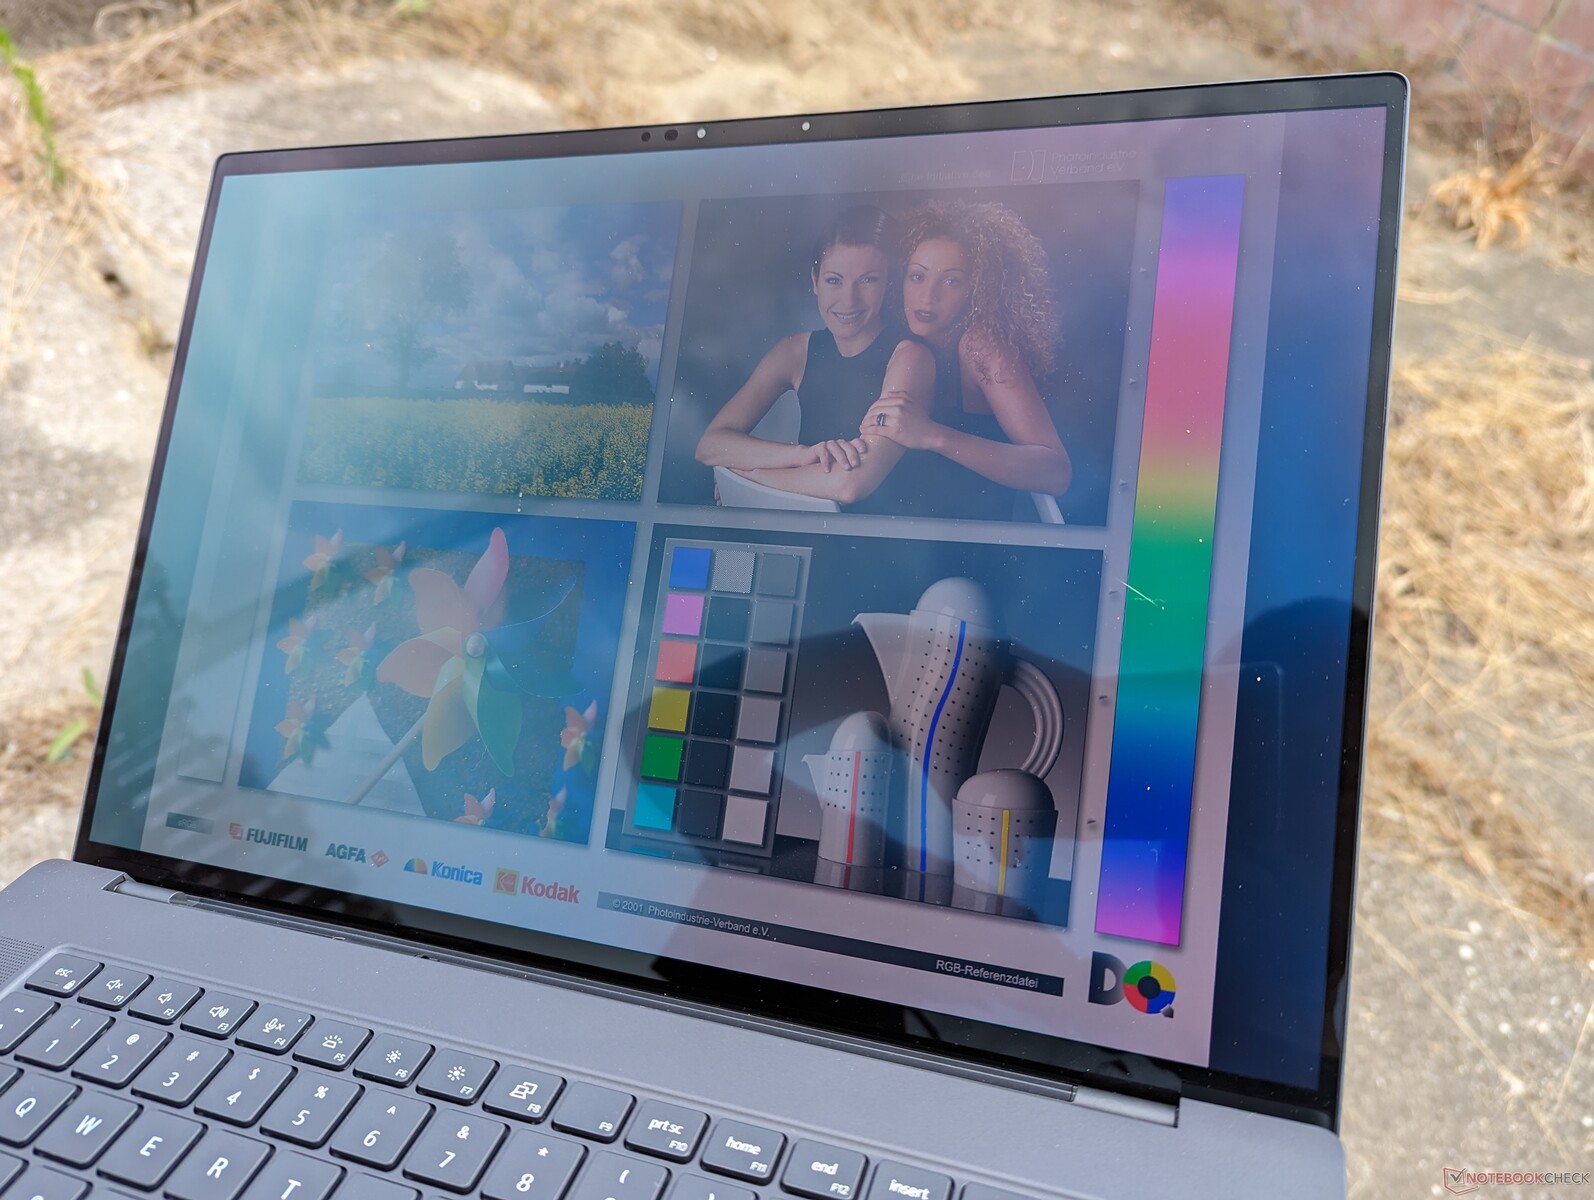
Sikten utomhus är i bästa fall genomsnittlig eftersom den 350-nit glänsande OLED-pekskärmen inte är lika ljusstark som IPS-skärmarna på ZBook Fury 16 G9 eller ThinkPad P16 G1 som kan uppnå 500 till 600 nits.
Prestanda - Intel 13:e generationens Raptor Lake-H
Villkor för testning
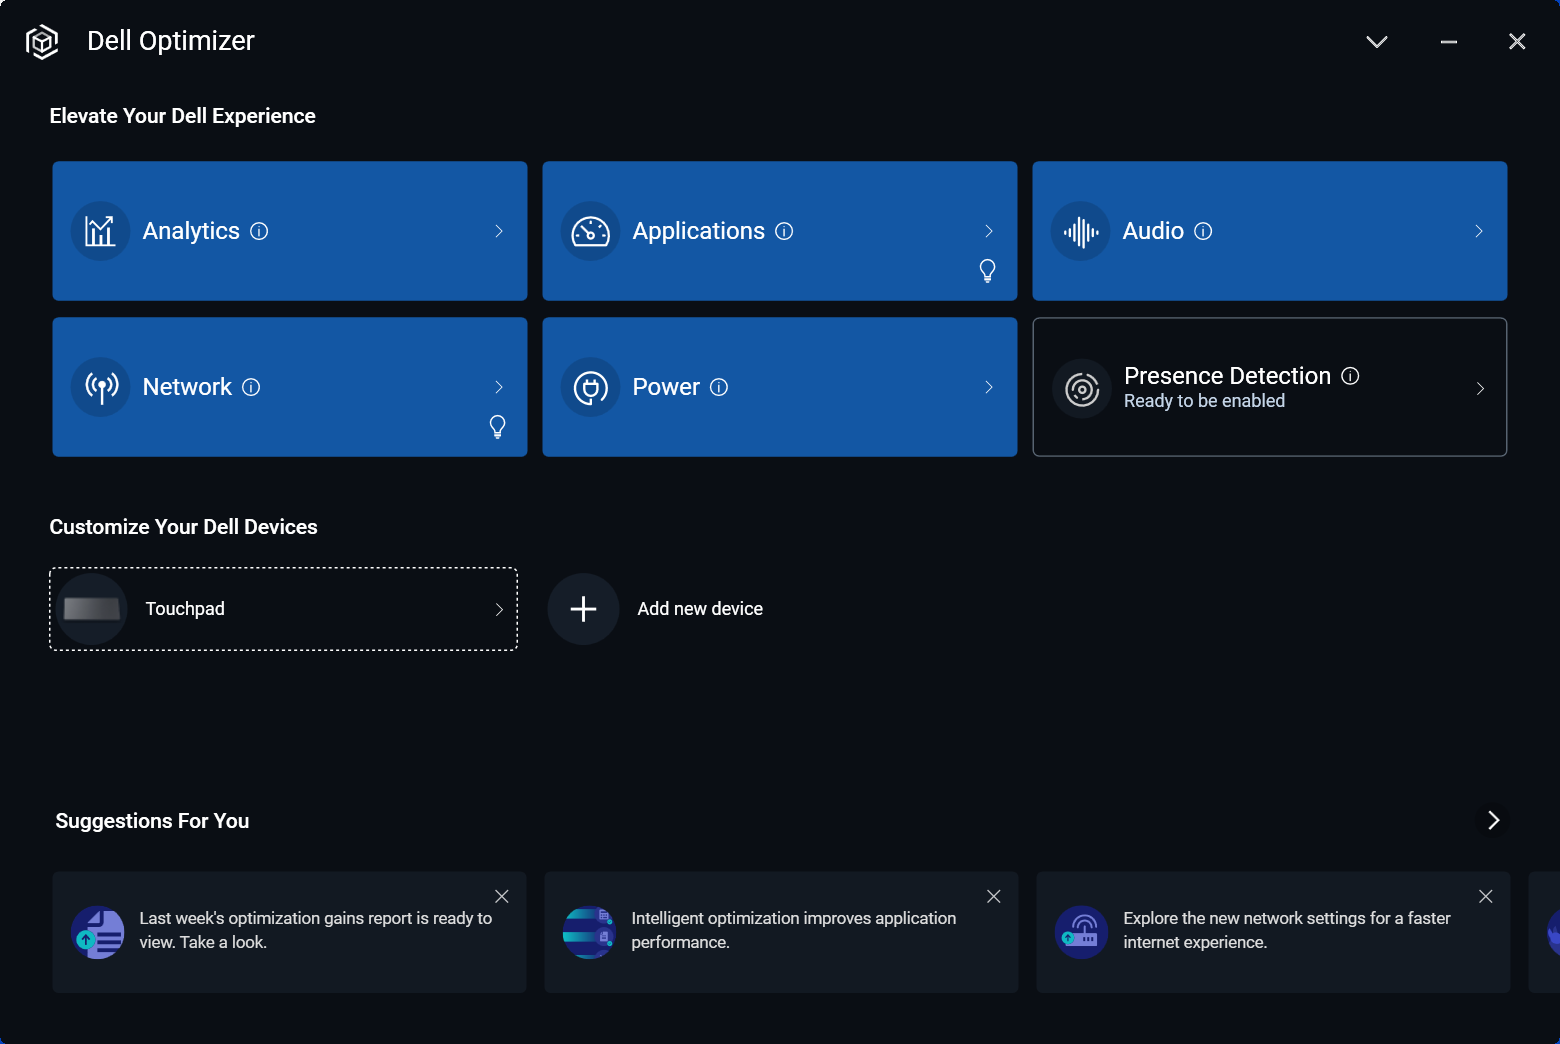
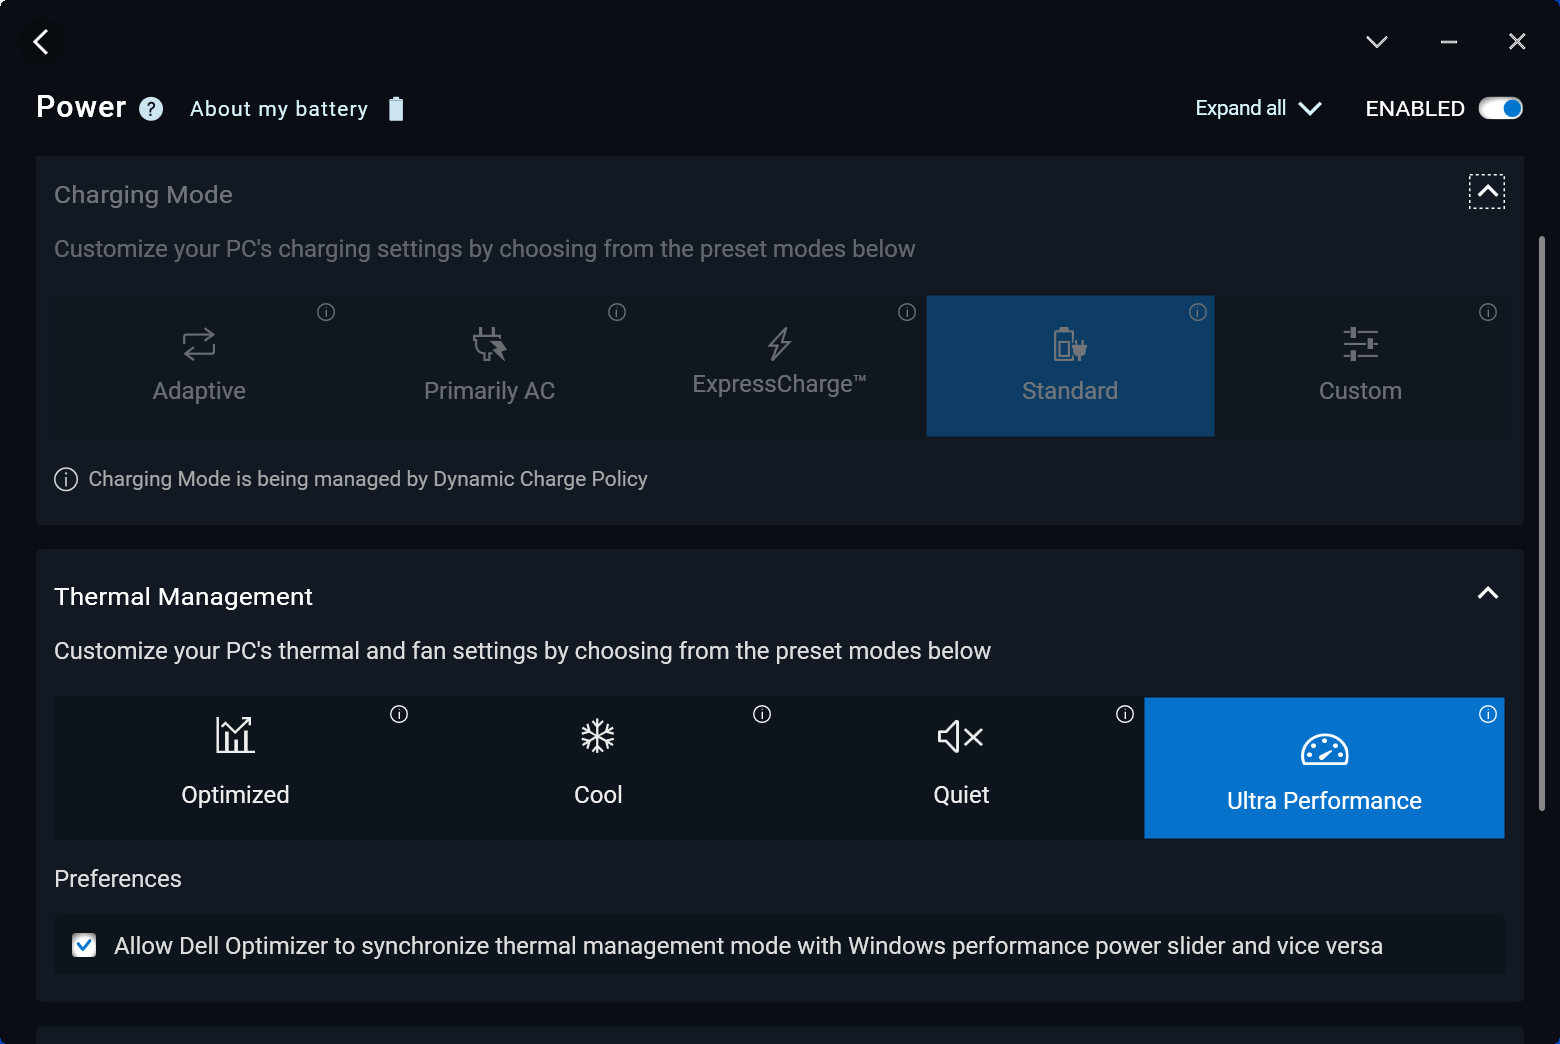
Vi ställde in vår enhet på Ultra Performance-läge via Dell Optimizer-programvaran innan vi körde riktmärkena nedan. Optimizer-strömprofilerna kan enkelt synkroniseras med Windows strömprofiler till skillnad från de specialiserade strömprofilerna på de flesta andra tillverkare.
Advanced Optimus eller Optimus 2.0 stöds inte. Nytt för Ada Lovelace GPU:er för arbetsstationer är dock ECC VRAM-läget som kan slås på eller av via Nvidias kontrollpanel. En omstart krävs när denna funktion aktiveras.
Processor
Den 13:e generationen Core i9-13900H är en besvikelse i den meningen att den inte är ett märkbart steg framåt jämfört med förra årets 12:e generation Core i9-12900H. Prestanda, till exempel, skulle vara väsentligen identisk medAsus ProArt StudioBook 16 som körs på den äldre Core i9-12900H med bara en mindre ökning på 5 till 10 procent i enkeltrådade operationer. Det är synd att Precision 5680 inte erbjuder en Core i9-13900HX vilket skulle ha gett en mycket mer betydande prestandaökning jämfört med alla mobila Alder Lake-H-processorer.
Observera att det inte heller finns några processoralternativ för Xeon eller W-klass, vilket innebär att det inte finns något stöd för ECC RAM på Precision 5680-serien.
Nedgradering till Core i7-13700H från vår i9-13900H förväntas minska prestandan för flertrådar med cirka 20 procent baserat på vår tid medSchenker Vision 16 Pro.
Cinebench R15 Multi Loop
Cinebench R23: Multi Core | Single Core
Cinebench R20: CPU (Multi Core) | CPU (Single Core)
Cinebench R15: CPU Multi 64Bit | CPU Single 64Bit
Blender: v2.79 BMW27 CPU
7-Zip 18.03: 7z b 4 | 7z b 4 -mmt1
Geekbench 5.5: Multi-Core | Single-Core
HWBOT x265 Benchmark v2.2: 4k Preset
LibreOffice : 20 Documents To PDF
R Benchmark 2.5: Overall mean
* ... mindre är bättre
AIDA64: FP32 Ray-Trace | FPU Julia | CPU SHA3 | CPU Queen | FPU SinJulia | FPU Mandel | CPU AES | CPU ZLib | FP64 Ray-Trace | CPU PhotoWorxx
| Performance rating | |
| Lenovo ThinkPad P16 G1 RTX A5500 | |
| HP ZBook Fury 16 G9 | |
| Dell Precision 5000 5680 | |
| MSI CreatorPro Z16P B12UKST | |
| Asus ExpertBook B6 Flip B6602FC2 | |
| Genomsnitt Intel Core i9-13900H | |
| Dell Precision 7000 7670 Performance | |
| AIDA64 / FP32 Ray-Trace | |
| Lenovo ThinkPad P16 G1 RTX A5500 | |
| HP ZBook Fury 16 G9 | |
| Asus ExpertBook B6 Flip B6602FC2 | |
| Dell Precision 5000 5680 | |
| Dell Precision 7000 7670 Performance | |
| Genomsnitt Intel Core i9-13900H (6788 - 19557, n=25) | |
| MSI CreatorPro Z16P B12UKST | |
| AIDA64 / FPU Julia | |
| HP ZBook Fury 16 G9 | |
| Lenovo ThinkPad P16 G1 RTX A5500 | |
| Asus ExpertBook B6 Flip B6602FC2 | |
| Dell Precision 5000 5680 | |
| Dell Precision 7000 7670 Performance | |
| Genomsnitt Intel Core i9-13900H (22551 - 95579, n=25) | |
| MSI CreatorPro Z16P B12UKST | |
| AIDA64 / CPU SHA3 | |
| Lenovo ThinkPad P16 G1 RTX A5500 | |
| HP ZBook Fury 16 G9 | |
| MSI CreatorPro Z16P B12UKST | |
| Genomsnitt Intel Core i9-13900H (2491 - 4270, n=25) | |
| Dell Precision 5000 5680 | |
| Asus ExpertBook B6 Flip B6602FC2 | |
| Dell Precision 7000 7670 Performance | |
| AIDA64 / CPU Queen | |
| Dell Precision 5000 5680 | |
| Genomsnitt Intel Core i9-13900H (65121 - 120936, n=25) | |
| Lenovo ThinkPad P16 G1 RTX A5500 | |
| Dell Precision 7000 7670 Performance | |
| Asus ExpertBook B6 Flip B6602FC2 | |
| HP ZBook Fury 16 G9 | |
| MSI CreatorPro Z16P B12UKST | |
| AIDA64 / FPU SinJulia | |
| Lenovo ThinkPad P16 G1 RTX A5500 | |
| HP ZBook Fury 16 G9 | |
| Asus ExpertBook B6 Flip B6602FC2 | |
| Dell Precision 7000 7670 Performance | |
| Dell Precision 5000 5680 | |
| Genomsnitt Intel Core i9-13900H (6108 - 11631, n=25) | |
| MSI CreatorPro Z16P B12UKST | |
| AIDA64 / FPU Mandel | |
| HP ZBook Fury 16 G9 | |
| Lenovo ThinkPad P16 G1 RTX A5500 | |
| Asus ExpertBook B6 Flip B6602FC2 | |
| Dell Precision 5000 5680 | |
| Genomsnitt Intel Core i9-13900H (11283 - 48474, n=25) | |
| Dell Precision 7000 7670 Performance | |
| MSI CreatorPro Z16P B12UKST | |
| AIDA64 / CPU AES | |
| MSI CreatorPro Z16P B12UKST | |
| HP ZBook Fury 16 G9 | |
| Lenovo ThinkPad P16 G1 RTX A5500 | |
| Genomsnitt Intel Core i9-13900H (3691 - 149377, n=25) | |
| Asus ExpertBook B6 Flip B6602FC2 | |
| Dell Precision 7000 7670 Performance | |
| Dell Precision 5000 5680 | |
| AIDA64 / CPU ZLib | |
| Lenovo ThinkPad P16 G1 RTX A5500 | |
| HP ZBook Fury 16 G9 | |
| Genomsnitt Intel Core i9-13900H (789 - 1254, n=25) | |
| Asus ExpertBook B6 Flip B6602FC2 | |
| MSI CreatorPro Z16P B12UKST | |
| Dell Precision 5000 5680 | |
| Dell Precision 7000 7670 Performance | |
| AIDA64 / FP64 Ray-Trace | |
| Lenovo ThinkPad P16 G1 RTX A5500 | |
| HP ZBook Fury 16 G9 | |
| Asus ExpertBook B6 Flip B6602FC2 | |
| Dell Precision 5000 5680 | |
| Dell Precision 7000 7670 Performance | |
| Genomsnitt Intel Core i9-13900H (3655 - 10716, n=25) | |
| MSI CreatorPro Z16P B12UKST | |
| AIDA64 / CPU PhotoWorxx | |
| Dell Precision 5000 5680 | |
| MSI CreatorPro Z16P B12UKST | |
| Dell Precision 7000 7670 Performance | |
| Lenovo ThinkPad P16 G1 RTX A5500 | |
| Genomsnitt Intel Core i9-13900H (10871 - 50488, n=25) | |
| HP ZBook Fury 16 G9 | |
| Asus ExpertBook B6 Flip B6602FC2 | |
Systemets prestanda
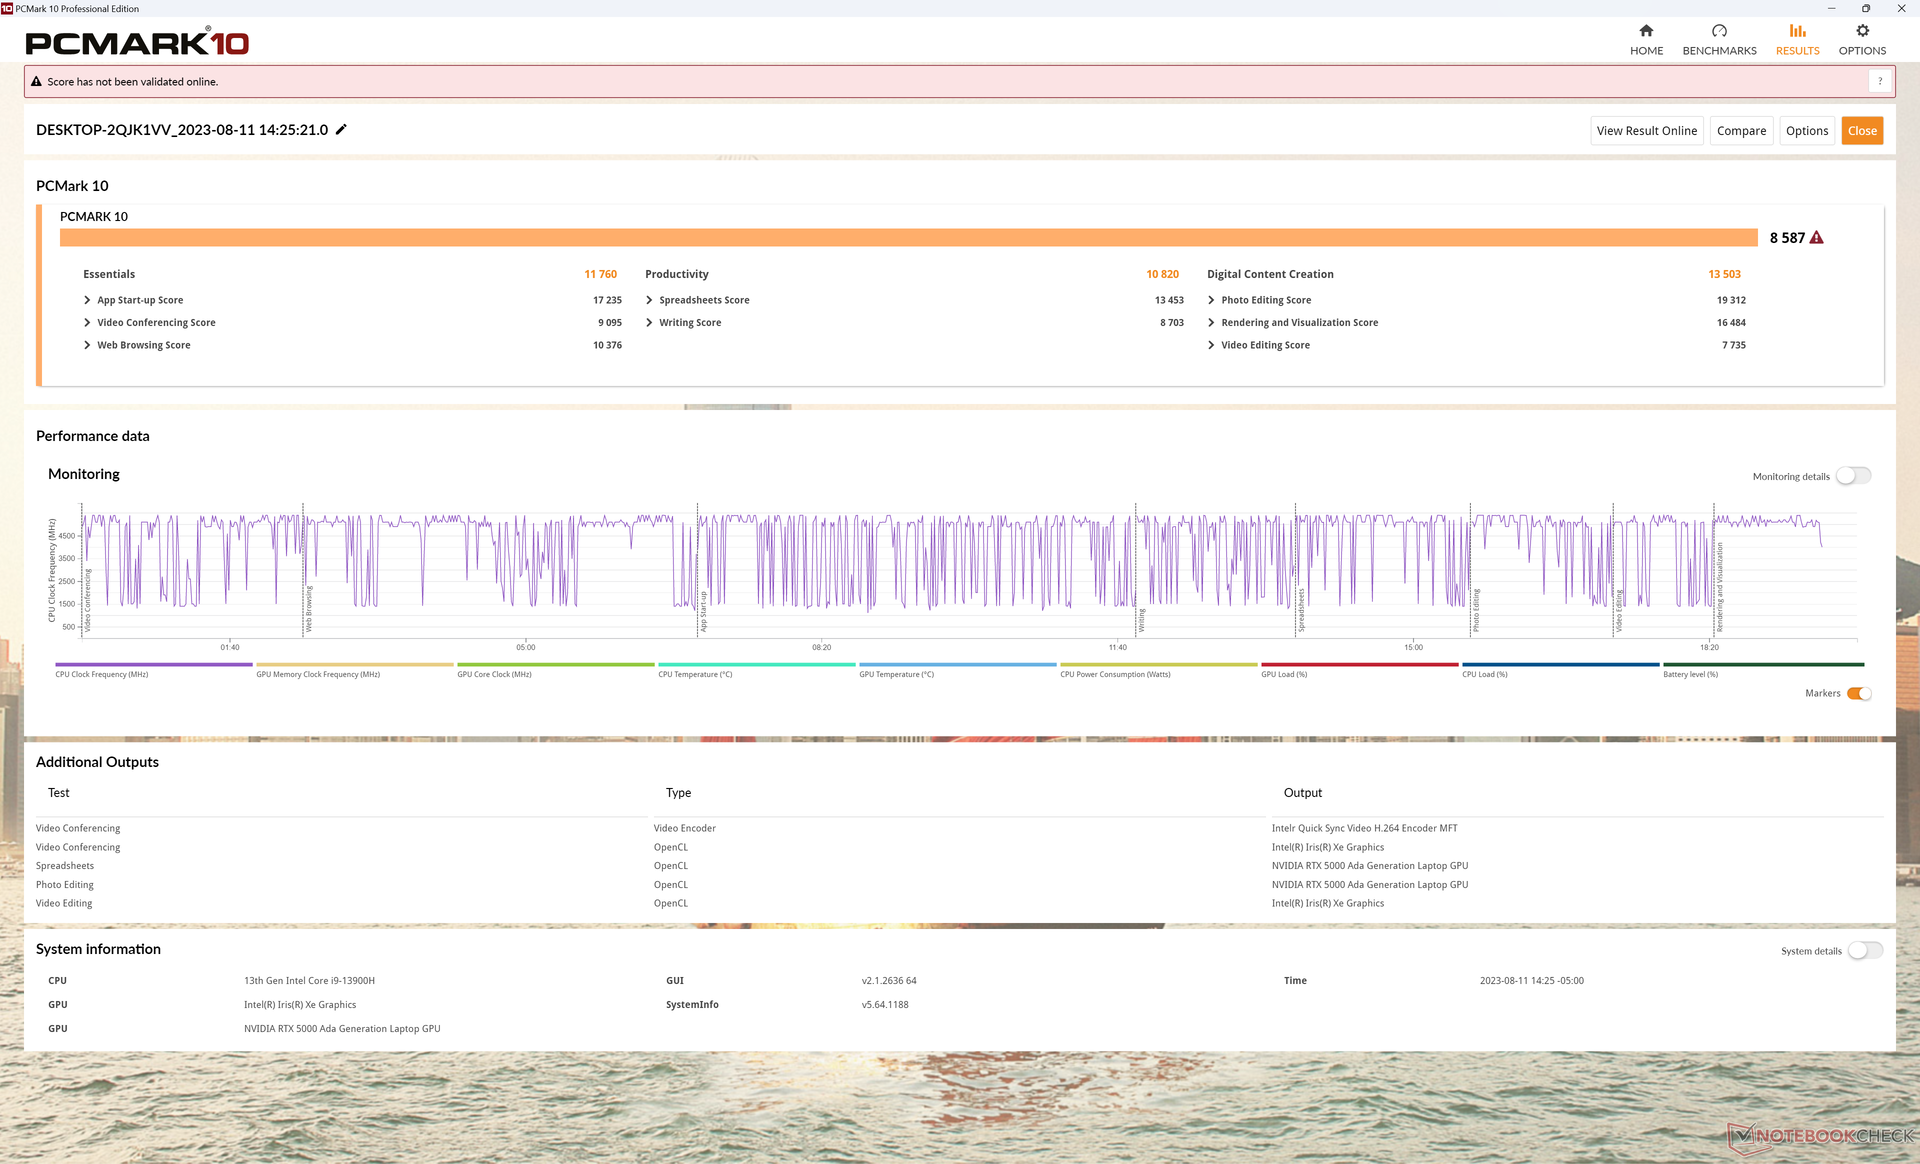
PCMark-resultaten är högre än för de flesta andra arbetsstationer med relativt stora marginaler, även för vissa kraftpaket som HP ZBook Fury 16 G9 ellerPrecision 7670 Prestanda. Detta kan tillskrivas vår RAID 0 SSD-konfiguration och RTX 5000 GPU medan de flesta andra arbetsstationer körs på enkla SSD-enheter och äldre generationens GPU:er.
CrossMark: Overall | Productivity | Creativity | Responsiveness
| PCMark 10 / Score | |
| Dell Precision 5000 5680 | |
| Genomsnitt Intel Core i9-13900H, NVIDIA RTX 5000 Ada Generation Laptop (n=1) | |
| Asus ExpertBook B6 Flip B6602FC2 | |
| Lenovo ThinkPad P16 G1 RTX A5500 | |
| MSI CreatorPro Z16P B12UKST | |
| HP ZBook Fury 16 G9 | |
| Dell Precision 7000 7670 Performance | |
| PCMark 10 / Essentials | |
| Dell Precision 5000 5680 | |
| Genomsnitt Intel Core i9-13900H, NVIDIA RTX 5000 Ada Generation Laptop (n=1) | |
| Dell Precision 7000 7670 Performance | |
| HP ZBook Fury 16 G9 | |
| Lenovo ThinkPad P16 G1 RTX A5500 | |
| Asus ExpertBook B6 Flip B6602FC2 | |
| MSI CreatorPro Z16P B12UKST | |
| PCMark 10 / Productivity | |
| Dell Precision 5000 5680 | |
| Genomsnitt Intel Core i9-13900H, NVIDIA RTX 5000 Ada Generation Laptop (n=1) | |
| Asus ExpertBook B6 Flip B6602FC2 | |
| Lenovo ThinkPad P16 G1 RTX A5500 | |
| MSI CreatorPro Z16P B12UKST | |
| HP ZBook Fury 16 G9 | |
| Dell Precision 7000 7670 Performance | |
| PCMark 10 / Digital Content Creation | |
| Dell Precision 5000 5680 | |
| Genomsnitt Intel Core i9-13900H, NVIDIA RTX 5000 Ada Generation Laptop (n=1) | |
| Lenovo ThinkPad P16 G1 RTX A5500 | |
| MSI CreatorPro Z16P B12UKST | |
| Dell Precision 7000 7670 Performance | |
| HP ZBook Fury 16 G9 | |
| Asus ExpertBook B6 Flip B6602FC2 | |
| CrossMark / Overall | |
| Asus ExpertBook B6 Flip B6602FC2 | |
| MSI CreatorPro Z16P B12UKST | |
| Dell Precision 5000 5680 | |
| Genomsnitt Intel Core i9-13900H, NVIDIA RTX 5000 Ada Generation Laptop (n=1) | |
| HP ZBook Fury 16 G9 | |
| Lenovo ThinkPad P16 G1 RTX A5500 | |
| Dell Precision 7000 7670 Performance | |
| CrossMark / Productivity | |
| Asus ExpertBook B6 Flip B6602FC2 | |
| MSI CreatorPro Z16P B12UKST | |
| Dell Precision 5000 5680 | |
| Genomsnitt Intel Core i9-13900H, NVIDIA RTX 5000 Ada Generation Laptop (n=1) | |
| HP ZBook Fury 16 G9 | |
| Lenovo ThinkPad P16 G1 RTX A5500 | |
| Dell Precision 7000 7670 Performance | |
| CrossMark / Creativity | |
| Lenovo ThinkPad P16 G1 RTX A5500 | |
| Dell Precision 5000 5680 | |
| Genomsnitt Intel Core i9-13900H, NVIDIA RTX 5000 Ada Generation Laptop (n=1) | |
| Asus ExpertBook B6 Flip B6602FC2 | |
| HP ZBook Fury 16 G9 | |
| MSI CreatorPro Z16P B12UKST | |
| Dell Precision 7000 7670 Performance | |
| CrossMark / Responsiveness | |
| MSI CreatorPro Z16P B12UKST | |
| Asus ExpertBook B6 Flip B6602FC2 | |
| HP ZBook Fury 16 G9 | |
| Dell Precision 5000 5680 | |
| Genomsnitt Intel Core i9-13900H, NVIDIA RTX 5000 Ada Generation Laptop (n=1) | |
| Dell Precision 7000 7670 Performance | |
| Lenovo ThinkPad P16 G1 RTX A5500 | |
| PCMark 10 Score | 8587 poäng | |
Hjälp | ||
| AIDA64 / Memory Copy | |
| Dell Precision 5000 5680 | |
| Dell Precision 7000 7670 Performance | |
| Lenovo ThinkPad P16 G1 RTX A5500 | |
| MSI CreatorPro Z16P B12UKST | |
| Genomsnitt Intel Core i9-13900H (37448 - 74486, n=25) | |
| HP ZBook Fury 16 G9 | |
| Asus ExpertBook B6 Flip B6602FC2 | |
| AIDA64 / Memory Read | |
| Dell Precision 7000 7670 Performance | |
| Dell Precision 5000 5680 | |
| MSI CreatorPro Z16P B12UKST | |
| Lenovo ThinkPad P16 G1 RTX A5500 | |
| Genomsnitt Intel Core i9-13900H (41599 - 75433, n=25) | |
| Asus ExpertBook B6 Flip B6602FC2 | |
| HP ZBook Fury 16 G9 | |
| AIDA64 / Memory Write | |
| Dell Precision 5000 5680 | |
| MSI CreatorPro Z16P B12UKST | |
| Dell Precision 7000 7670 Performance | |
| Genomsnitt Intel Core i9-13900H (36152 - 88505, n=25) | |
| Lenovo ThinkPad P16 G1 RTX A5500 | |
| Asus ExpertBook B6 Flip B6602FC2 | |
| HP ZBook Fury 16 G9 | |
| AIDA64 / Memory Latency | |
| MSI CreatorPro Z16P B12UKST | |
| Asus ExpertBook B6 Flip B6602FC2 | |
| Dell Precision 5000 5680 | |
| HP ZBook Fury 16 G9 | |
| Lenovo ThinkPad P16 G1 RTX A5500 | |
| Genomsnitt Intel Core i9-13900H (75.8 - 102.3, n=25) | |
| Dell Precision 7000 7670 Performance | |
* ... mindre är bättre
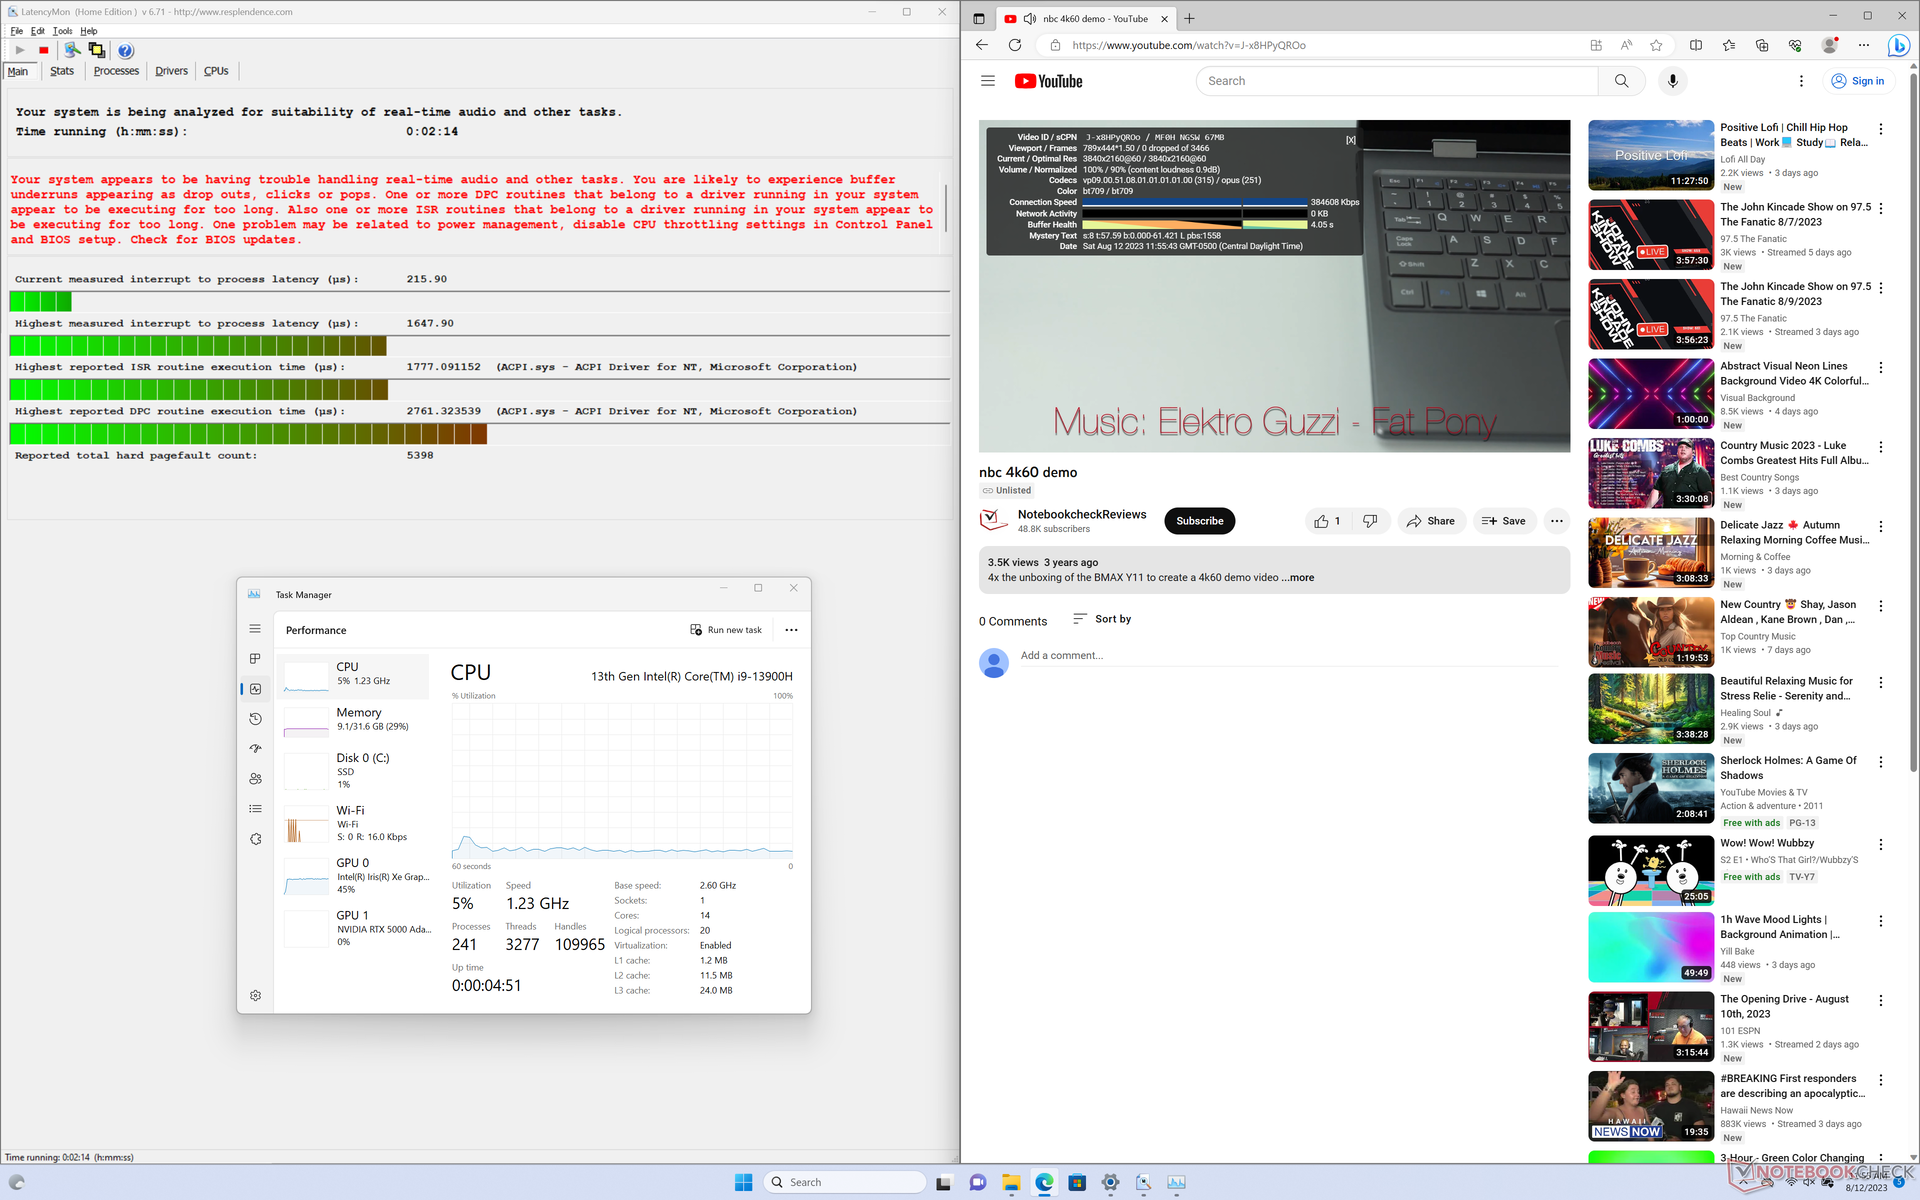
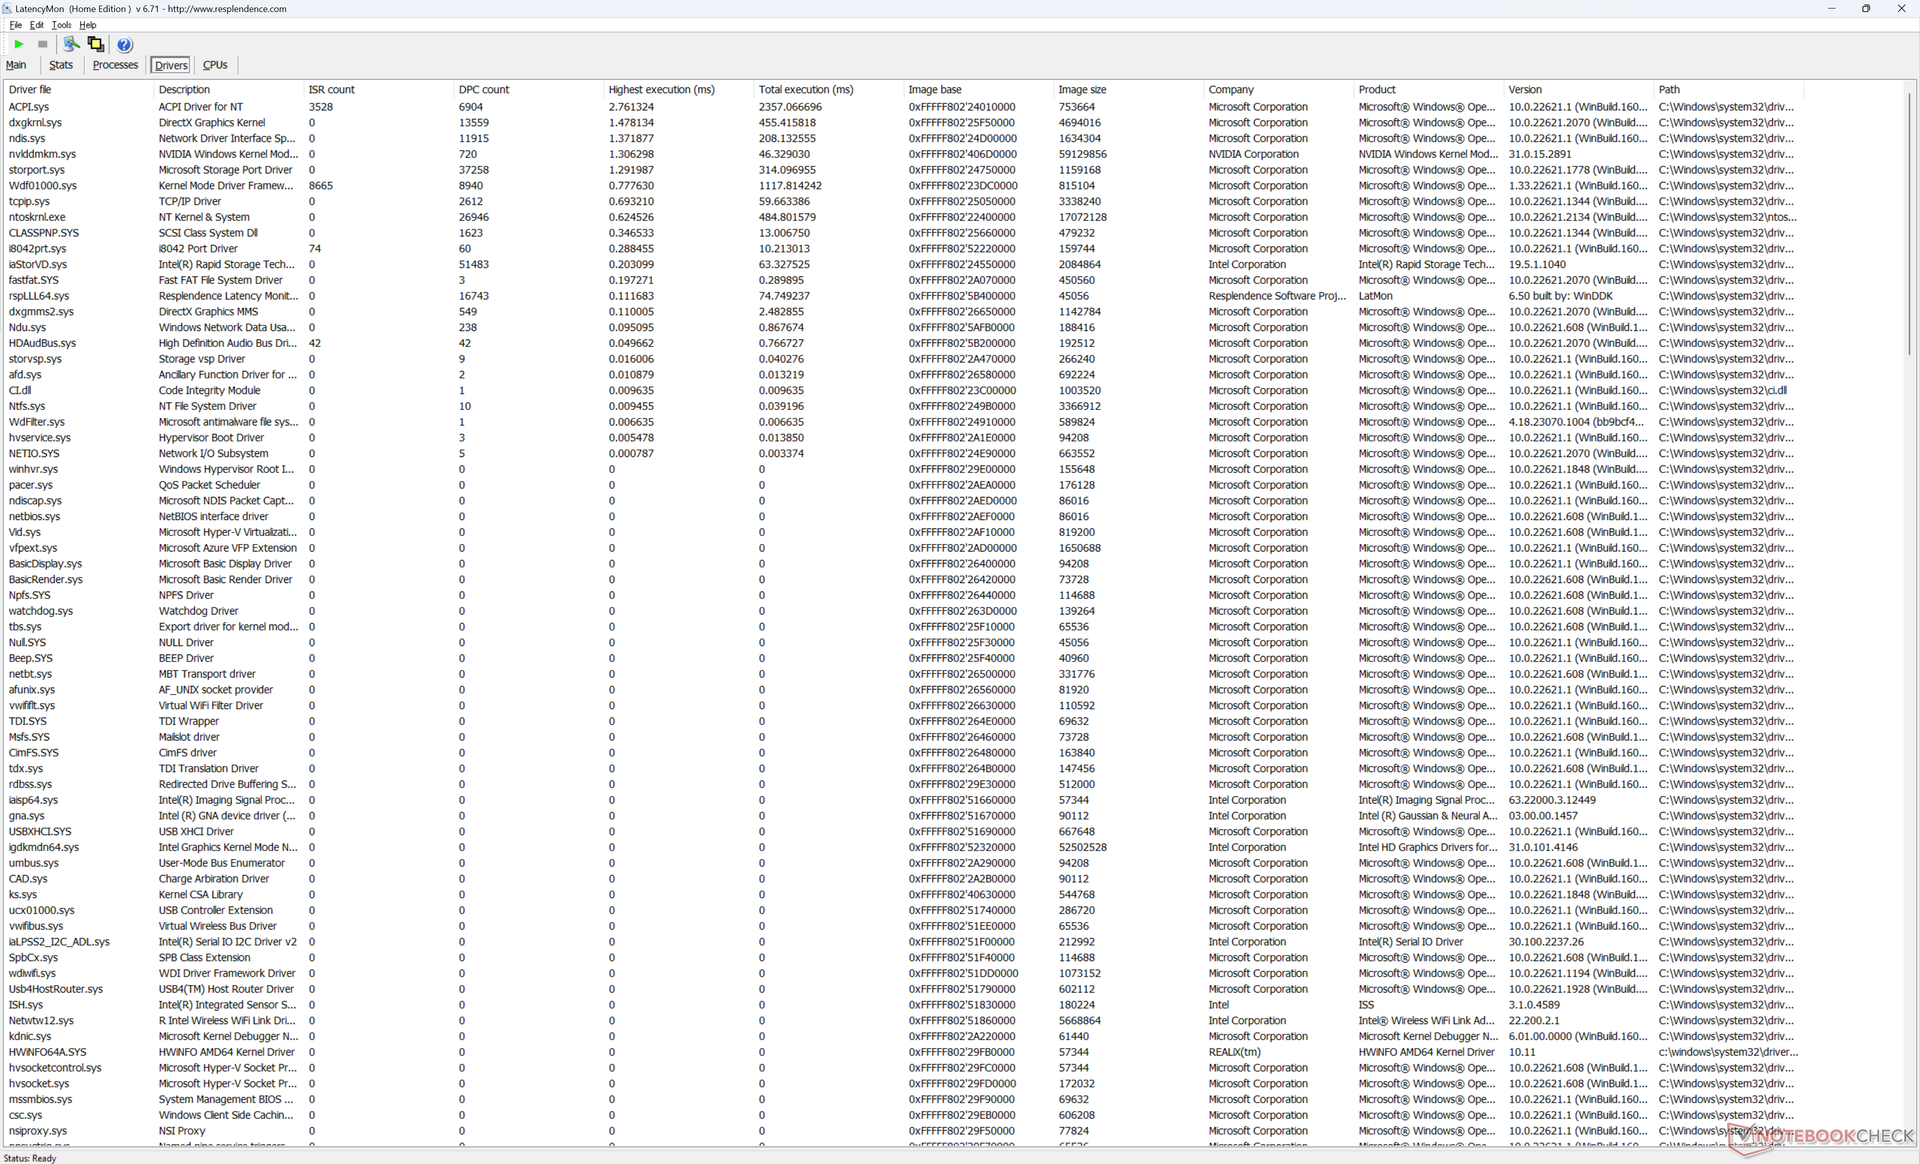
DPC-fördröjning
LatencyMon avslöjar små DPC-problem när vi öppnar flera webbläsarflikar på vår hemsida, liknande det vi observerade på Precision 7670. uppspelning av 4K-video vid 60 FPS är annars perfekt och inga tappade bildrutor har registrerats.
| DPC Latencies / LatencyMon - interrupt to process latency (max), Web, Youtube, Prime95 | |
| HP ZBook Fury 16 G9 | |
| Asus ExpertBook B6 Flip B6602FC2 | |
| Dell Precision 7000 7670 Performance | |
| Dell Precision 5000 5680 | |
| Lenovo ThinkPad P16 G1 RTX A5500 | |
| MSI CreatorPro Z16P B12UKST | |
* ... mindre är bättre
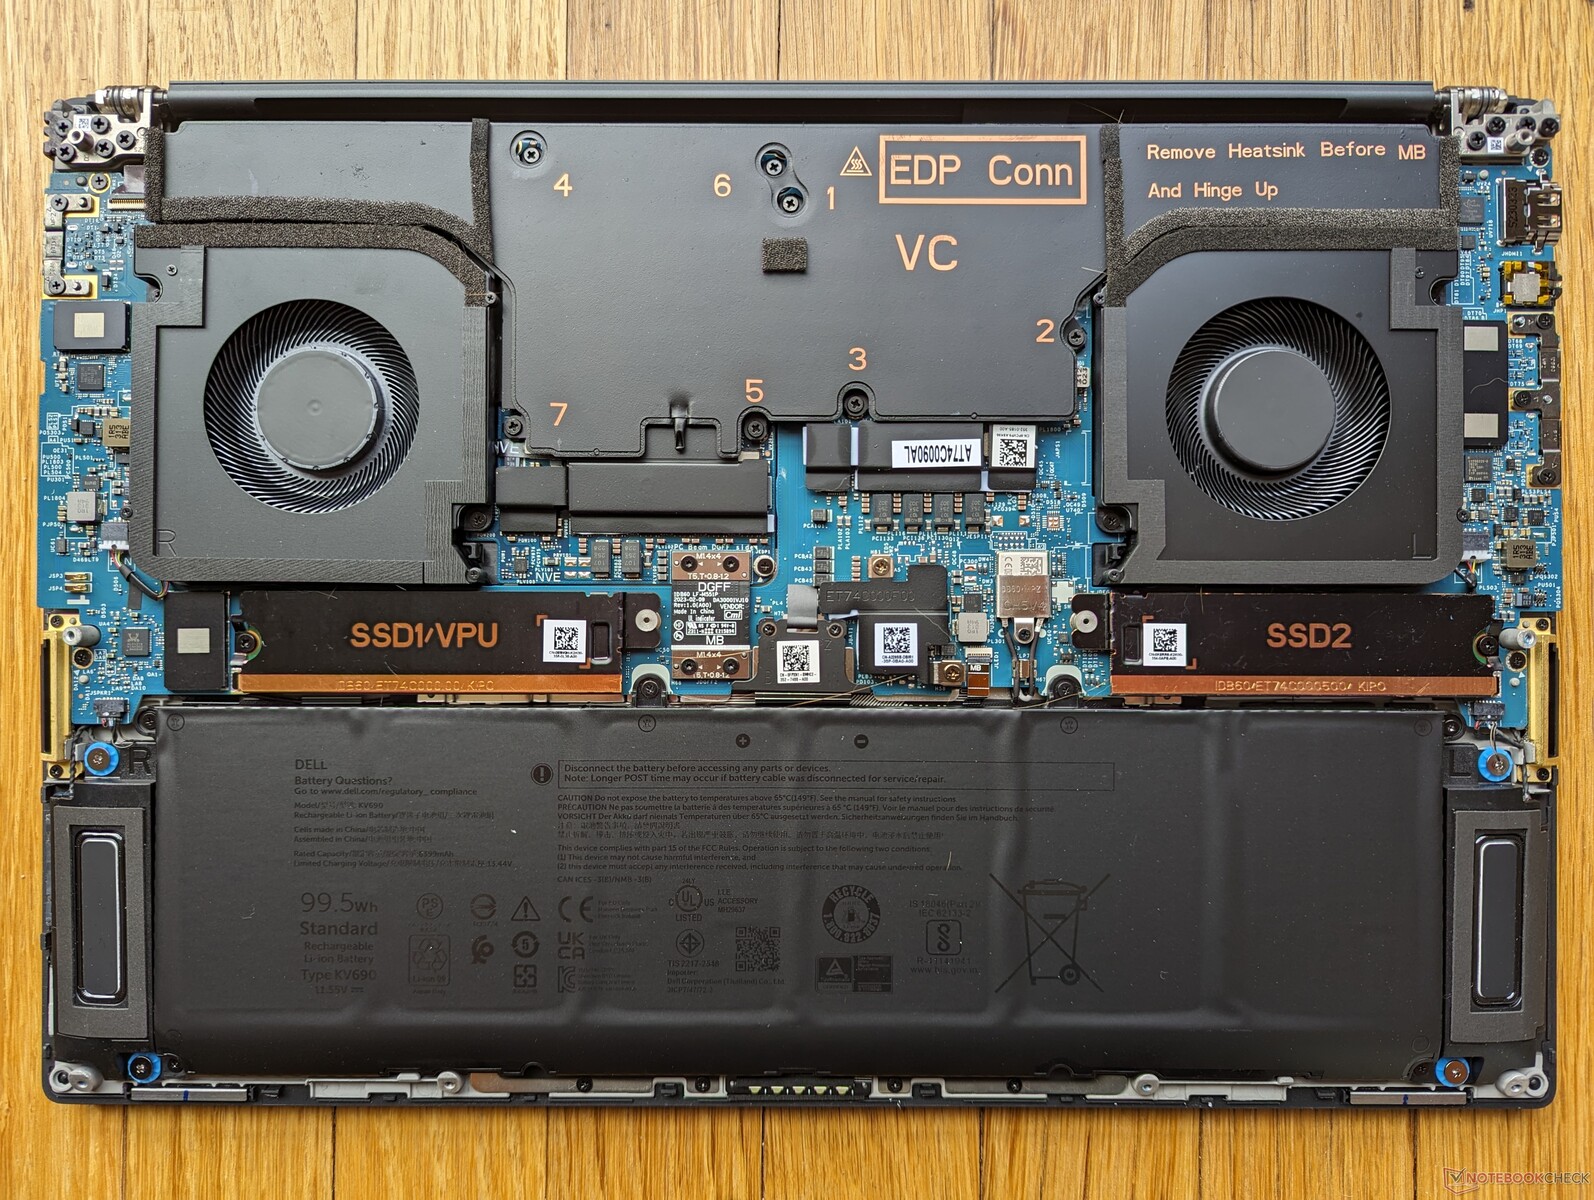
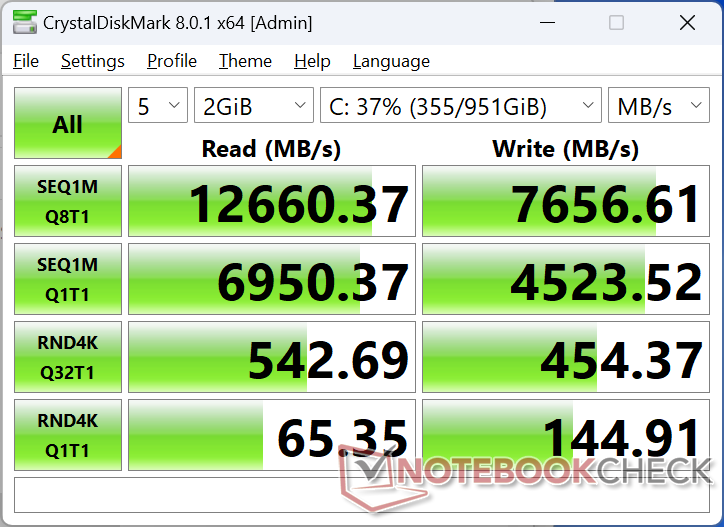
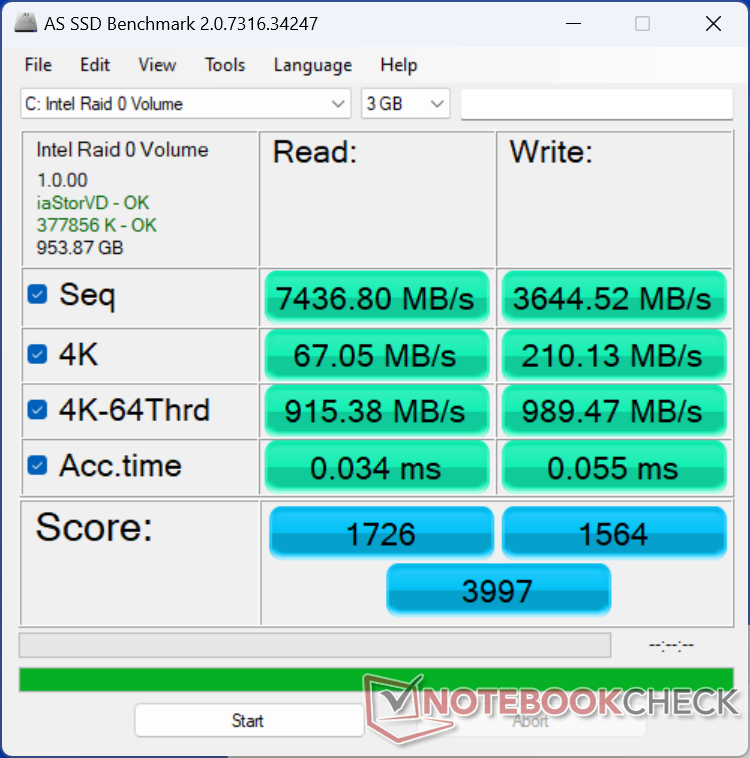
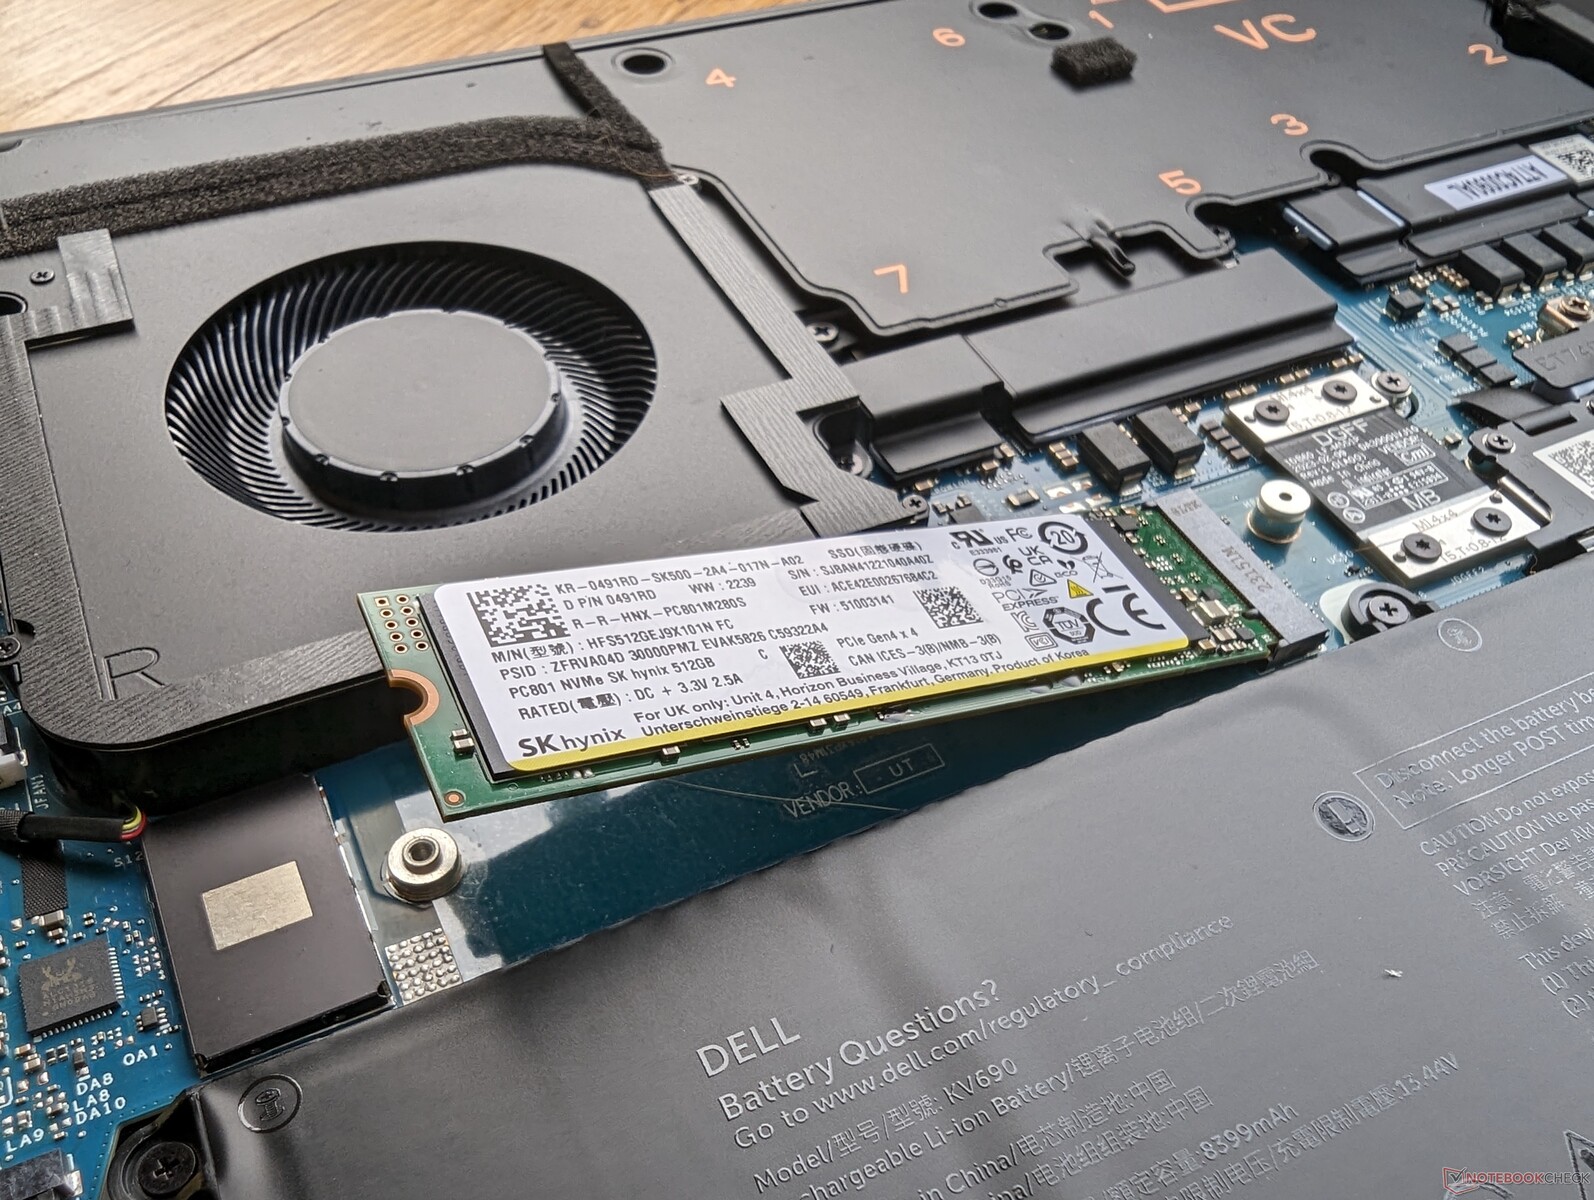
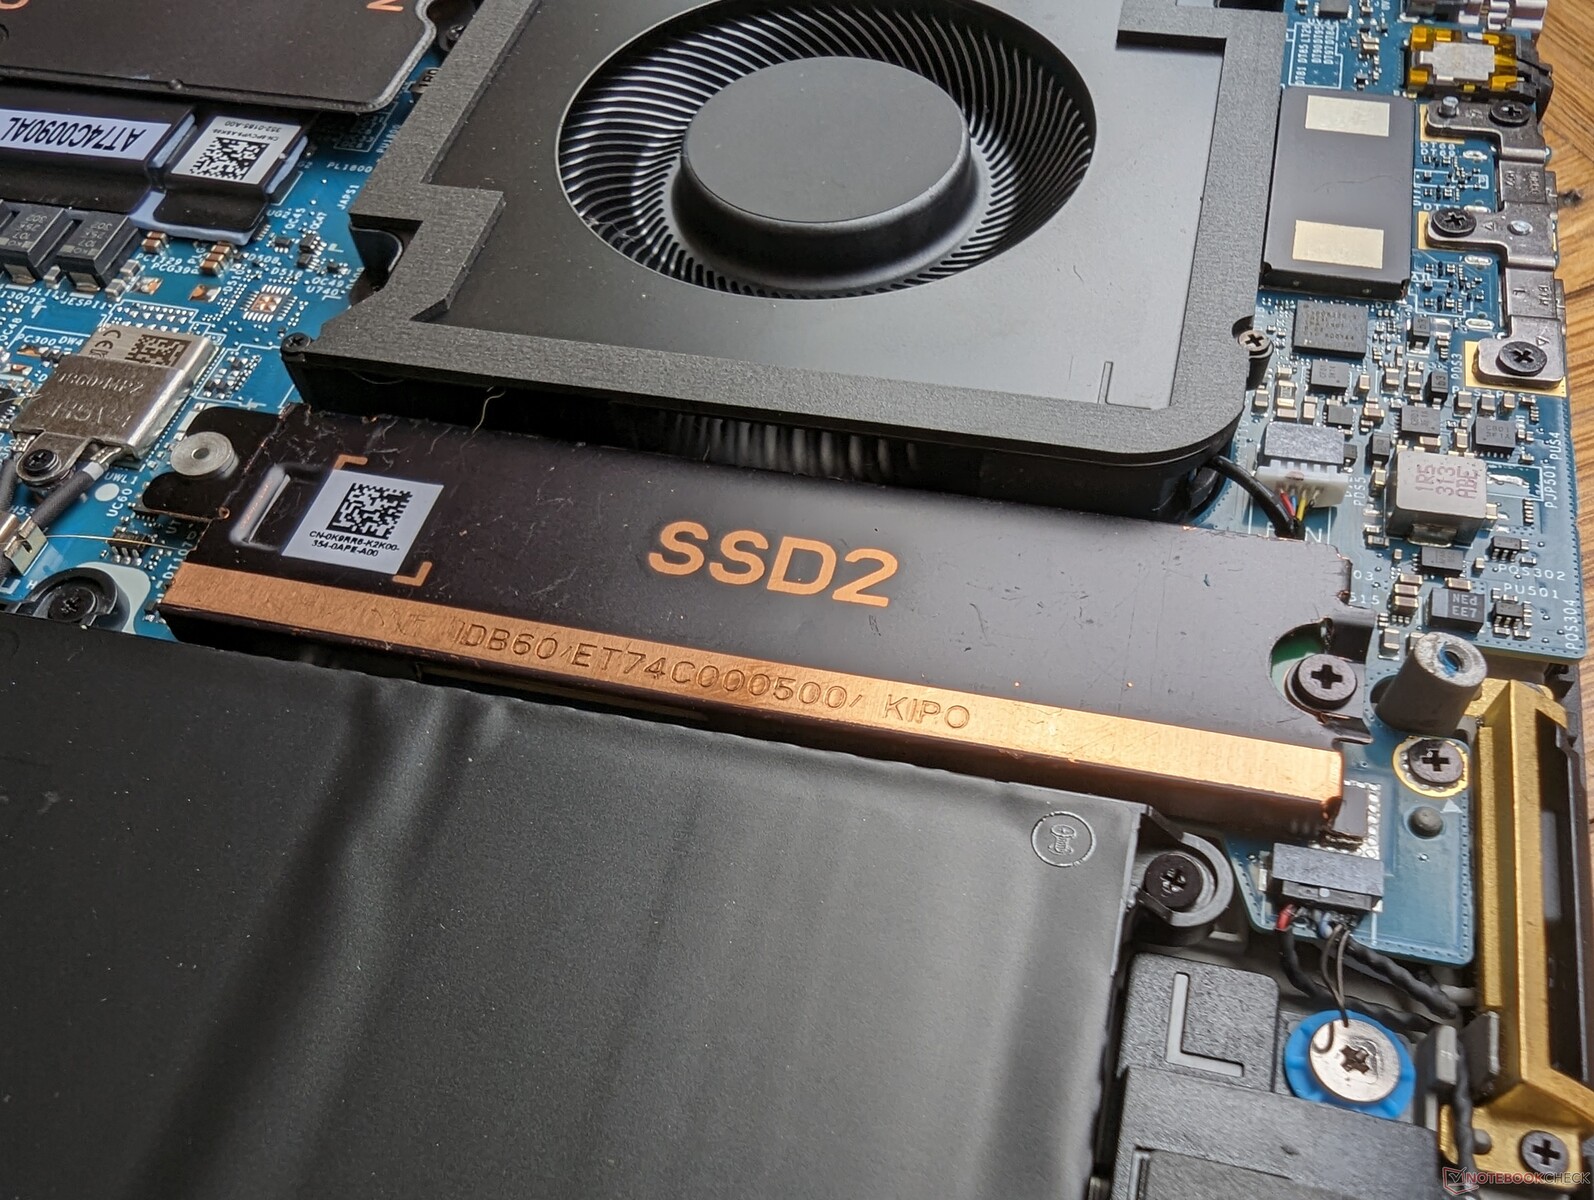
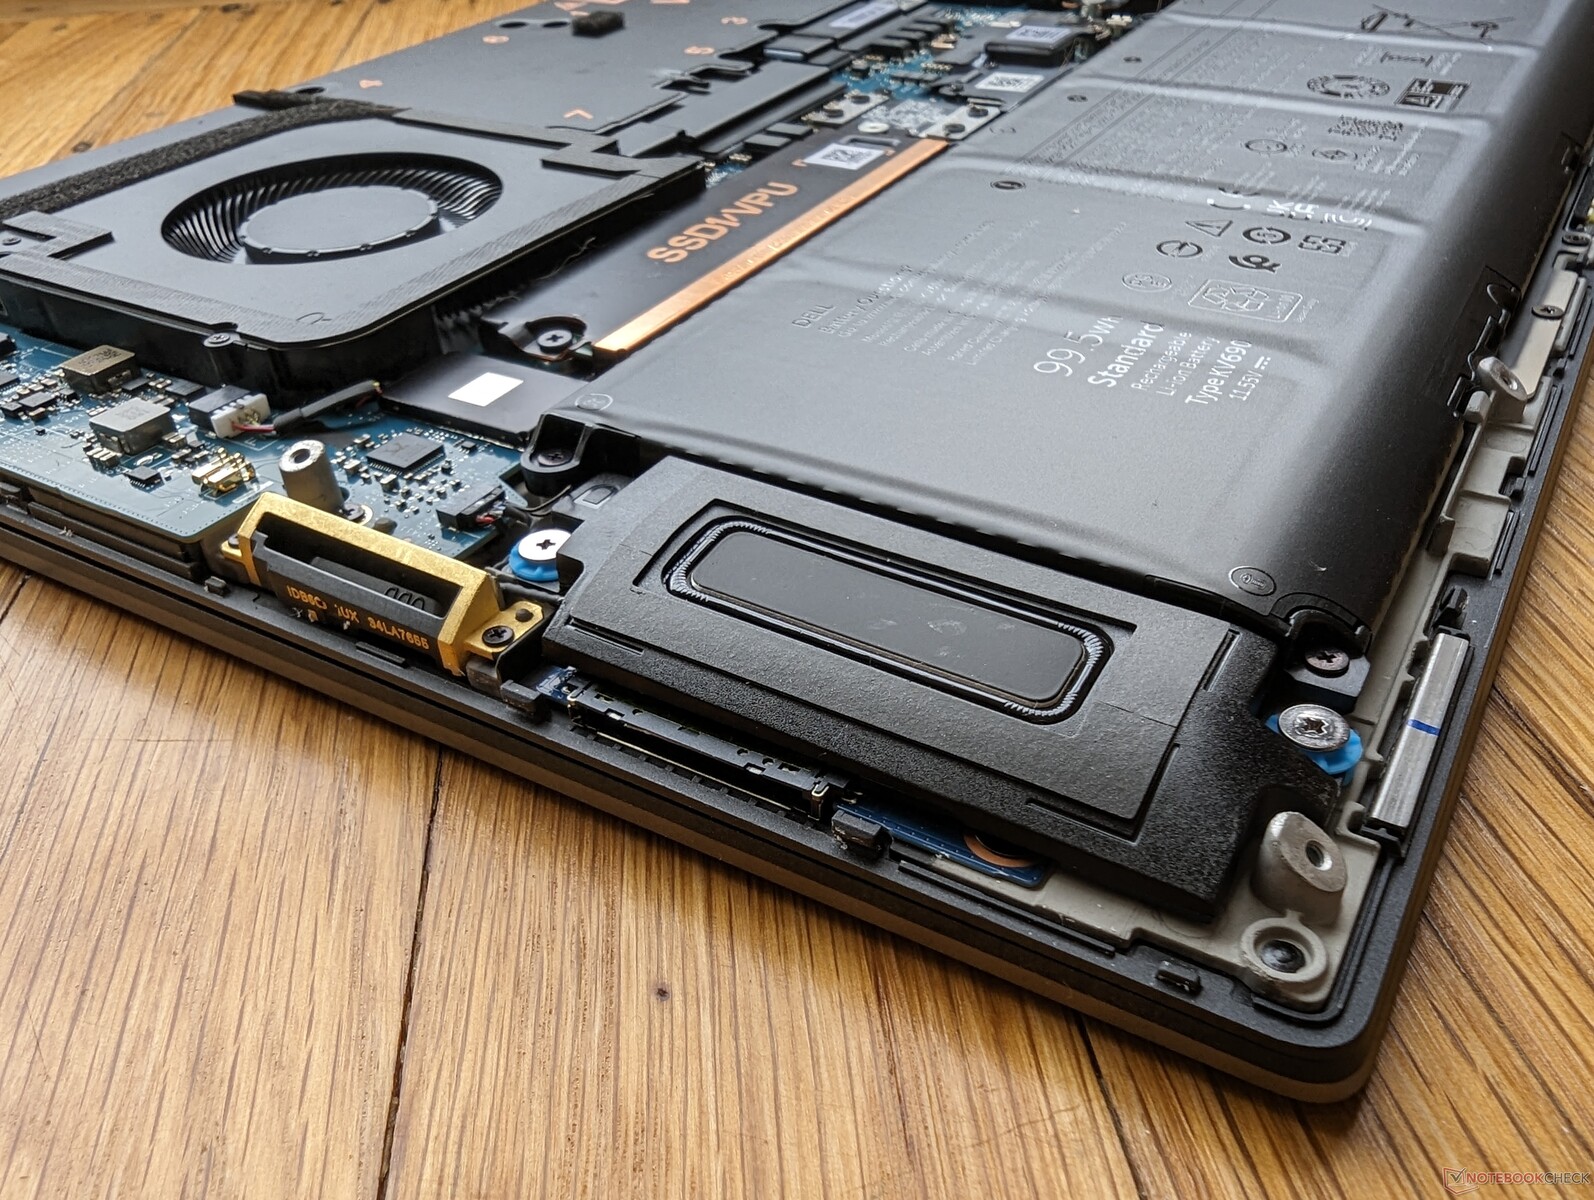
Lagringsenheter - Upp till två PCIe4 x4 NVMe SSD-enheter
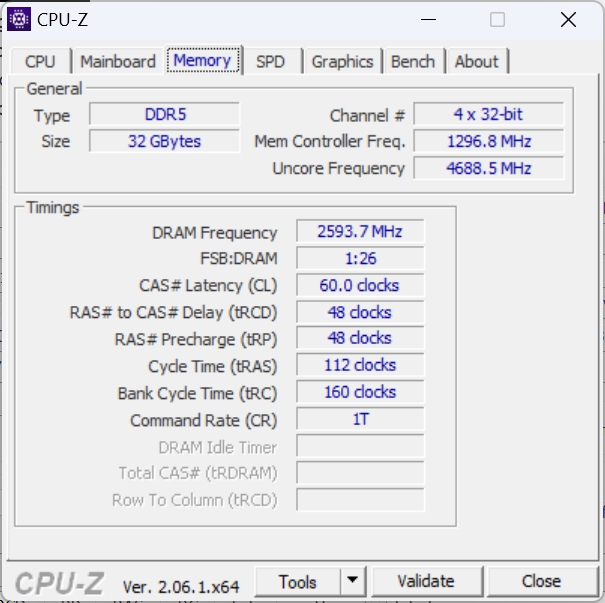
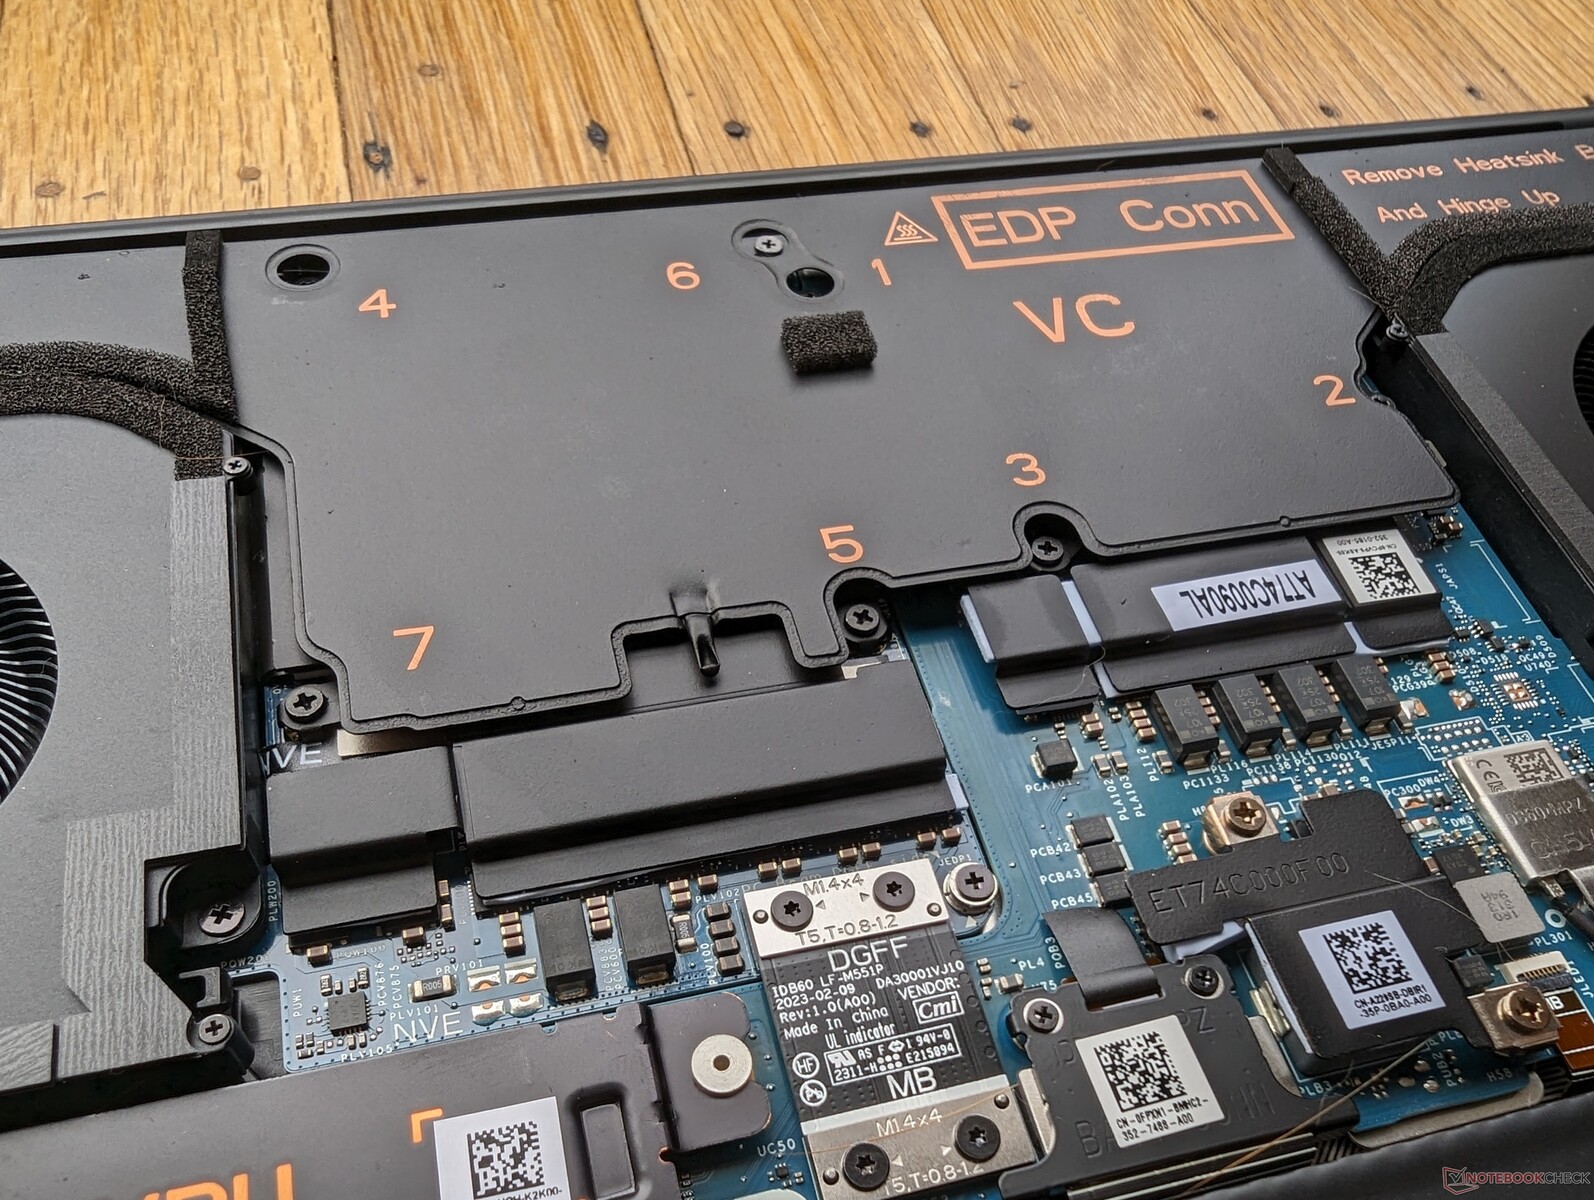
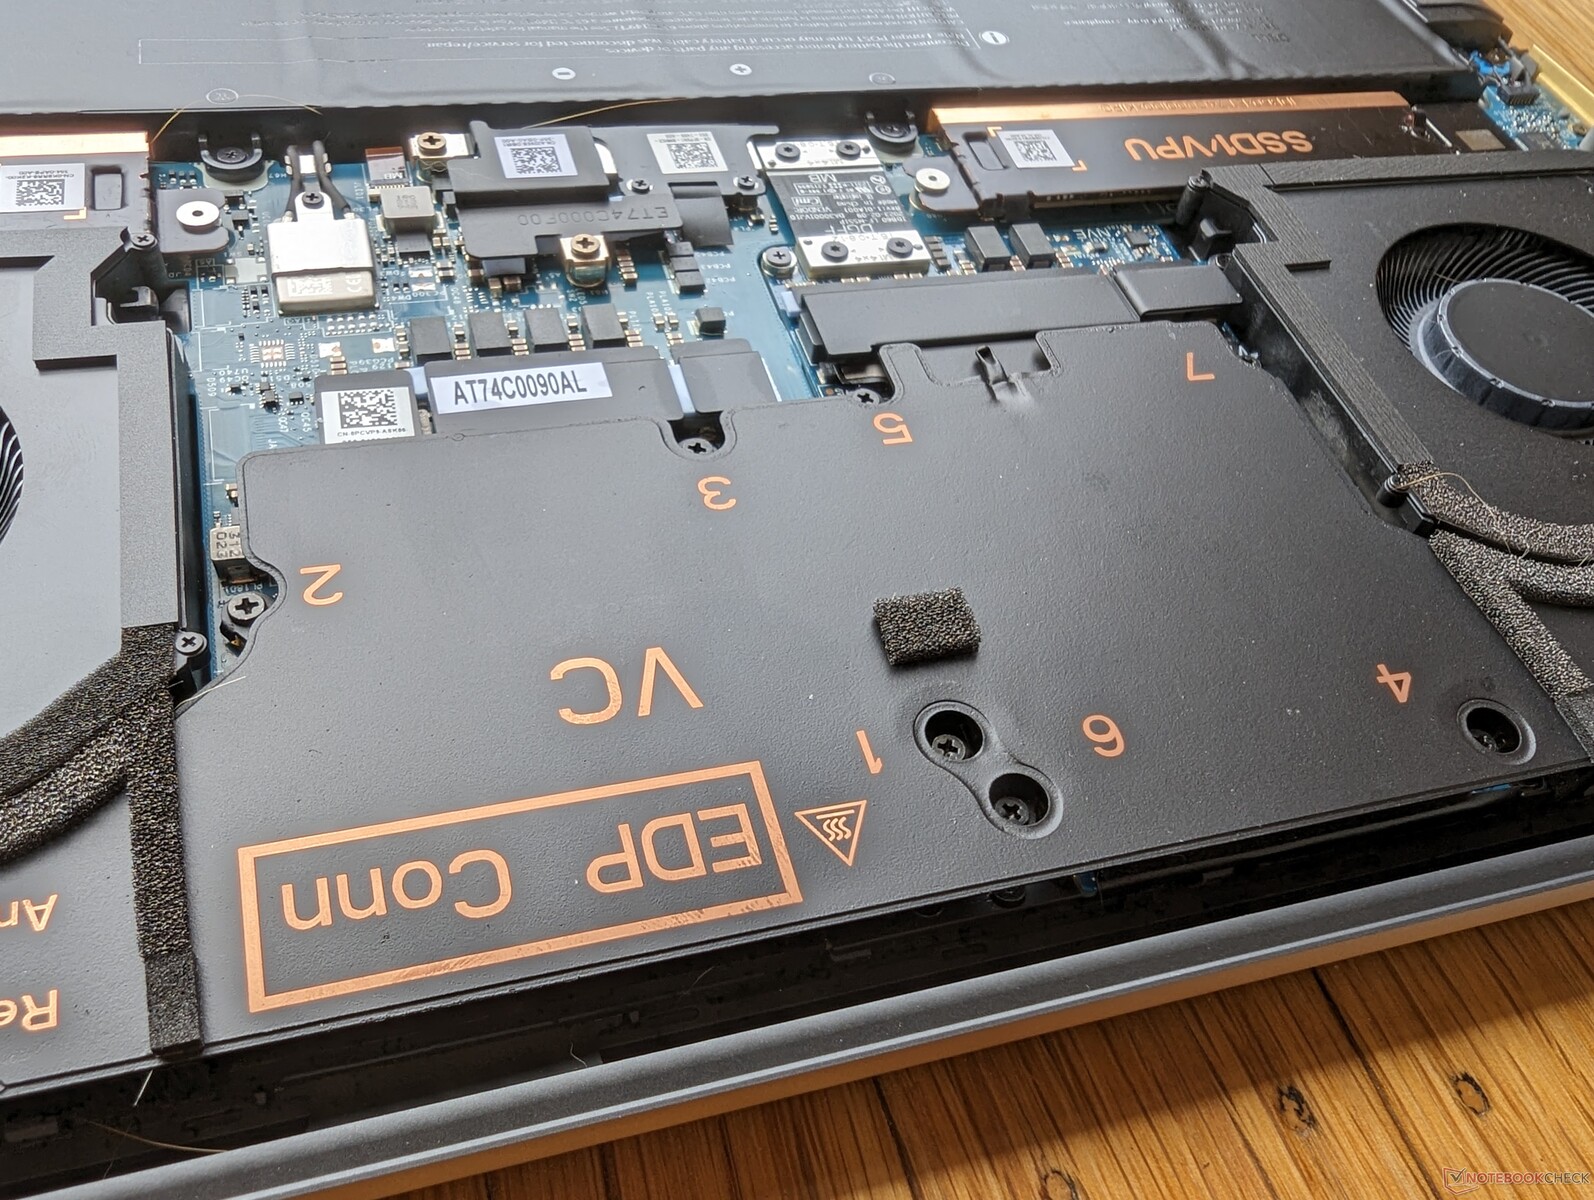
Vår testenhet levereras med samma SK hynix PC801 PCIe4 x4 NVMe SSD-enheter i RAID 0-konfiguration som finns på Precision 7670-serien. Medan PCIe5-stöd som i vissa bärbara speldatorer skulle ha varit trevligt att se, är det inte en viktig funktion för tillfället med tanke på hur sällsynta PCIe5 SSD-enheter fortfarande är. Dell erbjuder självkrypterande SSD-alternativ för ytterligare säkerhet.
Varje M.2 SSD-kortplats levereras med en kopparvärmespridare som visas nedan för att hjälpa till med kylningen. Varje enhet i vår enhet skulle inte ha några problem med att upprätthålla höga överföringshastigheter på ~5400 MB/s under långa perioder för att inte visa några större problem med strypning.

* ... mindre är bättre
Disk Throttling: DiskSpd Read Loop, Queue Depth 8
GPU-prestanda - 70 W Nvidia Ada Lovelace
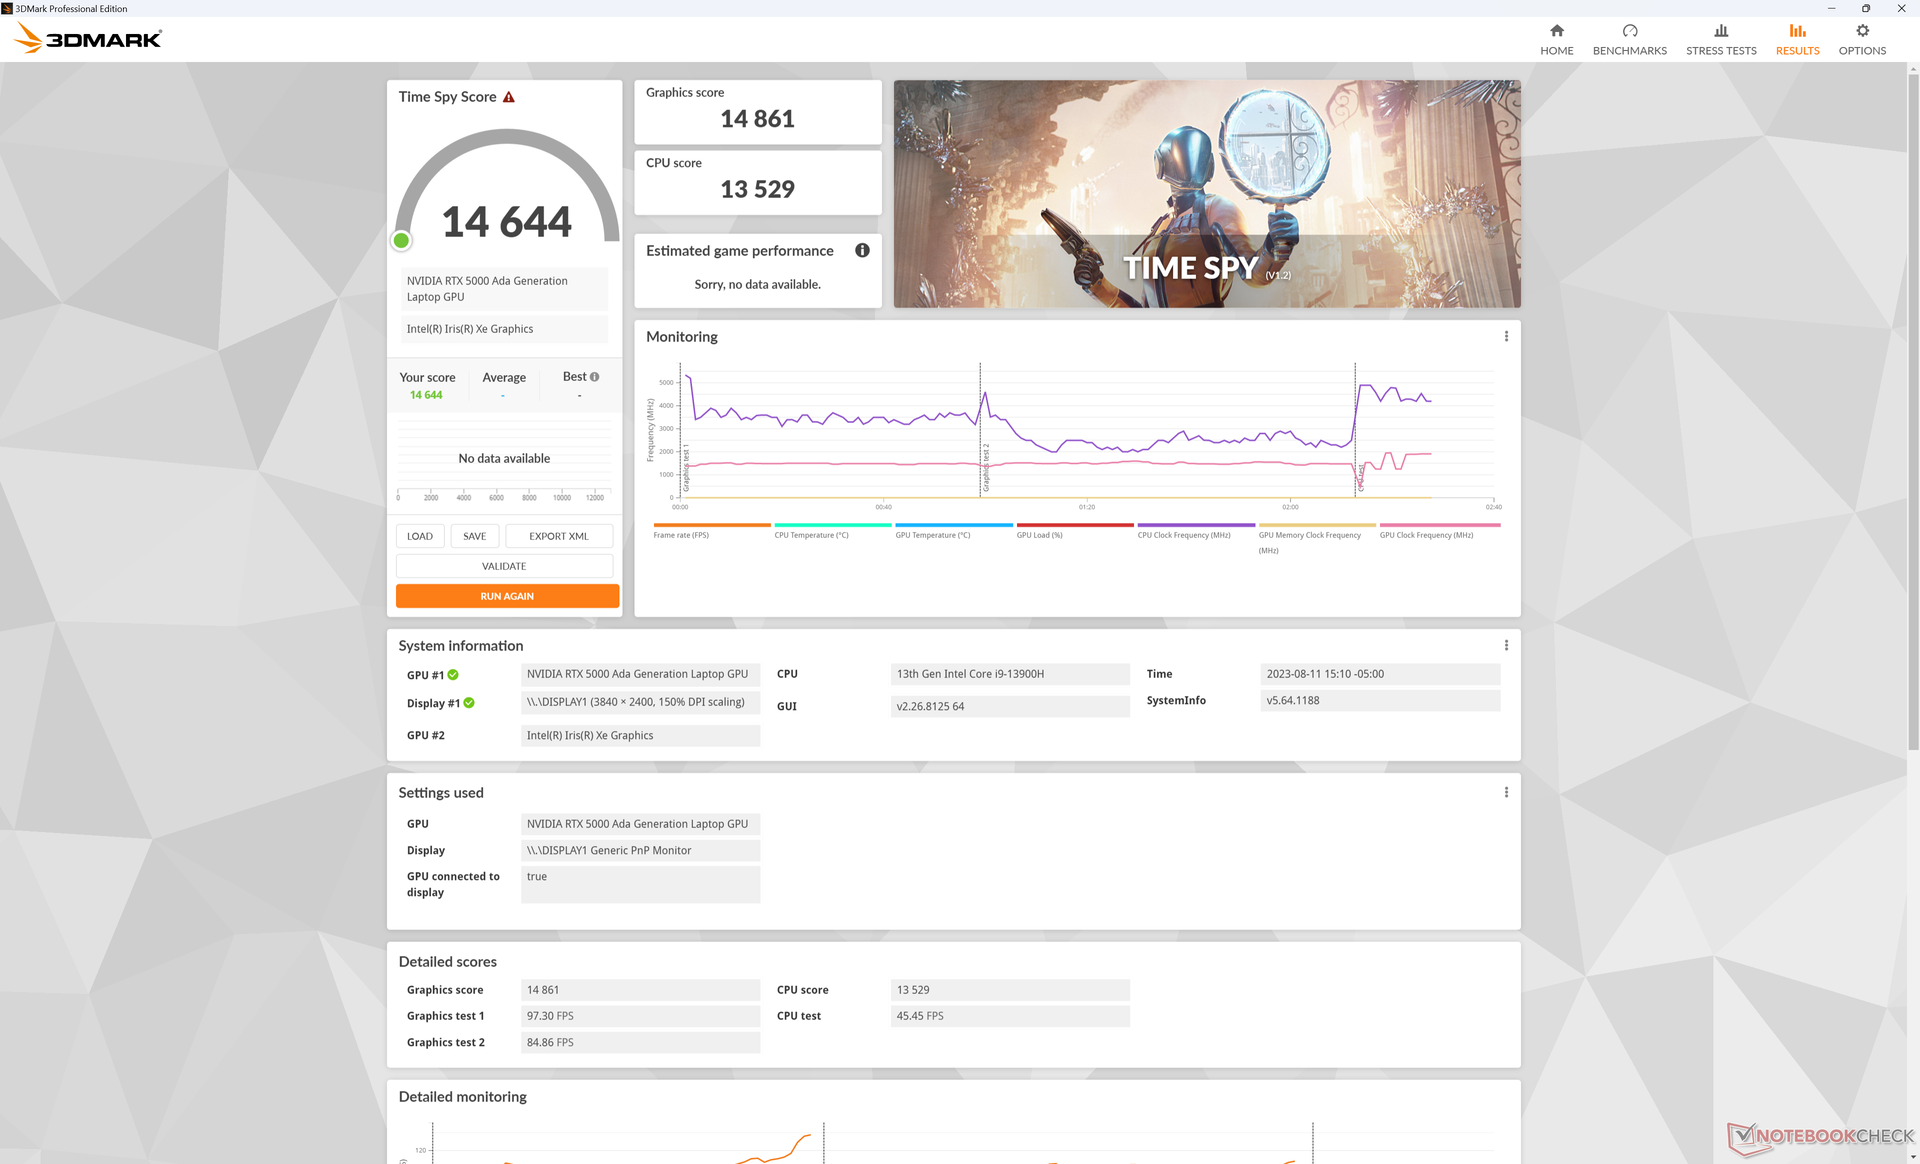
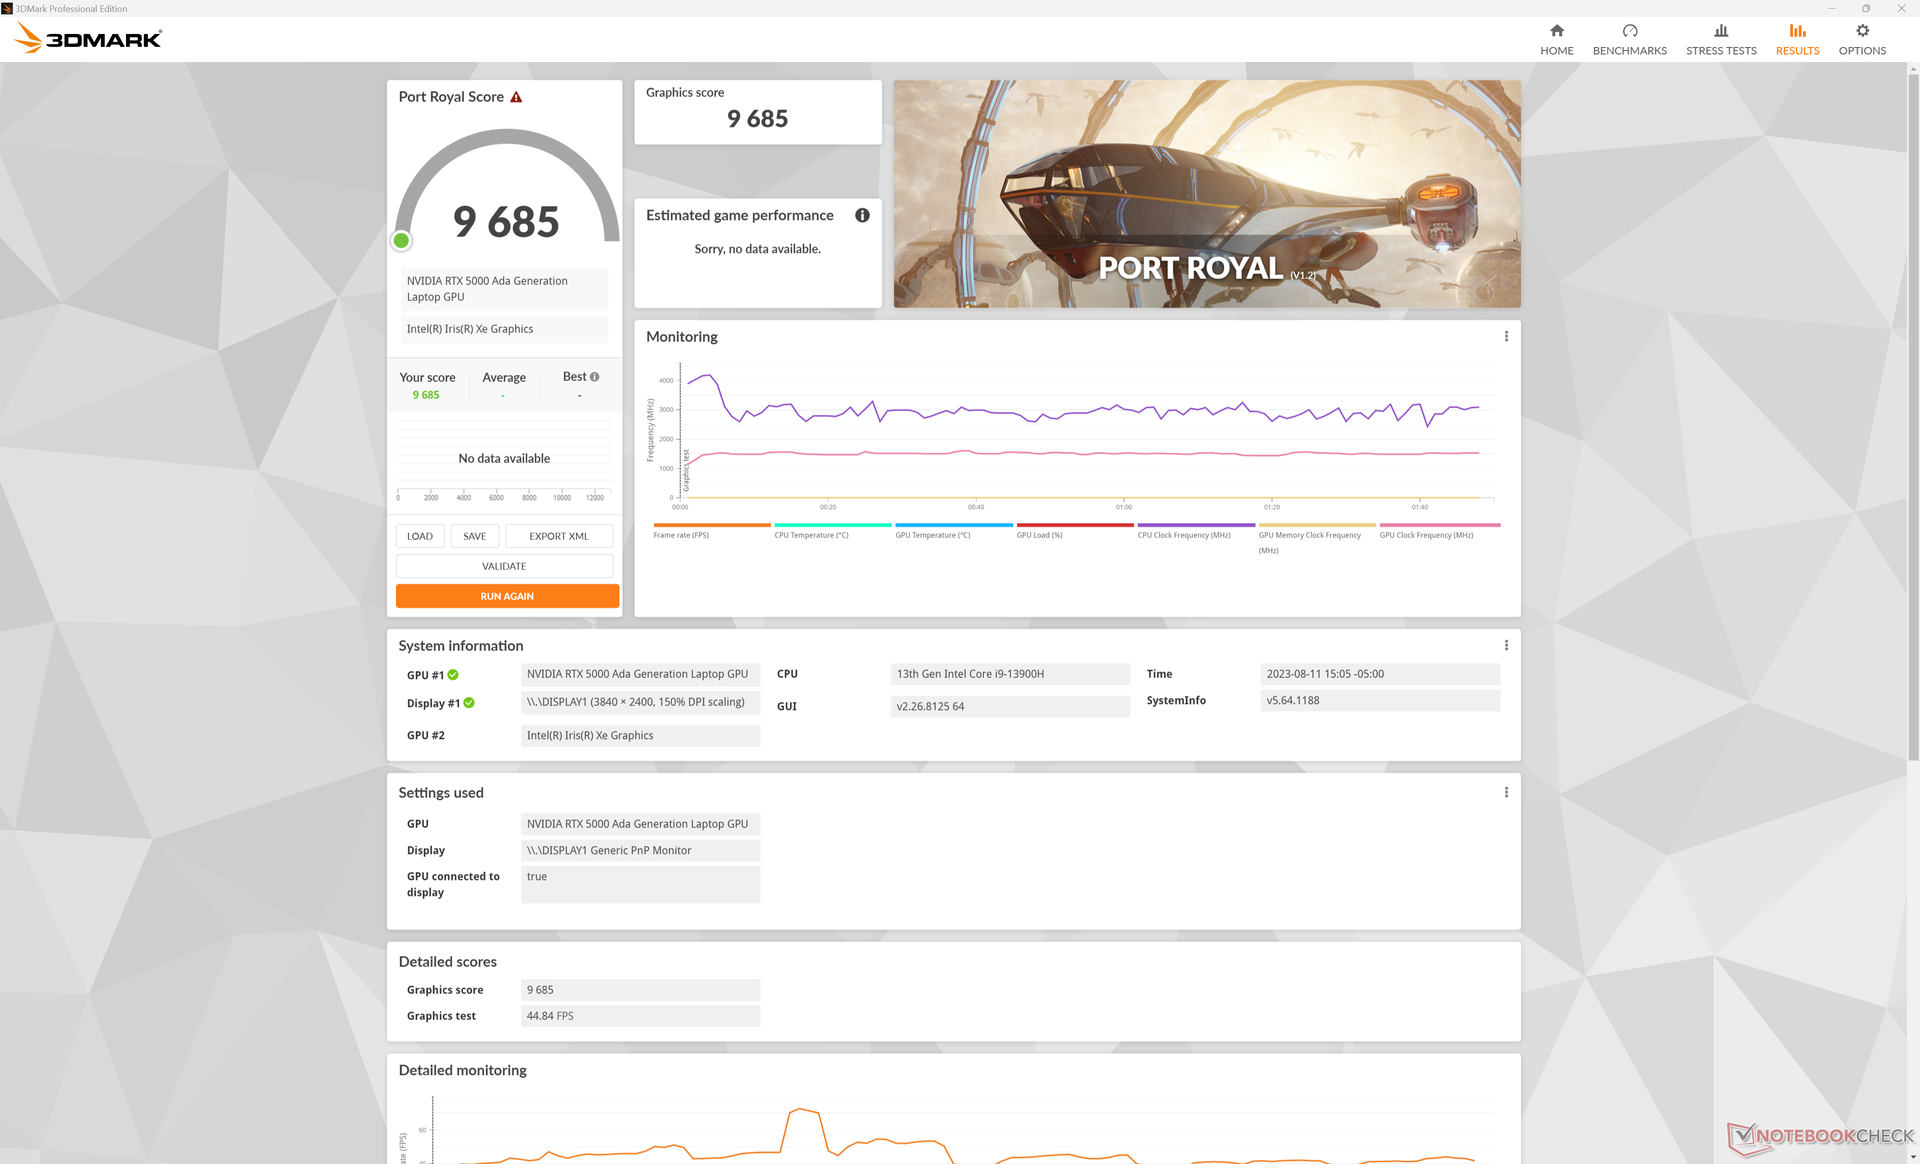
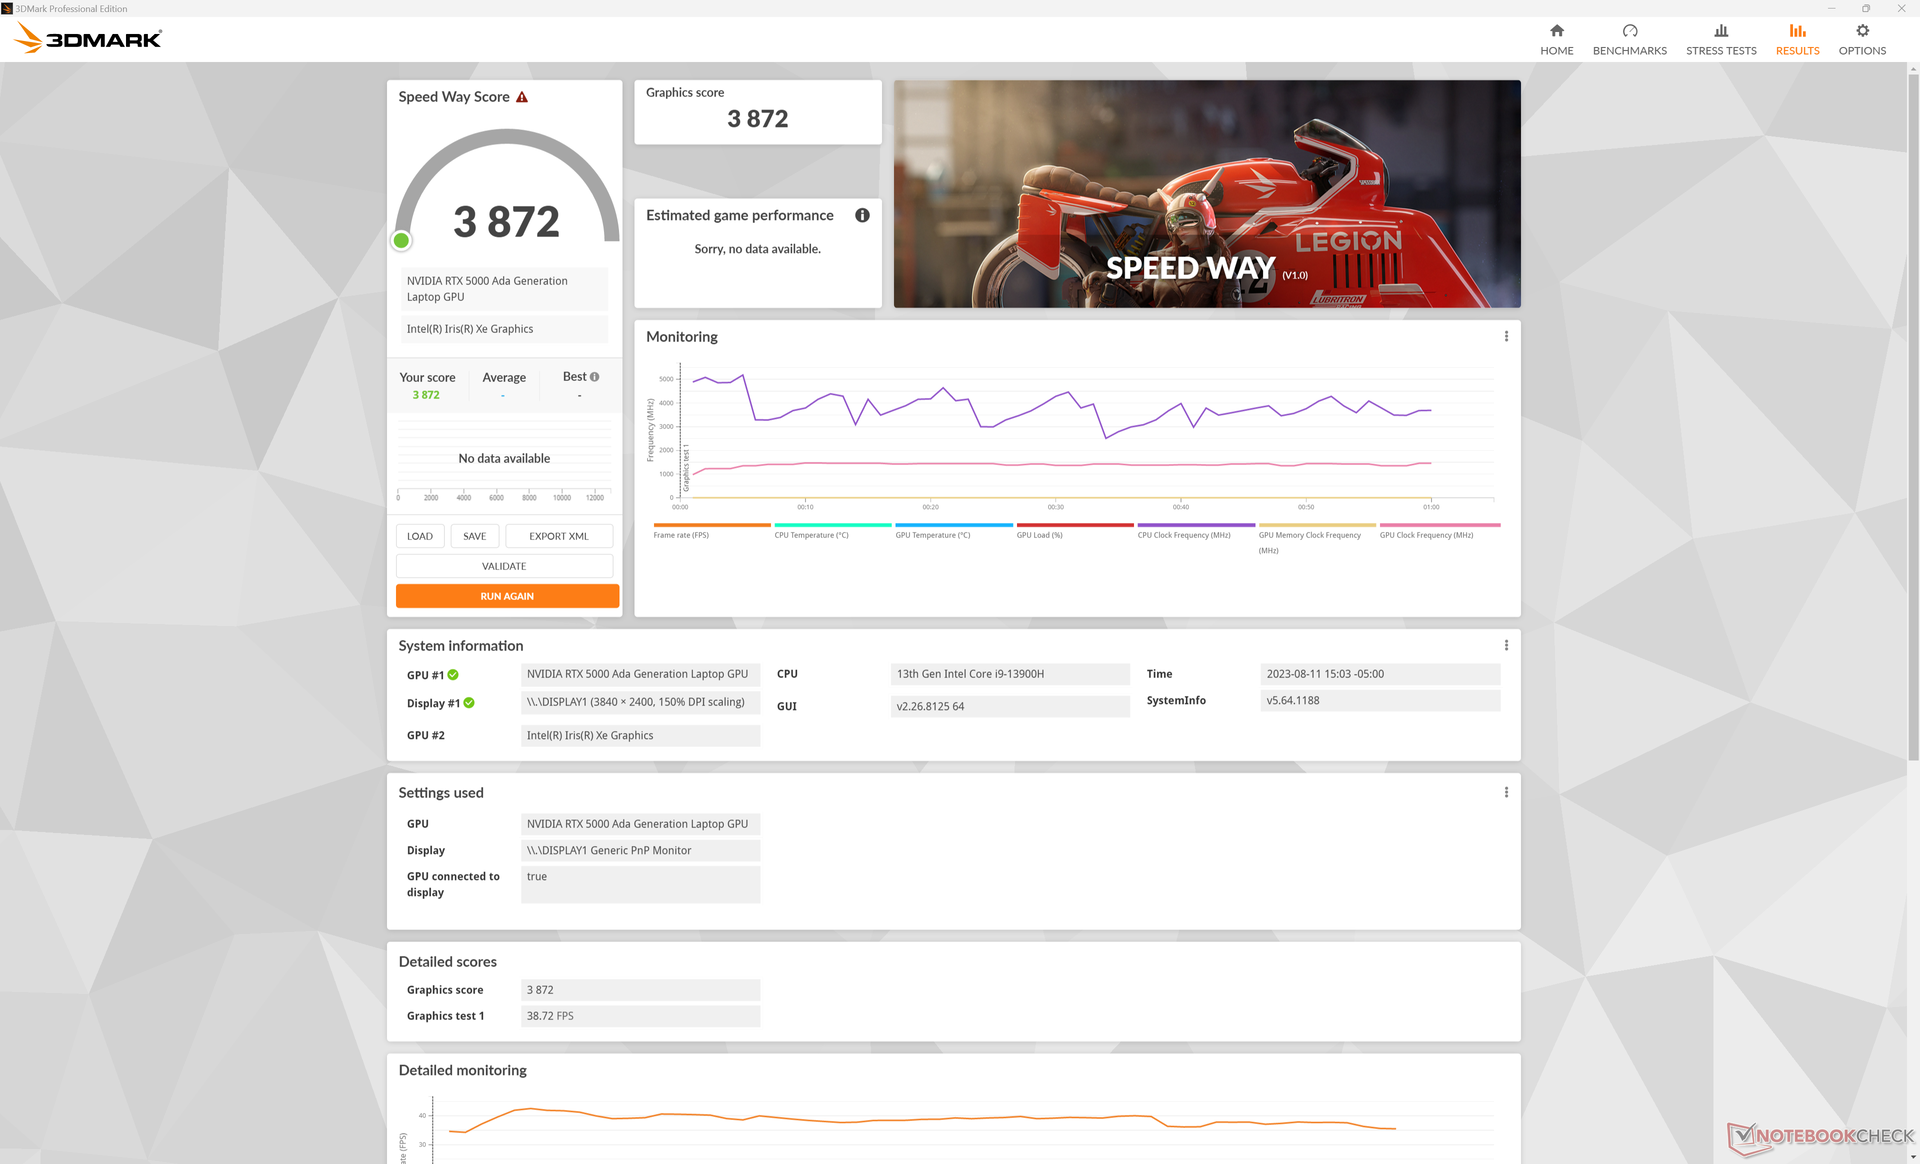
Nya RTX 5000 erbjuder betydande prestandafördelar jämfört med förra årets RTX A5000 och A5500 särskilt i DX12-applikationer och Blender CUDA-acceleration. Time Spy, skulle till exempel få 30 till 40 procent högre poäng på vår Precision än påMSI WE76 eller Lenovo ThinkPad P16 G1 som alla körs med äldre Ampere GPU:er. Fördelarna gäller även de flesta deltesterna i Specviewperf.
Aktivering av ECC VRAM-läge verkar inte påverka minnesklockfrekvenserna, men det maximalt tillgängliga VRAM-minnet skulle minska från 16384 MB till 15360 MB enligt GPU-Z.
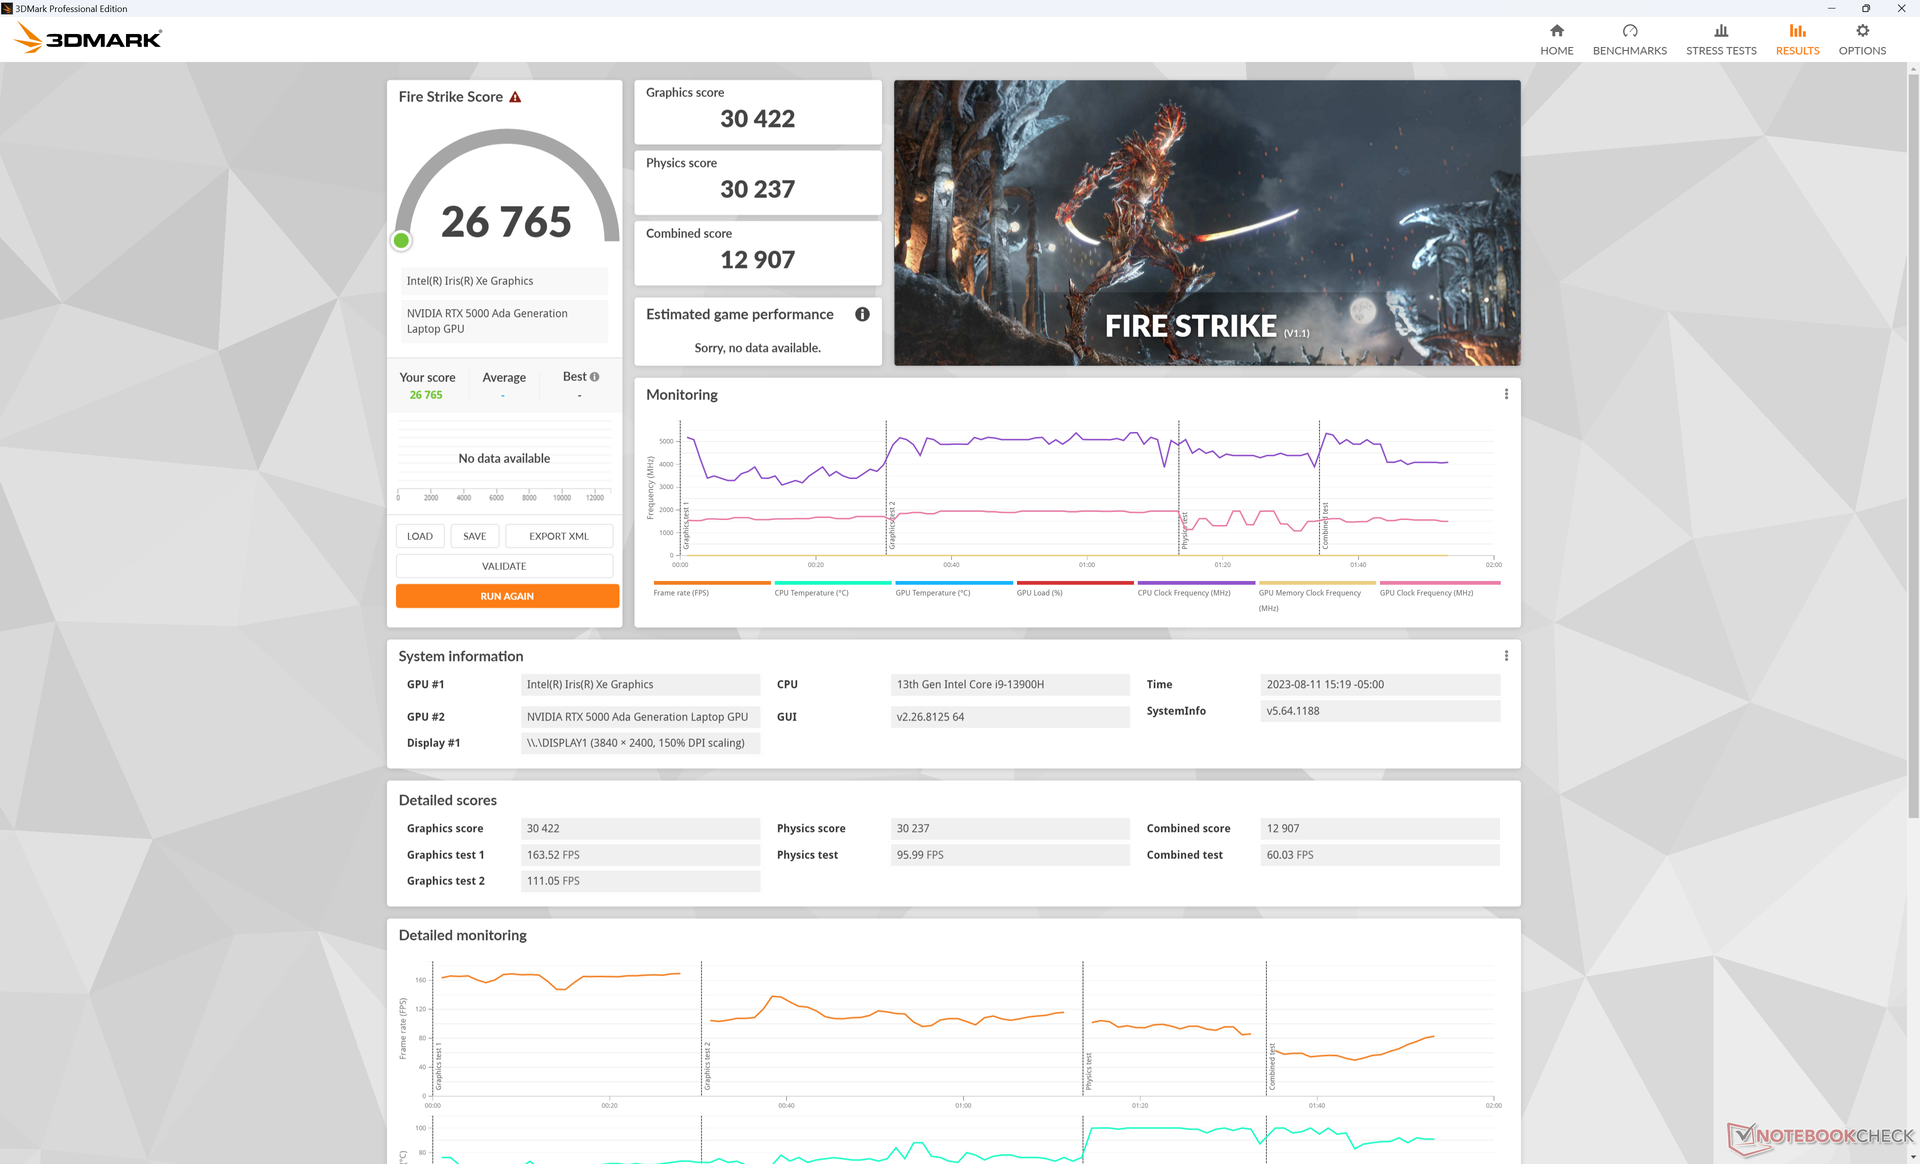
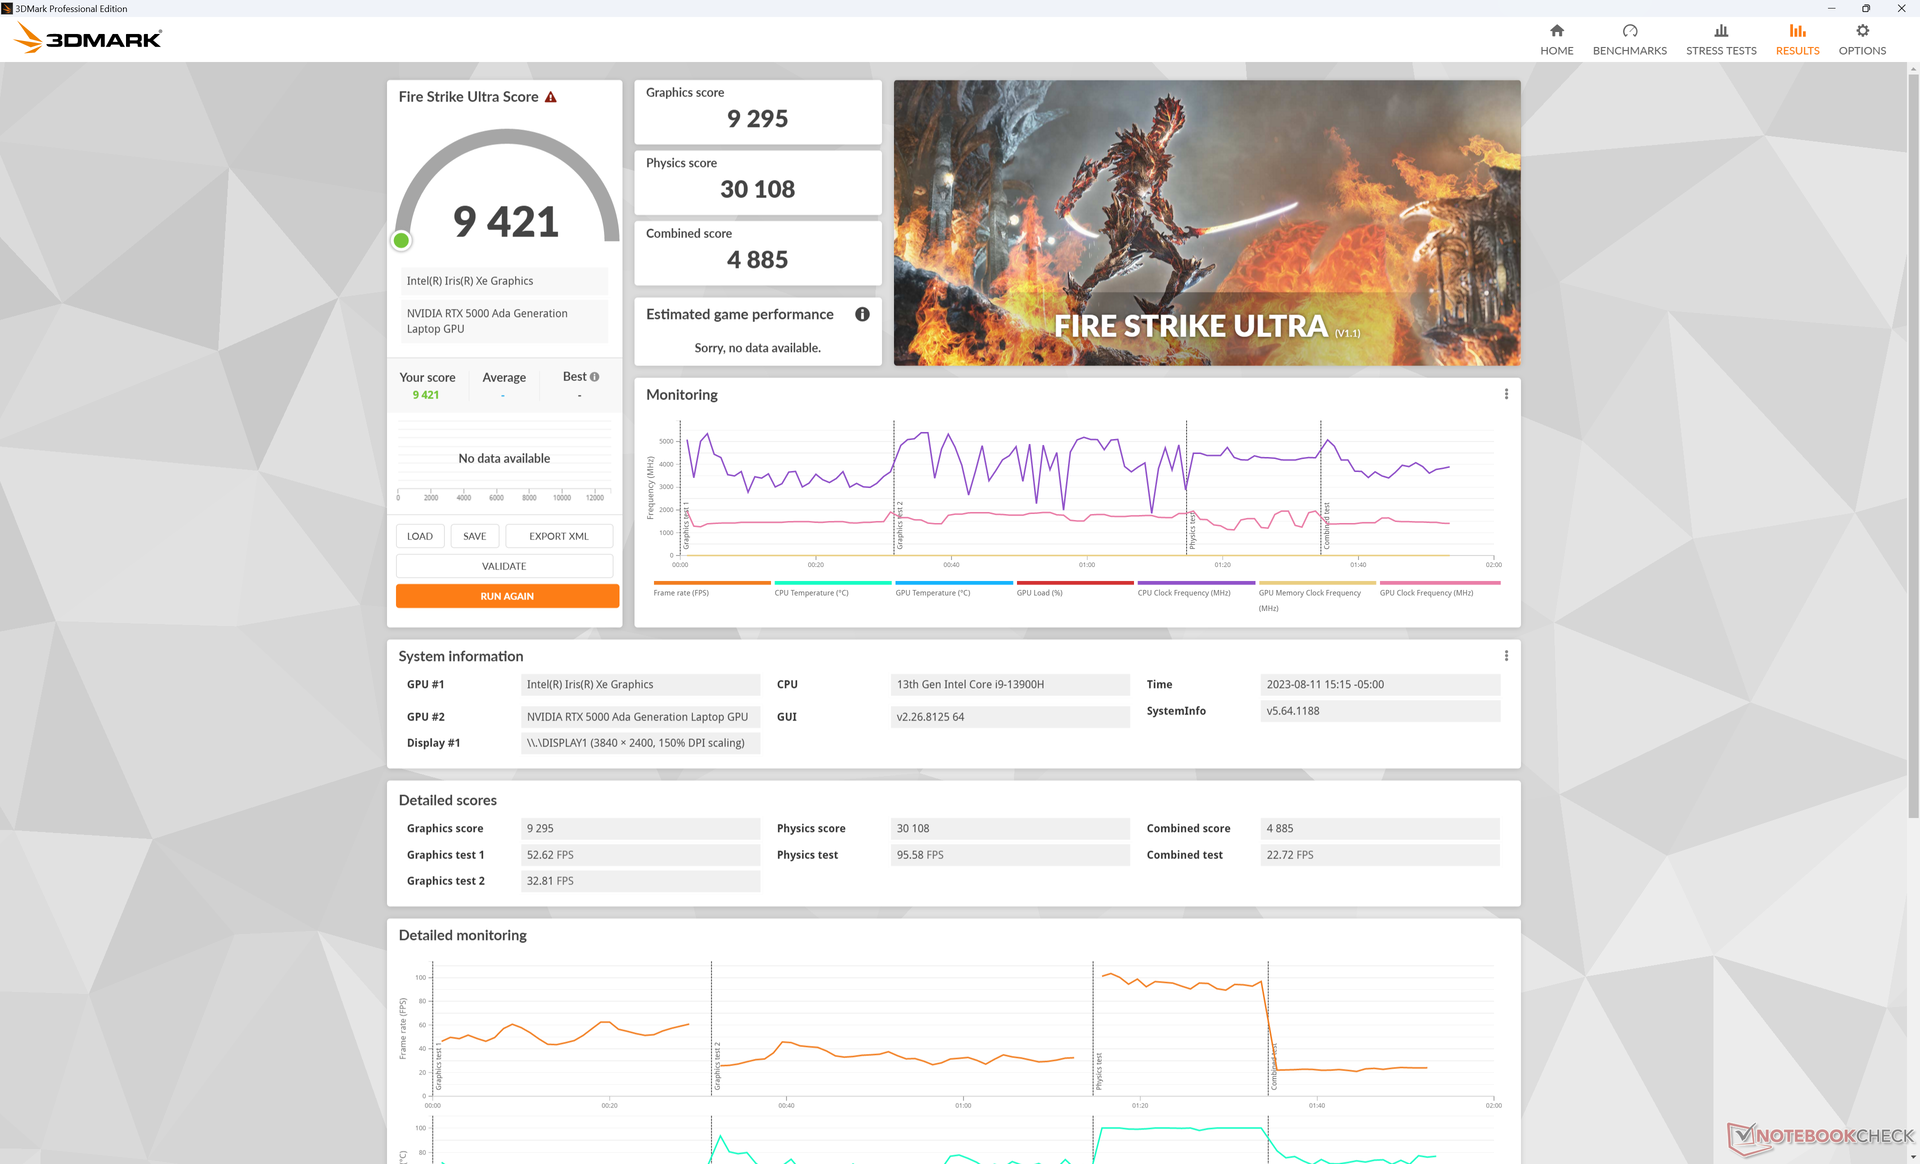
Observera att det inte finns någon större påverkan på GPU-prestandan när man går från Performance-läget till Balanced-läget, vilket framgår av Fire Strike -resultaten nedan. Istället skulle CPU-prestandan ta en märkbar smäll.
| Kraftprofil | Poäng för fysik | Poäng för grafik | Kombinerat resultat |
| Batteridrift | 20938 (-31%) | 27514 (-10%) | 8910 (-31%) |
| Balanserat läge | 24828 (-18%) | 30588 (-0%) | 11365 (-12%) |
| Prestandaläge | 30237 | 30422 | 12907 |
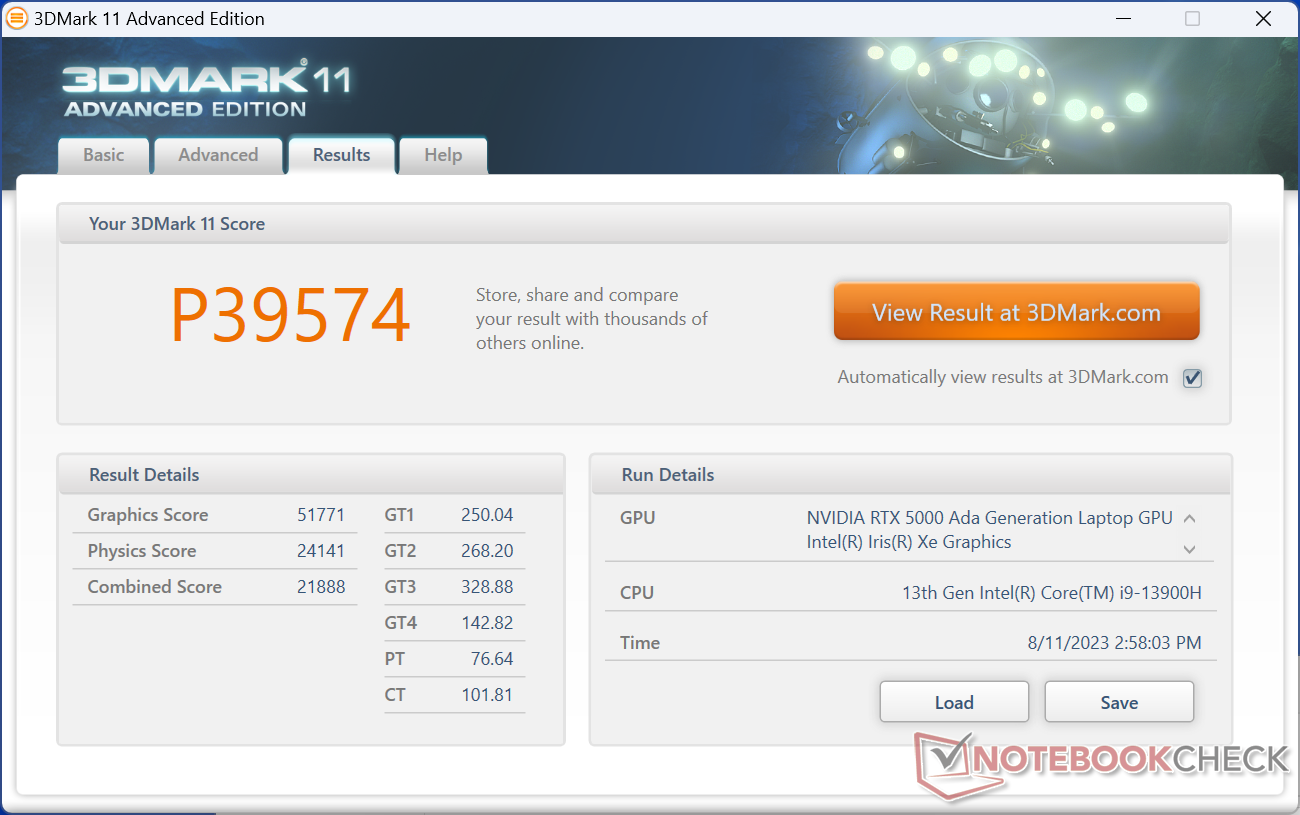
| 3DMark 11 Performance | 39574 poäng | |
| 3DMark Fire Strike Score | 26765 poäng | |
| 3DMark Time Spy Score | 14644 poäng | |
Hjälp | ||
* ... mindre är bättre
Spelprestanda
Även om Precision 5680 inte är en bärbar dator för spel, är den ändå fullt kapabel att spela de senaste krävande titlarna utan några kompatibilitetsproblem under testningen. Den övergripande spelprestandan ligger mellan den mobila GeForce RTX 4060 och mobil RTX 4070 som finns på dedikerade bärbara speldatorer som HP Omen Transcend 16.
Witcher 3 FPS Chart
| låg | med. | hög | ultra | QHD | 4K | |
|---|---|---|---|---|---|---|
| GTA V (2015) | 185.4 | 179.7 | 175.3 | 117.1 | 106.6 | 108 |
| The Witcher 3 (2015) | 412.7 | 329.6 | 256 | 137 | 97 | |
| Dota 2 Reborn (2015) | 178 | 161.7 | 154 | 144 | 142.5 | |
| Final Fantasy XV Benchmark (2018) | 196.3 | 165.6 | 127.4 | 100.8 | 60.4 | |
| X-Plane 11.11 (2018) | 155.3 | 133 | 102.4 | 86.2 | ||
| Far Cry 5 (2018) | 145 | 132 | 129 | 132 | 114 | 70 |
| Cyberpunk 2077 1.6 (2022) | 124.9 | 122.7 | 107.7 | 100 | 66.2 | 32.2 |
| Tiny Tina's Wonderlands (2022) | 220 | 202.3 | 152.6 | 125 | 90.1 | 50.9 |
| F1 22 (2022) | 232 | 218 | 202 | 84.5 | 56.1 | 28.8 |
| Returnal (2023) | 98 | 94 | 90 | 81 | 60 | 34 |
Utsläpp - tyst mest hela tiden
Buller från systemet
Bullernivåerna är mest likartade medPrecision 5550 även om vår Precision 5680 har en betydligt snabbare GPU. Fläktarna tenderar att ligga på mellan till höga 20 dB(A) när man kör enkla belastningar som webbläsare medan mer krävande belastningar skulle inducera ett stadigt ljud på 51 dB(A).
Intressant är att den maximala ljudnivån i balanserat läge är densamma som i prestandaläget.
Ljudnivå
| Låg belastning |
| 23 / 23 / 23 dB(A) |
| Hög belastning |
| 37.2 / 51 dB(A) |
 | ||
30 dB tyst 40 dB(A) hörbar 50 dB(A) högt ljud |
||
min: | ||
| Dell Precision 5000 5680 RTX 5000 Ada Generation Laptop, i9-13900H, 2x SK hynix PC801 HFS512GEJ9X101N RAID 0 | Dell Precision 7000 7670 Performance RTX A5500 Laptop GPU, i9-12950HX | HP ZBook Fury 16 G9 RTX A5500 Laptop GPU, i9-12950HX, Micron 3400 1TB MTFDKBA1T0TFH | Lenovo ThinkPad P16 G1 RTX A5500 RTX A5500 Laptop GPU, i9-12950HX, WDC PC SN810 2TB | MSI CreatorPro Z16P B12UKST RTX A3000 Laptop GPU, i7-12700H, Samsung PM9A1 MZVL21T0HCLR | Asus ExpertBook B6 Flip B6602FC2 RTX A2000 Laptop GPU, i9-12950HX, Samsung PM9A1 MZVL21T0HCLR | |
|---|---|---|---|---|---|---|
| Noise | -11% | -2% | 3% | -8% | -30% | |
| av / miljö * (dB) | 22.8 | 23.9 -5% | 22.6 1% | 23.1 -1% | 24.1 -6% | 26 -14% |
| Idle Minimum * (dB) | 23 | 24 -4% | 22.7 1% | 23.1 -0% | 27.1 -18% | 32.4 -41% |
| Idle Average * (dB) | 23 | 24 -4% | 22.7 1% | 23.1 -0% | 27.1 -18% | 32.4 -41% |
| Idle Maximum * (dB) | 23 | 38 -65% | 28.8 -25% | 23.1 -0% | 27.1 -18% | 32.4 -41% |
| Load Average * (dB) | 37.2 | 46.3 -24% | 36.2 3% | 28.9 22% | 42.9 -15% | 51.9 -40% |
| Witcher 3 ultra * (dB) | 51 | 41.9 18% | 49.5 3% | 51.6 -1% | 44 14% | |
| Load Maximum * (dB) | 51 | 47.9 6% | 49.3 3% | 51.4 -1% | 47 8% | 52.1 -2% |
* ... mindre är bättre
Temperatur
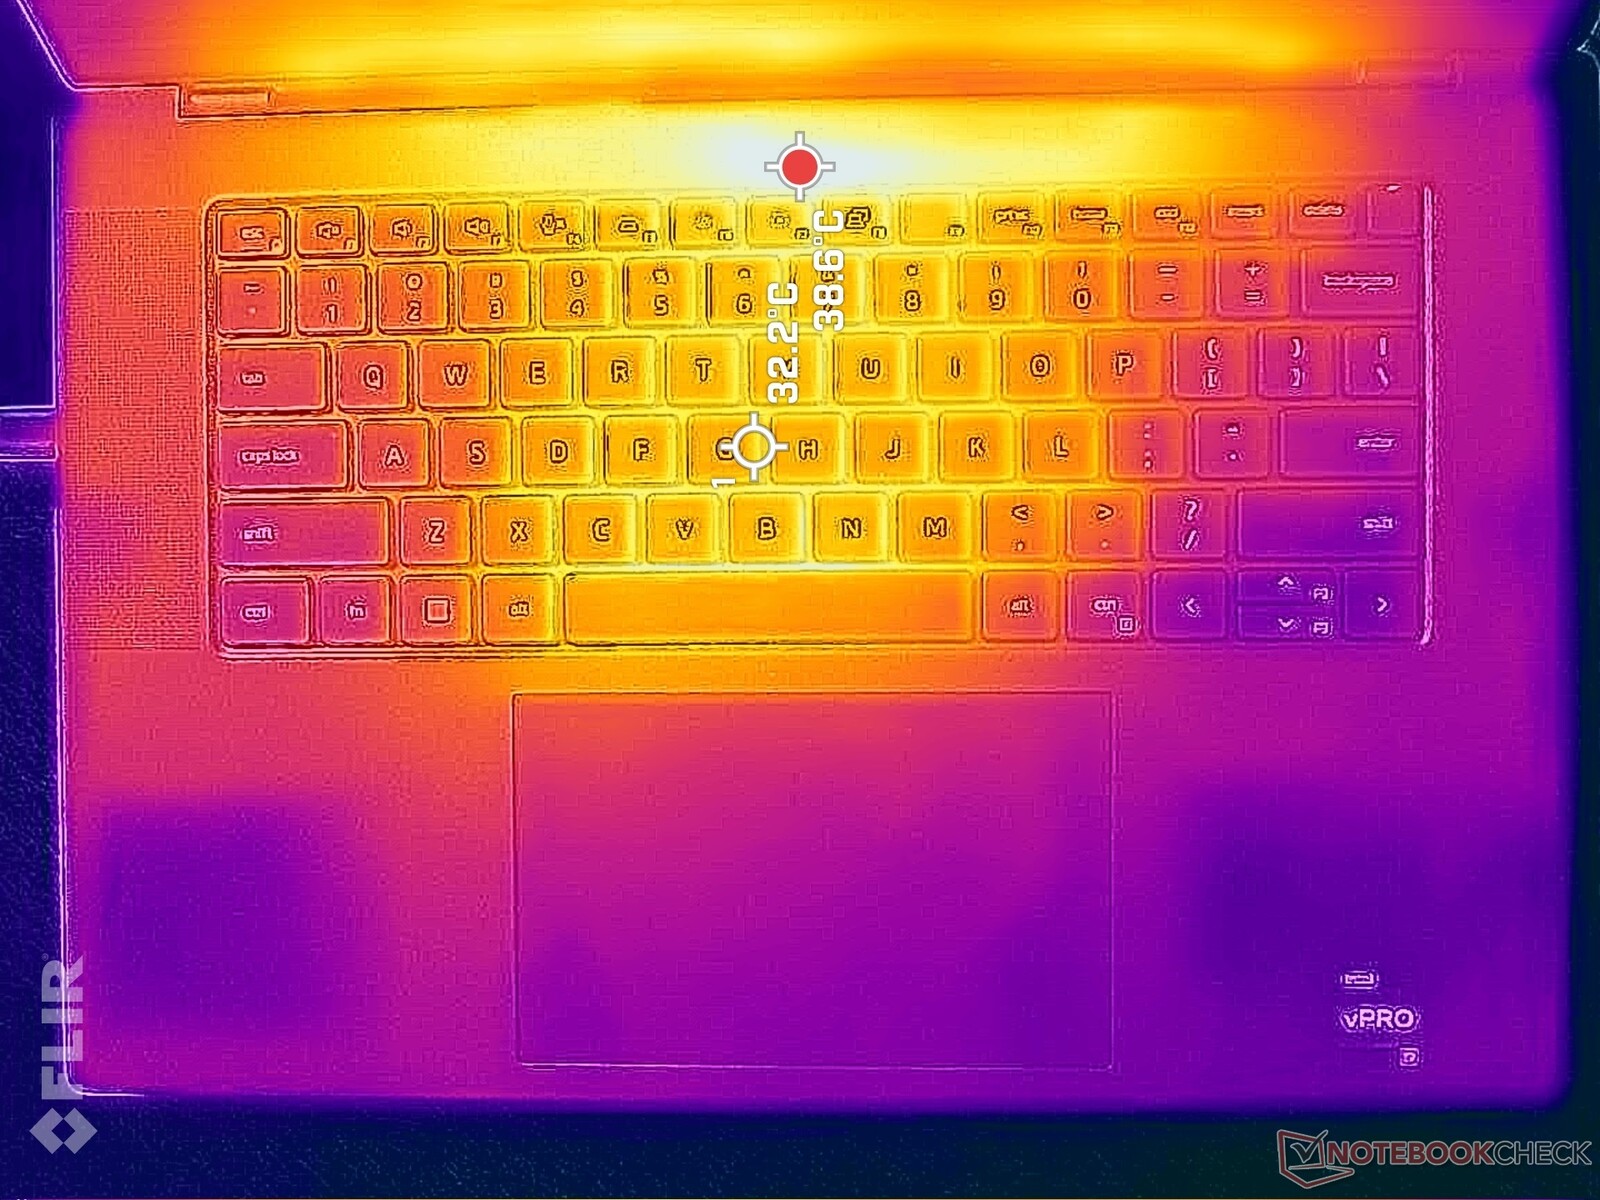
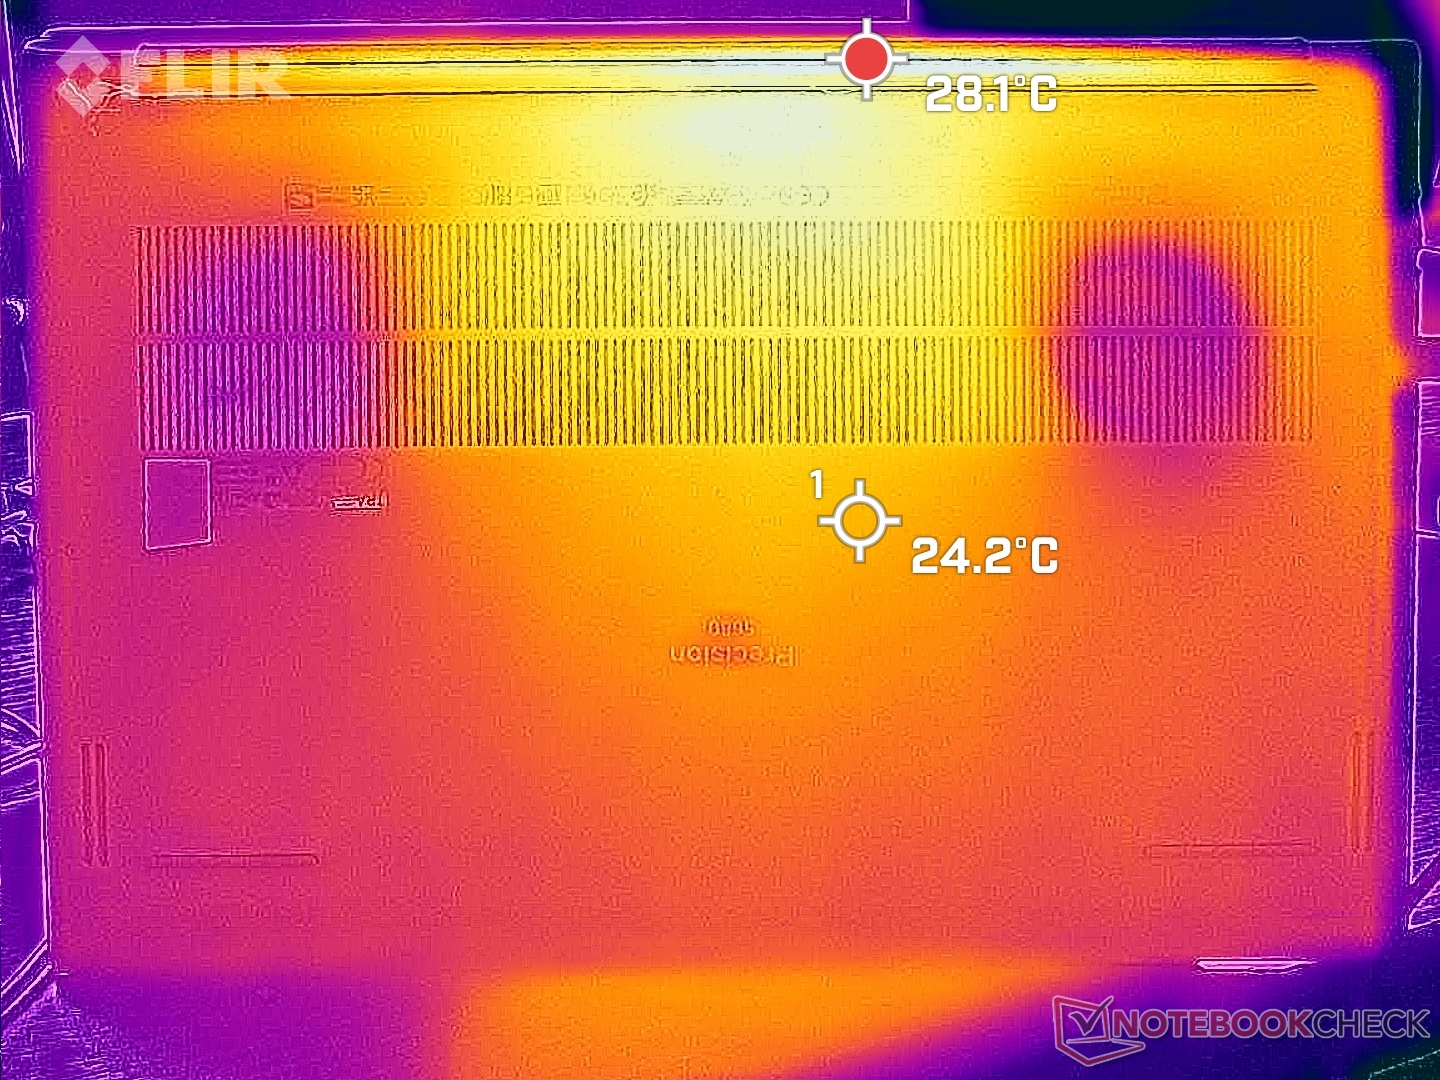
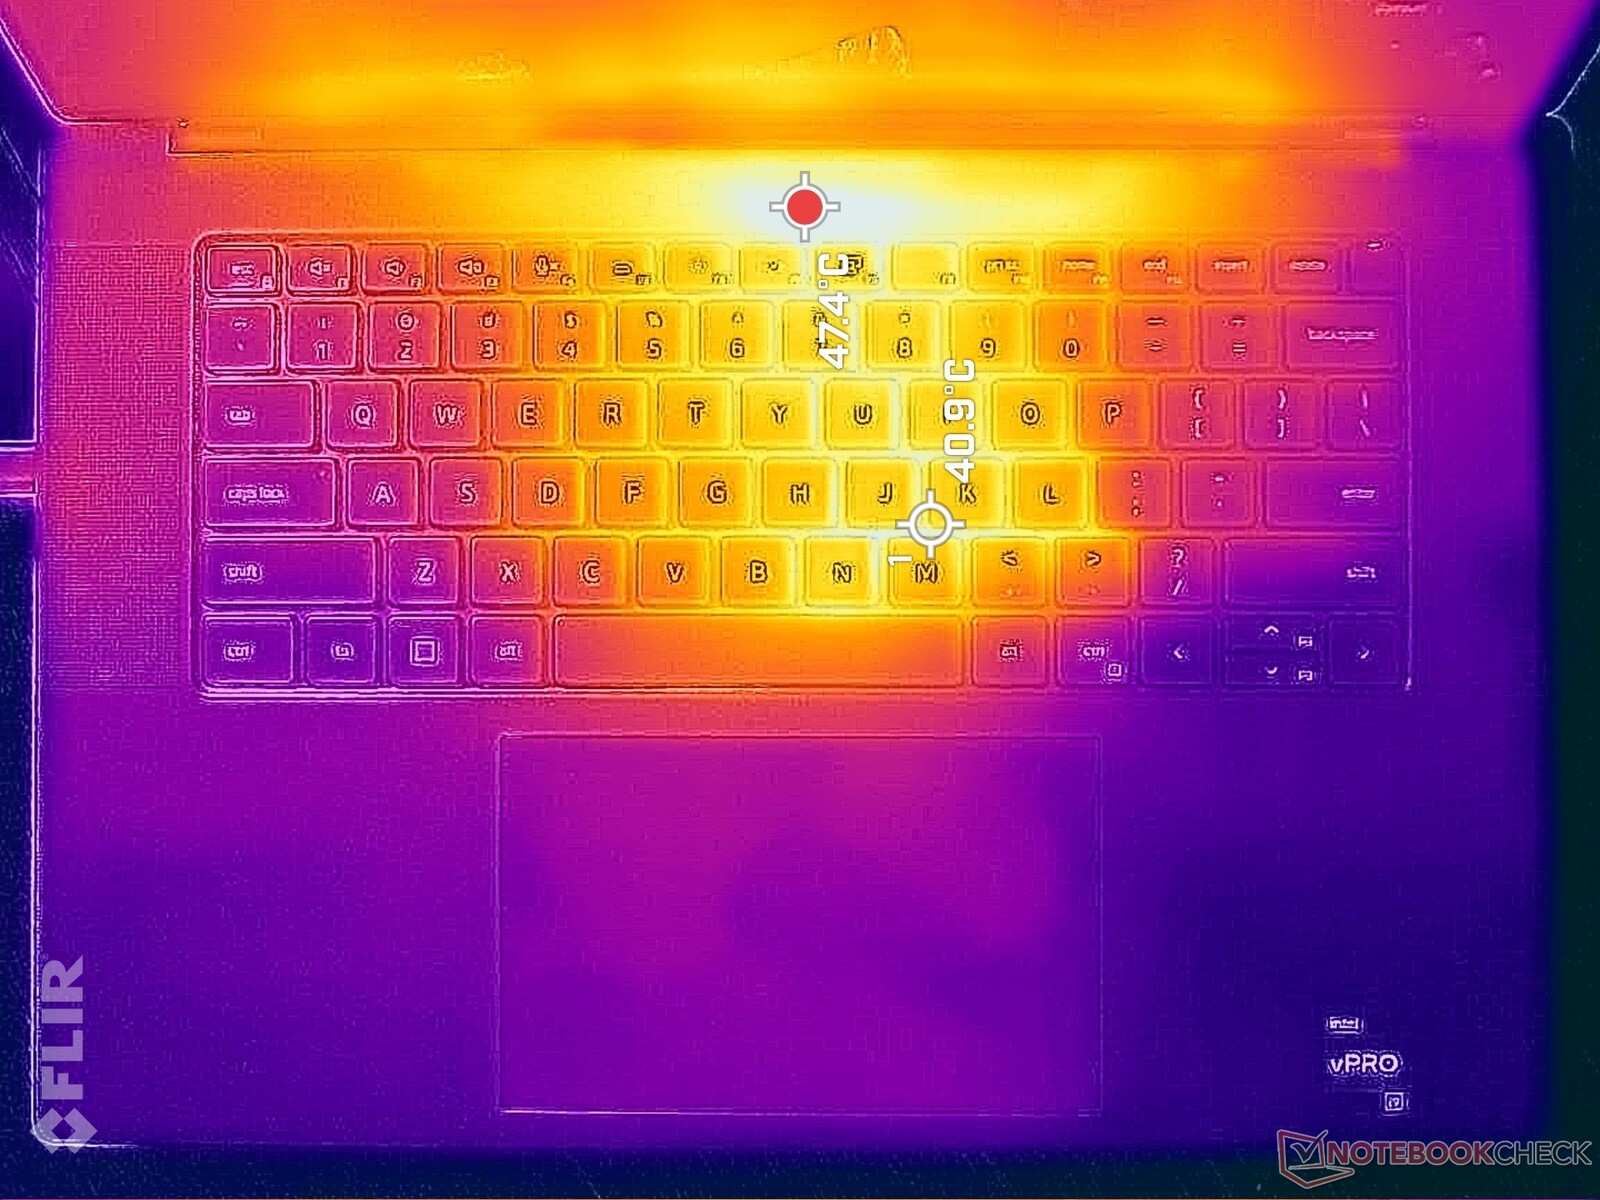
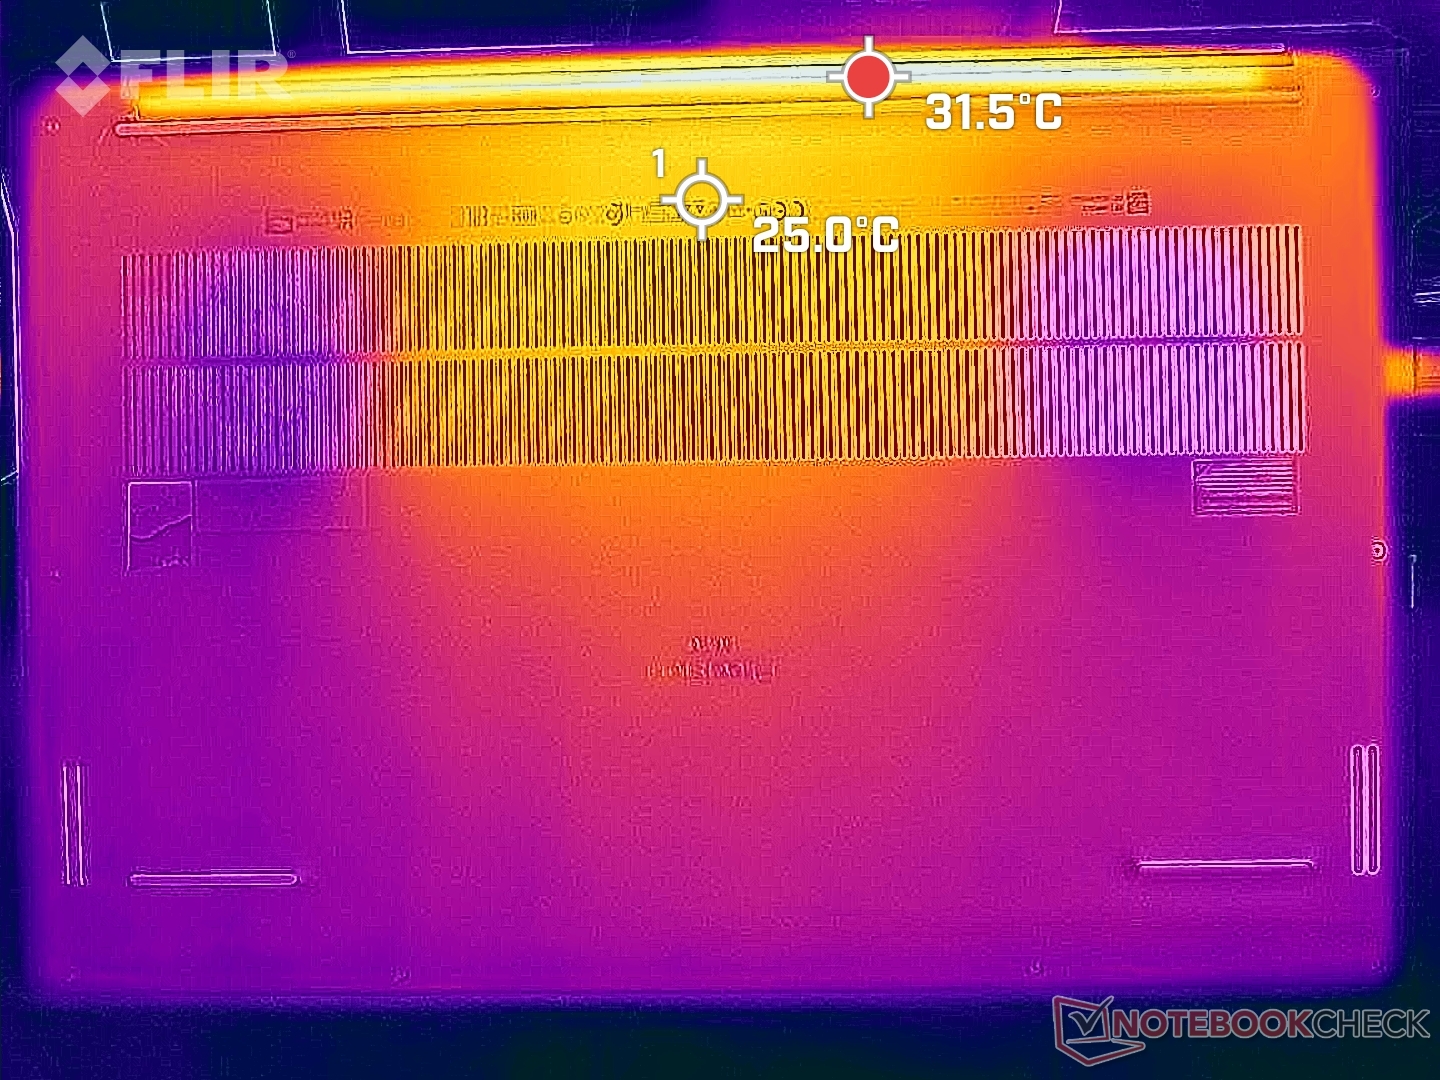
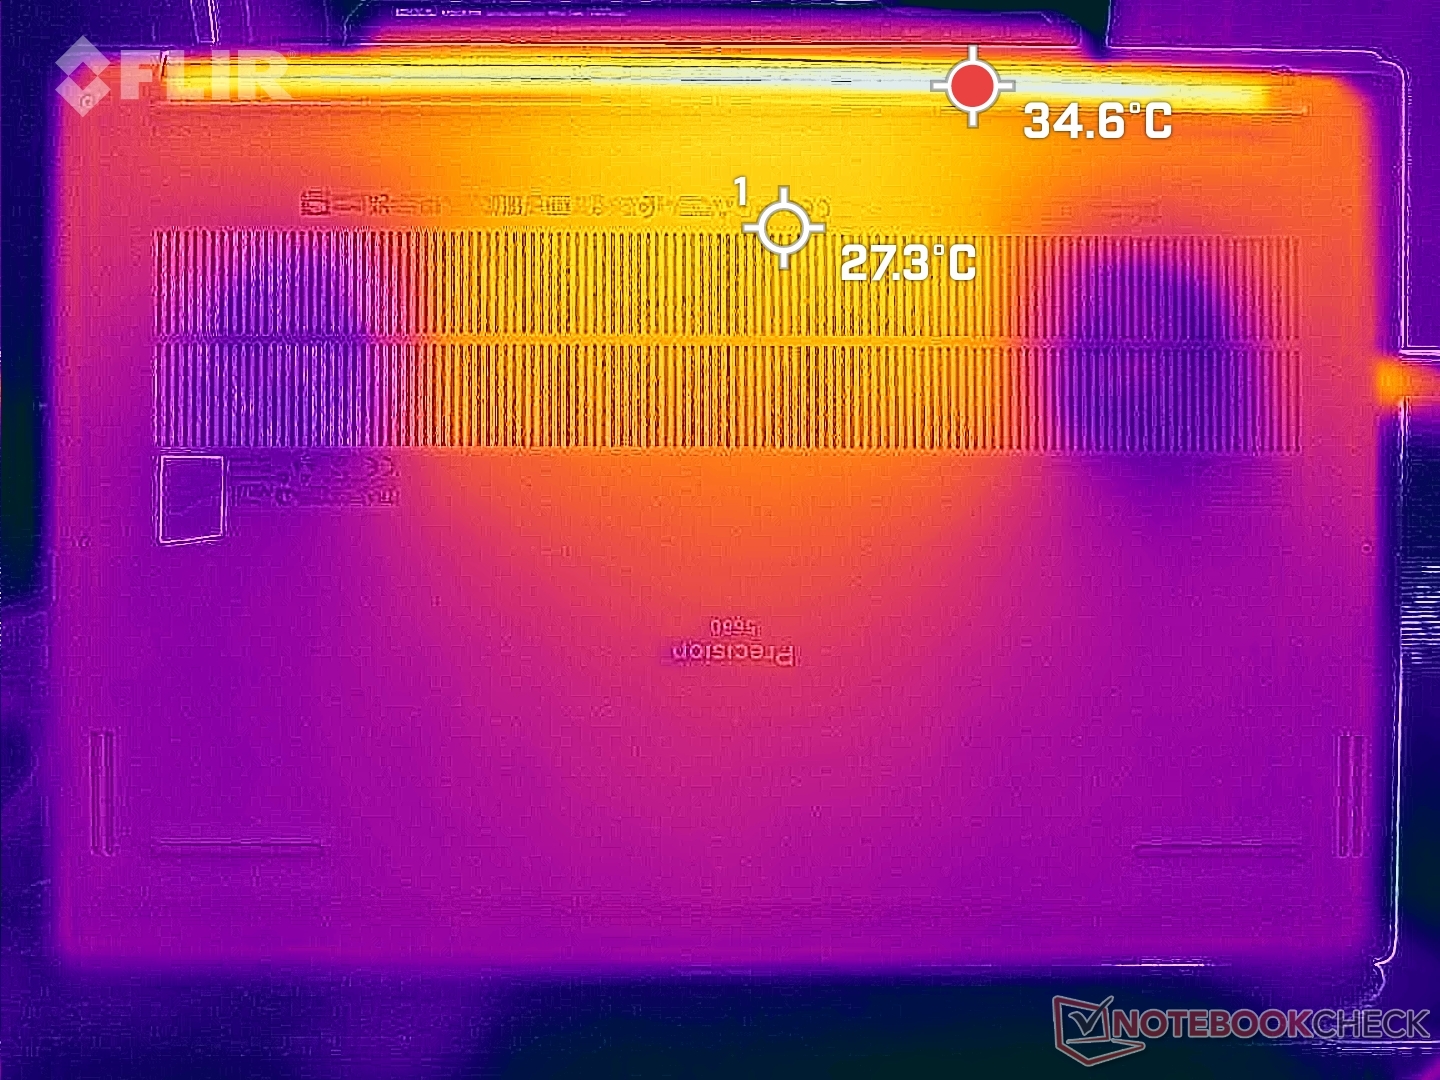
Yttemperaturen vid tomgångskörning är varmare än förväntat eftersom fläktarna tenderar att gå på tomgång tills de behövs. Hot spots kan vara så varma som 37 C och 32 C på över- respektive undersidan, jämfört med under 30 C påExpertBook B6 Flip.
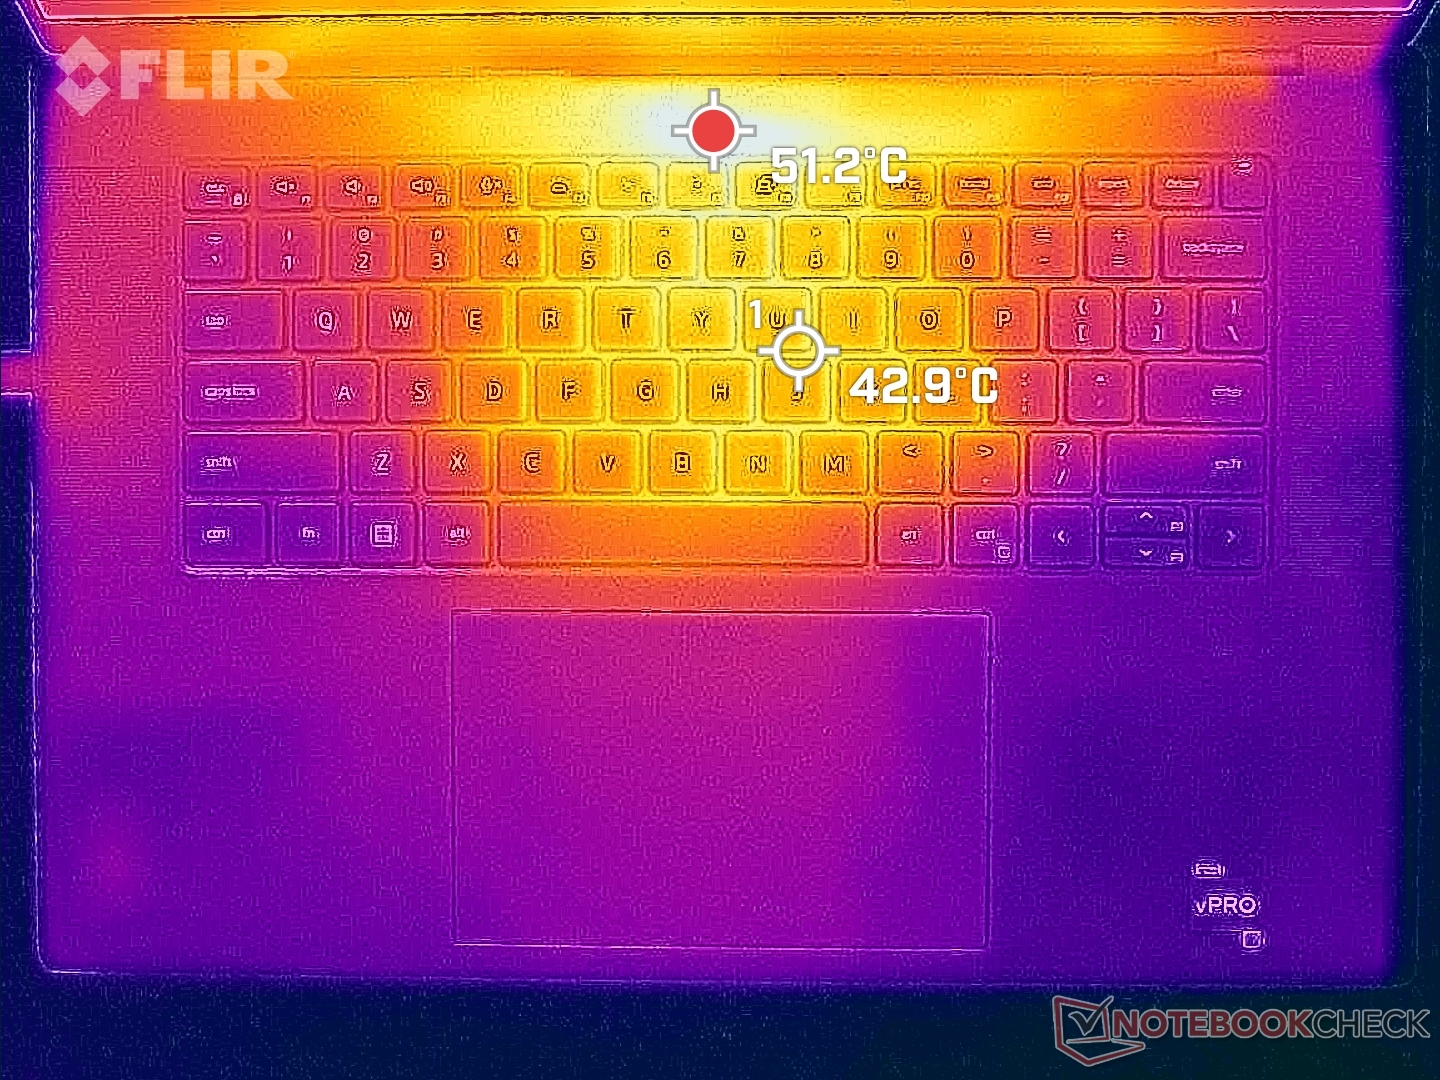
Vid mer krävande belastning kan tangentbordets mittpunkt nå över 50 C medan undersidan knappt värms upp alls, delvis på grund av Gore-isolatorerna. Fingrar och handflator vidrör tangentbordets mitt endast sällan, så de varma punkterna påverkar i allmänhet inte komforten.
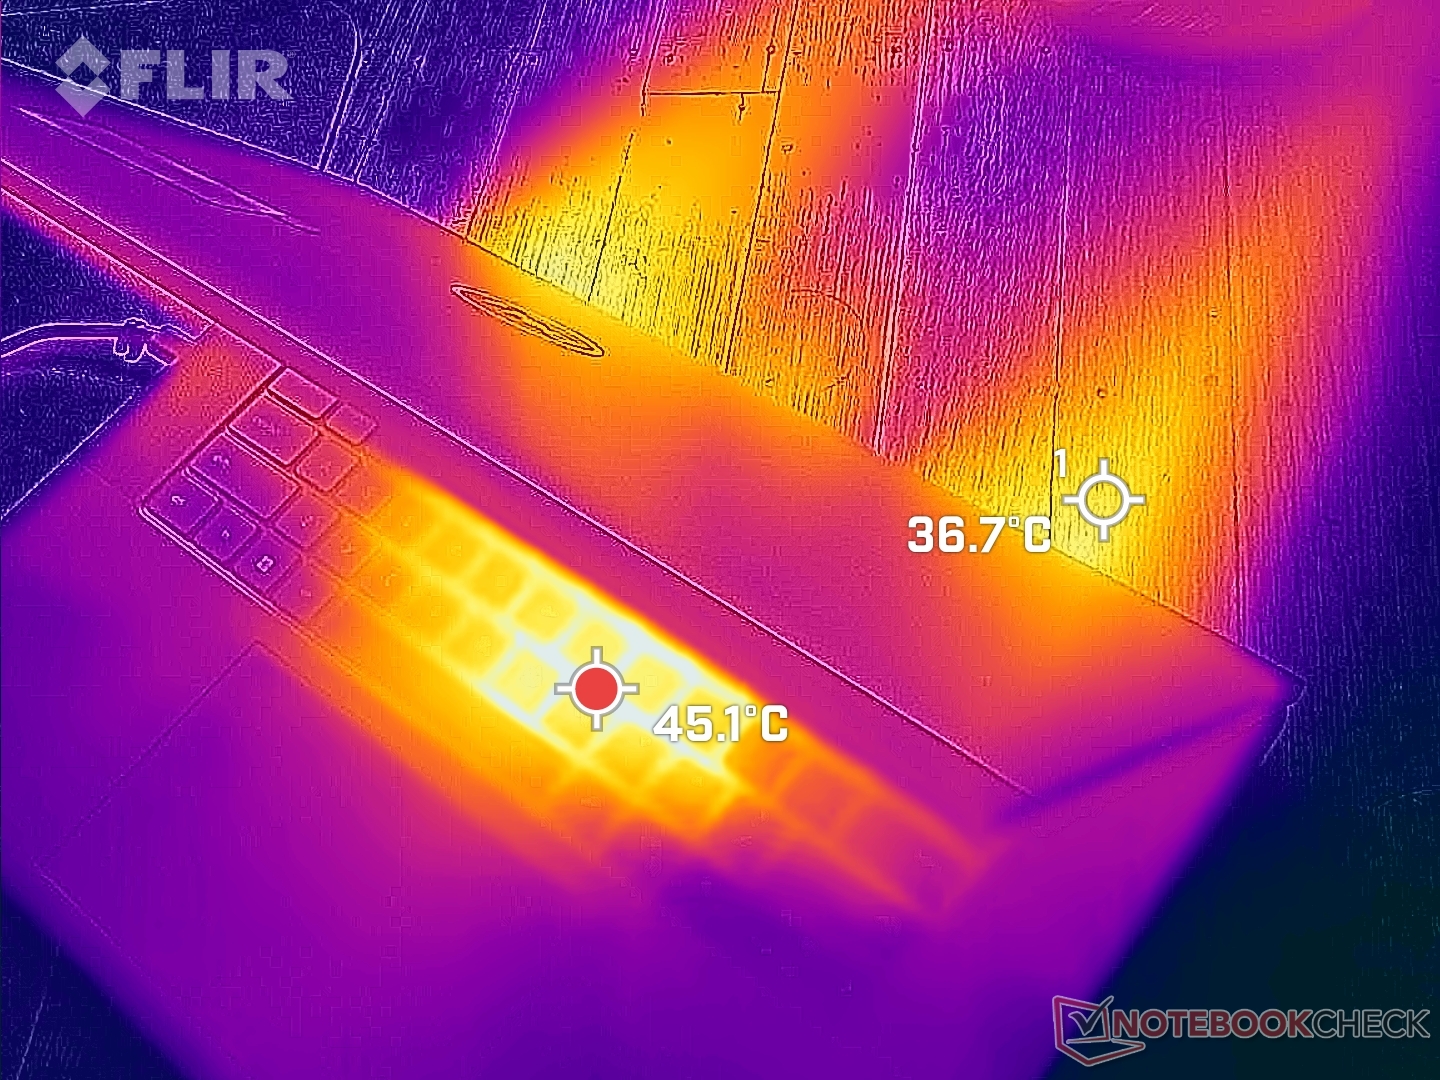
(-) Den maximala temperaturen på ovansidan är 50.2 °C / 122 F, jämfört med genomsnittet av 38.2 °C / 101 F , allt från 22.2 till 69.8 °C för klassen Workstation.
(+) Botten värms upp till maximalt 32 °C / 90 F, jämfört med genomsnittet av 41.1 °C / 106 F
(+) Vid tomgångsbruk är medeltemperaturen för ovansidan 30.1 °C / 86 F, jämfört med enhetsgenomsnittet på 32 °C / ### class_avg_f### F.
(±) När du spelar The Witcher 3 är medeltemperaturen för ovansidan 34.6 °C / 94 F, jämfört med enhetsgenomsnittet på 32 °C / ## #class_avg_f### F.
(+) Handledsstöden och pekplattan är kallare än hudtemperaturen med maximalt 27.6 °C / 81.7 F och är därför svala att ta på.
(±) Medeltemperaturen för handledsstödsområdet på liknande enheter var 27.8 °C / 82 F (+0.2 °C / 0.3 F).
| Dell Precision 5000 5680 Intel Core i9-13900H, NVIDIA RTX 5000 Ada Generation Laptop | Dell Precision 7000 7670 Performance Intel Core i9-12950HX, NVIDIA RTX A5500 Laptop GPU | HP ZBook Fury 16 G9 Intel Core i9-12950HX, NVIDIA RTX A5500 Laptop GPU | Lenovo ThinkPad P16 G1 RTX A5500 Intel Core i9-12950HX, NVIDIA RTX A5500 Laptop GPU | MSI CreatorPro Z16P B12UKST Intel Core i7-12700H, NVIDIA RTX A3000 Laptop GPU | Asus ExpertBook B6 Flip B6602FC2 Intel Core i9-12950HX, NVIDIA RTX A2000 Laptop GPU | |
|---|---|---|---|---|---|---|
| Heat | -12% | -3% | -13% | -19% | -8% | |
| Maximum Upper Side * (°C) | 50.2 | 53 -6% | 43.2 14% | 44.8 11% | 56.3 -12% | 48.4 4% |
| Maximum Bottom * (°C) | 32 | 43.2 -35% | 50.4 -58% | 49.8 -56% | 68.3 -113% | 52.3 -63% |
| Idle Upper Side * (°C) | 37.4 | 36.8 2% | 28.6 24% | 30.6 18% | 25.2 33% | 27.8 26% |
| Idle Bottom * (°C) | 31.2 | 33.8 -8% | 28.2 10% | 38.6 -24% | 25.9 17% | 30.3 3% |
* ... mindre är bättre
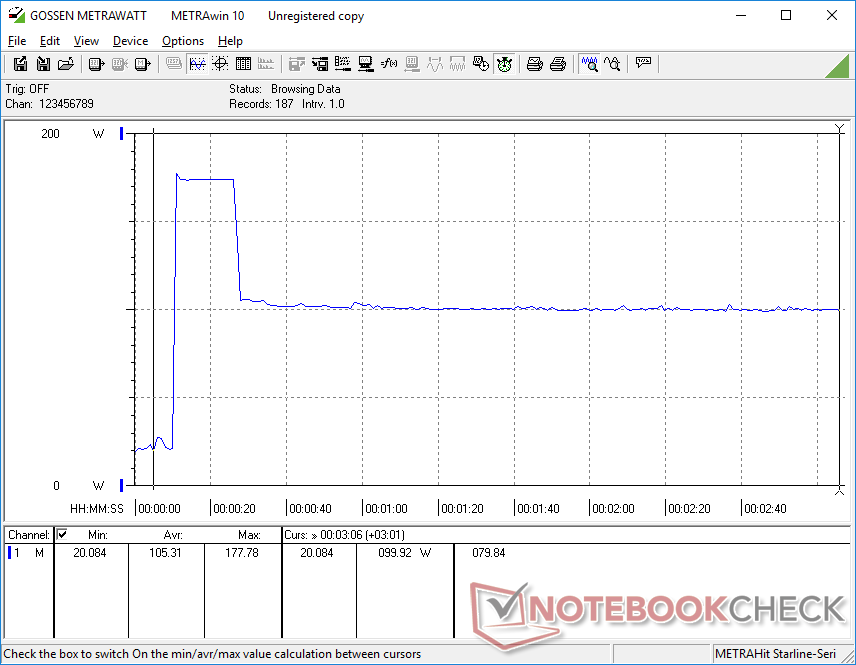
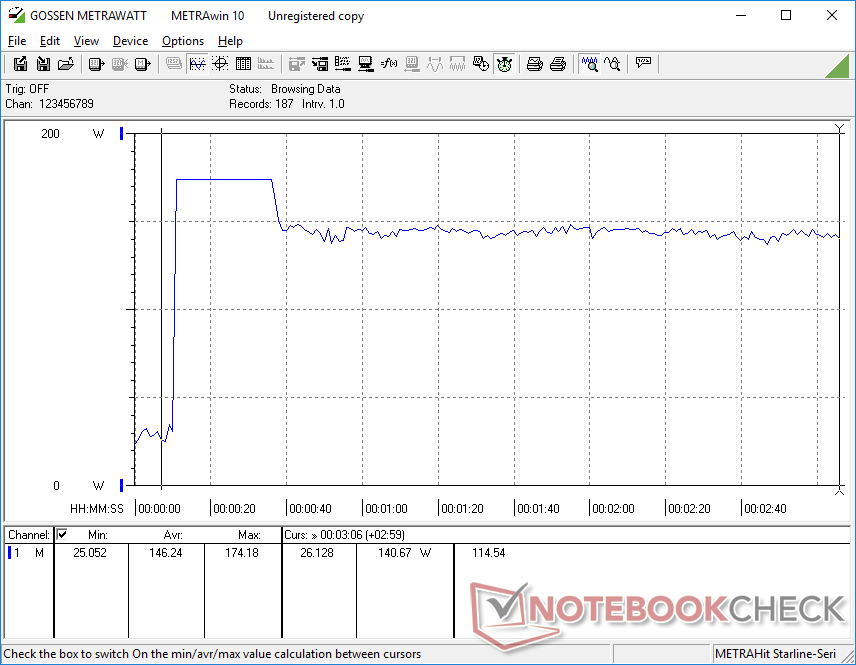
Stresstest
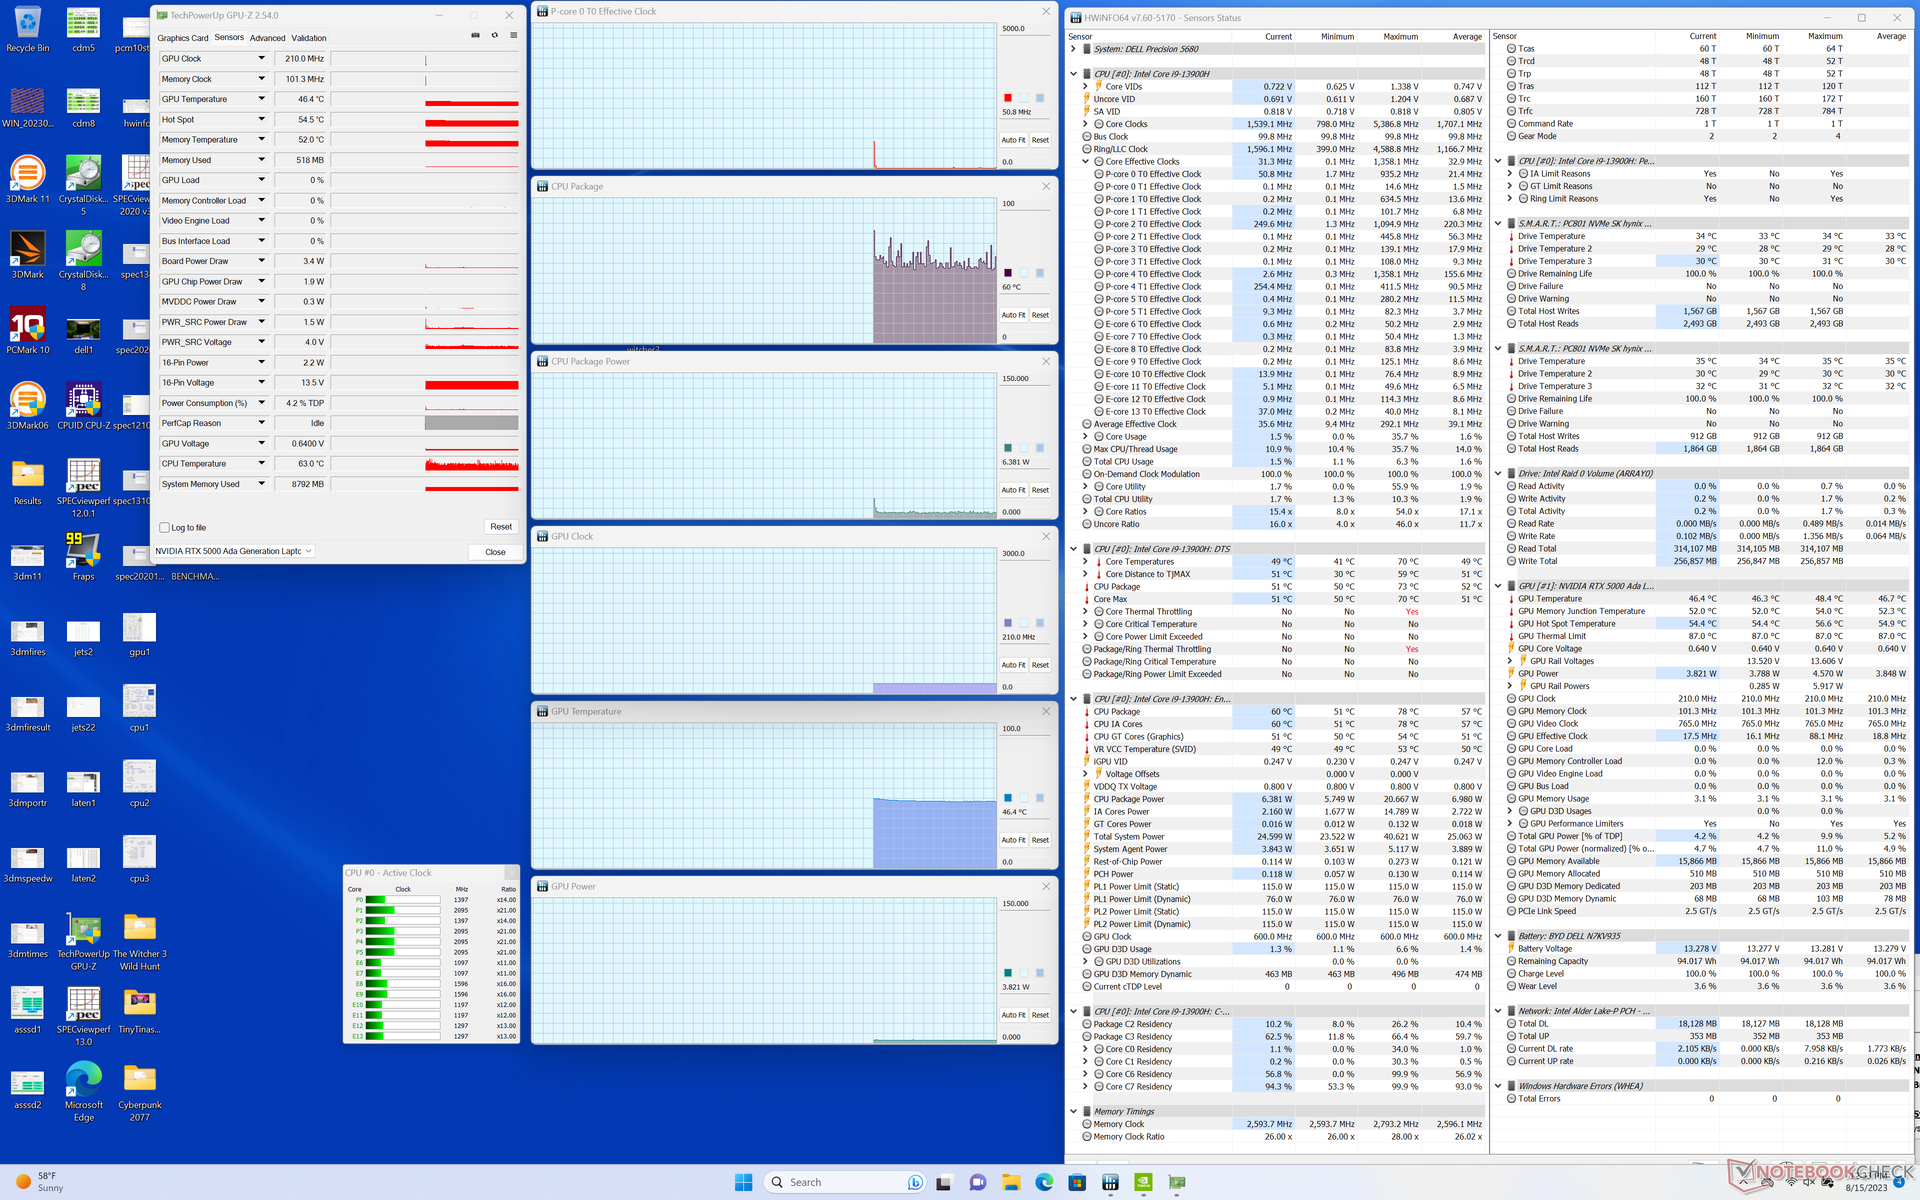
När Prime95 kördes ökade CPU:n till 3,9 GHz, 117 W och 100 C under endast ca 15 sekunder. Därefter sjönk Turbo Boost-potentialen för att sedan stabiliseras på cirka 2,8 GHz och 56 W för en mer rimlig kärntemperatur på 75 C. Maximal Turbo Boost är därför inte hållbar på Precision 5680 även om den är inställd på Performance-läget.
Att köra i balanserat läge istället för prestandaläge påverkar inte GPU-prestandan negativt som nämnts ovan. GPU-klocka, temperatur och strömförbrukning vid körning i Witcher 3 i Performance-läget stabiliseras på 1560 MHz, 72 C respektive 63 W, jämfört med 1665 MHz, 65 C och 69 W i Balanced-läget. Den största skillnaden mellan lägena Balanserad och Prestanda verkar vara CPU-temperaturen som kan vara så varm som 100+ C i läget Prestanda för högre Turbo Boost-potential jämfört med bara ~80 C i läget Balanserad.
Observera att vi bara kunde nå en maximal strömförbrukning för GPU-kortet på 75 W även om TGP-målet är 95 W enligt Nvidia Control Panel.
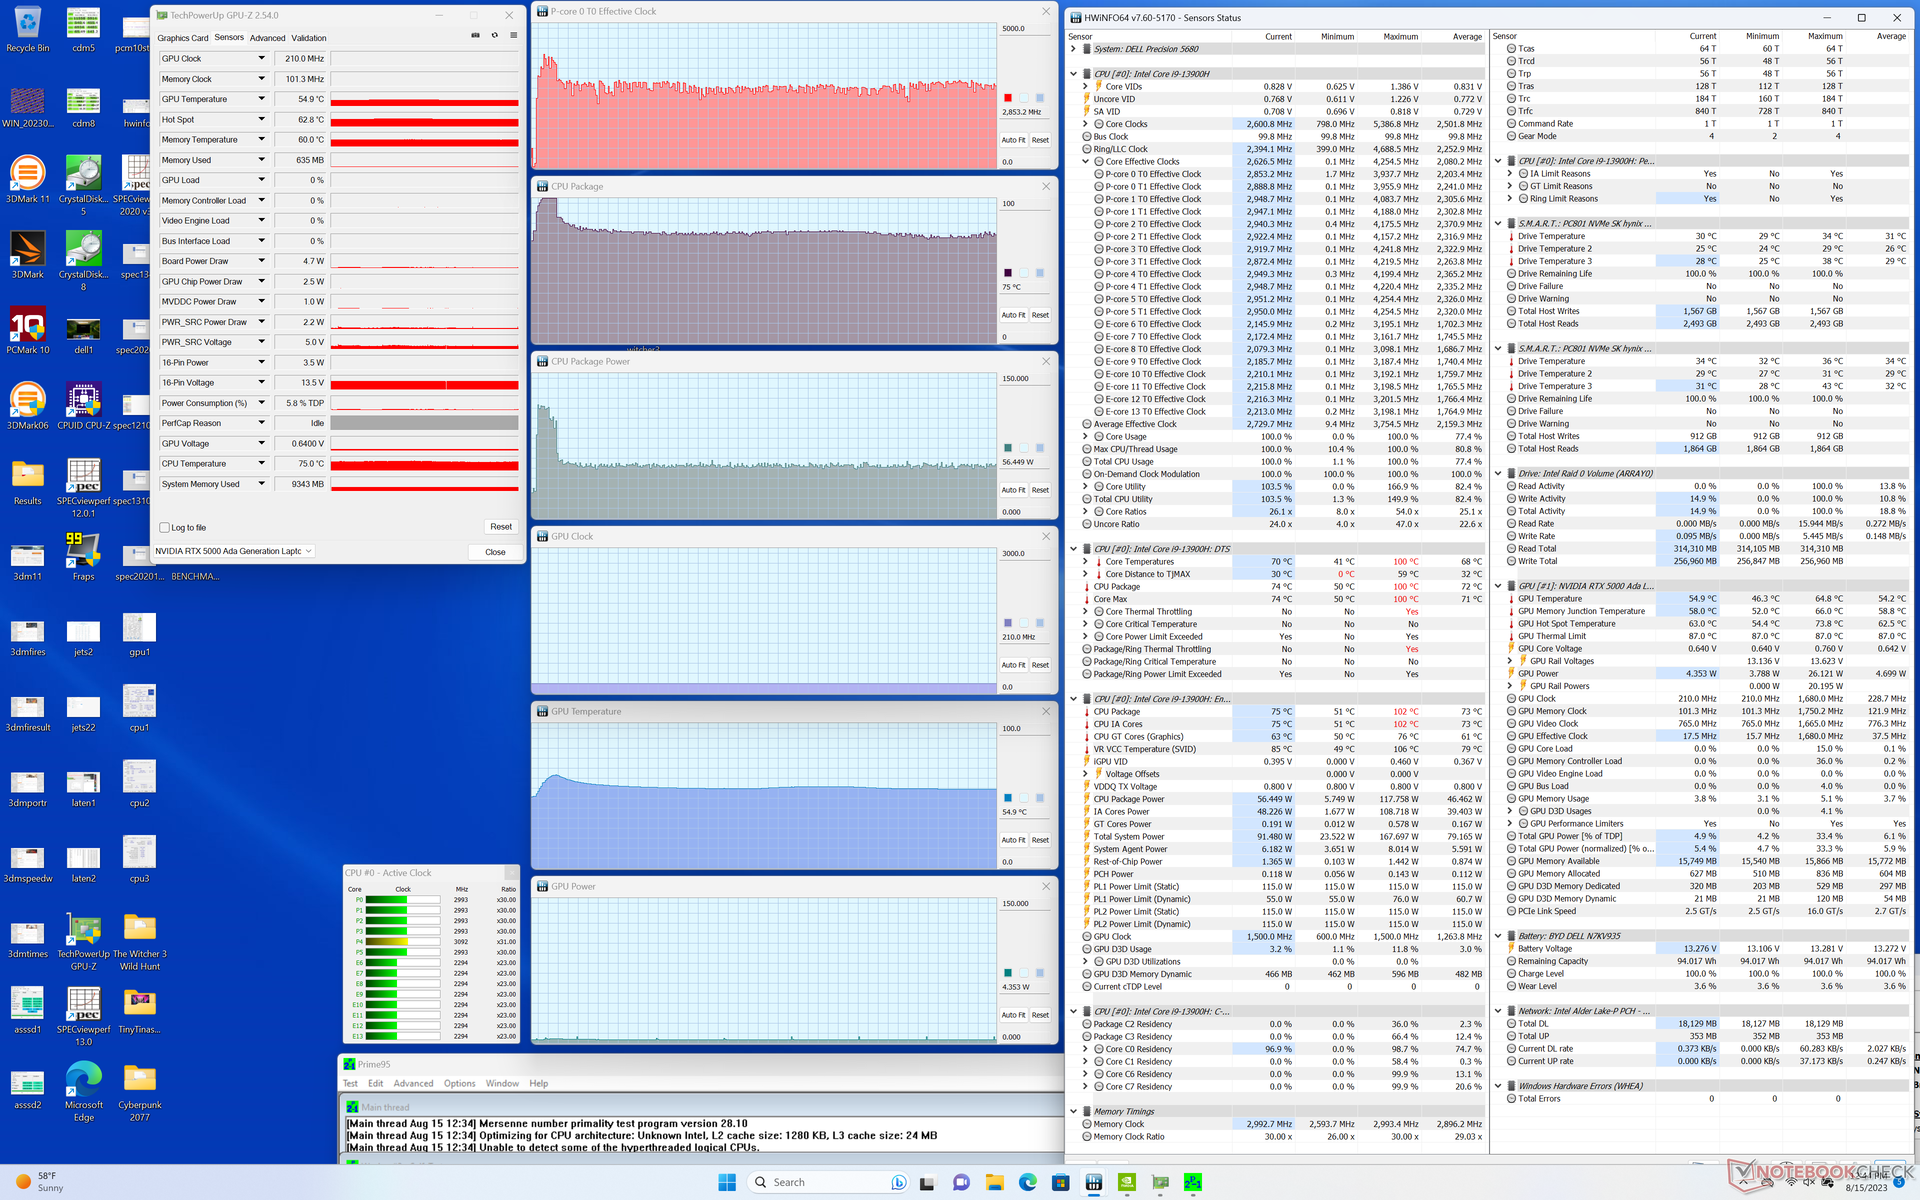
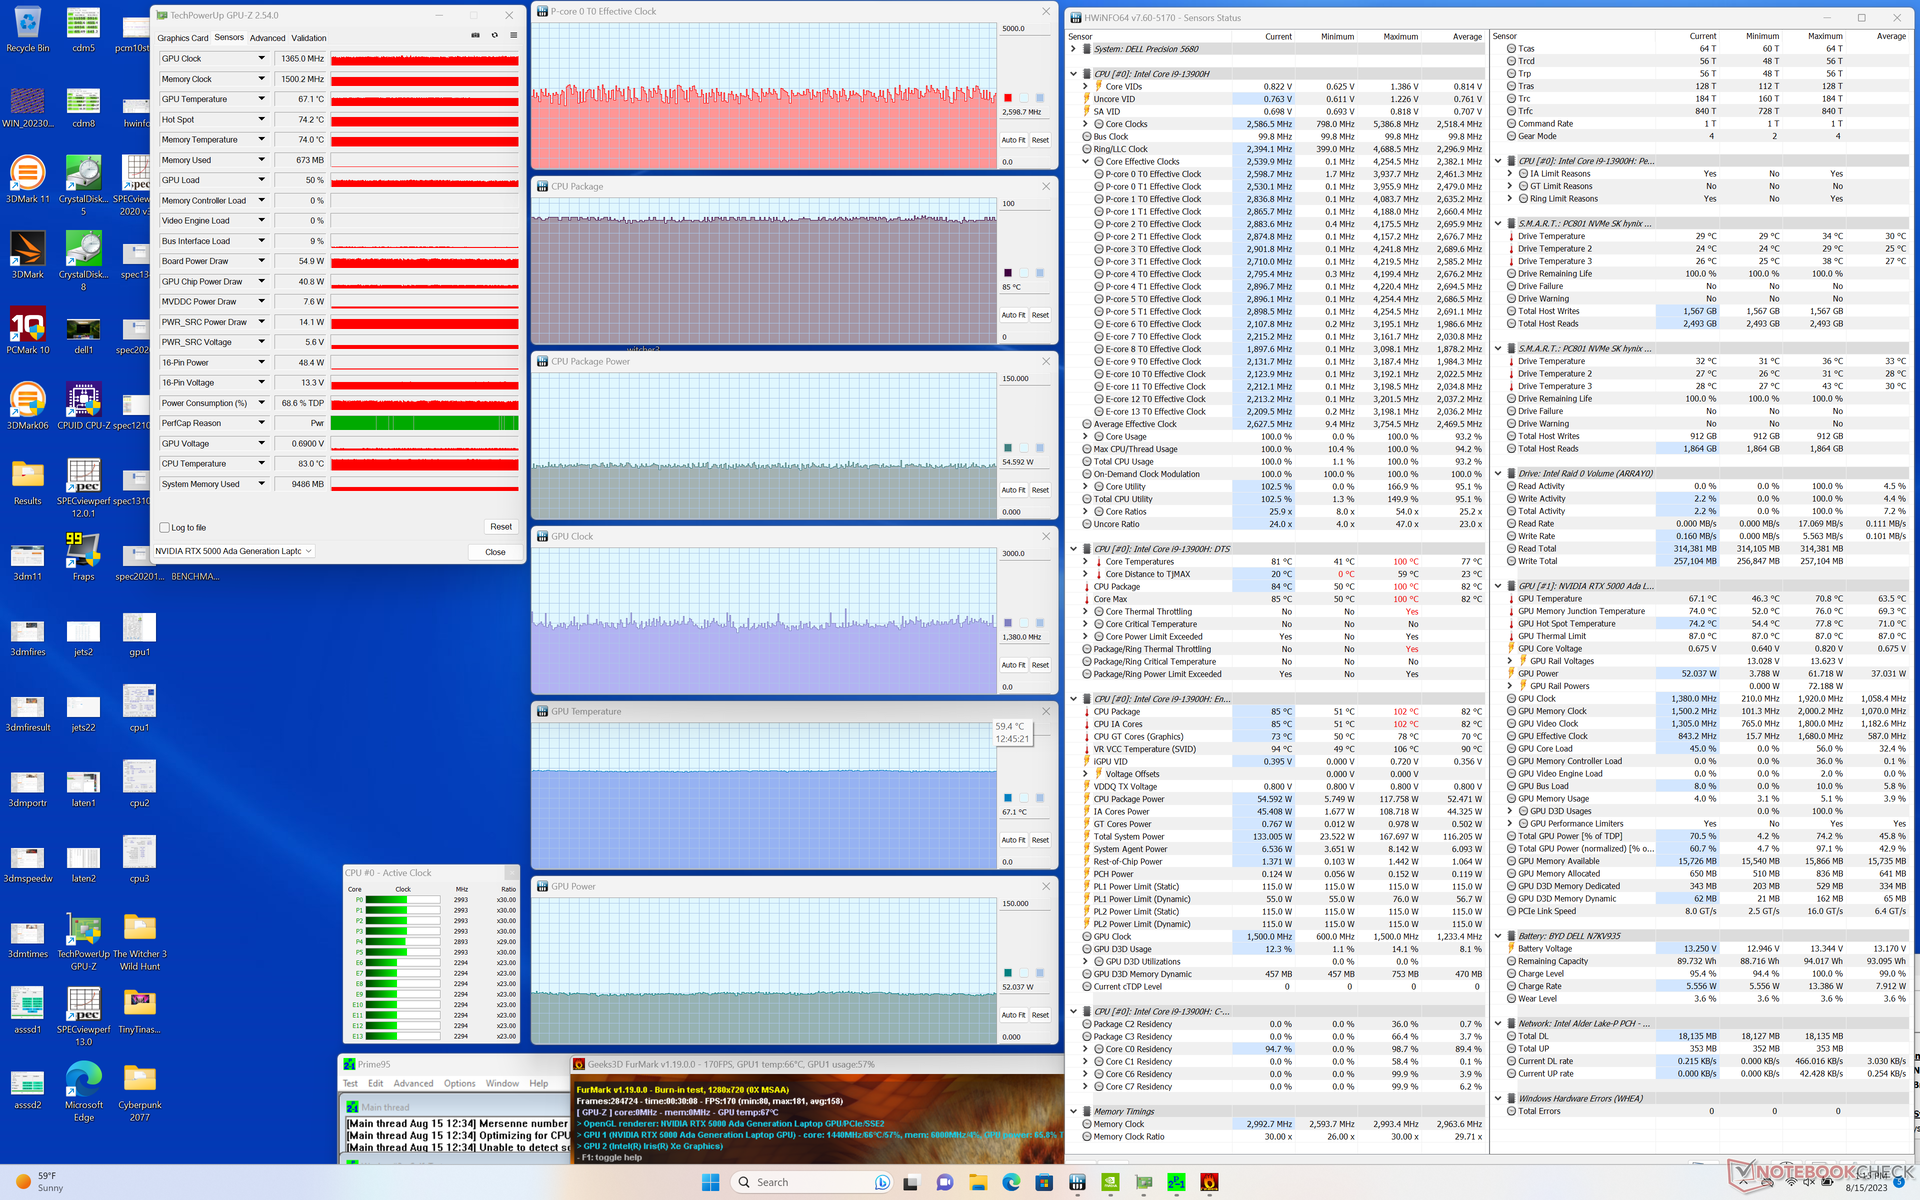
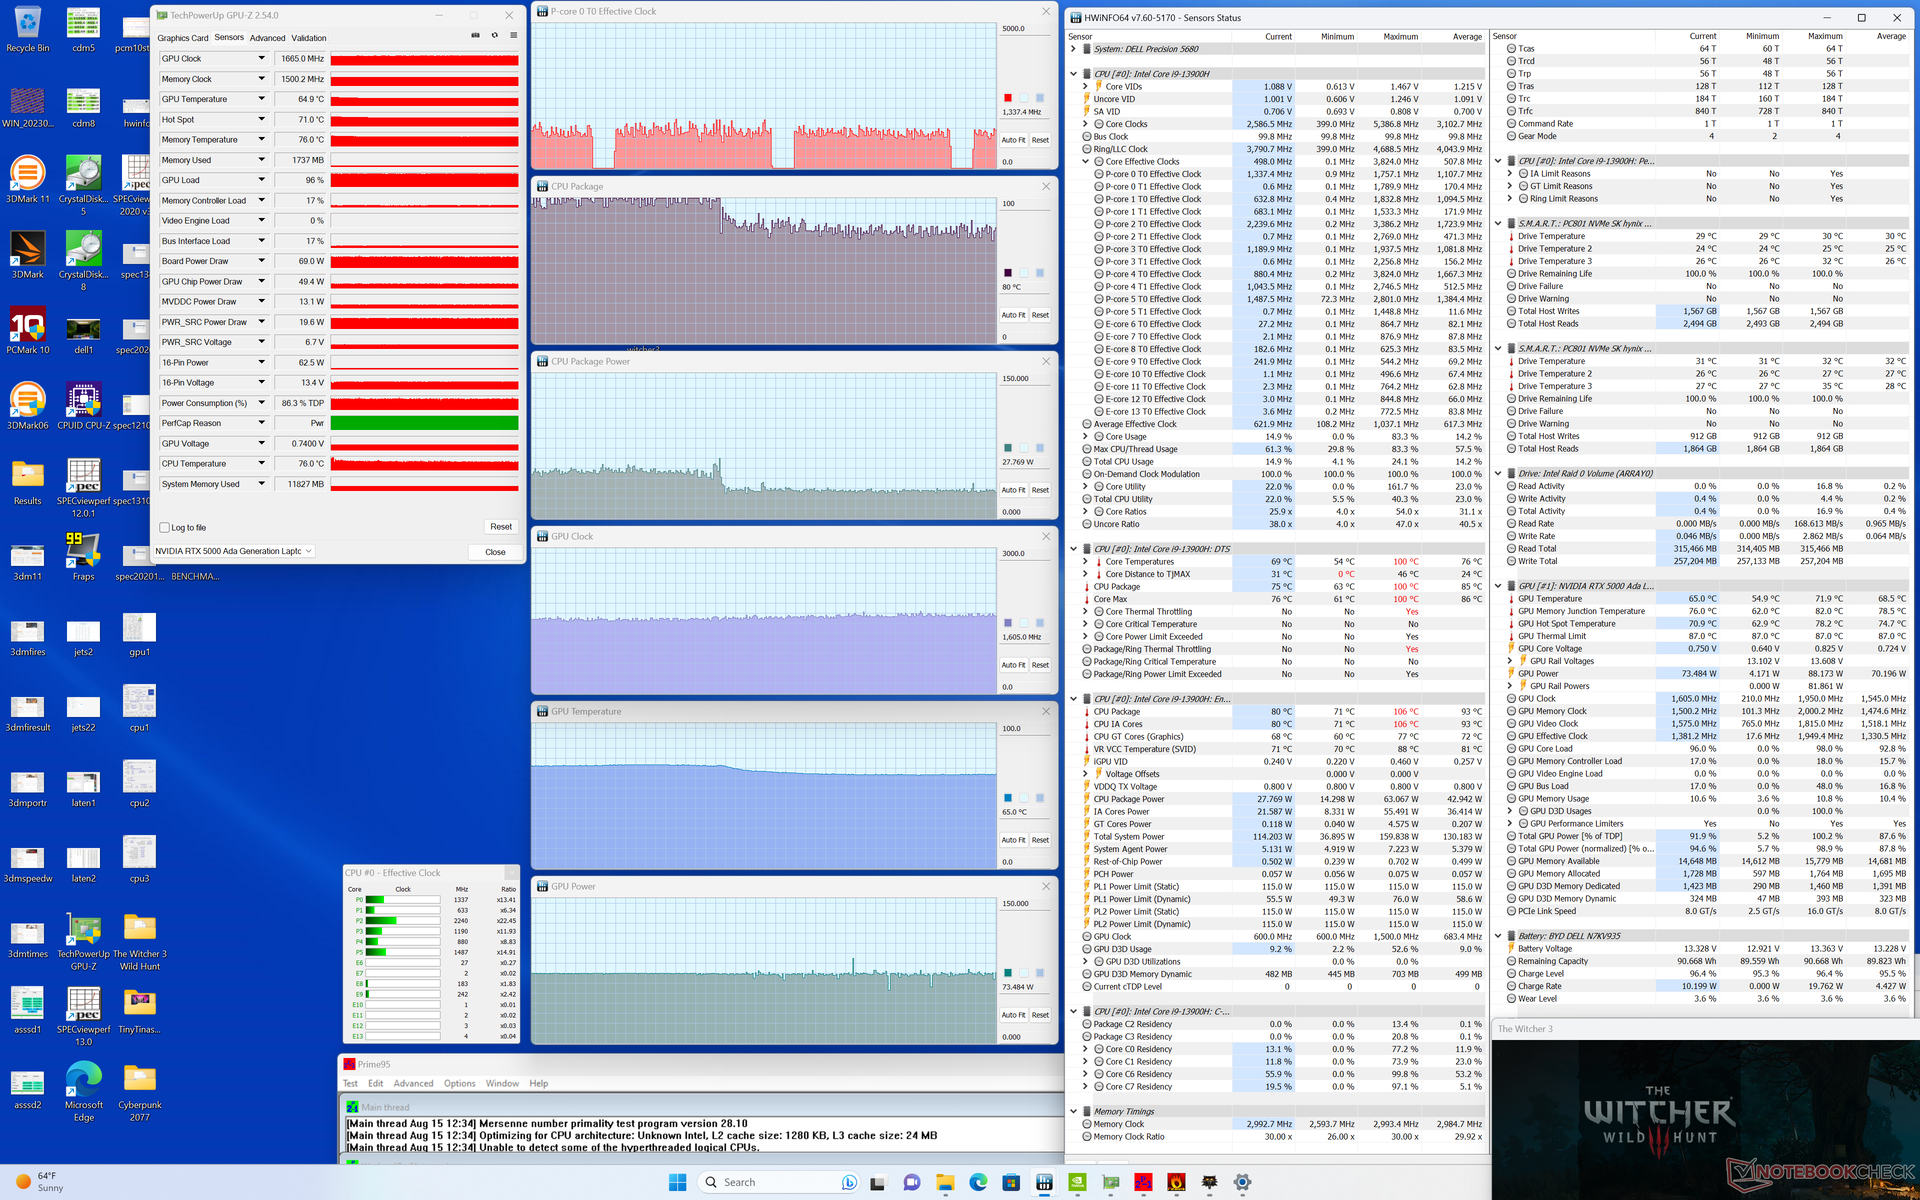
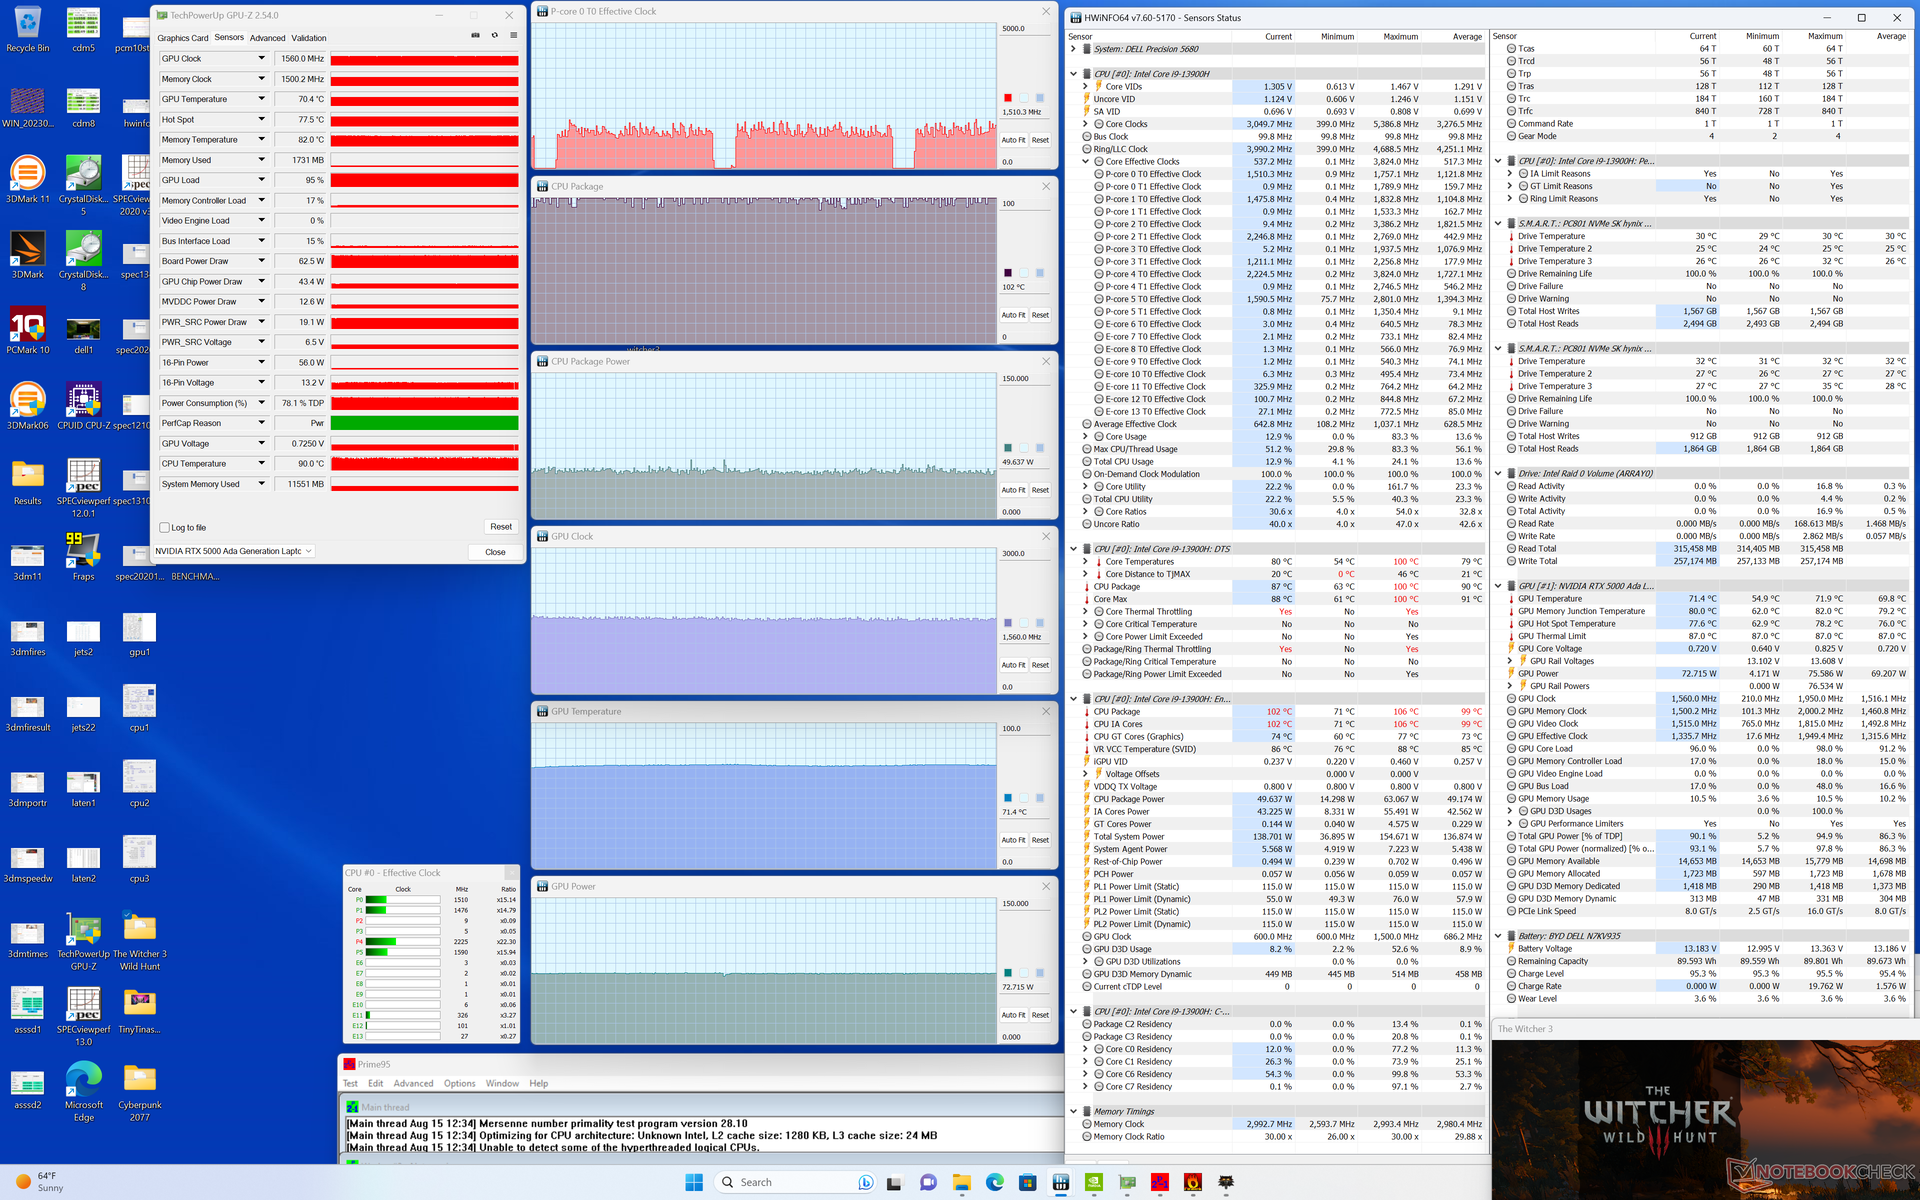
| CPU-klocka (GHz) | GPU-klocka (MHz) | Genomsnittlig CPU-temperatur (°C) | Genomsnittlig GPU-temperatur (°C) | |
| System i viloläge | -- | -- | 60 | 46 |
| Prime95 Stress | ~2.8 | -- | 75 | 55 |
| Prime95 + FurMark Stress | ~2.6 | 1365 | 85 | 67 |
| Witcher 3 Stress (Performance mode) | ~1,5 | 1560 | 100 | 72 |
| Witcher 3 Stress (balanserat läge) | ~1,3 | 1665 | 80 | 65 |
Högtalare
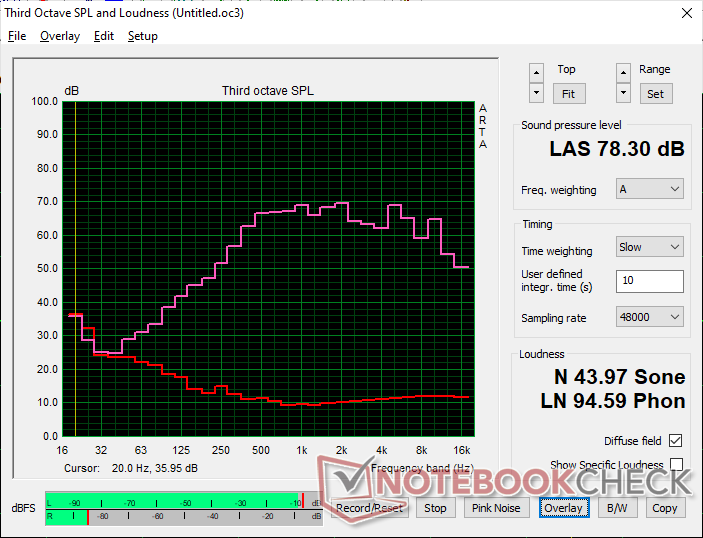
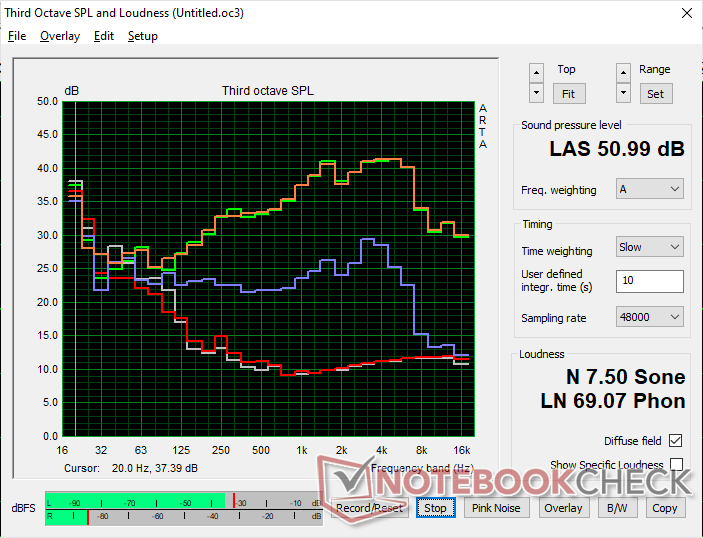
Dell Precision 5000 5680 ljudanalys
(±) | högtalarljudstyrkan är genomsnittlig men bra (78.3 dB)
Bas 100 - 315 Hz
(-) | nästan ingen bas - i genomsnitt 16.4% lägre än medianen
(±) | linjäriteten för basen är genomsnittlig (7.5% delta till föregående frekvens)
Mellan 400 - 2000 Hz
(+) | balanserad mellan - endast 3.9% från medianen
(+) | mids är linjära (4.5% delta till föregående frekvens)
Högsta 2 - 16 kHz
(+) | balanserade toppar - endast 2.2% från medianen
(±) | linjäriteten för toppar är genomsnittlig (8.3% delta till föregående frekvens)
Totalt 100 - 16 000 Hz
(±) | linjäriteten för det totala ljudet är genomsnittlig (15.5% skillnad mot median)
Jämfört med samma klass
» 35% av alla testade enheter i den här klassen var bättre, 10% liknande, 55% sämre
» Den bästa hade ett delta på 7%, genomsnittet var 17%, sämst var 35%
Jämfört med alla testade enheter
» 23% av alla testade enheter var bättre, 4% liknande, 73% sämre
» Den bästa hade ett delta på 4%, genomsnittet var 23%, sämst var 134%
Apple MacBook Pro 16 2021 M1 Pro ljudanalys
(+) | högtalare kan spela relativt högt (84.7 dB)
Bas 100 - 315 Hz
(+) | bra bas - bara 3.8% från medianen
(+) | basen är linjär (5.2% delta till föregående frekvens)
Mellan 400 - 2000 Hz
(+) | balanserad mellan - endast 1.3% från medianen
(+) | mids är linjära (2.1% delta till föregående frekvens)
Högsta 2 - 16 kHz
(+) | balanserade toppar - endast 1.9% från medianen
(+) | toppar är linjära (2.7% delta till föregående frekvens)
Totalt 100 - 16 000 Hz
(+) | det totala ljudet är linjärt (4.6% skillnad mot median)
Jämfört med samma klass
» 0% av alla testade enheter i den här klassen var bättre, 0% liknande, 100% sämre
» Den bästa hade ett delta på 5%, genomsnittet var 17%, sämst var 45%
Jämfört med alla testade enheter
» 0% av alla testade enheter var bättre, 0% liknande, 100% sämre
» Den bästa hade ett delta på 4%, genomsnittet var 23%, sämst var 134%
Energiförvaltning - Ada Lovelace skiner
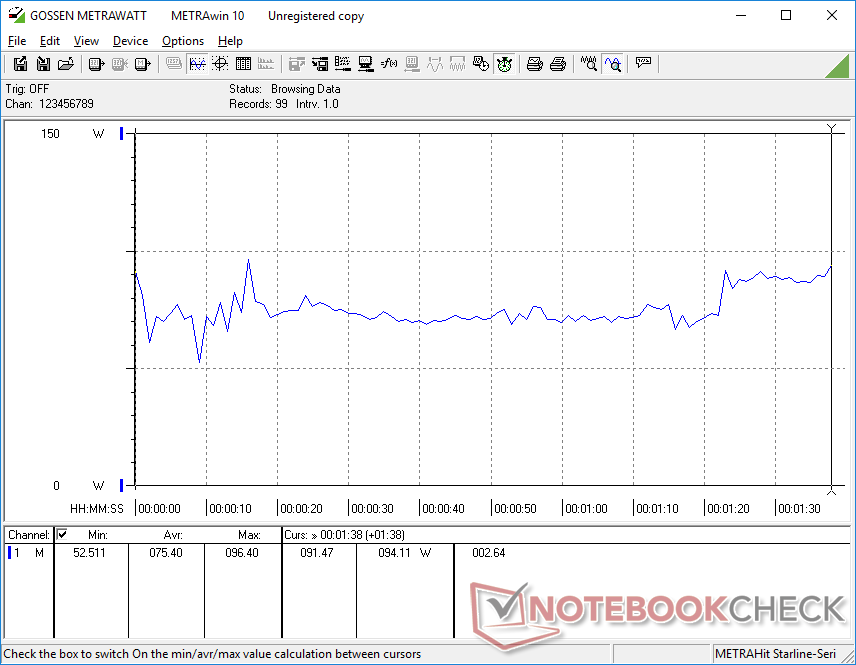
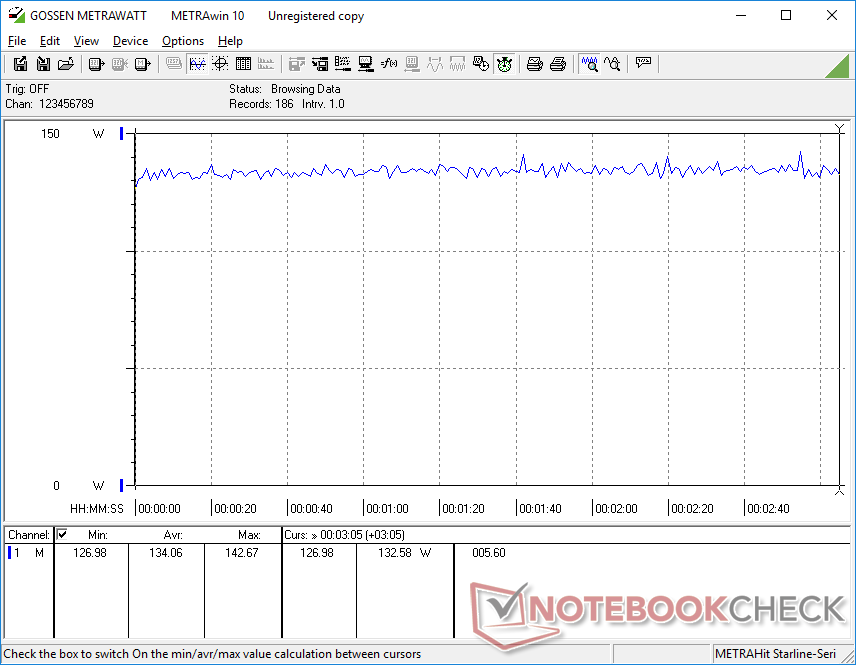
Strömförbrukning
Prestanda per watt är betydligt högre än för de flesta andra arbetsstationer eftersom vår Precision använder en nyare generation av Ada Lovelace GPU. Att köra Witcher 3skulle till exempel bara förbruka 134 W på vårt system jämfört med 159 W och 189 W på Precision 7670 Prestanda respektive HP ZBook Fury 16 G9, även om vår RTX 5000 GPU skulle överträffa deras RTX A5500 GPU:er som nämnts ovan.
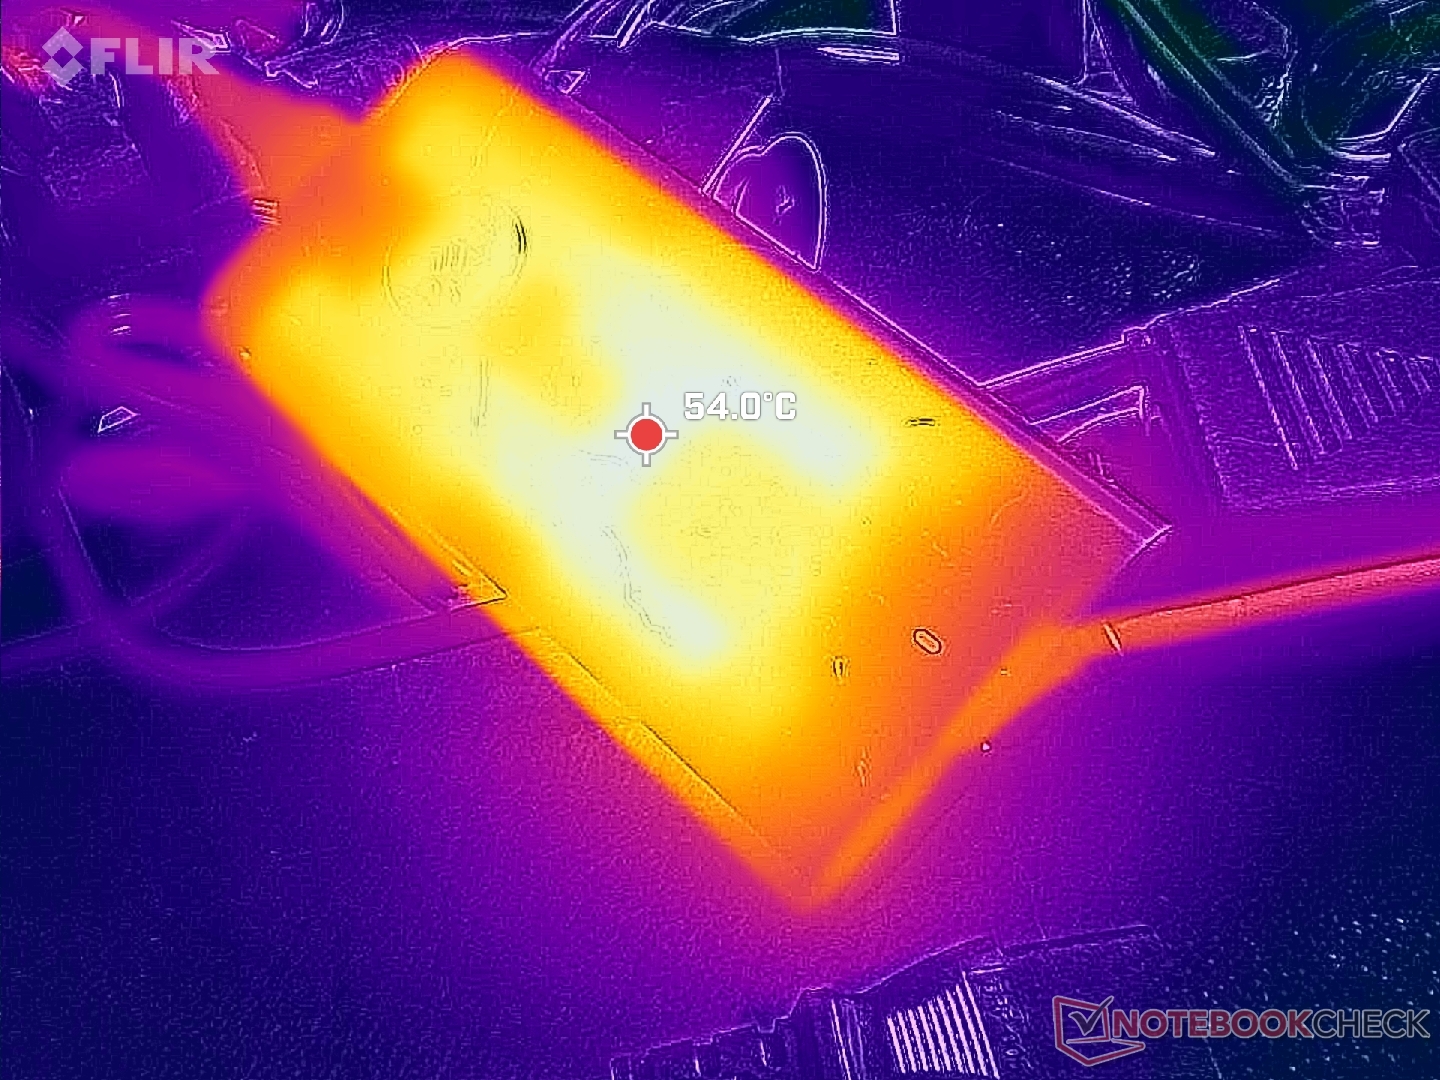
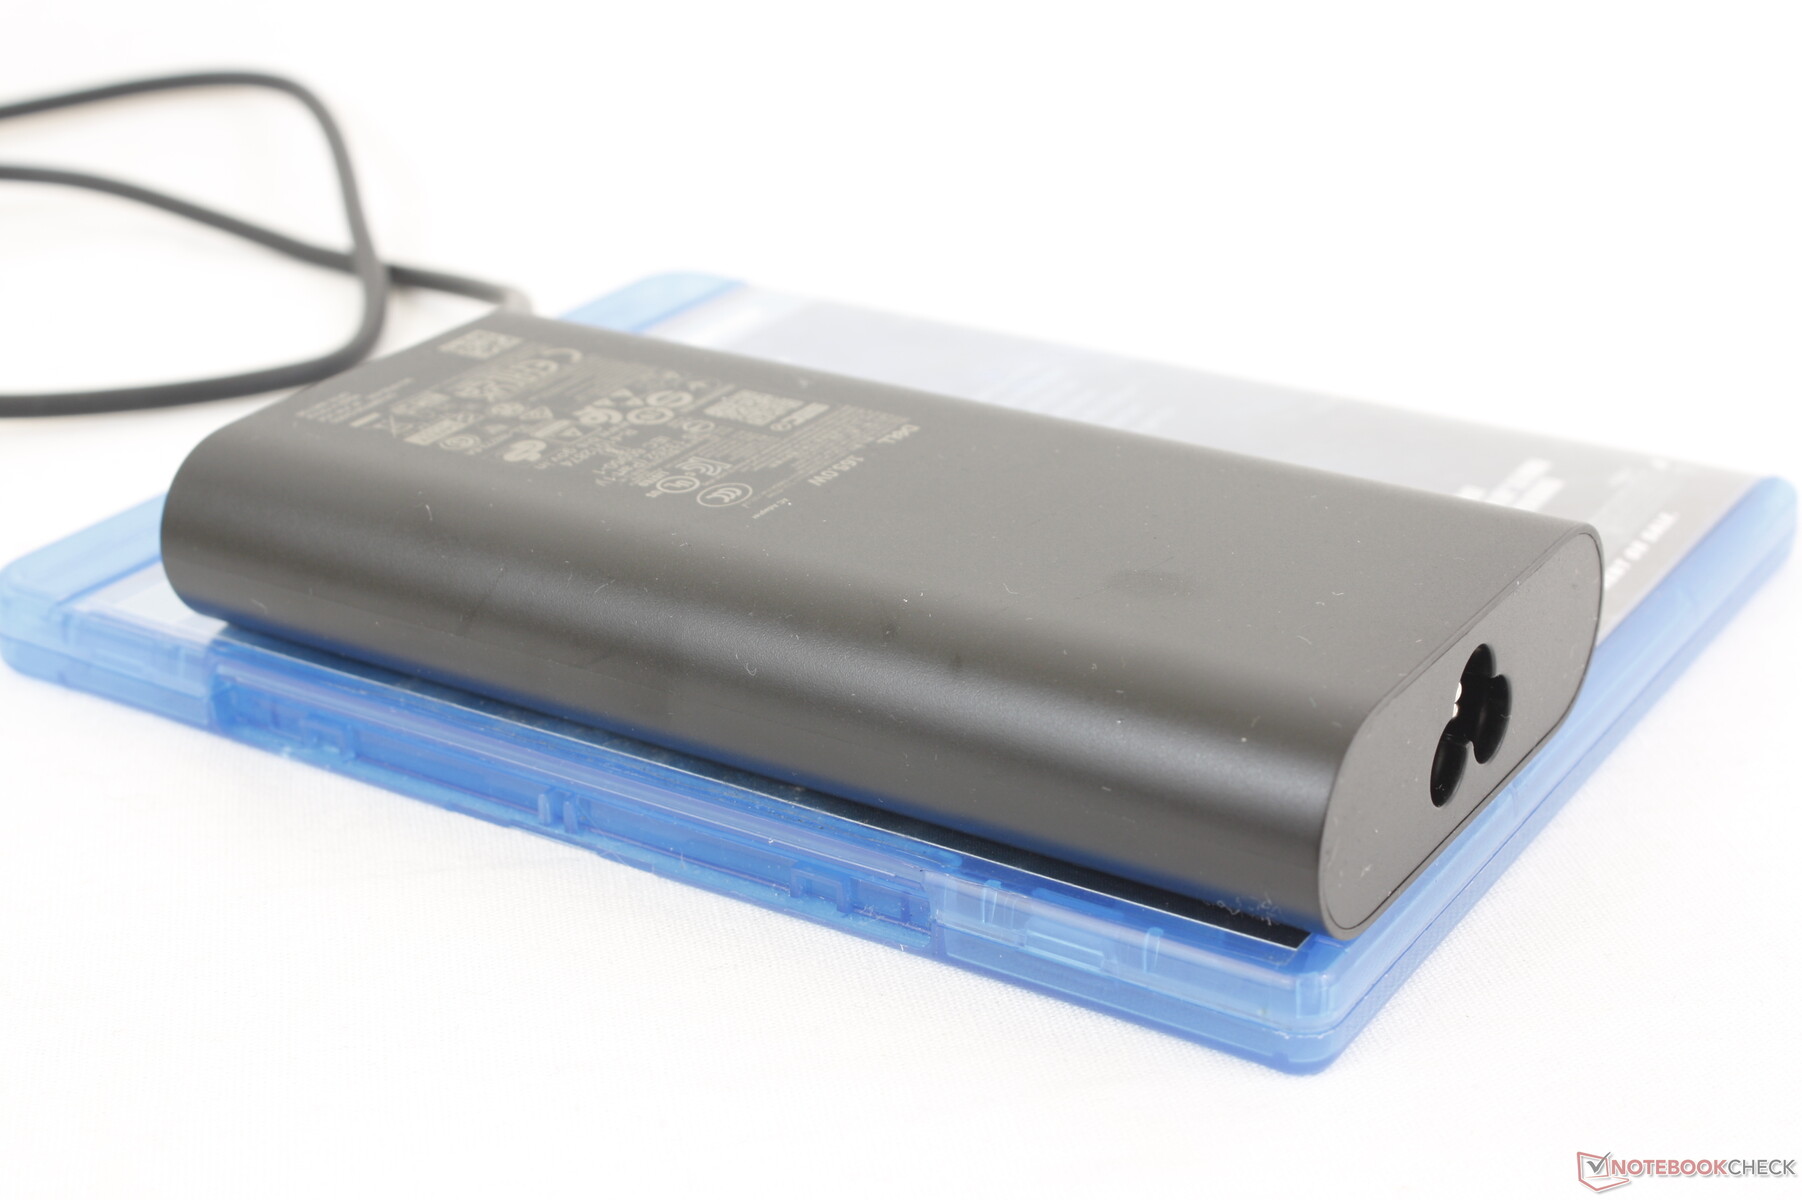
Den relativt lilla (~13,5 x 6,5 x 2,2 cm) 165 W USB-C AC-adaptern förtjänar också ett omnämnande för sin höga uteffekt. De flesta befintliga USB-C-adaptrar är begränsade till 100 W eller 140 W, vilket gör vår 165 W-adapter till en av de mest mångsidiga. Den här nya adaptern löser direkt problemen med problem med batteriladdning som vi upplevde på den äldre Precision 7000-modellen som levererades med en mindre kapabel 130 W USB-C-adapter.
| Av/Standby | |
| Låg belastning | |
| Hög belastning |
|
Förklaring:
min: | |
| Dell Precision 5000 5680 i9-13900H, RTX 5000 Ada Generation Laptop, 2x SK hynix PC801 HFS512GEJ9X101N RAID 0, OLED, 3840x2400, 16" | Dell Precision 7000 7670 Performance i9-12950HX, RTX A5500 Laptop GPU, , OLED, 3840x2400, 16" | HP ZBook Fury 16 G9 i9-12950HX, RTX A5500 Laptop GPU, Micron 3400 1TB MTFDKBA1T0TFH, IPS, 3840x2400, 16" | Lenovo ThinkPad P16 G1 RTX A5500 i9-12950HX, RTX A5500 Laptop GPU, WDC PC SN810 2TB, IPS, 3840x2400, 16" | MSI CreatorPro Z16P B12UKST i7-12700H, RTX A3000 Laptop GPU, Samsung PM9A1 MZVL21T0HCLR, IPS, 2560x1600, 16" | Asus ExpertBook B6 Flip B6602FC2 i9-12950HX, RTX A2000 Laptop GPU, Samsung PM9A1 MZVL21T0HCLR, IPS, 2560x1600, 16" | |
|---|---|---|---|---|---|---|
| Power Consumption | -99% | -86% | -53% | -18% | -35% | |
| Idle Minimum * (Watt) | 8 | 16.4 -105% | 19.5 -144% | 7.5 6% | 10.8 -35% | 10.5 -31% |
| Idle Average * (Watt) | 10.4 | 35.9 -245% | 29 -179% | 20.1 -93% | 16.3 -57% | 11.9 -14% |
| Idle Maximum * (Watt) | 30.5 | 47 -54% | 40.7 -33% | 40 -31% | 16.9 45% | 18 41% |
| Load Average * (Watt) | 75.4 | 147.1 -95% | 142.1 -88% | 137 -82% | 111.7 -48% | 182 -141% |
| Witcher 3 ultra * (Watt) | 134 | 158.8 -19% | 188.6 -41% | 208 -55% | 152.1 -14% | 177.5 -32% |
| Load Maximum * (Watt) | 175 | 311 -78% | 224.4 -28% | 285.9 -63% | 177.4 -1% | 229 -31% |
* ... mindre är bättre
Power Consumption Witcher 3 / Stresstest
Power Consumption external Monitor
Batteritid
Batteritiden är utmärkt med tanke på den högpresterande och krävande 4K OLED-panelen. Vi kan spela in nästan 10 timmar av verklig WLAN-surfning när vi använder den balanserade profilen med iGPU aktiv jämfört med nästan hälften så mycket på alternativ som Lenovo ThinkPad P16 G1 ellerMSI CreatorPro Z16P.
Laddning från tom till full kapacitet tar cirka 2 timmar med den medföljande 165 W AC-adaptern. Vår 65 W USB-C-adapter från tredje part kan också ladda systemet, om än långsammare.
| Dell Precision 5000 5680 i9-13900H, RTX 5000 Ada Generation Laptop, 98 Wh | Dell Precision 7000 7670 Performance i9-12950HX, RTX A5500 Laptop GPU, 93 Wh | HP ZBook Fury 16 G9 i9-12950HX, RTX A5500 Laptop GPU, 95 Wh | Lenovo ThinkPad P16 G1 RTX A5500 i9-12950HX, RTX A5500 Laptop GPU, 94 Wh | MSI CreatorPro Z16P B12UKST i7-12700H, RTX A3000 Laptop GPU, 90 Wh | Asus ExpertBook B6 Flip B6602FC2 i9-12950HX, RTX A2000 Laptop GPU, 90 Wh | |
|---|---|---|---|---|---|---|
| Batteridrifttid | -53% | -46% | -41% | -41% | -14% | |
| Reader / Idle (h) | 17.9 | 5.3 -70% | 12.5 -30% | |||
| WiFi v1.3 (h) | 9.9 | 4.7 -53% | 6 -39% | 5.8 -41% | 5.8 -41% | 8.7 -12% |
| Load (h) | 1.7 | 1.2 -29% | 1.7 0% | |||
| H.264 (h) | 5.8 |
För
Emot
Verdict - Mer kraftfull än den ser ut att vara
Precision 5680 är helt enkelt en av de smidigaste och snabbaste mobila arbetsstationerna i hela Dells sortiment. Den bärbara designen, 165 W USB-C-adaptern, den utmärkta 4K OLED-skärmen och den kraftfulla RTX 5000 GPU:n sticker alla ut som de starkaste egenskaperna hos modellen. Den senare är särskilt ansvarig för mycket av prestandaökningarna och batteritidsfördelarna jämfört med de flesta andra arbetsstationer på grund av sin Ada Lovelace-arkitektur och mycket höga prestanda per watt.
Precision 5680 erbjuder några av de högsta prestanda-per-watt i den växande kategorin tunna och lätta arbetsstationer
.
Hardcore-användare av arbetsstationer kan fortfarande föredra större och tjockare modeller som HP ZBook Fury 16 eller Precision 7670 eftersom den tunna Precision 5680-designen avstår från vissa viktiga funktioner som expanderbart RAM-minne, WAN, ECC RAM-minne och bredare portalternativ. Den hemska klickplattan är inte alls lika exakt som pekplattorna på HP eller Lenovo ThinkPad P16 som har riktiga musknappar för bättre kontroll.
Pris och tillgänglighet
Dell levererar nu Precision 5680 från $2490 USD upp till över $6500 enligt recensionen.
Dell Precision 5000 5680
- 08/18/2023 v7 (old)
Allen Ngo
Genomskinlighet
Valet av enheter som ska granskas görs av vår redaktion. Testprovet gavs till författaren som ett lån av tillverkaren eller återförsäljaren för denna recension. Långivaren hade inget inflytande på denna recension och inte heller fick tillverkaren en kopia av denna recension innan publiceringen. Det fanns ingen skyldighet att publicera denna recension. Som ett oberoende medieföretag är Notebookcheck inte föremål för auktoritet från tillverkare, återförsäljare eller förlag.
This is how Notebookcheck is testingEvery year, Notebookcheck independently reviews hundreds of laptops and smartphones using standardized procedures to ensure that all results are comparable. We have continuously developed our test methods for around 20 years and set industry standards in the process. In our test labs, high-quality measuring equipment is utilized by experienced technicians and editors. These tests involve a multi-stage validation process. Our complex rating system is based on hundreds of well-founded measurements and benchmarks, which maintains objectivity.
Price comparison

