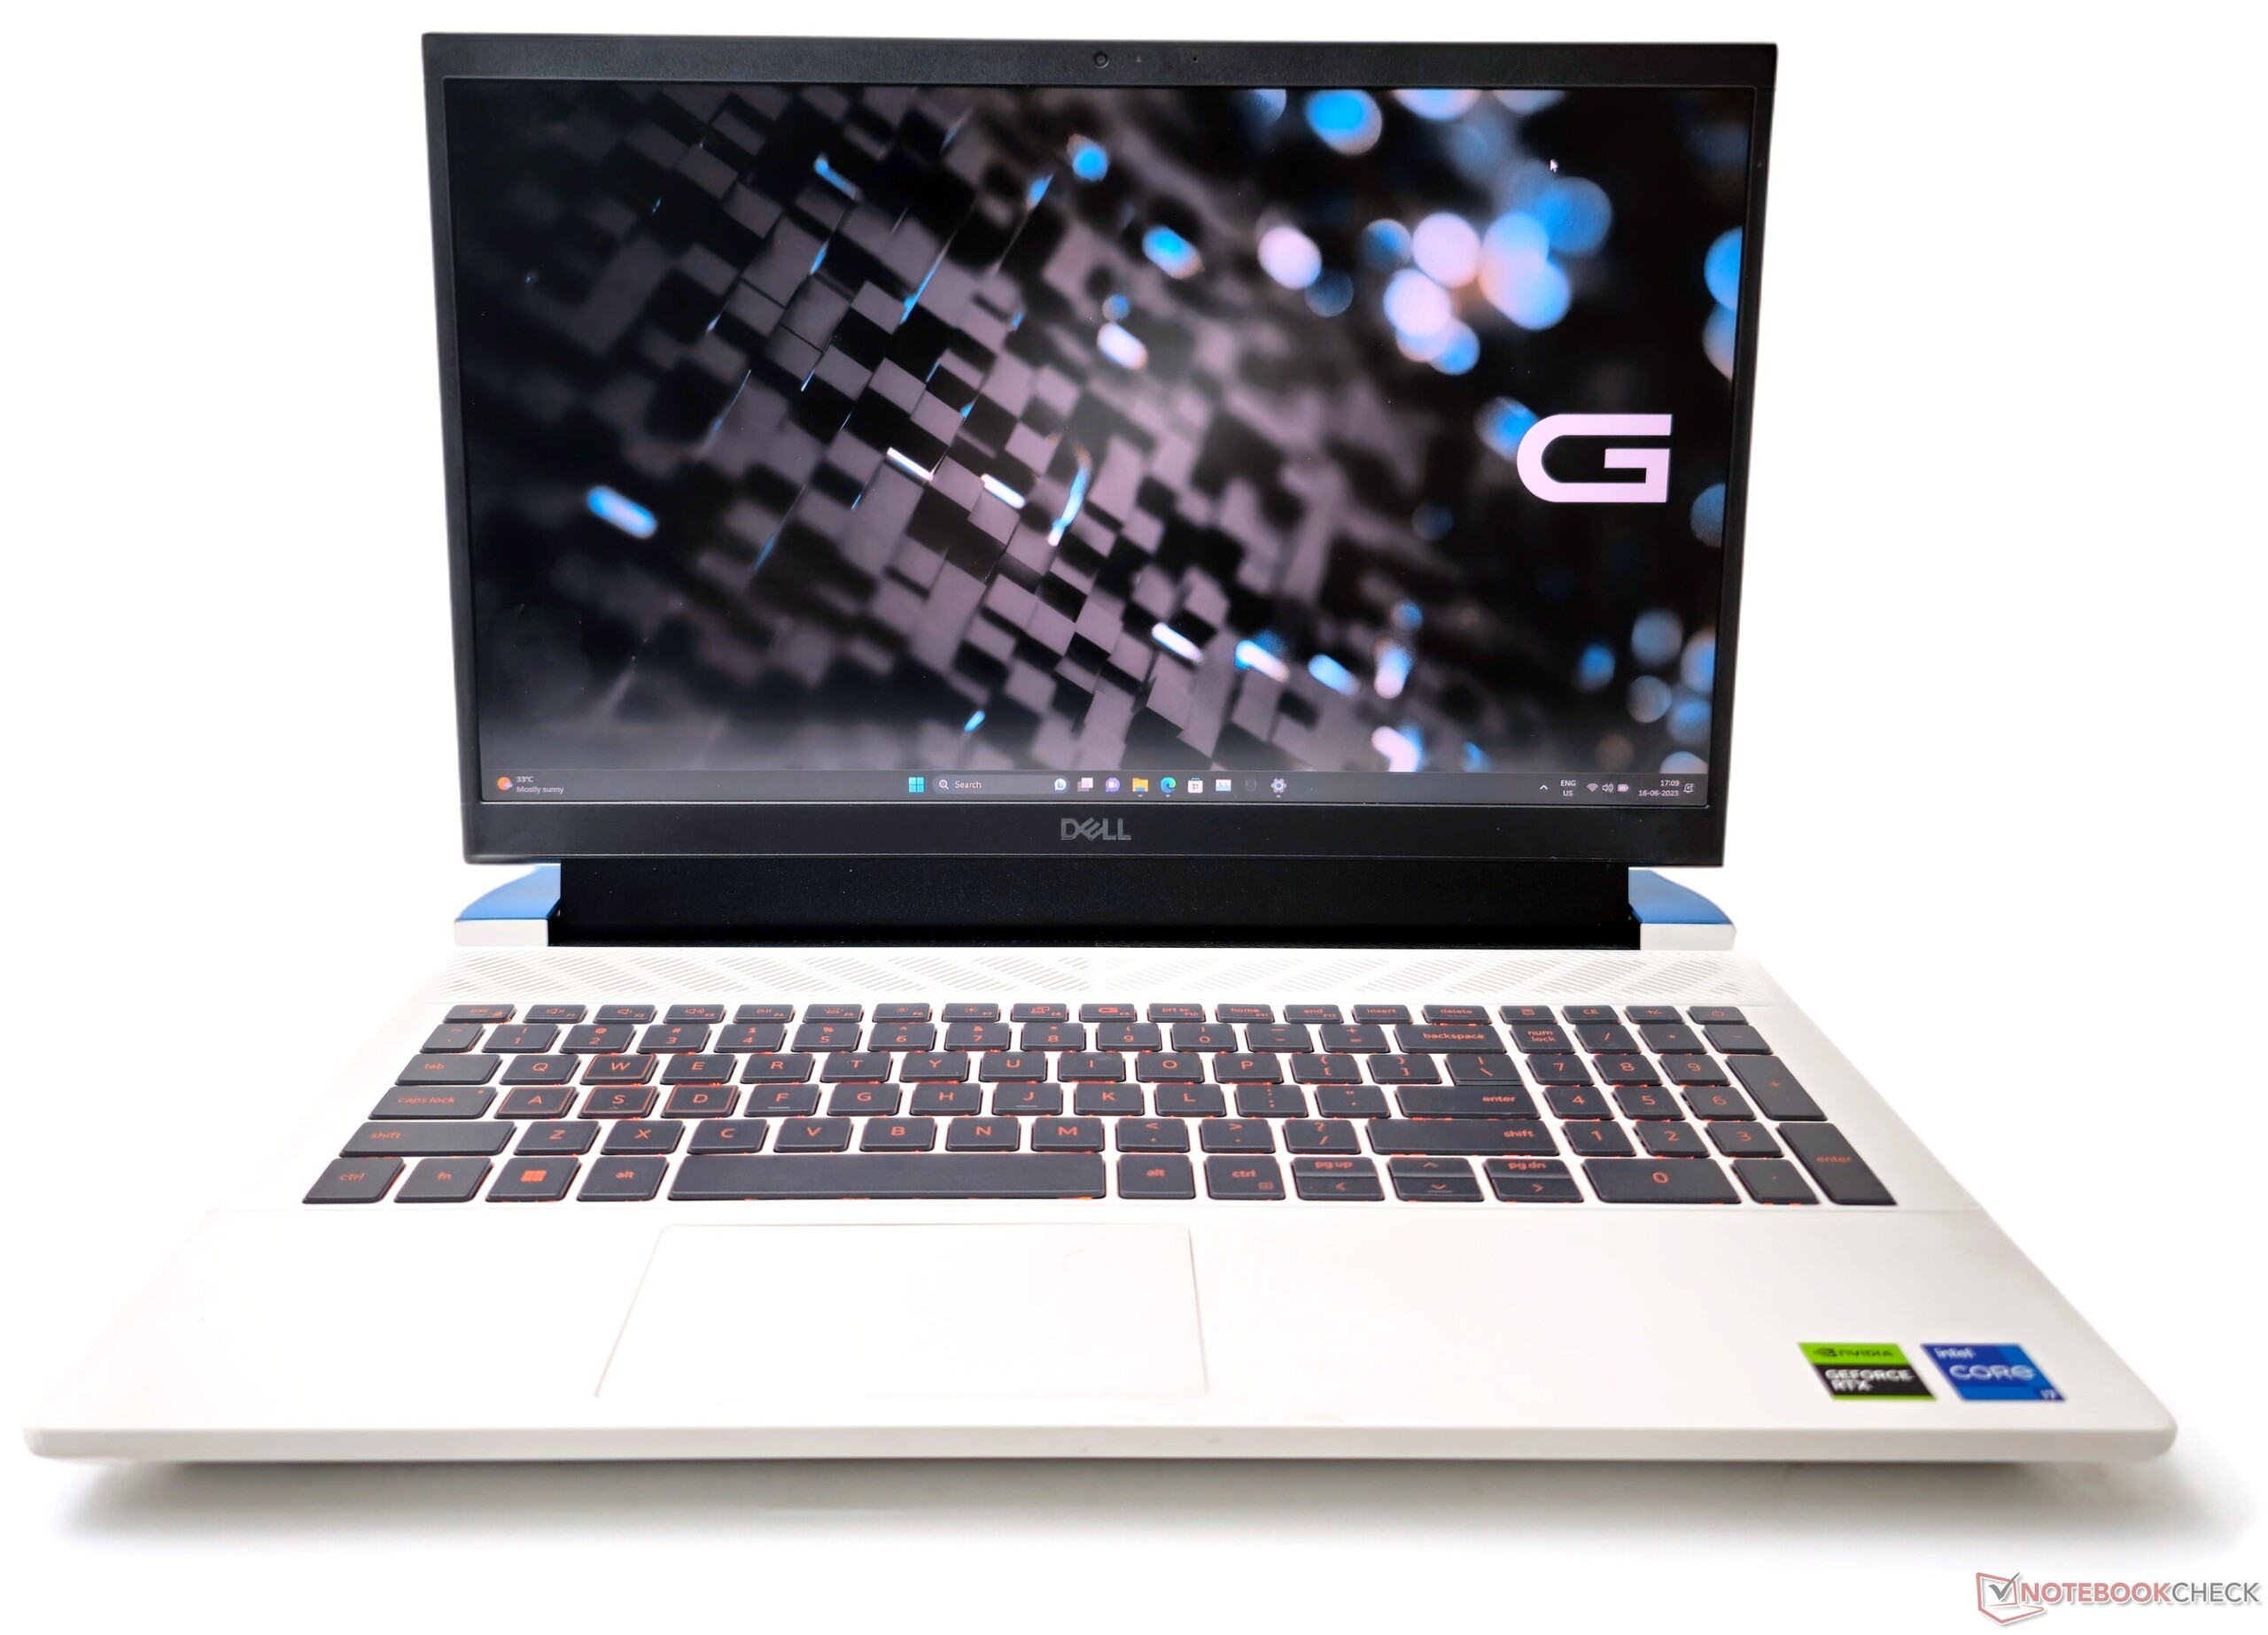
Dell G15 5530 recension: Ett livskraftigt Alienware-alternativ nu med Raptor Lake-HX

Dell G-serien är inriktad på att ge Alienware skicklighet till dem som föredrar att inte betala genom tänderna för en kapabel spelbärbar dator. Tillbaka under MWC 2023 introducerade Dell uppdaterade G15- och G16-serierna med Intel Raptor Lake-HX och Nvidia GeForce RTX 40-serie GPU-alternativ.
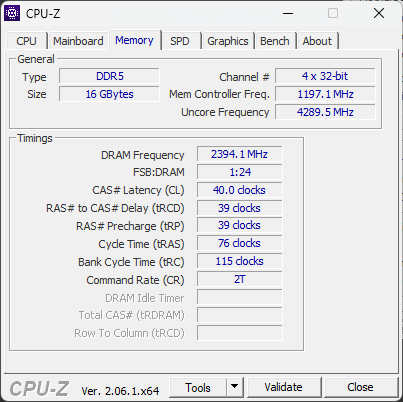
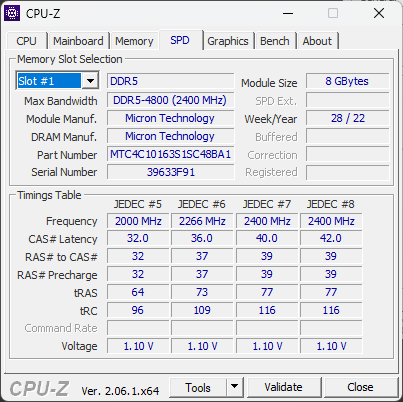
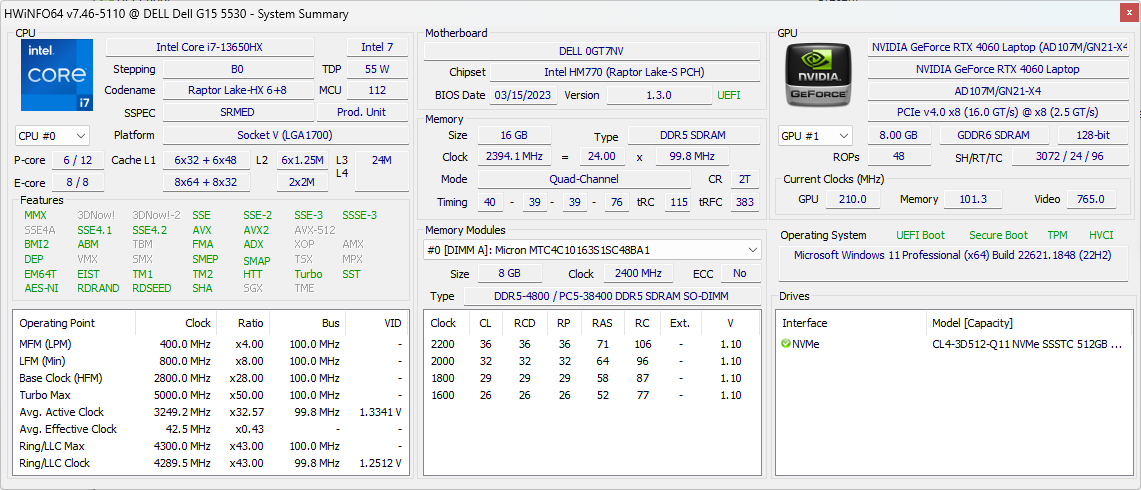
Vi har nu med oss Dell G15 5530 med en toppkonfiguration med Intel Core i7-13650HX, Nvidia GeForce RTX 4060 Laptop GPU16 GB DDR5-4800 RAM-minne, 512 GB NVMe SSD och en 15,6-tums 165 Hz FHD G-Sync-skärm.
I den här recensionen testar vi Dell G15 5530 och ser hur väl den står sig mot konkurrenterna för det begärda priset på 1 58 990 kr (1 449 € eller 1659,99 USD).
Potentiella konkurrenter i jämförelse
Gradering | Datum | Modell | Vikt | Höjd | Storlek | Upplösning | Pris |
|---|---|---|---|---|---|---|---|
| 84.2 % v7 (old) | 06/2023 | Dell G15 5530 i7-13650HX, GeForce RTX 4060 Laptop GPU | 3 kg | 26.95 mm | 15.60" | 1920x1080 | |
| 87.4 % v7 (old) | 03/2023 | Asus ROG Strix G18 G814JI i7-13650HX, GeForce RTX 4070 Laptop GPU | 3 kg | 31 mm | 18.00" | 2560x1600 | |
| 87.9 % v7 (old) | 05/2023 | Lenovo Legion Pro 5 16IRX8 i7-13700HX, GeForce RTX 4060 Laptop GPU | 2.5 kg | 26.8 mm | 16.00" | 2560x1600 | |
| 89.7 % v7 (old) | 06/2023 | Asus ROG Flow X16 GV601V i9-13900H, GeForce RTX 4060 Laptop GPU | 2.1 kg | 19.4 mm | 16.00" | 2560x1600 | |
| 82.1 % v7 (old) | 02/2023 | MSI Katana 17 B13VFK i7-13620H, GeForce RTX 4060 Laptop GPU | 2.8 kg | 25.2 mm | 17.30" | 1920x1080 | |
| 86.9 % v7 (old) | 06/2023 | Asus TUF Gaming A16 FA617XS R9 7940HS, Radeon RX 7600S | 2.2 kg | 22.1 mm | 16.00" | 1920x1200 | |
| 88.4 % v7 (old) | 04/2023 | Asus ROG Strix G17 G713PI R9 7945HX, GeForce RTX 4070 Laptop GPU | 2.8 kg | 30.7 mm | 17.30" | 2560x1440 | |
| 89 % v7 (old) | 04/2023 | Medion Erazer Major X20 i9-13900HX, GeForce RTX 4070 Laptop GPU | 2.4 kg | 29 mm | 16.00" | 2560x1600 |
Chassi: Tungviktare i plast kompletterad med en skrymmande power brick
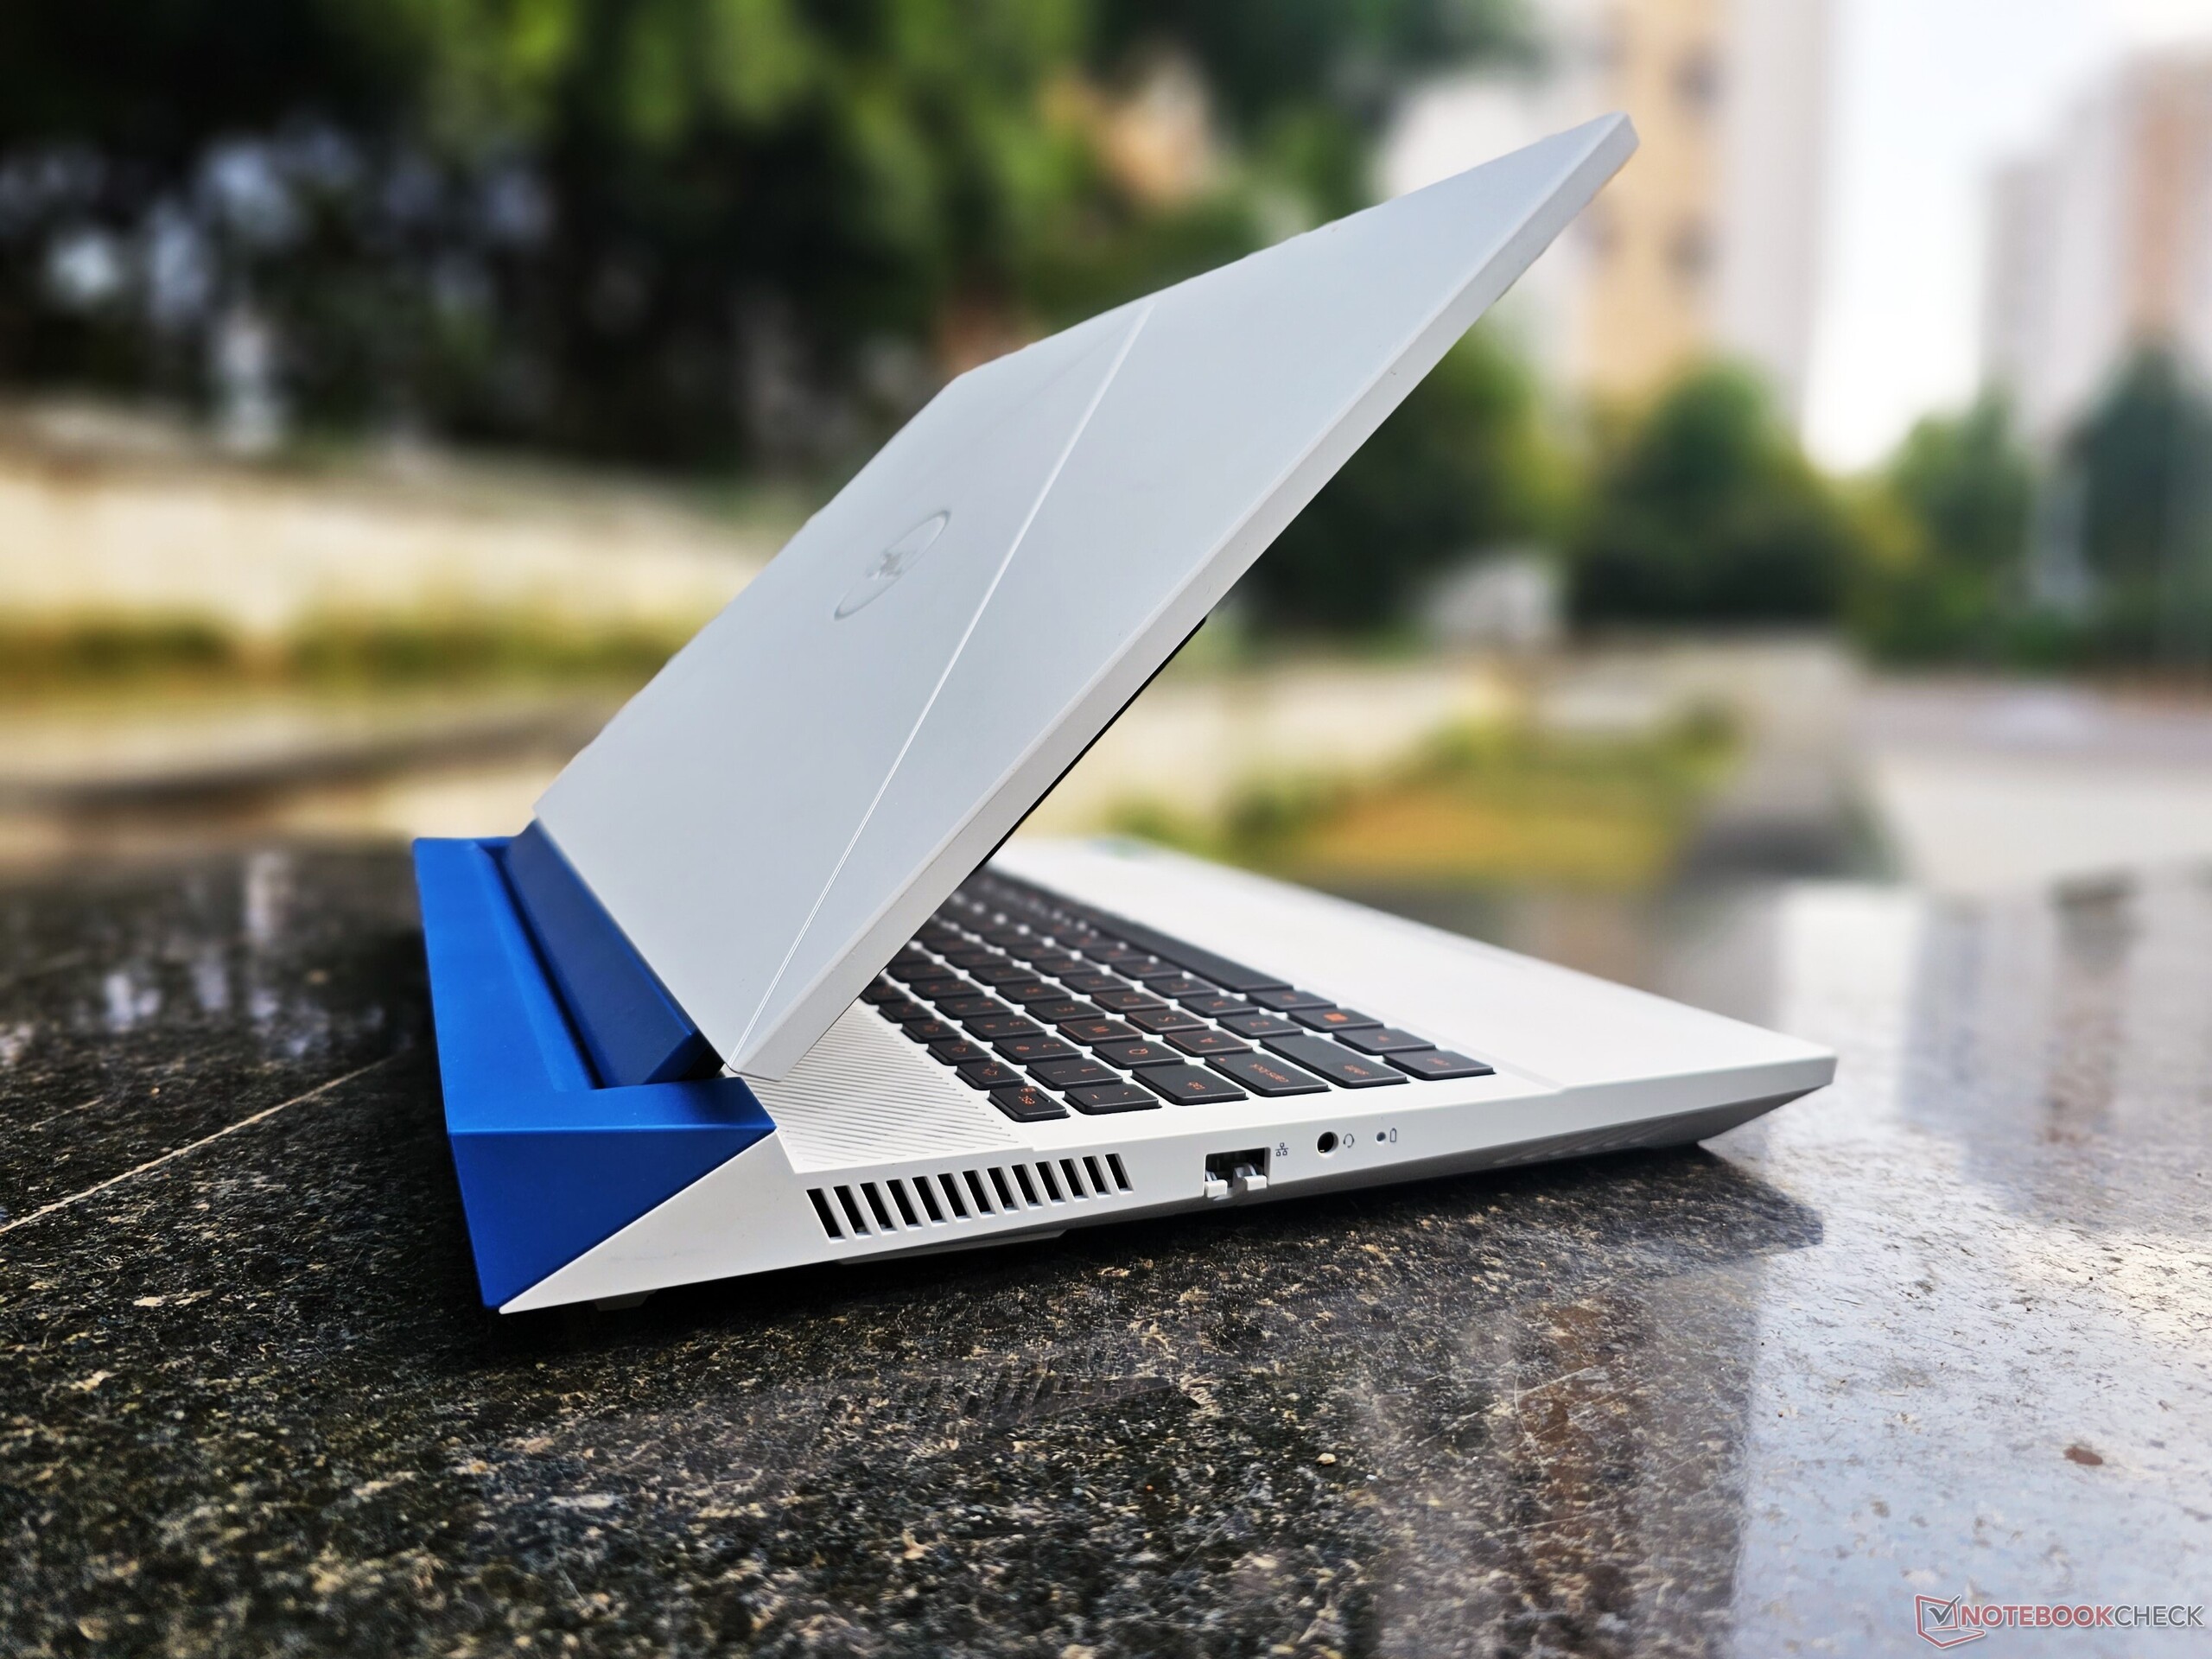
Dell verkar ha skurit ner på RGB-pizzan den här gången, till skillnad från vad vi tidigare har sett medG15 5520och G15 5521 Special Edition. Chassit på 5530 är mer eller mindre identiskt med det på G15 5510.
Vår G15 5530-enhet är Quantum White-varianten med en Deep Space Blue termisk hylla. Dessutom erbjuder Dell två alternativa färgval för den här modellen: Dark Shadow Gray med en svart termisk hylla och Pop Purple med en Neo Mint termisk hylla.
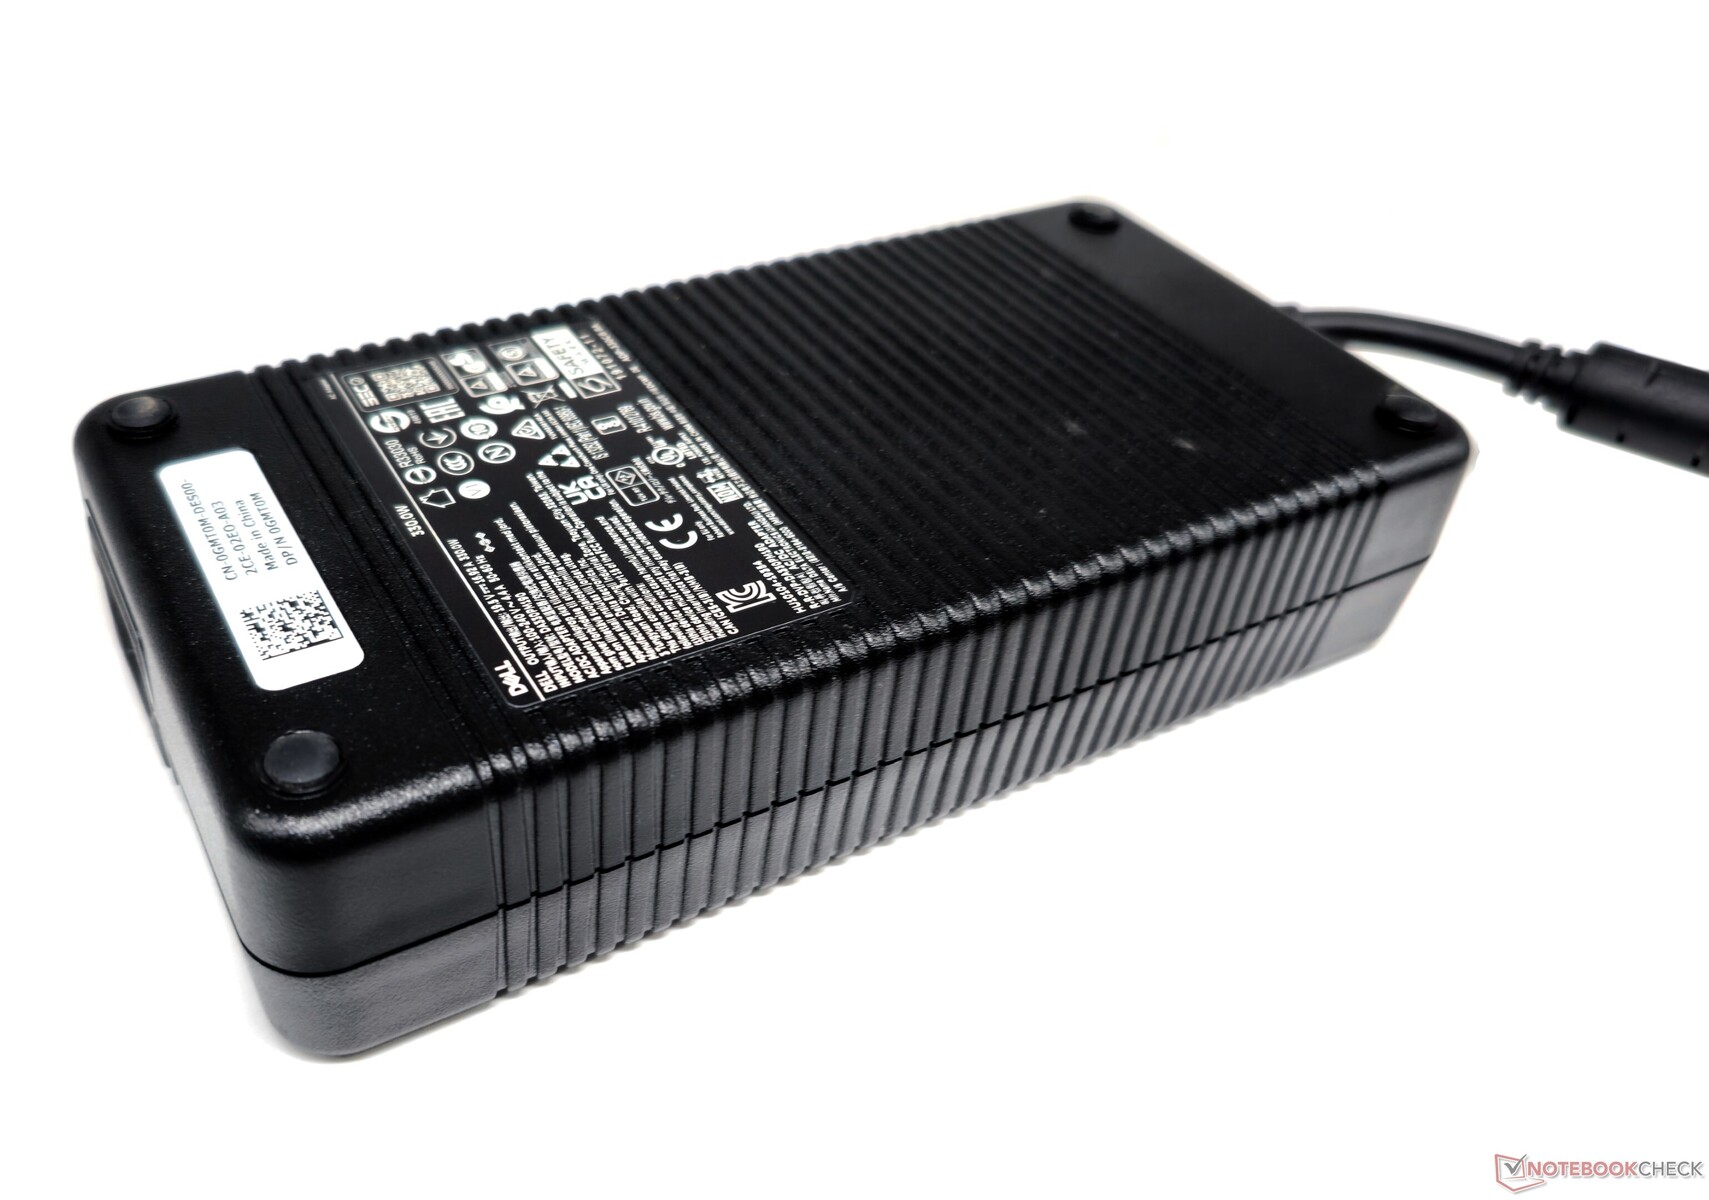
Den bärbara datorn G15 5530 har ett plastchassi som väger nästan 3 kg, vilket är dess största nackdel. En 330 W nätadapter på 1,34 kg bidrar också till tyngden, så spelare kan förvänta sig en hel del träning när de släpar runt på den bärbara datorn.
Gångjärnen i vår enhet kändes något stela, men locket kan öppnas med ett enda finger med viss ansträngning. Även om locket lätt böjs med minimal kraft, förblir det stabilt utan att vingla vid normal användning.
Det finns inga överraskningar i den övergripande chassidesignen, men de skarpa hörnen och den tunga vikten kanske inte faller alla i smaken.
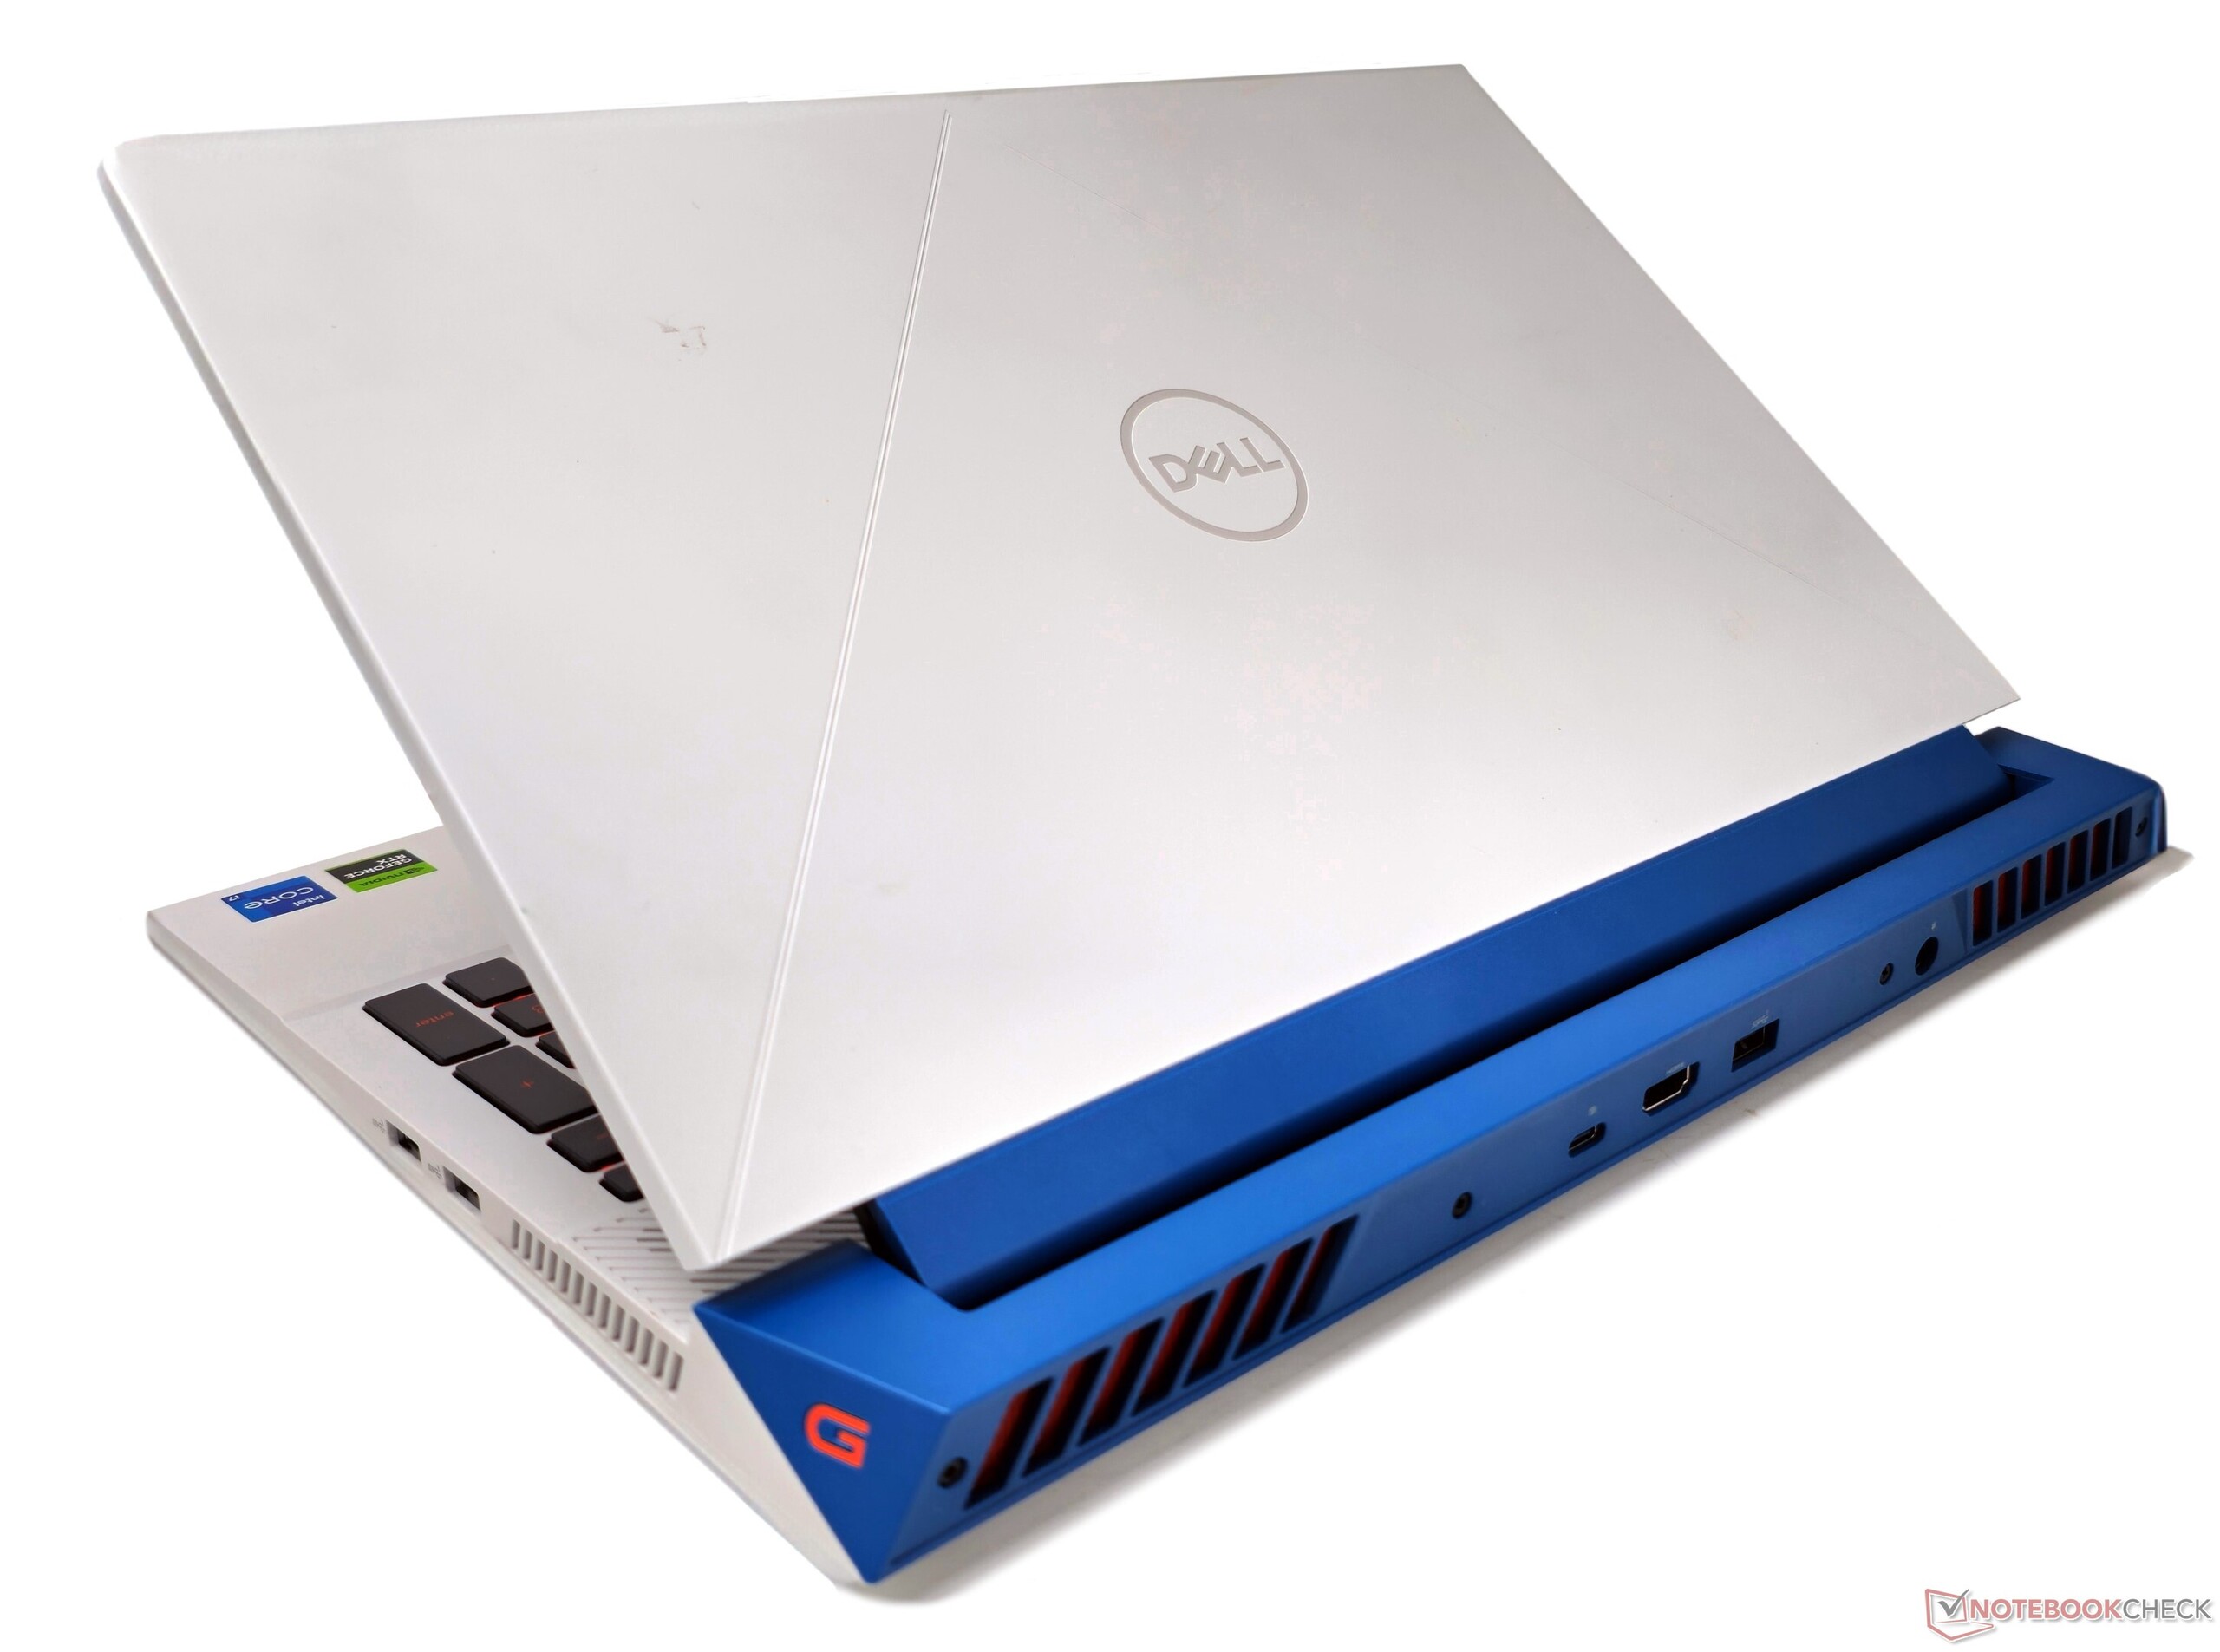

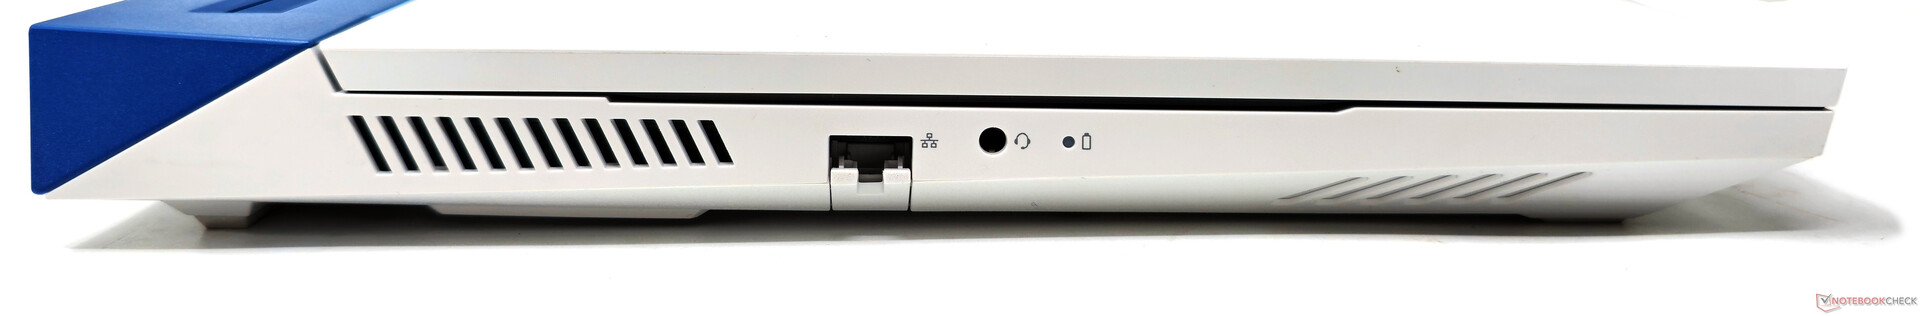
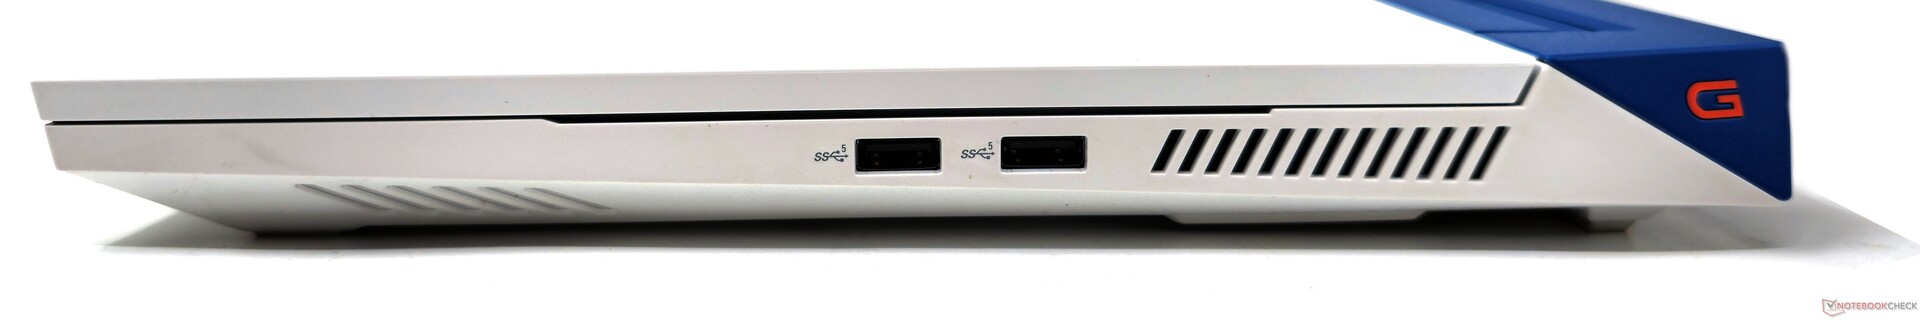
Anslutningsmöjligheter: Icke-ideell portfördelning för spelare
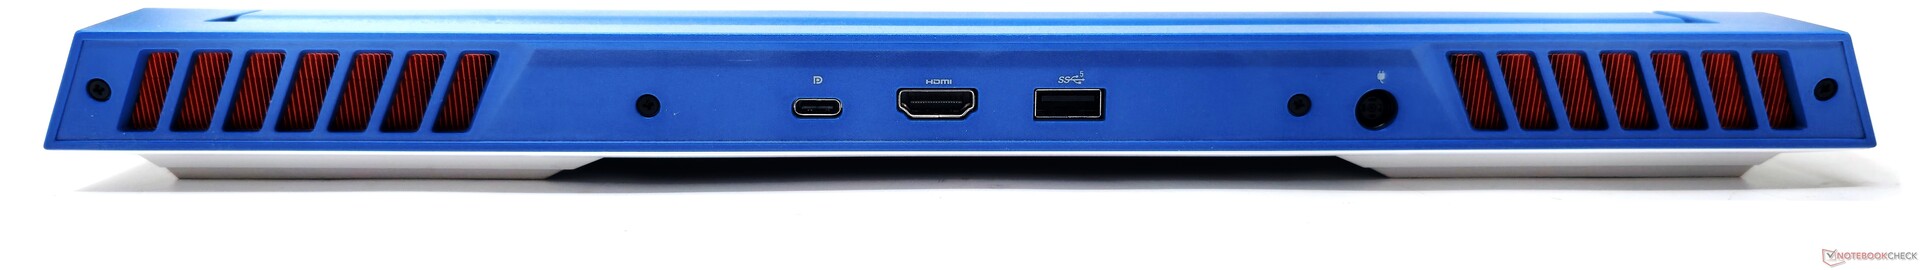
Portplaceringen på G15 5530 är inte helt idealisk. Endast LAN-porten och ett hörlursuttag finns på vänster sida medan höger sida har två USB 3.2 Gen1 Type-A-portar. De återstående portarna är placerade på baksidan.
Avsaknaden av USB-portar på vänster sida kan vara besvärande för anslutningen av kringutrustning, särskilt för spelare som använder en trådbunden mus.
Dessutom har den enda USB Type-C-porten DisplayPort-out-funktionalitet men saknar Power Delivery. Det innebär att den bärbara datorn inte kan laddas utan att använda det skrymmande nätaggregatet.
Kommunikation
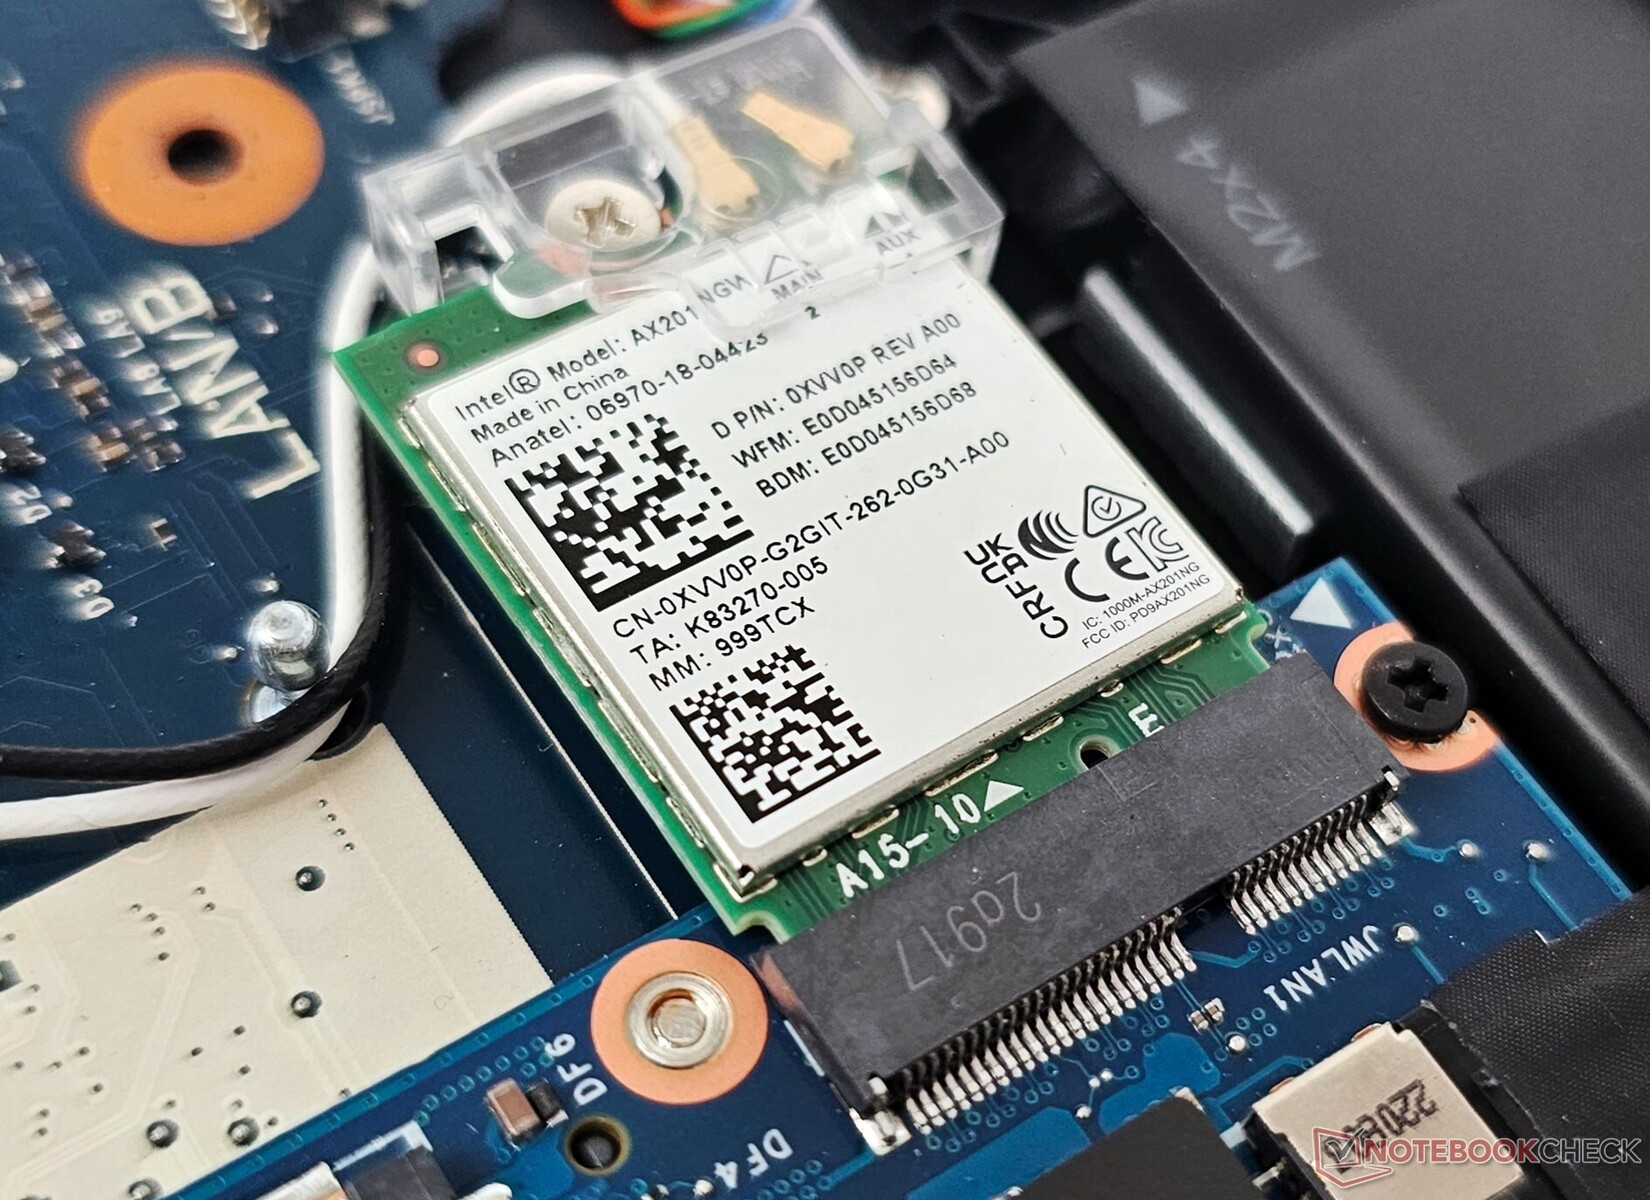
Även om Intel AX201 WLAN-kortet i G15 5530 saknar stöd för Wi-Fi 6E, fann vi att dess implementering i G15 5530 fortfarande ger utmärkt genomströmning.
Våra tester, som utfördes med Asus ROG Rapture GT-AXE11000 router som referens, visade relativt stabil prestanda när den bärbara datorn var placerad 1 m från routern med fri sikt och inga externa störningar.
Webbkamera
Bildkvaliteten från 720p-webbkameran är inget att skriva hem om med stora färgavvikelser (särskilt med blå nyanser) och en brist på övergripande skärpa och klarhet.


Säkerhet
Förutom TPM 2.0-modulen erbjuder G15 5530 inga ytterligare säkerhetsfunktioner eller biometriska inloggningar.
Tillbehör och garanti
Det finns inga andra tillbehör i förpackningen än en 330 W nätadapter och det vanliga pappersarbetet.
I Indien erbjuder Dell ett års premiumsupport på plats för hårdvara och mjukvara som standard.
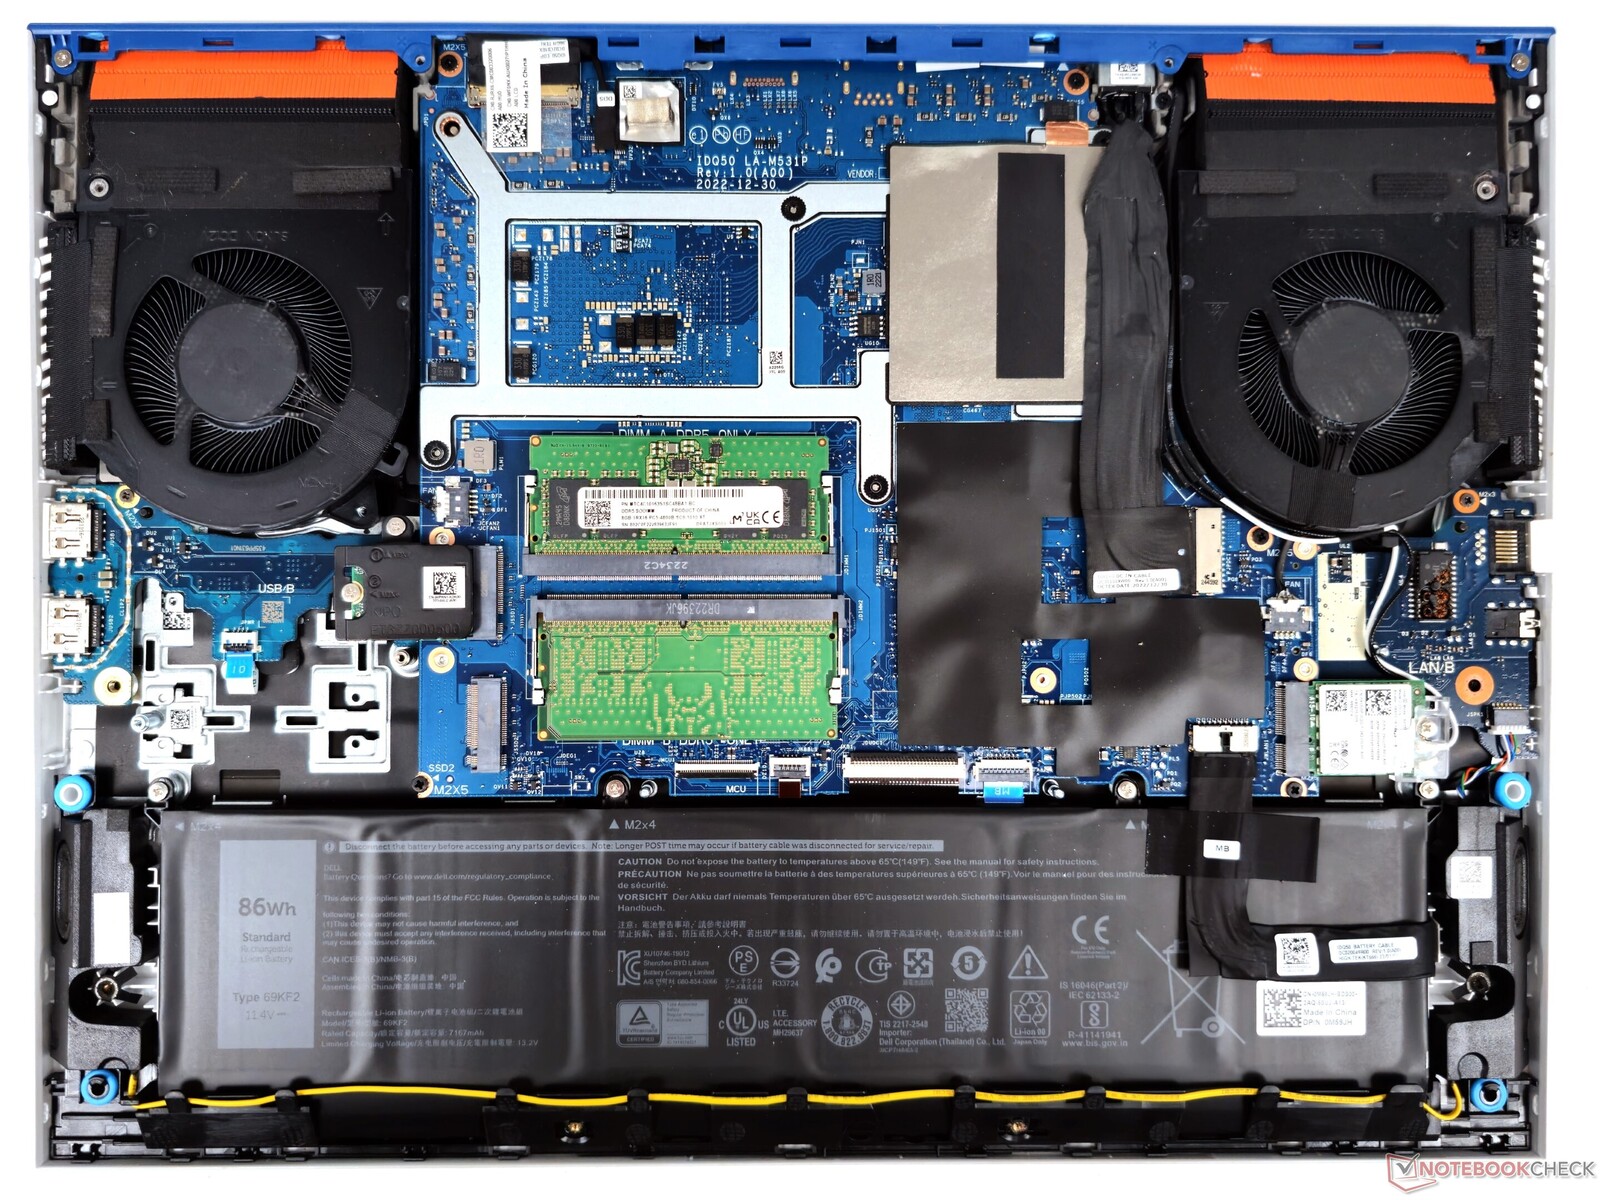
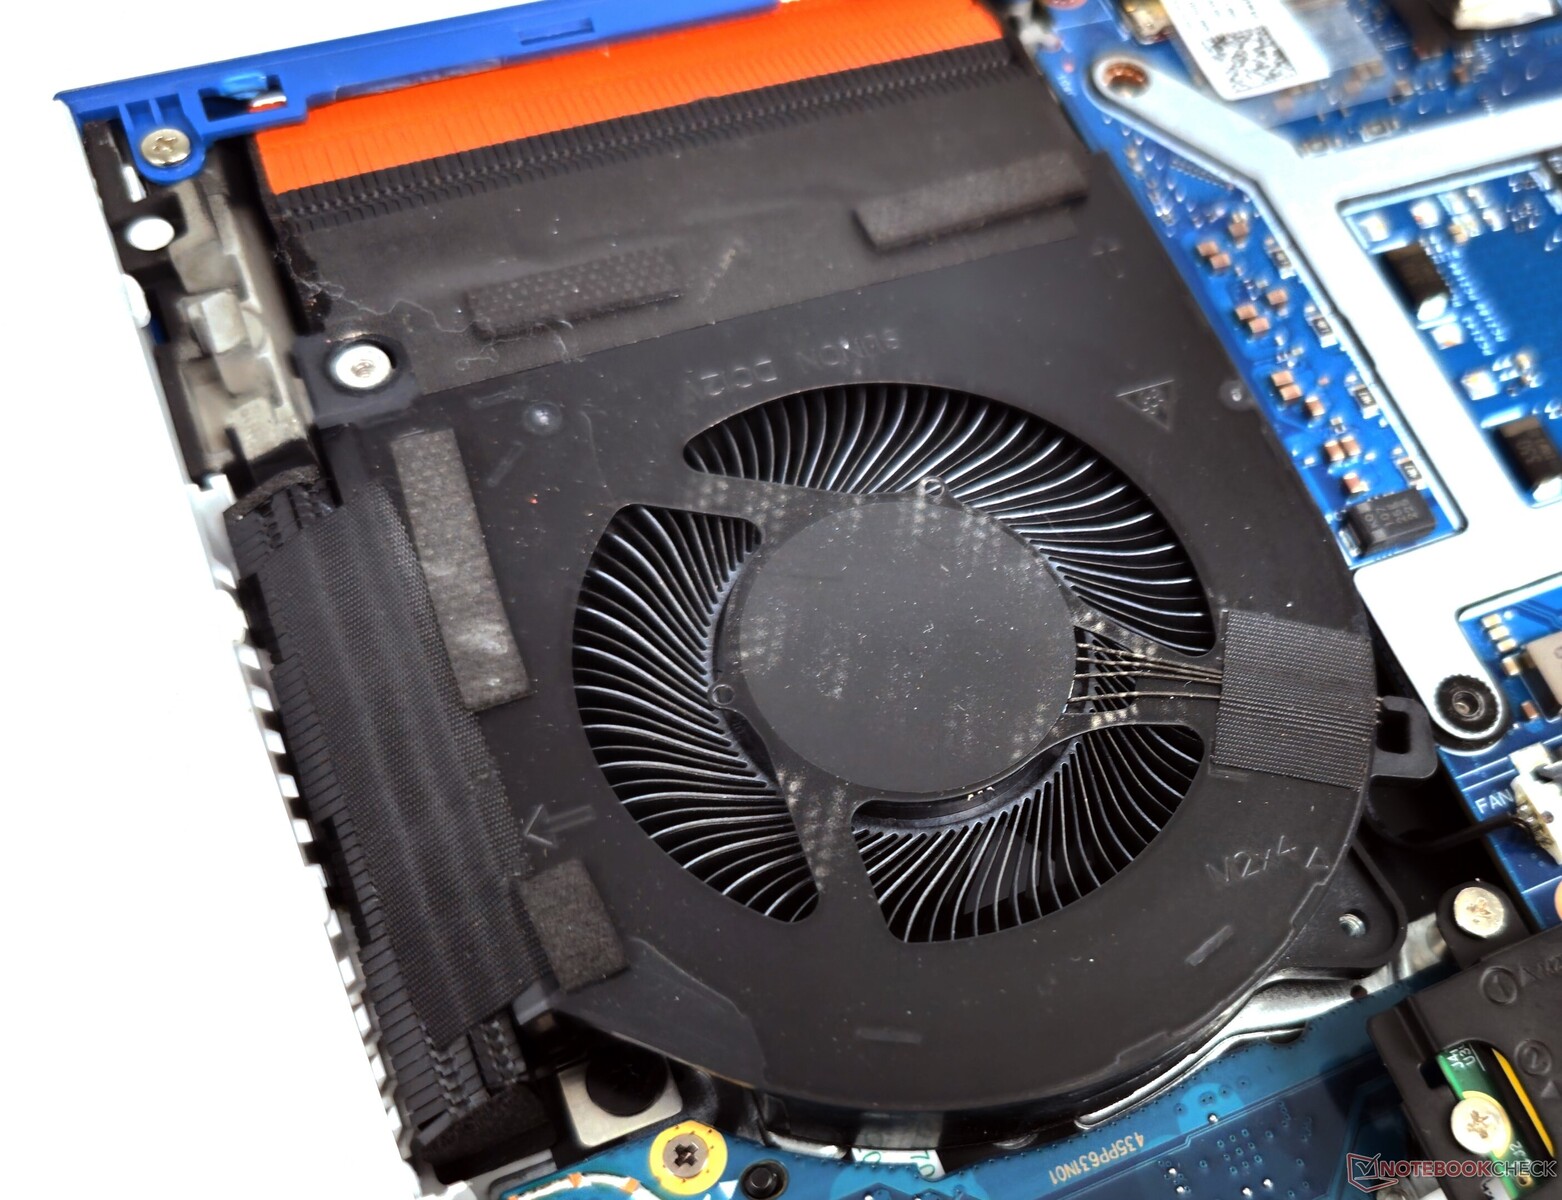
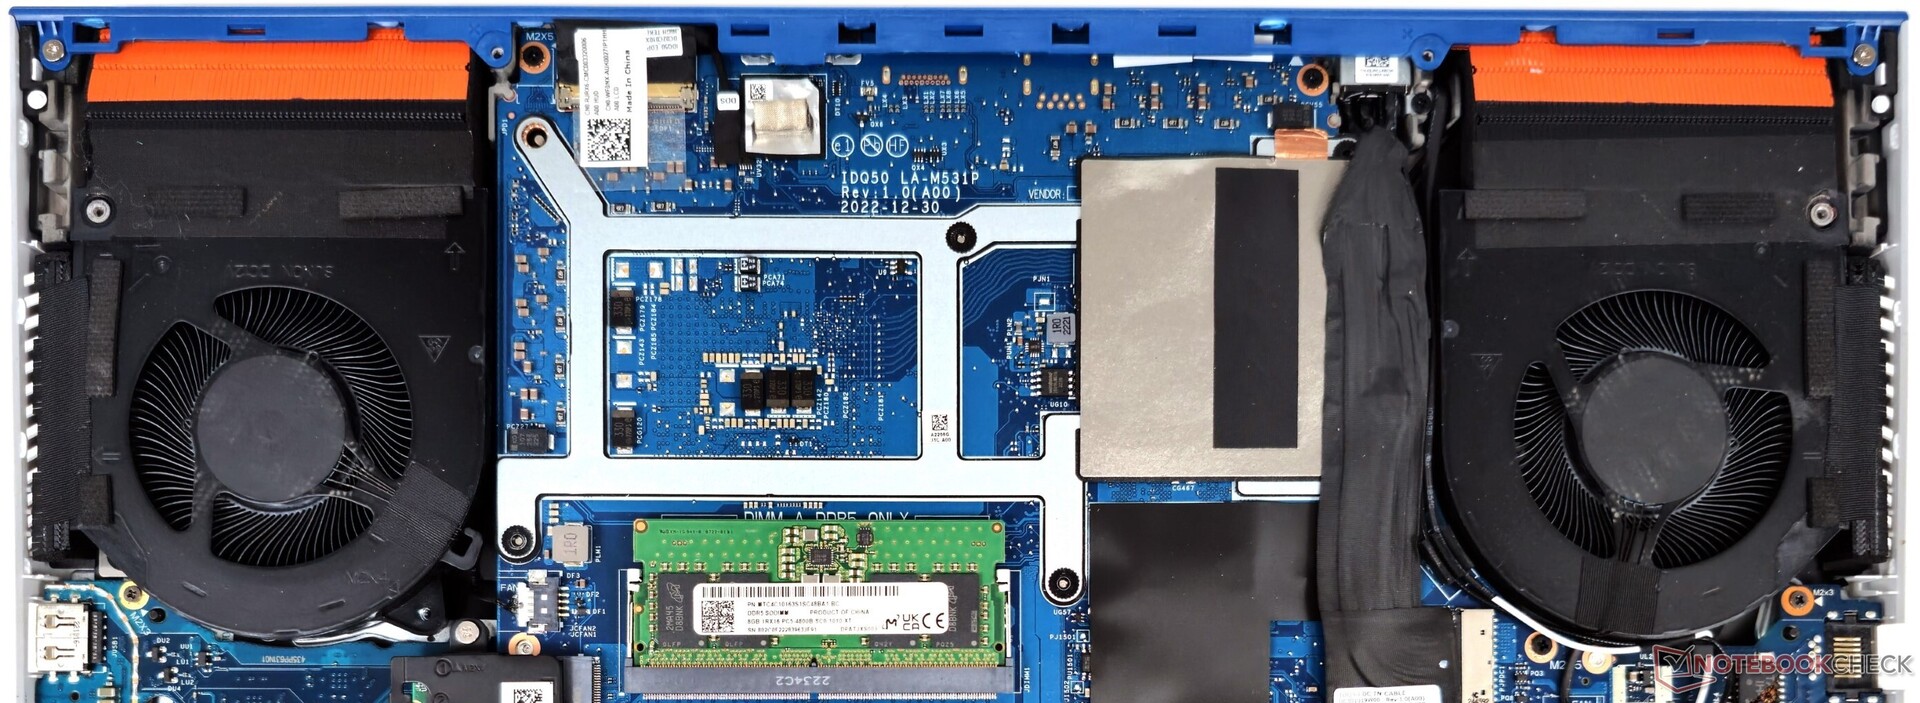
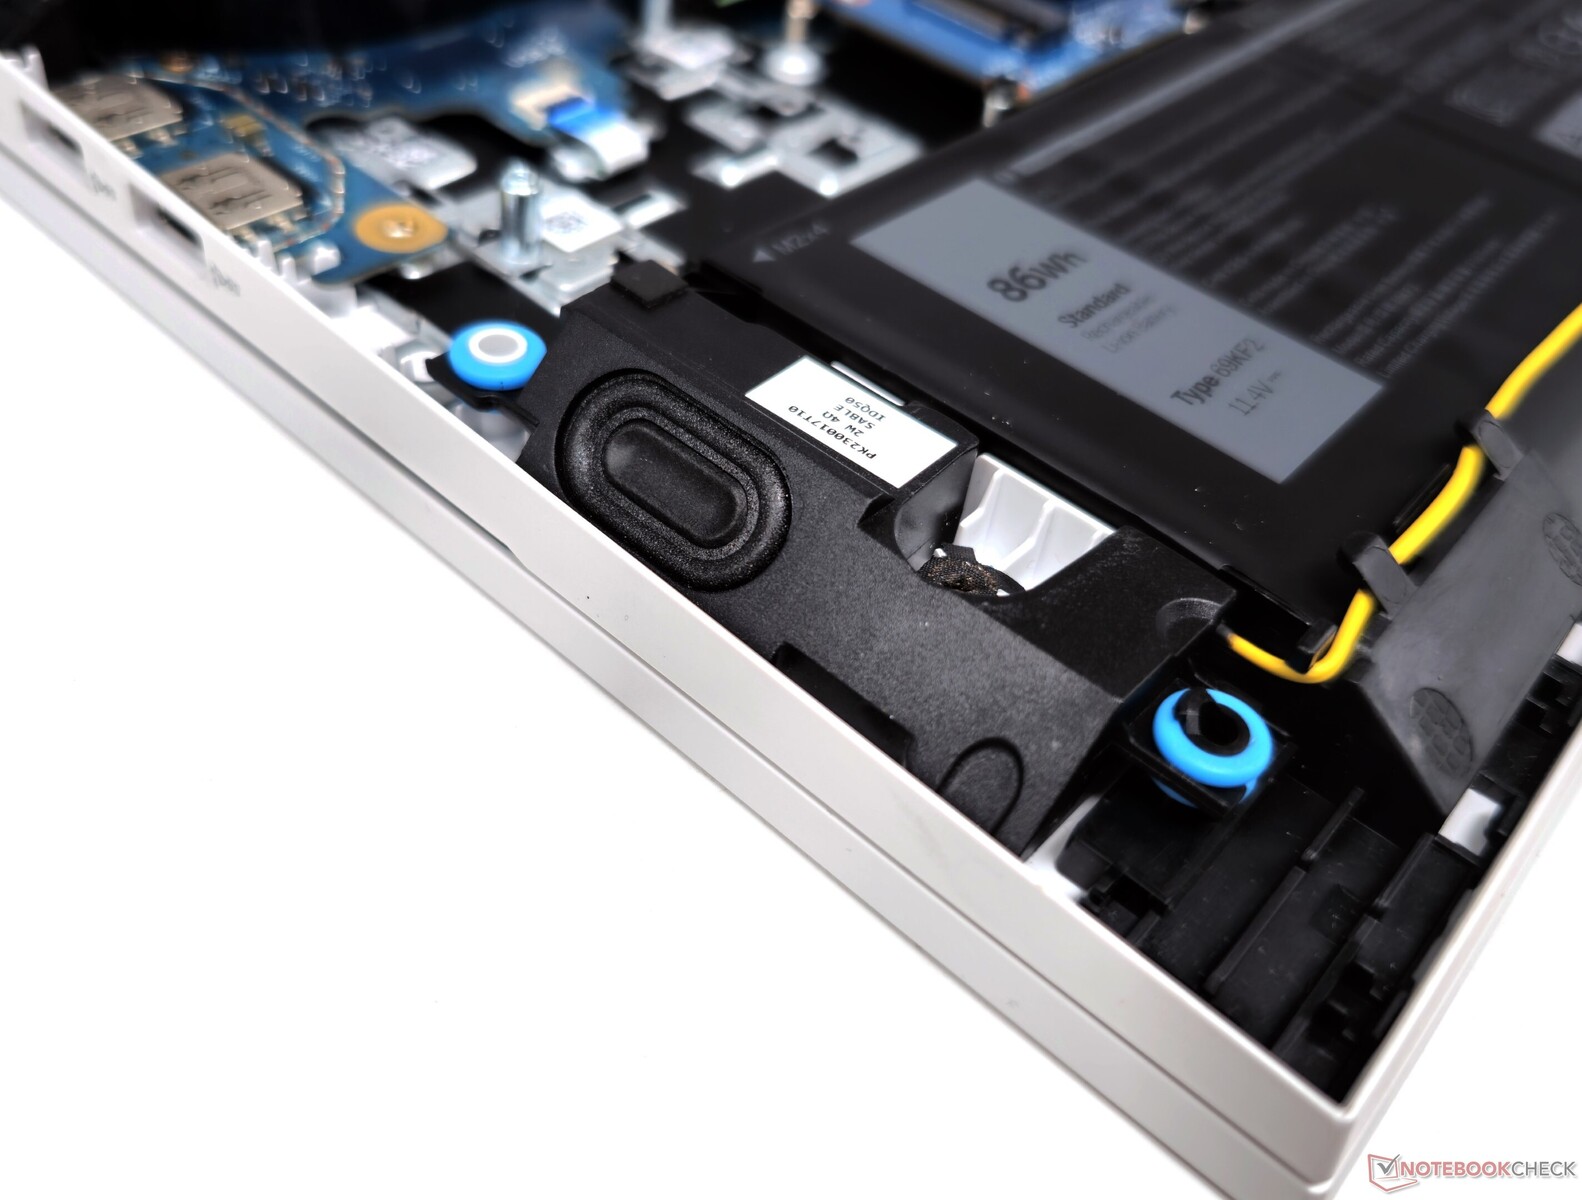
Underhåll
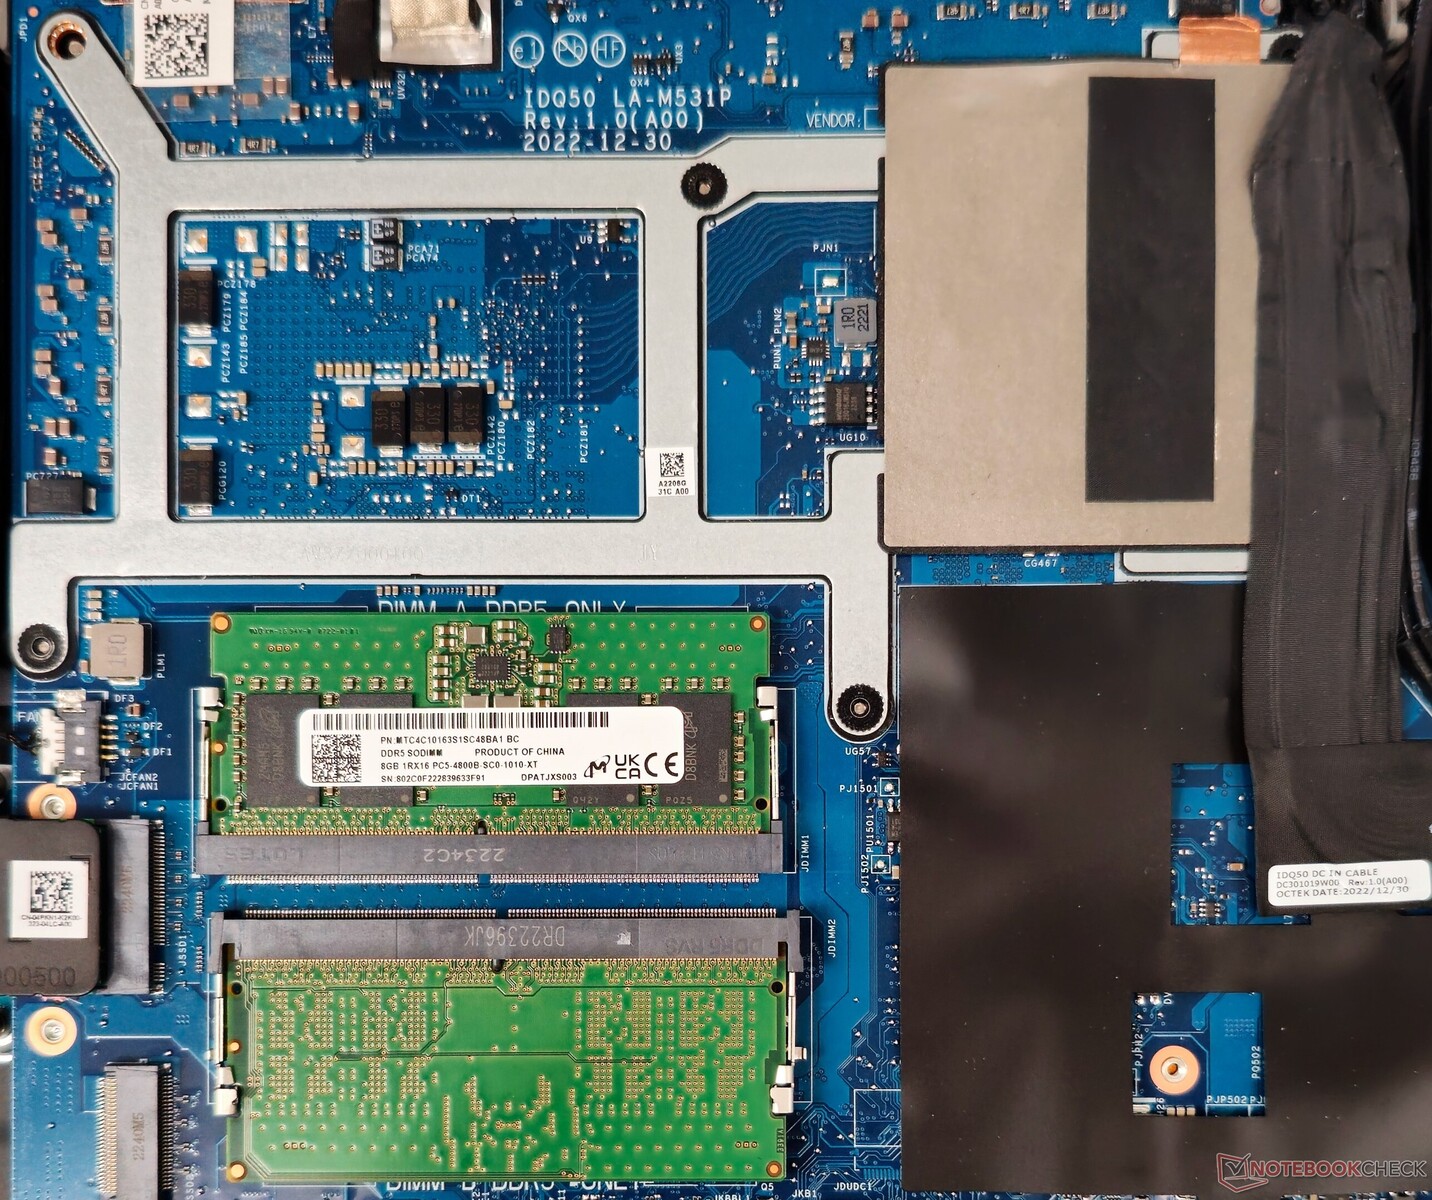
Bakpanelen på G15 5530 kan enkelt öppnas efter att 10 PH00-skruvar har tagits bort. Kylsystemet är placerat på undersidan av kortet. WLAN, SSD och DDR5 RAM-minne är alla uppgraderingsbara.
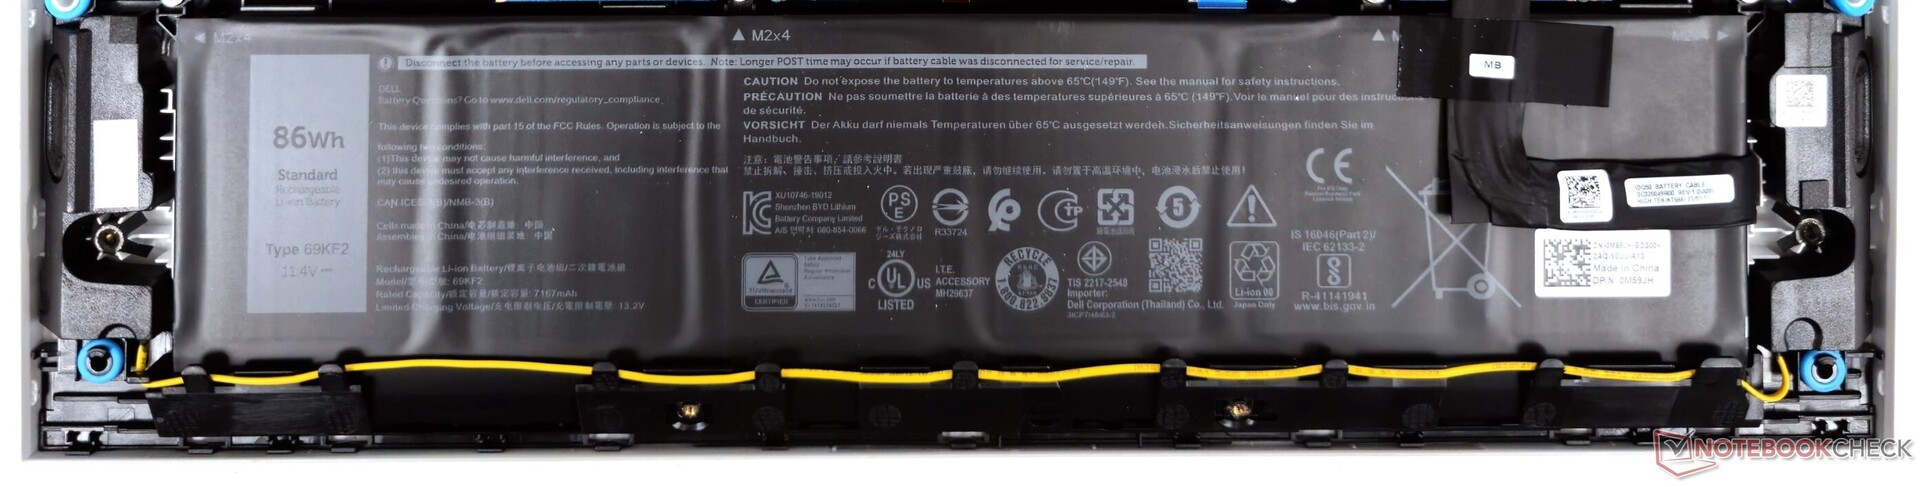
Dell använder icke-konventionella M.2 2242-kortplatser (M-key) för lagring. Användare bör ta hänsyn till detta när de lägger till eller byter ut NVMe-enheter. Batteriet kan skruvas loss och bytas ut vid behov.
Inmatningsenheter: Platta tangenter med liten slaglängd och en trång pekplatta
Tangentbord
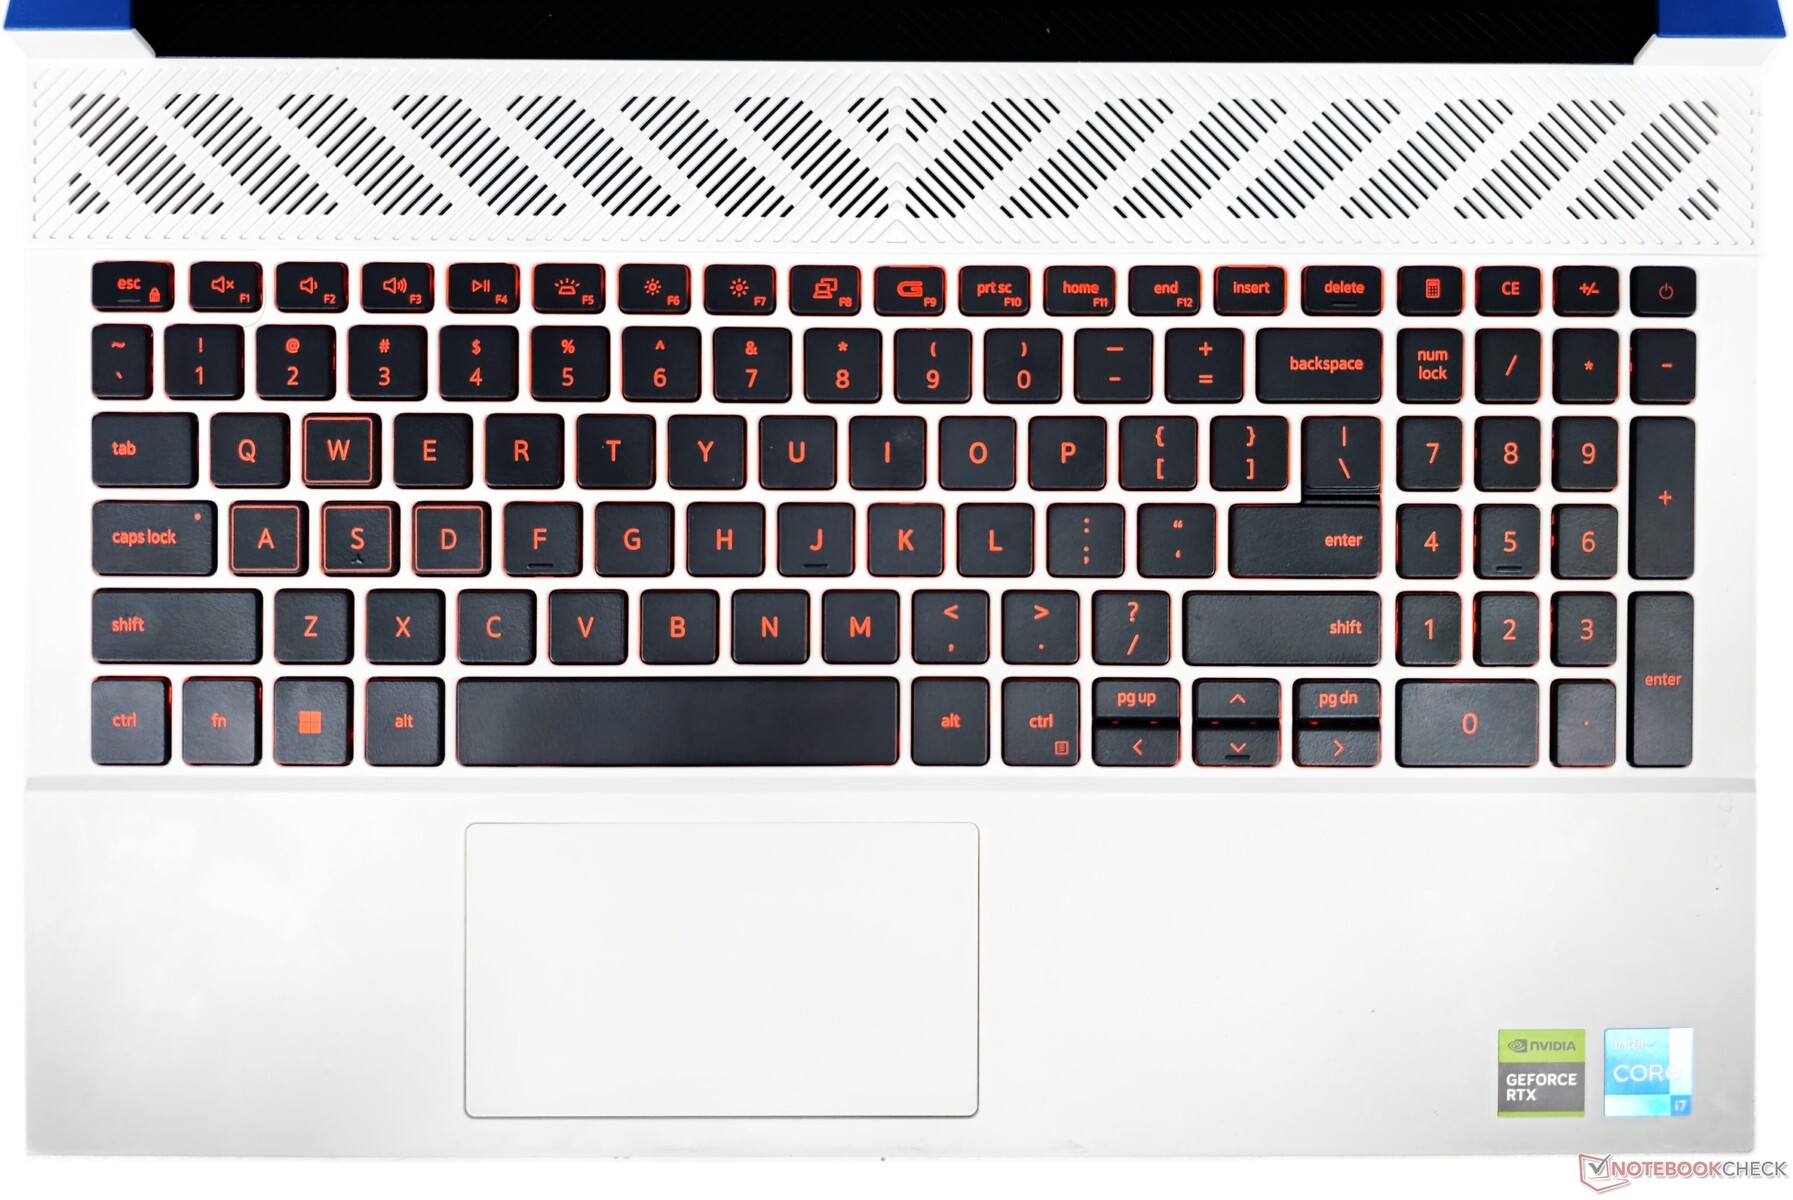
Tangentbordet på G15 5530 har minimal flexibilitet och har platta, jämnt fördelade tangenter som ger en något grund slaglängd. Det innehåller en numpad tillsammans med genvägar för miniräknare för bekvämlighetens skull. Denna layout resulterar dock i att knapparna för sida upp och sida ner kläms ihop med de små piltangenterna.
Enligt Dell är tangentbordet på G15 5530 utrustat med 4-zons RGB-bakgrundsbelysning. I vår enhet fanns dock endast orange LED-lampor med en tvåstegsjustering av ljusstyrkan. Dessutom känns tangentbordet inte igen i Alienware Command Center, vilket begränsar anpassningsalternativen.
F9-tangenten innehåller en genväg för Game Shift, vilket möjliggör omedelbar växling till maximal prestanda och fläkthastighet när det behövs.
Pekplatta
Pekplattan på 6 cm x 10,5 cm känns trång jämfört med andra bärbara 2023-datorer. Den är dock smidig att glida över, har stöd för Windows Precision -gester och är responsiv även i hörnen.
Klickningarna kan ibland bli högljudda, vilket kan vara ett mindre irritationsmoment för dem som föredrar tystare inmatning.
G15:s inmatningsenheter är inte dåliga i sig, men användare kan säkert dra nytta av ett externt tangentbord och mus.
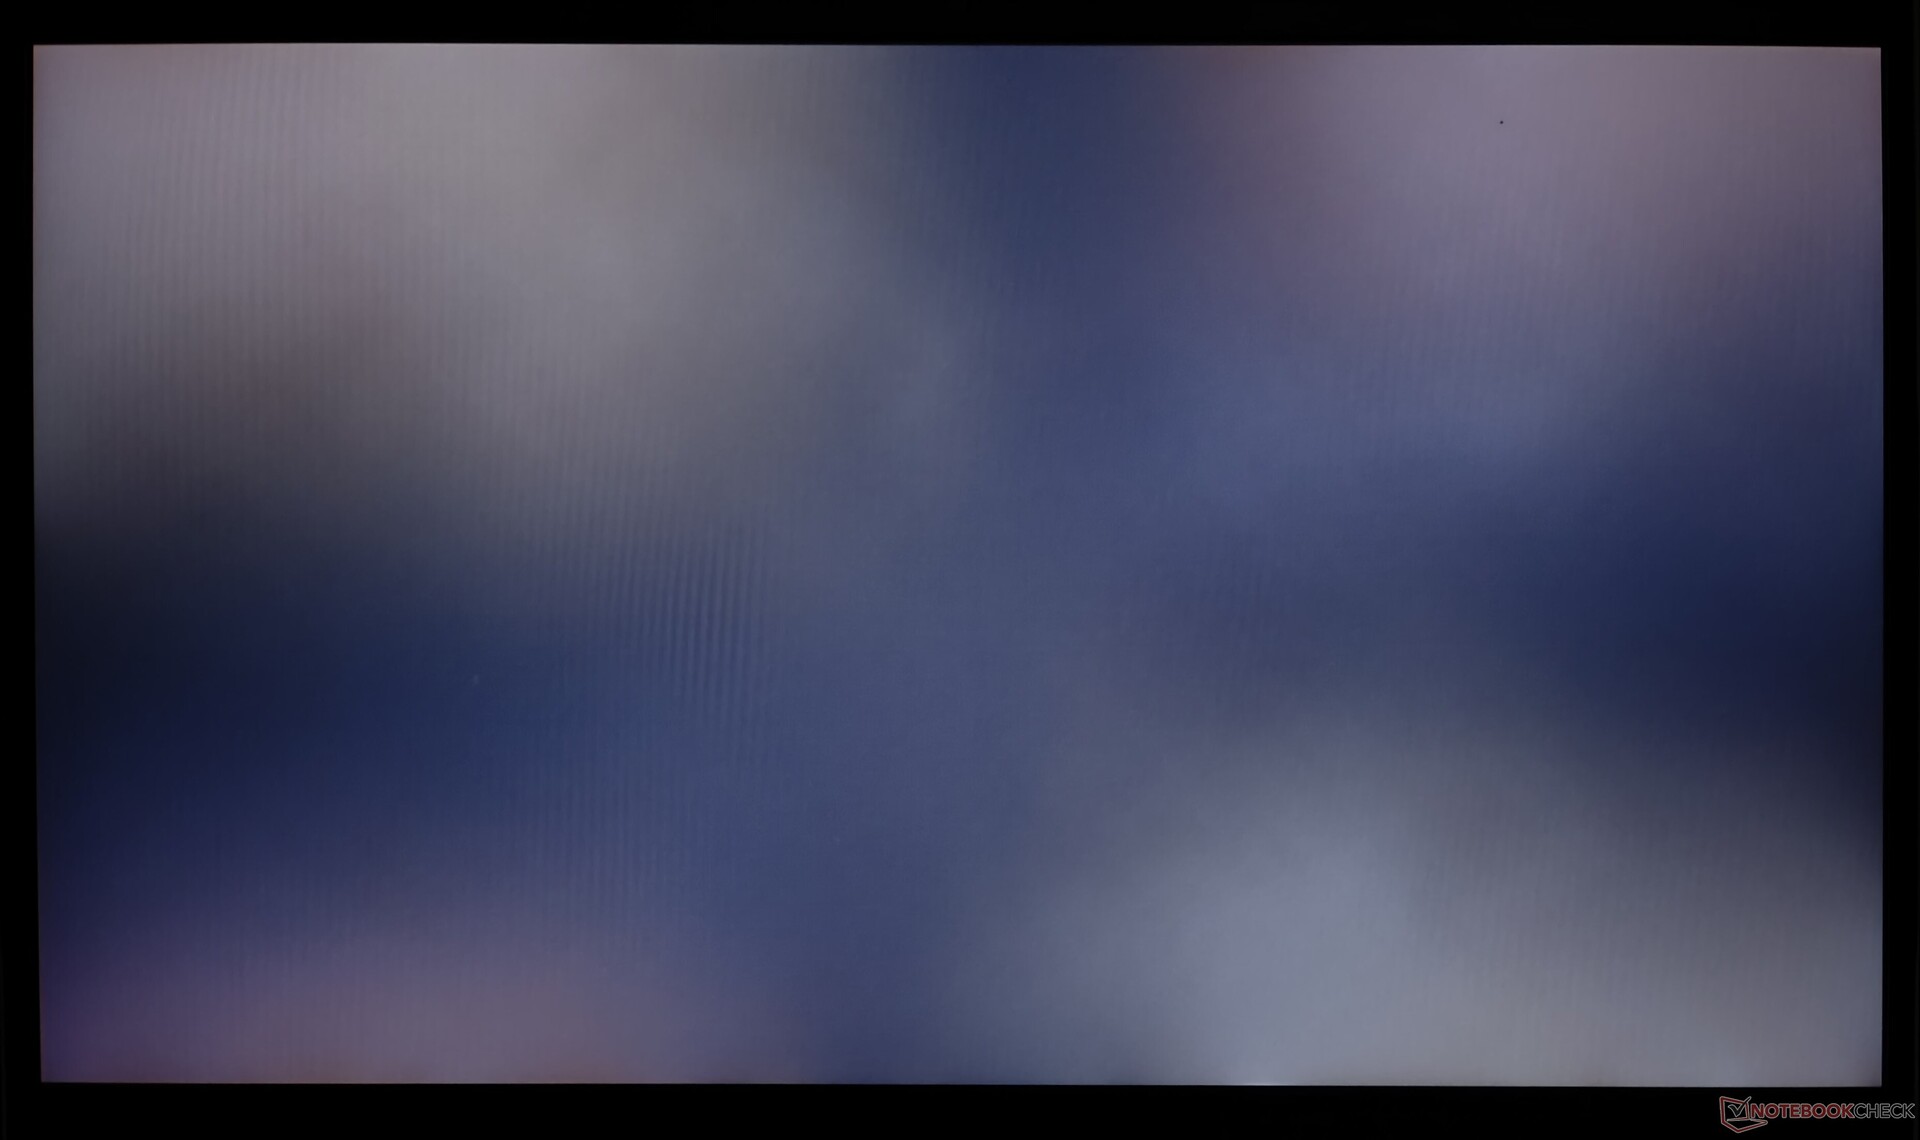
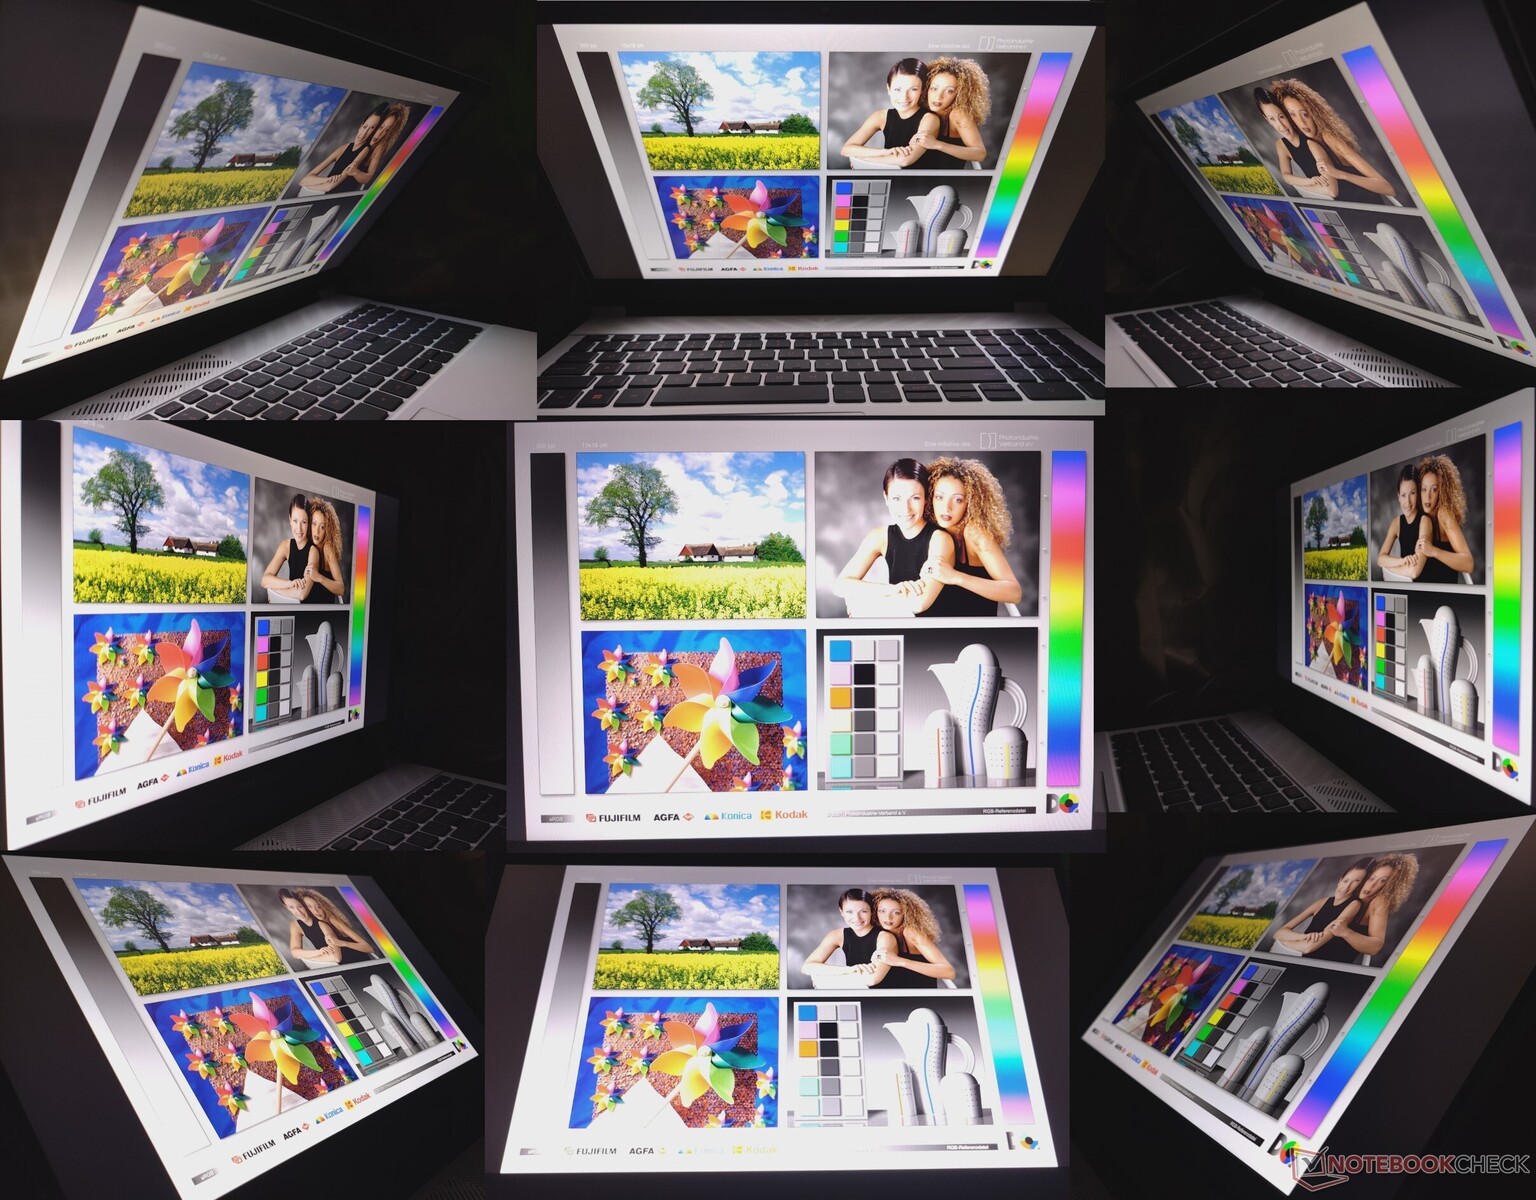
Bildskärm: 165 Hz 1080p-panel med överstyrning
Dell utrustar G15 med en 1080p AUO IPS-panel som erbjuder en 165 Hz uppdateringsfrekvens med G-Sync. Vi ser betydande svartljusblödning i hörnen, vilket är typiskt för IPS-skärmar.
Ljusstyrkan är ganska jämn med 94% och kontrastförhållandet är respektabla 1524:1, vilket bör ge en bra tittarupplevelse för spel.

| |||||||||||||||||||||||||
Distribution av ljusstyrkan: 94 %
Mitt på batteriet: 321 cd/m²
Kontrast: 1524:1 (Svärta: 0.21 cd/m²)
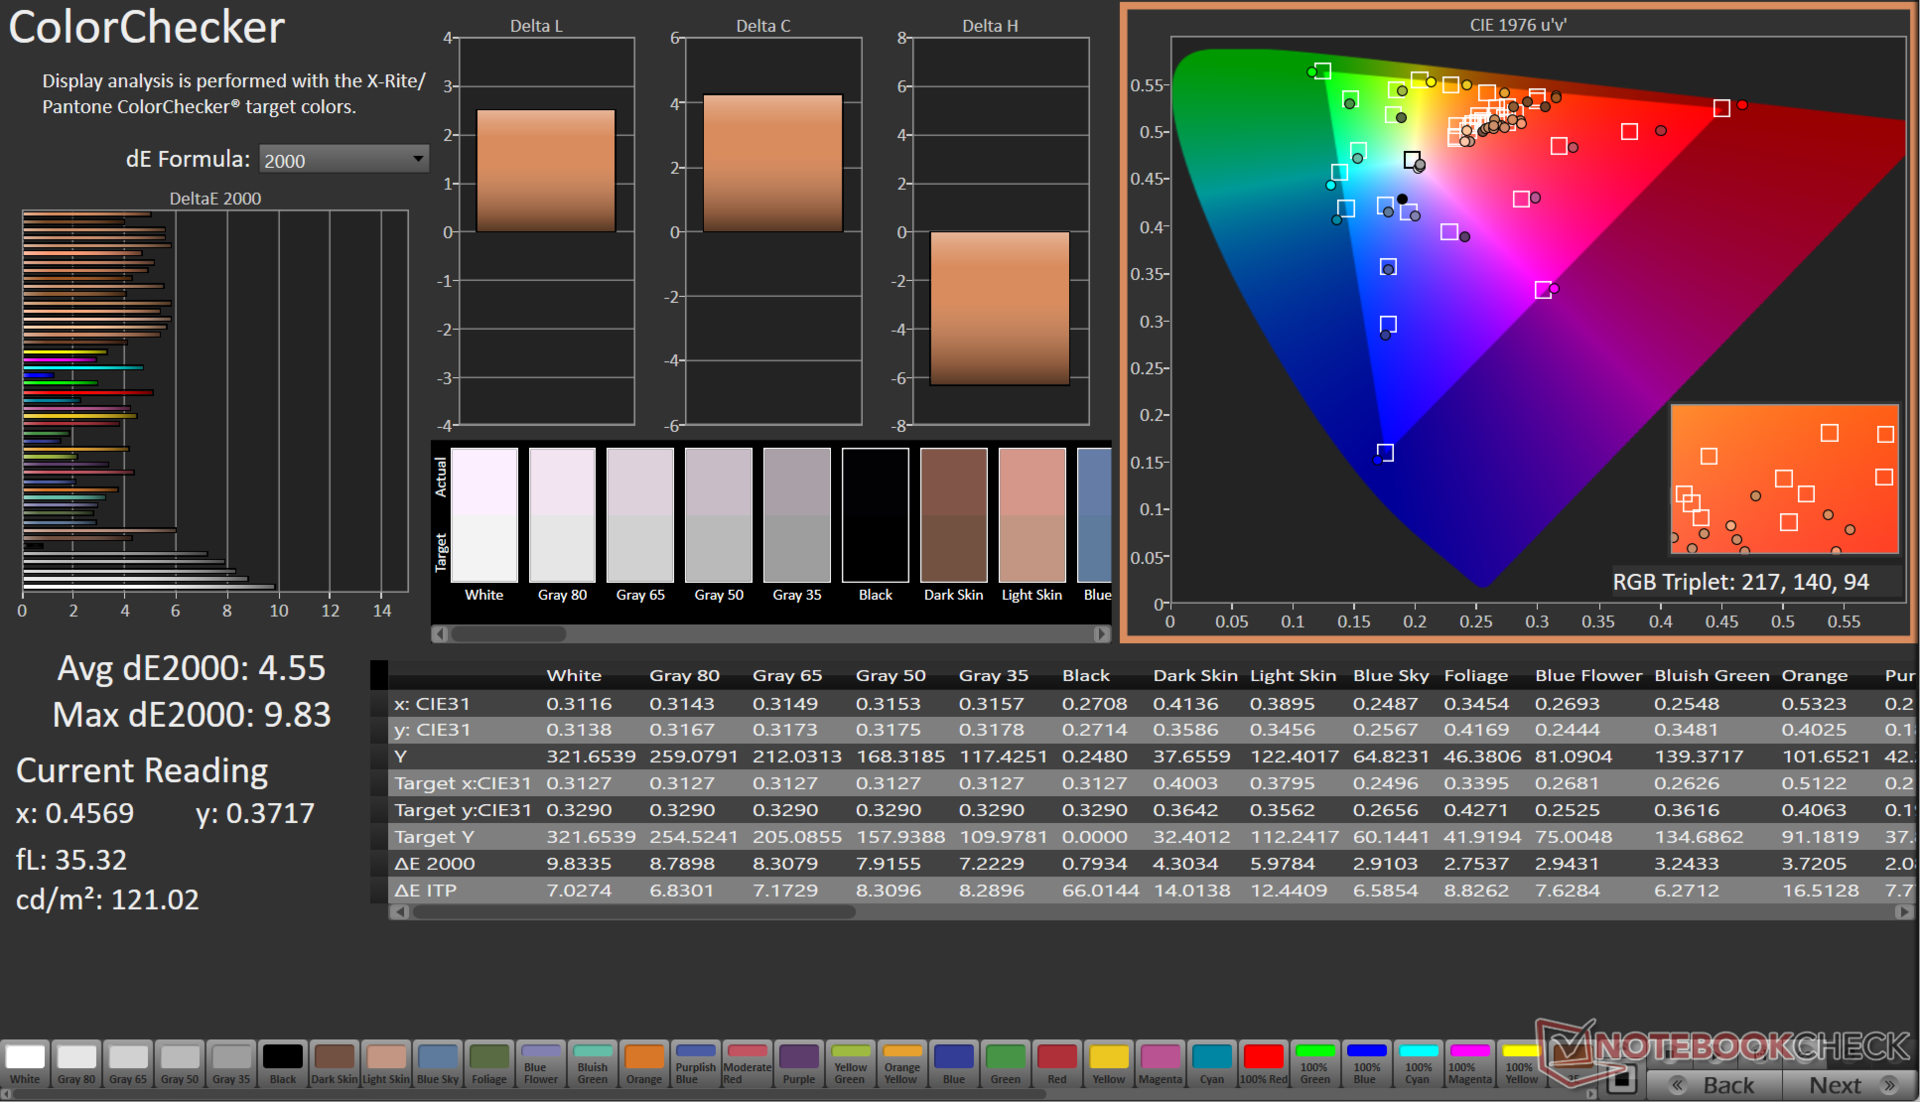
ΔE ColorChecker Calman: 4.55 | ∀{0.5-29.43 Ø4.71}
calibrated: 1.51
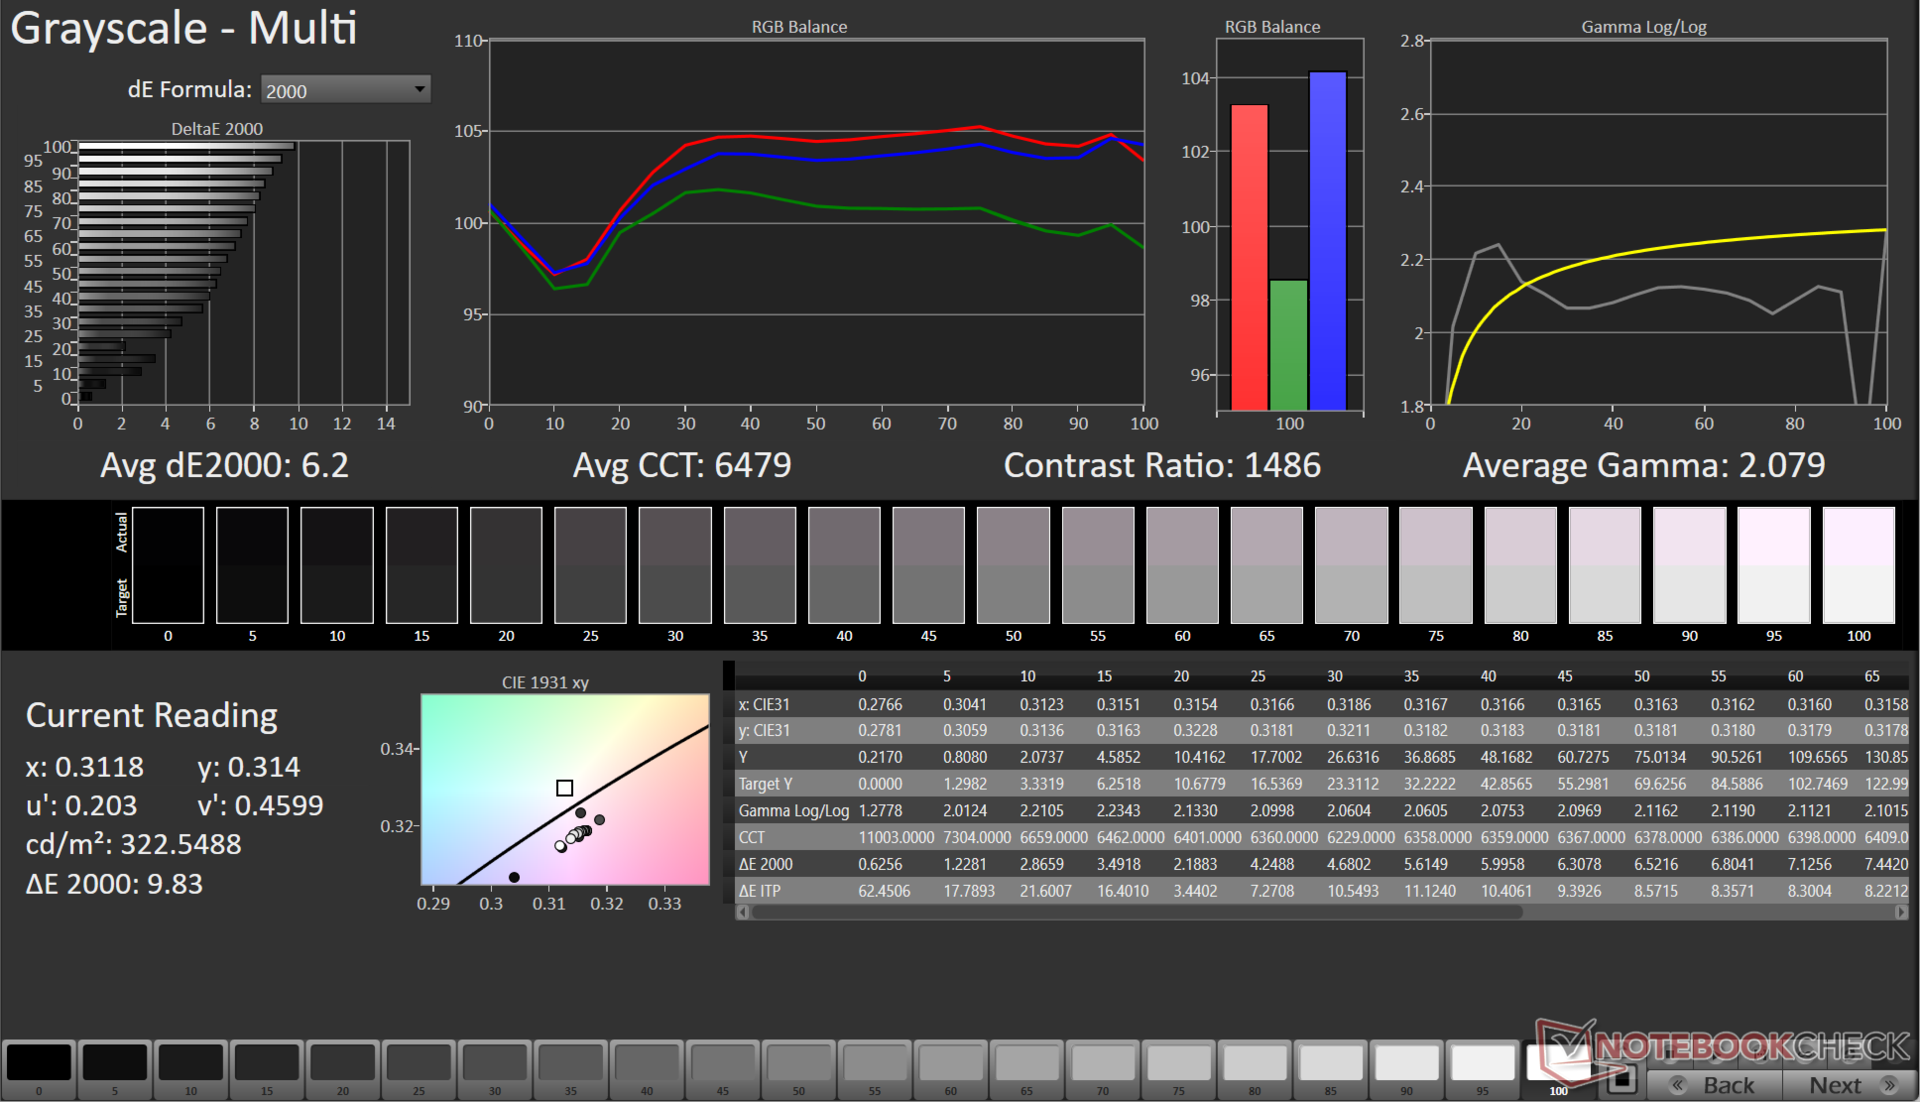
ΔE Greyscale Calman: 6.2 | ∀{0.09-98 Ø4.96}
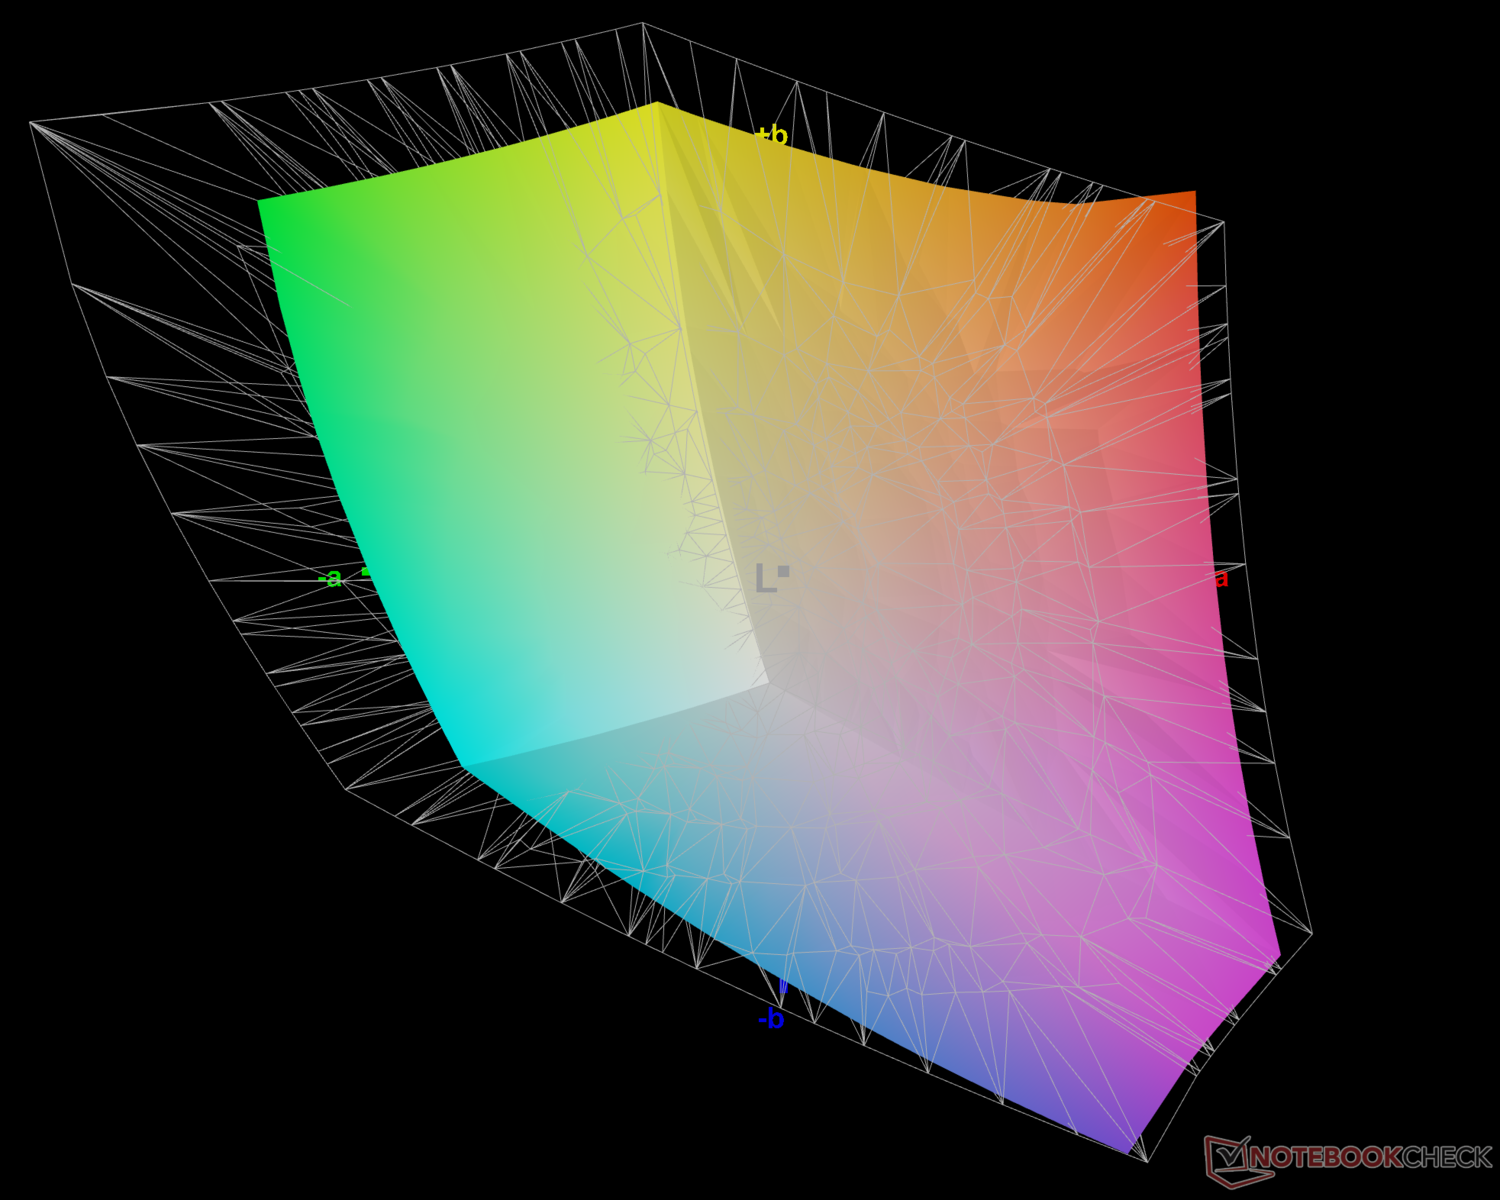
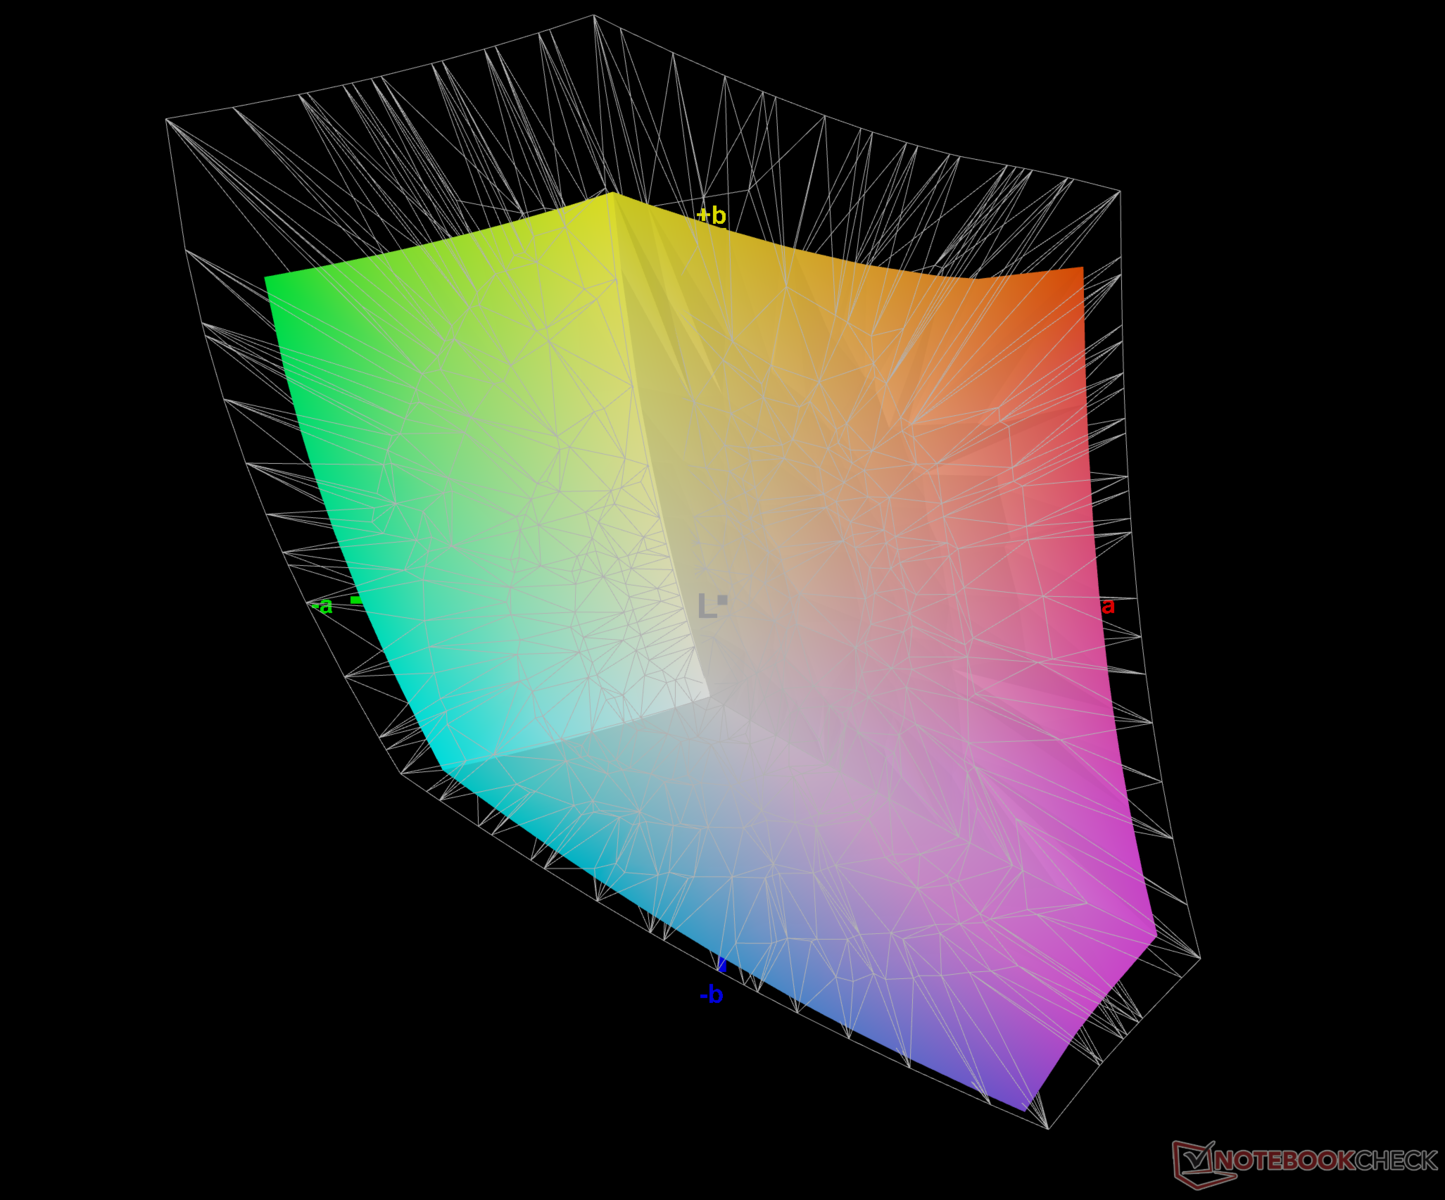
74.4% AdobeRGB 1998 (Argyll 3D)
98.4% sRGB (Argyll 3D)
73.1% Display P3 (Argyll 3D)
Gamma: 2.07
CCT: 6479 K
| Dell G15 5530 AUO B156HAN, IPS, 1920x1080, 15.6" | Asus ROG Strix G18 G814JI NE180QDM-NZ2 (BOE0B35), IPS, 2560x1600, 18" | Lenovo Legion Pro 5 16IRX8 AU Optronics B160QAN03.1, IPS, 2560x1600, 16" | Asus ROG Flow X16 GV601V TMX1603 (TL160ADMP03-0), IPS, 2560x1600, 16" | MSI Katana 17 B13VFK B173HAN04.9, IPS LED, 1920x1080, 17.3" | Asus TUF Gaming A16 FA617XS BOE NE160WUM-NX2, IPS, 1920x1200, 16" | Asus ROG Strix G17 G713PI BOE0B69, IPS, 2560x1440, 17.3" | Medion Erazer Major X20 BOE CQ NE160QDM-NZ1, IPS, 2560x1600, 16" | |
|---|---|---|---|---|---|---|---|---|
| Display | 17% | -1% | 16% | -42% | -4% | 17% | -3% | |
| Display P3 Coverage (%) | 73.1 | 98.1 34% | 71.2 -3% | 96.61 32% | 40.8 -44% | 69.3 -5% | 98.3 34% | 69.4 -5% |
| sRGB Coverage (%) | 98.4 | 99.9 2% | 98.8 0% | 99.92 2% | 61 -38% | 97.3 -1% | 100 2% | 98 0% |
| AdobeRGB 1998 Coverage (%) | 74.4 | 85.6 15% | 73.3 -1% | 84.63 14% | 42.2 -43% | 70.7 -5% | 85.9 15% | 70.9 -5% |
| Response Times | -67% | -211% | -27% | -630% | -224% | -59% | -161% | |
| Response Time Grey 50% / Grey 80% * (ms) | 3.39 ? | 5.6 ? -65% | 14.5 ? -328% | 3.8 ? -12% | 33 ? -873% | 15.6 ? -360% | 5.3 ? -56% | 13.1 ? -286% |
| Response Time Black / White * (ms) | 5.35 ? | 9 ? -68% | 10.4 ? -94% | 7.6 ? -42% | 26 ? -386% | 10 ? -87% | 8.6 ? -61% | 7.3 ? -36% |
| PWM Frequency (Hz) | 21620 ? | |||||||
| Screen | 14% | 21% | 21% | -32% | 21% | 17% | 12% | |
| Brightness middle (cd/m²) | 320 | 471 47% | 405.7 27% | 486 52% | 267 -17% | 301 -6% | 327 2% | 374 17% |
| Brightness (cd/m²) | 316 | 422 34% | 368 16% | 469 48% | 256 -19% | 294 -7% | 320 1% | 357 13% |
| Brightness Distribution (%) | 94 | 83 -12% | 87 -7% | 91 -3% | 93 -1% | 94 0% | 89 -5% | 92 -2% |
| Black Level * (cd/m²) | 0.21 | 0.47 -124% | 0.38 -81% | 0.39 -86% | 0.21 -0% | 0.21 -0% | 0.38 -81% | 0.33 -57% |
| Contrast (:1) | 1524 | 1002 -34% | 1068 -30% | 1246 -18% | 1271 -17% | 1433 -6% | 861 -44% | 1133 -26% |
| Colorchecker dE 2000 * | 4.55 | 2.05 55% | 1.65 64% | 2.27 50% | 4.7 -3% | 1.79 61% | 1.01 78% | 2.43 47% |
| Colorchecker dE 2000 max. * | 9.83 | 4.15 58% | 4.2 57% | 5.73 42% | 20.4 -108% | 3.48 65% | 4.01 59% | 3.97 60% |
| Colorchecker dE 2000 calibrated * | 1.51 | 0.8 47% | 0.53 65% | 0.6 60% | 4.5 -198% | 1.2 21% | 0.41 73% | 1.4 7% |
| Greyscale dE 2000 * | 6.2 | 2.8 55% | 1.2 81% | 3.36 46% | 1.5 76% | 2.5 60% | 1.6 74% | 3.1 50% |
| Gamma | 2.07 106% | 2.204 100% | 2.3 96% | 2.46 89% | 2.12 104% | 2.265 97% | 2.168 101% | 2.191 100% |
| CCT | 6479 100% | 7122 91% | 6453 101% | 6625 98% | 6552 99% | 6157 106% | 6659 98% | 6194 105% |
| Totalt genomsnitt (program/inställningar) | -12% /
3% | -64% /
-17% | 3% /
13% | -235% /
-119% | -69% /
-19% | -8% /
7% | -51% /
-16% |
* ... mindre är bättre
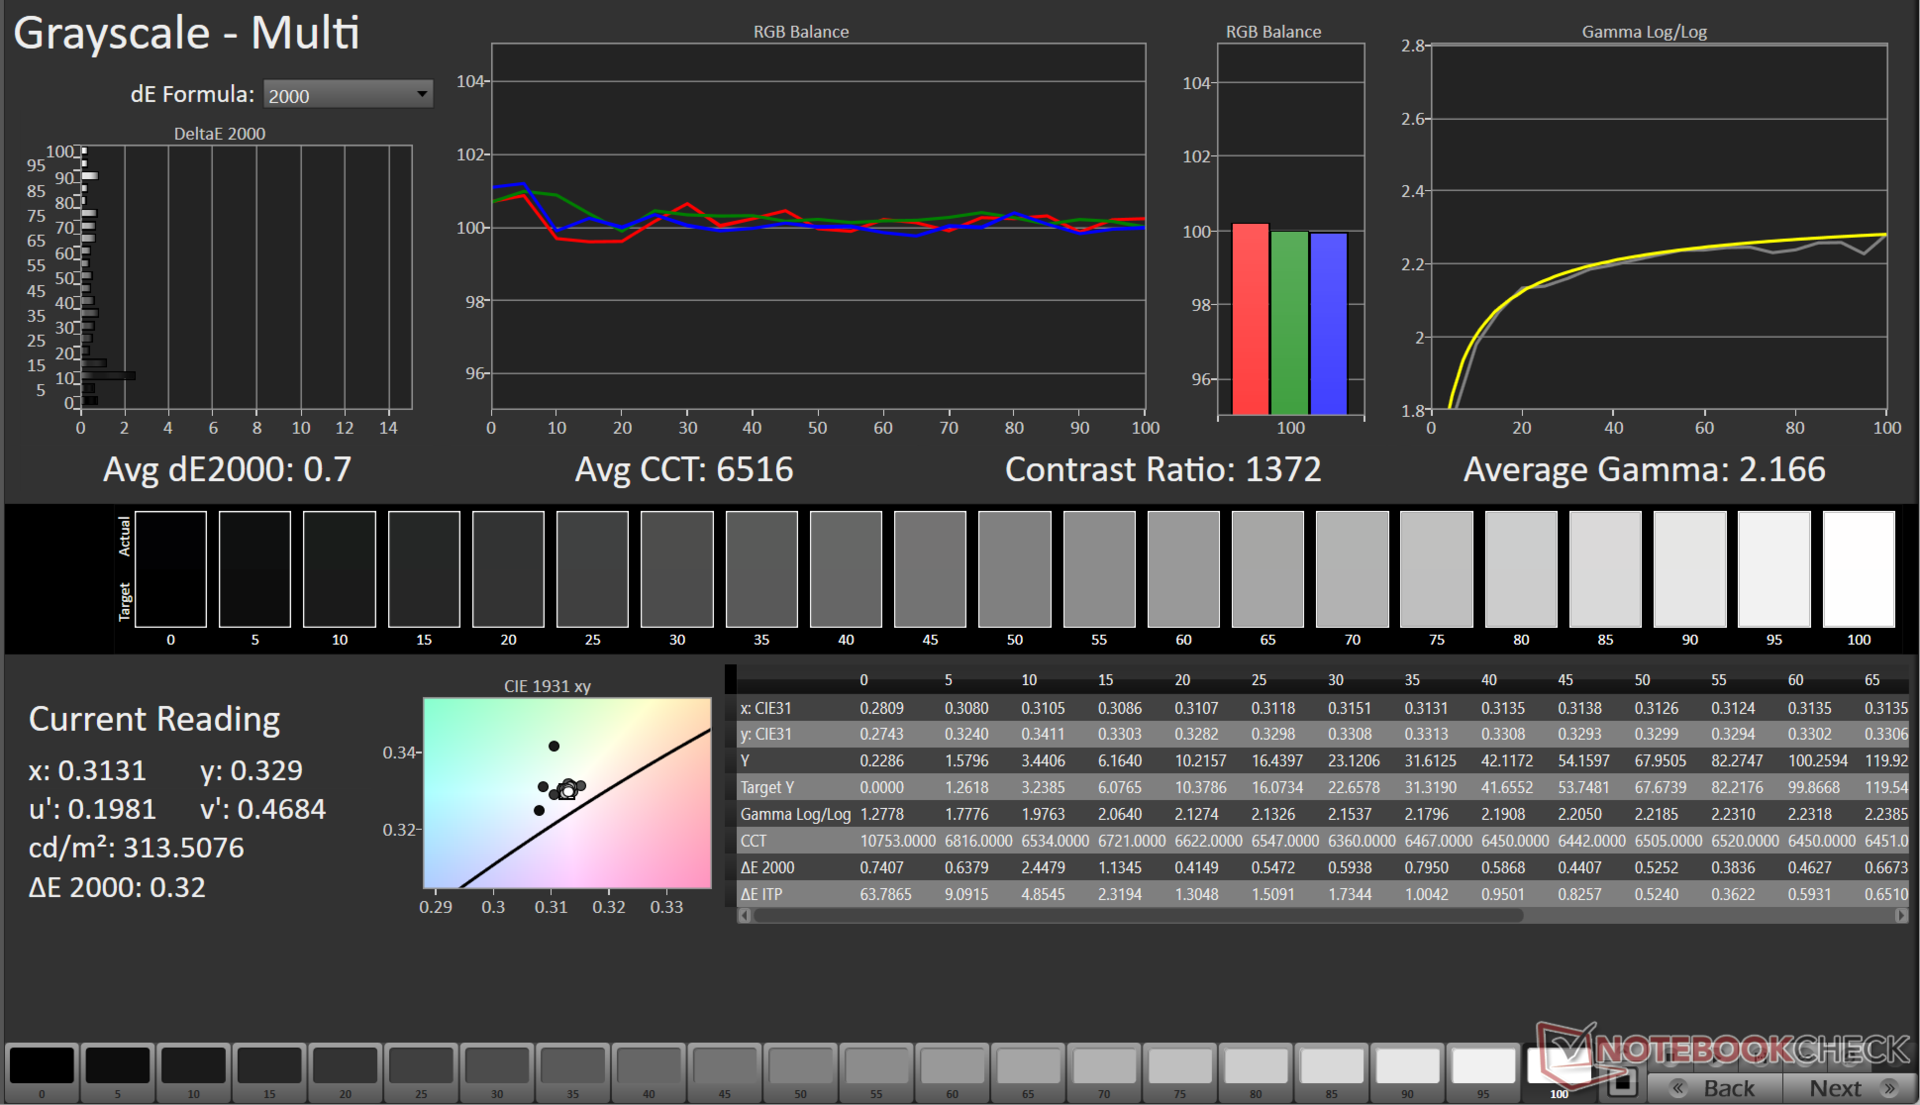
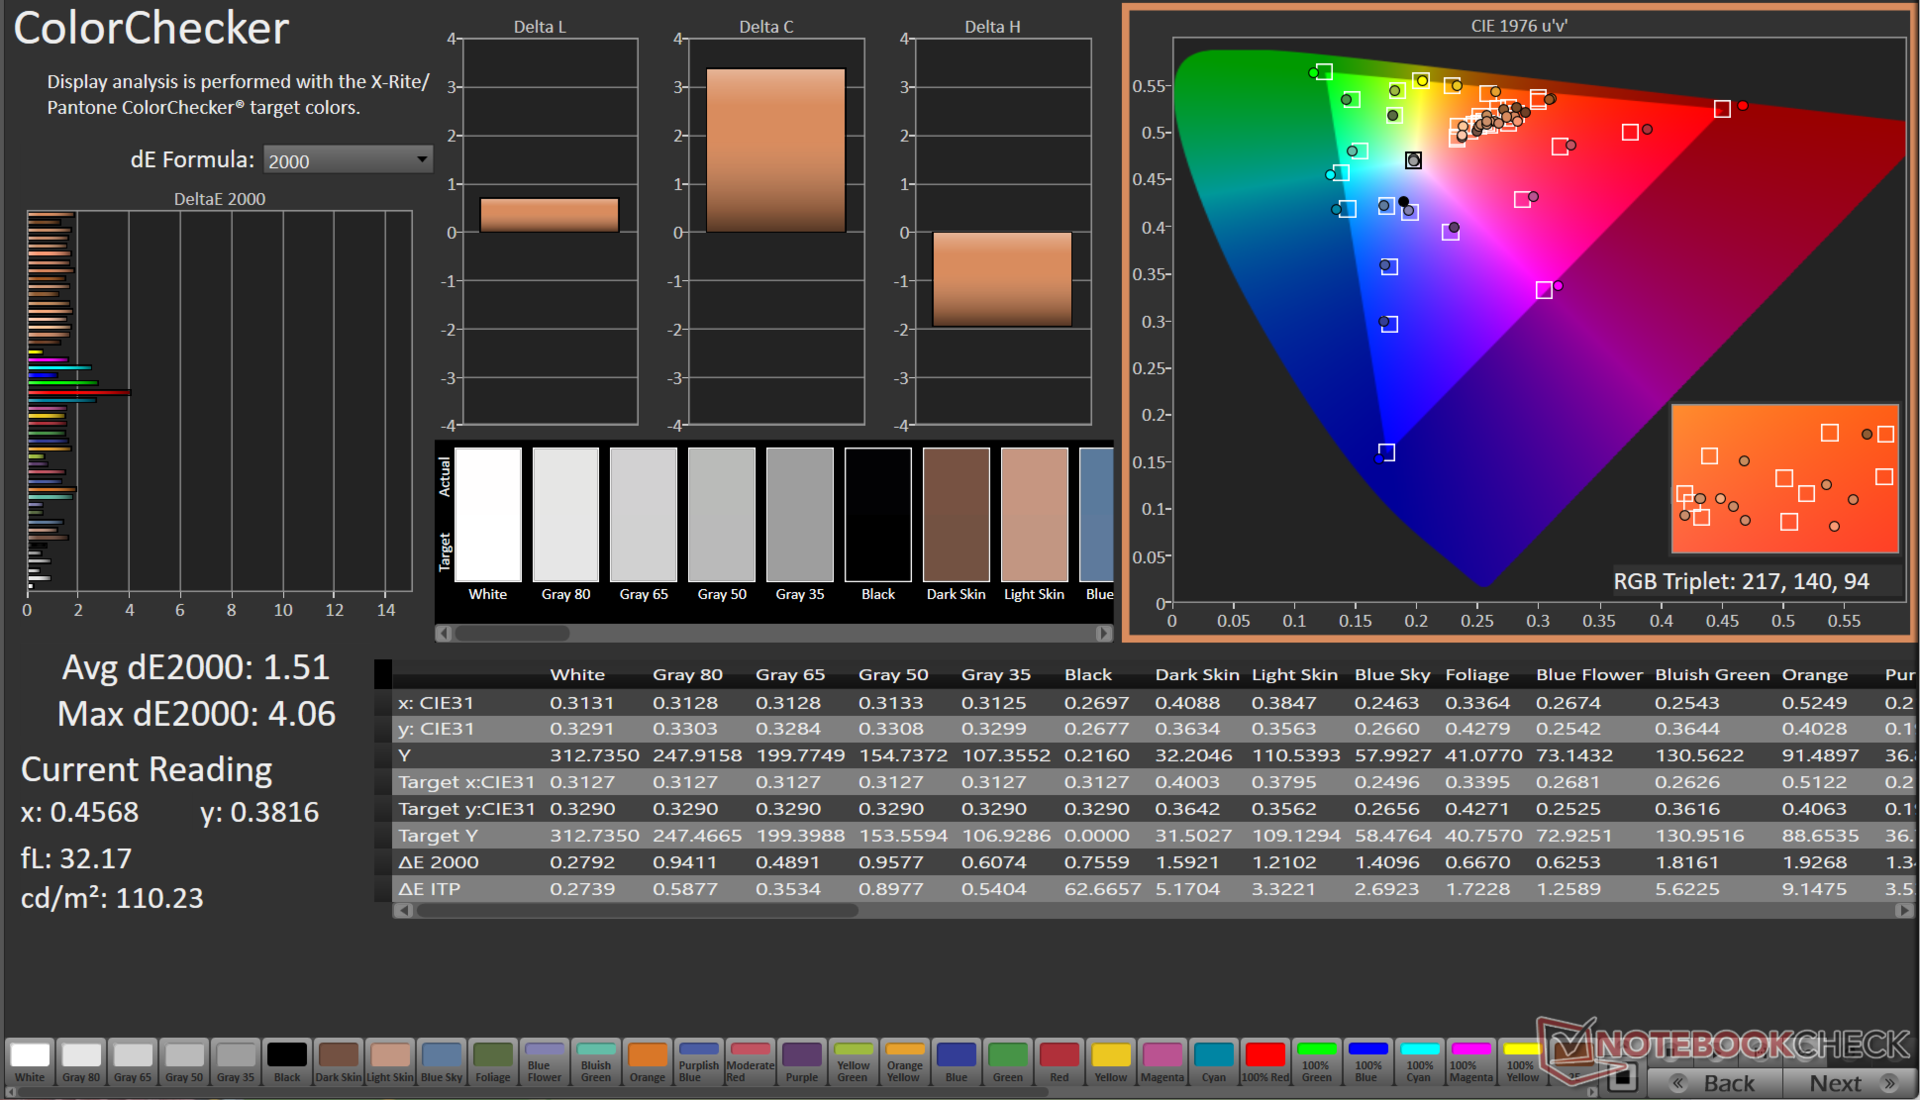
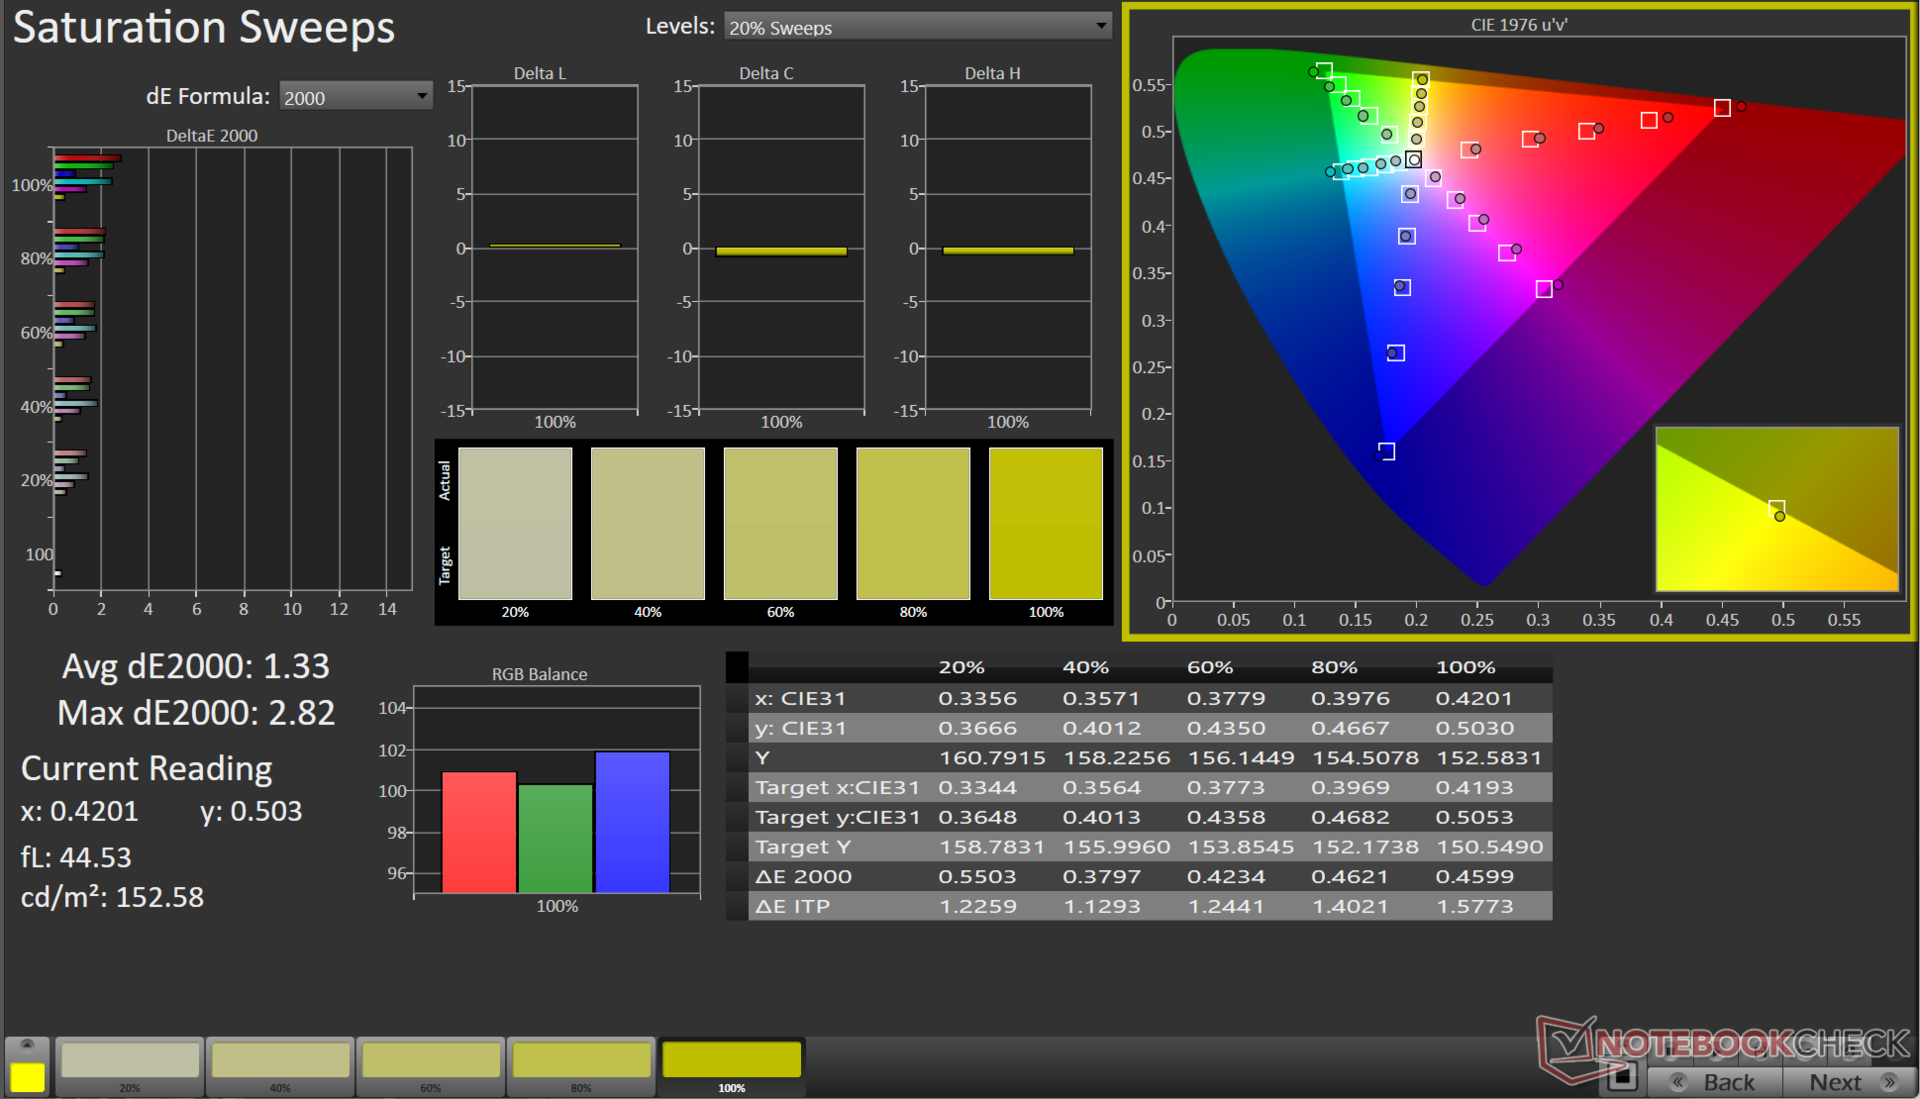
Skärmen täcker nästan hela sRGB-färgskalan med hyfsad prestanda även i Adobe RGB och Display P3 färgrymder, vilket bör vara lämpligt för spel och för att få grundläggande redigeringar gjorda.
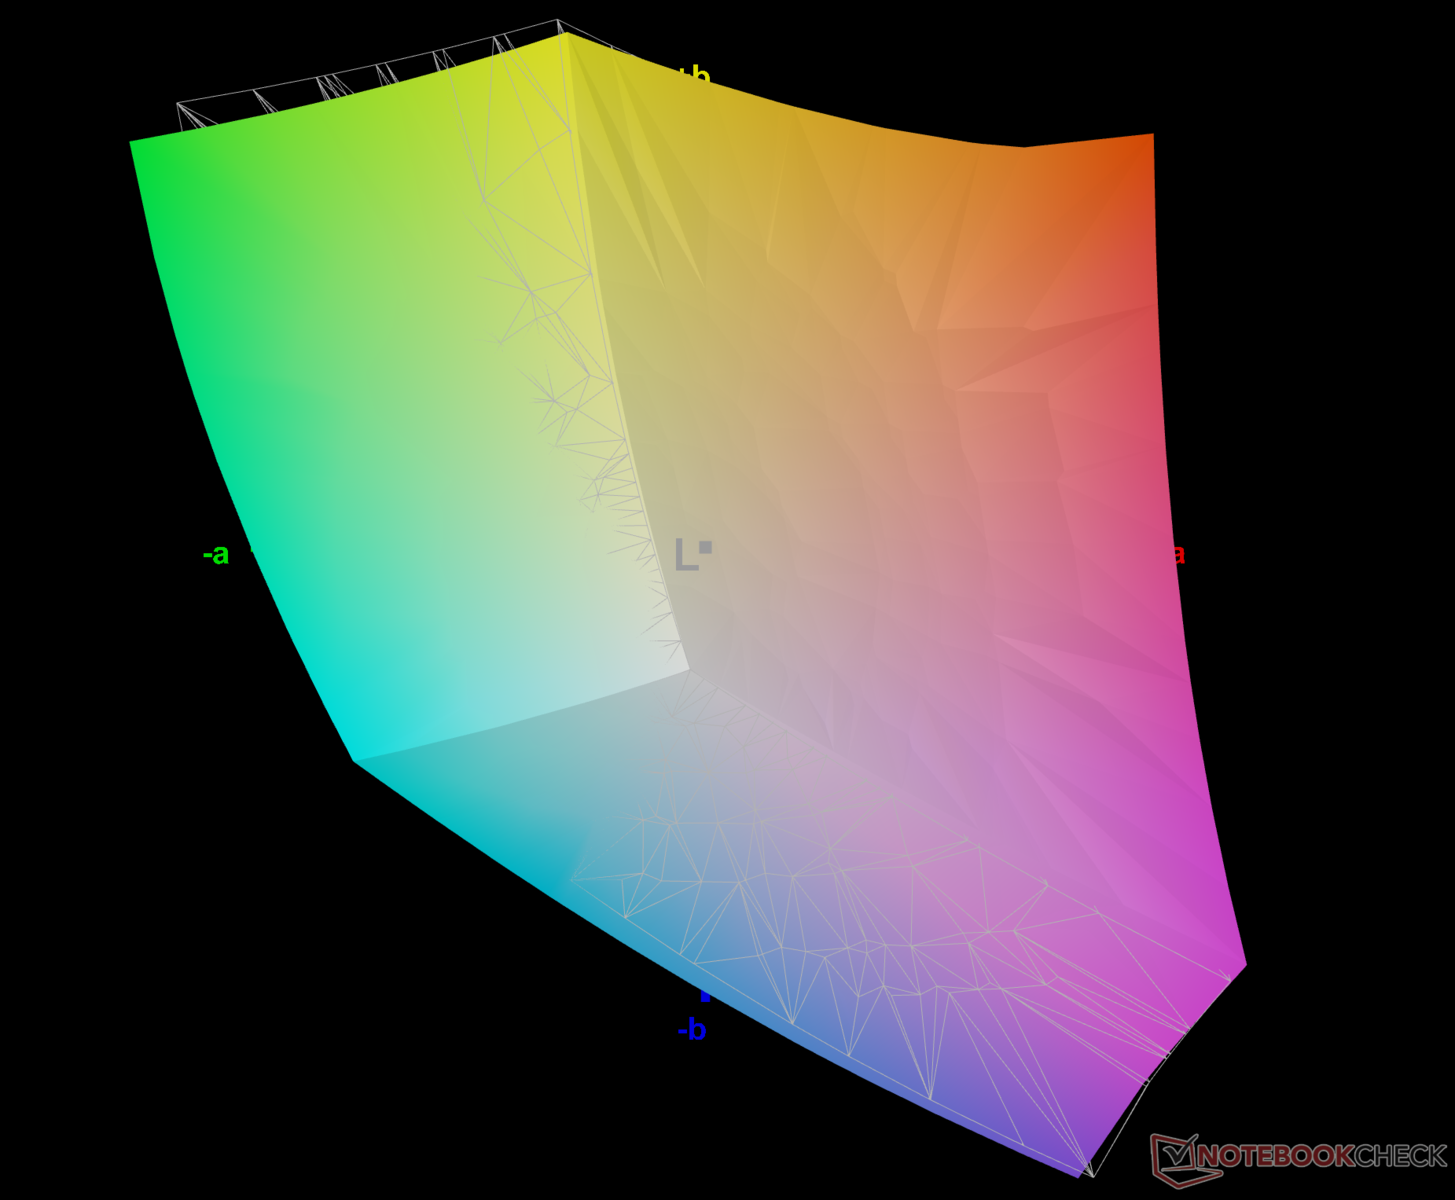
G15:s färgnoggrannhet från start uppvisar märkbara avvikelser. Vi kunde dock uppnå dramatiska förbättringar med vår kalibreringsrutin med X-Rite i1Basic Pro 3 spektrofotometer och Portrait Displays Calman Ultimate färgkalibreringsprogramvara.
Det genomsnittliga Delta E 2000 i gråskala kunde sänkas till 0,7, medan det genomsnittliga Delta E 2000 i ColorChecker förbättrades till 1,51.
Den kalibrerade ICC-filen kan laddas ner från länken ovan.

Visa svarstider
| ↔ Svarstid svart till vitt | ||
|---|---|---|
| 5.35 ms ... stiga ↗ och falla ↘ kombinerat | ↗ 2.34 ms stiga | 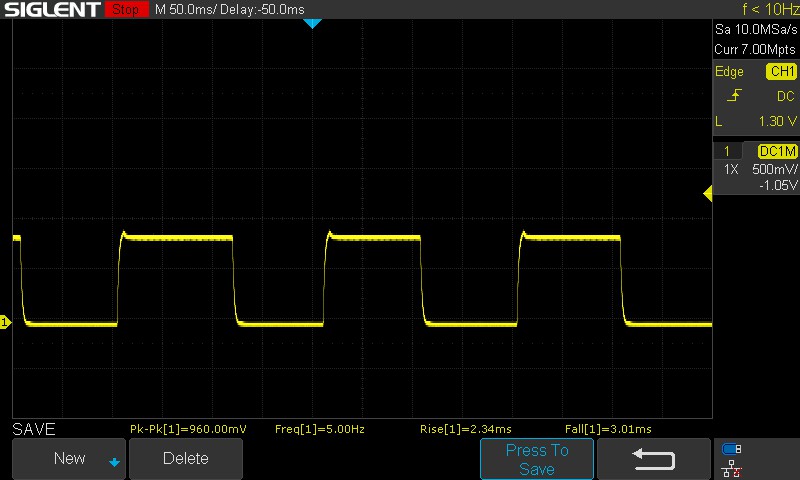 |
| ↘ 3.01 ms hösten | ||
| Skärmen visar väldigt snabba svarsfrekvenser i våra tester och borde vara mycket väl lämpad för fartfyllt spel. I jämförelse sträcker sig alla testade enheter från 0.1 (minst) till 240 (maximalt) ms. » 18 % av alla enheter är bättre. Det betyder att den uppmätta svarstiden är bättre än genomsnittet av alla testade enheter (19.8 ms). | ||
| ↔ Svarstid 50 % grått till 80 % grått | ||
| 3.39 ms ... stiga ↗ och falla ↘ kombinerat | ↗ 1.4 ms stiga | 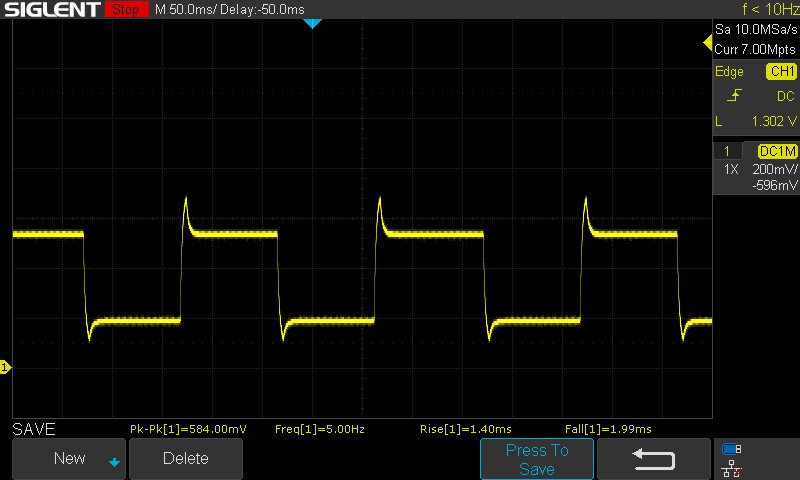 |
| ↘ 1.99 ms hösten | ||
| Skärmen visar väldigt snabba svarsfrekvenser i våra tester och borde vara mycket väl lämpad för fartfyllt spel. I jämförelse sträcker sig alla testade enheter från 0.165 (minst) till 636 (maximalt) ms. » 14 % av alla enheter är bättre. Det betyder att den uppmätta svarstiden är bättre än genomsnittet av alla testade enheter (31 ms). | ||
Skärmflimmer / PWM (Puls-Width Modulation)
| Skärmflimmer / PWM upptäckt | 21620 Hz | ≤ 100 % ljusstyrka inställning | 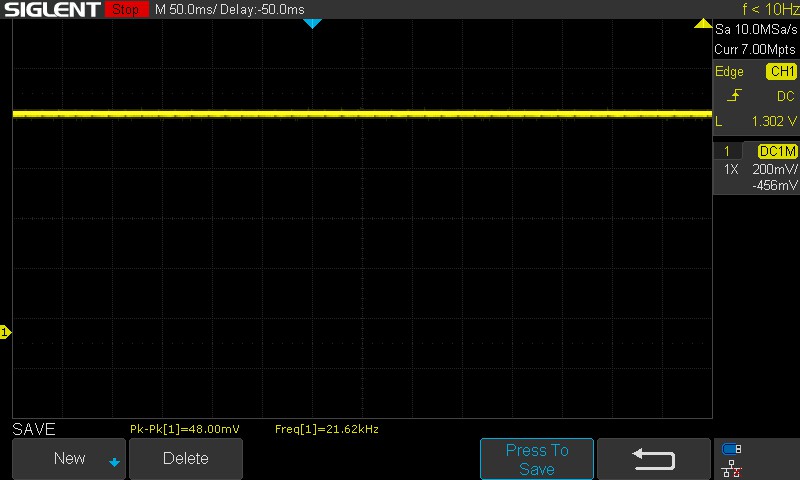 |
Displayens bakgrundsbelysning flimrar vid 21620 Hz (i värsta fall, t.ex. med PWM) Flimrande upptäckt vid en ljusstyrkeinställning på 100 % och lägre. Det ska inte finnas något flimmer eller PWM över denna ljusstyrkeinställning. Frekvensen för 21620 Hz är ganska hög, så de flesta användare som är känsliga för PWM bör inte märka något flimmer. Som jämförelse: 52 % av alla testade enheter använder inte PWM för att dämpa skärmen. Om PWM upptäcktes mättes ett medelvärde av 7757 (minst: 5 - maximum: 343500) Hz. | |||
G15:s panel använder sig av overdrive för att uppnå lägre svarstider. Det är värt att notera att det inte finns något alternativ för att inaktivera panelens overdrive via Alienware Command Center.
Även om panelen inte använder PWM för justering av ljusstyrka, uppvisar den fortfarande flimmer. Det är dock osannolikt att detta kommer att orsaka betydande ögonbelastning eller obehag för de flesta användare på grund av dess höga frekvens.
För mer information, kolla in vår artikel, "Varför PWM är en sådan huvudvärk". Dessutom har Tabell över PWM-ranking en översikt över uppmätta PWM-frekvenser för alla hittills granskade enheter.
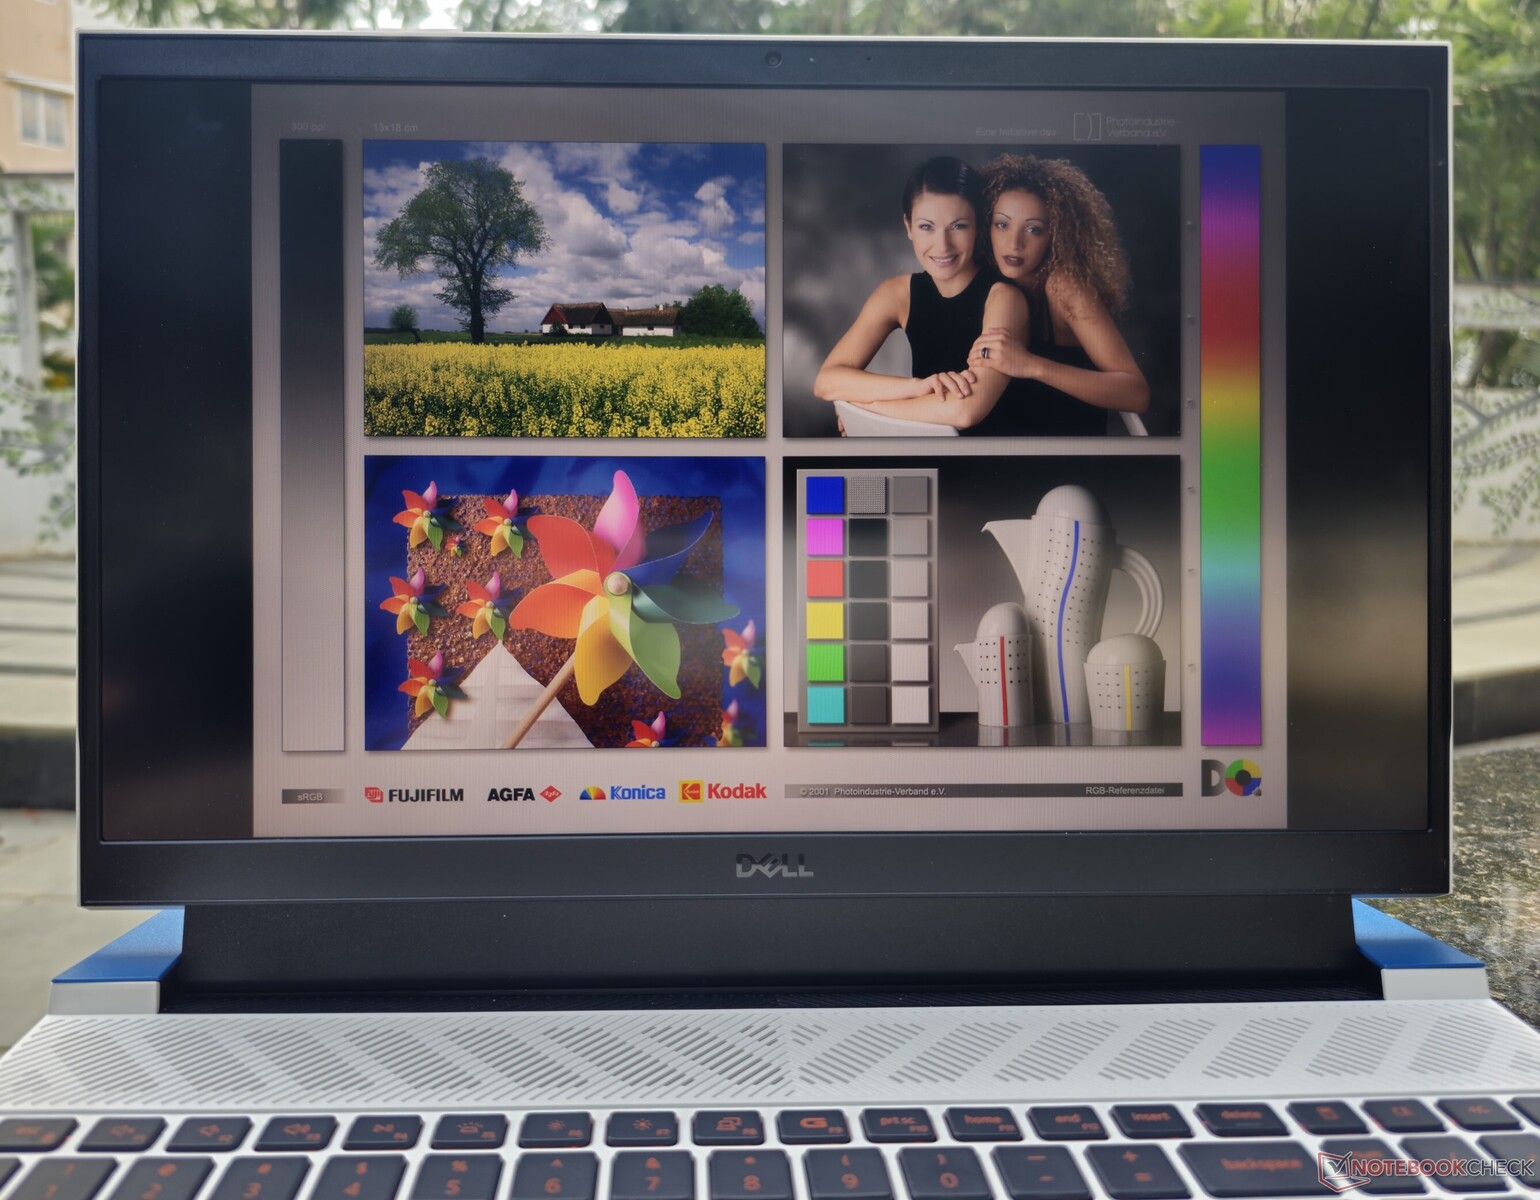
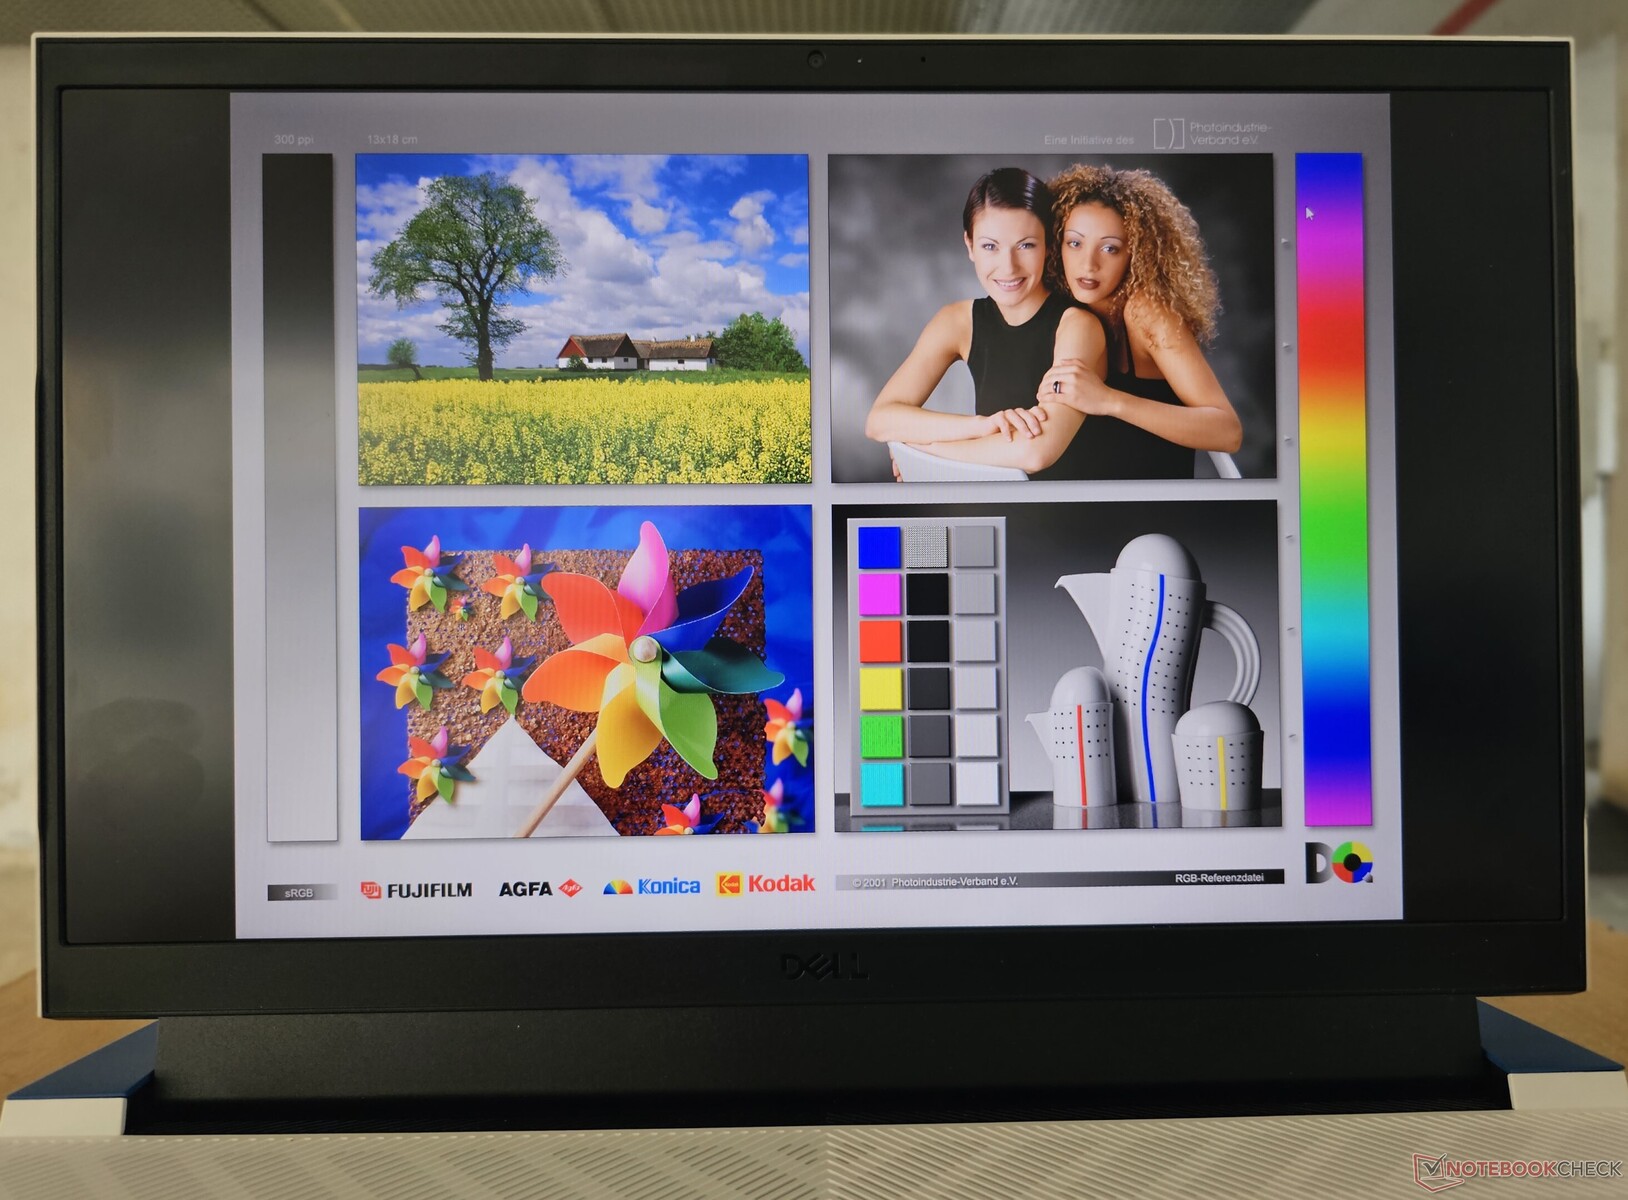
Utomhusvisning innebär inga större problem så länge inget direkt solljus faller på skärmen. Betraktningsvinklarna är breda och relativt stabila, med undantag för en viss märkbar förlust av ljusstyrka vid extremerna.
Prestanda: På förväntade linjer för en Core i7-13650HX och RTX 4060-kombination
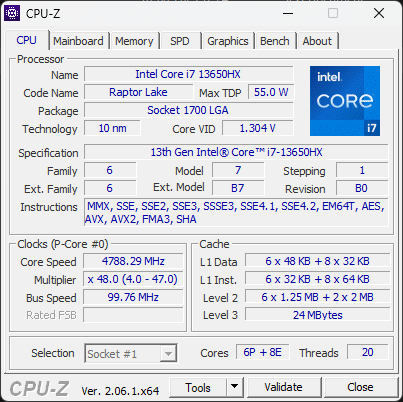
Vår Dell G15 5530-enhet drivs av Intel Core i7-13650HX ochNvidia GeForce RTX 4060 Laptop GPU. Beroende på region kan köpare också konfigurera den här bärbara datorn med en Core i5-13450HX och en RTX 3050 6 GB eller RTX 4050 GPU för bärbar dator.
Observera att RTX 3050-alternativet endast är tillgängligt i kombination med Core i5-13450HX.
Villkor för testning
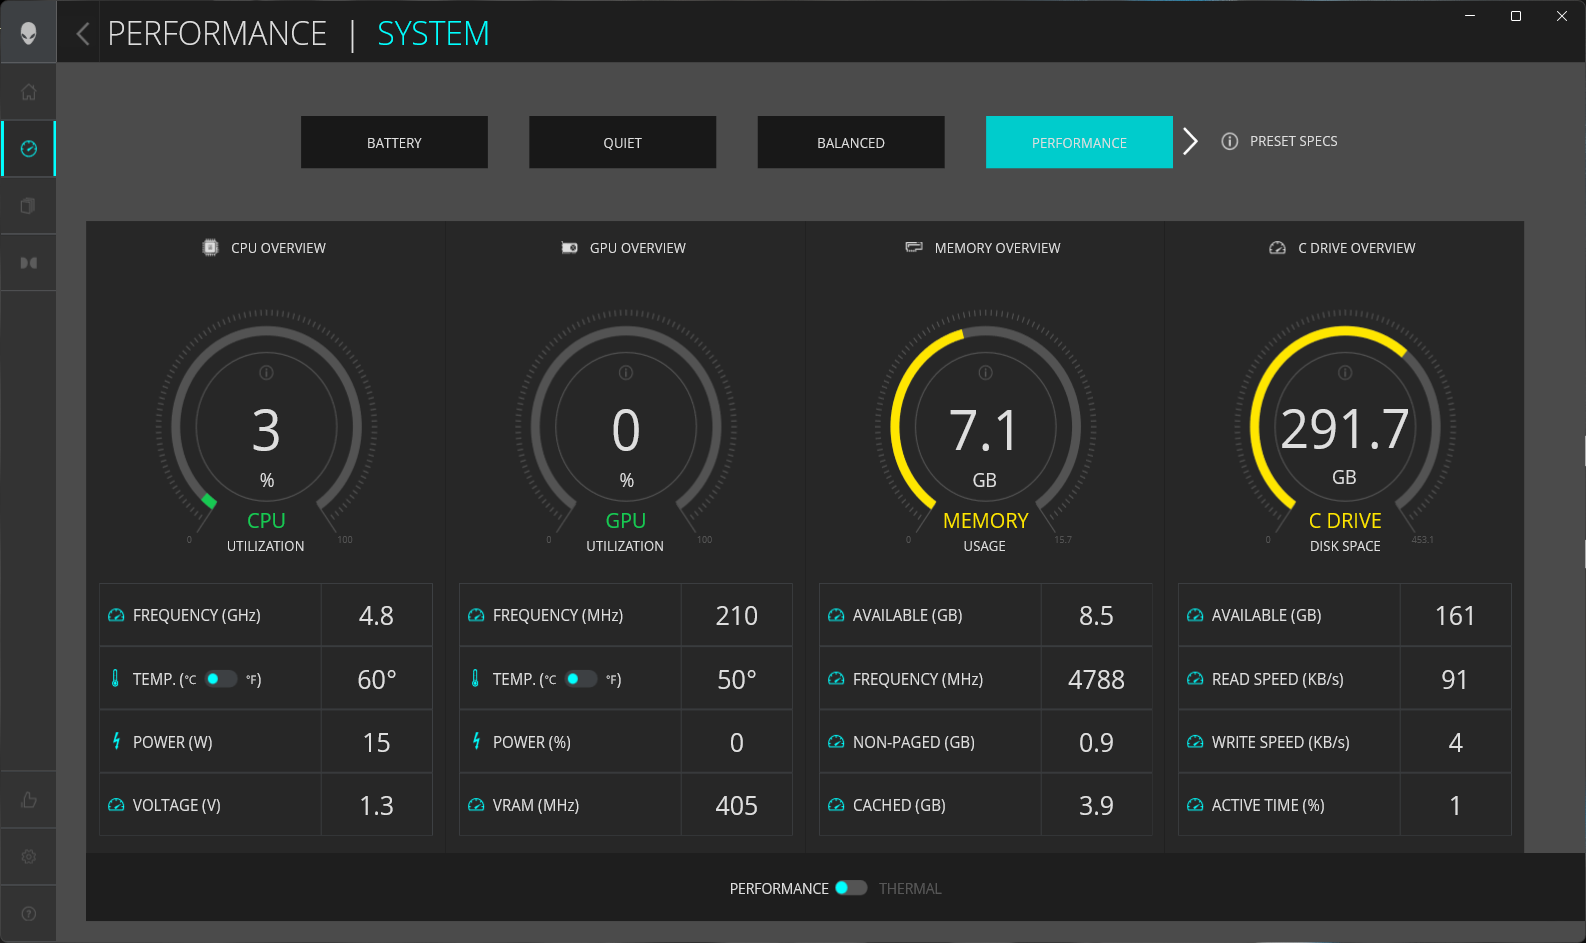
Alienware Command Center tillhandahåller fyra fördefinierade prestandaförinställningar att välja mellan, men det låter också användare skapa och anpassa sina egna profiler.
Vi använde prestandaläget för alla riktmärken och tester, förutom för att bedöma batteritiden där vi använde batteriprofilen.
I tabellen nedan illustreras variationerna i Processor Base Power (PBP) och Maximum Turbo Power (MTP) för varje scenario:
| Prestandaläge | PL1 (PBP) / Tau | PL2 (MTP) / Tau | PL4 |
|---|---|---|---|
| Batteri | 55 W / 56 s | 157 W / 2,44 ms | 242 W |
| Tyst | 55 W / 56 s | 157 W / 2,44 ms | 242 W |
| Balanserad | 157 W / 56 s | 157 W / 2,44 ms | 242 W |
| Prestanda | 191 W / 56 s | 191 W / 2,44 ms | 242 W |
Processor
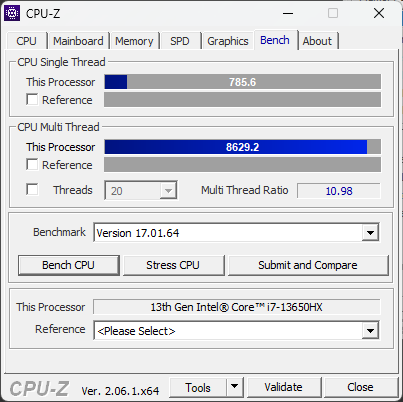
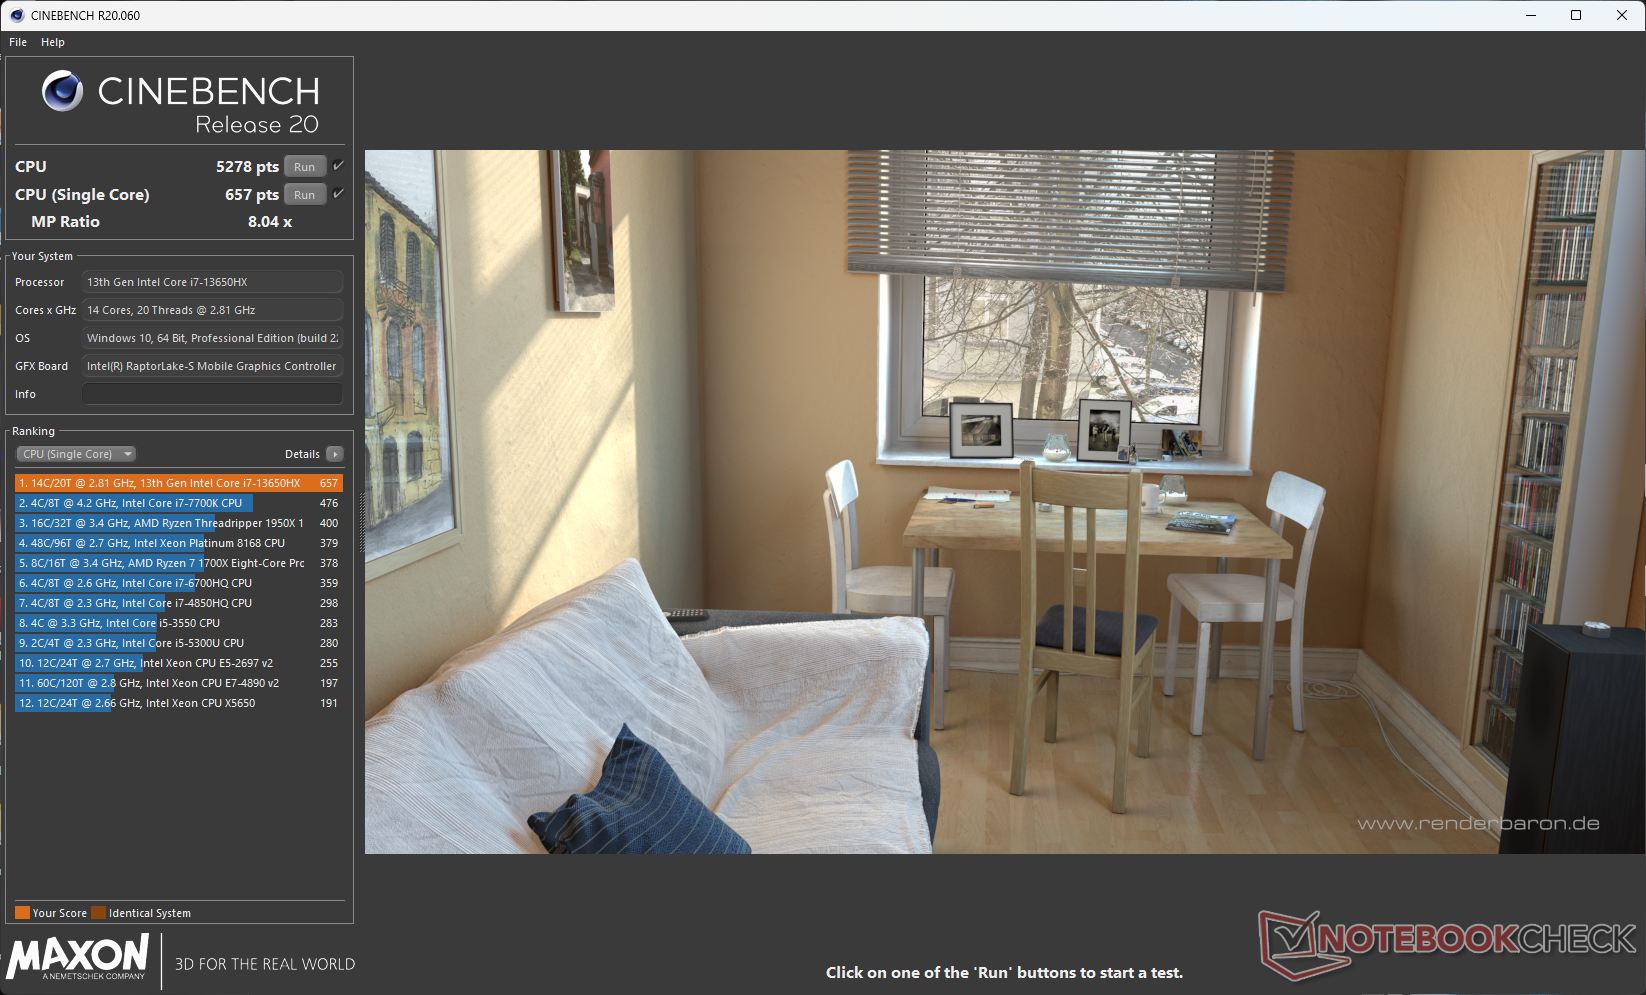
Intel Core i7-13650HX är en 14-kärnig 20-trådars Raptor Lake-HX-del som erbjuder en enkelkärnig boost upp till 4,9 GHz på sina P-kärnor.
I Cinebench R15 multi-core loop-testet startar G15 5530 i nivå med Asus ROG Strix G18, som använder samma CPU. Vi observerar dock en liten strypning halvvägs genom testet. Den övergripande CPU-prestandan är annars nästan identisk i båda modellerna.
G15 5530s Core i7-13650HX erbjuder bra ledningar i flerkärniga tester över Ryzen 9 7940HS i Asus TUF Gaming A16, men den senare lyckas hålla sig inom slående avstånd i kumulativ prestanda på grund av dess höga enkelkärniga vinster
.Cinebench R15 Multi Loop
Cinebench R23: Multi Core | Single Core
Cinebench R20: CPU (Multi Core) | CPU (Single Core)
Cinebench R15: CPU Multi 64Bit | CPU Single 64Bit
Blender: v2.79 BMW27 CPU
7-Zip 18.03: 7z b 4 | 7z b 4 -mmt1
Geekbench 5.5: Multi-Core | Single-Core
HWBOT x265 Benchmark v2.2: 4k Preset
LibreOffice : 20 Documents To PDF
R Benchmark 2.5: Overall mean
| CPU Performance rating | |
| Asus ROG Strix G17 G713PI | |
| Medion Erazer Major X20 | |
| Genomsnitt av klass Gaming | |
| Asus ROG Flow X16 GV601V | |
| Dell G15 5530 | |
| Asus ROG Strix G18 G814JI | |
| Lenovo Legion Pro 5 16IRX8 | |
| Genomsnitt Intel Core i7-13650HX | |
| Asus TUF Gaming A16 FA617XS | |
| MSI Katana 17 B13VFK | |
| Cinebench R23 / Multi Core | |
| Asus ROG Strix G17 G713PI | |
| Medion Erazer Major X20 | |
| Genomsnitt av klass Gaming (10488 - 42661, n=107, senaste 2 åren) | |
| Asus ROG Strix G18 G814JI | |
| Dell G15 5530 | |
| Genomsnitt Intel Core i7-13650HX (18744 - 21006, n=6) | |
| Lenovo Legion Pro 5 16IRX8 | |
| Asus ROG Flow X16 GV601V | |
| Asus TUF Gaming A16 FA617XS | |
| MSI Katana 17 B13VFK | |
| Cinebench R23 / Single Core | |
| Medion Erazer Major X20 | |
| Asus ROG Flow X16 GV601V | |
| Genomsnitt av klass Gaming (1166 - 2415, n=107, senaste 2 åren) | |
| Asus ROG Strix G18 G814JI | |
| Asus ROG Strix G17 G713PI | |
| Dell G15 5530 | |
| Genomsnitt Intel Core i7-13650HX (1693 - 1903, n=6) | |
| MSI Katana 17 B13VFK | |
| Asus TUF Gaming A16 FA617XS | |
| Lenovo Legion Pro 5 16IRX8 | |
| Cinebench R20 / CPU (Multi Core) | |
| Medion Erazer Major X20 | |
| Genomsnitt av klass Gaming (4029 - 16433, n=106, senaste 2 åren) | |
| Asus ROG Strix G17 G713PI | |
| Dell G15 5530 | |
| Asus ROG Strix G18 G814JI | |
| Genomsnitt Intel Core i7-13650HX (7197 - 8021, n=5) | |
| Asus ROG Flow X16 GV601V | |
| Lenovo Legion Pro 5 16IRX8 | |
| Asus TUF Gaming A16 FA617XS | |
| MSI Katana 17 B13VFK | |
| Cinebench R20 / CPU (Single Core) | |
| Genomsnitt av klass Gaming (442 - 913, n=106, senaste 2 åren) | |
| Medion Erazer Major X20 | |
| Asus ROG Flow X16 GV601V | |
| Asus ROG Strix G18 G814JI | |
| Genomsnitt Intel Core i7-13650HX (700 - 728, n=5) | |
| Asus ROG Strix G17 G713PI | |
| Dell G15 5530 | |
| Asus TUF Gaming A16 FA617XS | |
| MSI Katana 17 B13VFK | |
| Lenovo Legion Pro 5 16IRX8 | |
| Cinebench R15 / CPU Multi 64Bit | |
| Asus ROG Strix G17 G713PI | |
| Medion Erazer Major X20 | |
| Genomsnitt av klass Gaming (1578 - 6330, n=105, senaste 2 åren) | |
| Lenovo Legion Pro 5 16IRX8 | |
| Dell G15 5530 | |
| Asus ROG Strix G18 G814JI | |
| Asus ROG Flow X16 GV601V | |
| Genomsnitt Intel Core i7-13650HX (2864 - 3147, n=5) | |
| Asus TUF Gaming A16 FA617XS | |
| MSI Katana 17 B13VFK | |
| Cinebench R15 / CPU Single 64Bit | |
| Medion Erazer Major X20 | |
| Genomsnitt av klass Gaming (188.8 - 350, n=106, senaste 2 åren) | |
| Asus ROG Strix G17 G713PI | |
| Asus ROG Flow X16 GV601V | |
| Asus TUF Gaming A16 FA617XS | |
| Asus ROG Strix G18 G814JI | |
| Dell G15 5530 | |
| Genomsnitt Intel Core i7-13650HX (256 - 275, n=5) | |
| Lenovo Legion Pro 5 16IRX8 | |
| MSI Katana 17 B13VFK | |
| Blender / v2.79 BMW27 CPU | |
| MSI Katana 17 B13VFK | |
| Asus TUF Gaming A16 FA617XS | |
| Asus ROG Flow X16 GV601V | |
| Genomsnitt Intel Core i7-13650HX (158 - 226, n=5) | |
| Dell G15 5530 | |
| Asus ROG Strix G18 G814JI | |
| Lenovo Legion Pro 5 16IRX8 | |
| Genomsnitt av klass Gaming (79 - 330, n=104, senaste 2 åren) | |
| Medion Erazer Major X20 | |
| Asus ROG Strix G17 G713PI | |
| 7-Zip 18.03 / 7z b 4 | |
| Asus ROG Strix G17 G713PI | |
| Medion Erazer Major X20 | |
| Genomsnitt av klass Gaming (33491 - 148086, n=105, senaste 2 åren) | |
| Asus ROG Strix G18 G814JI | |
| Lenovo Legion Pro 5 16IRX8 | |
| Dell G15 5530 | |
| Genomsnitt Intel Core i7-13650HX (73927 - 80057, n=5) | |
| Asus ROG Flow X16 GV601V | |
| Asus TUF Gaming A16 FA617XS | |
| MSI Katana 17 B13VFK | |
| 7-Zip 18.03 / 7z b 4 -mmt1 | |
| Asus ROG Strix G17 G713PI | |
| Medion Erazer Major X20 | |
| Asus TUF Gaming A16 FA617XS | |
| Genomsnitt av klass Gaming (4199 - 7436, n=105, senaste 2 åren) | |
| Asus ROG Flow X16 GV601V | |
| Asus ROG Strix G18 G814JI | |
| Genomsnitt Intel Core i7-13650HX (5828 - 6125, n=5) | |
| Dell G15 5530 | |
| MSI Katana 17 B13VFK | |
| Lenovo Legion Pro 5 16IRX8 | |
| Geekbench 5.5 / Multi-Core | |
| Medion Erazer Major X20 | |
| Asus ROG Strix G17 G713PI | |
| Genomsnitt av klass Gaming (6460 - 28263, n=105, senaste 2 åren) | |
| Asus ROG Strix G18 G814JI | |
| Lenovo Legion Pro 5 16IRX8 | |
| Dell G15 5530 | |
| Asus ROG Flow X16 GV601V | |
| Genomsnitt Intel Core i7-13650HX (12509 - 14778, n=5) | |
| Asus TUF Gaming A16 FA617XS | |
| MSI Katana 17 B13VFK | |
| Geekbench 5.5 / Single-Core | |
| Genomsnitt av klass Gaming (986 - 2474, n=105, senaste 2 åren) | |
| Asus ROG Strix G17 G713PI | |
| Medion Erazer Major X20 | |
| Asus TUF Gaming A16 FA617XS | |
| Asus ROG Flow X16 GV601V | |
| Dell G15 5530 | |
| Genomsnitt Intel Core i7-13650HX (1810 - 1866, n=5) | |
| Asus ROG Strix G18 G814JI | |
| MSI Katana 17 B13VFK | |
| Lenovo Legion Pro 5 16IRX8 | |
| HWBOT x265 Benchmark v2.2 / 4k Preset | |
| Asus ROG Strix G17 G713PI | |
| Medion Erazer Major X20 | |
| Genomsnitt av klass Gaming (11.5 - 44.4, n=105, senaste 2 åren) | |
| Lenovo Legion Pro 5 16IRX8 | |
| Asus ROG Strix G18 G814JI | |
| Dell G15 5530 | |
| Asus ROG Flow X16 GV601V | |
| Genomsnitt Intel Core i7-13650HX (18.9 - 23.6, n=5) | |
| Asus TUF Gaming A16 FA617XS | |
| MSI Katana 17 B13VFK | |
| LibreOffice / 20 Documents To PDF | |
| Asus ROG Strix G18 G814JI | |
| MSI Katana 17 B13VFK | |
| Genomsnitt av klass Gaming (33.2 - 88.8, n=105, senaste 2 åren) | |
| Genomsnitt Intel Core i7-13650HX (38.9 - 58.8, n=5) | |
| Dell G15 5530 | |
| Asus ROG Strix G17 G713PI | |
| Medion Erazer Major X20 | |
| Asus TUF Gaming A16 FA617XS | |
| Asus ROG Flow X16 GV601V | |
| Lenovo Legion Pro 5 16IRX8 | |
| R Benchmark 2.5 / Overall mean | |
| Lenovo Legion Pro 5 16IRX8 | |
| MSI Katana 17 B13VFK | |
| Asus ROG Strix G18 G814JI | |
| Genomsnitt Intel Core i7-13650HX (0.4217 - 0.4461, n=6) | |
| Genomsnitt av klass Gaming (0.3439 - 0.759, n=106, senaste 2 åren) | |
| Dell G15 5530 | |
| Asus TUF Gaming A16 FA617XS | |
| Asus ROG Flow X16 GV601V | |
| Asus ROG Strix G17 G713PI | |
| Medion Erazer Major X20 | |
* ... mindre är bättre
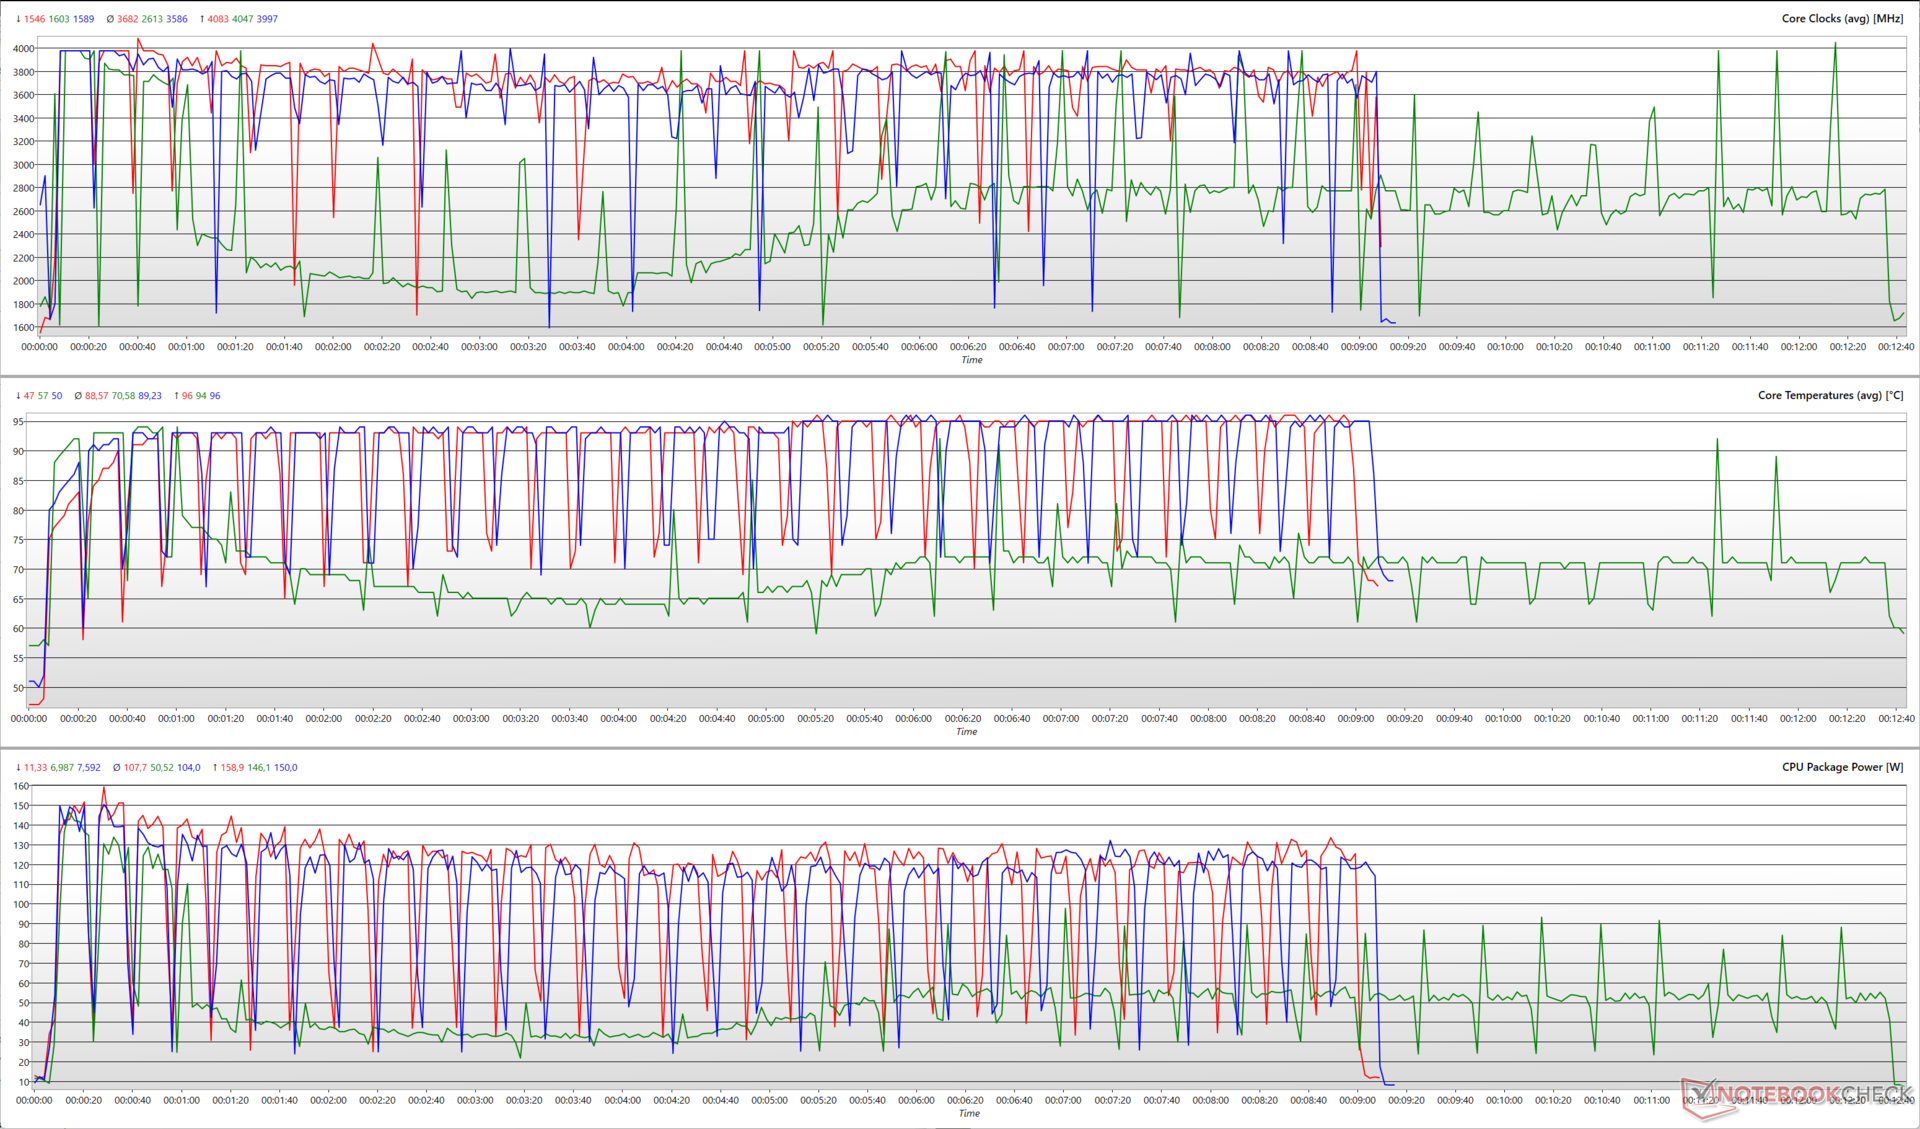
Diagrammet nedan illustrerar hur olika CPU-parametrar varierar i varje prestandaläge under en Cinebench R15-loop med flera kärnor.
Performance- och Balanced-lägena visar liknande genomsnittliga boost-klockor runt 3,6 GHz medan Quiet-läget nöjer sig med en genomsnittlig boost på bara 2,6 GHz.
Det balanserade läget är cirka 9 W mer ekonomiskt än Performance när det gäller CPU-paketets maximala effektförbrukning. Kärntemperaturerna är dock mer eller mindre identiska i båda förinställningarna.
Det är värt att notera att även om Quiet-läget förbrukar ungefär 50,5 W paketström i genomsnitt, resulterar det också i en prestandaförlust på 23%.
Med batteridrift minskar prestandan för enkelkärnig Cinebench R20 med endast 7 %. Resultatet för flera kärnor sjunker dock med 34 %.
AIDA64: FP32 Ray-Trace | FPU Julia | CPU SHA3 | CPU Queen | FPU SinJulia | FPU Mandel | CPU AES | CPU ZLib | FP64 Ray-Trace | CPU PhotoWorxx
| Performance rating | |
| Asus ROG Strix G17 G713PI | |
| Genomsnitt av klass Gaming | |
| Medion Erazer Major X20 | |
| Asus TUF Gaming A16 FA617XS | |
| Lenovo Legion Pro 5 16IRX8 | |
| Asus ROG Strix G18 G814JI | |
| Dell G15 5530 | |
| Genomsnitt Intel Core i7-13650HX | |
| Asus ROG Flow X16 GV601V | |
| MSI Katana 17 B13VFK | |
| AIDA64 / FP32 Ray-Trace | |
| Asus ROG Strix G17 G713PI | |
| Genomsnitt av klass Gaming (10227 - 85542, n=105, senaste 2 åren) | |
| Asus TUF Gaming A16 FA617XS | |
| Medion Erazer Major X20 | |
| Lenovo Legion Pro 5 16IRX8 | |
| Asus ROG Strix G18 G814JI | |
| Dell G15 5530 | |
| Genomsnitt Intel Core i7-13650HX (13404 - 20012, n=5) | |
| MSI Katana 17 B13VFK | |
| Asus ROG Flow X16 GV601V | |
| AIDA64 / FPU Julia | |
| Asus ROG Strix G17 G713PI | |
| Genomsnitt av klass Gaming (51376 - 238426, n=105, senaste 2 åren) | |
| Medion Erazer Major X20 | |
| Asus TUF Gaming A16 FA617XS | |
| Lenovo Legion Pro 5 16IRX8 | |
| Asus ROG Strix G18 G814JI | |
| Dell G15 5530 | |
| Genomsnitt Intel Core i7-13650HX (68241 - 97317, n=5) | |
| Asus ROG Flow X16 GV601V | |
| MSI Katana 17 B13VFK | |
| AIDA64 / CPU SHA3 | |
| Asus ROG Strix G17 G713PI | |
| Genomsnitt av klass Gaming (2180 - 10115, n=105, senaste 2 åren) | |
| Medion Erazer Major X20 | |
| Lenovo Legion Pro 5 16IRX8 | |
| Asus TUF Gaming A16 FA617XS | |
| Asus ROG Strix G18 G814JI | |
| Dell G15 5530 | |
| Asus ROG Flow X16 GV601V | |
| Genomsnitt Intel Core i7-13650HX (3127 - 4487, n=5) | |
| MSI Katana 17 B13VFK | |
| AIDA64 / CPU Queen | |
| Asus ROG Strix G17 G713PI | |
| Medion Erazer Major X20 | |
| Asus TUF Gaming A16 FA617XS | |
| Genomsnitt av klass Gaming (49785 - 173351, n=90, senaste 2 åren) | |
| Lenovo Legion Pro 5 16IRX8 | |
| Asus ROG Flow X16 GV601V | |
| Asus ROG Strix G18 G814JI | |
| Genomsnitt Intel Core i7-13650HX (108627 - 110589, n=5) | |
| Dell G15 5530 | |
| MSI Katana 17 B13VFK | |
| AIDA64 / FPU SinJulia | |
| Asus ROG Strix G17 G713PI | |
| Asus TUF Gaming A16 FA617XS | |
| Medion Erazer Major X20 | |
| Genomsnitt av klass Gaming (4424 - 33636, n=105, senaste 2 åren) | |
| Lenovo Legion Pro 5 16IRX8 | |
| Asus ROG Flow X16 GV601V | |
| Dell G15 5530 | |
| Asus ROG Strix G18 G814JI | |
| Genomsnitt Intel Core i7-13650HX (9134 - 10887, n=5) | |
| MSI Katana 17 B13VFK | |
| AIDA64 / FPU Mandel | |
| Asus ROG Strix G17 G713PI | |
| Genomsnitt av klass Gaming (25115 - 128721, n=105, senaste 2 åren) | |
| Asus TUF Gaming A16 FA617XS | |
| Medion Erazer Major X20 | |
| Lenovo Legion Pro 5 16IRX8 | |
| Asus ROG Strix G18 G814JI | |
| Dell G15 5530 | |
| Genomsnitt Intel Core i7-13650HX (33391 - 48323, n=5) | |
| Asus ROG Flow X16 GV601V | |
| MSI Katana 17 B13VFK | |
| AIDA64 / CPU AES | |
| Asus ROG Strix G17 G713PI | |
| Medion Erazer Major X20 | |
| Genomsnitt av klass Gaming (39258 - 247074, n=105, senaste 2 åren) | |
| Lenovo Legion Pro 5 16IRX8 | |
| Asus TUF Gaming A16 FA617XS | |
| Dell G15 5530 | |
| Asus ROG Strix G18 G814JI | |
| Asus ROG Flow X16 GV601V | |
| Genomsnitt Intel Core i7-13650HX (64436 - 85343, n=5) | |
| MSI Katana 17 B13VFK | |
| AIDA64 / CPU ZLib | |
| Asus ROG Strix G17 G713PI | |
| Medion Erazer Major X20 | |
| Genomsnitt av klass Gaming (574 - 2531, n=105, senaste 2 åren) | |
| Lenovo Legion Pro 5 16IRX8 | |
| Dell G15 5530 | |
| Asus ROG Strix G18 G814JI | |
| Genomsnitt Intel Core i7-13650HX (1136 - 1285, n=5) | |
| Asus ROG Flow X16 GV601V | |
| Asus TUF Gaming A16 FA617XS | |
| MSI Katana 17 B13VFK | |
| AIDA64 / FP64 Ray-Trace | |
| Asus ROG Strix G17 G713PI | |
| Genomsnitt av klass Gaming (5509 - 45446, n=105, senaste 2 åren) | |
| Asus TUF Gaming A16 FA617XS | |
| Medion Erazer Major X20 | |
| Lenovo Legion Pro 5 16IRX8 | |
| Asus ROG Strix G18 G814JI | |
| Dell G15 5530 | |
| Genomsnitt Intel Core i7-13650HX (7270 - 10900, n=5) | |
| Asus ROG Flow X16 GV601V | |
| MSI Katana 17 B13VFK | |
| AIDA64 / CPU PhotoWorxx | |
| Genomsnitt av klass Gaming (12271 - 89891, n=105, senaste 2 åren) | |
| Medion Erazer Major X20 | |
| Asus ROG Strix G18 G814JI | |
| Genomsnitt Intel Core i7-13650HX (36170 - 43289, n=5) | |
| Asus ROG Flow X16 GV601V | |
| Dell G15 5530 | |
| Lenovo Legion Pro 5 16IRX8 | |
| MSI Katana 17 B13VFK | |
| Asus ROG Strix G17 G713PI | |
| Asus TUF Gaming A16 FA617XS | |
Vår dedikerade Intel Core i7-13650HX sida innehåller mer information och prestandajämförelser.
Systemets prestanda
G15 5530 uppnår en lägre total PCMark 10-poäng jämfört med konkurrenterna, men vi stötte inte på några problem när vi använde datorn för allmänna ändamål.
Den MSI Katana 17 med en Core i7-13620H lyckas något överglänsa G15 5530 i PCMark 10 och CrossMark övergripande poäng.
CrossMark: Overall | Productivity | Creativity | Responsiveness
AIDA64: Memory Copy | Memory Read | Memory Write | Memory Latency
| PCMark 10 / Score | |
| Genomsnitt av klass Gaming (5828 - 12414, n=93, senaste 2 åren) | |
| Asus TUF Gaming A16 FA617XS | |
| Asus ROG Flow X16 GV601V | |
| Lenovo Legion Pro 5 16IRX8 | |
| Medion Erazer Major X20 | |
| Asus ROG Strix G17 G713PI | |
| Genomsnitt Intel Core i7-13650HX, NVIDIA GeForce RTX 4060 Laptop GPU (6984 - 7613, n=3) | |
| MSI Katana 17 B13VFK | |
| Dell G15 5530 | |
| Asus ROG Strix G18 G814JI | |
| PCMark 10 / Essentials | |
| Medion Erazer Major X20 | |
| Asus ROG Flow X16 GV601V | |
| Asus ROG Strix G17 G713PI | |
| Dell G15 5530 | |
| Lenovo Legion Pro 5 16IRX8 | |
| Asus TUF Gaming A16 FA617XS | |
| MSI Katana 17 B13VFK | |
| Genomsnitt av klass Gaming (8810 - 11935, n=97, senaste 2 åren) | |
| Genomsnitt Intel Core i7-13650HX, NVIDIA GeForce RTX 4060 Laptop GPU (9532 - 11151, n=3) | |
| Asus ROG Strix G18 G814JI | |
| PCMark 10 / Productivity | |
| Genomsnitt av klass Gaming (6845 - 25323, n=95, senaste 2 åren) | |
| Asus ROG Strix G17 G713PI | |
| Asus TUF Gaming A16 FA617XS | |
| Asus ROG Flow X16 GV601V | |
| Genomsnitt Intel Core i7-13650HX, NVIDIA GeForce RTX 4060 Laptop GPU (9961 - 10204, n=3) | |
| Dell G15 5530 | |
| Medion Erazer Major X20 | |
| MSI Katana 17 B13VFK | |
| Lenovo Legion Pro 5 16IRX8 | |
| Asus ROG Strix G18 G814JI | |
| PCMark 10 / Digital Content Creation | |
| Genomsnitt av klass Gaming (7602 - 19954, n=95, senaste 2 åren) | |
| Lenovo Legion Pro 5 16IRX8 | |
| Asus TUF Gaming A16 FA617XS | |
| Asus ROG Flow X16 GV601V | |
| Genomsnitt Intel Core i7-13650HX, NVIDIA GeForce RTX 4060 Laptop GPU (8323 - 11686, n=3) | |
| Medion Erazer Major X20 | |
| MSI Katana 17 B13VFK | |
| Asus ROG Strix G17 G713PI | |
| Dell G15 5530 | |
| Asus ROG Strix G18 G814JI | |
| CrossMark / Overall | |
| Asus ROG Strix G17 G713PI | |
| Genomsnitt av klass Gaming (1366 - 2409, n=94, senaste 2 åren) | |
| Asus ROG Flow X16 GV601V | |
| Genomsnitt Intel Core i7-13650HX, NVIDIA GeForce RTX 4060 Laptop GPU (1839 - 1951, n=3) | |
| MSI Katana 17 B13VFK | |
| Medion Erazer Major X20 | |
| Dell G15 5530 | |
| Asus TUF Gaming A16 FA617XS | |
| Lenovo Legion Pro 5 16IRX8 | |
| CrossMark / Productivity | |
| Asus ROG Strix G17 G713PI | |
| Asus ROG Flow X16 GV601V | |
| Genomsnitt av klass Gaming (1386 - 2254, n=94, senaste 2 åren) | |
| Genomsnitt Intel Core i7-13650HX, NVIDIA GeForce RTX 4060 Laptop GPU (1730 - 1864, n=3) | |
| MSI Katana 17 B13VFK | |
| Dell G15 5530 | |
| Asus TUF Gaming A16 FA617XS | |
| Medion Erazer Major X20 | |
| Lenovo Legion Pro 5 16IRX8 | |
| CrossMark / Creativity | |
| Asus ROG Strix G17 G713PI | |
| Genomsnitt av klass Gaming (1343 - 2786, n=94, senaste 2 åren) | |
| Asus ROG Flow X16 GV601V | |
| Medion Erazer Major X20 | |
| Dell G15 5530 | |
| Genomsnitt Intel Core i7-13650HX, NVIDIA GeForce RTX 4060 Laptop GPU (2020 - 2063, n=3) | |
| MSI Katana 17 B13VFK | |
| Asus TUF Gaming A16 FA617XS | |
| Lenovo Legion Pro 5 16IRX8 | |
| CrossMark / Responsiveness | |
| MSI Katana 17 B13VFK | |
| Genomsnitt Intel Core i7-13650HX, NVIDIA GeForce RTX 4060 Laptop GPU (1544 - 1907, n=3) | |
| Genomsnitt av klass Gaming (1226 - 2334, n=94, senaste 2 åren) | |
| Asus ROG Flow X16 GV601V | |
| Asus ROG Strix G17 G713PI | |
| Lenovo Legion Pro 5 16IRX8 | |
| Medion Erazer Major X20 | |
| Dell G15 5530 | |
| Asus TUF Gaming A16 FA617XS | |
| AIDA64 / Memory Copy | |
| Genomsnitt av klass Gaming (21750 - 129946, n=105, senaste 2 åren) | |
| Medion Erazer Major X20 | |
| Asus ROG Strix G18 G814JI | |
| Asus ROG Flow X16 GV601V | |
| Asus TUF Gaming A16 FA617XS | |
| Genomsnitt Intel Core i7-13650HX, NVIDIA GeForce RTX 4060 Laptop GPU (59266 - 59896, n=3) | |
| Dell G15 5530 | |
| Lenovo Legion Pro 5 16IRX8 | |
| MSI Katana 17 B13VFK | |
| Asus ROG Strix G17 G713PI | |
| AIDA64 / Memory Read | |
| Genomsnitt av klass Gaming (22956 - 118858, n=105, senaste 2 åren) | |
| Medion Erazer Major X20 | |
| Asus ROG Strix G18 G814JI | |
| Asus ROG Flow X16 GV601V | |
| Genomsnitt Intel Core i7-13650HX, NVIDIA GeForce RTX 4060 Laptop GPU (67305 - 68612, n=3) | |
| Dell G15 5530 | |
| Lenovo Legion Pro 5 16IRX8 | |
| MSI Katana 17 B13VFK | |
| Asus TUF Gaming A16 FA617XS | |
| Asus ROG Strix G17 G713PI | |
| AIDA64 / Memory Write | |
| Genomsnitt av klass Gaming (22297 - 135096, n=105, senaste 2 åren) | |
| Asus TUF Gaming A16 FA617XS | |
| Lenovo Legion Pro 5 16IRX8 | |
| Medion Erazer Major X20 | |
| Asus ROG Flow X16 GV601V | |
| Asus ROG Strix G18 G814JI | |
| Dell G15 5530 | |
| Genomsnitt Intel Core i7-13650HX, NVIDIA GeForce RTX 4060 Laptop GPU (58028 - 60298, n=3) | |
| Asus ROG Strix G17 G713PI | |
| MSI Katana 17 B13VFK | |
| AIDA64 / Memory Latency | |
| Genomsnitt av klass Gaming (75.3 - 259, n=105, senaste 2 åren) | |
| MSI Katana 17 B13VFK | |
| Asus ROG Flow X16 GV601V | |
| Dell G15 5530 | |
| Medion Erazer Major X20 | |
| Genomsnitt Intel Core i7-13650HX, NVIDIA GeForce RTX 4060 Laptop GPU (90.4 - 90.8, n=3) | |
| Asus TUF Gaming A16 FA617XS | |
| Asus ROG Strix G17 G713PI | |
| Asus ROG Strix G18 G814JI | |
| Lenovo Legion Pro 5 16IRX8 | |
* ... mindre är bättre
| PCMark 8 Home Score Accelerated v2 | 4748 poäng | |
| PCMark 8 Work Score Accelerated v2 | 6712 poäng | |
| PCMark 10 Score | 6984 poäng | |
Hjälp | ||
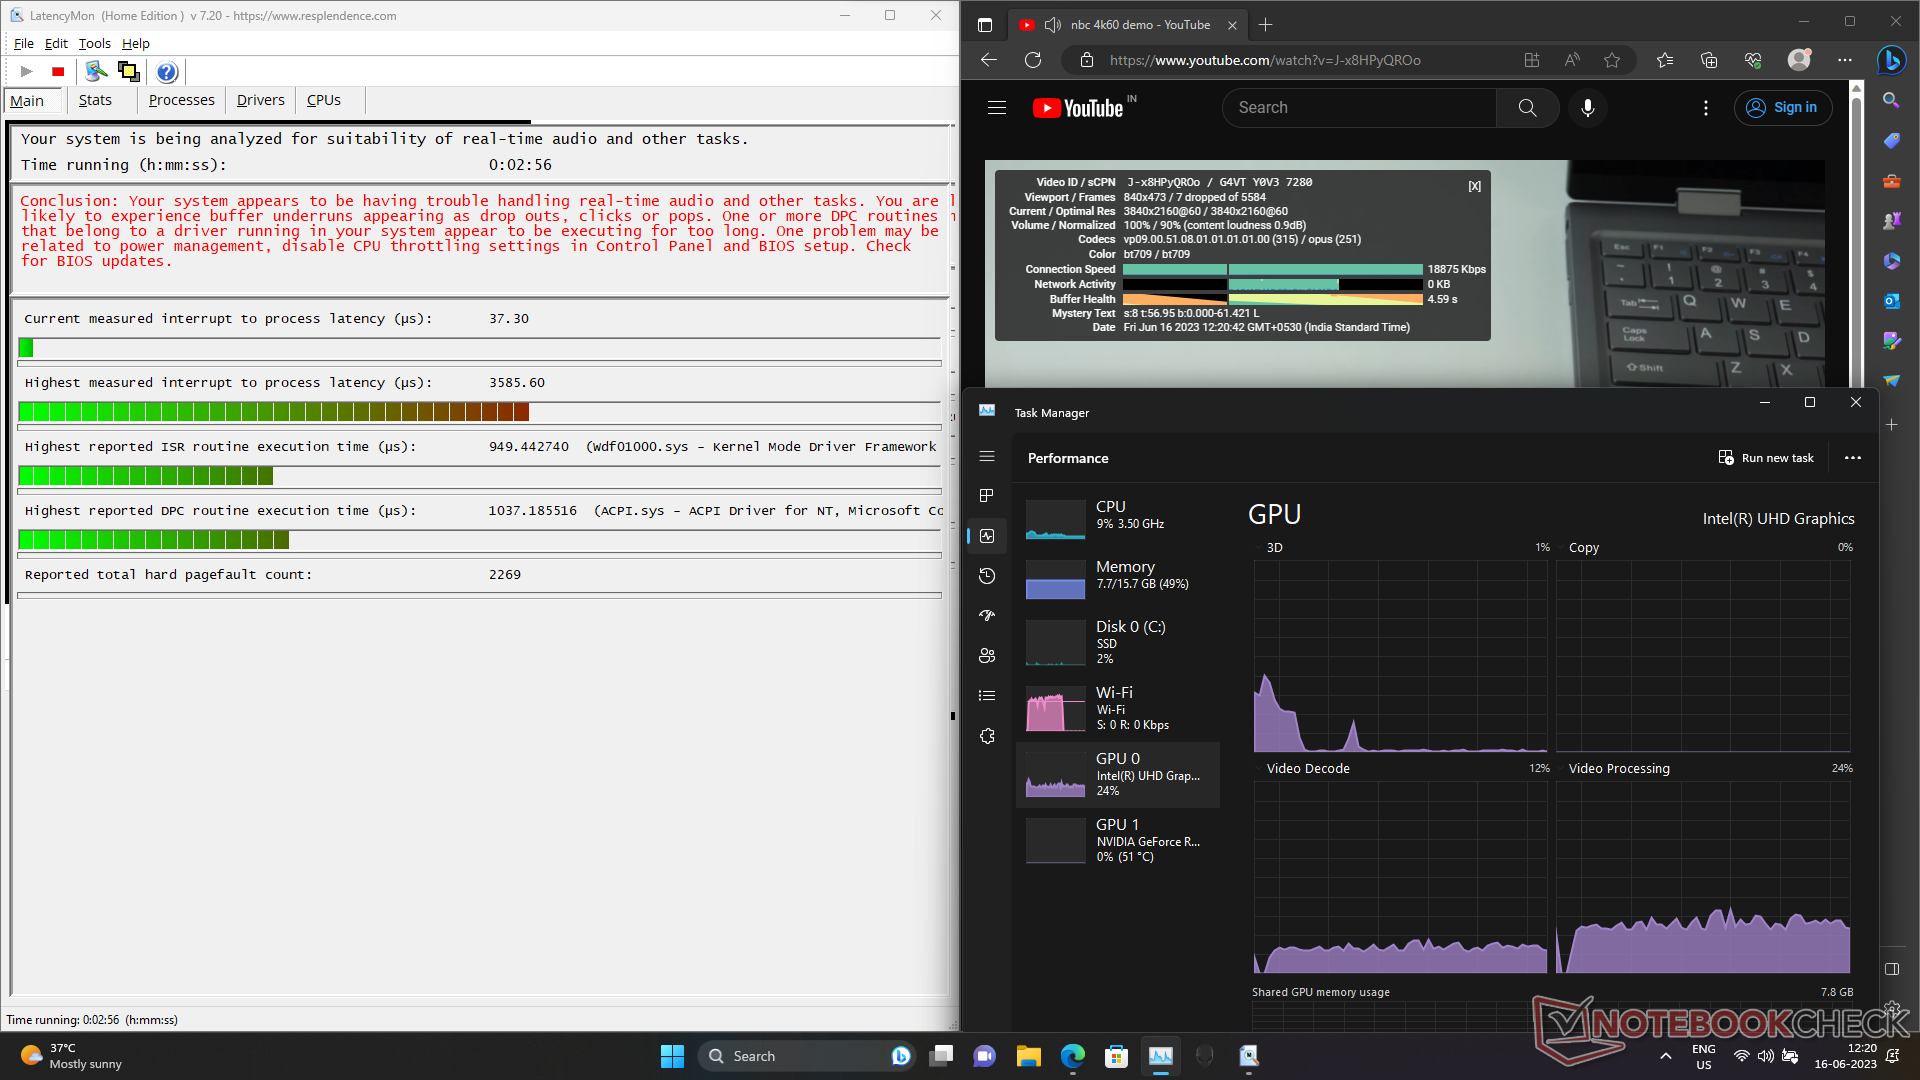
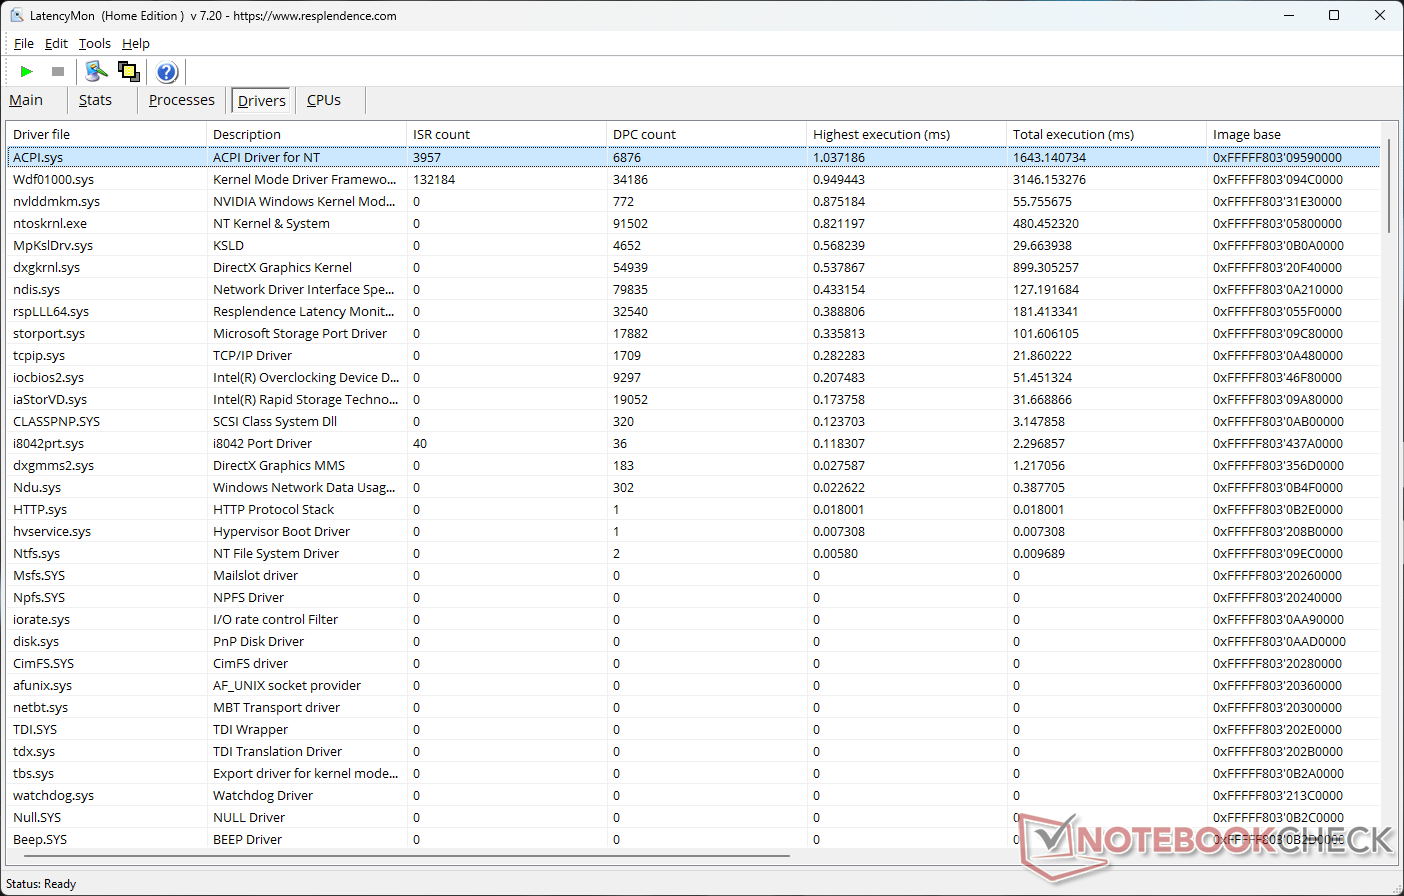
DPC-fördröjning
G15 5530 lider av en hög interrupt-till-process-latens på 3585,6 µs på grund av höga exekveringstider för ACPI.sys-drivrutinen.
| DPC Latencies / LatencyMon - interrupt to process latency (max), Web, Youtube, Prime95 | |
| Dell G15 5530 | |
| MSI Katana 17 B13VFK | |
| Medion Erazer Major X20 | |
| Asus ROG Strix G17 G713PI | |
| Asus ROG Flow X16 GV601V | |
| Asus TUF Gaming A16 FA617XS | |
| Asus ROG Strix G18 G814JI | |
| Lenovo Legion Pro 5 16IRX8 | |
* ... mindre är bättre
Lagringsenheter
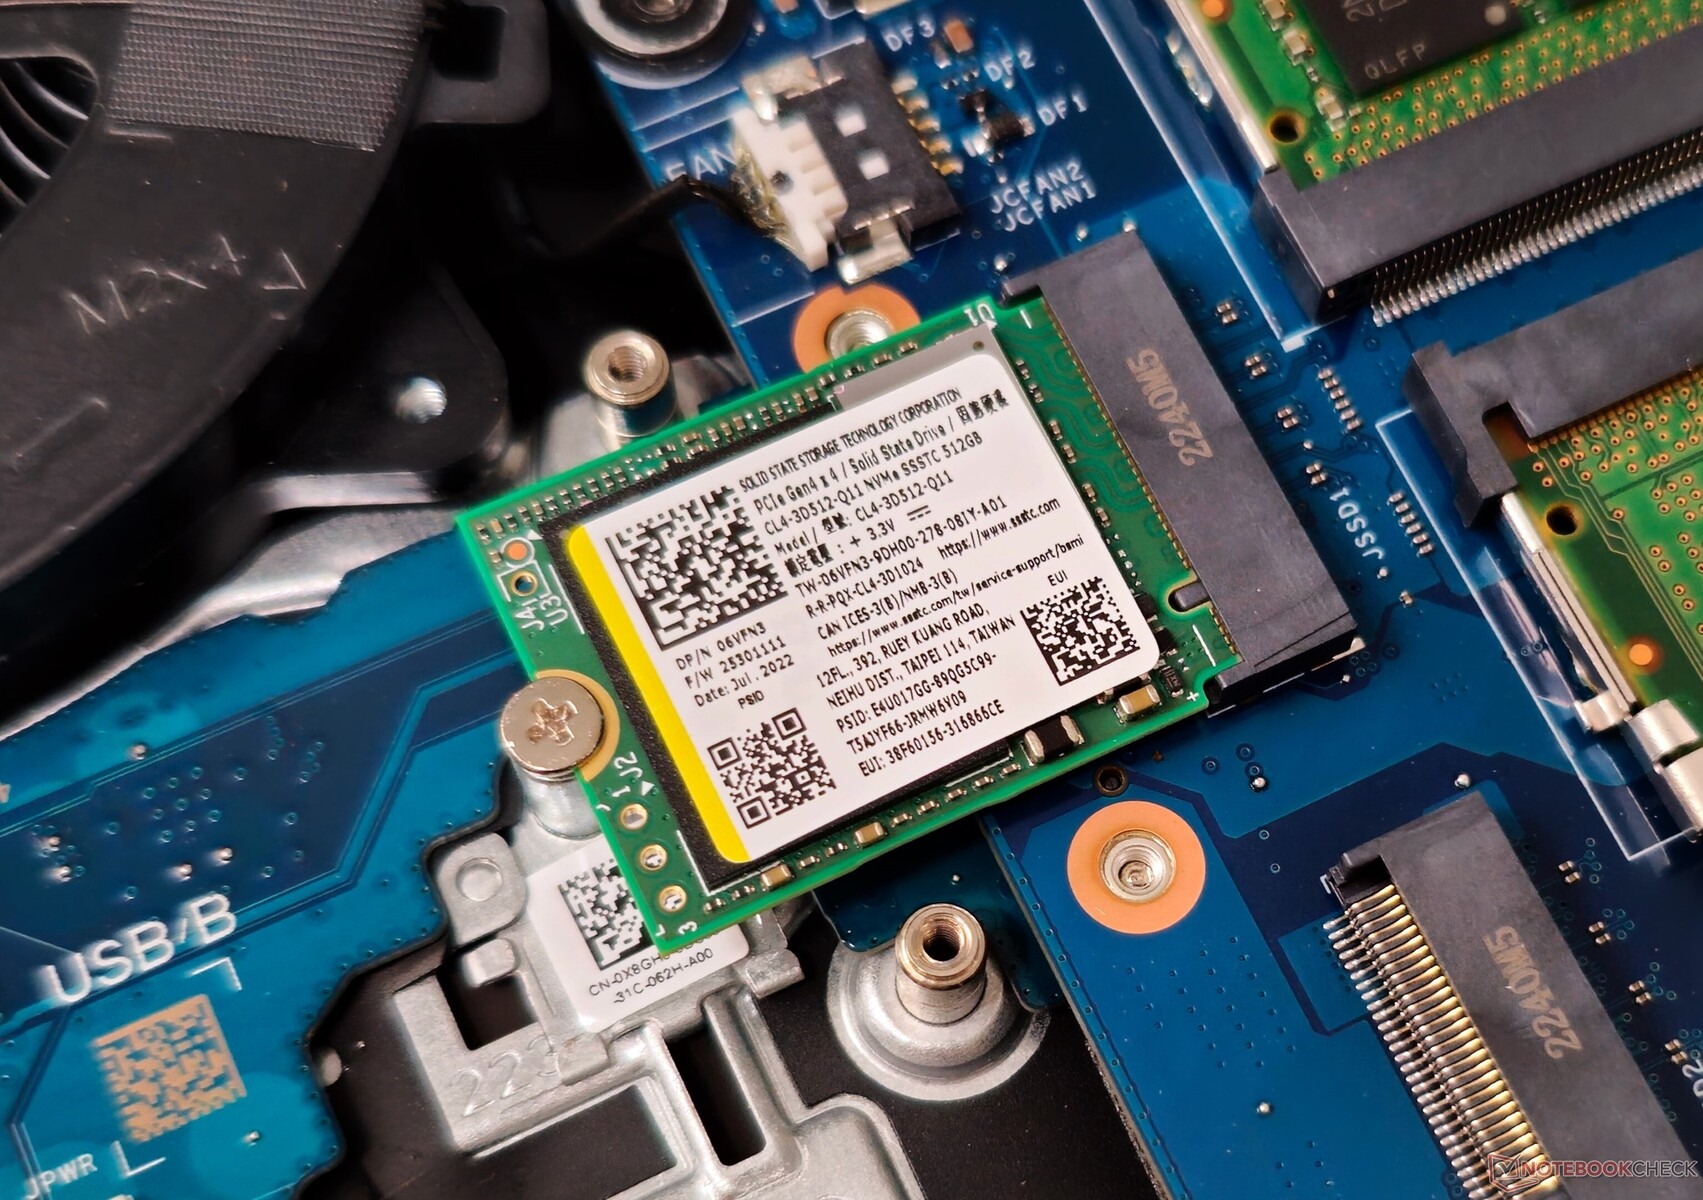
Dell erbjuder två M.2 2242-platser för lagringsenheter istället för den mer allmänt förekommande M.2 2280-varianten.
Användare bör uppgradera enheten om de avser att installera ett stort antal spel, eftersom fabriksbilden endast ger 398 GB gratis av 512 GB-kapaciteten.
Med sekventiella läsningar på mindre än 3 000 MB/s och sekventiella skrivningar runt 500 MB/s är SSTC CL4:s prestanda långt ifrån imponerande.
Det finns inget utrymme för lagringsexpansion via 2,5-tums SATA-enheter.

* ... mindre är bättre
SSD-enheten erbjuder ihållande läsningar vid ett ködjup på 8, men först efter att prestandan sjunkit drastiskt i den 10:e körningen.
Disk Throttling: DiskSpd Read Loop, Queue Depth 8
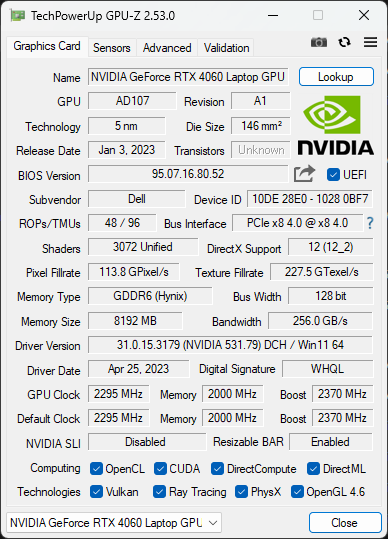
GPU-prestanda
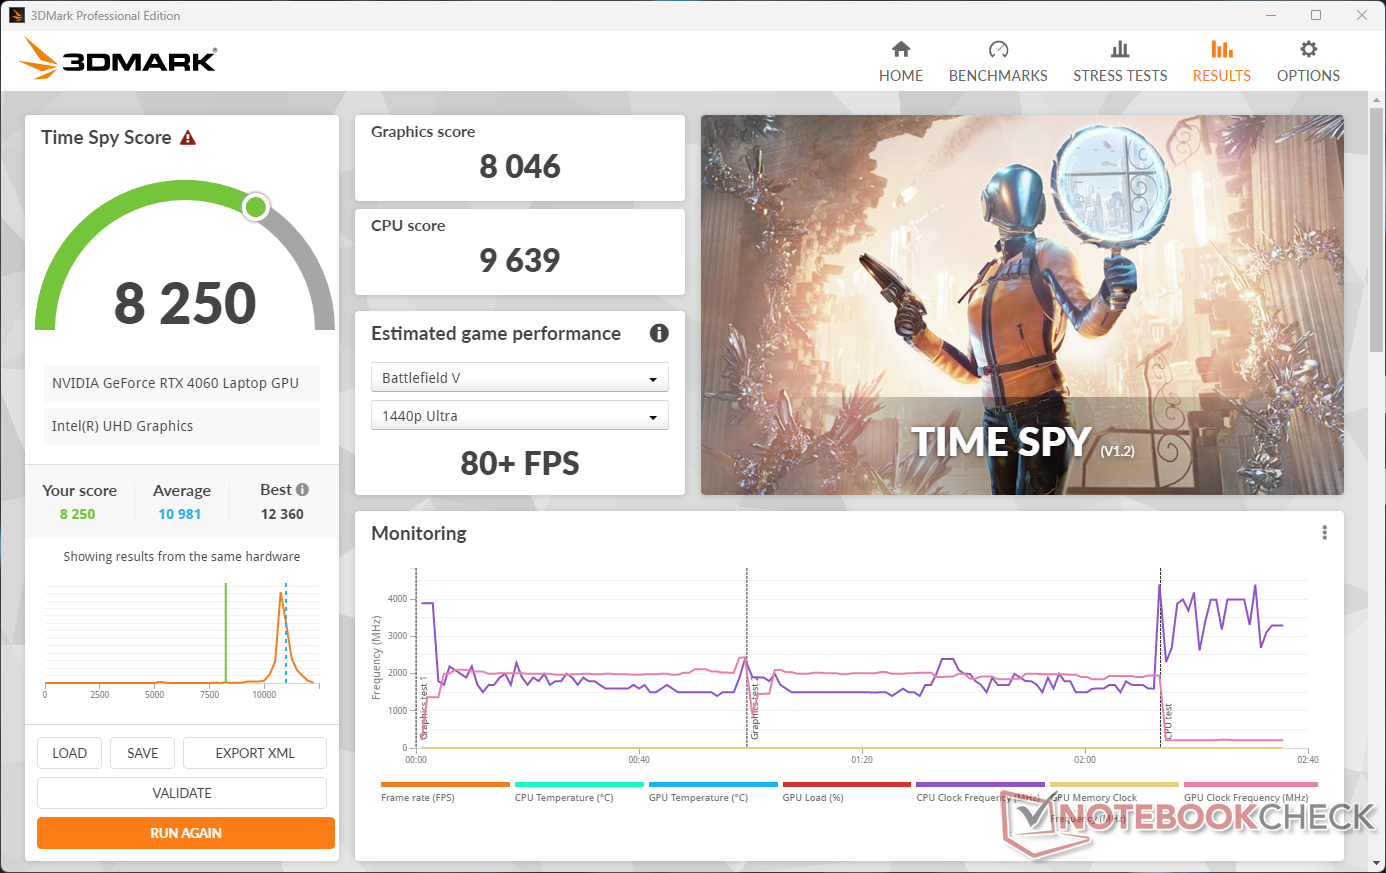
140 W Nvidia GeForce RTX 4060 Laptop GPU presterar på förväntade nivåer i kumulativa 3DMark-tester. Intressant nog har MSI Katana 17 med en 105 W RTX 4060 en liten prestandafördel jämfört med andra RTX 4060-drivna bärbara datorer i jämförelsen.
Å andra sidan kompenserar G15 5530 för denna prestandaskillnad i Blender-tester.
3DMark Time Spy poäng Grafikpoäng sjunker med 24% vid batteridrift.
| 3DMark 11 Performance | 32321 poäng | |
| 3DMark Ice Storm Standard Score | 242288 poäng | |
| 3DMark Cloud Gate Standard Score | 66116 poäng | |
| 3DMark Fire Strike Score | 24323 poäng | |
| 3DMark Fire Strike Extreme Score | 12237 poäng | |
| 3DMark Time Spy Score | 11007 poäng | |
Hjälp | ||
| Blender / v3.3 Classroom OPTIX/RTX | |
| MSI Katana 17 B13VFK | |
| Asus ROG Strix G18 G814JI | |
| Genomsnitt NVIDIA GeForce RTX 4060 Laptop GPU (19 - 28, n=53) | |
| Asus ROG Flow X16 GV601V | |
| Lenovo Legion Pro 5 16IRX8 | |
| Dell G15 5530 | |
| Asus ROG Strix G17 G713PI | |
| Medion Erazer Major X20 | |
| Genomsnitt av klass Gaming (9 - 32, n=106, senaste 2 åren) | |
| Blender / v3.3 Classroom CUDA | |
| MSI Katana 17 B13VFK | |
| Genomsnitt NVIDIA GeForce RTX 4060 Laptop GPU (39 - 53, n=53) | |
| Asus ROG Flow X16 GV601V | |
| Dell G15 5530 | |
| Lenovo Legion Pro 5 16IRX8 | |
| Asus ROG Strix G18 G814JI | |
| Asus ROG Strix G17 G713PI | |
| Medion Erazer Major X20 | |
| Genomsnitt av klass Gaming (15 - 228, n=106, senaste 2 åren) | |
| Blender / v3.3 Classroom CPU | |
| MSI Katana 17 B13VFK | |
| Asus ROG Flow X16 GV601V | |
| Genomsnitt NVIDIA GeForce RTX 4060 Laptop GPU (189 - 452, n=53) | |
| Asus TUF Gaming A16 FA617XS | |
| Dell G15 5530 | |
| Asus ROG Strix G18 G814JI | |
| Lenovo Legion Pro 5 16IRX8 | |
| Genomsnitt av klass Gaming (122 - 565, n=102, senaste 2 åren) | |
| Medion Erazer Major X20 | |
| Asus ROG Strix G17 G713PI | |
* ... mindre är bättre
Spelprestanda
RTX 4060 Laptop GPU kan uppnå tresiffriga bildhastigheter per sekund (fps) i relativt äldre spel med 1080p Ultra-inställningar. Även i nyare spel kan den konsekvent leverera bildfrekvenser långt över 60 fps vid 1080p Ultra.
För användare som är intresserade av att spela i högre upplösningar med en extern bildskärm kan aktivering av Nvidia DLSS (Deep Learning Super Sampling) eller AMD FSR (FidelityFX Super Resolution) i titlar som stöds ge bra fps-ökningar.
| The Witcher 3 - 1920x1080 Ultra Graphics & Postprocessing (HBAO+) | |
| Genomsnitt av klass Gaming (104.7 - 240, n=7, senaste 2 åren) | |
| Medion Erazer Major X20 | |
| Asus ROG Strix G17 G713PI | |
| Asus ROG Strix G18 G814JI | |
| Lenovo Legion Pro 5 16IRX8 | |
| Asus ROG Flow X16 GV601V | |
| MSI Katana 17 B13VFK | |
| Dell G15 5530 | |
| Asus TUF Gaming A16 FA617XS | |
| Cyberpunk 2077 1.6 | |
| 1920x1080 High Preset | |
| Lenovo Legion Pro 5 16IRX8 | |
| Dell G15 5530 | |
| Asus ROG Strix G17 G713PI | |
| Asus ROG Flow X16 GV601V | |
| Genomsnitt NVIDIA GeForce RTX 4060 Laptop GPU (63.5 - 114.9, n=16) | |
| 1920x1080 Ultra Preset | |
| Lenovo Legion Pro 5 16IRX8 | |
| Asus ROG Strix G17 G713PI | |
| Dell G15 5530 | |
| Asus ROG Flow X16 GV601V | |
| Genomsnitt NVIDIA GeForce RTX 4060 Laptop GPU (57.9 - 93.2, n=18) | |
| MSI Katana 17 B13VFK | |
| 1920x1080 Ray Tracing Ultra Preset (DLSS off) | |
| Genomsnitt NVIDIA GeForce RTX 4060 Laptop GPU (25.6 - 60, n=6) | |
| Dell G15 5530 | |
| Asus ROG Flow X16 GV601V | |
| MSI Katana 17 B13VFK | |
Witcher 3 FPS-diagram
Kylsystemet i G15 5530 verkar vara ganska effektivt, vilket framgår av de relativt stabila bildfrekvenser som visas nedan i Stresstestet Witcher 3 stresstestet.
| låg | med. | hög | ultra | |
|---|---|---|---|---|
| GTA V (2015) | 182.6 | 175.3 | 172.8 | 111.8 |
| The Witcher 3 (2015) | 407 | 335 | 205 | 104.6 |
| Dota 2 Reborn (2015) | 179.9 | 163.8 | 154.9 | 144.8 |
| Final Fantasy XV Benchmark (2018) | 212 | 137.3 | 100.1 | |
| X-Plane 11.11 (2018) | 160.1 | 146.8 | 115.6 | |
| Far Cry 5 (2018) | 168 | 152 | 146 | 139 |
| Strange Brigade (2018) | 467 | 281 | 222 | 189.6 |
| Cyberpunk 2077 1.6 (2022) | 123.2 | 99.4 | 86.1 | 80 |
| F1 22 (2022) | 244 | 235 | 177.7 | 66.1 |
Kolla in vår dedikerade Nvidia GeForce RTX 4060 GPU för bärbar dator sida för fler prestandajämförelser.
Utsläpp: Blir varm när den stressas
Buller från systemet
Under belastning kan G15 generera ljudnivåer strax under 50 dB(A)-gränsen. Intressant nog ger läget Tyst en högre ljudtrycksnivå (SPL) jämfört med lägena Balanserad och Prestanda, även med en lätt 3DMark 06-belastning. Med detta sagt förblir det maximala fläktljudet under 40 dB(A) i denna profil.
Inga större prestandaförluster observerades mellan de olika profilerna när de testades med The Witcher 3 vid 1080p Ultra.
Ljudnivå
| Låg belastning |
| 26.85 / 26.85 / 26.85 dB(A) |
| Hög belastning |
| 27.65 / 47.86 dB(A) |
 | ||
30 dB tyst 40 dB(A) hörbar 50 dB(A) högt ljud |
||
min: | ||
Som tidigare nämnts kan det tysta läget ha vissa begränsningar i CPU-prestanda, men det bör fortfarande möjliggöra tillfredsställande bildfrekvenser samtidigt som fläktljudet hålls på en acceptabel nivå.
| Prestandaläge | Tomgång dB(A) | Genomsnittlig belastning dB(A) | Maximal belastning dB(A) | Witcher 3 1080p Ultra dB(A) |
|---|---|---|---|---|
| Batteri | 20,90 | 32,60 | 33,21 | 44,36 / 104 fps |
| Tyst | 20,74 | 32,95 | 37,68 | 37,63 / 99 fps |
| Balanserad | 20,80 | 26,40 | 45,97 | 45,92 / 104 fps |
| Prestanda | 26,85 | 27,65 | 47,86 | 47,86 / 105 fps |
| Dell G15 5530 Intel Core i7-13650HX, GeForce RTX 4060 Laptop GPU | Asus ROG Strix G18 G814JI Intel Core i7-13650HX, GeForce RTX 4070 Laptop GPU | Lenovo Legion Pro 5 16IRX8 Intel Core i7-13700HX, GeForce RTX 4060 Laptop GPU | Asus ROG Flow X16 GV601V Intel Core i9-13900H, GeForce RTX 4060 Laptop GPU | MSI Katana 17 B13VFK Intel Core i7-13620H, GeForce RTX 4060 Laptop GPU | Asus TUF Gaming A16 FA617XS AMD Ryzen 9 7940HS, Radeon RX 7600S | Asus ROG Strix G17 G713PI AMD Ryzen 9 7945HX, GeForce RTX 4070 Laptop GPU | Medion Erazer Major X20 Intel Core i9-13900HX, GeForce RTX 4070 Laptop GPU | |
|---|---|---|---|---|---|---|---|---|
| Noise | -10% | -3% | -4% | -24% | -13% | -14% | -21% | |
| av / miljö * (dB) | 20.41 | 25 -22% | 23 -13% | 24 -18% | 24.5 -20% | 25 -22% | 25 -22% | 24 -18% |
| Idle Minimum * (dB) | 26.85 | 26 3% | 23.1 14% | 24 11% | 24.5 9% | 25 7% | 26 3% | 25 7% |
| Idle Average * (dB) | 26.85 | 28 -4% | 23.1 14% | 24 11% | 24.5 9% | 26 3% | 29 -8% | 29 -8% |
| Idle Maximum * (dB) | 26.85 | 29 -8% | 26.6 1% | 24 11% | 40 -49% | 28 -4% | 30 -12% | 31 -15% |
| Load Average * (dB) | 27.65 | 41 -48% | 34.7 -25% | 36.71 -33% | 48.3 -75% | 43 -56% | 46 -66% | 50 -81% |
| Witcher 3 ultra * (dB) | 47.9 | 44 8% | 47.6 1% | 50.92 -6% | 56 -17% | 51 -6% | 46 4% | 53 -11% |
| Load Maximum * (dB) | 47.86 | 46 4% | 54.8 -15% | 50.92 -6% | 59.1 -23% | 53 -11% | 47 2% | 57 -19% |
* ... mindre är bättre
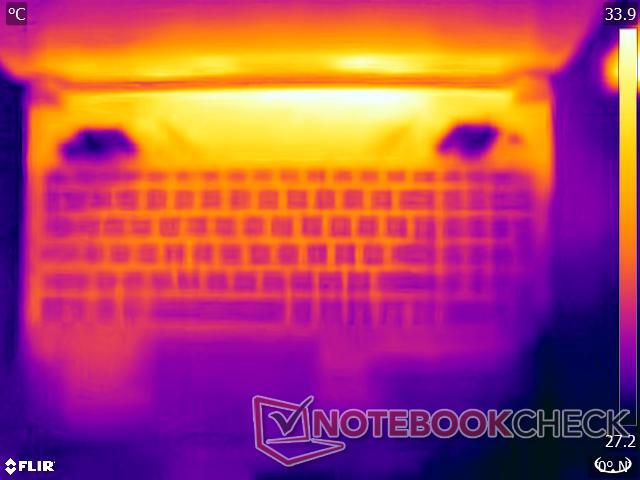
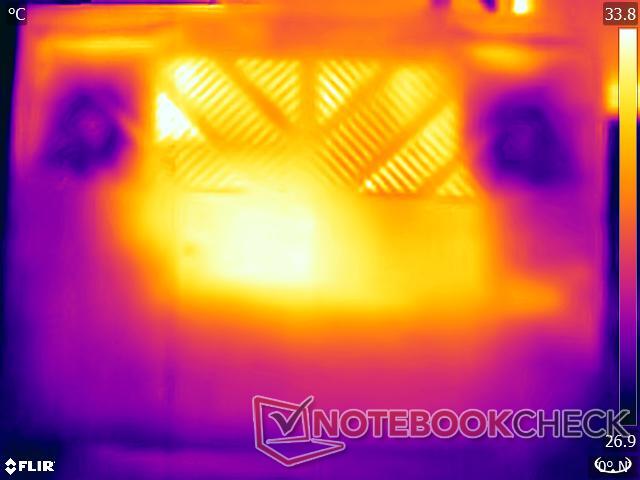
Temperatur
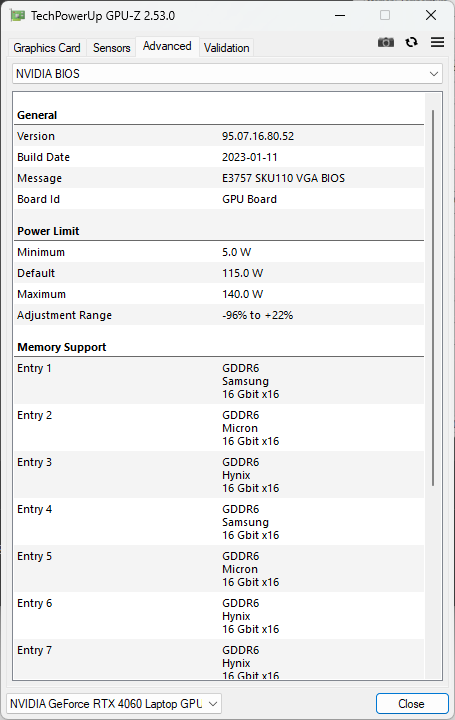
Enligt Dell använder G15 5530 SKU:er utrustade med en RTX 4050 och högre ett kylsystem med ångkammare, tillsammans med Element 31 termiskt gränssnittsmaterial, liknande deras Alienware-kusiner.
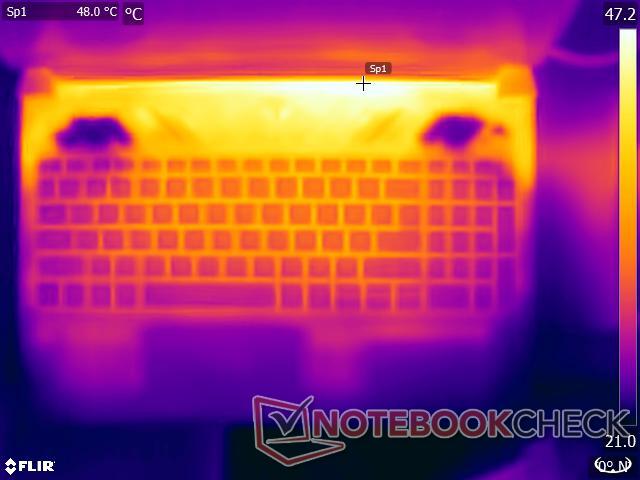
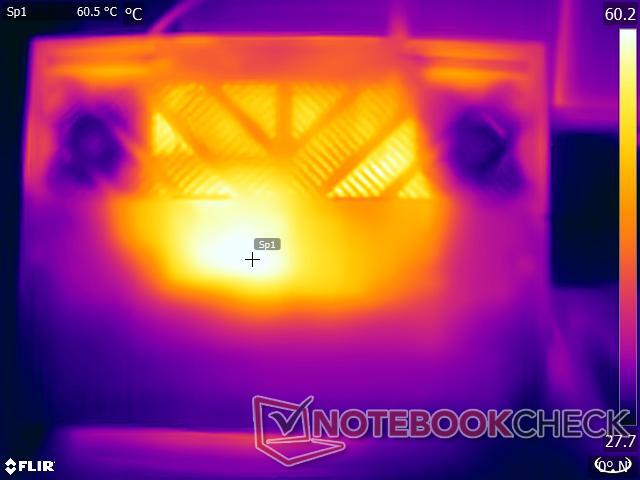
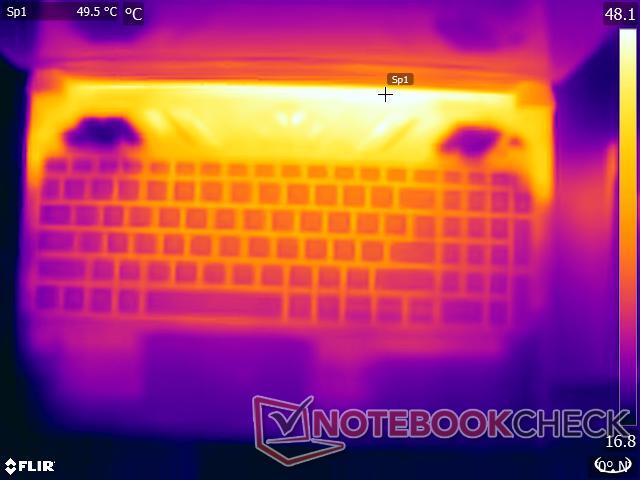
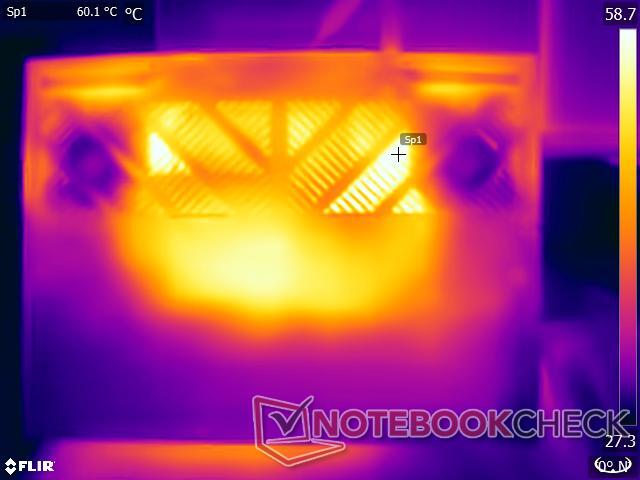
Trots närvaron av en ångkammare observerar vi höga yttemperaturer under belastning. Handflatestöden och pekplattorna förblir dock relativt svala.
(-) Den maximala temperaturen på ovansidan är 54 °C / 129 F, jämfört med genomsnittet av 40.4 °C / 105 F , allt från 21.2 till 68.8 °C för klassen Gaming.
(-) Botten värms upp till maximalt 62.2 °C / 144 F, jämfört med genomsnittet av 43.2 °C / 110 F
(+) Vid tomgångsbruk är medeltemperaturen för ovansidan 31 °C / 88 F, jämfört med enhetsgenomsnittet på 33.9 °C / ### class_avg_f### F.
(-) När du spelar The Witcher 3 är medeltemperaturen för ovansidan 41.9 °C / 107 F, jämfört med enhetsgenomsnittet på 33.9 °C / ## #class_avg_f### F.
(+) Handledsstöden och pekplattan når maximal hudtemperatur (34.4 °C / 93.9 F) och är därför inte varma.
(-) Medeltemperaturen för handledsstödsområdet på liknande enheter var 28.8 °C / 83.8 F (-5.6 °C / -10.1 F).
| Dell G15 5530 Intel Core i7-13650HX, NVIDIA GeForce RTX 4060 Laptop GPU | Asus ROG Strix G18 G814JI Intel Core i7-13650HX, NVIDIA GeForce RTX 4070 Laptop GPU | Lenovo Legion Pro 5 16IRX8 Intel Core i7-13700HX, NVIDIA GeForce RTX 4060 Laptop GPU | Asus ROG Flow X16 GV601V Intel Core i9-13900H, NVIDIA GeForce RTX 4060 Laptop GPU | MSI Katana 17 B13VFK Intel Core i7-13620H, NVIDIA GeForce RTX 4060 Laptop GPU | Asus TUF Gaming A16 FA617XS AMD Ryzen 9 7940HS, AMD Radeon RX 7600S | Asus ROG Strix G17 G713PI AMD Ryzen 9 7945HX, NVIDIA GeForce RTX 4070 Laptop GPU | Medion Erazer Major X20 Intel Core i9-13900HX, NVIDIA GeForce RTX 4070 Laptop GPU | |
|---|---|---|---|---|---|---|---|---|
| Heat | 16% | 13% | 11% | 13% | 11% | 14% | 3% | |
| Maximum Upper Side * (°C) | 54 | 45 17% | 42.8 21% | 46 15% | 41.6 23% | 53 2% | 42 22% | 46 15% |
| Maximum Bottom * (°C) | 62.2 | 47 24% | 50 20% | 41 34% | 43.1 31% | 48 23% | 41 34% | 49 21% |
| Idle Upper Side * (°C) | 33.4 | 28 16% | 29.6 11% | 36 -8% | 32 4% | 30 10% | 33 1% | 37 -11% |
| Idle Bottom * (°C) | 33.4 | 31 7% | 34 -2% | 33 1% | 35.8 -7% | 30 10% | 34 -2% | 38 -14% |
* ... mindre är bättre
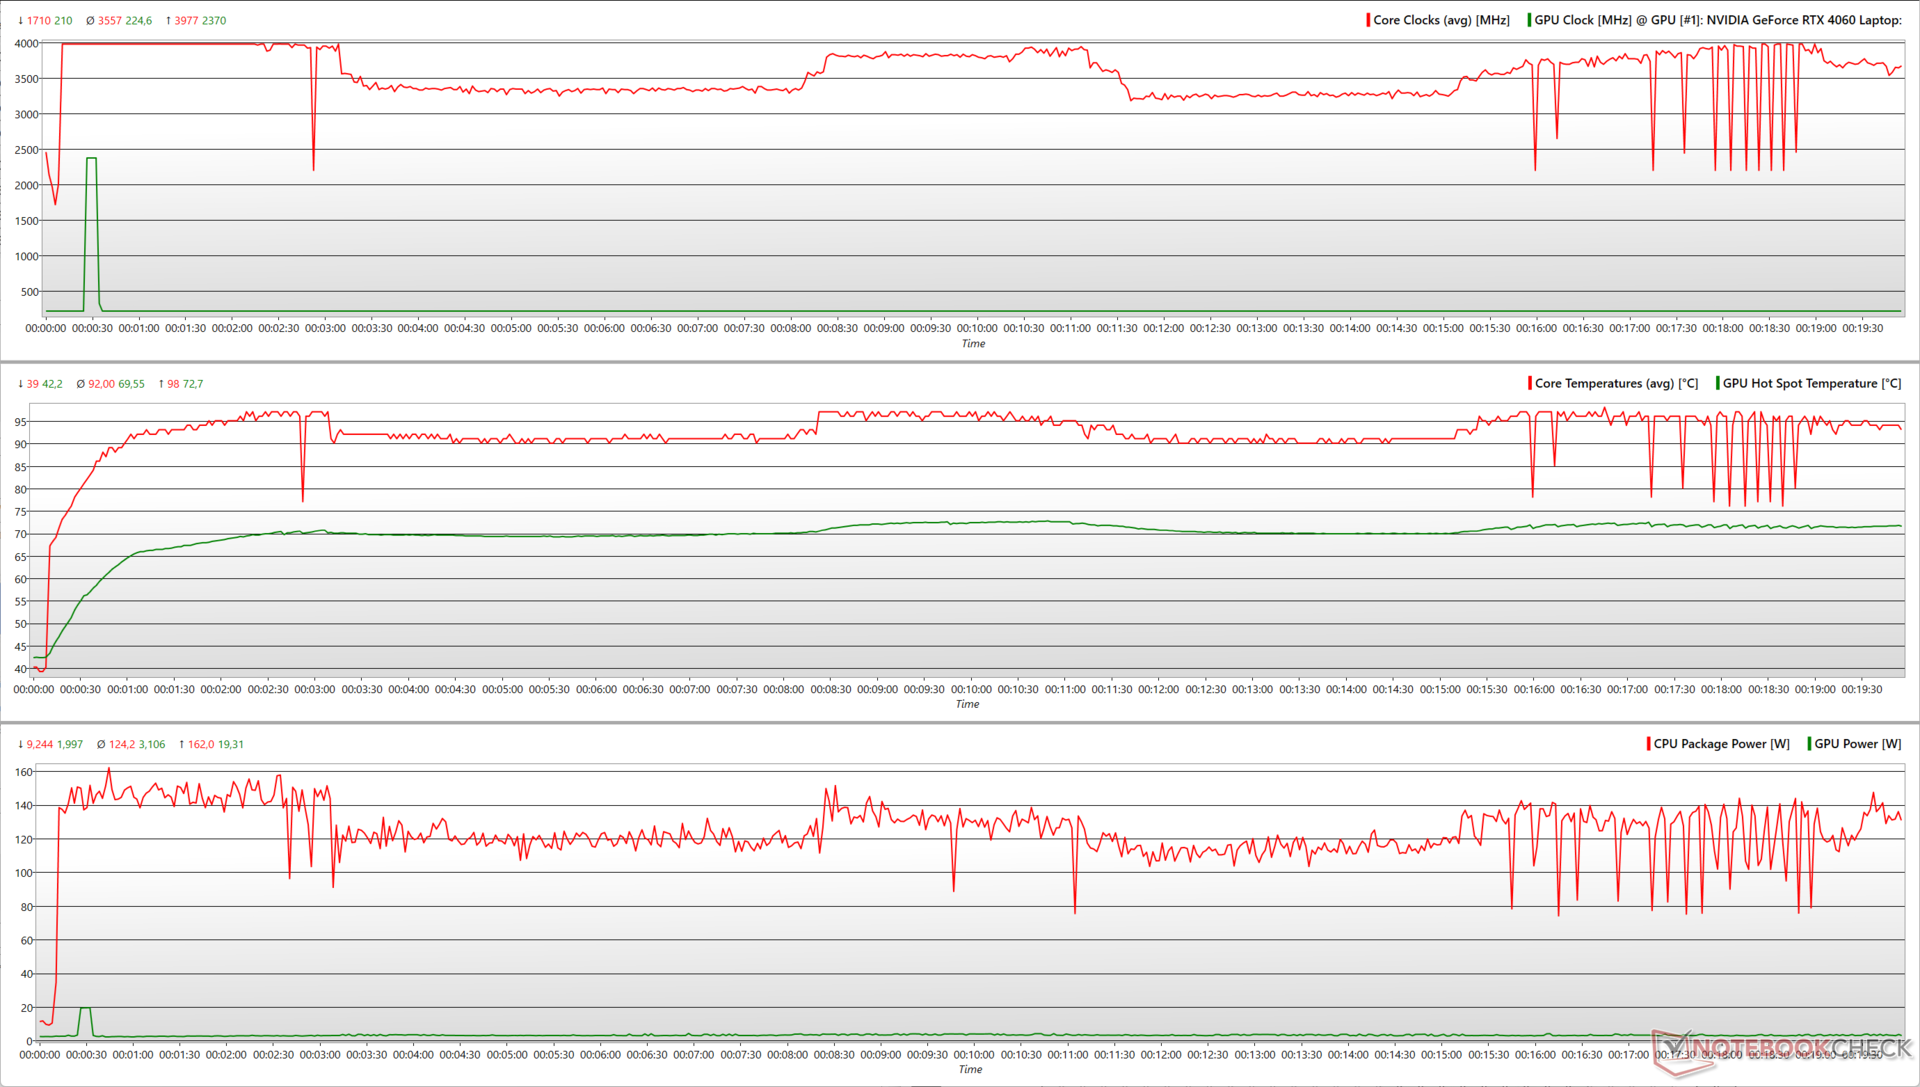
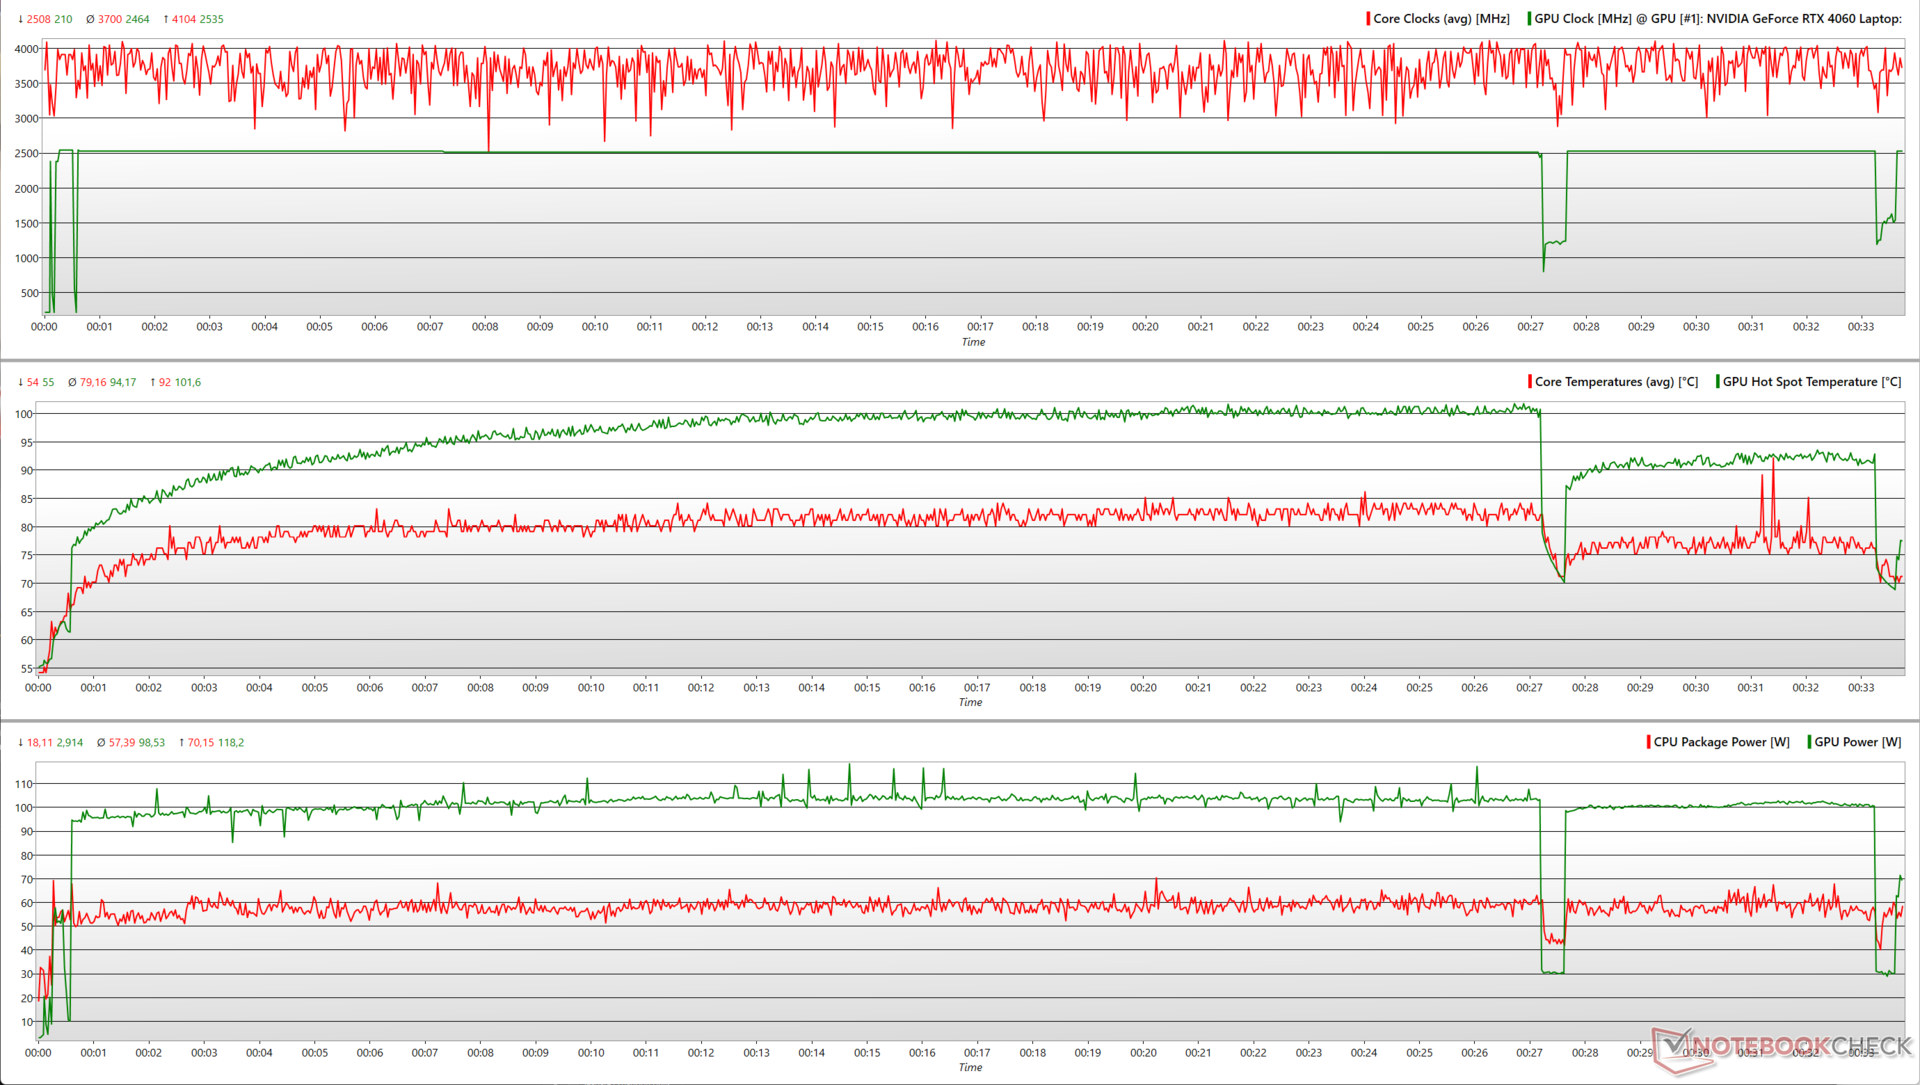
Stresstest
Under ett stresstest med Prime95:s stora FFT-filer på plats når Core i7-13650HX en maximal effekt på 162 W och uppnår en maximal boostfrekvens på nästan 4 GHz. Denna höga strömförbrukning och frekvens kan dock inte upprätthållas, och processorn ligger på en genomsnittlig paketström på 124 W under hela stresstestet.
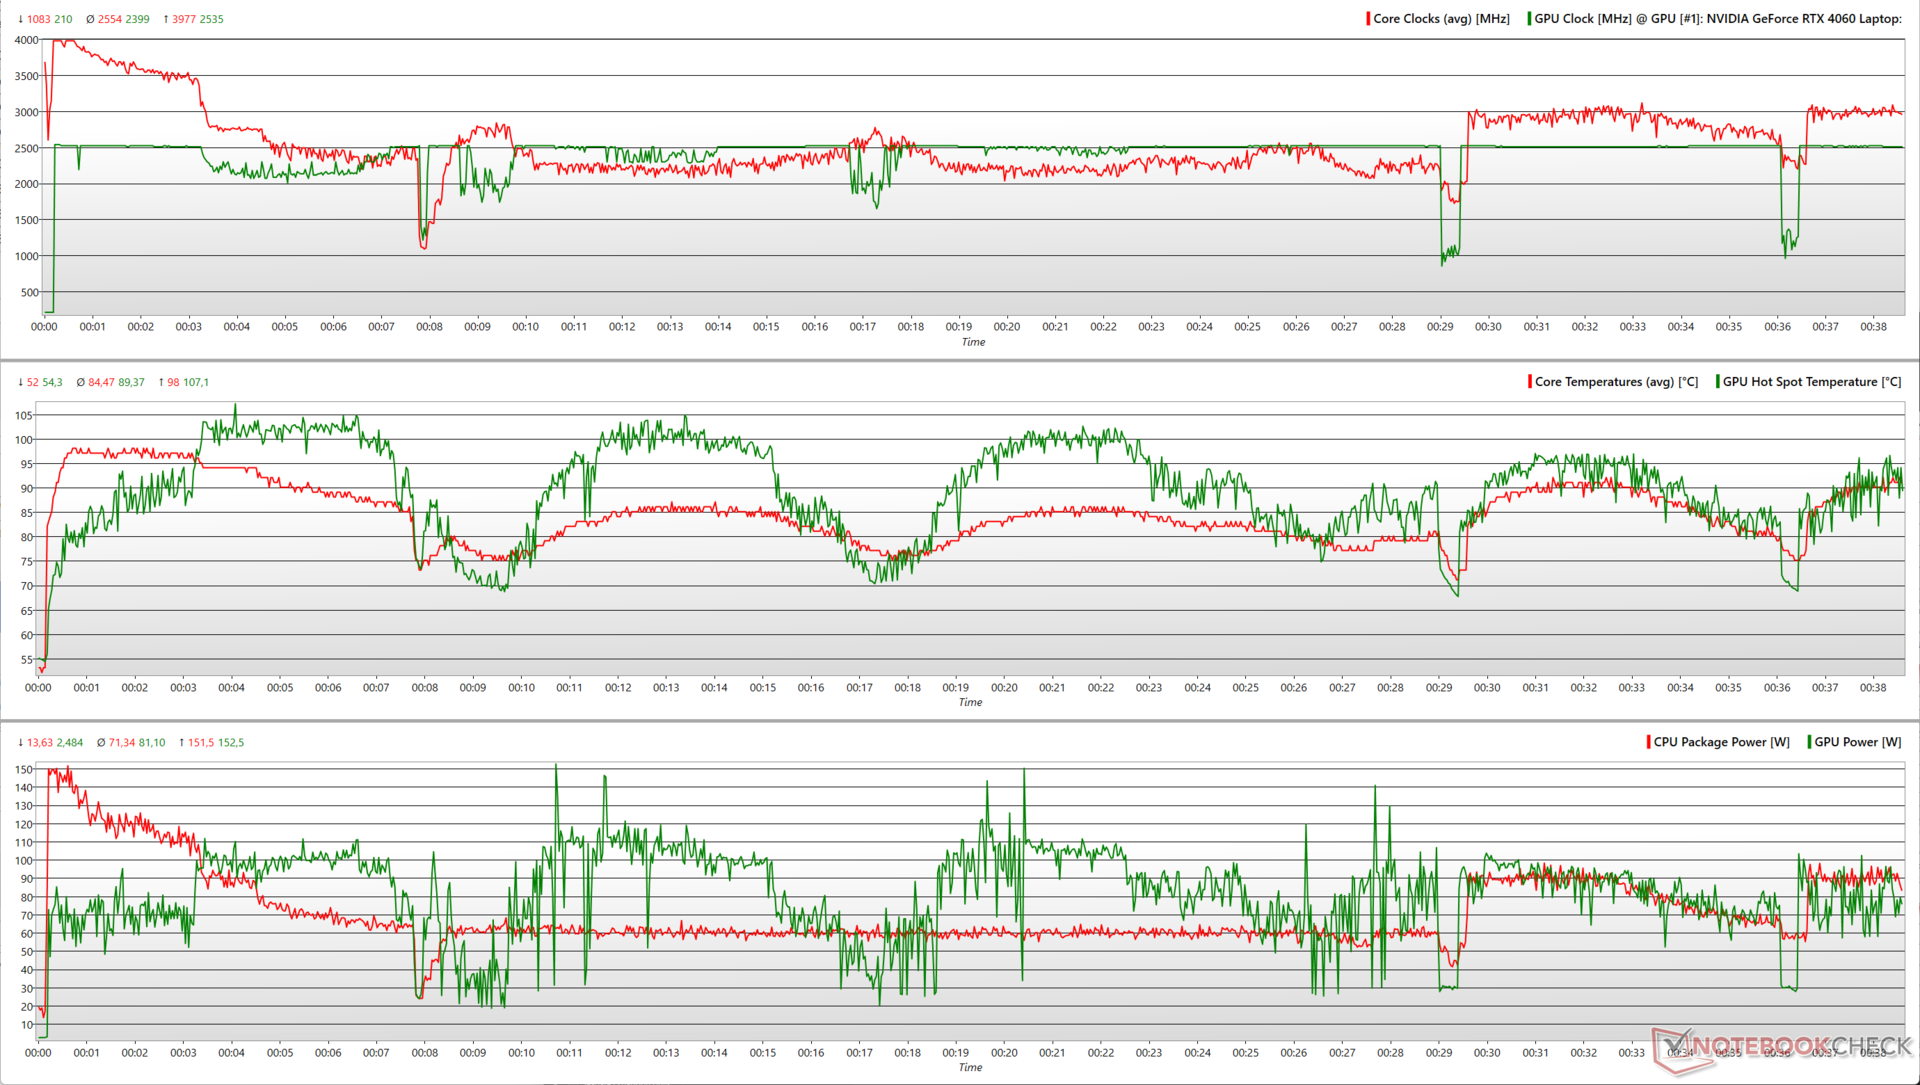
När FurMark introduceras når RTX 4060 GPU en maximal effektförbrukning på 152,5 W med en klockhastighet på 2 535 MHz. Så småningom stabiliserar sig både CPU och GPU på en genomsnittlig strömförbrukning på 71 W (klockad vid 2,5 GHz) respektive 81 W (klockad vid 2 399 MHz).
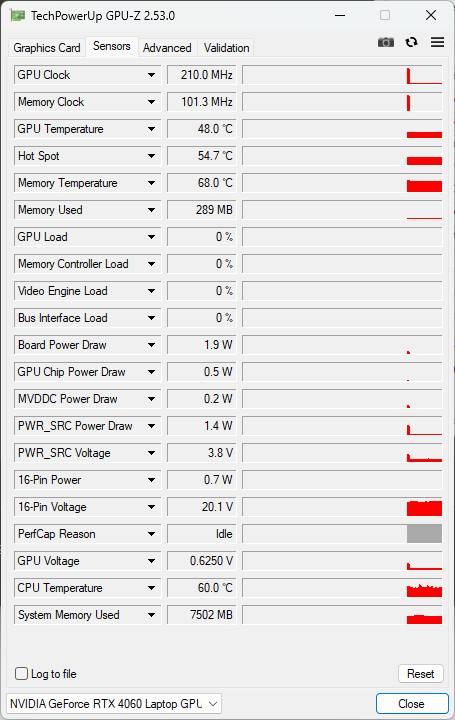
| Stresstest | CPU-klocka (GHz) | GPU-klocka (MHz) | Genomsnittlig CPU-temperatur (°C) | Genomsnittlig GPU-temperatur (°C) |
| System i viloläge | 1,6 | 210 | 39 | 36,3 |
| Prime95 | 3,7 | 210 | 92 | 61,3 |
| Prime95 + FurMark | 3,05 | 2 505 | 84,5 | 89,3 |
| The Witcher 3 1080p Ultra | 4 | 1 485 | 79 | 94 |
CPU och GPU uppvisar en mer förutsägbar respons under stresstestning med The Witcher 3 i 1080p Ultra. De når toppklockfrekvenser på 4,1 GHz respektive 2 535 MHz, med en maximal CPU-förbrukning på 70 W och en maximal GPU-förbrukning på 118 W. Det sker en kort nedgång i CPU- och GPU-mätvärdena runt 30-minutersmarkeringen av testet, men de återgår snabbt till sina ursprungliga klockfrekvenser.
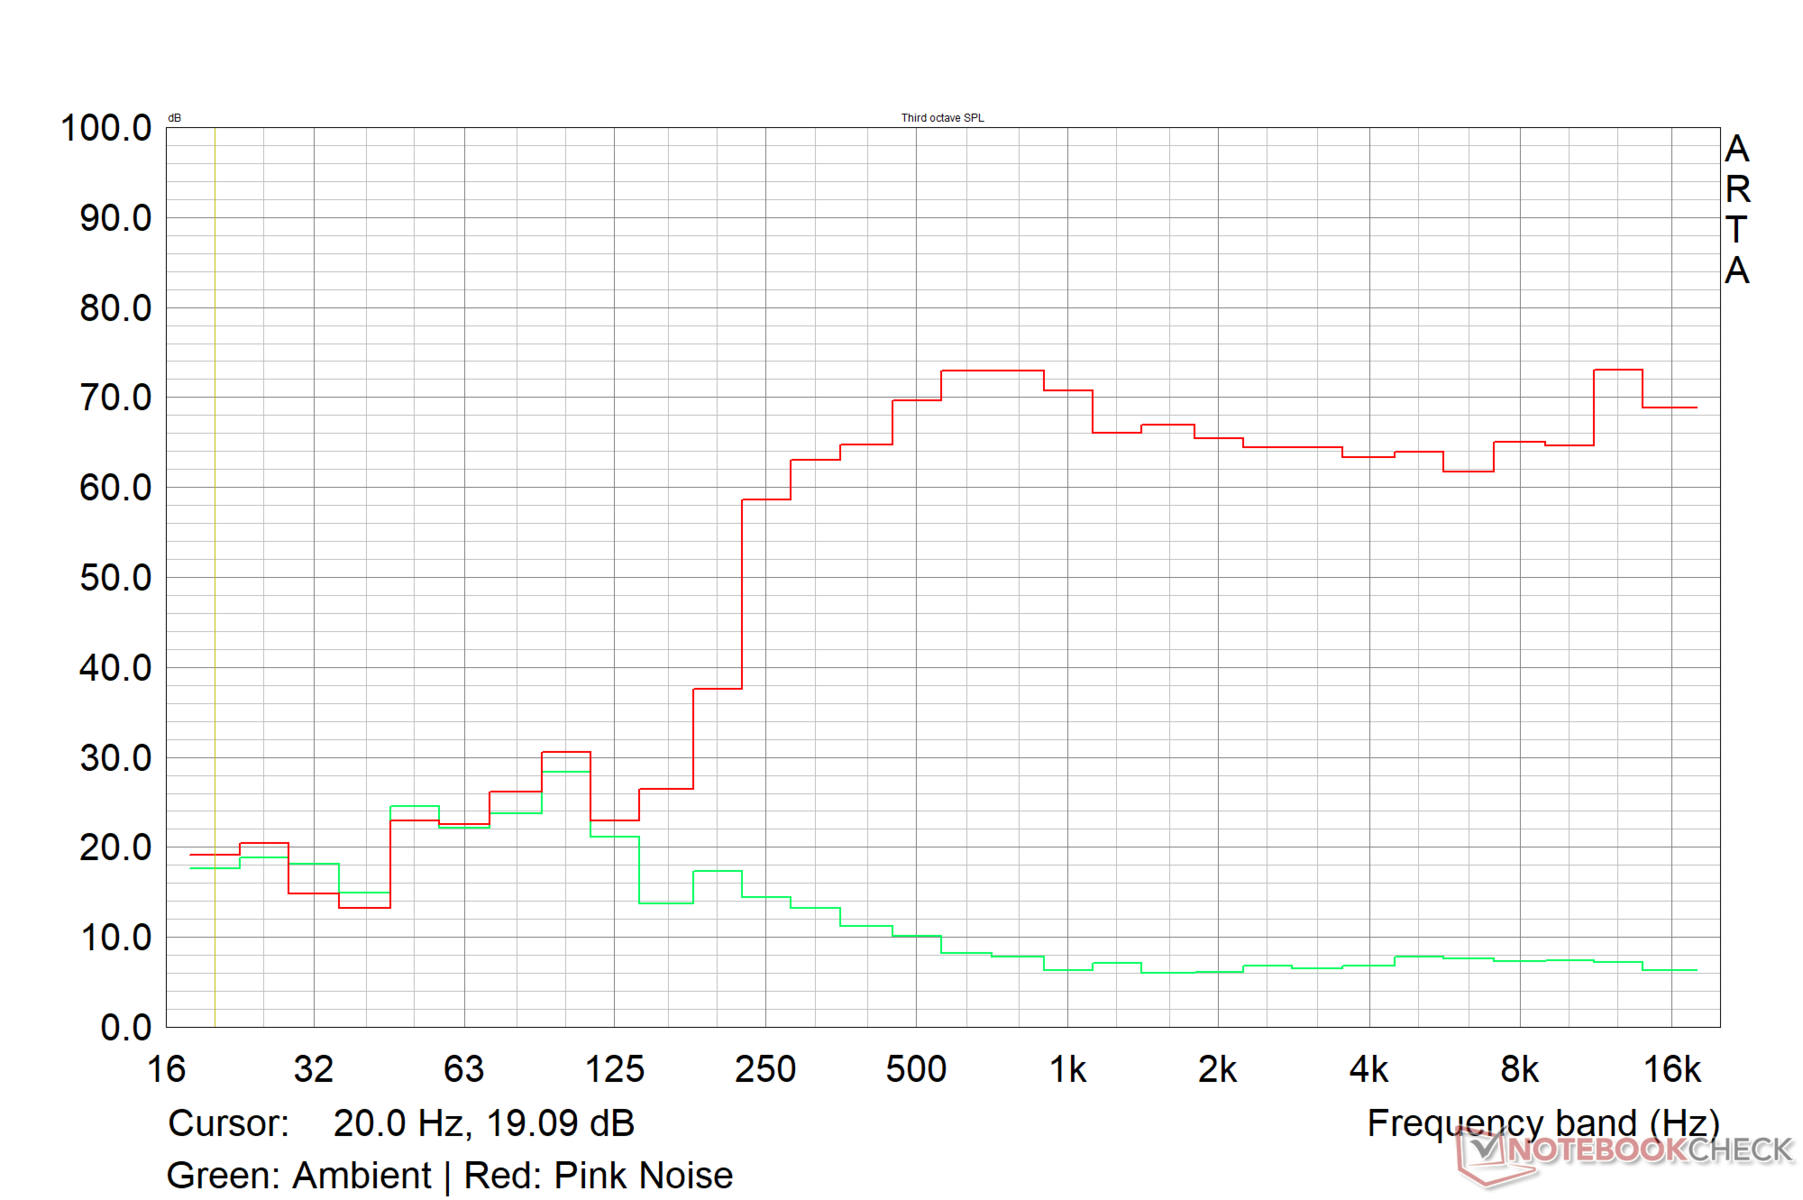
Högtalare
Högtalarna i G15 är ganska högljudda med 79,6 dB(A). Det verkar dock som att Dell kunde ha utnyttjat det stora chassit mer effektivt för att ge en starkare basåtergivning. Det positiva är att mellan- och högregister återges väl.
Ljudkvaliteten är acceptabel, men användare kan få en bättre ljudupplevelse genom att ansluta externa ljudenheter via 3,5 mm ljuduttaget eller via Bluetooth.
Dell G15 5530 ljudanalys
(±) | högtalarljudstyrkan är genomsnittlig men bra (79.6 dB)
Bas 100 - 315 Hz
(-) | nästan ingen bas - i genomsnitt 24.7% lägre än medianen
(-) | basen är inte linjär (15.2% delta till föregående frekvens)
Mellan 400 - 2000 Hz
(+) | balanserad mellan - endast 4.1% från medianen
(+) | mids är linjära (4.2% delta till föregående frekvens)
Högsta 2 - 16 kHz
(+) | balanserade toppar - endast 0.8% från medianen
(+) | toppar är linjära (2.2% delta till föregående frekvens)
Totalt 100 - 16 000 Hz
(±) | linjäriteten för det totala ljudet är genomsnittlig (16.3% skillnad mot median)
Jämfört med samma klass
» 41% av alla testade enheter i den här klassen var bättre, 6% liknande, 53% sämre
» Den bästa hade ett delta på 6%, genomsnittet var 18%, sämst var 132%
Jämfört med alla testade enheter
» 27% av alla testade enheter var bättre, 6% liknande, 68% sämre
» Den bästa hade ett delta på 4%, genomsnittet var 23%, sämst var 134%
Apple MacBook Pro 16 2021 M1 Pro ljudanalys
(+) | högtalare kan spela relativt högt (84.7 dB)
Bas 100 - 315 Hz
(+) | bra bas - bara 3.8% från medianen
(+) | basen är linjär (5.2% delta till föregående frekvens)
Mellan 400 - 2000 Hz
(+) | balanserad mellan - endast 1.3% från medianen
(+) | mids är linjära (2.1% delta till föregående frekvens)
Högsta 2 - 16 kHz
(+) | balanserade toppar - endast 1.9% från medianen
(+) | toppar är linjära (2.7% delta till föregående frekvens)
Totalt 100 - 16 000 Hz
(+) | det totala ljudet är linjärt (4.6% skillnad mot median)
Jämfört med samma klass
» 0% av alla testade enheter i den här klassen var bättre, 0% liknande, 100% sämre
» Den bästa hade ett delta på 5%, genomsnittet var 17%, sämst var 45%
Jämfört med alla testade enheter
» 0% av alla testade enheter var bättre, 0% liknande, 100% sämre
» Den bästa hade ett delta på 4%, genomsnittet var 23%, sämst var 134%
Energiförvaltning: Inte särskilt ekonomisk under belastning
Strömförbrukning
Medan G15 5530 uppvisar en rimligt effektiv strömförbrukning när den är inaktiv, förbrukar den mer ström under belastning jämfört med ROG Strix G18 som är utrustad med en RTX 4070.
Den Lenovo Legion Pro 5 16, med en Core i7-13700HX och RTX 4060, visar en omvänd rollfördelning med något lägre strömförbrukning under belastning än G15 5530 men högre strömförbrukning i viloläge.
Den medföljande massiva 330 W nätadaptern klarar av att hålla G15 tillräckligt matad även under stress.
| Av/Standby | |
| Låg belastning | |
| Hög belastning |
|
Förklaring:
min: | |
| Dell G15 5530 i7-13650HX, GeForce RTX 4060 Laptop GPU, IPS, 1920x1080, 15.6" | Asus ROG Strix G18 G814JI i7-13650HX, GeForce RTX 4070 Laptop GPU, IPS, 2560x1600, 18" | Lenovo Legion Pro 5 16IRX8 i7-13700HX, GeForce RTX 4060 Laptop GPU, IPS, 2560x1600, 16" | Asus ROG Flow X16 GV601V i9-13900H, GeForce RTX 4060 Laptop GPU, IPS, 2560x1600, 16" | MSI Katana 17 B13VFK i7-13620H, GeForce RTX 4060 Laptop GPU, IPS LED, 1920x1080, 17.3" | Asus TUF Gaming A16 FA617XS R9 7940HS, Radeon RX 7600S, IPS, 1920x1200, 16" | Asus ROG Strix G17 G713PI R9 7945HX, GeForce RTX 4070 Laptop GPU, IPS, 2560x1440, 17.3" | Medion Erazer Major X20 i9-13900HX, GeForce RTX 4070 Laptop GPU, IPS, 2560x1600, 16" | Genomsnitt NVIDIA GeForce RTX 4060 Laptop GPU | Genomsnitt av klass Gaming | |
|---|---|---|---|---|---|---|---|---|---|---|
| Power Consumption | -10% | -66% | 1% | 1% | 19% | -35% | -26% | -9% | -30% | |
| Idle Minimum * (Watt) | 8.4 | 8 5% | 24.5 -192% | 9.6 -14% | 12.2 -45% | 7 17% | 15 -79% | 12 -43% | 11.5 ? -37% | 13 ? -55% |
| Idle Average * (Watt) | 14.98 | 15 -0% | 29.2 -95% | 16 -7% | 14.9 1% | 10 33% | 20 -34% | 16 -7% | 16 ? -7% | 19 ? -27% |
| Idle Maximum * (Watt) | 15.56 | 26 -67% | 34.3 -120% | 16.9 -9% | 15.8 -2% | 15 4% | 29 -86% | 26 -67% | 20.3 ? -30% | 24.6 ? -58% |
| Load Average * (Watt) | 96.8 | 102 -5% | 98.7 -2% | 104 -7% | 85.22 12% | 86 11% | 121 -25% | 115 -19% | 92.9 ? 4% | 110.7 ? -14% |
| Witcher 3 ultra * (Watt) | 186 | 178.6 4% | 178.6 4% | 142 24% | 151.1 19% | 160.6 14% | 179.8 3% | 191.6 -3% | ||
| Load Maximum * (Watt) | 271.42 | 267 2% | 249.6 8% | 214 21% | 212.8 22% | 172 37% | 246 9% | 319 -18% | 210 ? 23% | 259 ? 5% |
* ... mindre är bättre
Power Consumption: The Witcher 3 / Stress test
Power Consumption: External monitor
Batteritid
G15 växlar till strömförsörjningsprofilen Batteri när den kopplas ur. Uppdateringsfrekvensen sänks dock inte automatiskt till 60 Hz.
Batteriet på 86 WHr ger hyfsade drifttider så länge den bärbara datorn inte utsätts för stora påfrestningar. Vid t.ex. videouppspelning i 1080p med 150 nits kan batteriet räcka i nästan 7 timmar. Vid spel med samma ljusstyrka räcker dock batteriet knappt en timme.
| Dell G15 5530 Intel Core i7-13650HX, GeForce RTX 4060 Laptop GPU, 86 Wh | Asus ROG Strix G18 G814JI Intel Core i7-13650HX, GeForce RTX 4070 Laptop GPU, 90 Wh | Lenovo Legion Pro 5 16IRX8 Intel Core i7-13700HX, GeForce RTX 4060 Laptop GPU, 80 Wh | Asus ROG Flow X16 GV601V Intel Core i9-13900H, GeForce RTX 4060 Laptop GPU, 90 Wh | MSI Katana 17 B13VFK Intel Core i7-13620H, GeForce RTX 4060 Laptop GPU, 53.5 Wh | Asus TUF Gaming A16 FA617XS AMD Ryzen 9 7940HS, Radeon RX 7600S, 90 Wh | Asus ROG Strix G17 G713PI AMD Ryzen 9 7945HX, GeForce RTX 4070 Laptop GPU, 90 Wh | Medion Erazer Major X20 Intel Core i9-13900HX, GeForce RTX 4070 Laptop GPU, 62.3 Wh | Genomsnitt av klass Gaming | |
|---|---|---|---|---|---|---|---|---|---|
| Batteridrifttid | 38% | -31% | 47% | -15% | 62% | -8% | 7% | 40% | |
| H.264 (h) | 6.8 | 8.9 31% | 12.4 82% | 2.8 -59% | 4.2 -38% | 8.32 ? 22% | |||
| WiFi v1.3 (h) | 6.5 | 8.1 25% | 3.4 -48% | 7.9 22% | 2.9 -55% | 12.4 91% | 4.3 -34% | 3.9 -40% | 7.11 ? 9% |
| Witcher 3 ultra (h) | 0.8 | 1.1 38% | |||||||
| Load (h) | 0.8 | 1.2 50% | 0.7 -13% | 1.5 88% | 1 25% | 0.9 13% | 1 25% | 1.6 100% | 1.502 ? 88% |
| Reader / Idle (h) | 11.7 | 6.7 | 20.3 | 5.8 | 8.27 ? |
För
Emot
Omdöme: Försöker göra det rätt utan att göra bankrutt

Dells uppdaterade G15 5530 ger kraften från Intel Raptor Lake-HX i skrivbordsklass till ett tungt men trendigt chassi som kompletteras med en skrymmande nätadapter.
G15 5530 har många bra saker som talar för den. Du får bra Wi-Fi-genomströmning och en snabb 1080p IPS-panel med hyfsad färgåtergivning. Underhåll och uppgraderingar är enkla, förutsatt att du inte har något emot den okonventionella M.2 2242 SSD-platsen.
På prestandafronten levererar kombinationen Core i7-13650HX och 140 W Nvidia GeForce RTX 4060 Laptop GPU stark prestanda för 1080p Ultra-spel, med potential för högre upplösningar med DLSS eller FSR. För det mesta presterar G15 5530 i nivå medLenovo Legion Pro 5 16 med en Core i7-13700HX.
Dell G15 5530 levererar stark prestanda, enkla uppgraderingar och är ett prisvärt alternativ till sina Alienware-bröder så länge du kan bortse från dess bulk och leva med några av dess kompromisser."
Det finns dock några oundvikliga kompromisser som måste göras. Portplaceringen är inte särskilt idealisk, lagringen är långsam, det finns ingen USB-strömförsörjning och webbkameran är en besvikelse för en 2023-enhet. Yttemperaturerna och strömförbrukningen under belastning är också på den högre sidan för den här konfigurationen. Även en Asus ROG Strix G17 med en AMD Ryzen 9 7945HX och RTX 4070 drar mindre ström under belastning.
Sammantaget gör Dell G15 5530 sitt bästa för att balansera kraft och pris, och den är definitivt värd ett övervägande om du letar efter en bärbar speldator runt 1 50 000 ₹ (1 400 USD).
Pris och tillgänglighet
Dell G15 5530 kan konfigureras och köpas direkt från Dell India och Dell US onlinebutiker. G15 5530 med RTX 4060 finns även listad på Amazon US.
Amazon India har en RTX 4050-version med okänd tillgänglighet. Dell G15 5530 med Core i7-13650HX, RTX 4050 och en 1 TB SSD kan köpas från Best Buy för 1 150 USD.
Dell G15 5530
- 06/25/2023 v7 (old)
Vaidyanathan Subramaniam
Genomskinlighet
Valet av enheter som ska granskas görs av vår redaktion. Testprovet gavs till författaren som ett lån av tillverkaren eller återförsäljaren för denna recension. Långivaren hade inget inflytande på denna recension och inte heller fick tillverkaren en kopia av denna recension innan publiceringen. Det fanns ingen skyldighet att publicera denna recension. Som ett oberoende medieföretag är Notebookcheck inte föremål för auktoritet från tillverkare, återförsäljare eller förlag.
This is how Notebookcheck is testingEvery year, Notebookcheck independently reviews hundreds of laptops and smartphones using standardized procedures to ensure that all results are comparable. We have continuously developed our test methods for around 20 years and set industry standards in the process. In our test labs, high-quality measuring equipment is utilized by experienced technicians and editors. These tests involve a multi-stage validation process. Our complex rating system is based on hundreds of well-founded measurements and benchmarks, which maintains objectivity.
Price comparison

