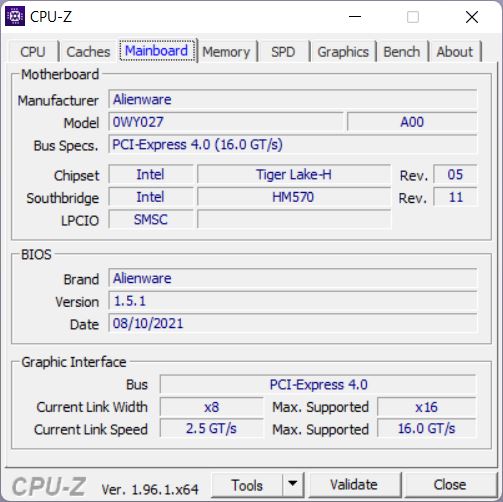
Alienware m15 R6 laptop recension: Effektivare, men RTX 3080 är långsammare än i föregångaren
Det är ganska förvånande hur många modeller av m15 Dell har introducerat på så kort tid. Vi har redan testat m15 R4, m15 R5 och nu m15 R6 - alla i år.
Det som är förvirrande är att eftersom R6 nu innehåller en Tiger Lake -processor är det egentligen en efterföljare till R4 med Comet Lake-processor och mer ett syskon till R5 med AMD-processor. Höljet och många andra egenskaper motsvarar m15 R5, vilket är anledningen till att vi inte kommer att diskutera egenskaperna hos höljet, inmatningsenheter, anslutningsutrustning etc. om det inte sker några förändringar. Du kan hitta information om dessa områden i vår granskning av Alienware m15 R5.
Naturligtvis jämför vi också Intel m15 R6 med den AMD m15 R5och m15 R4 Comet Lake- föregångaren, och dessutom även med Aorus 15P YD, denRazer Blade 15 pro-modellenoch Schenker XMG Neo 15
Possible competitors in Comparison
Gradering | Datum | Modell | Vikt | Höjd | Storlek | Upplösning | Pris |
|---|---|---|---|---|---|---|---|
| 86.1 % v7 (old) | 11/2021 | Alienware m15 R6, i7-11800H RTX 3080 i7-11800H, GeForce RTX 3080 Laptop GPU | 2.5 kg | 22.85 mm | 15.60" | 1920x1080 | |
| 84.7 % v7 (old) | 08/2025 | Alienware m15 R5 Ryzen Edition R7 5800H, GeForce RTX 3060 Laptop GPU | 2.5 kg | 22.85 mm | 15.60" | 1920x1080 | |
| 86.1 % v7 (old) | 09/2021 | Alienware m15 R4 RTX 3080 i9-10980HK, GeForce RTX 3080 Laptop GPU | 2.4 kg | 20 mm | 15.60" | 1920x1080 | |
| 86.4 % v7 (old) | 09/2021 | Aorus 15P YD i7-11800H, GeForce RTX 3080 Laptop GPU | 2.2 kg | 27 mm | 15.60" | 1920x1080 | |
| 87 % v7 (old) | Schenker XMG Neo 15 Tiger Lake i7-11800H, GeForce RTX 3080 Laptop GPU | 2.2 kg | 26 mm | 15.60" | 2560x1440 | ||
| 88.9 % v7 (old) | 10/2021 | Razer Blade 15 Advanced (Mid 2021) i7-11800H, GeForce RTX 3080 Laptop GPU | 2 kg | 16.99 mm | 15.60" | 1920x1080 |
Fall - Välkänd design
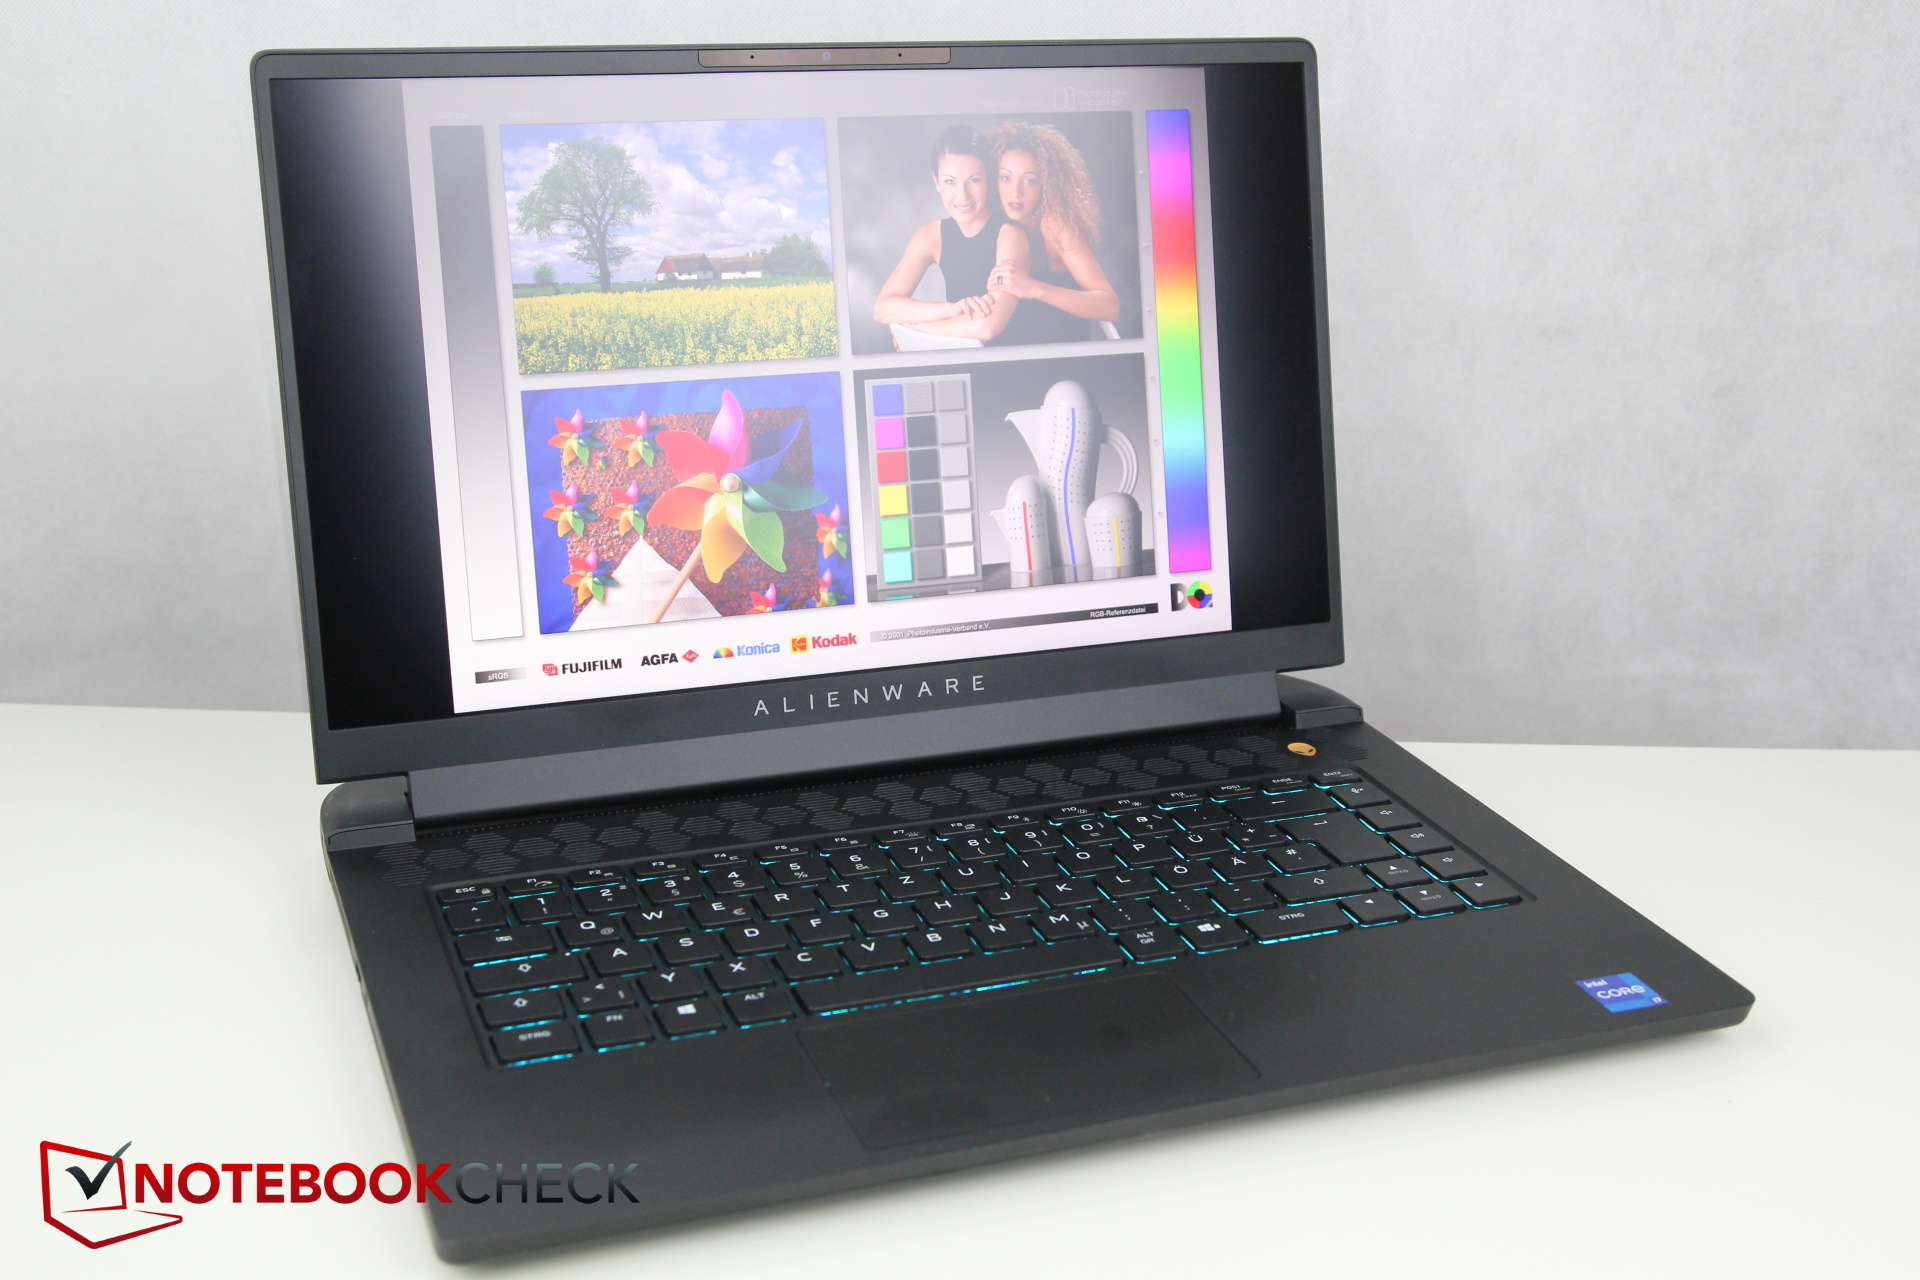
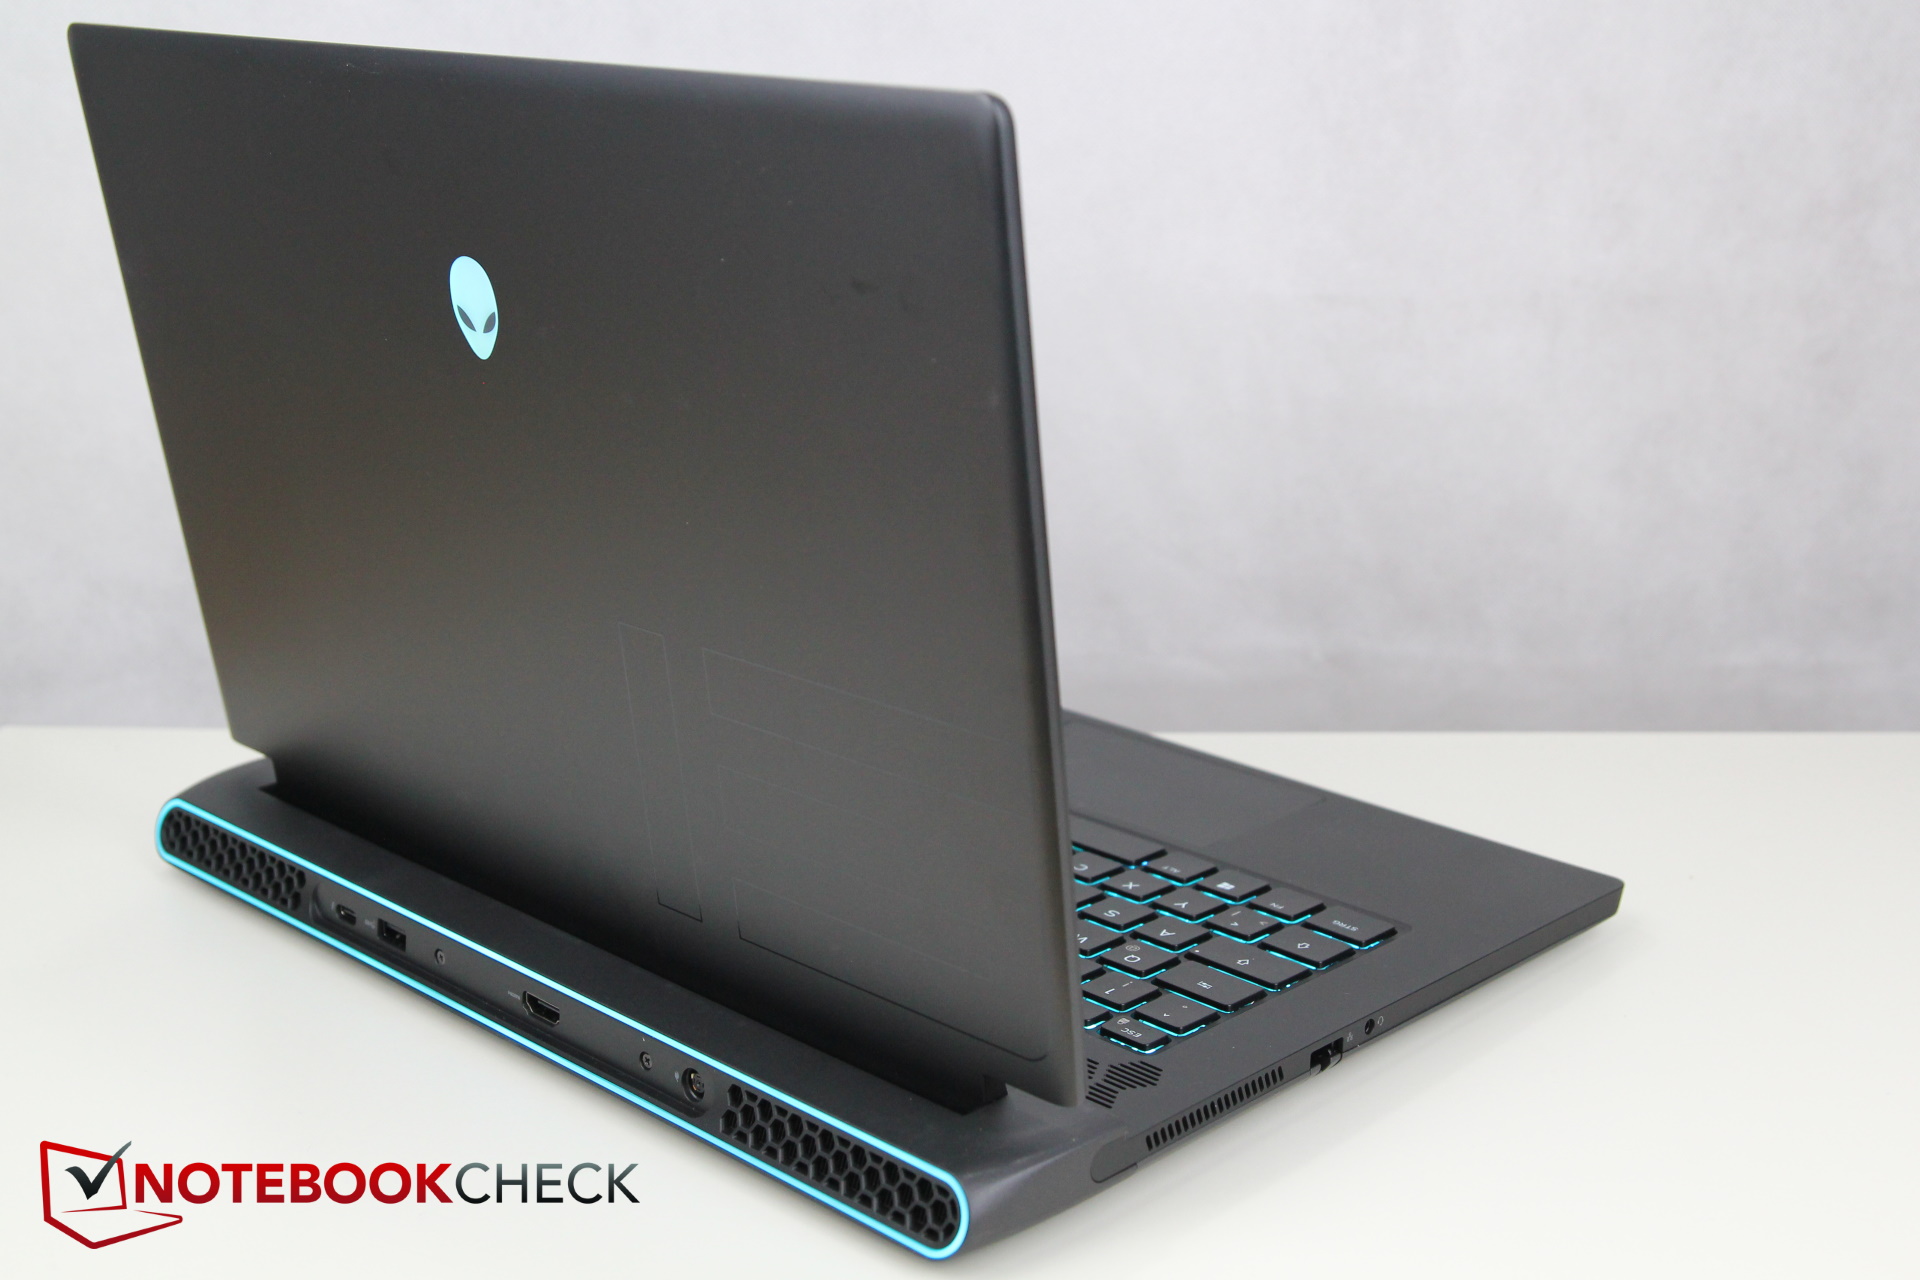
Alienwares bärbara datorer är kända för sitt stora kylsystem på baksidan, så det är knappast förvånande att den nuvarande modellen också är betydligt djupare än konkurrenterna från andra tillverkare. Men den är åtminstone något smalare än Schenker eller Aorus, även om ingen av modellerna kan slå Razer Blade i detta avseende
Med en vikt på 2,5 kg är Alienwares bärbara datorer också 200-500 g (~7-18 oz) tyngre än jämförelseenheterna
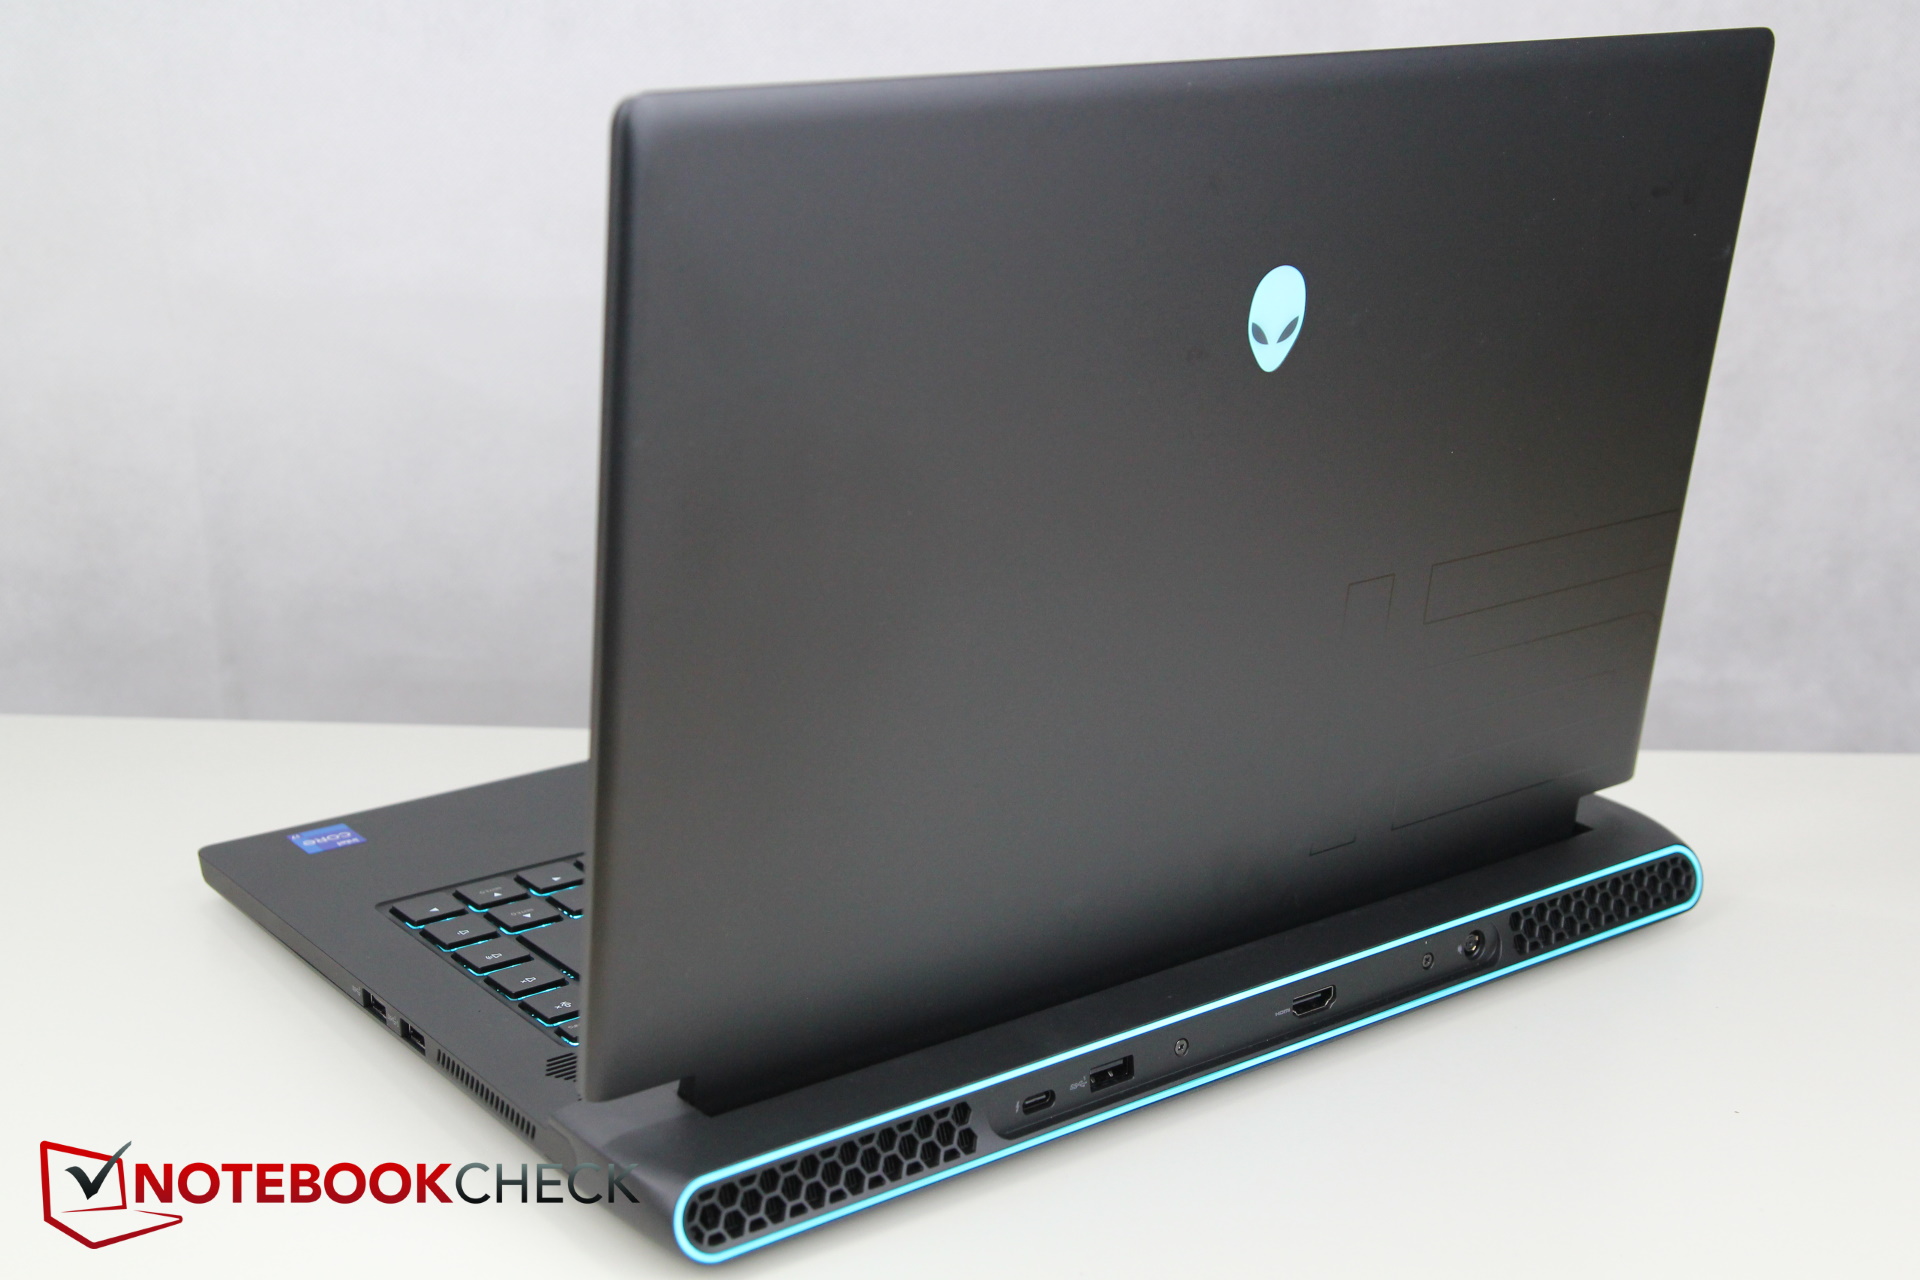
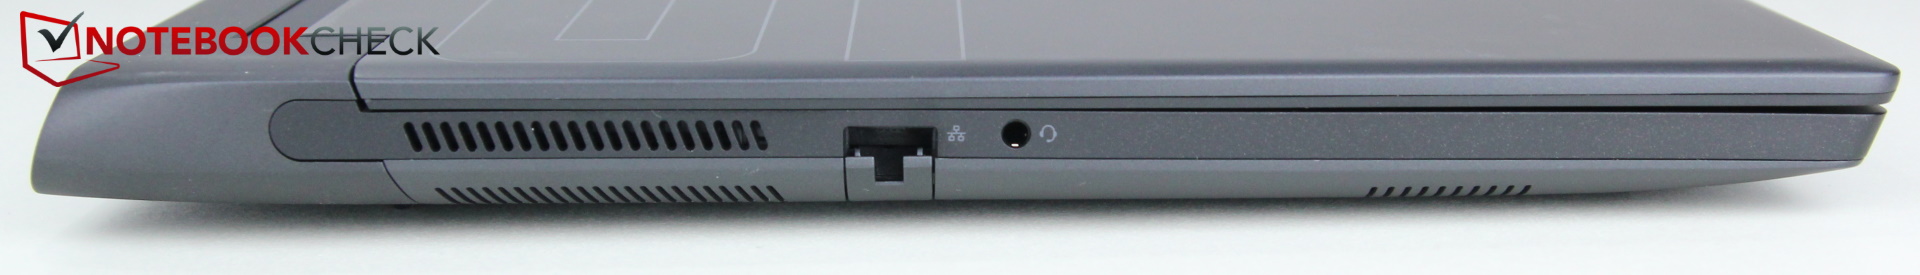
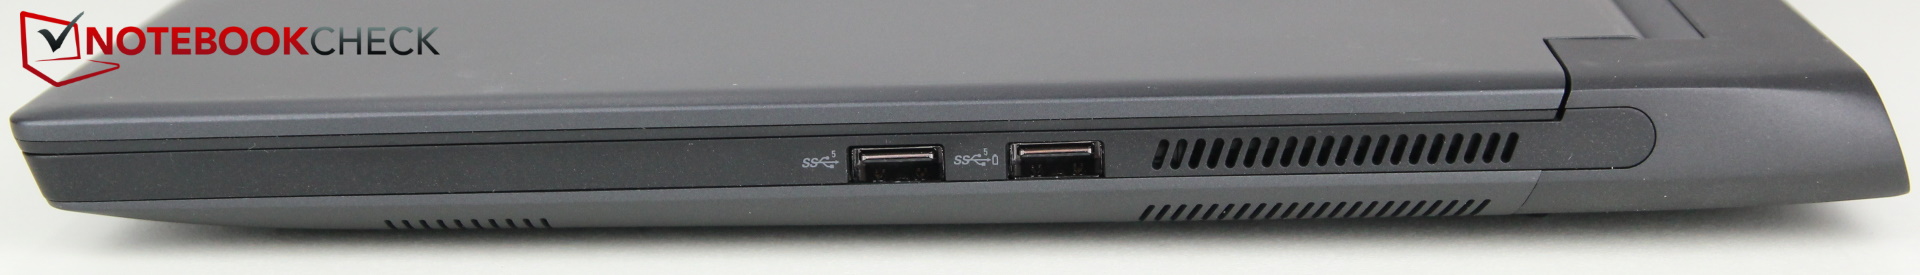
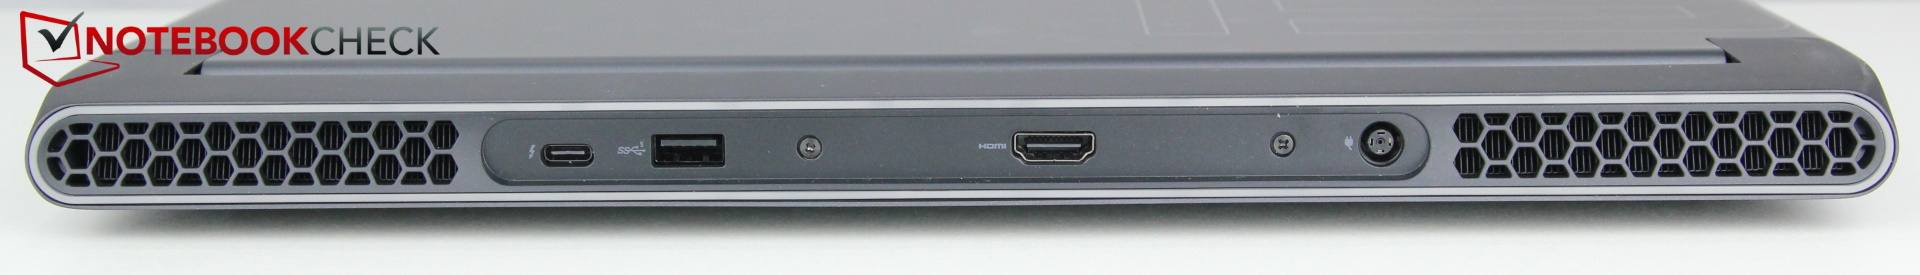
Anslutningsutrustning - Intel Alienware med Thunderbolt
Till skillnad från AMD-versionen m15 R5 har m15 R6 nu stöd för Thunderbolt 4 tack vare Intel-processorn, och motsvarande USB-C-port har också stöd för USB 3.2 Gen 2 i stället för Gen 1. Dessutom har USB-C-porten nu också stöd för Power Delivery, vilket innebär att den kan användas för uppladdning, men bara med upp till 15 watt. I övrigt är anslutningarna oförändrade
Kommunikation
| Networking | |
| iperf3 transmit AX12 | |
| Schenker XMG Neo 15 Tiger Lake | |
| Alienware m15 R5 Ryzen Edition | |
| Aorus 15P YD | |
| Genomsnitt Killer Wi-Fi 6 AX1650i 160MHz Wireless Network Adapter (201NGW) (758 - 1514, n=10) | |
| Alienware m15 R4 RTX 3080 | |
| Razer Blade 15 Advanced (Mid 2021) | |
| Alienware m15 R6, i7-11800H RTX 3080 | |
| iperf3 receive AX12 | |
| Schenker XMG Neo 15 Tiger Lake | |
| Razer Blade 15 Advanced (Mid 2021) | |
| Alienware m15 R5 Ryzen Edition | |
| Genomsnitt Killer Wi-Fi 6 AX1650i 160MHz Wireless Network Adapter (201NGW) (887 - 1670, n=10) | |
| Alienware m15 R6, i7-11800H RTX 3080 | |
| Aorus 15P YD | |
| Alienware m15 R4 RTX 3080 | |
Webbkamera


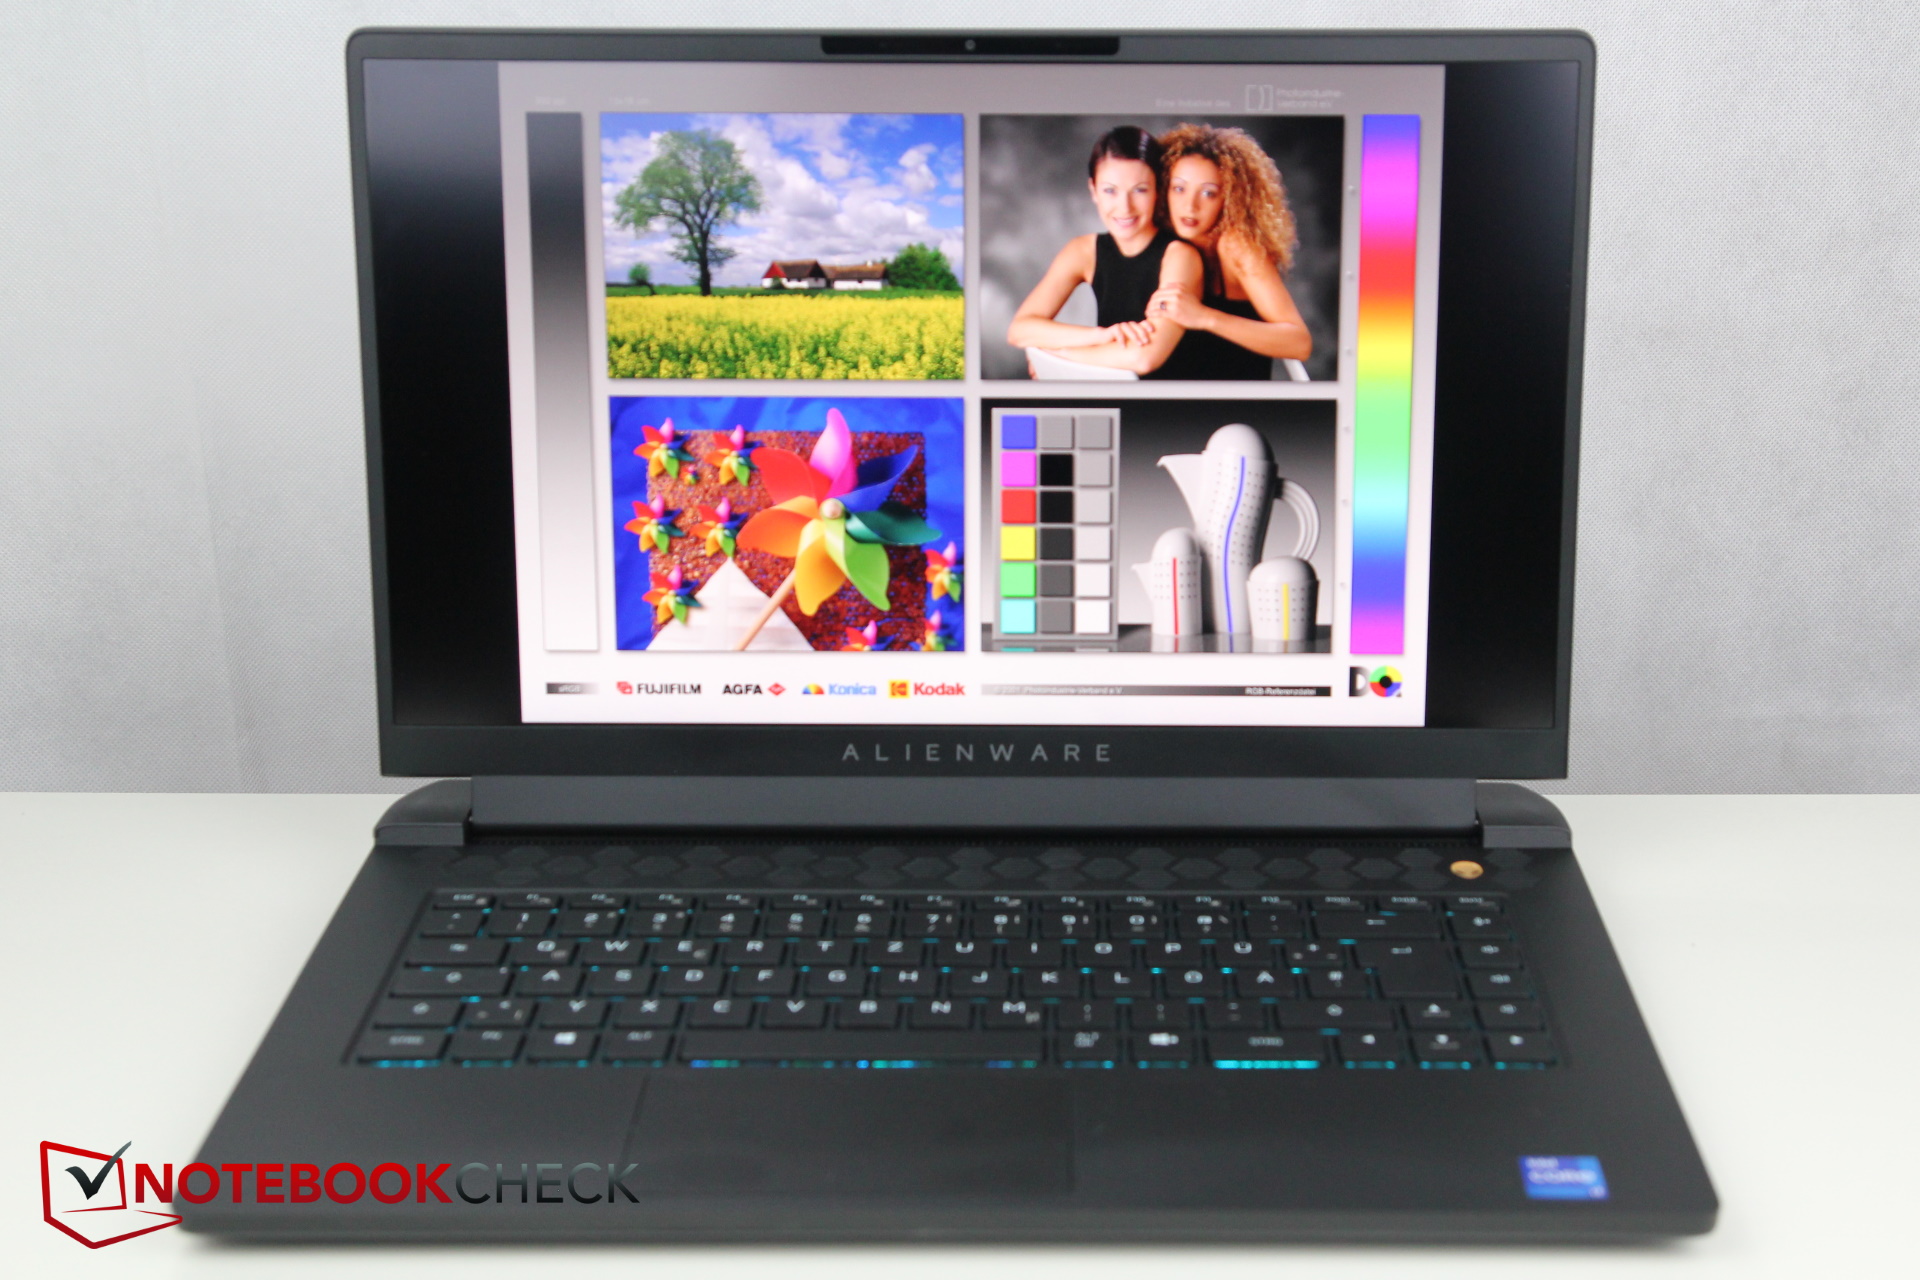
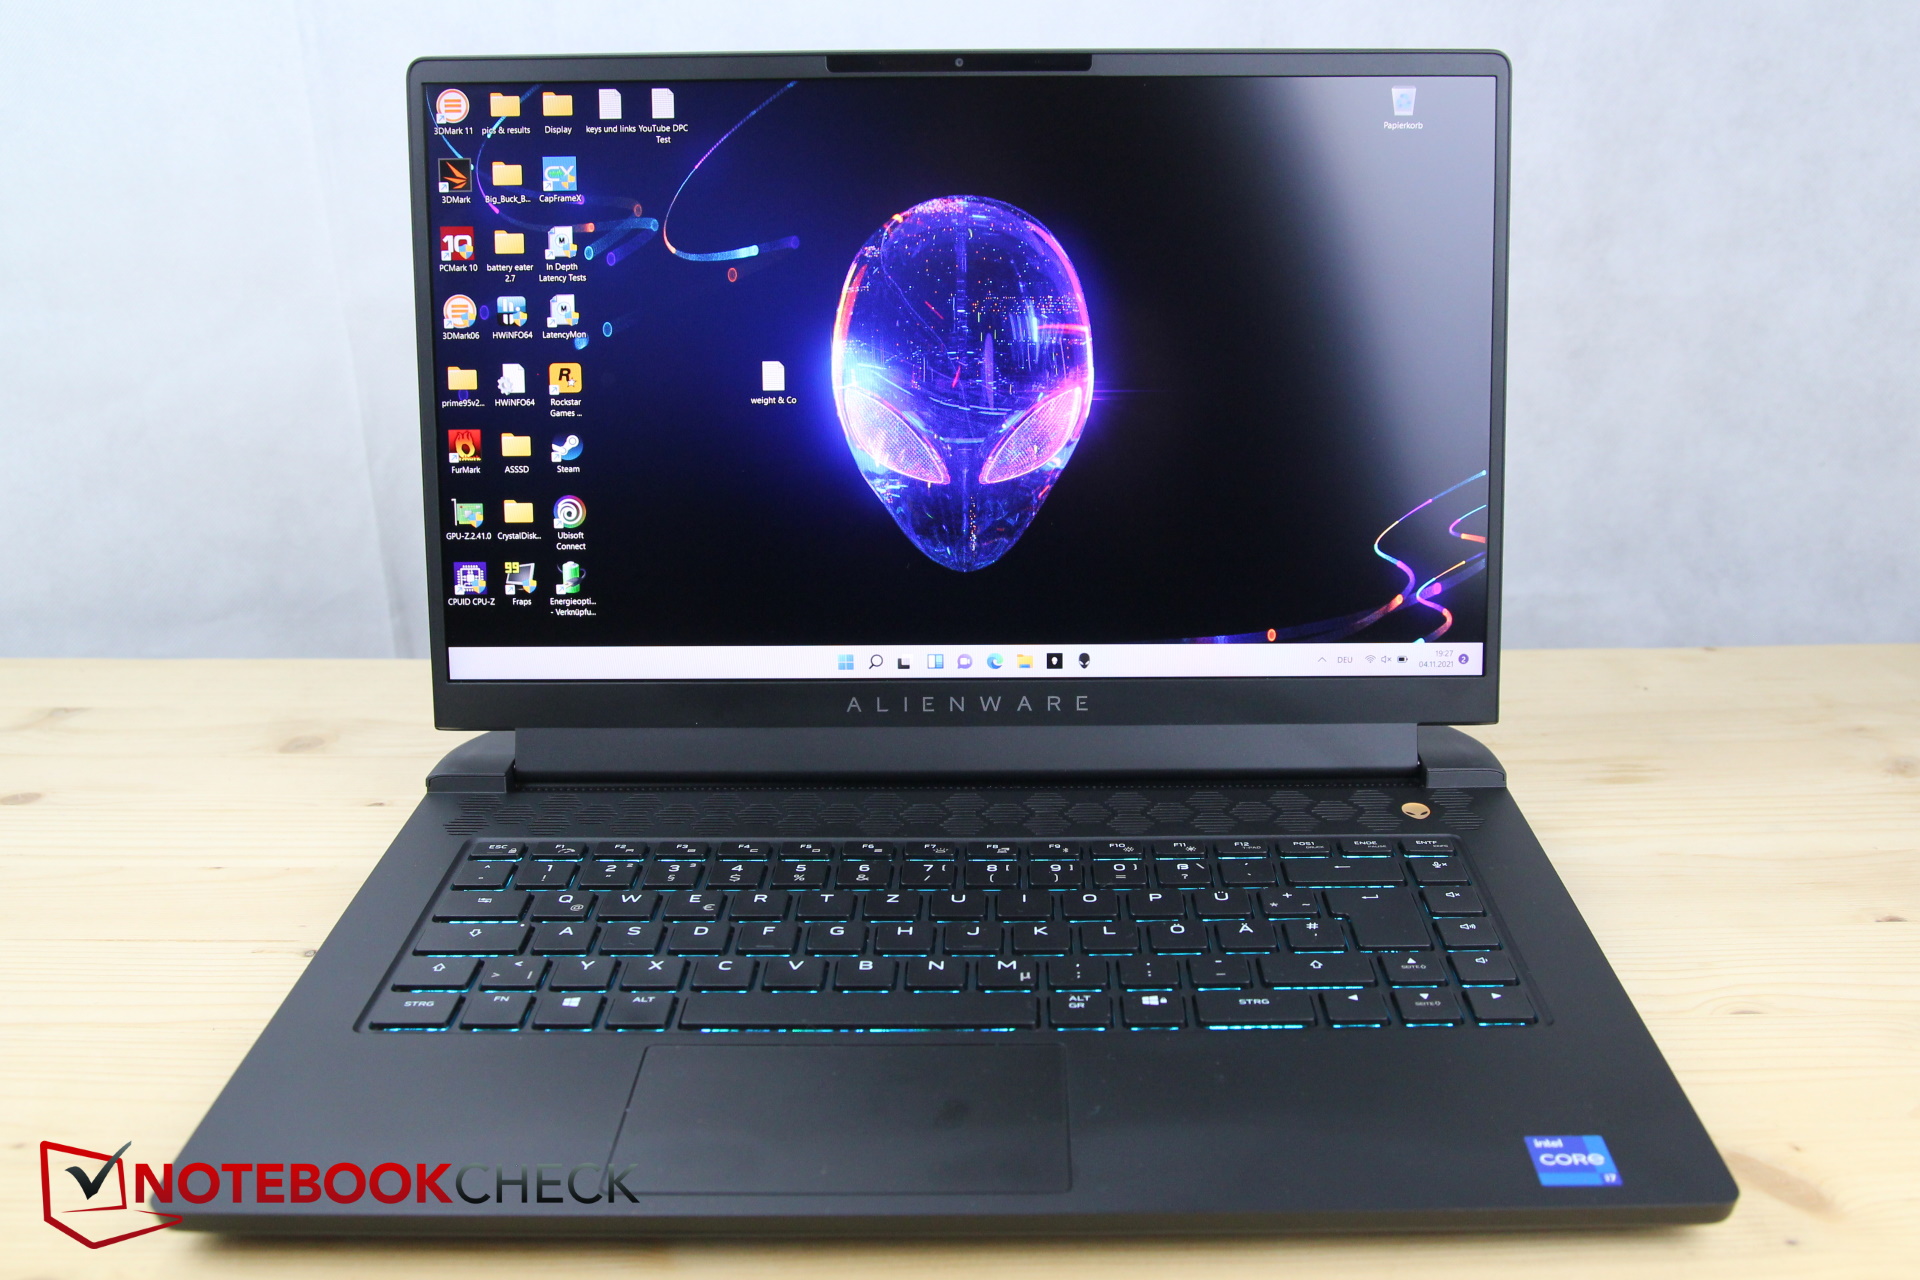
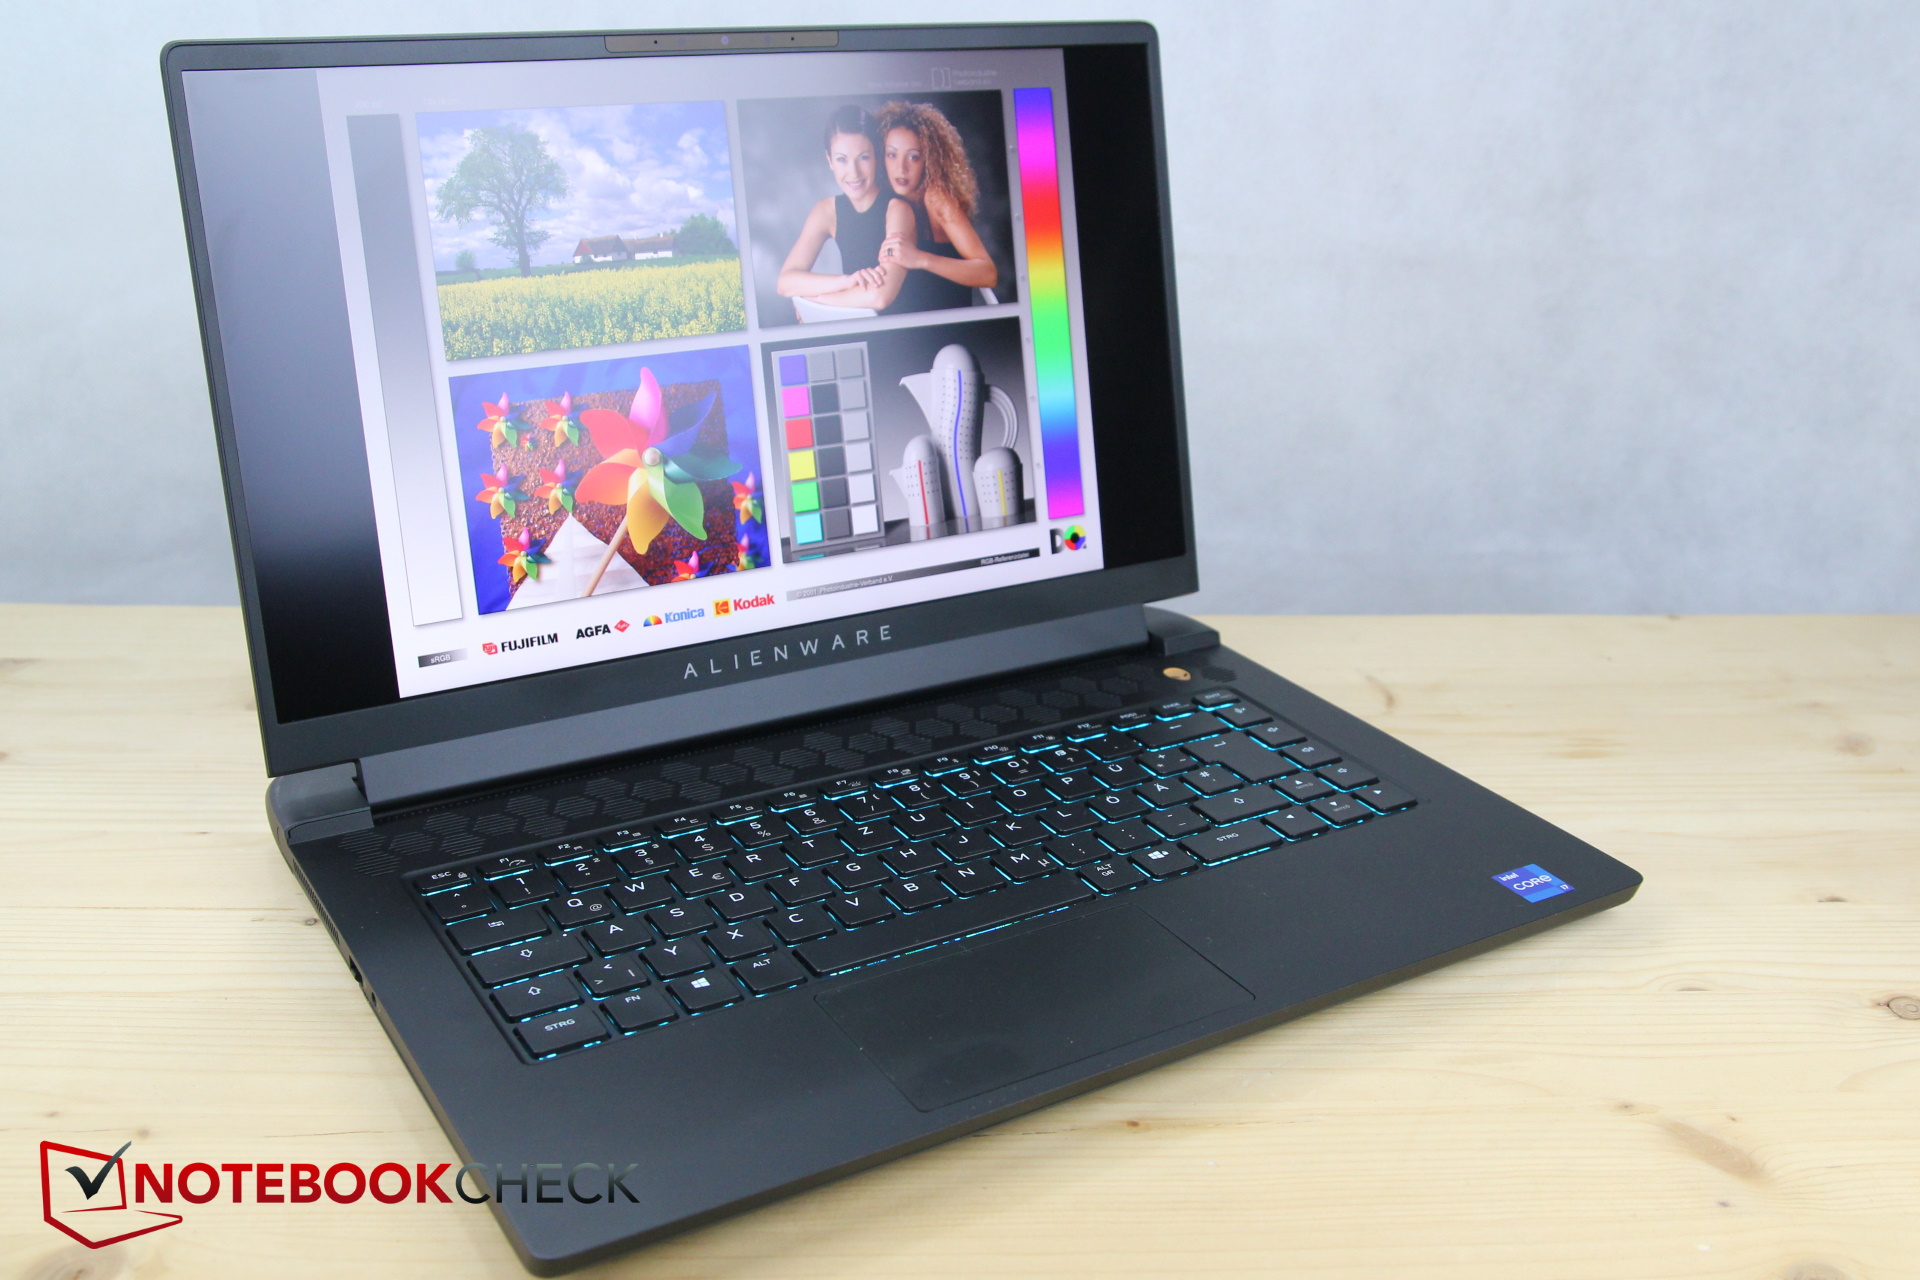
Display - Hastigheten ökas till 360 Hz
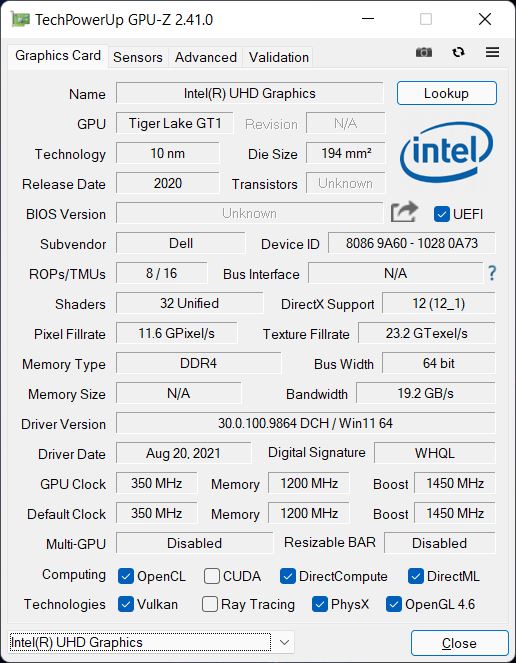
Enligt HWinfo är skärmen samma matta FHD-panel från AU Optronics som i m15 R5. Den aktuella modellen erbjuder dock en uppdateringsfrekvens på snabba 360 Hz, medan den i AMD m15 "bara" behärskar 165 Hz. Alternativt kan du även köpa R6 med samma 165 Hz-panel, och dessutom finns en QHD-panel med 240 Hz. Men varför finns det inget 4K-alternativ för en bärbar dator för spel med RTX 3080?
Trots att de delar samma etikett är värdena för de båda panelerna också olika. Medan ljusstyrkan är något bättre är fördelningen sämre. Svartvärdet och kontrasten är också något sämre än i syskonmodellen
Positivt är de två panelernas mycket korta och därmed enastående responstider
| |||||||||||||||||||||||||
Distribution av ljusstyrkan: 85 %
Mitt på batteriet: 360 cd/m²
Kontrast: 1026:1 (Svärta: 0.35 cd/m²)
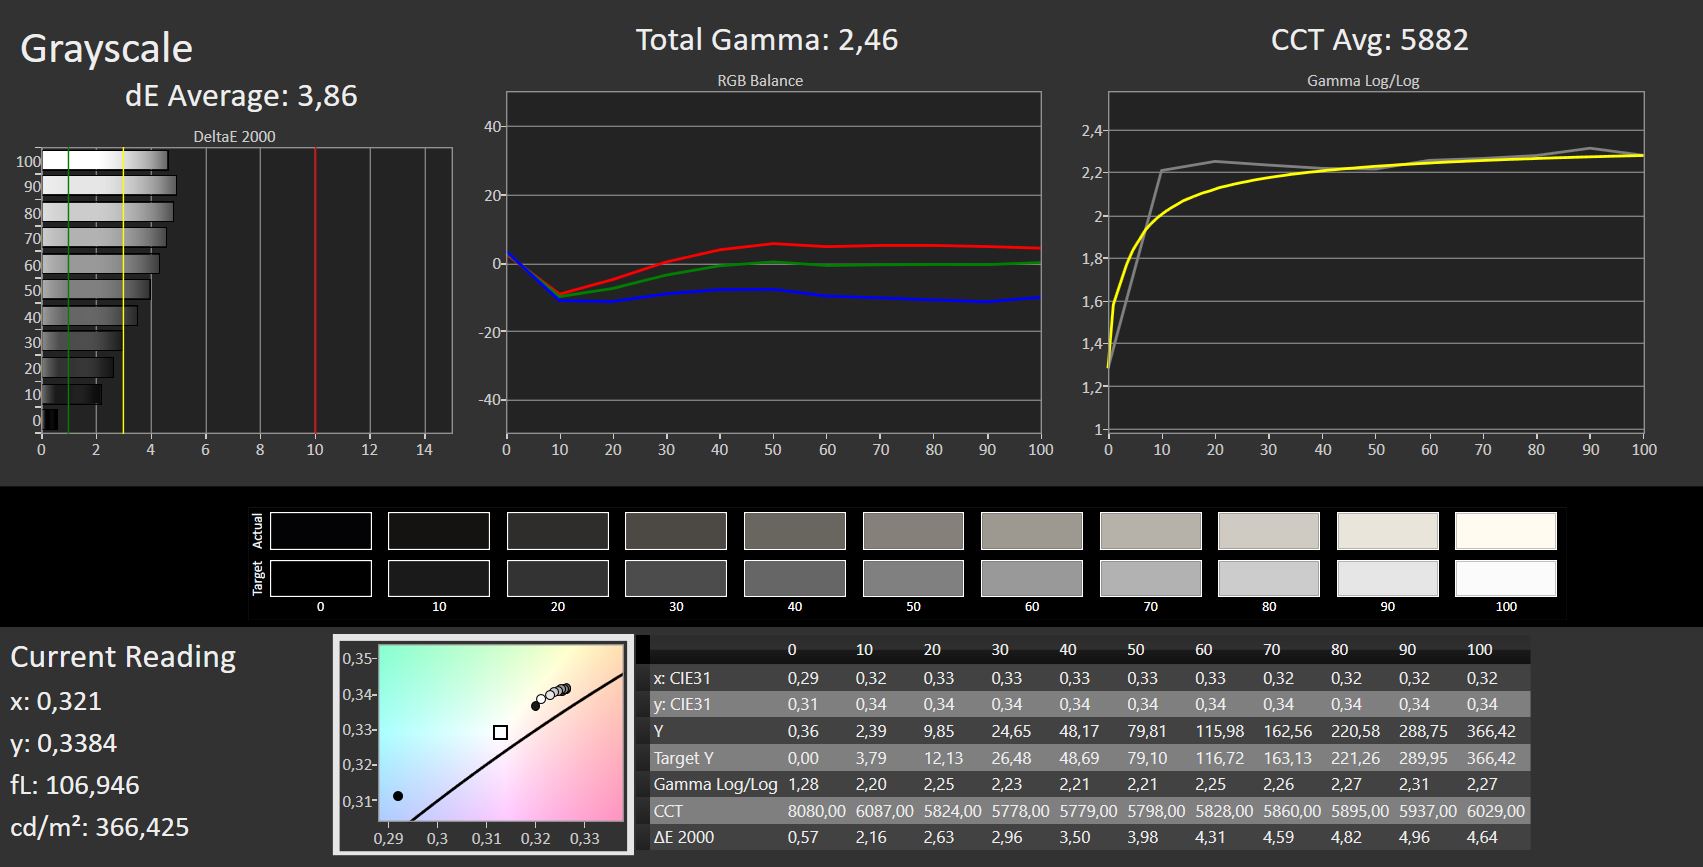
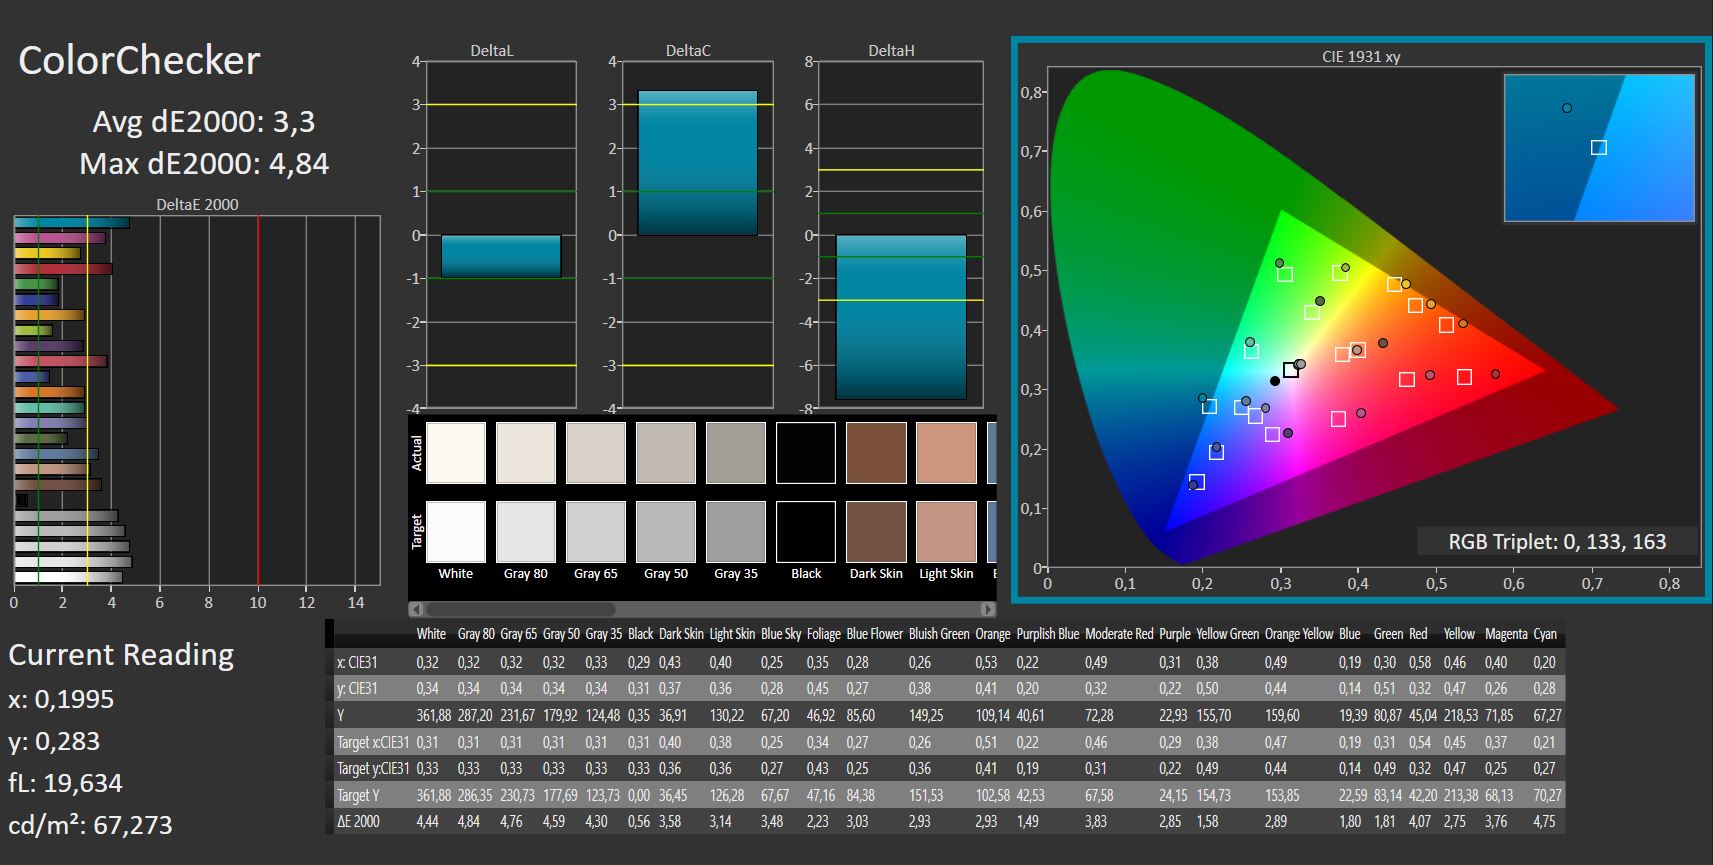
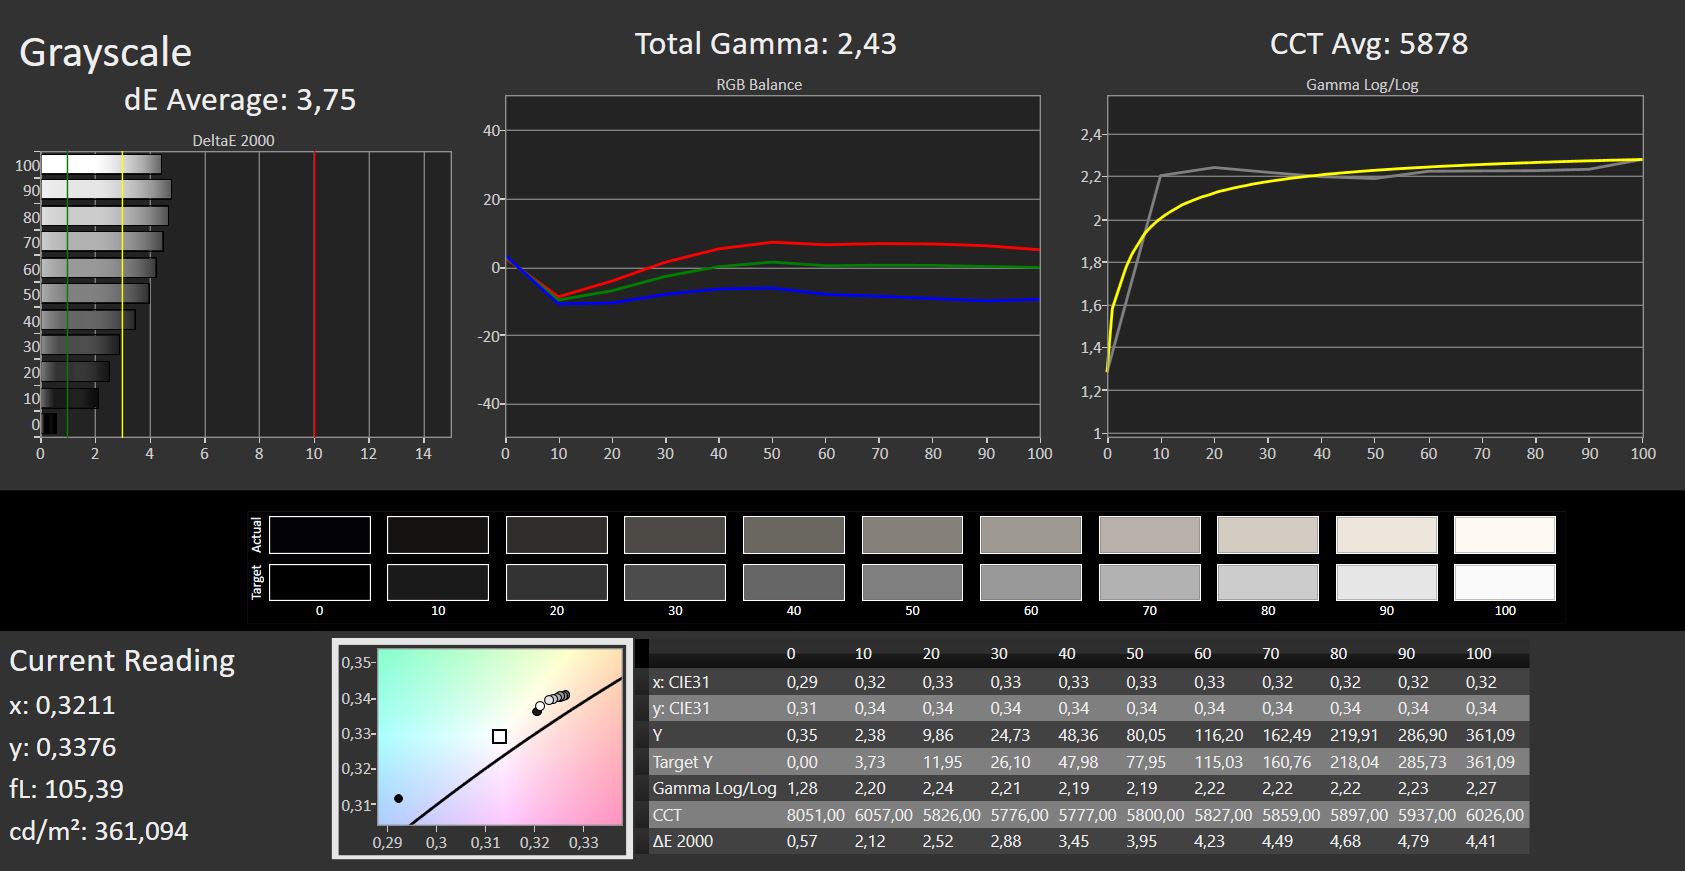
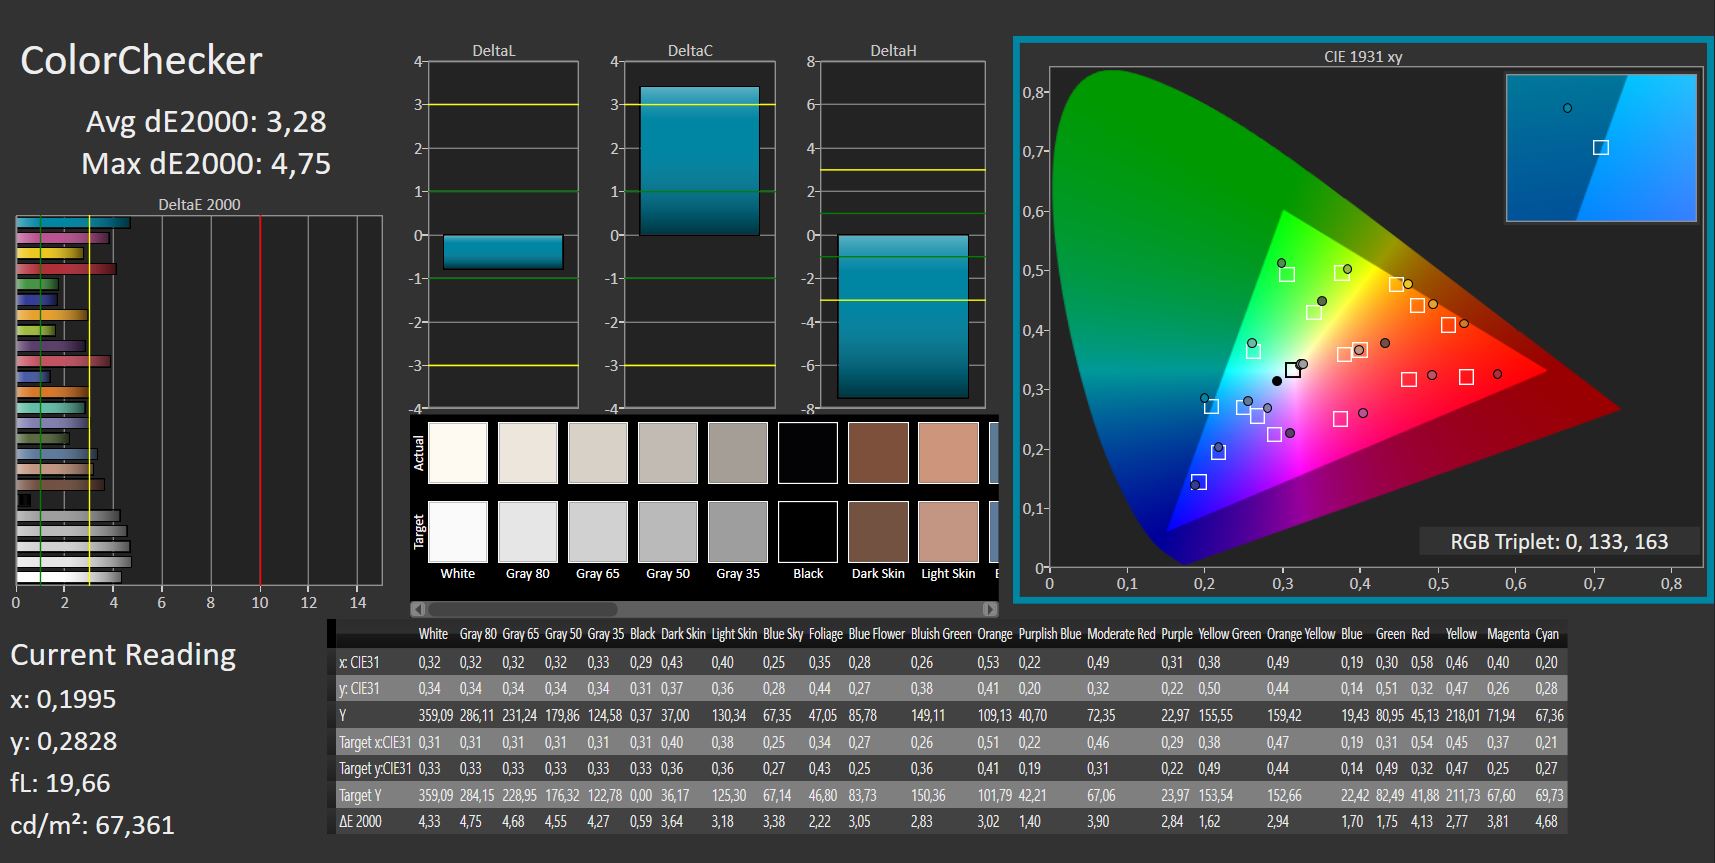
ΔE ColorChecker Calman: 3.3 | ∀{0.5-29.43 Ø4.71}
calibrated: 3.28
ΔE Greyscale Calman: 3.66 | ∀{0.09-98 Ø4.96}
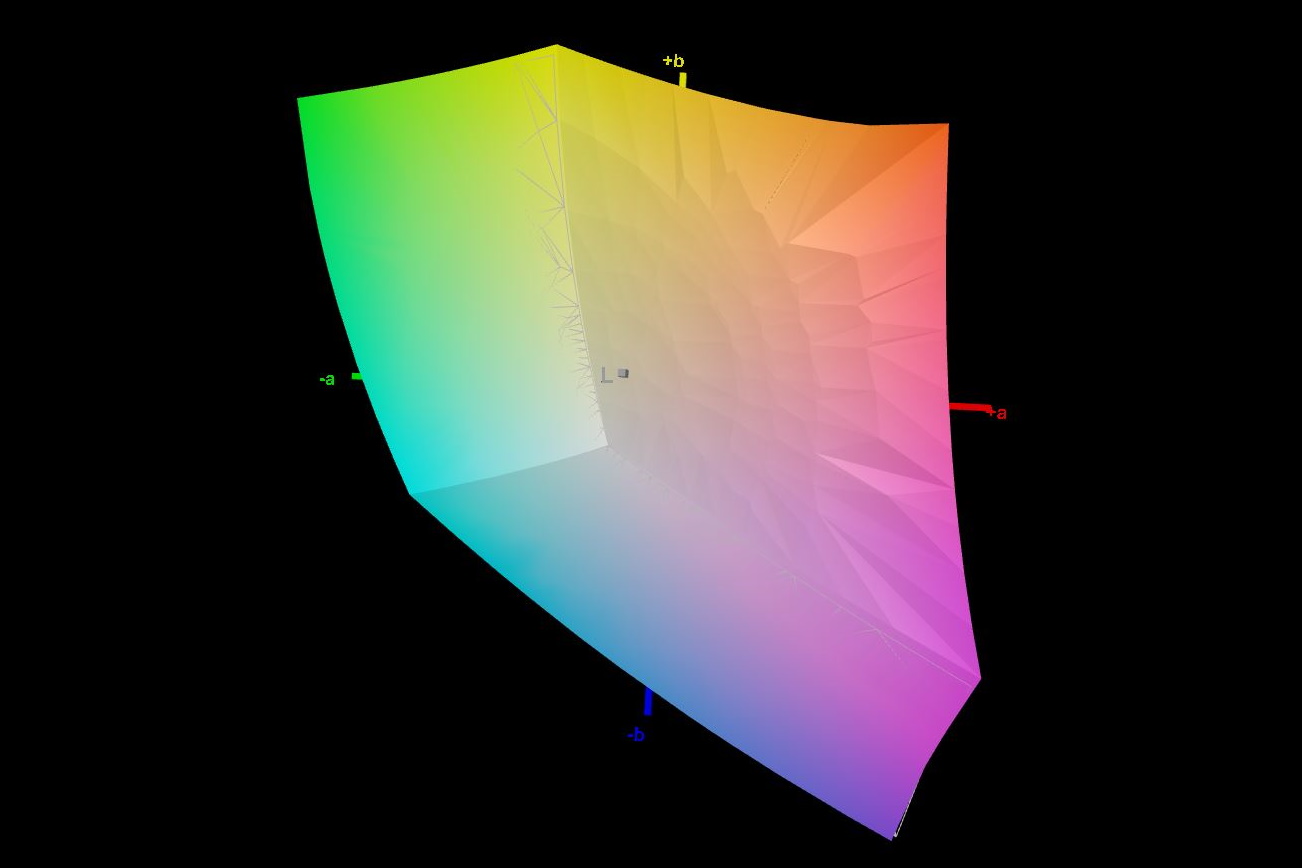
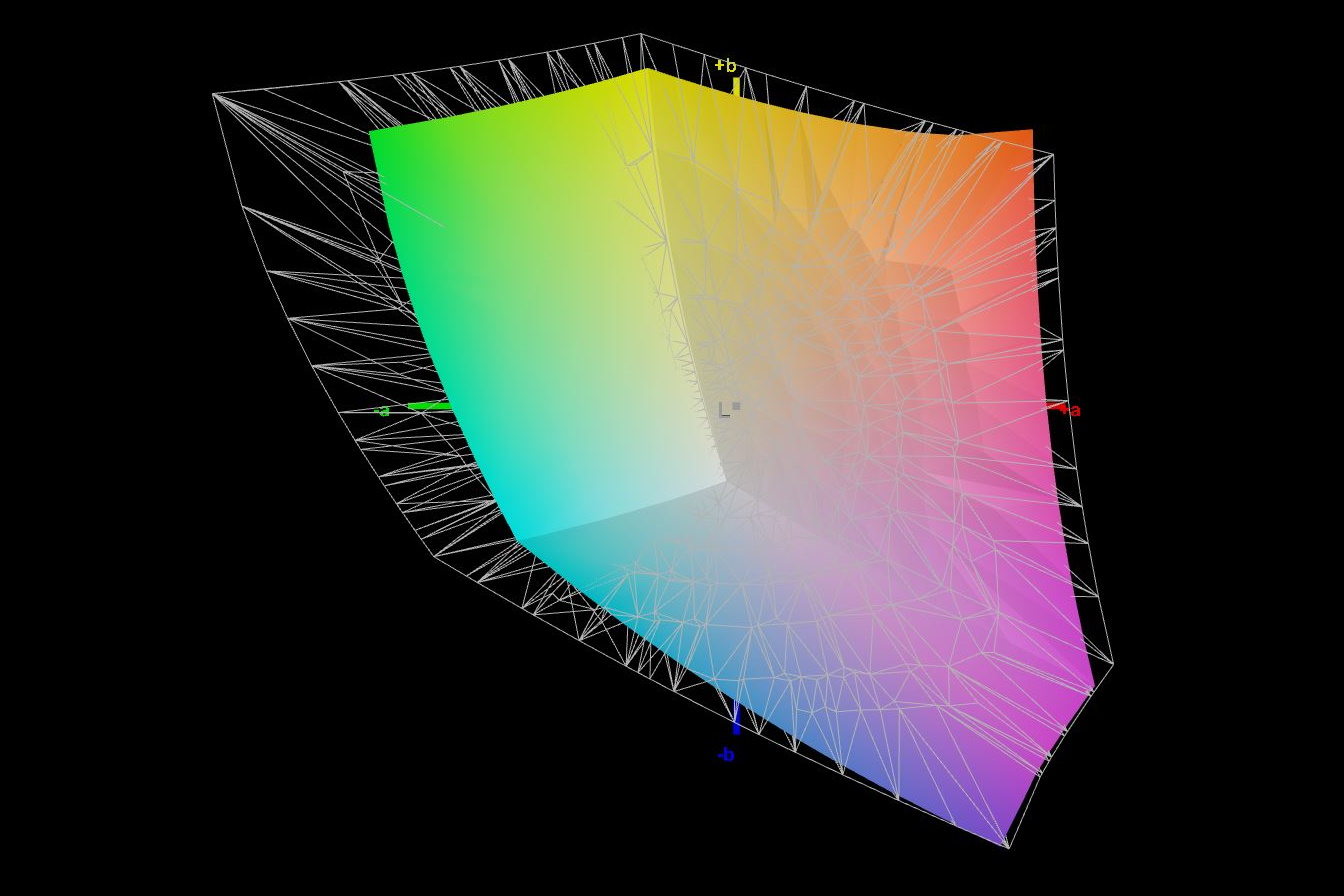
75.7% AdobeRGB 1998 (Argyll 3D)
99.5% sRGB (Argyll 3D)
74.1% Display P3 (Argyll 3D)
Gamma: 2.43
CCT: 5896 K
| Alienware m15 R6, i7-11800H RTX 3080 AU Optronics AUO9092 (B156HAN), IPS, 1920x1080, 15.6" | Alienware m15 R5 Ryzen Edition B156HAN, IPS, 1920x1080, 15.6" | Alienware m15 R4 RTX 3080 LG Philips LGD066E (156WFG), IPS, 1920x1080, 15.6" | Aorus 15P YD BOE09B9, IPS, 1920x1080, 15.6" | Schenker XMG Neo 15 Tiger Lake BOE CQ NE156QHM-NY2, IPS, 2560x1440, 15.6" | Razer Blade 15 Advanced (Mid 2021) TL156VDXP02-0, IPS, 1920x1080, 15.6" | |
|---|---|---|---|---|---|---|
| Display | -4% | -3% | -5% | -7% | ||
| Display P3 Coverage (%) | 74.1 | 70.1 -5% | 70.2 -5% | 68.6 -7% | 66.9 -10% | |
| sRGB Coverage (%) | 99.5 | 99.8 0% | 98.5 -1% | 98.6 -1% | 97.1 -2% | |
| AdobeRGB 1998 Coverage (%) | 75.7 | 71.5 -6% | 72.4 -4% | 69.3 -8% | 69 -9% | |
| Response Times | -47% | -121% | -236% | -293% | -65% | |
| Response Time Grey 50% / Grey 80% * (ms) | 2.8 | 4 ? -43% | 7.6 ? -171% | 14 ? -400% | 16 ? -471% | 4.2 ? -50% |
| Response Time Black / White * (ms) | 5.6 | 8.4 ? -50% | 9.6 ? -71% | 9.6 ? -71% | 12 ? -114% | 10 ? -79% |
| PWM Frequency (Hz) | ||||||
| Screen | 15% | 24% | -9% | -8% | 13% | |
| Brightness middle (cd/m²) | 359 | 329 -8% | 347 -3% | 337 -6% | 324 -10% | 353.4 -2% |
| Brightness (cd/m²) | 344 | 321 -7% | 318 -8% | 316 -8% | 307 -11% | 340 -1% |
| Brightness Distribution (%) | 85 | 92 8% | 86 1% | 85 0% | 91 7% | 92 8% |
| Black Level * (cd/m²) | 0.35 | 0.27 23% | 0.31 11% | 0.31 11% | 0.27 23% | 0.31 11% |
| Contrast (:1) | 1026 | 1219 19% | 1119 9% | 1087 6% | 1200 17% | 1140 11% |
| Colorchecker dE 2000 * | 3.3 | 2.78 16% | 1.68 49% | 3.87 -17% | 3.36 -2% | 2.17 34% |
| Colorchecker dE 2000 max. * | 4.84 | 4.88 -1% | 3.03 37% | 8.09 -67% | 9.87 -104% | 5.69 -18% |
| Colorchecker dE 2000 calibrated * | 3.28 | 1.63 50% | 1.08 67% | 1.15 65% | 1.23 62% | 1.05 68% |
| Greyscale dE 2000 * | 3.66 | 2.5 32% | 1.8 51% | 6.1 -67% | 5.8 -58% | 3.4 7% |
| Gamma | 2.43 91% | 2.106 104% | 2.262 97% | 2.132 103% | 2.311 95% | 2.2 100% |
| CCT | 5896 110% | 6201 105% | 6592 99% | 6891 94% | 7087 92% | 6830 95% |
| Color Space (Percent of AdobeRGB 1998) (%) | 76 | 71 | 72 | 69 | ||
| Color Space (Percent of sRGB) (%) | 99 | 94 | 94 | 93 | ||
| Totalt genomsnitt (program/inställningar) | -16% /
4% | -34% /
-3% | -83% /
-40% | -102% /
-48% | -20% /
-2% |
* ... mindre är bättre
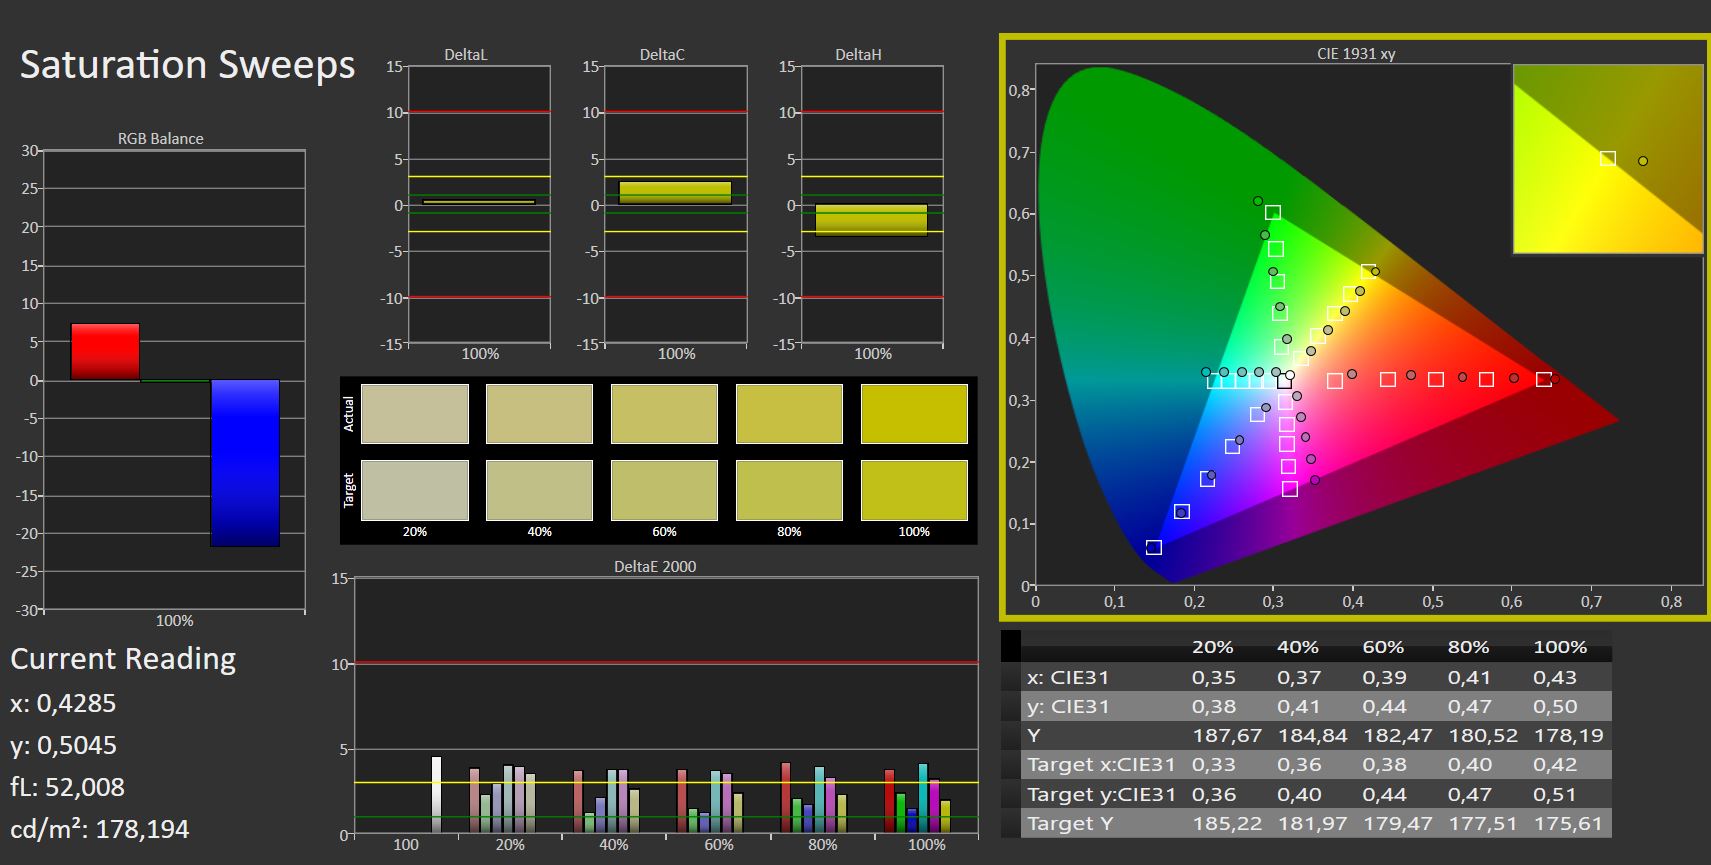
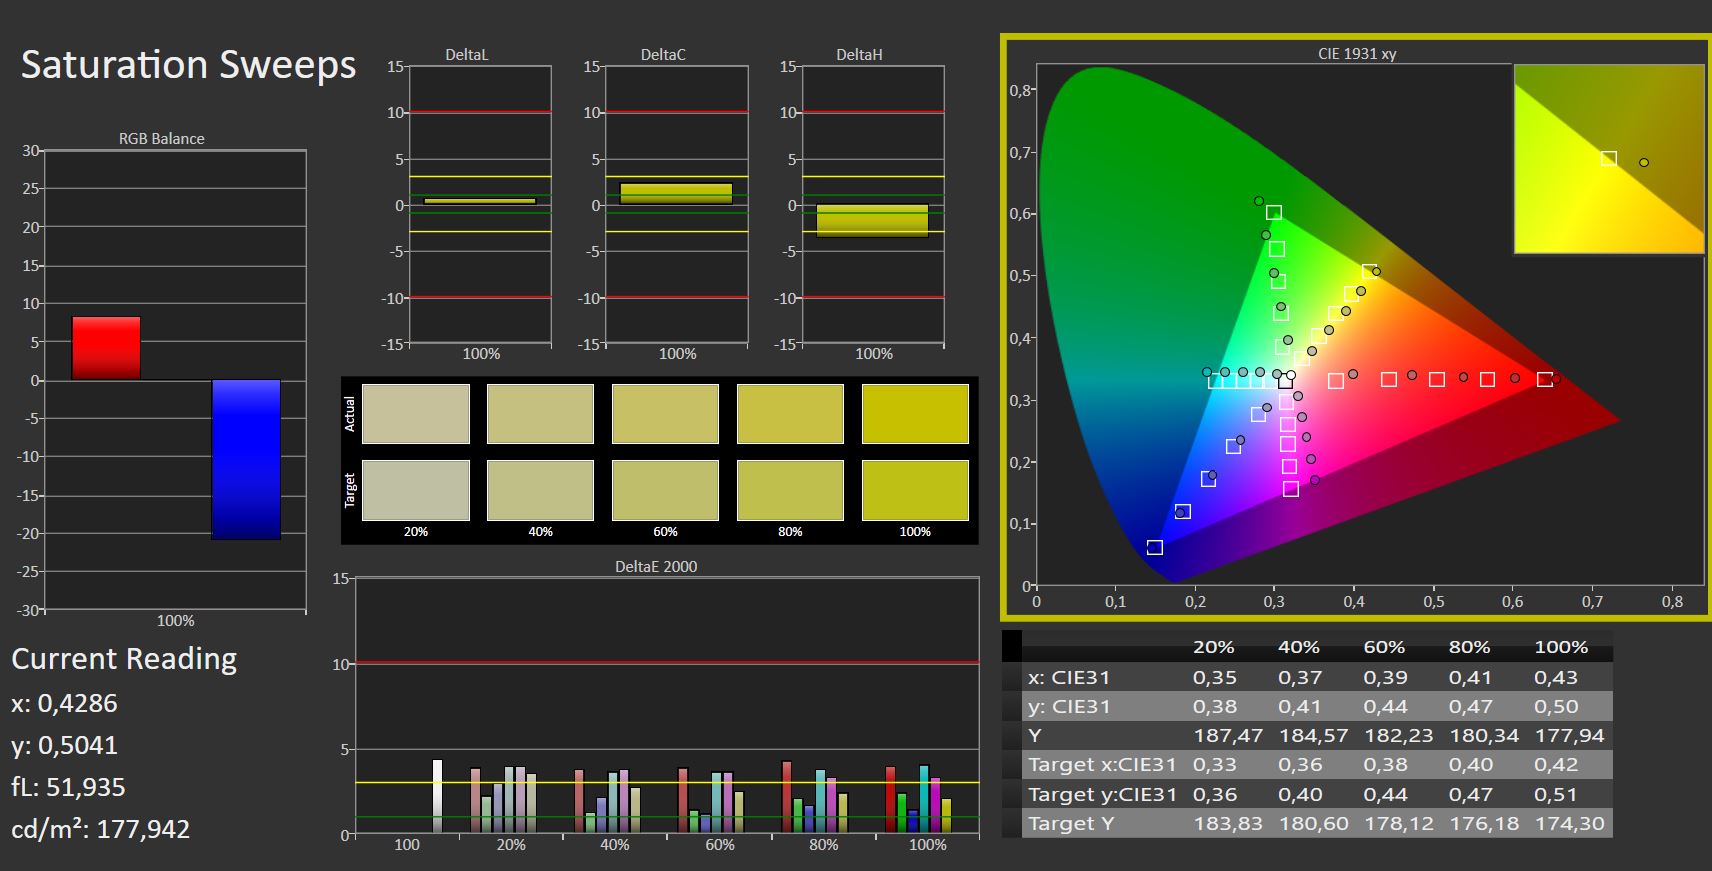
Med nästan 100 % sRGB och cirka 76 % AdobeRGB är färgområdestäckningen mycket god, medan många konkurrenter inte riktigt når upp till dessa värden
Skärmen är kalibrerad ganska bra redan vid leverans, och en manuell kalibrering ger nästan ingen betydande förbättring när det gäller färgavvikelser.
Visa svarstider
| ↔ Svarstid svart till vitt | ||
|---|---|---|
| 5.6 ms ... stiga ↗ och falla ↘ kombinerat | ↗ ms stiga | 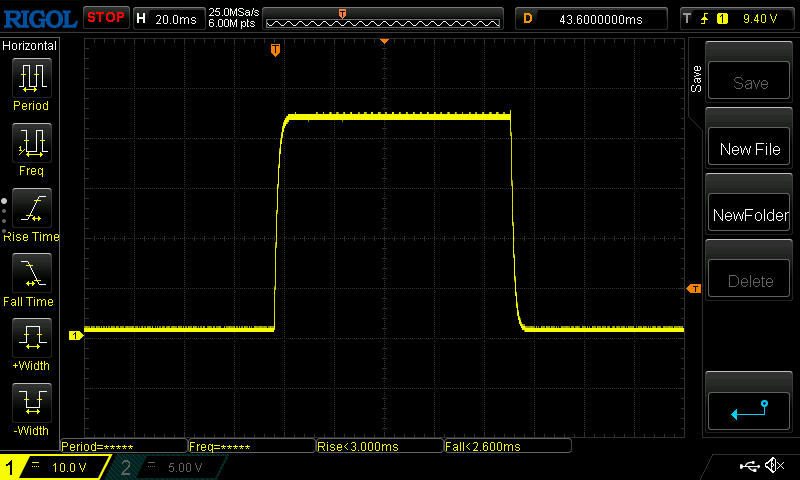 |
| ↘ ms hösten | ||
| Skärmen visar väldigt snabba svarsfrekvenser i våra tester och borde vara mycket väl lämpad för fartfyllt spel. I jämförelse sträcker sig alla testade enheter från 0.1 (minst) till 240 (maximalt) ms. » 18 % av alla enheter är bättre. Det betyder att den uppmätta svarstiden är bättre än genomsnittet av alla testade enheter (19.8 ms). | ||
| ↔ Svarstid 50 % grått till 80 % grått | ||
| 2.8 ms ... stiga ↗ och falla ↘ kombinerat | ↗ ms stiga | 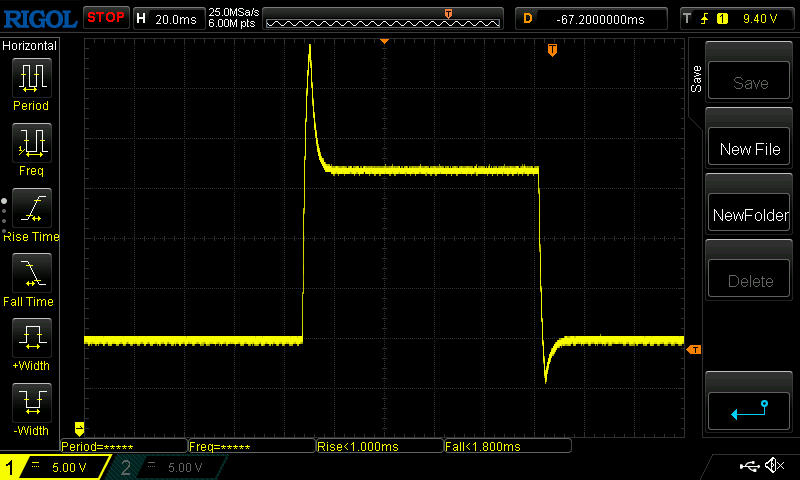 |
| ↘ ms hösten | ||
| Skärmen visar väldigt snabba svarsfrekvenser i våra tester och borde vara mycket väl lämpad för fartfyllt spel. I jämförelse sträcker sig alla testade enheter från 0.165 (minst) till 636 (maximalt) ms. » 12 % av alla enheter är bättre. Det betyder att den uppmätta svarstiden är bättre än genomsnittet av alla testade enheter (31 ms). | ||
Skärmflimmer / PWM (Puls-Width Modulation)
| Skärmflimmer / PWM upptäcktes inte | 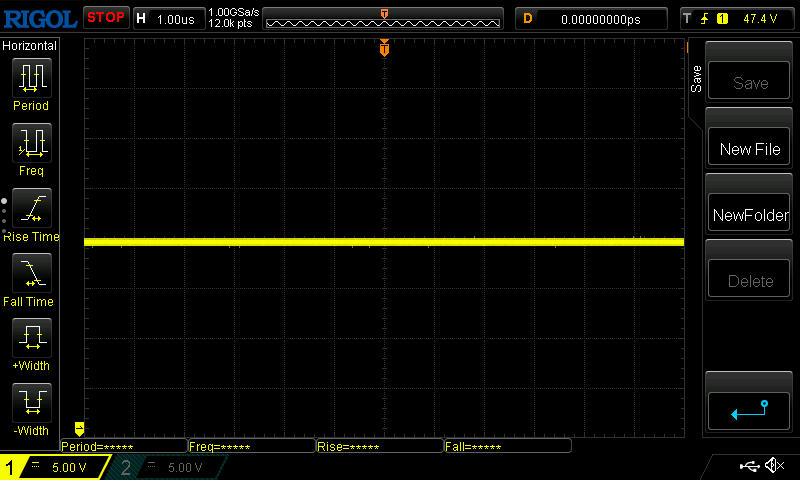 | ||
Som jämförelse: 52 % av alla testade enheter använder inte PWM för att dämpa skärmen. Om PWM upptäcktes mättes ett medelvärde av 7754 (minst: 5 - maximum: 343500) Hz. | |||
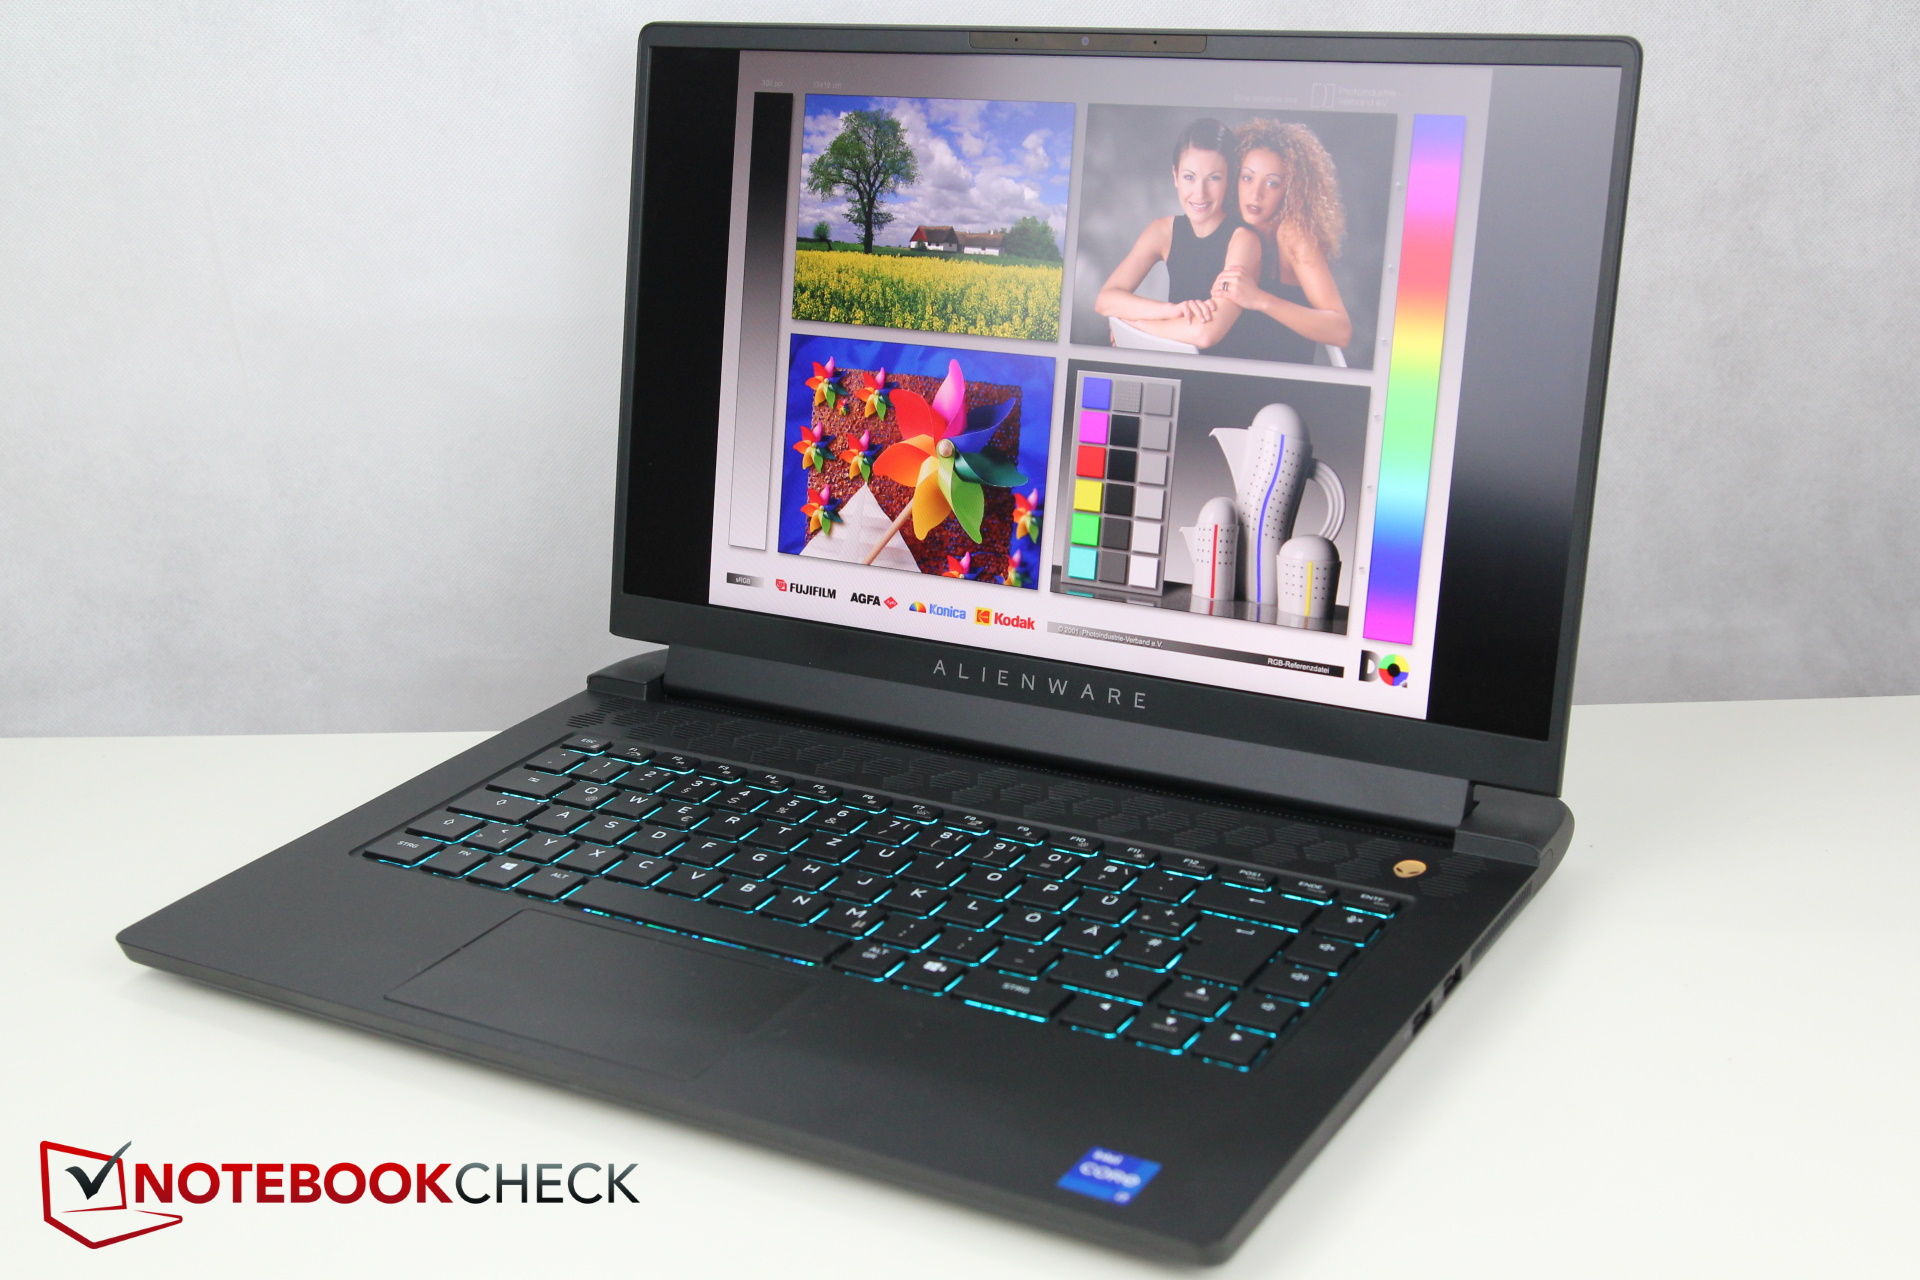
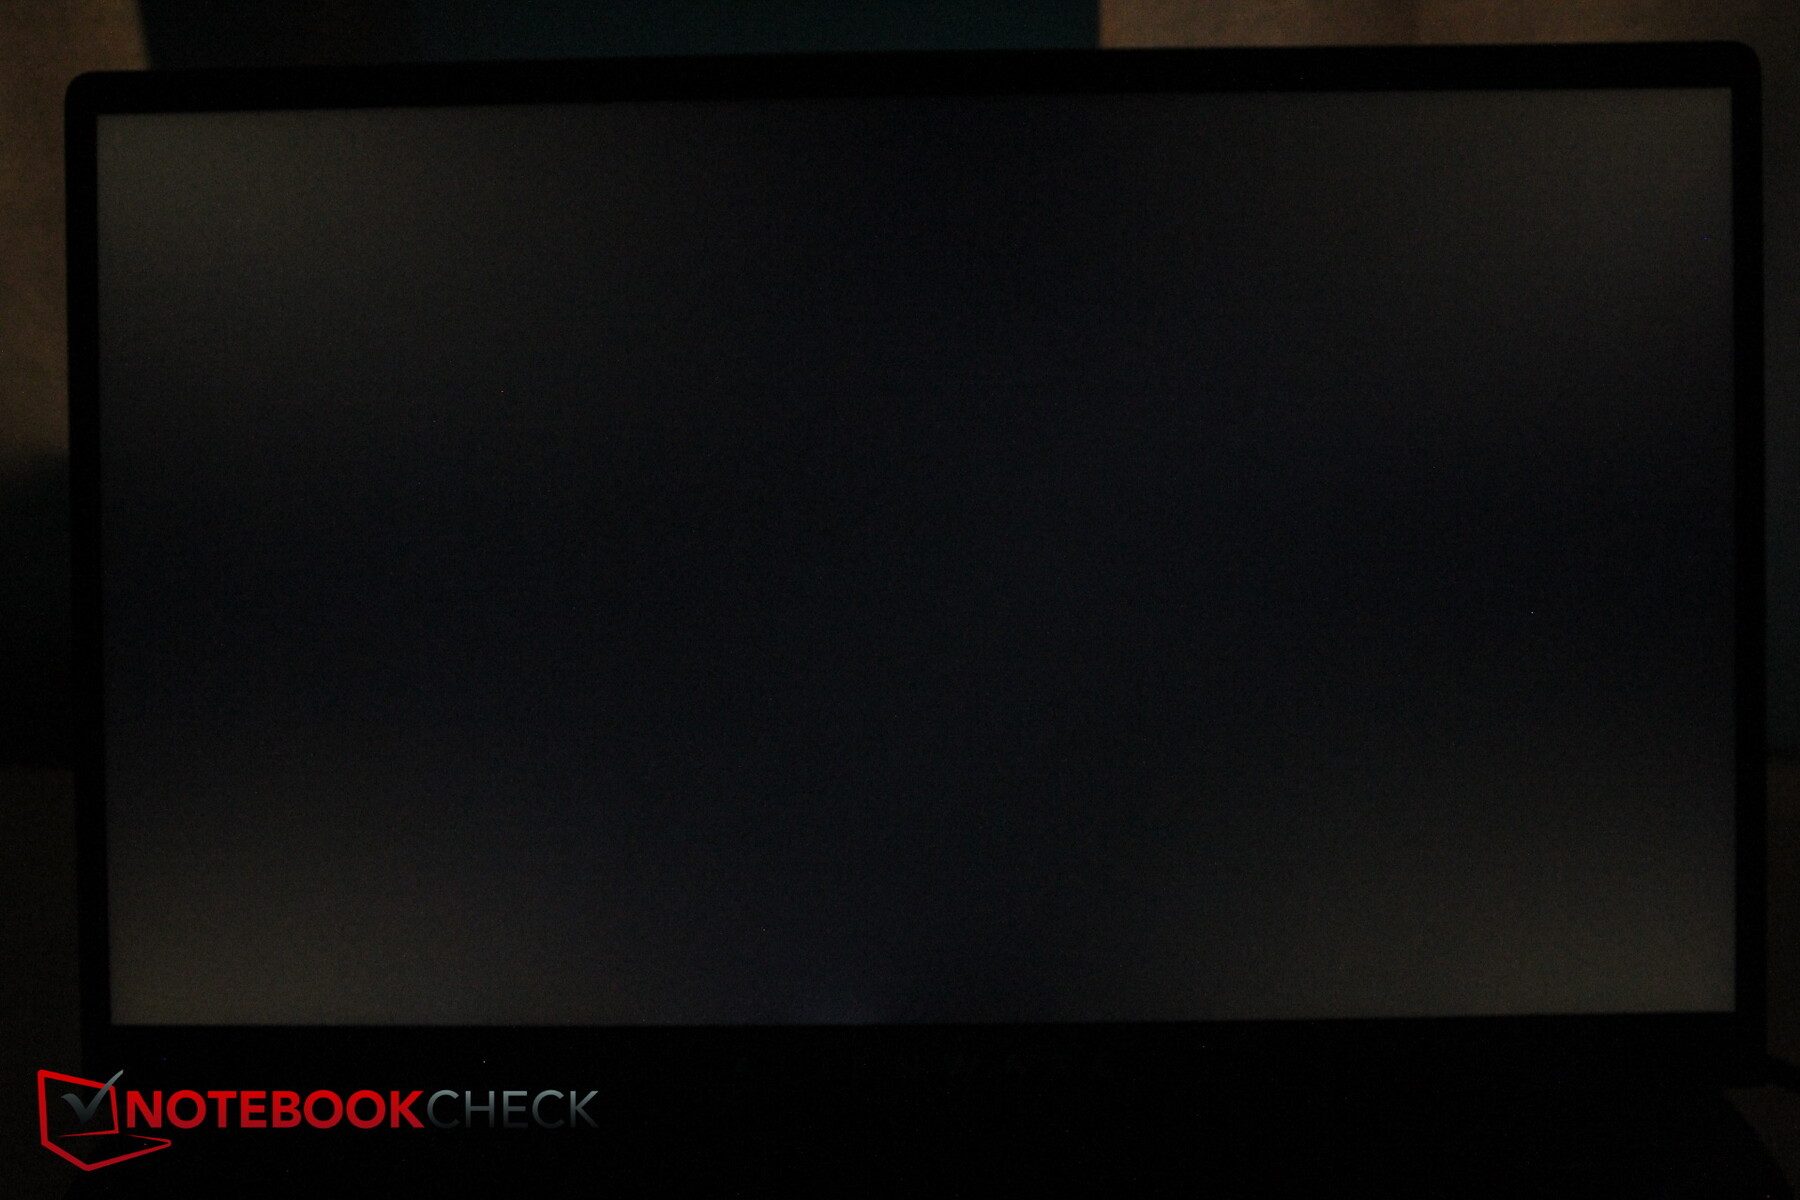
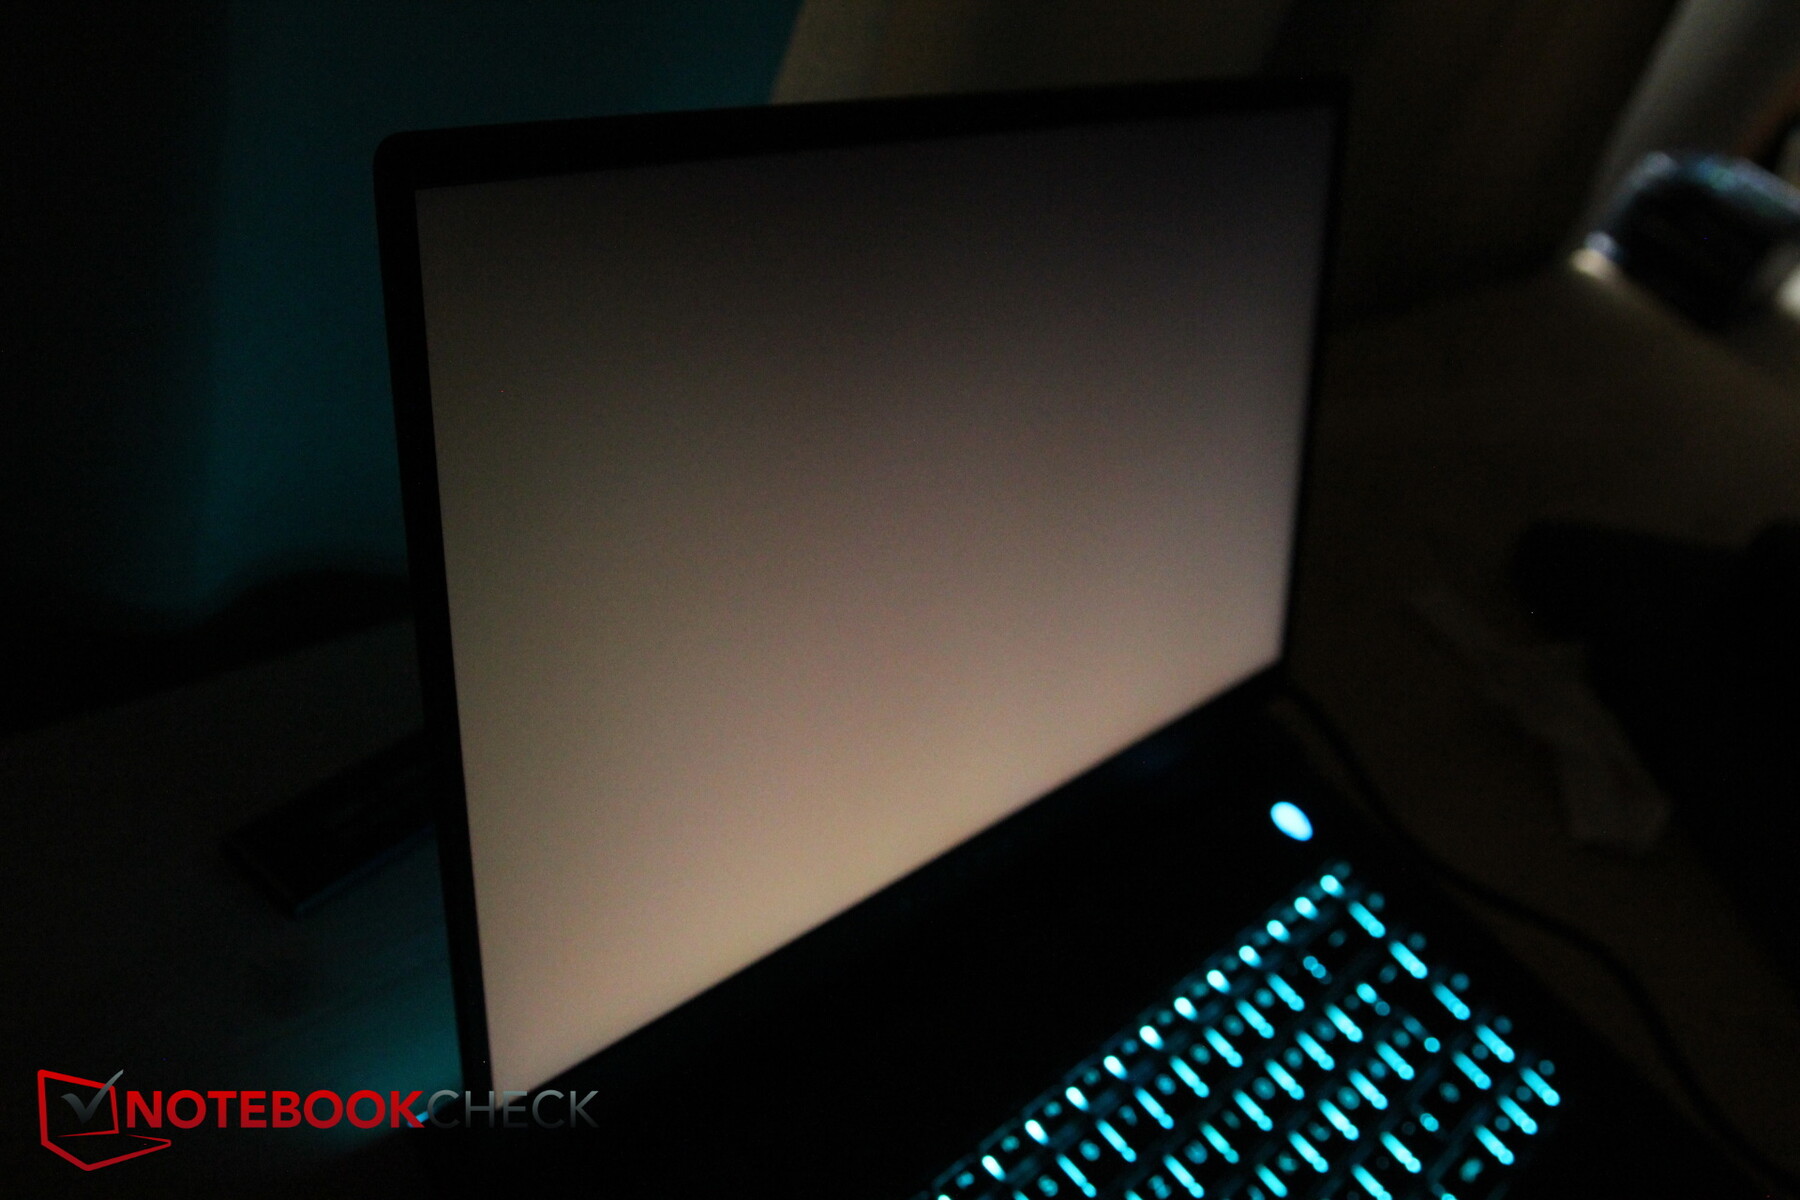
Det faktum att det inte är mycket sol under det här testet bidrar till att Alienwares bildskärmsinnehåll är lättare att läsa. Även vid branta betraktningsvinklar säkerställer den matta och ganska ljusa skärmen god läsbarhet, åtminstone under molniga dagar och i skuggan
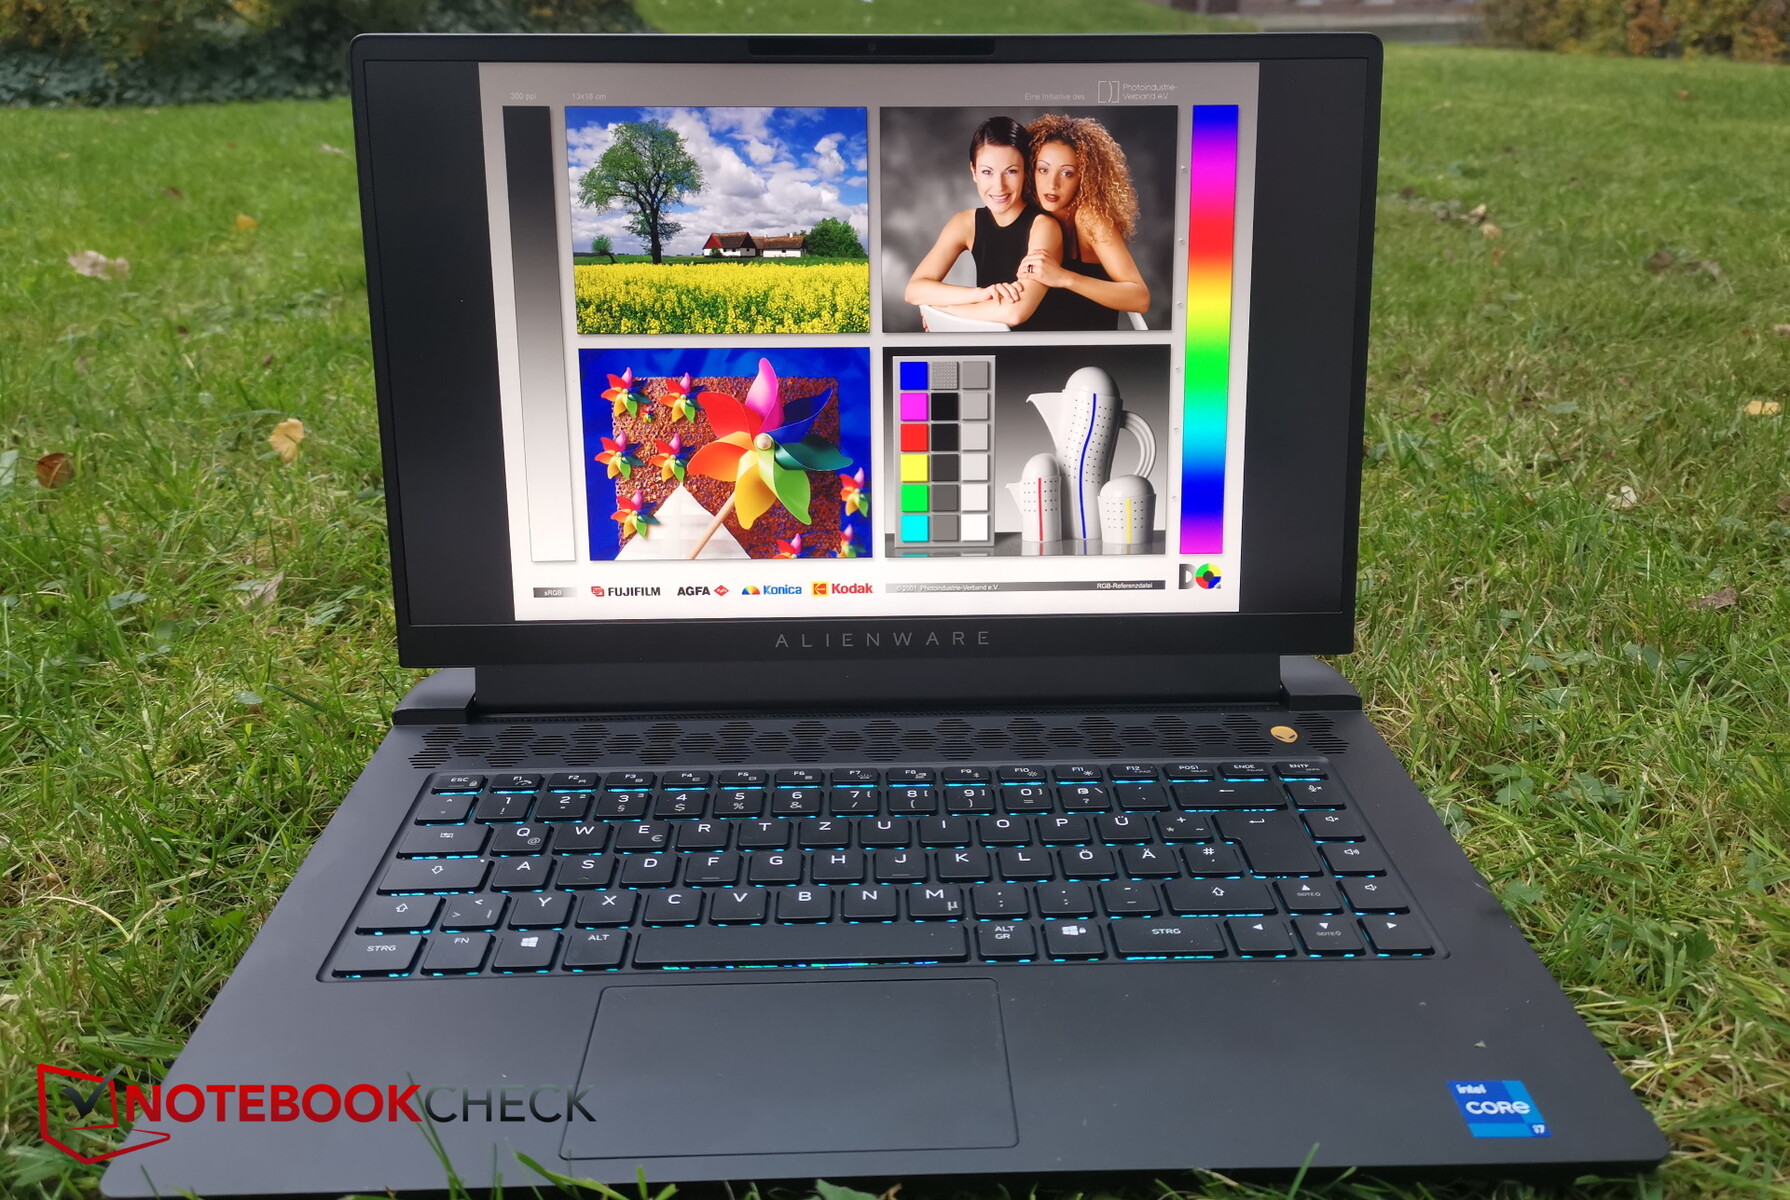
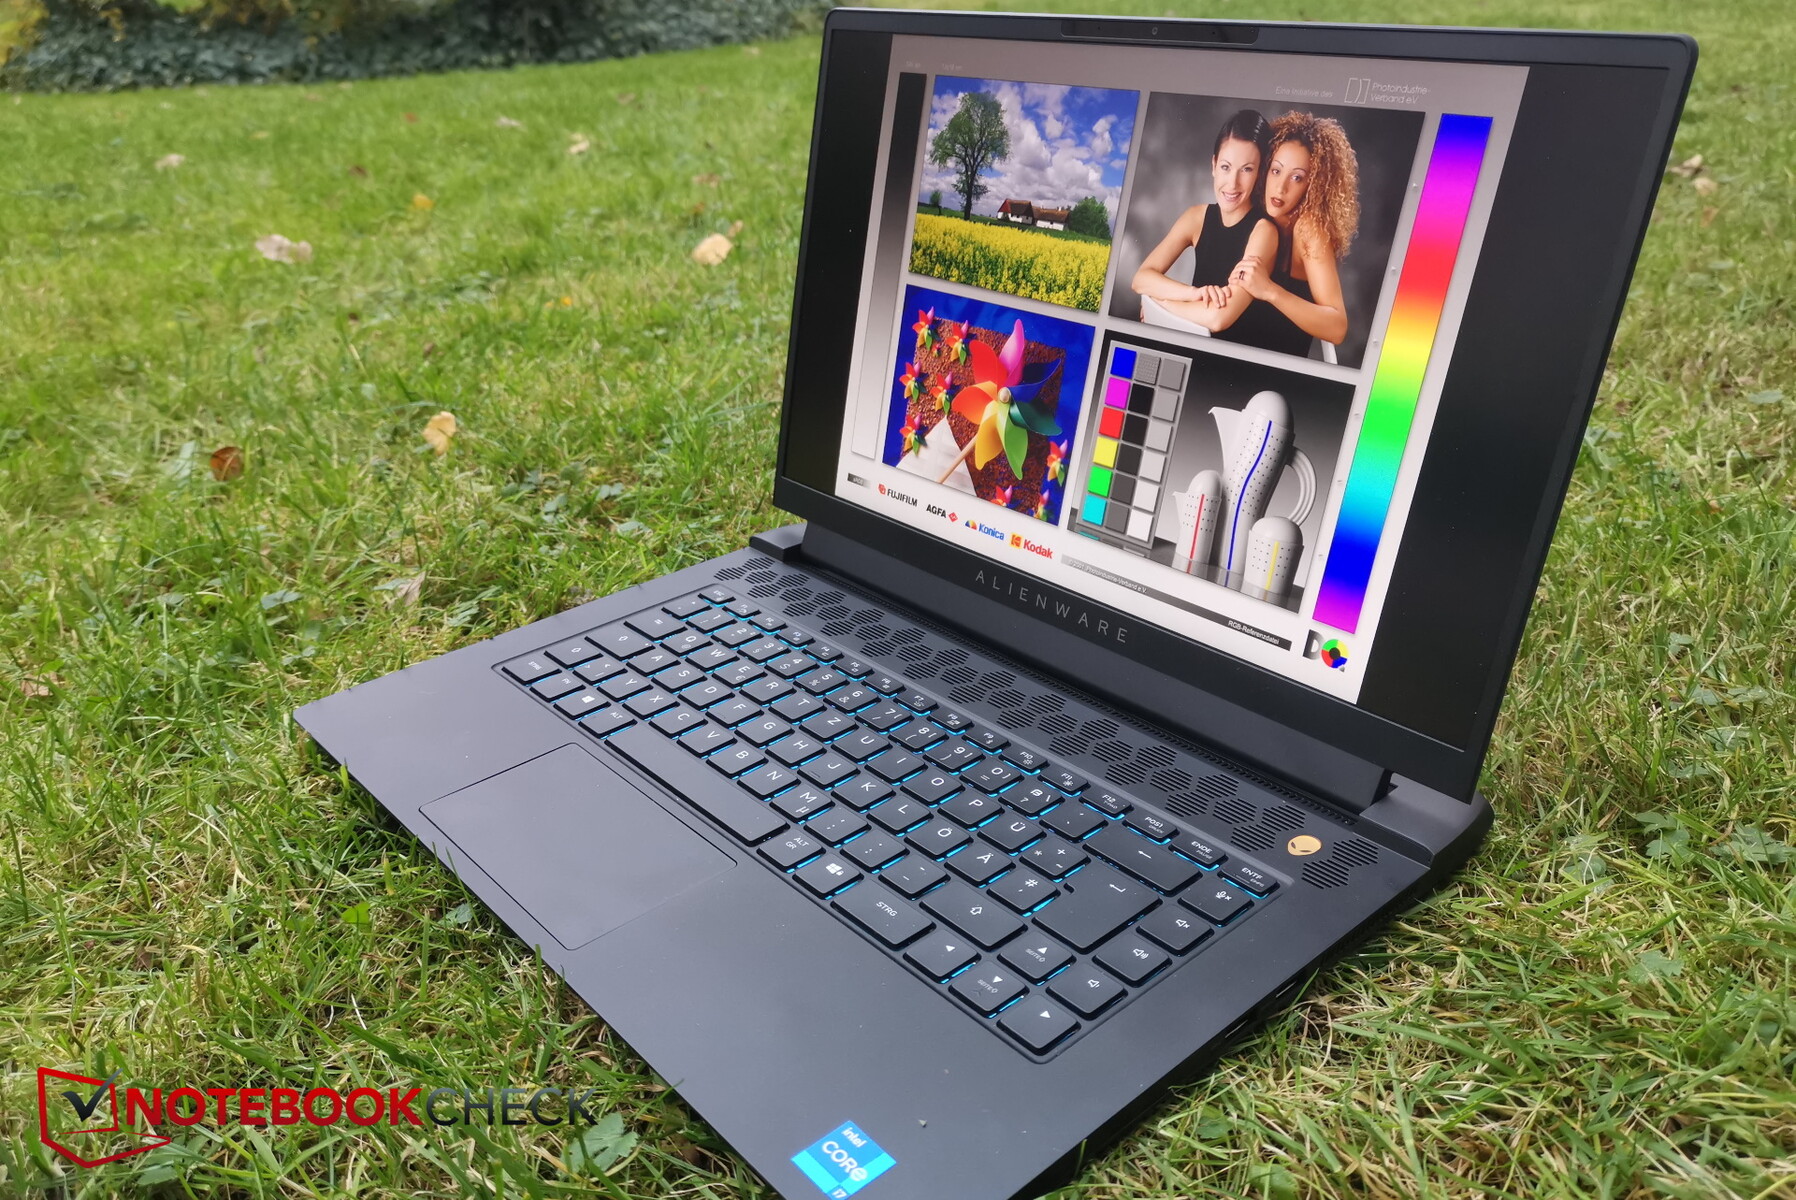
Som vanligt för IPS-skärmar är stabiliteten i betraktningsvinkeln mindre problematisk. Det är dock fortfarande märkbart att ljusstyrkan är bättre när man tittar direkt på skärmen än från branta betraktningsvinklar, men denna lilla minskning är fortfarande acceptabel.

Prestanda - Endast 125 W för RTX 3080
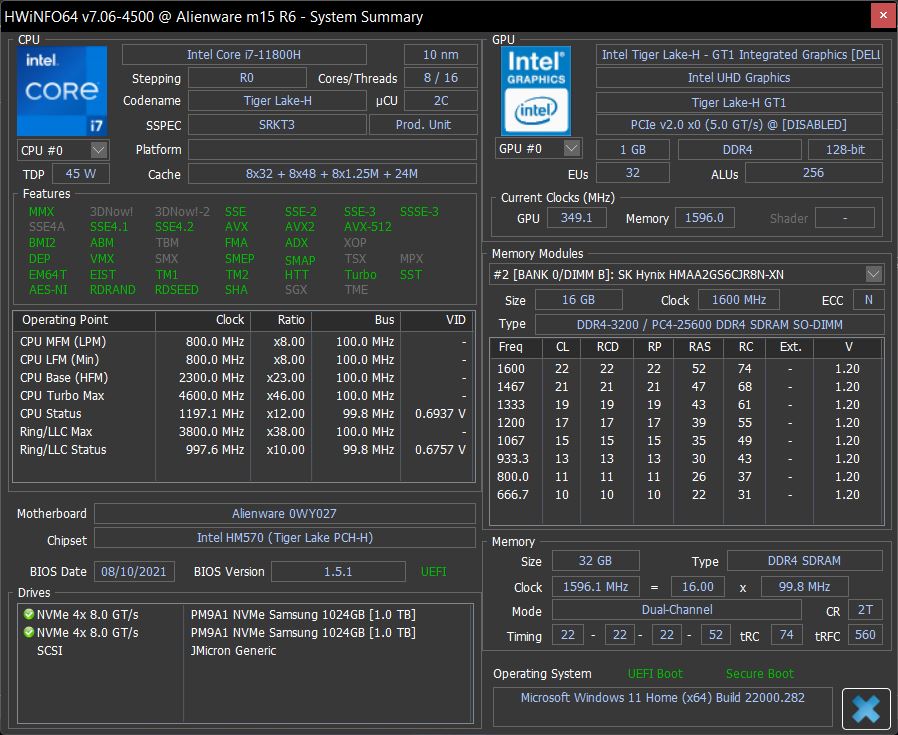
Med sinIntel Core i7-11800Hoch NVIDIA GeForce RTX 3080 Mobile GPUrepresenterar vår testenhet den övre delen av konfigurationen. Alternativt kan du också konfigurera Alienware, som helt klart kan betraktas som en bärbar dator för spel, med en RTX 3070 eller RTX 3060, och till och med med med en svagare Intel Core i5 11400HCPU
Testvillkor
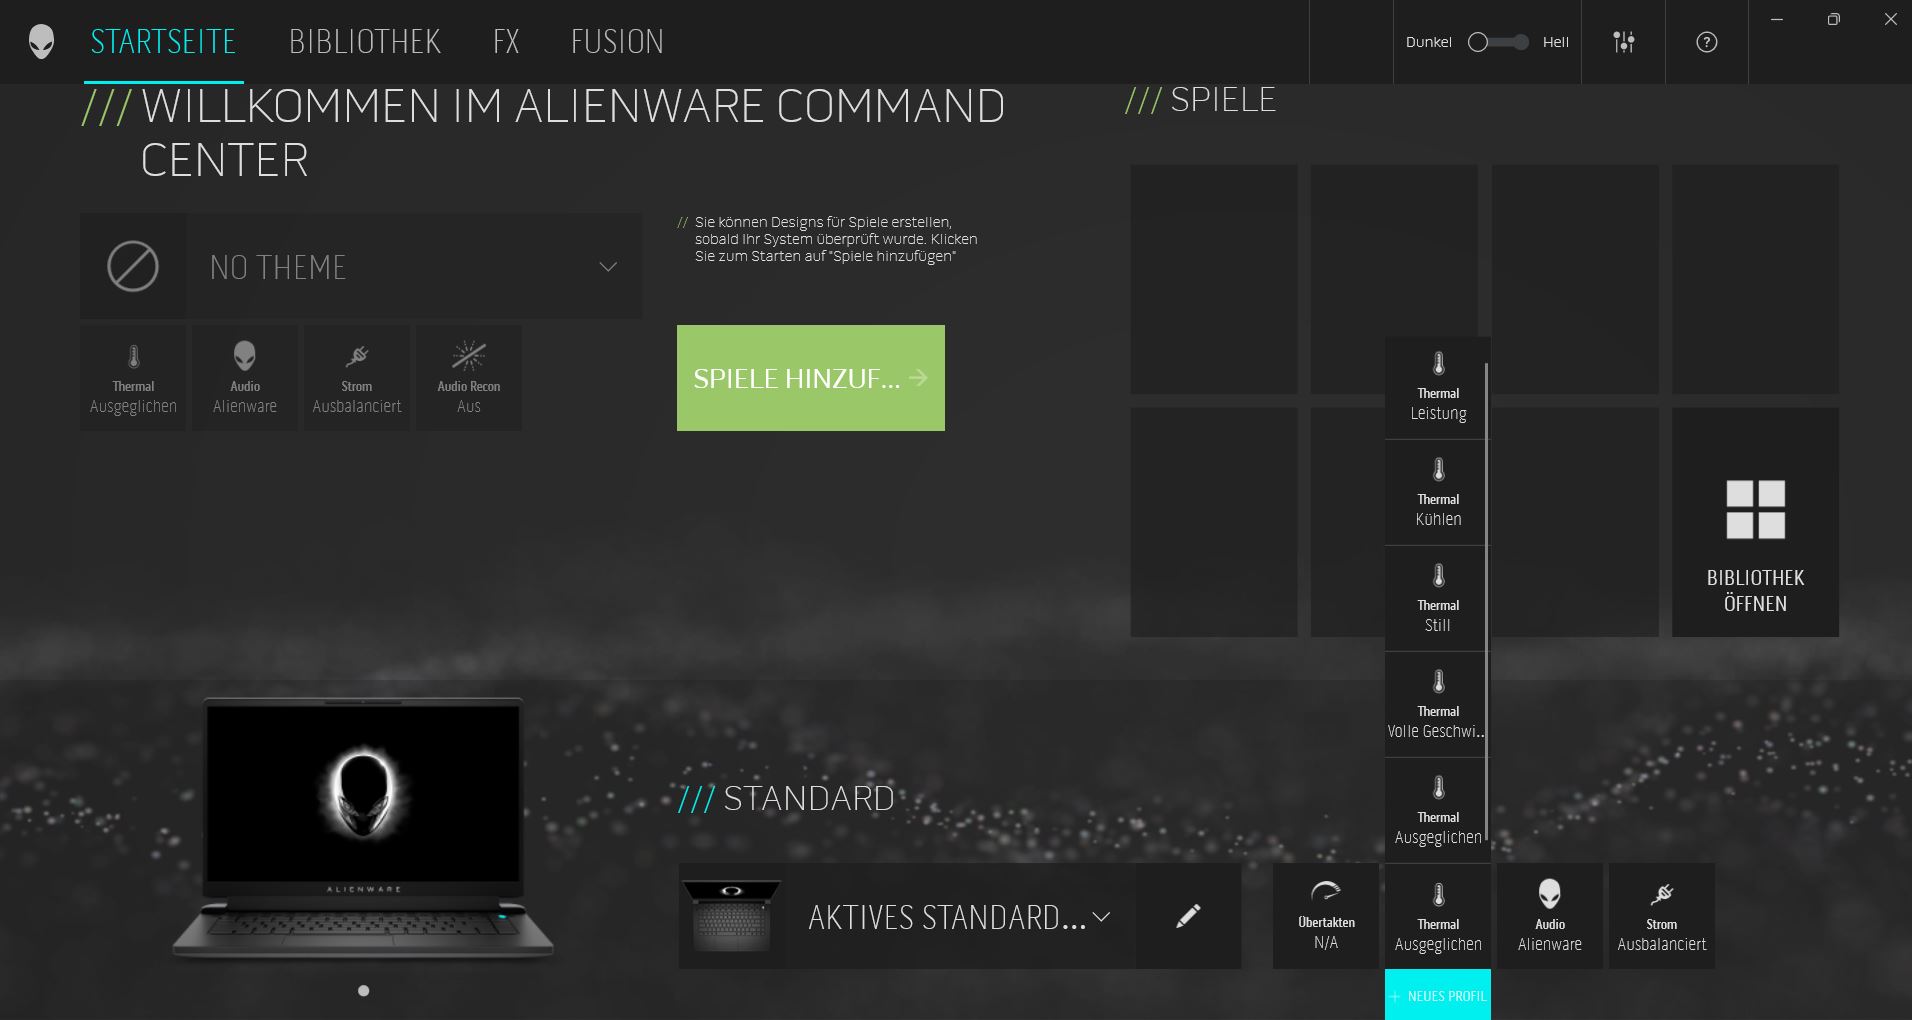
Alienware Command Center erbjuder många fläktprofiler med namn som inte är särskilt intuitiva, och lägesbeskrivningen genomförs endast genom ett system med små stjärnor. Vad kan skillnaderna mellan "Prestanda", "Full prestanda" och "Kylning" vara? Eftersom fläktarna alltid går på högvarv i alla tre lägena även vid tomgångsdrift ("Full Performance" är till och med högre än ljudet i "Performance"-läget) kör vi benchmarks och bullermätningar i "Balanced"-läget. Även om detta motsäger vår strategi att testa bärbara speldatorer med det högsta prestandaläget, kommer åtminstone bullermätningarna då att bli meningsfulla.
Alienware Command Center (ACC) behöver också särskilt lång tid för att slutföra laddningen vid varje systemstart. Även när subjektivt sett alla andra Windows-processer har laddat färdigt behöver ACC fortfarande mer tid. Även om du redan kan starta det kan du fortfarande inte välja fläktlägena i översikten på ganska lång tid
Alienwares beteende när man slår på den är också märkligt. När du trycker på strömbrytaren lyser den blått i flera sekunder, men sedan händer ingenting annat. Först när du trycker på knappen en andra gång startar den bärbara datorn verkligen upp - mycket irriterande!
Windows 11 är installerat som operativsystem, vilket fortfarande kan leda till problem med vissa benchmarks
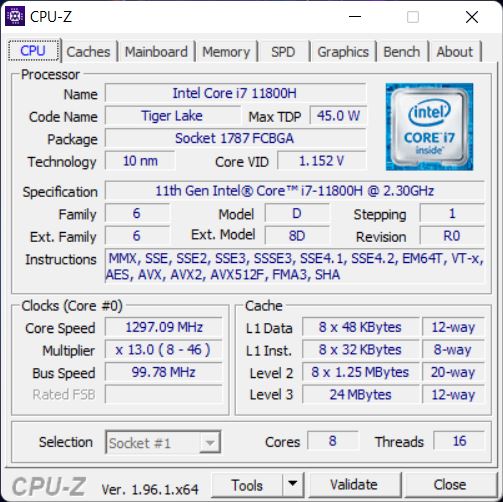
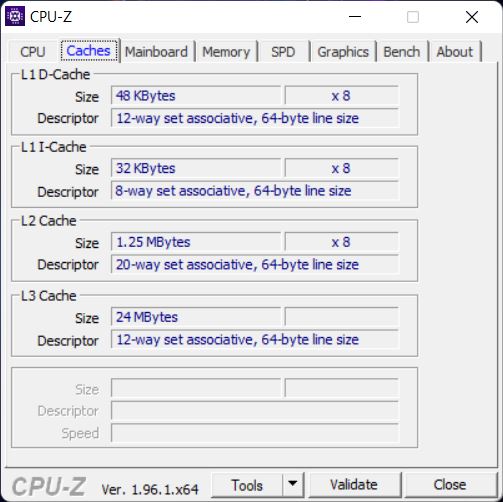
Processor
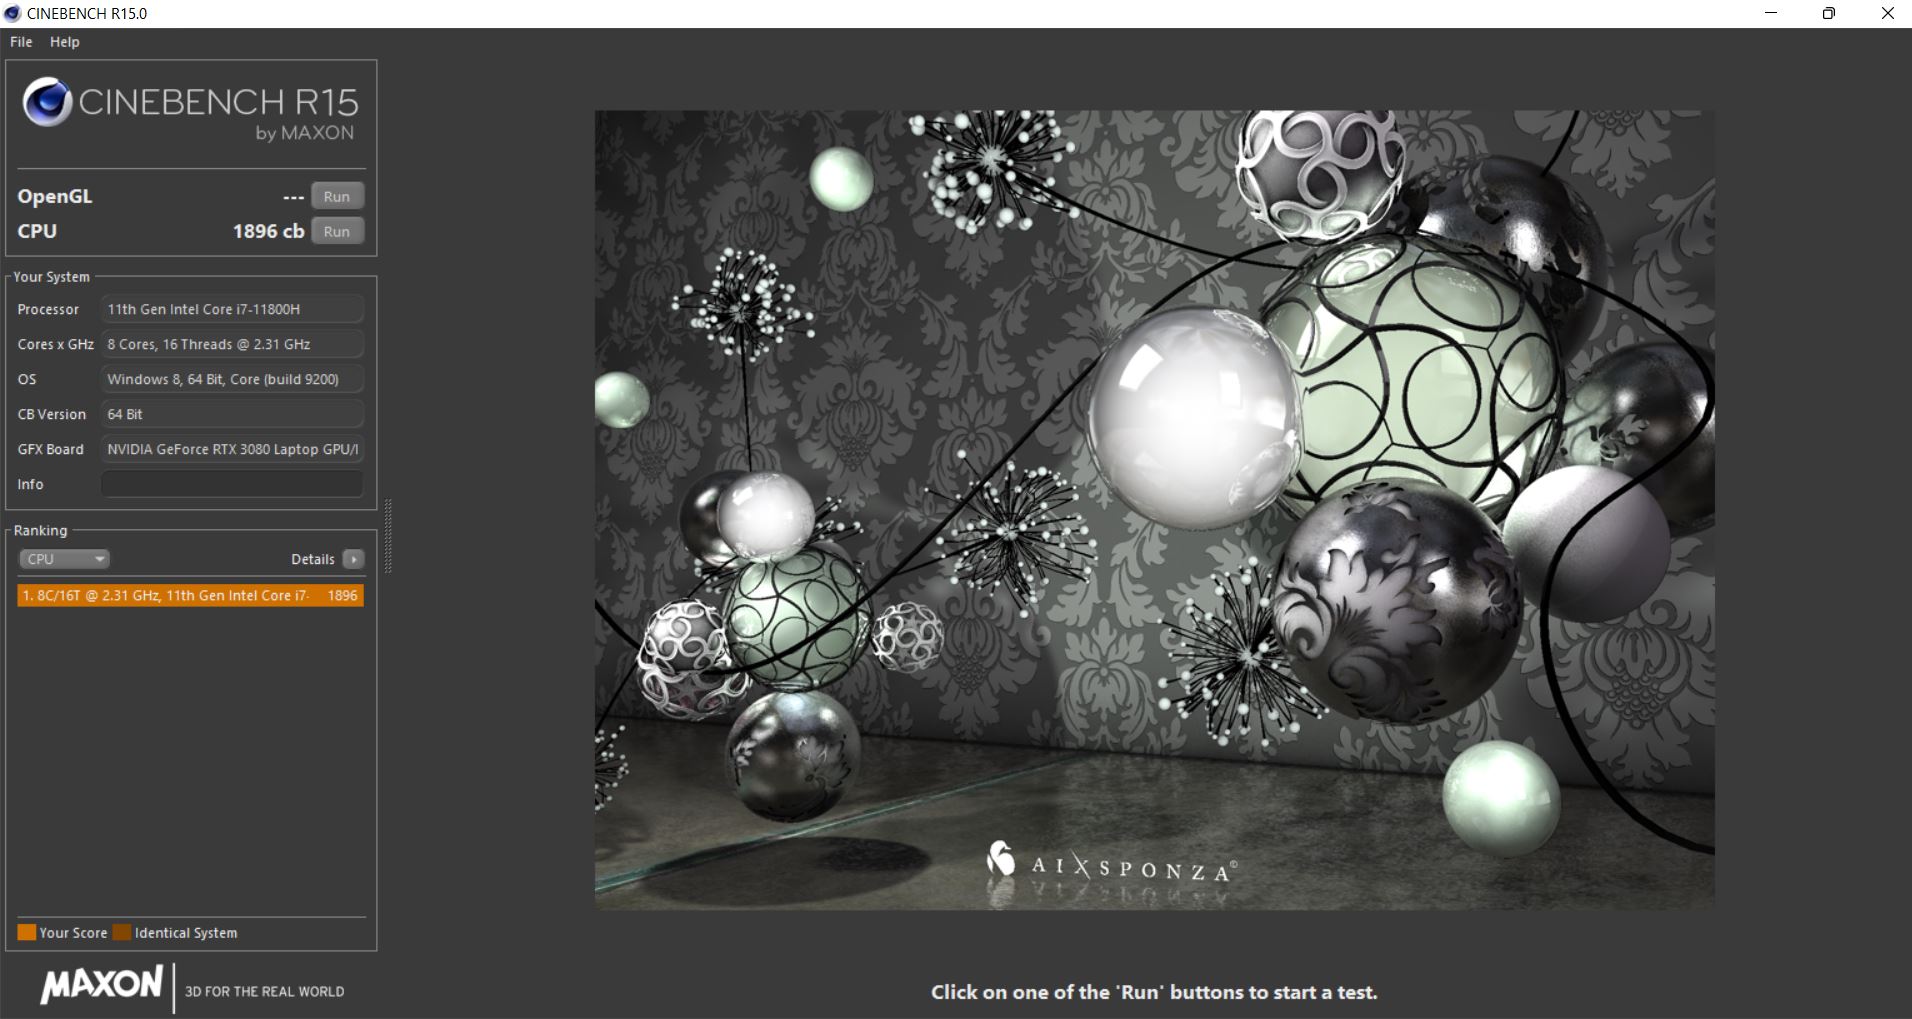
Intel Core i7-11800Hkommer från Tiger Lake -serien, och dess 8 kärnor kan nå klockfrekvenser mellan 2,3 och 4,6 GHz (Turbo med en kärna)
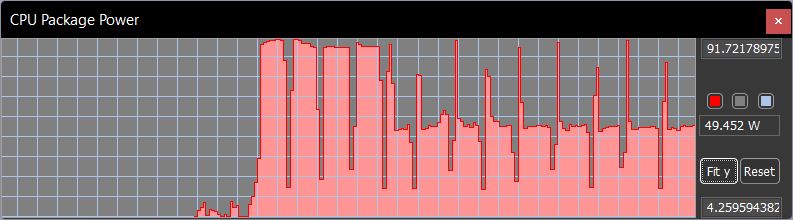
I Cinebench-slingan mäter vi en liten prestandaförlust efter de fyra första körningarna. Efter det är prestandan jämförbar med prestandan hos Intel Core i7-11800H i Aorus. Under de fyra första körningarna ligger TDP på cirka 90 watt. Därefter börjar det bli begränsat, och vid varje ny körning når TDP endast kortvarigt upp till maxvärdet för att sedan sjunka till cirka 50 watt
I den direkta jämförelsen levererar Core i7-11800H i Schenker den bästa prestandan, men för det mesta placerar sig Alienware cirka 5 % bakom.
I batteriläge sjunker Cinebench R15 CPU-prestanda endast med cirka 10 % jämfört med prestandan i början
Cinebench R15 Multi Constant Load Test
Cinebench R23: Multi Core | Single Core
Cinebench R20: CPU (Multi Core) | CPU (Single Core)
Cinebench R15: CPU Multi 64Bit | CPU Single 64Bit
Blender: v2.79 BMW27 CPU
7-Zip 18.03: 7z b 4 | 7z b 4 -mmt1
Geekbench 5.5: Multi-Core | Single-Core
HWBOT x265 Benchmark v2.2: 4k Preset
LibreOffice : 20 Documents To PDF
R Benchmark 2.5: Overall mean
| CPU Performance rating | |
| Genomsnitt av klass Gaming | |
| Schenker XMG Neo 15 Tiger Lake | |
| Alienware m15 R6, i7-11800H RTX 3080 | |
| Alienware m15 R5 Ryzen Edition | |
| Razer Blade 15 Advanced (Mid 2021) -2! | |
| Genomsnitt Intel Core i7-11800H | |
| Aorus 15P YD -2! | |
| Alienware m15 R4 RTX 3080 | |
| Cinebench R23 / Multi Core | |
| Genomsnitt av klass Gaming (10488 - 42661, n=107, senaste 2 åren) | |
| Schenker XMG Neo 15 Tiger Lake | |
| Alienware m15 R6, i7-11800H RTX 3080 | |
| Razer Blade 15 Advanced (Mid 2021) | |
| Alienware m15 R5 Ryzen Edition | |
| Genomsnitt Intel Core i7-11800H (6508 - 14088, n=48) | |
| Alienware m15 R4 RTX 3080 | |
| Cinebench R23 / Single Core | |
| Genomsnitt av klass Gaming (1166 - 2415, n=107, senaste 2 åren) | |
| Schenker XMG Neo 15 Tiger Lake | |
| Razer Blade 15 Advanced (Mid 2021) | |
| Genomsnitt Intel Core i7-11800H (1386 - 1522, n=45) | |
| Alienware m15 R6, i7-11800H RTX 3080 | |
| Alienware m15 R5 Ryzen Edition | |
| Alienware m15 R4 RTX 3080 | |
| Cinebench R20 / CPU (Multi Core) | |
| Genomsnitt av klass Gaming (4029 - 16433, n=106, senaste 2 åren) | |
| Schenker XMG Neo 15 Tiger Lake | |
| Aorus 15P YD | |
| Alienware m15 R5 Ryzen Edition | |
| Razer Blade 15 Advanced (Mid 2021) | |
| Alienware m15 R6, i7-11800H RTX 3080 | |
| Genomsnitt Intel Core i7-11800H (2498 - 5408, n=50) | |
| Alienware m15 R4 RTX 3080 | |
| Cinebench R20 / CPU (Single Core) | |
| Genomsnitt av klass Gaming (442 - 913, n=106, senaste 2 åren) | |
| Aorus 15P YD | |
| Razer Blade 15 Advanced (Mid 2021) | |
| Schenker XMG Neo 15 Tiger Lake | |
| Alienware m15 R6, i7-11800H RTX 3080 | |
| Genomsnitt Intel Core i7-11800H (520 - 586, n=47) | |
| Alienware m15 R5 Ryzen Edition | |
| Alienware m15 R4 RTX 3080 | |
| Cinebench R15 / CPU Multi 64Bit | |
| Genomsnitt av klass Gaming (1578 - 6330, n=105, senaste 2 åren) | |
| Schenker XMG Neo 15 Tiger Lake | |
| Alienware m15 R6, i7-11800H RTX 3080 | |
| Alienware m15 R5 Ryzen Edition | |
| Aorus 15P YD | |
| Genomsnitt Intel Core i7-11800H (1342 - 2173, n=50) | |
| Razer Blade 15 Advanced (Mid 2021) | |
| Alienware m15 R4 RTX 3080 | |
| Cinebench R15 / CPU Single 64Bit | |
| Genomsnitt av klass Gaming (188.8 - 350, n=106, senaste 2 åren) | |
| Alienware m15 R5 Ryzen Edition | |
| Aorus 15P YD | |
| Schenker XMG Neo 15 Tiger Lake | |
| Razer Blade 15 Advanced (Mid 2021) | |
| Alienware m15 R6, i7-11800H RTX 3080 | |
| Genomsnitt Intel Core i7-11800H (201 - 231, n=46) | |
| Alienware m15 R4 RTX 3080 | |
| Blender / v2.79 BMW27 CPU | |
| Aorus 15P YD | |
| Alienware m15 R4 RTX 3080 | |
| Genomsnitt Intel Core i7-11800H (217 - 454, n=46) | |
| Alienware m15 R6, i7-11800H RTX 3080 | |
| Razer Blade 15 Advanced (Mid 2021) | |
| Alienware m15 R5 Ryzen Edition | |
| Schenker XMG Neo 15 Tiger Lake | |
| Genomsnitt av klass Gaming (79 - 330, n=104, senaste 2 åren) | |
| 7-Zip 18.03 / 7z b 4 | |
| Genomsnitt av klass Gaming (33491 - 148086, n=105, senaste 2 åren) | |
| Schenker XMG Neo 15 Tiger Lake | |
| Alienware m15 R5 Ryzen Edition | |
| Razer Blade 15 Advanced (Mid 2021) | |
| Alienware m15 R6, i7-11800H RTX 3080 | |
| Alienware m15 R4 RTX 3080 | |
| Genomsnitt Intel Core i7-11800H (33718 - 56758, n=46) | |
| Aorus 15P YD | |
| 7-Zip 18.03 / 7z b 4 -mmt1 | |
| Genomsnitt av klass Gaming (4199 - 7436, n=105, senaste 2 åren) | |
| Schenker XMG Neo 15 Tiger Lake | |
| Alienware m15 R5 Ryzen Edition | |
| Aorus 15P YD | |
| Genomsnitt Intel Core i7-11800H (5138 - 5732, n=46) | |
| Razer Blade 15 Advanced (Mid 2021) | |
| Alienware m15 R6, i7-11800H RTX 3080 | |
| Alienware m15 R4 RTX 3080 | |
| Geekbench 5.5 / Multi-Core | |
| Genomsnitt av klass Gaming (6460 - 28263, n=105, senaste 2 åren) | |
| Schenker XMG Neo 15 Tiger Lake | |
| Alienware m15 R6, i7-11800H RTX 3080 | |
| Aorus 15P YD | |
| Genomsnitt Intel Core i7-11800H (4655 - 9851, n=40) | |
| Alienware m15 R4 RTX 3080 | |
| Alienware m15 R5 Ryzen Edition | |
| Geekbench 5.5 / Single-Core | |
| Genomsnitt av klass Gaming (986 - 2474, n=105, senaste 2 åren) | |
| Schenker XMG Neo 15 Tiger Lake | |
| Aorus 15P YD | |
| Alienware m15 R6, i7-11800H RTX 3080 | |
| Genomsnitt Intel Core i7-11800H (1429 - 1625, n=40) | |
| Alienware m15 R5 Ryzen Edition | |
| Alienware m15 R4 RTX 3080 | |
| HWBOT x265 Benchmark v2.2 / 4k Preset | |
| Genomsnitt av klass Gaming (11.5 - 44.4, n=105, senaste 2 åren) | |
| Schenker XMG Neo 15 Tiger Lake | |
| Razer Blade 15 Advanced (Mid 2021) | |
| Alienware m15 R5 Ryzen Edition | |
| Genomsnitt Intel Core i7-11800H (7.38 - 17.4, n=46) | |
| Alienware m15 R6, i7-11800H RTX 3080 | |
| Alienware m15 R4 RTX 3080 | |
| Aorus 15P YD | |
| LibreOffice / 20 Documents To PDF | |
| Alienware m15 R4 RTX 3080 | |
| Alienware m15 R5 Ryzen Edition | |
| Genomsnitt av klass Gaming (33.2 - 88.8, n=105, senaste 2 åren) | |
| Schenker XMG Neo 15 Tiger Lake | |
| Genomsnitt Intel Core i7-11800H (38.6 - 59.9, n=45) | |
| Razer Blade 15 Advanced (Mid 2021) | |
| Alienware m15 R6, i7-11800H RTX 3080 | |
| Aorus 15P YD | |
| R Benchmark 2.5 / Overall mean | |
| Alienware m15 R4 RTX 3080 | |
| Genomsnitt Intel Core i7-11800H (0.548 - 0.615, n=46) | |
| Aorus 15P YD | |
| Alienware m15 R6, i7-11800H RTX 3080 | |
| Schenker XMG Neo 15 Tiger Lake | |
| Razer Blade 15 Advanced (Mid 2021) | |
| Alienware m15 R5 Ryzen Edition | |
| Genomsnitt av klass Gaming (0.3439 - 0.759, n=106, senaste 2 åren) | |
* ... mindre är bättre
AIDA64: FP32 Ray-Trace | FPU Julia | CPU SHA3 | CPU Queen | FPU SinJulia | FPU Mandel | CPU AES | CPU ZLib | FP64 Ray-Trace | CPU PhotoWorxx
| Performance rating | |
| Genomsnitt av klass Gaming | |
| Alienware m15 R6, i7-11800H RTX 3080 | |
| Alienware m15 R5 Ryzen Edition | |
| Genomsnitt Intel Core i7-11800H | |
| Alienware m15 R4 RTX 3080 | |
| Aorus 15P YD -9! | |
| Schenker XMG Neo 15 Tiger Lake -9! | |
| Razer Blade 15 Advanced (Mid 2021) -9! | |
| AIDA64 / FP32 Ray-Trace | |
| Genomsnitt av klass Gaming (10227 - 85542, n=105, senaste 2 åren) | |
| Alienware m15 R6, i7-11800H RTX 3080 | |
| Alienware m15 R5 Ryzen Edition | |
| Alienware m15 R4 RTX 3080 | |
| Genomsnitt Intel Core i7-11800H (8772 - 15961, n=20) | |
| AIDA64 / FPU Julia | |
| Genomsnitt av klass Gaming (51376 - 238426, n=105, senaste 2 åren) | |
| Alienware m15 R5 Ryzen Edition | |
| Alienware m15 R4 RTX 3080 | |
| Alienware m15 R6, i7-11800H RTX 3080 | |
| Genomsnitt Intel Core i7-11800H (39404 - 65636, n=20) | |
| AIDA64 / CPU SHA3 | |
| Genomsnitt av klass Gaming (2180 - 10115, n=105, senaste 2 åren) | |
| Alienware m15 R6, i7-11800H RTX 3080 | |
| Genomsnitt Intel Core i7-11800H (2599 - 4439, n=20) | |
| Alienware m15 R4 RTX 3080 | |
| Alienware m15 R5 Ryzen Edition | |
| AIDA64 / CPU Queen | |
| Genomsnitt av klass Gaming (49785 - 173351, n=90, senaste 2 åren) | |
| Alienware m15 R5 Ryzen Edition | |
| Alienware m15 R4 RTX 3080 | |
| Alienware m15 R6, i7-11800H RTX 3080 | |
| Genomsnitt Intel Core i7-11800H (85233 - 91941, n=20) | |
| AIDA64 / FPU SinJulia | |
| Genomsnitt av klass Gaming (4424 - 33636, n=105, senaste 2 åren) | |
| Alienware m15 R5 Ryzen Edition | |
| Alienware m15 R4 RTX 3080 | |
| Alienware m15 R6, i7-11800H RTX 3080 | |
| Genomsnitt Intel Core i7-11800H (6420 - 9792, n=20) | |
| AIDA64 / FPU Mandel | |
| Genomsnitt av klass Gaming (25115 - 128721, n=105, senaste 2 åren) | |
| Alienware m15 R5 Ryzen Edition | |
| Alienware m15 R6, i7-11800H RTX 3080 | |
| Genomsnitt Intel Core i7-11800H (23365 - 39464, n=20) | |
| Alienware m15 R4 RTX 3080 | |
| AIDA64 / CPU AES | |
| Alienware m15 R6, i7-11800H RTX 3080 | |
| Genomsnitt Intel Core i7-11800H (74617 - 149388, n=20) | |
| Alienware m15 R5 Ryzen Edition | |
| Genomsnitt av klass Gaming (39258 - 247074, n=105, senaste 2 åren) | |
| Alienware m15 R4 RTX 3080 | |
| AIDA64 / CPU ZLib | |
| Genomsnitt av klass Gaming (574 - 2531, n=105, senaste 2 åren) | |
| Alienware m15 R6, i7-11800H RTX 3080 | |
| Alienware m15 R5 Ryzen Edition | |
| Alienware m15 R4 RTX 3080 | |
| Genomsnitt Intel Core i7-11800H (461 - 830, n=43) | |
| Aorus 15P YD | |
| Schenker XMG Neo 15 Tiger Lake | |
| Razer Blade 15 Advanced (Mid 2021) | |
| AIDA64 / FP64 Ray-Trace | |
| Genomsnitt av klass Gaming (5509 - 45446, n=105, senaste 2 åren) | |
| Alienware m15 R6, i7-11800H RTX 3080 | |
| Alienware m15 R5 Ryzen Edition | |
| Alienware m15 R4 RTX 3080 | |
| Genomsnitt Intel Core i7-11800H (4545 - 8717, n=21) | |
| AIDA64 / CPU PhotoWorxx | |
| Genomsnitt av klass Gaming (12271 - 89891, n=105, senaste 2 åren) | |
| Alienware m15 R6, i7-11800H RTX 3080 | |
| Genomsnitt Intel Core i7-11800H (11898 - 26757, n=21) | |
| Alienware m15 R4 RTX 3080 | |
| Alienware m15 R5 Ryzen Edition | |
Systemets prestanda
PCMark 10-jämförelsen skiljer inte konkurrenterna särskilt väl från varandra, åtminstone inte i den totala poängen. Razer Blade verkar ligga något före i deltesterna, men Alienware utmanar den och ligger fortfarande cirka 5 % efter bara i Essentials benchmark
| PCMark 10 / Score | |
| Genomsnitt av klass Gaming (5828 - 12414, n=93, senaste 2 åren) | |
| Razer Blade 15 Advanced (Mid 2021) | |
| Aorus 15P YD | |
| Schenker XMG Neo 15 Tiger Lake | |
| Alienware m15 R6, i7-11800H RTX 3080 | |
| Genomsnitt Intel Core i7-11800H, NVIDIA GeForce RTX 3080 Laptop GPU (6673 - 7470, n=11) | |
| Alienware m15 R4 RTX 3080 | |
| Alienware m15 R5 Ryzen Edition | |
| PCMark 10 / Essentials | |
| Razer Blade 15 Advanced (Mid 2021) | |
| Genomsnitt av klass Gaming (8810 - 11935, n=97, senaste 2 åren) | |
| Aorus 15P YD | |
| Genomsnitt Intel Core i7-11800H, NVIDIA GeForce RTX 3080 Laptop GPU (9862 - 11064, n=11) | |
| Schenker XMG Neo 15 Tiger Lake | |
| Alienware m15 R6, i7-11800H RTX 3080 | |
| Alienware m15 R4 RTX 3080 | |
| Alienware m15 R5 Ryzen Edition | |
| PCMark 10 / Productivity | |
| Genomsnitt av klass Gaming (6845 - 25323, n=95, senaste 2 åren) | |
| Alienware m15 R6, i7-11800H RTX 3080 | |
| Alienware m15 R4 RTX 3080 | |
| Aorus 15P YD | |
| Genomsnitt Intel Core i7-11800H, NVIDIA GeForce RTX 3080 Laptop GPU (8278 - 9803, n=11) | |
| Razer Blade 15 Advanced (Mid 2021) | |
| Schenker XMG Neo 15 Tiger Lake | |
| Alienware m15 R5 Ryzen Edition | |
| PCMark 10 / Digital Content Creation | |
| Genomsnitt av klass Gaming (7602 - 19954, n=95, senaste 2 åren) | |
| Schenker XMG Neo 15 Tiger Lake | |
| Razer Blade 15 Advanced (Mid 2021) | |
| Alienware m15 R6, i7-11800H RTX 3080 | |
| Genomsnitt Intel Core i7-11800H, NVIDIA GeForce RTX 3080 Laptop GPU (9881 - 11323, n=11) | |
| Aorus 15P YD | |
| Alienware m15 R4 RTX 3080 | |
| Alienware m15 R5 Ryzen Edition | |
| PCMark 10 Score | 7177 poäng | |
Hjälp | ||
| AIDA64 / Memory Copy | |
| Genomsnitt av klass Gaming (21750 - 129946, n=105, senaste 2 åren) | |
| Alienware m15 R6, i7-11800H RTX 3080 | |
| Genomsnitt Intel Core i7-11800H (24508 - 48144, n=21) | |
| Alienware m15 R5 Ryzen Edition | |
| Alienware m15 R4 RTX 3080 | |
| AIDA64 / Memory Read | |
| Genomsnitt av klass Gaming (22956 - 118858, n=105, senaste 2 åren) | |
| Alienware m15 R6, i7-11800H RTX 3080 | |
| Genomsnitt Intel Core i7-11800H (25882 - 50365, n=20) | |
| Alienware m15 R5 Ryzen Edition | |
| Alienware m15 R4 RTX 3080 | |
| AIDA64 / Memory Write | |
| Genomsnitt av klass Gaming (22297 - 135096, n=105, senaste 2 åren) | |
| Alienware m15 R6, i7-11800H RTX 3080 | |
| Genomsnitt Intel Core i7-11800H (22240 - 46214, n=20) | |
| Alienware m15 R4 RTX 3080 | |
| Alienware m15 R5 Ryzen Edition | |
| AIDA64 / Memory Latency | |
| Genomsnitt av klass Gaming (75.3 - 259, n=105, senaste 2 åren) | |
| Alienware m15 R6, i7-11800H RTX 3080 | |
| Alienware m15 R5 Ryzen Edition | |
| Alienware m15 R4 RTX 3080 | |
| Genomsnitt Intel Core i7-11800H (71.9 - 104.1, n=44) | |
| Aorus 15P YD | |
| Schenker XMG Neo 15 Tiger Lake | |
| Razer Blade 15 Advanced (Mid 2021) | |
* ... mindre är bättre
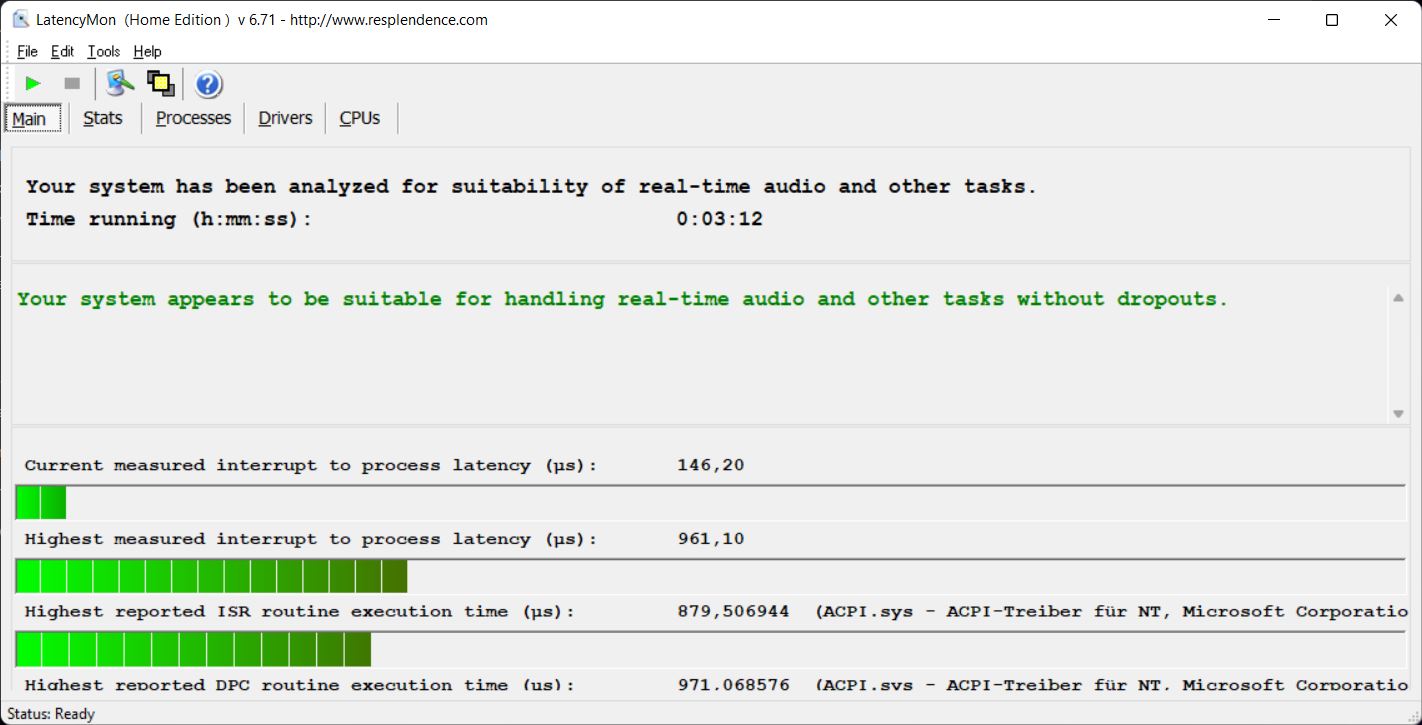
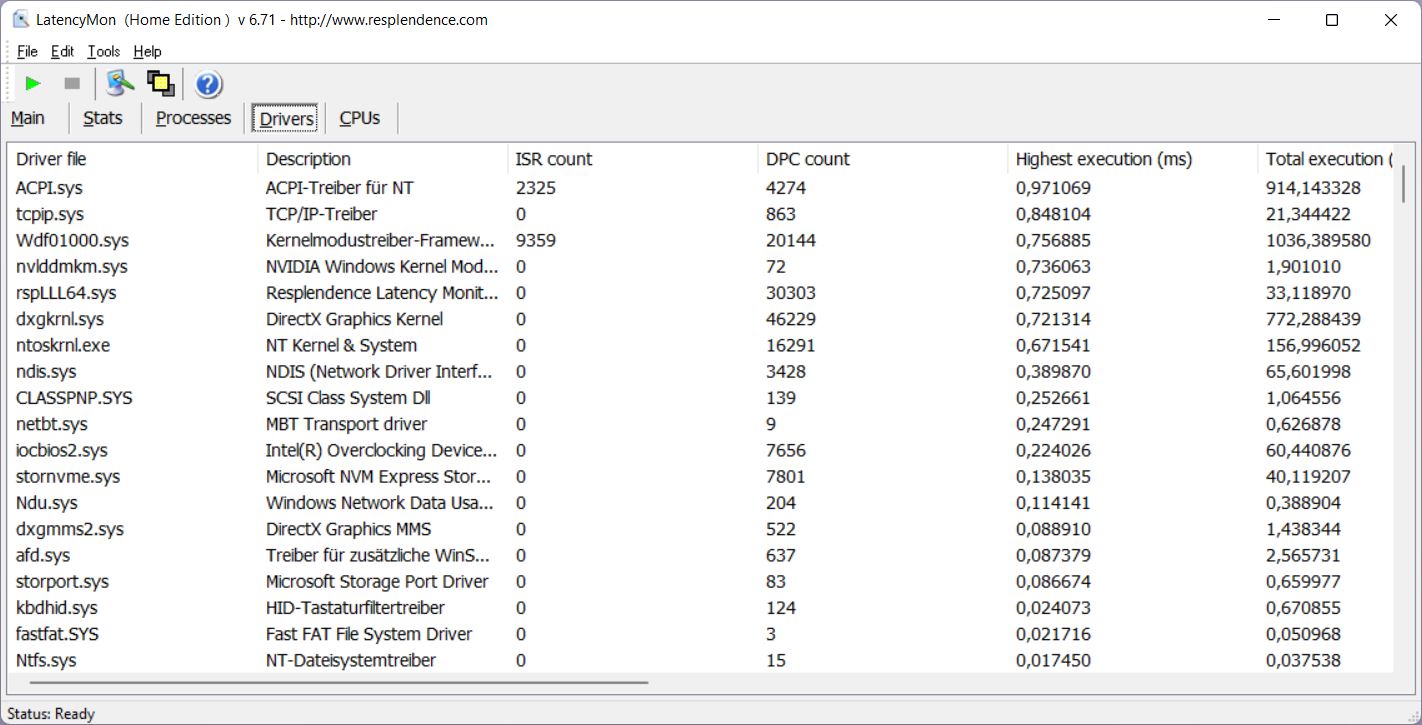
DPC-latenstider
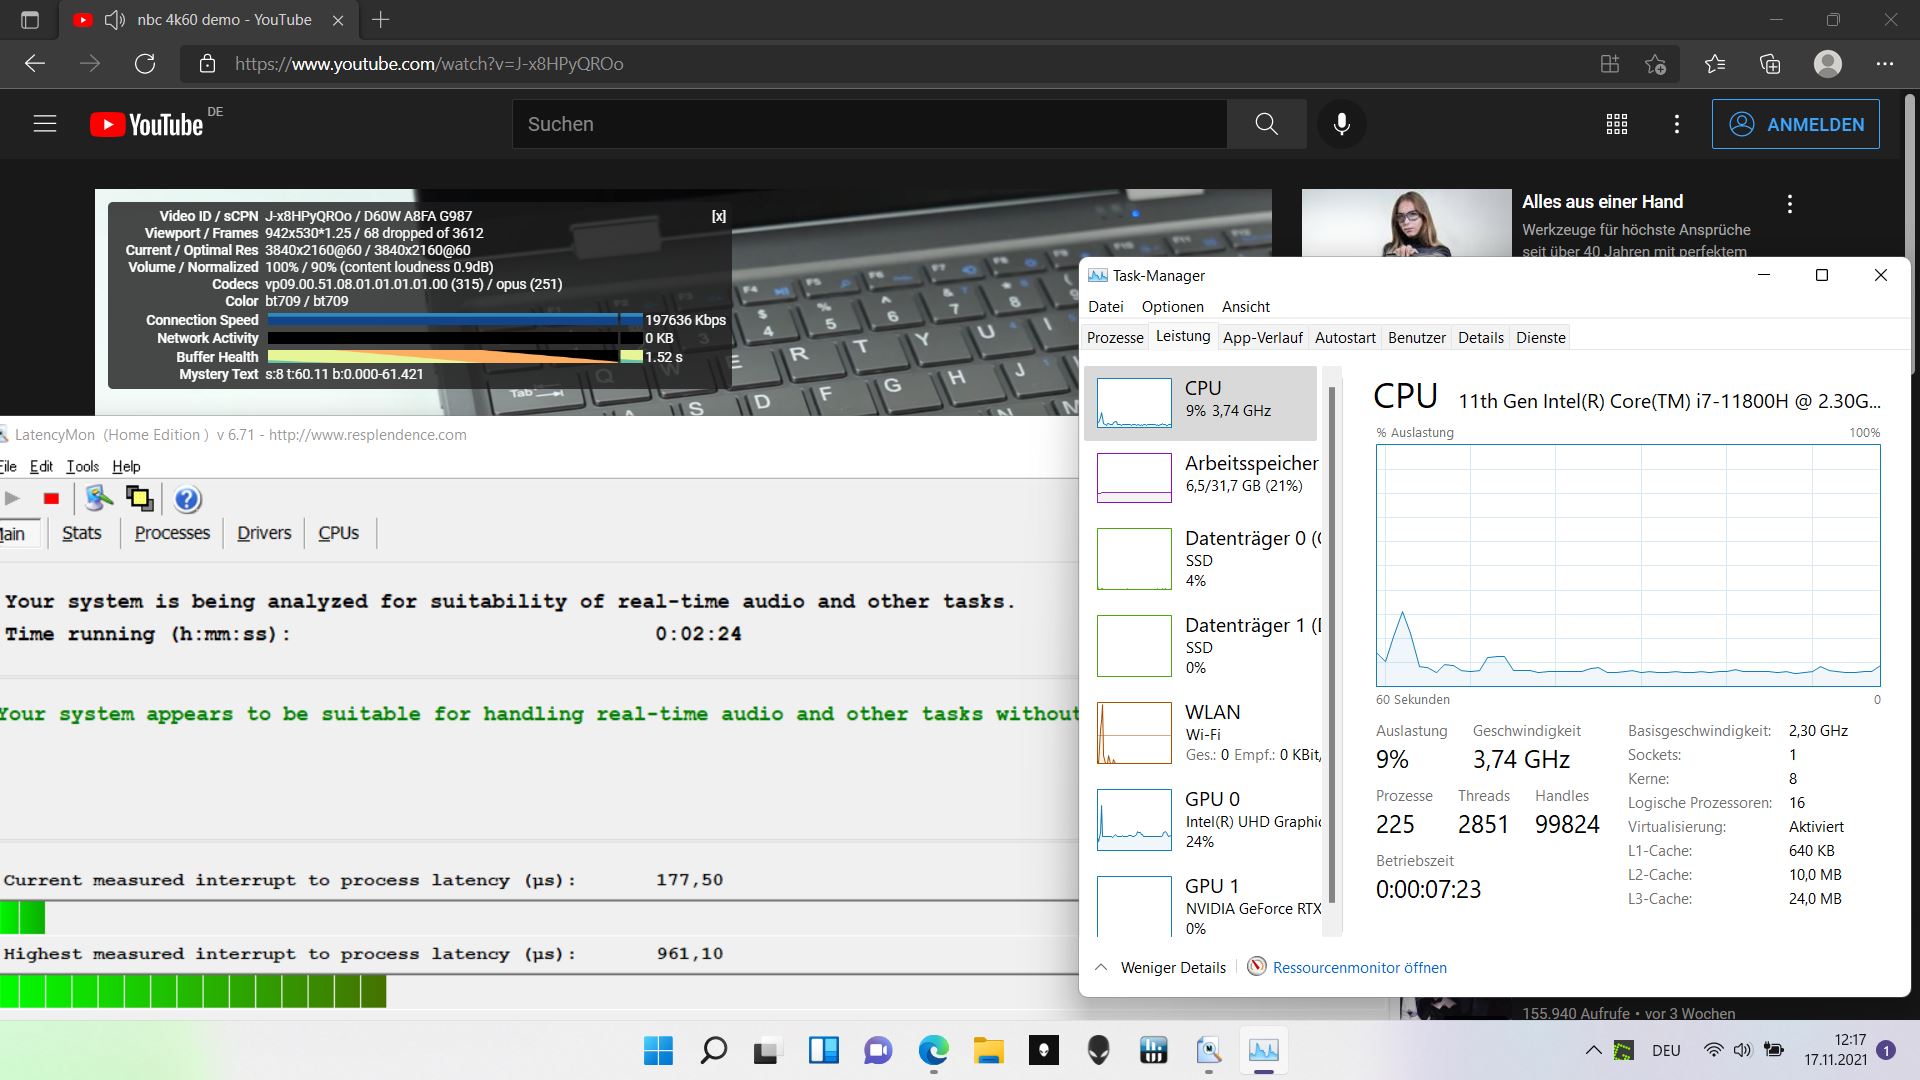
LatencyMon-verktyget upptäcker inga betydande fördröjningar, varken när man öppnar flera webbläsarflikar, strömmar videor eller belastar processorn via Prime95. Å andra sidan återgavs vår 4K/60-fps YouTube-video med totalt 68 tappade bilder
| DPC Latencies / LatencyMon - interrupt to process latency (max), Web, Youtube, Prime95 | |
| Razer Blade 15 Advanced (Mid 2021) | |
| Alienware m15 R6, i7-11800H RTX 3080 | |
| Aorus 15P YD | |
| Alienware m15 R4 RTX 3080 | |
| Schenker XMG Neo 15 Tiger Lake | |
| Alienware m15 R5 Ryzen Edition | |
* ... mindre är bättre
Lösning för lagring
Dell har utrustat m15 R6 med två 1 TB NVMe SSD-diskar från Samsung, så det finns gott om lagringsutrymme med totalt 2 TB. Även om Samsung PM9A1 intar tredjeplatsen i vår SSD-databaskan den inte ens komma i närheten av sina teoretiskt höga hastigheter i R6. Det finns en viss slösad potential här, men hastigheten är ändå inte dålig på något sätt

| Drive Performance rating - Percent | |
| Aorus 15P YD | |
| Genomsnitt av klass Gaming | |
| Genomsnitt Samsung PM9A1 MZVL21T0HCLR | |
| Razer Blade 15 Advanced (Mid 2021) | |
| Schenker XMG Neo 15 Tiger Lake | |
| Alienware m15 R6, i7-11800H RTX 3080 | |
| Alienware m15 R4 RTX 3080 | |
| Alienware m15 R5 Ryzen Edition | |
* ... mindre är bättre
Constant Performance Reading: DiskSpd Read Loop, Queue Depth 8
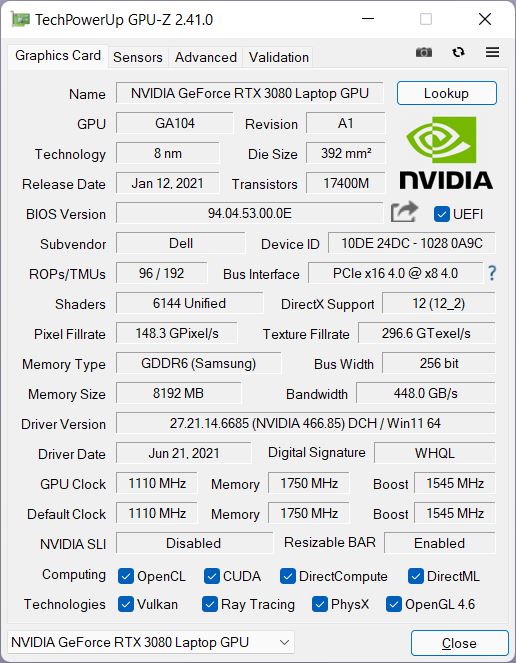
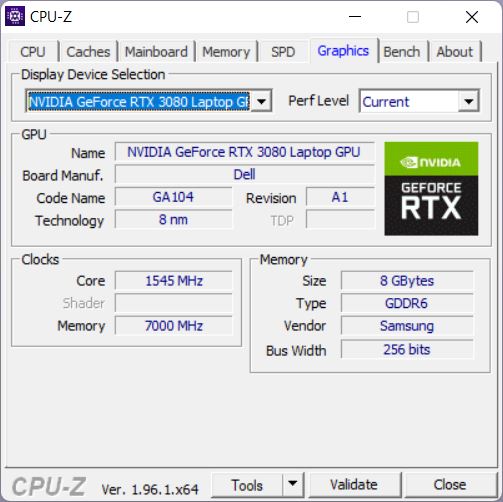
Grafikkort
R6 innehåller en NVIDIA GeForce RTX 3080 Mobile GPUsom kan förbruka 125 watt, inklusive 10 watt dynamisk boost. Med tanke på att vissa bärbara RTX 3080-datorer är konfigurerade med upp till 165 watt verkar detta ganska lågt, särskilt för en bärbar Alienware-dator. Till exempel kan till och med R6 med RTX 3070-alternativet använda 130 watt
I 3DMark-testerna motsvarar Alienwares prestanda ganska exakt genomsnittet, när det gäller RTX 3080. Den "gamla" R4 med RTX 3080 och Intel Core i9-10980HK Comet Lake CPU är märkbart snabbare för det mesta. Detta är ingen överraskning eftersom GPU:n i R4 kan använda 140 watt.
I batteriläge resulterar körningen av 3DMark 11 i endast 16 083 poäng istället för 30 178 poäng tidigare, vilket motsvarar en minskning med 47 procent
| 3DMark Performance rating - Percent | |
| Genomsnitt av klass Gaming | |
| Alienware m15 R4 RTX 3080 | |
| Razer Blade 15 Advanced (Mid 2021) | |
| Schenker XMG Neo 15 Tiger Lake | |
| Aorus 15P YD | |
| Alienware m15 R6, i7-11800H RTX 3080 | |
| Genomsnitt NVIDIA GeForce RTX 3080 Laptop GPU | |
| Alienware m15 R5 Ryzen Edition | |
| 3DMark 11 - 1280x720 Performance GPU | |
| Genomsnitt av klass Gaming (21841 - 80022, n=104, senaste 2 åren) | |
| Schenker XMG Neo 15 Tiger Lake | |
| Alienware m15 R4 RTX 3080 | |
| Alienware m15 R6, i7-11800H RTX 3080 | |
| Aorus 15P YD | |
| Genomsnitt NVIDIA GeForce RTX 3080 Laptop GPU (31288 - 43744, n=40) | |
| Razer Blade 15 Advanced (Mid 2021) | |
| Alienware m15 R5 Ryzen Edition | |
| 3DMark | |
| 1280x720 Cloud Gate Standard Graphics | |
| Alienware m15 R4 RTX 3080 | |
| Razer Blade 15 Advanced (Mid 2021) | |
| Genomsnitt av klass Gaming (86886 - 223650, n=60, senaste 2 åren) | |
| Aorus 15P YD | |
| Alienware m15 R6, i7-11800H RTX 3080 | |
| Genomsnitt NVIDIA GeForce RTX 3080 Laptop GPU (38816 - 192950, n=35) | |
| Schenker XMG Neo 15 Tiger Lake | |
| Alienware m15 R5 Ryzen Edition | |
| 1920x1080 Fire Strike Graphics | |
| Genomsnitt av klass Gaming (12242 - 62849, n=115, senaste 2 åren) | |
| Schenker XMG Neo 15 Tiger Lake | |
| Alienware m15 R4 RTX 3080 | |
| Aorus 15P YD | |
| Alienware m15 R6, i7-11800H RTX 3080 | |
| Genomsnitt NVIDIA GeForce RTX 3080 Laptop GPU (16455 - 32366, n=46) | |
| Razer Blade 15 Advanced (Mid 2021) | |
| Alienware m15 R5 Ryzen Edition | |
| 2560x1440 Time Spy Graphics | |
| Genomsnitt av klass Gaming (5012 - 26212, n=115, senaste 2 åren) | |
| Schenker XMG Neo 15 Tiger Lake | |
| Alienware m15 R4 RTX 3080 | |
| Aorus 15P YD | |
| Alienware m15 R6, i7-11800H RTX 3080 | |
| Genomsnitt NVIDIA GeForce RTX 3080 Laptop GPU (6407 - 13210, n=45) | |
| Razer Blade 15 Advanced (Mid 2021) | |
| Alienware m15 R5 Ryzen Edition | |
| 3DMark 11 Performance | 30178 poäng | |
| 3DMark Cloud Gate Standard Score | 53399 poäng | |
| 3DMark Fire Strike Score | 24014 poäng | |
| 3DMark Time Spy Score | 10763 poäng | |
Hjälp | ||
Spelprestanda
Trots den något strypta RTX 3080 kan Alienware visa alla moderna spel med maximal detaljrikedom och i Full HD-upplösning, och det borde till och med finnas tillräckliga reserver för 4K-upplösningar.
Sammantaget ligger R6:s prestanda återigen ganska nära genomsnittet för andra bärbara datorer med RTX 3080 från vår databas. De flesta av dess direkta konkurrenter är dock fortfarande snabbare, med den gamla m15 R4 i topp. Det verkar lite märkligt att man skulle begränsa prestandan jämfört med föregångaren, möjligen för att kunna ge bättre kylning av systemet.
Fläktlägena verkar ha endast liten påverkan på prestandan. I prestandaläget kommer många spel bara knappt eller inte alls att dra nytta av den teoretiska extrakylningen (GTA V), men i vissa spel kan vi se en minimal fördel (Strange Brigade, + 3-5 %).
| Far Cry 5 | |
| 1920x1080 Medium Preset AA:T | |
| Alienware m15 R4 RTX 3080 | |
| Schenker XMG Neo 15 Tiger Lake | |
| Genomsnitt av klass Gaming (84 - 173, n=6, senaste 2 åren) | |
| Aorus 15P YD | |
| Genomsnitt NVIDIA GeForce RTX 3080 Laptop GPU (84 - 162, n=26) | |
| Alienware m15 R6, i7-11800H RTX 3080 | |
| Alienware m15 R5 Ryzen Edition | |
| 1920x1080 High Preset AA:T | |
| Alienware m15 R4 RTX 3080 | |
| Schenker XMG Neo 15 Tiger Lake | |
| Genomsnitt av klass Gaming (82 - 163, n=6, senaste 2 åren) | |
| Aorus 15P YD | |
| Genomsnitt NVIDIA GeForce RTX 3080 Laptop GPU (79 - 155, n=28) | |
| Alienware m15 R6, i7-11800H RTX 3080 | |
| Alienware m15 R5 Ryzen Edition | |
| 1920x1080 Ultra Preset AA:T | |
| Aorus 15P YD | |
| Alienware m15 R4 RTX 3080 | |
| Schenker XMG Neo 15 Tiger Lake | |
| Genomsnitt av klass Gaming (70 - 151, n=6, senaste 2 åren) | |
| Genomsnitt NVIDIA GeForce RTX 3080 Laptop GPU (75 - 146, n=33) | |
| Alienware m15 R6, i7-11800H RTX 3080 | |
| Alienware m15 R5 Ryzen Edition | |
| New World | |
| 1920x1080 Medium Video Quality | |
| Alienware m15 R6, i7-11800H RTX 3080 | |
| Genomsnitt NVIDIA GeForce RTX 3080 Laptop GPU (80.8 - 105.4, n=4) | |
| 1920x1080 High Video Quality | |
| Alienware m15 R6, i7-11800H RTX 3080 | |
| Genomsnitt NVIDIA GeForce RTX 3080 Laptop GPU (75.1 - 96.7, n=4) | |
| 1920x1080 Very High Video Quality | |
| Alienware m15 R6, i7-11800H RTX 3080 | |
| Genomsnitt NVIDIA GeForce RTX 3080 Laptop GPU (71.5 - 90.4, n=4) | |
| Strange Brigade | |
| 1920x1080 medium AA:medium AF:4 | |
| Genomsnitt av klass Gaming (160.9 - 509, n=72, senaste 2 åren) | |
| Schenker XMG Neo 15 Tiger Lake | |
| Alienware m15 R6, i7-11800H RTX 3080 | |
| Aorus 15P YD | |
| Genomsnitt NVIDIA GeForce RTX 3080 Laptop GPU (186 - 306, n=29) | |
| Razer Blade 15 Advanced (Mid 2021) | |
| Alienware m15 R5 Ryzen Edition | |
| 1920x1080 high AA:high AF:8 | |
| Genomsnitt av klass Gaming (129.5 - 494, n=75, senaste 2 åren) | |
| Schenker XMG Neo 15 Tiger Lake | |
| Alienware m15 R6, i7-11800H RTX 3080 | |
| Aorus 15P YD | |
| Genomsnitt NVIDIA GeForce RTX 3080 Laptop GPU (165 - 248, n=30) | |
| Razer Blade 15 Advanced (Mid 2021) | |
| Alienware m15 R5 Ryzen Edition | |
| 1920x1080 ultra AA:ultra AF:16 | |
| Genomsnitt av klass Gaming (76.3 - 458, n=87, senaste 2 åren) | |
| Schenker XMG Neo 15 Tiger Lake | |
| Alienware m15 R6, i7-11800H RTX 3080 | |
| Aorus 15P YD | |
| Genomsnitt NVIDIA GeForce RTX 3080 Laptop GPU (117 - 219, n=34) | |
| Razer Blade 15 Advanced (Mid 2021) | |
| Alienware m15 R5 Ryzen Edition | |
| Dota 2 Reborn | |
| 1920x1080 high (2/3) | |
| Genomsnitt av klass Gaming (82.8 - 275, n=106, senaste 2 åren) | |
| Schenker XMG Neo 15 Tiger Lake | |
| Razer Blade 15 Advanced (Mid 2021) | |
| Alienware m15 R6, i7-11800H RTX 3080 | |
| Aorus 15P YD | |
| Genomsnitt NVIDIA GeForce RTX 3080 Laptop GPU (108.1 - 161, n=45) | |
| Alienware m15 R4 RTX 3080 | |
| Alienware m15 R5 Ryzen Edition | |
| 1920x1080 ultra (3/3) best looking | |
| Genomsnitt av klass Gaming (84.8 - 248, n=107, senaste 2 åren) | |
| Schenker XMG Neo 15 Tiger Lake | |
| Razer Blade 15 Advanced (Mid 2021) | |
| Alienware m15 R6, i7-11800H RTX 3080 | |
| Aorus 15P YD | |
| Alienware m15 R4 RTX 3080 | |
| Genomsnitt NVIDIA GeForce RTX 3080 Laptop GPU (98 - 156, n=45) | |
| Alienware m15 R5 Ryzen Edition | |
| X-Plane 11.11 | |
| 1920x1080 med (fps_test=2) | |
| Razer Blade 15 Advanced (Mid 2021) | |
| Genomsnitt av klass Gaming (63.8 - 181.2, n=103, senaste 2 åren) | |
| Alienware m15 R6, i7-11800H RTX 3080 | |
| Aorus 15P YD | |
| Schenker XMG Neo 15 Tiger Lake | |
| Genomsnitt NVIDIA GeForce RTX 3080 Laptop GPU (80.6 - 139, n=44) | |
| Alienware m15 R4 RTX 3080 | |
| Alienware m15 R5 Ryzen Edition | |
| 1920x1080 high (fps_test=3) | |
| Genomsnitt av klass Gaming (55.5 - 143.5, n=109, senaste 2 åren) | |
| Razer Blade 15 Advanced (Mid 2021) | |
| Alienware m15 R6, i7-11800H RTX 3080 | |
| Alienware m15 R4 RTX 3080 | |
| Aorus 15P YD | |
| Genomsnitt NVIDIA GeForce RTX 3080 Laptop GPU (65.6 - 113, n=44) | |
| Schenker XMG Neo 15 Tiger Lake | |
| Alienware m15 R5 Ryzen Edition | |
Under en timmes körning av The Witcher 3 sjunker bildfrekvensen bara något, så prestandan är ganska konstant och avvikelser eller nedgångar är undantag
The Witcher 3 FPS Chart
| låg | med. | hög | ultra | |
|---|---|---|---|---|
| GTA V (2015) | 183 | 177 | 166 | 99.5 |
| The Witcher 3 (2015) | 312 | 276 | 149 | 108.4 |
| Dota 2 Reborn (2015) | 168 | 151 | 144 | 135 |
| X-Plane 11.11 (2018) | 127 | 110 | 87.9 | |
| Far Cry 5 (2018) | 132 | 126 | 119 | 113 |
| Strange Brigade (2018) | 424 | 261 | 216 | 190 |
| New World (2021) | 115.5 | 95.7 | 91.3 | 84 |
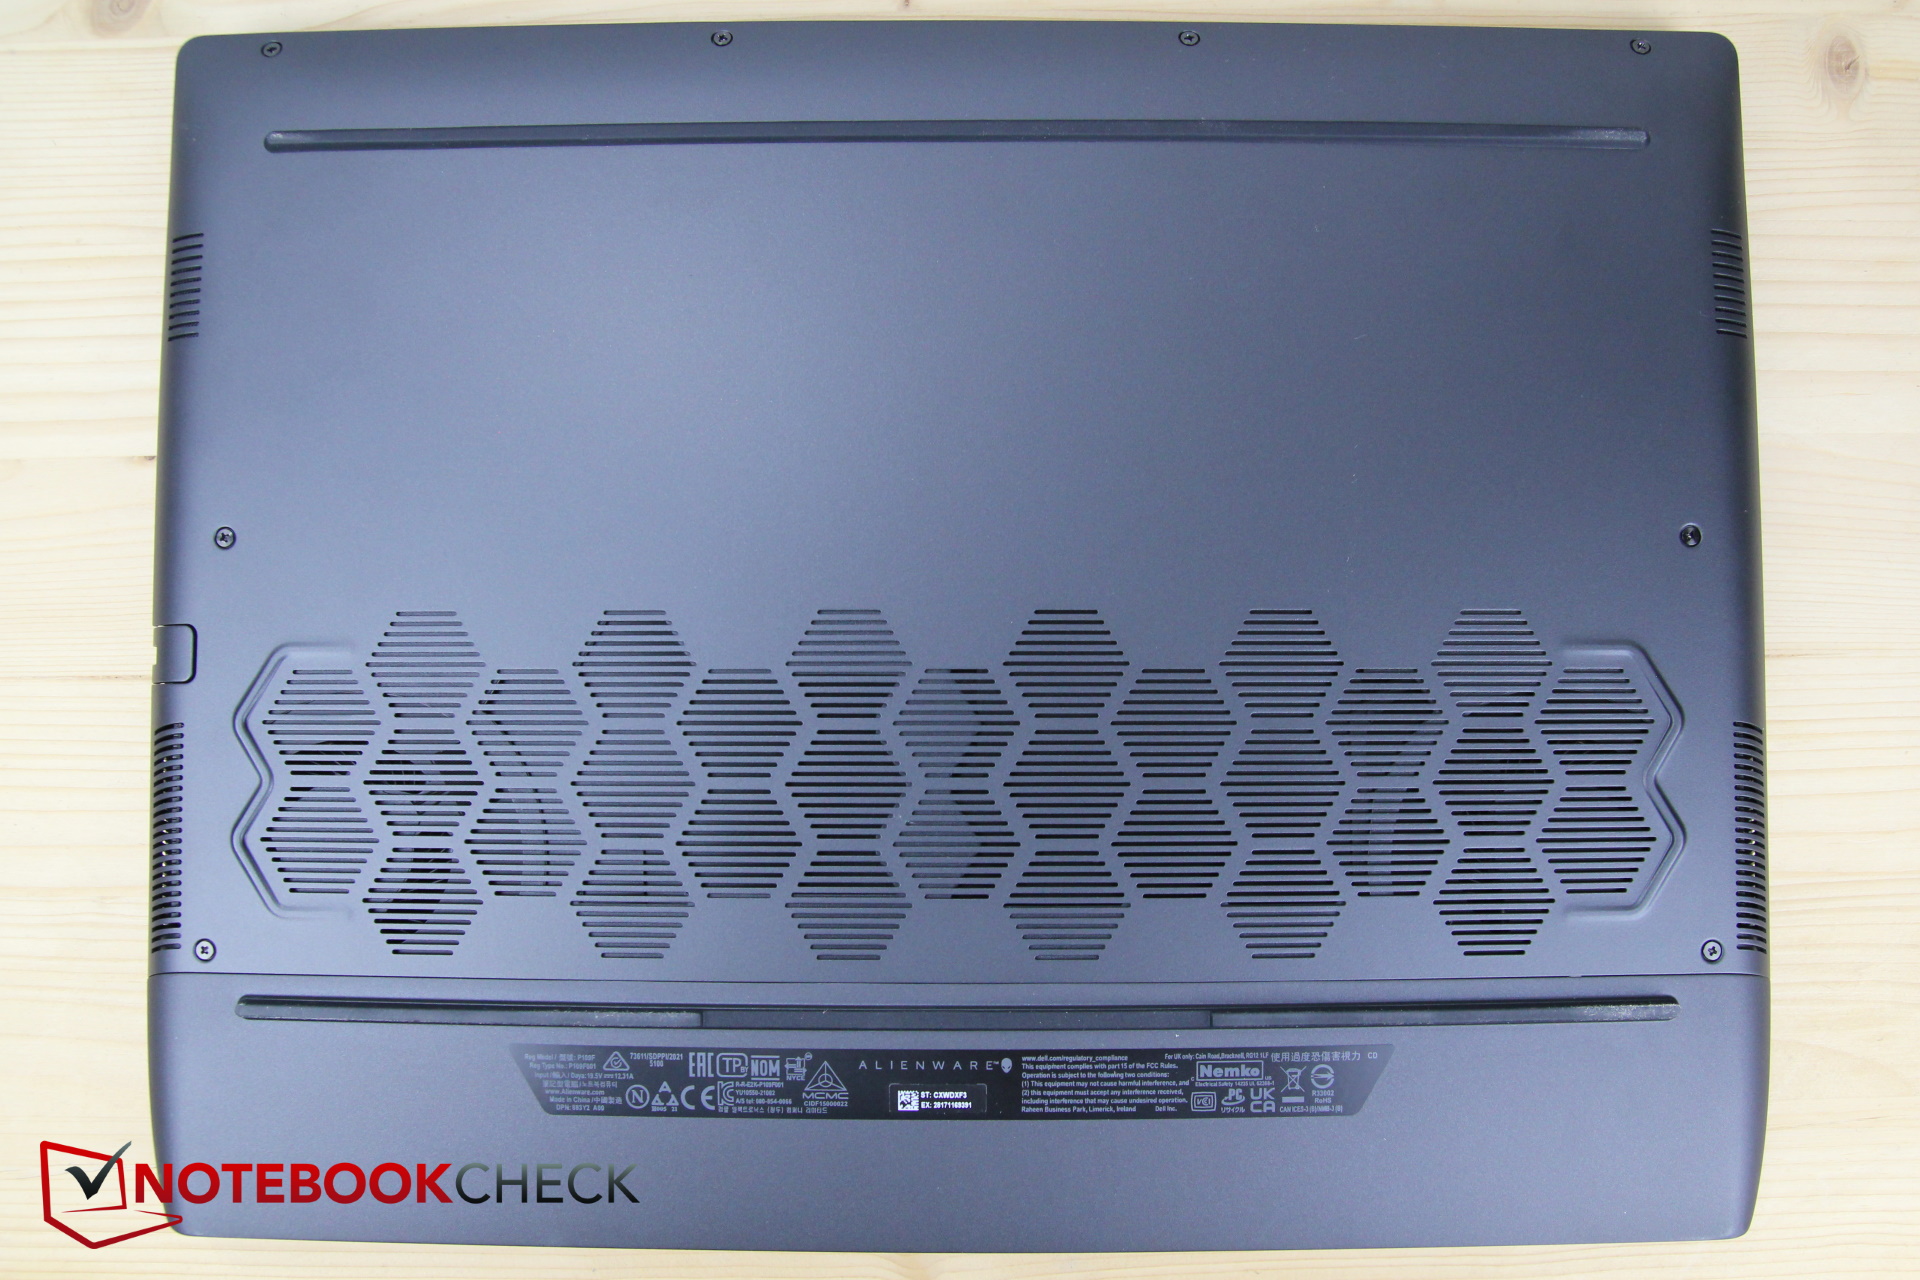
Utsläpp - Varmare än de flesta konkurrenter
Bullerutsläpp
Vid tomgångsdrift förblir fläktarna i 6 ofta avstängda, åtminstone i balanserat eller tyst läge. I prestandaläget är de också högljudda vid tomgång, och likaså i läget "Cooling". I läget Full Performance blir de ännu högre.
I läget Balanserat kan fläktarna till och med gå upp i varv från tid till annan vid maximal tomgångsdrift, upp till en ljudnivå på cirka 30 dB. Vid genomsnittlig belastning (3DMark06, första riktmärket) förblir R6 nu till och med tystare än vissa av sina konkurrenter.
Å andra sidan rusar fläktarna upp ganska mycket under hög belastning. Men de är åtminstone inte högre än Aorus eller Schenker här också. Detta är dock inte fallet när du använder läget Full Performance. Så varje användare måste själv avgöra om några ramar mer också är värt den ökande ljudnivån.
Under vissa typer av belastning (3DMark06) kan vi höra ett elektroniskt brus i form av ett brum. Förmodligen är det endast märkbart under medelhög belastningsnivå, och efter det drunknar det i fläktljudet.
Ljudnivå
| Låg belastning |
| 23 / 23 / 30 dB(A) |
| Hög belastning |
| 41.26 / 53.37 dB(A) |
 | ||
30 dB tyst 40 dB(A) hörbar 50 dB(A) högt ljud |
||
min: | ||
| Alienware m15 R6, i7-11800H RTX 3080 GeForce RTX 3080 Laptop GPU, i7-11800H, Samsung PM9A1 MZVL21T0HCLR | Alienware m15 R5 Ryzen Edition GeForce RTX 3060 Laptop GPU, R7 5800H, Toshiba KBG40ZNS512G NVMe | Alienware m15 R4 RTX 3080 GeForce RTX 3080 Laptop GPU, i9-10980HK, 2x WDC PC SN730 SDBPNTY-512G (RAID 0) | Aorus 15P YD GeForce RTX 3080 Laptop GPU, i7-11800H, Samsung PM9A1 MZVL21T0HCLR | Schenker XMG Neo 15 Tiger Lake GeForce RTX 3080 Laptop GPU, i7-11800H, Samsung SSD 980 Pro 1TB MZ-V8P1T0BW | Razer Blade 15 Advanced (Mid 2021) GeForce RTX 3080 Laptop GPU, i7-11800H, SSSTC CA6-8D1024 | |
|---|---|---|---|---|---|---|
| Noise | -4% | -7% | -10% | -11% | 0% | |
| av / miljö * (dB) | 23 | 24 -4% | 25 -9% | 25 -9% | 25 -9% | 25.1 -9% |
| Idle Minimum * (dB) | 23 | 24 -4% | 25 -9% | 26 -13% | 27 -17% | 25.3 -10% |
| Idle Average * (dB) | 23 | 25 -9% | 29 -26% | 30 -30% | 30 -30% | 25.3 -10% |
| Idle Maximum * (dB) | 30 | 35 -17% | 33 -10% | 34 -13% | 32 -7% | 25.3 16% |
| Load Average * (dB) | 41.26 | 44 -7% | 48 -16% | 43 -4% | 46 -11% | 42 -2% |
| Witcher 3 ultra * (dB) | 53.4 | 48 10% | 46 14% | 50 6% | 52 3% | 45.6 15% |
| Load Maximum * (dB) | 53.37 | 50 6% | 49 8% | 57 -7% | 55 -3% | 51.6 3% |
* ... mindre är bättre
Temperatur
Vid tomgångsdrift är R6 nu kallare än R4. Under belastning blir den dock lika varm igen, och det trots att åtminstone 3D-prestandan är något lägre.
Vid kraftig belastning kan ytorna på ovansidan och undersidan nå temperaturer på omkring 60 °C, vilket definitivt inte längre lämpar sig för drift i knät. Å andra sidan kan de som bor i en kall trädgårdsstuga dra nytta av R6 på några andra sätt: När man spelar når temperaturen runt WASD-tangenterna fortfarande upp till mysiga 40-45 °C (104-113 °F), men åtminstone handflatsstödet förblir relativt svalt
Intressant nog blir R5 med det svagare RTX 3060 och Ryzen 7 5800H lika varmt. Resten av konkurrenterna förblir dock märkbart svalare
(-) Den maximala temperaturen på ovansidan är 61 °C / 142 F, jämfört med genomsnittet av 40.4 °C / 105 F , allt från 21.2 till 68.8 °C för klassen Gaming.
(-) Botten värms upp till maximalt 58 °C / 136 F, jämfört med genomsnittet av 43.2 °C / 110 F
(+) Vid tomgångsbruk är medeltemperaturen för ovansidan 29.6 °C / 85 F, jämfört med enhetsgenomsnittet på 33.9 °C / ### class_avg_f### F.
(-) När du spelar The Witcher 3 är medeltemperaturen för ovansidan 40.7 °C / 105 F, jämfört med enhetsgenomsnittet på 33.9 °C / ## #class_avg_f### F.
(±) Handledsstöden och pekplattan kan bli väldigt varma vid beröring med maximalt 39 °C / 102.2 F.
(-) Medeltemperaturen för handledsstödsområdet på liknande enheter var 28.8 °C / 83.8 F (-10.2 °C / -18.4 F).
| Alienware m15 R6, i7-11800H RTX 3080 Intel Core i7-11800H, NVIDIA GeForce RTX 3080 Laptop GPU | Alienware m15 R5 Ryzen Edition AMD Ryzen 7 5800H, NVIDIA GeForce RTX 3060 Laptop GPU | Alienware m15 R4 RTX 3080 Intel Core i9-10980HK, NVIDIA GeForce RTX 3080 Laptop GPU | Aorus 15P YD Intel Core i7-11800H, NVIDIA GeForce RTX 3080 Laptop GPU | Schenker XMG Neo 15 Tiger Lake Intel Core i7-11800H, NVIDIA GeForce RTX 3080 Laptop GPU | Razer Blade 15 Advanced (Mid 2021) Intel Core i7-11800H, NVIDIA GeForce RTX 3080 Laptop GPU | |
|---|---|---|---|---|---|---|
| Heat | 2% | -7% | 9% | 15% | 7% | |
| Maximum Upper Side * (°C) | 61 | 62 -2% | 59 3% | 49 20% | 39 36% | 51 16% |
| Maximum Bottom * (°C) | 58 | 61 -5% | 61 -5% | 57 2% | 50 14% | 52 10% |
| Idle Upper Side * (°C) | 38 | 36 5% | 43 -13% | 33 13% | 34 11% | 35.2 7% |
| Idle Bottom * (°C) | 36 | 33 8% | 41 -14% | 36 -0% | 37 -3% | 37.8 -5% |
* ... mindre är bättre
Stresstest
I det timslånga stresstestet börjar kärnorna på cirka 4,2 GHz. Efter mindre än en halvtimme är klockfrekvensen endast 2,7 GHz. Fram till slutet varierar den något mellan 2,7 och 2,9 GHz
Under denna tid ligger kärnornas temperaturer på helt okritiska 80 °C (176 °F), även om de tillfälligt kan stiga upp till 98 °C (208 °F), vilket utlöser termisk strypning
Samtidigt varierar GPU:ns klockfrekvens mellan 1,3 och 1,7 GHz under hela testet. Dess temperatur ligger runt 77 °C (171 °F), och den heta punkten når runt 85 °C (185 °F)
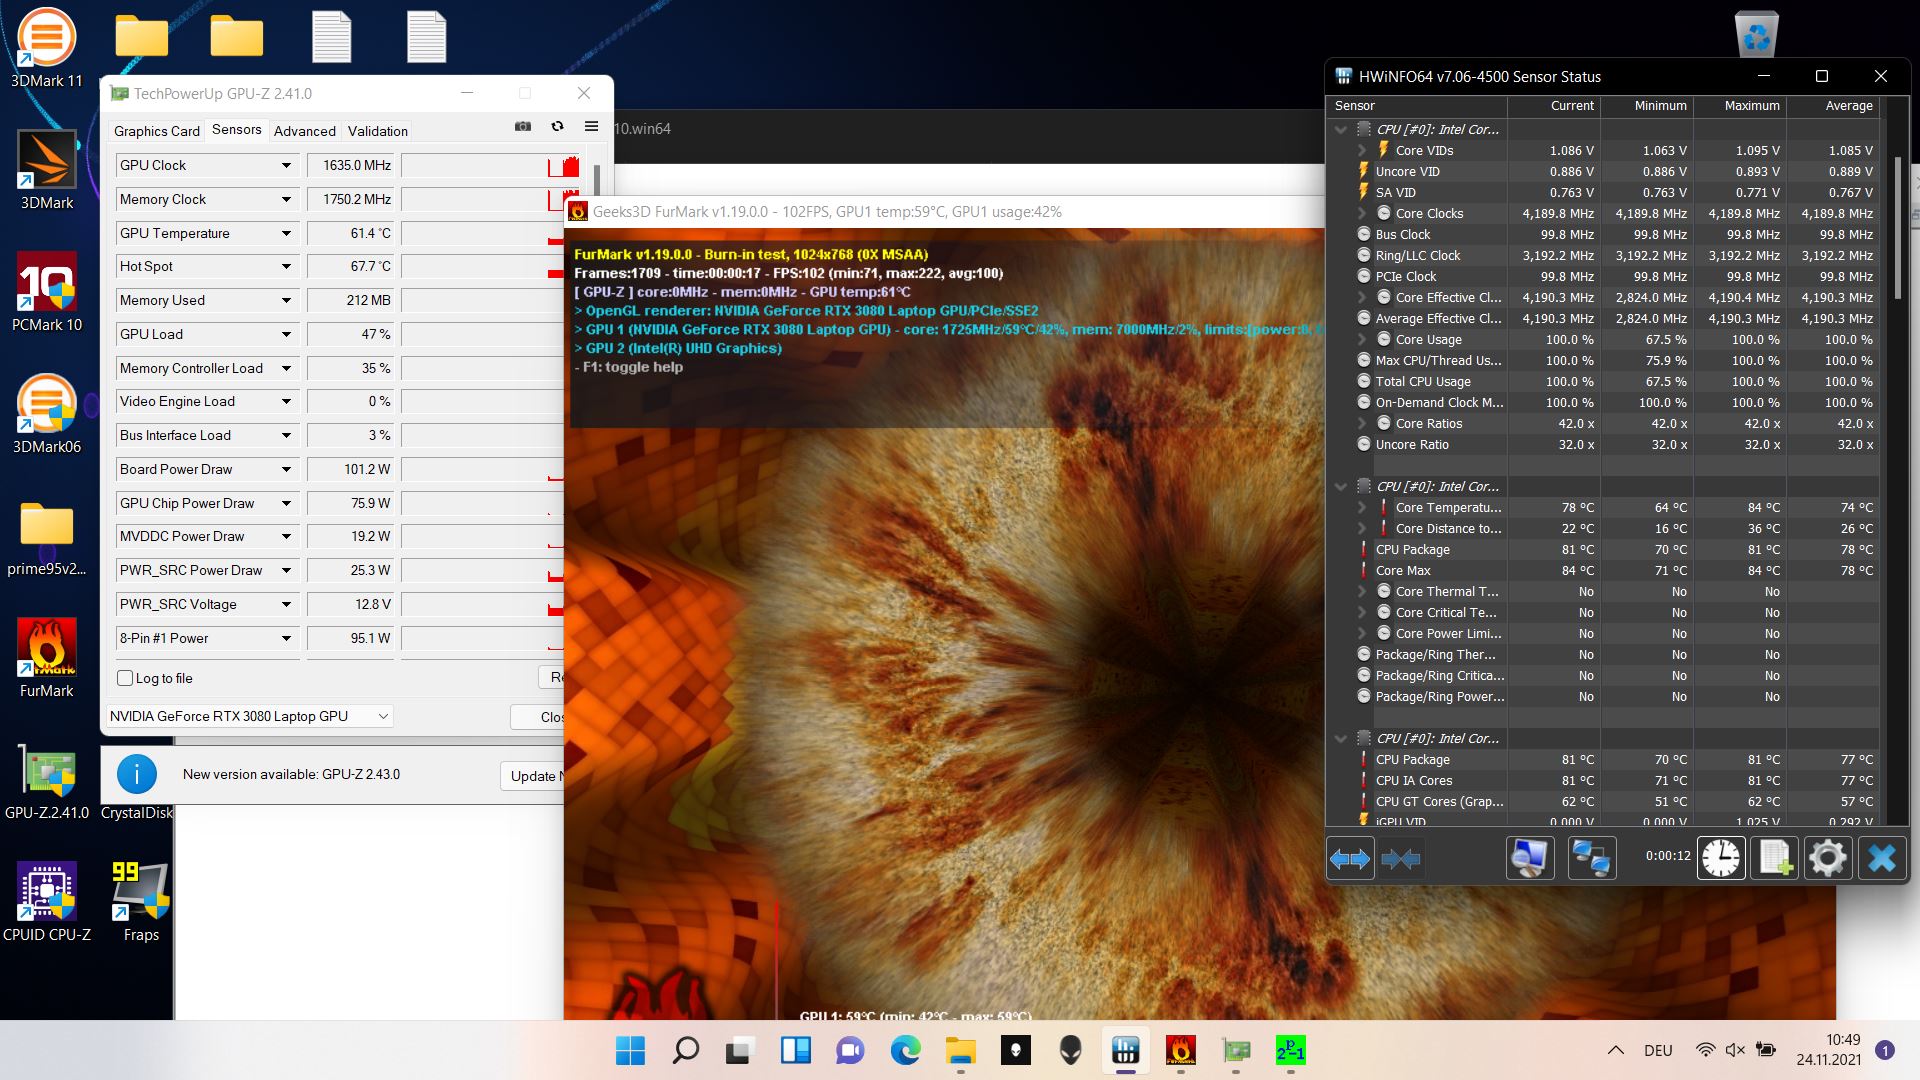
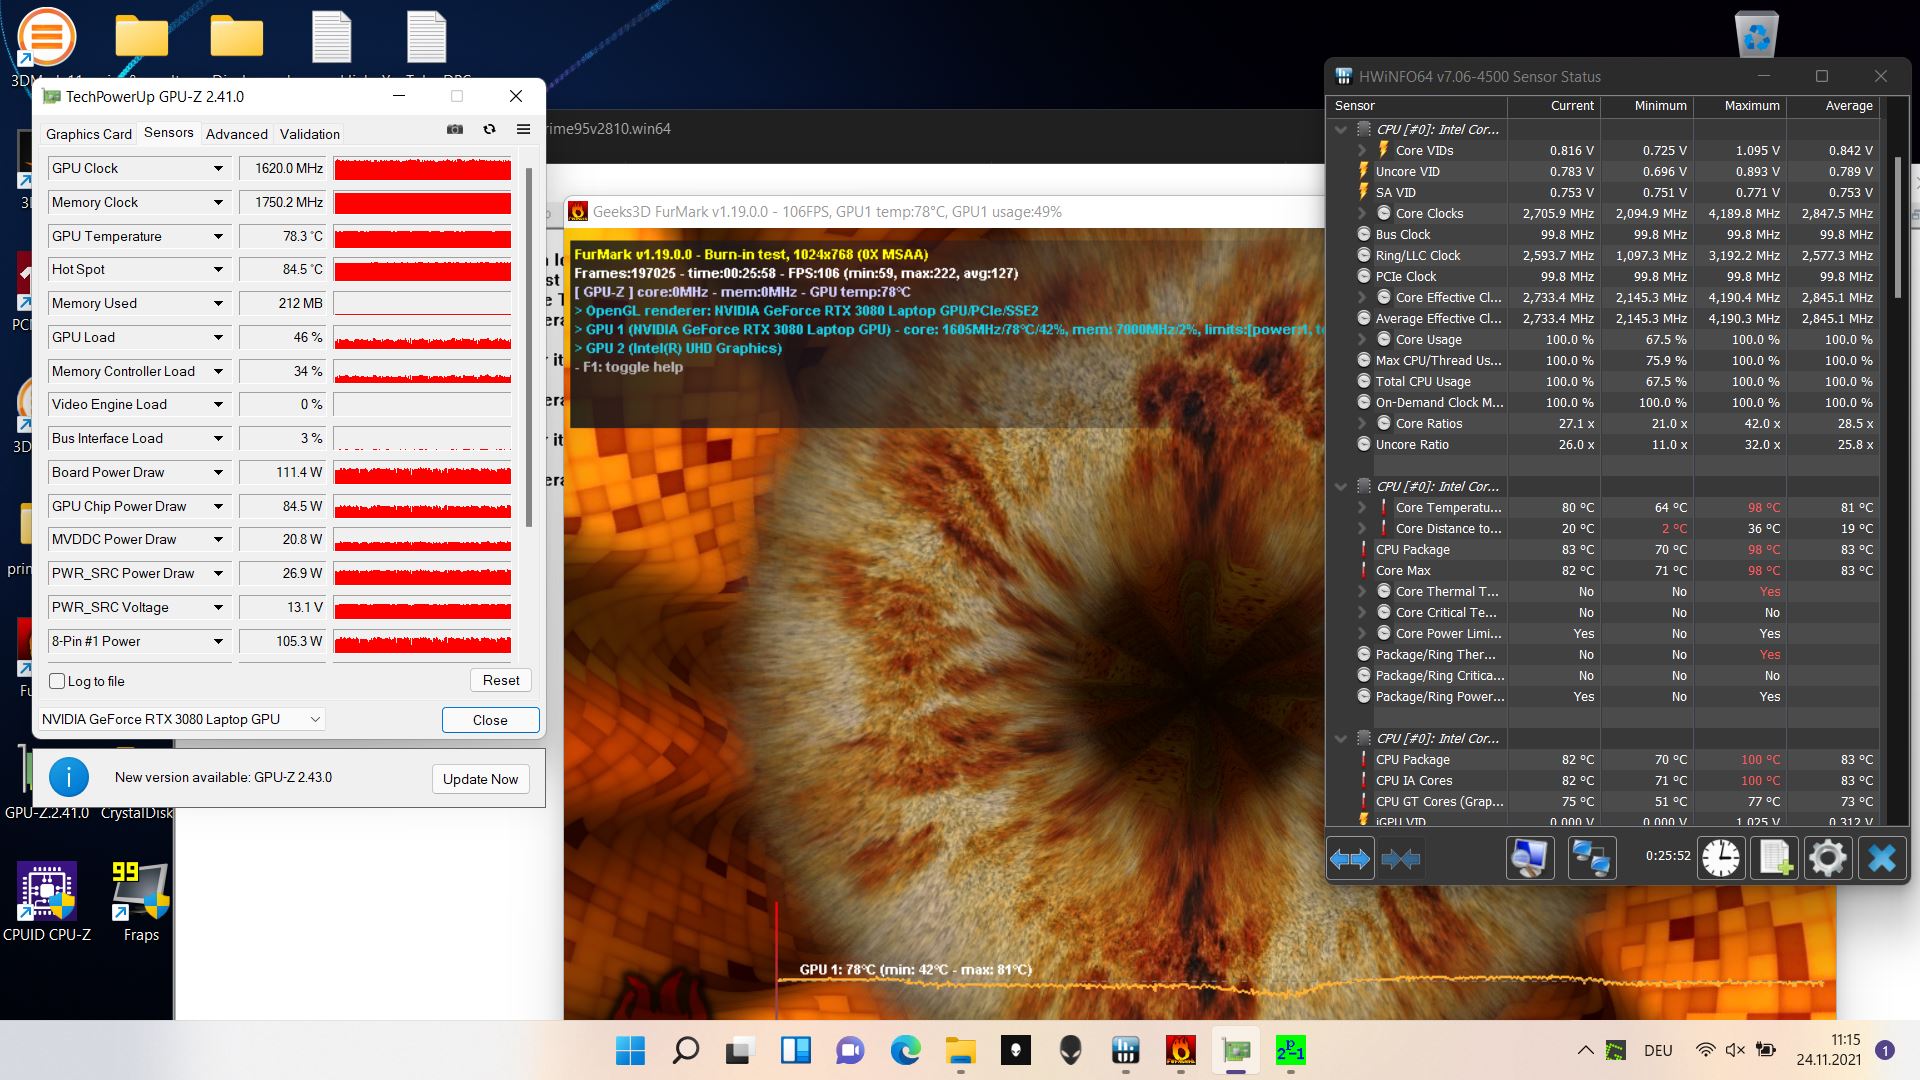
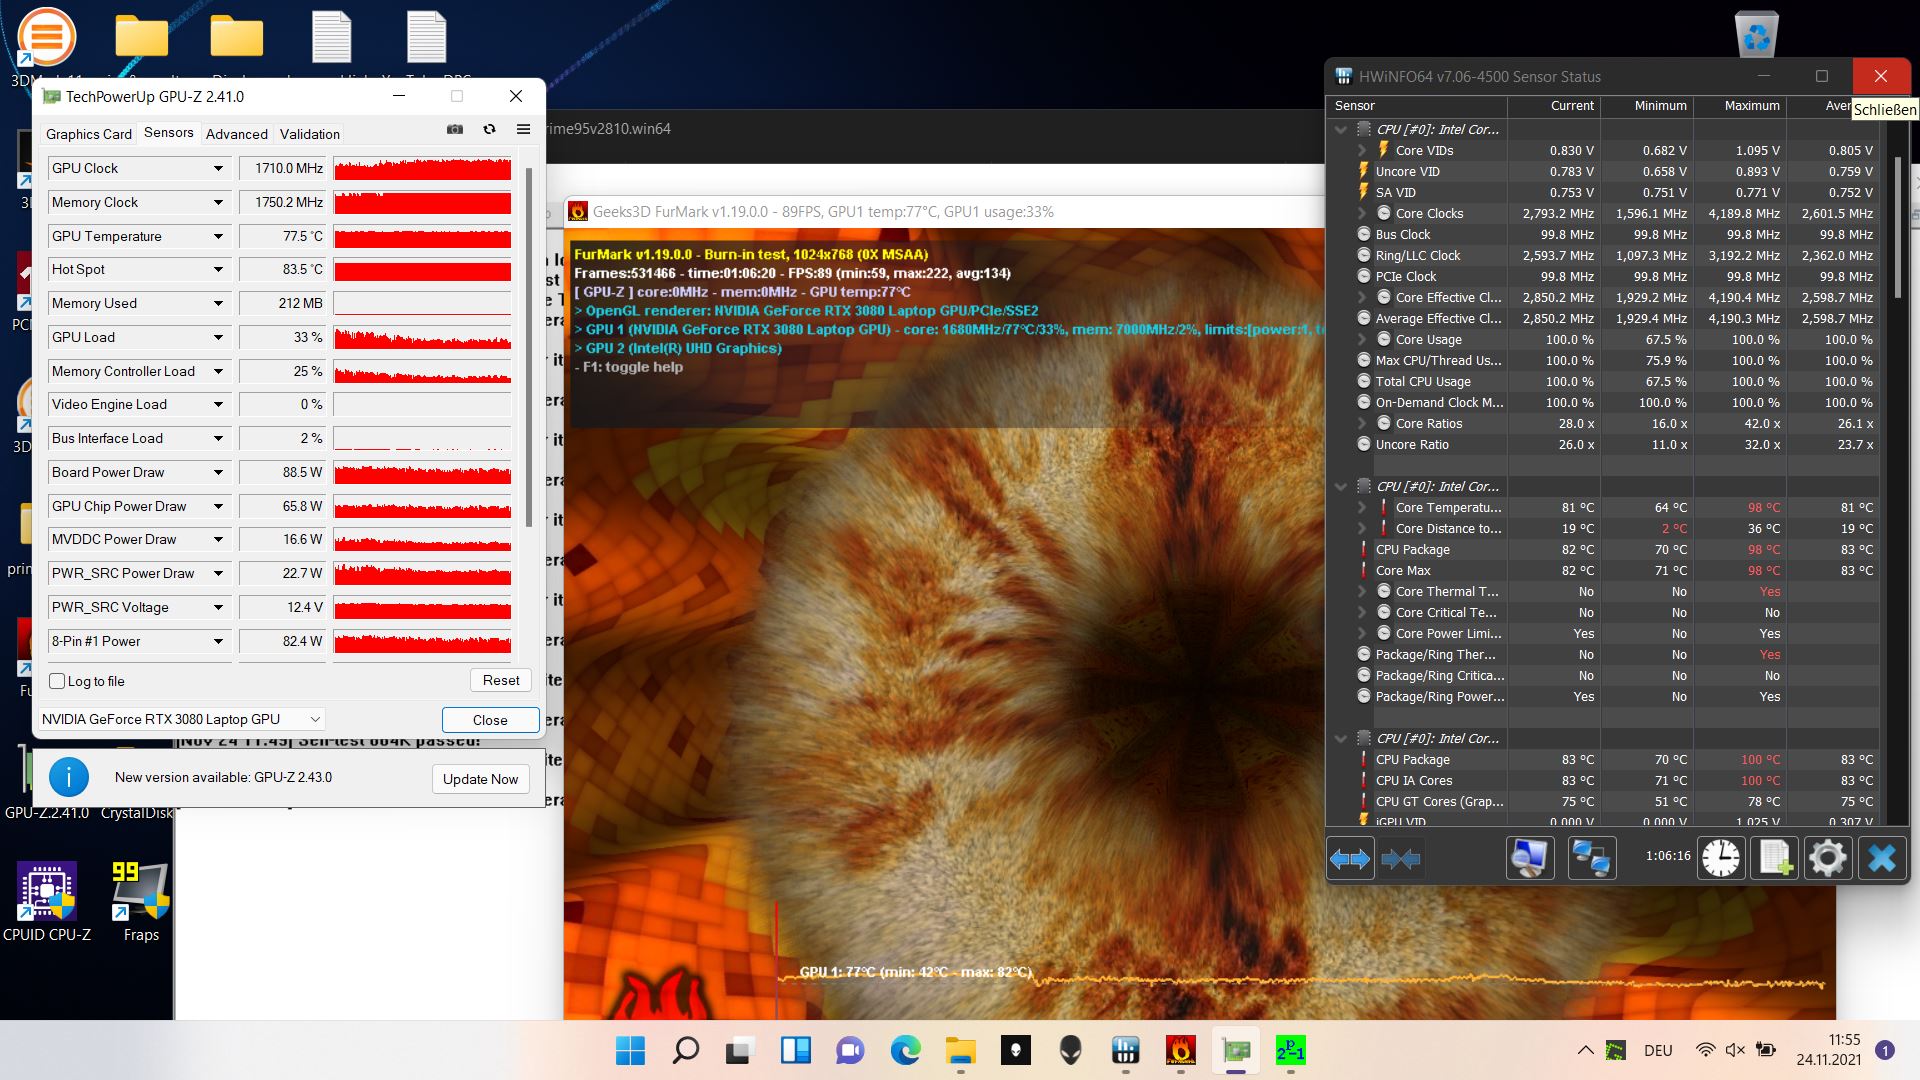
| CPU-klocka (GHz) | GPU-klocka (MHz) | GenomsnittligCPU-temperatur (°C) | GenomsnittligGPU-temperatur (°C) | |
| Prime95 + FurMark Stress | 2,7 - 2,9 | 1 395 - 1 710 | 80 | 77 |
Högtalare
Den positiva aspekten är att högtalaren kan bli ganska högljudd. Men tyvärr saknar de bas, och vi hörde också bättre modeller när det gäller mellanregistret. På grund av de högljudda fläktarna rekommenderas användning av hörlurar ändå, och det finns en ljudport för detta
Alienware m15 R6, i7-11800H RTX 3080 ljudanalys
(+) | högtalare kan spela relativt högt (85.2 dB)
Bas 100 - 315 Hz
(-) | nästan ingen bas - i genomsnitt 23.8% lägre än medianen
(±) | linjäriteten för basen är genomsnittlig (12% delta till föregående frekvens)
Mellan 400 - 2000 Hz
(±) | högre mellan - i genomsnitt 8.3% högre än median
(+) | mids är linjära (6.9% delta till föregående frekvens)
Högsta 2 - 16 kHz
(+) | balanserade toppar - endast 3.3% från medianen
(+) | toppar är linjära (5.7% delta till föregående frekvens)
Totalt 100 - 16 000 Hz
(±) | linjäriteten för det totala ljudet är genomsnittlig (21.8% skillnad mot median)
Jämfört med samma klass
» 78% av alla testade enheter i den här klassen var bättre, 6% liknande, 16% sämre
» Den bästa hade ett delta på 6%, genomsnittet var 18%, sämst var 132%
Jämfört med alla testade enheter
» 62% av alla testade enheter var bättre, 7% liknande, 31% sämre
» Den bästa hade ett delta på 4%, genomsnittet var 23%, sämst var 134%
Apple MacBook 12 (Early 2016) 1.1 GHz ljudanalys
(+) | högtalare kan spela relativt högt (83.6 dB)
Bas 100 - 315 Hz
(±) | reducerad bas - i genomsnitt 11.3% lägre än medianen
(±) | linjäriteten för basen är genomsnittlig (14.2% delta till föregående frekvens)
Mellan 400 - 2000 Hz
(+) | balanserad mellan - endast 2.4% från medianen
(+) | mids är linjära (5.5% delta till föregående frekvens)
Högsta 2 - 16 kHz
(+) | balanserade toppar - endast 2% från medianen
(+) | toppar är linjära (4.5% delta till föregående frekvens)
Totalt 100 - 16 000 Hz
(+) | det totala ljudet är linjärt (10.2% skillnad mot median)
Jämfört med samma klass
» 7% av alla testade enheter i den här klassen var bättre, 2% liknande, 90% sämre
» Den bästa hade ett delta på 5%, genomsnittet var 18%, sämst var 53%
Jämfört med alla testade enheter
» 5% av alla testade enheter var bättre, 1% liknande, 94% sämre
» Den bästa hade ett delta på 4%, genomsnittet var 23%, sämst var 134%
Energihantering - Effektivare än föregångaren
Effektförbrukning
Tack vare Optimus-omkopplingen förbrukar R6 nu märkbart mindre ström än R4, åtminstone vid tomgångsdrift. Under belastning är förbrukningen också något lägre än hos konkurrenterna, men det kan också bero på den lägre 3D-prestandan.
Vi mäter en maximal förbrukning på strax över 200 watt, vilket innebär att strömförsörjningen på 240 watt bör vara tillräcklig för att kunna ladda enheten på ett tillförlitligt sätt i alla situationer
| Låg belastning | |
| Hög belastning |
|
Förklaring:
min: | |
| Alienware m15 R6, i7-11800H RTX 3080 i7-11800H, GeForce RTX 3080 Laptop GPU, Samsung PM9A1 MZVL21T0HCLR, IPS, 1920x1080, 15.6" | Alienware m15 R5 Ryzen Edition R7 5800H, GeForce RTX 3060 Laptop GPU, Toshiba KBG40ZNS512G NVMe, IPS, 1920x1080, 15.6" | Alienware m15 R4 RTX 3080 i9-10980HK, GeForce RTX 3080 Laptop GPU, 2x WDC PC SN730 SDBPNTY-512G (RAID 0), IPS, 1920x1080, 15.6" | Aorus 15P YD i7-11800H, GeForce RTX 3080 Laptop GPU, Samsung PM9A1 MZVL21T0HCLR, IPS, 1920x1080, 15.6" | Schenker XMG Neo 15 Tiger Lake i7-11800H, GeForce RTX 3080 Laptop GPU, Samsung SSD 980 Pro 1TB MZ-V8P1T0BW, IPS, 2560x1440, 15.6" | Razer Blade 15 Advanced (Mid 2021) i7-11800H, GeForce RTX 3080 Laptop GPU, SSSTC CA6-8D1024, IPS, 1920x1080, 15.6" | Genomsnitt NVIDIA GeForce RTX 3080 Laptop GPU | Genomsnitt av klass Gaming | |
|---|---|---|---|---|---|---|---|---|
| Power Consumption | 4% | -70% | -29% | -0% | -18% | -24% | -6% | |
| Idle Minimum * (Watt) | 14 | 11 21% | 37 -164% | 23 -64% | 15 -7% | 19.5 -39% | 19.8 ? -41% | 13 ? 7% |
| Idle Average * (Watt) | 18 | 14 22% | 40 -122% | 25 -39% | 17 6% | 23.3 -29% | 24.3 ? -35% | 19 ? -6% |
| Idle Maximum * (Watt) | 29 | 25 14% | 53 -83% | 35 -21% | 22 24% | 40.1 -38% | 33.3 ? -15% | 24.6 ? 15% |
| Load Average * (Watt) | 93 | 123 -32% | 121 -30% | 101 -9% | 101 -9% | 98.9 -6% | 108.1 ? -16% | 110.7 ? -19% |
| Witcher 3 ultra * (Watt) | 190 | 176 7% | 193 -2% | 190 -0% | 195 -3% | 174 8% | ||
| Load Maximum * (Watt) | 203 | 226 -11% | 246 -21% | 280 -38% | 230 -13% | 214 -5% | 230 ? -13% | 259 ? -28% |
* ... mindre är bättre
Power Consumption The Witcher 3 / Stress Test
Power Consumption with an External Monitor
Batteritid
Trots sin kraftfullare GPU har R6 inte ett större batteri än R5 med RTX 3060. Detta verkar dock inte nödvändigtvis ha en negativ effekt på batteritiden, eftersom den integrerade GPU:n under våra batteritester var aktiv under större delen av tiden. WLAN-testresultaten är i ögonhöjd, och endast vid uppspelning av videor håller R6 märkbart kortare tid med 5,5 timmar än R5 med 8 timmar.
| Alienware m15 R6, i7-11800H RTX 3080 i7-11800H, GeForce RTX 3080 Laptop GPU, 84 Wh | Alienware m15 R5 Ryzen Edition R7 5800H, GeForce RTX 3060 Laptop GPU, 86 Wh | Alienware m15 R4 RTX 3080 i9-10980HK, GeForce RTX 3080 Laptop GPU, 86 Wh | Aorus 15P YD i7-11800H, GeForce RTX 3080 Laptop GPU, 99 Wh | Schenker XMG Neo 15 Tiger Lake i7-11800H, GeForce RTX 3080 Laptop GPU, 93 Wh | Razer Blade 15 Advanced (Mid 2021) i7-11800H, GeForce RTX 3080 Laptop GPU, 80 Wh | Genomsnitt av klass Gaming | |
|---|---|---|---|---|---|---|---|
| Batteridrifttid | 5% | -60% | 19% | 29% | 18% | 28% | |
| H.264 (h) | 5.6 | 8.8 57% | 1.9 -66% | 5.9 5% | 8.32 ? 49% | ||
| WiFi v1.3 (h) | 5 | 5.1 2% | 1.8 -64% | 5.3 6% | 5.6 12% | 5.9 18% | 7.11 ? 42% |
| Load (h) | 1.6 | 0.9 -44% | 0.8 -50% | 2.1 31% | 2.7 69% | 1.502 ? -6% | |
| Reader / Idle (h) | 14.7 | 7.5 | 8.27 ? | ||||
| Witcher 3 ultra (h) | 1.6 | 0.8 |
För
Emot
Bedömning - Varför så het?
Jämfört med R4 gör uppdateringen Tiger Lake R6 huvudsakligen effektivare och sparsammare, men inte nödvändigtvis snabbare. Även om CPU-prestandan har ökat har 3D-prestandan minskat på grund av den lägre TGP. Detta sänker också förbrukningen. Kylningslägena verkar bara ha liten inverkan på prestandan, och RTX 3080 får fortfarande ingen högre strömtilldelning.
CPU-prestandan är jämförbar med Ryzen m15 R5. Dessutom finns fördelen med Thunderbolt-stödet. Men i övrigt är R5 och R6 extremt lika varandra. Så du bör välja utifrån priset och hur viktigt Thunderbolt är för dig.
Kylsystemet avslöjar fortfarande ytterligare behov av optimering: Trots den låga strömförbrukningen hos RTX 3080 blir Alienwares ytor varmare än hos de flesta konkurrenterna, varav vissa erbjuder en högre 3D-prestanda.
M15 R6 är effektivare och sparsammare än föregångaren R4. RTX 3080 stryps dock här, och ytorna på Alienware blir fortfarande mycket varma.
Aorus 15P YDger en minimalt högre prestanda samtidigt som den håller sig svalare, men den har också en högre förbrukning. Schenker XMG Neo 15ger också en betydligt högre 3D-prestanda och håller sig också svalare. Dessutom erbjuder den den längre batteritid, men å andra sidan är den också ännu högre ljudnivå.
Pris och tillgänglighet
Olika konfigurationer av m15 R6 finns för närvarande tillgängliga på Dell från cirka 1200 dollar. Amazon erbjuder en högre modell konfiguration för 1783 dollar
Alienware m15 R6, i7-11800H RTX 3080
- 11/25/2021 v7 (old)
Christian Hintze
Price comparison

