Dell Inspiron 16 Plus 7610 recension: Mer prestanda utan Nvidia?

Skulle en Inspiron 16 Plus 7610 utan Nvidia-grafikkort kanske vara bättre för mig som inte spelar än dGPU-versionen? Vi köpte en Inspiron 16 Plus 7610 MHJ8F med etti7-11800H, 16 GB RAM och 512 GB SSD för att besvara exakt denna fråga. I testet avInspiron 16 Plus 7610 med RTXhade våra kollegor klagat på processorns prestandautveckling under genomsnittet. Så har Core i7 nu mer utrymme när det gäller kylningen? Är värmeutvecklingen kanske lägre eller batteritiden längre? Vi får reda på svaren i det här testet
Possible Competitors in Comparison
Gradering | Datum | Modell | Vikt | Höjd | Storlek | Upplösning | Pris |
|---|---|---|---|---|---|---|---|
| 82.6 % v7 (old) | 11/2021 | Dell Inspiron 16 Plus 7610-MHJ8F i7-11800H, UHD Graphics Xe 32EUs (Tiger Lake-H) | 2 kg | 19 mm | 16.00" | 3072x1920 | |
| 86.7 % v7 (old) | 10/2021 | Dell Inspiron 16 Plus 7610 i7-11800H, GeForce RTX 3050 4GB Laptop GPU | 2 kg | 18.99 mm | 16.00" | 3072x1920 | |
| 86.3 % v7 (old) | 09/2021 | LG Gram 16 (2021) i7-1165G7, Iris Xe G7 96EUs | 1.2 kg | 16.8 mm | 16.00" | 2560x1600 | |
| 87.4 % v7 (old) | 09/2021 | Lenovo Legion 5 Pro 16ACH6H (82JQ001PGE) R7 5800H, GeForce RTX 3070 Laptop GPU | 2.6 kg | 26.85 mm | 16.00" | 2560x1600 | |
| 82.4 % v7 (old) | 01/2021 | Dell Inspiron 15 7000 7506 2-in-1 Black Edition i7-1165G7, Xe MAX | 1.9 kg | 17.94 mm | 15.60" | 3840x2160 | |
| 82.7 % v7 (old) | Acer Aspire 5 A517-52G-79Z5 i7-1165G7, GeForce MX350 | 2.2 kg | 19.9 mm | 17.30" | 1920x1080 |
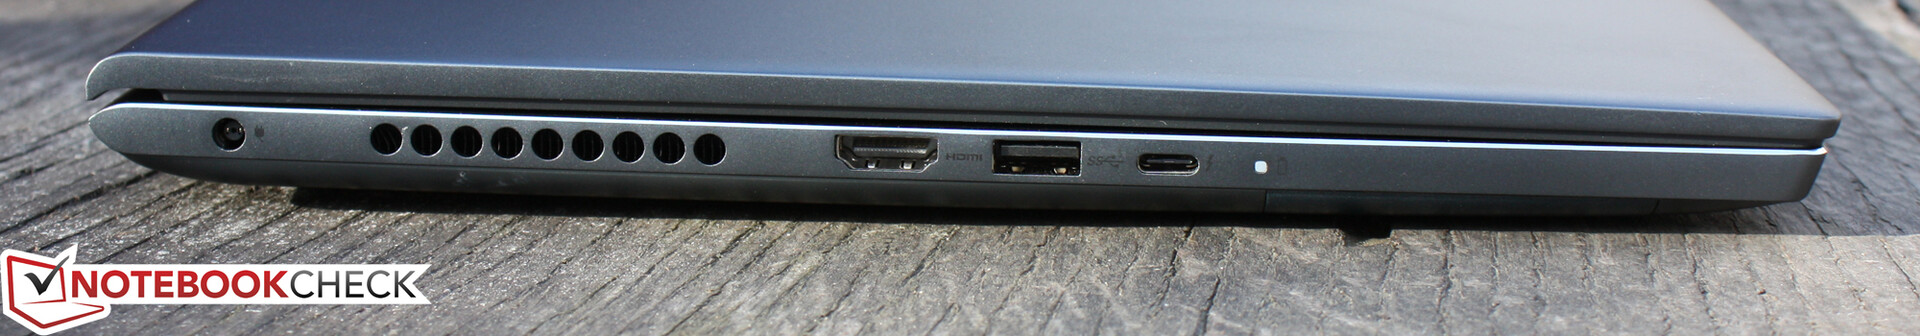
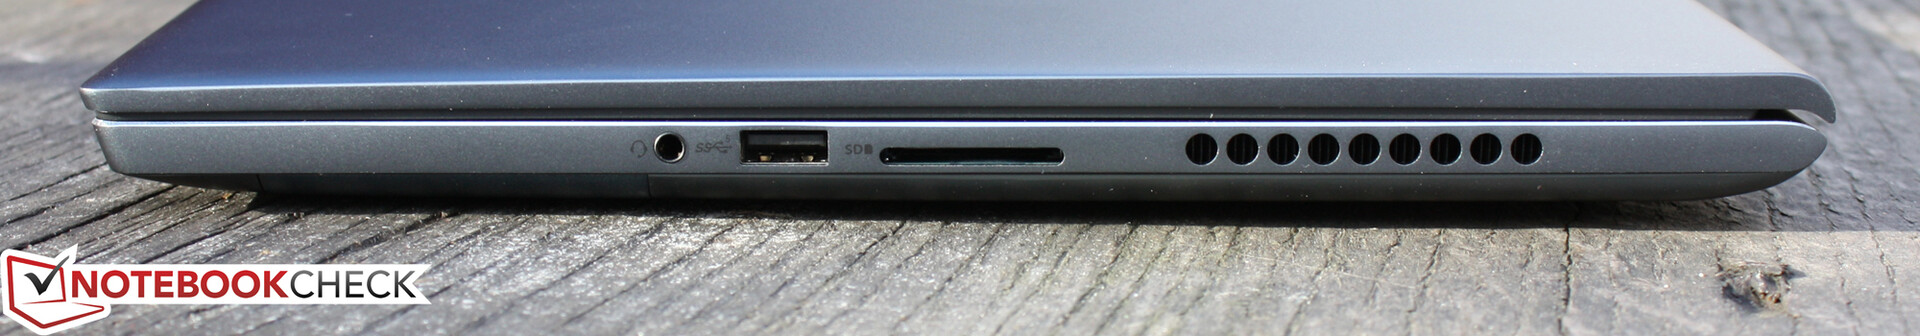
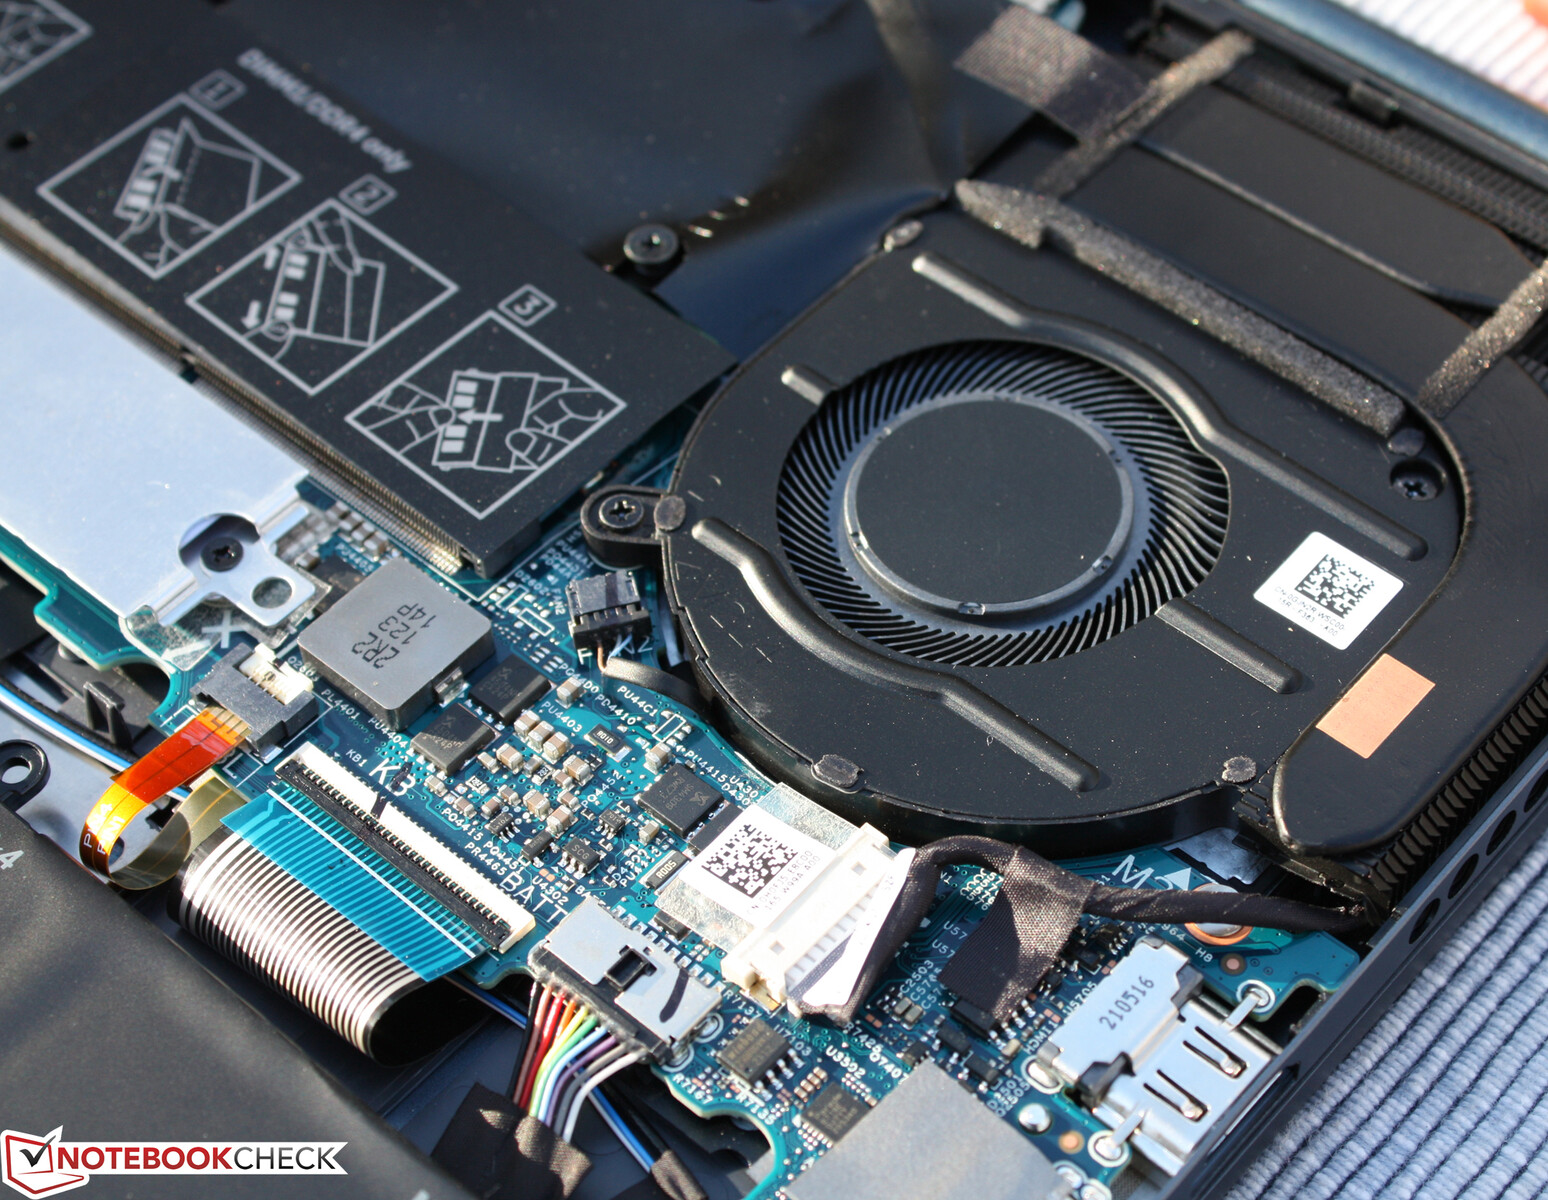
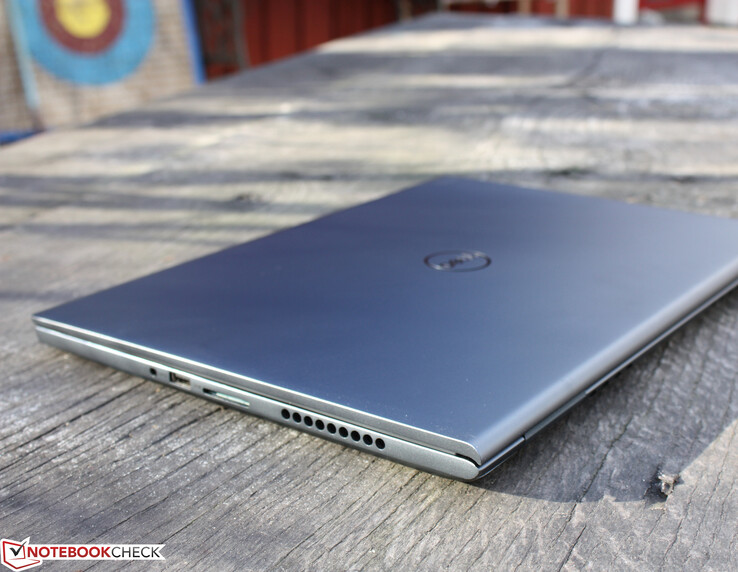
Väska och utrustning
Du kan läsa alla detaljer om detta i vårt fullständiga test av Dell Inspiron 16 Plus 7610GPU-version.


| SD Card Reader | |
| average JPG Copy Test (av. of 3 runs) | |
| Genomsnitt av klass Multimedia (23 - 531, n=43, senaste 2 åren) | |
| LG Gram 16 (2021) (Toshiba Exceria Pro M501 microSDXC 64GB) | |
| Dell Inspiron 15 7000 7506 2-in-1 Black Edition (Toshiba Exceria Pro M501 microSDXC 32GB) | |
| Dell Inspiron 16 Plus 7610-MHJ8F (AV Pro SD microSD 128 GB V60) | |
| Dell Inspiron 16 Plus 7610 (AV PRO microSD 128 GB V60) | |
| maximum AS SSD Seq Read Test (1GB) | |
| Genomsnitt av klass Multimedia (27.9 - 1455, n=42, senaste 2 åren) | |
| LG Gram 16 (2021) (Toshiba Exceria Pro M501 microSDXC 64GB) | |
| Dell Inspiron 15 7000 7506 2-in-1 Black Edition (Toshiba Exceria Pro M501 microSDXC 32GB) | |
| Dell Inspiron 16 Plus 7610-MHJ8F (AV Pro SD microSD 128 GB V60) | |
| Dell Inspiron 16 Plus 7610 (AV PRO microSD 128 GB V60) | |
| Networking | |
| iperf3 transmit AX12 | |
| Acer Aspire 5 A517-52G-79Z5 | |
| Dell Inspiron 16 Plus 7610-MHJ8F | |
| Genomsnitt Intel Wi-Fi 6 AX201 (49.8 - 1775, n=324) | |
| Lenovo Legion 5 Pro 16ACH6H (82JQ001PGE) | |
| LG Gram 16 (2021) | |
| Dell Inspiron 16 Plus 7610 | |
| Dell Inspiron 15 7000 7506 2-in-1 Black Edition | |
| iperf3 receive AX12 | |
| Genomsnitt Intel Wi-Fi 6 AX201 (136 - 1743, n=324) | |
| Dell Inspiron 16 Plus 7610-MHJ8F | |
| Dell Inspiron 16 Plus 7610 | |
| Lenovo Legion 5 Pro 16ACH6H (82JQ001PGE) | |
| Dell Inspiron 15 7000 7506 2-in-1 Black Edition | |
| Acer Aspire 5 A517-52G-79Z5 | |
| LG Gram 16 (2021) | |

, i7-11800H, OM3PDP3-AD NVMe KDI 512GB")
, i7-11800H, OM3PDP3-AD NVMe KDI 512GB")
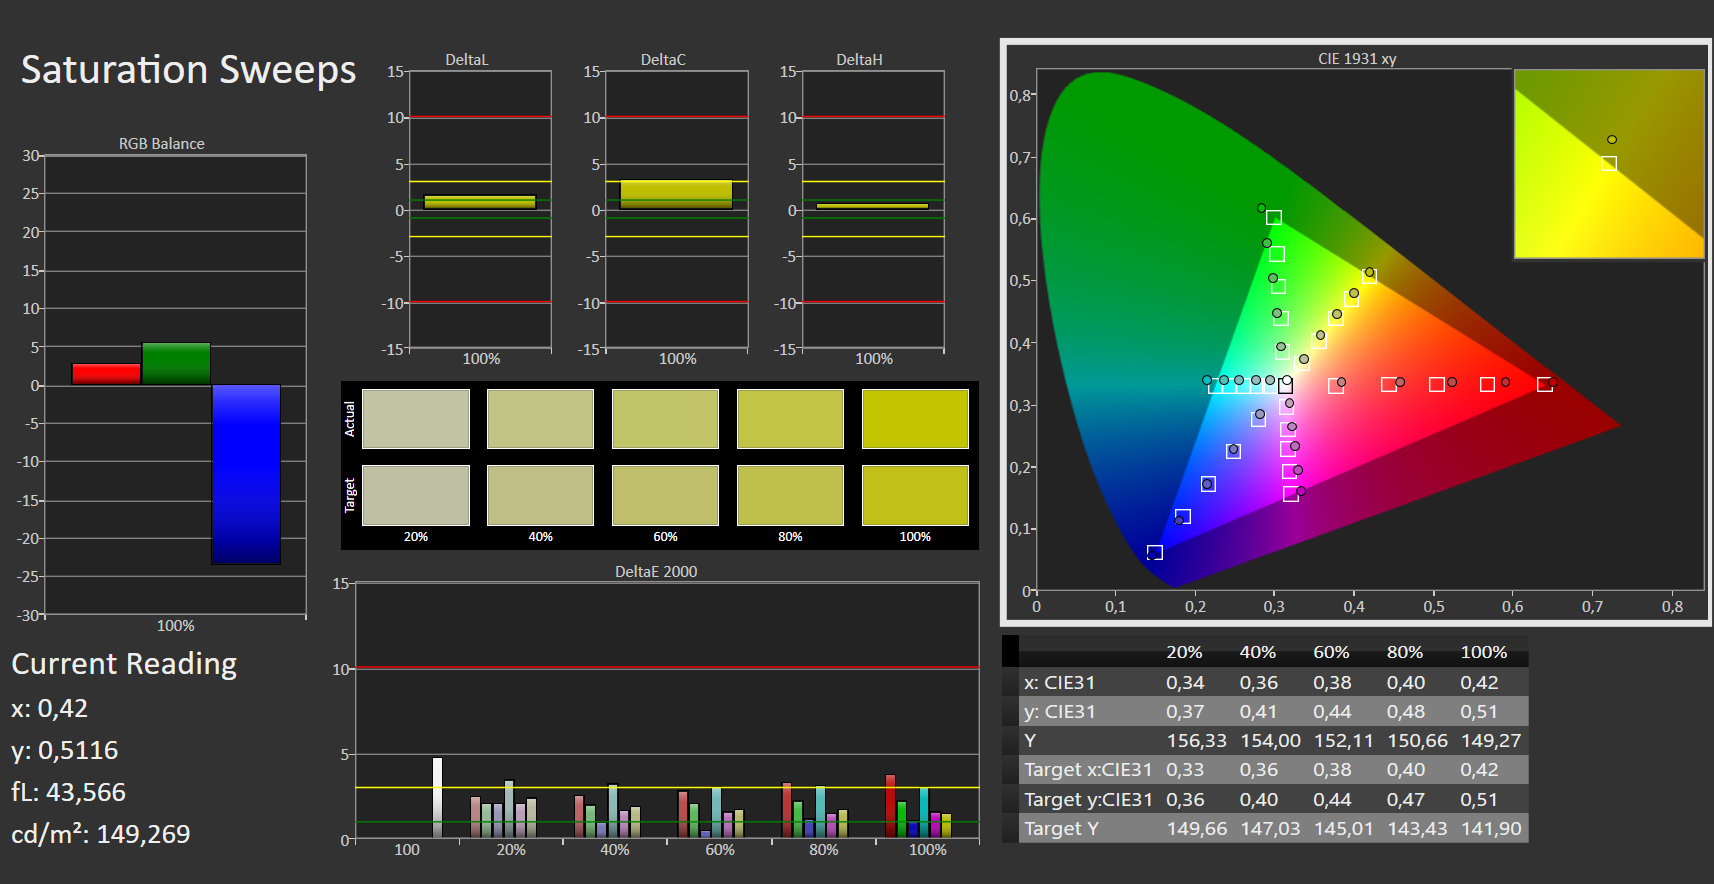
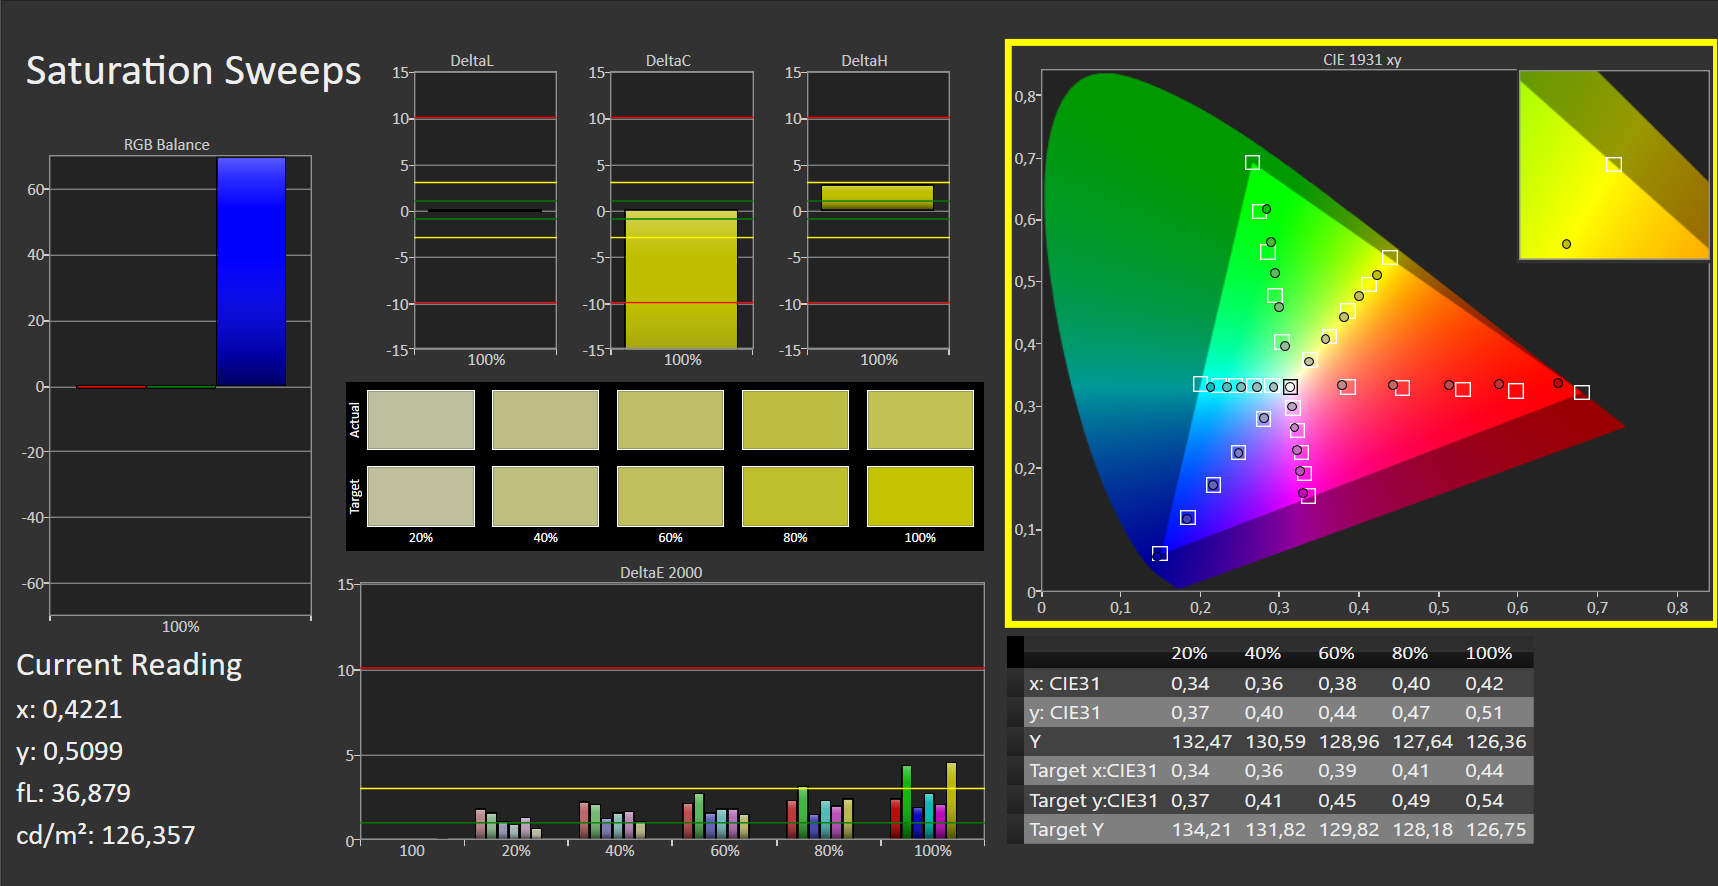
Skärm - Bra färger, acceptabel ljusstyrka och långsam svarstid
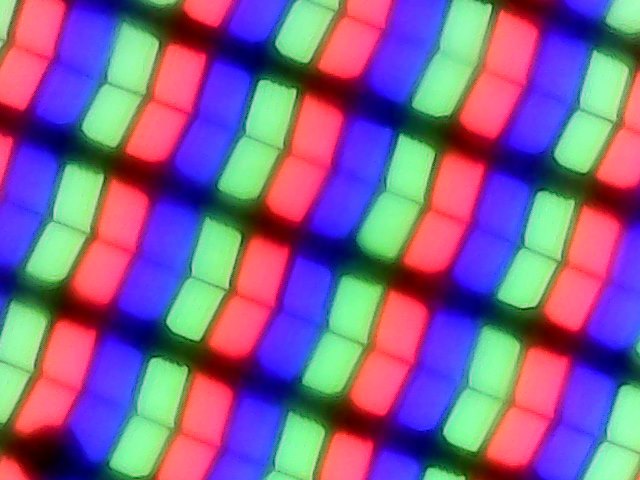
Vår testenhet använder också 3K AU Optronics B160QAN IPS-panel, som tydligen är standard för alla 7610-modeller. Upplösningen är identisk med den för MacBook Pro 16. Eftersom DPI blir nästan lika högt som i en 4K-skärm kan du behöva justera din textskalering för att förbättra läsbarheten.
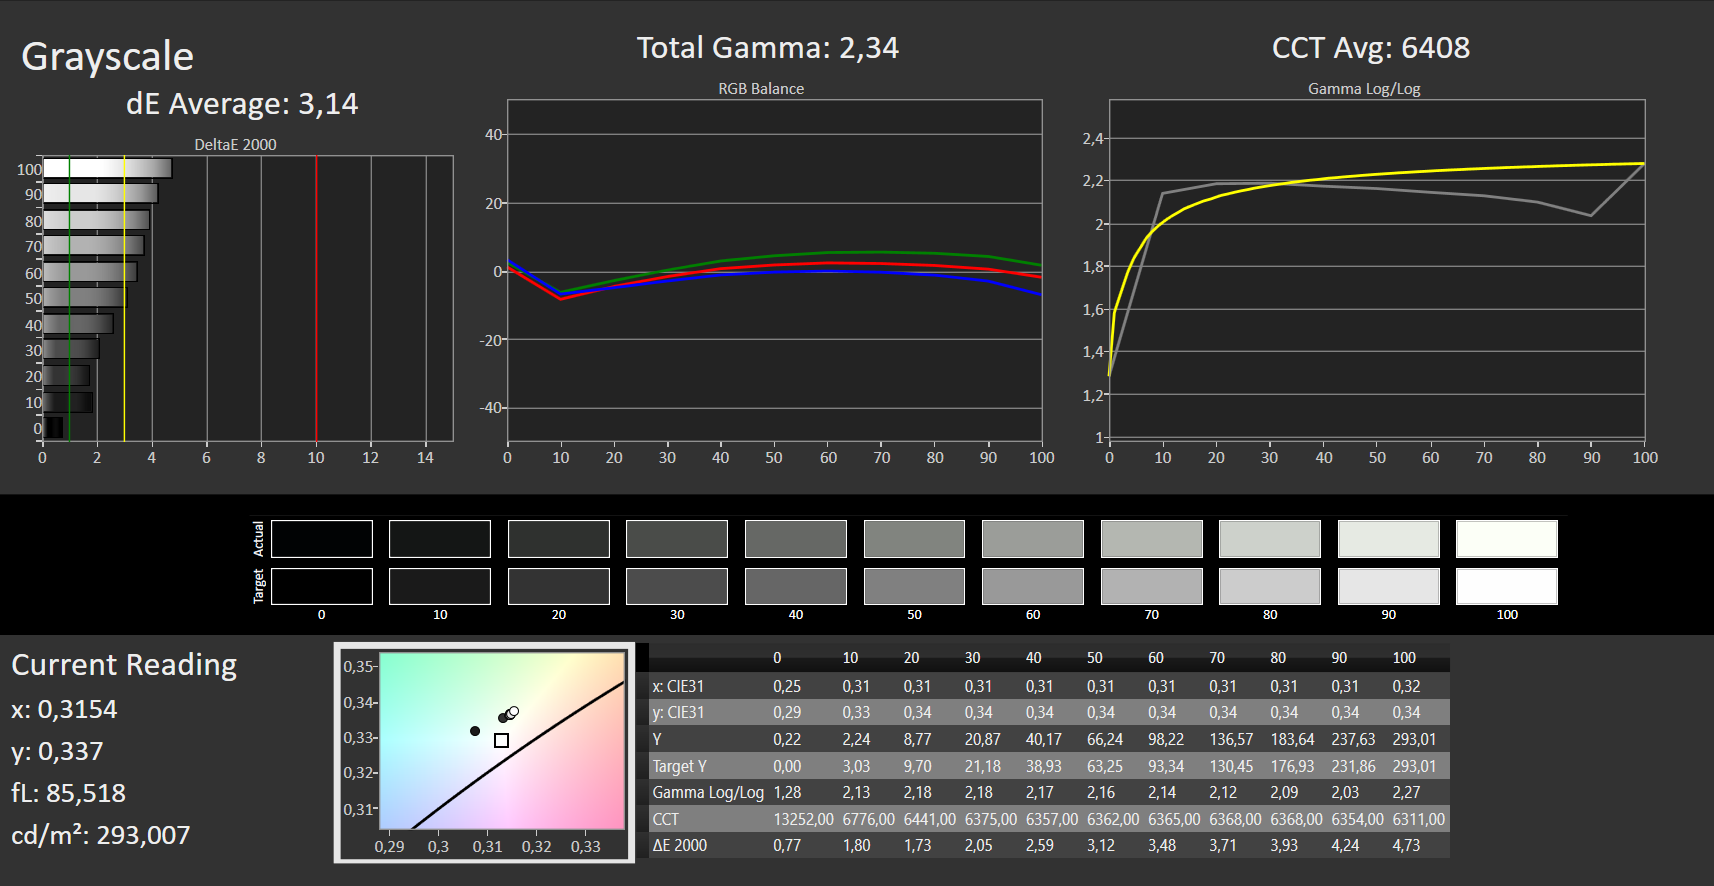
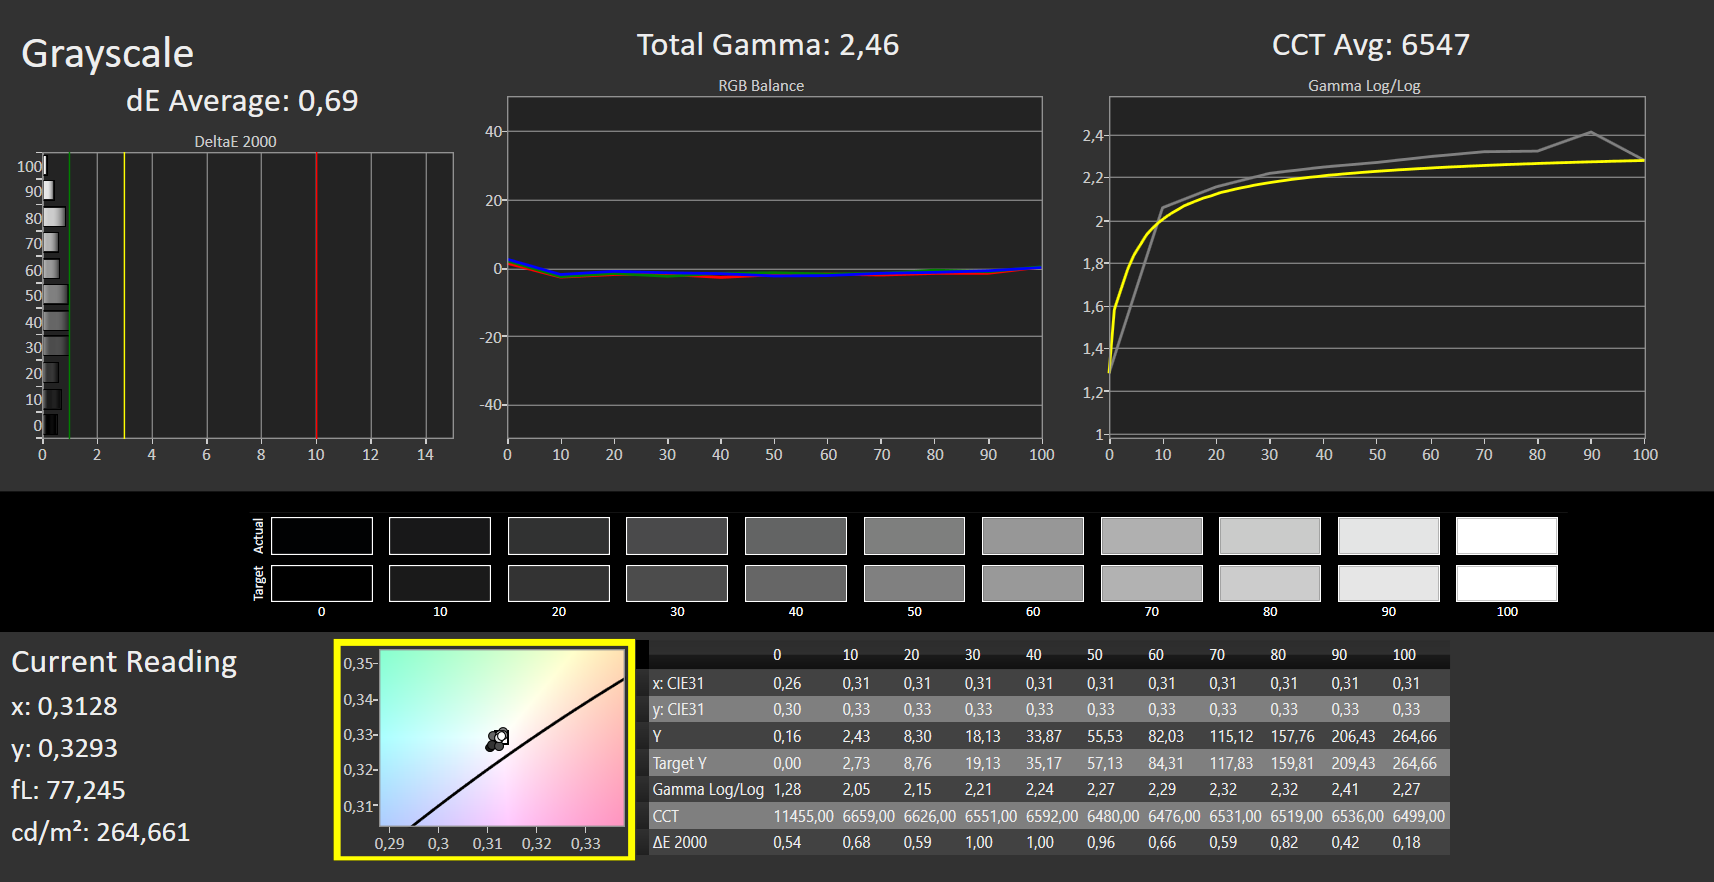
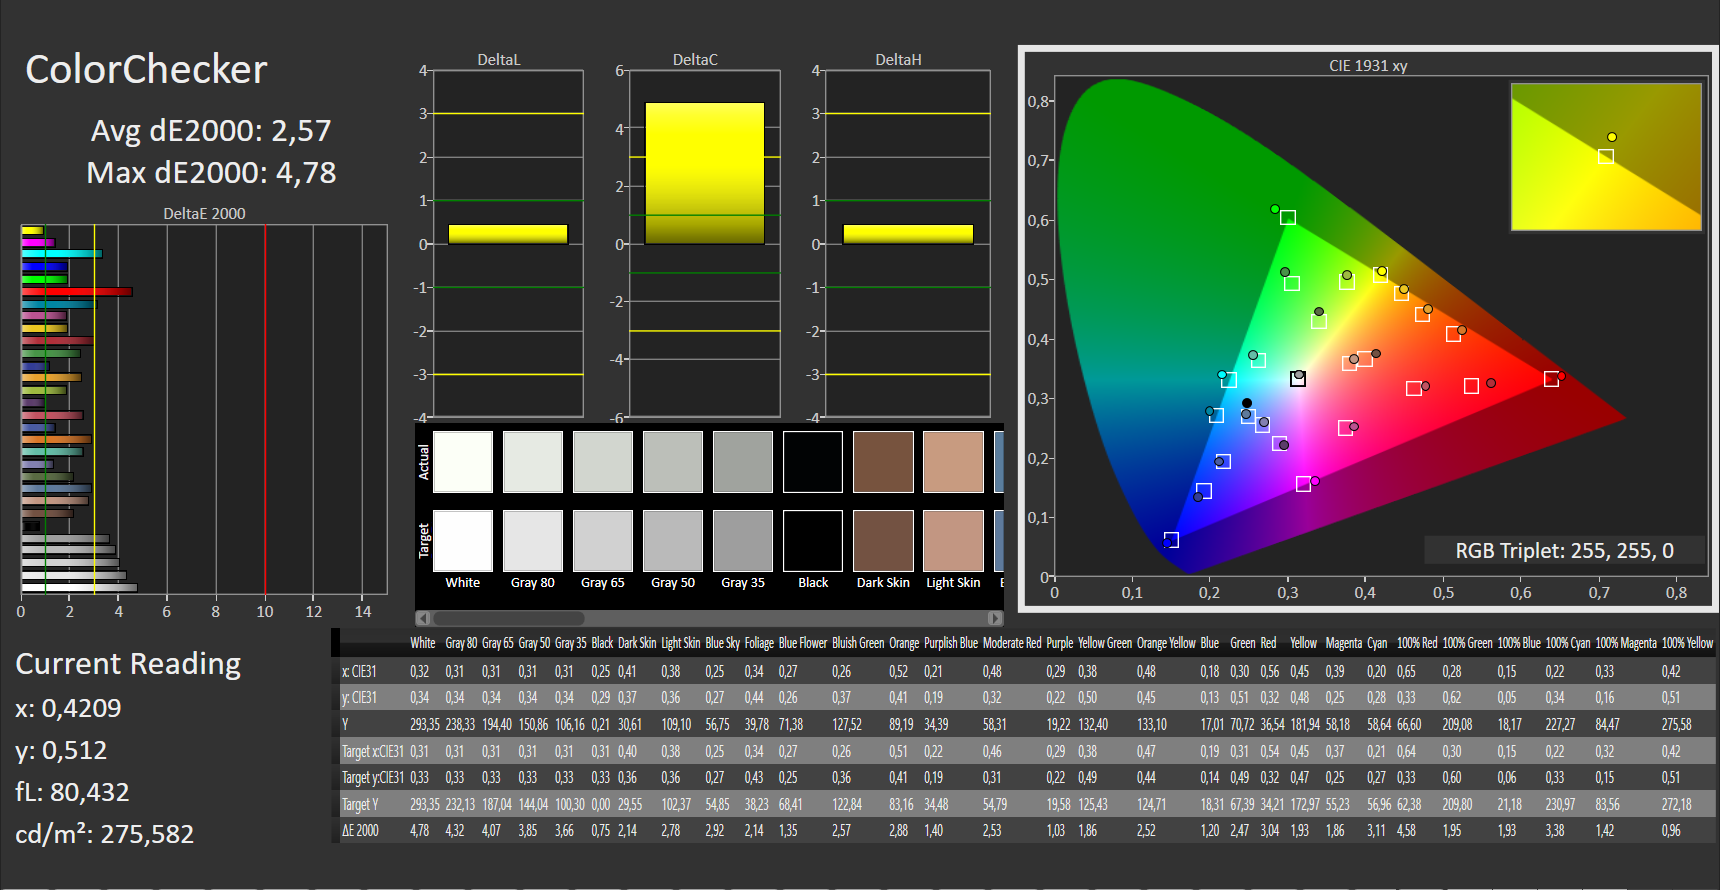
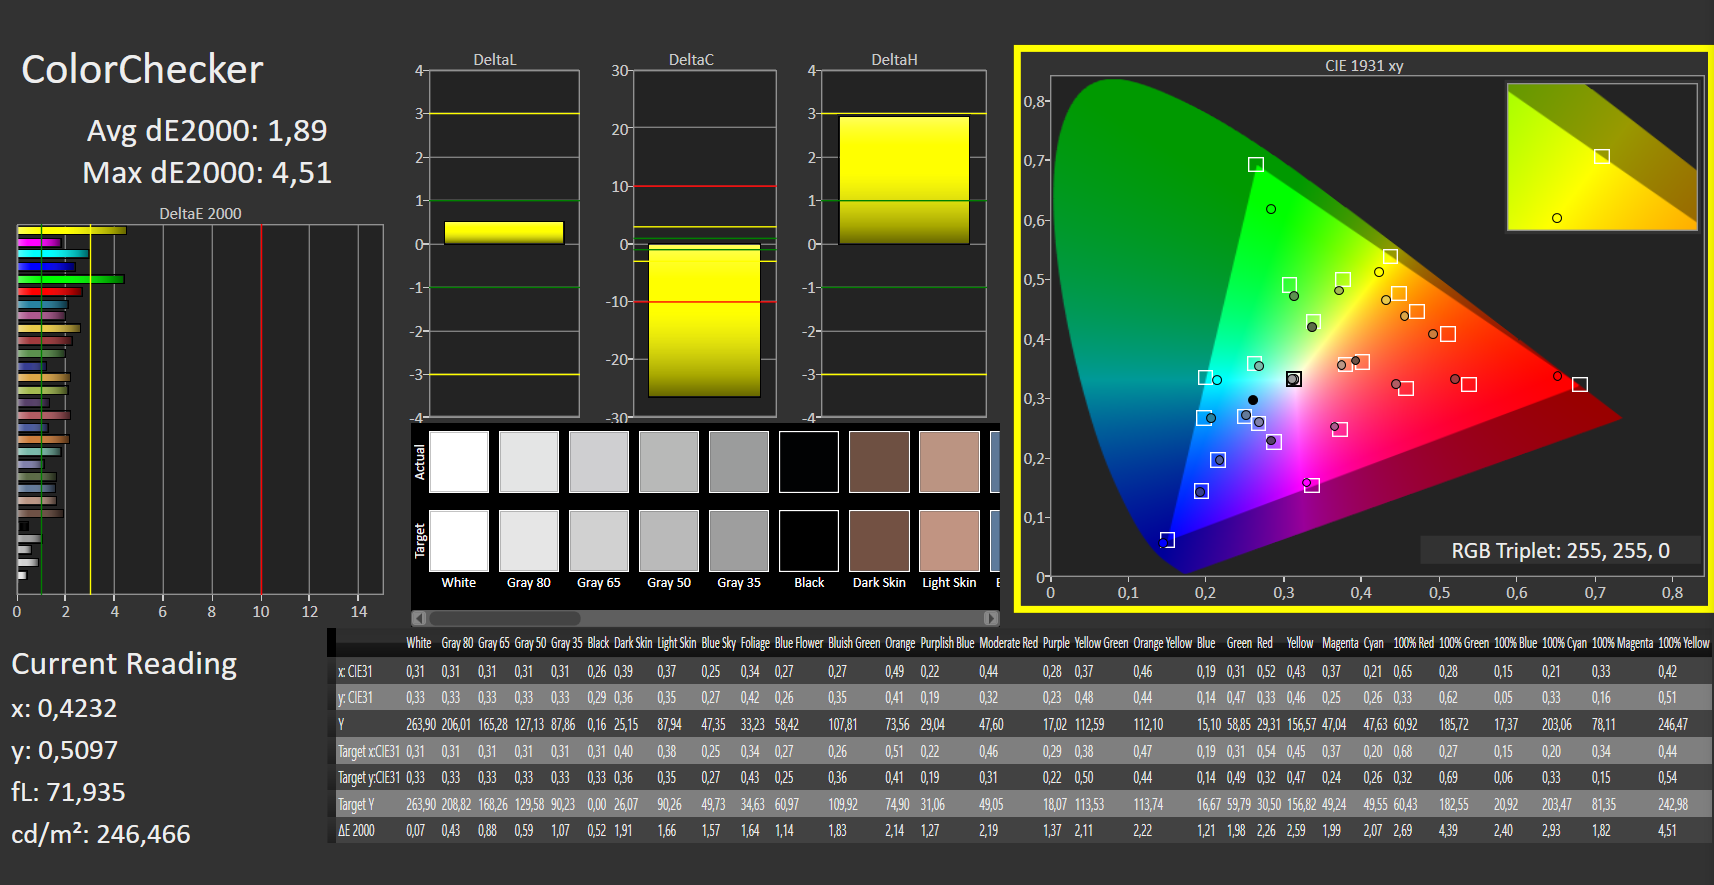
På grund av panelens identiska uppbyggnad som i Geforce-modellen gäller samma punkter även här: skärmkvaliteten är bra men inte utmärkt, kontrastförhållandet ligger på nästan 1400:1, DeltaE-avvikelserna är låga och sRGB täcks - men inte Adobe-färgrymden. Inspiron 16 skiljer sig med sina långsamma svarstider från bärbara 16-tums gamingdatorer som Legion 5 Pro, som erbjuder betydligt snabbare svarstider. Jämfört med konkurrenterna är ljusstyrkan måttlig, men jämnt fördelad. Det finns ingen PWM.
| |||||||||||||||||||||||||
Distribution av ljusstyrkan: 88 %
Mitt på batteriet: 275 cd/m²
Kontrast: 1381:1 (Svärta: 0.21 cd/m²)
ΔE ColorChecker Calman: 2.57 | ∀{0.5-29.43 Ø4.73}
calibrated: 1.89
ΔE Greyscale Calman: 3.14 | ∀{0.09-98 Ø4.97}
76% AdobeRGB 1998 (Argyll 3D)
100% sRGB (Argyll 3D)
75% Display P3 (Argyll 3D)
Gamma: 2.34
CCT: 6408 K
| Dell Inspiron 16 Plus 7610-MHJ8F AU Optronics B160QAN, AUO9F91, IPS, 3072x1920, 16" | Dell Inspiron 16 Plus 7610 AU Optronics B160QAN, IPS, 3072x1920, 16" | LG Gram 16 (2021) LG Philips LP160WQ1-SPA1, IPS, 2560x1600, 16" | Lenovo Legion 5 Pro 16ACH6H (82JQ001PGE) CSOT T3 MNG007DA1-1, IPS, 2560x1600, 16" | Dell Inspiron 15 7000 7506 2-in-1 Black Edition AU Optronics B156ZAN, IPS, 3840x2160, 15.6" | Acer Aspire 5 A517-52G-79Z5 BOE084E, IPS, 1920x1080, 17.3" | |
|---|---|---|---|---|---|---|
| Display | -1% | 13% | -3% | -1% | -45% | |
| Display P3 Coverage (%) | 75 | 74.1 -1% | 95.8 28% | 74.3 -1% | 39.98 -47% | |
| sRGB Coverage (%) | 100 | 99.4 -1% | 99.8 0% | 99 -1% | 99 -1% | 59.3 -41% |
| AdobeRGB 1998 Coverage (%) | 76 | 75.8 0% | 83.8 10% | 73 -4% | 74.6 -2% | 41.3 -46% |
| Response Times | -3% | 28% | 84% | -4% | 75% | |
| Response Time Grey 50% / Grey 80% * (ms) | 54 ? | 49.2 ? 9% | 44 ? 19% | 9.2 ? 83% | 55.2 ? -2% | 14 ? 74% |
| Response Time Black / White * (ms) | 32 ? | 36.8 ? -15% | 20 ? 37% | 4.8 85% | 34 ? -6% | 8 ? 75% |
| PWM Frequency (Hz) | ||||||
| Screen | 3% | -39% | 13% | -33% | -24% | |
| Brightness middle (cd/m²) | 290 | 296.8 2% | 331 14% | 551 90% | 303.8 5% | 321 11% |
| Brightness (cd/m²) | 285 | 292 2% | 309 8% | 523 84% | 296 4% | 282 -1% |
| Brightness Distribution (%) | 88 | 87 -1% | 88 0% | 88 0% | 93 6% | 81 -8% |
| Black Level * (cd/m²) | 0.21 | 0.21 -0% | 0.22 -5% | 0.54 -157% | 0.24 -14% | 0.36 -71% |
| Contrast (:1) | 1381 | 1413 2% | 1505 9% | 1020 -26% | 1266 -8% | 892 -35% |
| Colorchecker dE 2000 * | 2.57 | 2.56 -0% | 4.64 -81% | 1.8 30% | 4.58 -78% | 4.3 -67% |
| Colorchecker dE 2000 max. * | 4.78 | 4.76 -0% | 9.82 -105% | 2.53 47% | 9.4 -97% | 7.1 -49% |
| Colorchecker dE 2000 calibrated * | 1.89 | 1.86 2% | 3.16 -67% | 1.66 12% | 2.17 -15% | |
| Greyscale dE 2000 * | 3.14 | 2.6 17% | 6.9 -120% | 1.85 41% | 6.4 -104% | 2.26 28% |
| Gamma | 2.34 94% | 2.07 106% | 2.34 94% | 2.3 96% | 2.3 96% | 2.36 93% |
| CCT | 6408 101% | 6628 98% | 7904 82% | 6338 103% | 7414 88% | 6650 98% |
| Color Space (Percent of AdobeRGB 1998) (%) | 75.1 | 72.81 | 66.7 | 38 | ||
| Color Space (Percent of sRGB) (%) | 100 | 99.41 | 99 | 59 | ||
| Totalt genomsnitt (program/inställningar) | -0% /
1% | 1% /
-18% | 31% /
22% | -13% /
-22% | 2% /
-14% |
* ... mindre är bättre
Visa svarstider
| ↔ Svarstid svart till vitt | ||
|---|---|---|
| 32 ms ... stiga ↗ och falla ↘ kombinerat | ↗ 15 ms stiga |  |
| ↘ 17 ms hösten | ||
| Skärmen visar långsamma svarsfrekvenser i våra tester och kommer att vara otillfredsställande för spelare. I jämförelse sträcker sig alla testade enheter från 0.1 (minst) till 240 (maximalt) ms. » 86 % av alla enheter är bättre. Detta innebär att den uppmätta svarstiden är sämre än genomsnittet av alla testade enheter (19.9 ms). | ||
| ↔ Svarstid 50 % grått till 80 % grått | ||
| 54 ms ... stiga ↗ och falla ↘ kombinerat | ↗ 24 ms stiga |  |
| ↘ 30 ms hösten | ||
| Skärmen visar långsamma svarsfrekvenser i våra tester och kommer att vara otillfredsställande för spelare. I jämförelse sträcker sig alla testade enheter från 0.165 (minst) till 636 (maximalt) ms. » 91 % av alla enheter är bättre. Detta innebär att den uppmätta svarstiden är sämre än genomsnittet av alla testade enheter (31.1 ms). | ||
Skärmflimmer / PWM (Puls-Width Modulation)
| Skärmflimmer / PWM upptäcktes inte |  | ||
Som jämförelse: 52 % av alla testade enheter använder inte PWM för att dämpa skärmen. Om PWM upptäcktes mättes ett medelvärde av 7798 (minst: 5 - maximum: 343500) Hz. | |||
Prestanda
Som standard används Intels Tiger Lake H CPU:er (11400H, 11800H) och som tillval en GeForce RTX 3050 eller RTX 3060används. Även om vår testenhet inte har någon dGPU är den inte riktigt lågprestandan med sina 16 GB RAM-minne. Vid tidpunkten för testet finns det inga modeller från AMD.
Testvillkor
Benchmarks kördes i nätdrift med den högsta prestandaprofilen.
Processor
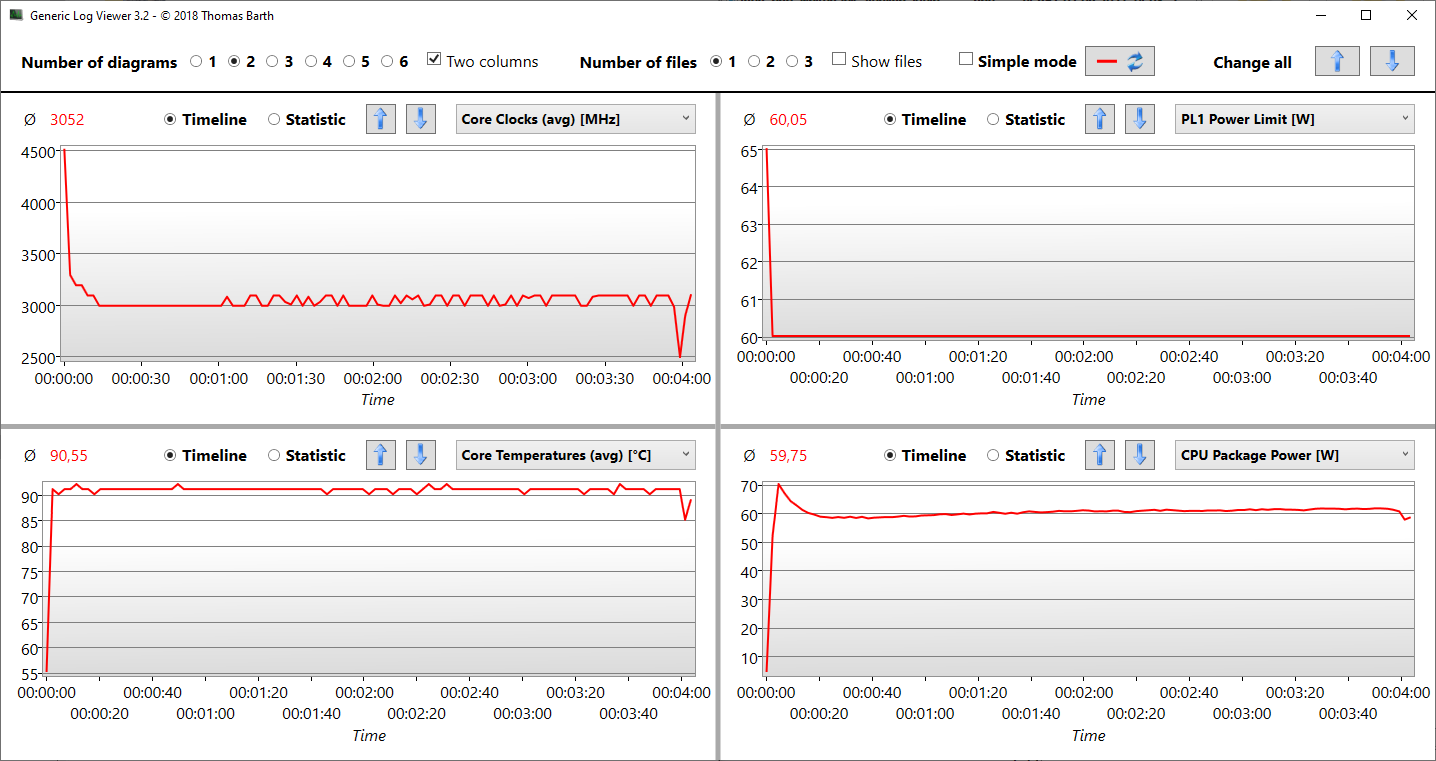
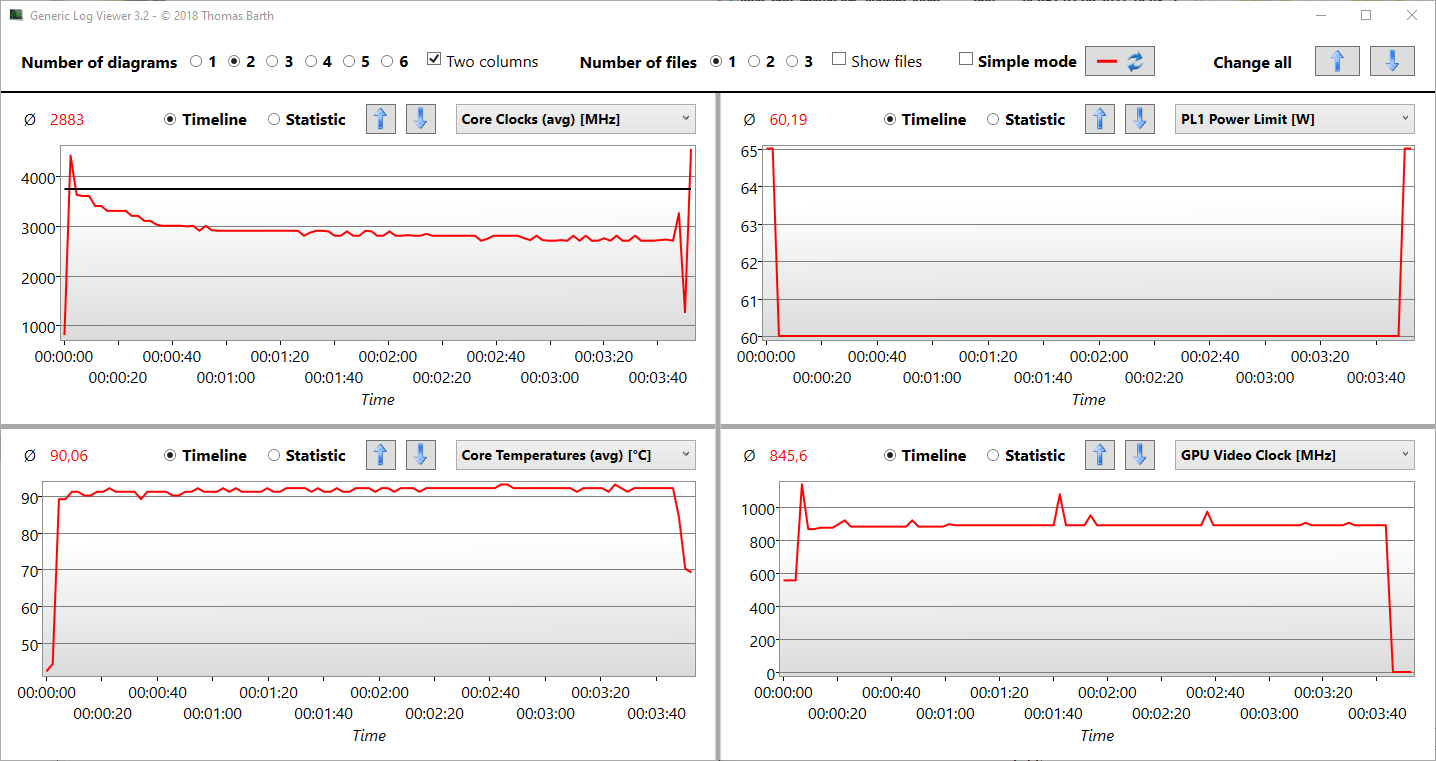
CPU-prestandan kunde vara bättre, och Cinebench-resultaten för flera trådar ligger 5-20 % efter resultaten för en genomsnittlig bärbar dator utrustad med en Core i7-11800H. Inspiron 16 Plus 7610 utan dGPU uppnår endast 13 % fler poäng i ett enda riktmärke, R15, än den identiska SoC:n i modellen med Geforce. Det ser alltså ut som om modellen utan dGPU inte har några termiska fördelar. Prestandan i en enda tråd är utmärkt och motsvarar våra förväntningar på en11800H. Från den första till den tredje körningen visar R15-slingan en fördel för testenheten, så lite mer termiskt utrymme kan vara möjligt här, vilket gör att klockfrekvensen kan ligga kvar på en hög nivå i flera sekunder längre. Grafisk logg 15 visar i detalj vad som händer: Den skrapar kortvarigt 4 GHz innan den sjunker till 3,6 GHz och PL1 sänks med 5 watt. Men som redan sagts uppnår i7-11800H utan dGPU-begledning endast bättre resultat i R15- och Blender-benchmarks
Cinebench R15 Multi Constant Load Test
Cinebench R23: Multi Core | Single Core
Cinebench R20: CPU (Multi Core) | CPU (Single Core)
Cinebench R15: CPU Multi 64Bit | CPU Single 64Bit
Blender: v2.79 BMW27 CPU
7-Zip 18.03: 7z b 4 | 7z b 4 -mmt1
Geekbench 5.5: Multi-Core | Single-Core
HWBOT x265 Benchmark v2.2: 4k Preset
LibreOffice : 20 Documents To PDF
R Benchmark 2.5: Overall mean
| CPU Performance rating | |
| Genomsnitt av klass Multimedia | |
| Genomsnitt Intel Core i7-11800H | |
| Lenovo Legion 5 Pro 16ACH6H (82JQ001PGE) | |
| Dell Inspiron 16 Plus 7610 -2! | |
| Dell Inspiron 16 Plus 7610-MHJ8F | |
| Acer Aspire 5 A517-52G-79Z5 | |
| Dell Inspiron 15 7000 7506 2-in-1 Black Edition -1! | |
| LG Gram 16 (2021) | |
| Cinebench R23 / Multi Core | |
| Genomsnitt av klass Multimedia (4861 - 33362, n=81, senaste 2 åren) | |
| Lenovo Legion 5 Pro 16ACH6H (82JQ001PGE) | |
| Lenovo Legion 5 Pro 16ACH6H (82JQ001PGE) | |
| Genomsnitt Intel Core i7-11800H (6508 - 14088, n=48) | |
| Dell Inspiron 16 Plus 7610-MHJ8F | |
| Dell Inspiron 16 Plus 7610 | |
| Acer Aspire 5 A517-52G-79Z5 | |
| Dell Inspiron 15 7000 7506 2-in-1 Black Edition | |
| LG Gram 16 (2021) | |
| Cinebench R23 / Single Core | |
| Genomsnitt av klass Multimedia (1128 - 2459, n=73, senaste 2 åren) | |
| Dell Inspiron 16 Plus 7610 | |
| Acer Aspire 5 A517-52G-79Z5 | |
| Dell Inspiron 16 Plus 7610-MHJ8F | |
| Genomsnitt Intel Core i7-11800H (1386 - 1522, n=45) | |
| Lenovo Legion 5 Pro 16ACH6H (82JQ001PGE) | |
| Lenovo Legion 5 Pro 16ACH6H (82JQ001PGE) | |
| LG Gram 16 (2021) | |
| Cinebench R20 / CPU (Multi Core) | |
| Genomsnitt av klass Multimedia (1887 - 12912, n=64, senaste 2 åren) | |
| Lenovo Legion 5 Pro 16ACH6H (82JQ001PGE) | |
| Lenovo Legion 5 Pro 16ACH6H (82JQ001PGE) | |
| Genomsnitt Intel Core i7-11800H (2498 - 5408, n=50) | |
| Dell Inspiron 16 Plus 7610 | |
| Dell Inspiron 16 Plus 7610-MHJ8F | |
| Acer Aspire 5 A517-52G-79Z5 | |
| Dell Inspiron 15 7000 7506 2-in-1 Black Edition | |
| LG Gram 16 (2021) | |
| Cinebench R20 / CPU (Single Core) | |
| Genomsnitt av klass Multimedia (425 - 853, n=64, senaste 2 åren) | |
| Dell Inspiron 16 Plus 7610 | |
| Dell Inspiron 16 Plus 7610-MHJ8F | |
| Genomsnitt Intel Core i7-11800H (520 - 586, n=47) | |
| Acer Aspire 5 A517-52G-79Z5 | |
| Lenovo Legion 5 Pro 16ACH6H (82JQ001PGE) | |
| Lenovo Legion 5 Pro 16ACH6H (82JQ001PGE) | |
| LG Gram 16 (2021) | |
| Dell Inspiron 15 7000 7506 2-in-1 Black Edition | |
| Cinebench R15 / CPU Multi 64Bit | |
| Genomsnitt av klass Multimedia (856 - 5224, n=68, senaste 2 åren) | |
| Lenovo Legion 5 Pro 16ACH6H (82JQ001PGE) | |
| Genomsnitt Intel Core i7-11800H (1342 - 2173, n=50) | |
| Dell Inspiron 16 Plus 7610-MHJ8F | |
| Dell Inspiron 16 Plus 7610 | |
| Acer Aspire 5 A517-52G-79Z5 | |
| LG Gram 16 (2021) | |
| Dell Inspiron 15 7000 7506 2-in-1 Black Edition | |
| Cinebench R15 / CPU Single 64Bit | |
| Genomsnitt av klass Multimedia (184.8 - 326, n=66, senaste 2 åren) | |
| Lenovo Legion 5 Pro 16ACH6H (82JQ001PGE) | |
| Lenovo Legion 5 Pro 16ACH6H (82JQ001PGE) | |
| Dell Inspiron 16 Plus 7610 | |
| Dell Inspiron 16 Plus 7610-MHJ8F | |
| Genomsnitt Intel Core i7-11800H (201 - 231, n=46) | |
| Acer Aspire 5 A517-52G-79Z5 | |
| LG Gram 16 (2021) | |
| Dell Inspiron 15 7000 7506 2-in-1 Black Edition | |
| Blender / v2.79 BMW27 CPU | |
| LG Gram 16 (2021) | |
| Dell Inspiron 15 7000 7506 2-in-1 Black Edition | |
| Acer Aspire 5 A517-52G-79Z5 | |
| Dell Inspiron 16 Plus 7610-MHJ8F | |
| Genomsnitt Intel Core i7-11800H (217 - 454, n=46) | |
| Dell Inspiron 16 Plus 7610 | |
| Lenovo Legion 5 Pro 16ACH6H (82JQ001PGE) | |
| Lenovo Legion 5 Pro 16ACH6H (82JQ001PGE) | |
| Genomsnitt av klass Multimedia (100 - 557, n=65, senaste 2 åren) | |
| 7-Zip 18.03 / 7z b 4 | |
| Genomsnitt av klass Multimedia (29095 - 130368, n=62, senaste 2 åren) | |
| Lenovo Legion 5 Pro 16ACH6H (82JQ001PGE) | |
| Lenovo Legion 5 Pro 16ACH6H (82JQ001PGE) | |
| Genomsnitt Intel Core i7-11800H (33718 - 56758, n=46) | |
| Dell Inspiron 16 Plus 7610 | |
| Dell Inspiron 16 Plus 7610-MHJ8F | |
| Acer Aspire 5 A517-52G-79Z5 | |
| Dell Inspiron 15 7000 7506 2-in-1 Black Edition | |
| LG Gram 16 (2021) | |
| 7-Zip 18.03 / 7z b 4 -mmt1 | |
| Genomsnitt av klass Multimedia (3666 - 7545, n=63, senaste 2 åren) | |
| Dell Inspiron 16 Plus 7610 | |
| Lenovo Legion 5 Pro 16ACH6H (82JQ001PGE) | |
| Lenovo Legion 5 Pro 16ACH6H (82JQ001PGE) | |
| Genomsnitt Intel Core i7-11800H (5138 - 5732, n=46) | |
| Acer Aspire 5 A517-52G-79Z5 | |
| Dell Inspiron 16 Plus 7610-MHJ8F | |
| Dell Inspiron 15 7000 7506 2-in-1 Black Edition | |
| LG Gram 16 (2021) | |
| Geekbench 5.5 / Multi-Core | |
| Genomsnitt av klass Multimedia (4652 - 20422, n=62, senaste 2 åren) | |
| Genomsnitt Intel Core i7-11800H (4655 - 9851, n=40) | |
| Lenovo Legion 5 Pro 16ACH6H (82JQ001PGE) | |
| Lenovo Legion 5 Pro 16ACH6H (82JQ001PGE) | |
| Dell Inspiron 16 Plus 7610-MHJ8F | |
| Dell Inspiron 16 Plus 7610-MHJ8F | |
| Dell Inspiron 16 Plus 7610-MHJ8F | |
| Dell Inspiron 15 7000 7506 2-in-1 Black Edition | |
| LG Gram 16 (2021) | |
| Acer Aspire 5 A517-52G-79Z5 | |
| Geekbench 5.5 / Single-Core | |
| Genomsnitt av klass Multimedia (805 - 2974, n=62, senaste 2 åren) | |
| Dell Inspiron 16 Plus 7610-MHJ8F | |
| Dell Inspiron 16 Plus 7610-MHJ8F | |
| Dell Inspiron 16 Plus 7610-MHJ8F | |
| Acer Aspire 5 A517-52G-79Z5 | |
| Genomsnitt Intel Core i7-11800H (1429 - 1625, n=40) | |
| LG Gram 16 (2021) | |
| Dell Inspiron 15 7000 7506 2-in-1 Black Edition | |
| Lenovo Legion 5 Pro 16ACH6H (82JQ001PGE) | |
| Lenovo Legion 5 Pro 16ACH6H (82JQ001PGE) | |
| HWBOT x265 Benchmark v2.2 / 4k Preset | |
| Genomsnitt av klass Multimedia (5.26 - 36.1, n=63, senaste 2 åren) | |
| Lenovo Legion 5 Pro 16ACH6H (82JQ001PGE) | |
| Lenovo Legion 5 Pro 16ACH6H (82JQ001PGE) | |
| Genomsnitt Intel Core i7-11800H (7.38 - 17.4, n=46) | |
| Dell Inspiron 16 Plus 7610 | |
| Dell Inspiron 16 Plus 7610-MHJ8F | |
| Dell Inspiron 15 7000 7506 2-in-1 Black Edition | |
| Acer Aspire 5 A517-52G-79Z5 | |
| LG Gram 16 (2021) | |
| LibreOffice / 20 Documents To PDF | |
| Lenovo Legion 5 Pro 16ACH6H (82JQ001PGE) | |
| Lenovo Legion 5 Pro 16ACH6H (82JQ001PGE) | |
| Acer Aspire 5 A517-52G-79Z5 | |
| Genomsnitt av klass Multimedia (23.9 - 146.7, n=64, senaste 2 åren) | |
| Dell Inspiron 15 7000 7506 2-in-1 Black Edition | |
| Genomsnitt Intel Core i7-11800H (38.6 - 59.9, n=45) | |
| Dell Inspiron 16 Plus 7610 | |
| LG Gram 16 (2021) | |
| Dell Inspiron 16 Plus 7610-MHJ8F | |
| R Benchmark 2.5 / Overall mean | |
| LG Gram 16 (2021) | |
| Dell Inspiron 15 7000 7506 2-in-1 Black Edition | |
| Dell Inspiron 16 Plus 7610-MHJ8F | |
| Acer Aspire 5 A517-52G-79Z5 | |
| Genomsnitt Intel Core i7-11800H (0.548 - 0.615, n=46) | |
| Dell Inspiron 16 Plus 7610 | |
| Lenovo Legion 5 Pro 16ACH6H (82JQ001PGE) | |
| Lenovo Legion 5 Pro 16ACH6H (82JQ001PGE) | |
| Genomsnitt av klass Multimedia (0.3604 - 0.947, n=63, senaste 2 åren) | |
* ... mindre är bättre
AIDA64: FP32 Ray-Trace | FPU Julia | CPU SHA3 | CPU Queen | FPU SinJulia | FPU Mandel | CPU AES | CPU ZLib | FP64 Ray-Trace | CPU PhotoWorxx
| Performance rating | |
| Genomsnitt av klass Multimedia | |
| Lenovo Legion 5 Pro 16ACH6H (82JQ001PGE) | |
| Genomsnitt Intel Core i7-11800H | |
| Dell Inspiron 16 Plus 7610-MHJ8F | |
| LG Gram 16 (2021) | |
| Dell Inspiron 16 Plus 7610 -9! | |
| AIDA64 / FP32 Ray-Trace | |
| Genomsnitt av klass Multimedia (2214 - 50388, n=60, senaste 2 åren) | |
| Lenovo Legion 5 Pro 16ACH6H (82JQ001PGE) | |
| Lenovo Legion 5 Pro 16ACH6H (82JQ001PGE) | |
| Genomsnitt Intel Core i7-11800H (8772 - 15961, n=20) | |
| Dell Inspiron 16 Plus 7610-MHJ8F | |
| LG Gram 16 (2021) | |
| AIDA64 / FPU Julia | |
| Lenovo Legion 5 Pro 16ACH6H (82JQ001PGE) | |
| Lenovo Legion 5 Pro 16ACH6H (82JQ001PGE) | |
| Genomsnitt av klass Multimedia (12867 - 201874, n=61, senaste 2 åren) | |
| Genomsnitt Intel Core i7-11800H (39404 - 65636, n=20) | |
| Dell Inspiron 16 Plus 7610-MHJ8F | |
| LG Gram 16 (2021) | |
| AIDA64 / CPU SHA3 | |
| Genomsnitt av klass Multimedia (653 - 8623, n=61, senaste 2 åren) | |
| Genomsnitt Intel Core i7-11800H (2599 - 4439, n=20) | |
| Dell Inspiron 16 Plus 7610-MHJ8F | |
| Lenovo Legion 5 Pro 16ACH6H (82JQ001PGE) | |
| Lenovo Legion 5 Pro 16ACH6H (82JQ001PGE) | |
| LG Gram 16 (2021) | |
| AIDA64 / CPU Queen | |
| Lenovo Legion 5 Pro 16ACH6H (82JQ001PGE) | |
| Lenovo Legion 5 Pro 16ACH6H (82JQ001PGE) | |
| Dell Inspiron 16 Plus 7610-MHJ8F | |
| Genomsnitt Intel Core i7-11800H (85233 - 91941, n=20) | |
| Genomsnitt av klass Multimedia (13483 - 181505, n=49, senaste 2 åren) | |
| LG Gram 16 (2021) | |
| AIDA64 / FPU SinJulia | |
| Lenovo Legion 5 Pro 16ACH6H (82JQ001PGE) | |
| Lenovo Legion 5 Pro 16ACH6H (82JQ001PGE) | |
| Genomsnitt Intel Core i7-11800H (6420 - 9792, n=20) | |
| Genomsnitt av klass Multimedia (1240 - 28794, n=61, senaste 2 åren) | |
| Dell Inspiron 16 Plus 7610-MHJ8F | |
| LG Gram 16 (2021) | |
| AIDA64 / FPU Mandel | |
| Lenovo Legion 5 Pro 16ACH6H (82JQ001PGE) | |
| Lenovo Legion 5 Pro 16ACH6H (82JQ001PGE) | |
| Genomsnitt av klass Multimedia (6395 - 105740, n=60, senaste 2 åren) | |
| Genomsnitt Intel Core i7-11800H (23365 - 39464, n=20) | |
| Dell Inspiron 16 Plus 7610-MHJ8F | |
| LG Gram 16 (2021) | |
| AIDA64 / CPU AES | |
| Lenovo Legion 5 Pro 16ACH6H (82JQ001PGE) | |
| Lenovo Legion 5 Pro 16ACH6H (82JQ001PGE) | |
| Genomsnitt Intel Core i7-11800H (74617 - 149388, n=20) | |
| Dell Inspiron 16 Plus 7610-MHJ8F | |
| Genomsnitt av klass Multimedia (13243 - 126790, n=61, senaste 2 åren) | |
| LG Gram 16 (2021) | |
| AIDA64 / CPU ZLib | |
| Genomsnitt av klass Multimedia (167.2 - 2022, n=61, senaste 2 åren) | |
| Lenovo Legion 5 Pro 16ACH6H (82JQ001PGE) | |
| Lenovo Legion 5 Pro 16ACH6H (82JQ001PGE) | |
| Dell Inspiron 16 Plus 7610-MHJ8F | |
| Genomsnitt Intel Core i7-11800H (461 - 830, n=43) | |
| LG Gram 16 (2021) | |
| Dell Inspiron 16 Plus 7610 | |
| AIDA64 / FP64 Ray-Trace | |
| Genomsnitt av klass Multimedia (1014 - 26875, n=61, senaste 2 åren) | |
| Lenovo Legion 5 Pro 16ACH6H (82JQ001PGE) | |
| Lenovo Legion 5 Pro 16ACH6H (82JQ001PGE) | |
| Genomsnitt Intel Core i7-11800H (4545 - 8717, n=21) | |
| Dell Inspiron 16 Plus 7610-MHJ8F | |
| LG Gram 16 (2021) | |
| AIDA64 / CPU PhotoWorxx | |
| Genomsnitt av klass Multimedia (12860 - 88154, n=61, senaste 2 åren) | |
| LG Gram 16 (2021) | |
| Genomsnitt Intel Core i7-11800H (11898 - 26757, n=21) | |
| Lenovo Legion 5 Pro 16ACH6H (82JQ001PGE) | |
| Lenovo Legion 5 Pro 16ACH6H (82JQ001PGE) | |
| Dell Inspiron 16 Plus 7610-MHJ8F | |
Systemets prestanda
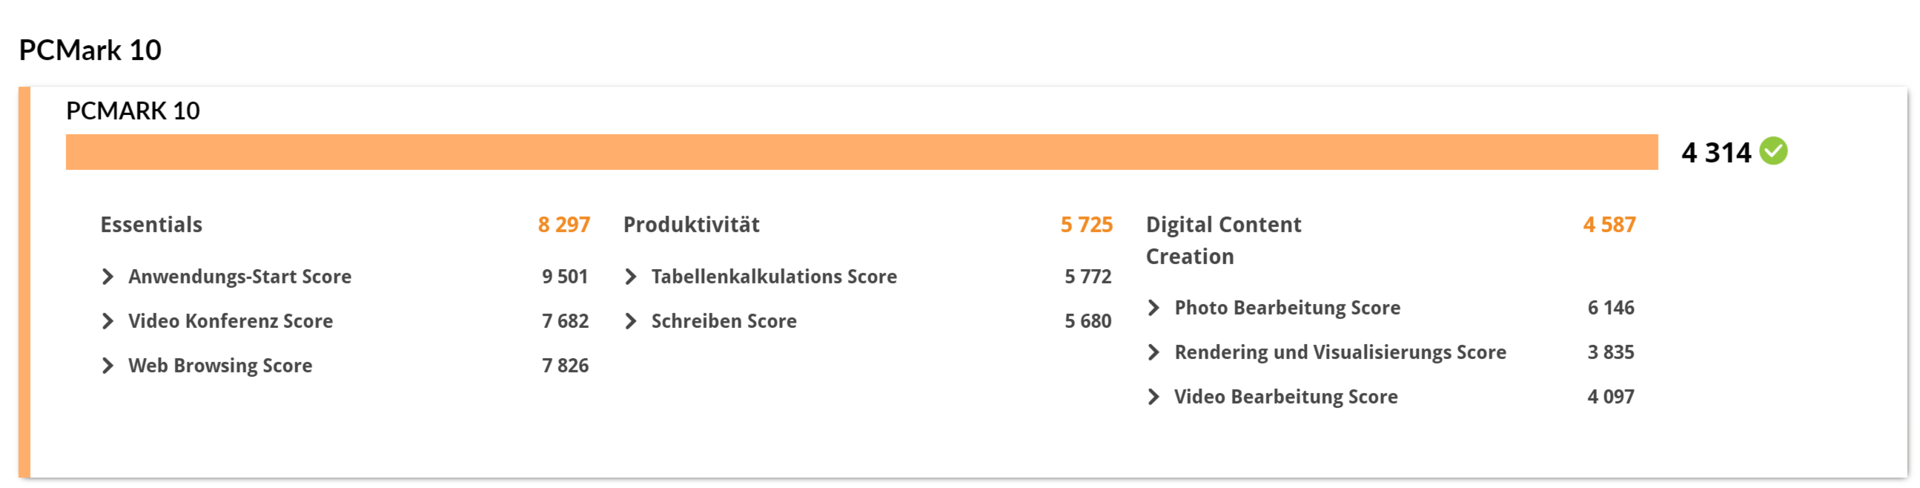
PCMark-poängen lider av avsaknaden av Geforce, och vi ser en skillnad på 25-50 % i underpoängen. Detta är dock inte fallet med Essentials, som visar sig vara ännu högre än med dGPU. Vid batteridrift sjunker prestandan något men inte särskilt mycket.
| PCMark 10 / Score | |
| Genomsnitt av klass Multimedia (4325 - 10386, n=58, senaste 2 åren) | |
| Lenovo Legion 5 Pro 16ACH6H (82JQ001PGE) | |
| Dell Inspiron 16 Plus 7610 | |
| Acer Aspire 5 A517-52G-79Z5 | |
| Dell Inspiron 16 Plus 7610-MHJ8F | |
| Genomsnitt Intel Core i7-11800H, Intel UHD Graphics Xe 32EUs (Tiger Lake-H) (5036 - 5067, n=2) | |
| Dell Inspiron 15 7000 7506 2-in-1 Black Edition | |
| LG Gram 16 (2021) | |
| PCMark 10 / Essentials | |
| Genomsnitt av klass Multimedia (8025 - 11664, n=57, senaste 2 åren) | |
| LG Gram 16 (2021) | |
| Dell Inspiron 16 Plus 7610-MHJ8F | |
| Dell Inspiron 16 Plus 7610 | |
| Genomsnitt Intel Core i7-11800H, Intel UHD Graphics Xe 32EUs (Tiger Lake-H) (9694 - 9847, n=2) | |
| Dell Inspiron 15 7000 7506 2-in-1 Black Edition | |
| Lenovo Legion 5 Pro 16ACH6H (82JQ001PGE) | |
| Acer Aspire 5 A517-52G-79Z5 | |
| PCMark 10 / Productivity | |
| Genomsnitt av klass Multimedia (7323 - 18233, n=57, senaste 2 åren) | |
| Acer Aspire 5 A517-52G-79Z5 | |
| Lenovo Legion 5 Pro 16ACH6H (82JQ001PGE) | |
| Dell Inspiron 16 Plus 7610 | |
| LG Gram 16 (2021) | |
| Genomsnitt Intel Core i7-11800H, Intel UHD Graphics Xe 32EUs (Tiger Lake-H) (6562 - 6723, n=2) | |
| Dell Inspiron 15 7000 7506 2-in-1 Black Edition | |
| Dell Inspiron 16 Plus 7610-MHJ8F | |
| PCMark 10 / Digital Content Creation | |
| Genomsnitt av klass Multimedia (3651 - 16240, n=57, senaste 2 åren) | |
| Lenovo Legion 5 Pro 16ACH6H (82JQ001PGE) | |
| Dell Inspiron 16 Plus 7610 | |
| Dell Inspiron 16 Plus 7610-MHJ8F | |
| Dell Inspiron 15 7000 7506 2-in-1 Black Edition | |
| Genomsnitt Intel Core i7-11800H, Intel UHD Graphics Xe 32EUs (Tiger Lake-H) (5318 - 5464, n=2) | |
| Acer Aspire 5 A517-52G-79Z5 | |
| LG Gram 16 (2021) | |
| PCMark 10 Score | 5067 poäng | |
Hjälp | ||
| AIDA64 / Memory Copy | |
| Genomsnitt av klass Multimedia (21158 - 132135, n=61, senaste 2 åren) | |
| LG Gram 16 (2021) | |
| Genomsnitt Intel Core i7-11800H (24508 - 48144, n=21) | |
| Dell Inspiron 16 Plus 7610-MHJ8F | |
| Lenovo Legion 5 Pro 16ACH6H (82JQ001PGE) | |
| Lenovo Legion 5 Pro 16ACH6H (82JQ001PGE) | |
| AIDA64 / Memory Read | |
| Genomsnitt av klass Multimedia (19699 - 174586, n=61, senaste 2 åren) | |
| LG Gram 16 (2021) | |
| Lenovo Legion 5 Pro 16ACH6H (82JQ001PGE) | |
| Lenovo Legion 5 Pro 16ACH6H (82JQ001PGE) | |
| Dell Inspiron 16 Plus 7610-MHJ8F | |
| Genomsnitt Intel Core i7-11800H (25882 - 50365, n=20) | |
| AIDA64 / Memory Write | |
| Genomsnitt av klass Multimedia (17733 - 134998, n=61, senaste 2 åren) | |
| LG Gram 16 (2021) | |
| Dell Inspiron 16 Plus 7610-MHJ8F | |
| Genomsnitt Intel Core i7-11800H (22240 - 46214, n=20) | |
| Lenovo Legion 5 Pro 16ACH6H (82JQ001PGE) | |
| Lenovo Legion 5 Pro 16ACH6H (82JQ001PGE) | |
| AIDA64 / Memory Latency | |
| Genomsnitt av klass Multimedia (7 - 535, n=60, senaste 2 åren) | |
| Dell Inspiron 16 Plus 7610-MHJ8F | |
| LG Gram 16 (2021) | |
| Lenovo Legion 5 Pro 16ACH6H (82JQ001PGE) | |
| Lenovo Legion 5 Pro 16ACH6H (82JQ001PGE) | |
| Genomsnitt Intel Core i7-11800H (71.9 - 104.1, n=44) | |
| Dell Inspiron 16 Plus 7610 | |
* ... mindre är bättre
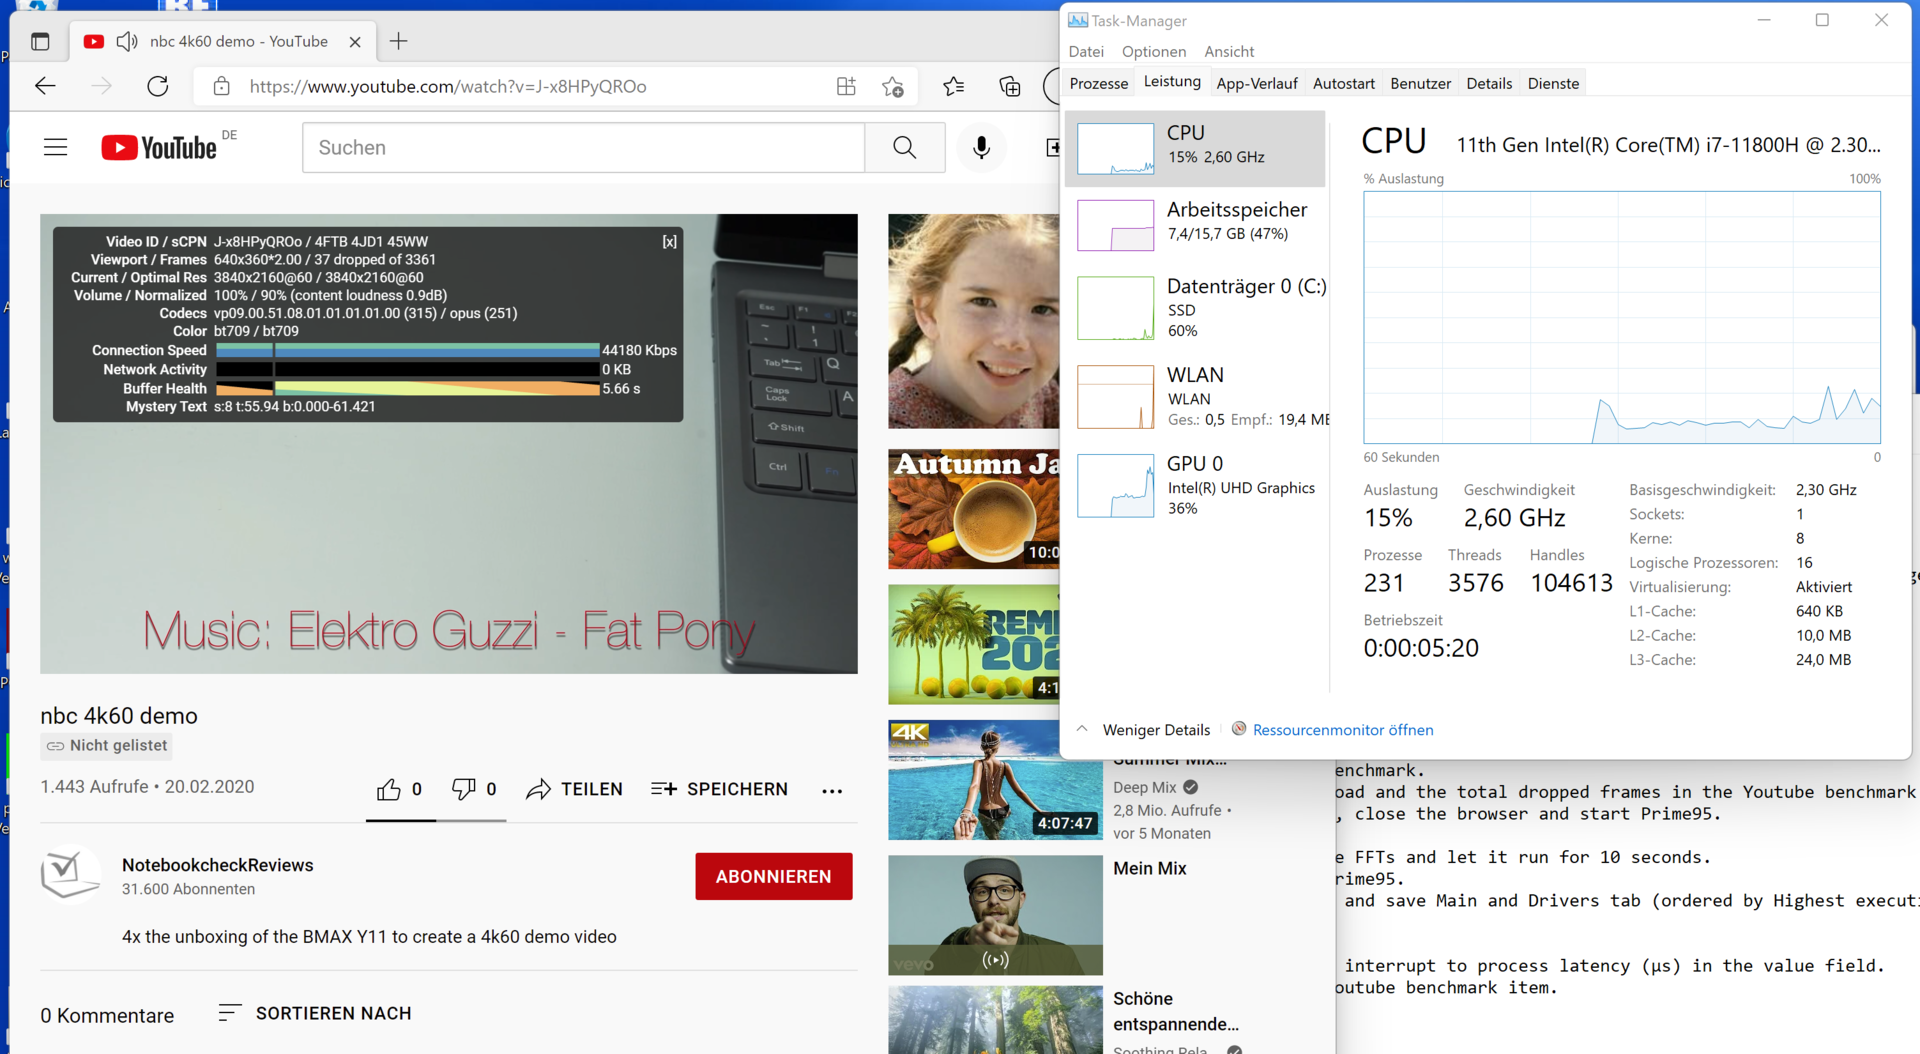
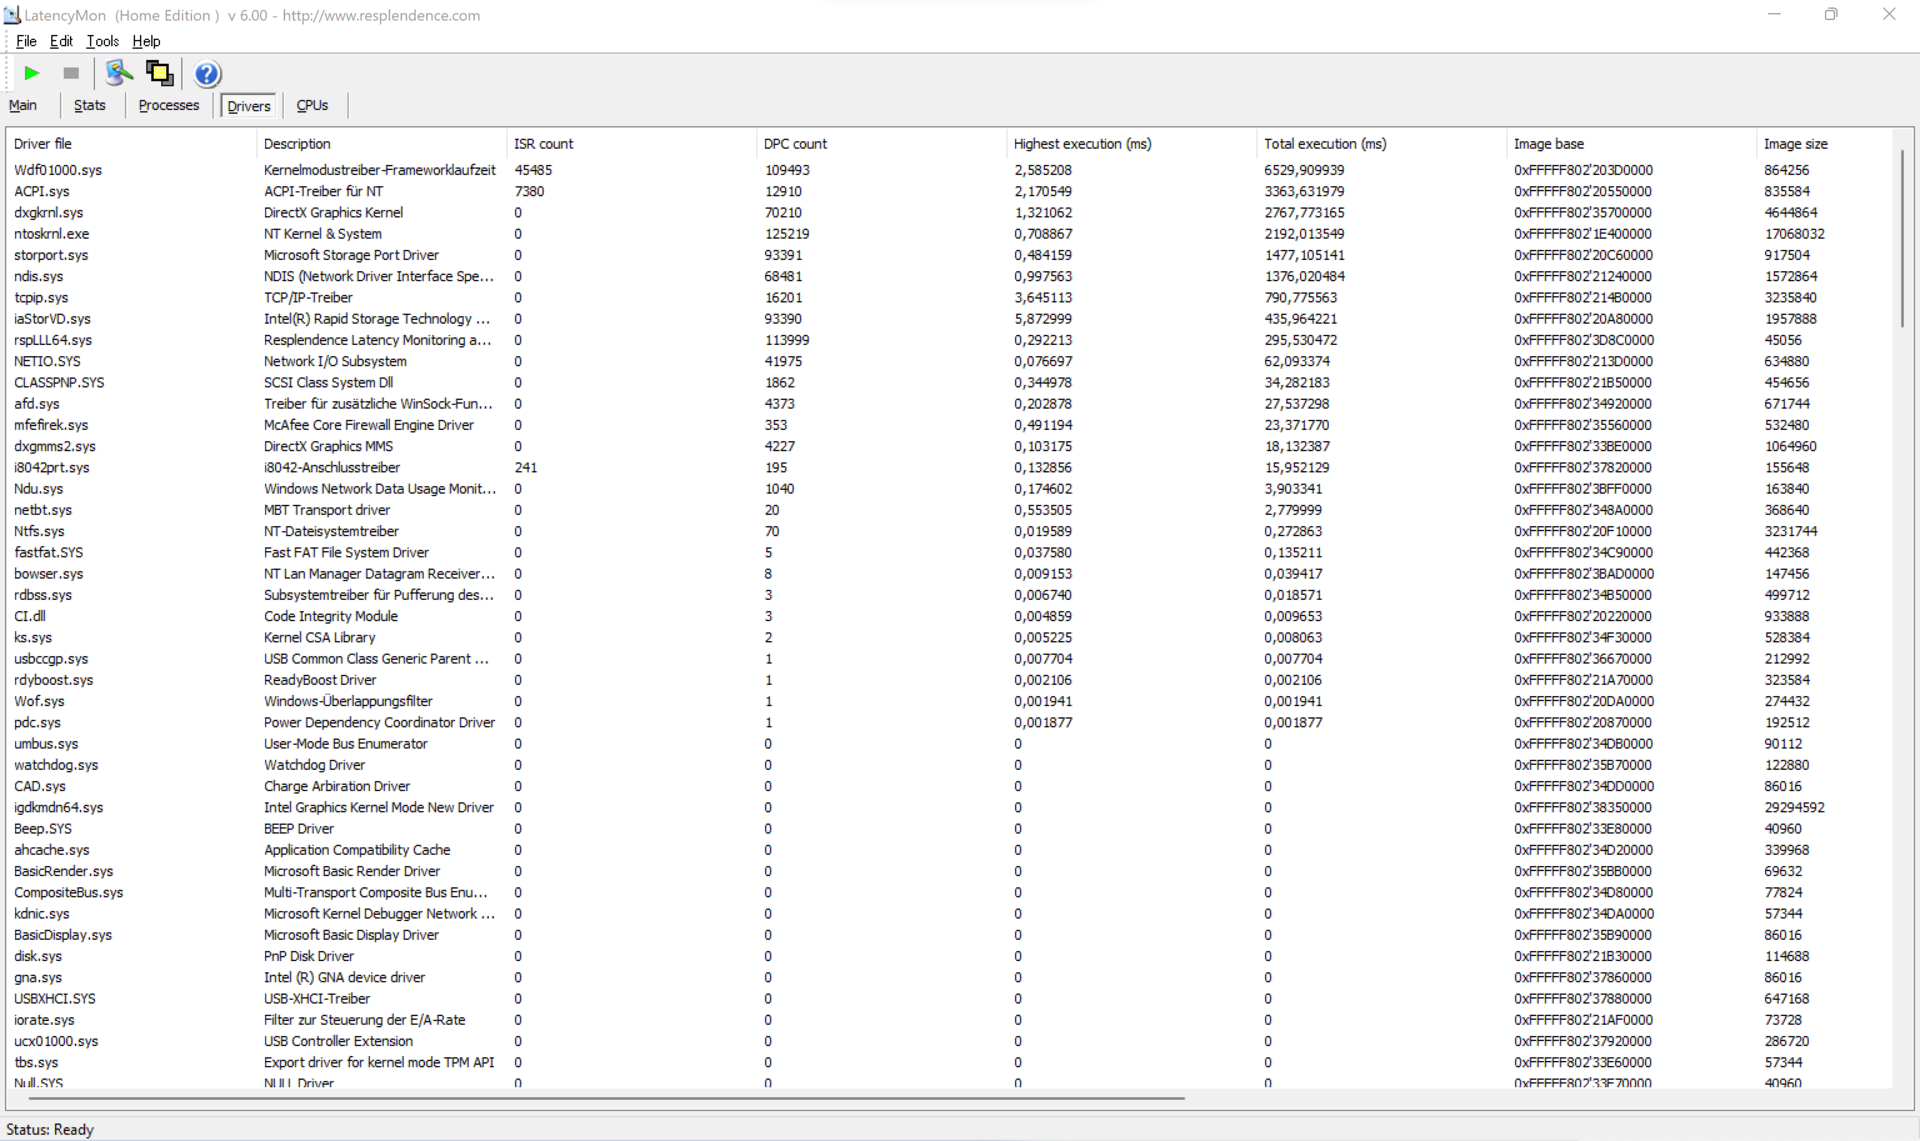
DPC-latenstider
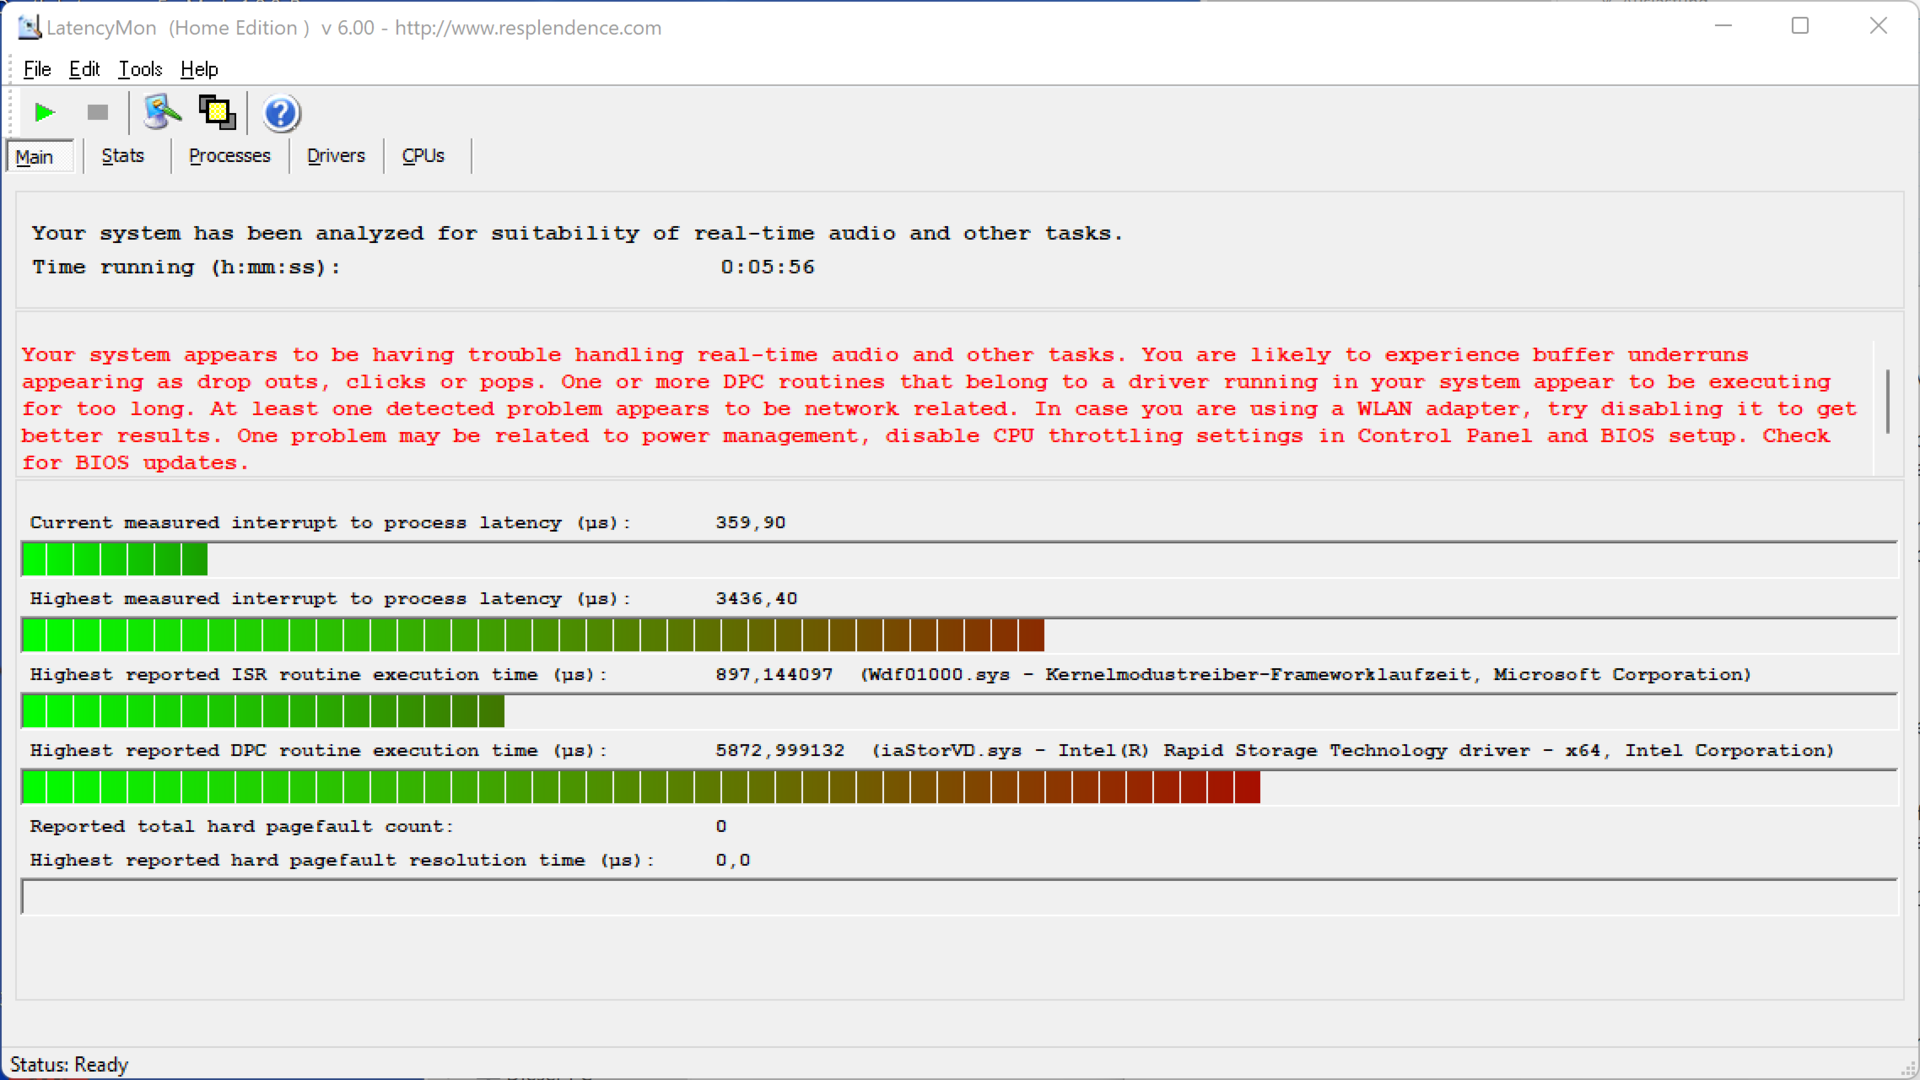
När du öppnar vår hemsida i flera flikar eller när du kör Prime95 rapporterar LatencyMon om problematiska DPC-fördröjningar. Återgivningen av en 4K-video fungerar inte heller helt sömlöst, med 37 bilder som tappas när man kör den 60 sekunder långa videon. Orsaken ligger i kärnan och ACPI-drivrutinen.
| DPC Latencies / LatencyMon - interrupt to process latency (max), Web, Youtube, Prime95 | |
| Dell Inspiron 16 Plus 7610 | |
| Acer Aspire 5 A517-52G-79Z5 | |
| Lenovo Legion 5 Pro 16ACH6H (82JQ001PGE) | |
| LG Gram 16 (2021) | |
| Dell Inspiron 15 7000 7506 2-in-1 Black Edition | |
* ... mindre är bättre
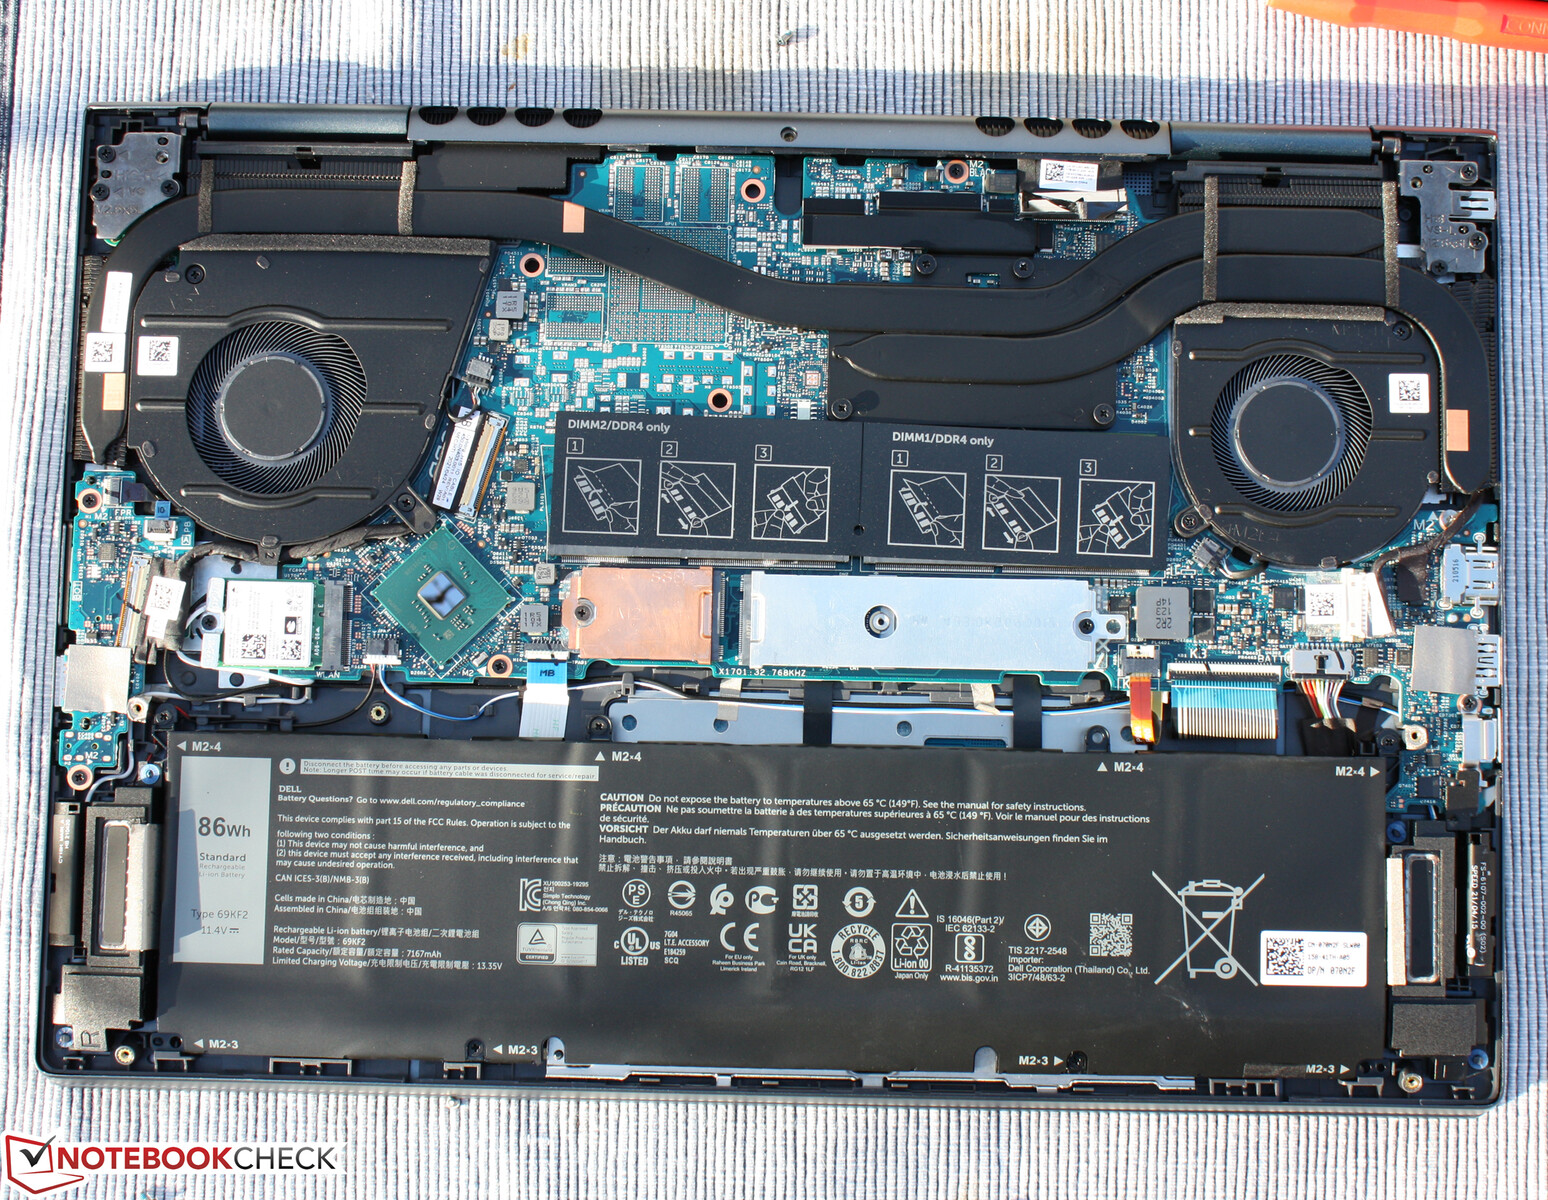
Lagringslösning - En intern enhet
Vår 7610-modell är utrustad med den ovanliga Kingston OM3PDP3-AD NVMe SSD-enheten. Med upp till hälften av prestandan jämfört med Micron 2300 i XPS 15 9510 är hastigheten i bästa fall medelmåttig. Eftersom Dell får sina enheter från flera SSD-tillverkare som inkluderar Samsung, Micron, Western Digital, Toshiba och tydligen även Kingston, är det svårt att förutse vilken enhet en bärbar Inspiron-dator som finns tillgänglig från leverantörer kommer att vara utrustad med.
Obs: Du kan visserligen sätta in upp till två interna enheter, men minst en av dem måste ha det mindre formatet 2230.

| Drive Performance rating - Percent | |
| Genomsnitt av klass Multimedia | |
| LG Gram 16 (2021) | |
| Dell Inspiron 15 7000 7506 2-in-1 Black Edition | |
| Acer Aspire 5 A517-52G-79Z5 | |
| Lenovo Legion 5 Pro 16ACH6H (82JQ001PGE) | |
| Dell Inspiron 16 Plus 7610-MHJ8F -1! | |
| Genomsnitt OM3PDP3-AD NVMe KDI 512GB -1! | |
| Dell Inspiron 16 Plus 7610 | |
* ... mindre är bättre
Constant Performance Reading: DiskSpd Read Loop, Queue Depth 8
Grafikkort
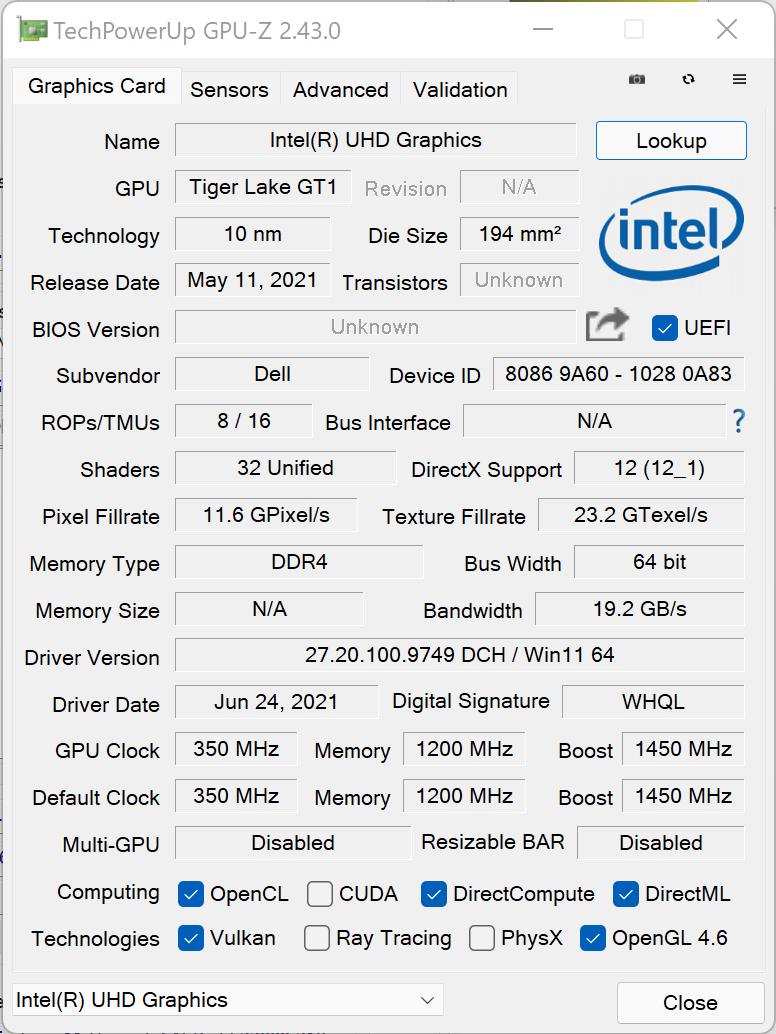
Det råder ingen tvekan om att Intel UHD Xe (32 EU) inte ger någon större prestanda, vilket bekräftas av alla benchmarks. Den RTX-utrustade Inspiron 16 Plus 7610 ligger 500 procent före, och i spel mellan 250 och nästan 500 procent.
De som väljer iGPU-versionen får leva med att då saknas också hårdvarustödet genom Nvidias CUDA-kärnor. Detta kommer att sänka till exempel renderingshastigheten vid video- eller bildbehandling avsevärt. Smidig spelupplevelse är endast möjlig i vissa utvalda äldre spel eller spel som är mindre krävande.
| 3DMark Performance rating - Percent | |
| Lenovo Legion 5 Pro 16ACH6H (82JQ001PGE) -3! | |
| Genomsnitt av klass Multimedia | |
| Dell Inspiron 16 Plus 7610 | |
| Dell Inspiron 15 7000 7506 2-in-1 Black Edition | |
| LG Gram 16 (2021) | |
| Acer Aspire 5 A517-52G-79Z5 -1! | |
| Genomsnitt Intel UHD Graphics Xe 32EUs (Tiger Lake-H) | |
| Dell Inspiron 16 Plus 7610-MHJ8F -1! | |
| 3DMark 11 Performance | 3691 poäng | |
| 3DMark Fire Strike Score | 2345 poäng | |
| 3DMark Time Spy Score | 805 poäng | |
Hjälp | ||
| The Witcher 3 | |
| 1024x768 Low Graphics & Postprocessing | |
| Dell Inspiron 16 Plus 7610 | |
| Lenovo Legion 5 Pro 16ACH6H (82JQ001PGE) | |
| Genomsnitt av klass Multimedia (68 - 380, n=10, senaste 2 åren) | |
| LG Gram 16 (2021) | |
| Acer Aspire 5 A517-52G-79Z5 | |
| Dell Inspiron 15 7000 7506 2-in-1 Black Edition | |
| Dell Inspiron 16 Plus 7610-MHJ8F | |
| Genomsnitt Intel UHD Graphics Xe 32EUs (Tiger Lake-H) (47.3 - 50.1, n=4) | |
| 1366x768 Medium Graphics & Postprocessing | |
| Lenovo Legion 5 Pro 16ACH6H (82JQ001PGE) | |
| Dell Inspiron 16 Plus 7610 | |
| Genomsnitt av klass Multimedia (41 - 93, n=4, senaste 2 åren) | |
| Dell Inspiron 15 7000 7506 2-in-1 Black Edition | |
| LG Gram 16 (2021) | |
| Acer Aspire 5 A517-52G-79Z5 | |
| Dell Inspiron 16 Plus 7610-MHJ8F | |
| Genomsnitt Intel UHD Graphics Xe 32EUs (Tiger Lake-H) (29.8 - 31.1, n=2) | |
| låg | med. | hög | ultra | 4K | |
|---|---|---|---|---|---|
| The Witcher 3 (2015) | 50.1 | 31.1 | 15.8 | 7.5 | |
| Dota 2 Reborn (2015) | 126.2 | 76.6 | 36.3 | 33.3 | 12.1 |
| X-Plane 11.11 (2018) | 21.3 | 17.6 | 11.1 | 9.43 | |
| Strange Brigade (2018) | 56.7 | 21.7 | 16.9 | 16.2 |
Utsläpp och energihantering - En cool bärbar dator från Dell
Bullerutsläpp
Inspiron 16:s fläktar lyckas vara tysta eller åtminstone mycket tysta under lång tid. Med det bästa energisparläget slås fläktarna nästan aldrig på. I läget Balanserat körs de två fläktarna sporadiskt i några sekunder. Båda dessa uttalanden gäller tomgångsdrift. Det är slående att belastning inte orsakar ett omedelbart varvande av fläktarna utan endast en mycket fördröjd reaktion, även i prestandaläget. I 3DMark, till exempel, blir de märkbara först efter cirka 40 sekunder. Så snart deras hastighet ökar, vid 49 dB(A), blir den bärbara datorn snabbt lika högljudd som bärbara speldatorer. Maxvärdet är identiskt med det för Nvidia-versionen av den bärbara datorn, fläktens egenskaper är identiska
Ljudnivå
| Låg belastning |
| 26.3 / 26.3 / dB(A) |
| Hög belastning |
| 33 / 49.2 dB(A) |
 | ||
30 dB tyst 40 dB(A) hörbar 50 dB(A) högt ljud |
||
min: | ||
| Dell Inspiron 16 Plus 7610-MHJ8F UHD Graphics Xe 32EUs (Tiger Lake-H), i7-11800H, OM3PDP3-AD NVMe KDI 512GB | Dell Inspiron 16 Plus 7610 GeForce RTX 3050 4GB Laptop GPU, i7-11800H, Kingston OM3PDP3512B | LG Gram 16 (2021) Iris Xe G7 96EUs, i7-1165G7, SK Hynix PC601 1TB HFS001TD9TNG | Lenovo Legion 5 Pro 16ACH6H (82JQ001PGE) GeForce RTX 3070 Laptop GPU, R7 5800H, WDC PC SN730 SDBPNTY-1T00 | Dell Inspiron 15 7000 7506 2-in-1 Black Edition Xe MAX, i7-1165G7, Micron 2300 1TB MTFDHBA1T0TDV | Acer Aspire 5 A517-52G-79Z5 GeForce MX350, i7-1165G7, WDC PC SN530 SDBPNPZ-1T00 | |
|---|---|---|---|---|---|---|
| Noise | -6% | 9% | 1% | -10% | -2% | |
| av / miljö * (dB) | 26.3 | 24.4 7% | 26 1% | 23 13% | 27.3 -4% | 24.9 5% |
| Idle Minimum * (dB) | 26.3 | 24.4 7% | 26 1% | 25 5% | 27.3 -4% | 24.9 5% |
| Idle Average * (dB) | 26.3 | 24.4 7% | 26 1% | 25 5% | 27.3 -4% | 24.9 5% |
| Load Average * (dB) | 33 | 48.3 -46% | 30.8 7% | 35.5 -8% | 47.4 -44% | 44.1 -34% |
| Witcher 3 ultra * (dB) | 44 | 48.9 -11% | 46.67 -6% | 47.4 -8% | ||
| Load Maximum * (dB) | 49.2 | 48.9 1% | 31.1 37% | 50.35 -2% | 47.5 3% | 44.8 9% |
| Idle Maximum * (dB) | 24.4 | 26 | 25 | 27.3 | 27 |
* ... mindre är bättre
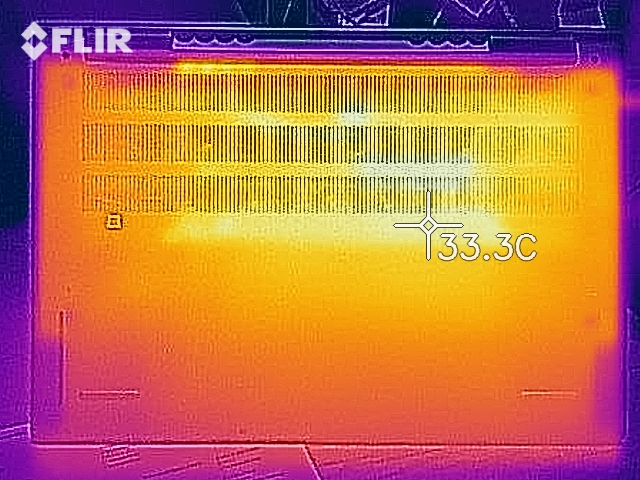
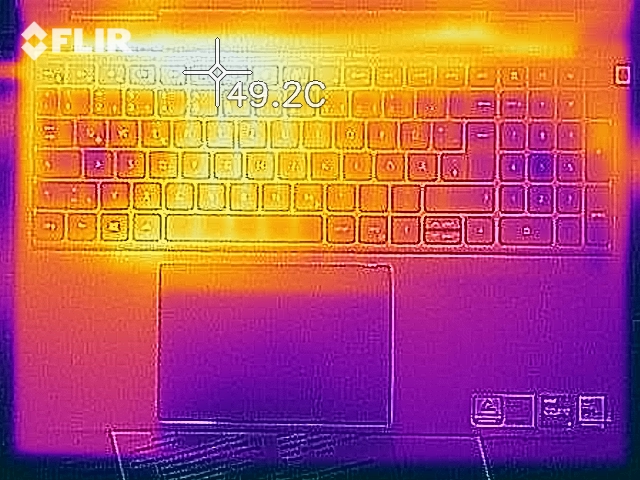
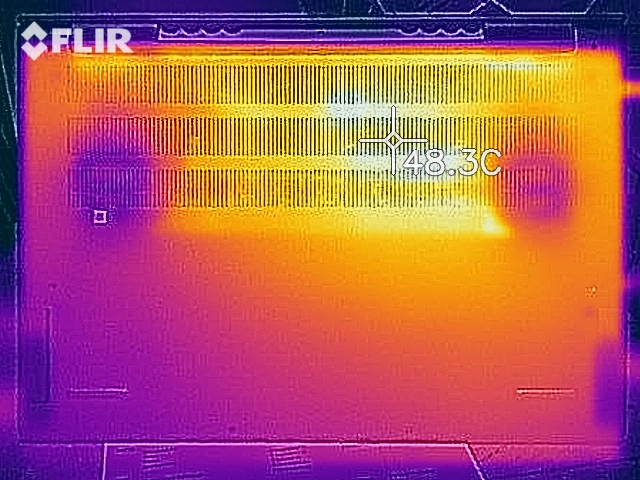
Temperatur
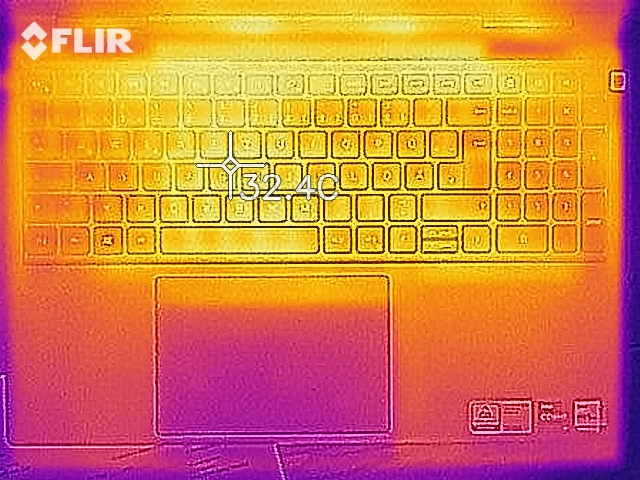
Trots de tröga fläktarna är yttemperaturerna inte höga, utan ligger i genomsnitt runt 29 ºC (~84 ºF). DGPU-modellen har ett 3ºC (~5 ºF) högre genomsnitt, men bara på undersidan. Som väntat finns det en betydande skillnad under belastning: I den heta fläcken i botten är Geforce-modellen cirka 10 ºC (~18 ºF) varmare än iGPU-versionen
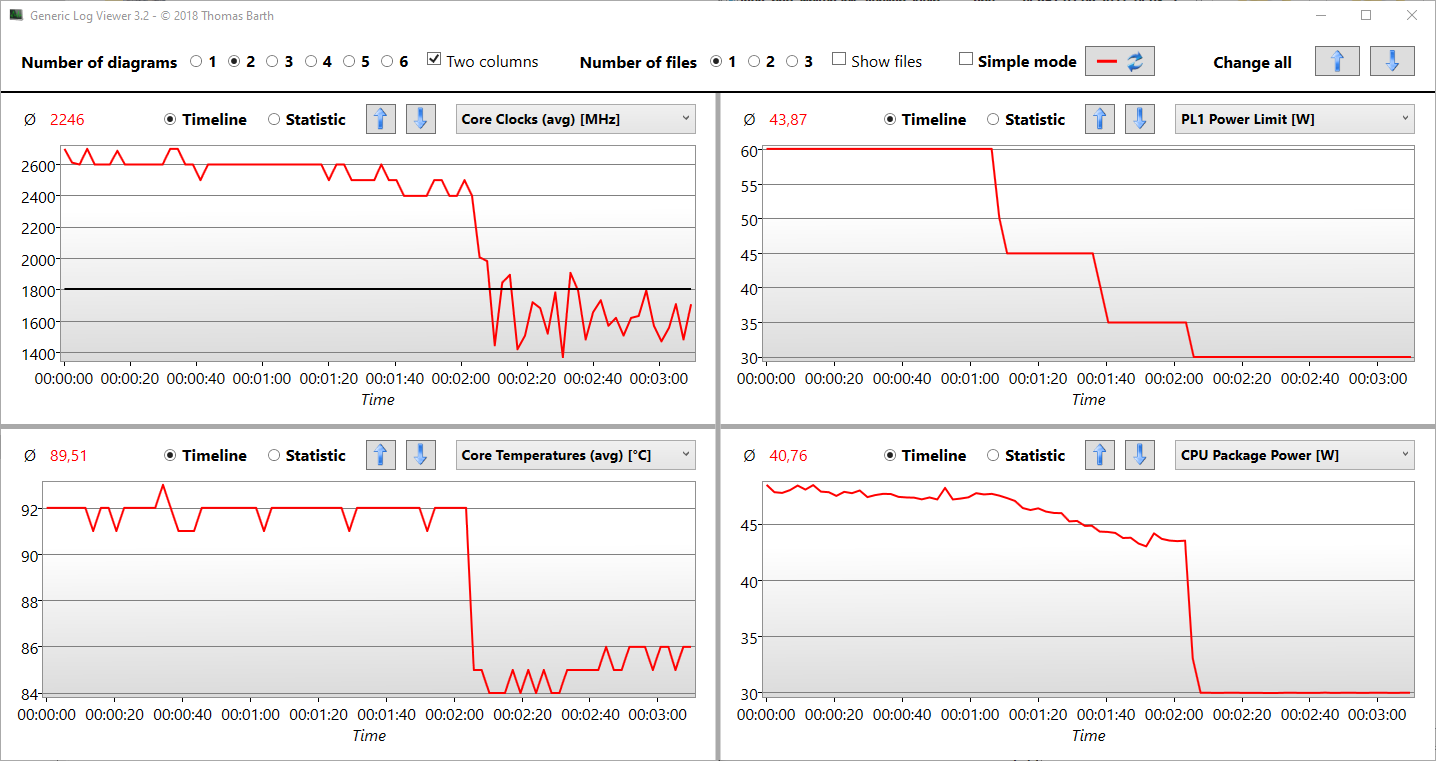
Under belastning från Prime95 ökar klockfrekvensen till 4,3 GHz i en eller två sekunder, varefter en kärntemperatur på 90 °C (194 °F) uppnås. Klockfrekvensen sjunker sedan till 2,8-3,0 GHz för att hålla en temperatur på cirka 90 °C (194 °F). Skillnaden är att dGPU-modellen försöker hålla 83 °C (181 °F) och jämnar ut sig i intervallet 2,4-3,2 GHz.
(±) Den maximala temperaturen på ovansidan är 43.4 °C / 110 F, jämfört med genomsnittet av 36.8 °C / 98 F , allt från 21 till 71 °C för klassen Multimedia.
(-) Botten värms upp till maximalt 45.1 °C / 113 F, jämfört med genomsnittet av 39.1 °C / 102 F
(+) Vid tomgångsbruk är medeltemperaturen för ovansidan 28.4 °C / 83 F, jämfört med enhetsgenomsnittet på 31.3 °C / ### class_avg_f### F.
(+) Handledsstöden och pekplattan når maximal hudtemperatur (34.8 °C / 94.6 F) och är därför inte varma.
(-) Medeltemperaturen för handledsstödsområdet på liknande enheter var 28.7 °C / 83.7 F (-6.1 °C / -10.9 F).
| Dell Inspiron 16 Plus 7610-MHJ8F Intel Core i7-11800H, Intel UHD Graphics Xe 32EUs (Tiger Lake-H) | Dell Inspiron 16 Plus 7610 Intel Core i7-11800H, NVIDIA GeForce RTX 3050 4GB Laptop GPU | LG Gram 16 (2021) Intel Core i7-1165G7, Intel Iris Xe Graphics G7 96EUs | Lenovo Legion 5 Pro 16ACH6H (82JQ001PGE) AMD Ryzen 7 5800H, NVIDIA GeForce RTX 3070 Laptop GPU | Dell Inspiron 15 7000 7506 2-in-1 Black Edition Intel Core i7-1165G7, Intel Iris Xe MAX Graphics | Acer Aspire 5 A517-52G-79Z5 Intel Core i7-1165G7, NVIDIA GeForce MX350 | |
|---|---|---|---|---|---|---|
| Heat | -13% | 7% | -17% | -9% | 16% | |
| Maximum Upper Side * (°C) | 43.4 | 46.4 -7% | 46.9 -8% | 50 -15% | 43 1% | 35 19% |
| Maximum Bottom * (°C) | 45.1 | 54.8 -22% | 45.1 -0% | 55 -22% | 48.8 -8% | 40 11% |
| Idle Upper Side * (°C) | 30.6 | 31.4 -3% | 26.4 14% | 34 -11% | 31.6 -3% | 25.6 16% |
| Idle Bottom * (°C) | 31.1 | 36.6 -18% | 24.1 23% | 37 -19% | 38.6 -24% | 25.3 19% |
* ... mindre är bättre
Dell Inspiron 16 Plus 7610-MHJ8F ljudanalys
(±) | högtalarljudstyrkan är genomsnittlig men bra (73.2 dB)
Bas 100 - 315 Hz
(-) | nästan ingen bas - i genomsnitt 19.5% lägre än medianen
(±) | linjäriteten för basen är genomsnittlig (11.1% delta till föregående frekvens)
Mellan 400 - 2000 Hz
(+) | balanserad mellan - endast 4.6% från medianen
(+) | mids är linjära (6.4% delta till föregående frekvens)
Högsta 2 - 16 kHz
(±) | högre toppar - i genomsnitt 6.1% högre än medianen
(±) | linjäriteten för toppar är genomsnittlig (7.7% delta till föregående frekvens)
Totalt 100 - 16 000 Hz
(±) | linjäriteten för det totala ljudet är genomsnittlig (22.5% skillnad mot median)
Jämfört med samma klass
» 80% av alla testade enheter i den här klassen var bättre, 4% liknande, 16% sämre
» Den bästa hade ett delta på 5%, genomsnittet var 17%, sämst var 45%
Jämfört med alla testade enheter
» 66% av alla testade enheter var bättre, 6% liknande, 28% sämre
» Den bästa hade ett delta på 4%, genomsnittet var 24%, sämst var 134%
LG Gram 16 (2021) ljudanalys
(±) | högtalarljudstyrkan är genomsnittlig men bra (76.1 dB)
Bas 100 - 315 Hz
(-) | nästan ingen bas - i genomsnitt 18.8% lägre än medianen
(±) | linjäriteten för basen är genomsnittlig (12.2% delta till föregående frekvens)
Mellan 400 - 2000 Hz
(+) | balanserad mellan - endast 2.2% från medianen
(+) | mids är linjära (5.4% delta till föregående frekvens)
Högsta 2 - 16 kHz
(+) | balanserade toppar - endast 2.5% från medianen
(+) | toppar är linjära (3.7% delta till föregående frekvens)
Totalt 100 - 16 000 Hz
(+) | det totala ljudet är linjärt (14.7% skillnad mot median)
Jämfört med samma klass
» 12% av alla testade enheter i den här klassen var bättre, 4% liknande, 84% sämre
» Den bästa hade ett delta på 7%, genomsnittet var 21%, sämst var 53%
Jämfört med alla testade enheter
» 19% av alla testade enheter var bättre, 4% liknande, 77% sämre
» Den bästa hade ett delta på 4%, genomsnittet var 24%, sämst var 134%
Energihantering
Effektförbrukning
Vid tomgångsdrift förbrukar den bärbara datorn något mer än 5 watt vid den lägsta ljusstyrkan och i den mest energisparande prestandaprofilen. Det maximala under tomgång ligger på 14 watt, vilket är ett måttligt värde. I liknande scenarier förbrukar LG Gram 16 endast mellan 4 och 11 watt. Motsvarande Inspiron 16 Plus 7610 med Geforce förbrukar mellan 8 och 17 watt trots att dess dGPU är avstängd genom Optimus-omkopplingen.
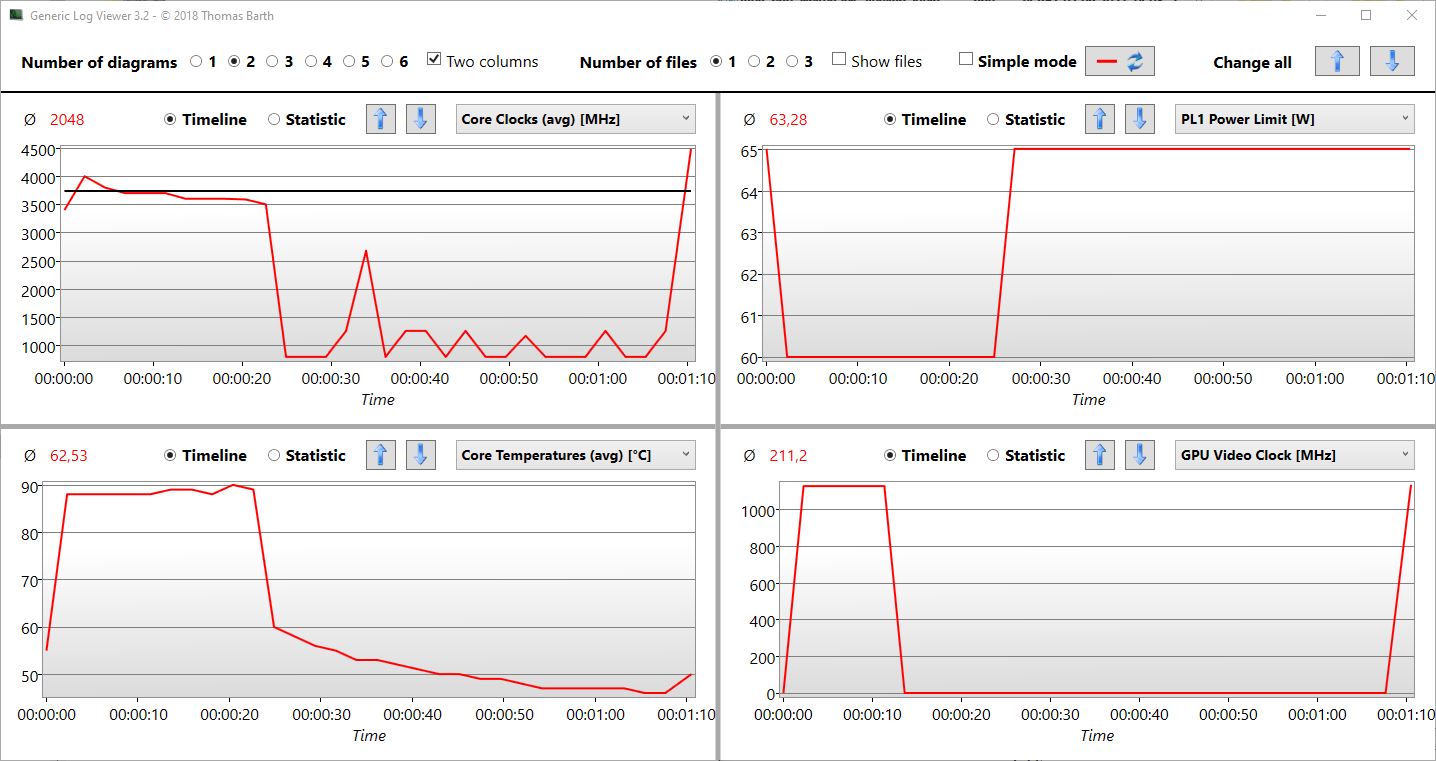
Under belastning är skillnaderna naturligtvis enorma. Under extremt hög belastning uppmätte vi en maximal förbrukning på bara 76 watt vid 130-watts nätaggregatet. Som diagrammet nedan visar kan iGPU-modellen förbruka mer ström (stresstest med Prime95 och Furmark) och når upp till 100 watt. Under stresstestet planar den ut på 90 watt. Vid körning av Witcher 3 Ultra ligger den runt ett genomsnitt på 44 watt.
| Av/Standby | |
| Låg belastning | |
| Hög belastning |
|
Förklaring:
min: | |
Power Consumption The Witcher 3 / Stress Test
| Dell Inspiron 16 Plus 7610-MHJ8F i7-11800H, UHD Graphics Xe 32EUs (Tiger Lake-H), OM3PDP3-AD NVMe KDI 512GB, IPS, 3072x1920, 16" | Dell Inspiron 16 Plus 7610 i7-11800H, GeForce RTX 3050 4GB Laptop GPU, Kingston OM3PDP3512B, IPS, 3072x1920, 16" | LG Gram 16 (2021) i7-1165G7, Iris Xe G7 96EUs, SK Hynix PC601 1TB HFS001TD9TNG, IPS, 2560x1600, 16" | Lenovo Legion 5 Pro 16ACH6H (82JQ001PGE) R7 5800H, GeForce RTX 3070 Laptop GPU, WDC PC SN730 SDBPNTY-1T00, IPS, 2560x1600, 16" | Dell Inspiron 15 7000 7506 2-in-1 Black Edition i7-1165G7, Xe MAX, Micron 2300 1TB MTFDHBA1T0TDV, IPS, 3840x2160, 15.6" | Acer Aspire 5 A517-52G-79Z5 i7-1165G7, GeForce MX350, WDC PC SN530 SDBPNPZ-1T00, IPS, 1920x1080, 17.3" | |
|---|---|---|---|---|---|---|
| Power Consumption | -69% | 24% | -129% | -17% | 16% | |
| Idle Minimum * (Watt) | 5.4 | 7.7 -43% | 3.8 30% | 10.45 -94% | 4 26% | 4.1 24% |
| Idle Average * (Watt) | 9.8 | 10.7 -9% | 9 8% | 14.92 -52% | 15.5 -58% | 7.8 20% |
| Idle Maximum * (Watt) | 14 | 16.8 -20% | 11.3 19% | 16.02 -14% | 16.2 -16% | 10 29% |
| Load Average * (Watt) | 44 | 100.39 -128% | 35.2 20% | 119.65 -172% | 49.7 -13% | 47 -7% |
| Witcher 3 ultra * (Watt) | 44 | 108 -145% | 174.9 -298% | 52.2 -19% | ||
| Load Maximum * (Watt) | 76.8 | 129 -68% | 43.5 43% | 187.26 -144% | 92.7 -21% | 64.7 16% |
* ... mindre är bättre
Batteritid
Skillnaden i batteritid mellan iGPU- och dGPU-versionerna är endast marginell i WiFi-testet, och Geforce-modellen klarar sig till och med några minuter längre här. Under belastning klarar iGPU-modellen däremot 50 minuter längre (Battery Eater Classic). IGPU-modellen vinner också när det gäller batteritid i tomgång, och ett plus på 120 minuter gör att testenheten klarar sig i 22:30 timmar. Detta värde är dock inte riktigt realistiskt, eftersom det mäts vid minimal ljusstyrka och i flygplansläge. De 86 Wh är identiska i de båda modellerna.
| Dell Inspiron 16 Plus 7610-MHJ8F i7-11800H, UHD Graphics Xe 32EUs (Tiger Lake-H), 86 Wh | Dell Inspiron 16 Plus 7610 i7-11800H, GeForce RTX 3050 4GB Laptop GPU, 86 Wh | LG Gram 16 (2021) i7-1165G7, Iris Xe G7 96EUs, 80 Wh | Lenovo Legion 5 Pro 16ACH6H (82JQ001PGE) R7 5800H, GeForce RTX 3070 Laptop GPU, 80 Wh | Dell Inspiron 15 7000 7506 2-in-1 Black Edition i7-1165G7, Xe MAX, 68 Wh | Acer Aspire 5 A517-52G-79Z5 i7-1165G7, GeForce MX350, 50.2 Wh | Genomsnitt av klass Multimedia | |
|---|---|---|---|---|---|---|---|
| Batteridrifttid | -8% | 32% | -56% | -16% | -36% | -7% | |
| Reader / Idle (h) | 22.5 | 20.5 -9% | 28.6 27% | 9.1 -60% | 25 11% | 13.8 -39% | 25.2 ? 12% |
| WiFi (h) | 9.5 | ||||||
| WiFi v1.3 (h) | 9.5 | 9.9 4% | 15.7 65% | 7 -26% | 9.7 2% | 7.4 -22% | 12 ? 26% |
| Load (h) | 4.1 | 3.3 -20% | 4.3 5% | 0.7 -83% | 1.6 -61% | 2.2 -46% | 1.675 ? -59% |
| H.264 (h) | 20.1 | 4.9 | 16.4 ? | ||||
| Witcher 3 ultra (h) | 1.3 |
För
Emot
Slutsats - svalare och mer uthållighet
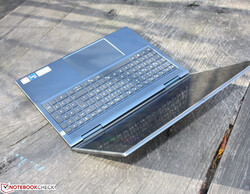
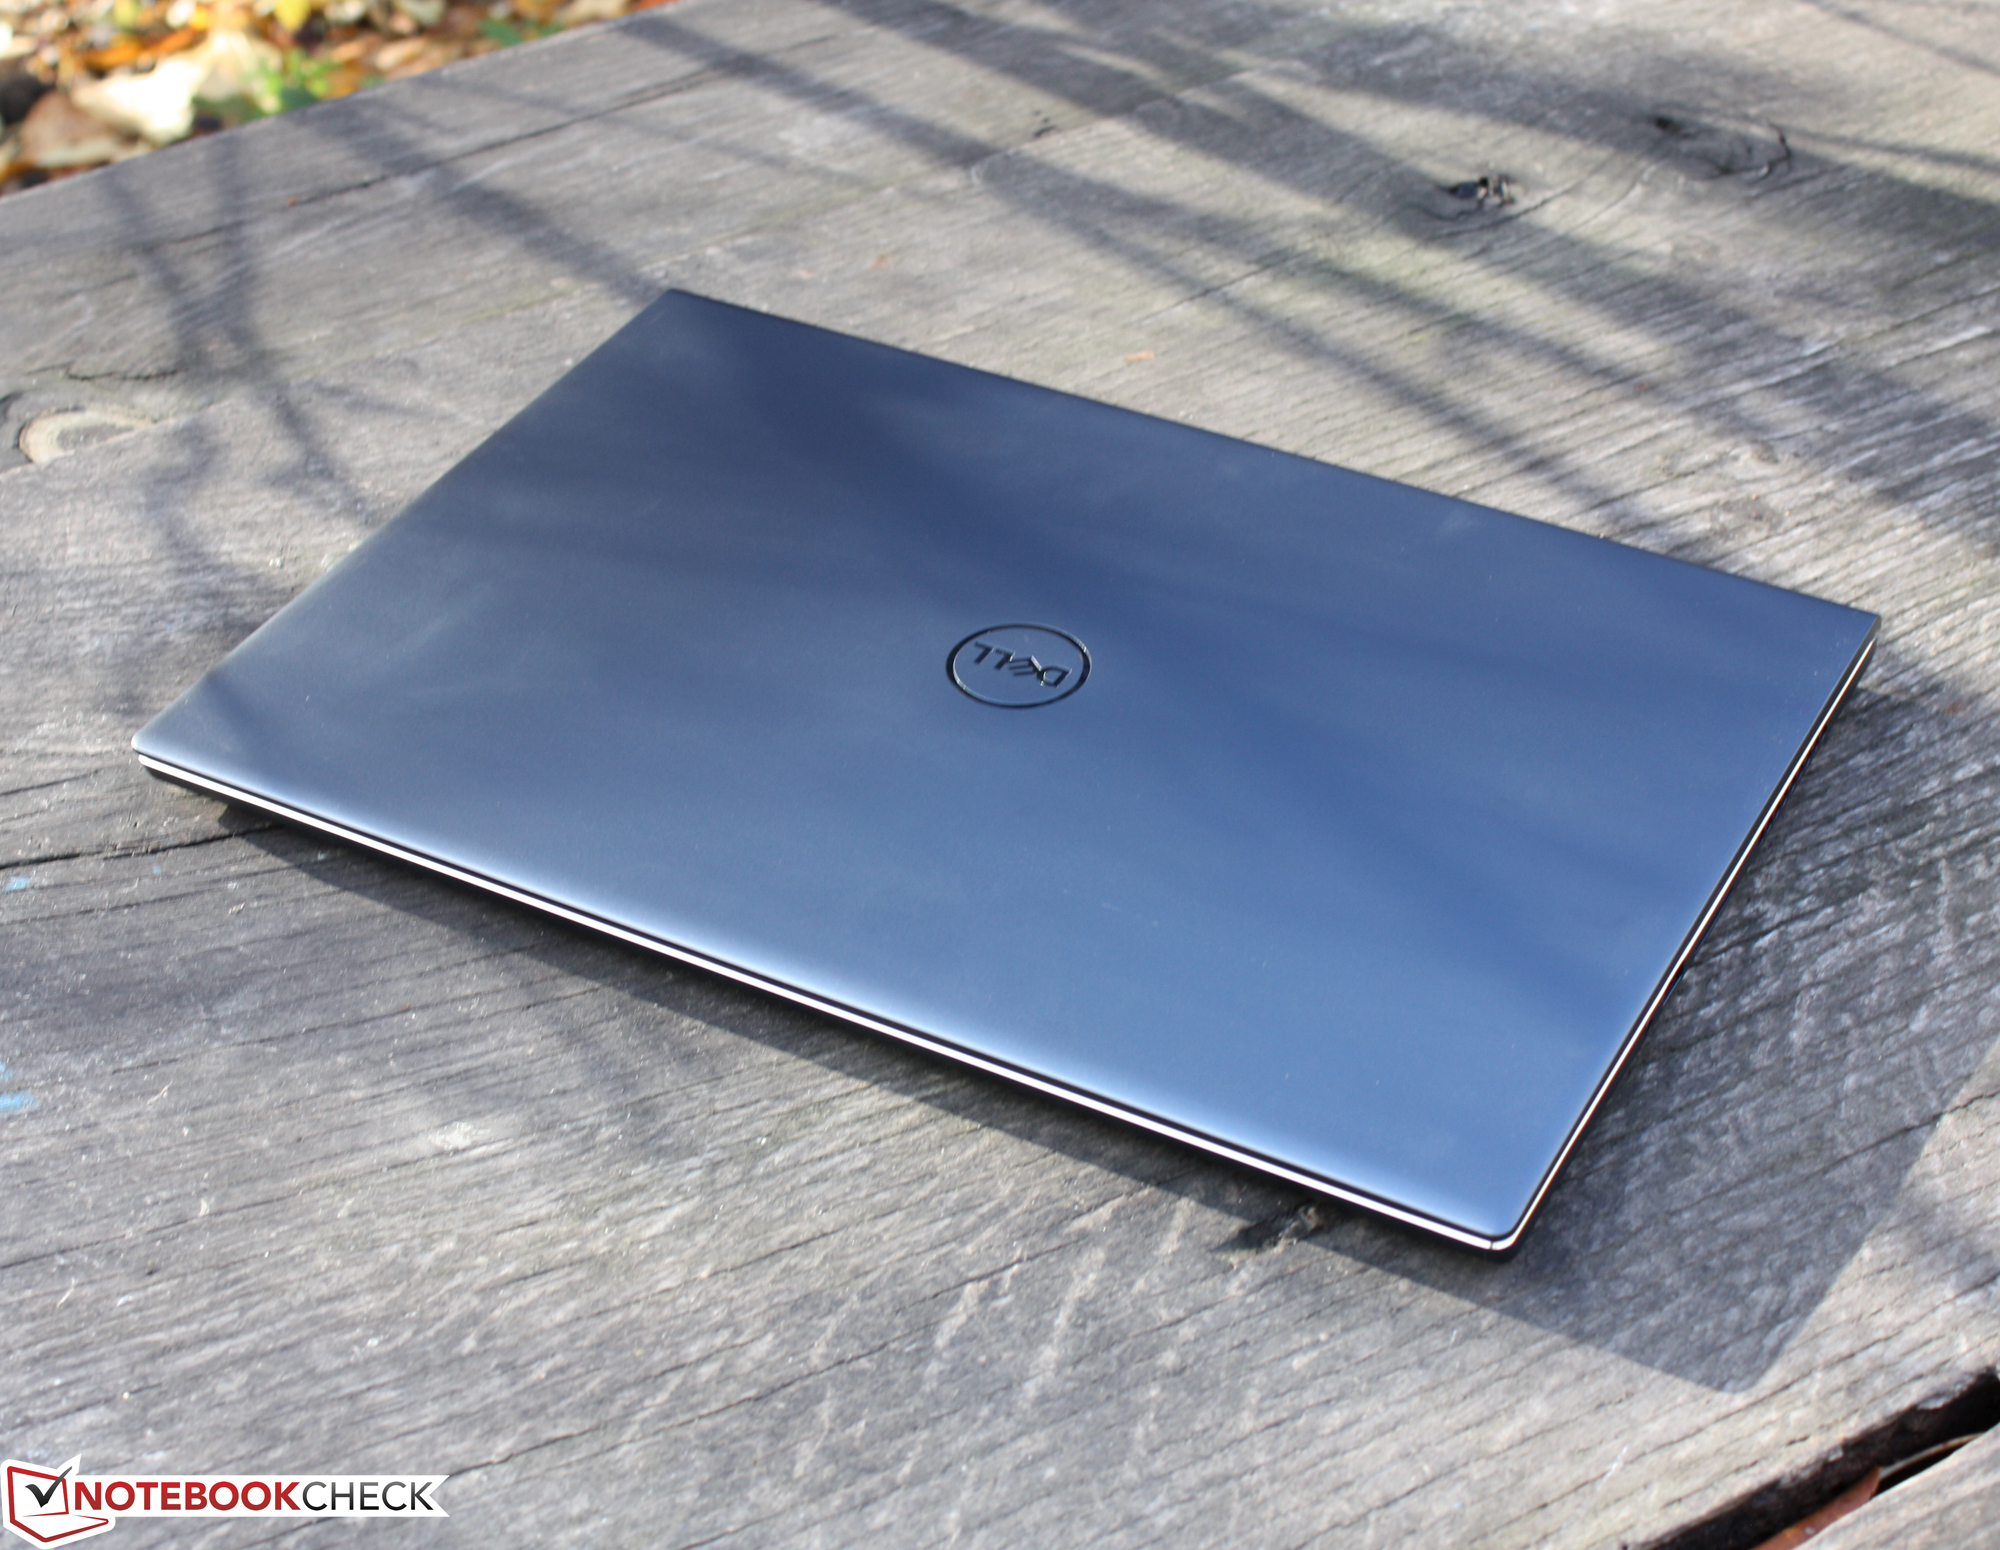
Inspiron 16 är en bärbar dator att visa upp: Det tunga metallhöljet förmedlar en haptisk kvalitet som kommer nära den dyrare XPS 15:s. Kringlisterna är smala och anslutningsutrustningen är omfattande. Underhållet visar sig vara enkelt, och den matta 3K-skärmen toppar perfekt hela paketet.
När det gäller prestanda ser det inte riktigt lika bra ut. Jämfört med liknande eller nästan lika utrustade konkurrenter är processorn långsammare än väntat, vilket också är fallet med iGPU-modellen. Vår testenhet kunde dock komma ikapp något när det gäller poäng, vilket innebär att den till en början räknade snabbare än versionen med Nvidias grafikkrets.
Medan Dell Inspiron 16 Plus 7610 delar fördelarna med sin syskonmodell, avstår den från prestandan hos Geforce-grafiken. Detta ger en längre batteritid, lägre strömförbrukning och ett svalare hölje.
De som känner sig entusiastiska över Inspiron 16 Plus 7610 i allmänhet men överväger om den mer prisvärda iGPU-versionen är tillräcklig bör förstå detta: Det finns ingen skillnad i WiFi-batteritiden, vilket är det mest realistiska måttet i praktiken. Testenheten håller dock längre vid tomgångsdrift eller vid konstant belastning. Dess drift är effektivare och den värms inte upp lika mycket under belastning. Så de som letar efter en 16-tums kontorskompis med en bra 3K-skärm kommer inte att bli besvikna på Inspiron 16 Plus 7610
För närvarande är prisskillnaden mellan vår iGPU-testenhet (1200 euro = ~1348 dollar, i7, 512 GB, 16 GB, butiksversion) och den mest prisvärda Geforce-versionen med en RTX 3050 men i övrigt liknande utrustning 200 euro (~225 dollar). Om du väljer i5 är det bara en skillnad på 50 euro (~56 dollar).
Ett kraftfullare och billigare alternativ till Dell ärLegion 5 Profrån Lenovo, som har en kraftfullare Ryzen 5000H och redan innehåller en RTX 3050 Ti tillsammans med en 165 Hz-skärm för 1300 euro (~1461 dollar). LG Gramm 16lägger fokus på låg vikt och en betydligt längre batteritid vid lägre prestanda. De för vilka allt detta är för dyrt kan ta en titt på den 17-tums Acer Aspire 5 A517. För knappt 800 euro (~899 dollar) får du mindre skärm och lägre prestanda än med iGPU Dell, men istället en dGPU på instegsnivå.
Pris och tillgänglighet
Provningsenheten som är konfigurerad med en i7-11800H, 16 GB RAM och 512 GB SSD finns för närvarande på Dell för 999 dollar.
Dell Inspiron 16 Plus 7610-MHJ8F
- 11/22/2021 v7 (old)
Sebastian Jentsch
Price comparison

