Core i7-13700HX-prestanda debut: Uniwill GM6PX7X IDX laptop recension

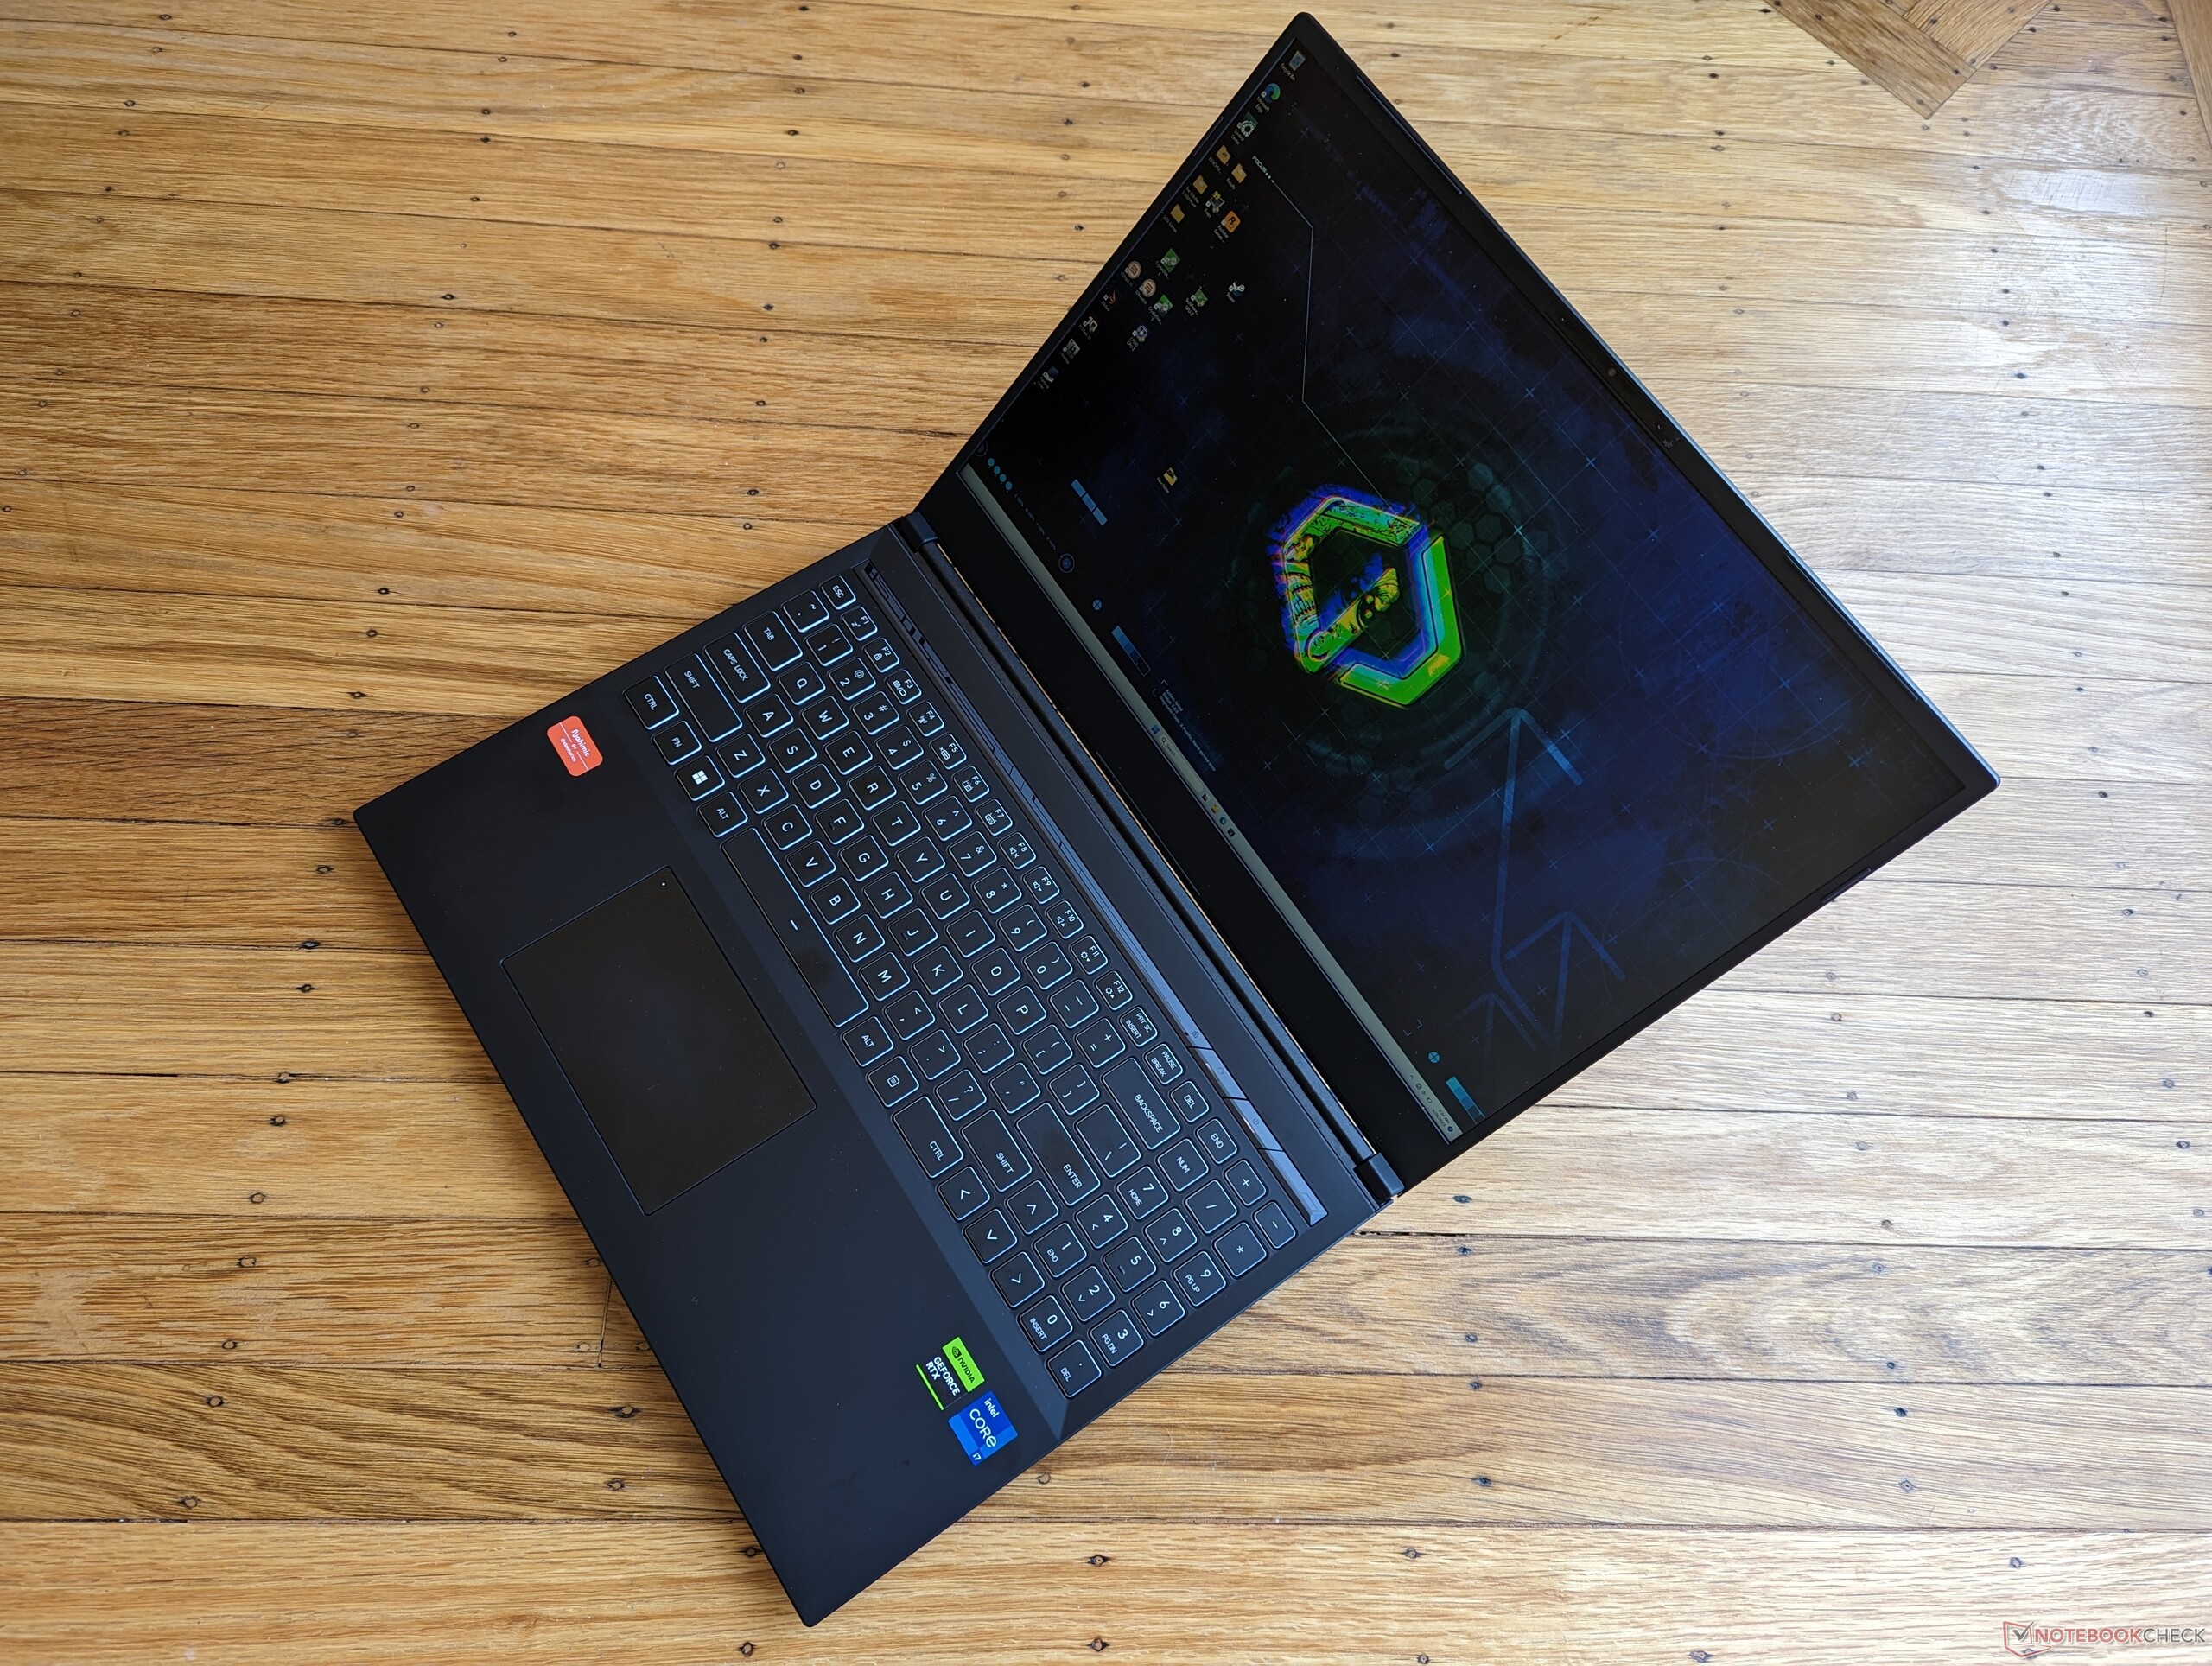
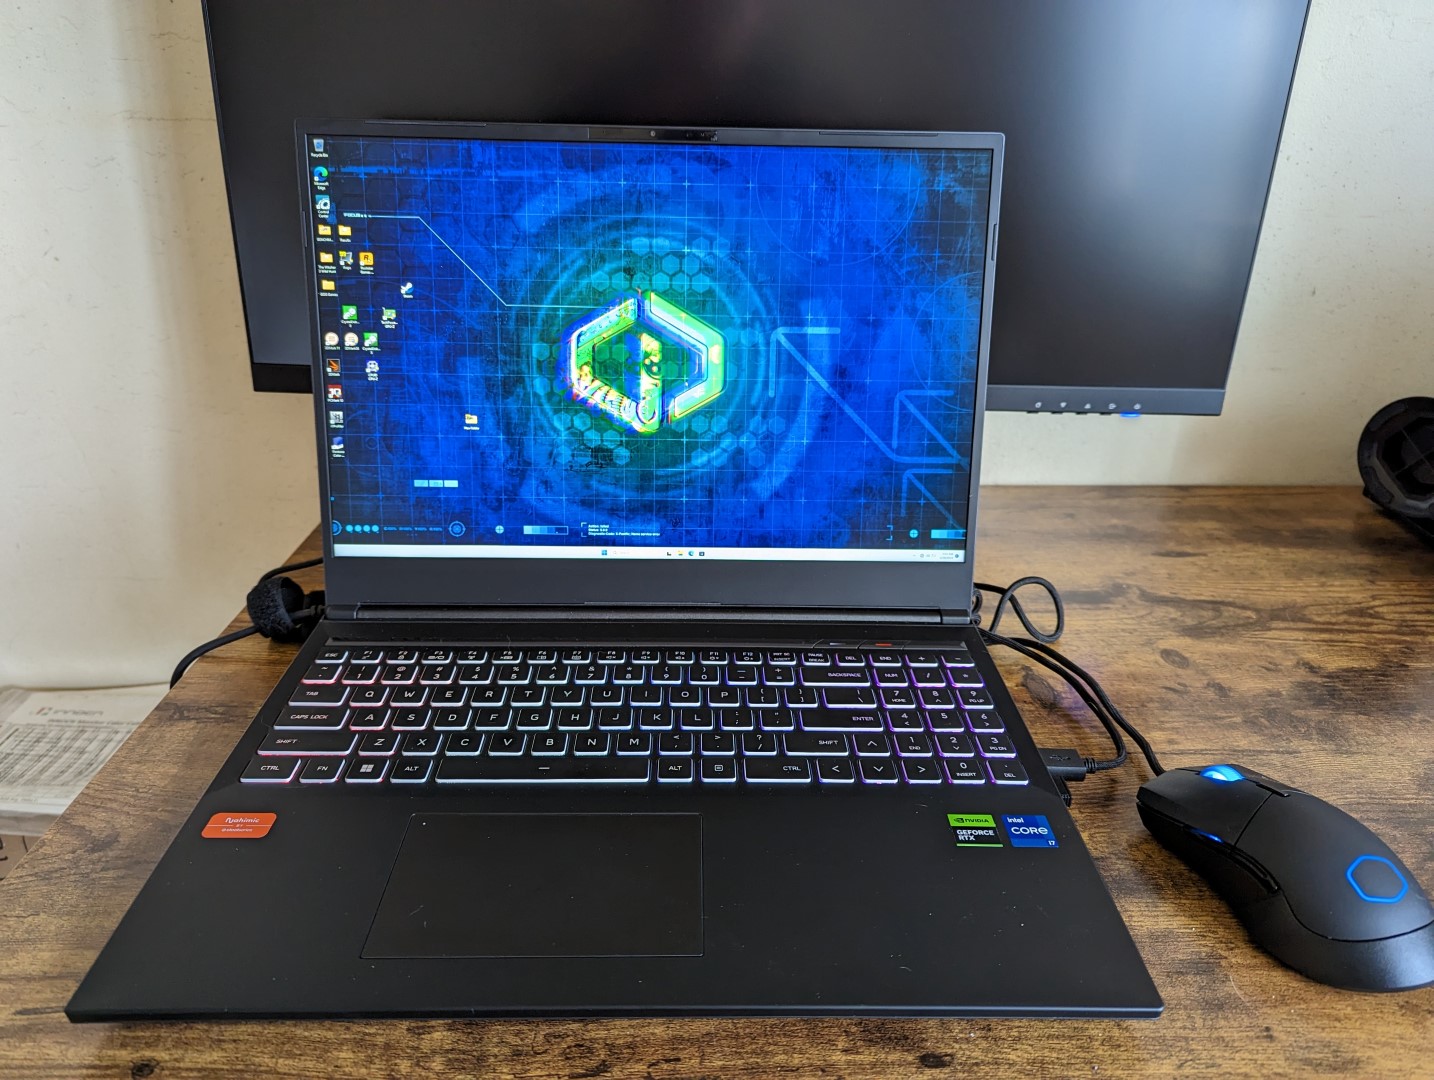
Uniwill GM6PX7X är en 16-tums bärbar dator för spel med vitmärke som på vissa marknader kallas för Schenker XMG Neo 16 E23. Det är en nyare modell som avslöjades på CES 2023 tillsammans med den mobila 13th gen Raptor Lake-H-serien och den mobila Ada Lovelace GeForce RTX 40-serien.
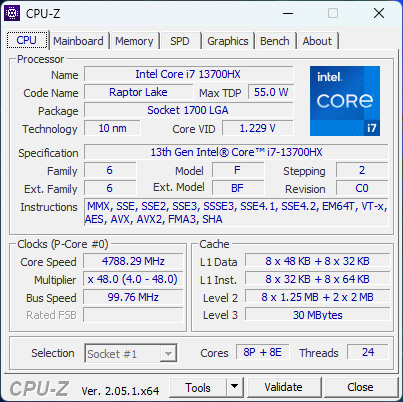
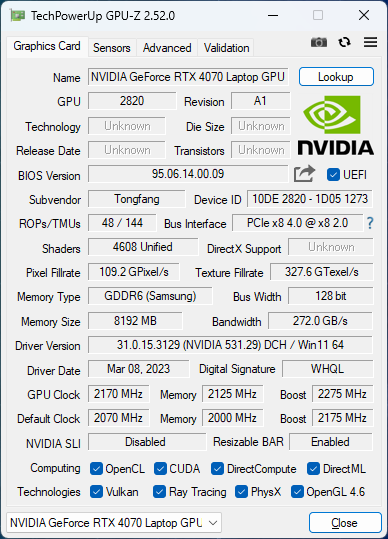
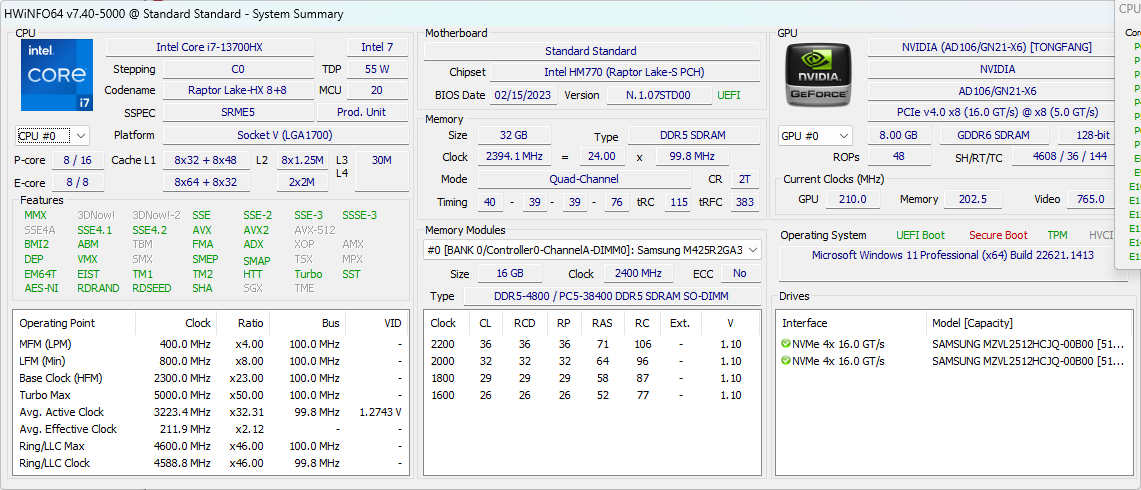
Liksom de flesta andra Uniwill- eller Schenker-modeller är GM6PX7X mycket konfigurerbar med CPU-alternativ upp till Core i9-13900HX och GPU-alternativ som sträcker sig från den mobila GeForce RTX 4060 upp till 4090. Vår specifika granskningsenhet är en mellankonfiguration utrustad med Core i7-13700HX och RTX 4070.
Se vår fullständiga recension av Schenker XMG Neo 16 E23 med RTX 4090-drift för mer information om chassit och vår RTX 4070-drivna Uniwill GM6PX7X använder samma konstruktion. Det finns dock flera fysiska skillnader mellan dem som vi kommer att notera nedan.
Fler recensioner av Uniwill/Schenker:
Potentiella konkurrenter i jämförelse
Gradering | Datum | Modell | Vikt | Höjd | Storlek | Upplösning | Pris |
|---|---|---|---|---|---|---|---|
| 88.2 % v7 (old) | 03/2023 | Uniwill GM6PX7X RTX 4070 i7-13700HX, GeForce RTX 4070 Laptop GPU | 2.2 kg | 22 mm | 16.00" | 2560x1600 | |
| 87.7 % v7 (old) | 04/2023 | Schenker XMG Neo 16 E23 i9-13900HX, GeForce RTX 4090 Laptop GPU | 2.5 kg | 29.9 mm | 16.00" | 2560x1600 | |
| 88.4 % v7 (old) | 03/2023 | Asus ROG Strix G16 G614JZ i9-13980HX, GeForce RTX 4080 Laptop GPU | 2.4 kg | 30.4 mm | 16.00" | 2560x1600 | |
| 89.4 % v7 (old) | 02/2023 | Lenovo Legion Pro 7 16IRX8H i9-13900HX, GeForce RTX 4080 Laptop GPU | 2.7 kg | 26 mm | 16.00" | 2560x1600 | |
| 86.2 % v7 (old) | 03/2023 | Gigabyte AERO 16 OLED BSF i9-13900H, GeForce RTX 4070 Laptop GPU | 2.1 kg | 18 mm | 16.00" | 3840x2400 | |
| 91.2 % v7 (old) | 02/2023 | Razer Blade 16 Early 2023 i9-13950HX, GeForce RTX 4080 Laptop GPU | 2.4 kg | 21.99 mm | 16.00" | 2560x1600 |
Fall
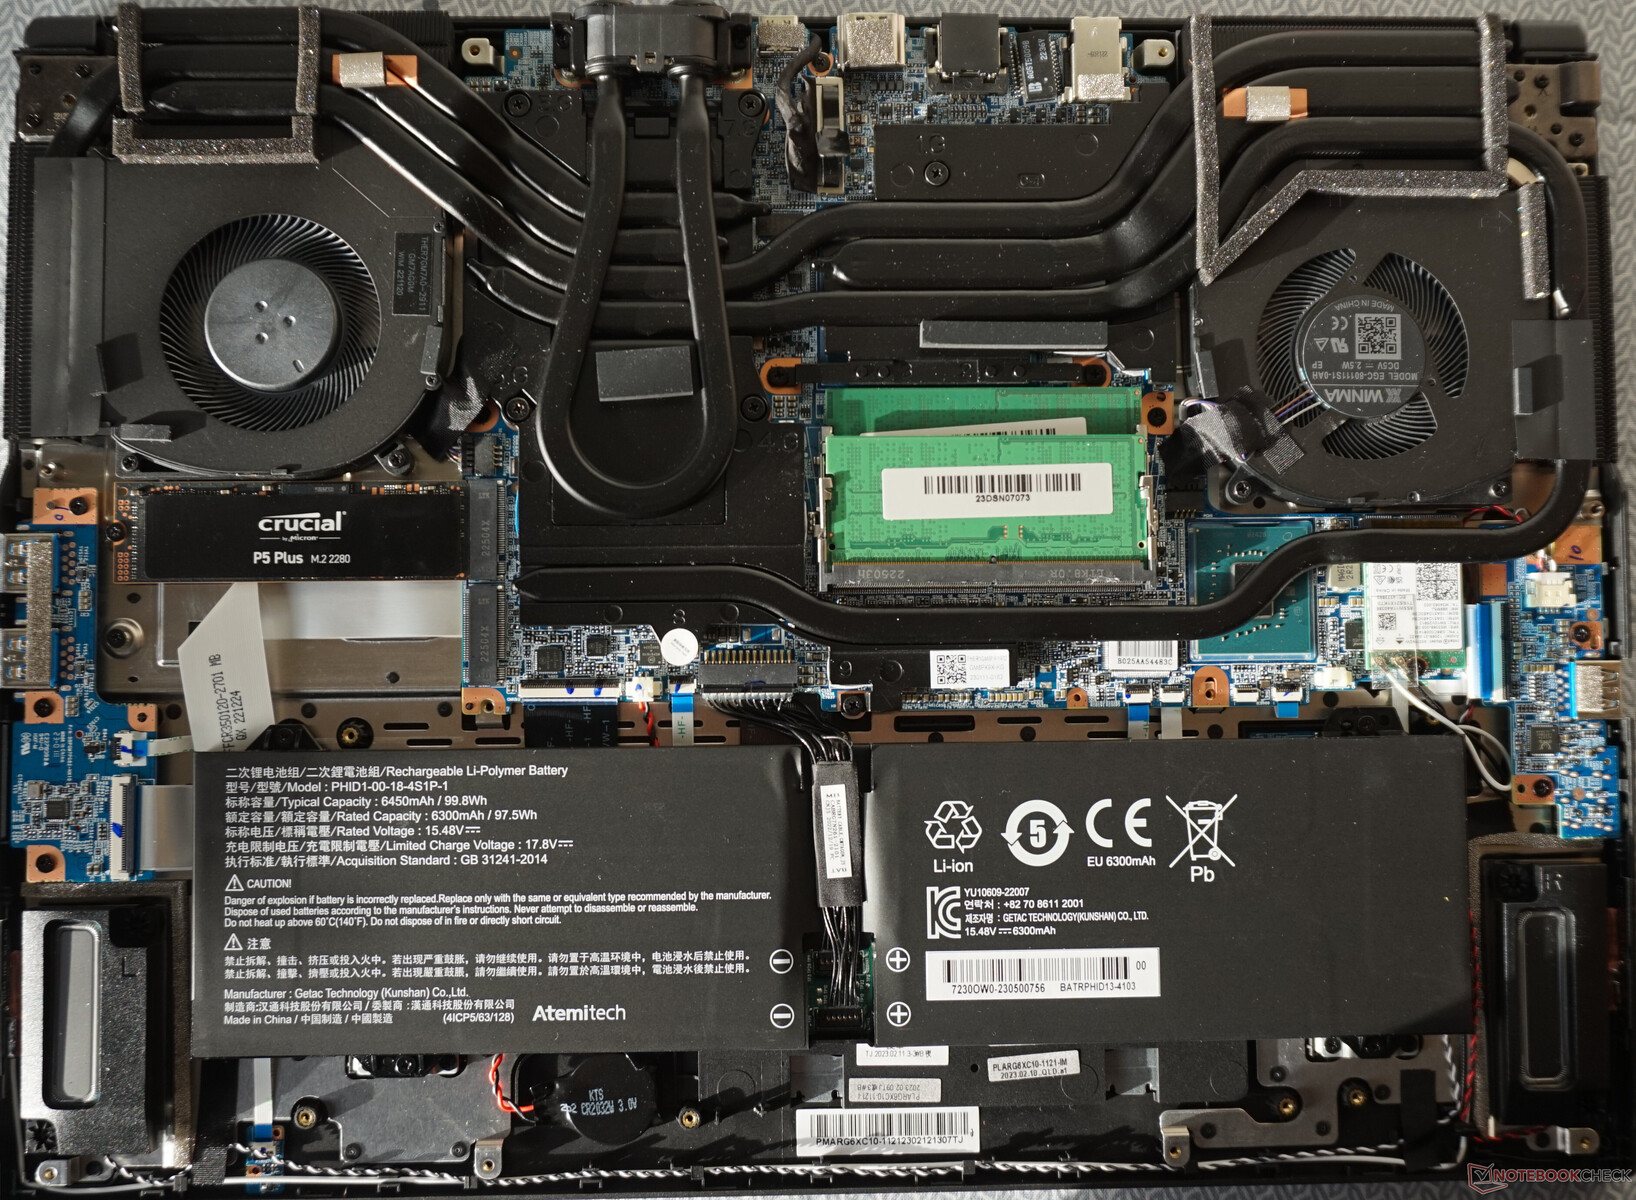
Det finns två chassiversioner av Schenker XMG Neo 16: en tunnare version för alla RTX 4060- och 4070-konfigurationer och en tjockare version för alla RTX 4080- och 4090-konfigurationer. De mobila RTX 4080/4090 GPU:erna är mer energikrävande än de mobila RTX 4060/4070 och kräver därför en större chassistorlek. De viktigaste skillnaderna mellan de två versionerna är bland annat:
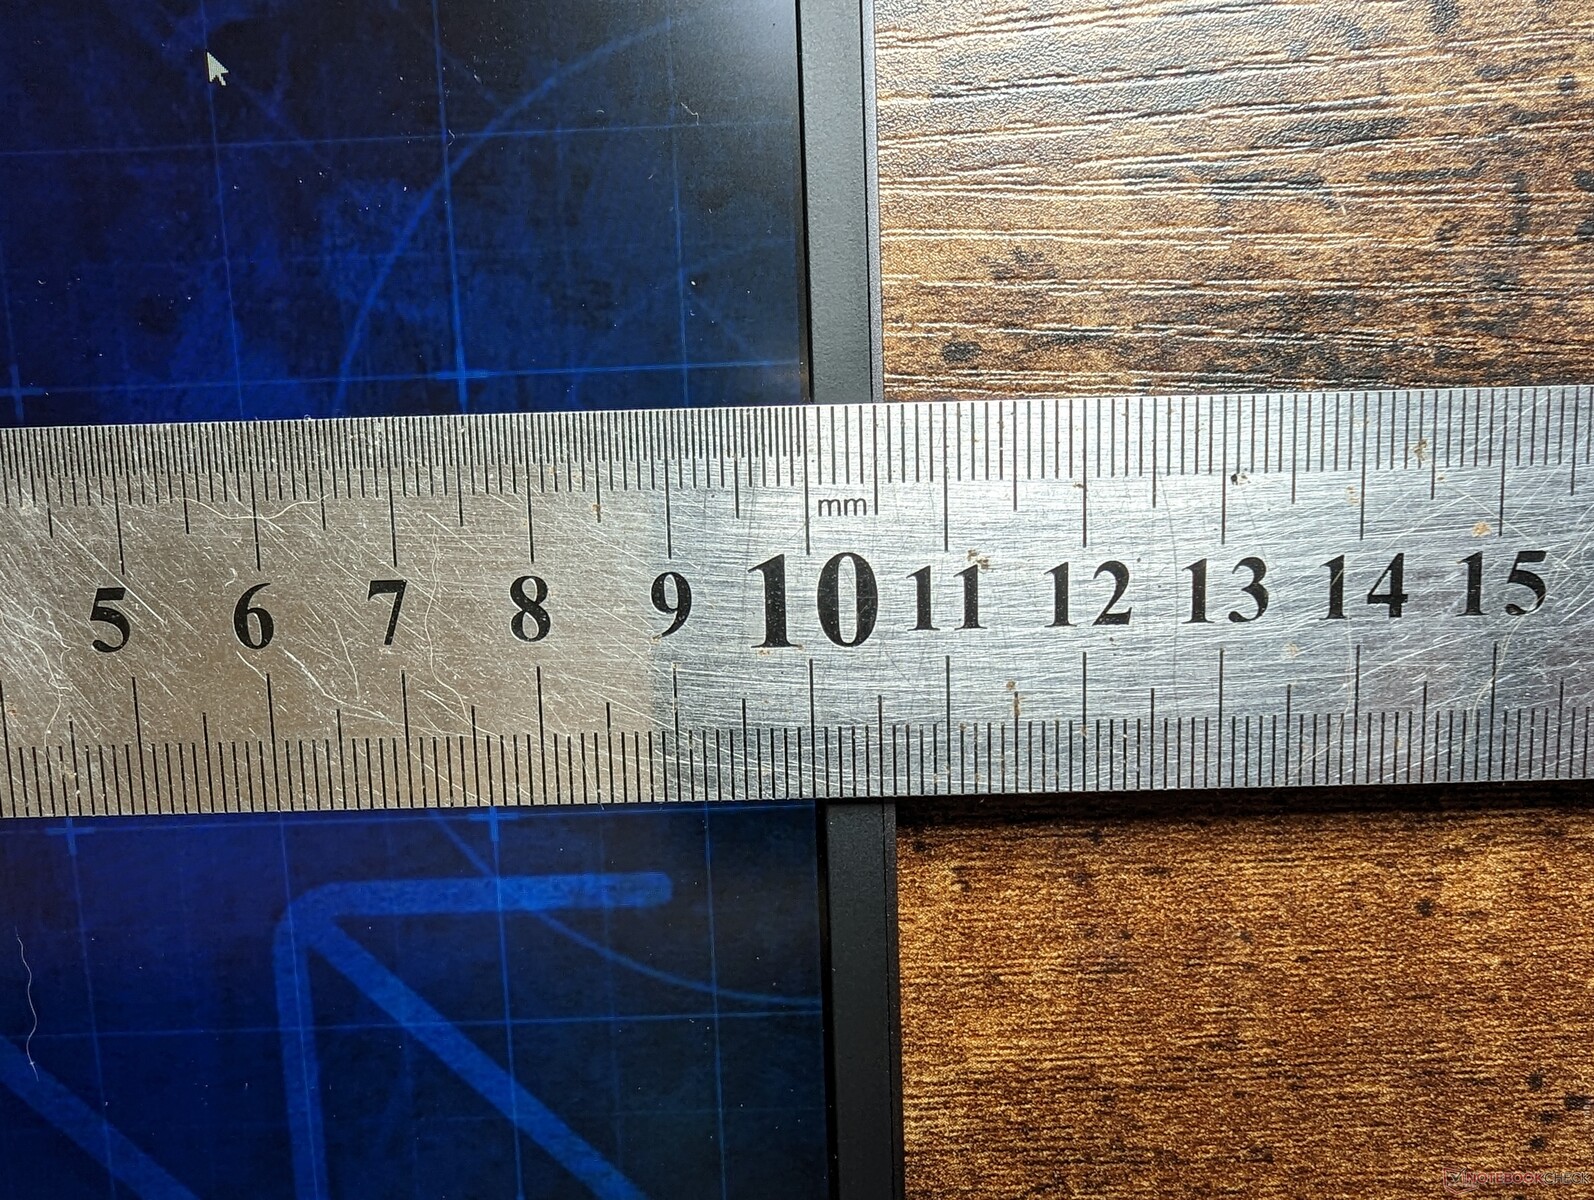
- Tjocklek: 22 mm jämfört med 26,1 mm
- Vikt: 2,2 kg jämfört med 2,5 kg
- Batterikapacitet: 62 Wh jämfört med 99 Wh
- Webbkamera: 1 MP vs. 2 MP
- Växelströmsadapter: 280 W vs. 330 W
Båda modellerna har i övrigt samma tangentbordsalternativ (membran eller Cherry MX mechanical), klickplatta, portar, skärm och chassimaterial.
SD-kortläsare
| SD Card Reader | |
| average JPG Copy Test (av. of 3 runs) | |
| Gigabyte AERO 16 OLED BSF | |
| Razer Blade 16 Early 2023 (AV PRO microSD 128 GB V60) | |
| Schenker XMG Neo 16 E23 (AV PRO microSD 128 GB V60) | |
| Uniwill GM6PX7X RTX 4070 (AV PRO microSD 128 GB V60) | |
| maximum AS SSD Seq Read Test (1GB) | |
| Razer Blade 16 Early 2023 (AV PRO microSD 128 GB V60) | |
| Gigabyte AERO 16 OLED BSF | |
| Uniwill GM6PX7X RTX 4070 (AV PRO microSD 128 GB V60) | |
| Schenker XMG Neo 16 E23 (AV PRO microSD 128 GB V60) | |
Kommunikation
| Networking | |
| iperf3 transmit AXE11000 | |
| Schenker XMG Neo 16 E23 | |
| Lenovo Legion Pro 7 16IRX8H | |
| Asus ROG Strix G16 G614JZ | |
| Razer Blade 16 Early 2023 | |
| Uniwill GM6PX7X RTX 4070 | |
| iperf3 receive AXE11000 | |
| Schenker XMG Neo 16 E23 | |
| Lenovo Legion Pro 7 16IRX8H | |
| Asus ROG Strix G16 G614JZ | |
| Razer Blade 16 Early 2023 | |
| Uniwill GM6PX7X RTX 4070 | |
| iperf3 transmit AXE11000 6GHz | |
| Gigabyte AERO 16 OLED BSF | |
| Razer Blade 16 Early 2023 | |
| iperf3 receive AXE11000 6GHz | |
| Gigabyte AERO 16 OLED BSF | |
| Razer Blade 16 Early 2023 | |
Webbkamera


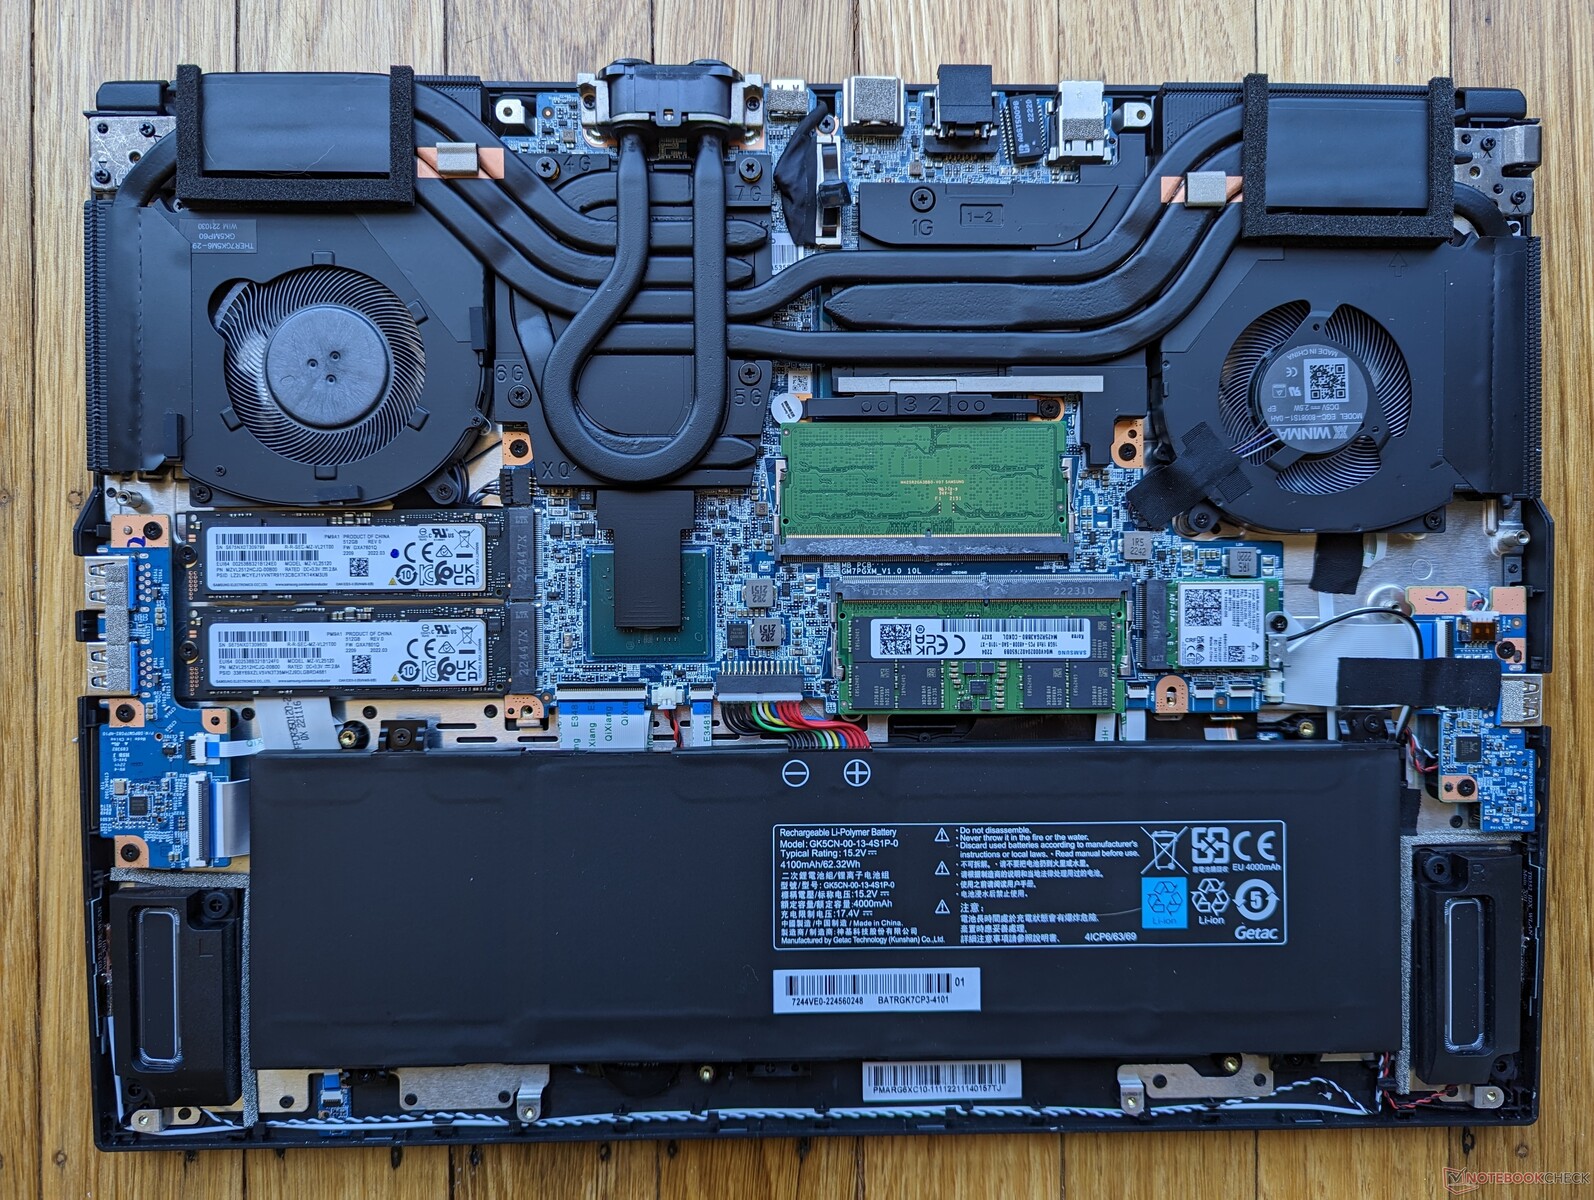
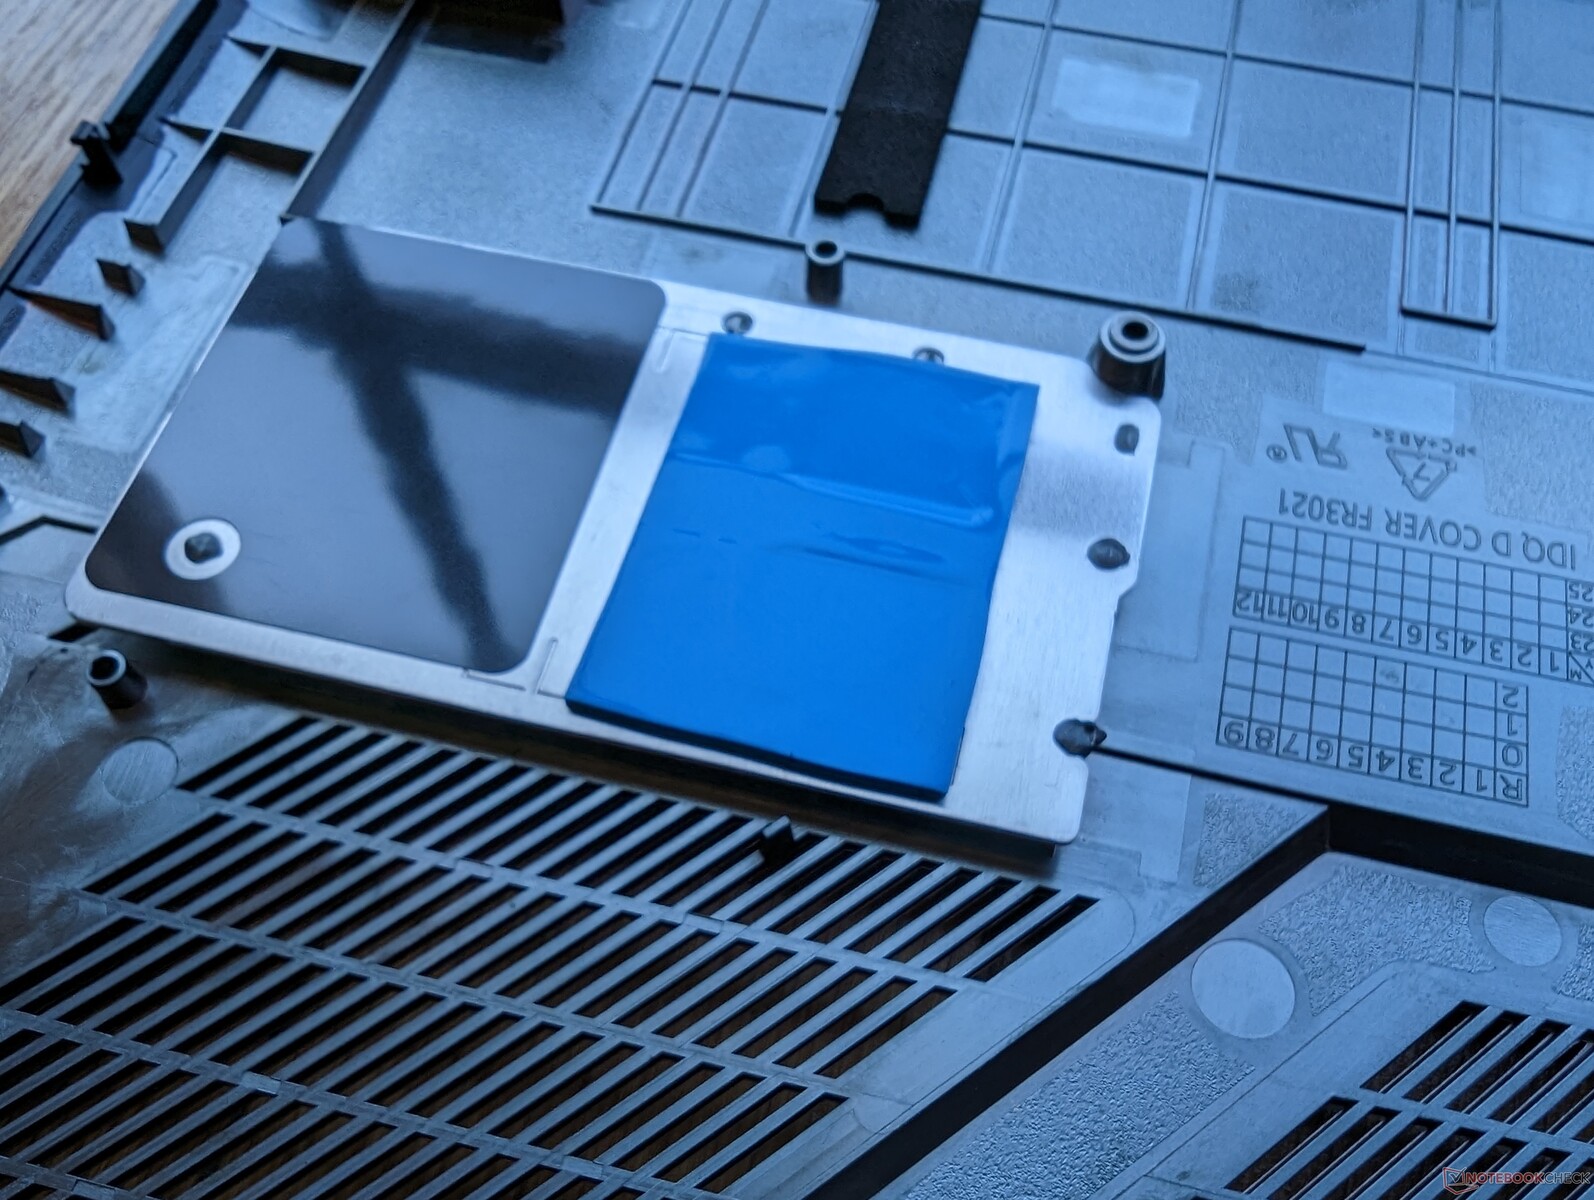
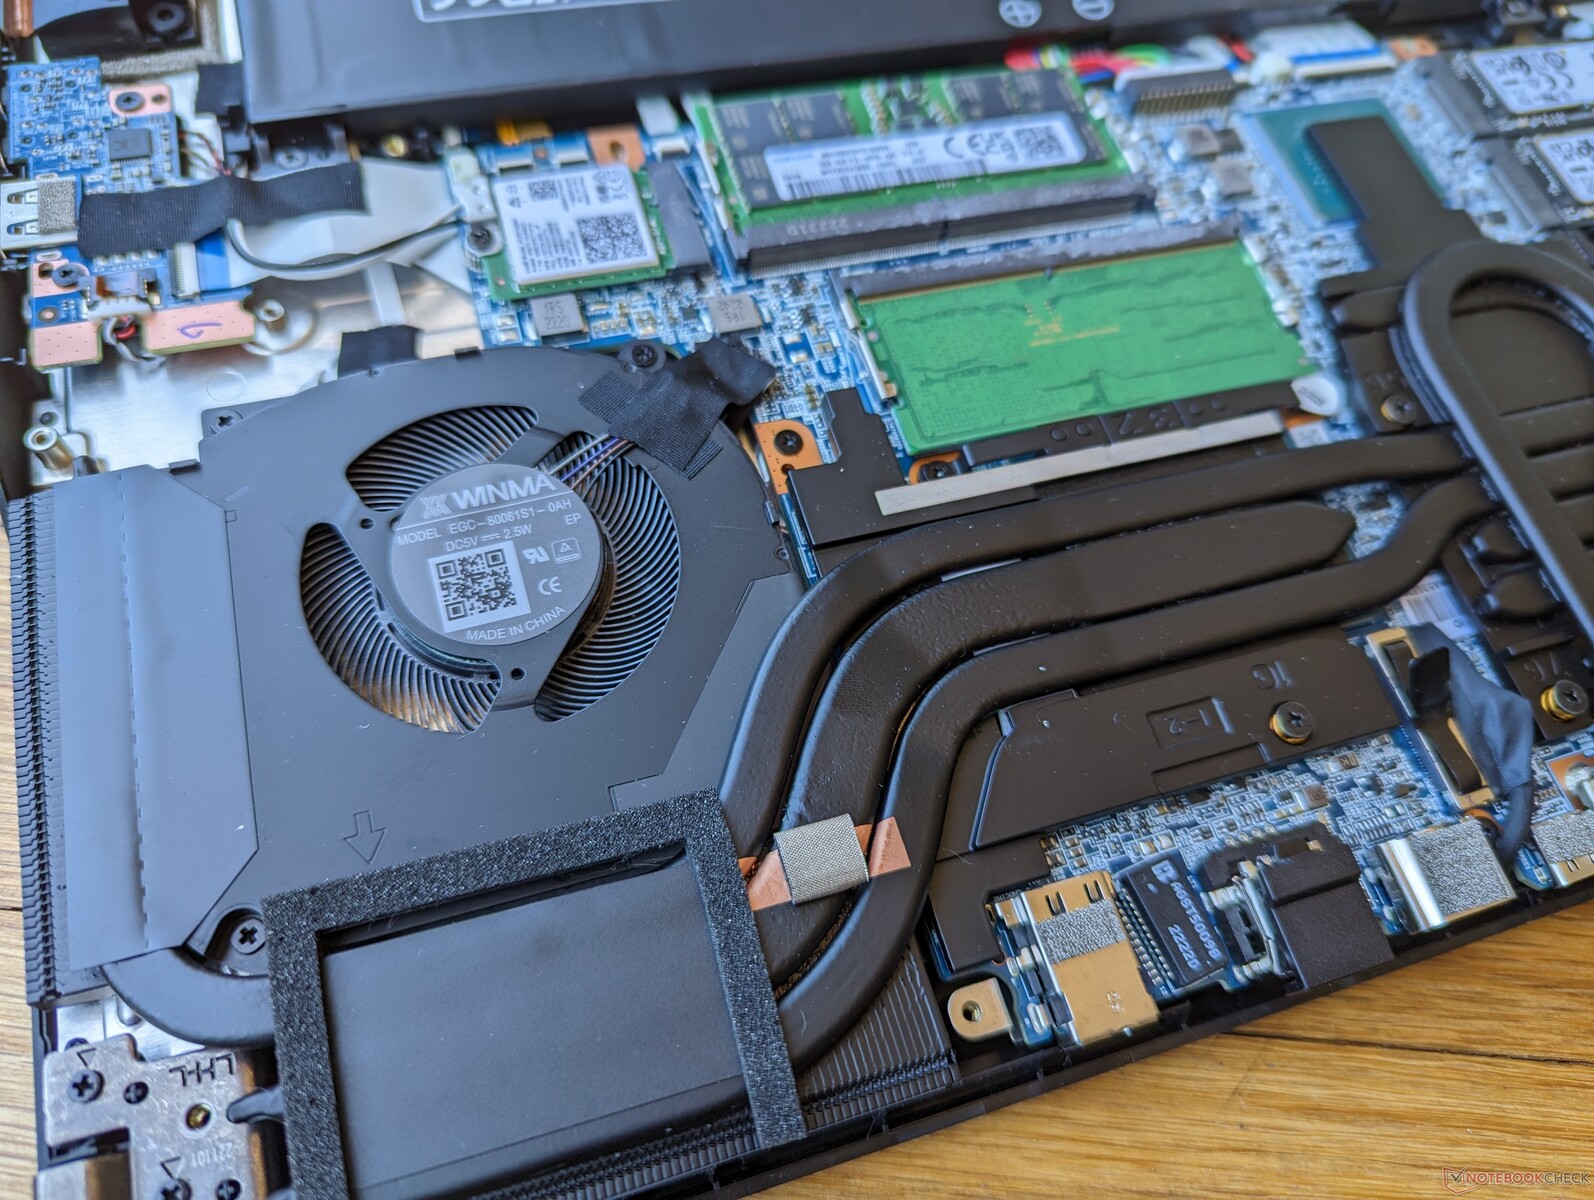
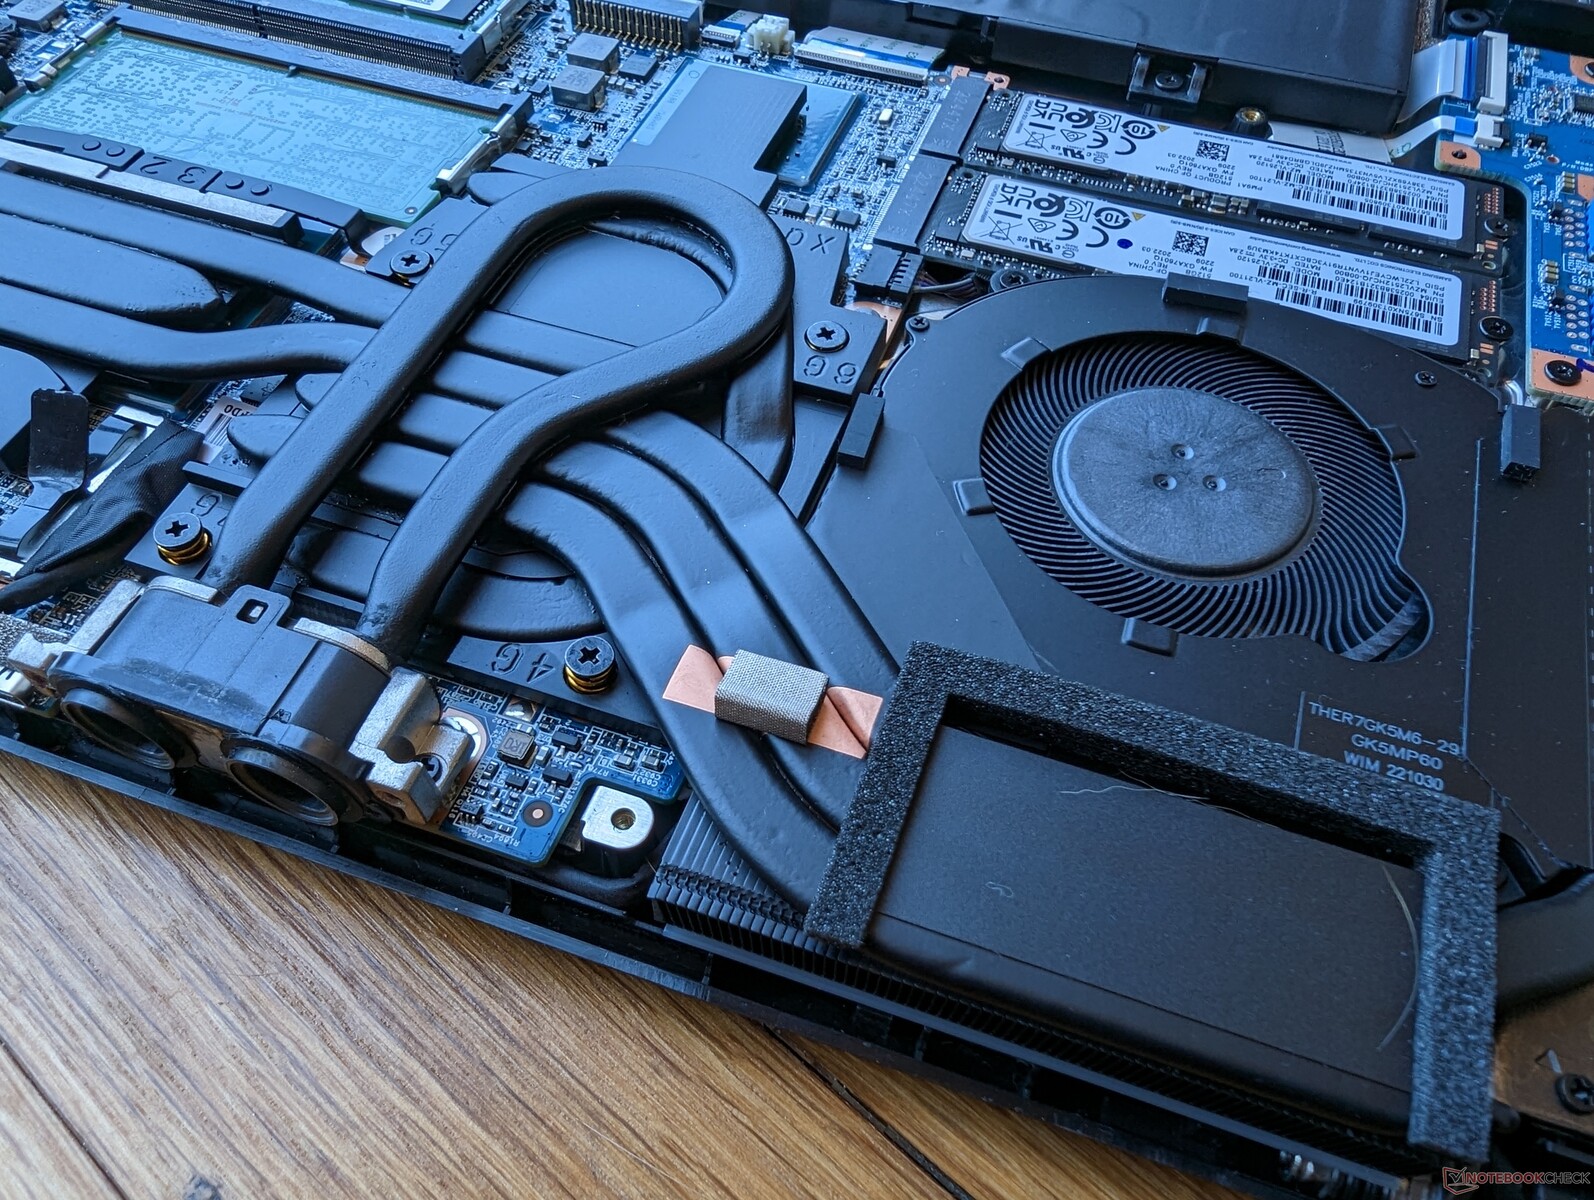
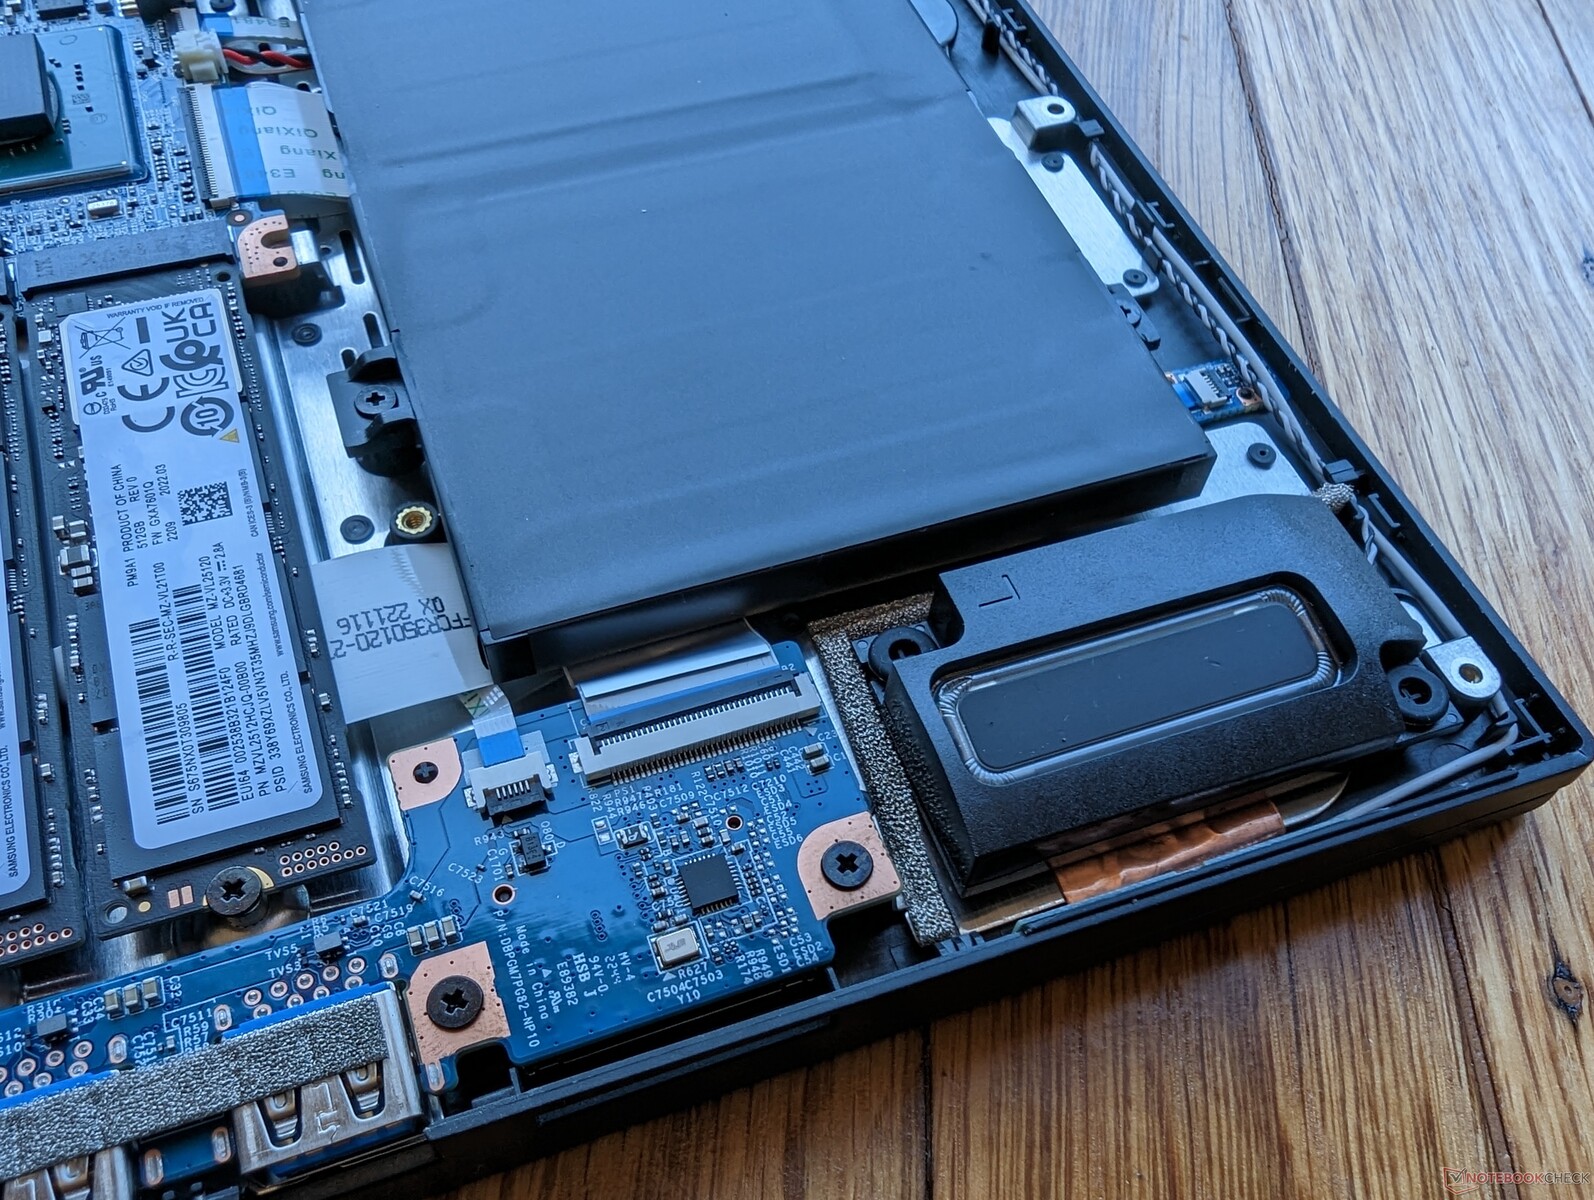
Underhåll
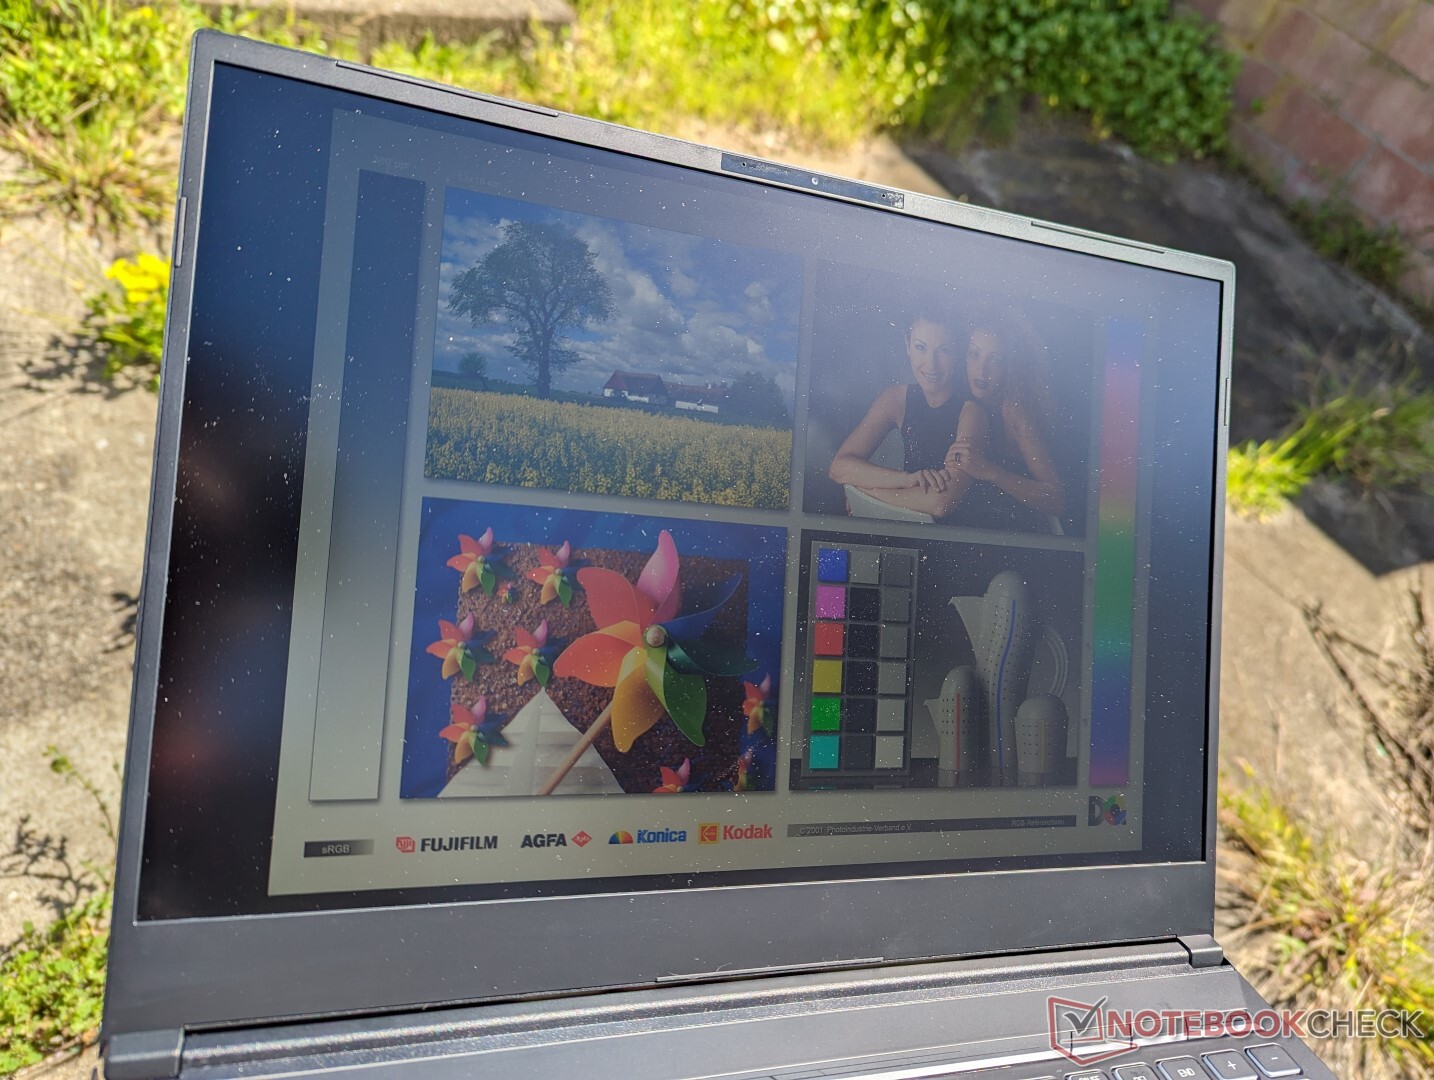
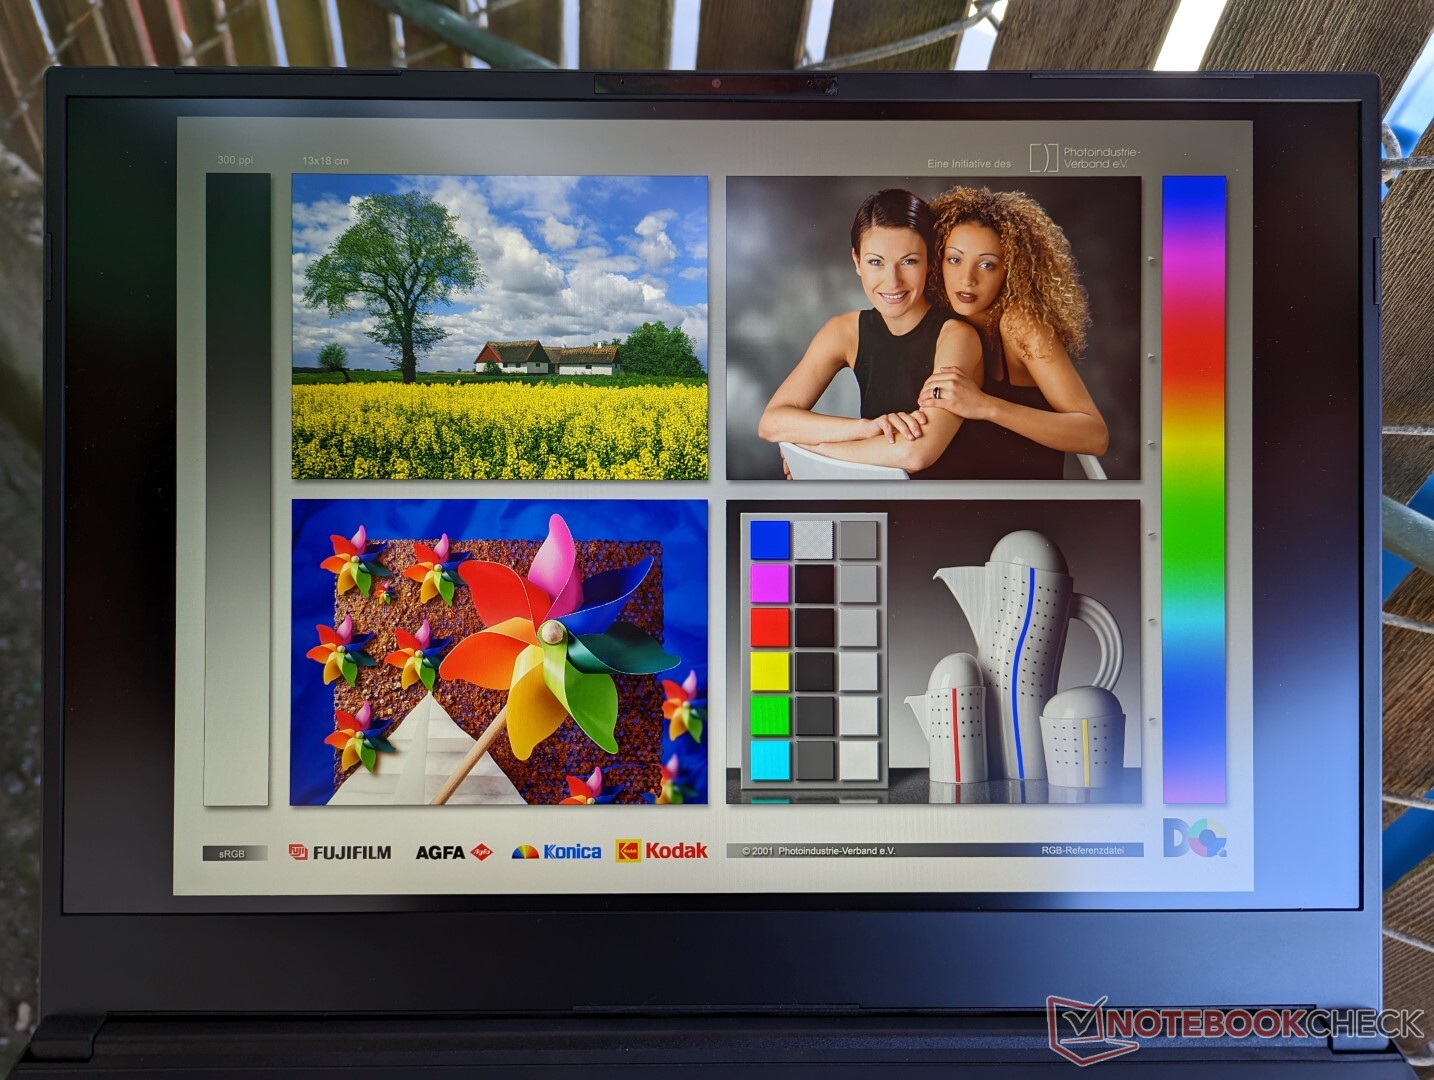
Visa
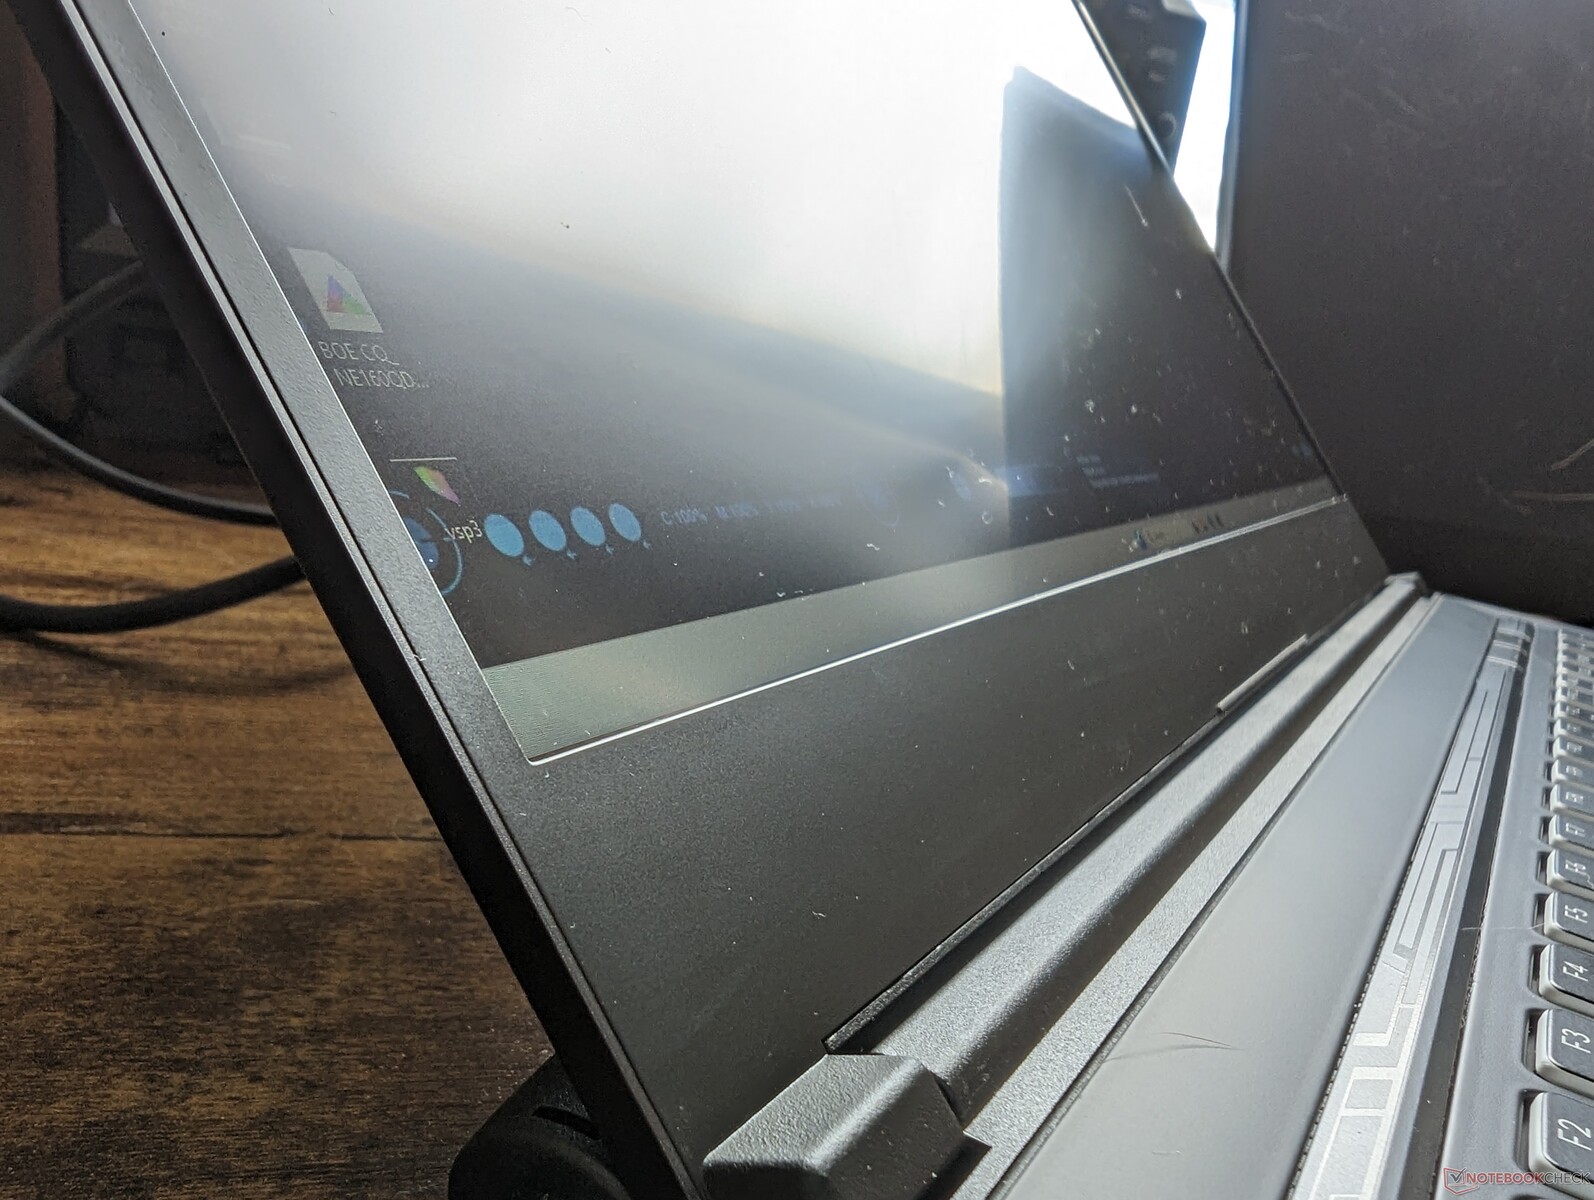
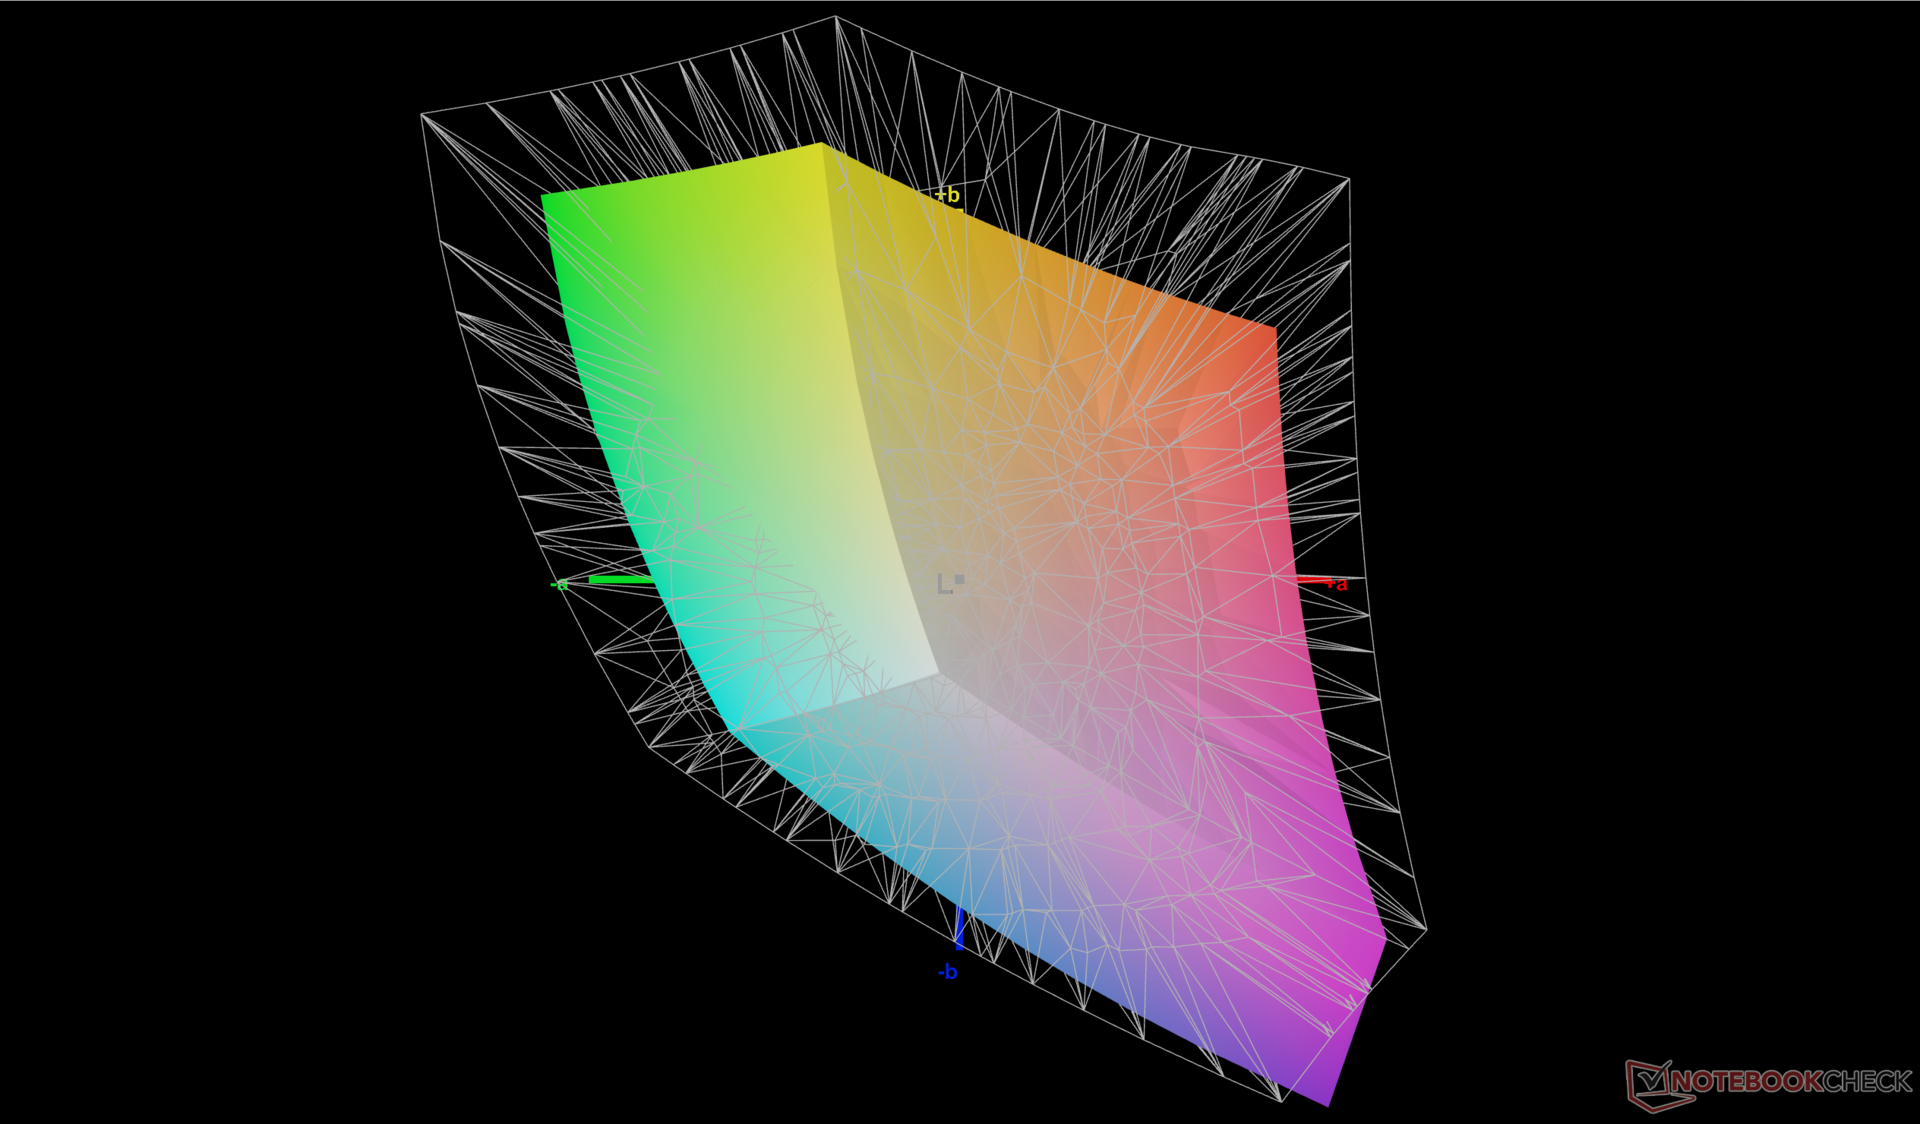
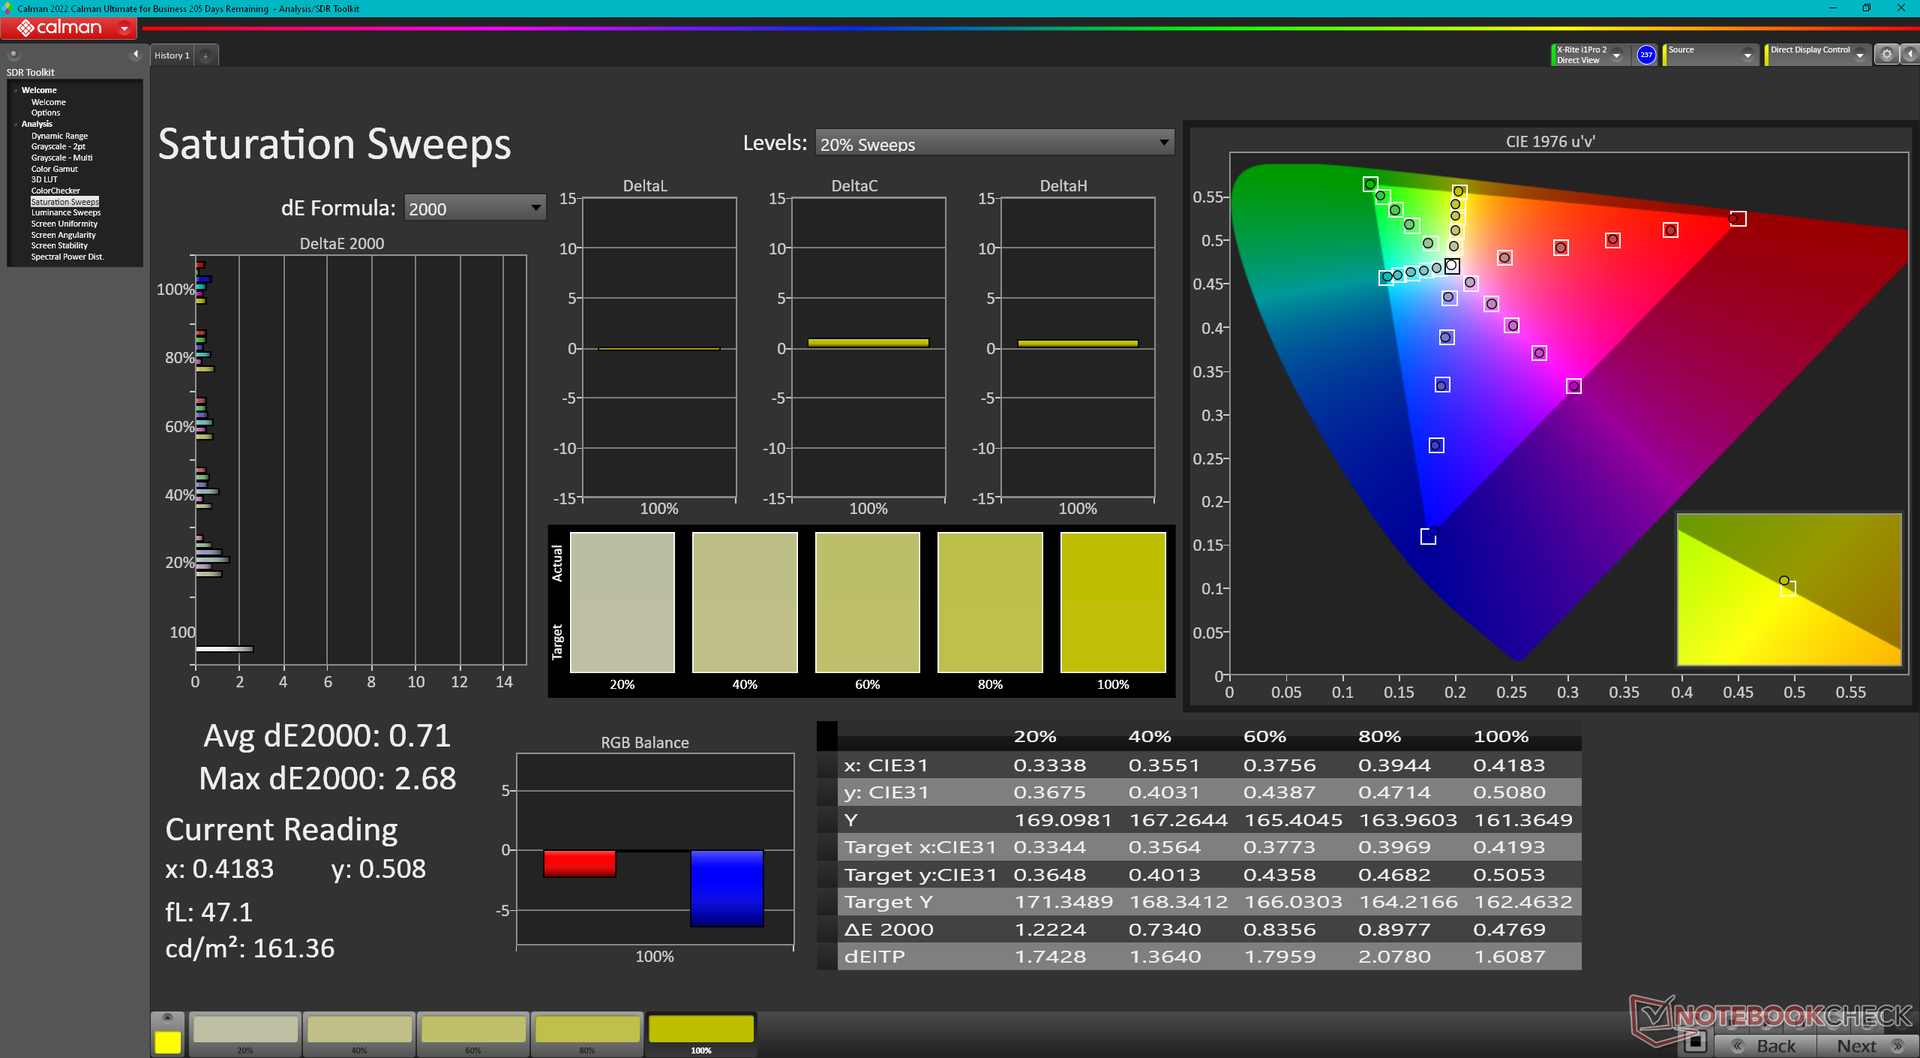
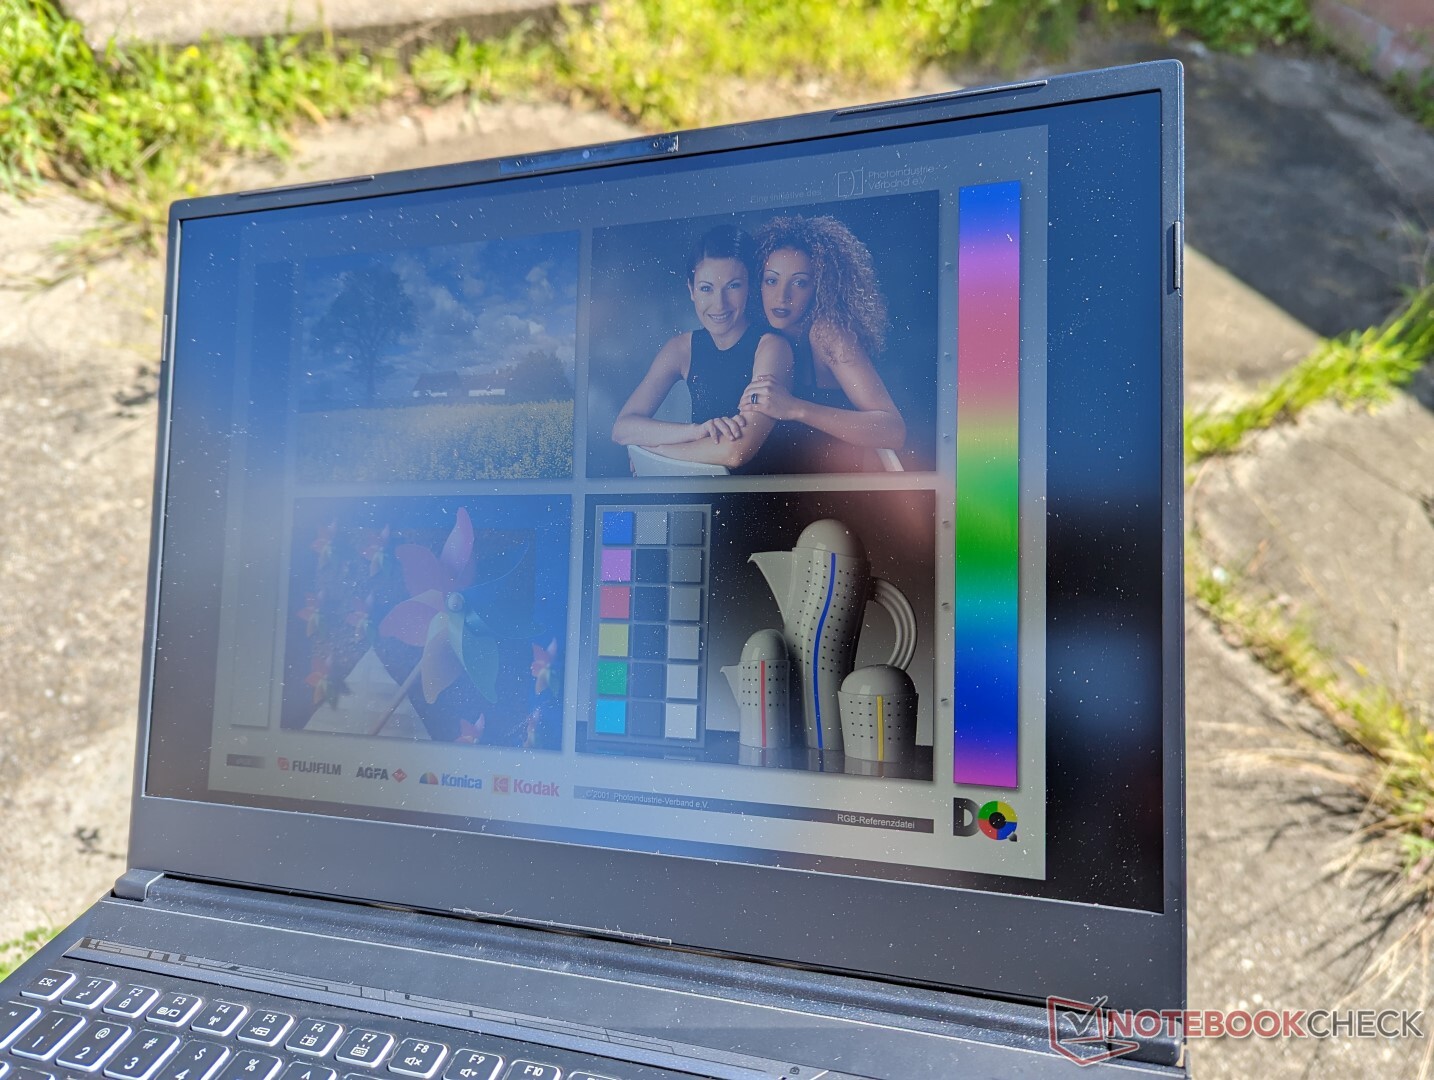
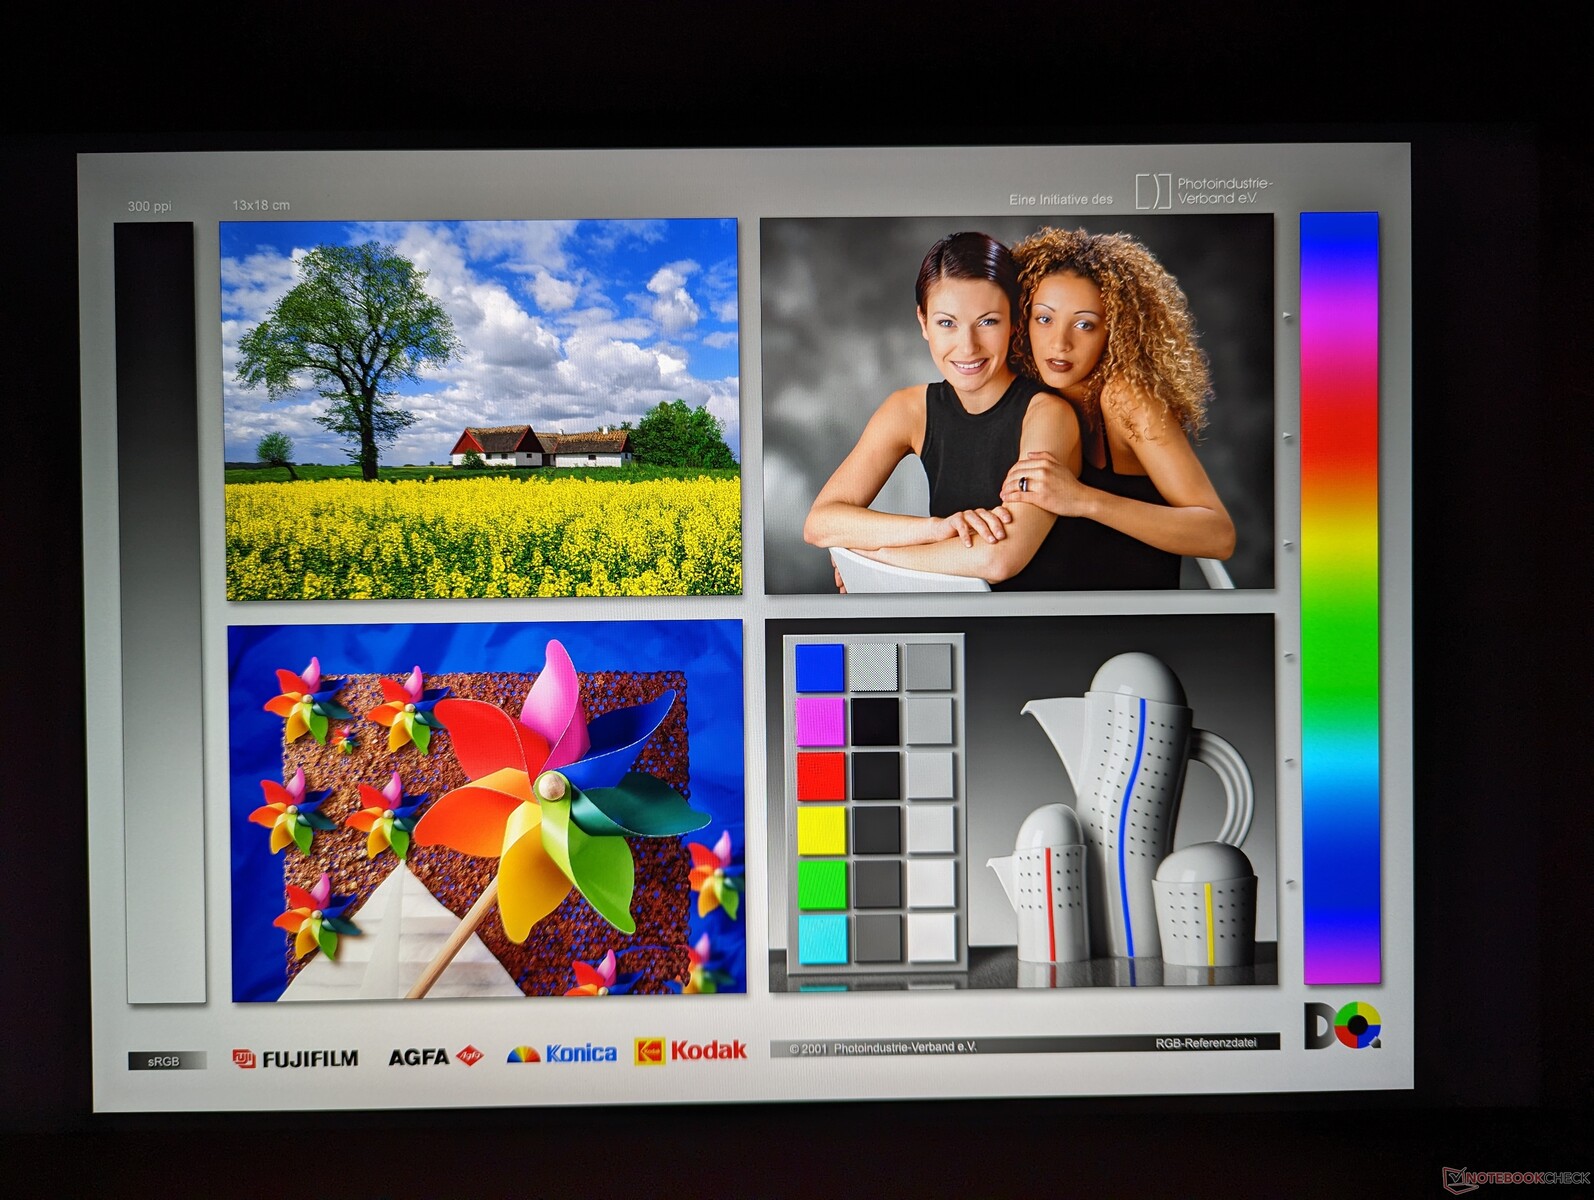
Det finns inga andra bildskärmsalternativ för just den här chassidesignen och därför använder vår Uniwill samma BOE NE160QDM-NZ1 IPS-panel som finns på Schenker Neo 16 med RTX 4090-drift. Panelen är anmärkningsvärd för sin snabba uppdateringsfrekvens på 240 Hz och >95 procent sRGB-täckning. Trots detta kan konkurrerande bärbara datorer som t.ex.Asus ROG Strix G16 ellerGigabyte AERO 16 OLED erbjuder ännu djupare färger och snabbare svarstider som hardcore-spelare eller grafikredigerare kan uppskatta.

| |||||||||||||||||||||||||
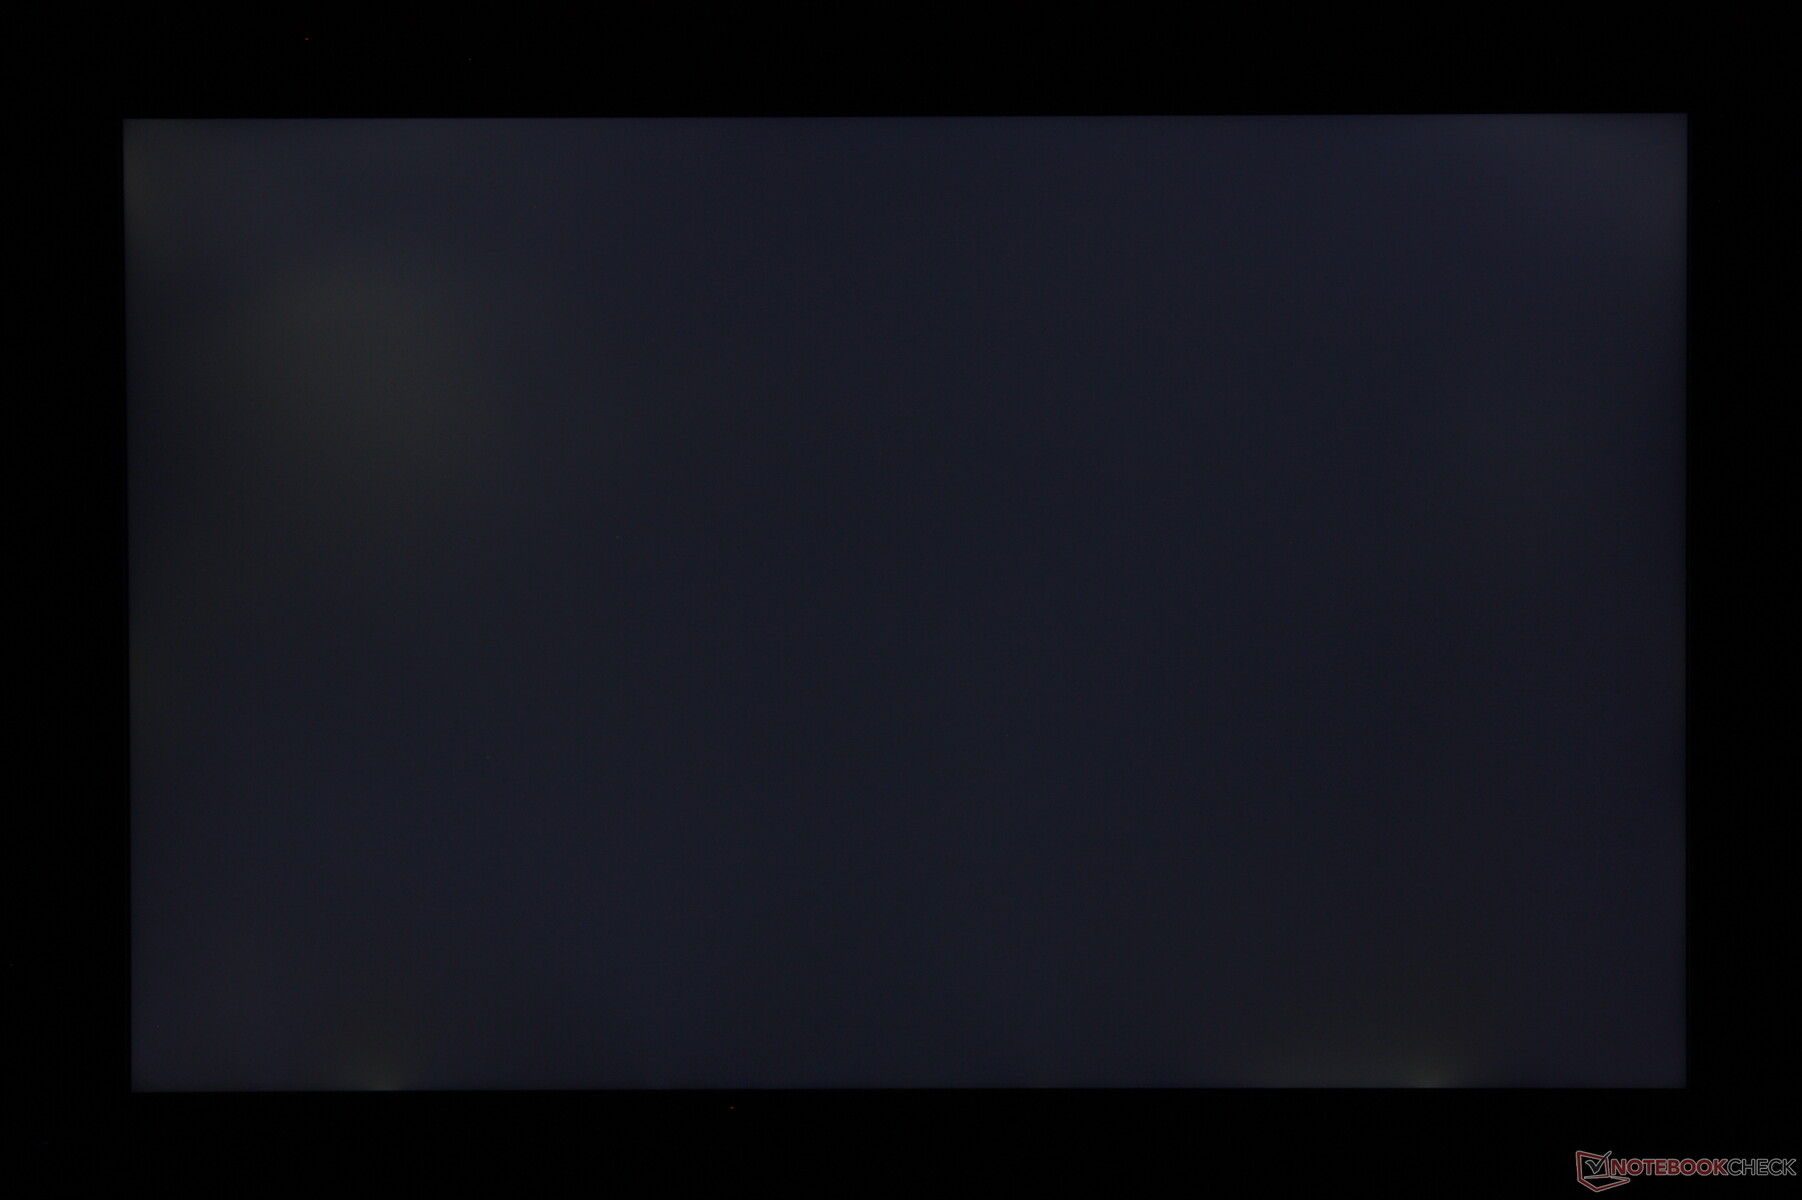
Distribution av ljusstyrkan: 89 %
Mitt på batteriet: 338.6 cd/m²
Kontrast: 1058:1 (Svärta: 0.32 cd/m²)
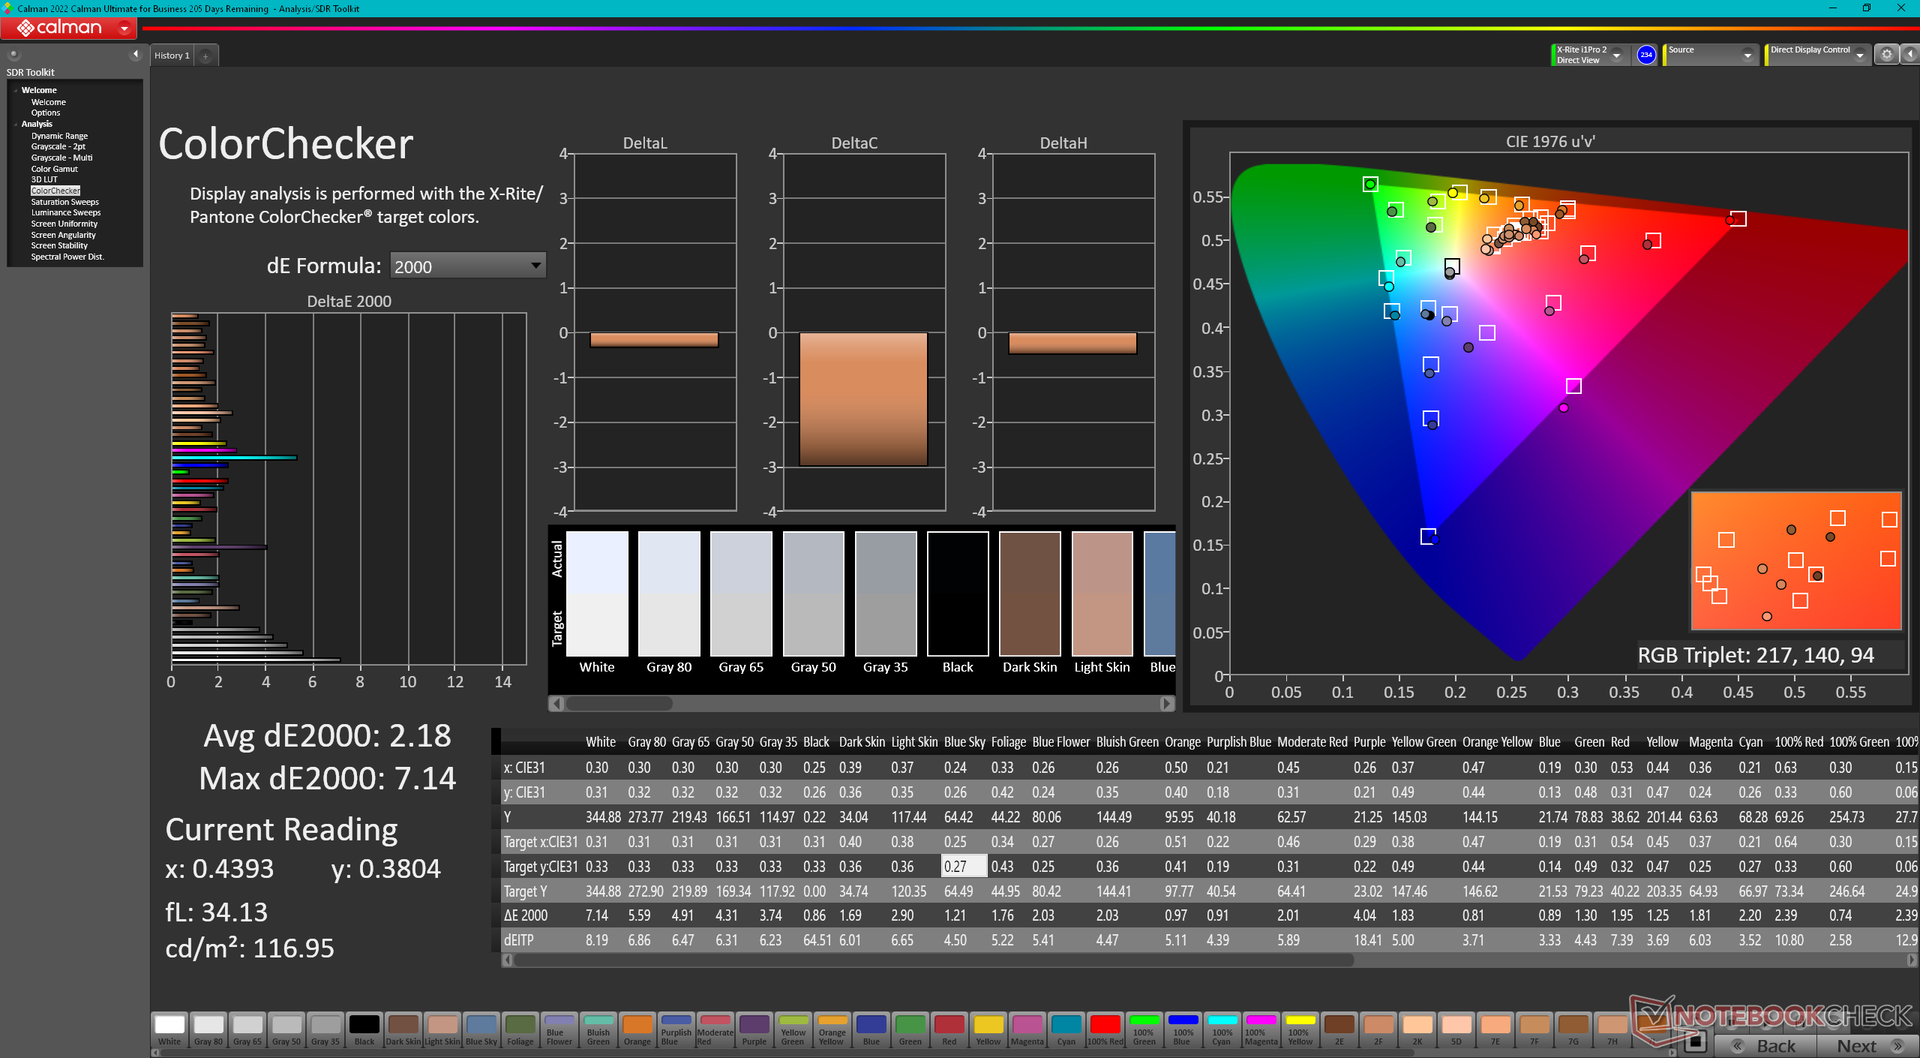
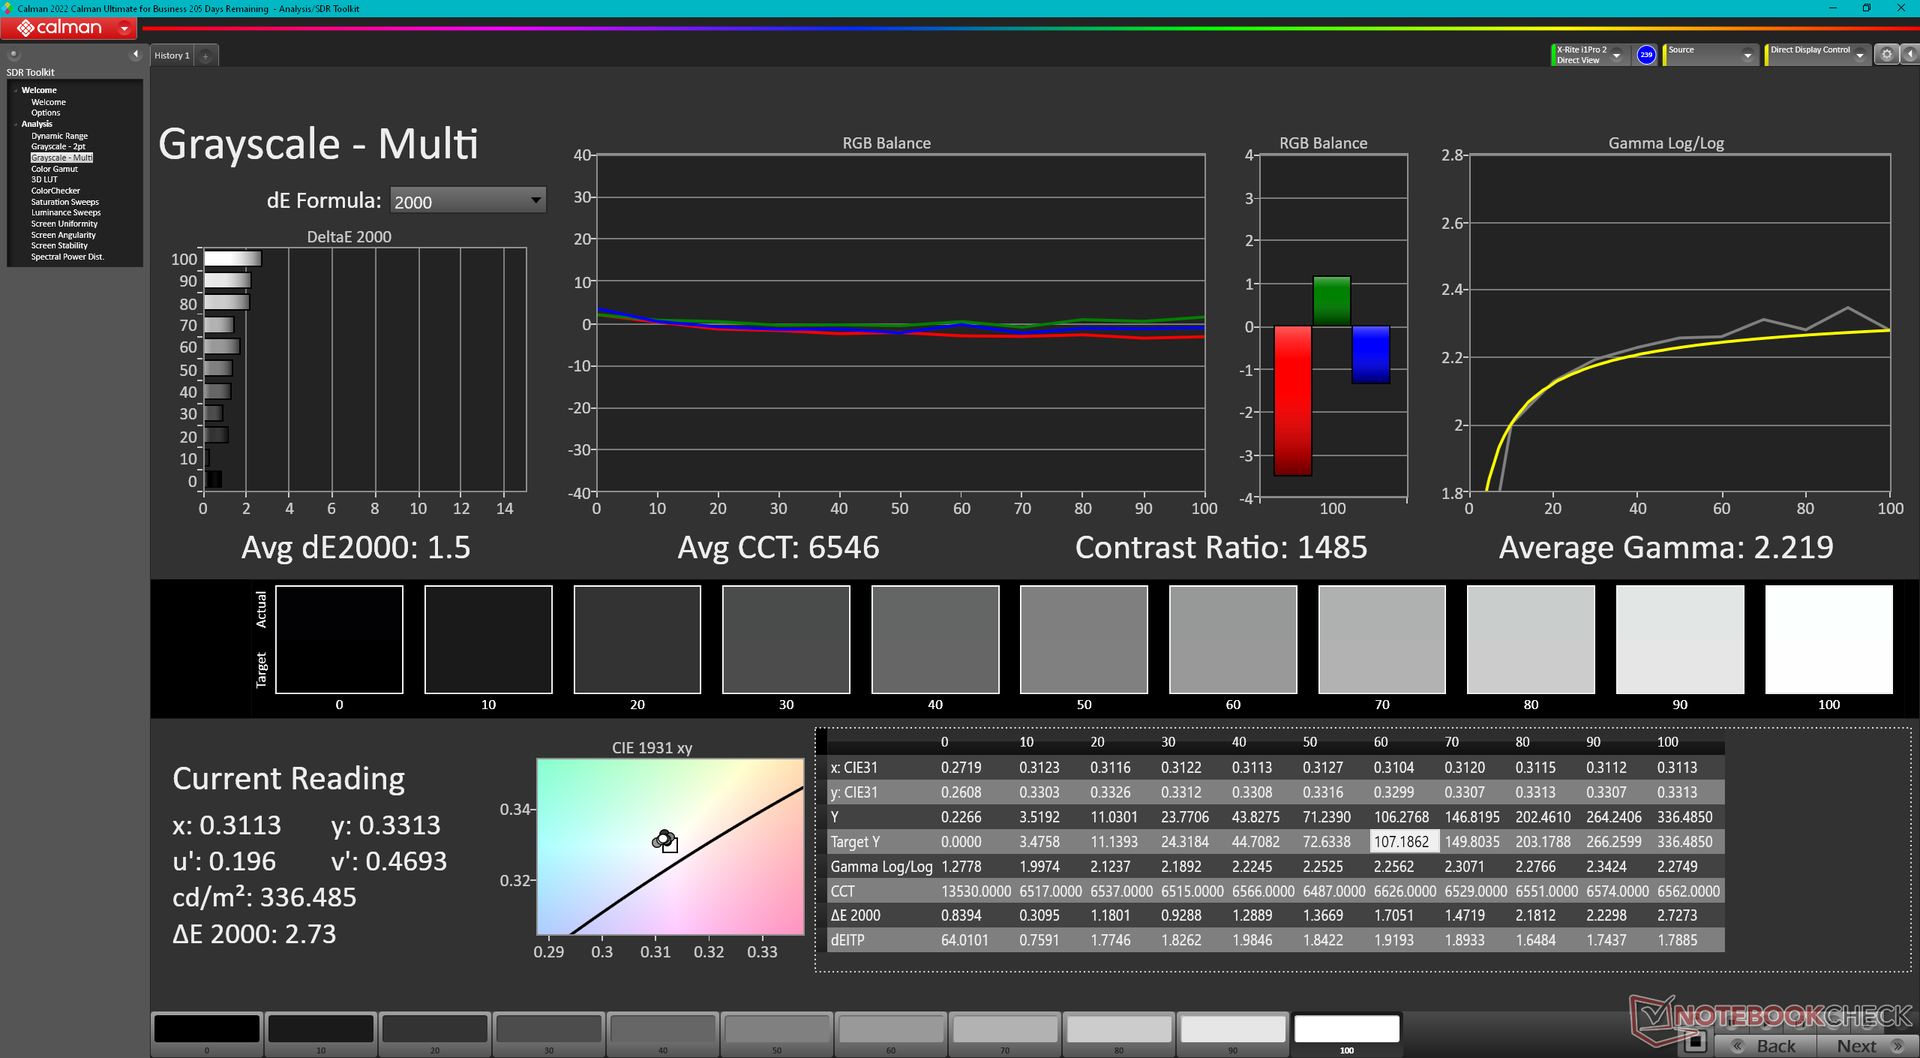
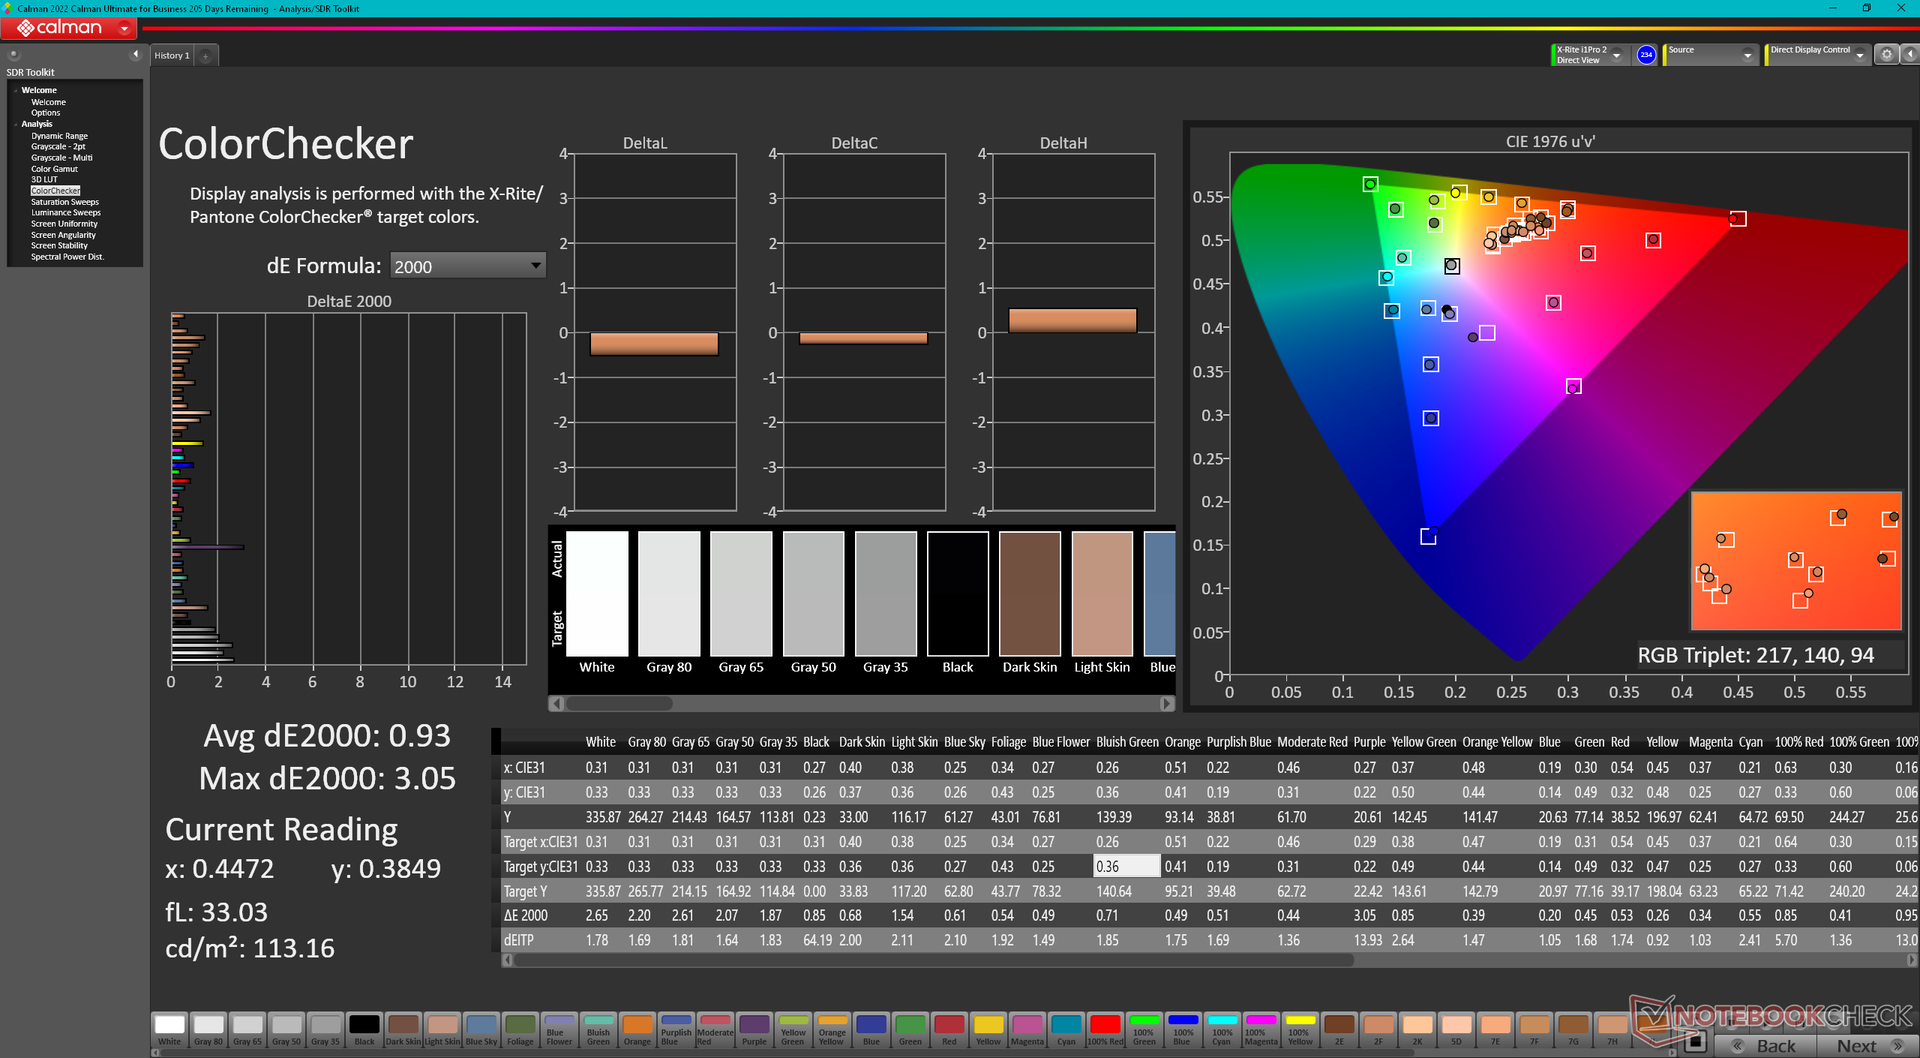
ΔE ColorChecker Calman: 2.18 | ∀{0.5-29.43 Ø4.71}
calibrated: 0.93
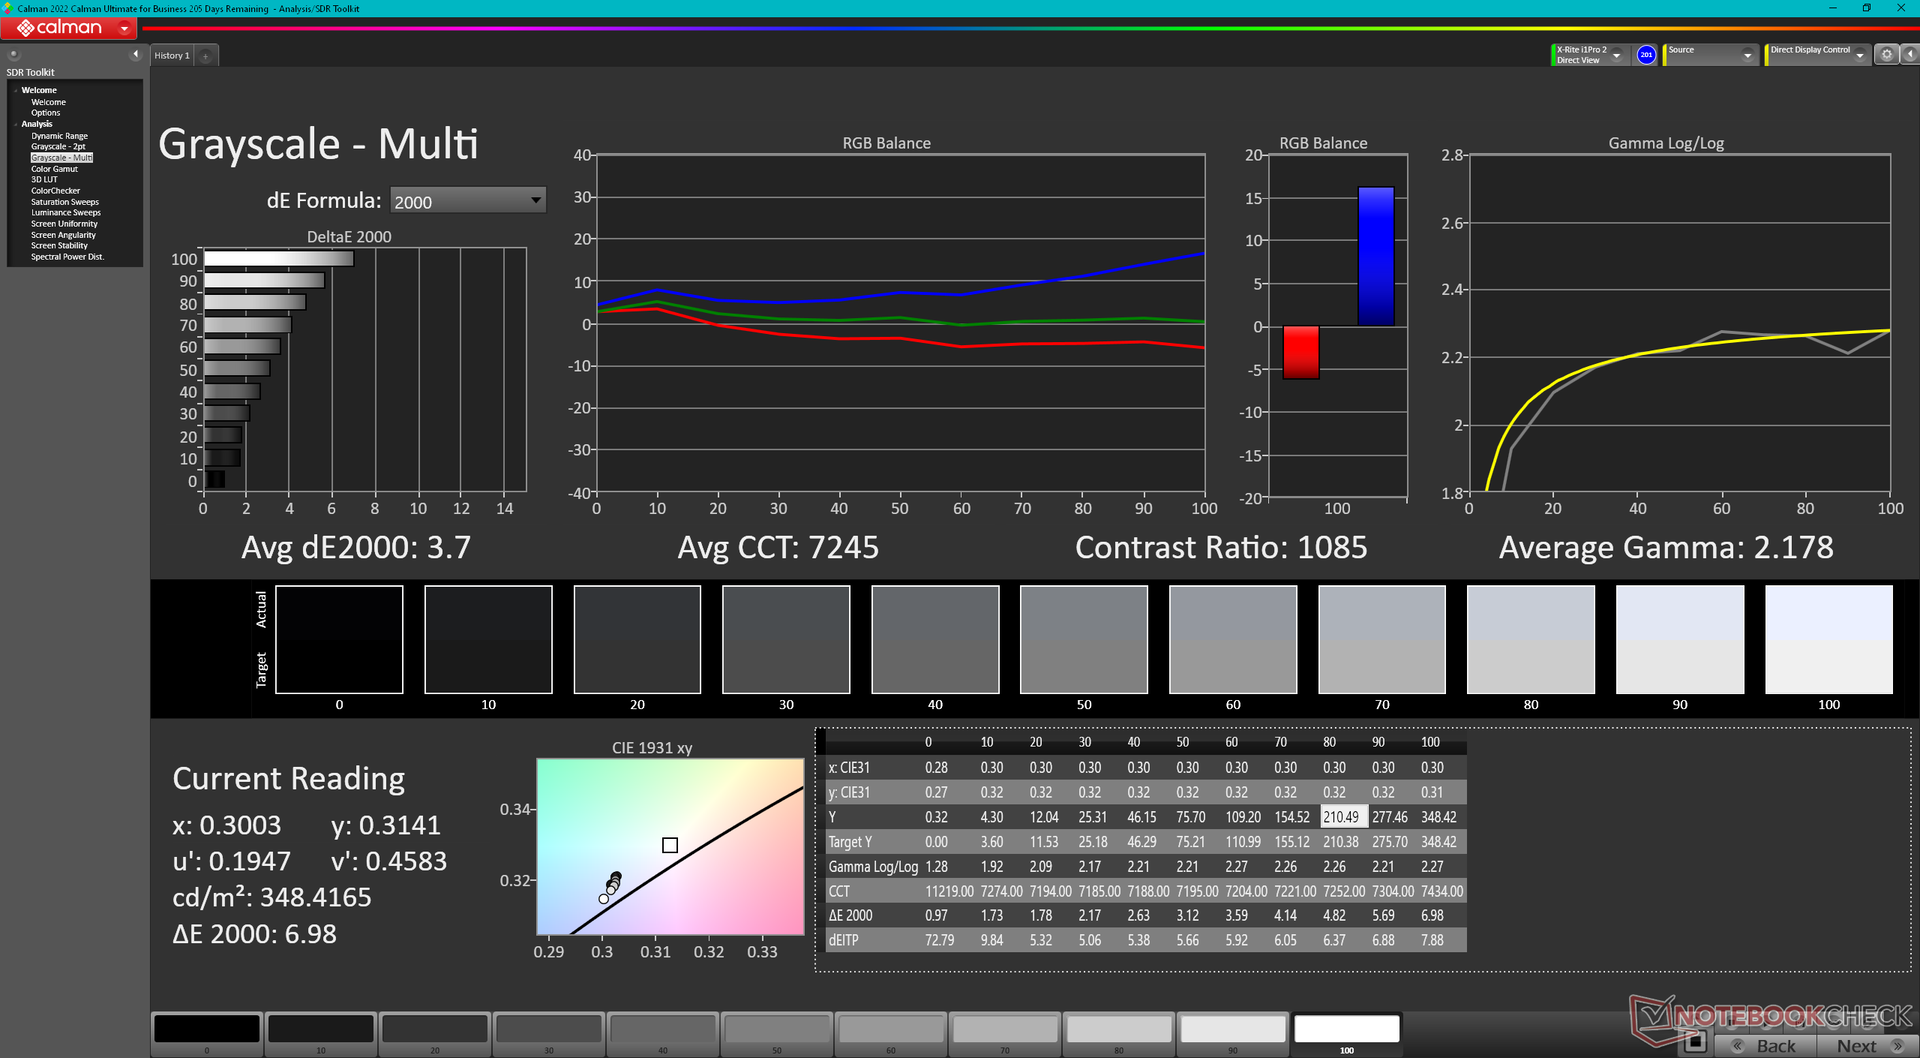
ΔE Greyscale Calman: 3.7 | ∀{0.09-98 Ø4.96}
68.6% AdobeRGB 1998 (Argyll 3D)
96.4% sRGB (Argyll 3D)
67.5% Display P3 (Argyll 3D)
Gamma: 2.18
CCT: 7245 K
| Uniwill GM6PX7X RTX 4070 BOE CQ NE160QDM-NZ1, IPS, 2560x1600, 16" | Schenker XMG Neo 16 E23 BOE0AF0 NE160QDM-NZ1, IPS, 2560x1600, 16" | Asus ROG Strix G16 G614JZ TL160ADMP03-0, IPS, 2560x1600, 16" | Lenovo Legion Pro 7 16IRX8H MNG007DA2-3 (CSO1628), IPS, 2560x1600, 16" | Gigabyte AERO 16 OLED BSF Samsung SDC4191 (ATNA60YV09-0, OLED, 3840x2400, 16" | Razer Blade 16 Early 2023 CSOT T3 MNG007DA4-1, IPS, 2560x1600, 16" | |
|---|---|---|---|---|---|---|
| Display | 0% | 24% | 3% | 31% | 27% | |
| Display P3 Coverage (%) | 67.5 | 67.3 0% | 97 44% | 69.1 2% | 99.9 48% | 98.5 46% |
| sRGB Coverage (%) | 96.4 | 96.7 0% | 99.9 4% | 99.7 3% | 100 4% | 100 4% |
| AdobeRGB 1998 Coverage (%) | 68.6 | 68.9 0% | 84.9 24% | 71.2 4% | 96.4 41% | 89.7 31% |
| Response Times | -2% | 47% | 21% | 82% | 13% | |
| Response Time Grey 50% / Grey 80% * (ms) | 12.6 ? | 14.5 ? -15% | 5.1 ? 60% | 12.3 ? 2% | 2 ? 84% | 6.6 ? 48% |
| Response Time Black / White * (ms) | 9.8 ? | 8.6 ? 12% | 6.6 ? 33% | 5.9 ? 40% | 1.98 ? 80% | 12 ? -22% |
| PWM Frequency (Hz) | 60 | |||||
| Screen | 9% | 16% | 33% | 142% | 8% | |
| Brightness middle (cd/m²) | 338.6 | 372 10% | 470 39% | 511 51% | 389.97 15% | 456.8 35% |
| Brightness (cd/m²) | 328 | 349 6% | 459 40% | 469 43% | 395 20% | 437 33% |
| Brightness Distribution (%) | 89 | 88 -1% | 93 4% | 86 -3% | 97 9% | 83 -7% |
| Black Level * (cd/m²) | 0.32 | 0.32 -0% | 0.42 -31% | 0.4 -25% | 0.03 91% | 0.35 -9% |
| Contrast (:1) | 1058 | 1163 10% | 1119 6% | 1278 21% | 12999 1129% | 1305 23% |
| Colorchecker dE 2000 * | 2.18 | 2.06 6% | 1.86 15% | 0.95 56% | 2 8% | 3.7 -70% |
| Colorchecker dE 2000 max. * | 7.14 | 3 58% | 3.87 46% | 2.07 71% | 4.1 43% | 6.42 10% |
| Colorchecker dE 2000 calibrated * | 0.93 | 1.5 -61% | 0.93 -0% | 0.91 2% | 1.68 -81% | 0.66 29% |
| Greyscale dE 2000 * | 3.7 | 1.9 49% | 2.7 27% | 0.6 84% | 2.23 40% | 2.6 30% |
| Gamma | 2.18 101% | 2.312 95% | 2.246 98% | 2.176 101% | 2.41 91% | 2.3 96% |
| CCT | 7245 90% | 6747 96% | 6711 97% | 6545 99% | 6323 103% | 6108 106% |
| Totalt genomsnitt (program/inställningar) | 2% /
5% | 29% /
22% | 19% /
25% | 85% /
109% | 16% /
13% |
* ... mindre är bättre
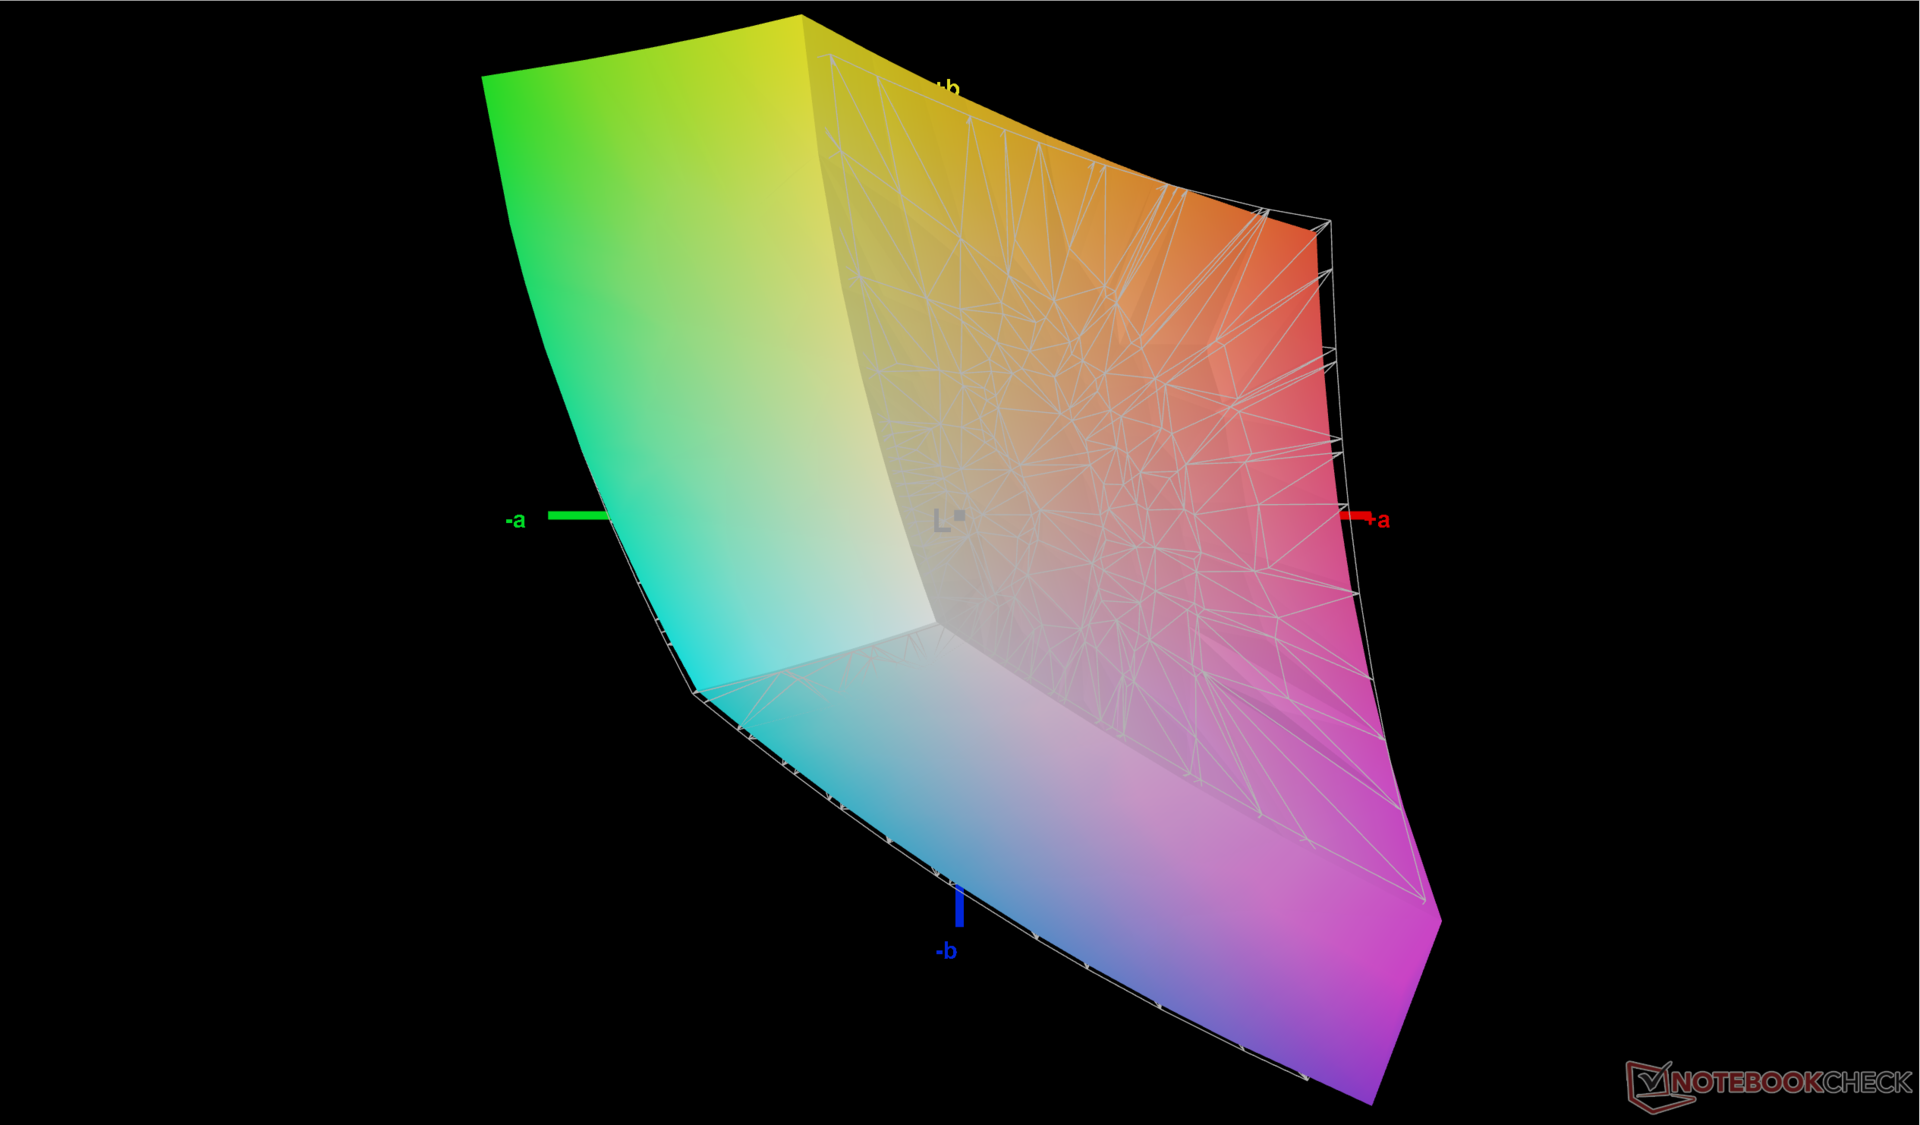
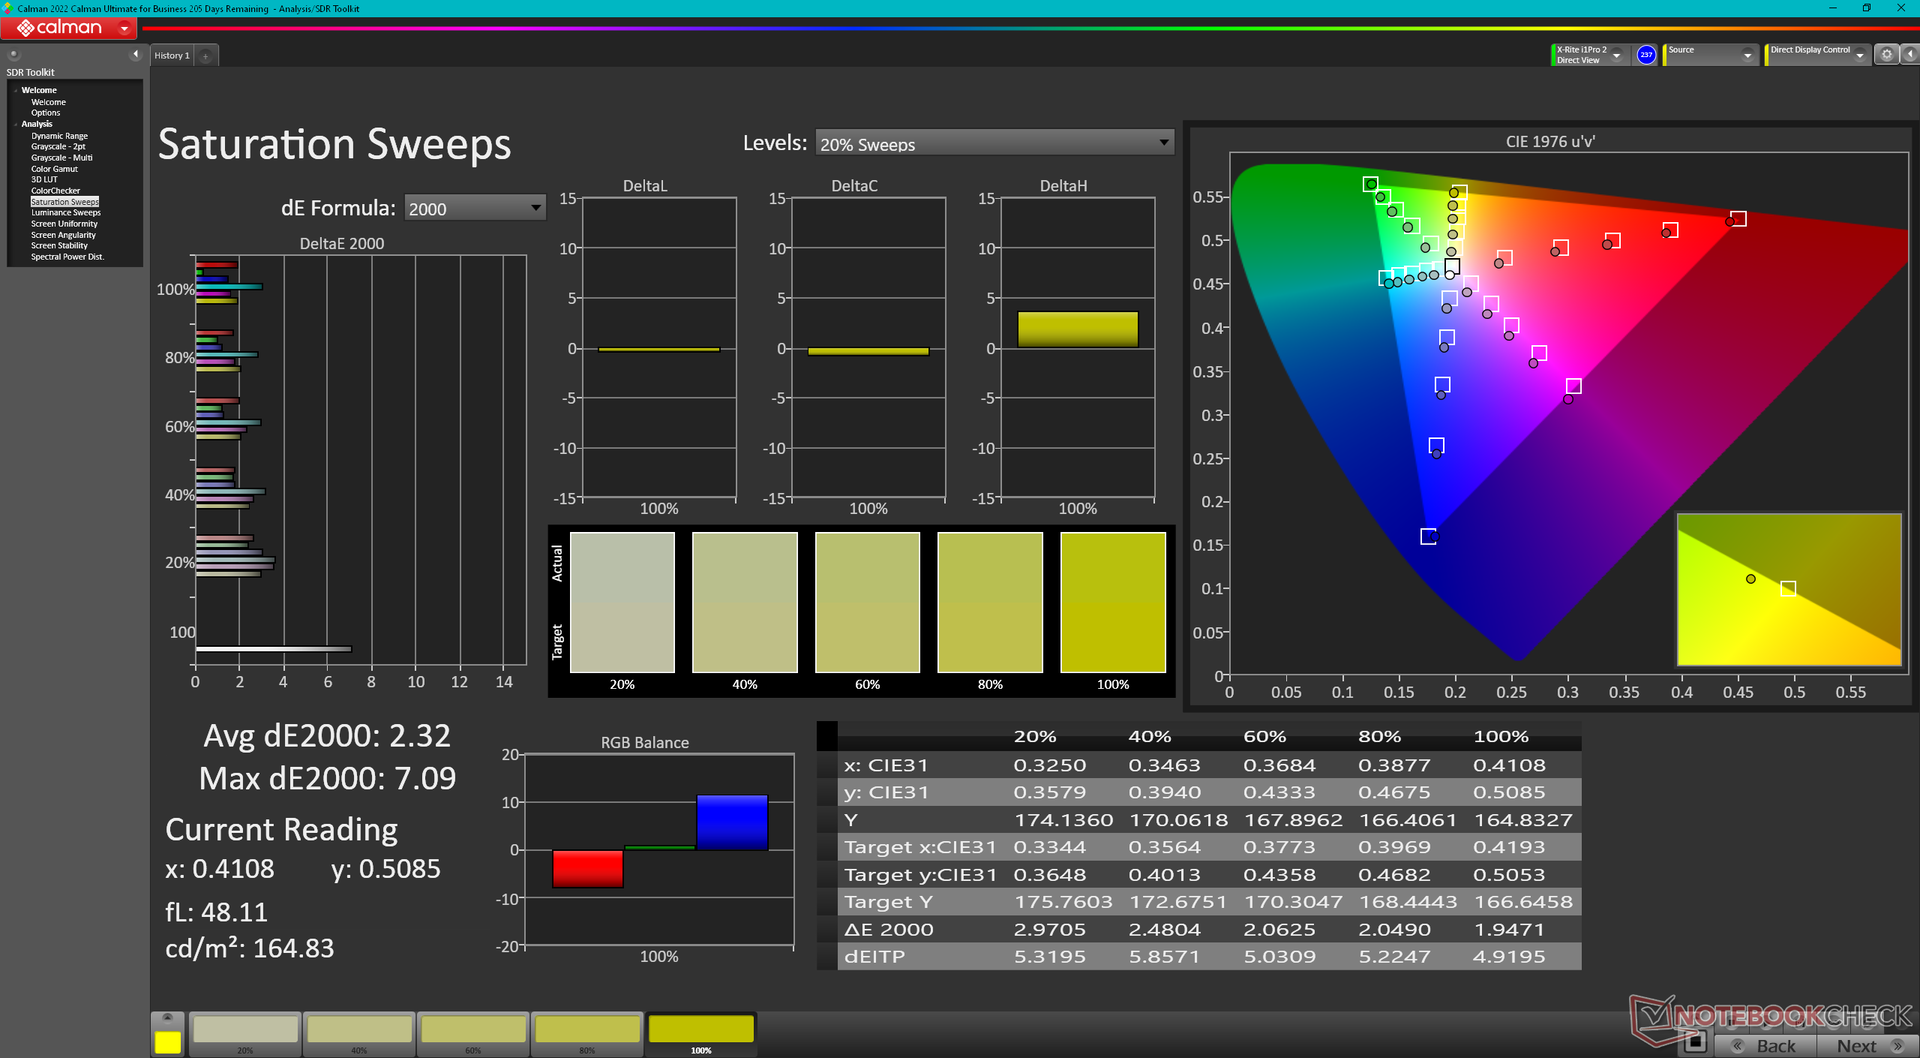
Skärmen är hyfsat kalibrerad direkt från förpackningen med genomsnittliga deltaE-värden för gråskala och färg på 3,7 respektive 2,18. Färgtemperaturen är dock något på den svala sidan, vilket vår egen X-Rite-kalibrering åtgärdar. Användare kan tillämpa vår kalibrerade ICM-profil ovan för att få ut mer exakta färger ur Uniwill.
Visa svarstider
| ↔ Svarstid svart till vitt | ||
|---|---|---|
| 9.8 ms ... stiga ↗ och falla ↘ kombinerat | ↗ 5.1 ms stiga | 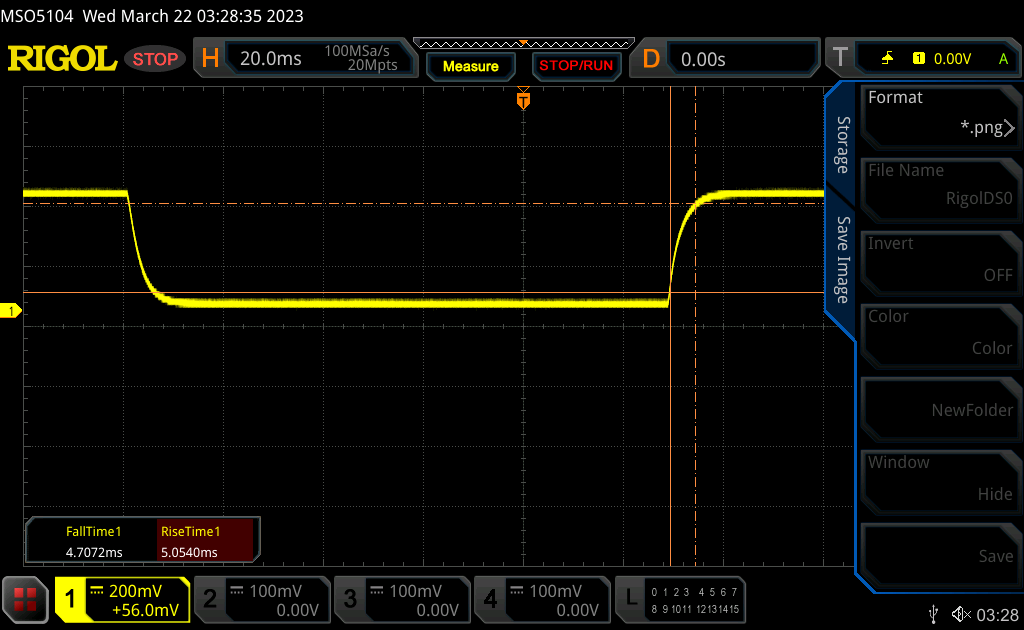 |
| ↘ 4.7 ms hösten | ||
| Skärmen visar snabba svarsfrekvenser i våra tester och bör passa för spel. I jämförelse sträcker sig alla testade enheter från 0.1 (minst) till 240 (maximalt) ms. » 27 % av alla enheter är bättre. Det betyder att den uppmätta svarstiden är bättre än genomsnittet av alla testade enheter (19.8 ms). | ||
| ↔ Svarstid 50 % grått till 80 % grått | ||
| 12.6 ms ... stiga ↗ och falla ↘ kombinerat | ↗ 6.3 ms stiga | 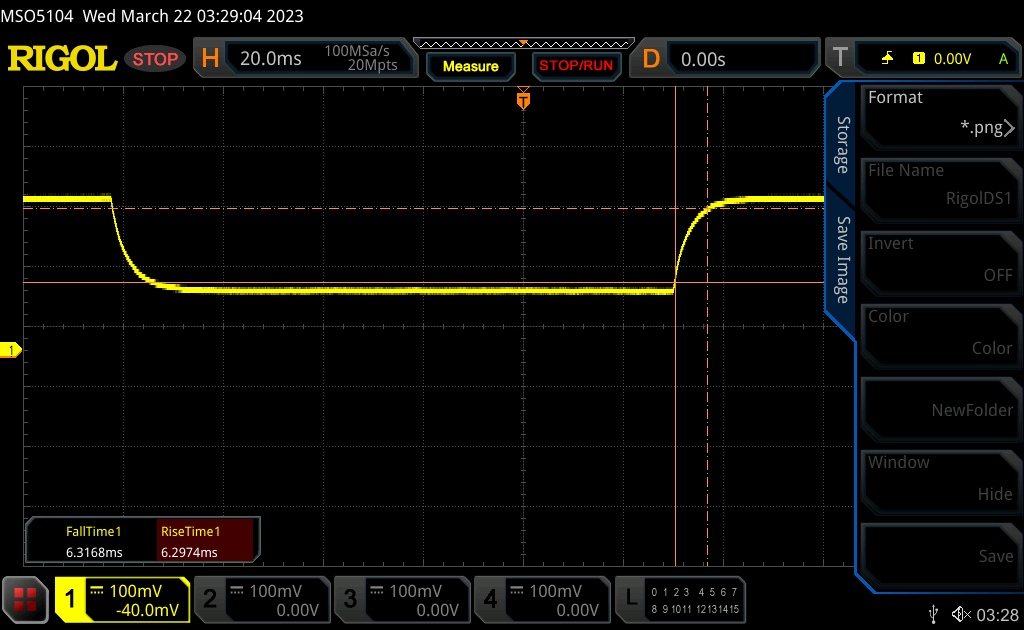 |
| ↘ 6.3 ms hösten | ||
| Skärmen visar bra svarsfrekvens i våra tester, men kan vara för långsam för konkurrenskraftiga spelare. I jämförelse sträcker sig alla testade enheter från 0.165 (minst) till 636 (maximalt) ms. » 26 % av alla enheter är bättre. Det betyder att den uppmätta svarstiden är bättre än genomsnittet av alla testade enheter (30.9 ms). | ||
Skärmflimmer / PWM (Puls-Width Modulation)
| Skärmflimmer / PWM upptäcktes inte | 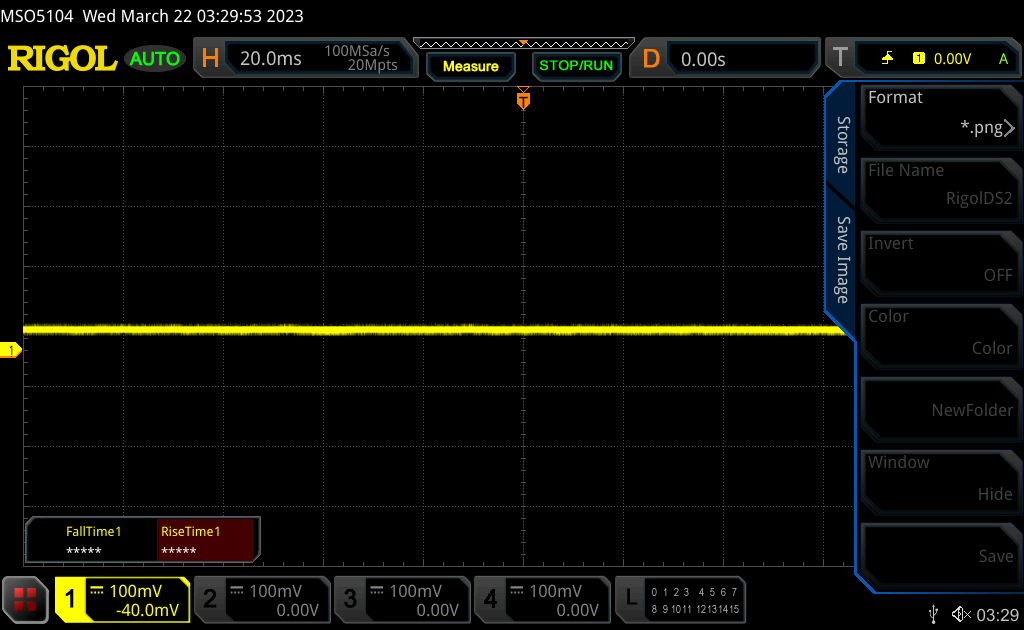 | ||
Som jämförelse: 52 % av alla testade enheter använder inte PWM för att dämpa skärmen. Om PWM upptäcktes mättes ett medelvärde av 7741 (minst: 5 - maximum: 343500) Hz. | |||
Prestanda
Provningsförhållanden
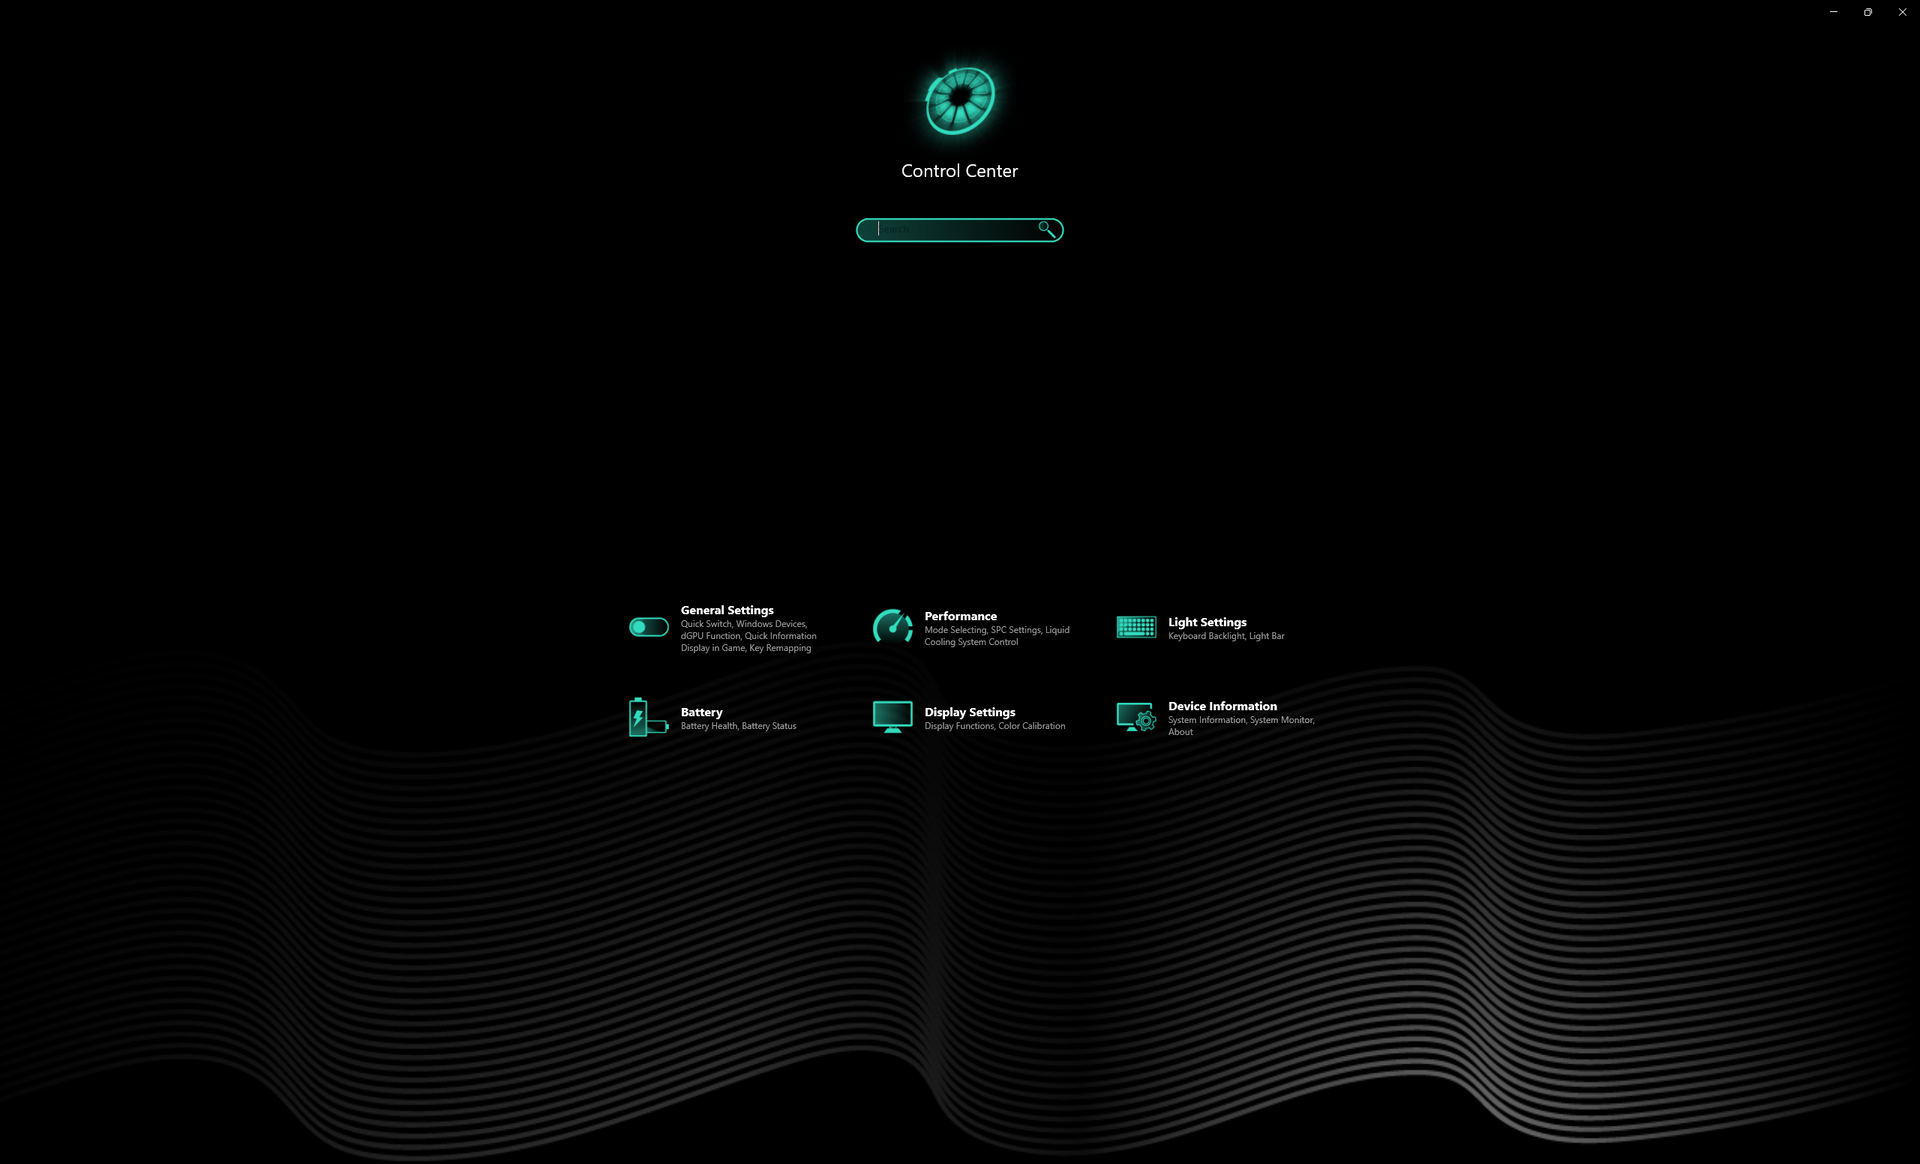
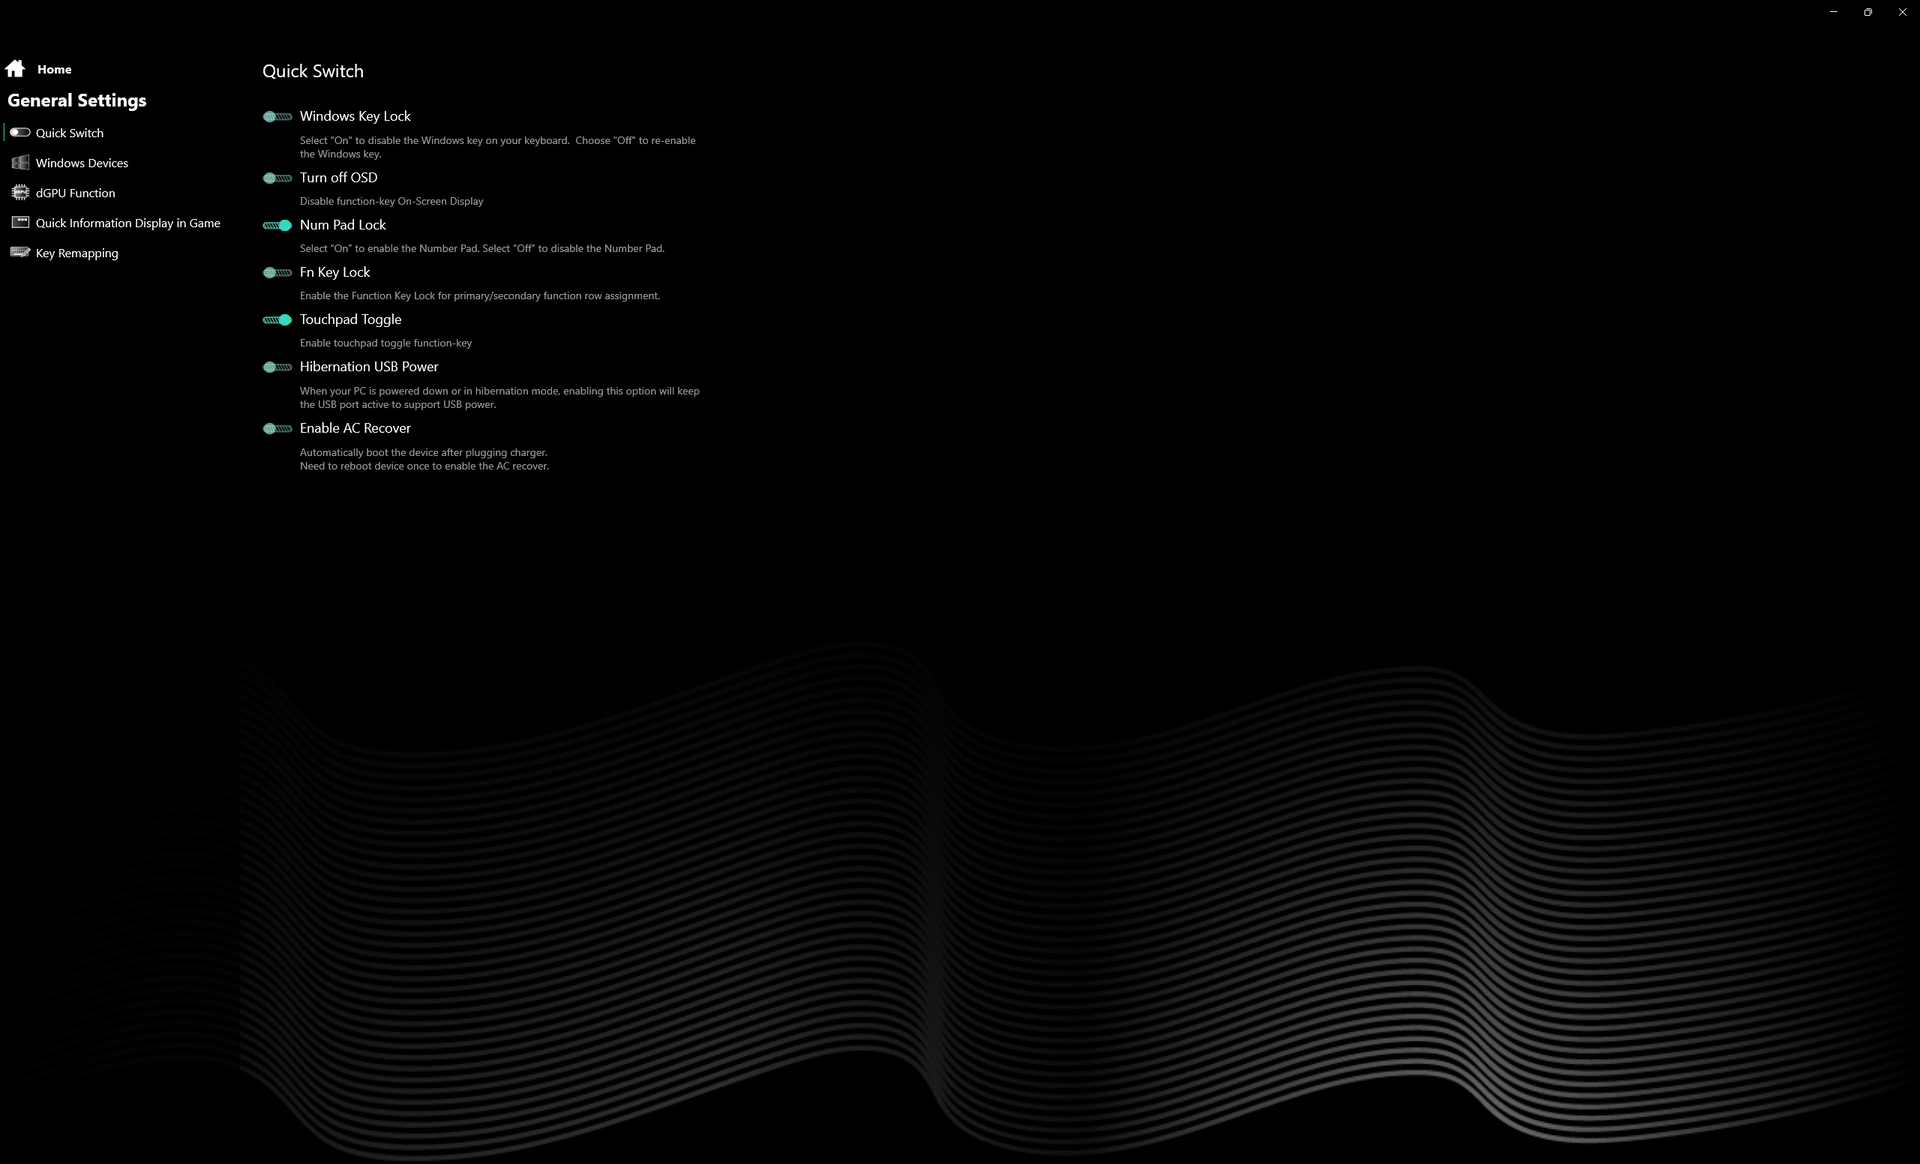
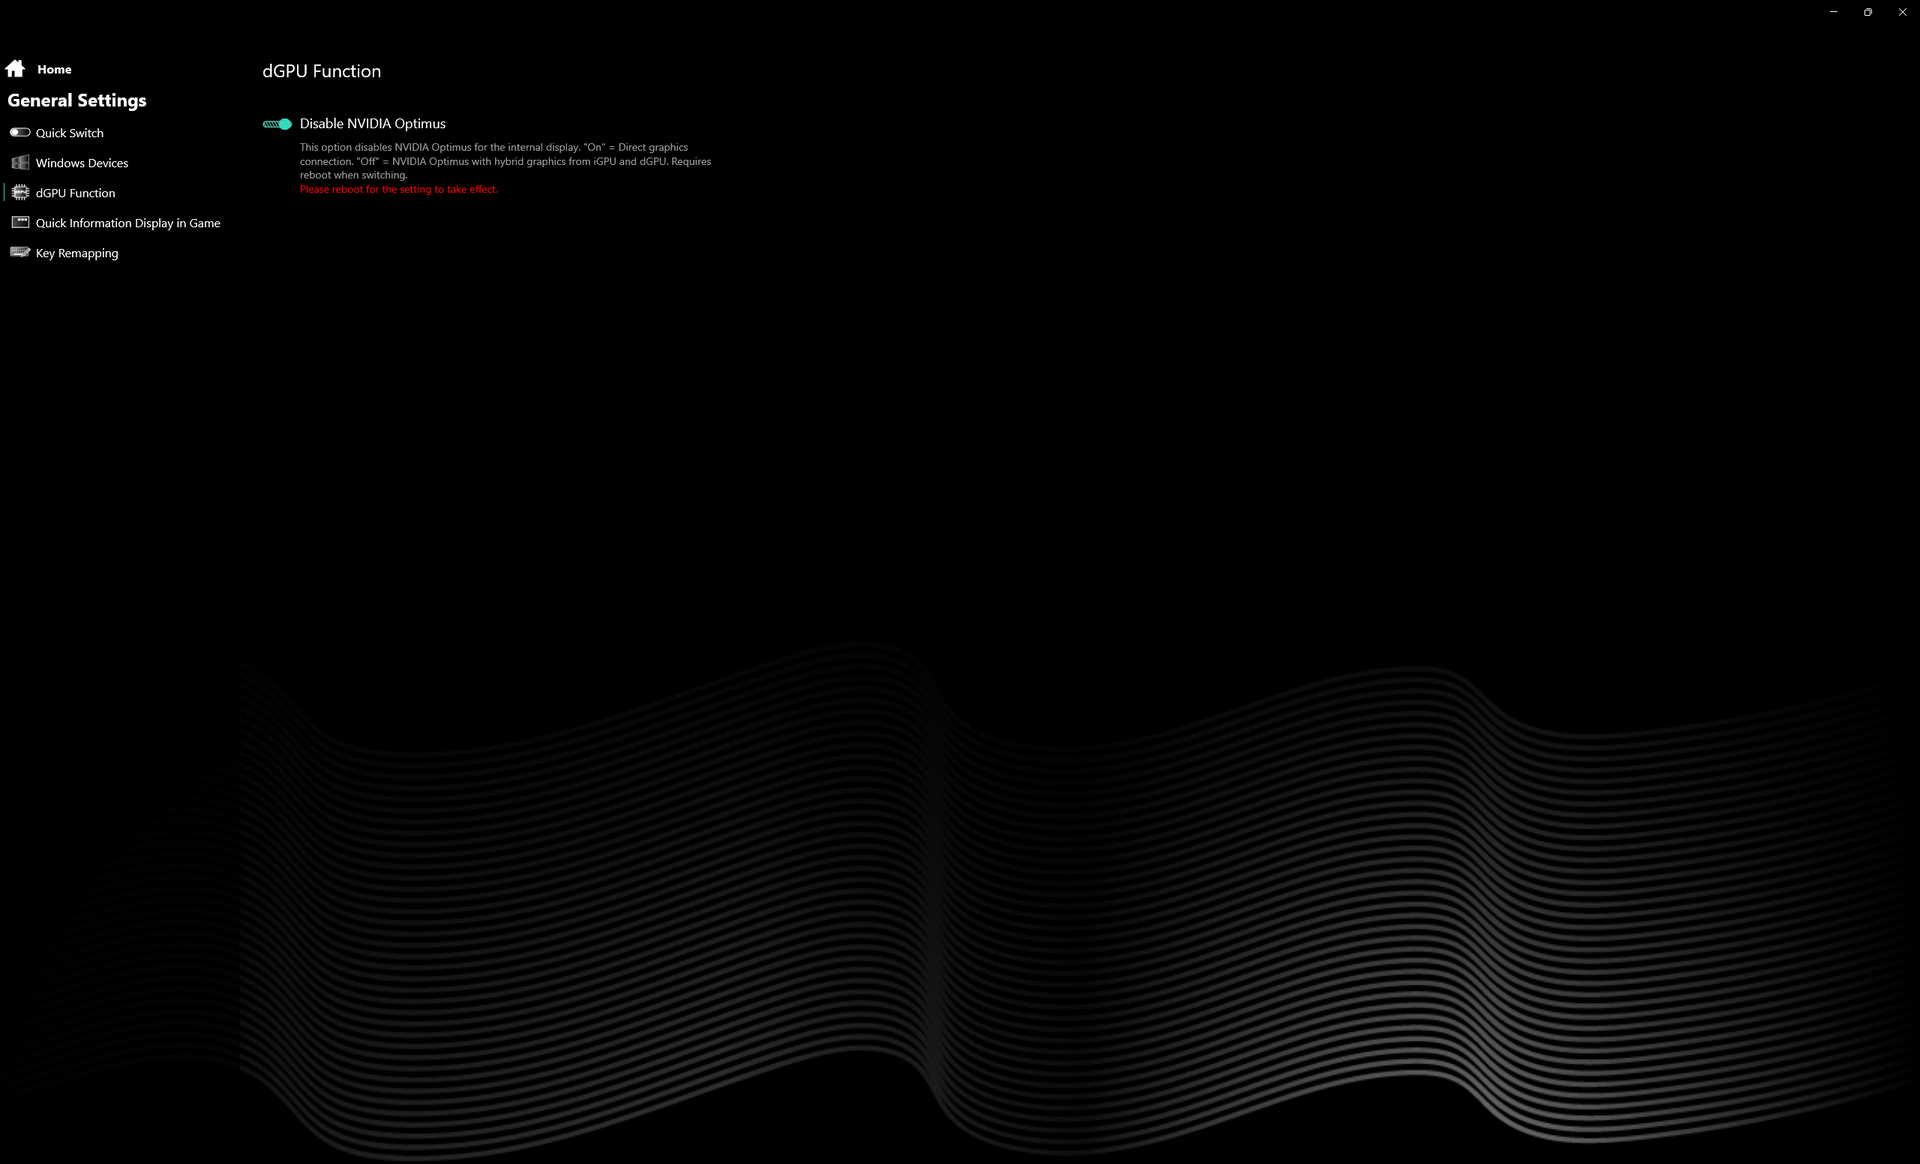
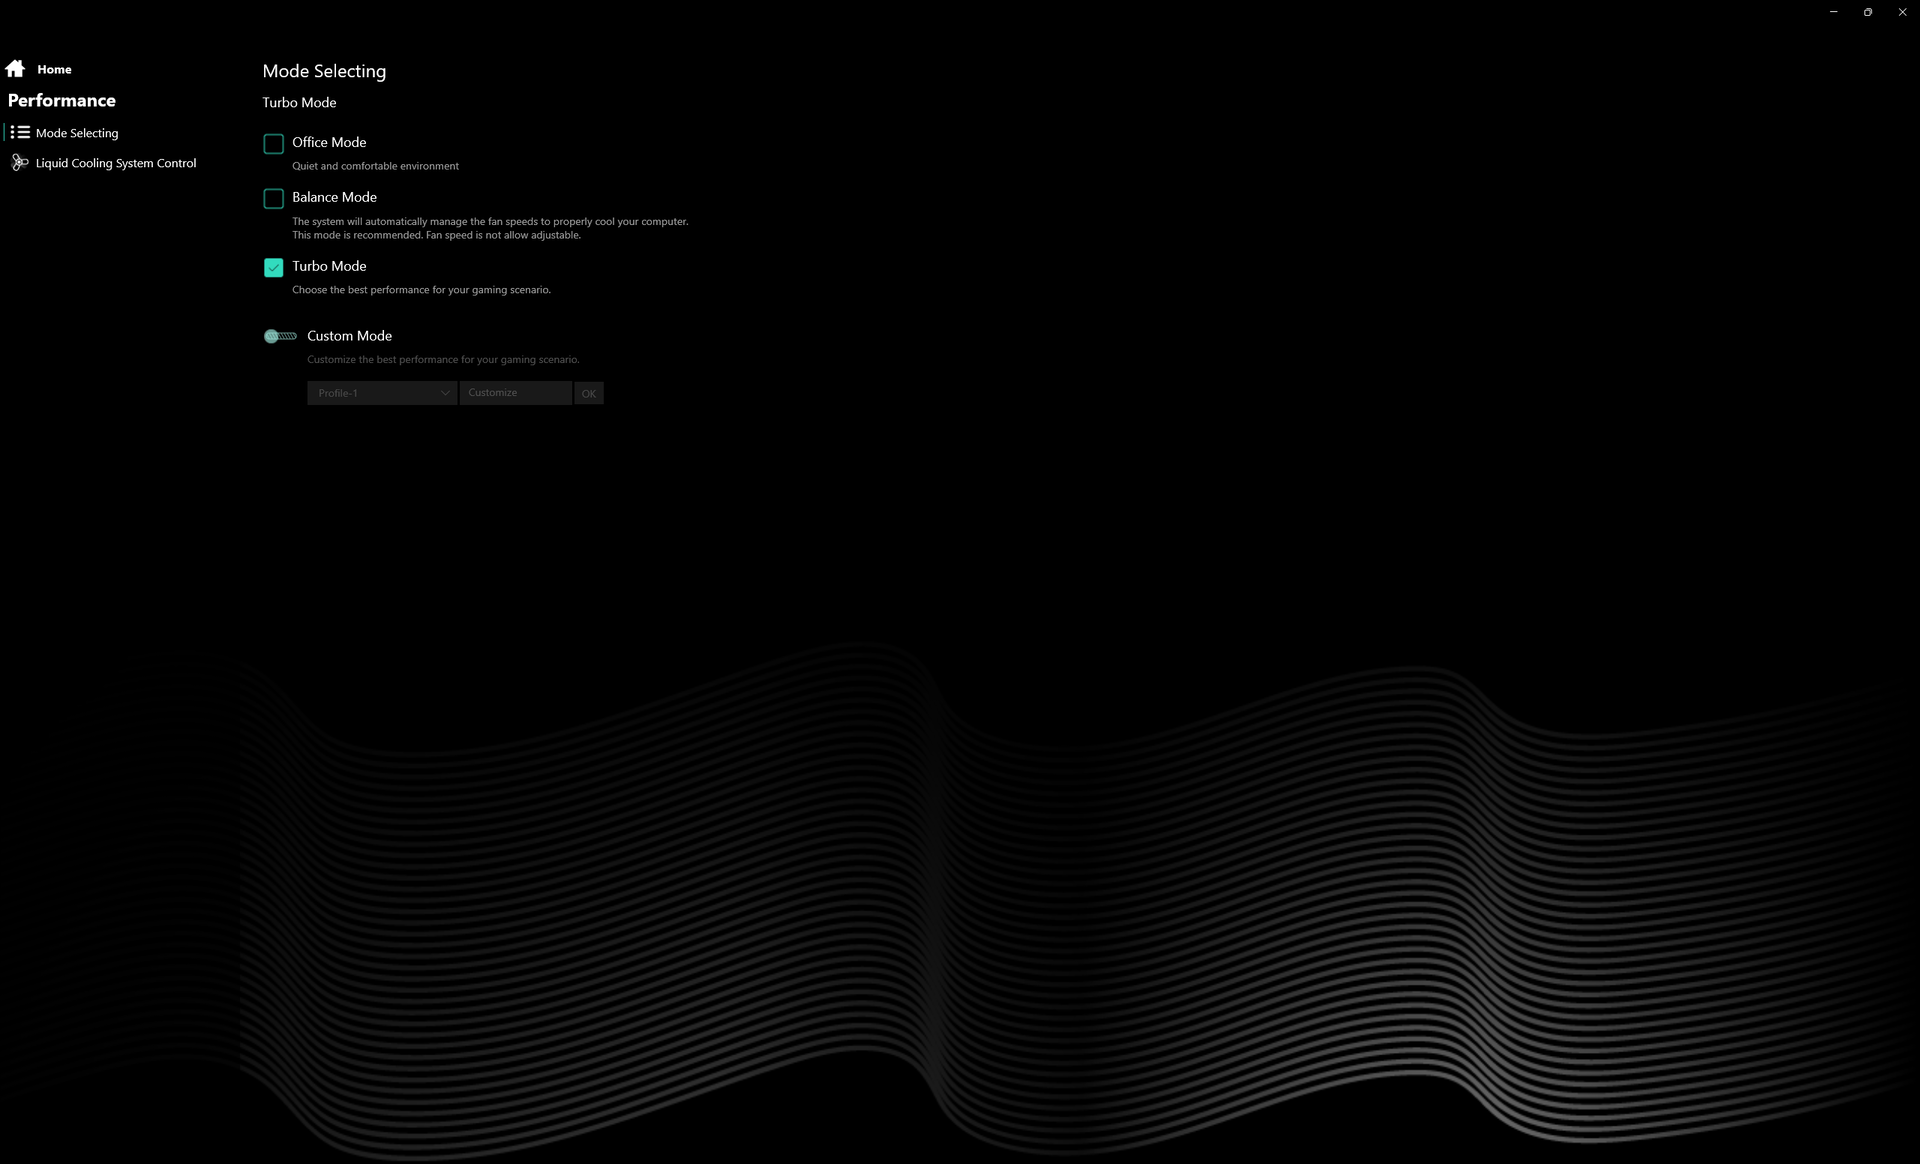
Vi ställde in vår enhet i turboläge via den förinstallerade Control Center-mjukvaran med Optimus avstängd innan vi körde några av nedanstående benchmarks. Systemet har inte stöd för Advanced Optimus, vilket innebär att det krävs en omstart när man växlar mellan den diskreta GPU:n och Optimus. Användare uppmuntras att bekanta sig med den förinstallerade Control Center-programvaran eftersom den är navet för att justera prestandaprofiler, Optimus med mera.
G-Sync stöds inte på den interna skärmen.
Processor
Vi kan äntligen se hur den övre mellanklassen av Core i7-13700HX-processorer fungerar efter att ha testat flera bärbara datorer för entusiastspel med 13:e generationens Core i9-processorer. Benchmarks visar att den är ungefär 25 procent snabbare än den tidigare generationen 12th gen Core i7-12700H som vanligen återfinns i de flesta bärbara speldatorer i mellanklass till högre prisklass från 2022. Uppgradering till Core i9-13900HX konfiguration förväntas öka prestandan ganska markant med 35 procent.
Den totala prestandan ligger långt före alla mobila Zen 3+ CPU:er medan den senaste Zen 4 Ryzen 9 7945HX fortfarande är den snabbare processorn med 20 till 50 procent. Prestandastabiliteten är utmärkt utan några större klockfrekvensfluktuationer vid stress.
Mer teknisk information och jämförelser av riktmärken om Core i7-13700HX finns på vår dedikerade sida här.
Cinebench R15 Multi Loop
Cinebench R23: Multi Core | Single Core
Cinebench R20: CPU (Multi Core) | CPU (Single Core)
Cinebench R15: CPU Multi 64Bit | CPU Single 64Bit
Blender: v2.79 BMW27 CPU
7-Zip 18.03: 7z b 4 | 7z b 4 -mmt1
Geekbench 5.5: Multi-Core | Single-Core
HWBOT x265 Benchmark v2.2: 4k Preset
LibreOffice : 20 Documents To PDF
R Benchmark 2.5: Overall mean
* ... mindre är bättre
AIDA64: FP32 Ray-Trace | FPU Julia | CPU SHA3 | CPU Queen | FPU SinJulia | FPU Mandel | CPU AES | CPU ZLib | FP64 Ray-Trace | CPU PhotoWorxx
| Performance rating | |
| Lenovo Legion Pro 7 16IRX8H | |
| Asus ROG Strix G16 G614JZ | |
| Schenker XMG Neo 16 E23 | |
| Razer Blade 16 Early 2023 | |
| Uniwill GM6PX7X RTX 4070 | |
| Gigabyte AERO 16 OLED BSF | |
| Genomsnitt Intel Core i7-13700HX | |
| AIDA64 / FP32 Ray-Trace | |
| Asus ROG Strix G16 G614JZ | |
| Lenovo Legion Pro 7 16IRX8H | |
| Razer Blade 16 Early 2023 | |
| Razer Blade 16 Early 2023 | |
| Razer Blade 16 Early 2023 | |
| Schenker XMG Neo 16 E23 | |
| Uniwill GM6PX7X RTX 4070 | |
| Genomsnitt Intel Core i7-13700HX (14261 - 21999, n=11) | |
| Gigabyte AERO 16 OLED BSF | |
| AIDA64 / CPU Queen | |
| Asus ROG Strix G16 G614JZ | |
| Schenker XMG Neo 16 E23 | |
| Razer Blade 16 Early 2023 | |
| Razer Blade 16 Early 2023 | |
| Lenovo Legion Pro 7 16IRX8H | |
| Uniwill GM6PX7X RTX 4070 | |
| Genomsnitt Intel Core i7-13700HX (86532 - 114717, n=11) | |
| Gigabyte AERO 16 OLED BSF | |
| AIDA64 / FPU SinJulia | |
| Asus ROG Strix G16 G614JZ | |
| Razer Blade 16 Early 2023 | |
| Razer Blade 16 Early 2023 | |
| Razer Blade 16 Early 2023 | |
| Lenovo Legion Pro 7 16IRX8H | |
| Schenker XMG Neo 16 E23 | |
| Uniwill GM6PX7X RTX 4070 | |
| Genomsnitt Intel Core i7-13700HX (9290 - 13519, n=11) | |
| Gigabyte AERO 16 OLED BSF | |
| AIDA64 / FPU Mandel | |
| Lenovo Legion Pro 7 16IRX8H | |
| Asus ROG Strix G16 G614JZ | |
| Razer Blade 16 Early 2023 | |
| Razer Blade 16 Early 2023 | |
| Razer Blade 16 Early 2023 | |
| Schenker XMG Neo 16 E23 | |
| Uniwill GM6PX7X RTX 4070 | |
| Genomsnitt Intel Core i7-13700HX (35751 - 53484, n=11) | |
| Gigabyte AERO 16 OLED BSF | |
| AIDA64 / FP64 Ray-Trace | |
| Lenovo Legion Pro 7 16IRX8H | |
| Asus ROG Strix G16 G614JZ | |
| Razer Blade 16 Early 2023 | |
| Razer Blade 16 Early 2023 | |
| Razer Blade 16 Early 2023 | |
| Schenker XMG Neo 16 E23 | |
| Uniwill GM6PX7X RTX 4070 | |
| Genomsnitt Intel Core i7-13700HX (7728 - 11837, n=11) | |
| Gigabyte AERO 16 OLED BSF | |
| AIDA64 / CPU PhotoWorxx | |
| Razer Blade 16 Early 2023 | |
| Razer Blade 16 Early 2023 | |
| Razer Blade 16 Early 2023 | |
| Schenker XMG Neo 16 E23 | |
| Lenovo Legion Pro 7 16IRX8H | |
| Gigabyte AERO 16 OLED BSF | |
| Uniwill GM6PX7X RTX 4070 | |
| Asus ROG Strix G16 G614JZ | |
| Genomsnitt Intel Core i7-13700HX (19678 - 42415, n=11) | |
Systemets prestanda
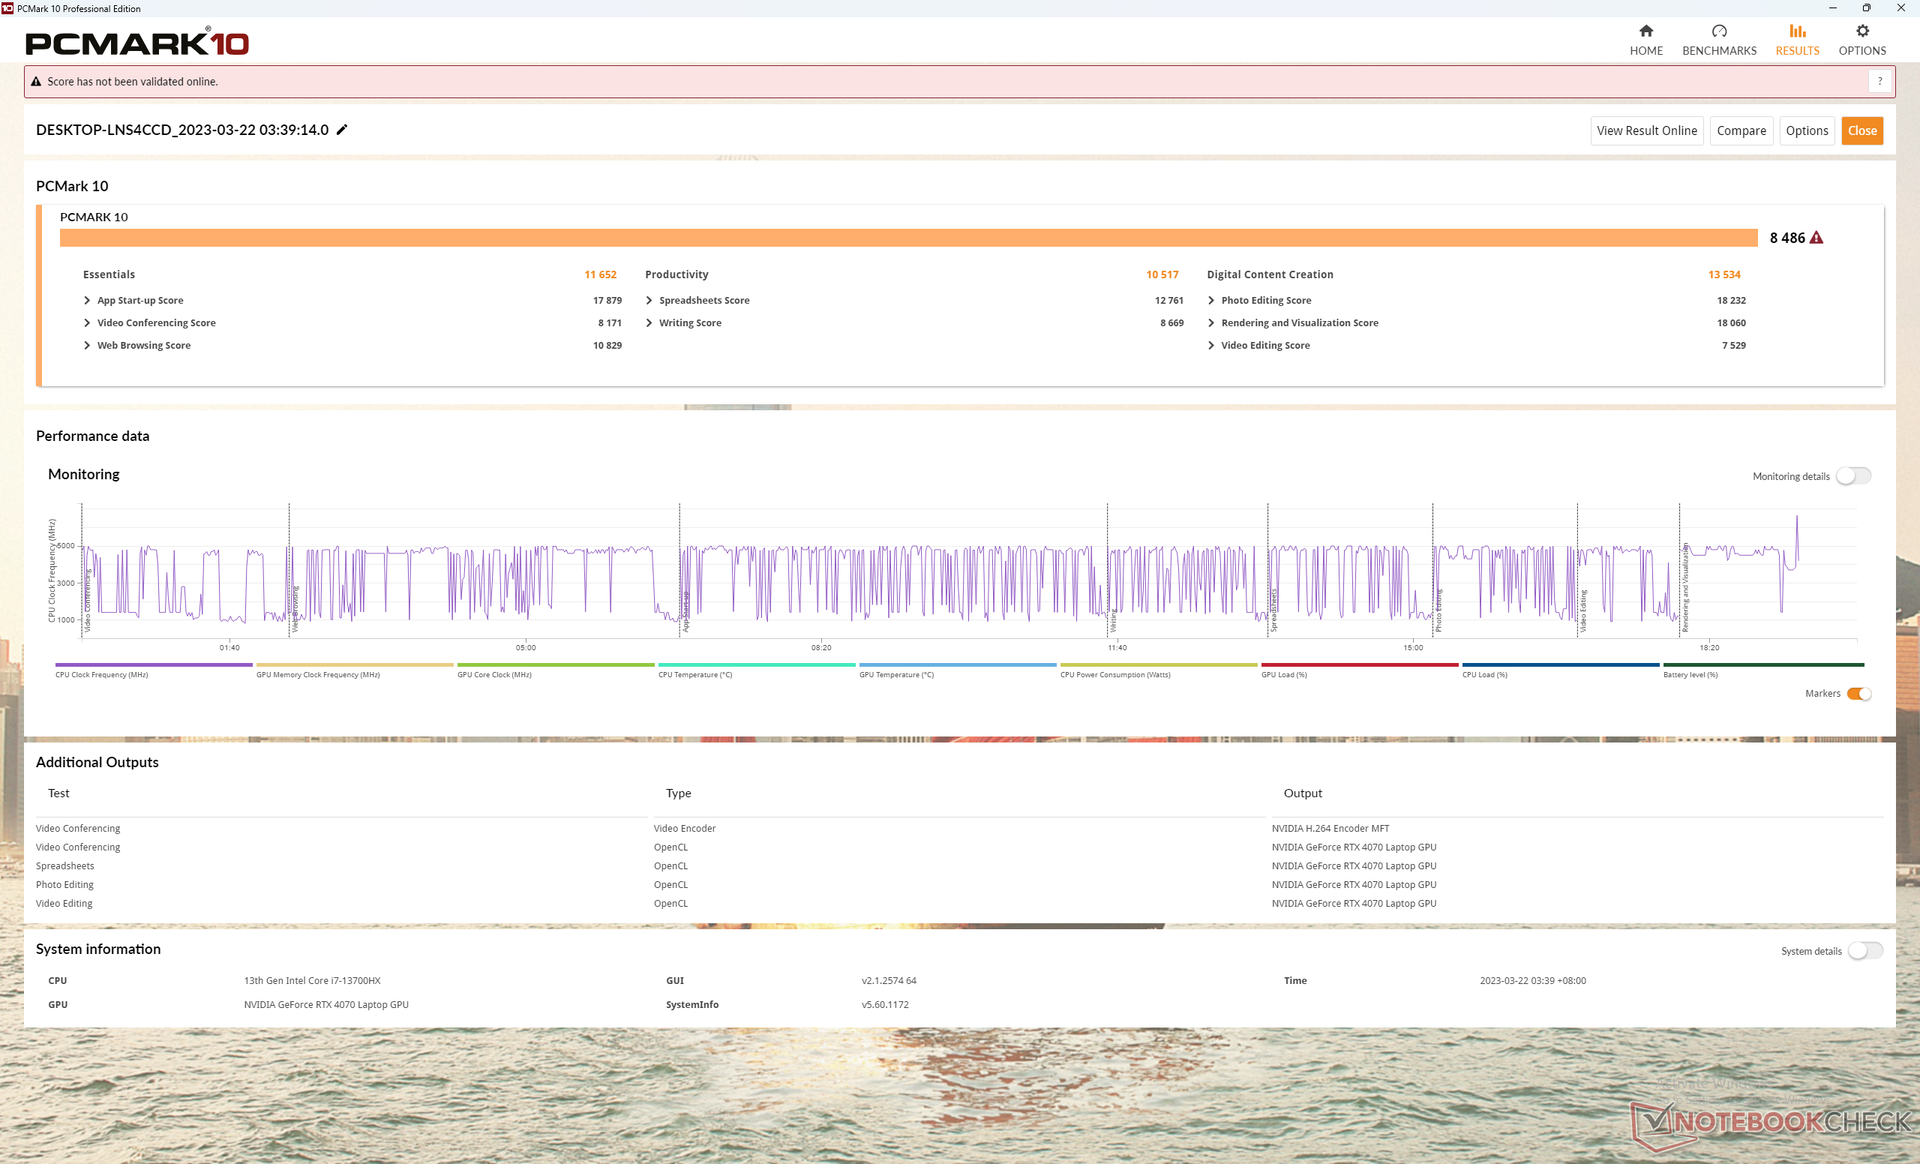
PCMark-resultaten är jämförbara med andra bärbara datorer för avancerade spel som körs med 13:e generationens Core CPU:er och GeForce 40 GPU:er som Gigabyte AERO 16 eller Razer Blade 16. Resultaten ligger konsekvent före Schenker XMG Neo 15 som körs på äldre Zen 3+ och GeForce 30-hårdvara.
CrossMark: Overall | Productivity | Creativity | Responsiveness
| PCMark 10 / Score | |
| Uniwill GM6PX7X RTX 4070 | |
| Schenker XMG Neo 16 E23 | |
| Gigabyte AERO 16 OLED BSF | |
| Razer Blade 16 Early 2023 | |
| Lenovo Legion Pro 7 16IRX8H | |
| Asus ROG Strix G16 G614JZ | |
| PCMark 10 / Essentials | |
| Asus ROG Strix G16 G614JZ | |
| Lenovo Legion Pro 7 16IRX8H | |
| Uniwill GM6PX7X RTX 4070 | |
| Gigabyte AERO 16 OLED BSF | |
| Razer Blade 16 Early 2023 | |
| Schenker XMG Neo 16 E23 | |
| PCMark 10 / Productivity | |
| Lenovo Legion Pro 7 16IRX8H | |
| Uniwill GM6PX7X RTX 4070 | |
| Schenker XMG Neo 16 E23 | |
| Gigabyte AERO 16 OLED BSF | |
| Razer Blade 16 Early 2023 | |
| Asus ROG Strix G16 G614JZ | |
| PCMark 10 / Digital Content Creation | |
| Schenker XMG Neo 16 E23 | |
| Razer Blade 16 Early 2023 | |
| Gigabyte AERO 16 OLED BSF | |
| Uniwill GM6PX7X RTX 4070 | |
| Asus ROG Strix G16 G614JZ | |
| Lenovo Legion Pro 7 16IRX8H | |
| CrossMark / Overall | |
| Asus ROG Strix G16 G614JZ | |
| Schenker XMG Neo 16 E23 | |
| Uniwill GM6PX7X RTX 4070 | |
| Gigabyte AERO 16 OLED BSF | |
| Razer Blade 16 Early 2023 | |
| CrossMark / Productivity | |
| Asus ROG Strix G16 G614JZ | |
| Schenker XMG Neo 16 E23 | |
| Uniwill GM6PX7X RTX 4070 | |
| Gigabyte AERO 16 OLED BSF | |
| Razer Blade 16 Early 2023 | |
| CrossMark / Creativity | |
| Schenker XMG Neo 16 E23 | |
| Asus ROG Strix G16 G614JZ | |
| Uniwill GM6PX7X RTX 4070 | |
| Gigabyte AERO 16 OLED BSF | |
| Razer Blade 16 Early 2023 | |
| CrossMark / Responsiveness | |
| Asus ROG Strix G16 G614JZ | |
| Gigabyte AERO 16 OLED BSF | |
| Uniwill GM6PX7X RTX 4070 | |
| Schenker XMG Neo 16 E23 | |
| Razer Blade 16 Early 2023 | |
| PCMark 10 Score | 8486 poäng | |
Hjälp | ||
| AIDA64 / Memory Copy | |
| Razer Blade 16 Early 2023 | |
| Razer Blade 16 Early 2023 | |
| Razer Blade 16 Early 2023 | |
| Lenovo Legion Pro 7 16IRX8H | |
| Schenker XMG Neo 16 E23 | |
| Gigabyte AERO 16 OLED BSF | |
| Uniwill GM6PX7X RTX 4070 | |
| Asus ROG Strix G16 G614JZ | |
| Genomsnitt Intel Core i7-13700HX (36125 - 63990, n=11) | |
| AIDA64 / Memory Read | |
| Razer Blade 16 Early 2023 | |
| Razer Blade 16 Early 2023 | |
| Razer Blade 16 Early 2023 | |
| Lenovo Legion Pro 7 16IRX8H | |
| Schenker XMG Neo 16 E23 | |
| Asus ROG Strix G16 G614JZ | |
| Uniwill GM6PX7X RTX 4070 | |
| Gigabyte AERO 16 OLED BSF | |
| Genomsnitt Intel Core i7-13700HX (36510 - 69729, n=11) | |
| AIDA64 / Memory Write | |
| Razer Blade 16 Early 2023 | |
| Razer Blade 16 Early 2023 | |
| Razer Blade 16 Early 2023 | |
| Schenker XMG Neo 16 E23 | |
| Lenovo Legion Pro 7 16IRX8H | |
| Gigabyte AERO 16 OLED BSF | |
| Uniwill GM6PX7X RTX 4070 | |
| Asus ROG Strix G16 G614JZ | |
| Genomsnitt Intel Core i7-13700HX (33598 - 85675, n=11) | |
| AIDA64 / Memory Latency | |
| Razer Blade 16 Early 2023 | |
| Razer Blade 16 Early 2023 | |
| Razer Blade 16 Early 2023 | |
| Gigabyte AERO 16 OLED BSF | |
| Asus ROG Strix G16 G614JZ | |
| Uniwill GM6PX7X RTX 4070 | |
| Genomsnitt Intel Core i7-13700HX (81.5 - 97.9, n=11) | |
| Schenker XMG Neo 16 E23 | |
| Lenovo Legion Pro 7 16IRX8H | |
* ... mindre är bättre
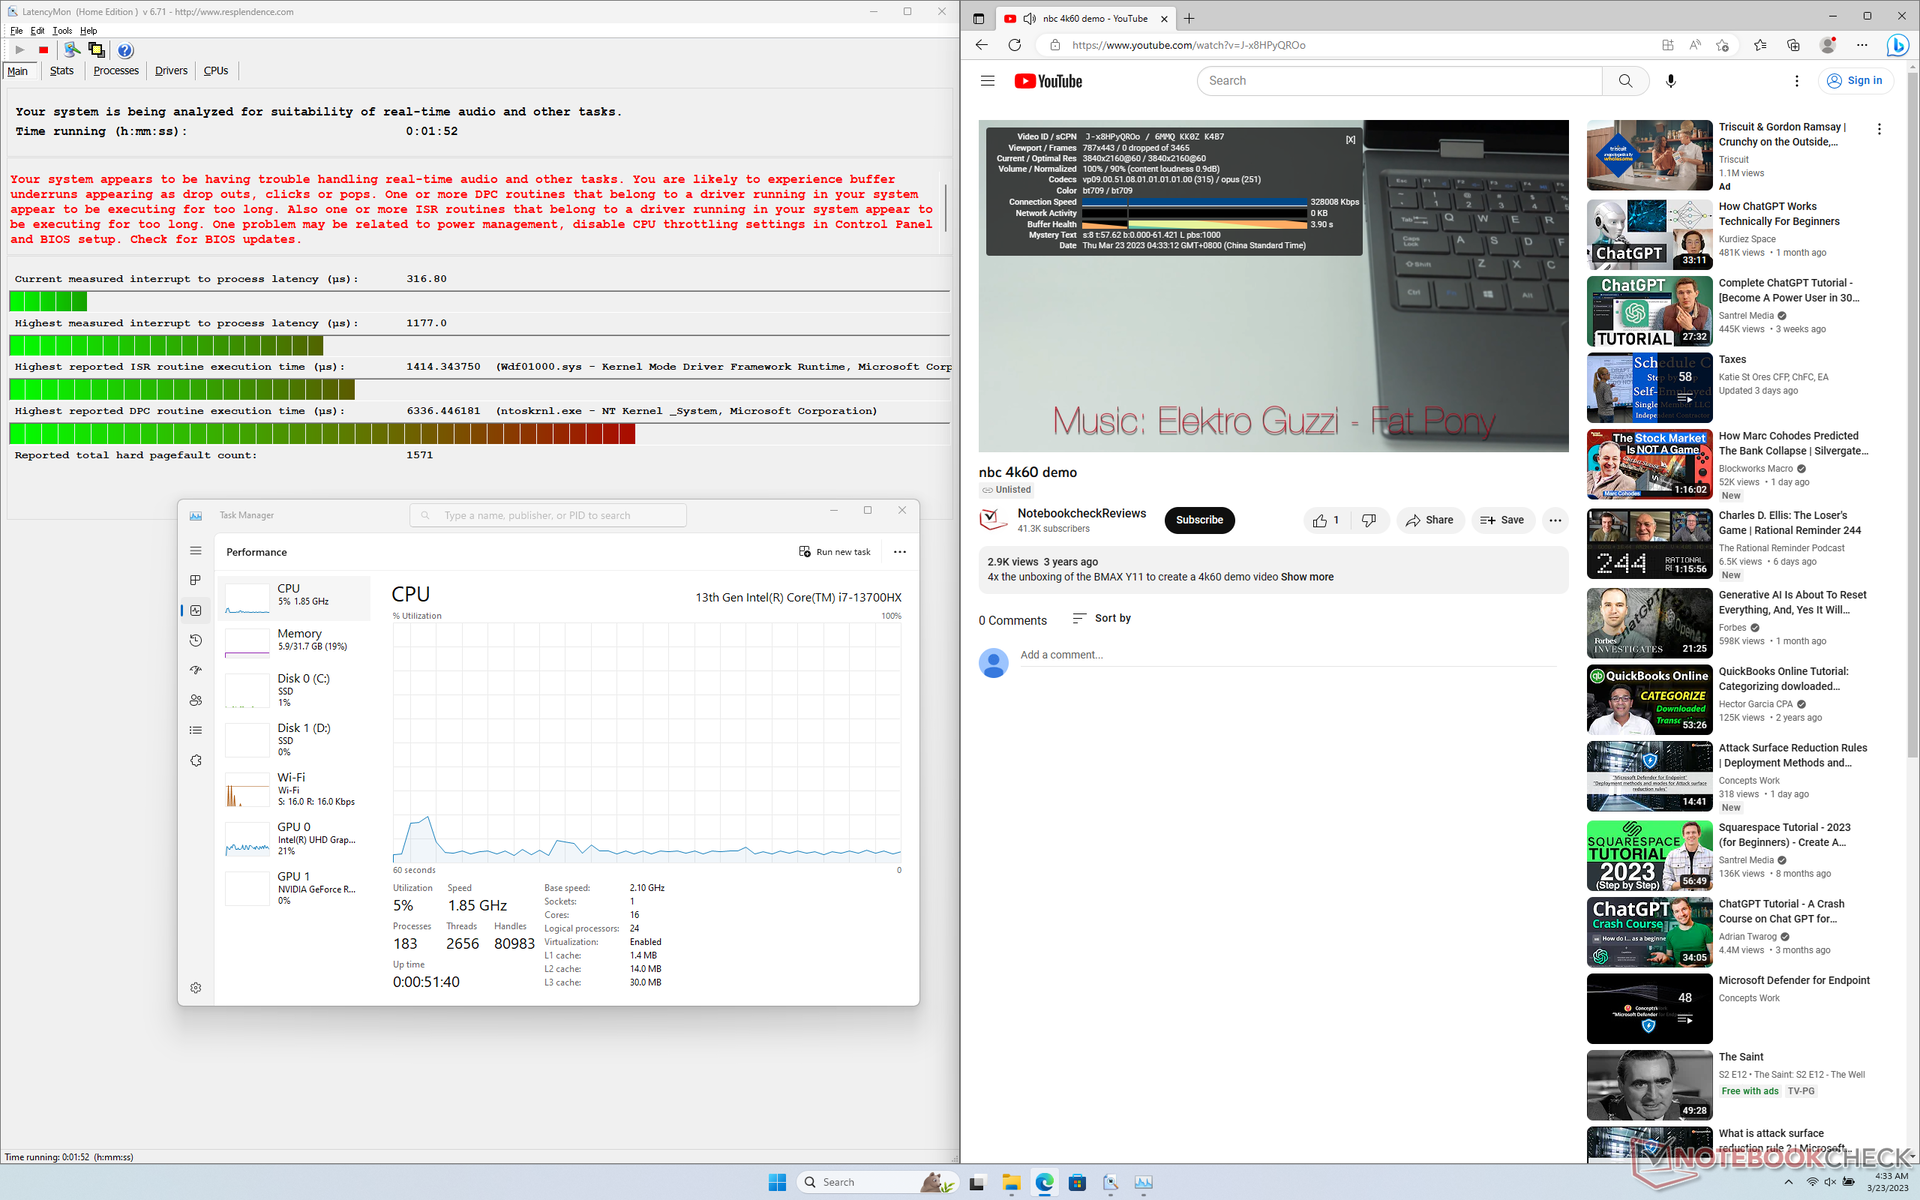
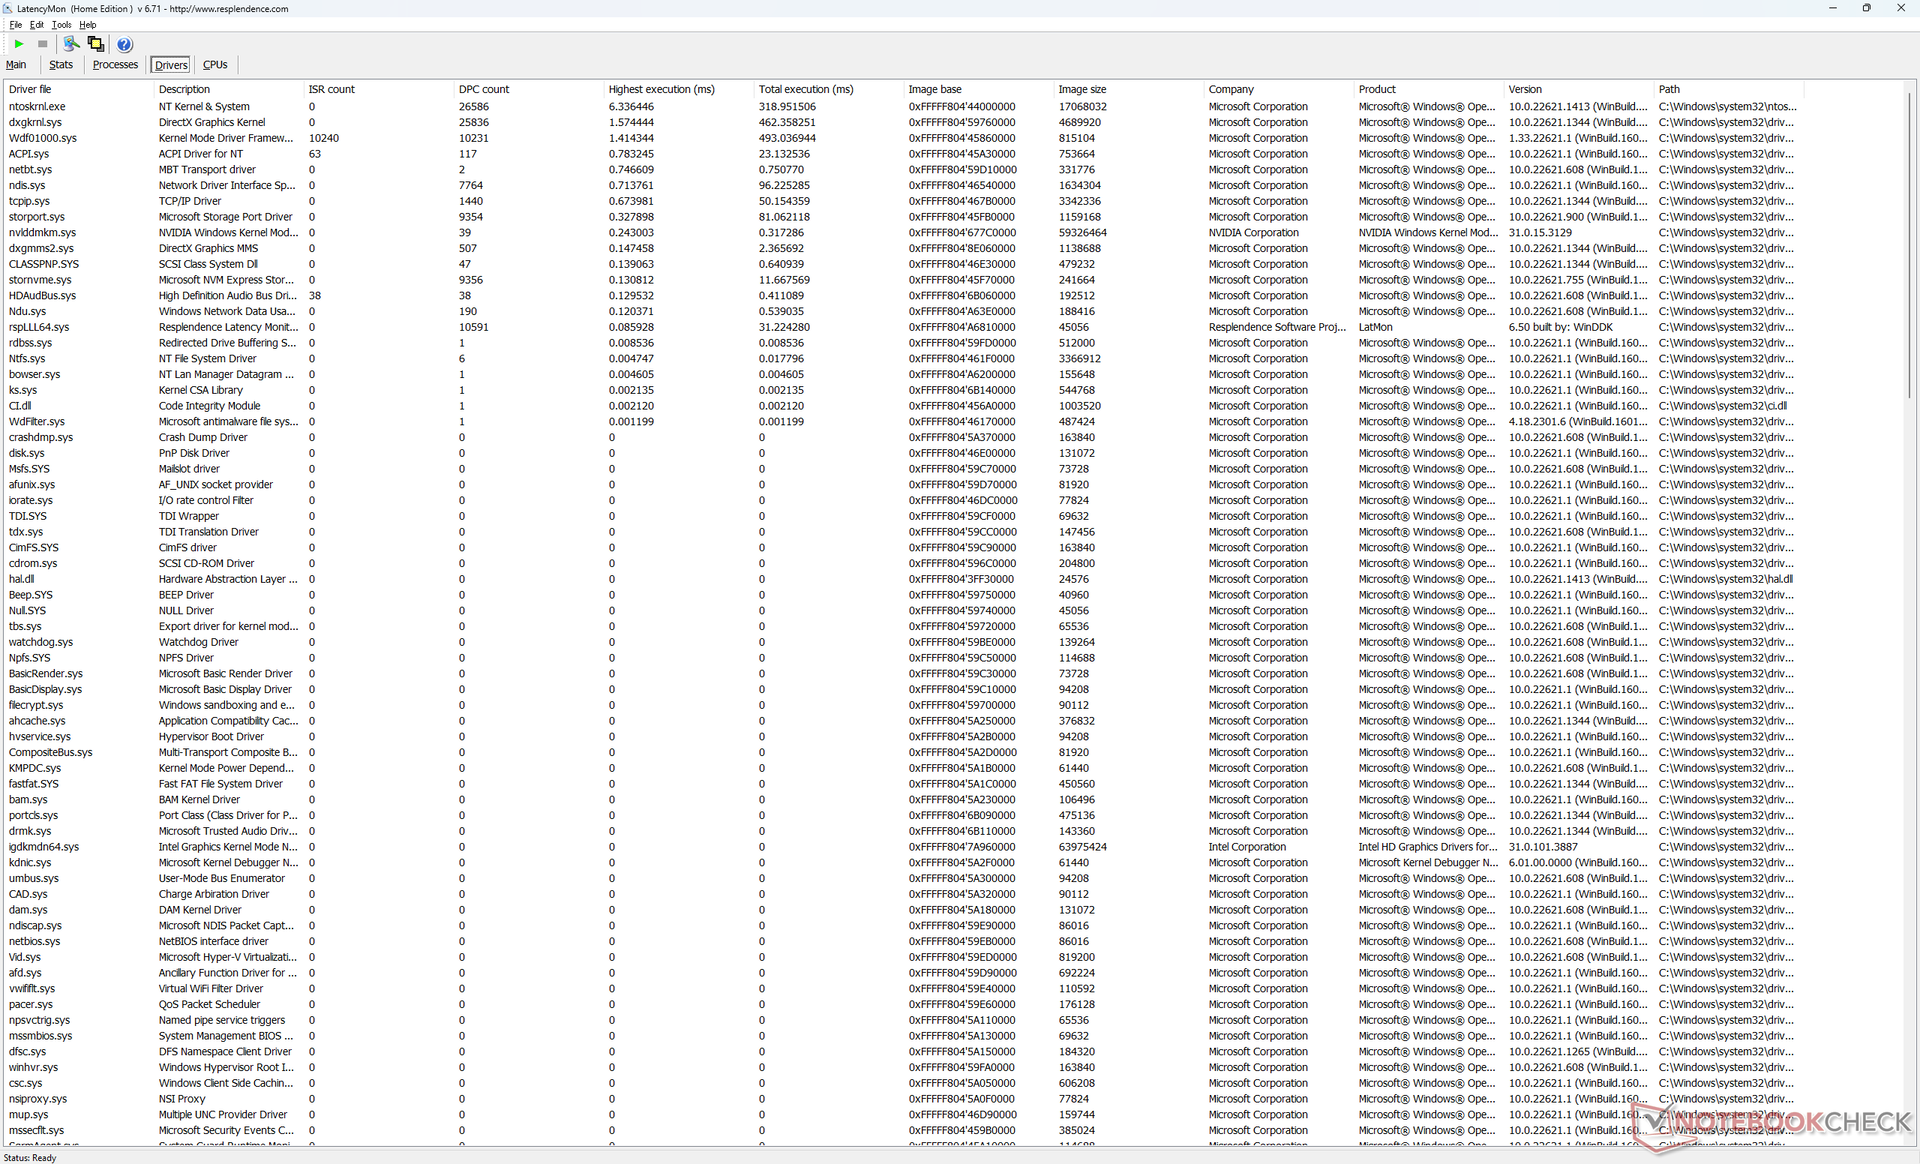
DPC-latenstid
LatencyMon avslöjar DPC-problem när man öppnar flera webbläsarflikar på vår hemsida. uppspelning av 4K-video vid 60 FPS är annars perfekt med lågt CPU- och GPU-utnyttjande och inga tappade bilder.
| DPC Latencies / LatencyMon - interrupt to process latency (max), Web, Youtube, Prime95 | |
| Schenker XMG Neo 16 E23 | |
| Asus ROG Strix G16 G614JZ | |
| Razer Blade 16 Early 2023 | |
| Uniwill GM6PX7X RTX 4070 | |
| Gigabyte AERO 16 OLED BSF | |
| Lenovo Legion Pro 7 16IRX8H | |
* ... mindre är bättre
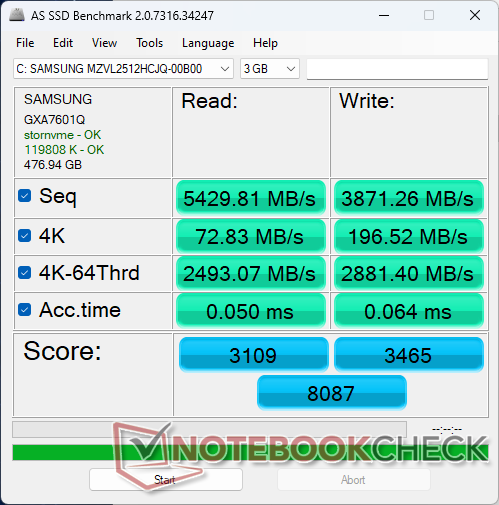
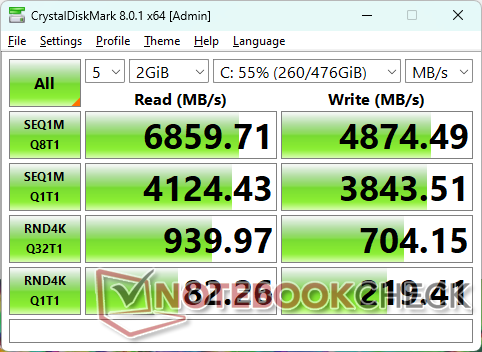
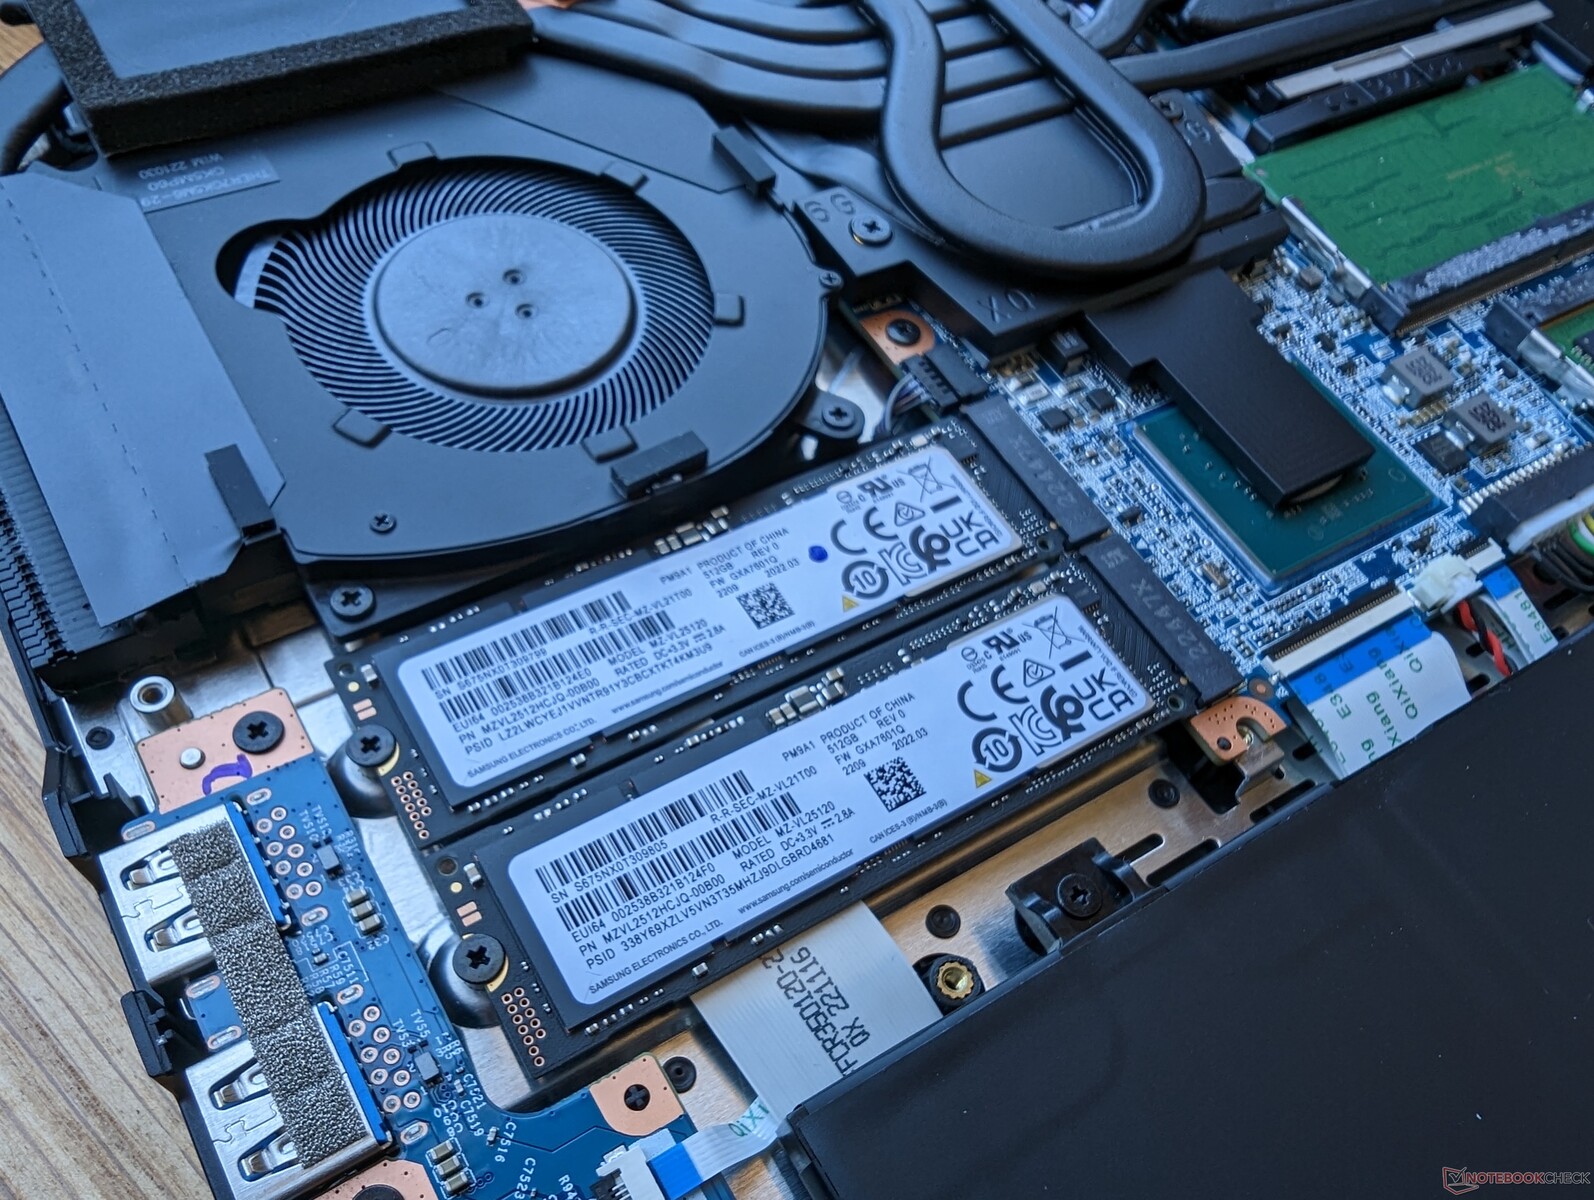
Lagringsenheter
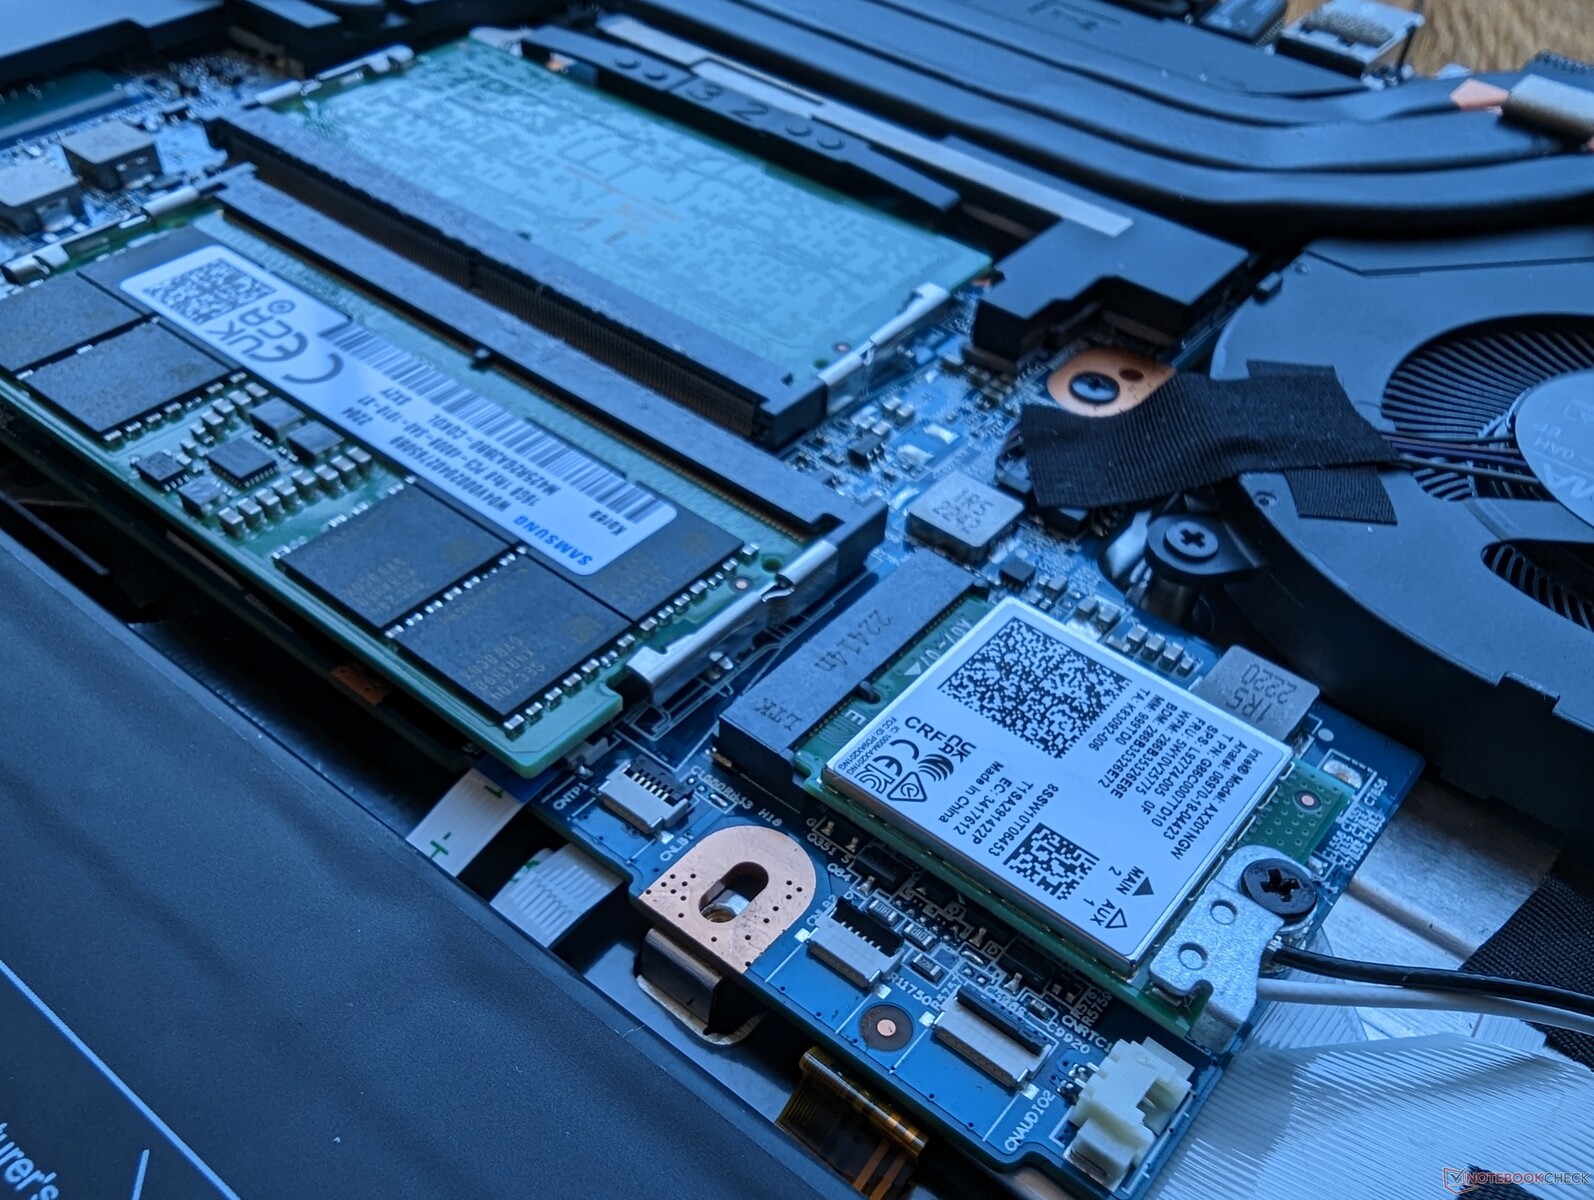
Vår testenhet levereras med en PCIe4 x4 Samsung PM9A1 MZVL2512HCJQ NVMe SSD med stöd för sekventiell läshastighet på 6700 MB/s. De snabba hastigheterna är också hållbara utan några prestandadoppar vid stress.

| Drive Performance rating - Percent | |
| Lenovo Legion Pro 7 16IRX8H | |
| Uniwill GM6PX7X RTX 4070 | |
| Gigabyte AERO 16 OLED BSF | |
| Razer Blade 16 Early 2023 | |
| Asus ROG Strix G16 G614JZ | |
| Schenker XMG Neo 16 E23 | |
* ... mindre är bättre
Disk Throttling: DiskSpd Read Loop, Queue Depth 8
GPU-prestanda
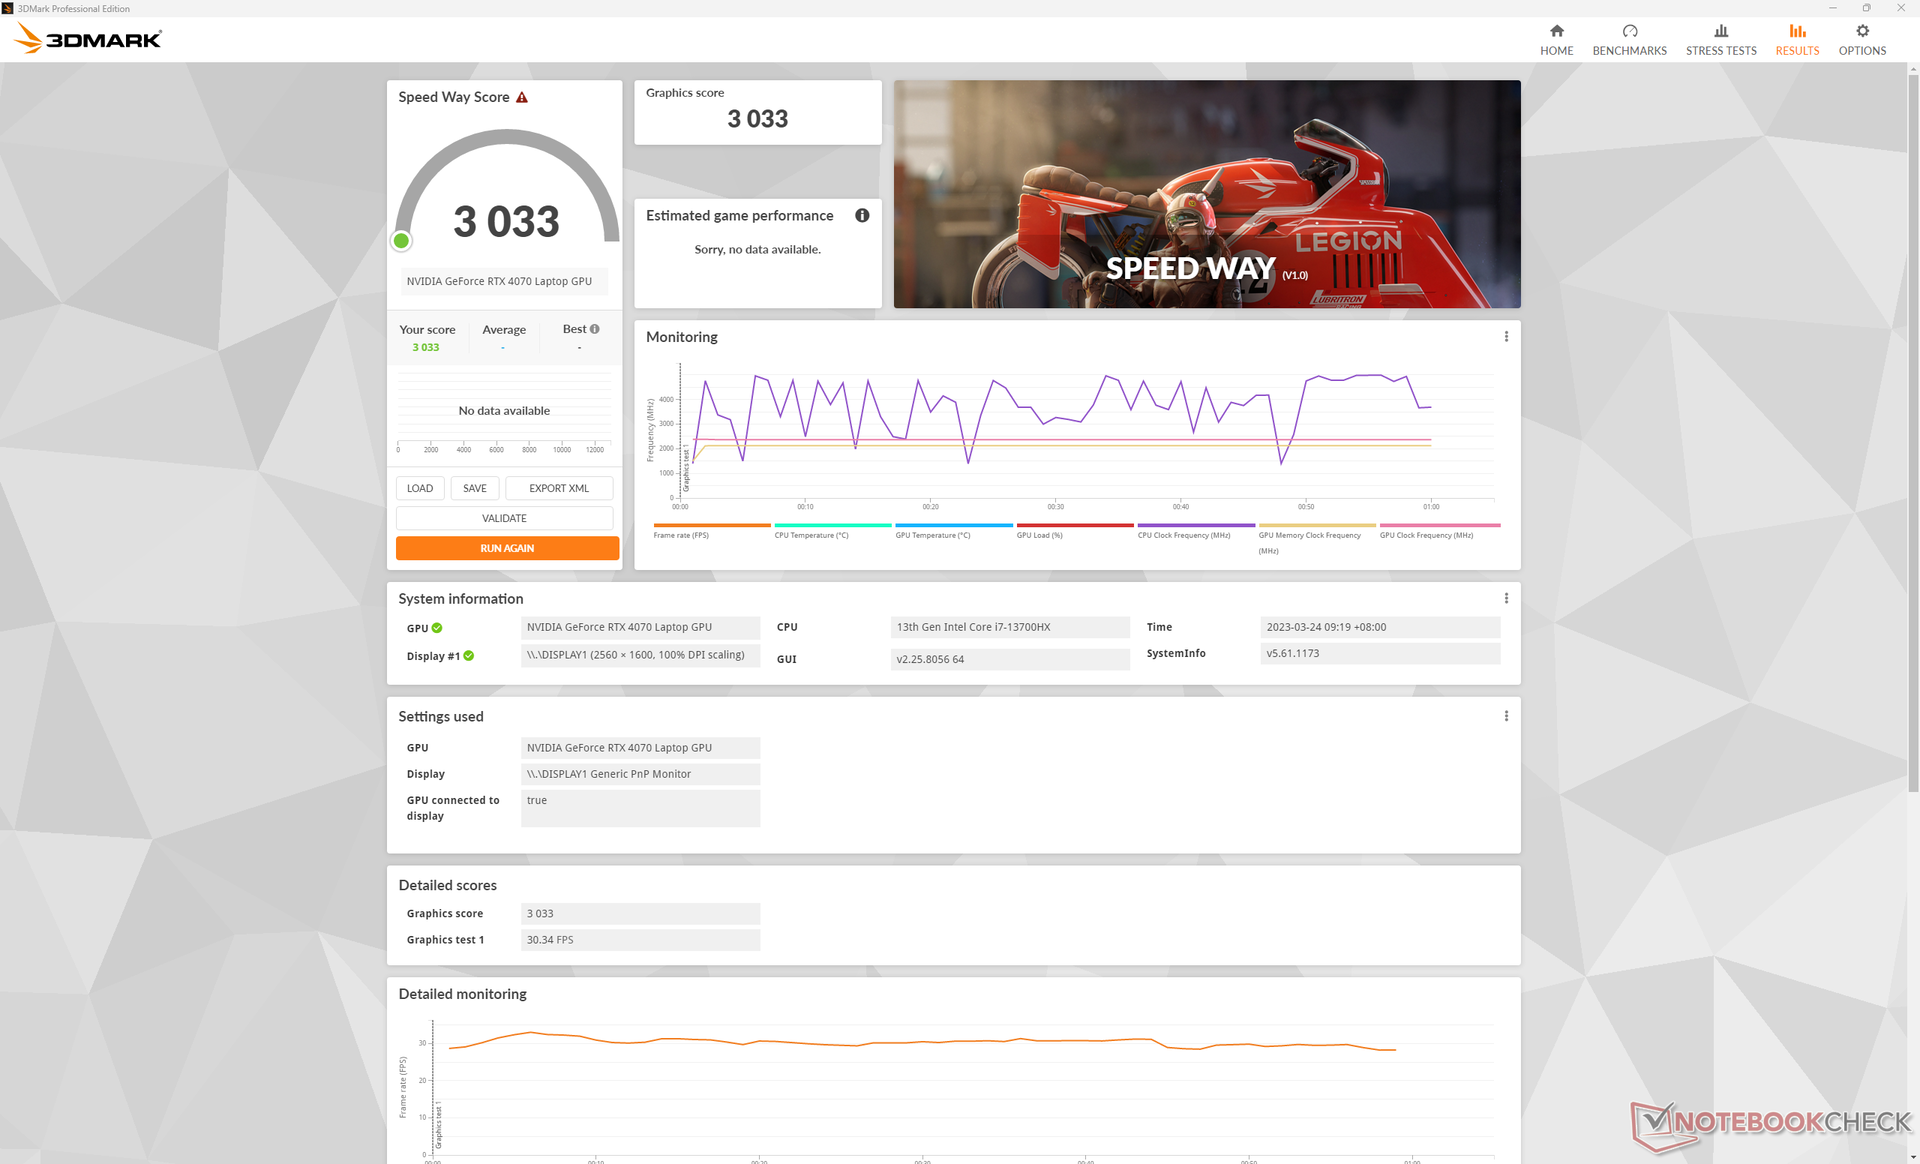
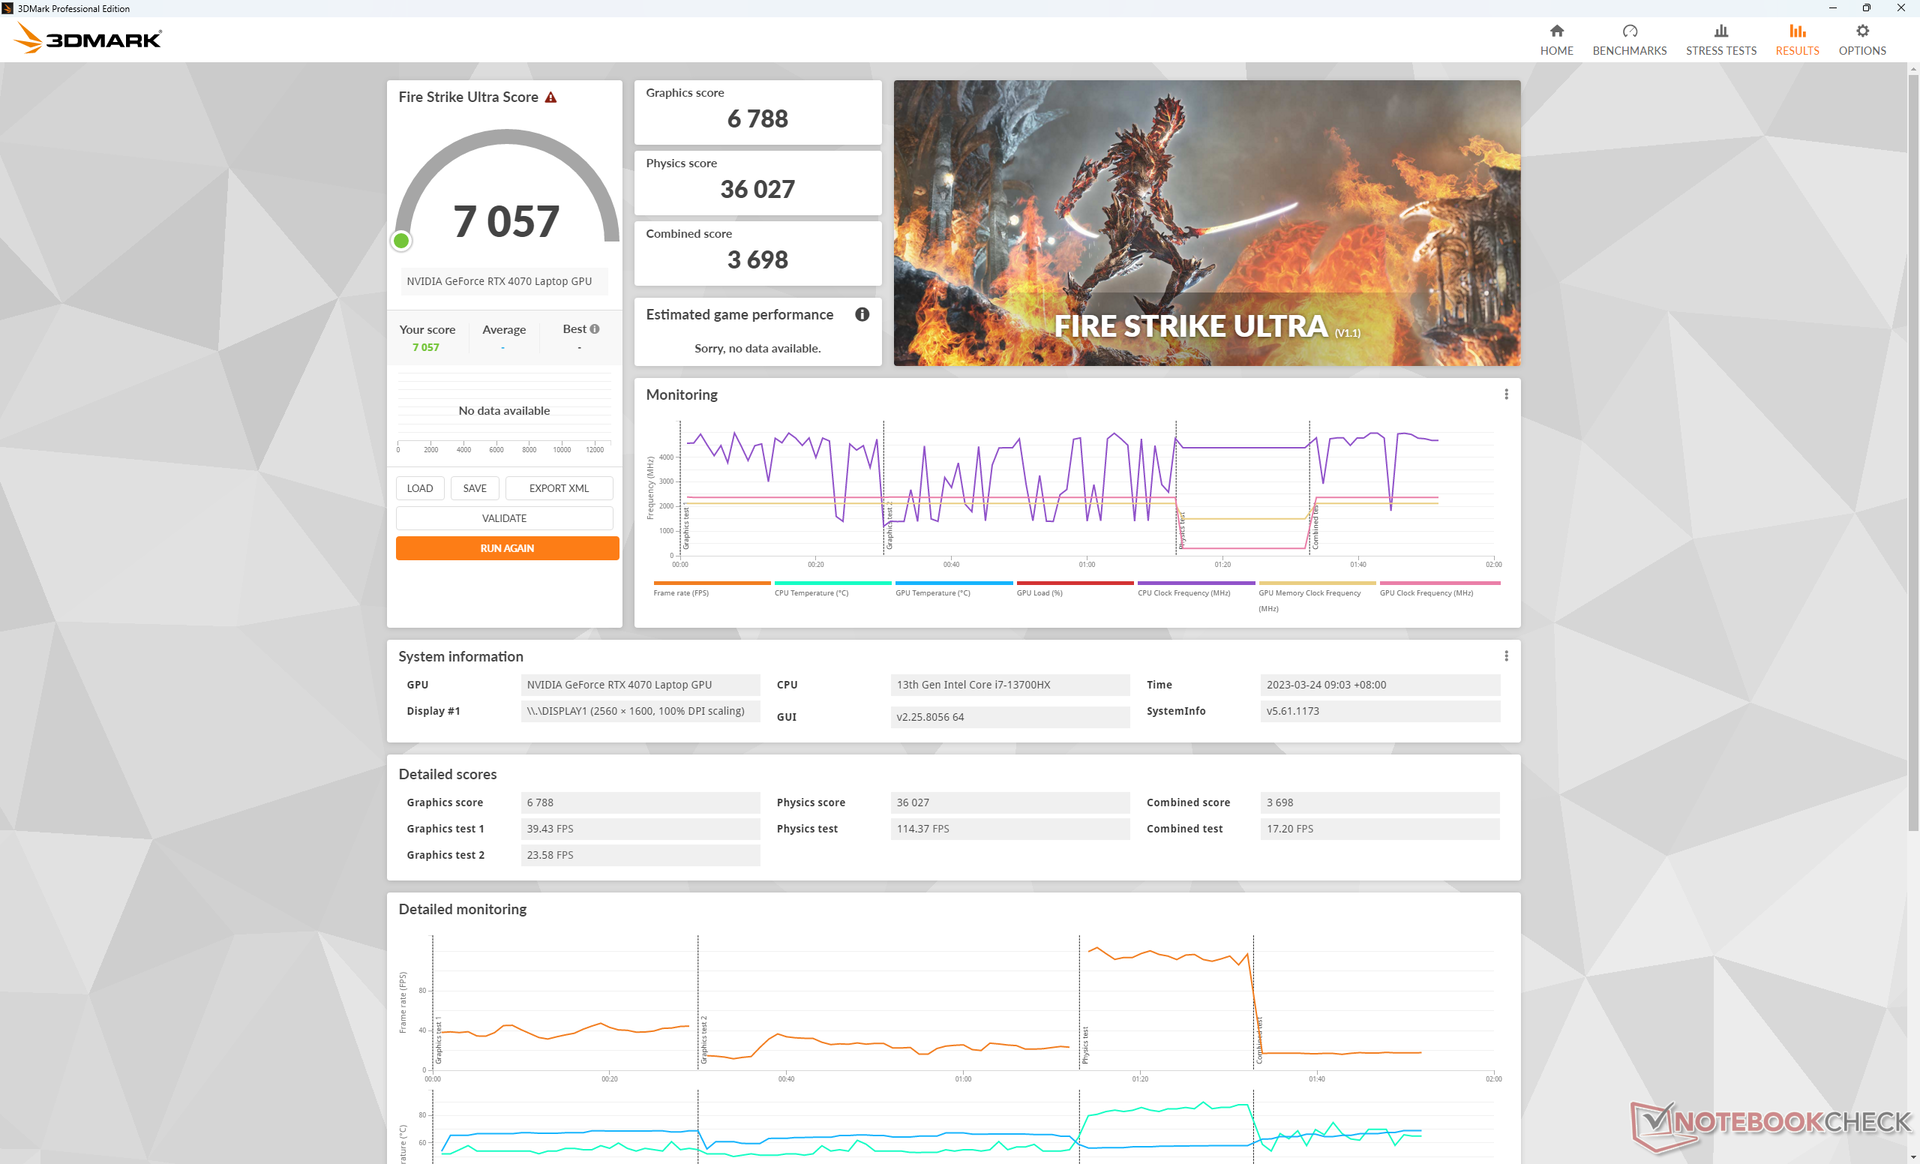
Efter att ha testat en handfull GeForce RTX 4060, 4070, 4080 och 4090 bärbara datorer hittills, och de förväntade skillnaderna i prestanda mellan dem börjar bli tydliga. När det gäller 140 W mobile RTX 4070 kan användarna förvänta sig att den ska prestera 15 till 20 procent snabbare än mobile RTX 4060 eller ungefär 30 till 35 procent långsammare än 175 W mobile RTX 4080. Prestandaklyftan mellan mobila RTX 4070 och mobila RTX 4080 är alltså mycket större än klyftan mellan mobila RTX 4060 och RTX 4070. Detta kan vara Nvidias sätt att uppmuntra potentiella köpare att istället överväga de mer avancerade 4080- eller 4090-konfigurationerna.
Genom att uppgradera från det mobila RTX 4070 till alternativet 175 W mobile RTX 4090 ökar den råa prestandan med cirka 55 till 80 procent. Extremt krävande spel i 4K som Cyberpunk 2077 eller F1 22 körs inte bra på mobila RTX 4070 om inte om DLSS eller ramgenerering stöds.
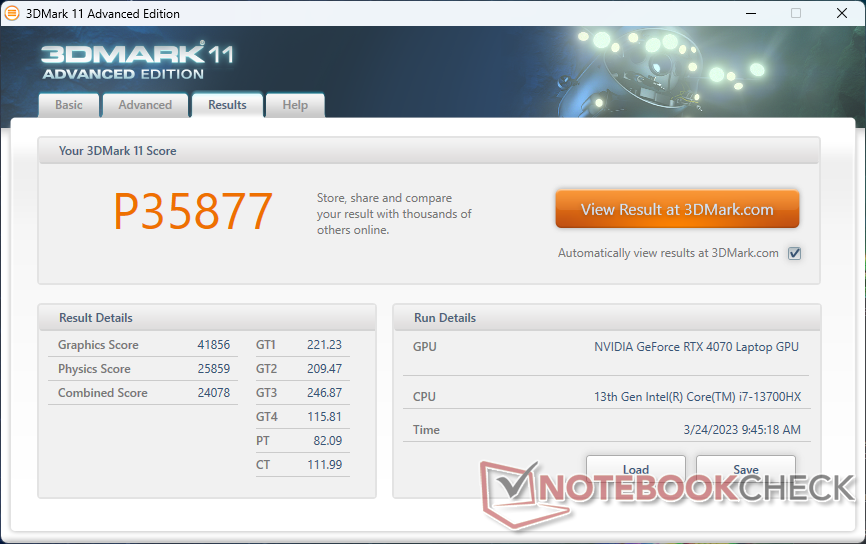
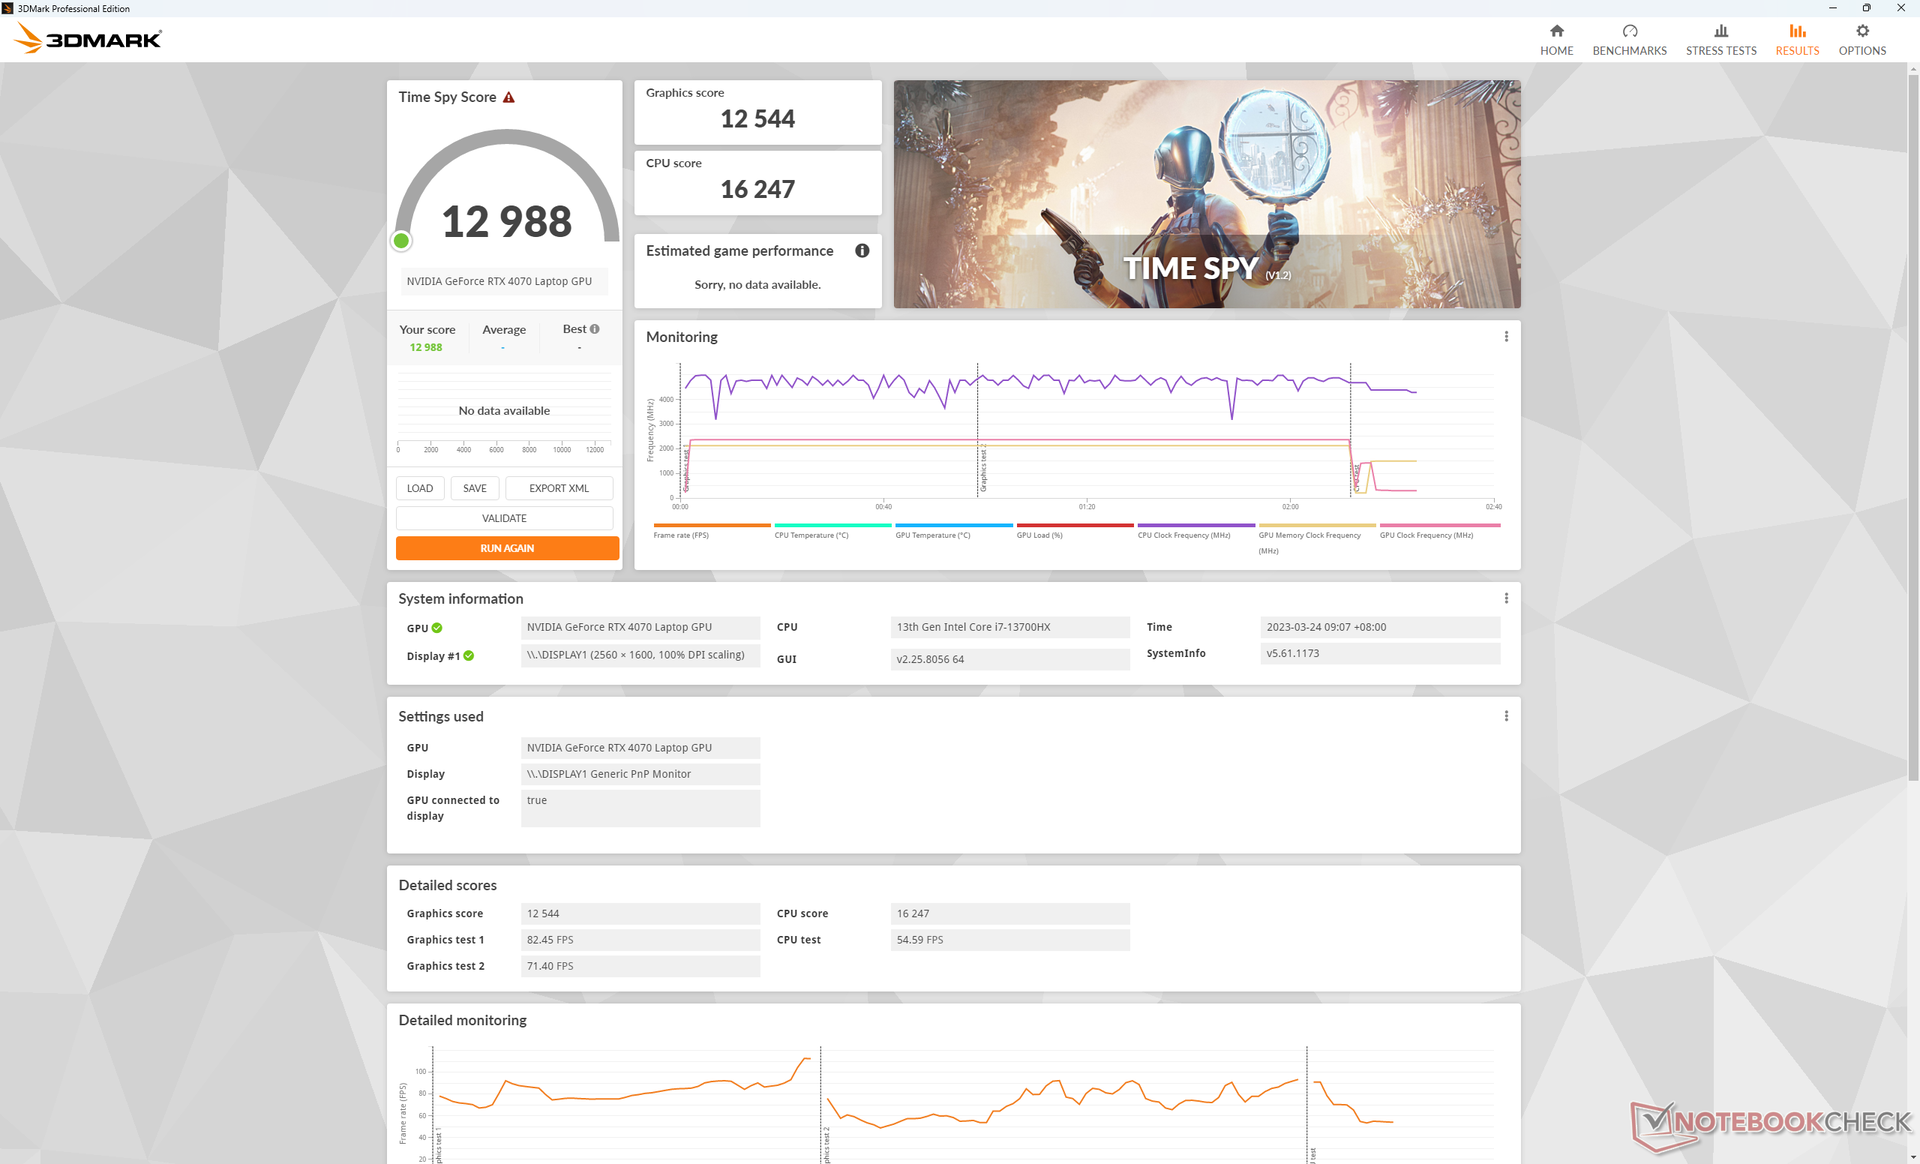
| 3DMark 11 Performance | 35877 poäng | |
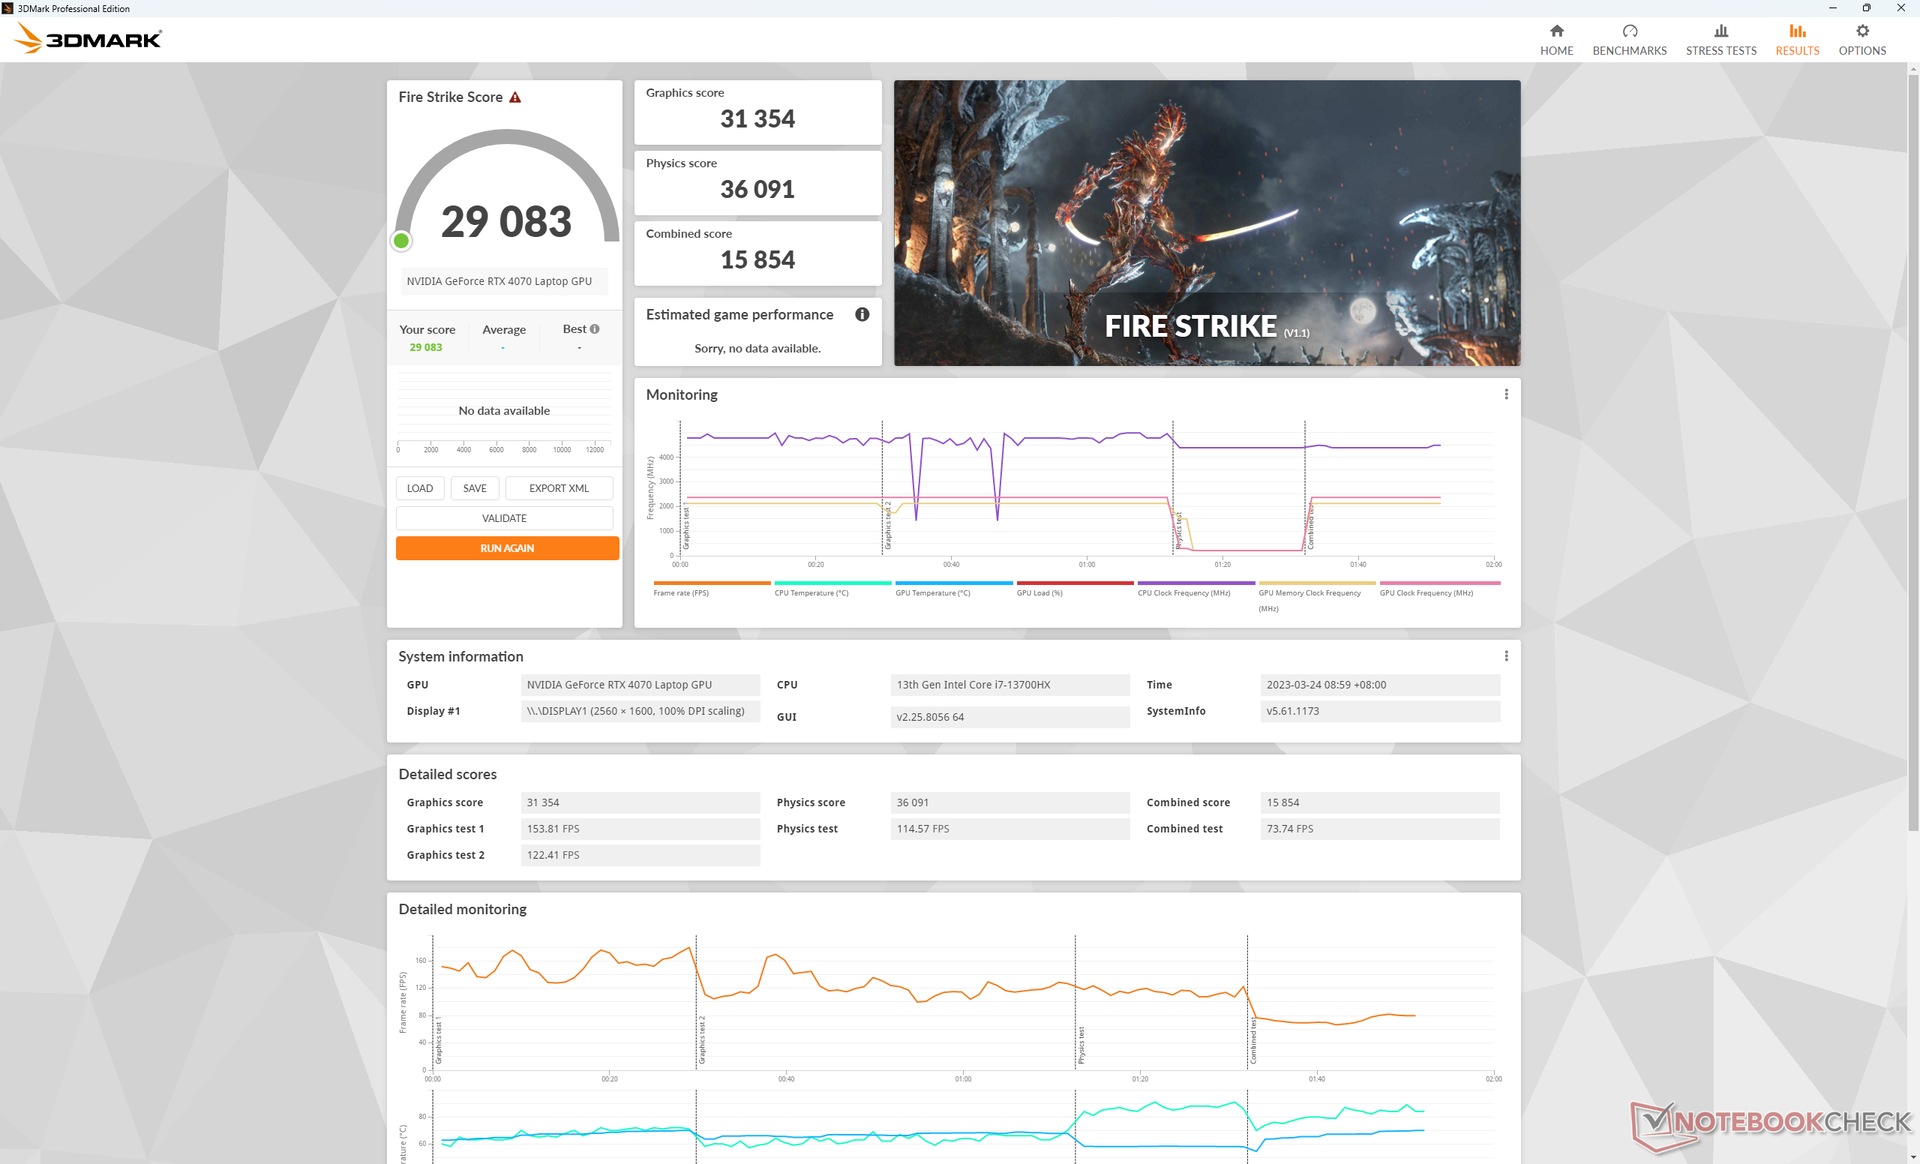
| 3DMark Fire Strike Score | 29083 poäng | |
| 3DMark Time Spy Score | 12988 poäng | |
Hjälp | ||
* ... mindre är bättre
Witcher 3 FPS Chart
| låg | med. | hög | ultra | QHD | 4K | |
|---|---|---|---|---|---|---|
| GTA V (2015) | 187 | 186.9 | 183.1 | 124.8 | 93.1 | 93.6 |
| The Witcher 3 (2015) | 606.3 | 430.3 | 260.5 | 123.2 | 78.8 | |
| Dota 2 Reborn (2015) | 213 | 187.9 | 187.2 | 170.2 | 146.6 | |
| Final Fantasy XV Benchmark (2018) | 227 | 177.3 | 121.2 | 88.6 | 48.8 | |
| X-Plane 11.11 (2018) | 189.4 | 165.6 | 129.2 | 109.2 | ||
| Strange Brigade (2018) | 567 | 332 | 255 | 217 | 143.3 | 75.3 |
| Cyberpunk 2077 1.6 (2022) | 182.8 | 152.9 | 115.1 | 93.6 | 55.6 | 24.4 |
| F1 22 (2022) | 310 | 306 | 231 | 83.1 | 53.8 | 26.5 |
Utsläpp
Systembrus
Fläktljudet beror på strömprofilen och GPU-inställningen. Om du till exempel har diskret GPU-läge skulle fläktljudet vara 29 dB(A) när det går på tomgång på skrivbordet mot en tyst bakgrund på 22,4 dB(A). I jämförelse skulle fläktljudet vara mycket tystare med bara 22,9 dB(A) om det är i Optimus-läget. Du kommer därför att vilja ha systemet i Optimus-läget för kravlösa uppgifter som webbsurfning eller videoströmning.
Körning av Witcher 3 i läget Performance med dGPU:n aktiv skulle det resultera i ett fläktljud på strax under 49 dB(A), vilket är tystare än på många andra bärbara 16-tums gamingdatorer, inklusive den tjockare RTX 4090-drivna Neo 16 ellerLenovo Legion Pro 7 16. Icke desto mindre kan fläktljudet fortfarande nå upp till ännu högre 55 dB(A) om titeln är mycket mer krävande.
Ljudnivå
| Låg belastning |
| 22.9 / 29 / 29 dB(A) |
| Hög belastning |
| 40.2 / 55 dB(A) |
 | ||
30 dB tyst 40 dB(A) hörbar 50 dB(A) högt ljud |
||
min: | ||
| Uniwill GM6PX7X RTX 4070 GeForce RTX 4070 Laptop GPU, i7-13700HX, Samsung PM9A1 MZVL2512HCJQ | Schenker XMG Neo 16 E23 GeForce RTX 4090 Laptop GPU, i9-13900HX, Crucial P5 Plus 1TB CT1000P5PSSD8 | Asus ROG Strix G16 G614JZ GeForce RTX 4080 Laptop GPU, i9-13980HX, WD PC SN560 SDDPNQE-1T00 | Lenovo Legion Pro 7 16IRX8H GeForce RTX 4080 Laptop GPU, i9-13900HX, Samsung PM9A1 MZVL21T0HCLR | Gigabyte AERO 16 OLED BSF GeForce RTX 4070 Laptop GPU, i9-13900H, Gigabyte AG470S1TB-SI B10 | Razer Blade 16 Early 2023 GeForce RTX 4080 Laptop GPU, i9-13950HX, SSSTC CA6-8D1024 | |
|---|---|---|---|---|---|---|
| Noise | -25% | -6% | -10% | -6% | 6% | |
| av / miljö * (dB) | 22.4 | 25 -12% | 25 -12% | 24 -7% | 23 -3% | 23 -3% |
| Idle Minimum * (dB) | 22.9 | 31 -35% | 26 -14% | 26 -14% | 23 -0% | 23 -0% |
| Idle Average * (dB) | 29 | 33 -14% | 28 3% | 28 3% | 23 21% | 23 21% |
| Idle Maximum * (dB) | 29 | 42 -45% | 30 -3% | 34 -17% | 33.64 -16% | 23.6 19% |
| Load Average * (dB) | 40.2 | 58 -44% | 48 -19% | 47 -17% | 51.49 -28% | 39 3% |
| Witcher 3 ultra * (dB) | 48.7 | 57 -17% | 49 -1% | 55 -13% | 55.27 -13% | 51.6 -6% |
| Load Maximum * (dB) | 55 | 59 -7% | 52 5% | 56 -2% | 55.24 -0% | 51.3 7% |
* ... mindre är bättre
Temperatur
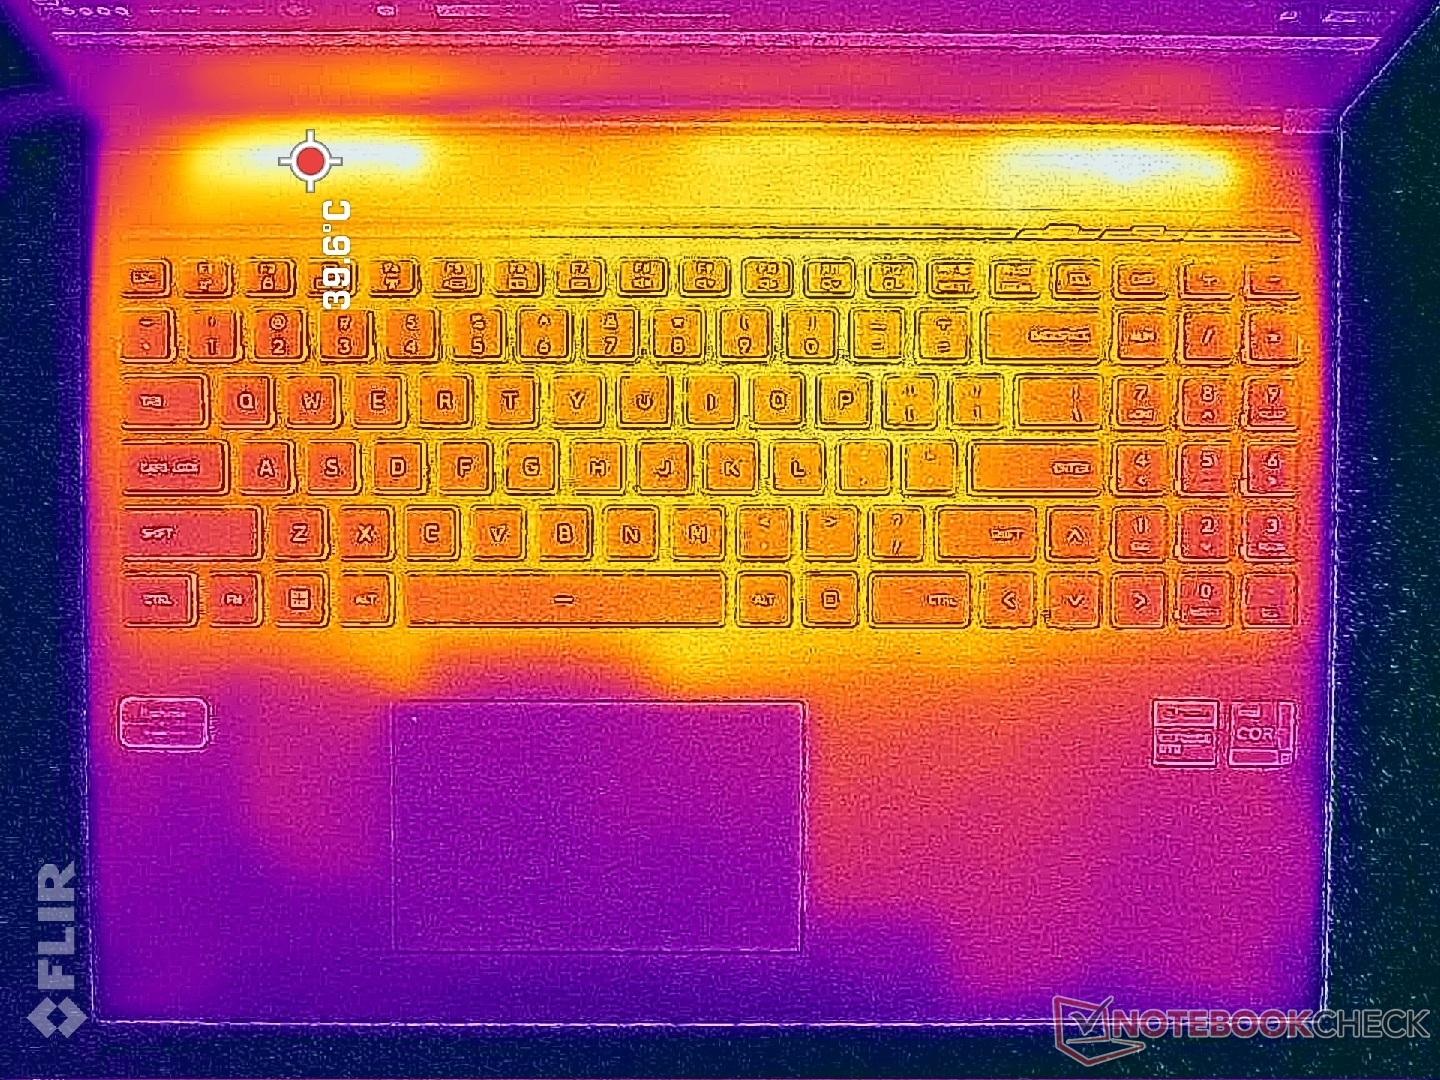
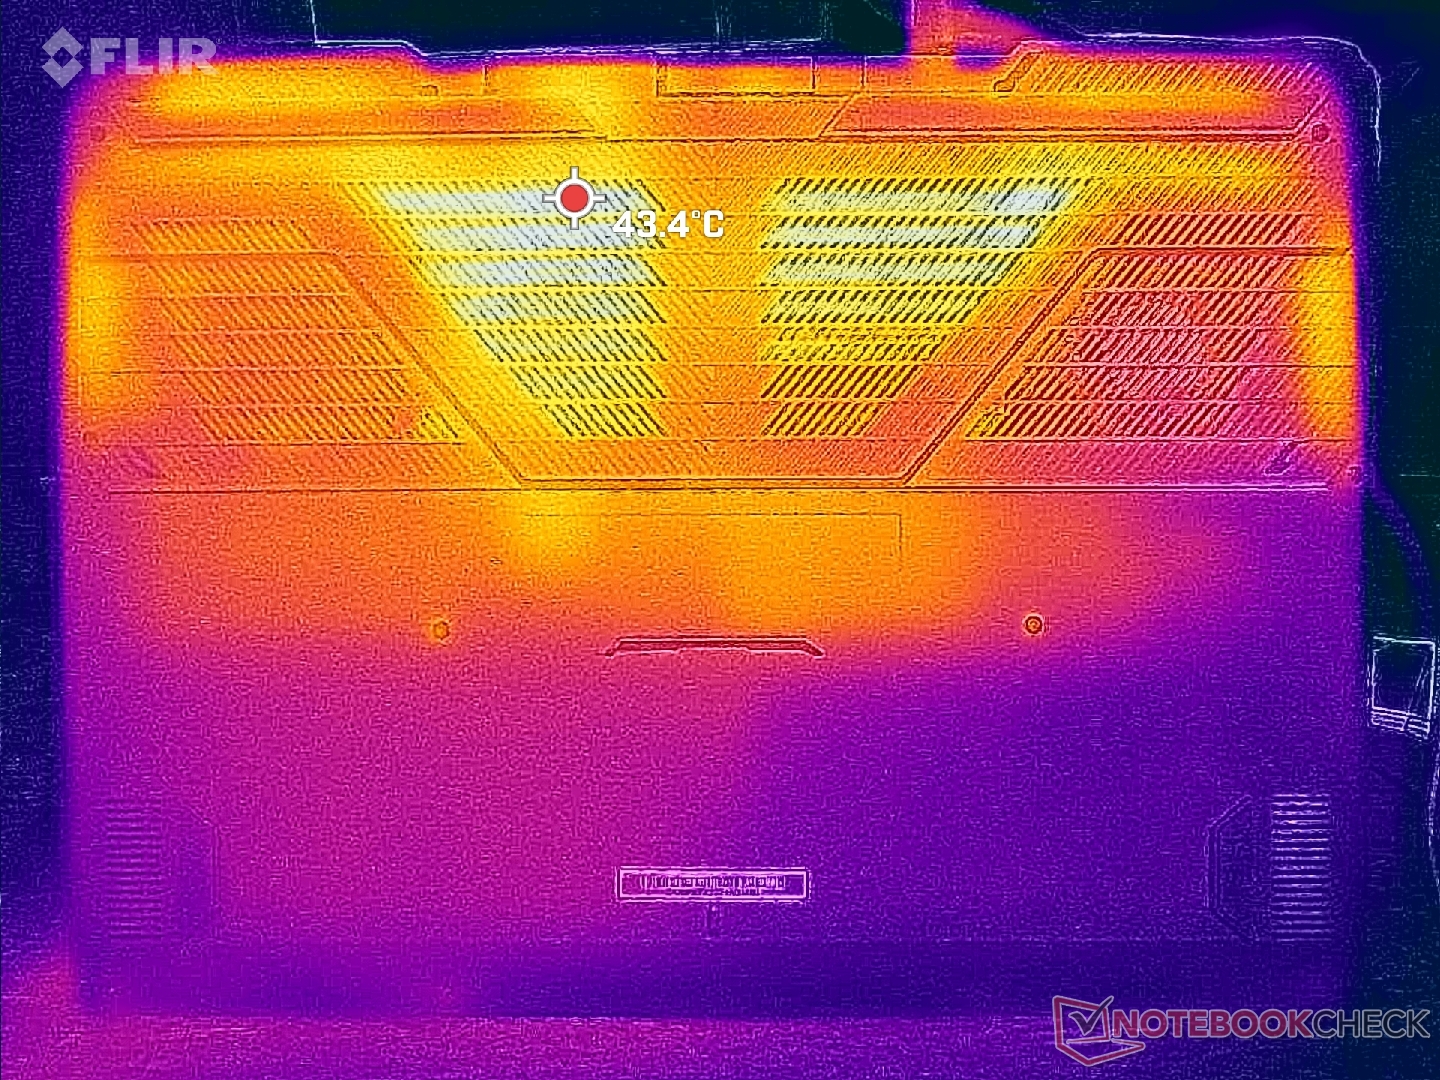
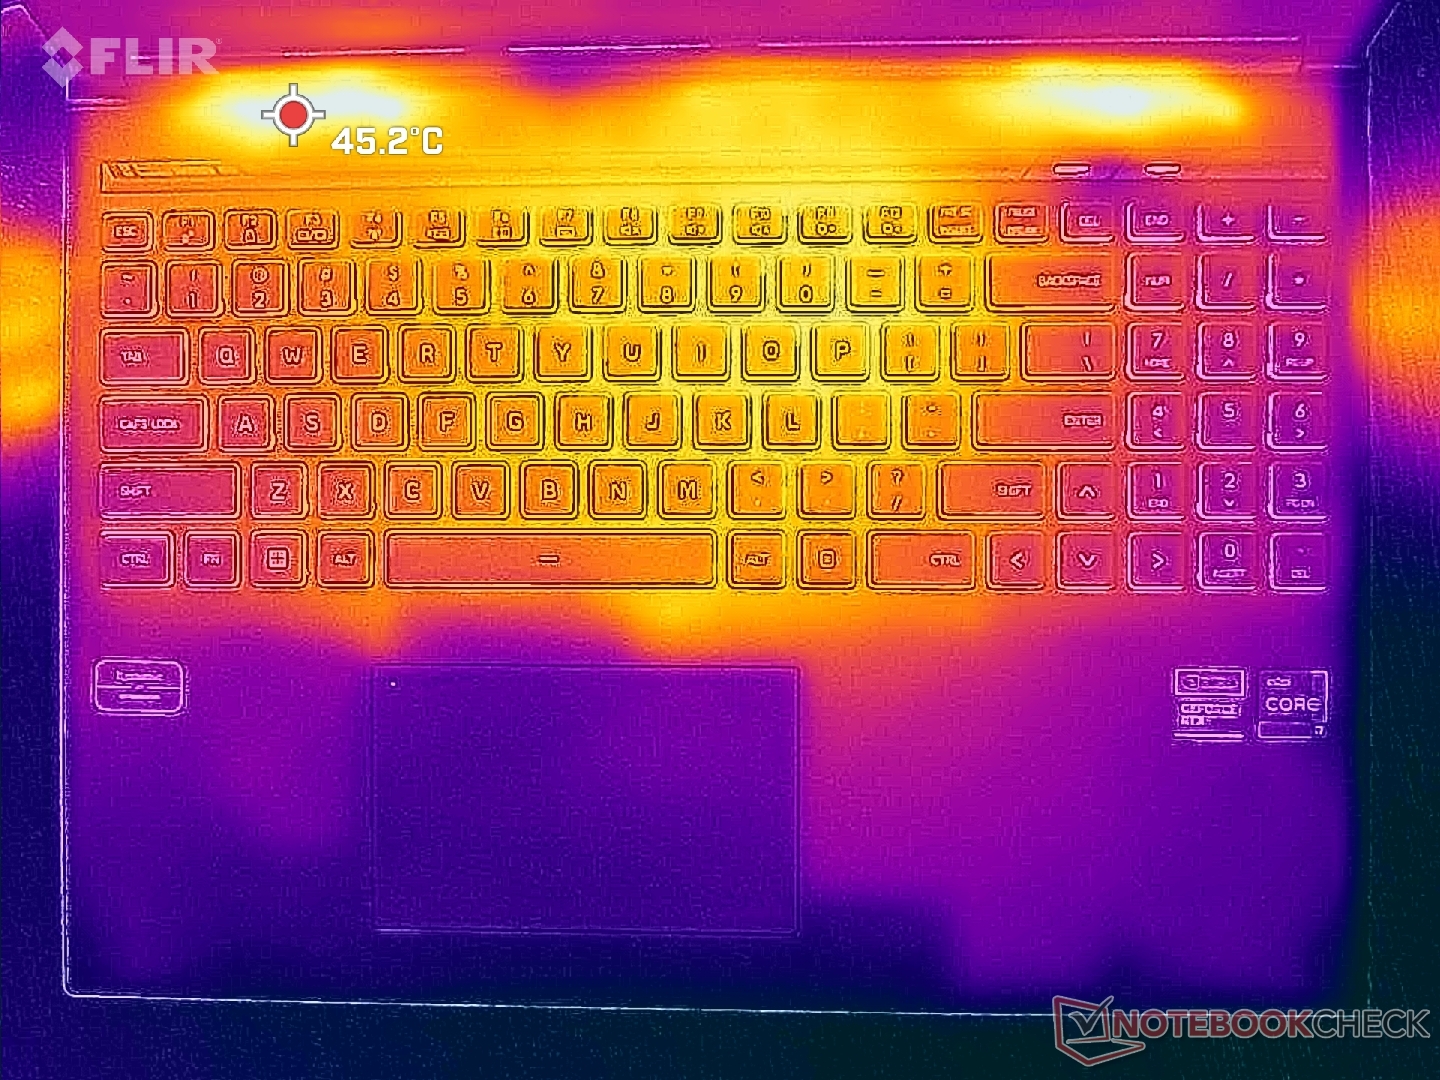
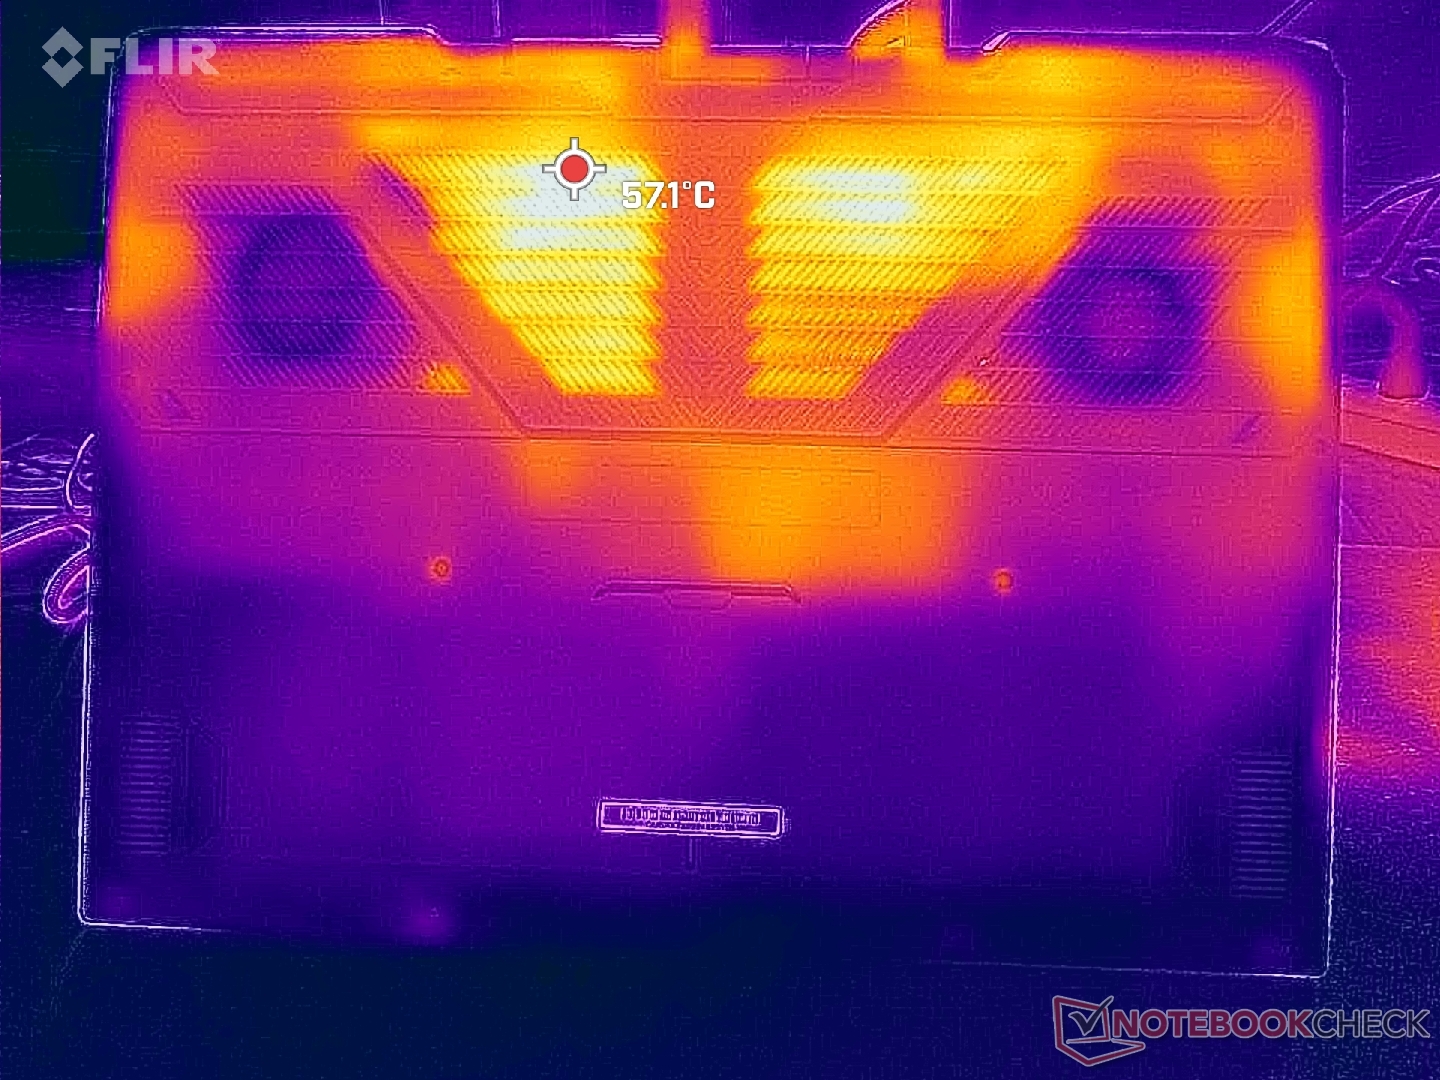
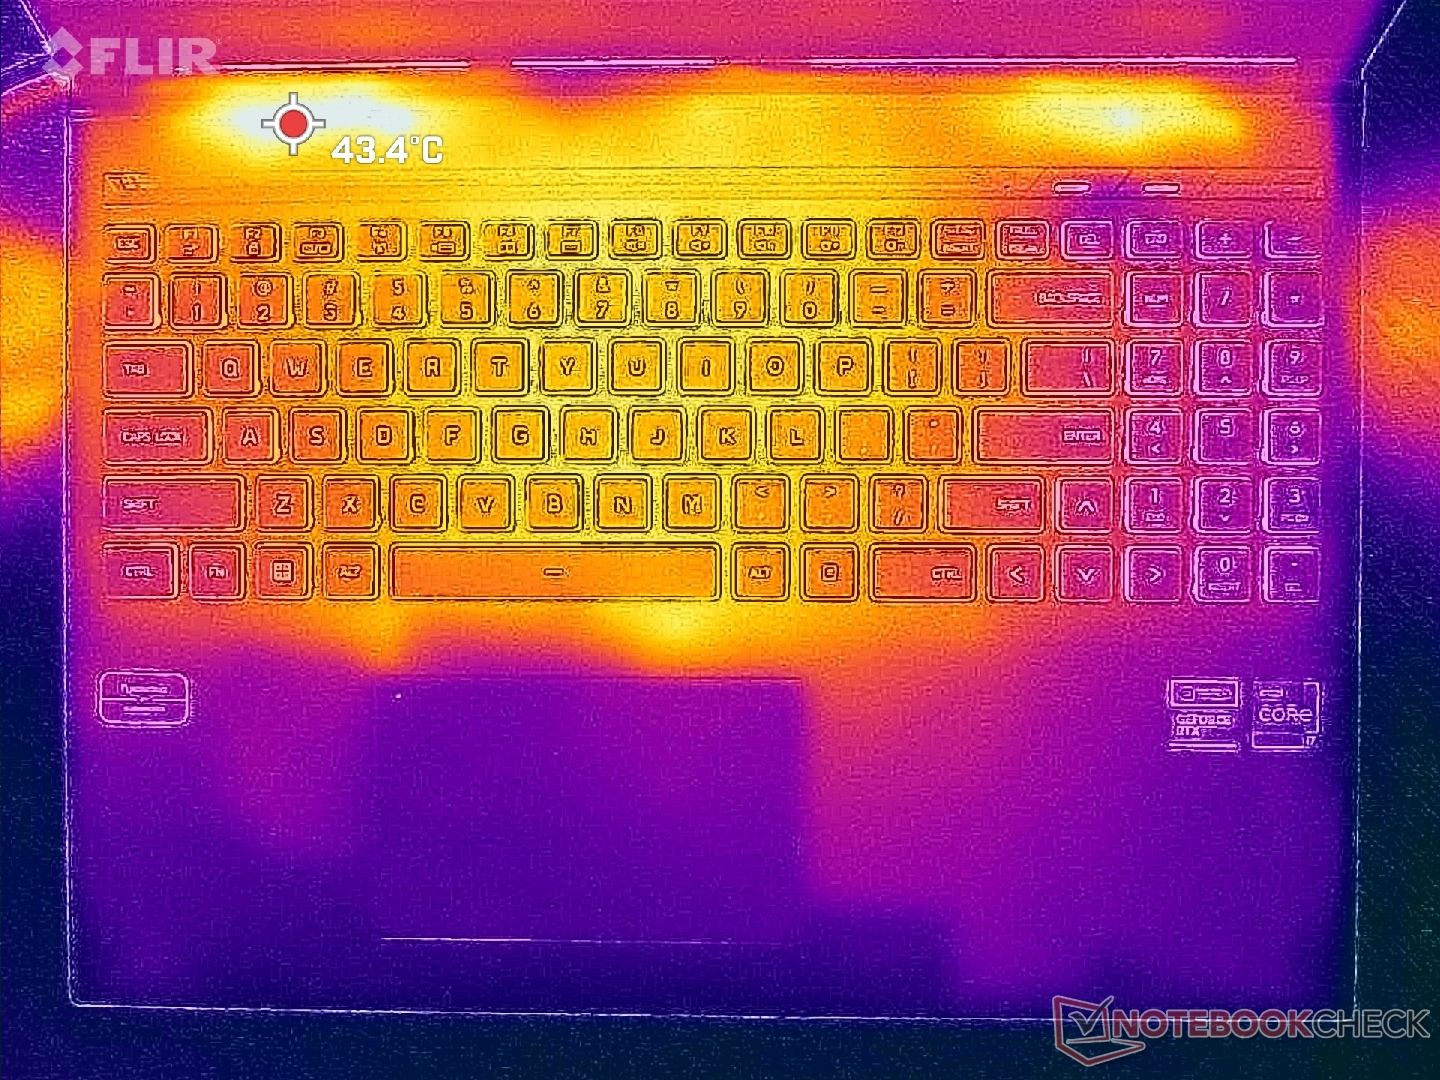
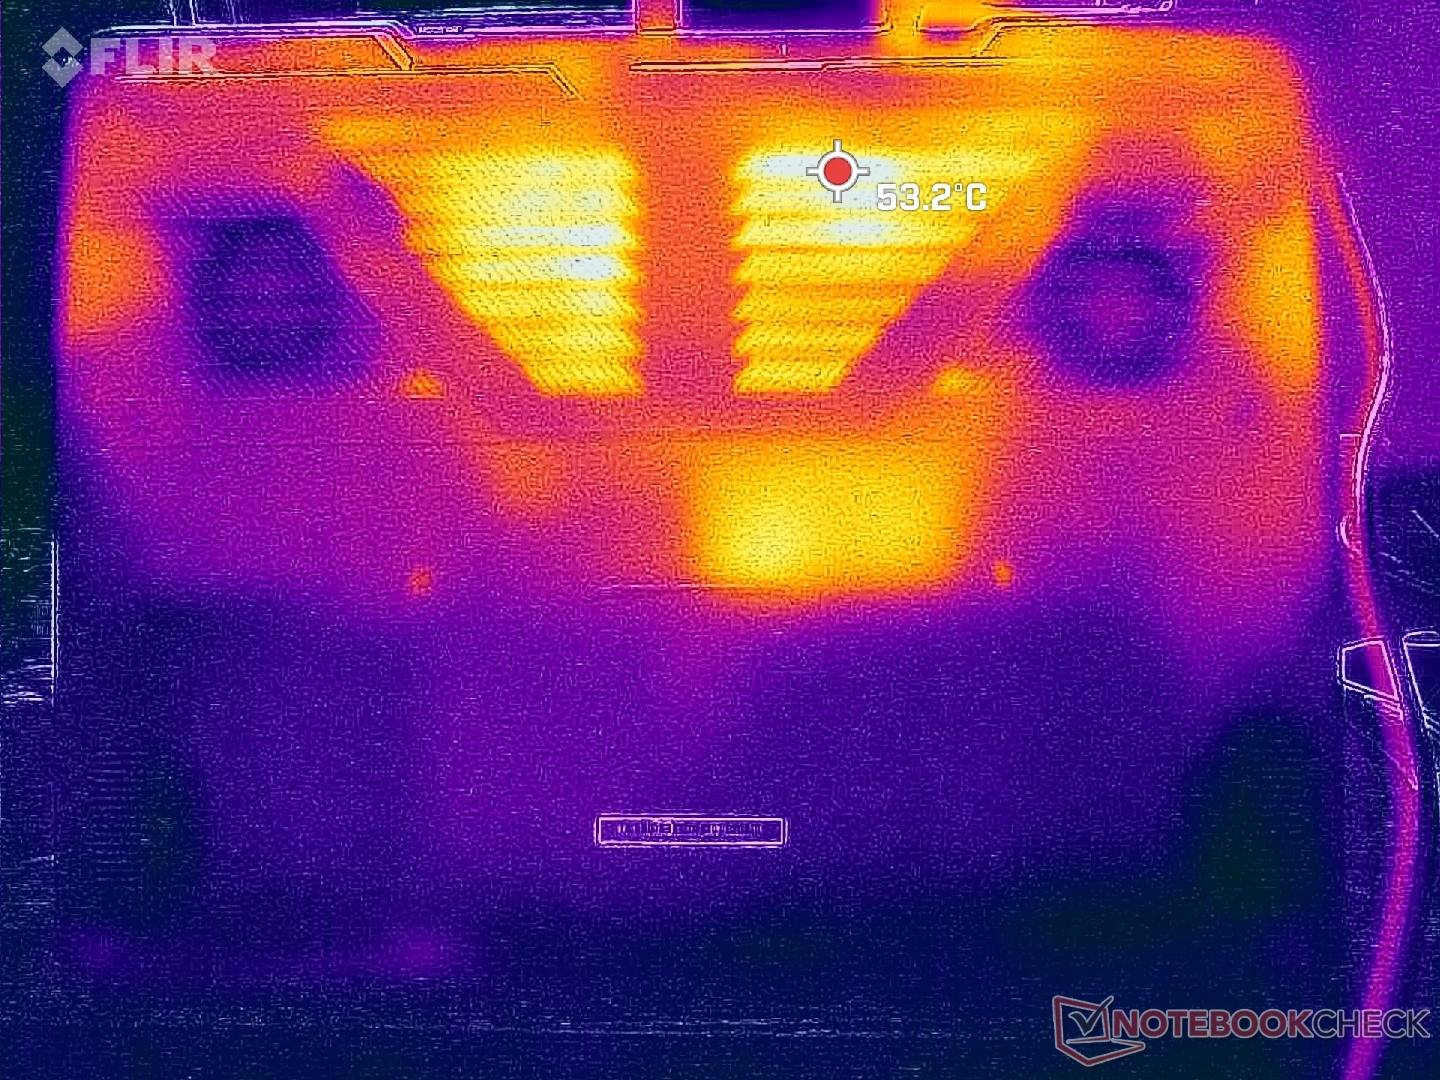
Yttemperaturen när du spelar är relativt sval jämfört med andra bärbara 16-tums gamingdatorer. TheAsus ROG Strix G16kan till exempel nå upp till över 54 C, medan de heta punkterna på Uniwill toppar vid 40 C på ovansidan och 45 C på undersidan. Temperaturerna är svalare än på den RTX 4090-drivna Neo 16 med några grader C också vid liknande spelbelastning.
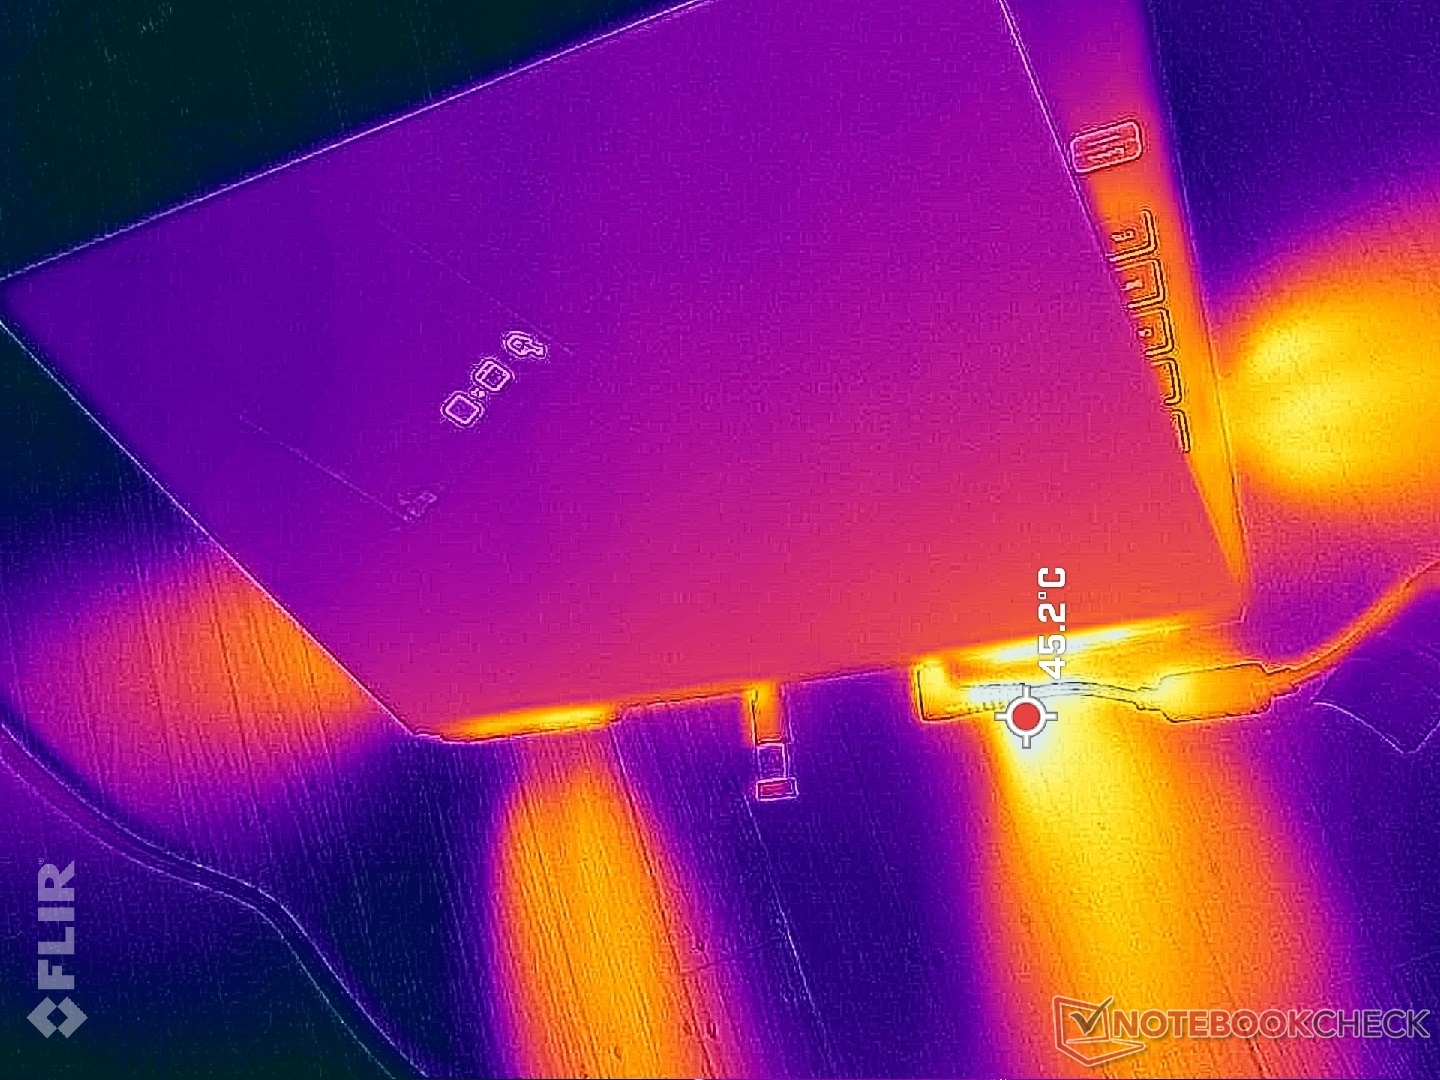
(+) Den maximala temperaturen på ovansidan är 38.2 °C / 101 F, jämfört med genomsnittet av 40.4 °C / 105 F , allt från 21.2 till 68.8 °C för klassen Gaming.
(±) Botten värms upp till maximalt 45 °C / 113 F, jämfört med genomsnittet av 43.2 °C / 110 F
(+) Vid tomgångsbruk är medeltemperaturen för ovansidan 28.9 °C / 84 F, jämfört med enhetsgenomsnittet på 33.9 °C / ### class_avg_f### F.
(±) När du spelar The Witcher 3 är medeltemperaturen för ovansidan 32.7 °C / 91 F, jämfört med enhetsgenomsnittet på 33.9 °C / ## #class_avg_f### F.
(+) Handledsstöden och pekplattan är kallare än hudtemperaturen med maximalt 26.4 °C / 79.5 F och är därför svala att ta på.
(+) Medeltemperaturen för handledsstödsområdet på liknande enheter var 28.8 °C / 83.8 F (+2.4 °C / 4.3 F).
| Uniwill GM6PX7X RTX 4070 Intel Core i7-13700HX, NVIDIA GeForce RTX 4070 Laptop GPU | Schenker XMG Neo 16 E23 Intel Core i9-13900HX, NVIDIA GeForce RTX 4090 Laptop GPU | Asus ROG Strix G16 G614JZ Intel Core i9-13980HX, NVIDIA GeForce RTX 4080 Laptop GPU | Lenovo Legion Pro 7 16IRX8H Intel Core i9-13900HX, NVIDIA GeForce RTX 4080 Laptop GPU | Gigabyte AERO 16 OLED BSF Intel Core i9-13900H, NVIDIA GeForce RTX 4070 Laptop GPU | Razer Blade 16 Early 2023 Intel Core i9-13950HX, NVIDIA GeForce RTX 4080 Laptop GPU | |
|---|---|---|---|---|---|---|
| Heat | 2% | -8% | -9% | 16% | 9% | |
| Maximum Upper Side * (°C) | 38.2 | 50 -31% | 54 -41% | 48 -26% | 41 -7% | 40 -5% |
| Maximum Bottom * (°C) | 45 | 51 -13% | 55 -22% | 49 -9% | 47 -4% | 37.6 16% |
| Idle Upper Side * (°C) | 33.6 | 28 17% | 29 14% | 40 -19% | 23 32% | 32.4 4% |
| Idle Bottom * (°C) | 39.6 | 26 34% | 33 17% | 33 17% | 23 42% | 31.4 21% |
* ... mindre är bättre
Stresstest
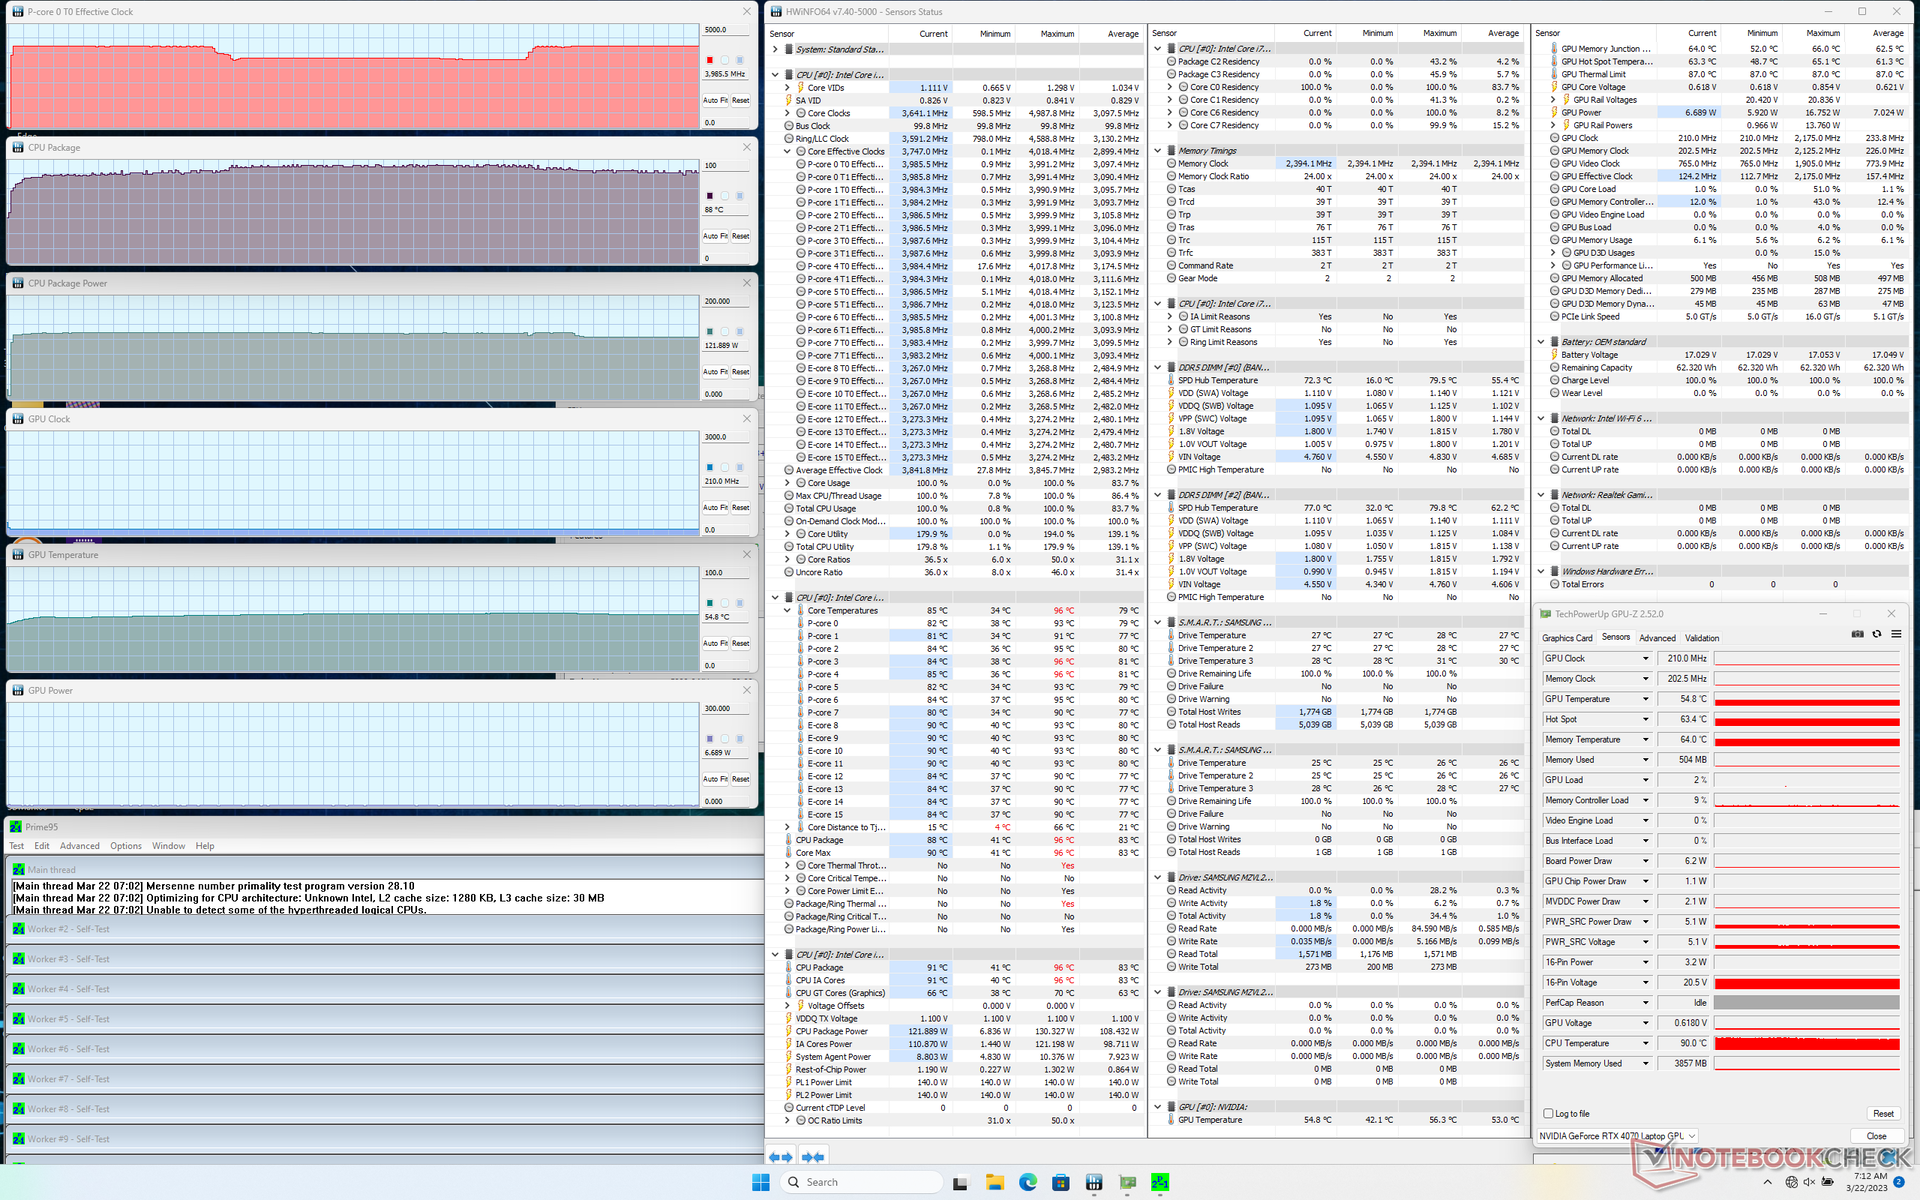
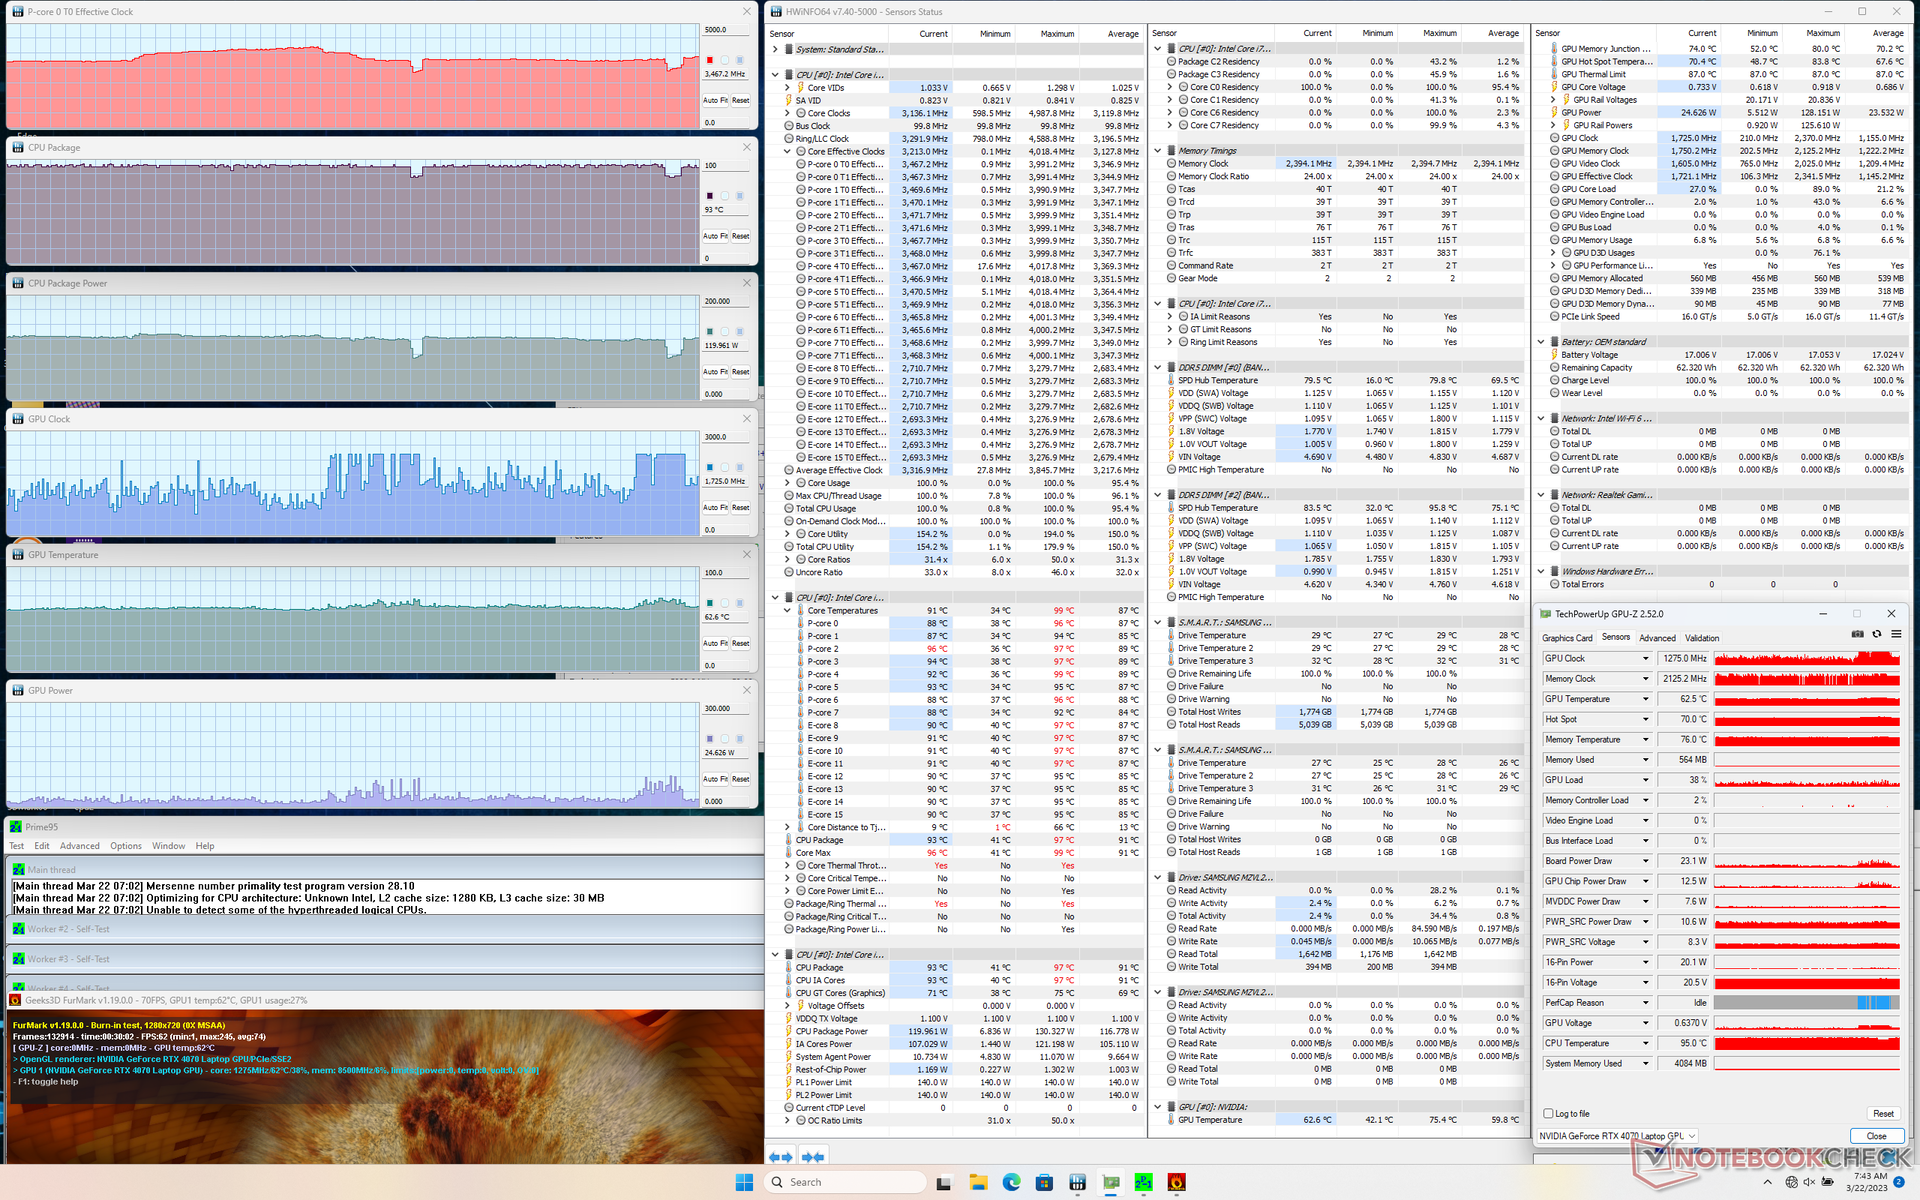
När processorn stressades under Prime95 ökade den till 4 GHz och 130 W under de första minuterna. Därefter sjönk klockfrekvensen och strömförbrukningen på kortet till 3,4 GHz respektive 122 W. Kärnans temperatur skulle ligga runt 90 C, vilket är mycket varmt även för en bärbar dator för spel. Om man körde samma test på Razer Blade 16 skulle till exempel CPU-temperaturen ligga mycket närmare 80 C.
CPU- och GPU-temperaturen när Witcher 3 körs skulle stabiliseras på 83 C respektive 73 C, jämfört med 78 C vardera på Blade 16. GPU-kortets strömförbrukning skulle stabiliseras på endast 100 W jämfört med dess 140 W TGP-klassning.
Att köra på batteri begränsar prestandan som förväntat. Ett Fire Strike -test på batterier skulle ge fysik- och grafikpoäng på 9314 respektive 11777 poäng, jämfört med 36091 respektive 31354 poäng när det är på nätet.
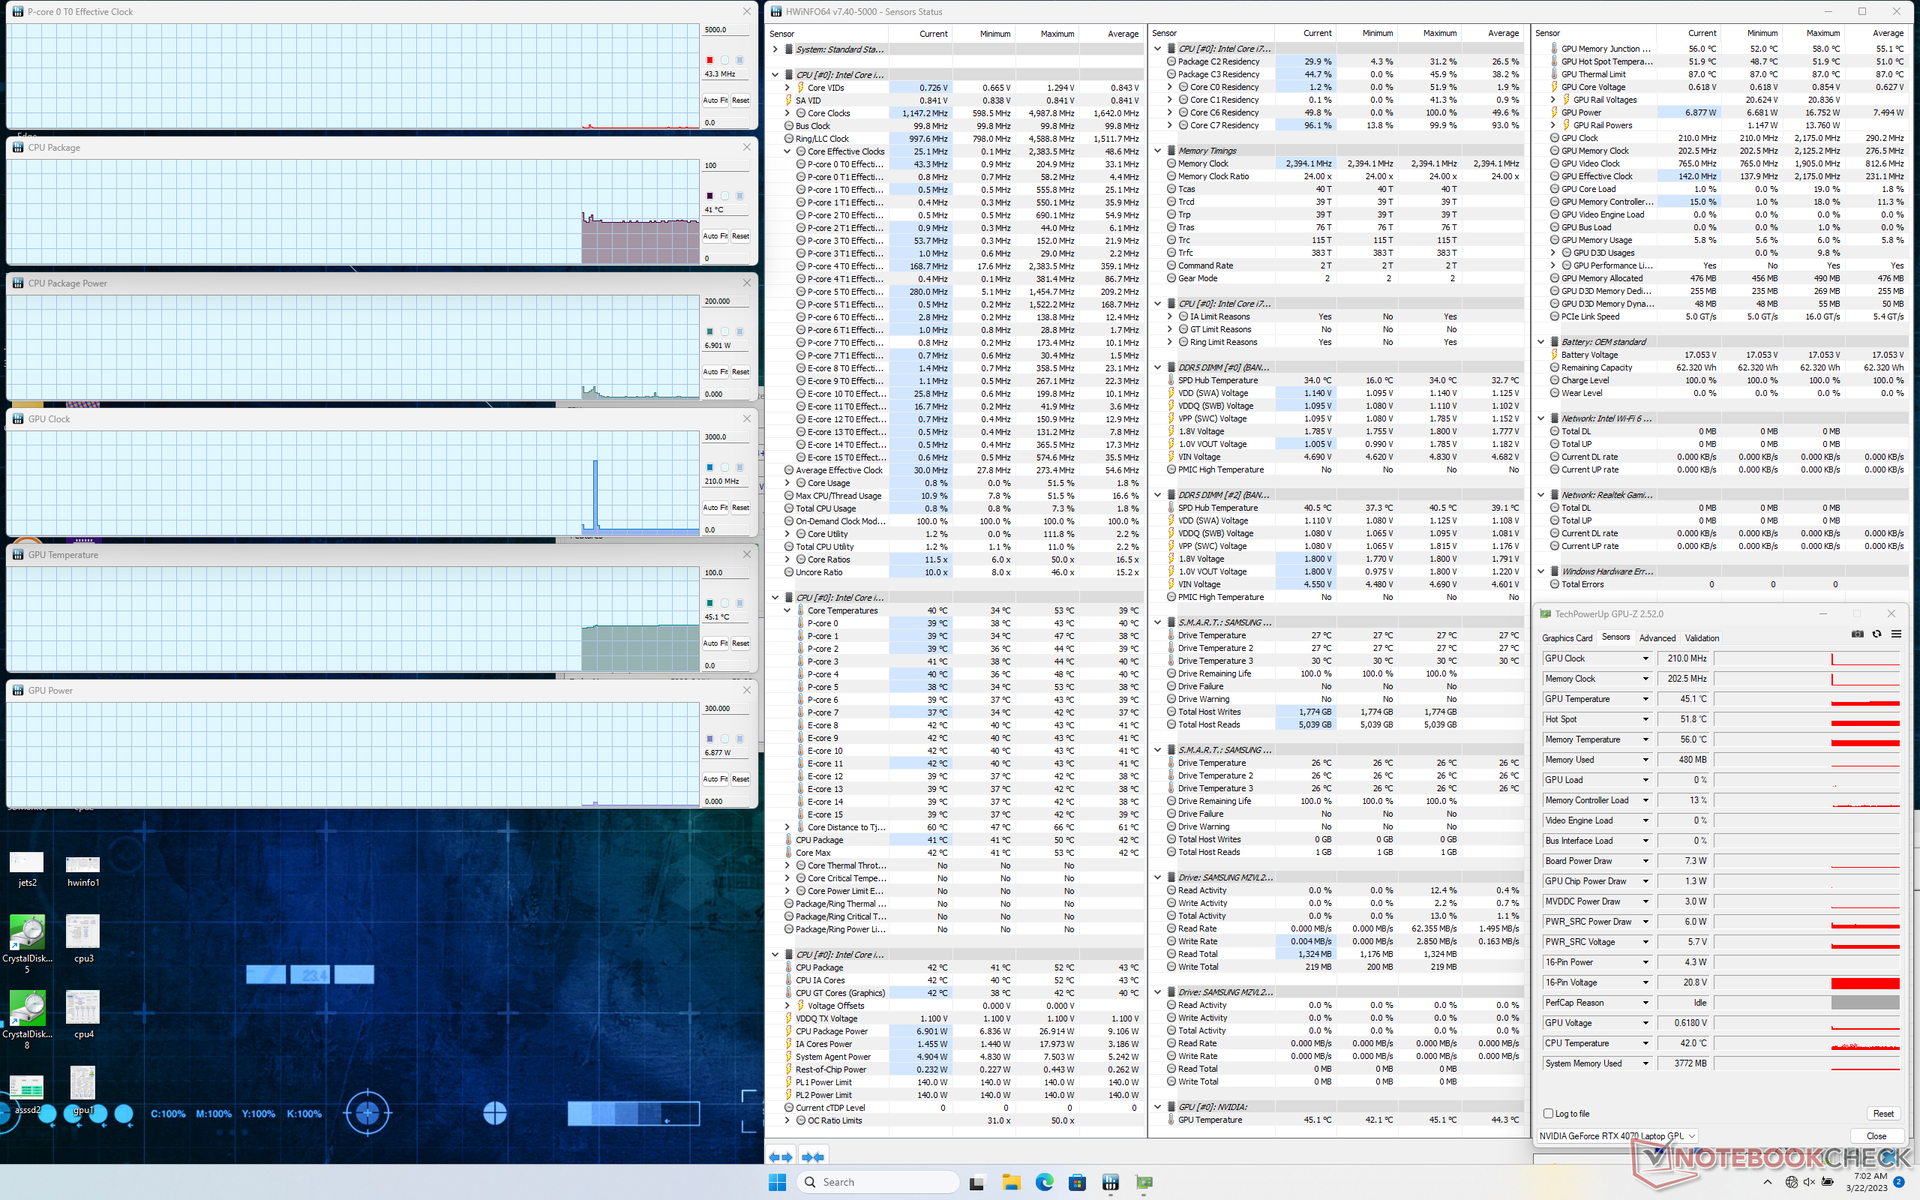
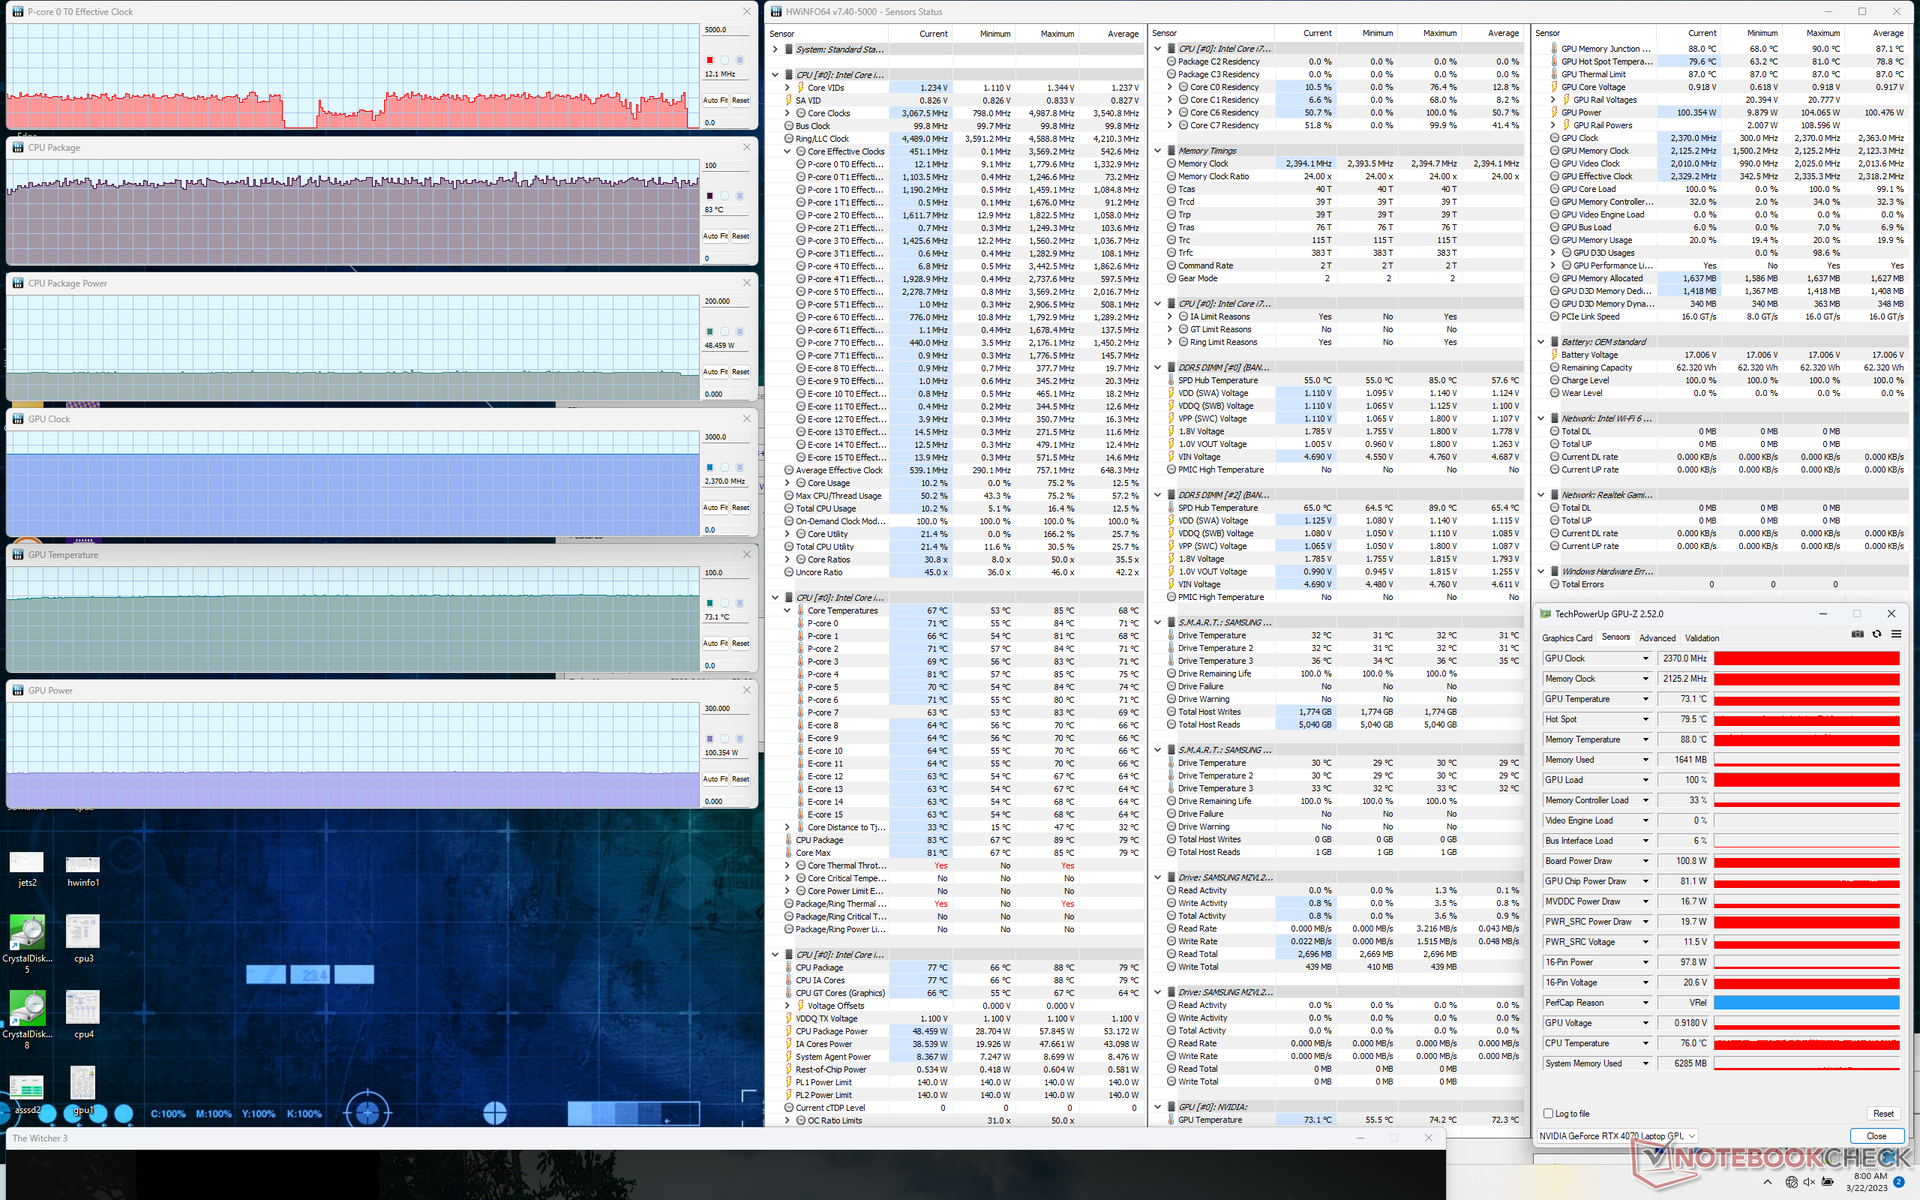
| CPU-klocka (GHz) | GPU-klocka (MHz) | Genomsnittlig CPU-temperatur (°C) | Genomsnittlig GPU-temperatur (°C) | |
| System Idle | -- | -- | 41 | 45 |
| Prime95 Stress | 3.4 - 4.0 | -- | 89 | 55 |
| Prime95 + FurMark Stress | ~3,5 | 1275 - 2350 | 93 | 63 |
| Witcher 3 Stress | ~1450 | 2370 | 83 | 73 |
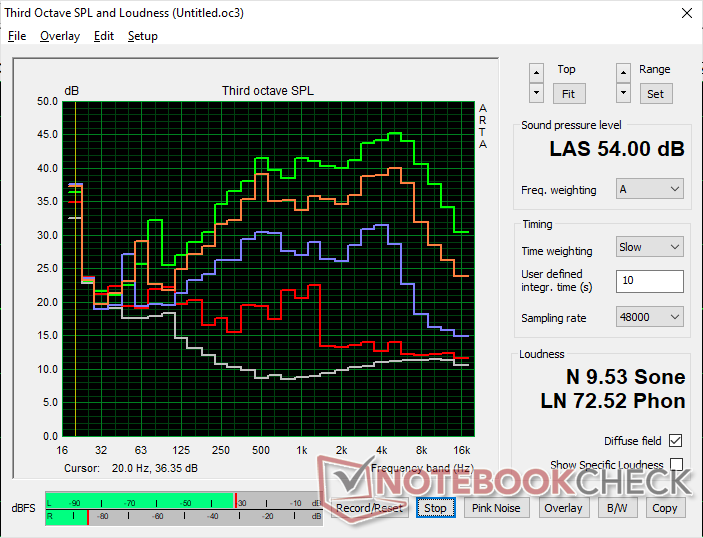
Högtalare
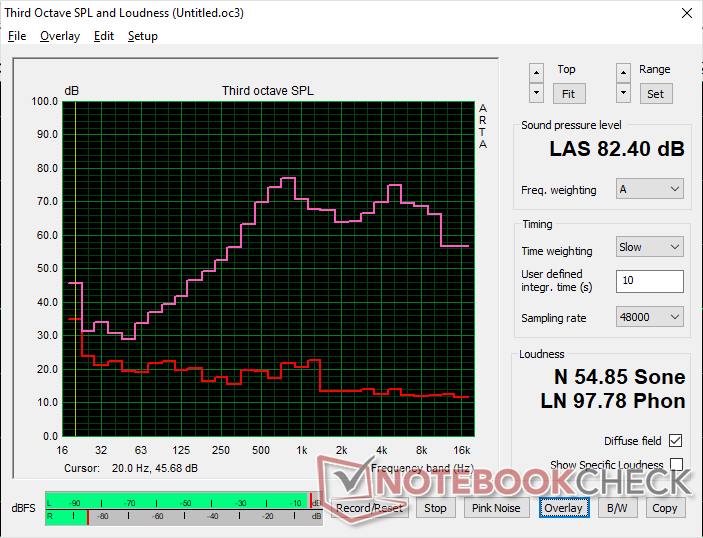
Uniwill GM6PX7X RTX 4070 ljudanalys
(+) | högtalare kan spela relativt högt (82.4 dB)
Bas 100 - 315 Hz
(-) | nästan ingen bas - i genomsnitt 18.6% lägre än medianen
(+) | basen är linjär (6.4% delta till föregående frekvens)
Mellan 400 - 2000 Hz
(+) | balanserad mellan - endast 4.4% från medianen
(±) | linjäriteten för mids är genomsnittlig (8.4% delta till föregående frekvens)
Högsta 2 - 16 kHz
(+) | balanserade toppar - endast 2.9% från medianen
(+) | toppar är linjära (5.5% delta till föregående frekvens)
Totalt 100 - 16 000 Hz
(±) | linjäriteten för det totala ljudet är genomsnittlig (16.8% skillnad mot median)
Jämfört med samma klass
» 44% av alla testade enheter i den här klassen var bättre, 11% liknande, 45% sämre
» Den bästa hade ett delta på 6%, genomsnittet var 18%, sämst var 132%
Jämfört med alla testade enheter
» 30% av alla testade enheter var bättre, 7% liknande, 63% sämre
» Den bästa hade ett delta på 4%, genomsnittet var 23%, sämst var 134%
Apple MacBook Pro 16 2021 M1 Pro ljudanalys
(+) | högtalare kan spela relativt högt (84.7 dB)
Bas 100 - 315 Hz
(+) | bra bas - bara 3.8% från medianen
(+) | basen är linjär (5.2% delta till föregående frekvens)
Mellan 400 - 2000 Hz
(+) | balanserad mellan - endast 1.3% från medianen
(+) | mids är linjära (2.1% delta till föregående frekvens)
Högsta 2 - 16 kHz
(+) | balanserade toppar - endast 1.9% från medianen
(+) | toppar är linjära (2.7% delta till föregående frekvens)
Totalt 100 - 16 000 Hz
(+) | det totala ljudet är linjärt (4.6% skillnad mot median)
Jämfört med samma klass
» 0% av alla testade enheter i den här klassen var bättre, 0% liknande, 100% sämre
» Den bästa hade ett delta på 5%, genomsnittet var 17%, sämst var 45%
Jämfört med alla testade enheter
» 0% av alla testade enheter var bättre, 0% liknande, 100% sämre
» Den bästa hade ett delta på 4%, genomsnittet var 23%, sämst var 134%
Energiförvaltning
Effektförbrukning
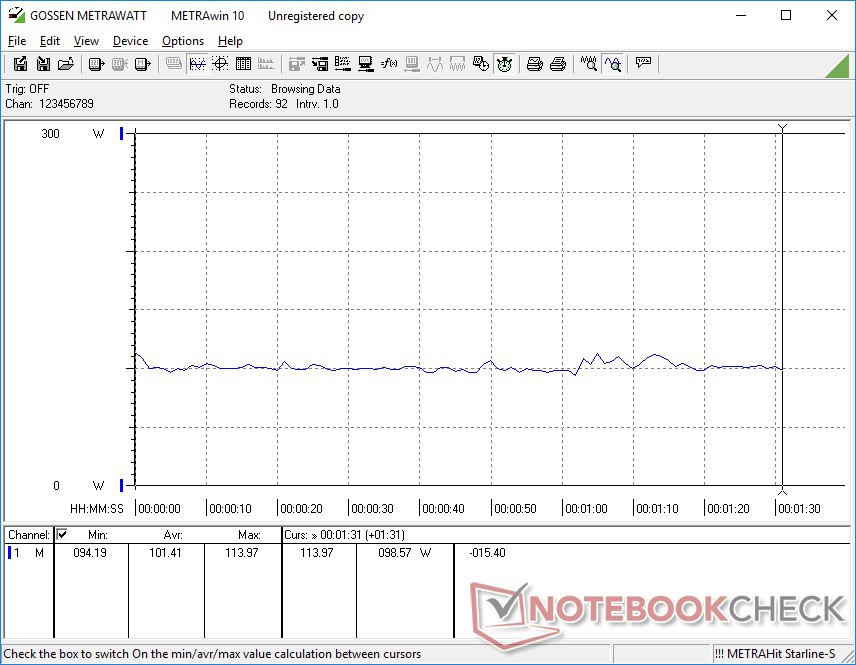
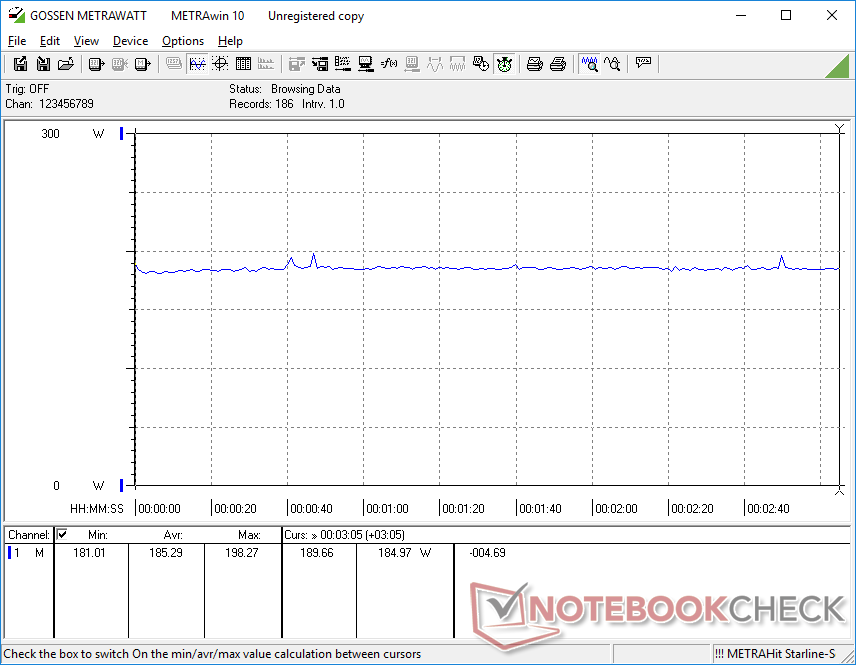
Strömförbrukningen borde vara lägre än den snabbare Neo 16 med RTX 4090 i alla fall, men det stämmer konstigt nog inte. Tomgångskörning på skrivbordet skulle kräva mellan 12 W och 32 W jämfört med bara 8 W och 28 W på den RTX 4090-drivna Neo 16. Vi dubbelkollade våra strömprofiler och inställningar för ljusstyrka men resultaten blev inte bättre.
Att köra högre belastningar som spel drar 24 till 37 procent mindre ström än Neo 16. Det mobila RTX 4070 är cirka 35 till 45 procent långsammare än det mobila RTX 4090 och därför är den lägre förbrukningen inte oväntad.
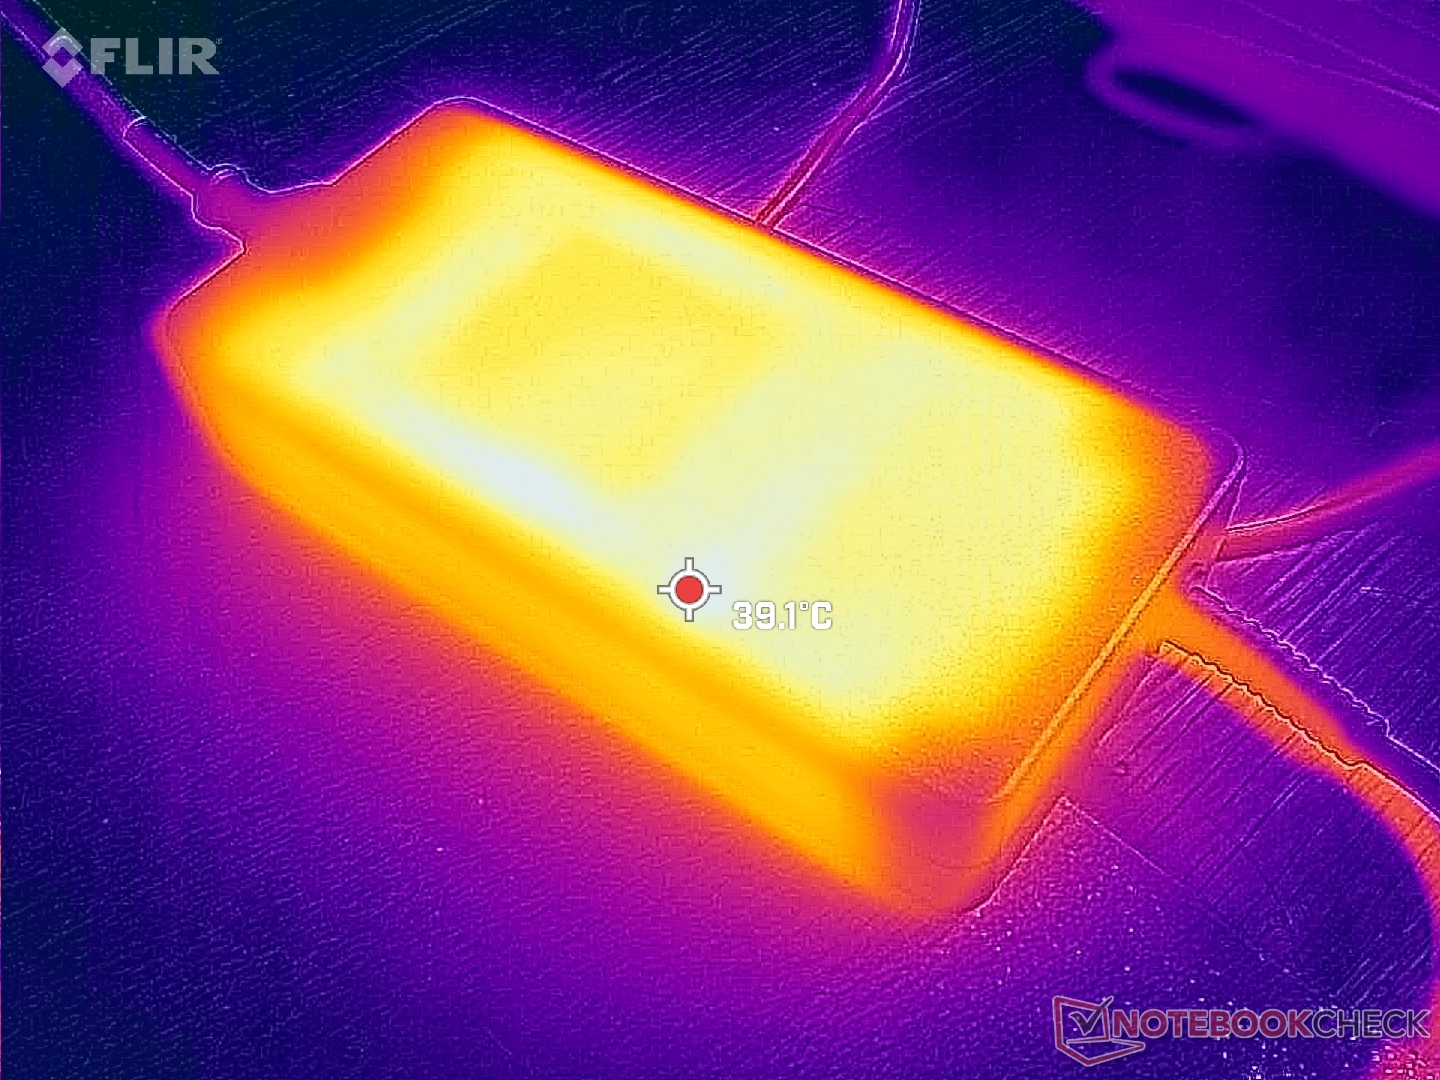
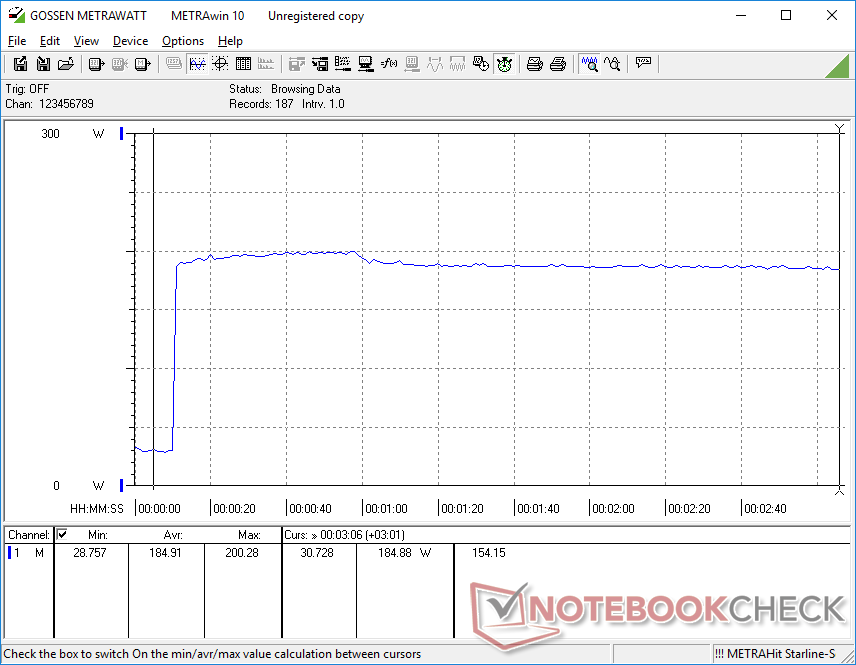
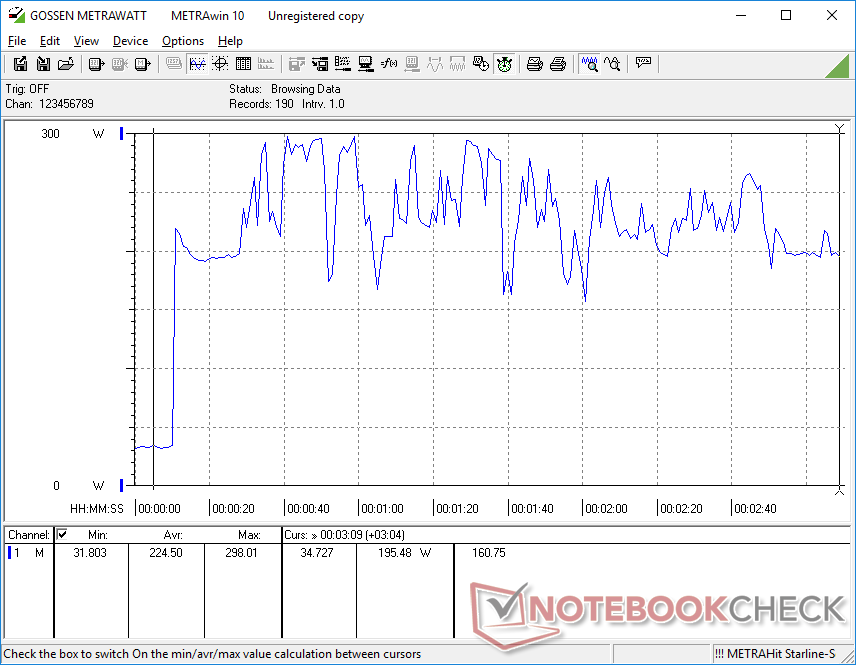
Att köra Prime95 och FurMark samtidigt skulle få förbrukningen att växla kraftigt från så lågt som 167 W upp till 298 W trots att den stora (~18 x 8,4 x 3,5 cm) nätadaptern är dimensionerad för 280 W. Förbrukningen skulle vara mycket stabilare när man upprepade det här testet på den RTX 4090-utrustade Neo 16, vilket framgår av jämförelsediagrammet nedan.
| Av/Standby | |
| Låg belastning | |
| Hög belastning |
|
Förklaring:
min: | |
| Uniwill GM6PX7X RTX 4070 i7-13700HX, GeForce RTX 4070 Laptop GPU, Samsung PM9A1 MZVL2512HCJQ, IPS, 2560x1600, 16" | Schenker XMG Neo 16 E23 i9-13900HX, GeForce RTX 4090 Laptop GPU, Crucial P5 Plus 1TB CT1000P5PSSD8, IPS, 2560x1600, 16" | Asus ROG Strix G16 G614JZ i9-13980HX, GeForce RTX 4080 Laptop GPU, WD PC SN560 SDDPNQE-1T00, IPS, 2560x1600, 16" | Lenovo Legion Pro 7 16IRX8H i9-13900HX, GeForce RTX 4080 Laptop GPU, Samsung PM9A1 MZVL21T0HCLR, IPS, 2560x1600, 16" | Gigabyte AERO 16 OLED BSF i9-13900H, GeForce RTX 4070 Laptop GPU, Gigabyte AG470S1TB-SI B10, OLED, 3840x2400, 16" | Razer Blade 16 Early 2023 i9-13950HX, GeForce RTX 4080 Laptop GPU, SSSTC CA6-8D1024, IPS, 2560x1600, 16" | |
|---|---|---|---|---|---|---|
| Power Consumption | -13% | -5% | -26% | 19% | -25% | |
| Idle Minimum * (Watt) | 12.6 | 8 37% | 10 21% | 18 -43% | 11.8 6% | 15.2 -21% |
| Idle Average * (Watt) | 17.7 | 18 -2% | 16 10% | 24 -36% | 16.1 9% | 22.8 -29% |
| Idle Maximum * (Watt) | 31.8 | 28 12% | 27 15% | 32 -1% | 17 47% | 49.8 -57% |
| Load Average * (Watt) | 101.4 | 133 -31% | 129 -27% | 130 -28% | 100.6 1% | 121.2 -20% |
| Witcher 3 ultra * (Watt) | 185.3 | 294 -59% | 247 -33% | 260 -40% | 158 15% | 242 -31% |
| Load Maximum * (Watt) | 298 | 399 -34% | 342 -15% | 320 -7% | 192 36% | 273.7 8% |
* ... mindre är bättre
Power Consumption Witcher 3 / Stresstest
Power Consumption external Monitor
Batteritid
Batterikapaciteten är en tredjedel mindre än på Neo 16 med RTX 4090-drift, vilket innebär en kortare batteritid för WLAN på cirka 4 timmar. De flesta andra bärbara 16-tums gamingdatorer har större batterikapacitet och körtider i jämförelse.
Laddning från tom till full kapacitet tar knappt två timmar. Ingen av våra USB-C-laddare kan ladda den bärbara datorn.
| Uniwill GM6PX7X RTX 4070 i7-13700HX, GeForce RTX 4070 Laptop GPU, 62 Wh | Schenker XMG Neo 16 E23 i9-13900HX, GeForce RTX 4090 Laptop GPU, 99 Wh | Asus ROG Strix G16 G614JZ i9-13980HX, GeForce RTX 4080 Laptop GPU, 90 Wh | Lenovo Legion Pro 7 16IRX8H i9-13900HX, GeForce RTX 4080 Laptop GPU, 99.9 Wh | Gigabyte AERO 16 OLED BSF i9-13900H, GeForce RTX 4070 Laptop GPU, 88 Wh | Razer Blade 16 Early 2023 i9-13950HX, GeForce RTX 4080 Laptop GPU, 95.2 Wh | |
|---|---|---|---|---|---|---|
| Batteridrifttid | 68% | 142% | 27% | 88% | 53% | |
| WiFi v1.3 (h) | 4 | 6.7 68% | 9.7 142% | 5.1 27% | 7.5 88% | 6.1 53% |
| H.264 (h) | 5.8 | 7.4 | ||||
| Witcher 3 ultra (h) | 1.4 | |||||
| Load (h) | 1.1 | 2.1 | 2.1 | 1.4 | ||
| Reader / Idle (h) | 6.4 | 8.9 |
För
Emot
Dom
Uniwill GM6PX7X är en solid 16-tums bärbar dator för gaming, även om den inte utmärker sig i någon särskild kategori. Systemet är lätt, till exempel, men den Gigabyte Aero 16 är ännu lättare. Färgtäckningen närmar sig 100 procent sRGB, men ännu djupare P3-färger finns tillgängliga påAsus ROG Strix G16 ellerRazer Blade 16. Grafikprestanda är bra för storleken, men bristen på Advanced Optimus eller G-Sync-stöd på den interna skärmen är en nagel i ögat. Zonbaserad RGB-bakgrundsbelysning stöds, men RGB-belysning per tangent är knuten till en valfri Cherry mekanisk uppgradering. Samtidigt innebär konfigurering med den snabbare GeForce RTX 4080 eller 4090 ett tjockare och tyngre chassi som förnekar en av de viktigaste fördelarna med Uniwills GM6PX7X-design. Det finns inga anmärkningsvärda svagheter eller utmärkande egenskaper hos Uniwill vilket ger det en känsla av konsekvens som vissa spelare kan uppskatta.
Uniwill GM6PX7X är en bärbar dator utan krusiduller som är över genomsnittet i de flesta kategorier, men den saknar den kraft eller den iögonfallande funktion som hjälper den att sticka ut från mängden.
Vi kan ändå berömma modellen för dess fullstora numpad och piltangenter och det sällsynta stödet för en extern vattenkylare som tillval. Samma tangentbordstangenter tenderar att vara mindre och mer trånga på andra bärbara speldatorer. Entusiaster kanske vill överväga de mer avancerade RTX 4080- eller 4090-SKU:erna för att bättre utnyttja den valfria vattenkylningen.
Pris och tillgänglighet
Uniwill GM6PX7X levereras nu under flera olika namn och priser beroende på region. Schenker erbjuder till exempel chassit under varumärket XMG Neo 16.
Uniwill GM6PX7X RTX 4070
- 03/28/2023 v7 (old)
Allen Ngo
Genomskinlighet
Valet av enheter som ska granskas görs av vår redaktion. Testprovet gavs till författaren som ett lån av tillverkaren eller återförsäljaren för denna recension. Långivaren hade inget inflytande på denna recension och inte heller fick tillverkaren en kopia av denna recension innan publiceringen. Det fanns ingen skyldighet att publicera denna recension. Som ett oberoende medieföretag är Notebookcheck inte föremål för auktoritet från tillverkare, återförsäljare eller förlag.
This is how Notebookcheck is testingEvery year, Notebookcheck independently reviews hundreds of laptops and smartphones using standardized procedures to ensure that all results are comparable. We have continuously developed our test methods for around 20 years and set industry standards in the process. In our test labs, high-quality measuring equipment is utilized by experienced technicians and editors. These tests involve a multi-stage validation process. Our complex rating system is based on hundreds of well-founded measurements and benchmarks, which maintains objectivity.
Price comparison

