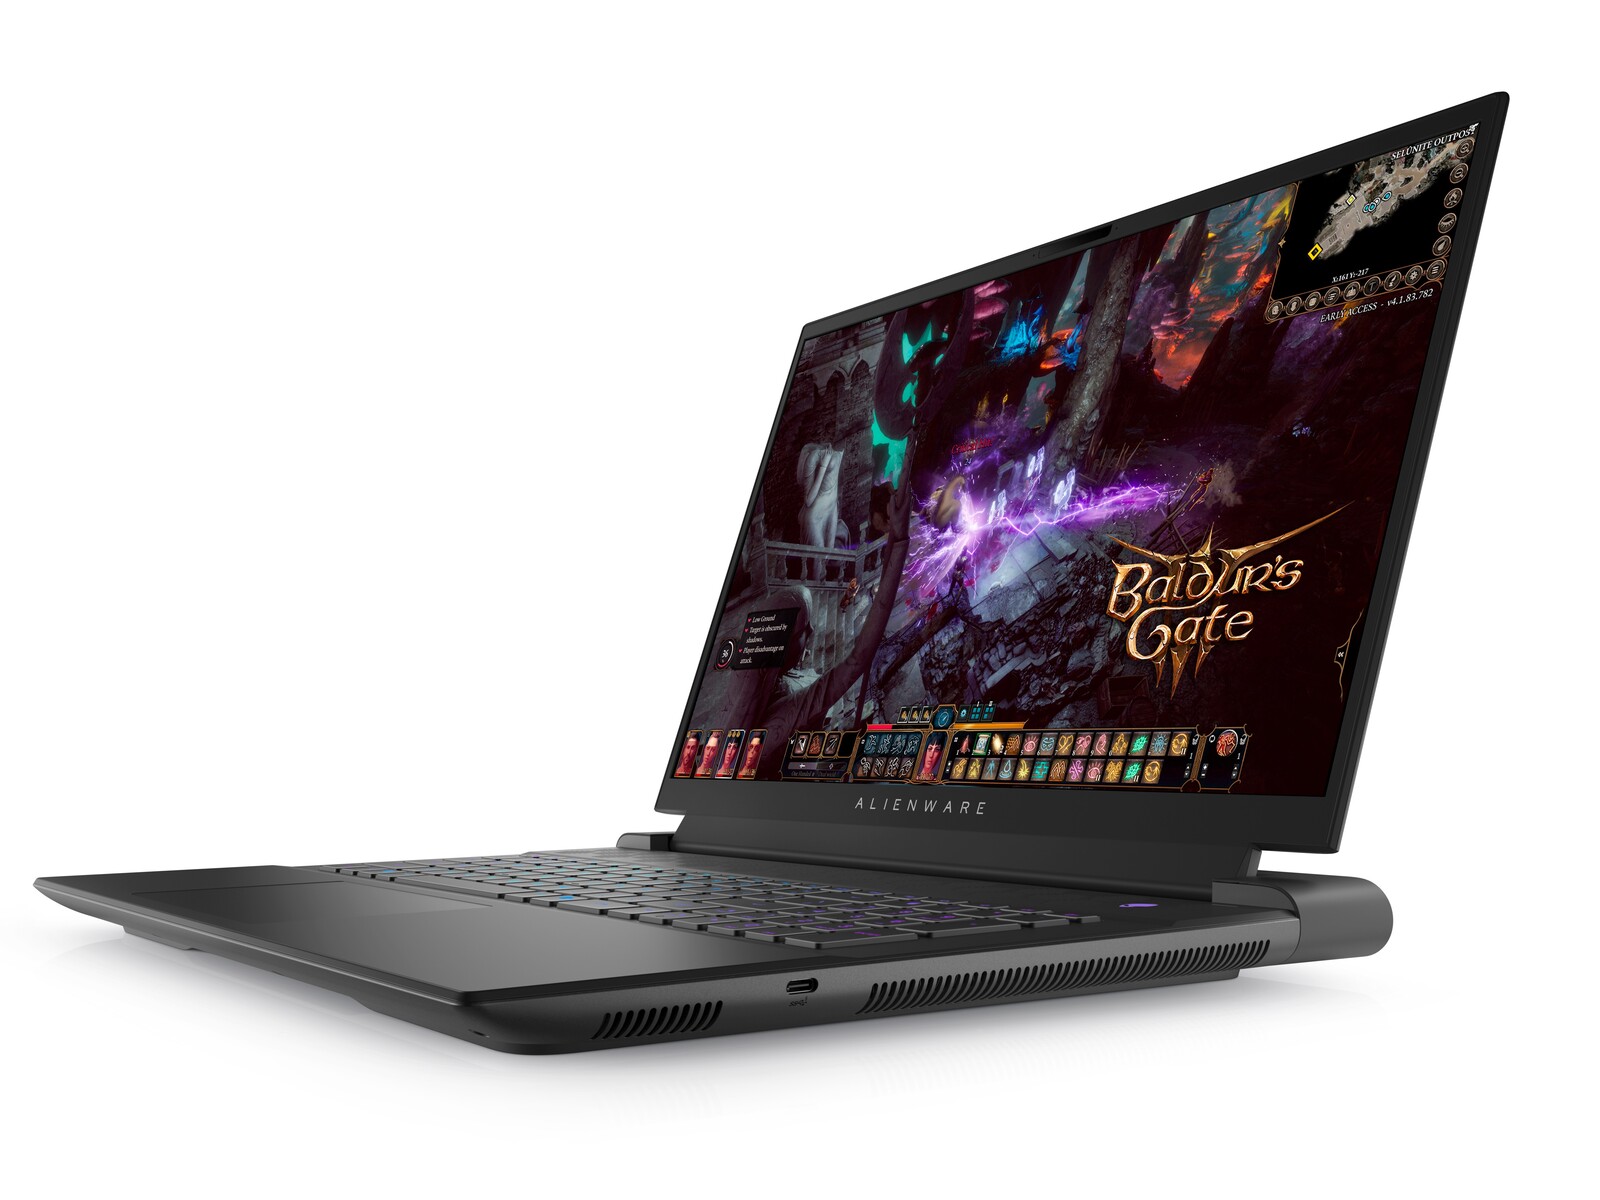
Alienware m18 R1 laptop recension: Större och tyngre än MSI Titan GT77
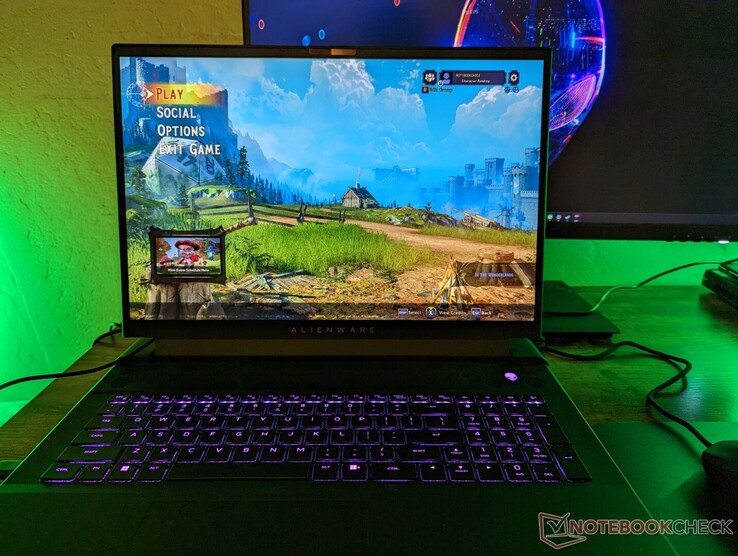
Avslöjades tidigare i år tillsammans med den mobila Intel Raptor Lake-H-serien och den mobila Ada Lovelace GeForce RTX 40-serien, är flaggskeppet Alienware m18 R1 den första 18-tumsmodellen i familjen sedan 2013. Mycket har förstås förändrats sedan dess, men prestandajägare som vill ha något större än den vanliga 17-tumslösningen kan finna mycket att gilla i en 18-tums formfaktor där funktioner och termik kan maximeras.
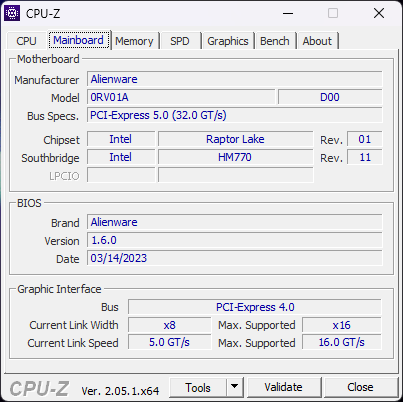
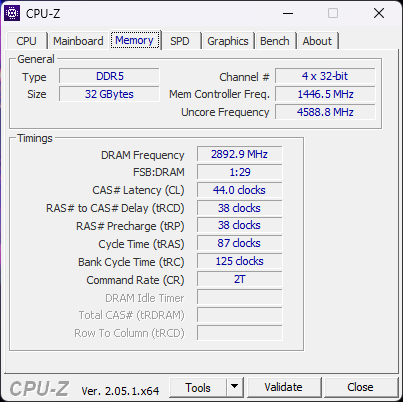
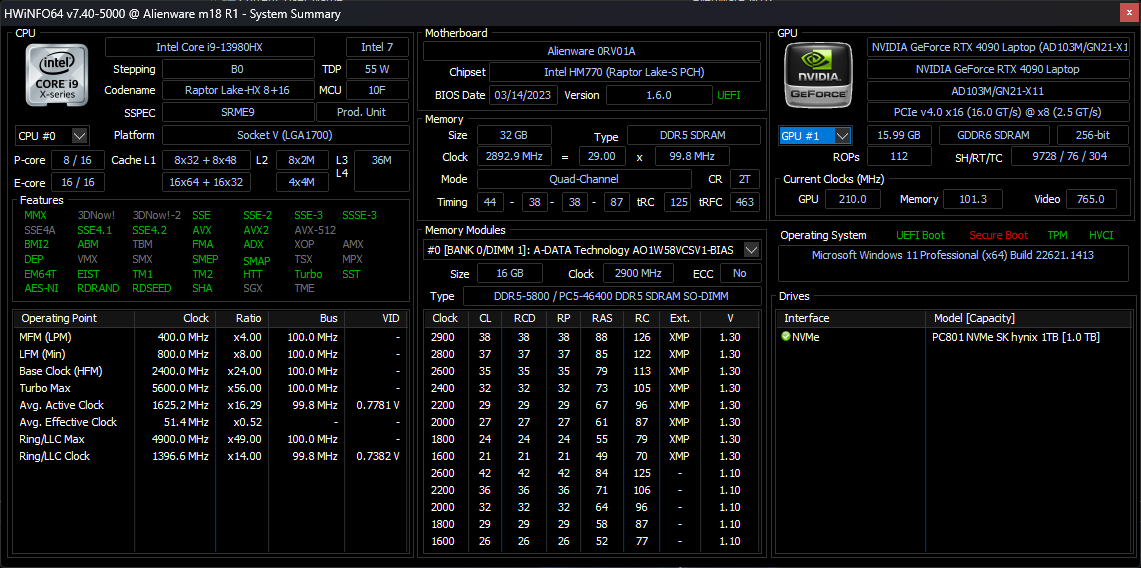
Vår konfiguration i recensionen är en högre specifikation med 13th gen Core i9-13980HX CPU, 175 W GeForce RTX 4090, membranbaserat RGB-tangentbord och 1200p 480 Hz IPS-skärm för cirka 2 900 USD. Andra SKU:er är tillgängliga från RTX 4060, Core i7-13700HX och 1600p 165 Hz-skärm med CherryMX ultra low-profile mekaniskt tangentbord. Alla konfigurationer har annars stöd för G-Sync och fullständiga DCI-P3-färger.
Bland de direkta konkurrenterna finns andra bärbara 18-tums gamingdatorer som t.ex Razer Blade 18 ellerAsus ROG Strix Scar 18. MSI har i skrivande stund ännu inte tillkännagivit någon ny 18-tums modell.
Fler recensioner av Dell:
Potentiella konkurrenter i jämförelse
Gradering | Datum | Modell | Vikt | Höjd | Storlek | Upplösning | Pris |
|---|---|---|---|---|---|---|---|
| 90.7 % v7 (old) | 04/2023 | Alienware m18 R1 i9-13980HX, GeForce RTX 4090 Laptop GPU | 3.9 kg | 26.7 mm | 18.00" | 1920x1200 | |
| 91.4 % v7 (old) | 02/2023 | Razer Blade 18 RTX 4070 i9-13950HX, GeForce RTX 4070 Laptop GPU | 3 kg | 21.9 mm | 18.00" | 2560x1600 | |
| 86.6 % v7 (old) | 02/2023 | Asus ROG Strix Scar 18 2023 G834JY-N6005W i9-13980HX, GeForce RTX 4090 Laptop GPU | 3.1 kg | 30.8 mm | 18.00" | 2560x1600 | |
| 88.3 % v7 (old) | 03/2023 | MSI GE78HX 13VH-070US i9-13950HX, GeForce RTX 4080 Laptop GPU | 3 kg | 23 mm | 17.00" | 2560x1600 | |
| 89.9 % v7 (old) | 03/2023 | Eluktronics Mech-17 GP2 i9-13900HX, GeForce RTX 4090 Laptop GPU | 2.9 kg | 27 mm | 17.00" | 2560x1600 | |
| 89 % v7 (old) | 02/2023 | MSI Titan GT77 HX 13VI i9-13950HX, GeForce RTX 4090 Laptop GPU | 3.5 kg | 23 mm | 17.30" | 3840x2160 |
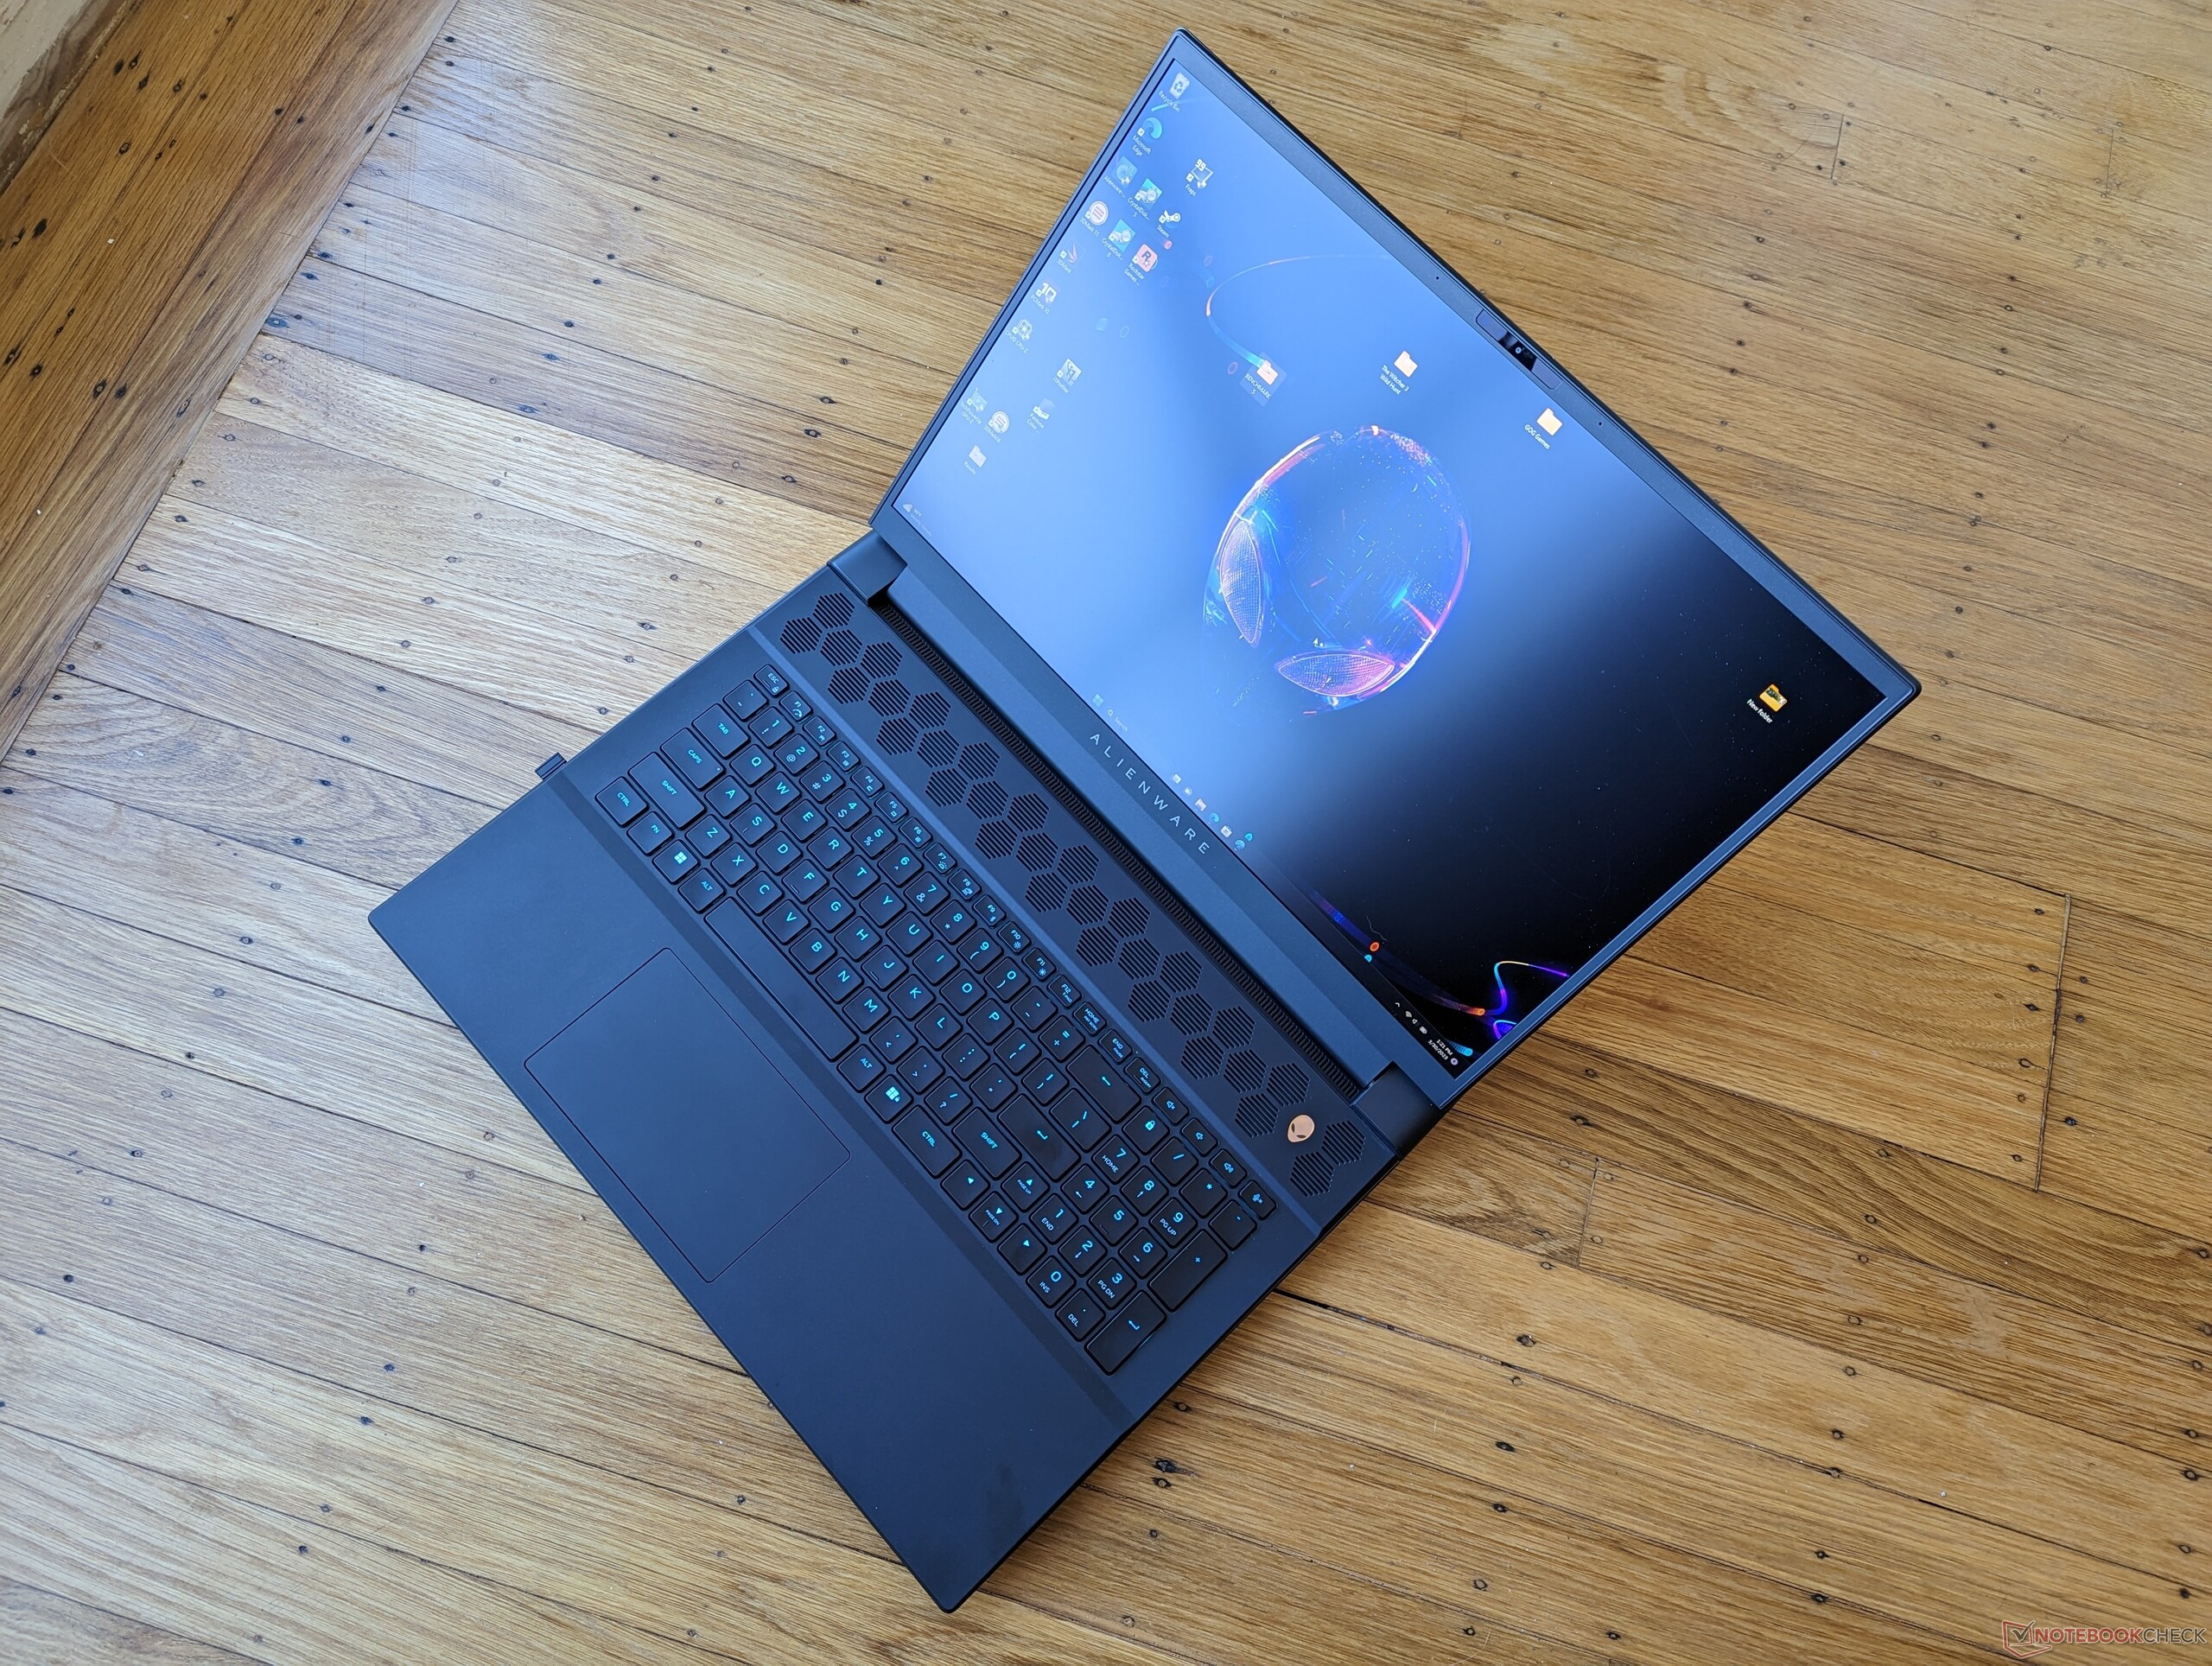
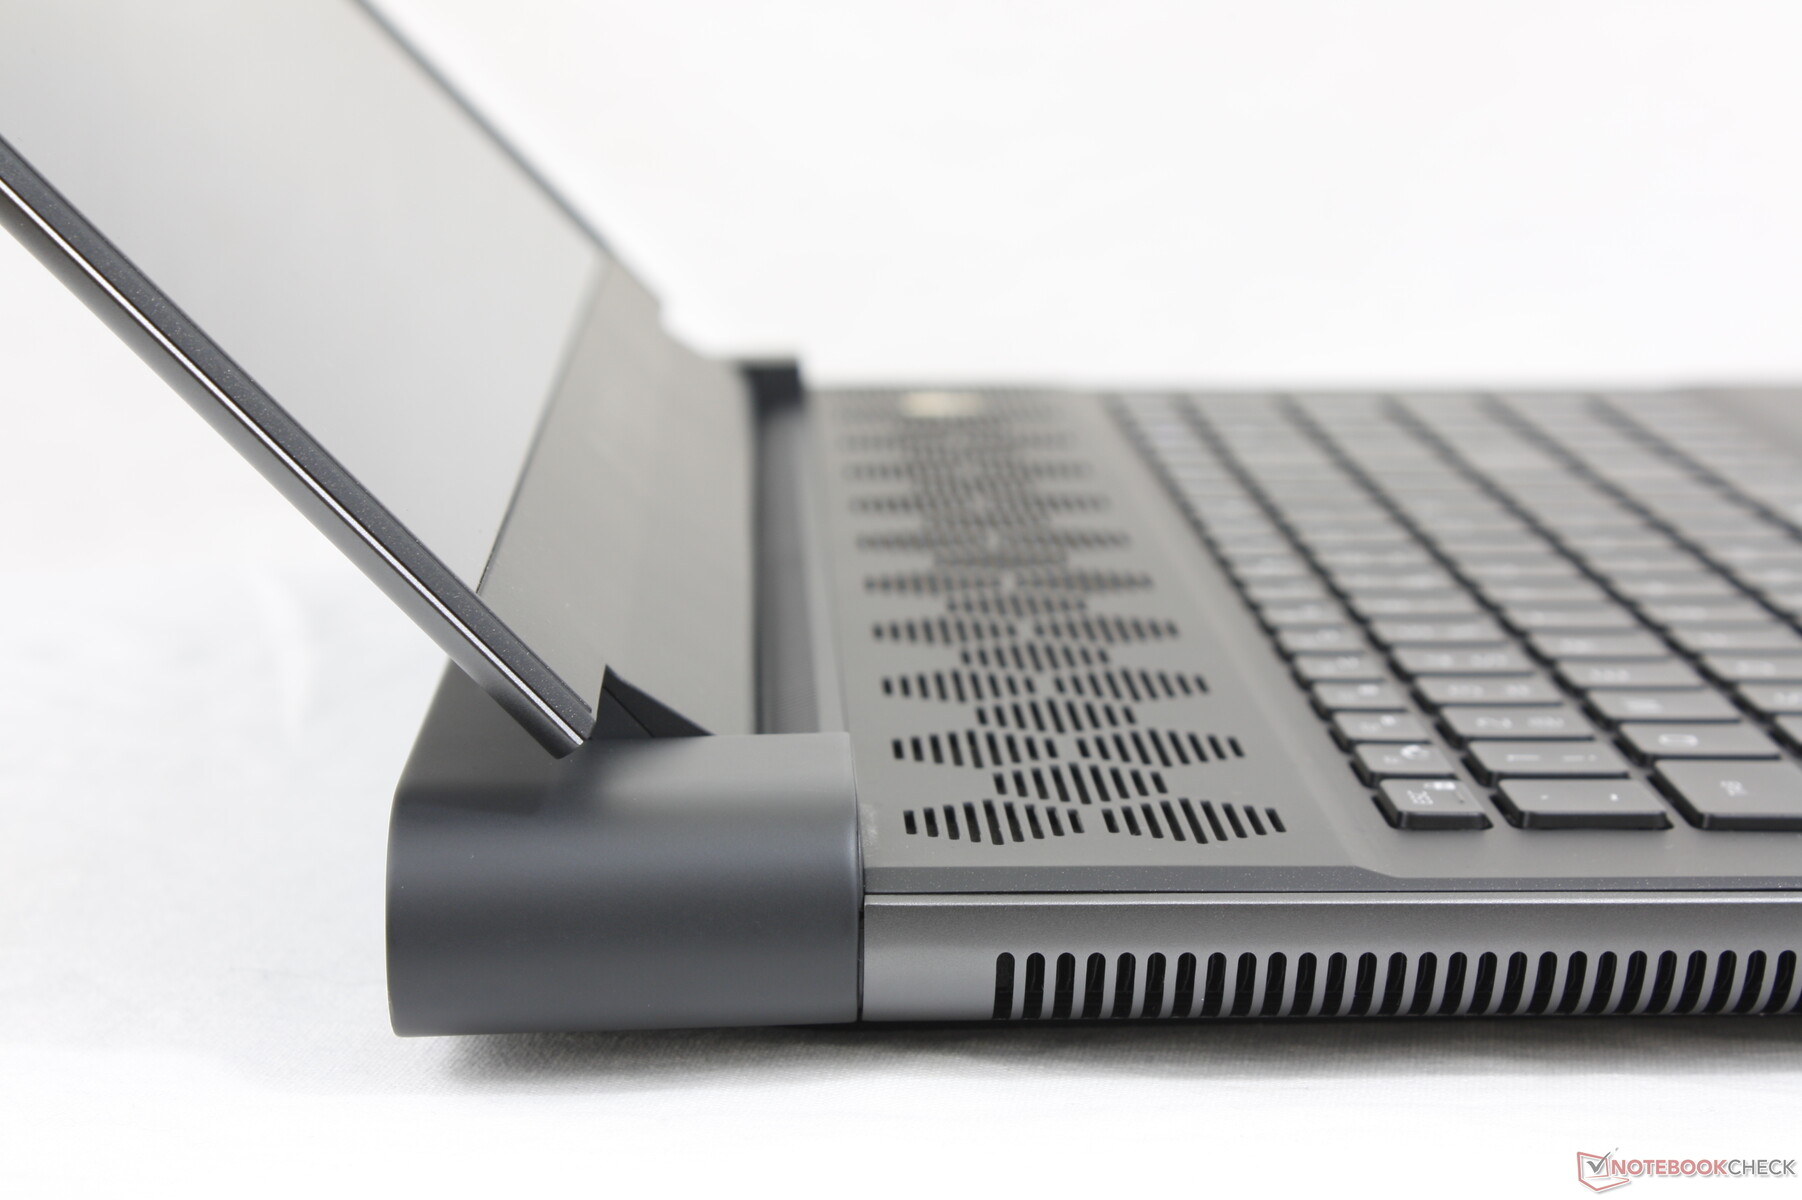
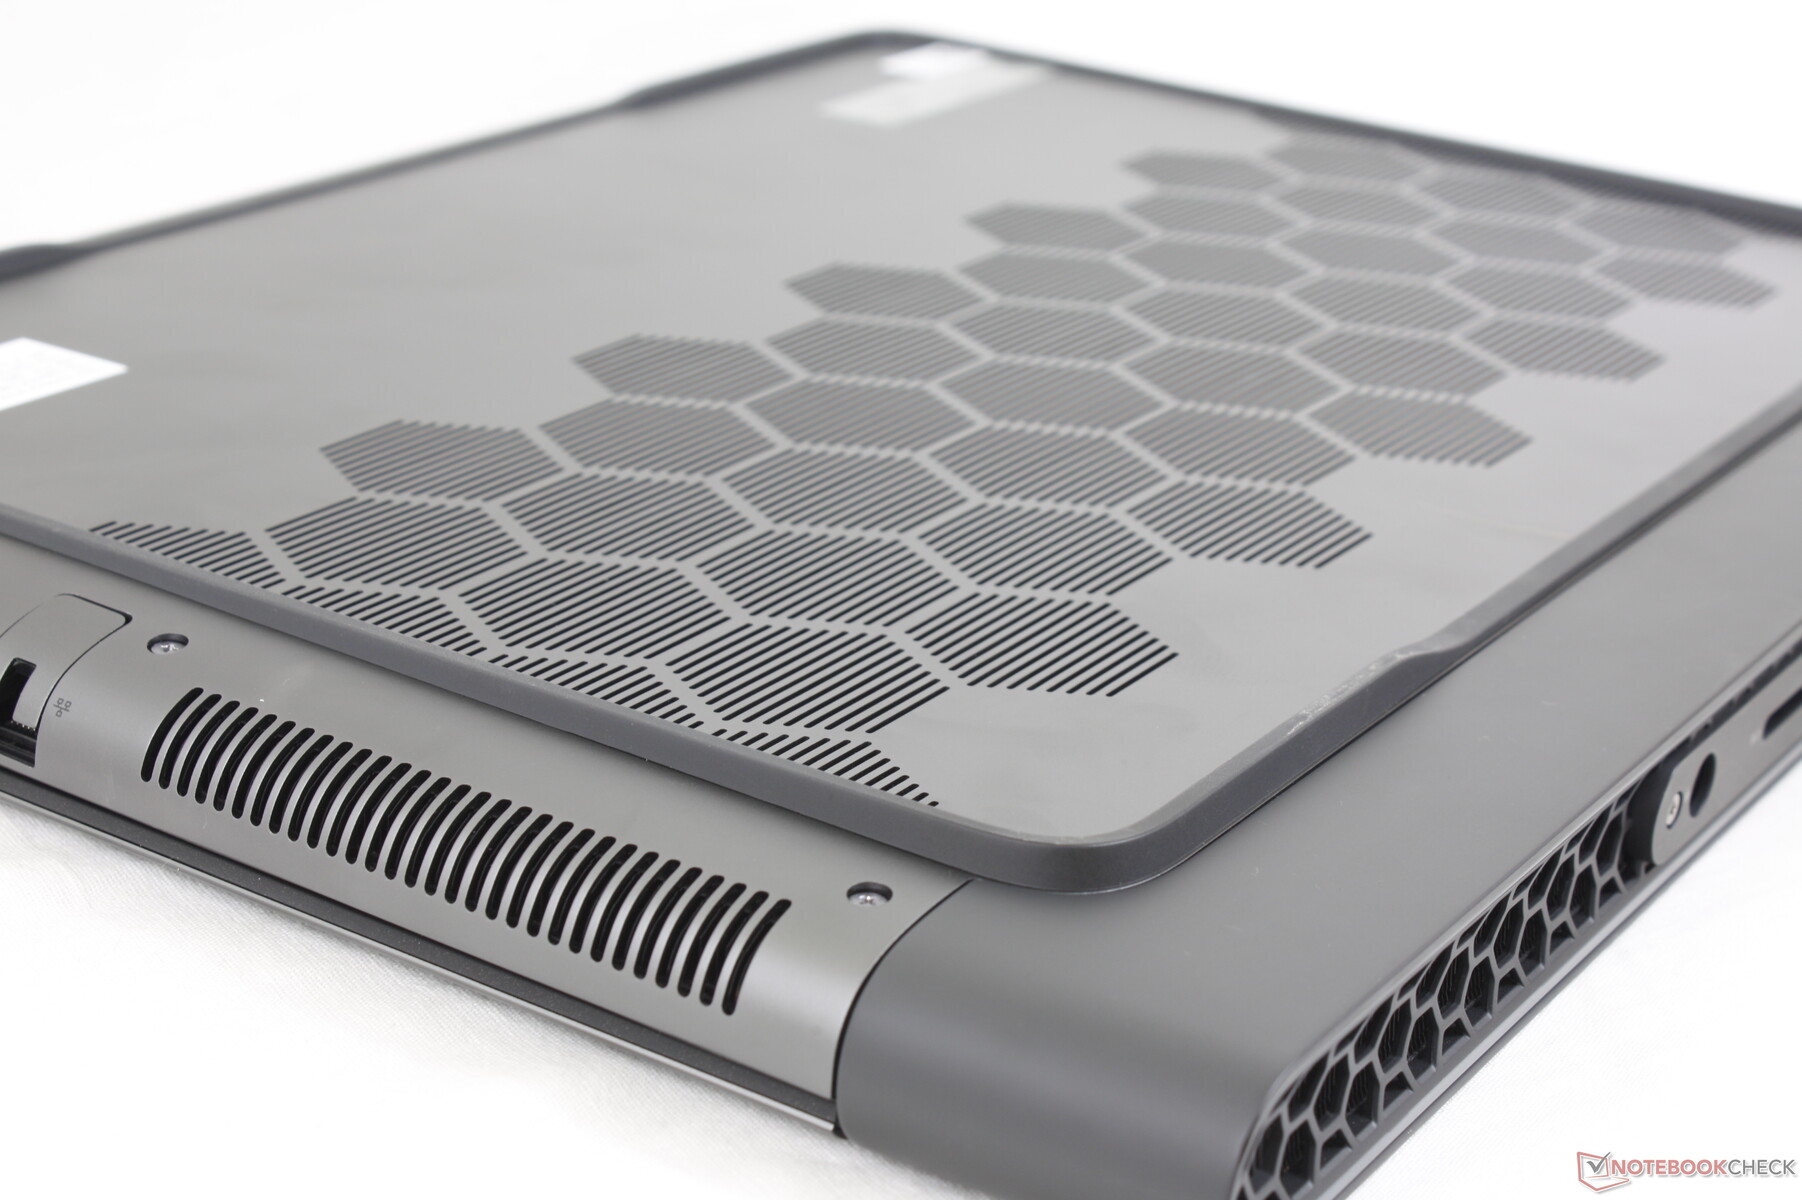
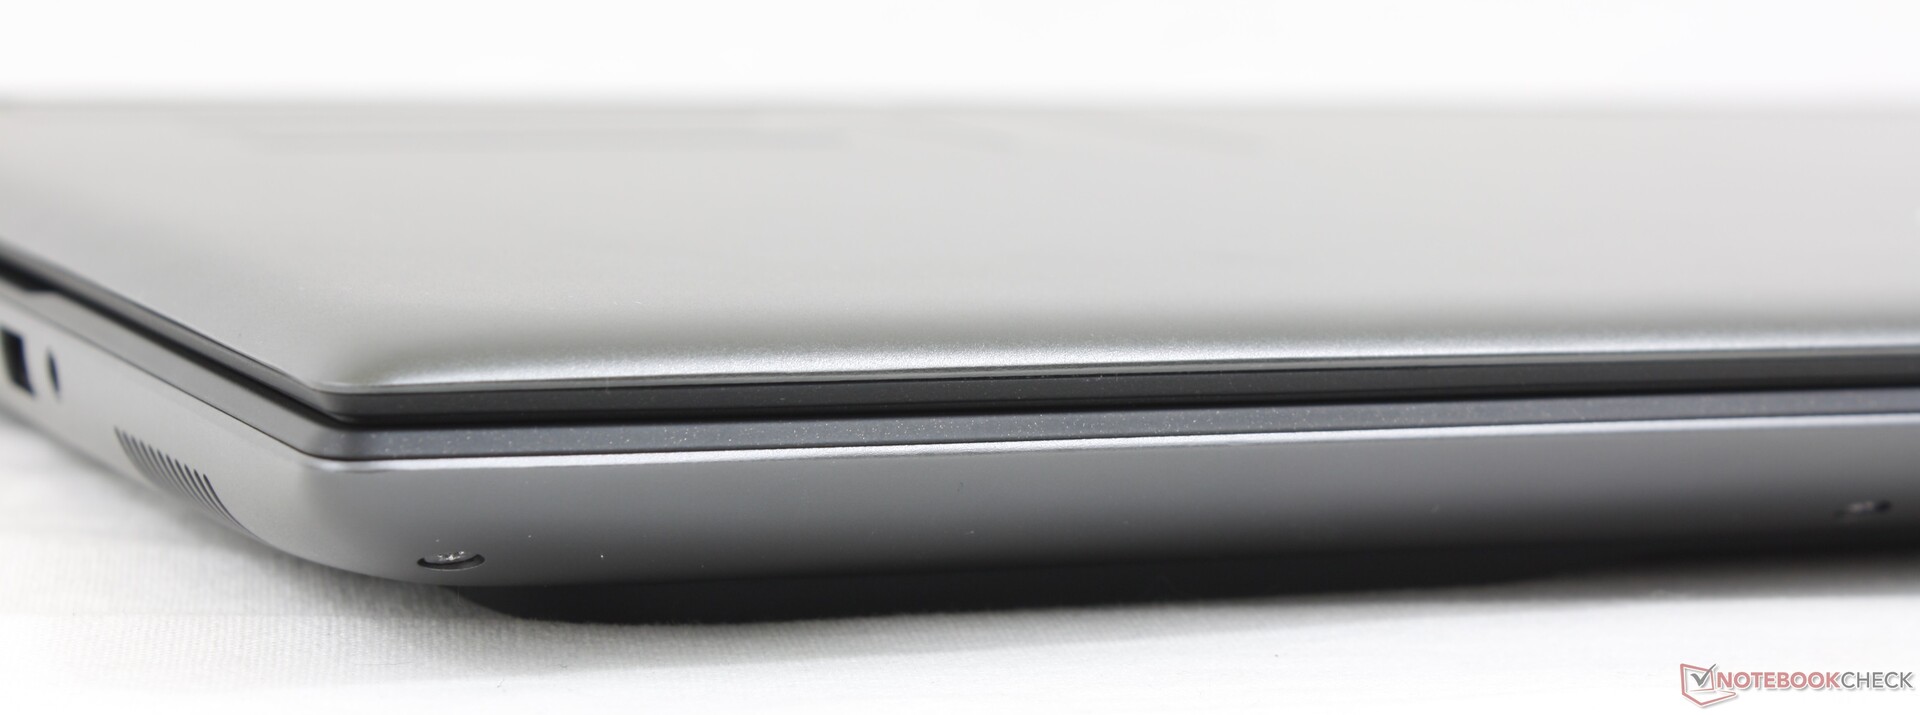
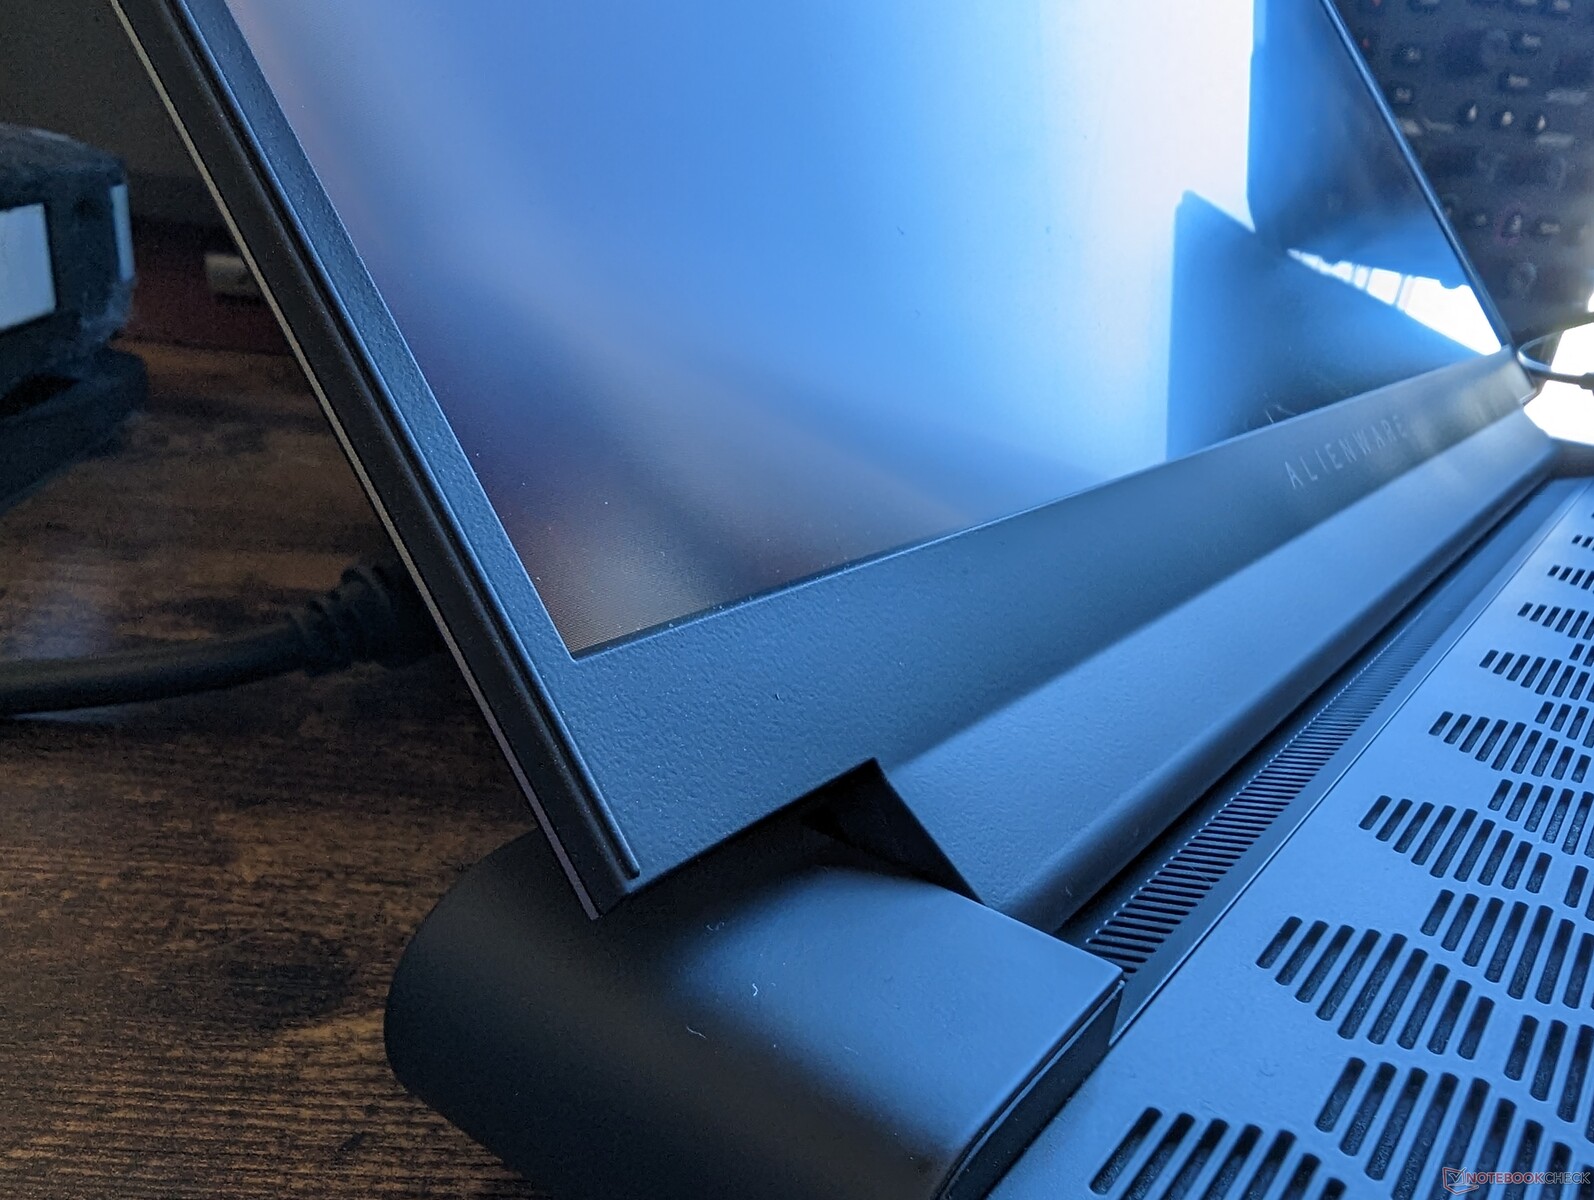
Case - Legend 3 Design
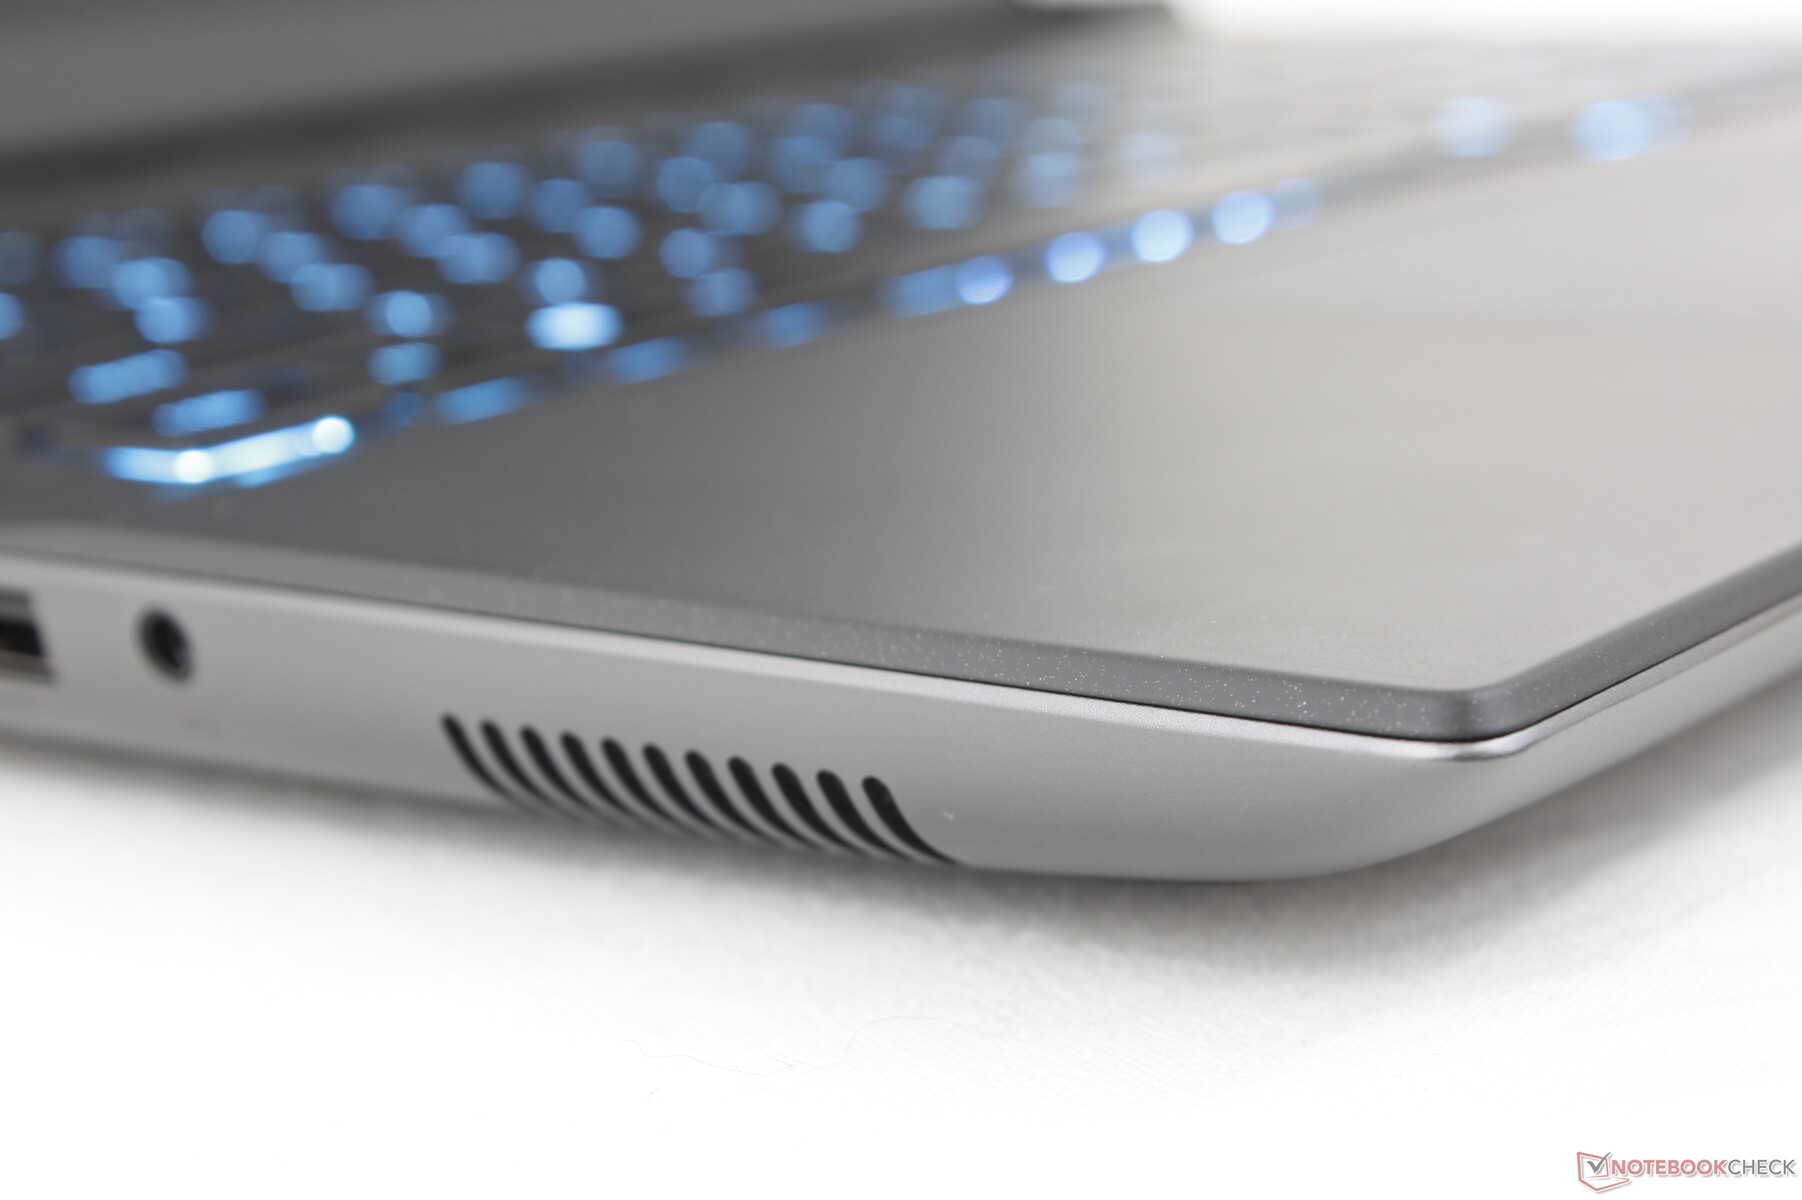
Intrycken av chassit liknar den senaste Alienware x17 R2 eftersom Alienware m18 R1 använder liknande material. Den täta konstruktionen och den snäva anpassningen mellan materialen visar att du inte behöver en unibody-design som Razer Blade 18 för att få en högkvalitativ känsla. Allt från tangentbordets mitt till det yttre locket är fastare och mer motståndskraftigt mot vridningar och nedtryckningar än på många andra bärbara datorer för spel, inklusive MSI GE78.
Det matta gummerade tangentbordsdäcket kan vara en blandad kompott eftersom det lätt samlar på sig fula fett- och fingeravtryck med tiden.
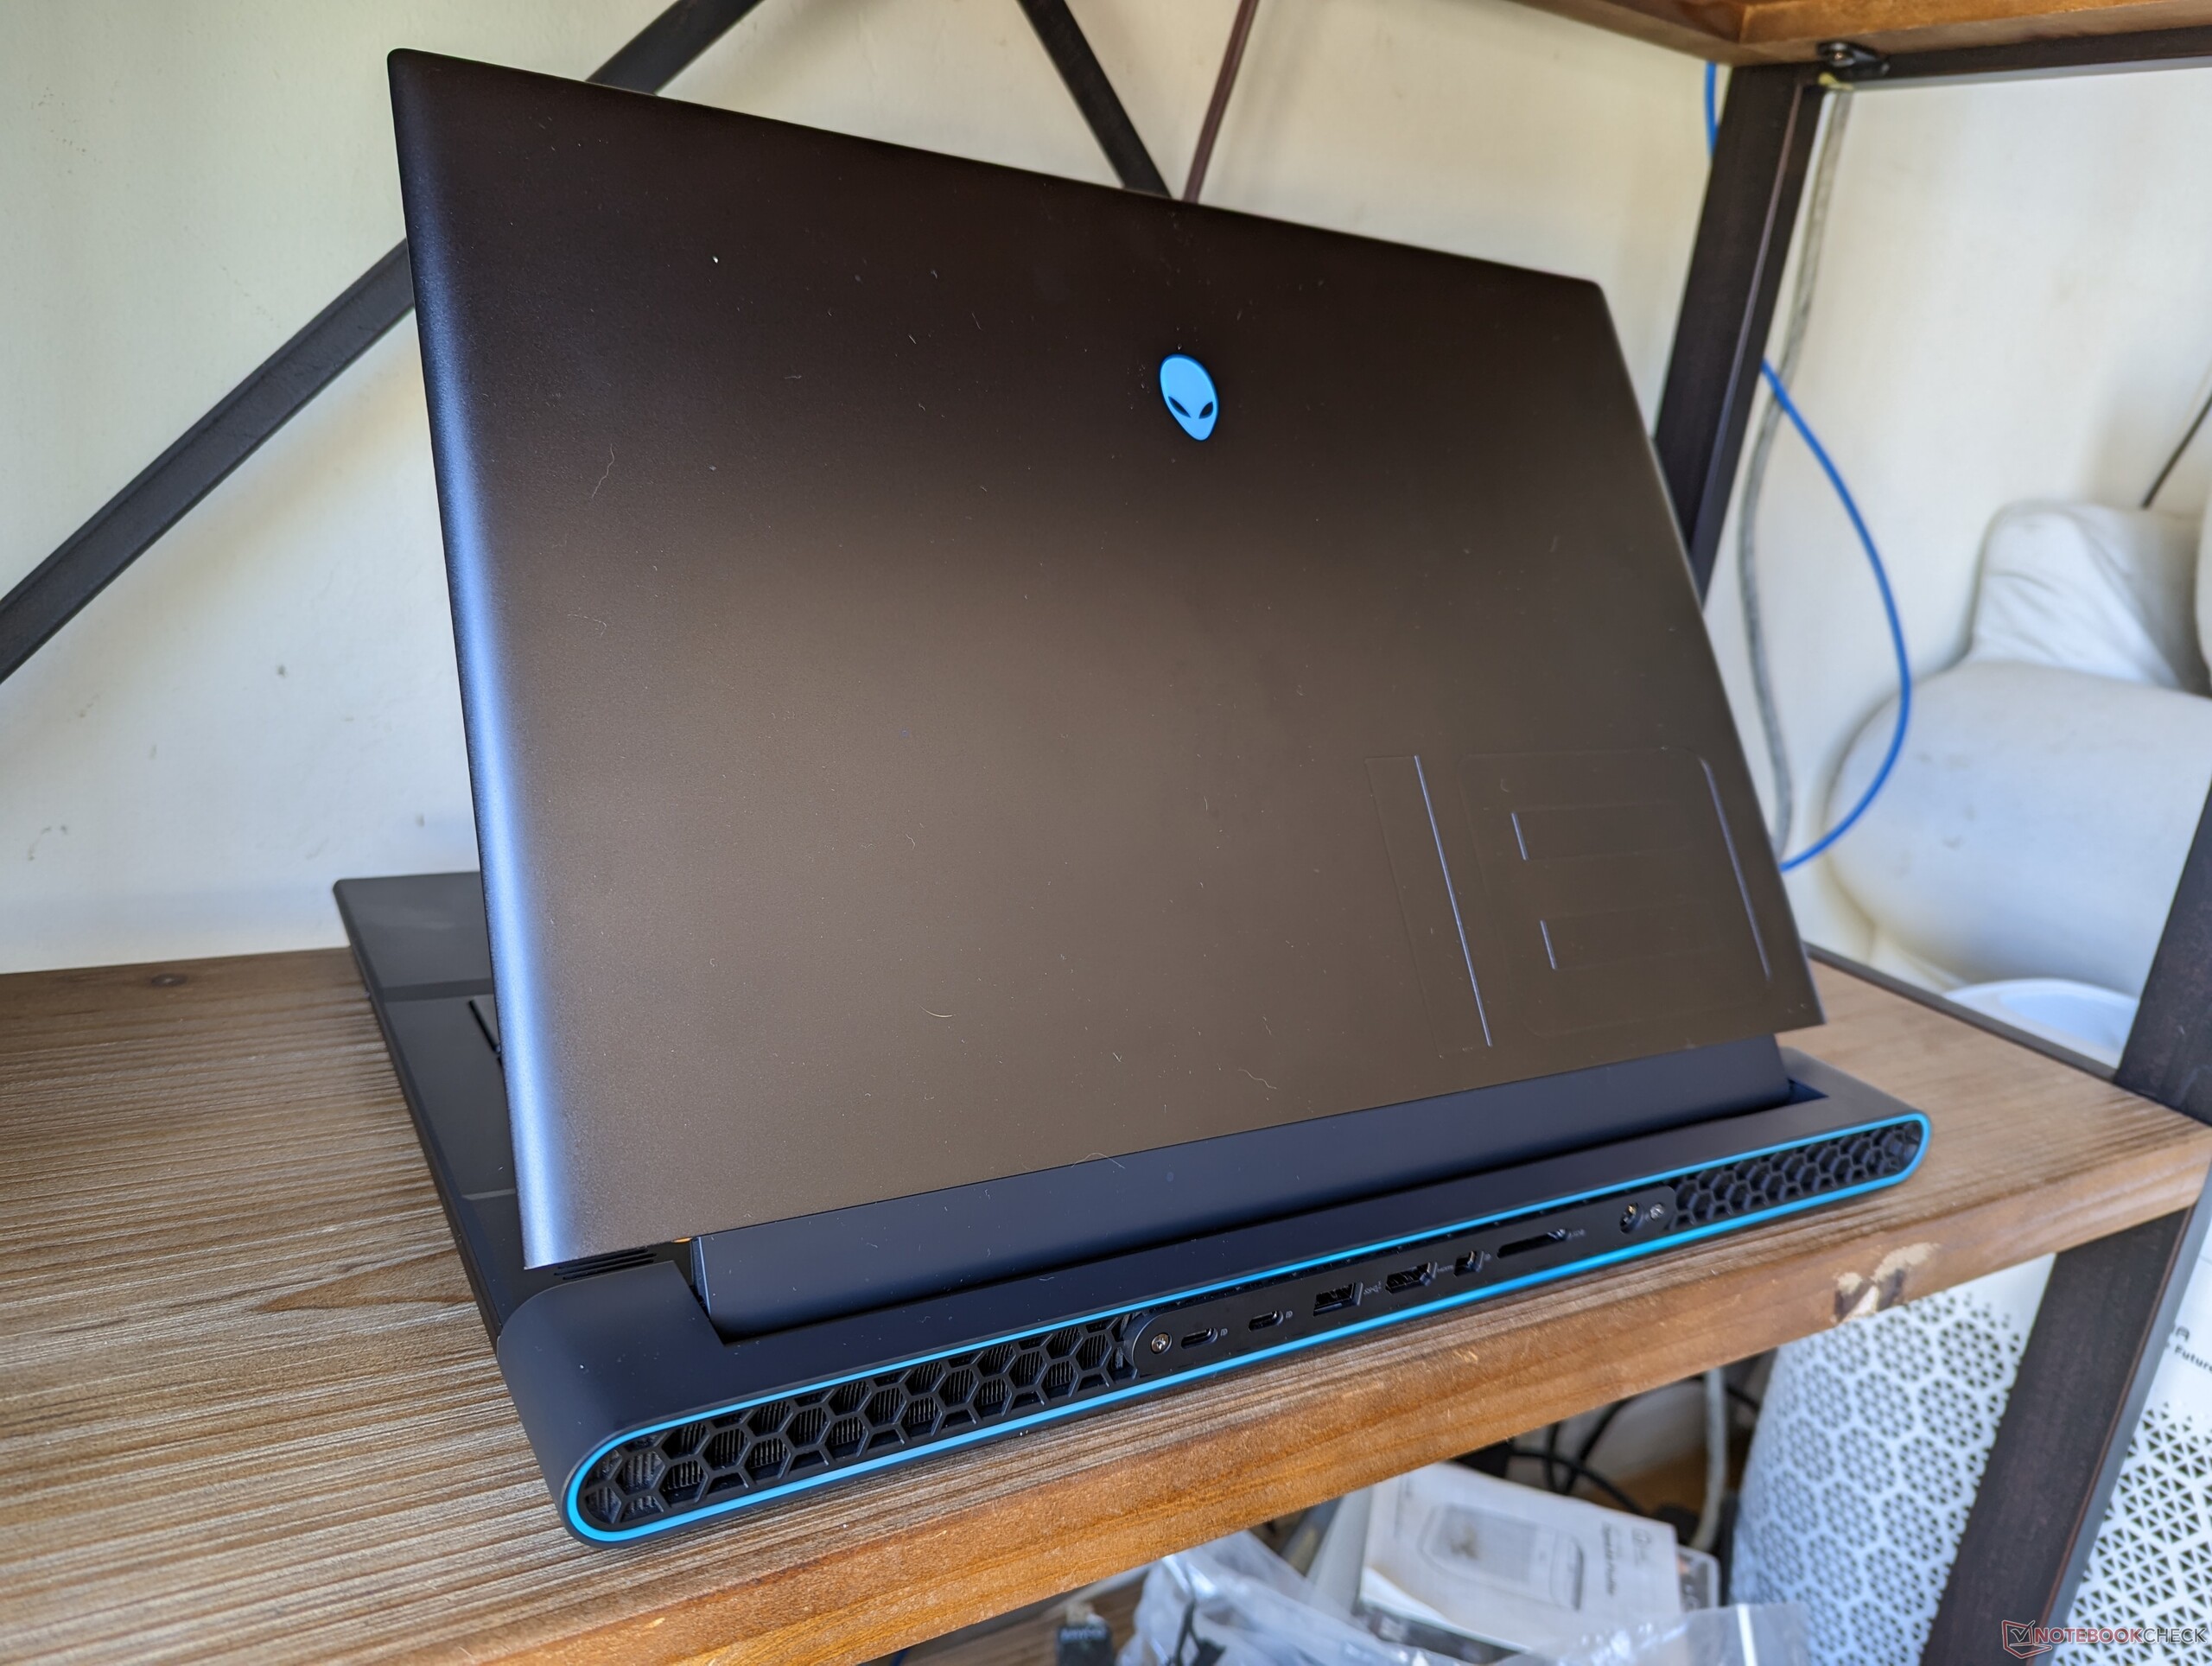
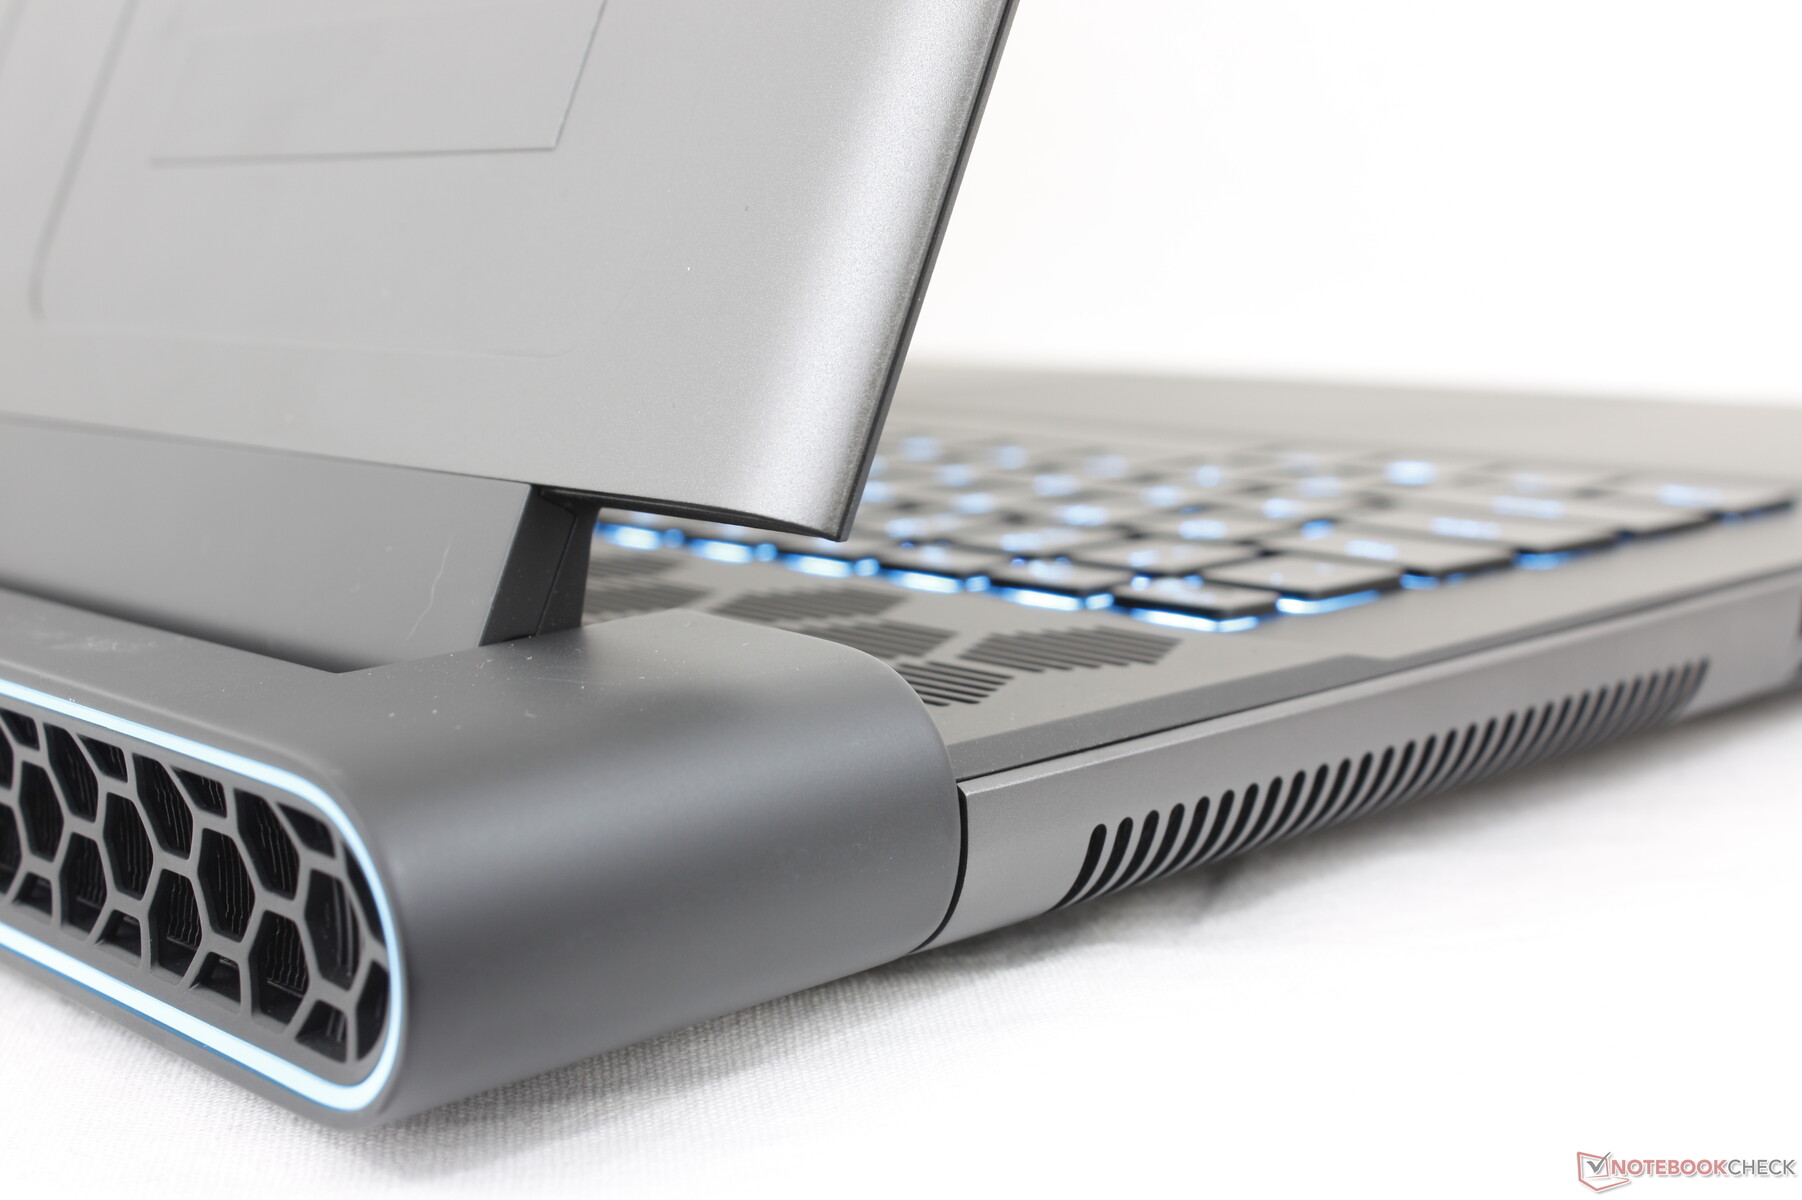
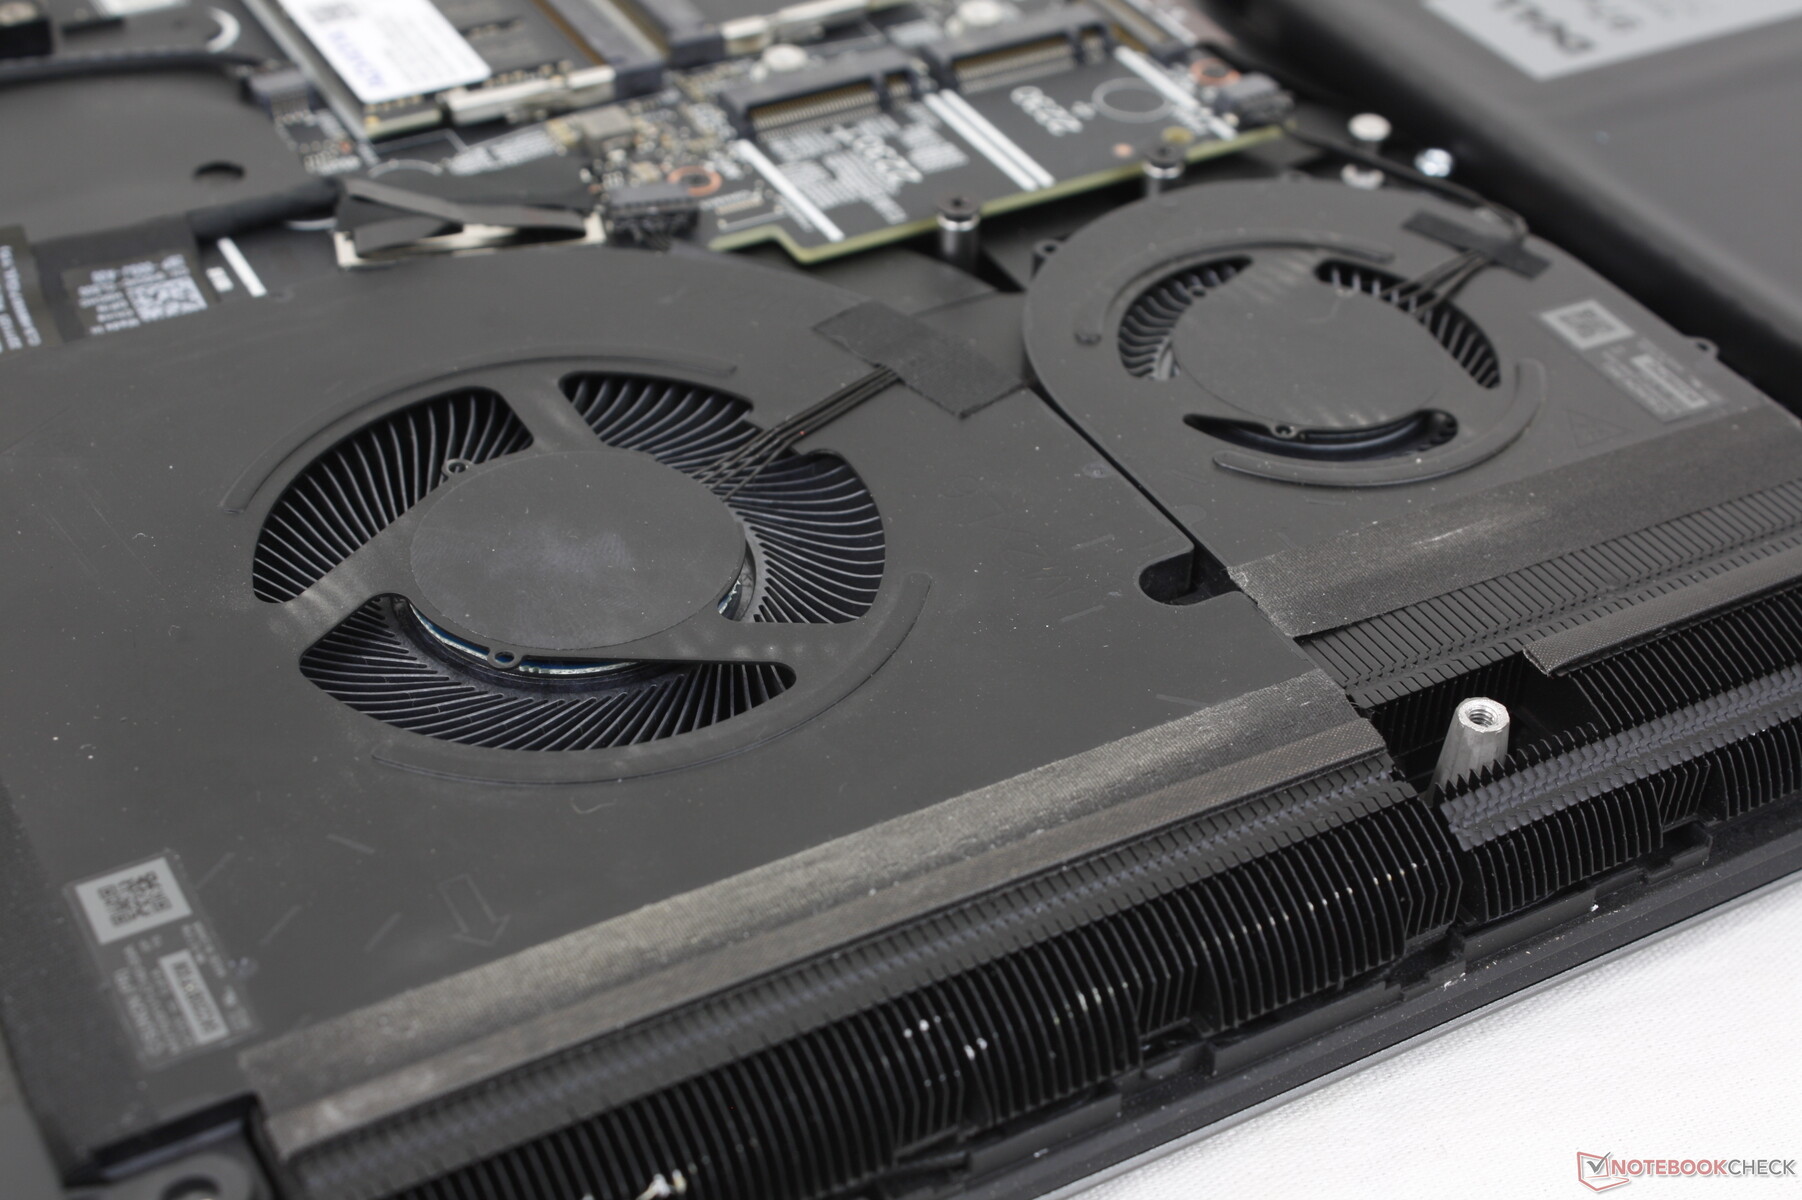
Alienware-modellen är betydligt tyngre än 18-tums Blade 18 ellerROG Strix Scar 18 med nästan ett helt kilo vardera och är därmed en av årets tyngsta bärbara datorer. Faktum är att vår leveranskurir till och med kommenterade hur tung fraktlådan var i förhållande till sin lilla storlek. En stor del av vikten kan tillskrivas den förlängda baksidan, den tjockare profilen och kylaren med ångkammare, som alla är avsedda att förbättra kylningen. Om du bryr dig om resevikten kan du överväga följande MSI Titan GT77 istället som faktiskt är lättare och tunnare än vår Alienware.
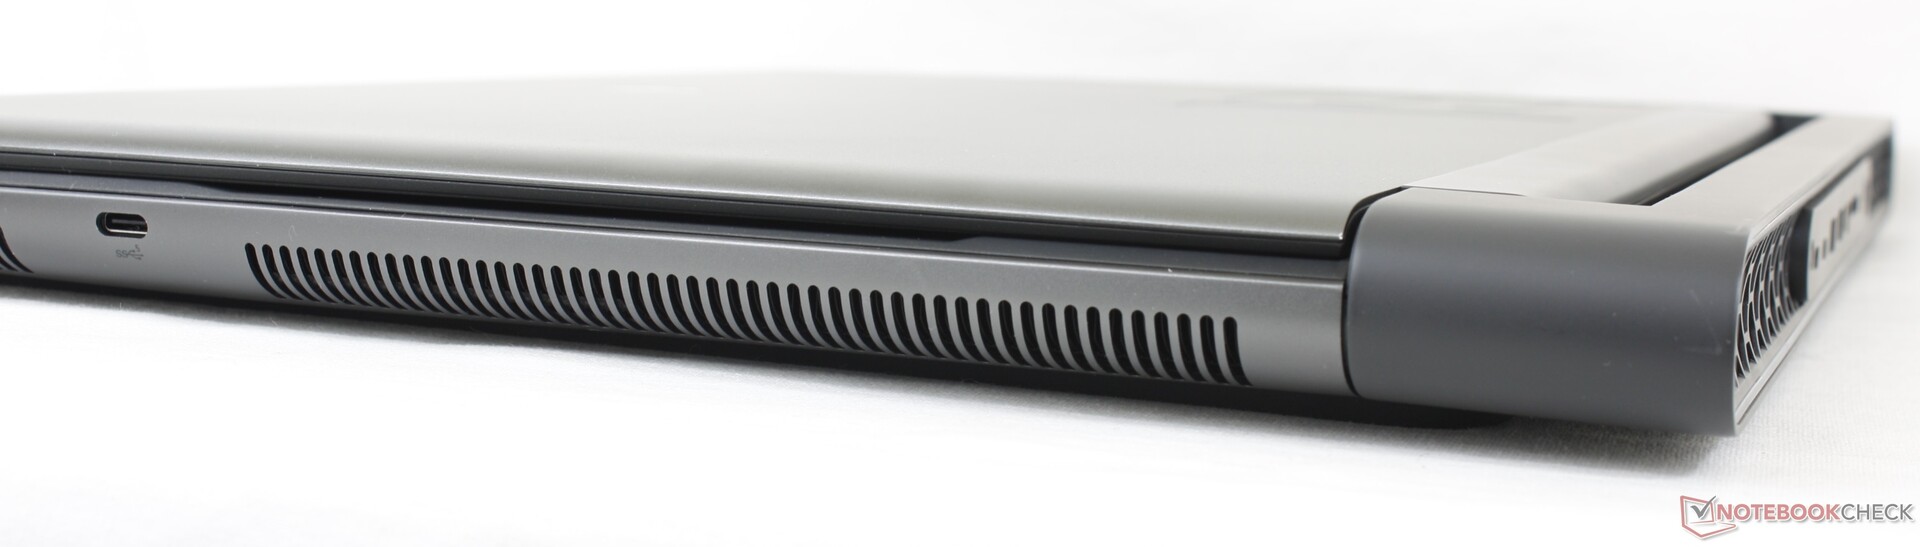
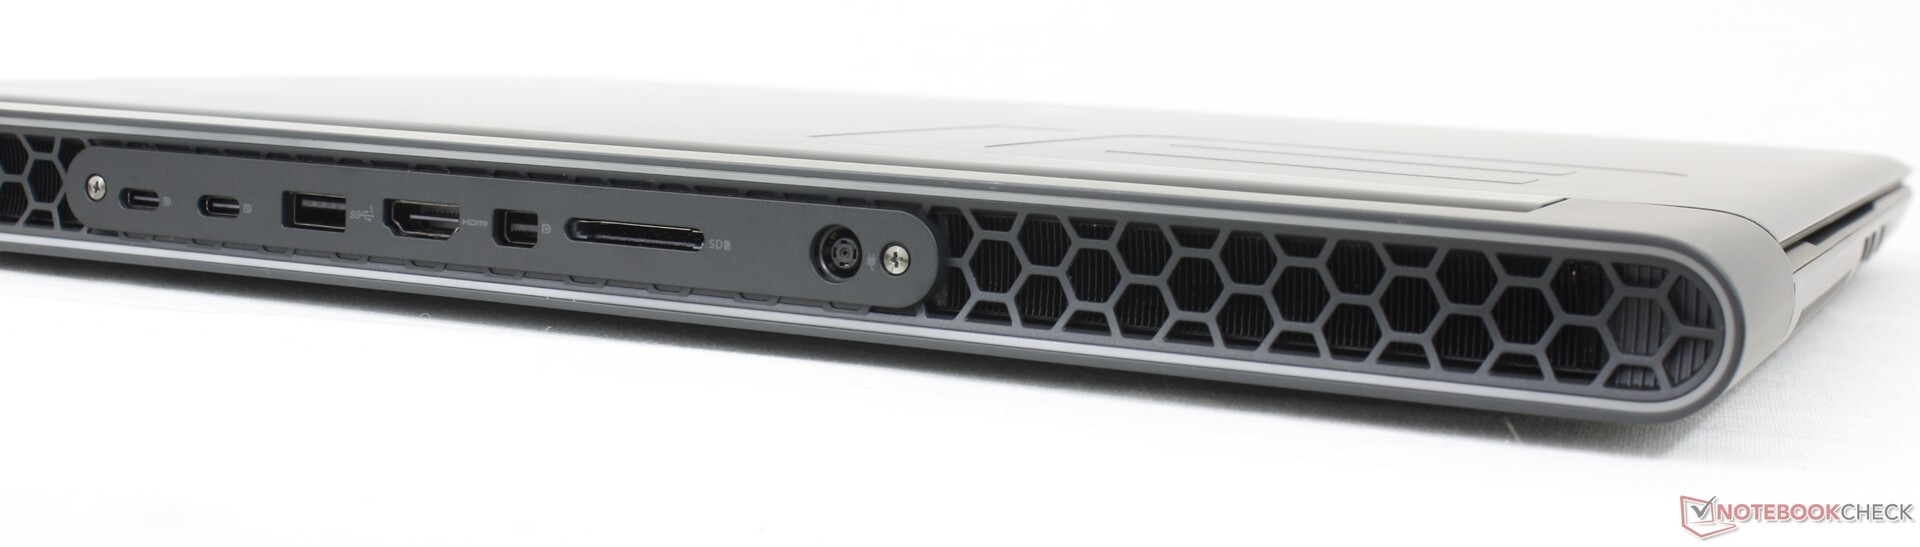
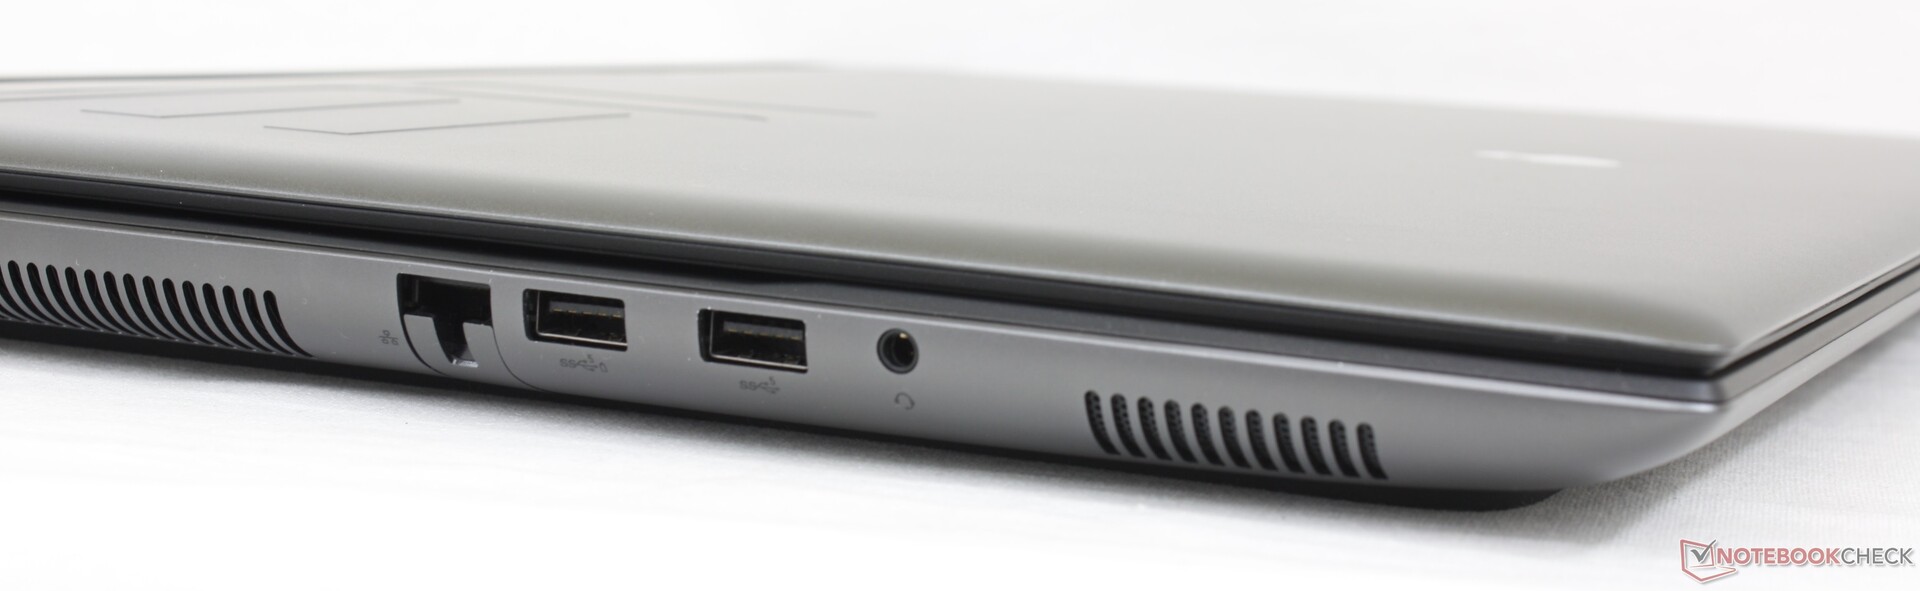
Anslutningsmöjligheter - mer än vanligt
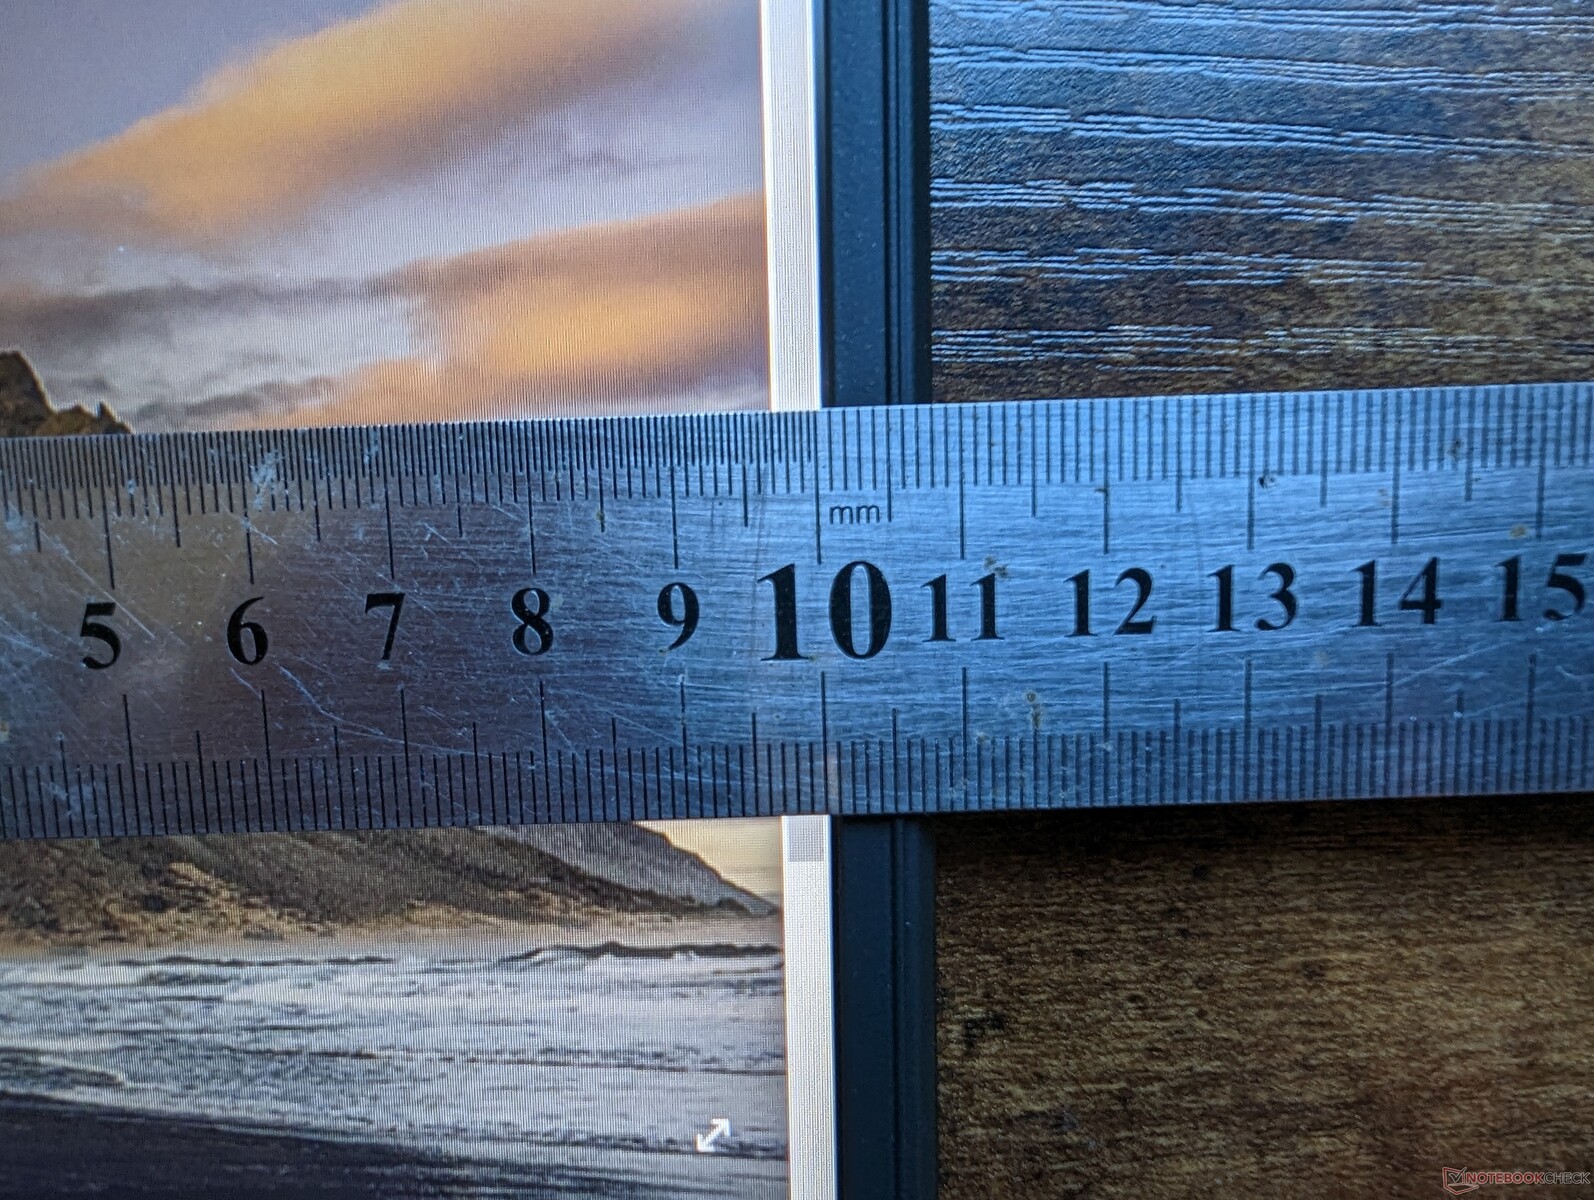
Alienware har fler integrerade portar än de konkurrerande Razer Blade 18 och Asus ROG Strix Scar 18. Haken är dock att de flesta portarna är tätt packade längs den bakre kanten vilket gör dem lite svårare att komma åt.
USB-C-skärmar stöds endast på de två bakre USB-C-portarna eftersom den tredje USB-C-porten längs högerkanten inte stöder videout.
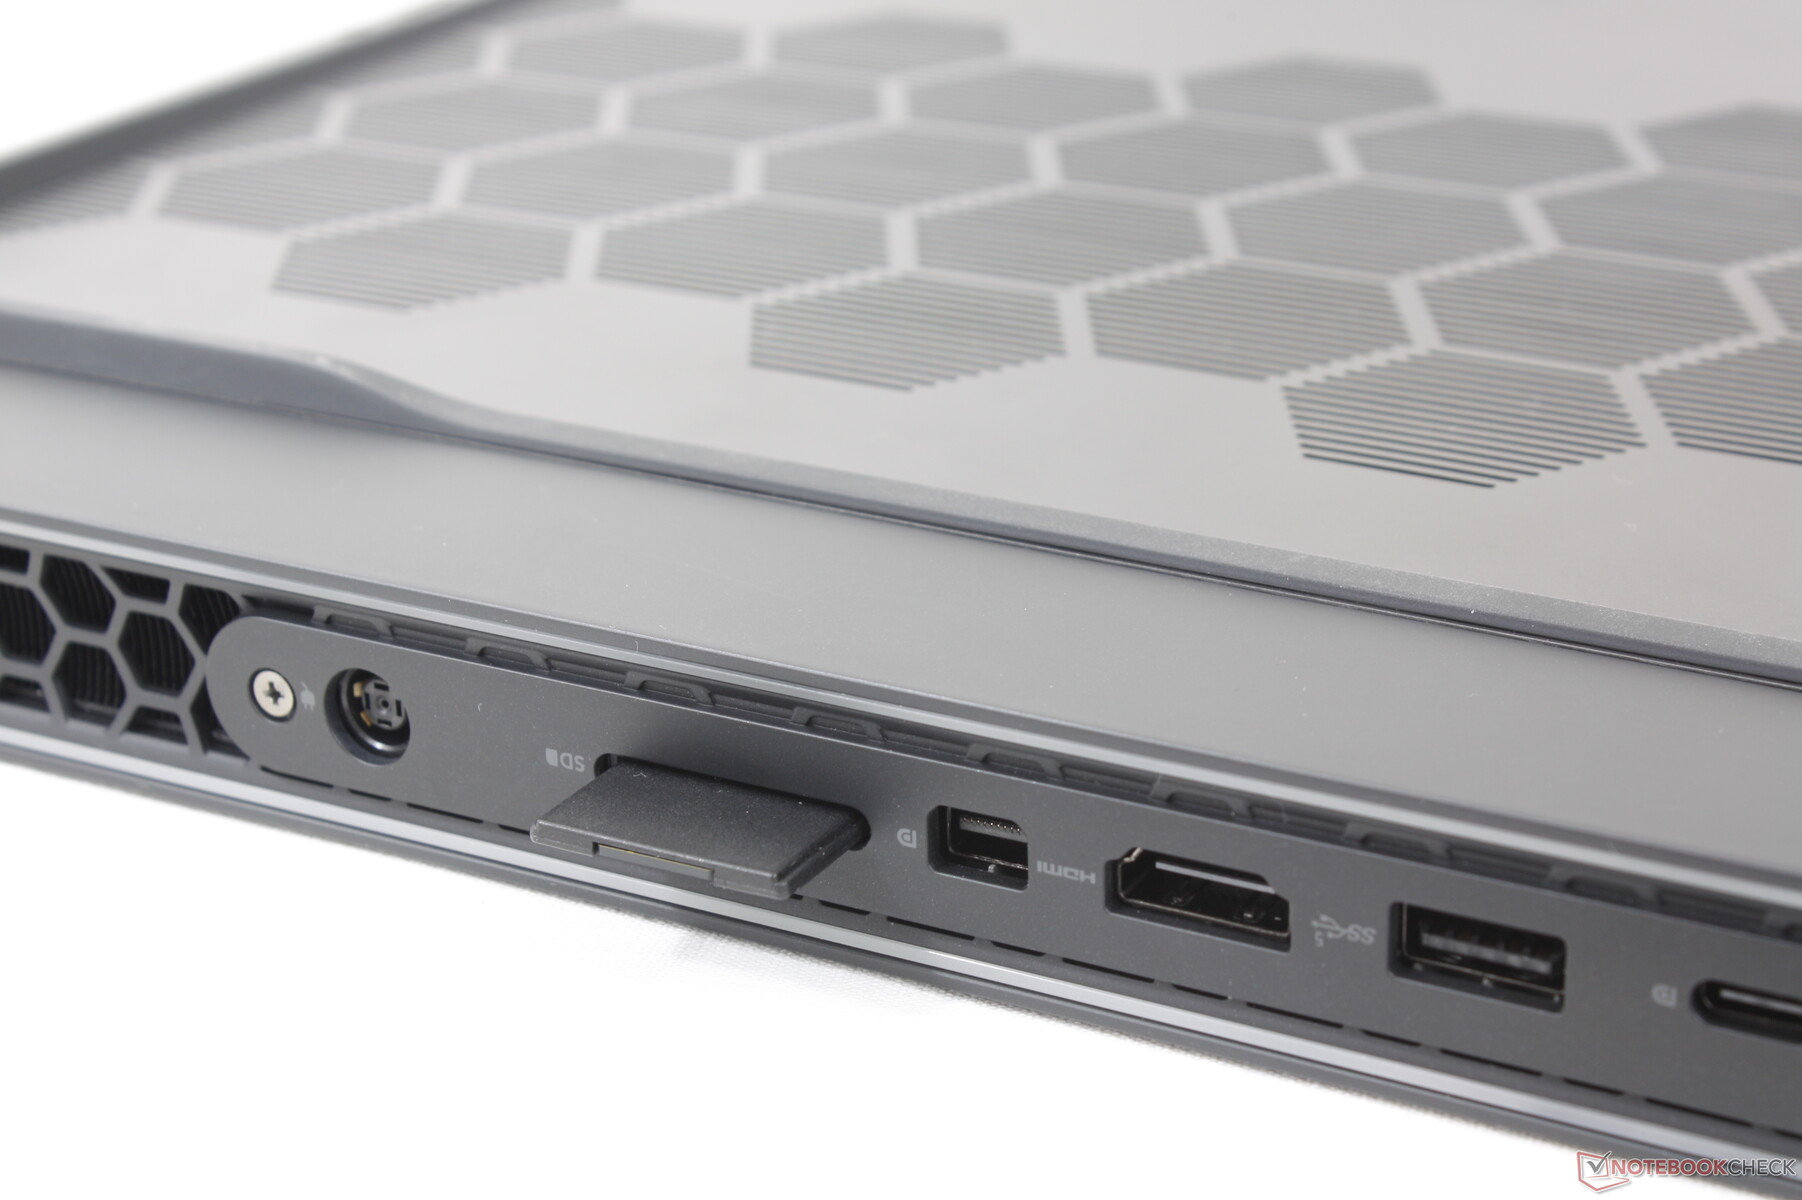
SD-kortläsare
Den integrerade SD-kortläsaren finns på baksidan av enheten till skillnad från de flesta andra bärbara datorer. Överföringshastigheterna är ändå mycket snabba, mer än dubbelt så snabba som på MSI Titan GT77.
| SD Card Reader | |
| average JPG Copy Test (av. of 3 runs) | |
| Razer Blade 18 RTX 4070 (Angelibird AV Pro V60) | |
| Alienware m18 R1 (Angelibird AV Pro V60) | |
| Alienware x17 R2 P48E (AV Pro V60) | |
| MSI Titan GT77 HX 13VI (Angelibird AV Pro V60) | |
| Eluktronics Mech-17 GP2 (Angelibird AV Pro V60) | |
| maximum AS SSD Seq Read Test (1GB) | |
| Alienware x17 R2 P48E (AV Pro V60) | |
| Alienware m18 R1 (Angelibird AV Pro V60) | |
| Razer Blade 18 RTX 4070 (Angelibird AV Pro V60) | |
| Eluktronics Mech-17 GP2 (Angelibird AV Pro V60) | |
| MSI Titan GT77 HX 13VI (Angelibird AV Pro V60) | |
Kommunikation
En Intel Killer 1675i är standard för Wi-Fi 6E och Bluetooth 5.2-kompatibilitet. Killer är ett undermärke från Intel som är optimerat för bärbara datorer för spel och därför är Killer 1675i i grund och botten en Intel AX211. Prestandan är utmärkt och pålitlig när den paras ihop med vår testrouter Asus AXE11000.
| Networking | |
| iperf3 transmit AX12 | |
| Alienware x17 R2 P48E | |
| iperf3 receive AX12 | |
| Alienware x17 R2 P48E | |
| iperf3 transmit AXE11000 | |
| MSI Titan GT77 HX 13VI | |
| Asus ROG Strix Scar 18 2023 G834JY-N6005W | |
| Eluktronics Mech-17 GP2 | |
| Alienware m18 R1 | |
| Razer Blade 18 RTX 4070 | |
| iperf3 receive AXE11000 | |
| Asus ROG Strix Scar 18 2023 G834JY-N6005W | |
| MSI Titan GT77 HX 13VI | |
| Razer Blade 18 RTX 4070 | |
| Eluktronics Mech-17 GP2 | |
| Alienware m18 R1 | |
| iperf3 transmit AXE11000 6GHz | |
| Alienware m18 R1 | |
| Razer Blade 18 RTX 4070 | |
| iperf3 receive AXE11000 6GHz | |
| Razer Blade 18 RTX 4070 | |
| Alienware m18 R1 | |
Webbkamera
Webbkameran med 2 MP är typisk för de flesta bärbara datorer nuförtiden, men vi är lite besvikna över att det inte finns en 5 MP-sensor med tanke på hur stort chassit är. IR är standard, medan en stängare för webbkameran saknas till skillnad från Razer Blade 18.


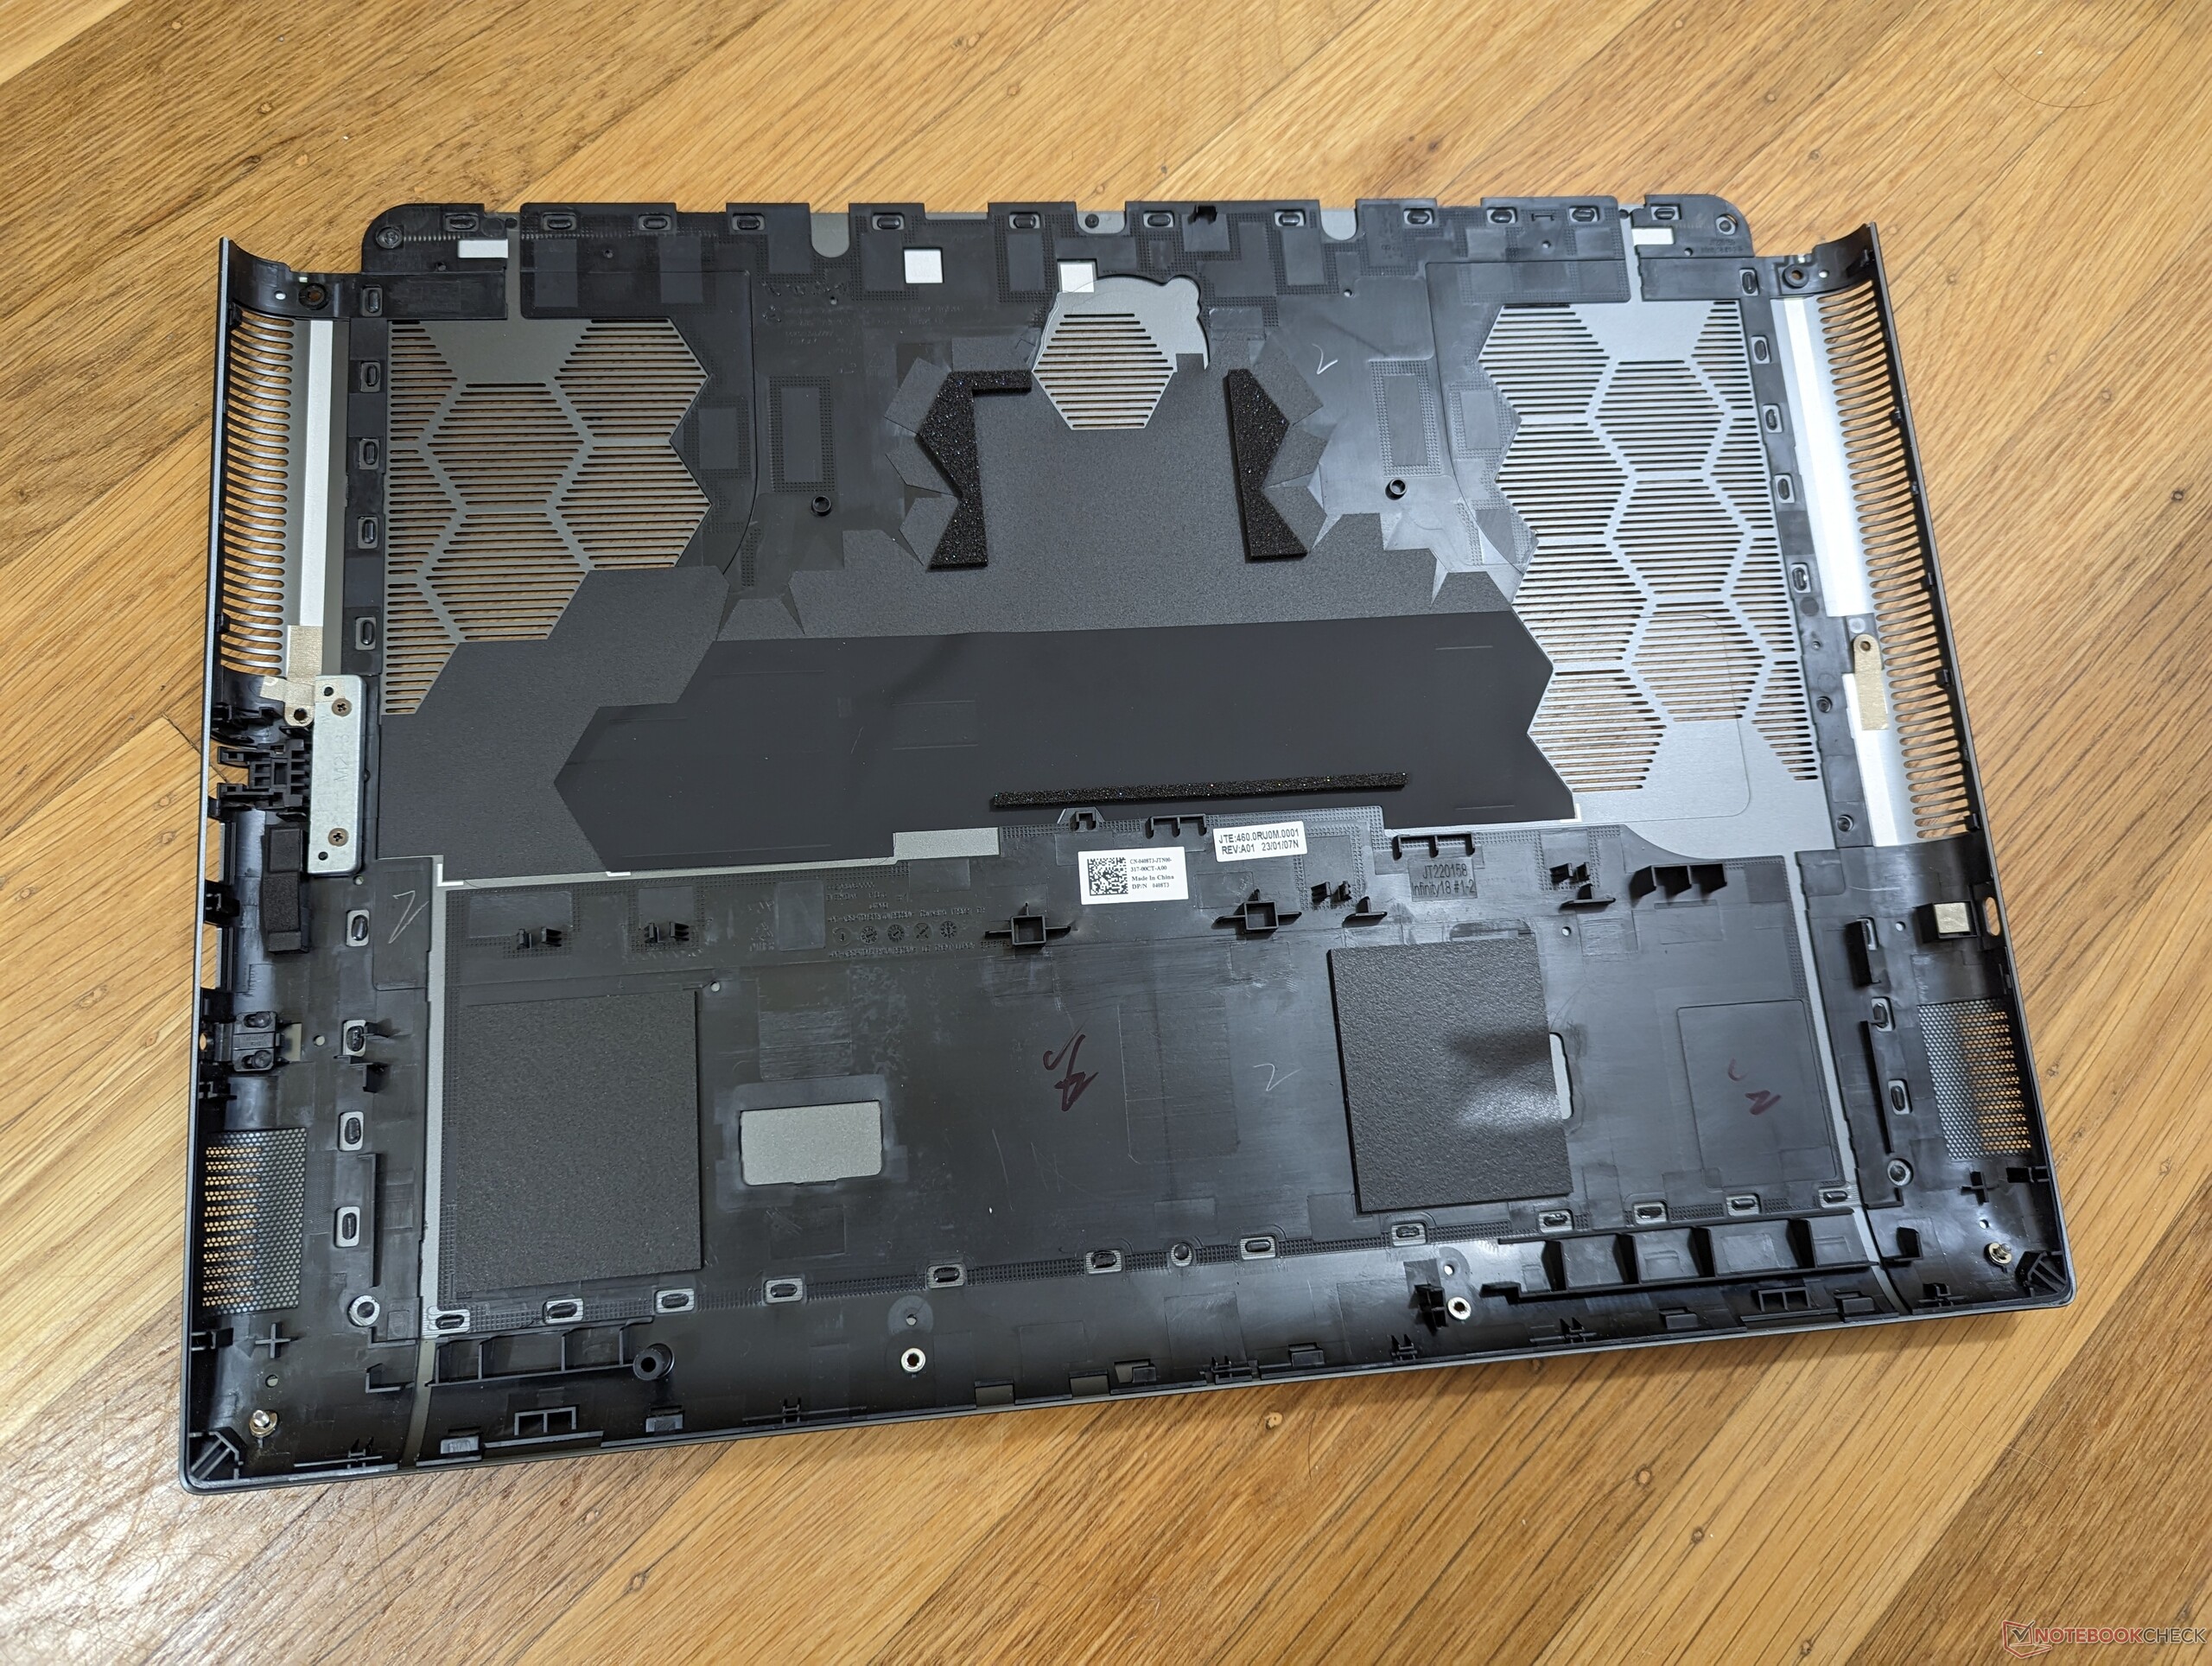
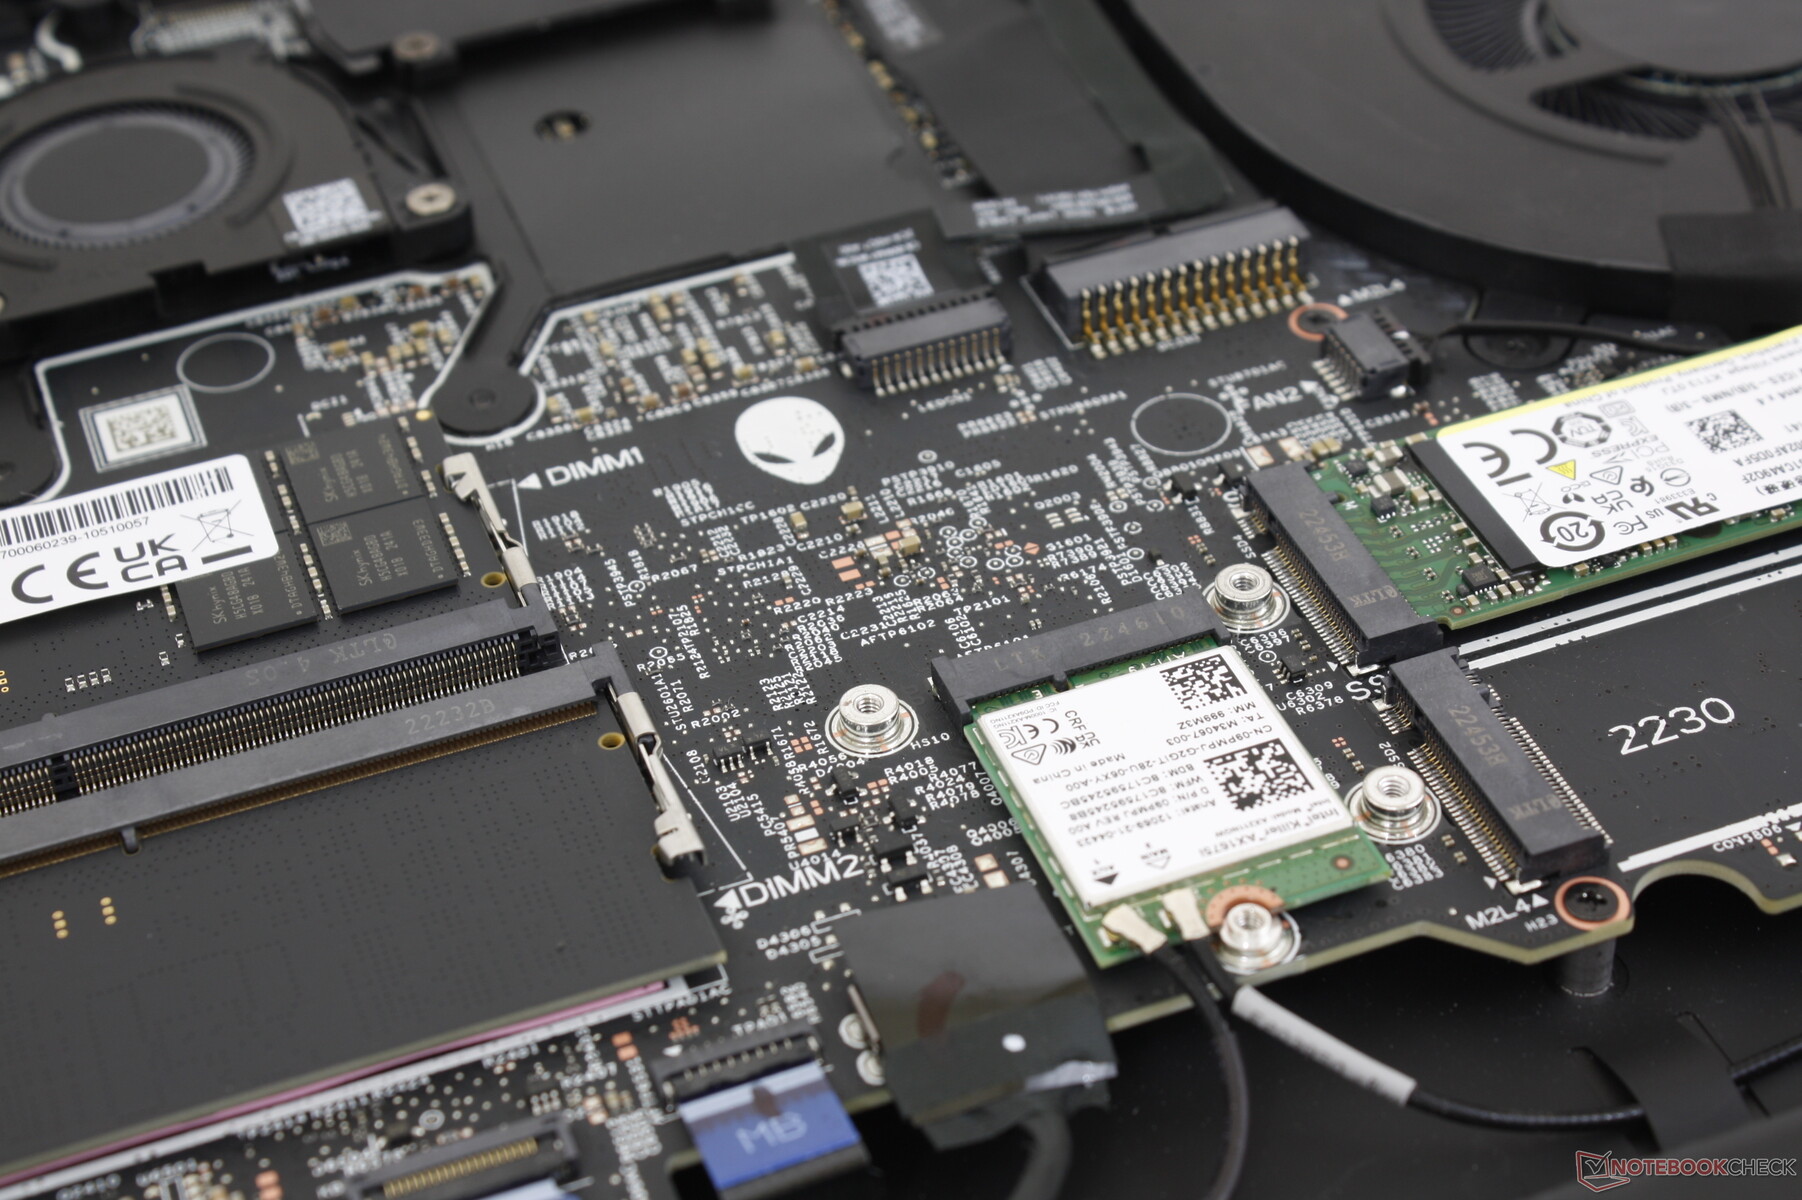
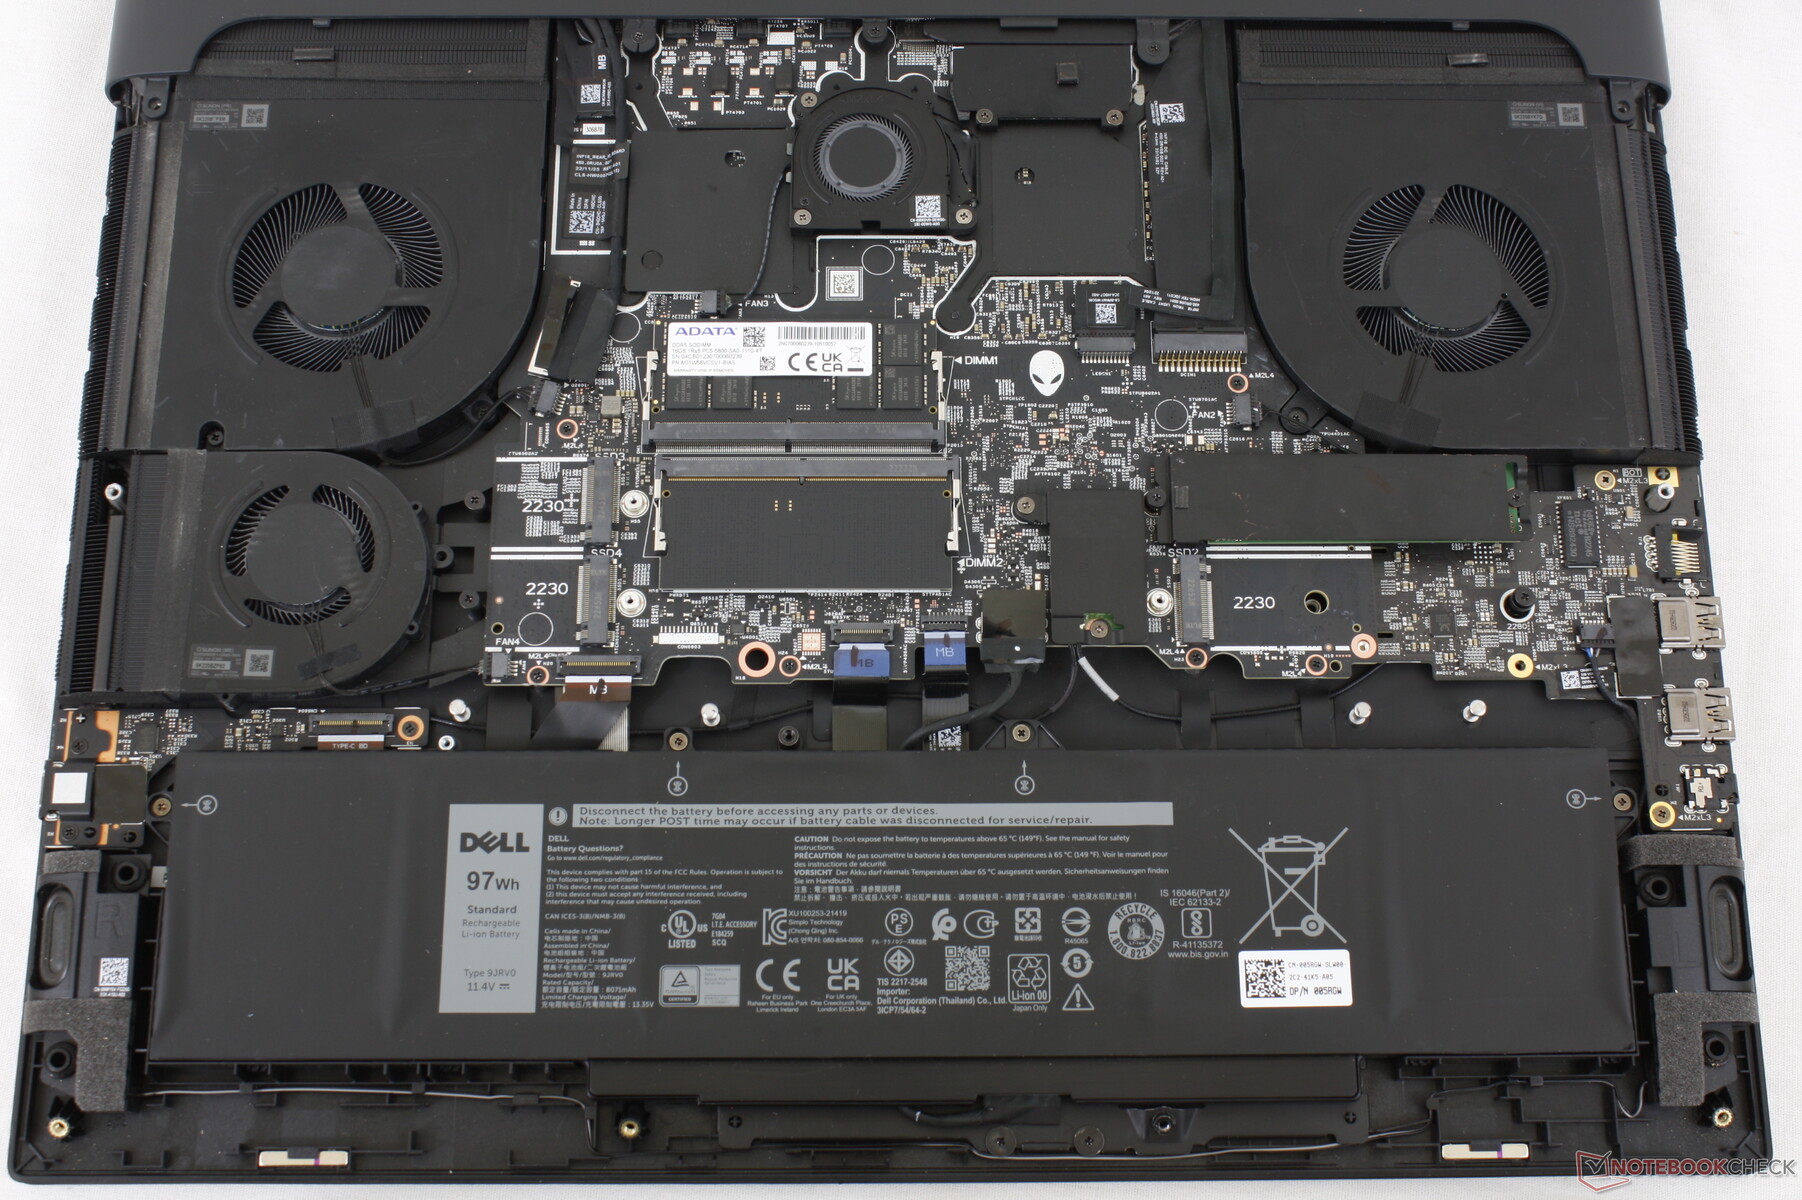
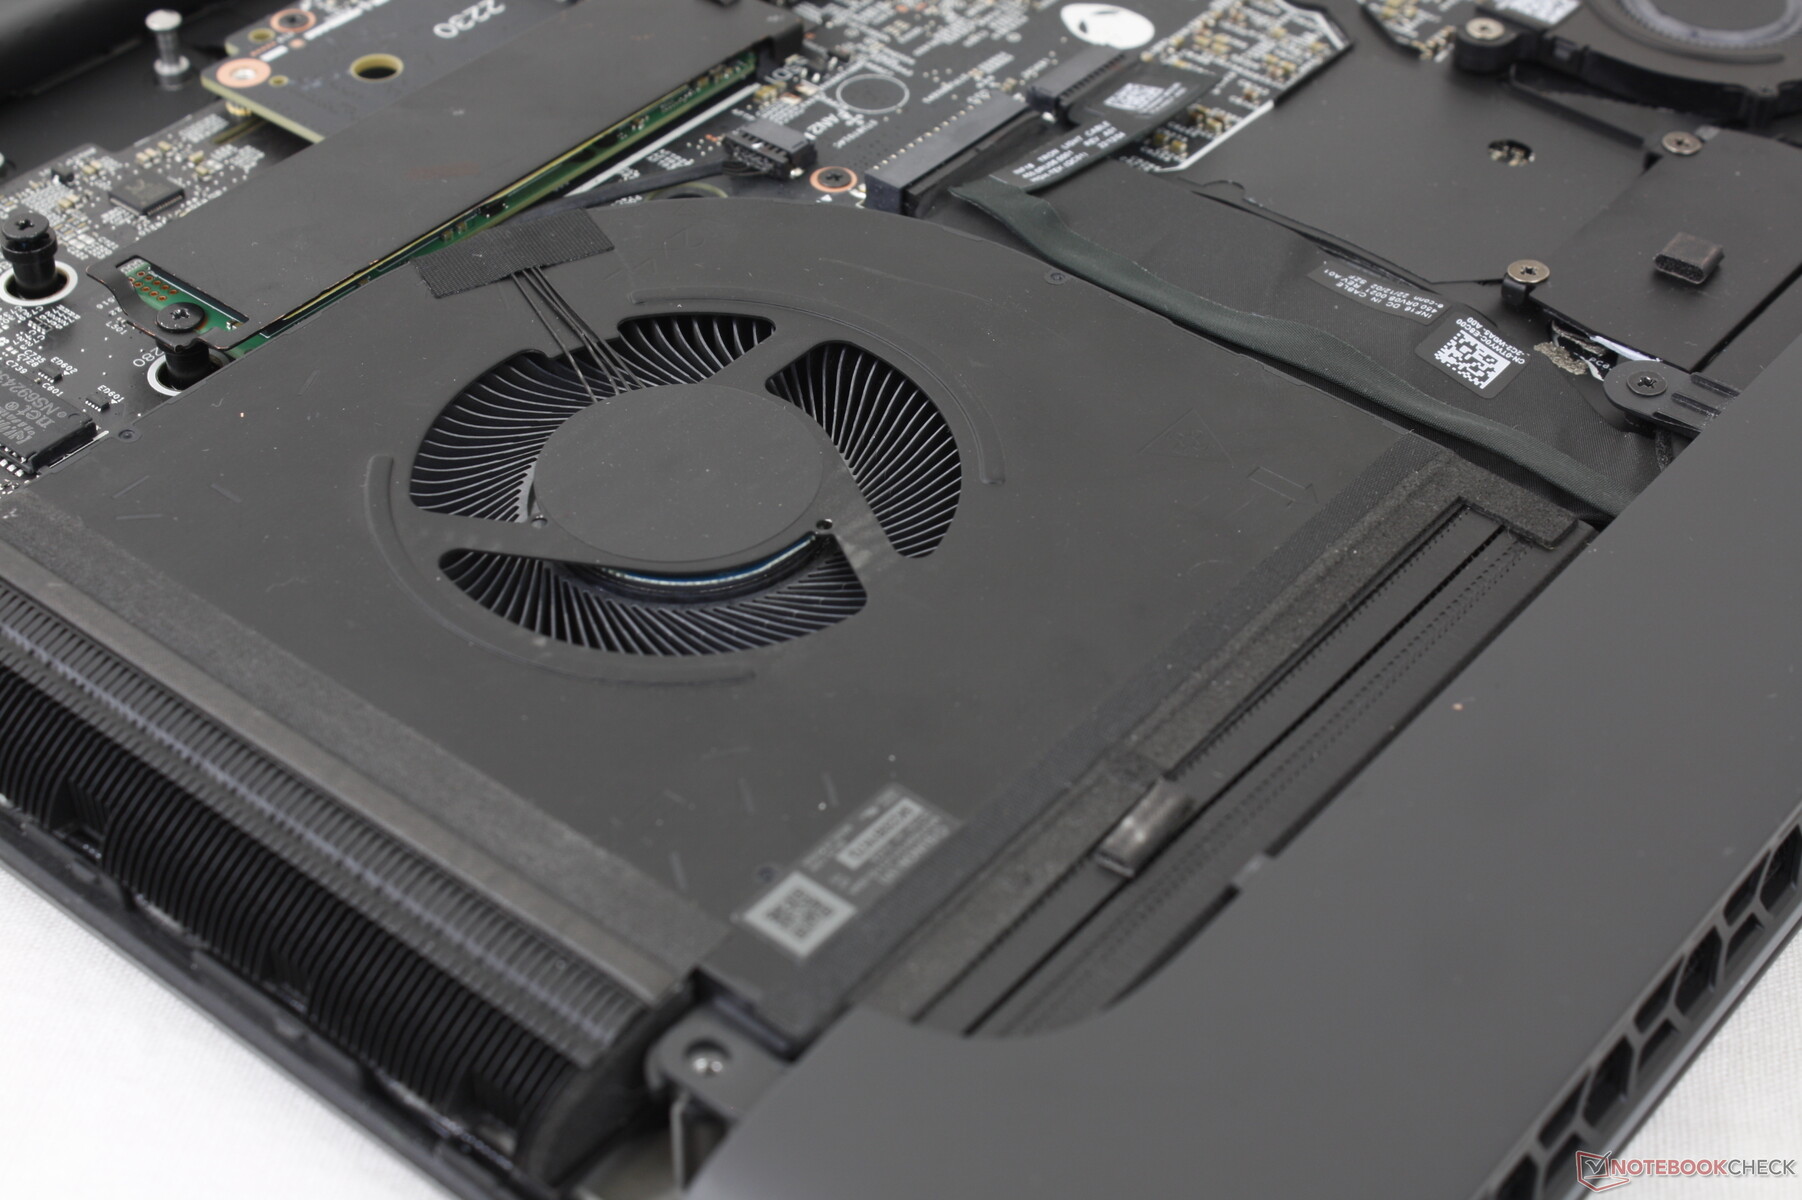
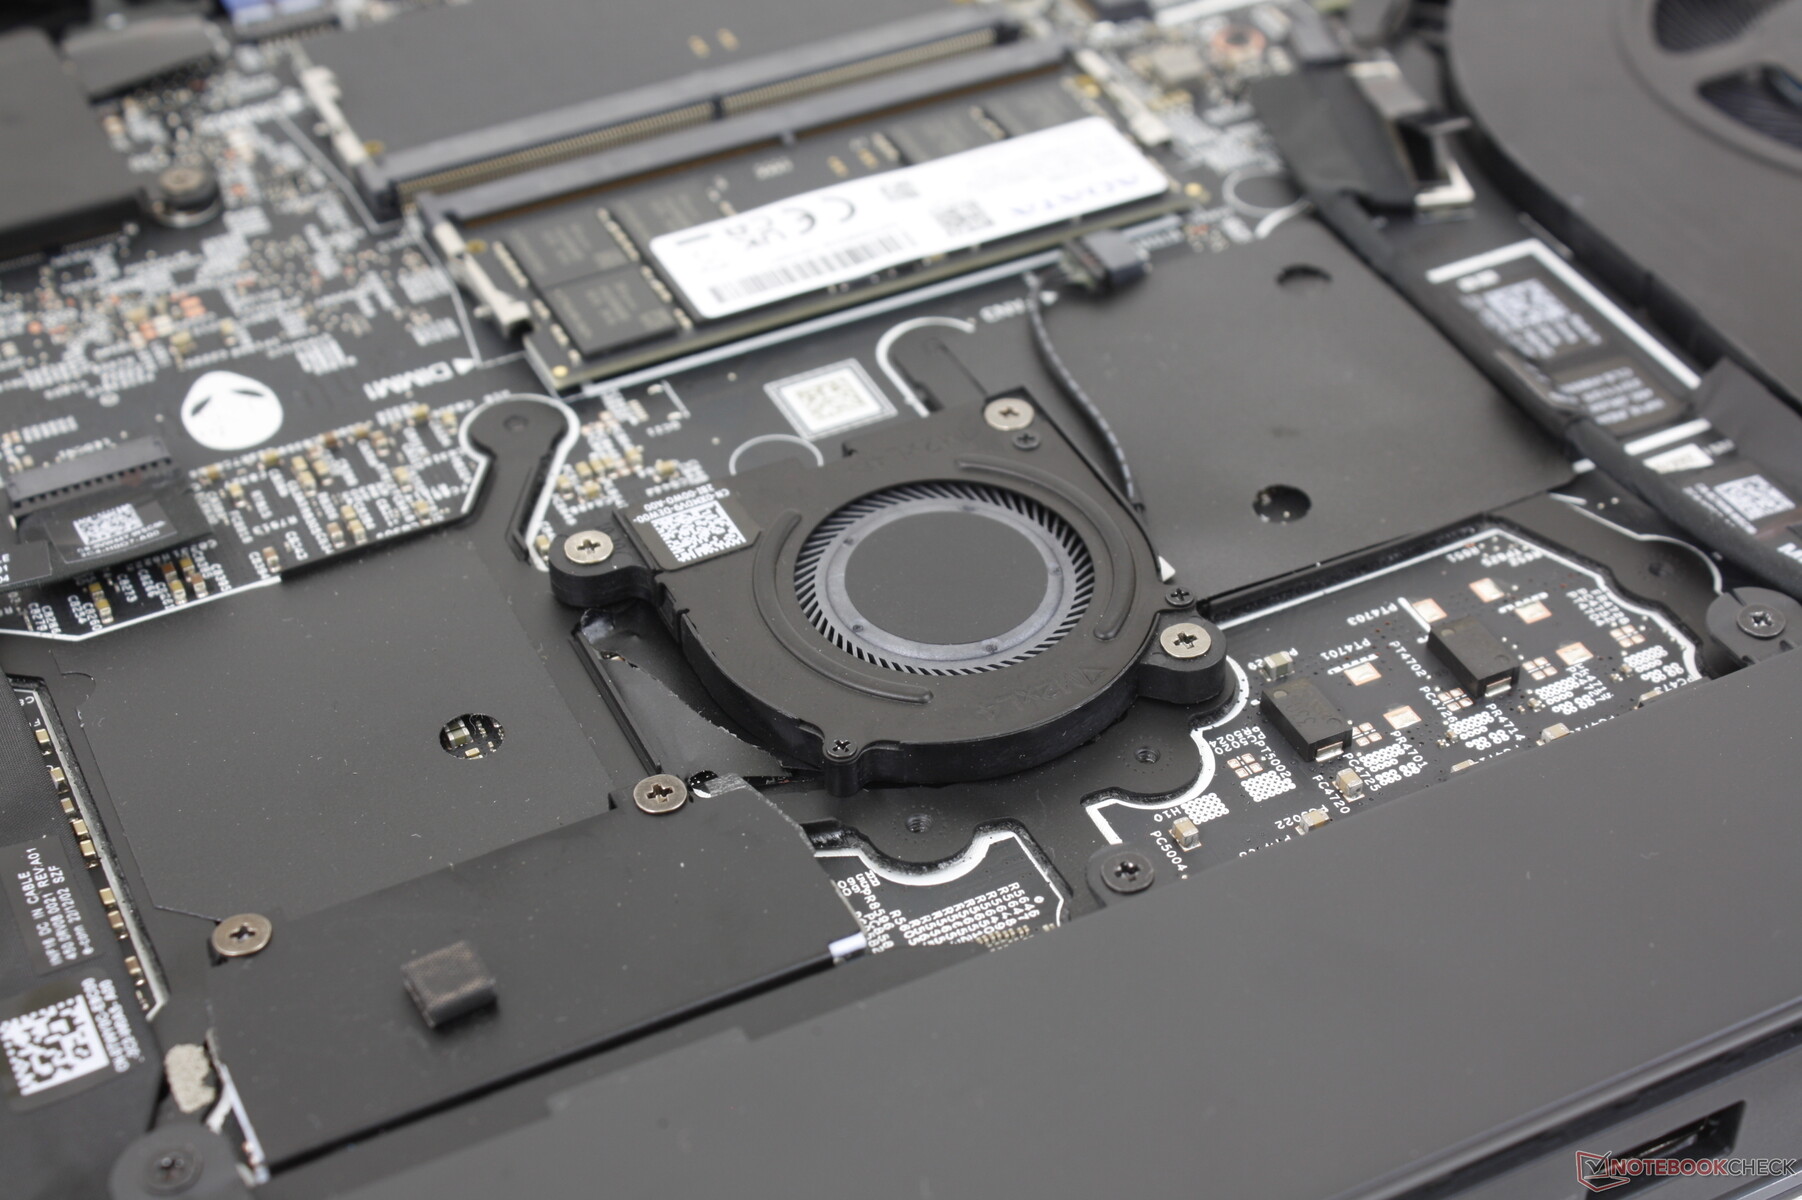
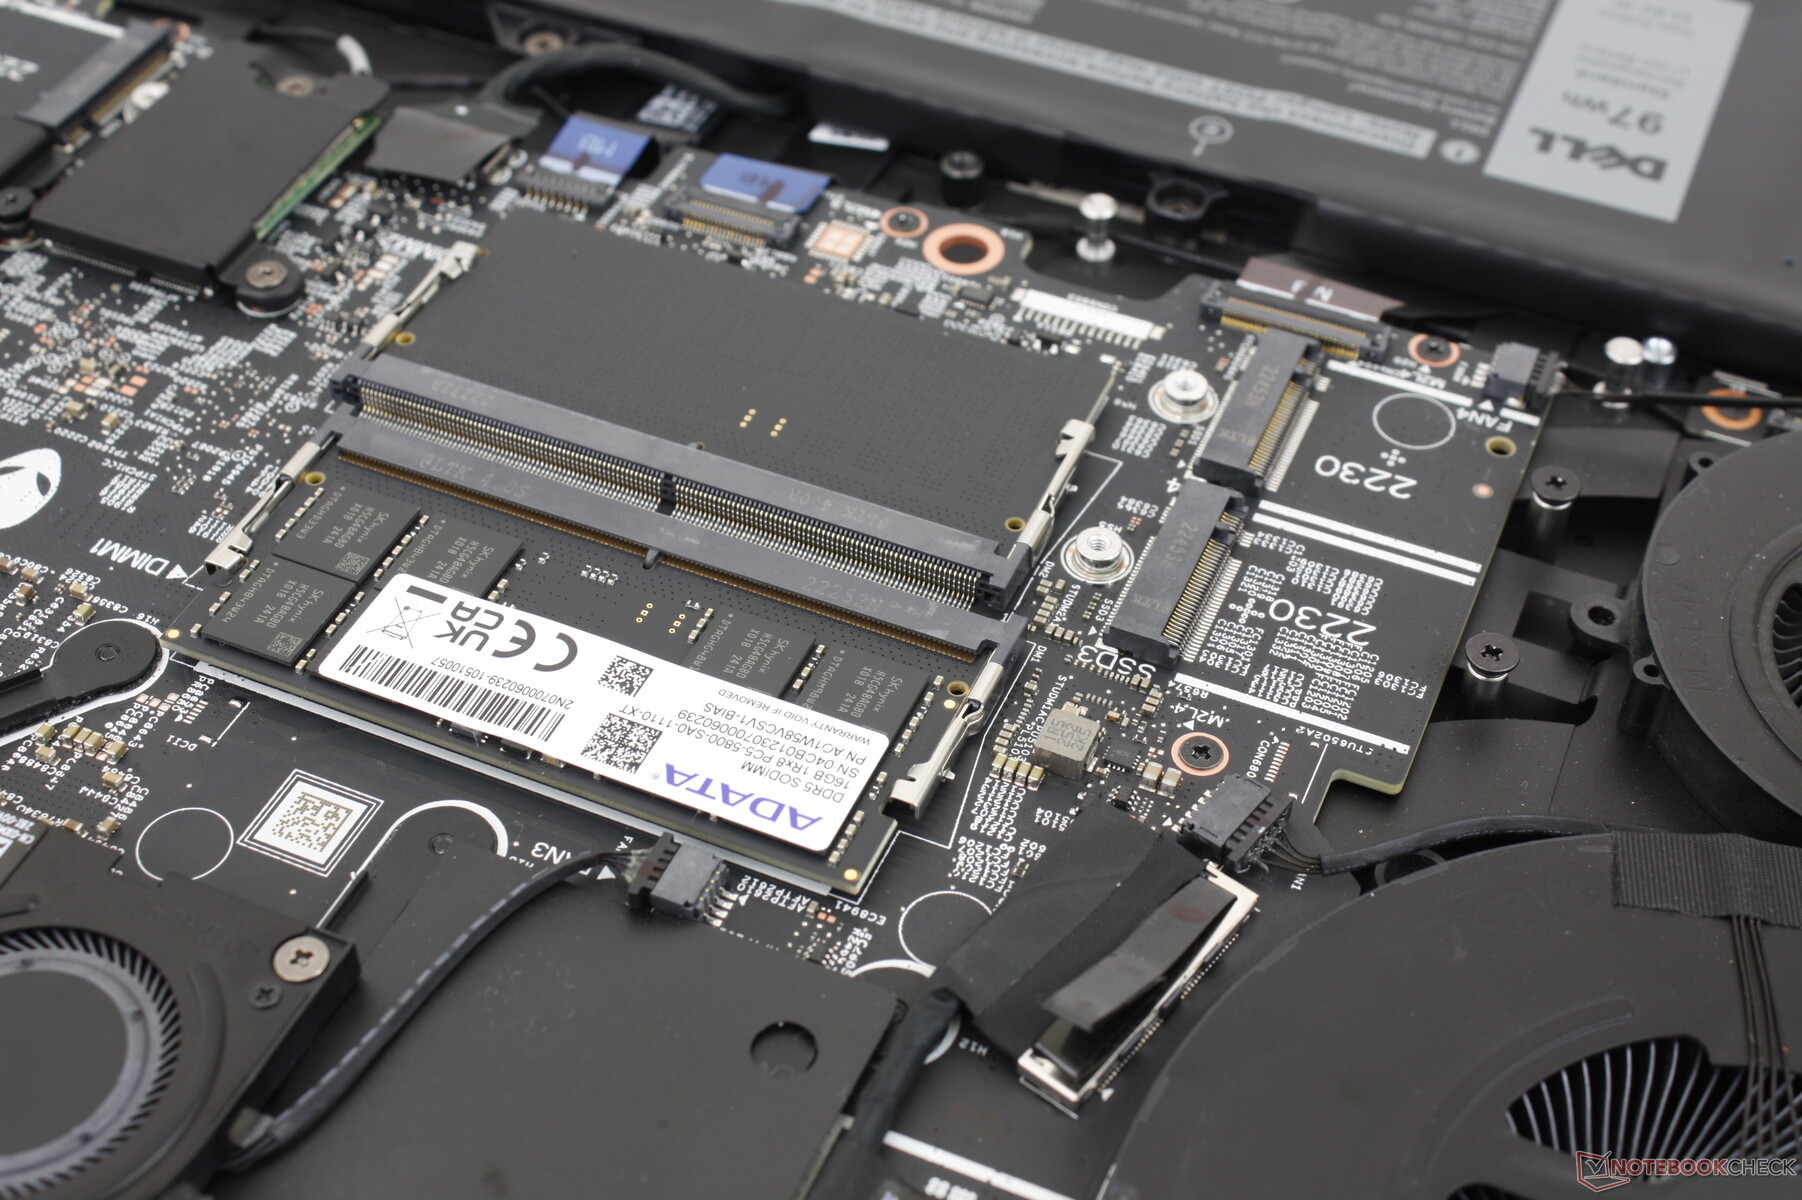
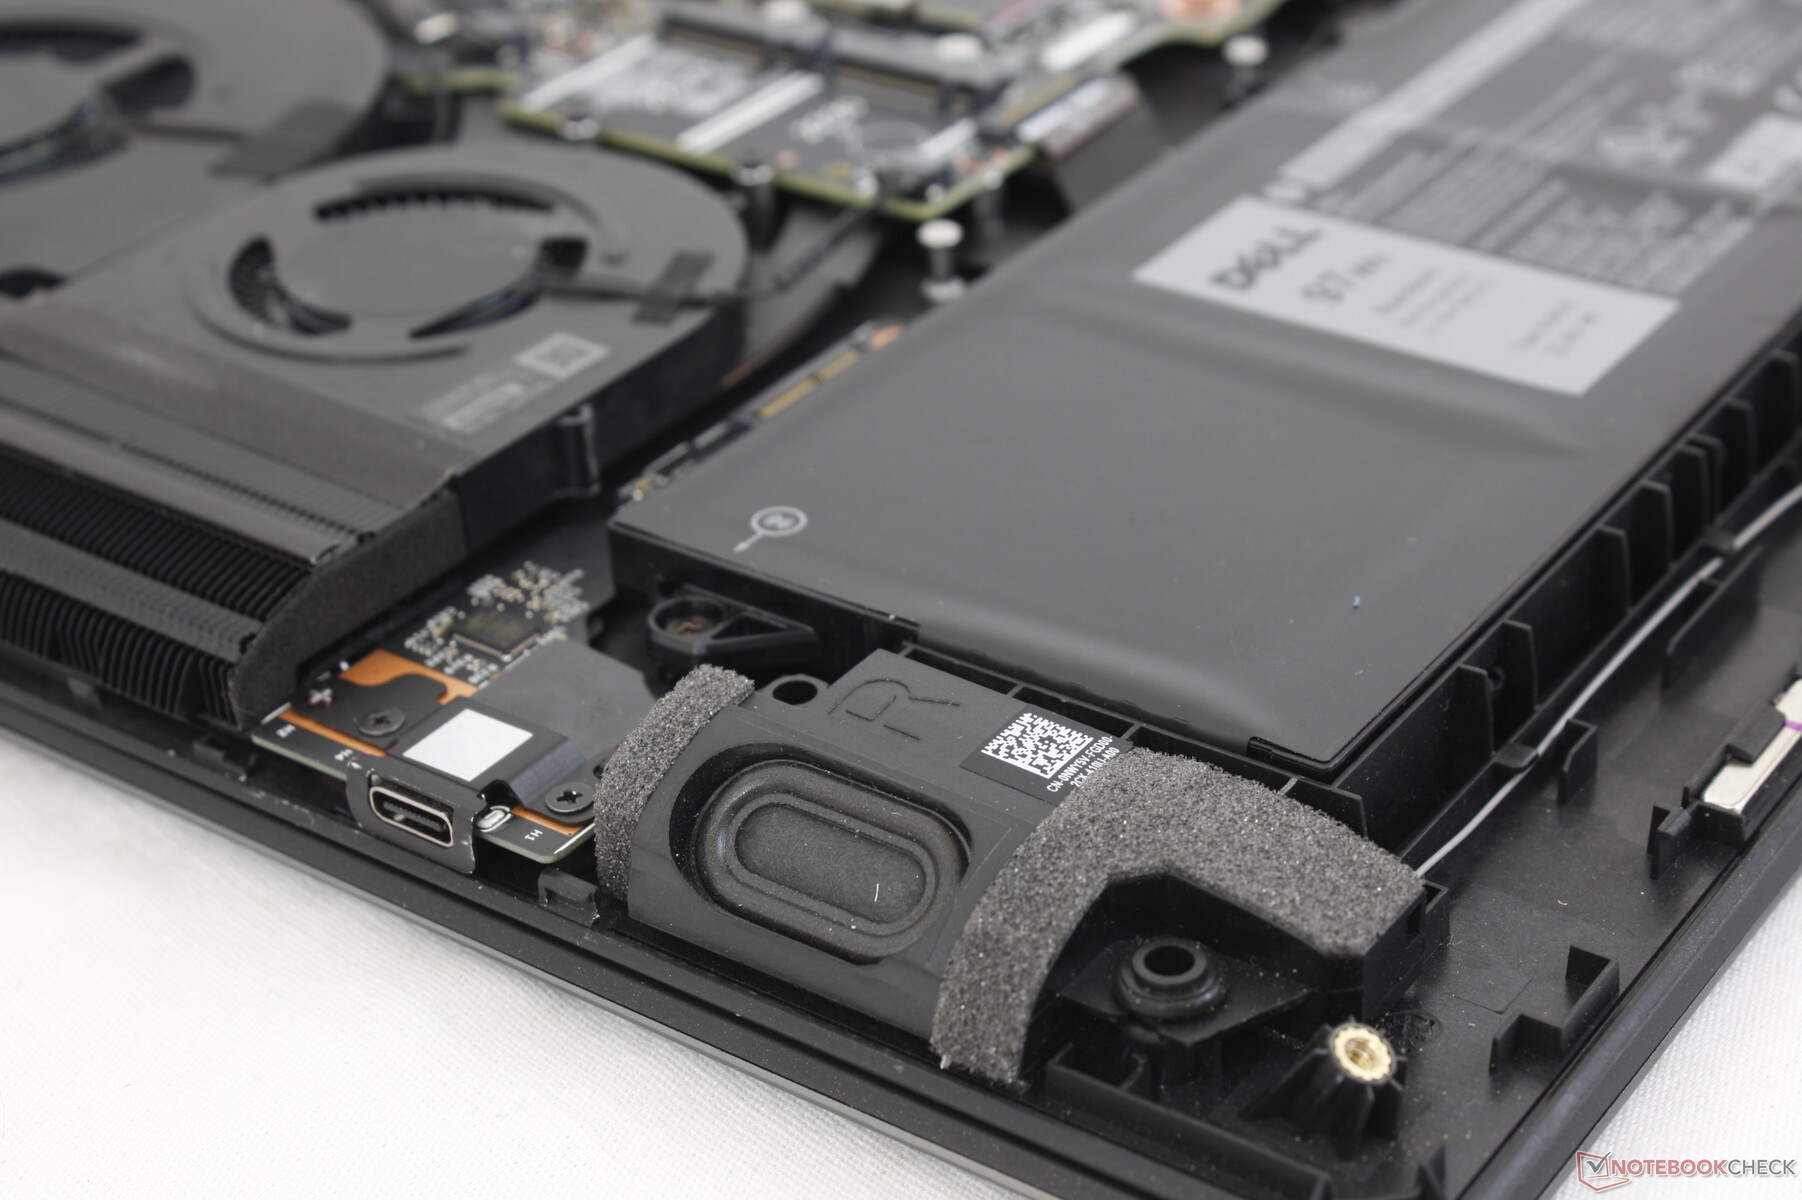
Underhåll
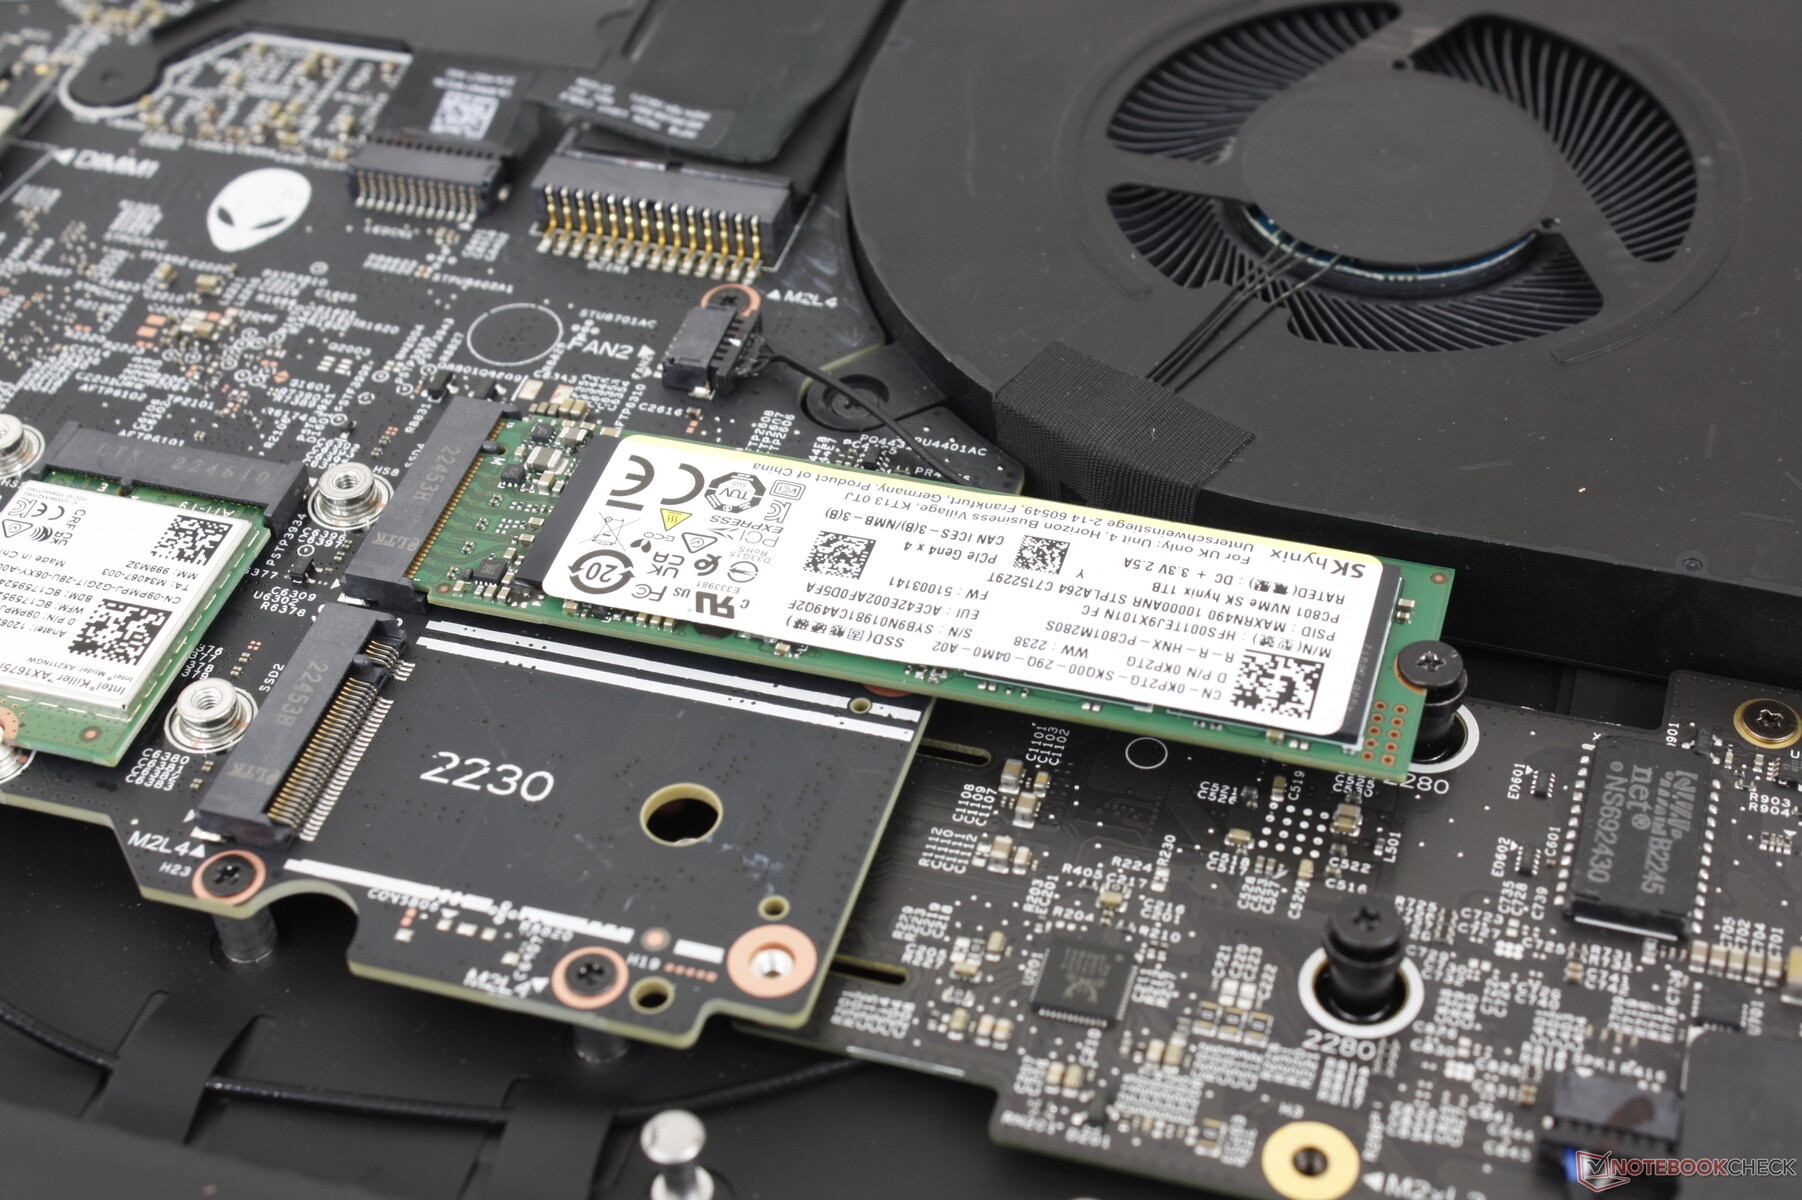
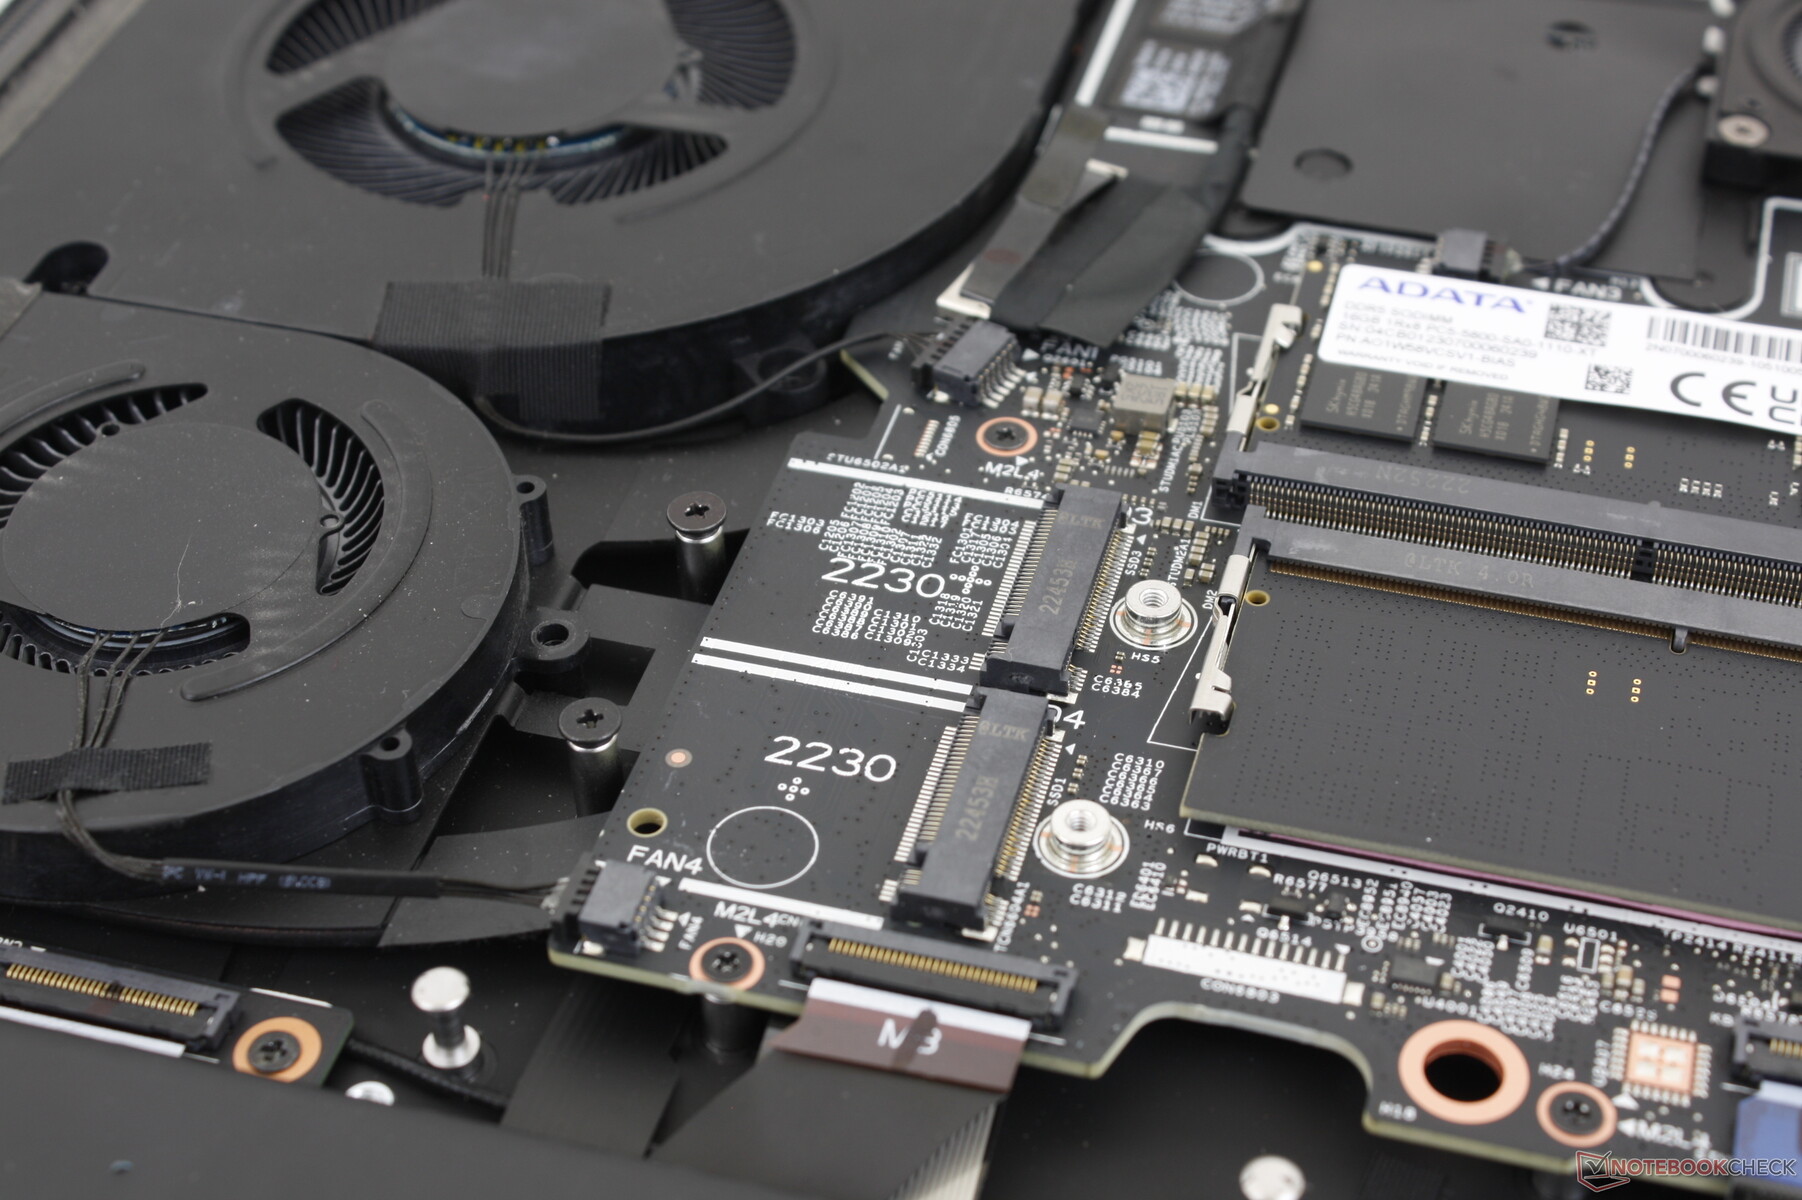
Bottenpanelen kan enkelt tas bort med en Philips-skruvmejsel. I jämförelse kräver bottenpanelen på nya MSI GE78 mer pyssel och rivning av ett klistermärke som förhindrar manipulering.
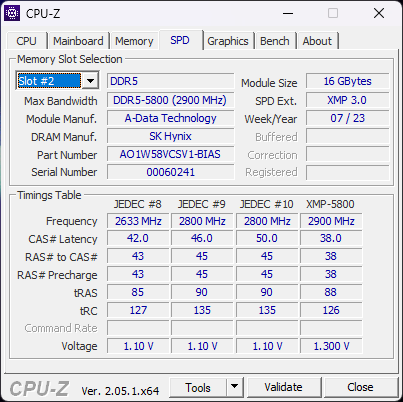
Användarna har direkt tillgång till batteriet, den avtagbara WLAN-modulen, 4x M.2 SSD-fack och 2x DDR5 SODIMM-fack. Det här är en av de mycket få bärbara datorerna med stöd för fyra interna NVMe SSD-enheter (2x M.2 2230 + 2x M.2 2280). Det hade varit intressant att se CAMM istället för SODIMM här, särskilt eftersom Dell har förespråkat den snabbare RAM-tekniken.
Tillbehör och garanti
Det finns inget extra i lådan förutom nätadapter och papper. Observera att Dell har släppt sin proprietära Alienware-dockningsport och att den äldre Alienware eGPU-dockningsstationen därför inte längre stöds.
Den vanliga ettåriga begränsade garantin gäller om den köps i USA.
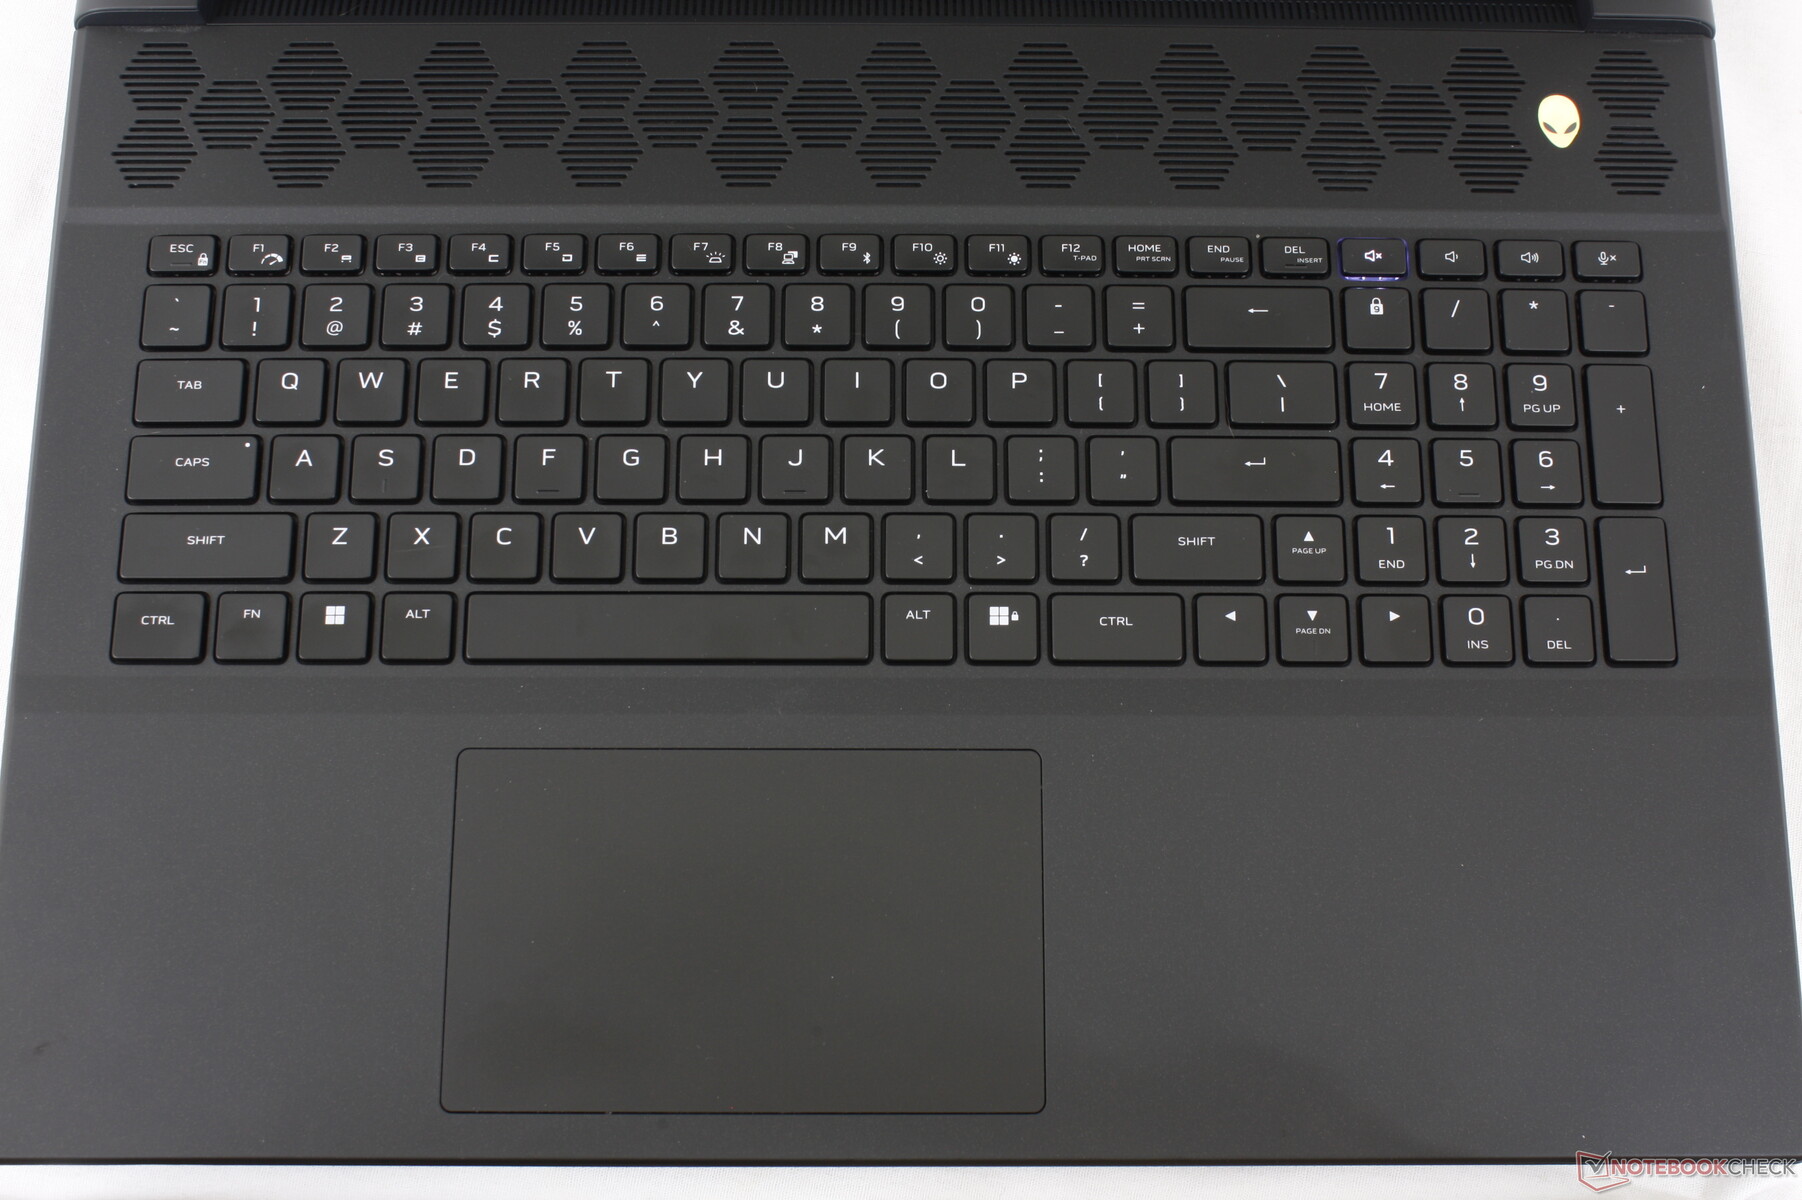
Inmatningsenheter - Bekvämt tangentbord, svampig pekplatta
Tangentbord
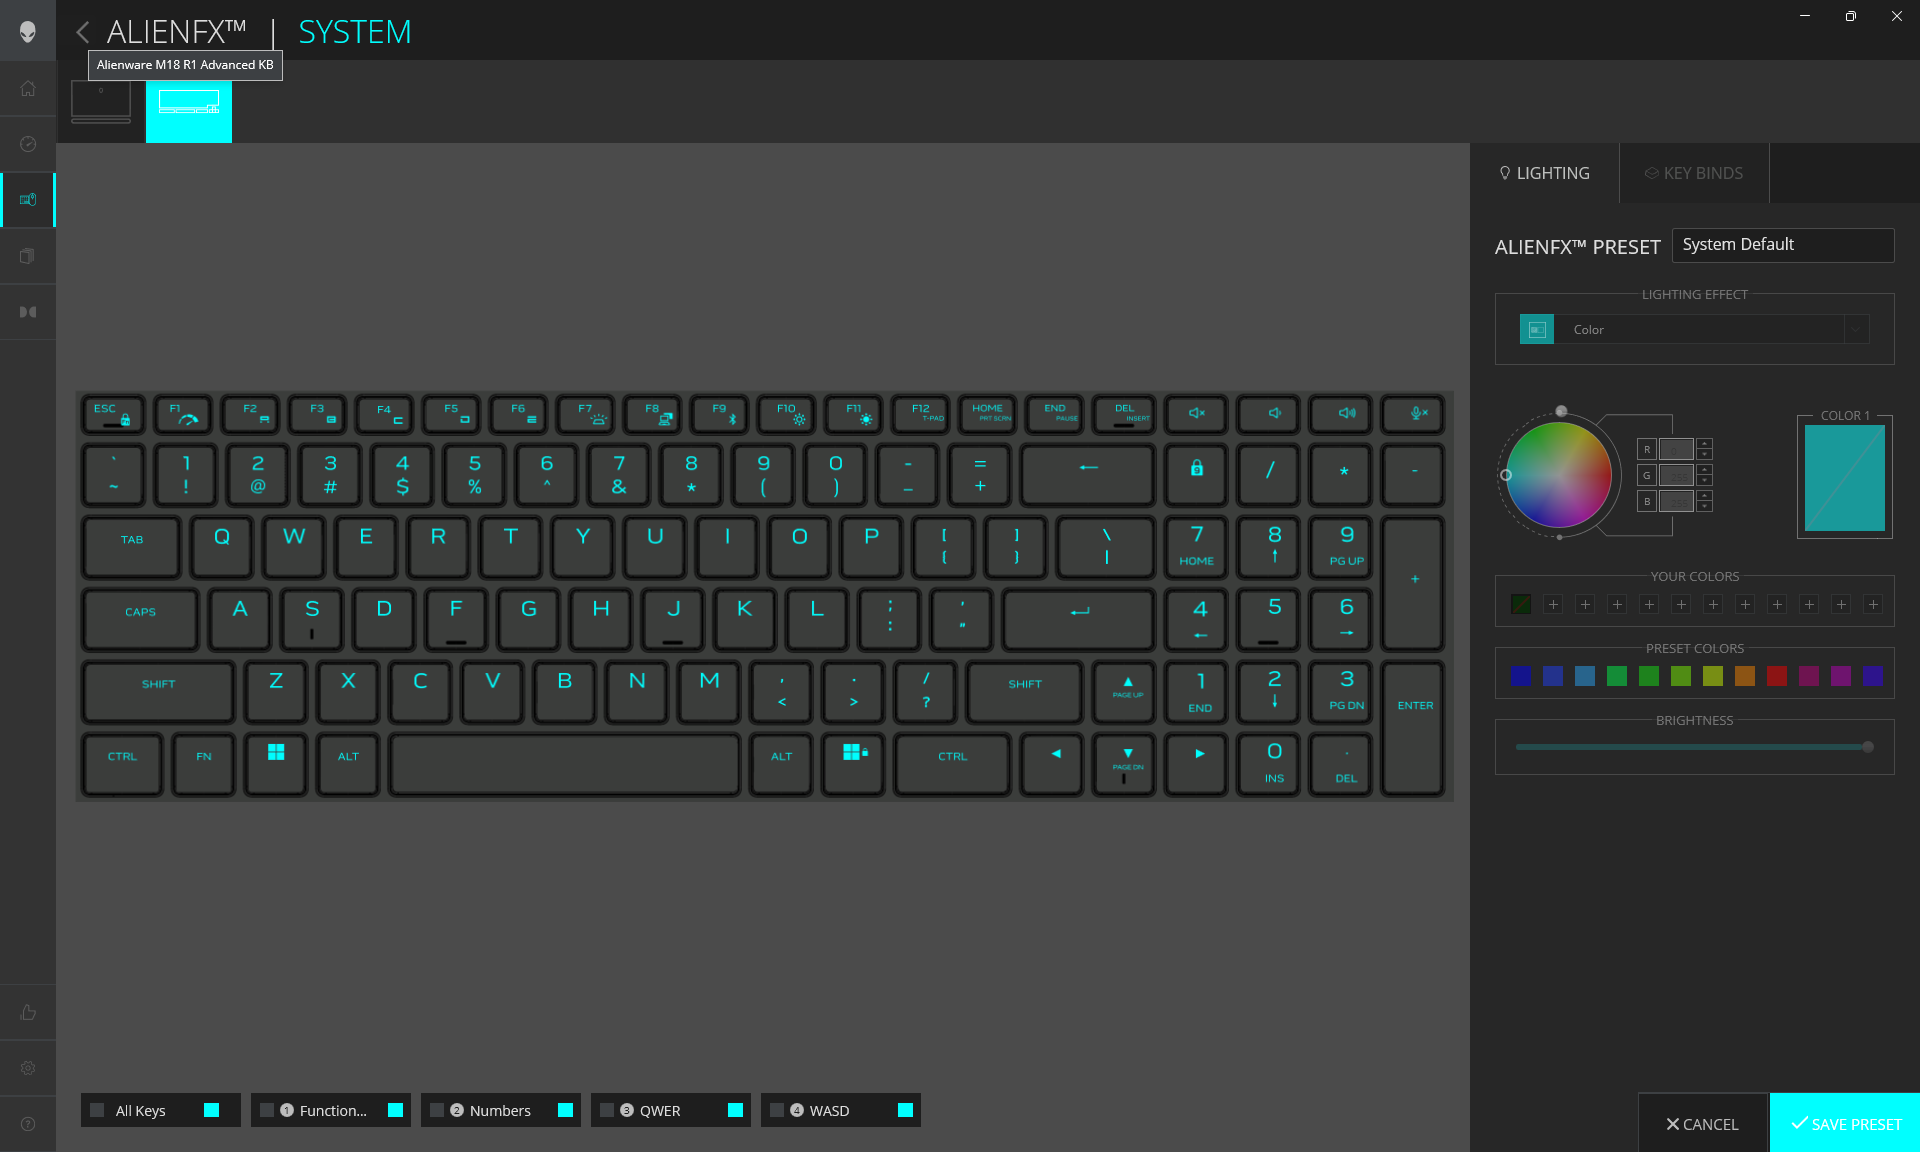
De membranbaserade tangenterna på vår enhet är förmodligen de bästa vi har använt på någon bärbar dator för spel. Travel känns djupare och med fastare feedback än tangenterna på MSI GE78 eller Razer Blade 18. Det finns väldigt lite att klaga på tangentbordet här när det gäller komfort.
De mekaniska CherryMX-switcharna som finns som tillval kommer troligen att vara klickigare men mycket mer högljudda. Dessa switchar är förmodligen samma som Dell erbjuder till de befintliga Alienware M15- och M17-serierna.
Alla tangentsymboler är upplysta när bakgrundsbelysningen är aktiv till skillnad från på äldre Alienware x15/x17-modeller där de sekundära symbolerna inte är upplysta.
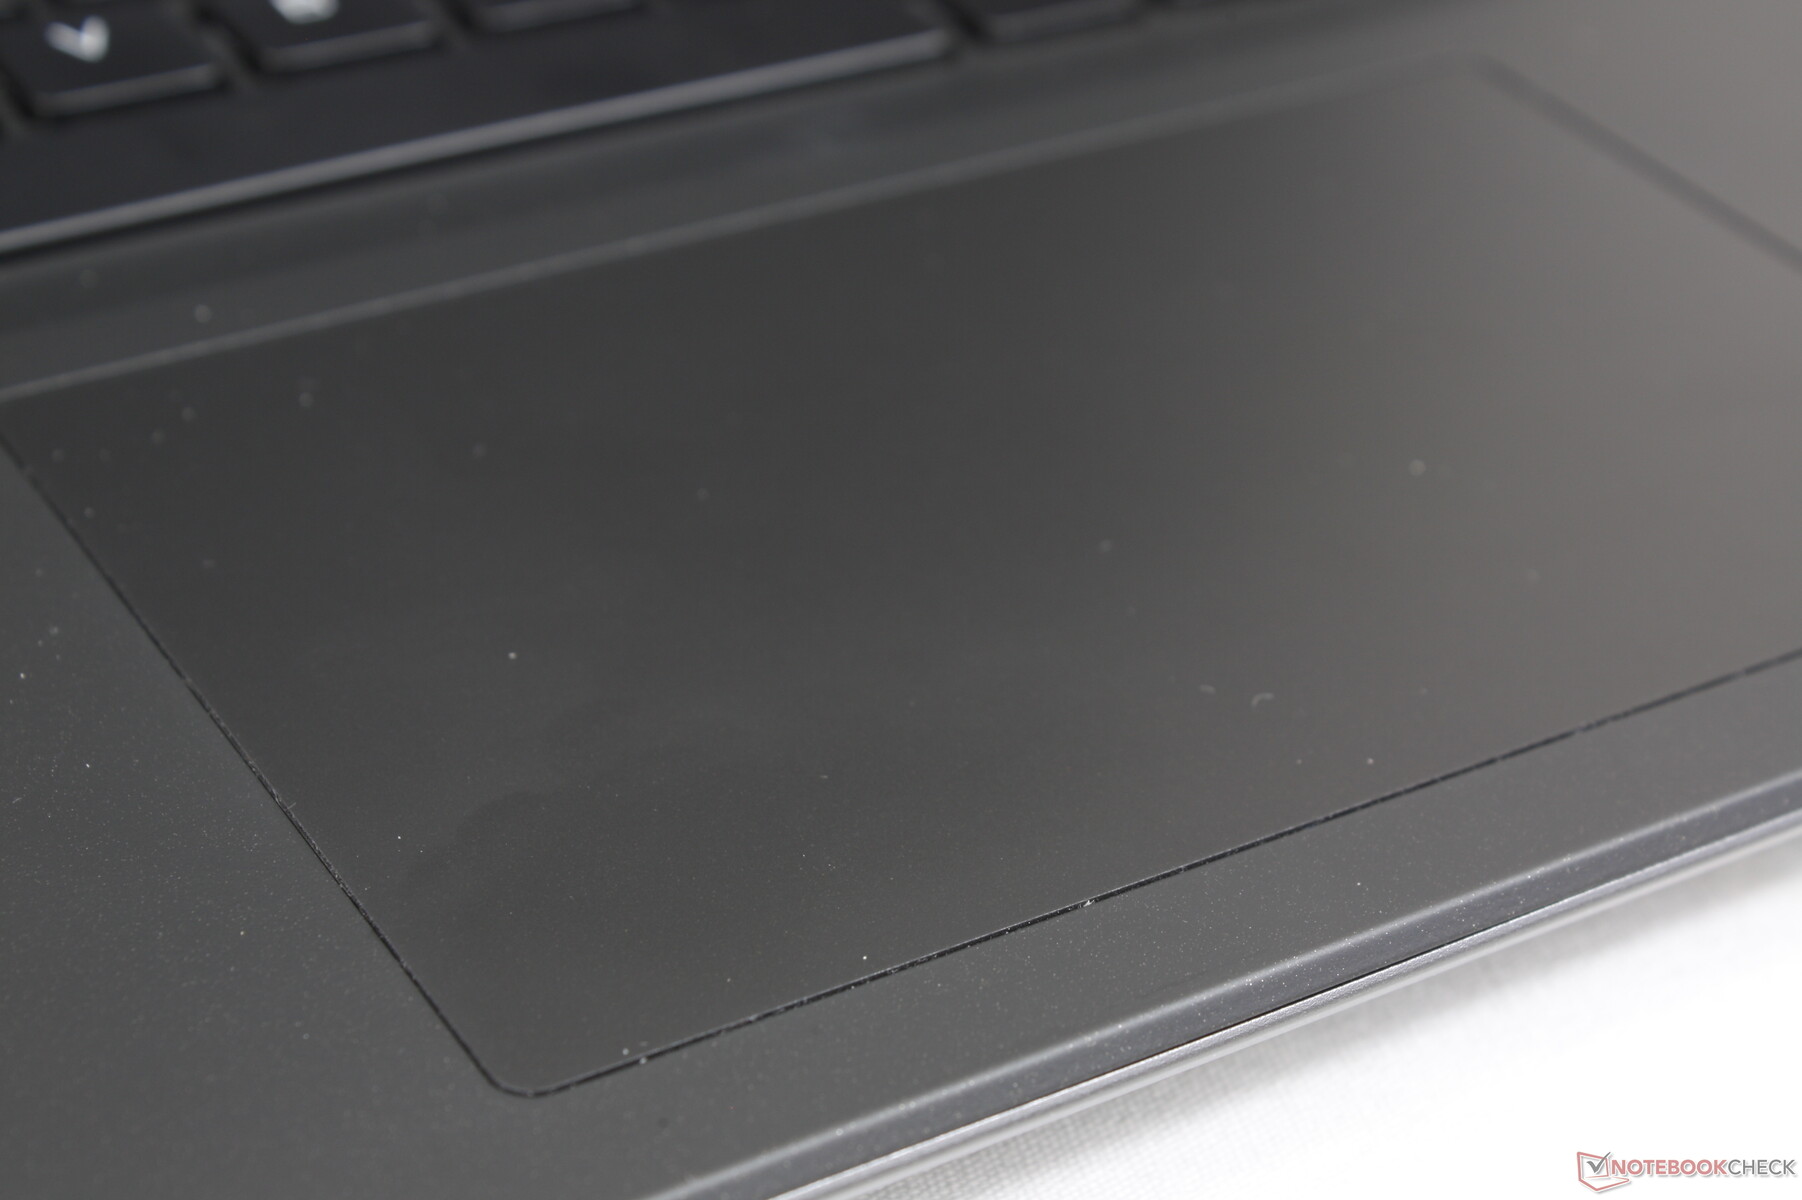
Pekplatta
Ytan är nästan identisk med klickplattan på MSI GE78 (13,2 x 8 cm jämfört med 13 x 8,2 cm) trots Alienwares större 18-tumsformfaktor. Även om dragningen är jämn med minimal kladdighet när man glider, är återkopplingen när man klickar på den mjuka sidan vilket gör upplevelsen otillfredsställande. Dubbelklick kan också kännas tröttsamt eftersom varje klick kräver lite mer kraft från fingret än på de flesta andra bärbara datorer.
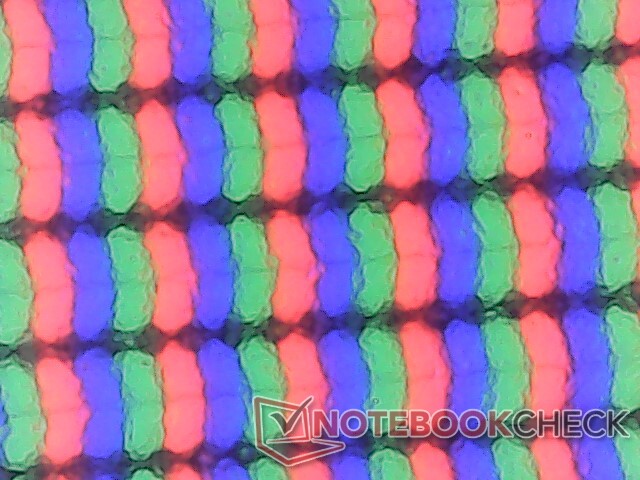
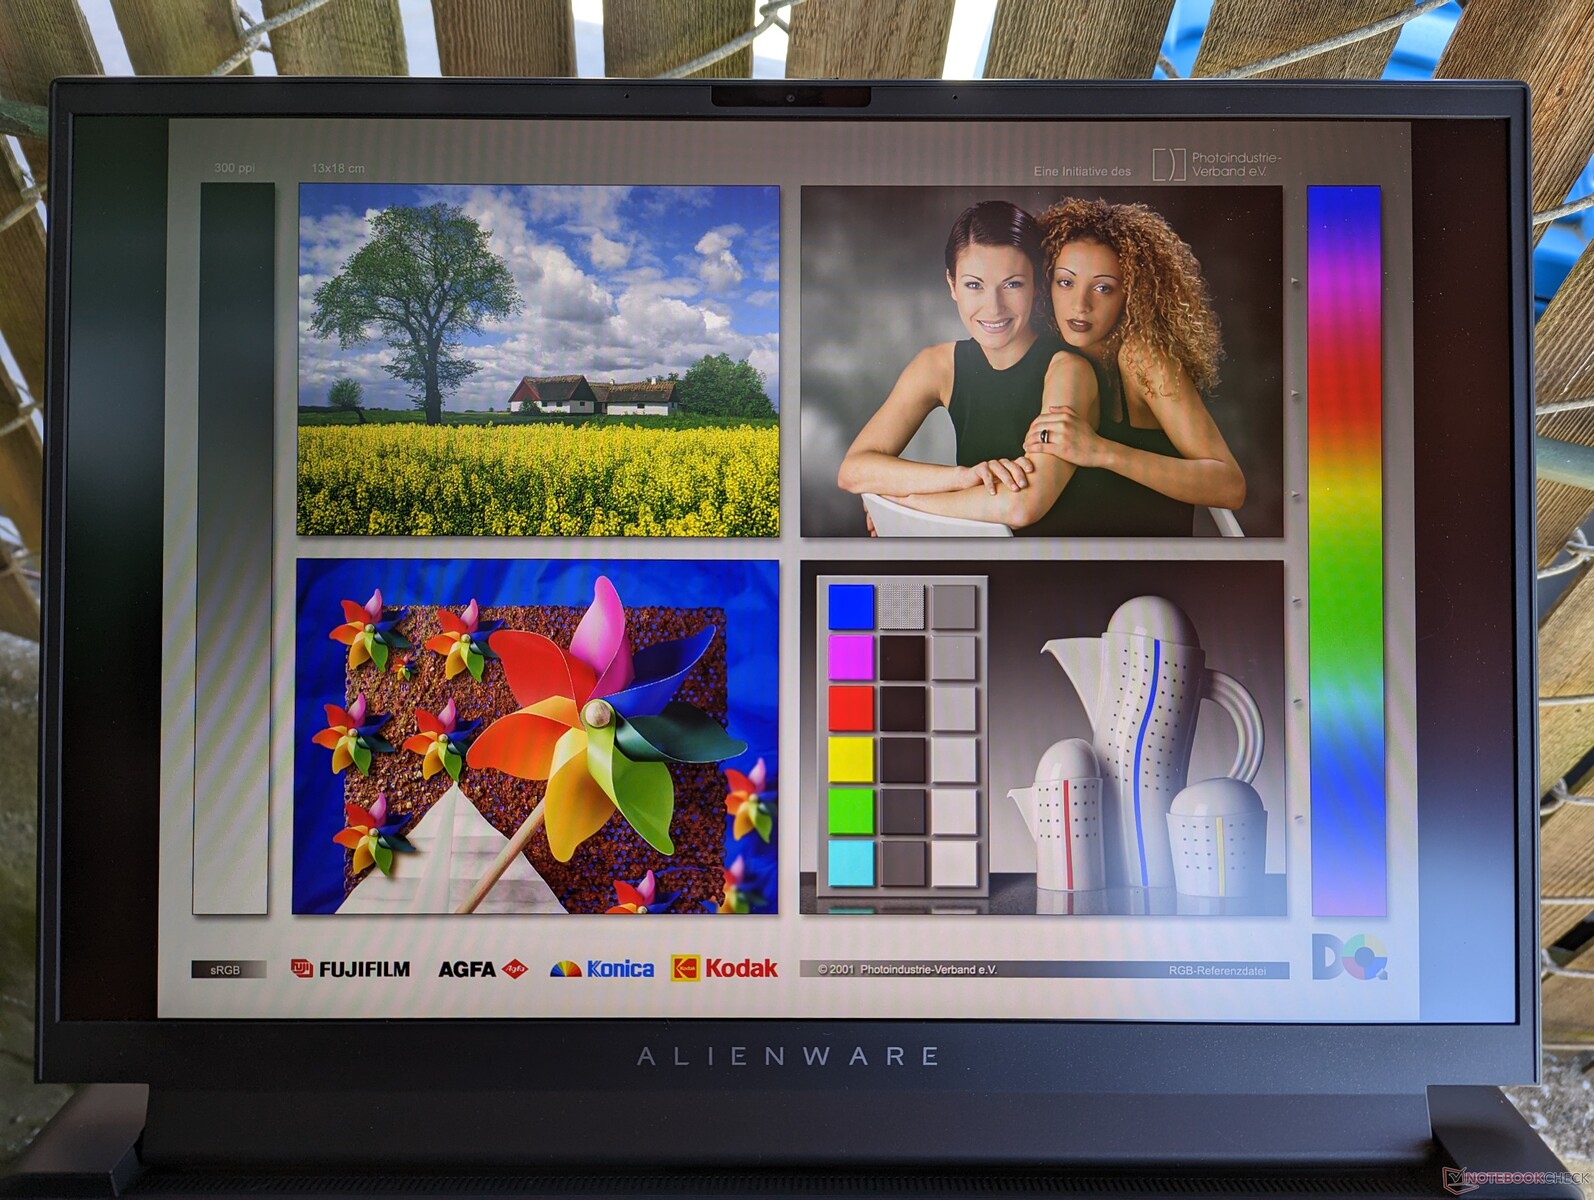
Skärm - extremt snabb uppdateringsfrekvens på 480 Hz
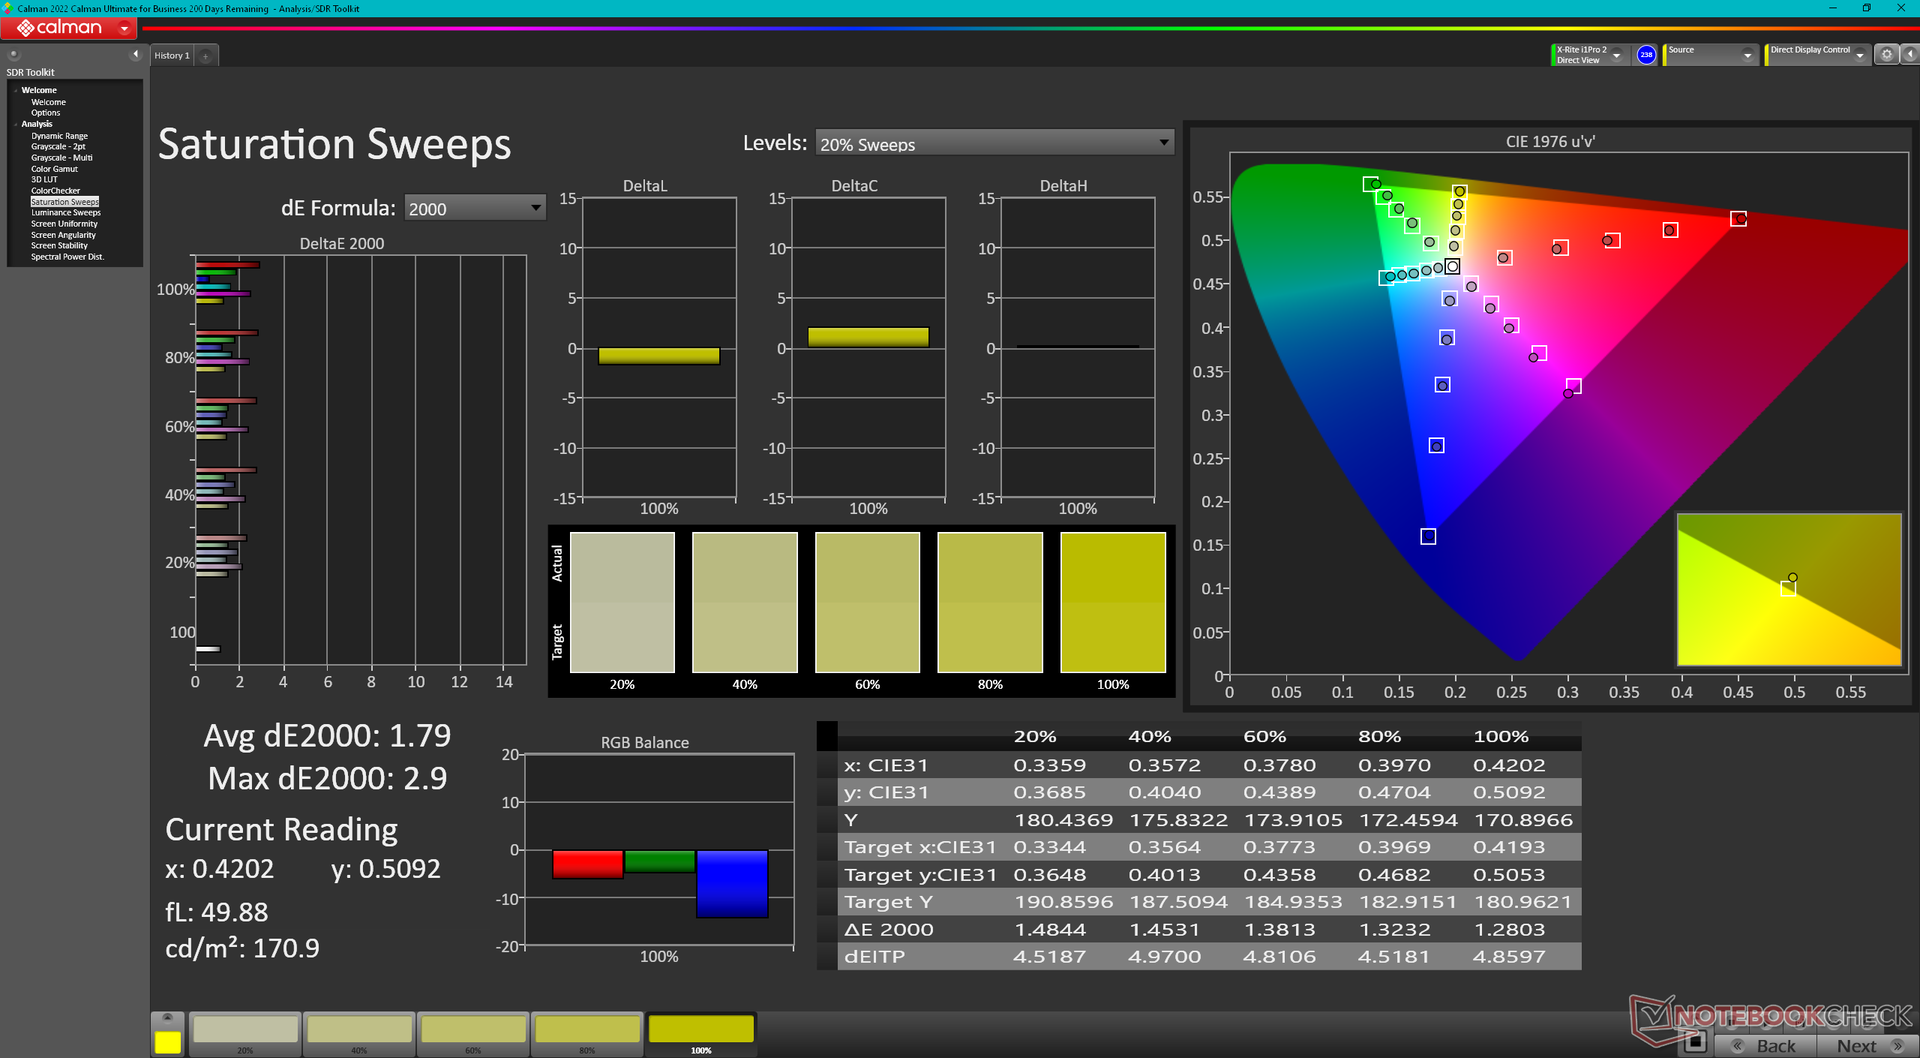
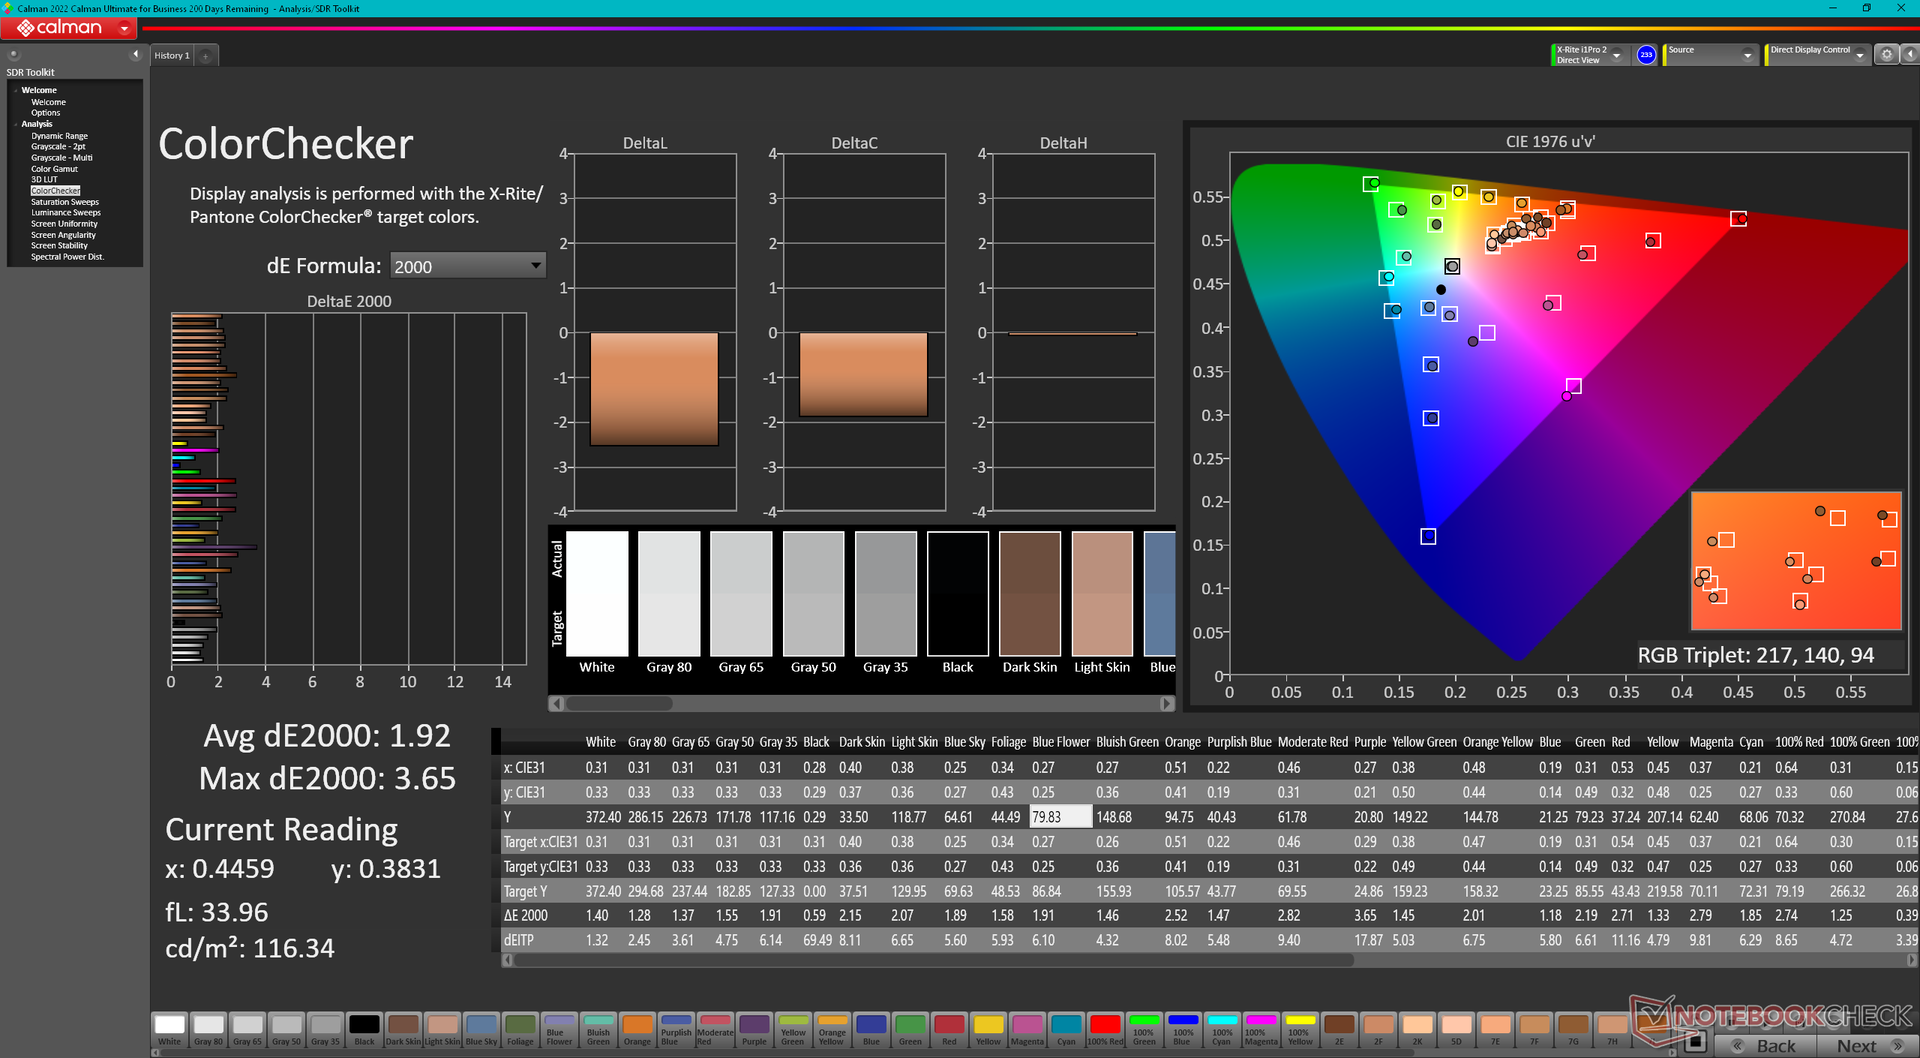
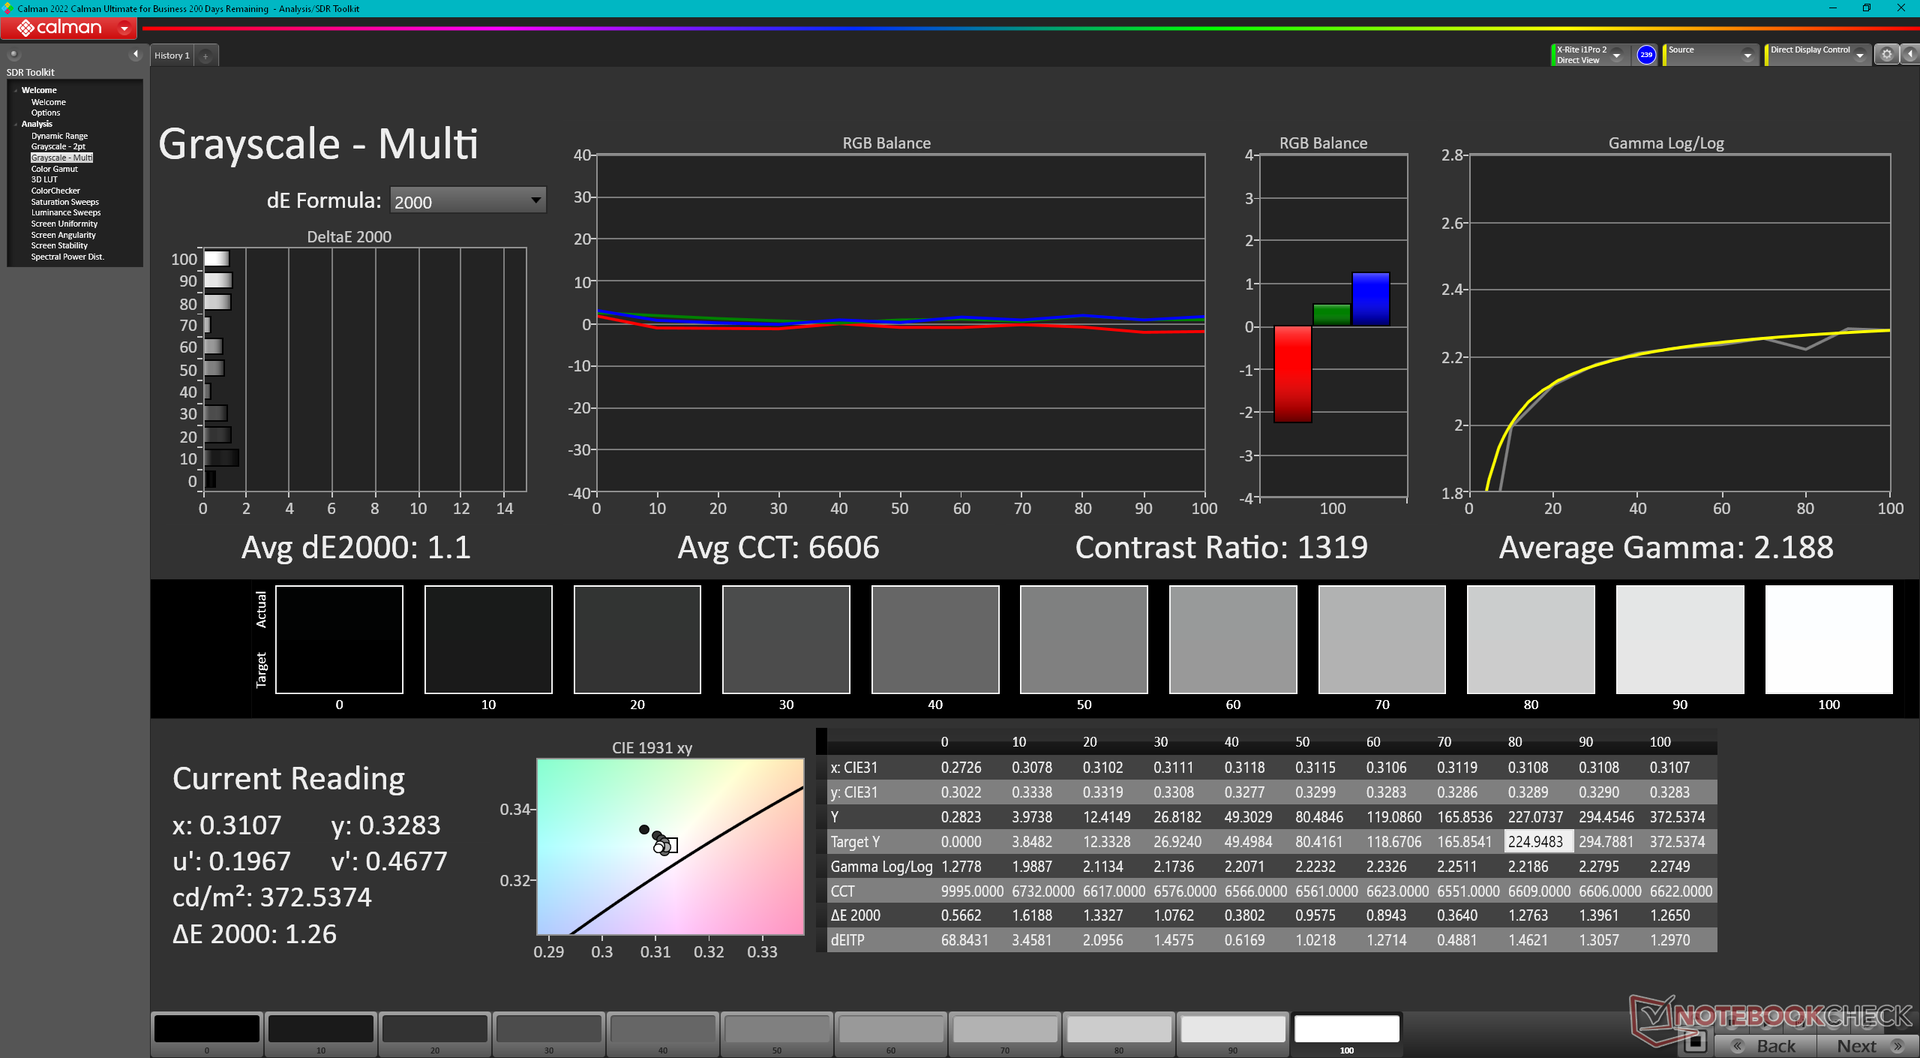
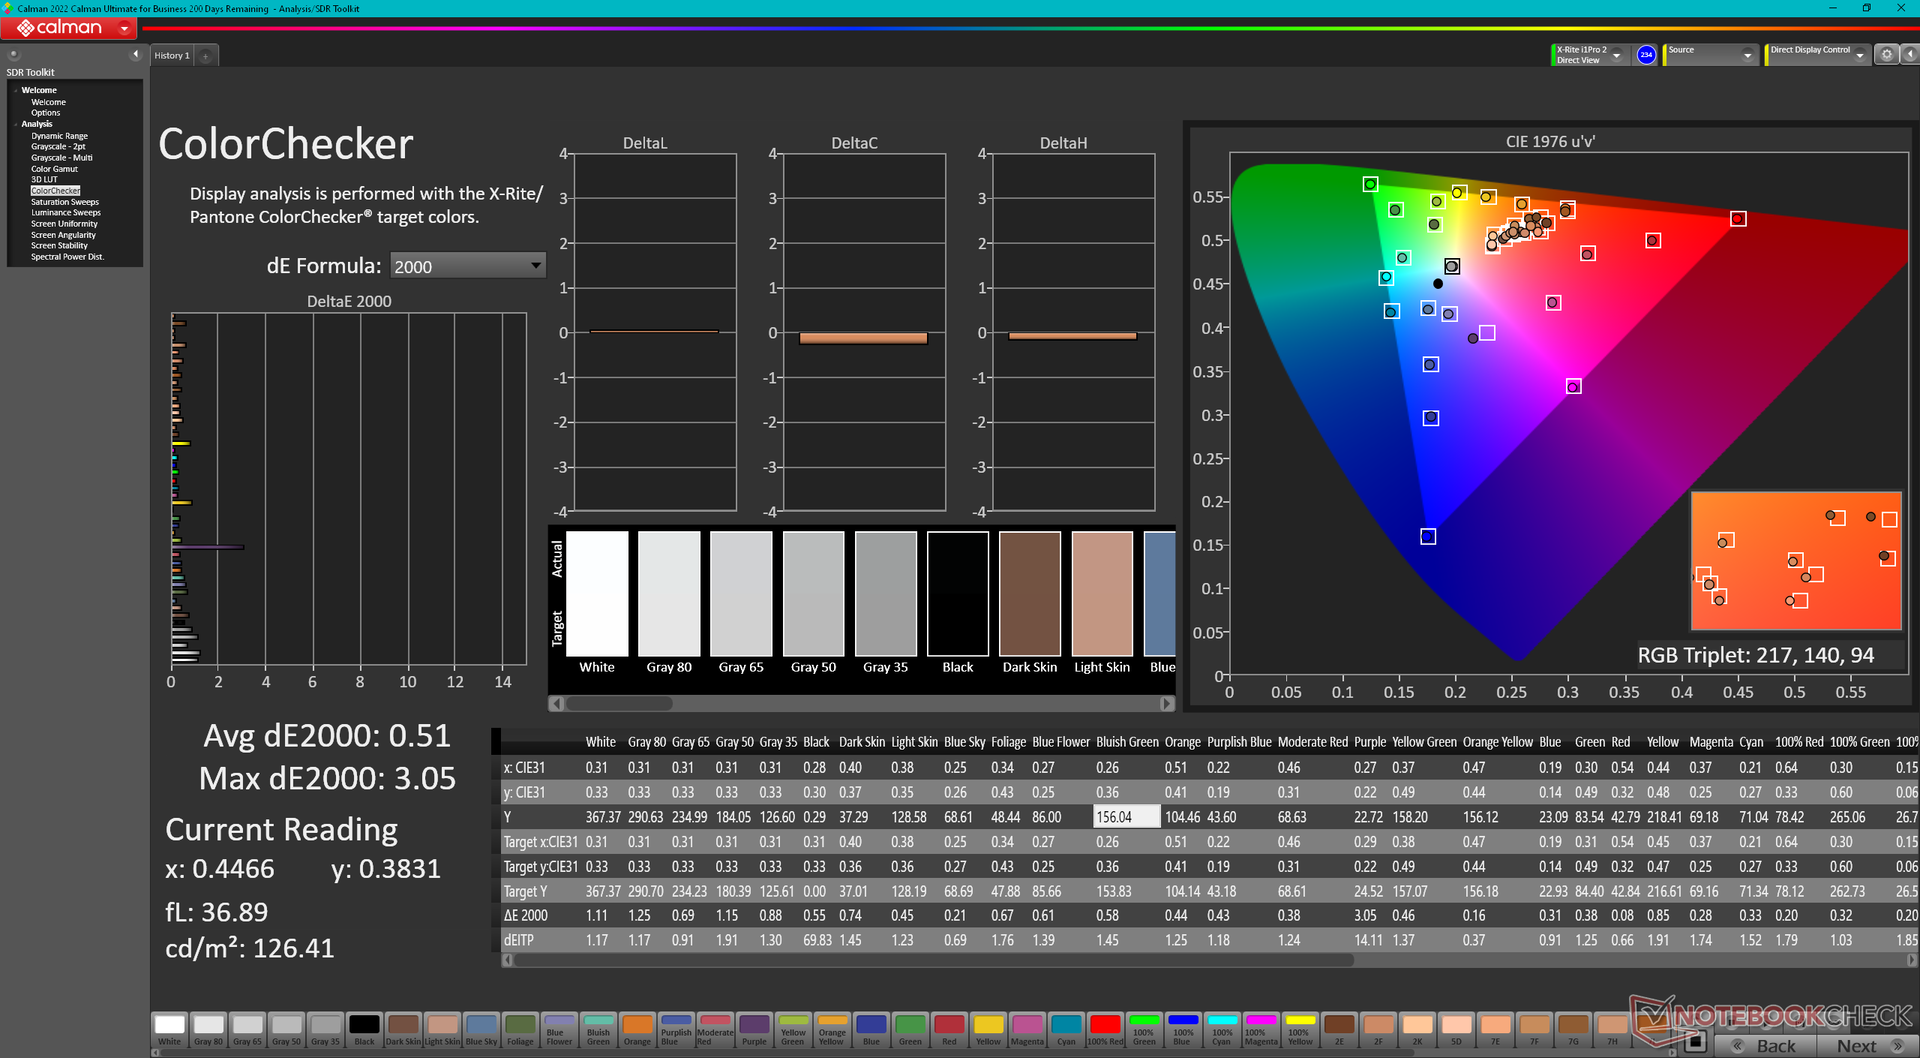
Alienware levereras med en 1200p Chi Mei 180JME-panel till skillnad från 1600p AU Optronics B180QAN01.0 eller BOE NE180QDM-paneler påRazer Blade 18 och Asus ROG Strix Scar 18. Den unika egenskapen som skiljer den här Chi Mei-panelen från de andra två är dess 2x snabbare ursprungliga uppdateringsfrekvens på 480 Hz istället för 240 Hz. I övrigt har alla tre panelerna liknande färgtäckningar, pixelsvarstider och kontrastförhållanden. De fulla P3-färgerna och den snabba uppdateringsfrekvensen gör att just den här Alienware-modellen lämpar sig för både spel och grafikredigering.
Ett andra bildskärmsalternativ finns tillgängligt med en högre 1600p nativ upplösning men lägre 165 Hz uppdateringsfrekvens.
| |||||||||||||||||||||||||
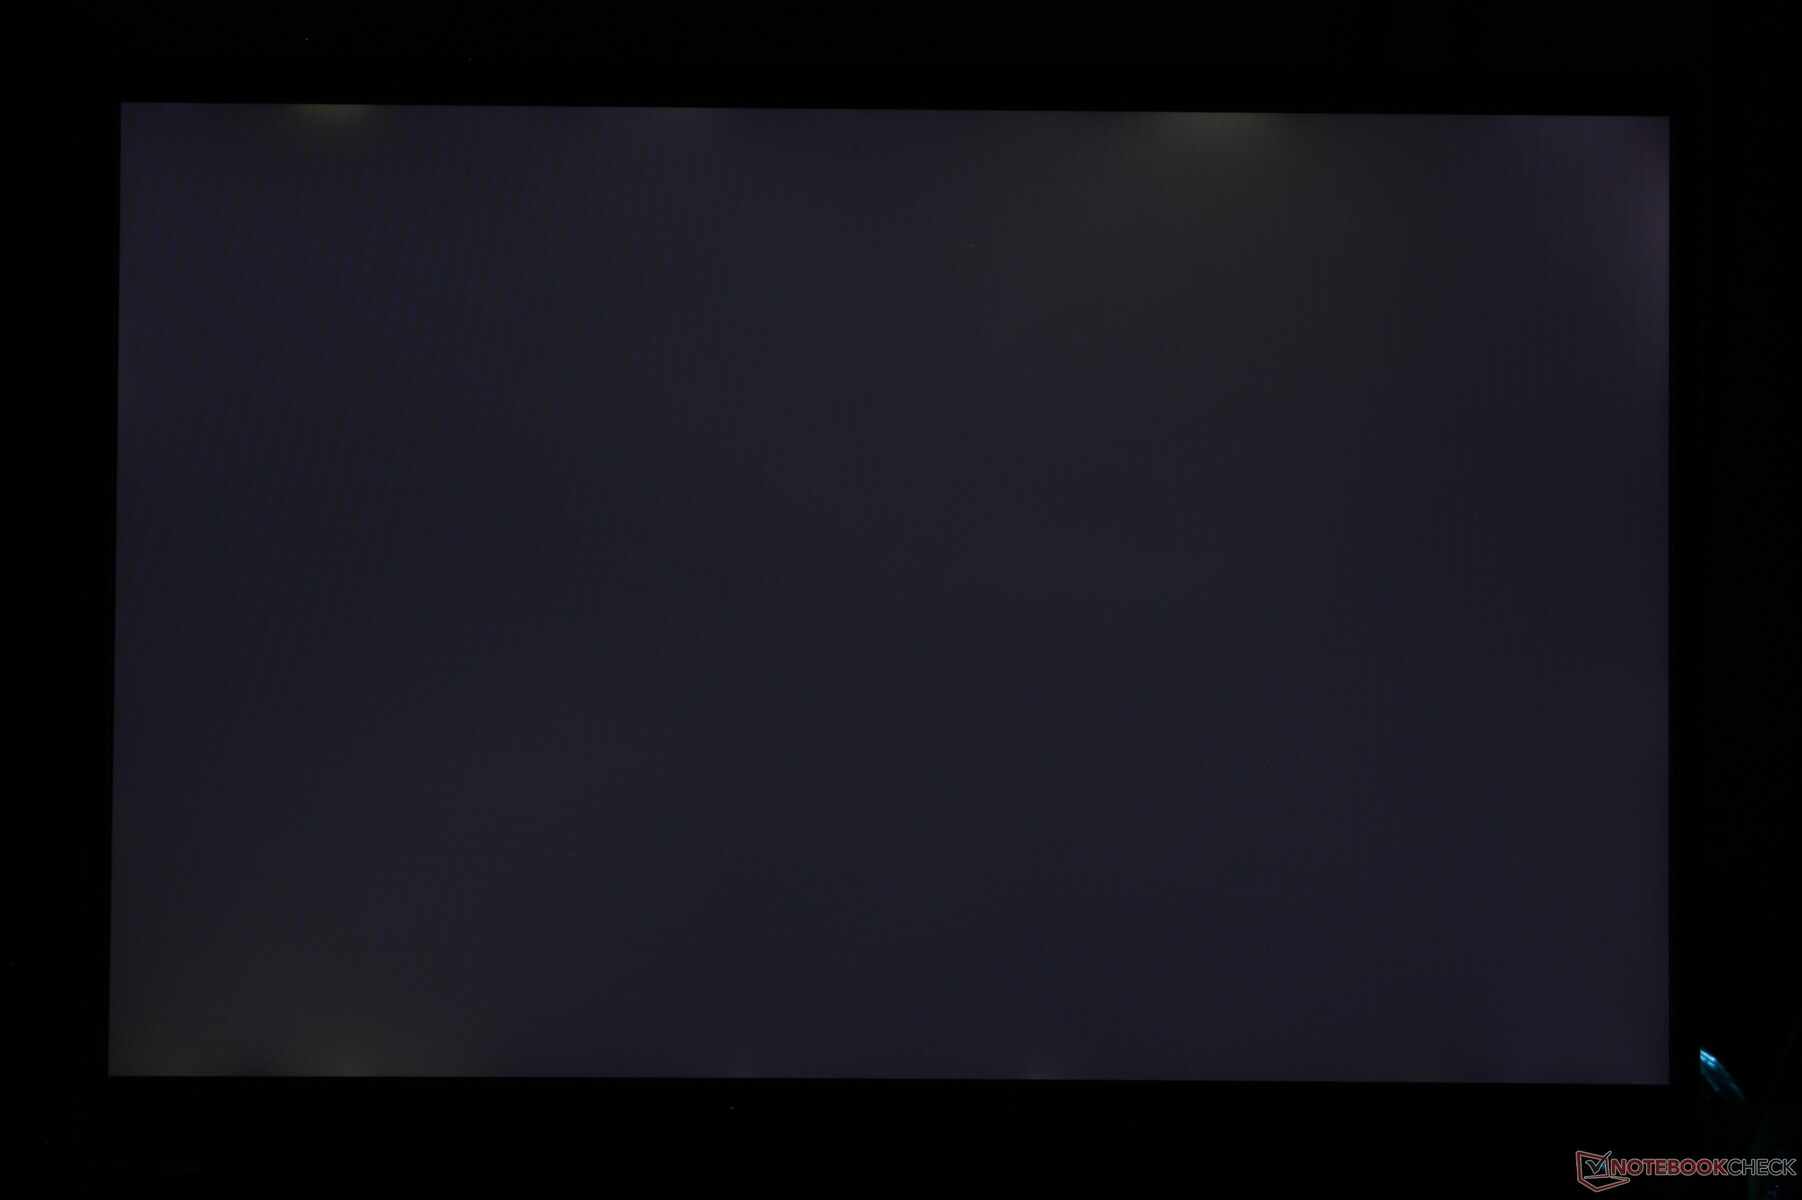
Distribution av ljusstyrkan: 97 %
Mitt på batteriet: 372.8 cd/m²
Kontrast: 1165:1 (Svärta: 0.32 cd/m²)
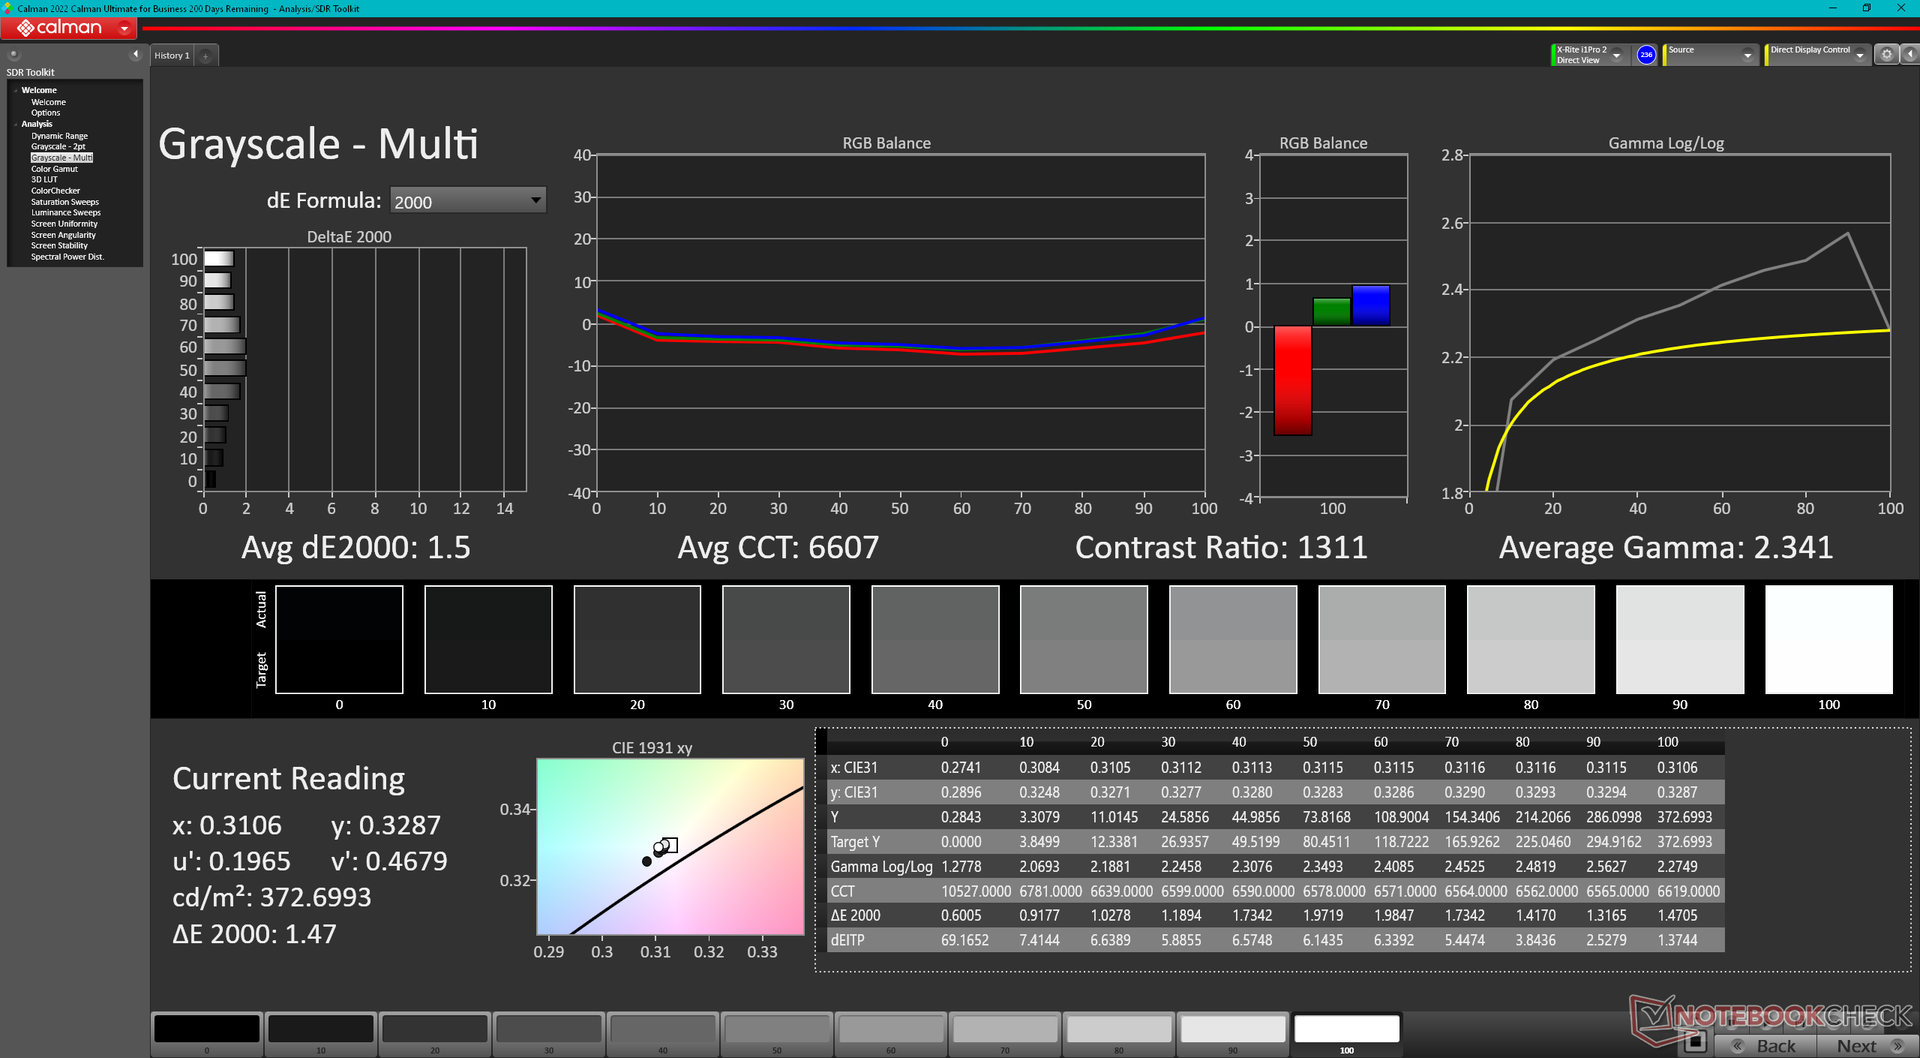
ΔE ColorChecker Calman: 1.92 | ∀{0.5-29.43 Ø4.72}
calibrated: 0.51
ΔE Greyscale Calman: 1.5 | ∀{0.09-98 Ø4.97}
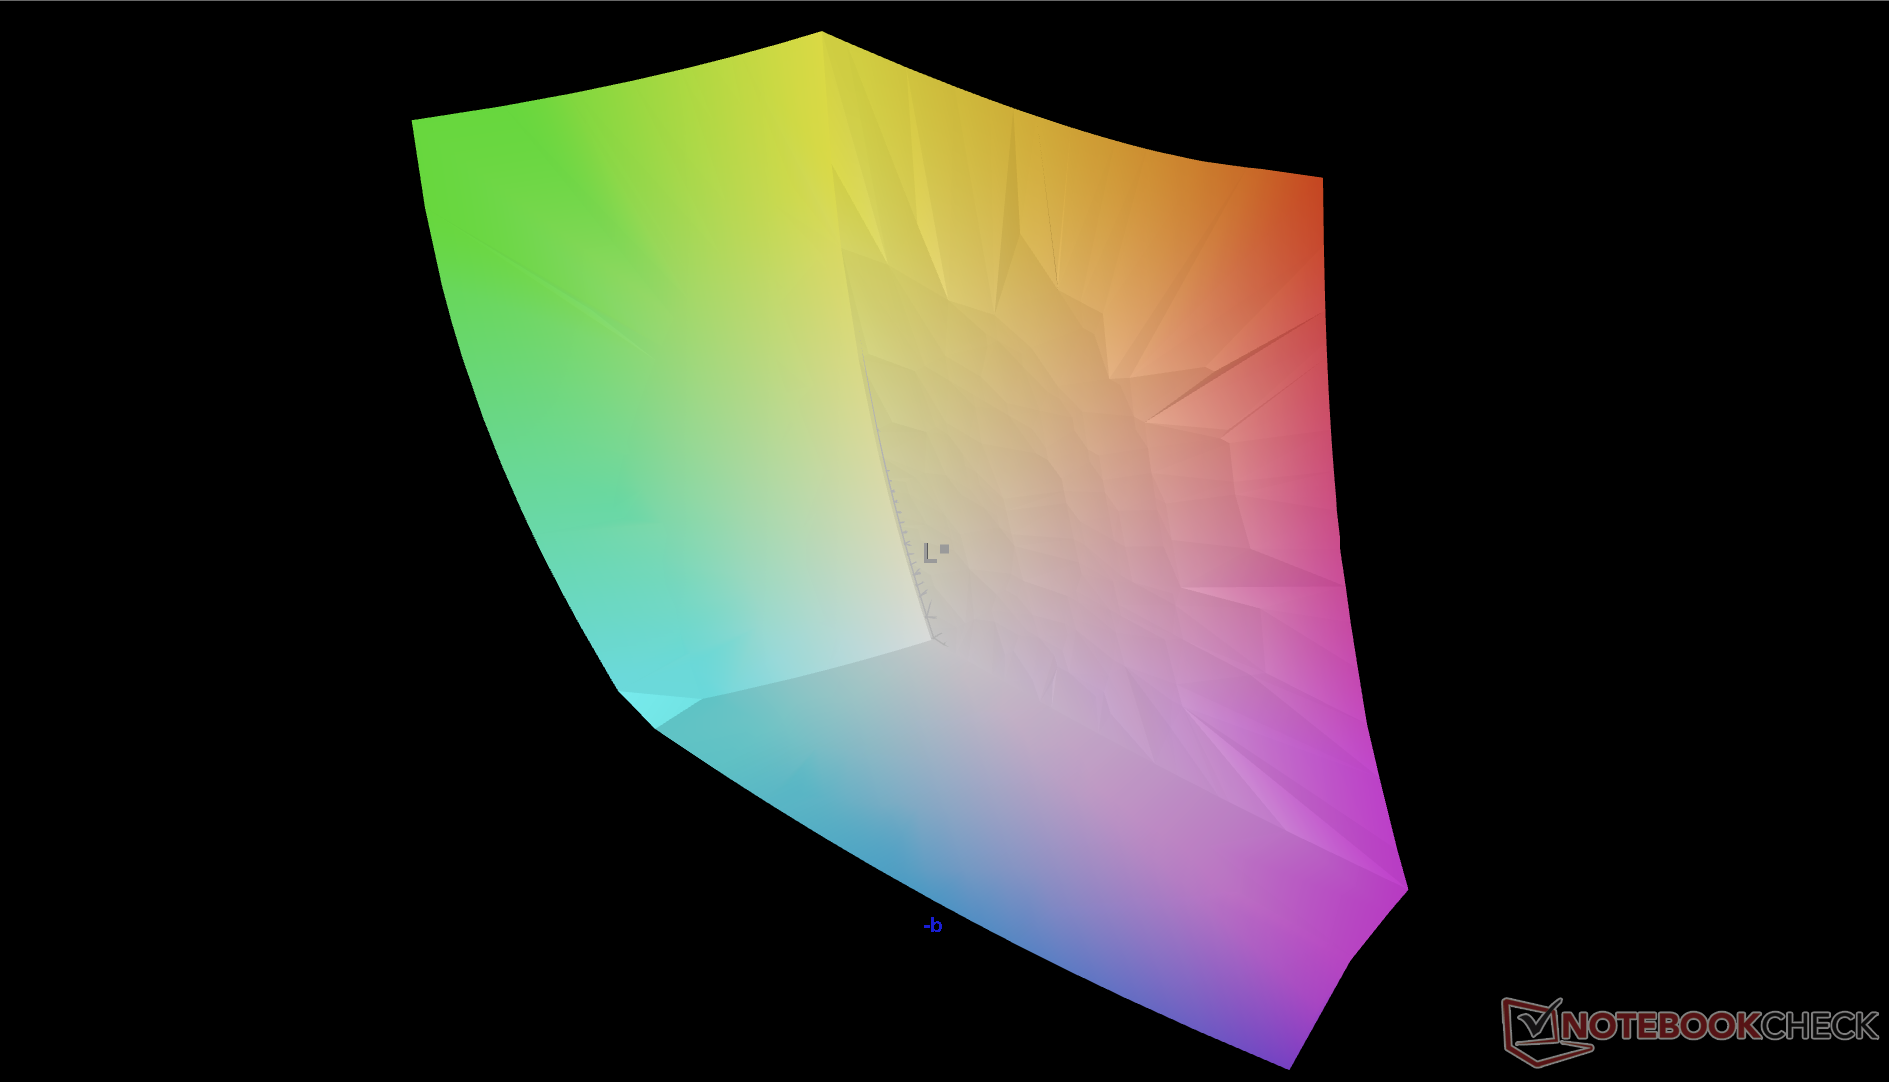
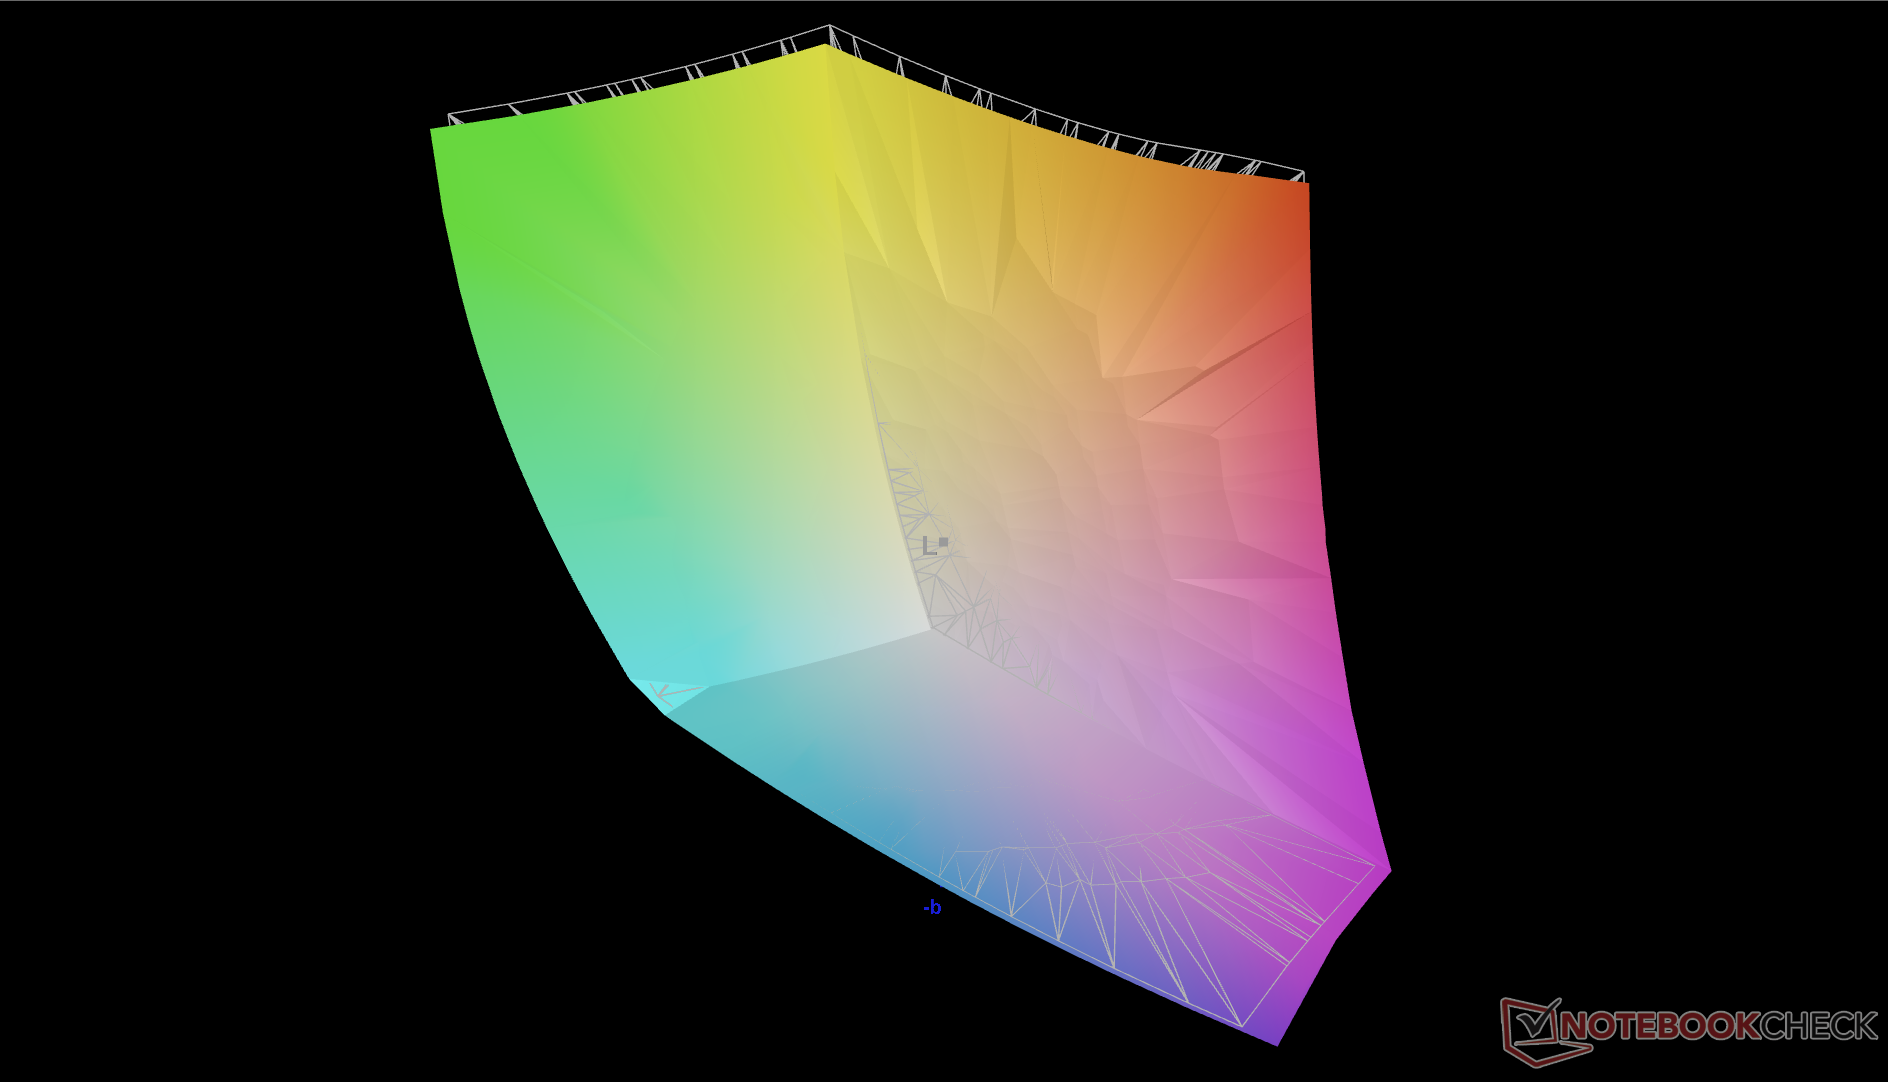
89.8% AdobeRGB 1998 (Argyll 3D)
100% sRGB (Argyll 3D)
97.7% Display P3 (Argyll 3D)
Gamma: 2.34
CCT: 6607 K
| Alienware m18 R1 Chi Mei 180JME, IPS, 1920x1200, 18" | Razer Blade 18 RTX 4070 AU Optronics B180QAN01.0, IPS, 2560x1600, 18" | Asus ROG Strix Scar 18 2023 G834JY-N6005W NE180QDM-NZ2, IPS, 2560x1600, 18" | Eluktronics Mech-17 GP2 BOE NE170QDM-NZ1, IPS, 2560x1600, 17" | MSI Titan GT77 HX 13VI B173ZAN06.C, Mini-LED, 3840x2160, 17.3" | Alienware x17 R2 P48E AU Optronics B173HAN, IPS, 1920x1080, 17.3" | |
|---|---|---|---|---|---|---|
| Display | -2% | -2% | -17% | 0% | -10% | |
| Display P3 Coverage (%) | 97.7 | 96.9 -1% | 97.2 -1% | 69.1 -29% | 94.9 -3% | 79.2 -19% |
| sRGB Coverage (%) | 100 | 99.8 0% | 99.9 0% | 99.7 0% | 99.9 0% | 99.8 0% |
| AdobeRGB 1998 Coverage (%) | 89.8 | 85.3 -5% | 84.9 -5% | 69.8 -22% | 92.4 3% | 79.6 -11% |
| Response Times | -11% | -34% | -148% | -675% | -153% | |
| Response Time Grey 50% / Grey 80% * (ms) | 3 ? | 4.2 ? -40% | 5.41 ? -80% | 12 ? -300% | 38.4 ? -1180% | 12.4 ? -313% |
| Response Time Black / White * (ms) | 9.9 ? | 8 ? 19% | 8.62 ? 13% | 9.4 ? 5% | 26.6 ? -169% | 9.2 ? 7% |
| PWM Frequency (Hz) | 2380 ? | |||||
| Screen | -68% | -141% | -17% | 57715% | -48% | |
| Brightness middle (cd/m²) | 372.8 | 549.6 47% | 490 31% | 417.3 12% | 606 63% | 365.4 -2% |
| Brightness (cd/m²) | 367 | 524 43% | 468 28% | 387 5% | 602 64% | 344 -6% |
| Brightness Distribution (%) | 97 | 89 -8% | 86 -11% | 87 -10% | 93 -4% | 85 -12% |
| Black Level * (cd/m²) | 0.32 | 0.53 -66% | 0.54 -69% | 0.42 -31% | 0.0001 100% | 0.29 9% |
| Contrast (:1) | 1165 | 1037 -11% | 907 -22% | 994 -15% | 6060000 520072% | 1260 8% |
| Colorchecker dE 2000 * | 1.92 | 3.32 -73% | 4.97 -159% | 2.14 -11% | 4.8 -150% | 3.17 -65% |
| Colorchecker dE 2000 max. * | 3.65 | 6.63 -82% | 11.02 -202% | 4.09 -12% | 8.2 -125% | 7.69 -111% |
| Colorchecker dE 2000 calibrated * | 0.51 | 2.7 -429% | 2.97 -482% | 0.42 18% | 1.8 -253% | 0.51 -0% |
| Greyscale dE 2000 * | 1.5 | 2 -33% | 7.2 -380% | 3.1 -107% | 6.5 -333% | 5.3 -253% |
| Gamma | 2.34 94% | 2.29 96% | 2.161 102% | 2.19 100% | 2.63 84% | 2.18 101% |
| CCT | 6607 98% | 6319 103% | 6515 100% | 6040 108% | 6596 99% | 5879 111% |
| Totalt genomsnitt (program/inställningar) | -27% /
-46% | -59% /
-96% | -61% /
-36% | 19013% /
37006% | -70% /
-55% |
* ... mindre är bättre
Skärmen är förkalibrerad för exakta färger och gråskalor. Att kalibrera panelen ytterligare skulle inte förbättra de genomsnittliga deltaE-värdena nämnvärt och därför är en kalibrering för slutanvändaren inte nödvändig.

Visa svarstider
| ↔ Svarstid svart till vitt | ||
|---|---|---|
| 9.9 ms ... stiga ↗ och falla ↘ kombinerat | ↗ 5.4 ms stiga | 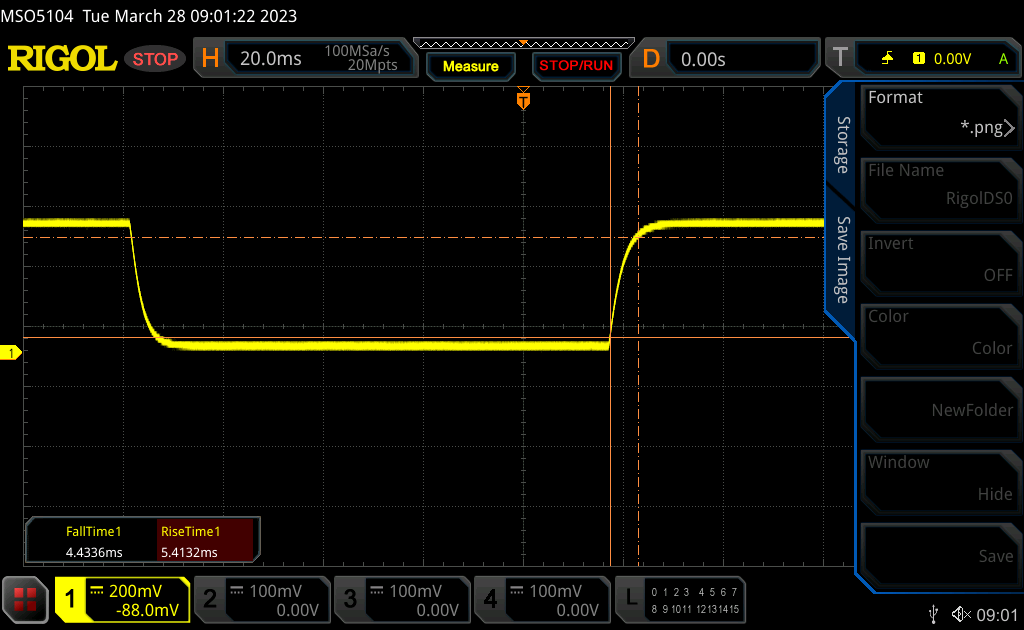 |
| ↘ 4.5 ms hösten | ||
| Skärmen visar snabba svarsfrekvenser i våra tester och bör passa för spel. I jämförelse sträcker sig alla testade enheter från 0.1 (minst) till 240 (maximalt) ms. » 27 % av alla enheter är bättre. Det betyder att den uppmätta svarstiden är bättre än genomsnittet av alla testade enheter (19.8 ms). | ||
| ↔ Svarstid 50 % grått till 80 % grått | ||
| 3 ms ... stiga ↗ och falla ↘ kombinerat | ↗ 1.5 ms stiga | 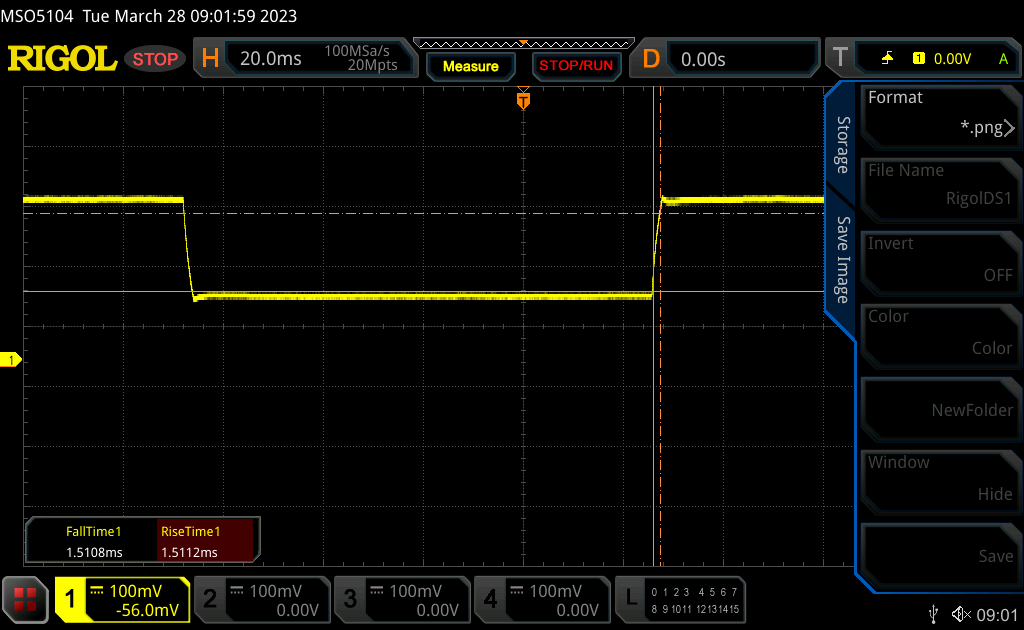 |
| ↘ 1.5 ms hösten | ||
| Skärmen visar väldigt snabba svarsfrekvenser i våra tester och borde vara mycket väl lämpad för fartfyllt spel. I jämförelse sträcker sig alla testade enheter från 0.165 (minst) till 636 (maximalt) ms. » 13 % av alla enheter är bättre. Det betyder att den uppmätta svarstiden är bättre än genomsnittet av alla testade enheter (31 ms). | ||
Skärmflimmer / PWM (Puls-Width Modulation)
| Skärmflimmer / PWM upptäcktes inte | 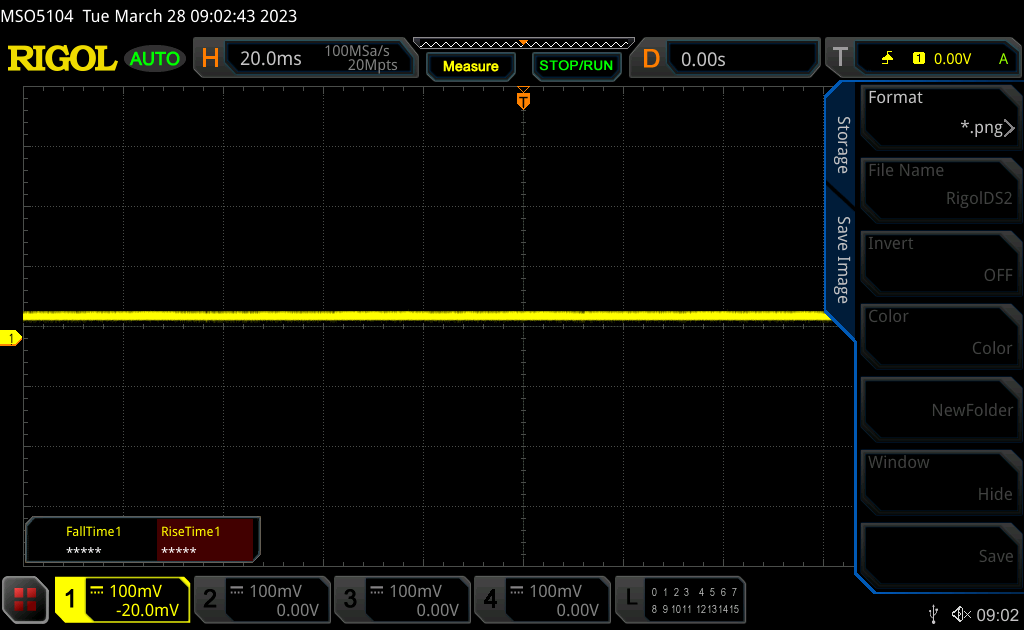 | ||
Som jämförelse: 52 % av alla testade enheter använder inte PWM för att dämpa skärmen. Om PWM upptäcktes mättes ett medelvärde av 7763 (minst: 5 - maximum: 343500) Hz. | |||
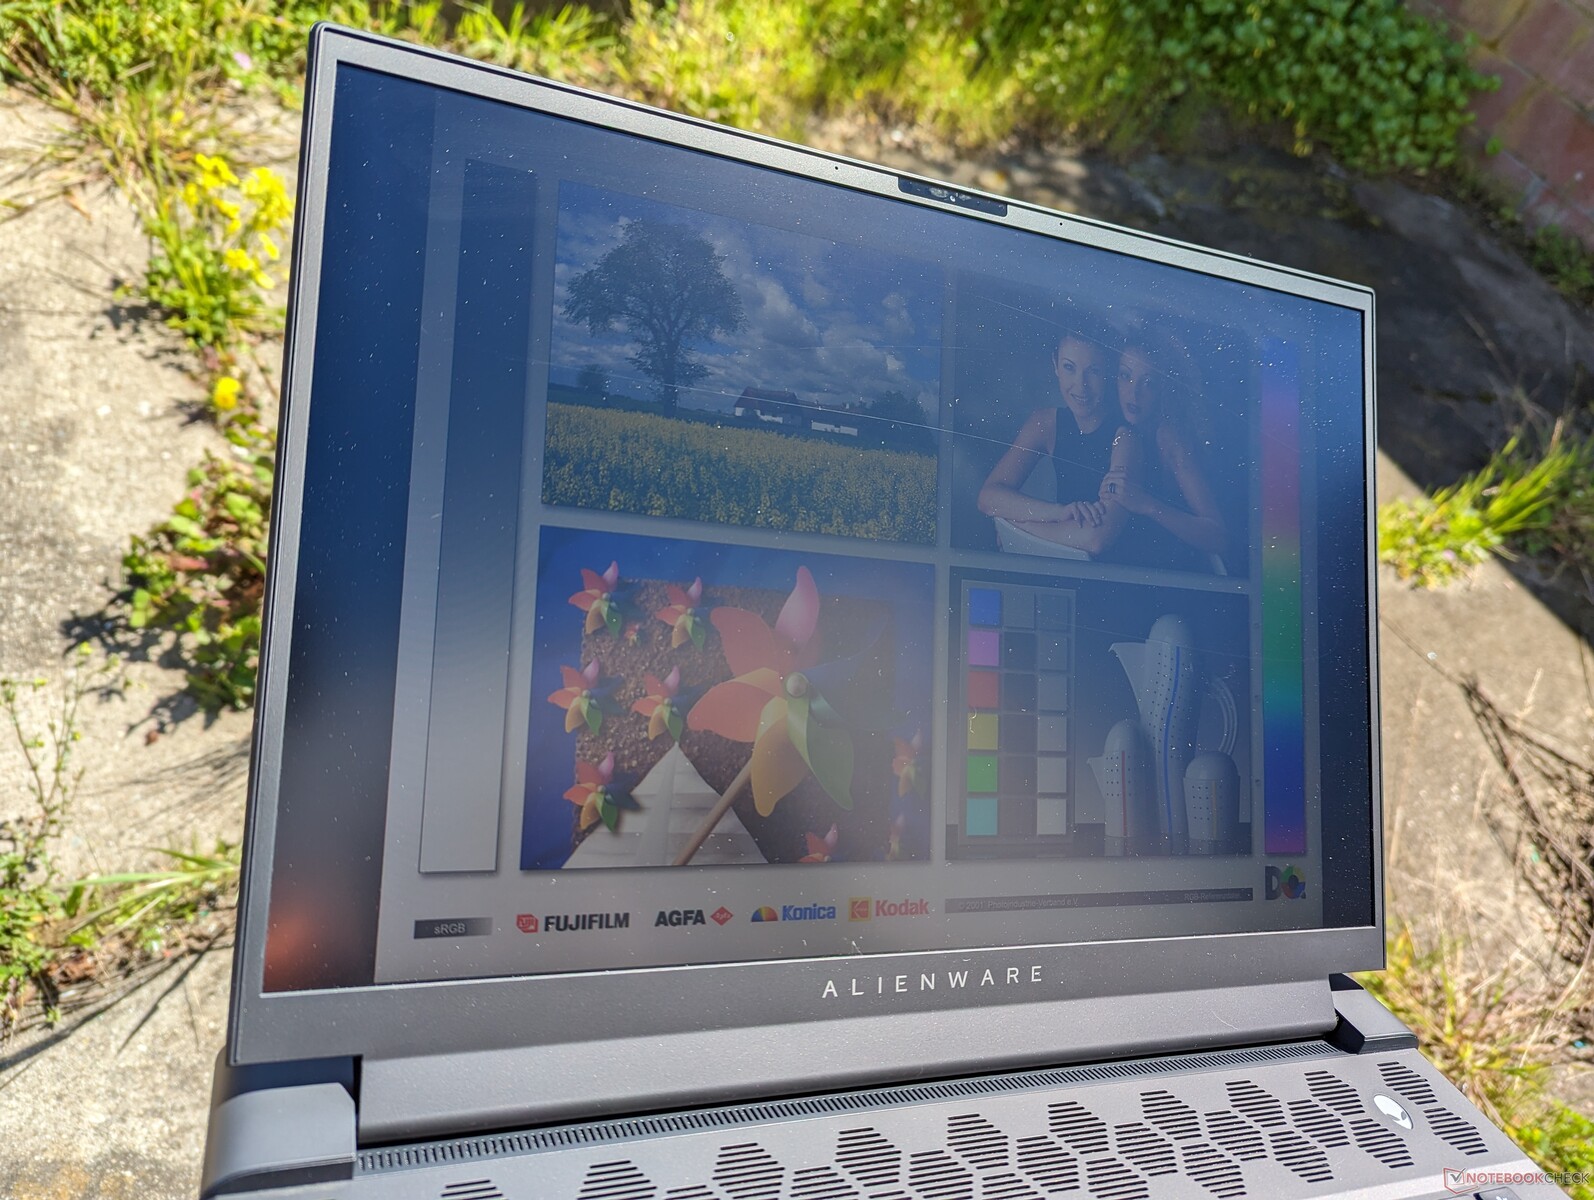
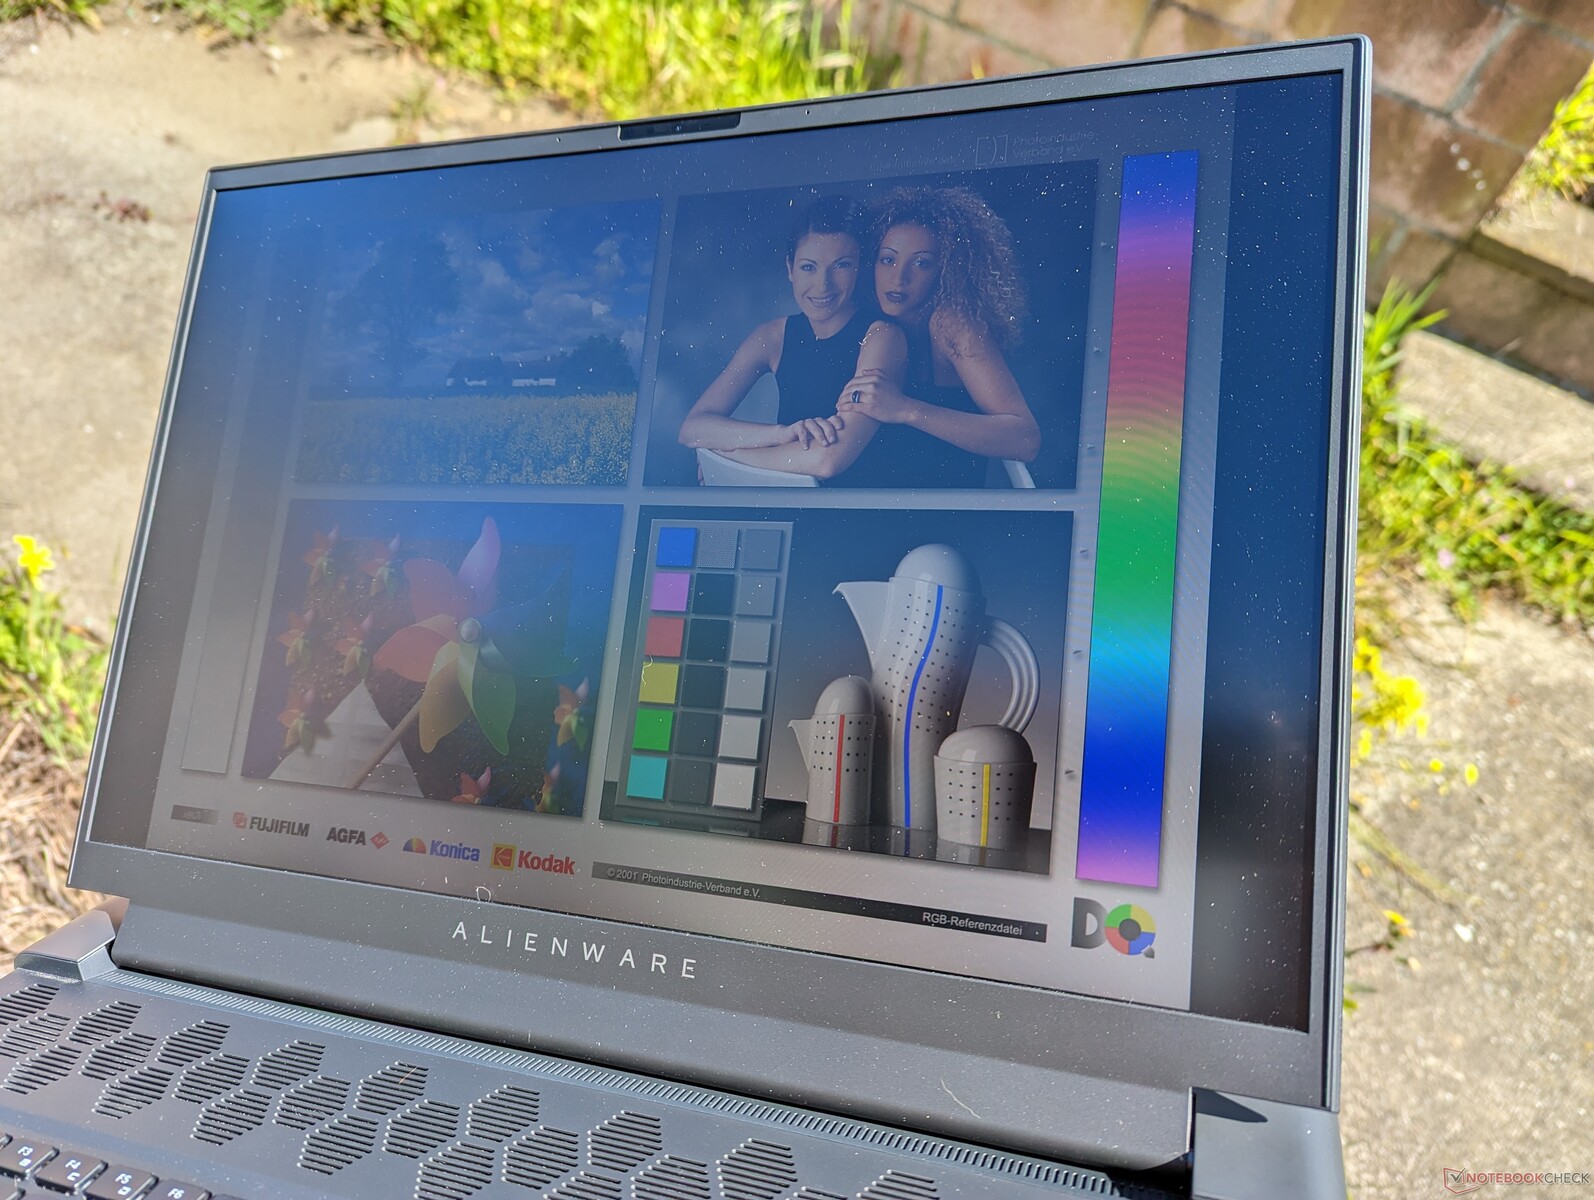
Synligheten utomhus är genomsnittlig för kategorin eftersom skärmarna på de flesta bärbara speldatorer vanligtvis ligger mellan 300 och 400 nits. Alienwares enorma vikt avskräcker dock från användning utomhus. Blade 18 och Titan GT77 är ljusare för bättre synlighet utomhus.
Prestanda - Intel 13th Gen + Nvidia Ada Lovelace
Provningsförhållanden
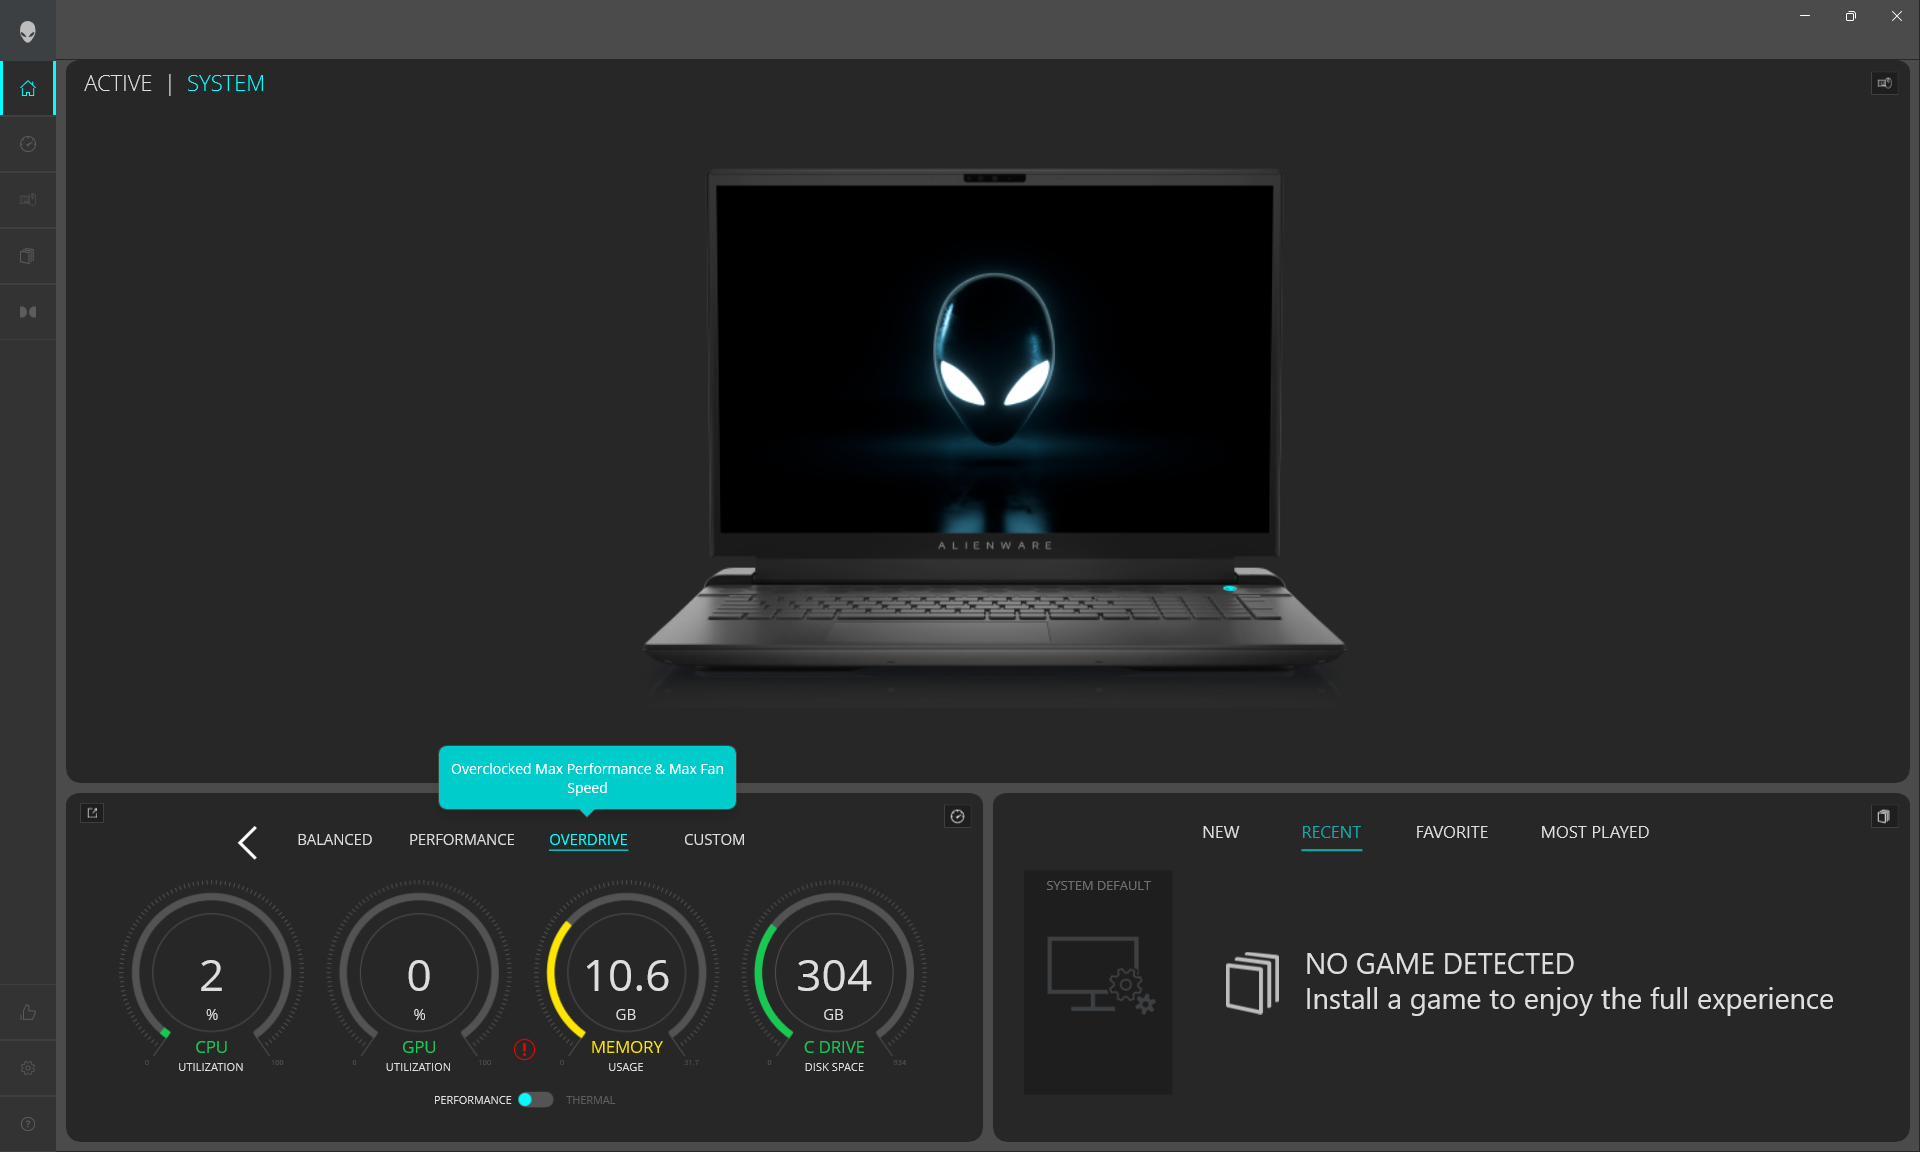
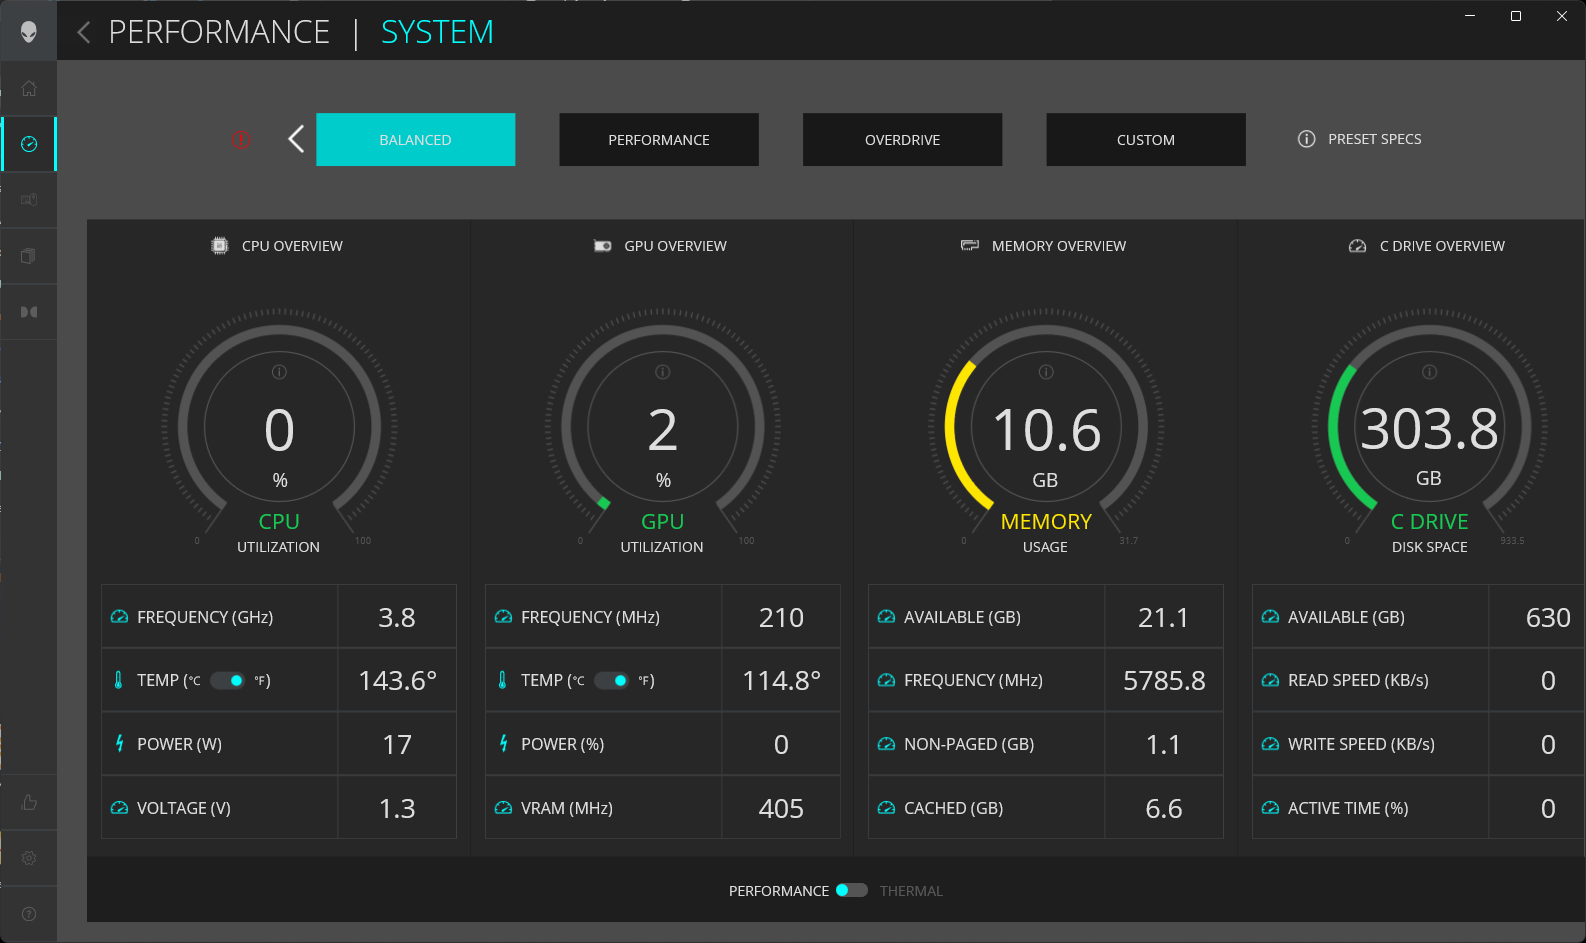
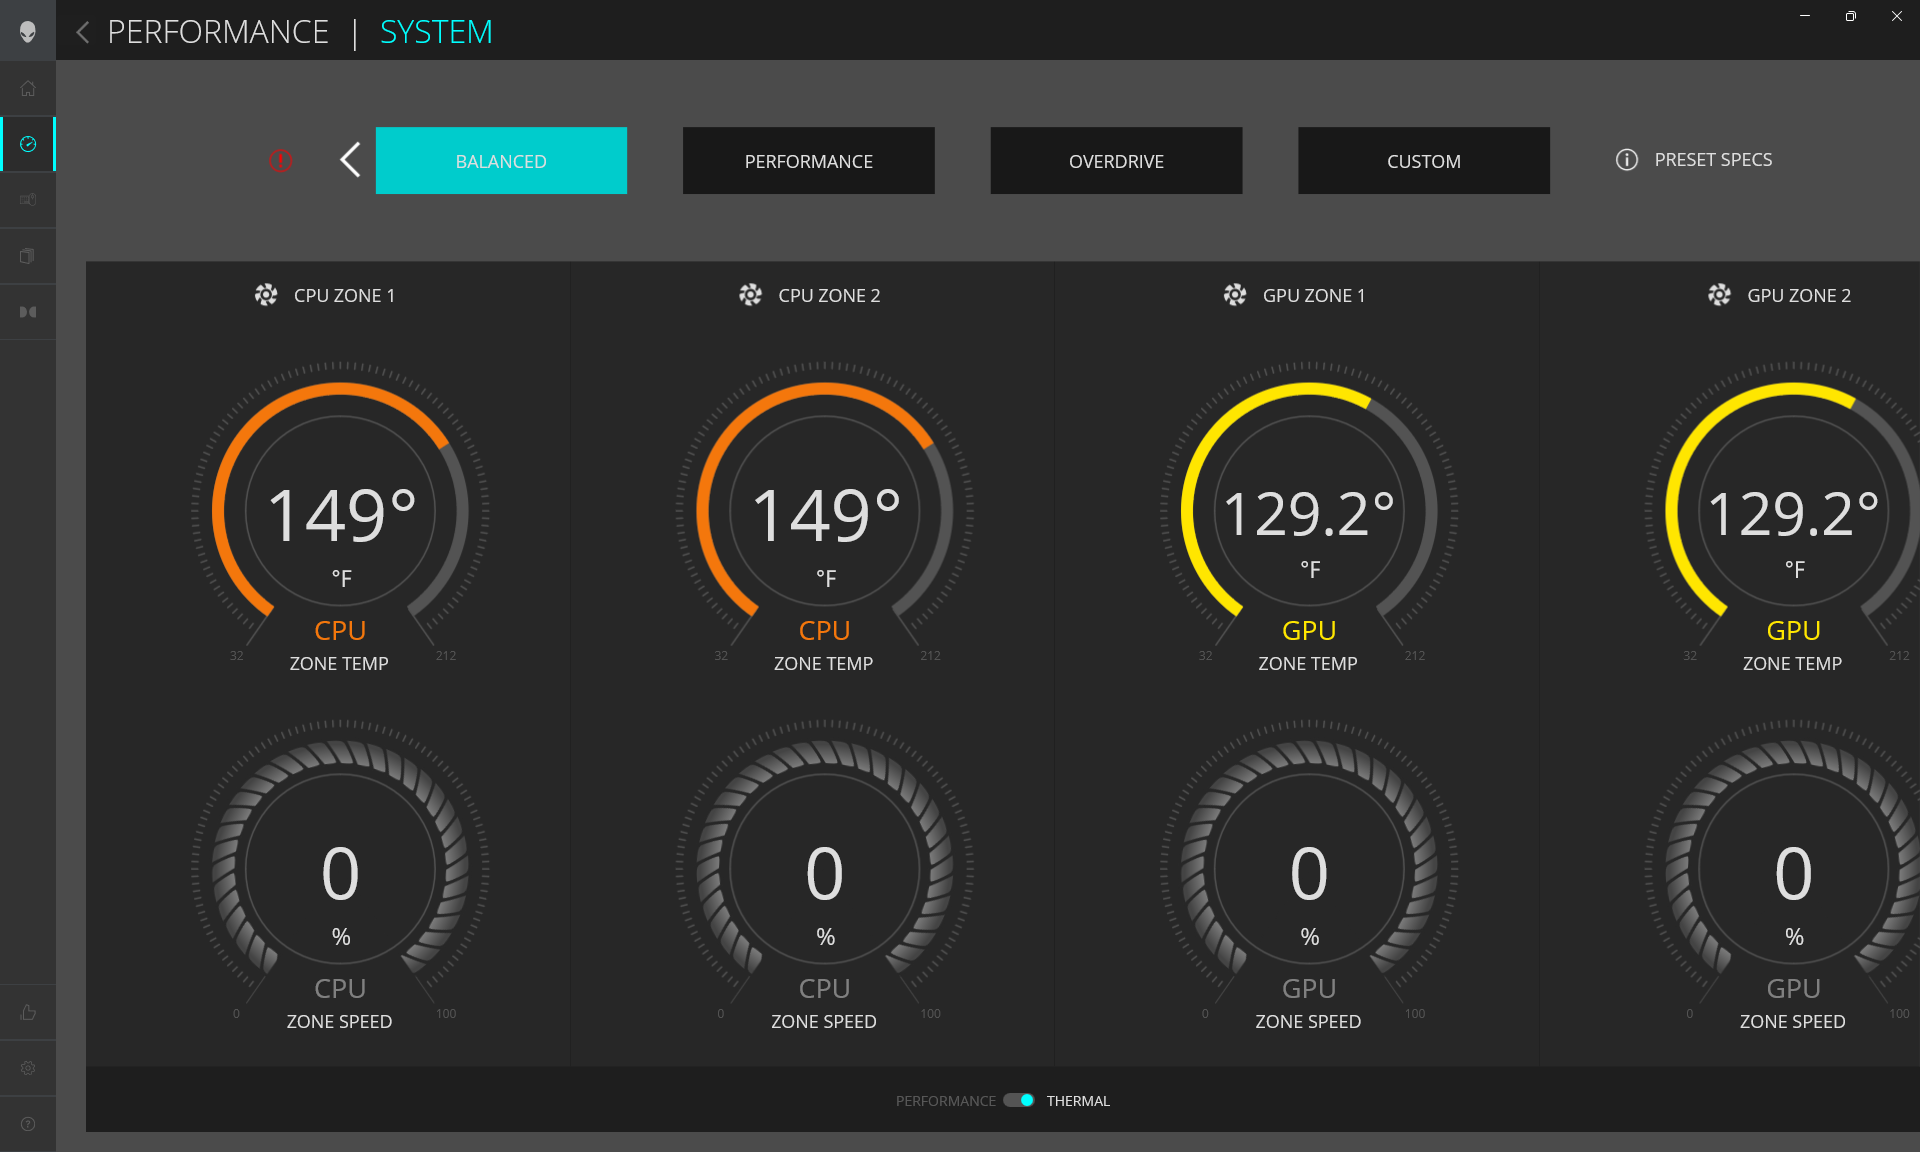
Vi ställde in vår enhet till prestandaläge via Windows, diskret GPU-läge via Nvidias kontrollpanel och Overdrive-läge via Alienwares kommandocentral innan vi körde några av nedanstående riktmärken. Dell har helt förnyat programvaran Command Center i år för att den ska vara enklare att använda och med större teckenstorlekar än tidigare. Den laddas dock fortfarande mycket långsamt, särskilt i jämförelse med de snabbare motsvarigheterna MSI Center eller Schenker Control Center.
Vi upplevde ett par buggar med Alienware Command Center värda att nämna även efter att ha uppdaterat till den senaste versionen i skrivande stund. För det första misslyckas programvaran med att ladda om en extern bildskärm är ansluten. För det andra fortsatte de interna fläktarna ibland att köra mycket högt även när systemet sover eller går i viloläge i Performance- eller Overdrive-lägena.
Advanced Optimus stöds, vilket innebär att användare kan växla mellan diskret GPU och Optimus-lägen via Nvidias kontrollpanel utan att behöva starta om. G-Sync är endast tillgängligt i dGPU-läget medan Optimus automatiskt aktiveras om en extern bildskärm är ansluten.
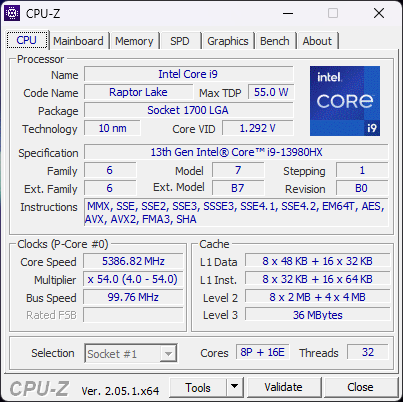
Processor
Processorns prestanda är en av de snabbaste av alla mobila CPU:er som finns på marknaden. Användarna kan förvänta sig en ökning av enkel- och flertrådsanvändningen med cirka 10 procent respektive 75 procent jämfört med den 12:e generationen.Core i9-12900HK i den äldre Alienware x17 R2. AMD:s främsta Zen 4-konkurrent, denRyzen 9 7945HX hamnar på efterkälken i enkeltrådade belastningar med cirka 10 till 15 procent.
Trots det enorma prestandasprånget jämfört med Alder Lake-H är prestandaklyftorna mellanCore i9-13900HX,Core i9-13950HXochCore i9-13980HX är mycket små och ligger under 5 procent. Om du får välja mellan de tre processorerna kan du alltså spara lite pengar genom att välja den "långsammare" i9-13900HX.
Det lägsta CPU-alternativet är Core i7-13700HX som är långsammare än vår i9-13980HX med cirka 33 procent.
Cinebench R15 Multi Loop
Cinebench R23: Multi Core | Single Core
Cinebench R20: CPU (Multi Core) | CPU (Single Core)
Cinebench R15: CPU Multi 64Bit | CPU Single 64Bit
Blender: v2.79 BMW27 CPU
7-Zip 18.03: 7z b 4 | 7z b 4 -mmt1
Geekbench 5.5: Multi-Core | Single-Core
HWBOT x265 Benchmark v2.2: 4k Preset
LibreOffice : 20 Documents To PDF
R Benchmark 2.5: Overall mean
* ... mindre är bättre
AIDA64: FP32 Ray-Trace | FPU Julia | CPU SHA3 | CPU Queen | FPU SinJulia | FPU Mandel | CPU AES | CPU ZLib | FP64 Ray-Trace | CPU PhotoWorxx
| Performance rating | |
| Alienware m18 R1 | |
| Eluktronics Mech-17 GP2 | |
| MSI Titan GT77 HX 13VI | |
| Asus ROG Strix Scar 18 2023 G834JY-N6005W | |
| Genomsnitt Intel Core i9-13980HX | |
| Razer Blade 18 RTX 4070 | |
| Alienware x17 R2 P48E | |
| AIDA64 / FP32 Ray-Trace | |
| Alienware m18 R1 | |
| MSI Titan GT77 HX 13VI | |
| Asus ROG Strix Scar 18 2023 G834JY-N6005W | |
| Eluktronics Mech-17 GP2 | |
| Genomsnitt Intel Core i9-13980HX (21332 - 29553, n=9) | |
| Razer Blade 18 RTX 4070 | |
| Alienware x17 R2 P48E | |
| AIDA64 / FPU Julia | |
| Alienware m18 R1 | |
| MSI Titan GT77 HX 13VI | |
| Asus ROG Strix Scar 18 2023 G834JY-N6005W | |
| Genomsnitt Intel Core i9-13980HX (108001 - 148168, n=9) | |
| Eluktronics Mech-17 GP2 | |
| Razer Blade 18 RTX 4070 | |
| Alienware x17 R2 P48E | |
| AIDA64 / CPU SHA3 | |
| Alienware m18 R1 | |
| MSI Titan GT77 HX 13VI | |
| Eluktronics Mech-17 GP2 | |
| Asus ROG Strix Scar 18 2023 G834JY-N6005W | |
| Genomsnitt Intel Core i9-13980HX (5264 - 7142, n=9) | |
| Razer Blade 18 RTX 4070 | |
| Alienware x17 R2 P48E | |
| AIDA64 / CPU Queen | |
| Alienware m18 R1 | |
| Asus ROG Strix Scar 18 2023 G834JY-N6005W | |
| Eluktronics Mech-17 GP2 | |
| MSI Titan GT77 HX 13VI | |
| Genomsnitt Intel Core i9-13980HX (126758 - 143409, n=9) | |
| Razer Blade 18 RTX 4070 | |
| Alienware x17 R2 P48E | |
| AIDA64 / FPU SinJulia | |
| Eluktronics Mech-17 GP2 | |
| Asus ROG Strix Scar 18 2023 G834JY-N6005W | |
| MSI Titan GT77 HX 13VI | |
| Alienware m18 R1 | |
| Genomsnitt Intel Core i9-13980HX (13785 - 17117, n=9) | |
| Razer Blade 18 RTX 4070 | |
| Alienware x17 R2 P48E | |
| AIDA64 / FPU Mandel | |
| Alienware m18 R1 | |
| MSI Titan GT77 HX 13VI | |
| Asus ROG Strix Scar 18 2023 G834JY-N6005W | |
| Eluktronics Mech-17 GP2 | |
| Genomsnitt Intel Core i9-13980HX (53398 - 73758, n=9) | |
| Razer Blade 18 RTX 4070 | |
| Alienware x17 R2 P48E | |
| AIDA64 / CPU AES | |
| Eluktronics Mech-17 GP2 | |
| MSI Titan GT77 HX 13VI | |
| Alienware m18 R1 | |
| Asus ROG Strix Scar 18 2023 G834JY-N6005W | |
| Genomsnitt Intel Core i9-13980HX (105169 - 136520, n=9) | |
| Razer Blade 18 RTX 4070 | |
| Alienware x17 R2 P48E | |
| AIDA64 / CPU ZLib | |
| MSI Titan GT77 HX 13VI | |
| Asus ROG Strix Scar 18 2023 G834JY-N6005W | |
| Alienware m18 R1 | |
| Eluktronics Mech-17 GP2 | |
| Genomsnitt Intel Core i9-13980HX (1513 - 2039, n=9) | |
| Razer Blade 18 RTX 4070 | |
| Alienware x17 R2 P48E | |
| AIDA64 / FP64 Ray-Trace | |
| Alienware m18 R1 | |
| MSI Titan GT77 HX 13VI | |
| Asus ROG Strix Scar 18 2023 G834JY-N6005W | |
| Eluktronics Mech-17 GP2 | |
| Genomsnitt Intel Core i9-13980HX (11431 - 16325, n=9) | |
| Razer Blade 18 RTX 4070 | |
| Alienware x17 R2 P48E | |
| AIDA64 / CPU PhotoWorxx | |
| Alienware m18 R1 | |
| Razer Blade 18 RTX 4070 | |
| Genomsnitt Intel Core i9-13980HX (37069 - 52949, n=9) | |
| Eluktronics Mech-17 GP2 | |
| Asus ROG Strix Scar 18 2023 G834JY-N6005W | |
| MSI Titan GT77 HX 13VI | |
| Alienware x17 R2 P48E | |
Systemets prestanda
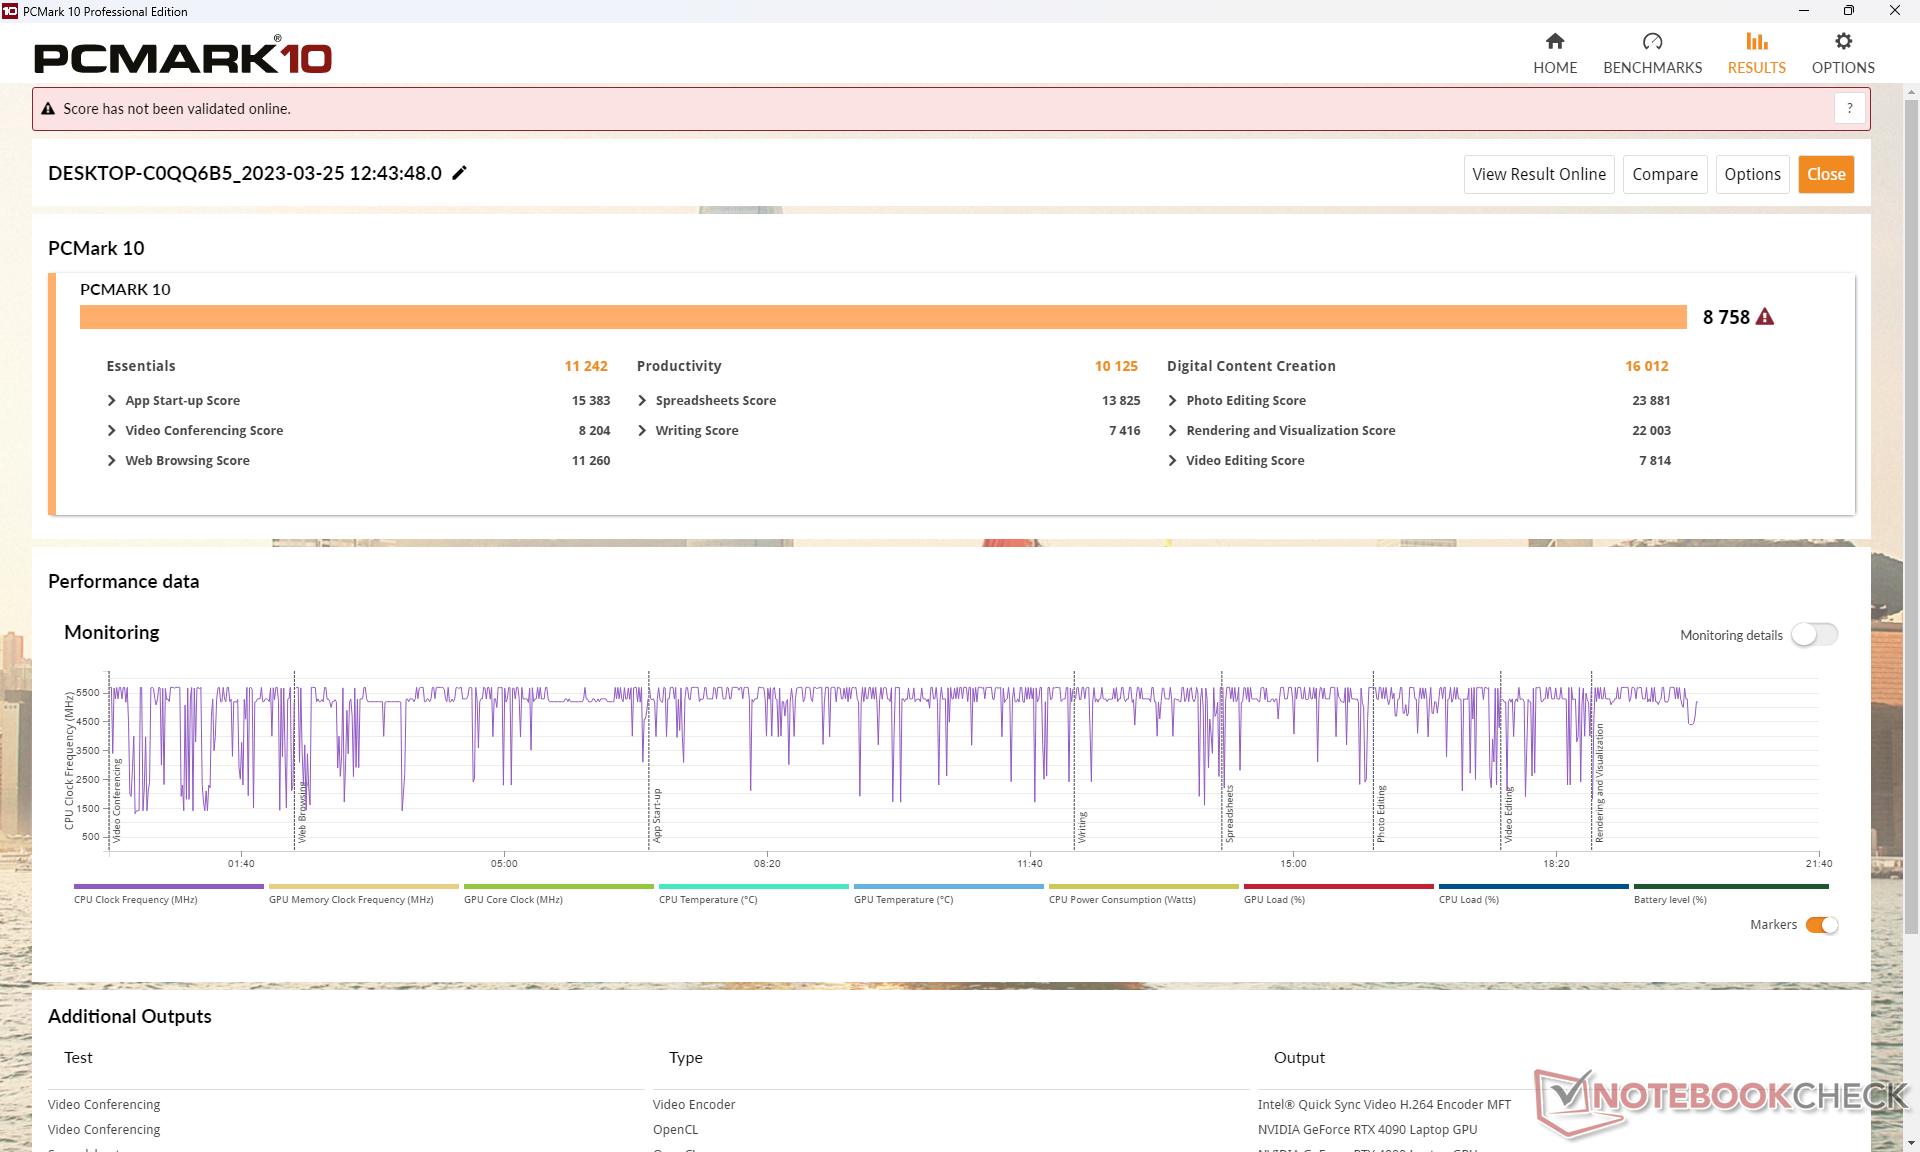
PCMark 10-resultaten är jämförbara med andra bärbara toppmodeller för spel med liknande 13:e generationens Intel CPU:er och GeForce 40 GPU:er som t.ex.Asus ROG Strix Scar 18 eller MSI Titan GT77 HX. Vår Alienware lyckas också överträffa den äldre Alienware x17 R2 som körs på två Samsung PM9A1 SSD-diskar i RAID 0.
CrossMark: Overall | Productivity | Creativity | Responsiveness
| PCMark 10 / Score | |
| Eluktronics Mech-17 GP2 | |
| MSI Titan GT77 HX 13VI | |
| Genomsnitt Intel Core i9-13980HX, NVIDIA GeForce RTX 4090 Laptop GPU (8650 - 9068, n=4) | |
| Asus ROG Strix Scar 18 2023 G834JY-N6005W | |
| Alienware m18 R1 | |
| Alienware x17 R2 P48E | |
| Razer Blade 18 RTX 4070 | |
| PCMark 10 / Essentials | |
| Eluktronics Mech-17 GP2 | |
| MSI Titan GT77 HX 13VI | |
| Razer Blade 18 RTX 4070 | |
| Genomsnitt Intel Core i9-13980HX, NVIDIA GeForce RTX 4090 Laptop GPU (11215 - 11644, n=3) | |
| Alienware m18 R1 | |
| Alienware x17 R2 P48E | |
| PCMark 10 / Productivity | |
| Eluktronics Mech-17 GP2 | |
| Genomsnitt Intel Core i9-13980HX, NVIDIA GeForce RTX 4090 Laptop GPU (10125 - 11067, n=3) | |
| Alienware x17 R2 P48E | |
| Alienware m18 R1 | |
| MSI Titan GT77 HX 13VI | |
| Razer Blade 18 RTX 4070 | |
| PCMark 10 / Digital Content Creation | |
| MSI Titan GT77 HX 13VI | |
| Alienware m18 R1 | |
| Genomsnitt Intel Core i9-13980HX, NVIDIA GeForce RTX 4090 Laptop GPU (15052 - 16012, n=3) | |
| Eluktronics Mech-17 GP2 | |
| Alienware x17 R2 P48E | |
| Razer Blade 18 RTX 4070 | |
| CrossMark / Overall | |
| Eluktronics Mech-17 GP2 | |
| Alienware m18 R1 | |
| MSI Titan GT77 HX 13VI | |
| Razer Blade 18 RTX 4070 | |
| Asus ROG Strix Scar 18 2023 G834JY-N6005W | |
| Genomsnitt Intel Core i9-13980HX, NVIDIA GeForce RTX 4090 Laptop GPU (1935 - 2176, n=4) | |
| Alienware x17 R2 P48E | |
| CrossMark / Productivity | |
| Eluktronics Mech-17 GP2 | |
| Alienware m18 R1 | |
| MSI Titan GT77 HX 13VI | |
| Razer Blade 18 RTX 4070 | |
| Asus ROG Strix Scar 18 2023 G834JY-N6005W | |
| Genomsnitt Intel Core i9-13980HX, NVIDIA GeForce RTX 4090 Laptop GPU (1764 - 2005, n=4) | |
| Alienware x17 R2 P48E | |
| CrossMark / Creativity | |
| Eluktronics Mech-17 GP2 | |
| Alienware m18 R1 | |
| Asus ROG Strix Scar 18 2023 G834JY-N6005W | |
| MSI Titan GT77 HX 13VI | |
| Genomsnitt Intel Core i9-13980HX, NVIDIA GeForce RTX 4090 Laptop GPU (2267 - 2469, n=4) | |
| Razer Blade 18 RTX 4070 | |
| Alienware x17 R2 P48E | |
| CrossMark / Responsiveness | |
| Alienware m18 R1 | |
| Razer Blade 18 RTX 4070 | |
| MSI Titan GT77 HX 13VI | |
| Eluktronics Mech-17 GP2 | |
| Genomsnitt Intel Core i9-13980HX, NVIDIA GeForce RTX 4090 Laptop GPU (1556 - 1904, n=4) | |
| Alienware x17 R2 P48E | |
| Asus ROG Strix Scar 18 2023 G834JY-N6005W | |
| PCMark 10 Score | 8758 poäng | |
Hjälp | ||
| AIDA64 / Memory Copy | |
| Alienware m18 R1 | |
| Razer Blade 18 RTX 4070 | |
| Genomsnitt Intel Core i9-13980HX (62189 - 80776, n=9) | |
| Eluktronics Mech-17 GP2 | |
| Asus ROG Strix Scar 18 2023 G834JY-N6005W | |
| MSI Titan GT77 HX 13VI | |
| Alienware x17 R2 P48E | |
| AIDA64 / Memory Read | |
| Alienware m18 R1 | |
| Razer Blade 18 RTX 4070 | |
| Genomsnitt Intel Core i9-13980HX (62624 - 89096, n=9) | |
| Eluktronics Mech-17 GP2 | |
| Asus ROG Strix Scar 18 2023 G834JY-N6005W | |
| MSI Titan GT77 HX 13VI | |
| Alienware x17 R2 P48E | |
| AIDA64 / Memory Write | |
| Alienware m18 R1 | |
| Razer Blade 18 RTX 4070 | |
| Genomsnitt Intel Core i9-13980HX (59912 - 79917, n=9) | |
| Eluktronics Mech-17 GP2 | |
| Asus ROG Strix Scar 18 2023 G834JY-N6005W | |
| MSI Titan GT77 HX 13VI | |
| Alienware x17 R2 P48E | |
| AIDA64 / Memory Latency | |
| Alienware x17 R2 P48E | |
| MSI Titan GT77 HX 13VI | |
| Asus ROG Strix Scar 18 2023 G834JY-N6005W | |
| Eluktronics Mech-17 GP2 | |
| Genomsnitt Intel Core i9-13980HX (79.4 - 93.2, n=9) | |
| Razer Blade 18 RTX 4070 | |
| Alienware m18 R1 | |
* ... mindre är bättre
DPC-latenstid
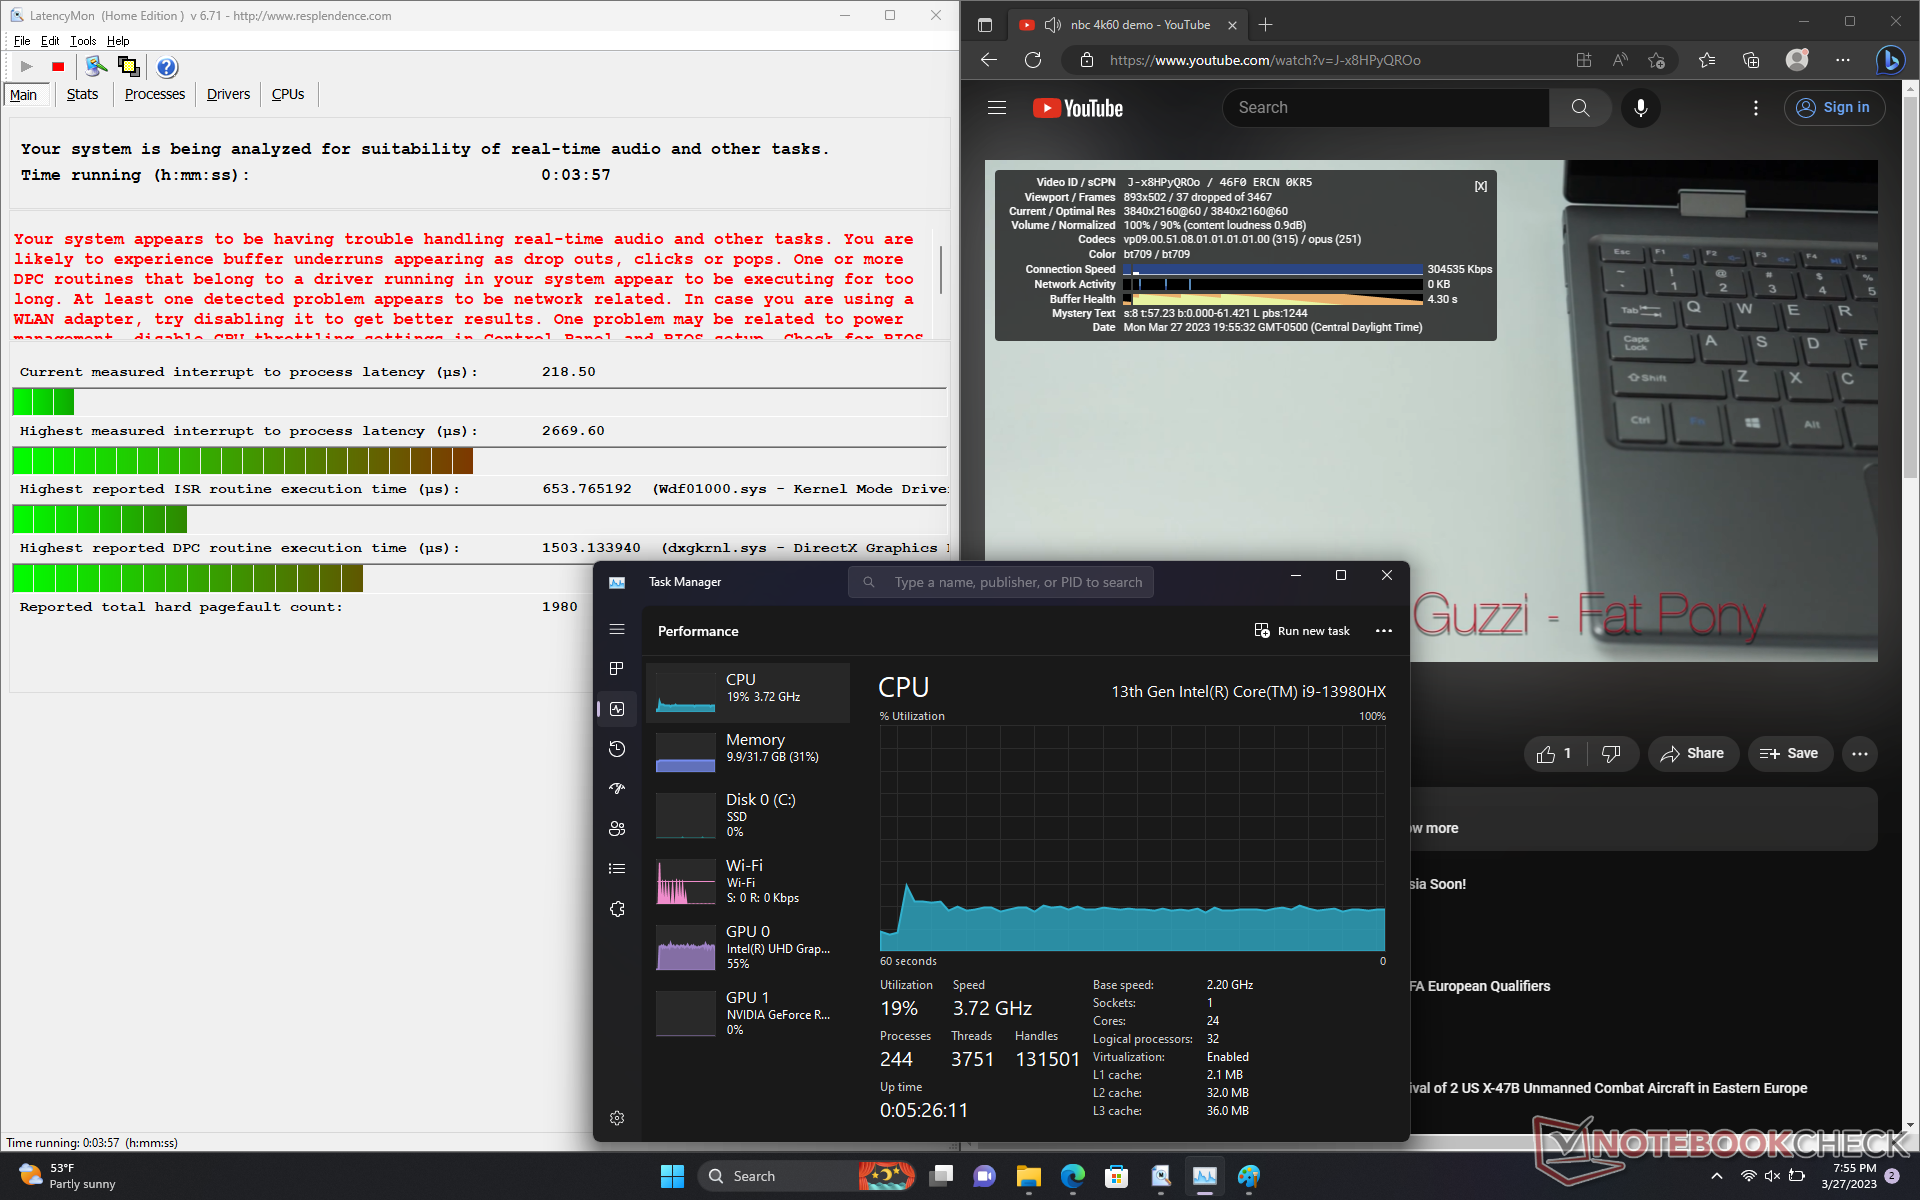
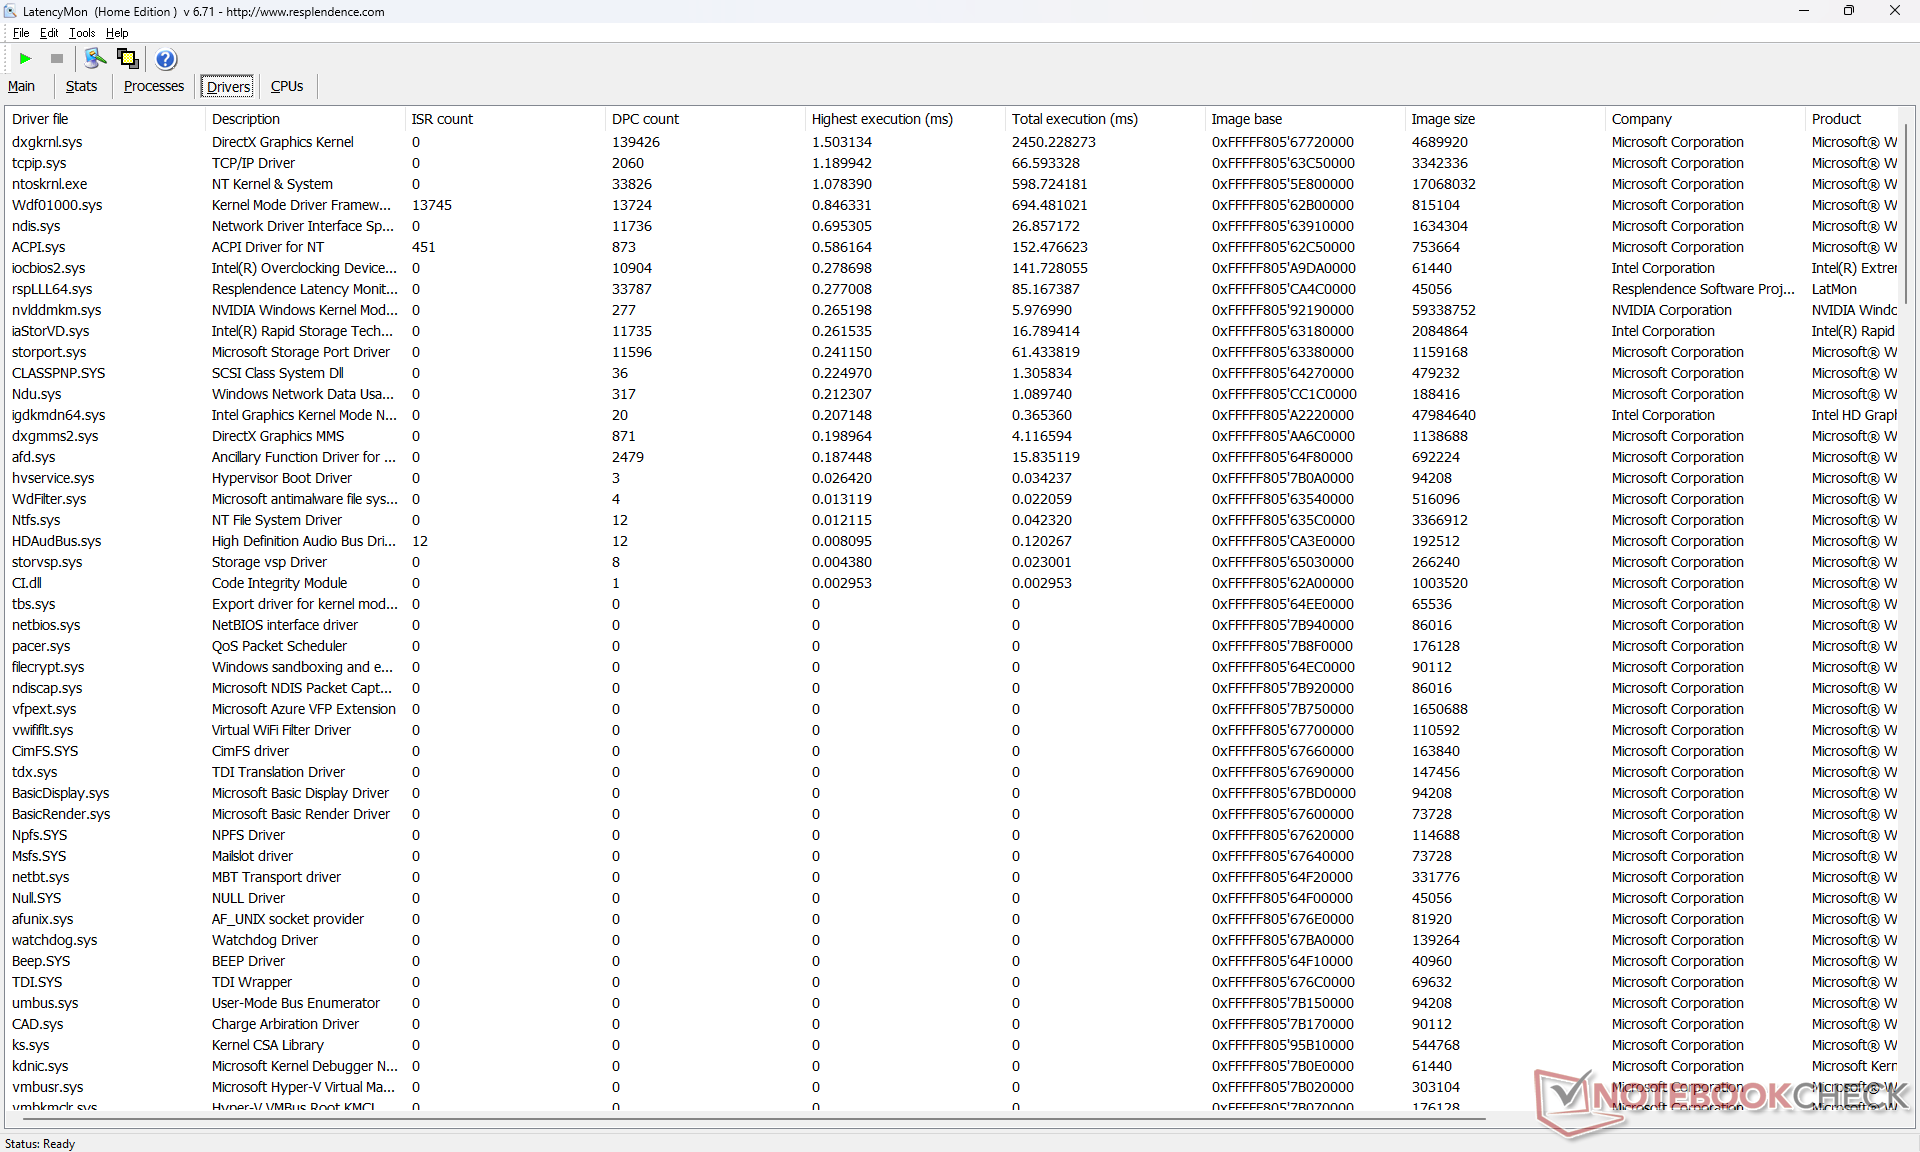
LatencyMon avslöjar DPC-problem när du öppnar flera webbläsarflikar på vår hemsida. Dessutom har systemet problem med att spela upp 4K-videoinnehåll eftersom vi kan registrera 37 tappade bilder under vår minutlånga testvideo även efter upprepade tester. CPU- och iGPU-användningen är också ovanligt hög med 19 procent respektive 55 procent. Dessa observationer tyder på dålig hantering av bakgrundsprocesser som kan påverka aktiviteten i fokus.
För vad det är värt har Nvidia erkänt en bugg relaterad till en ökning av DPC-latency med grafikdrivrutinen 531.29. Förhoppningsvis kan en lösning komma snart i vilket fall som helst.
| DPC Latencies / LatencyMon - interrupt to process latency (max), Web, Youtube, Prime95 | |
| MSI Titan GT77 HX 13VI | |
| Alienware m18 R1 | |
| Razer Blade 18 RTX 4070 | |
| Alienware x17 R2 P48E | |
| Asus ROG Strix Scar 18 2023 G834JY-N6005W | |
| Eluktronics Mech-17 GP2 | |
* ... mindre är bättre
Lagringsenheter - totalt fyra M.2-enheter
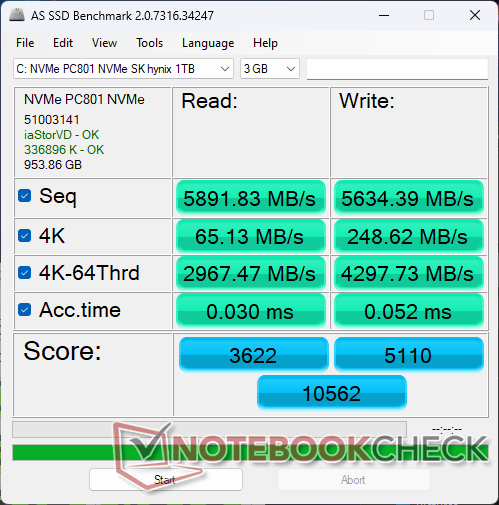
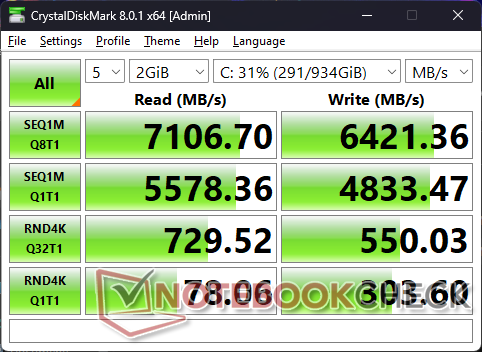
Vår enhet är konfigurerad med en SK Hynix PC801 PCIe4 x4 NVMe SSD för sekventiell läs- och skrivhastighet på upp till 7000 MB/s respektive 6500 MB/s. Prestandan är konkurrenskraftig mot Samsung PMA1-serien och vår enhet uppvisar inga problem med att upprätthålla maximala hastigheter utan att strypas.
Alienware har inte stöd för PCIe5 NVMe SSD-enheter till skillnad från MSI GE78- eller GT77-serien. Trots detta har den stöd för fler interna SSD-enheter än på de flesta andra bärbara datorer.

| Drive Performance rating - Percent | |
| Alienware m18 R1 | |
| MSI Titan GT77 HX 13VI | |
| Razer Blade 18 RTX 4070 | |
| Alienware x17 R2 P48E | |
| Asus ROG Strix Scar 18 2023 G834JY-N6005W | |
| Eluktronics Mech-17 GP2 | |
* ... mindre är bättre
Disk Throttling: DiskSpd Read Loop, Queue Depth 8
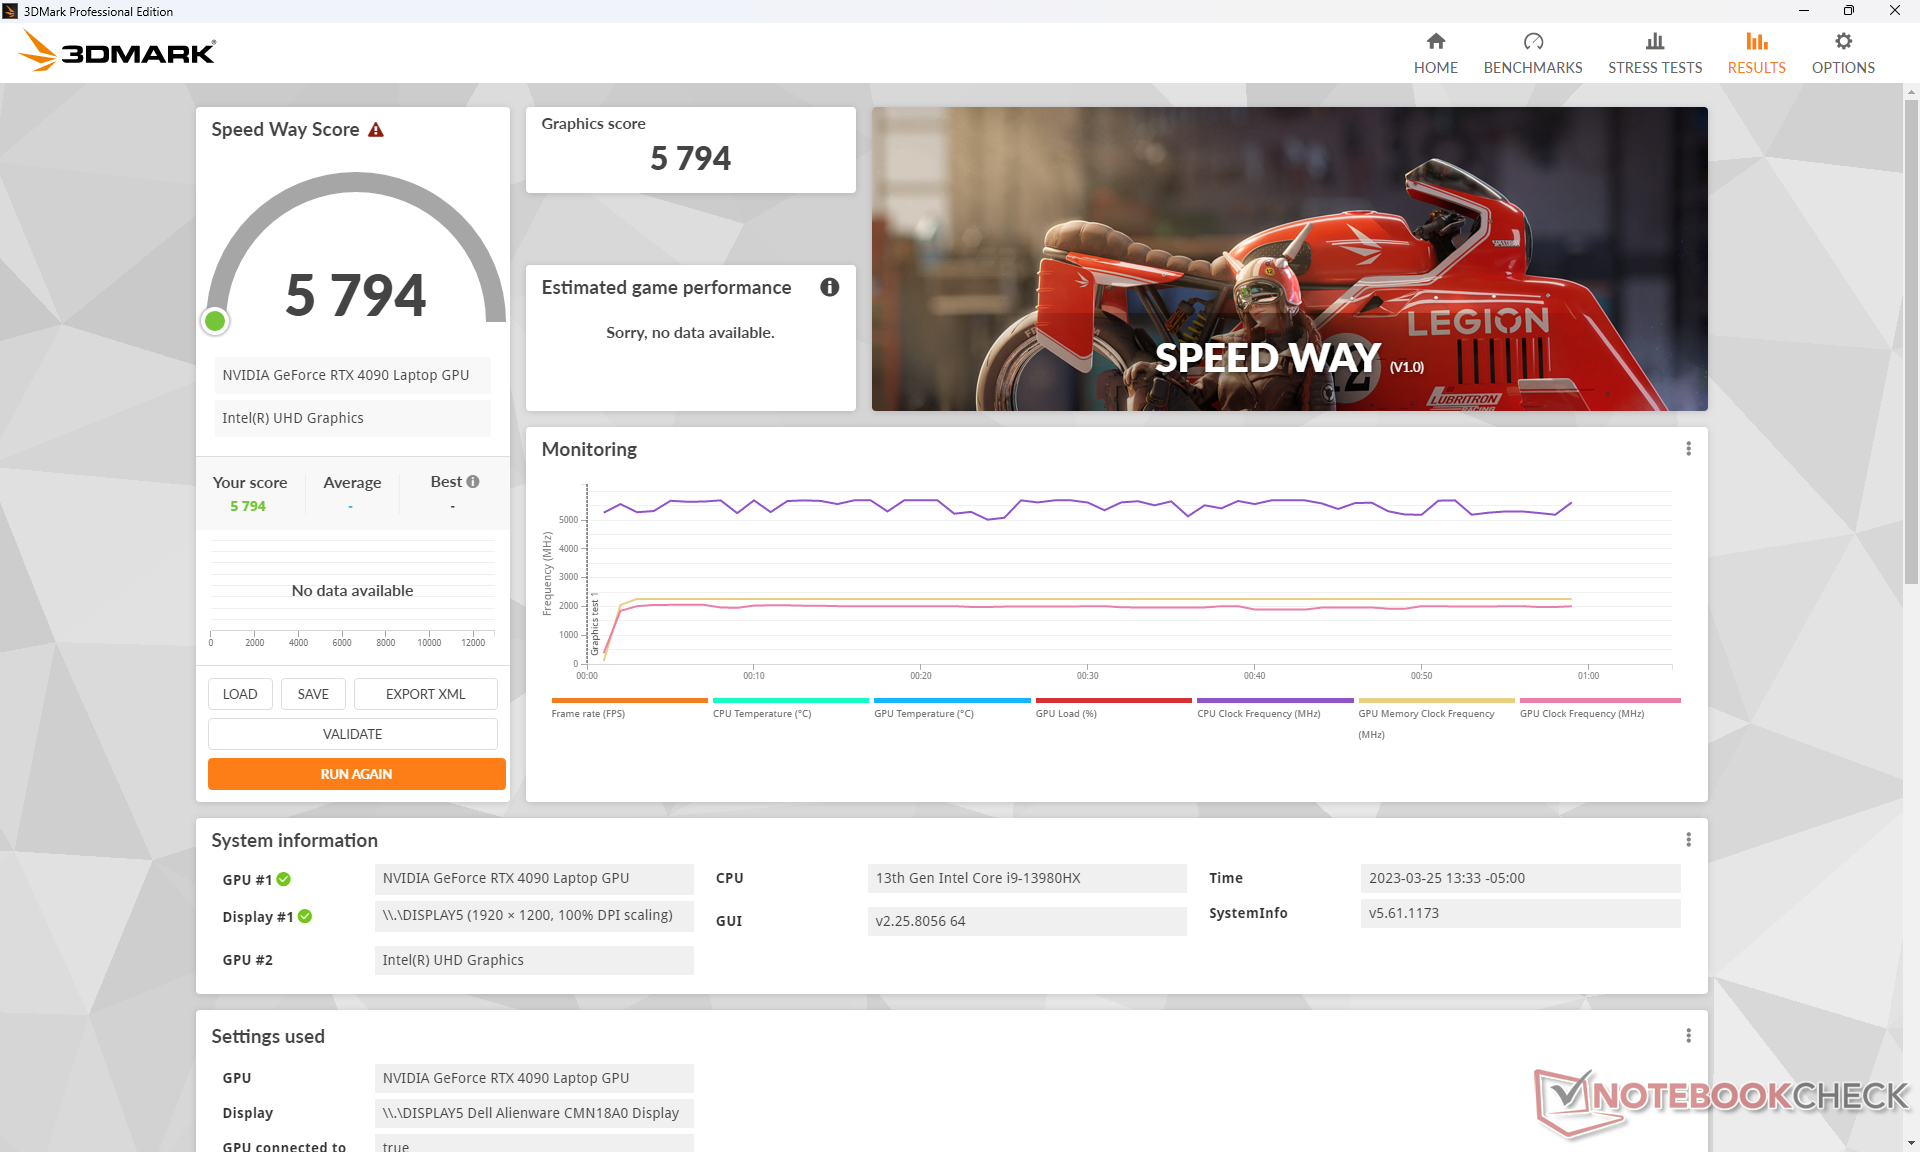
GPU-prestanda - 175 W GeForce RTX 4090
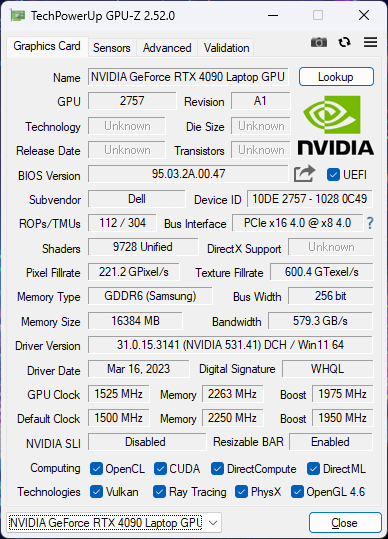
Den totala grafikprestandan från mobil GeForce RTX 4090 liknar mest den desktop GeForce RTX 4070. Den erbjuder tillräckligt med prestanda för att spela alla aktuella spel i 4K Ultra-inställningar, inklusive F1 22. Om ray-tracing är aktiverat rekommenderas dock att du aktiverar DLSS eller ramgenerering där det stöds för att hålla ramfrekvensen uppe.
När man jämför med den senaste generationens mobila RTX 3080 Tierbjuder det mobila RTX 4090 mellan 40 och 70 procent snabbare prestanda samtidigt som det bibehåller en liknande 175 W effektkuvert.
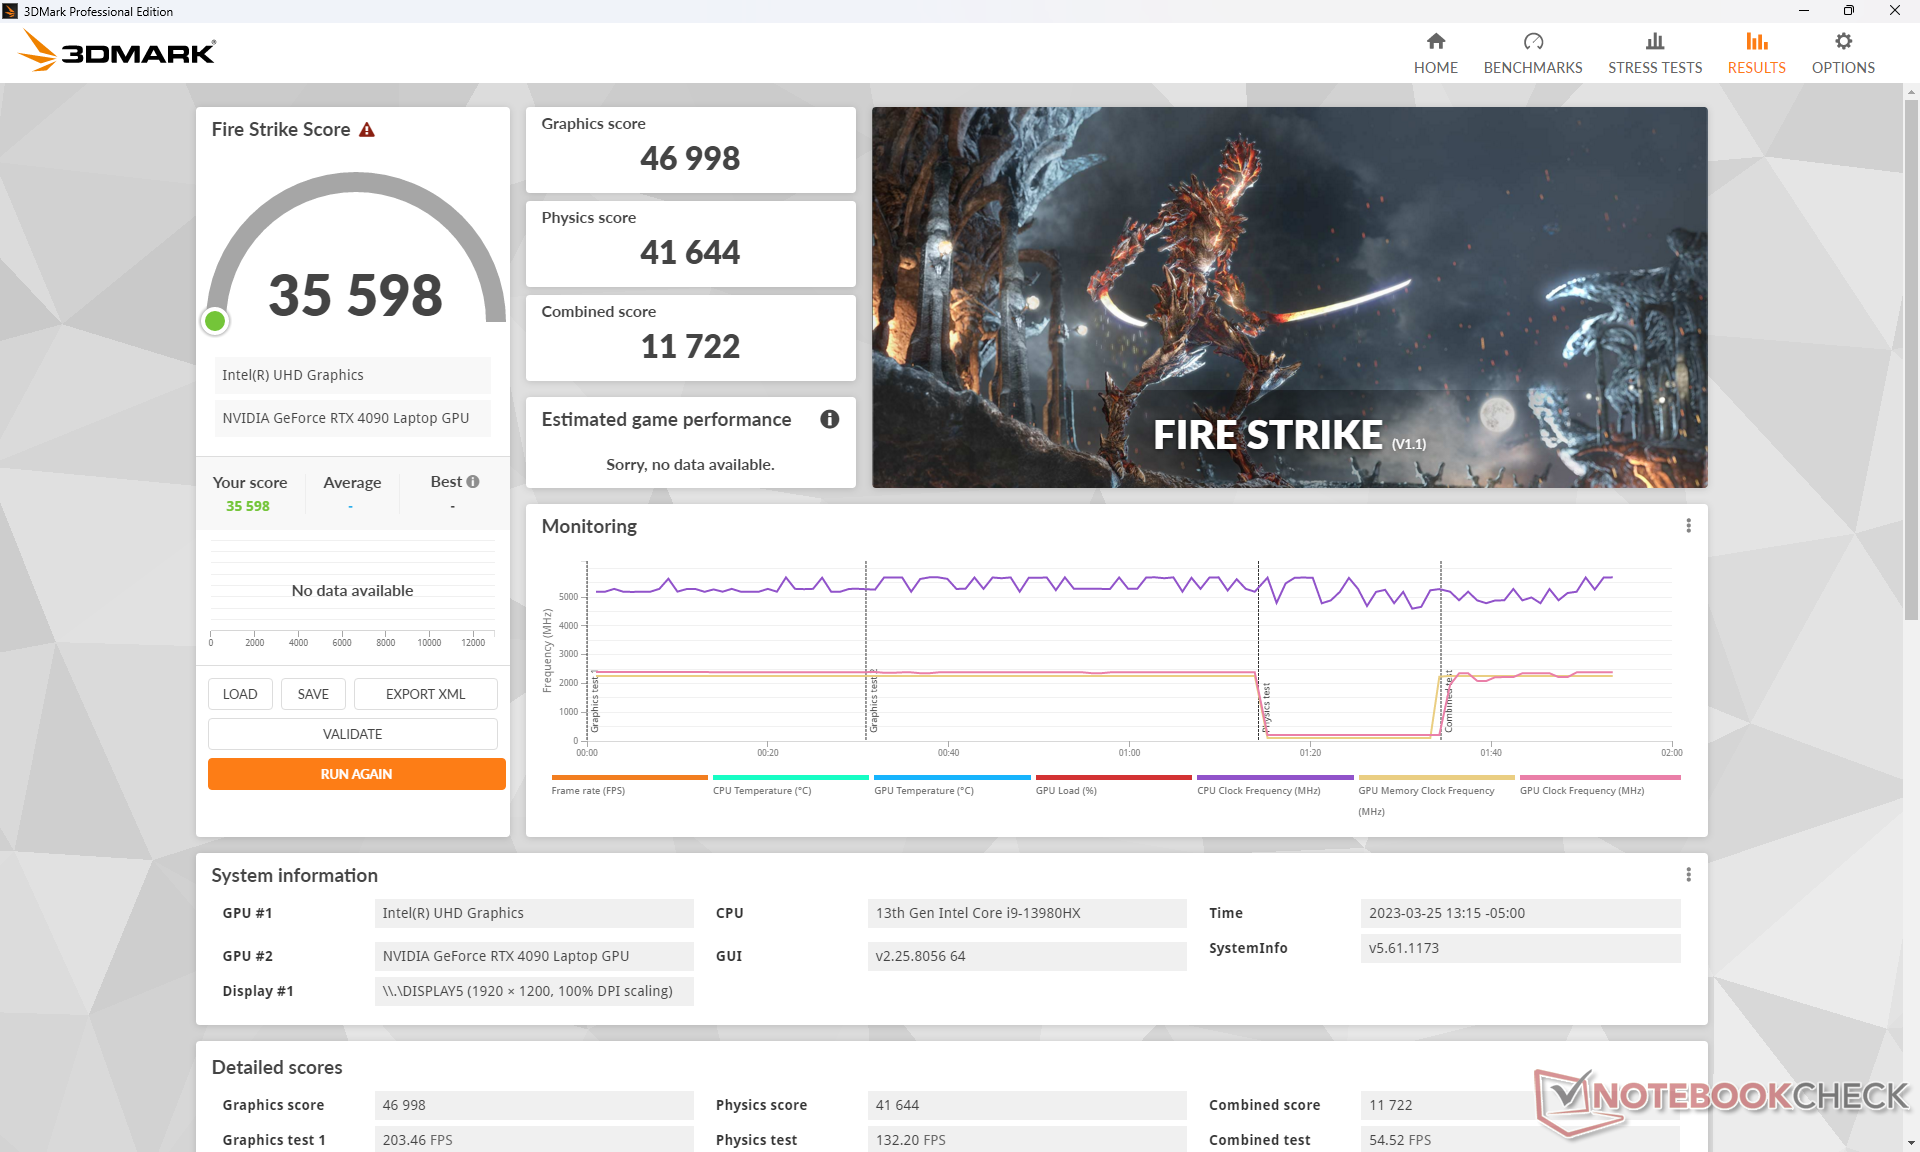
Att köra Fire Strike i Overdrive-läget visar inga större fördelar jämfört med det tystare Performance-läget eftersom deras slutresultat skulle vara nästan identiska. Att upprepa testet i läget Balanced skulle dock resultera i en 5-procentig respektive 9-procentig minskning av GPU- och CPU-prestanda.
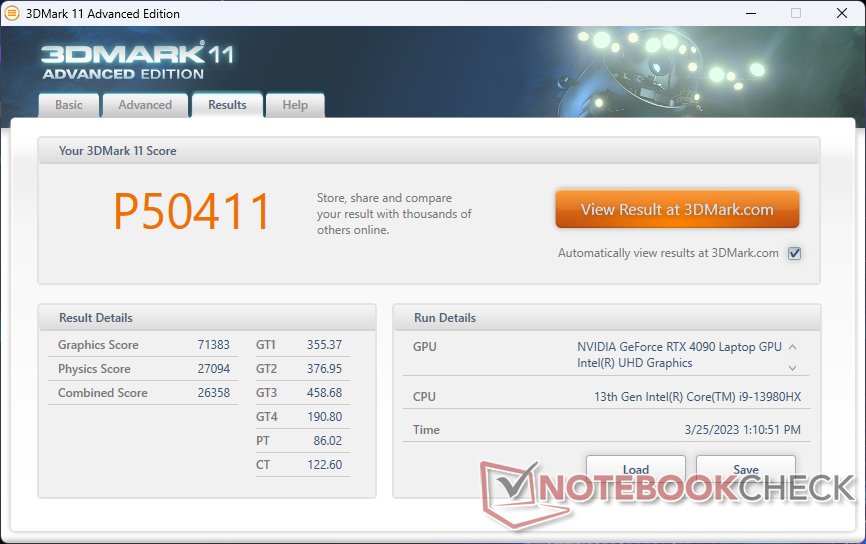
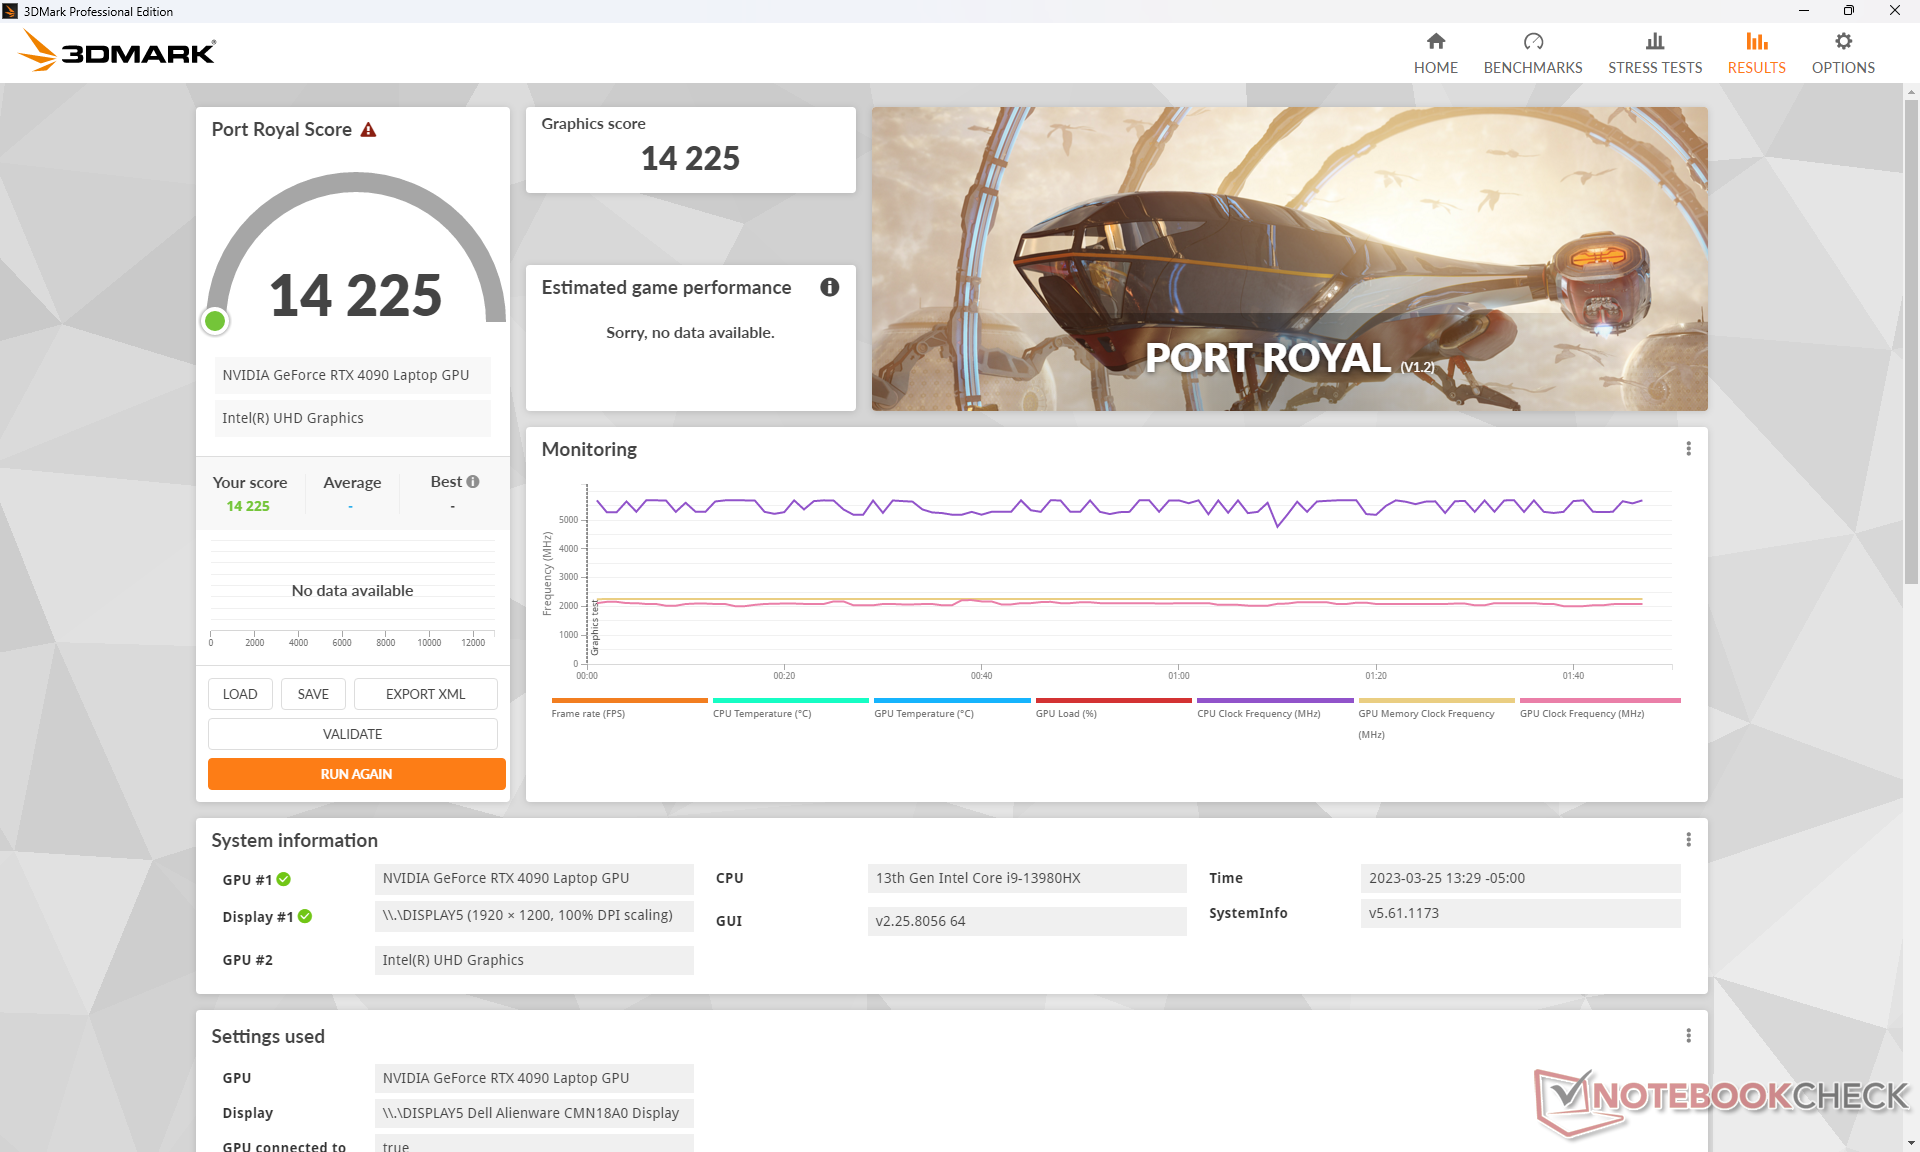
| 3DMark 11 Performance | 50411 poäng | |
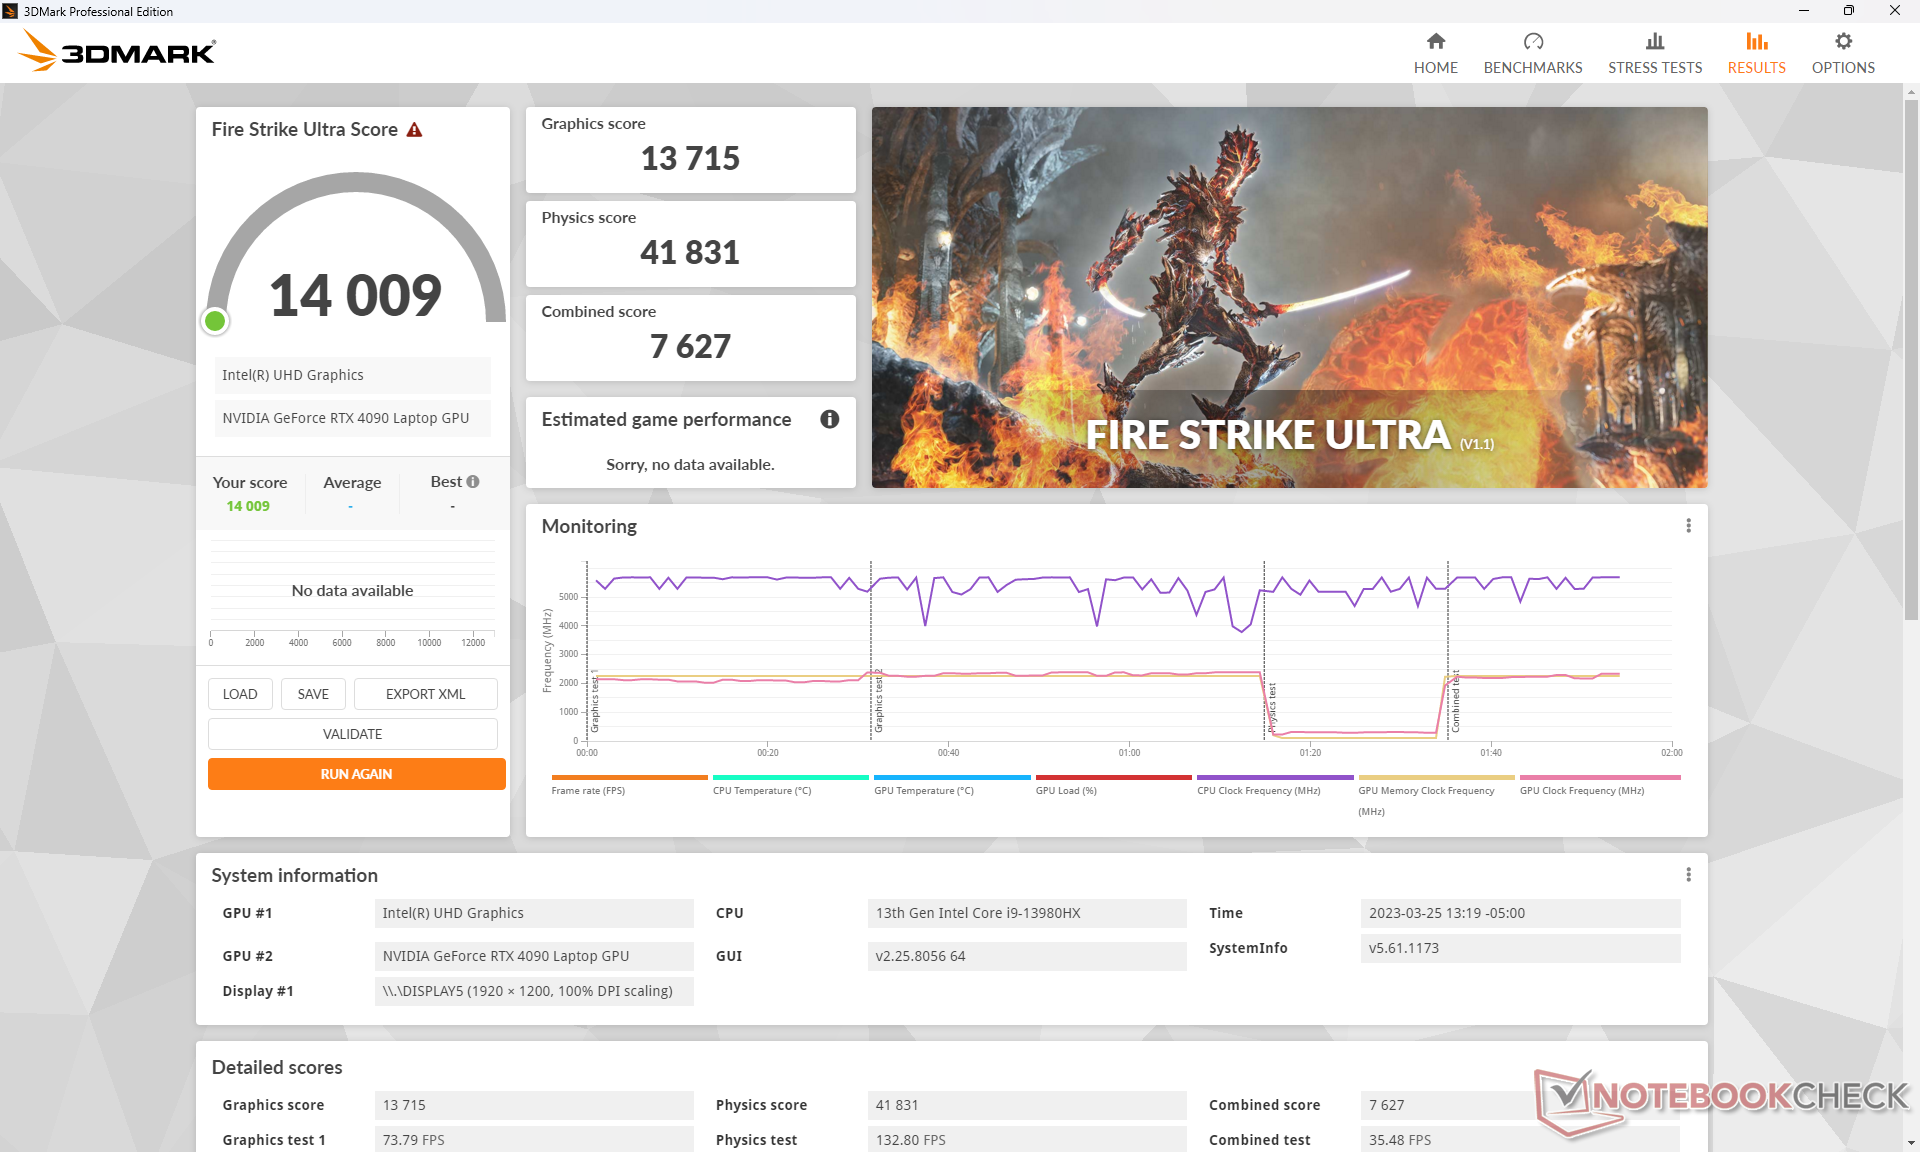
| 3DMark Fire Strike Score | 35598 poäng | |
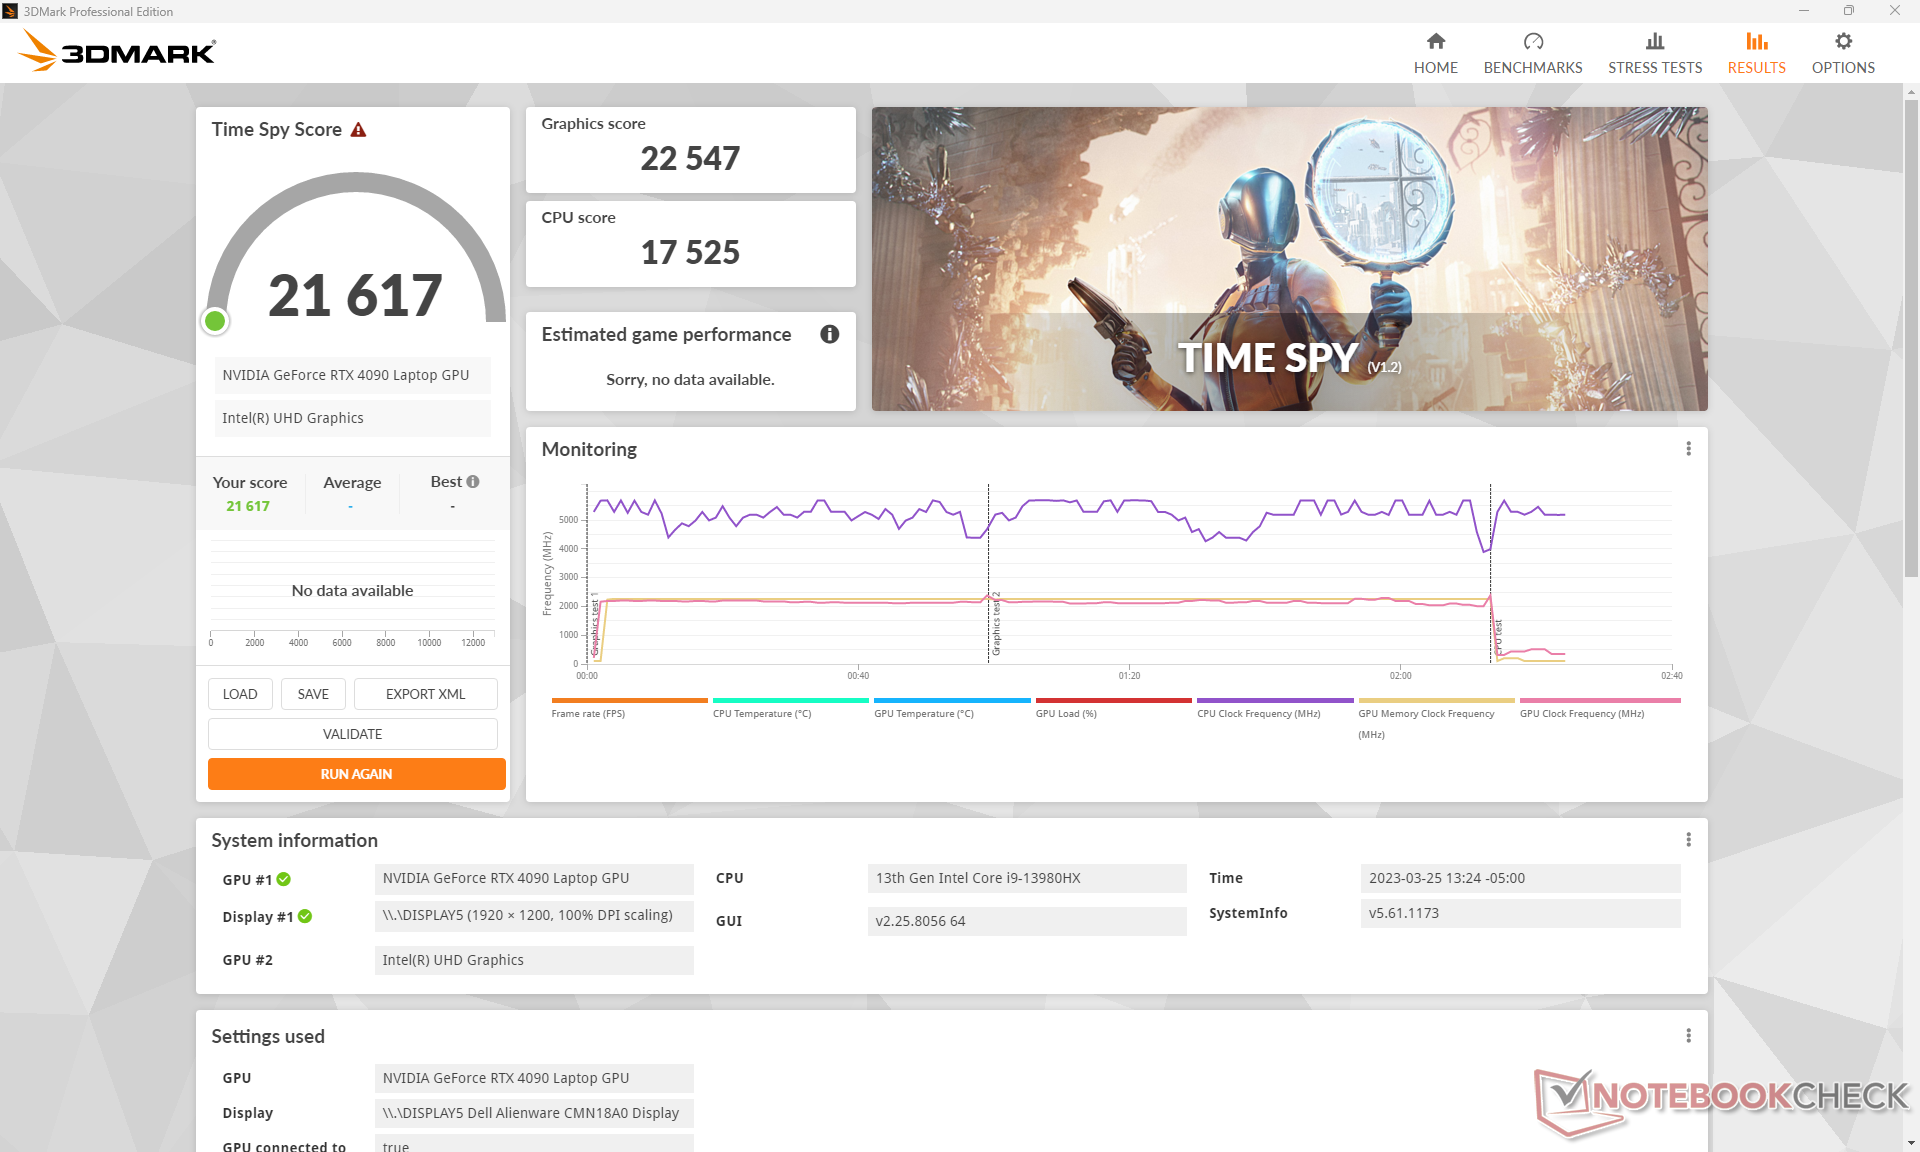
| 3DMark Time Spy Score | 21617 poäng | |
Hjälp | ||
* ... mindre är bättre
Witcher 3 FPS Chart
| låg | med. | hög | ultra | QHD | 4K | |
|---|---|---|---|---|---|---|
| GTA V (2015) | 186.7 | 185.3 | 184.5 | 149 | 145.5 | 176.4 |
| The Witcher 3 (2015) | 649.2 | 563.8 | 441.6 | 213.9 | 165.6 | |
| Dota 2 Reborn (2015) | 251 | 220 | 210 | 194.2 | 190.2 | |
| Final Fantasy XV Benchmark (2018) | 231 | 227 | 194.8 | 159.5 | 92.6 | |
| X-Plane 11.11 (2018) | 210 | 187.1 | 143.5 | 124 | ||
| Strange Brigade (2018) | 475 | 388 | 388 | 373 | 308 | 159.8 |
| Cyberpunk 2077 1.6 (2022) | 157.2 | 151.8 | 148.2 | 127.92 | 102.16 | 49.99 |
| Tiny Tina's Wonderlands (2022) | 359.1 | 301.8 | 232.5 | 187.7 | 133.8 | 71.3 |
| F1 22 (2022) | 336 | 320 | 318 | 144.7 | 92.2 | 45.5 |
Utsläpp - Fyra Fast & Furious-fans
Systembrus
Om du trodde att en bärbar dator med fyra fläktar skulle vara högljudd har du... helt rätt. Spel i prestandaläget ger ett fläktljud på 51 dB(A), vilket liknar denEluktronics Mech-17 GP2 men högre än Razer Blade 18. Om du spelar i Overdrive-läget skulle fläktljudet vara ännu högre, nästan 57 dB(A). Allt över 50 dB(A) kräver ett par bra hörlurar för att överrösta de surrande fläktarna. Tänk på att Overdrive-läget inte är nödvändigt för de flesta spel, vilket vårt avsnitt om stresstest nedan visar.
Tack och lov är systemet bättre på att vara tyst vid lägre belastning eftersom fläktarna inte pulserar när de är inställda på lägre profilinställningar. Du kan alltså fortfarande surfa på webben eller strömma videoinnehåll med bekväma fläktljudnivåer.
Ljudnivå
| Låg belastning |
| 23 / 23 / 23 dB(A) |
| Hög belastning |
| 35.6 / 56.7 dB(A) |
 | ||
30 dB tyst 40 dB(A) hörbar 50 dB(A) högt ljud |
||
min: | ||
| Alienware m18 R1 GeForce RTX 4090 Laptop GPU, i9-13980HX, SK hynix PC801 HFS001TEJ9X101N | Razer Blade 18 RTX 4070 GeForce RTX 4070 Laptop GPU, i9-13950HX, SSSTC CA6-8D1024 | Asus ROG Strix Scar 18 2023 G834JY-N6005W GeForce RTX 4090 Laptop GPU, i9-13980HX, 2x Samsung PM9A1 MZVL21T0HCLR (RAID 0) | Eluktronics Mech-17 GP2 GeForce RTX 4090 Laptop GPU, i9-13900HX, Samsung PM9A1 MZVL21T0HCLR | MSI Titan GT77 HX 13VI GeForce RTX 4090 Laptop GPU, i9-13950HX, Samsung PM9A1 MZVL22T0HBLB | Alienware x17 R2 P48E GeForce RTX 3080 Ti Laptop GPU, i9-12900HK, 2x Samsung PM9A1 1TB (RAID 0) | |
|---|---|---|---|---|---|---|
| Noise | -3% | -15% | -13% | -20% | 2% | |
| av / miljö * (dB) | 22.8 | 23.5 -3% | 23.9 -5% | 25.2 -11% | 24.6 -8% | 22.7 -0% |
| Idle Minimum * (dB) | 23 | 23.8 -3% | 23.9 -4% | 28 -22% | 29.2 -27% | 23.1 -0% |
| Idle Average * (dB) | 23 | 23.8 -3% | 32.6 -42% | 28 -22% | 29.2 -27% | 23.1 -0% |
| Idle Maximum * (dB) | 23 | 26.8 -17% | 32.6 -42% | 30.4 -32% | 29.2 -27% | 23.1 -0% |
| Load Average * (dB) | 35.6 | 37.3 -5% | 35.9 -1% | 41 -15% | 50.7 -42% | 31.9 10% |
| Witcher 3 ultra * (dB) | 51.3 | 48 6% | 50.7 1% | 53.3 -4% | 52.5 -2% | |
| Load Maximum * (dB) | 56.7 | 53.5 6% | 55.8 2% | 52.6 7% | 61 -8% | 52.5 7% |
* ... mindre är bättre
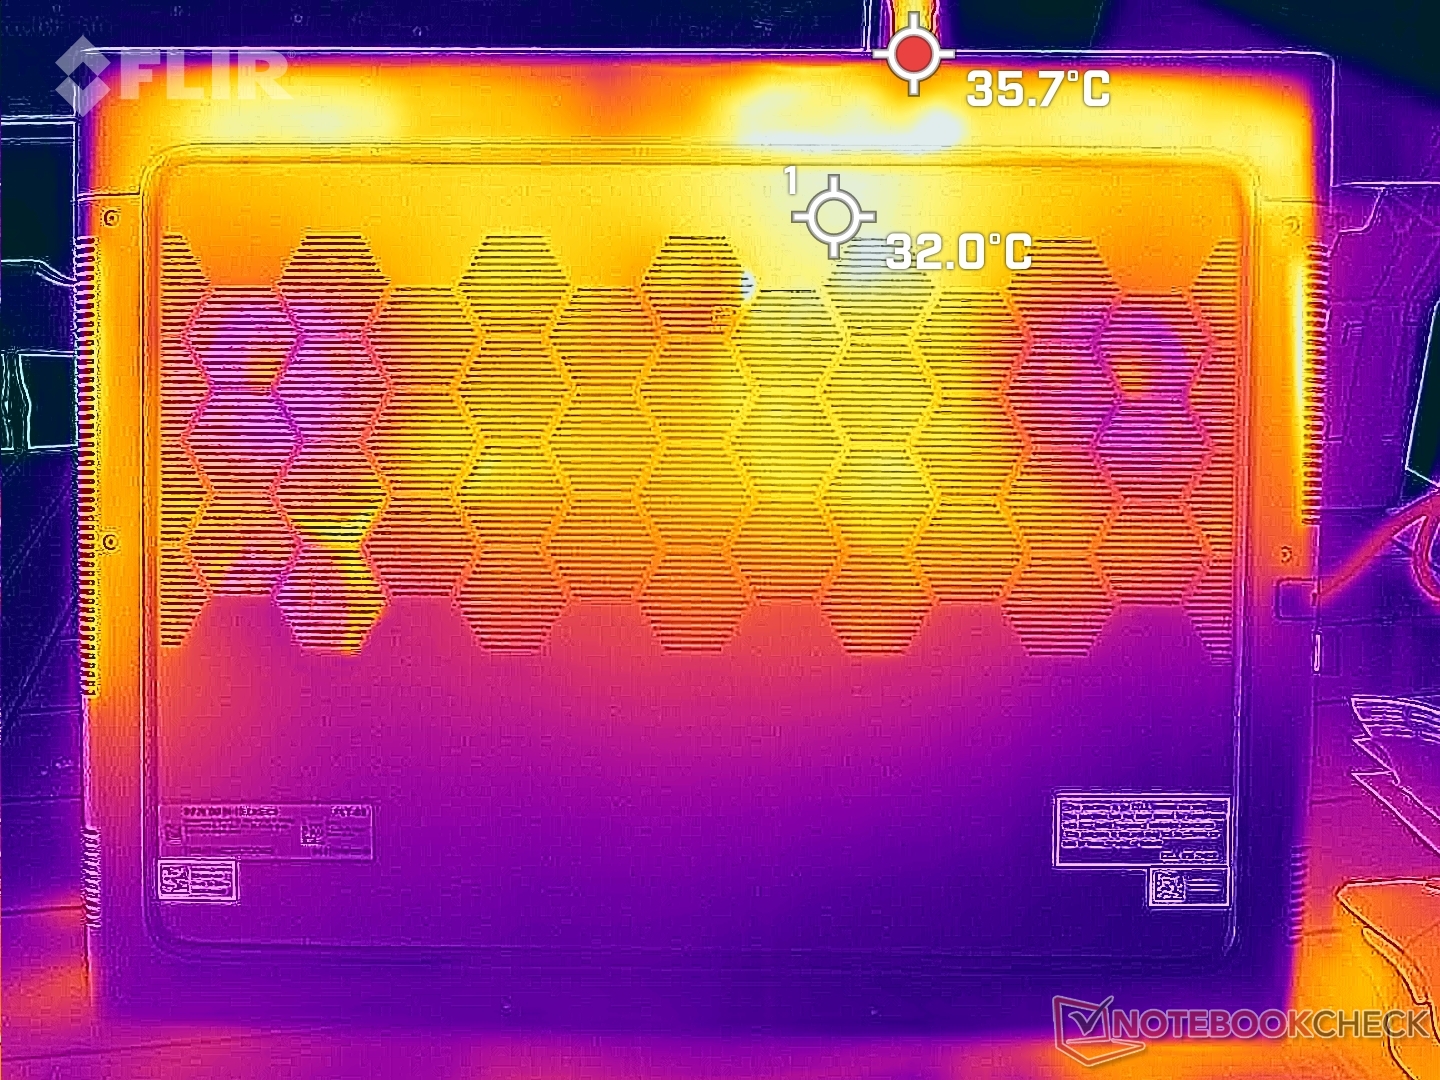
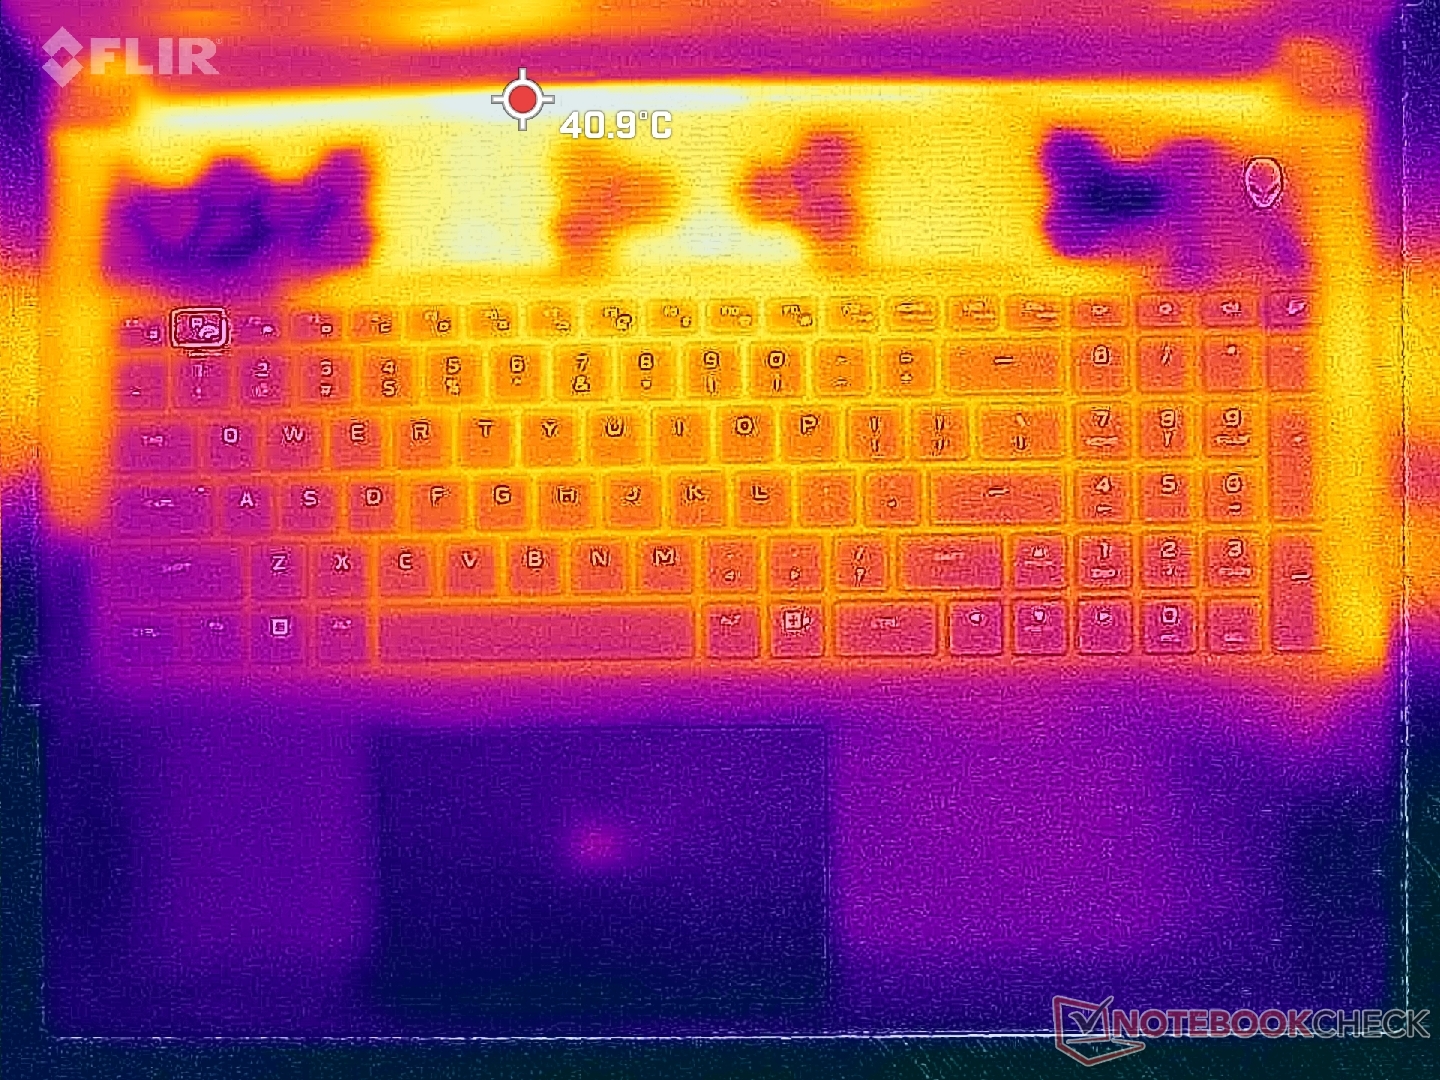
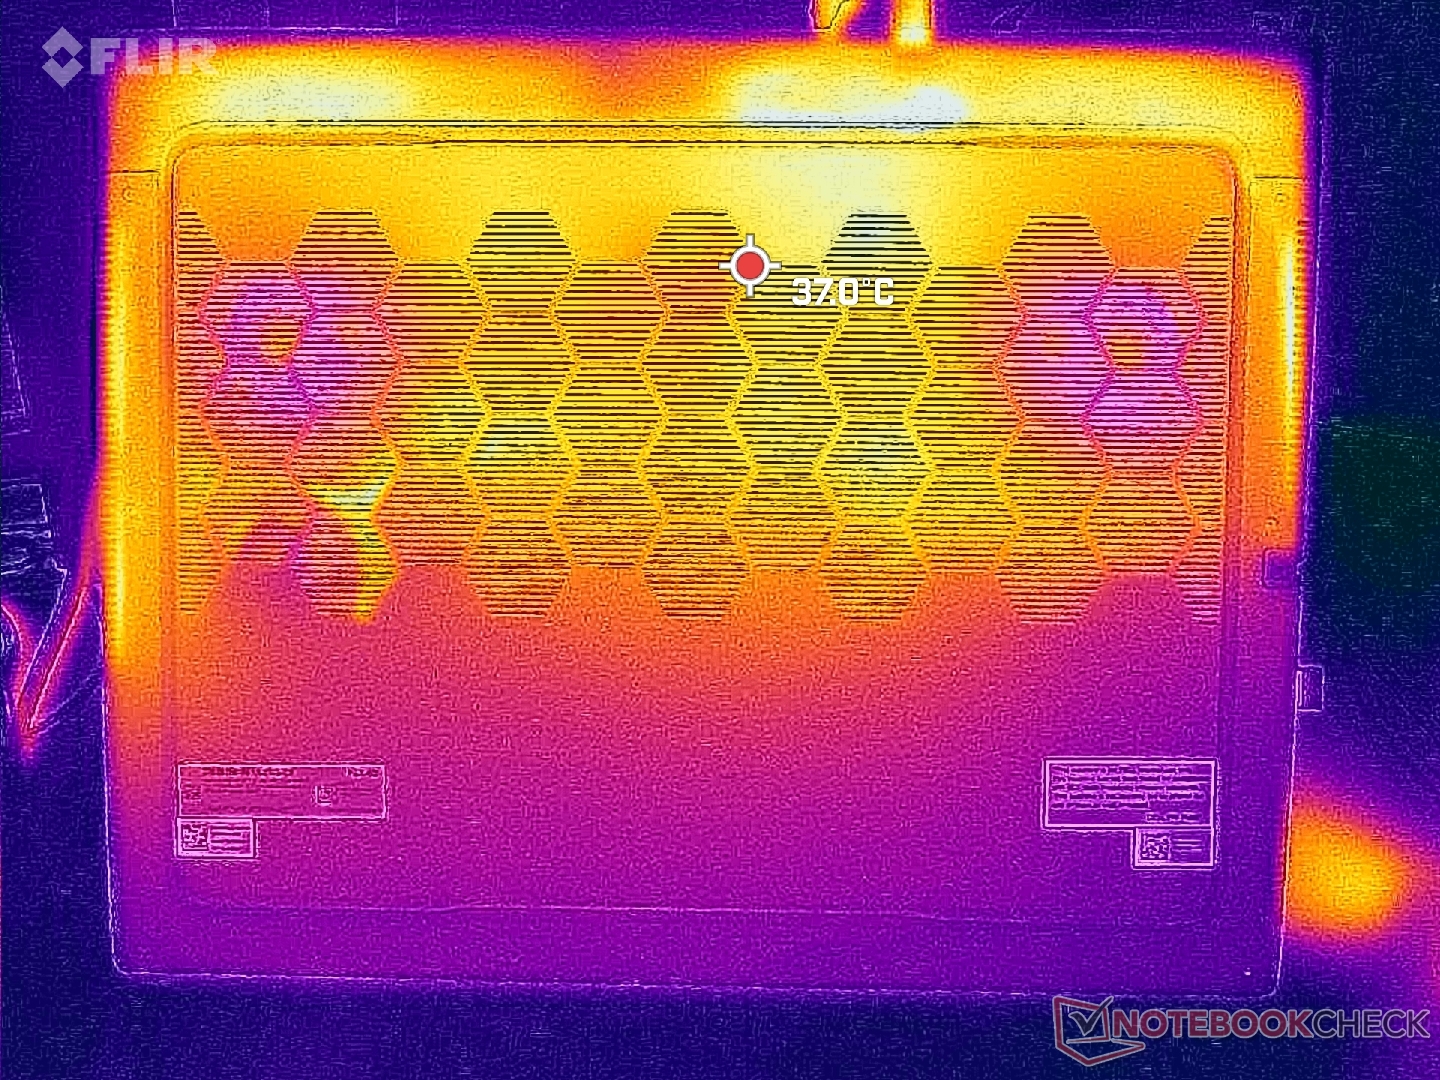
Temperatur
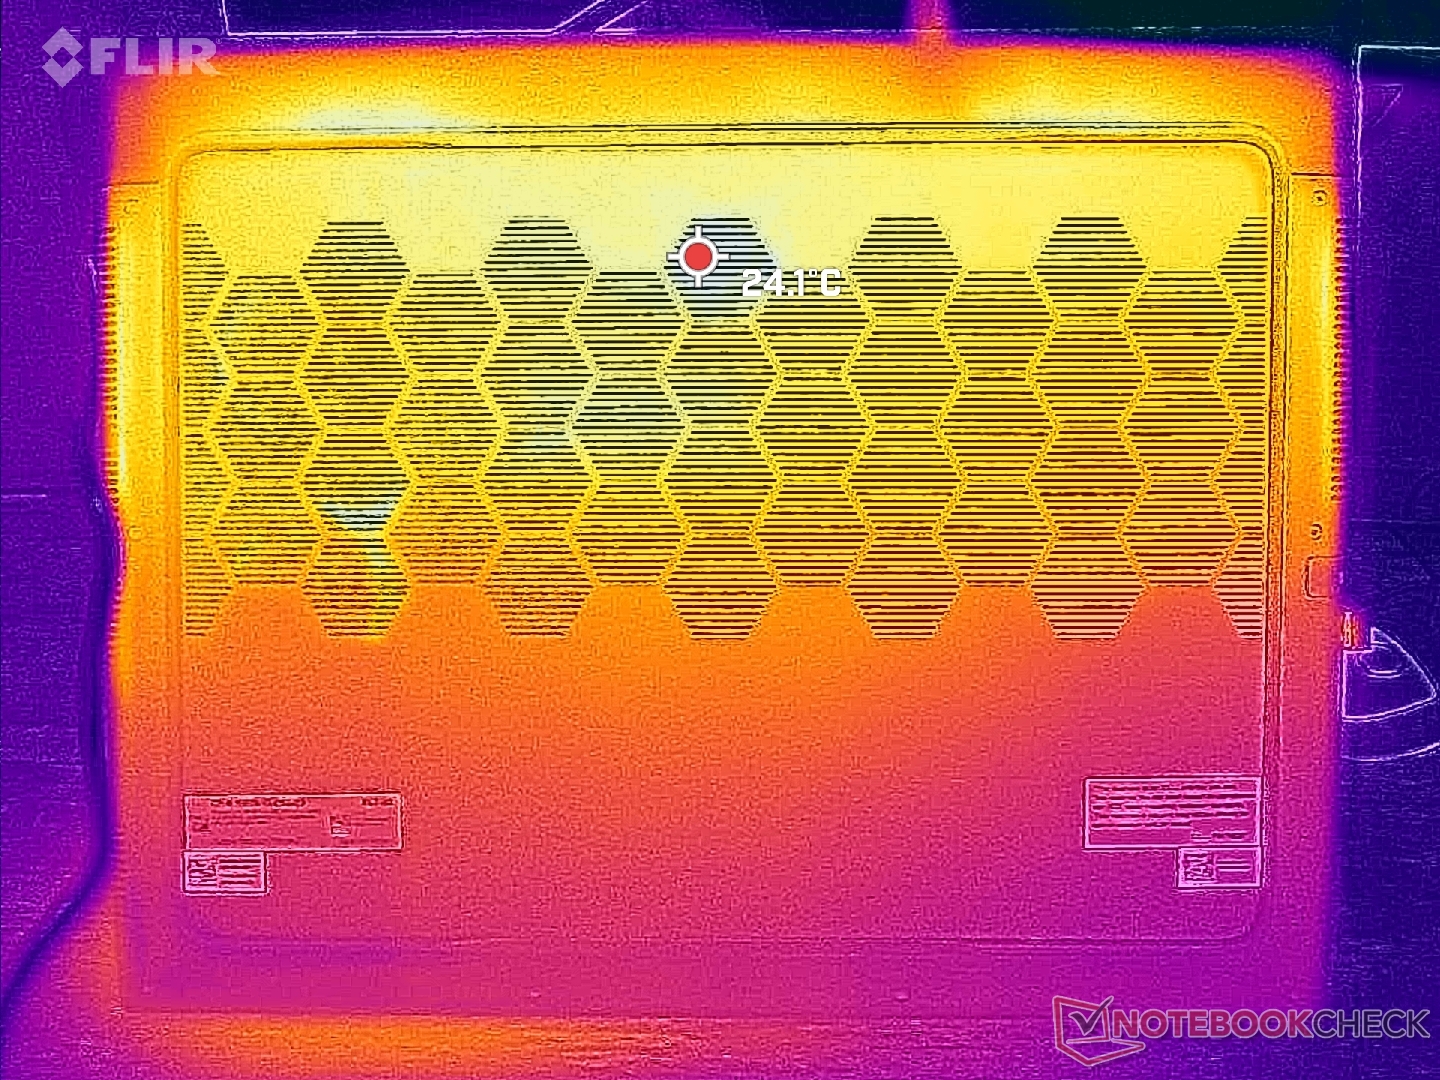
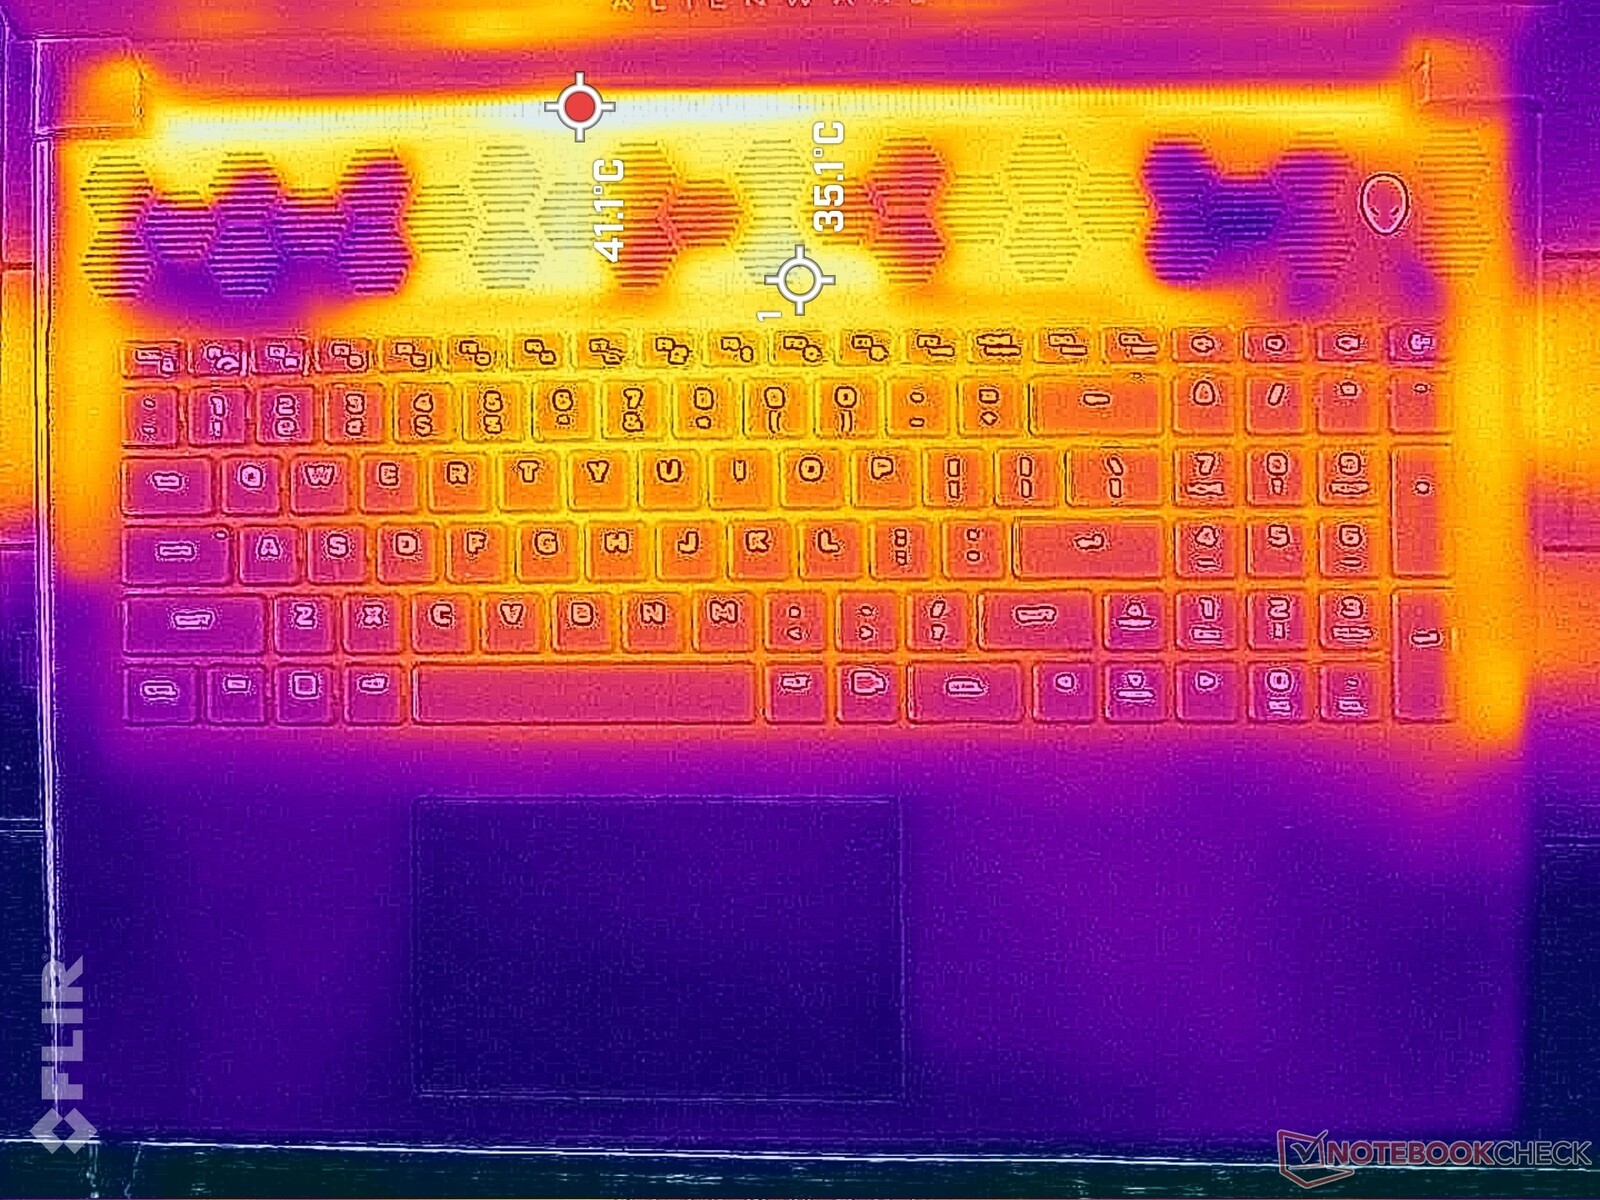
Yttemperaturer är inget problem, delvis tack vare de rikliga ventilationsgallren på nästan varje sida av det stora chassit. De varmaste platserna finns längs baksidan, bort från tangentbordstangenterna och handflatorna för att hålla händerna bekväma.
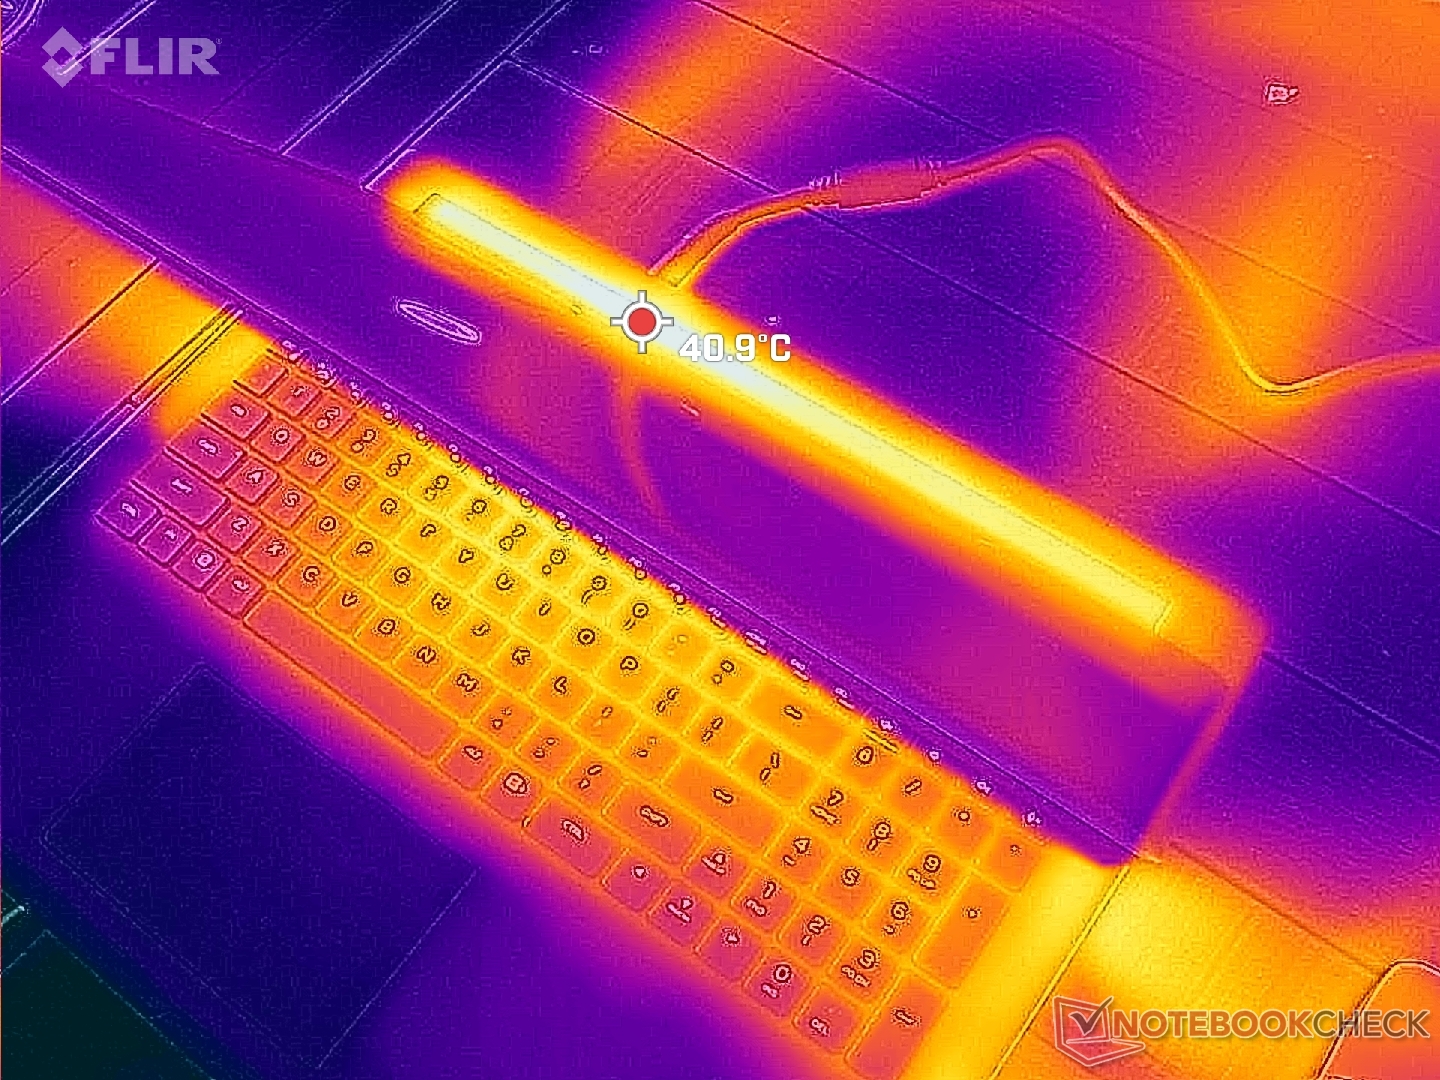
(+) Den maximala temperaturen på ovansidan är 39 °C / 102 F, jämfört med genomsnittet av 40.4 °C / 105 F , allt från 21.2 till 68.8 °C för klassen Gaming.
(+) Botten värms upp till maximalt 36.4 °C / 98 F, jämfört med genomsnittet av 43.2 °C / 110 F
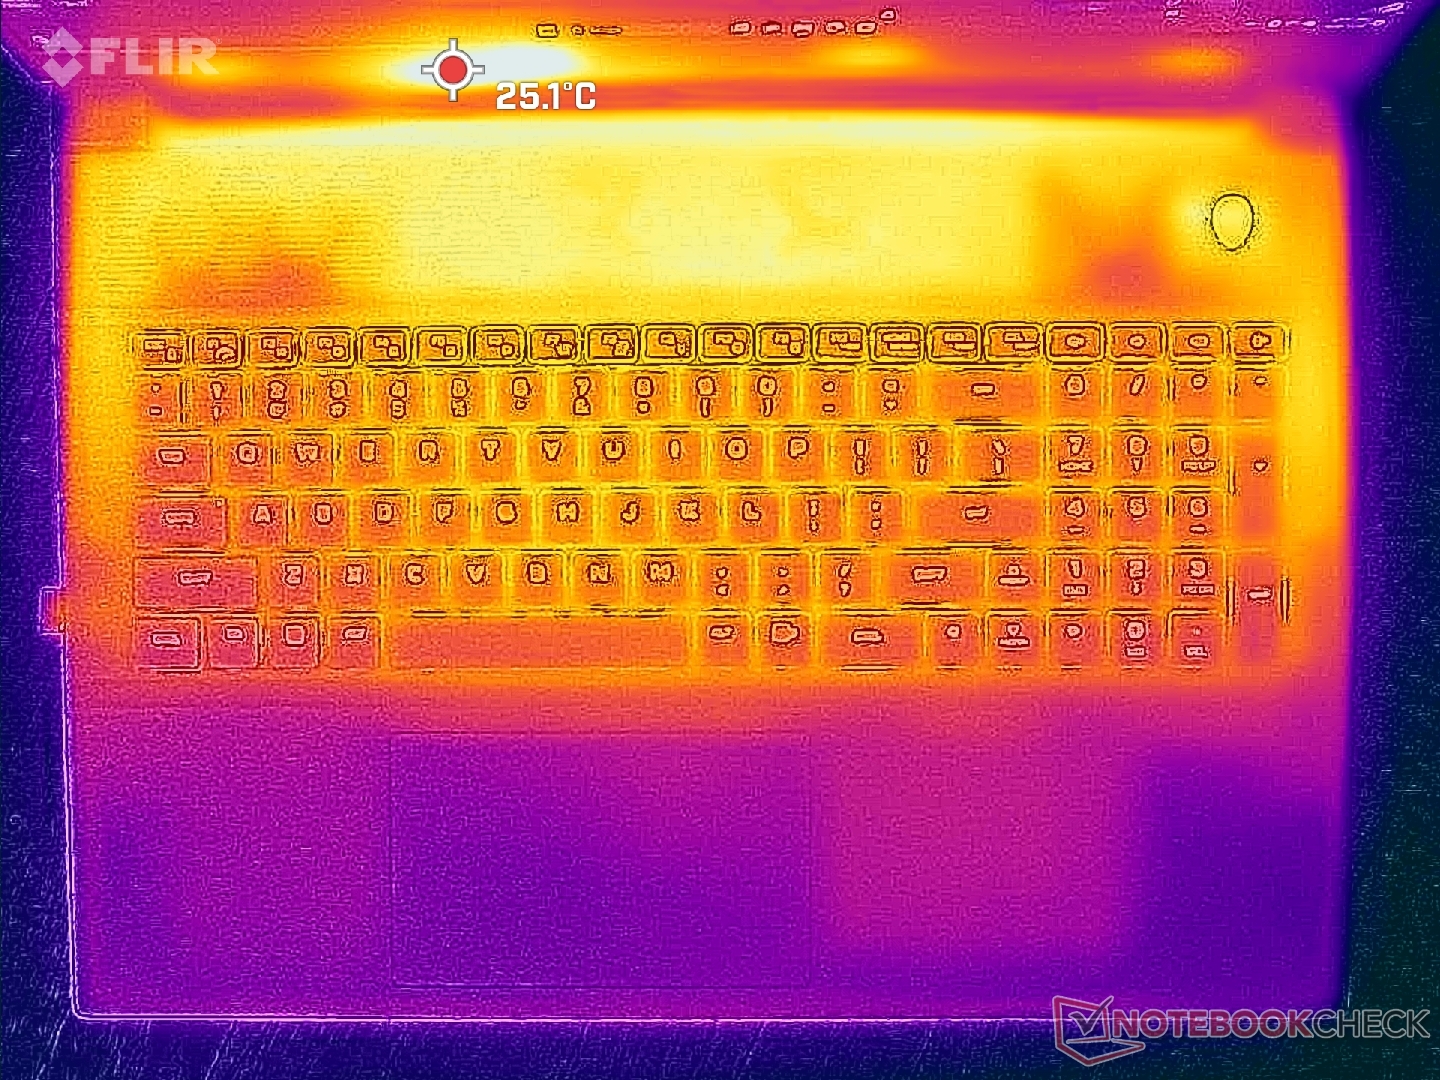
(+) Vid tomgångsbruk är medeltemperaturen för ovansidan 25.2 °C / 77 F, jämfört med enhetsgenomsnittet på 33.9 °C / ### class_avg_f### F.
(+) När du spelar The Witcher 3 är medeltemperaturen för ovansidan 29.8 °C / 86 F, jämfört med enhetsgenomsnittet på 33.9 °C / ## #class_avg_f### F.
(+) Handledsstöden och pekplattan är kallare än hudtemperaturen med maximalt 23.8 °C / 74.8 F och är därför svala att ta på.
(+) Medeltemperaturen för handledsstödsområdet på liknande enheter var 28.8 °C / 83.8 F (+5 °C / 9 F).
| Alienware m18 R1 Intel Core i9-13980HX, NVIDIA GeForce RTX 4090 Laptop GPU | Razer Blade 18 RTX 4070 Intel Core i9-13950HX, NVIDIA GeForce RTX 4070 Laptop GPU | Asus ROG Strix Scar 18 2023 G834JY-N6005W Intel Core i9-13980HX, NVIDIA GeForce RTX 4090 Laptop GPU | Eluktronics Mech-17 GP2 Intel Core i9-13900HX, NVIDIA GeForce RTX 4090 Laptop GPU | MSI Titan GT77 HX 13VI Intel Core i9-13950HX, NVIDIA GeForce RTX 4090 Laptop GPU | Alienware x17 R2 P48E Intel Core i9-12900HK, NVIDIA GeForce RTX 3080 Ti Laptop GPU | |
|---|---|---|---|---|---|---|
| Heat | -7% | -20% | -9% | -4% | -15% | |
| Maximum Upper Side * (°C) | 39 | 39.2 -1% | 54 -38% | 39 -0% | 40.6 -4% | 49.6 -27% |
| Maximum Bottom * (°C) | 36.4 | 35.6 2% | 46 -26% | 44 -21% | 41.1 -13% | 42.4 -16% |
| Idle Upper Side * (°C) | 29.2 | 31.8 -9% | 30 -3% | 31 -6% | 26.2 10% | 29.2 -0% |
| Idle Bottom * (°C) | 27.8 | 33.2 -19% | 31 -12% | 29.8 -7% | 30.3 -9% | 32 -15% |
* ... mindre är bättre
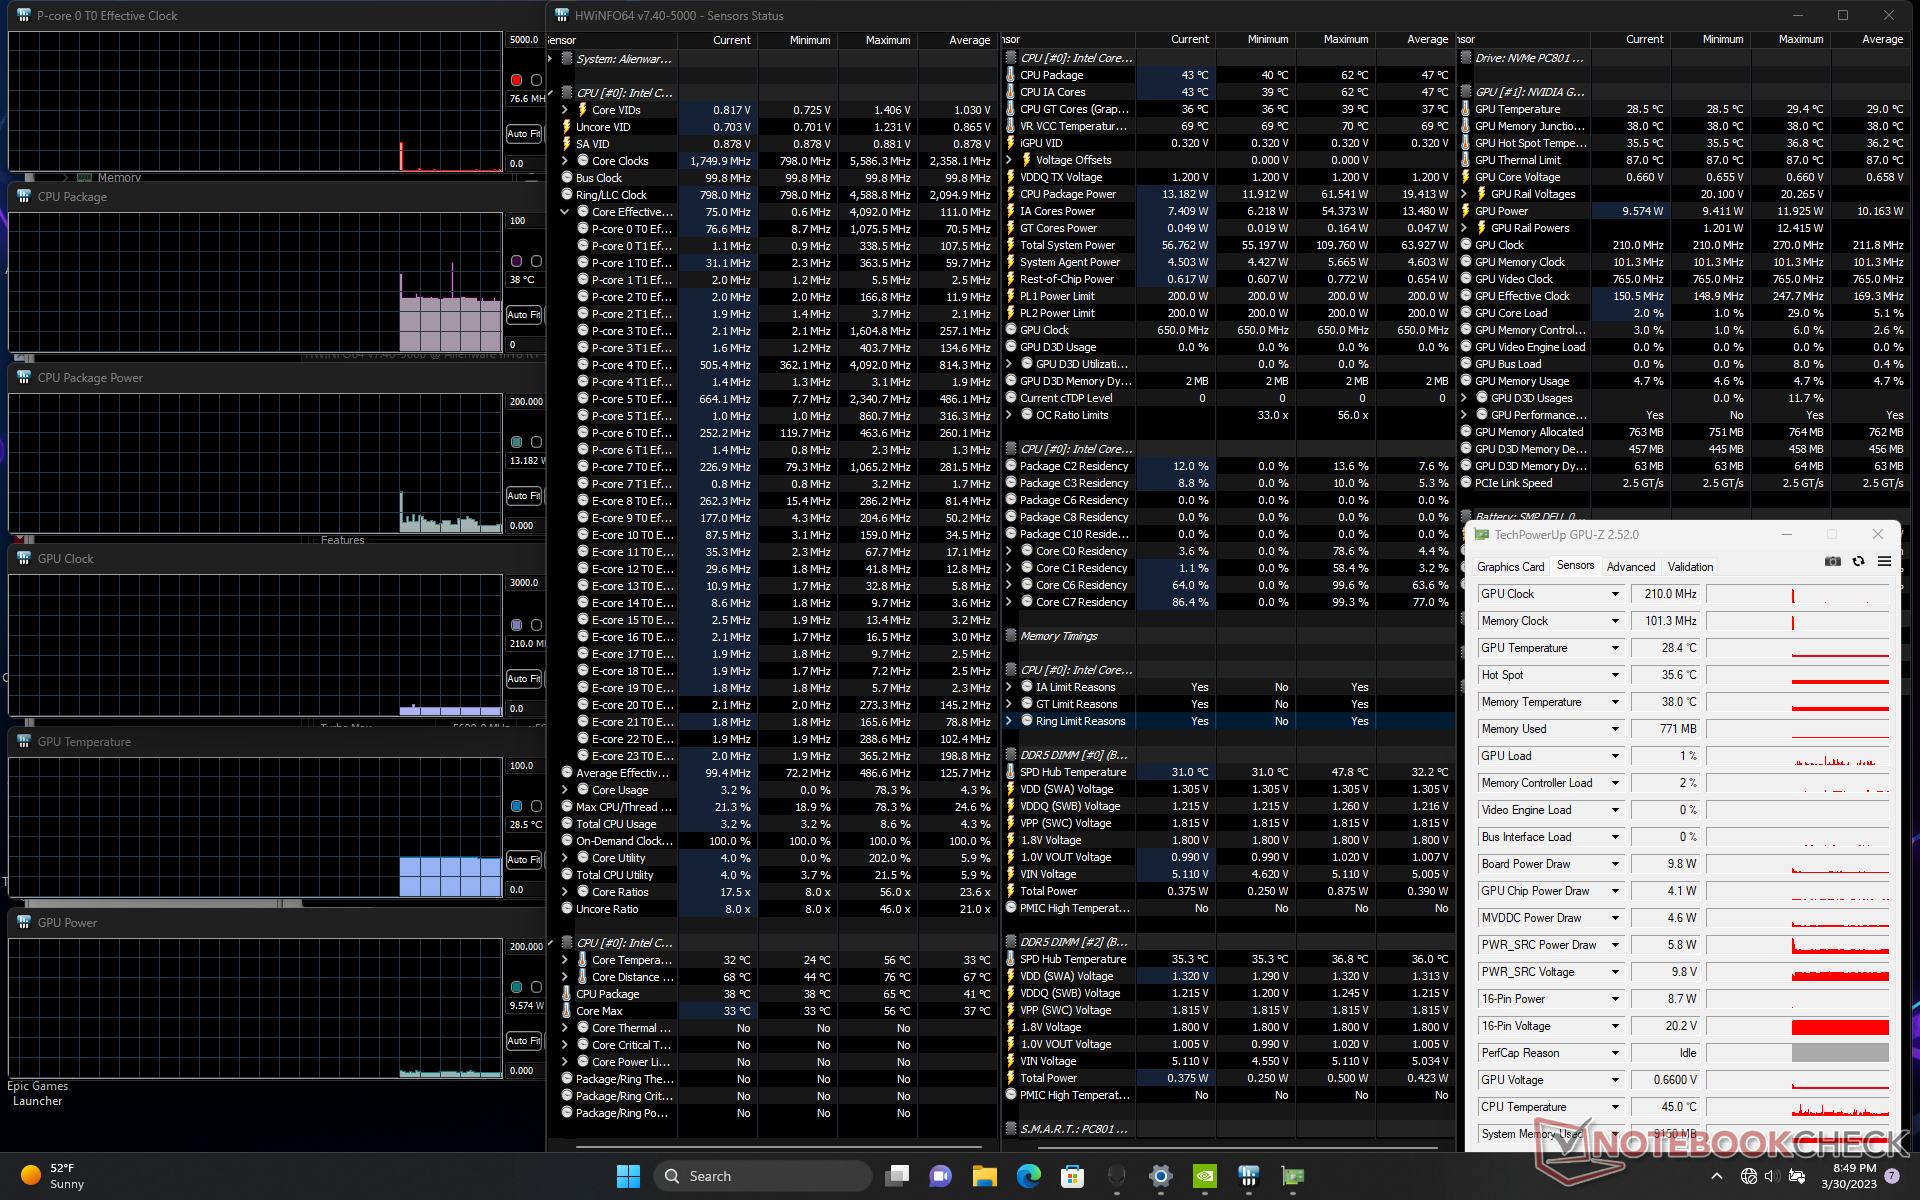
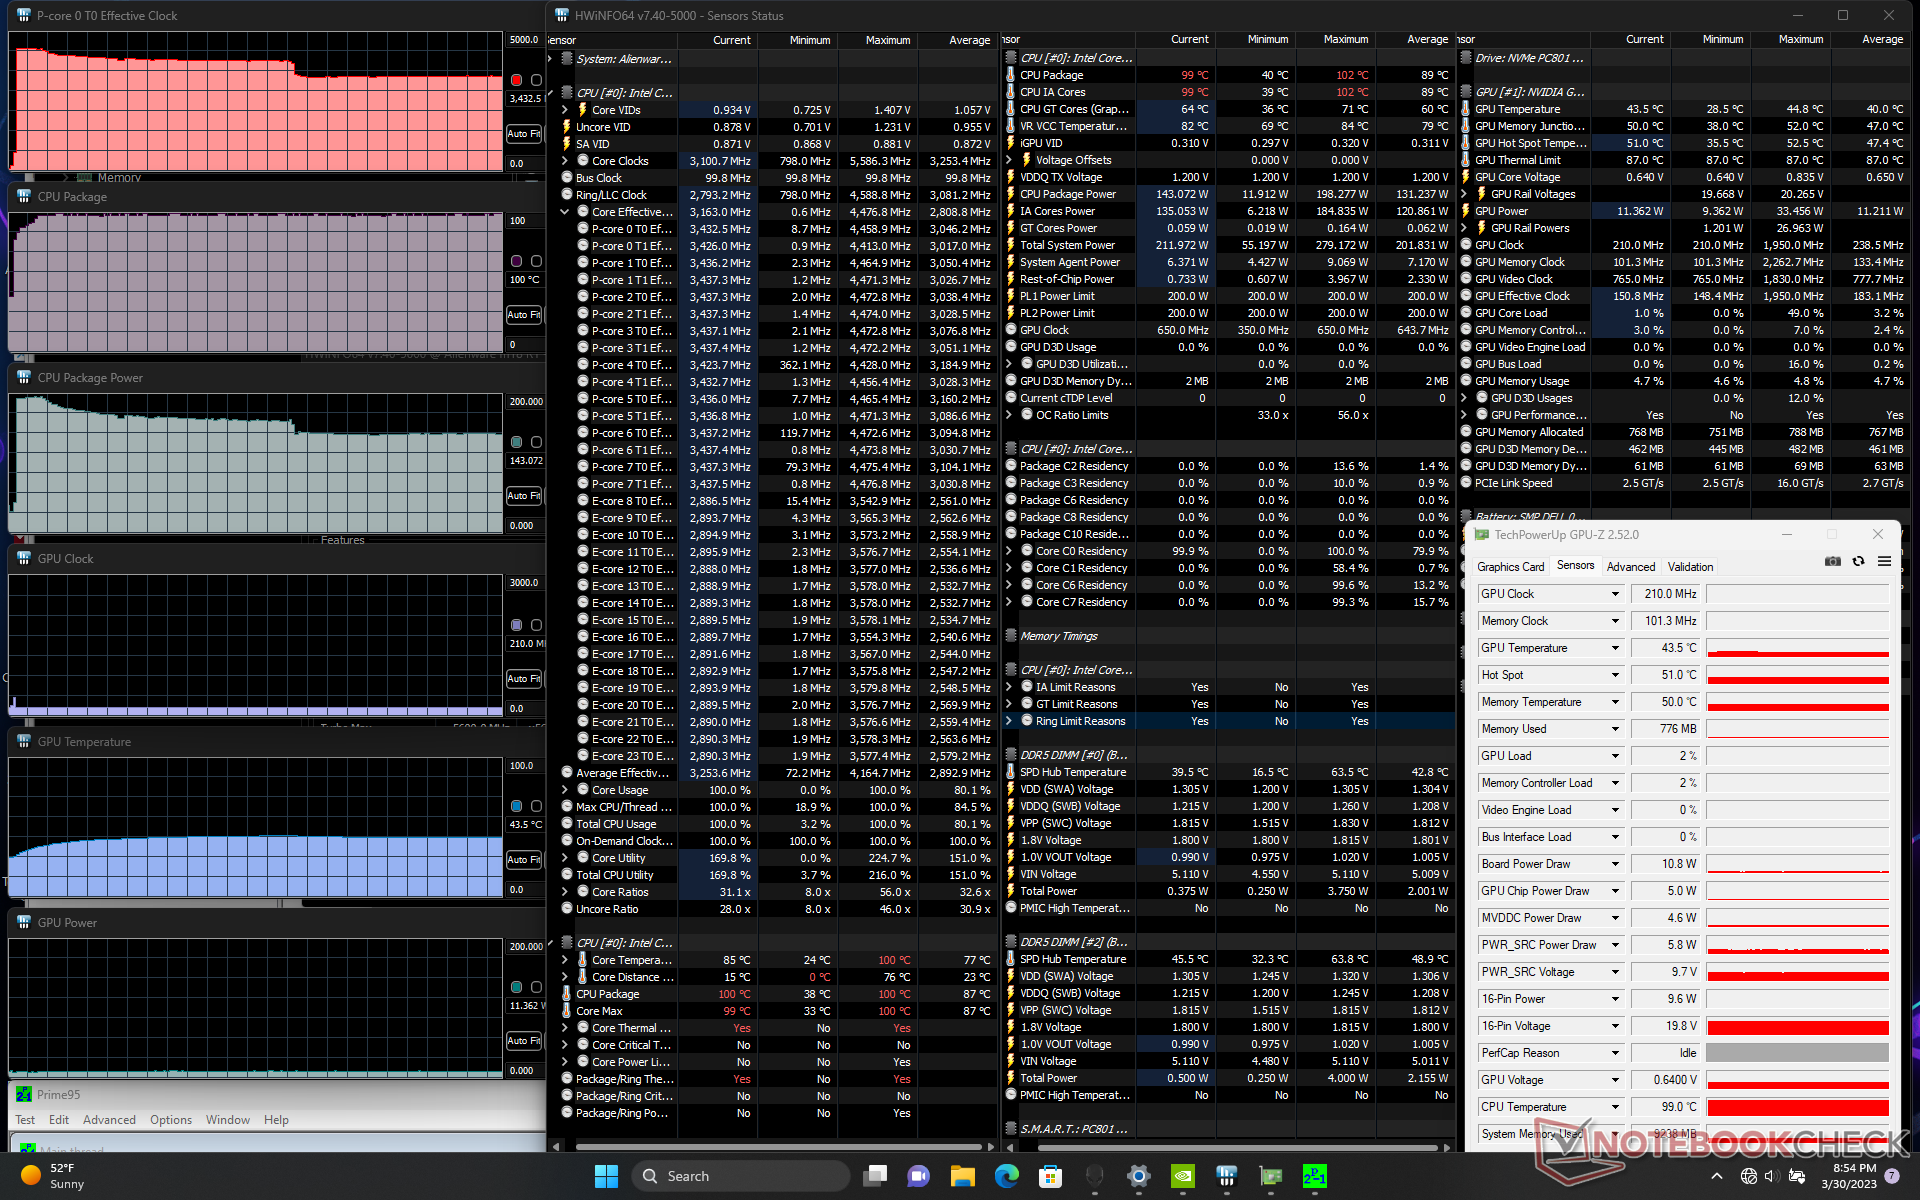
Stresstest
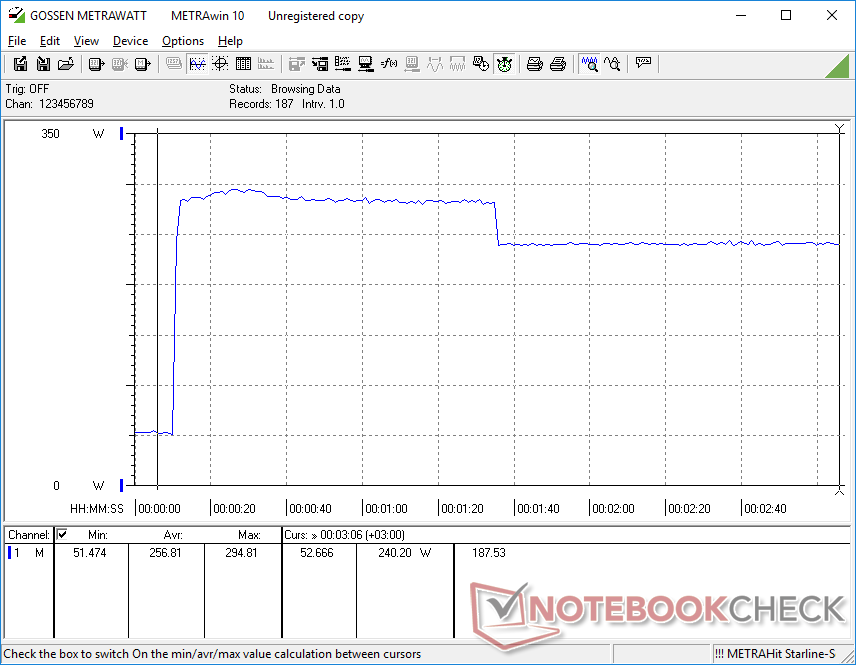
När Prime95 körs för att stressa CPU:n, stiger klockfrekvensen och strömförbrukningen på kortet till 4,5 GHz respektive 198 W, vilket bara varar i några sekunder eller tills kärntemperaturen når 99 C. Därefter sjunker CPU:n till 4,2 GHz och 175 W under de närmaste minuterna innan den slutligen stabiliseras på 3,4 GHz, 143 W och 99 C. Maximal Turbo Boost är därför inte hållbar oavsett strömläge. CPU-temperaturerna är också extrema även för en bärbar dator för spel.
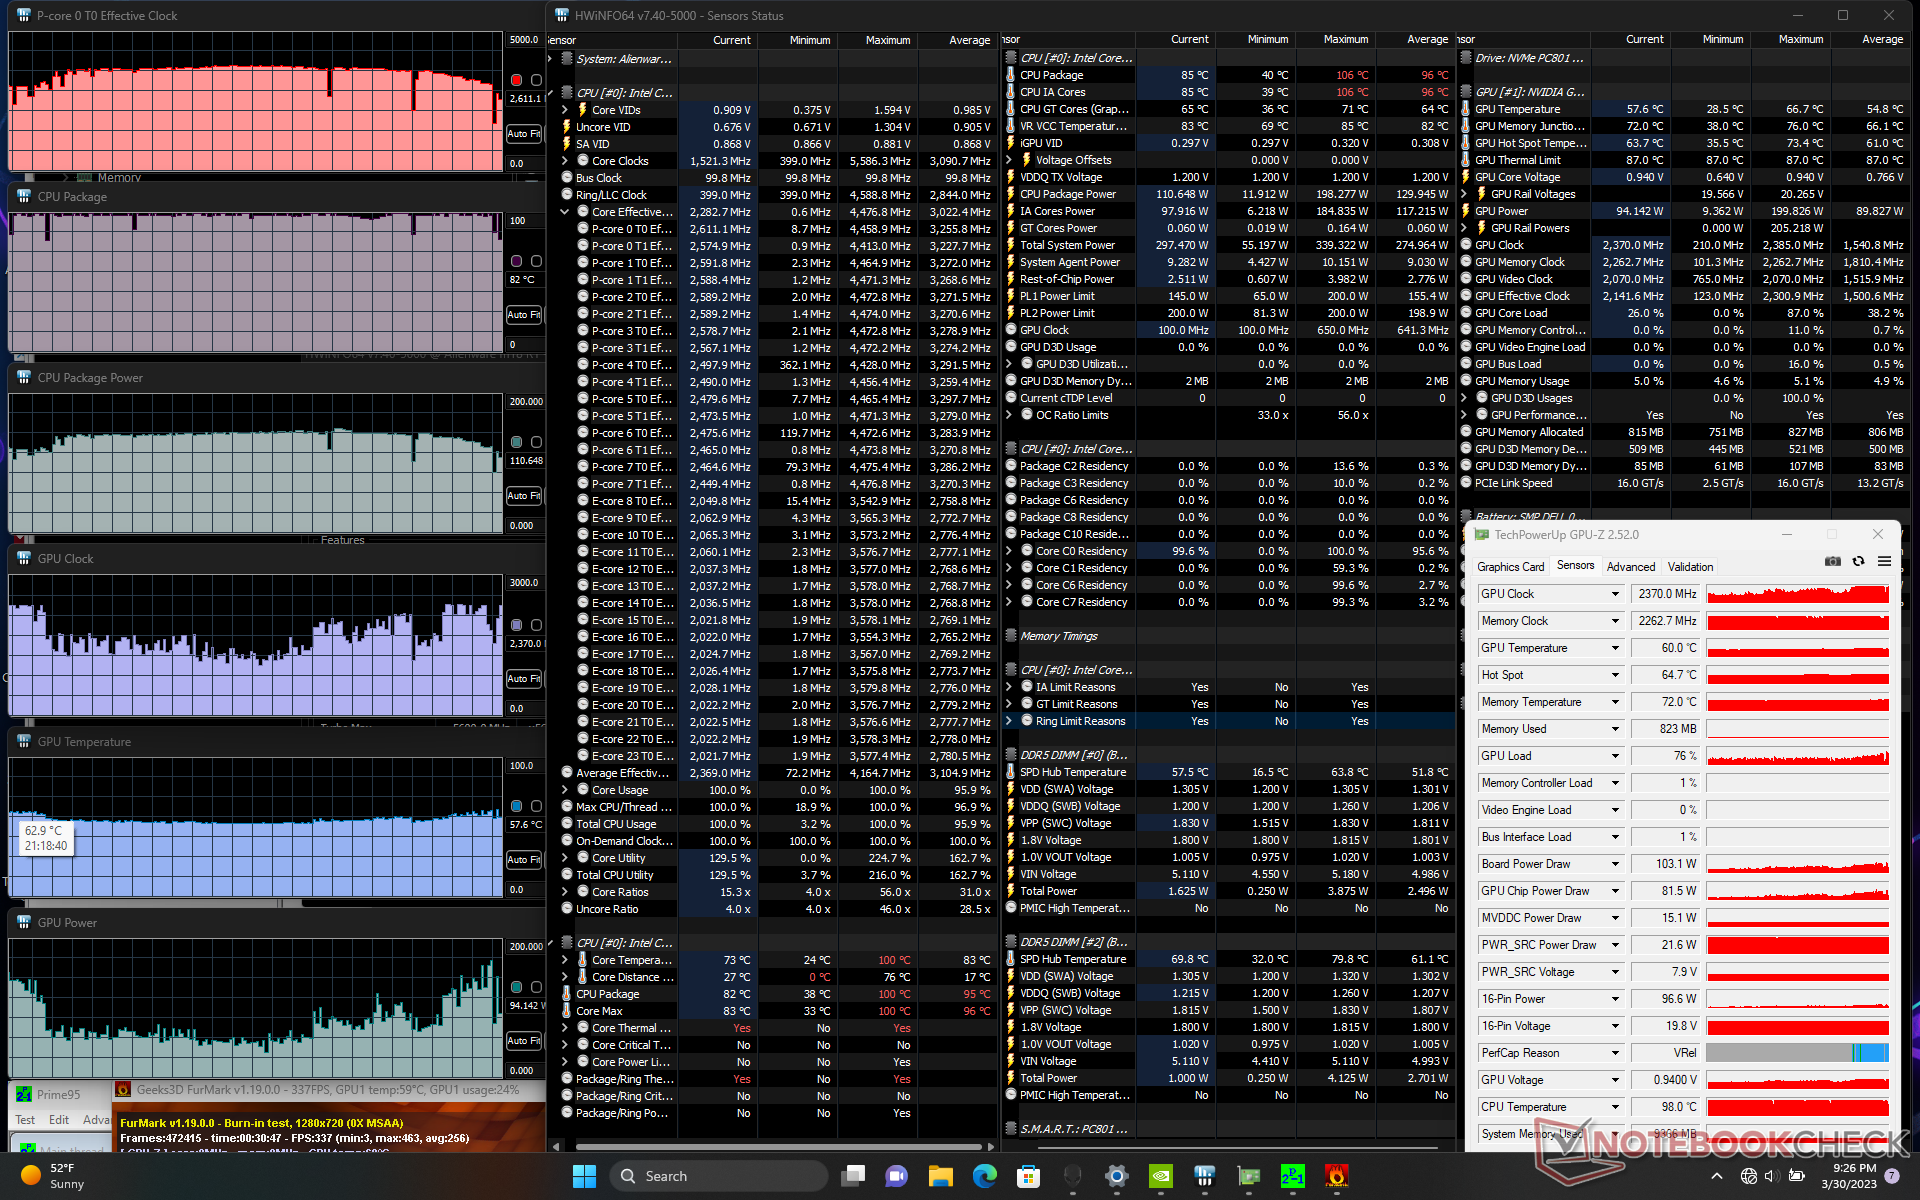
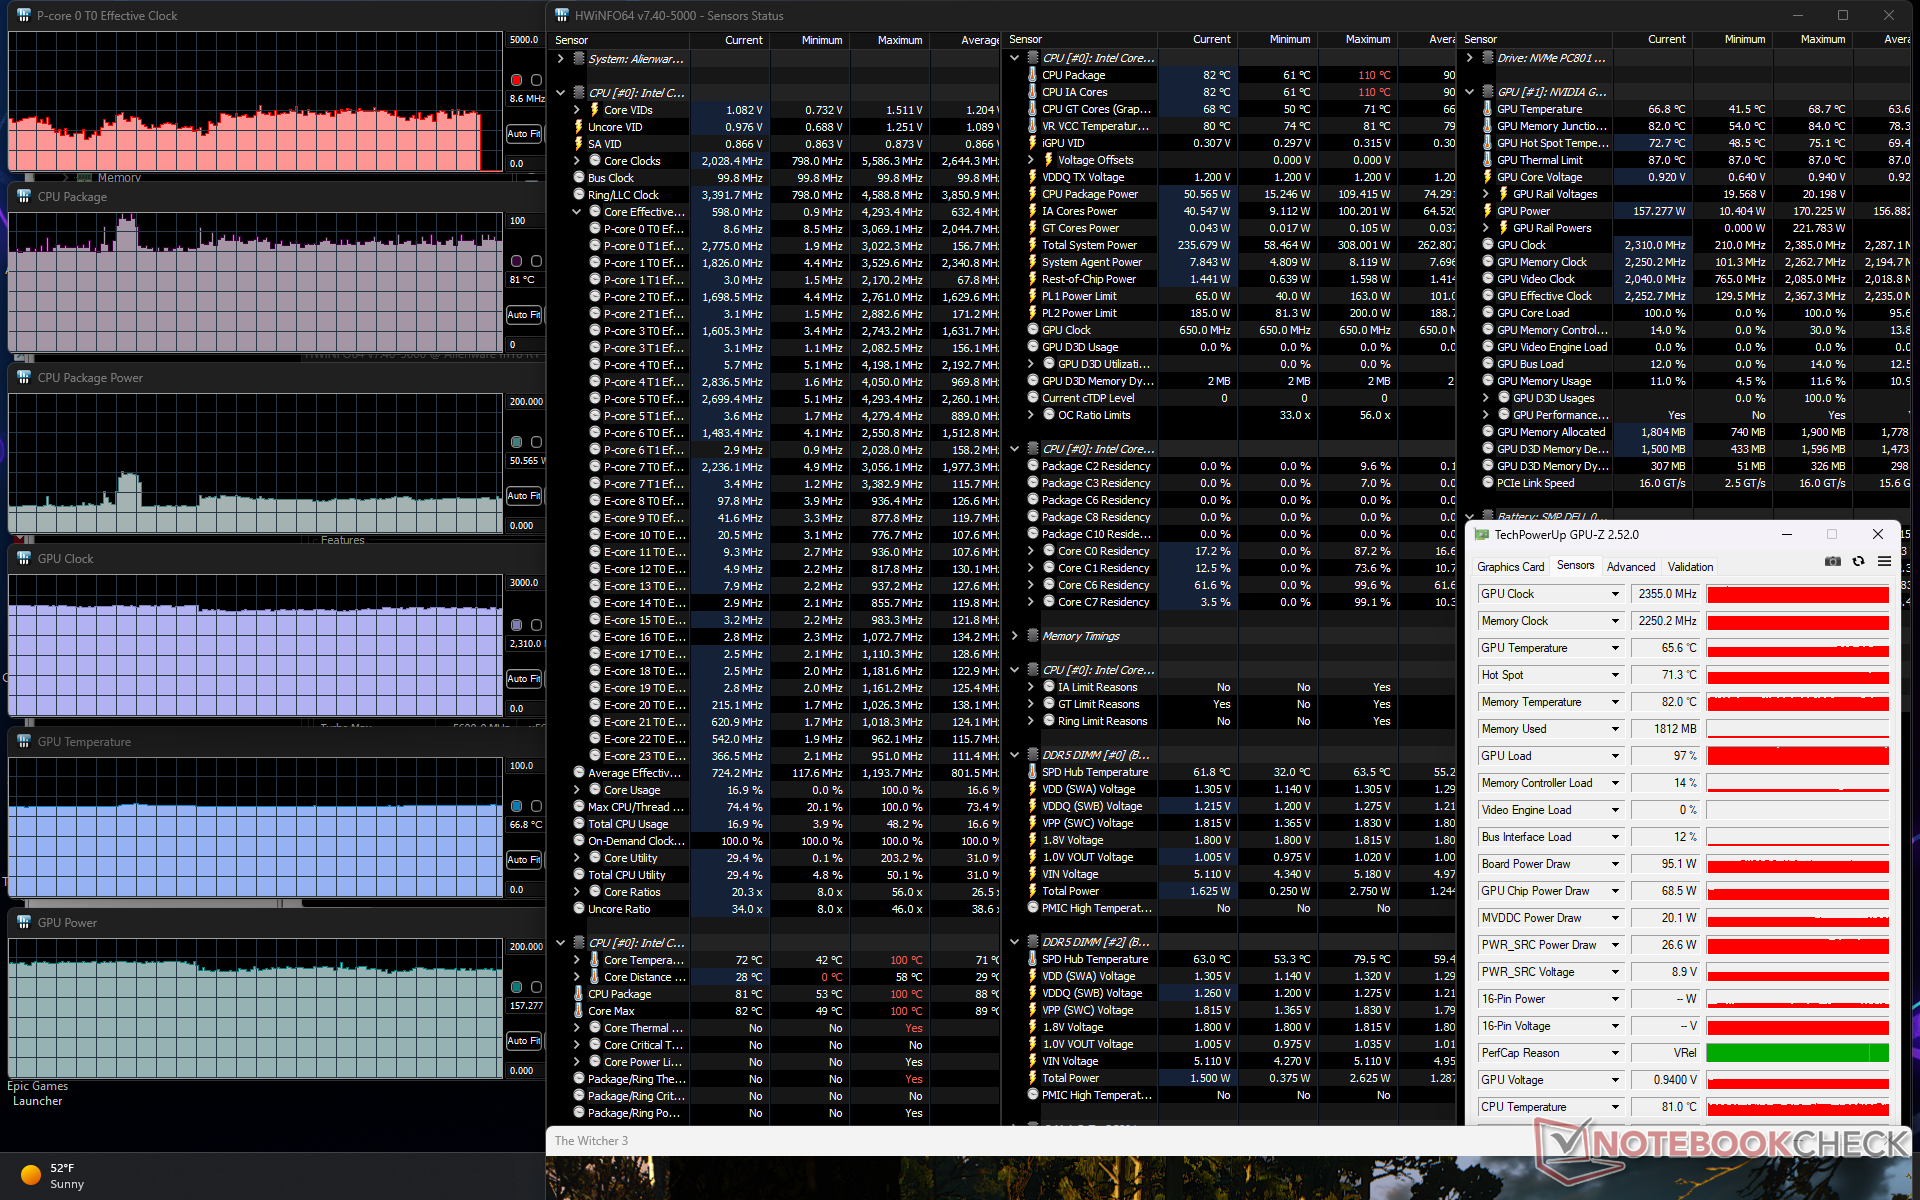
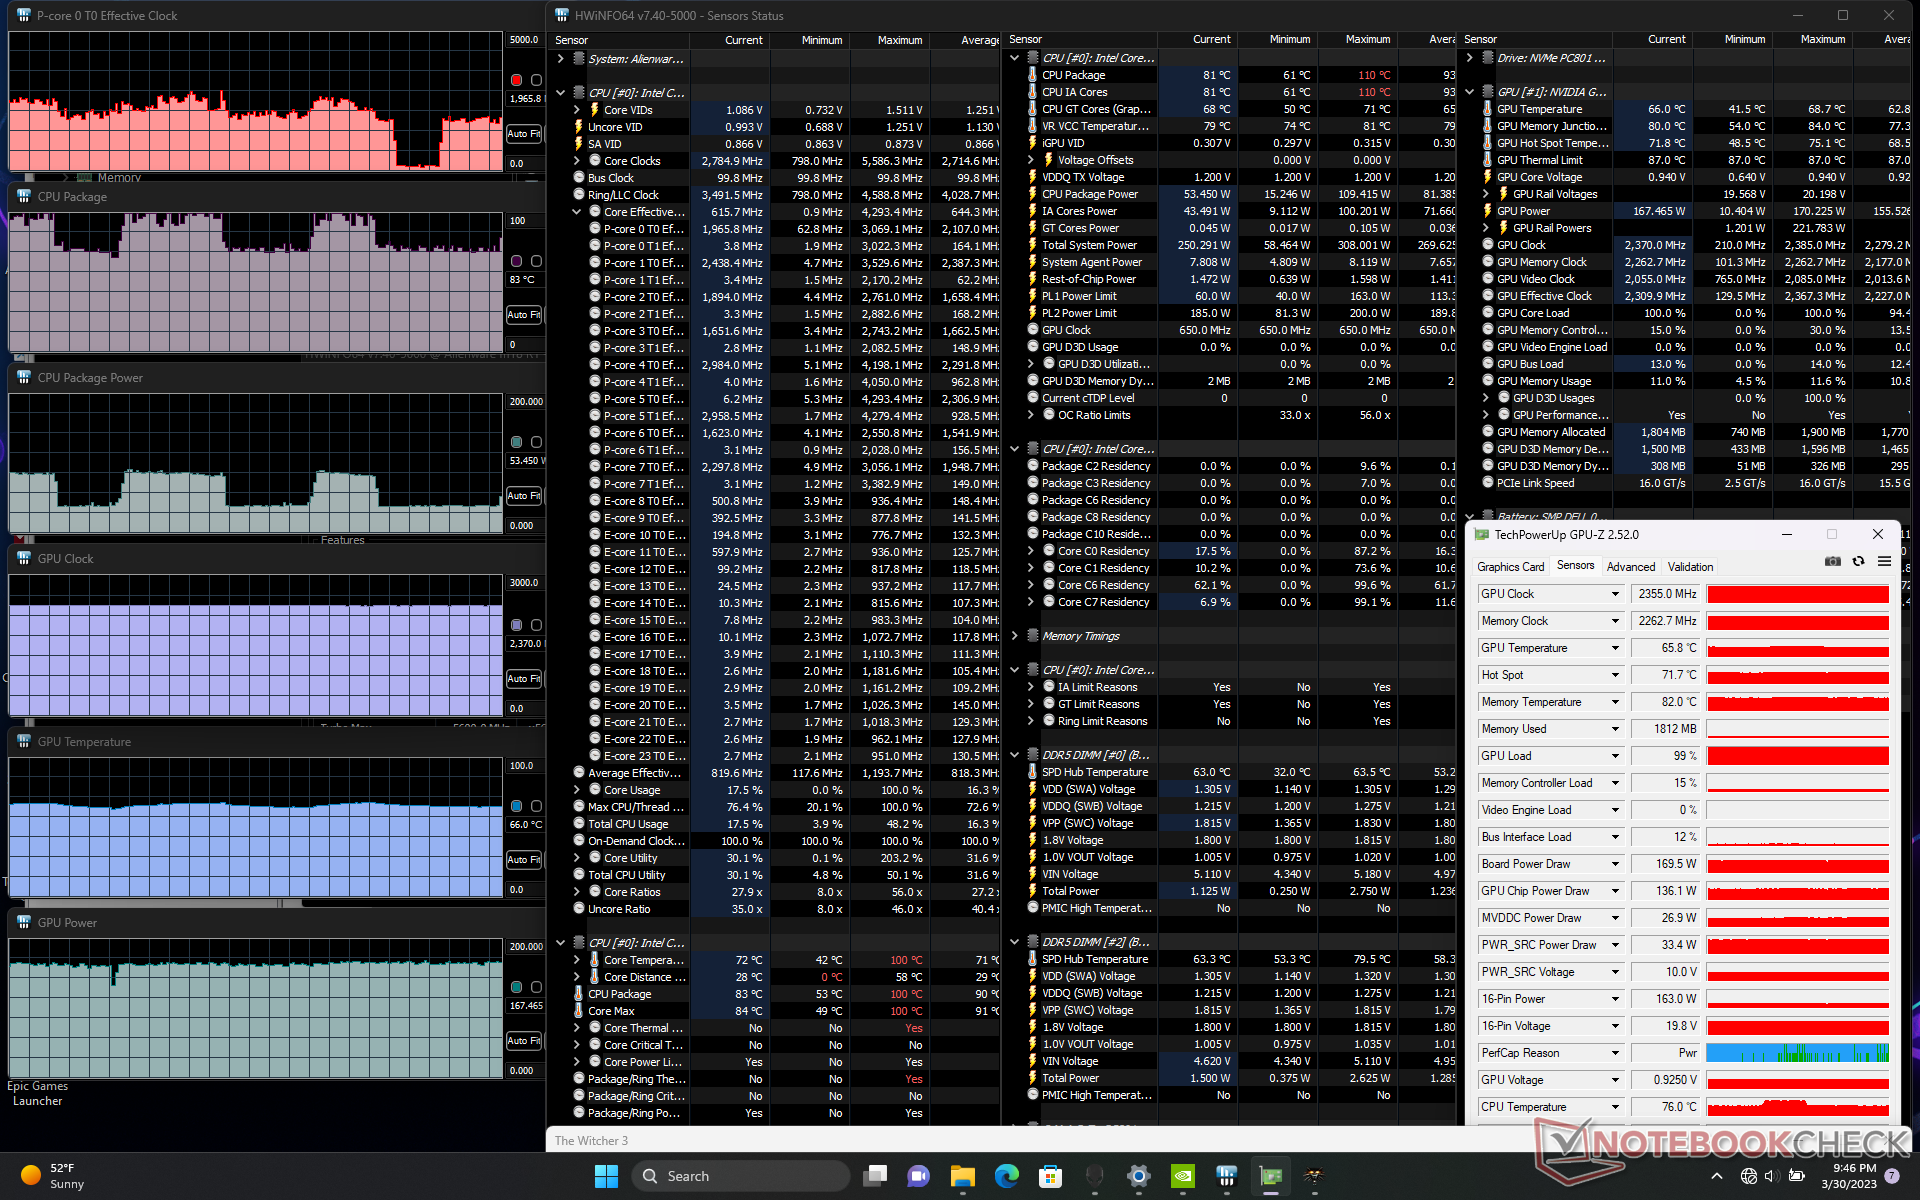
GPU:s klockfrekvens, temperatur och strömförbrukning på kortet skulle stabiliseras vid 2370 MHz, 63 C respektive 162 W när följande körs Witcher 3 i Overdrive-läget. Observera att GPU-prestandan inte påverkas när den körs i det tystare läget Performance, vilket stämmer överens med våra observationer från Fire Strike ovan. Istället är det CPU:n som tar en liten skada i prestanda. Eftersom de flesta spel är GPU-bundna rekommenderar vi att du spelar i Performance-läget snarare än i det högre Overdrive-läget om fläktljudet är ett bekymmer.
Att köra på batteri begränsar prestandan som förväntat. Ett Fire Strike -test på batterier skulle ge Physics- och Graphics-poäng på 25319 respektive 18778 poäng, jämfört med 41644 respektive 46998 poäng när det är på strömnätet.
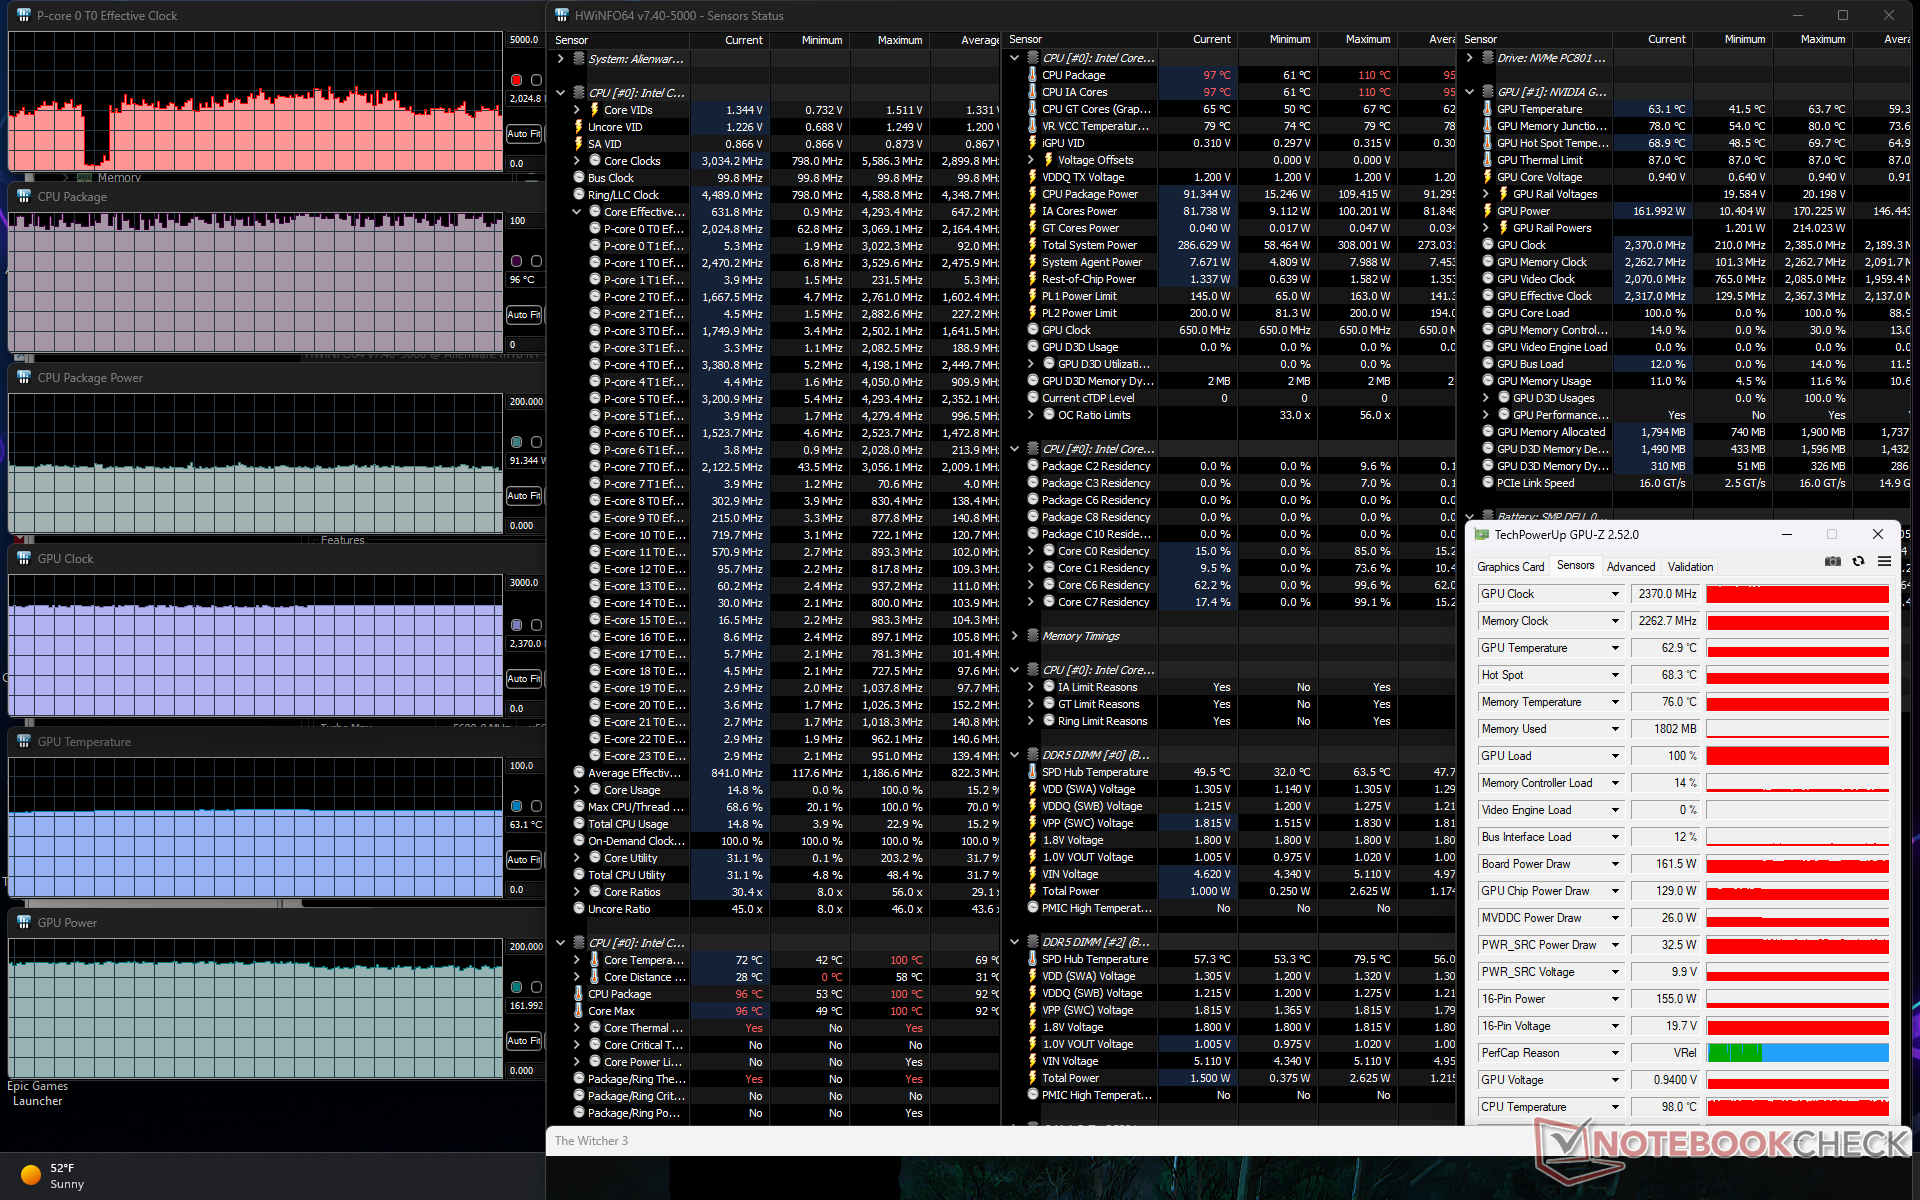
| CPU-klocka (GHz) | GPU-klocka (MHz) | Genomsnittlig CPU-temperatur (°C) | Genomsnittlig GPU-temperatur (°C) | |
| System Idle | -- | -- | 38 | 29 |
| Prime95 Stress | 3.4 | -- | 100 | 44 |
| Prime95 + FurMark Stress | 2.6+ | 1070 - 2370 | 82 - 100 | 57 |
| Witcher 3 Stress (Overdrive-läge) | ~2,0+ | 2370 | 96 | 63 |
| Witcher 3 Stress (prestanda) | ~1.8+ | 2370 | 81 | 66 |
| Witcher 3 Stress (balanserat läge) | ~1,8 | 2310 | 81 | 67 |
Högtalare
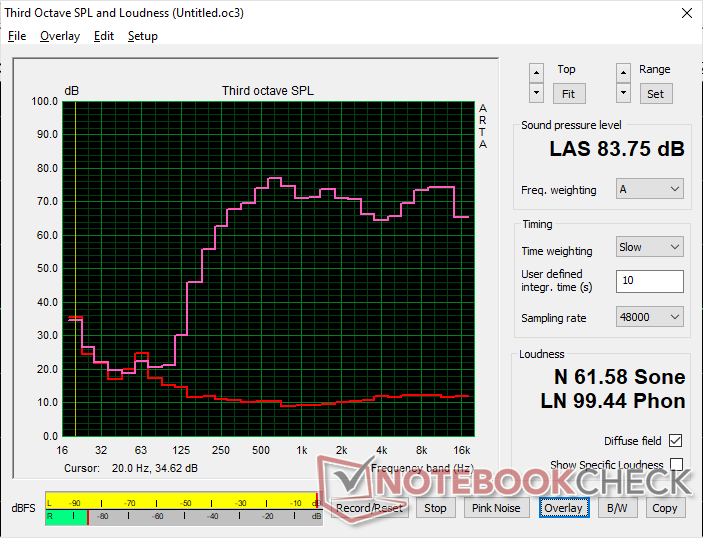
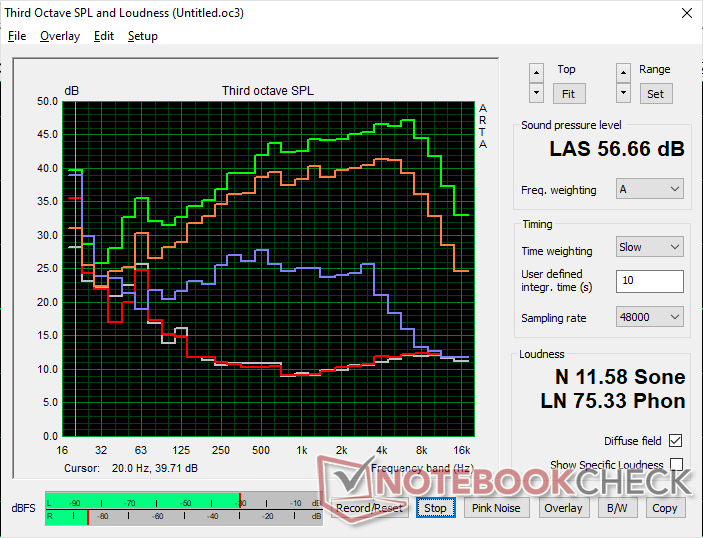
Alienware m18 R1 ljudanalys
(+) | högtalare kan spela relativt högt (83.8 dB)
Bas 100 - 315 Hz
(-) | nästan ingen bas - i genomsnitt 22.4% lägre än medianen
(±) | linjäriteten för basen är genomsnittlig (13.4% delta till föregående frekvens)
Mellan 400 - 2000 Hz
(+) | balanserad mellan - endast 3.2% från medianen
(+) | mids är linjära (4.4% delta till föregående frekvens)
Högsta 2 - 16 kHz
(+) | balanserade toppar - endast 3.2% från medianen
(+) | toppar är linjära (4% delta till föregående frekvens)
Totalt 100 - 16 000 Hz
(+) | det totala ljudet är linjärt (14.6% skillnad mot median)
Jämfört med samma klass
» 28% av alla testade enheter i den här klassen var bättre, 7% liknande, 65% sämre
» Den bästa hade ett delta på 6%, genomsnittet var 18%, sämst var 132%
Jämfört med alla testade enheter
» 19% av alla testade enheter var bättre, 4% liknande, 77% sämre
» Den bästa hade ett delta på 4%, genomsnittet var 24%, sämst var 134%
Apple MacBook Pro 16 2021 M1 Pro ljudanalys
(+) | högtalare kan spela relativt högt (84.7 dB)
Bas 100 - 315 Hz
(+) | bra bas - bara 3.8% från medianen
(+) | basen är linjär (5.2% delta till föregående frekvens)
Mellan 400 - 2000 Hz
(+) | balanserad mellan - endast 1.3% från medianen
(+) | mids är linjära (2.1% delta till föregående frekvens)
Högsta 2 - 16 kHz
(+) | balanserade toppar - endast 1.9% från medianen
(+) | toppar är linjära (2.7% delta till föregående frekvens)
Totalt 100 - 16 000 Hz
(+) | det totala ljudet är linjärt (4.6% skillnad mot median)
Jämfört med samma klass
» 0% av alla testade enheter i den här klassen var bättre, 0% liknande, 100% sämre
» Den bästa hade ett delta på 5%, genomsnittet var 17%, sämst var 45%
Jämfört med alla testade enheter
» 0% av alla testade enheter var bättre, 0% liknande, 100% sämre
» Den bästa hade ett delta på 4%, genomsnittet var 24%, sämst var 134%
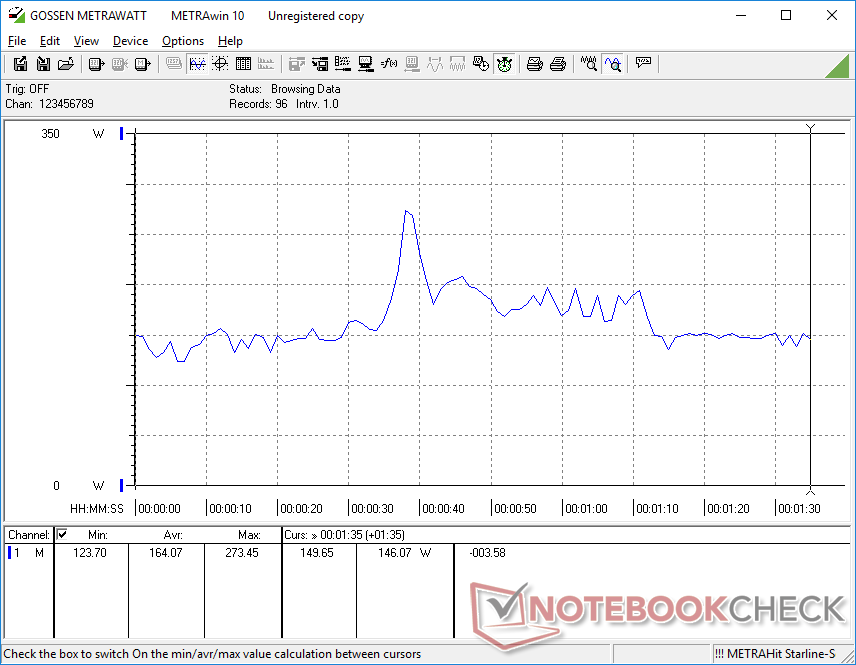
Energihantering - Över 300 W när du spelar
Effektförbrukning
Systemet är förvånande nog mycket krävande även när inga program körs. Vi kan registrera ett minimum av 21 W när det går på tomgång i energisparläge, Optimus-läge och den lägsta ljusstyrkan. Tomgång på Performance- eller Turboläget skulle öka tomgångsförbrukningen med över 2x och därför rekommenderas det starkt att undvika de högre profilinställningarna om de extra hästkrafterna inte behövs.
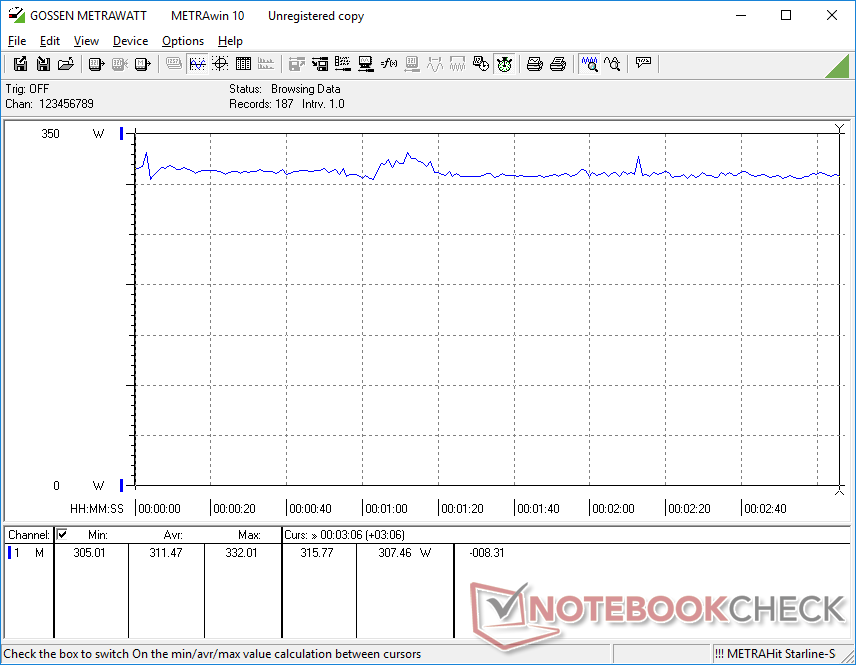
Körning av Witcher 3 för att representera typiska spelbelastningar drar 311 W eller över 50 W mer än på förra årets RTX 3080 Ti-drivna Alienware x17 R2. Även om prestandan är snabbare från generation till generation får användarna alltså betala för det genom högre elräkningar på grund av den mer krävande processorn.
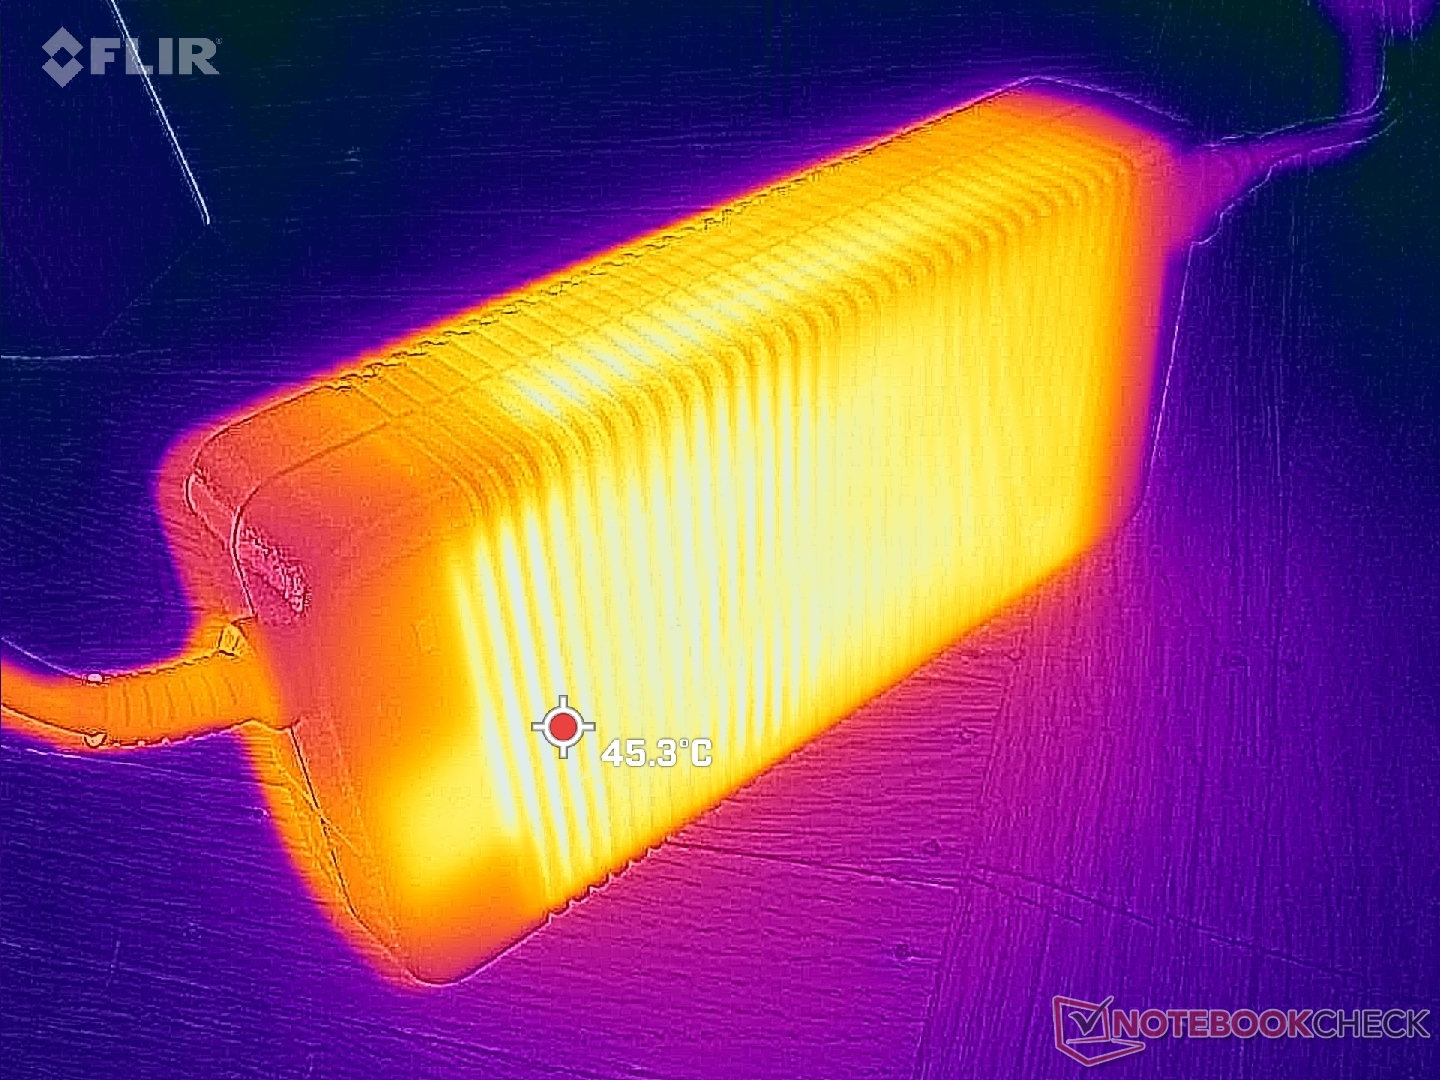
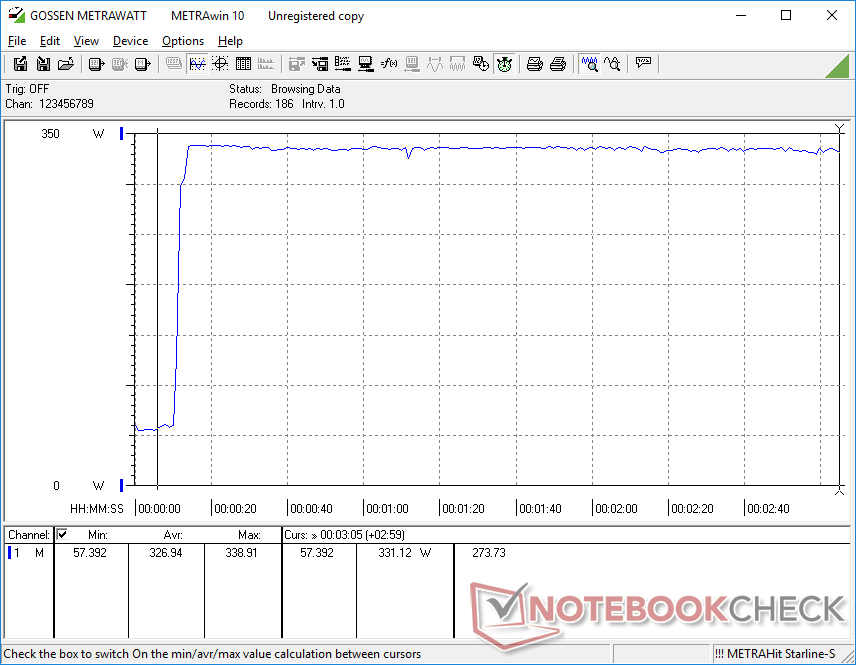
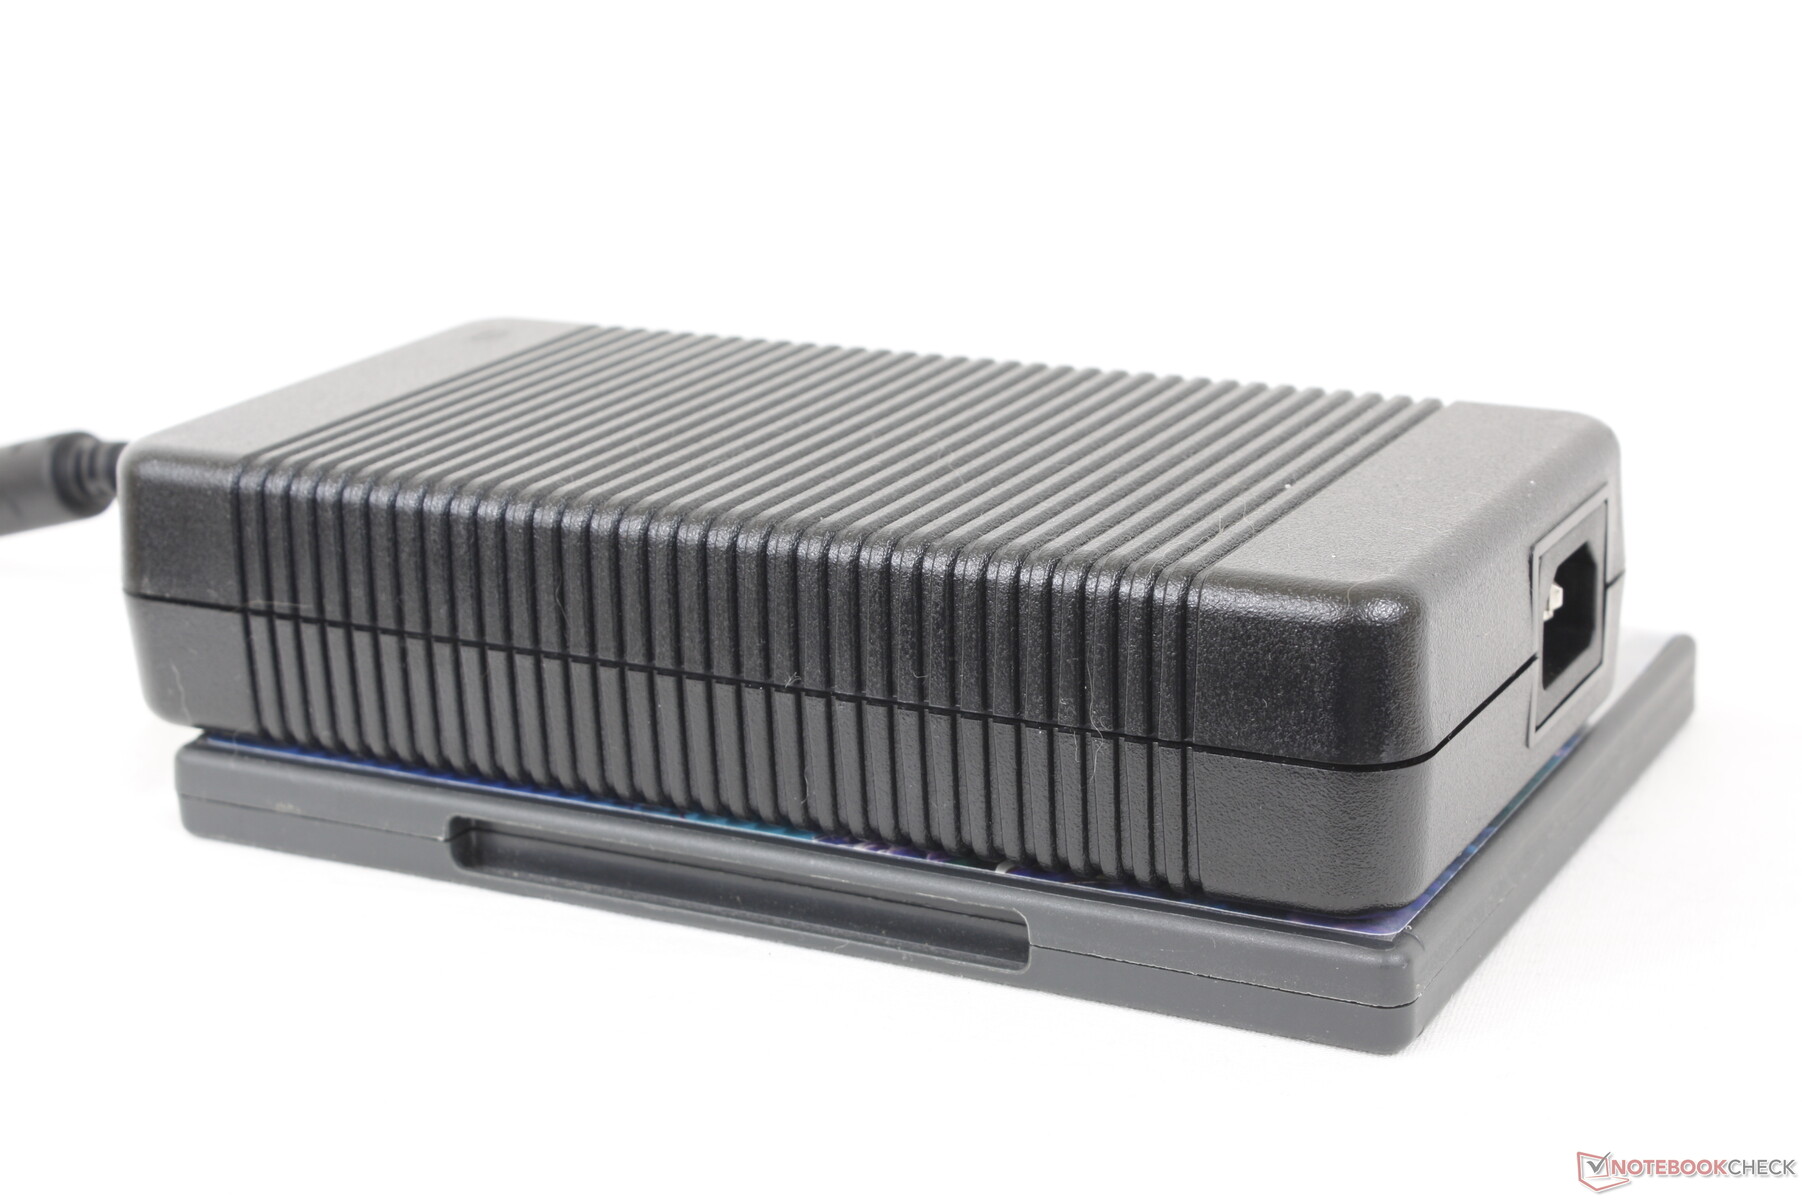
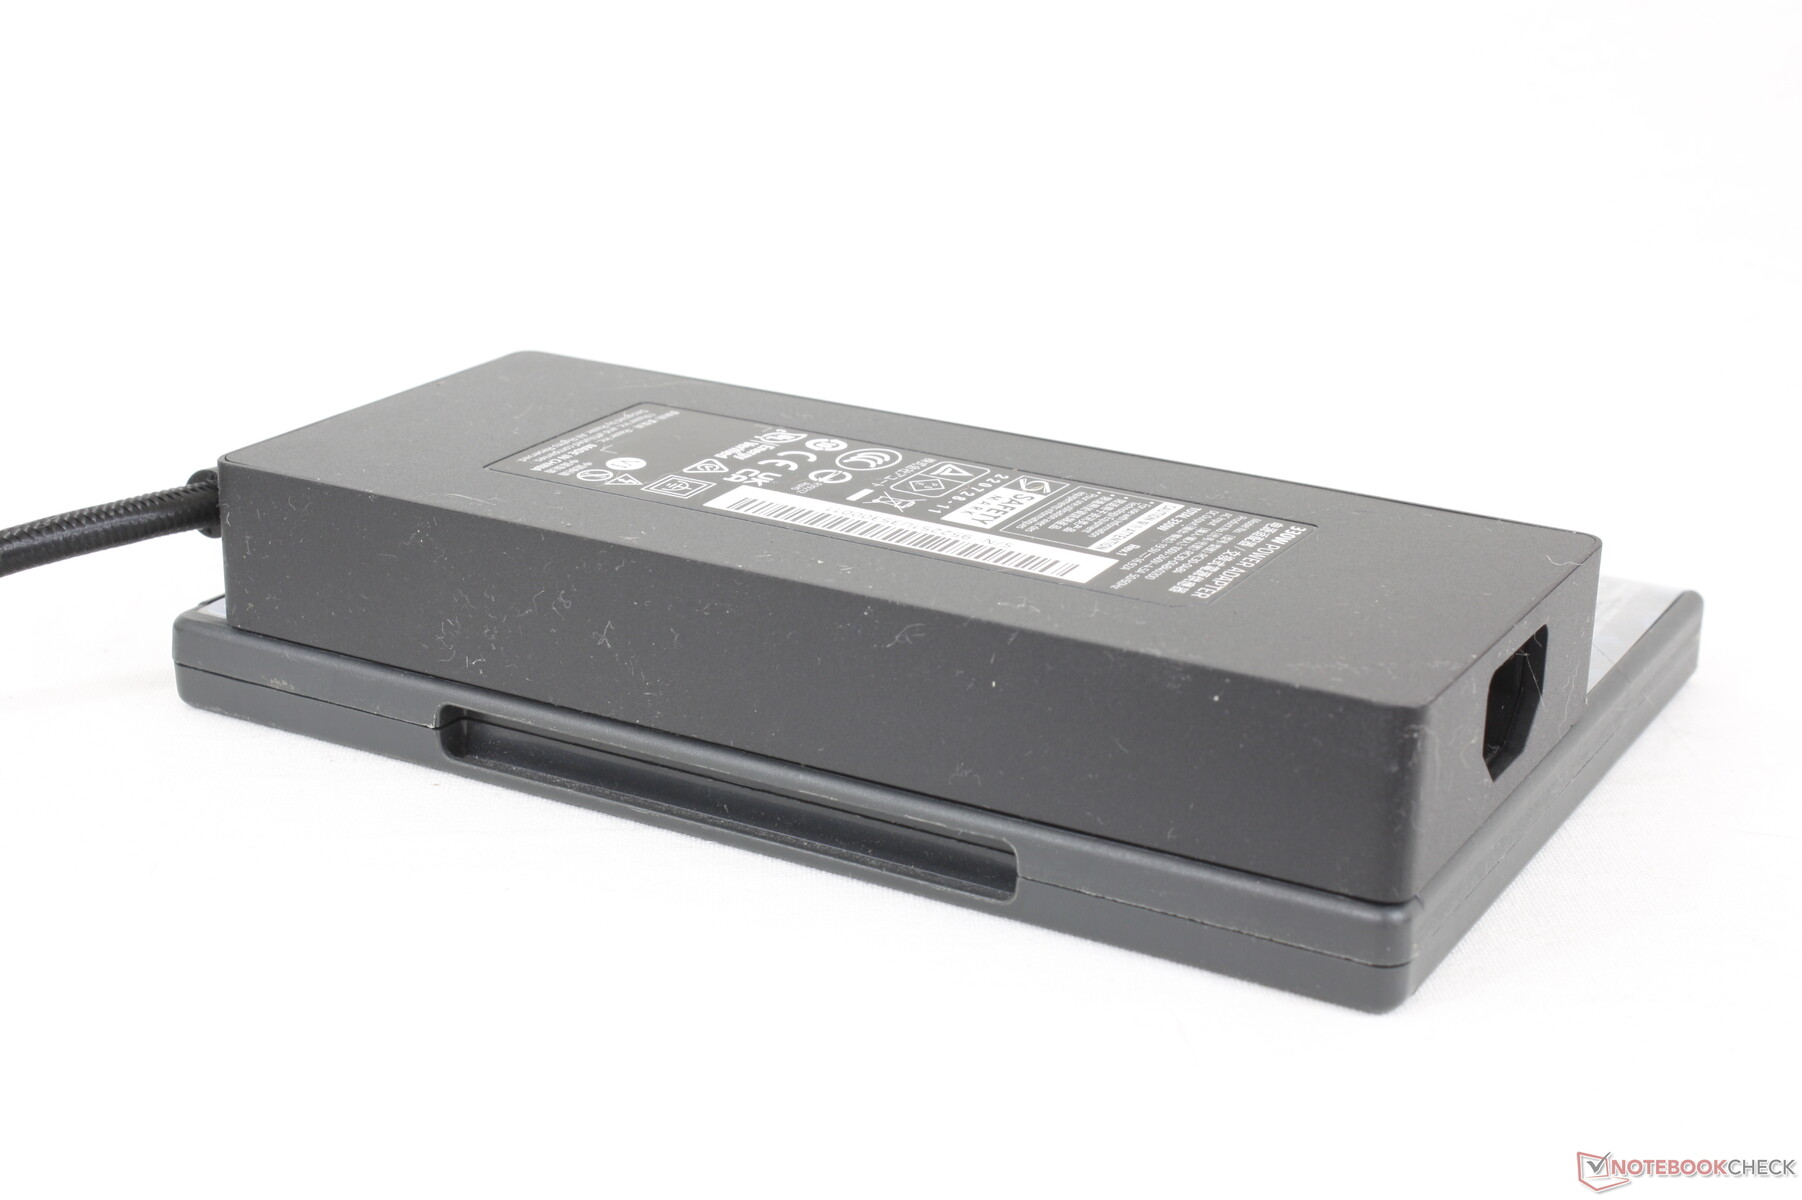
Vi kan registrera ett maximalt uttag på 339 W när både CPU och GPU är 100 procent utnyttjade. Den skrymmande nätadaptern (~19,5 x 9,8 x 4 cm) är dimensionerad för 330 W och vår fullt konfigurerade enhet utnyttjar alltså den tillgängliga strömmen maximalt. Tänk på att laddningshastigheten för den bärbara datorns batteri saktar ner när du spelar. Faktum är att vi kan observera att vårt batteri sjunker från 100 procent till 91 procent när vi kör extremt krävande belastningar som Prime95 och FurMark samtidigt.
| Av/Standby | |
| Låg belastning | |
| Hög belastning |
|
Förklaring:
min: | |
| Alienware m18 R1 i9-13980HX, GeForce RTX 4090 Laptop GPU, SK hynix PC801 HFS001TEJ9X101N, IPS, 1920x1200, 18" | Razer Blade 18 RTX 4070 i9-13950HX, GeForce RTX 4070 Laptop GPU, SSSTC CA6-8D1024, IPS, 2560x1600, 18" | Asus ROG Strix Scar 18 2023 G834JY-N6005W i9-13980HX, GeForce RTX 4090 Laptop GPU, 2x Samsung PM9A1 MZVL21T0HCLR (RAID 0), IPS, 2560x1600, 18" | MSI GE78HX 13VH-070US i9-13950HX, GeForce RTX 4080 Laptop GPU, Samsung PM9A1 MZVL22T0HBLB, IPS, 2560x1600, 17" | Eluktronics Mech-17 GP2 i9-13900HX, GeForce RTX 4090 Laptop GPU, Samsung PM9A1 MZVL21T0HCLR, IPS, 2560x1600, 17" | MSI Titan GT77 HX 13VI i9-13950HX, GeForce RTX 4090 Laptop GPU, Samsung PM9A1 MZVL22T0HBLB, Mini-LED, 3840x2160, 17.3" | |
|---|---|---|---|---|---|---|
| Power Consumption | 7% | 11% | 20% | 21% | 20% | |
| Idle Minimum * (Watt) | 21.6 | 24.5 -13% | 17.3 20% | 16.1 25% | 14 35% | 14 35% |
| Idle Average * (Watt) | 25.2 | 34.1 -35% | 27 -7% | 24 5% | 19.3 23% | 21.6 14% |
| Idle Maximum * (Watt) | 56.7 | 47.7 16% | 46 19% | 34 40% | 36.8 35% | 24.8 56% |
| Load Average * (Watt) | 164.1 | 140 15% | 133 19% | 123.6 25% | 117.2 29% | 122.5 25% |
| Witcher 3 ultra * (Watt) | 311 | 202 35% | 286 8% | 304 2% | 265 15% | |
| Load Maximum * (Watt) | 338.9 | 261 23% | 329 3% | 285.7 16% | 342.5 -1% | 418 -23% |
* ... mindre är bättre
Power Consumption Witcher 3 / Stresstest
Power Consumption external Monitor
Batteritid - Inte så hemskt för storleken
Batteritiden har aldrig varit en stark punkt för Alienware-serien. Förra årets Alienware x17 R2, till exempel, höll bara i ett par timmar även när man bara surfade på webben. Alienware m18 innehåller ett batteri med högre kapacitet (97 Wh jämfört med 87 Wh) med bättre energihantering för märkbart längre driftstider för surfning på cirka 4 timmar. Det är förvisso inte lika länge som en typisk Ultrabook, men det är inte illa för en så stor bärbar dator för spel.
Laddning från tom till full tar cirka 2 timmar med den medföljande barrel AC-adaptern. USB-C-laddare stöds inte, vilket är synd eftersom det innebär att du är bunden till den gigantiska 330 W AC-adaptern var du än går.
| Alienware m18 R1 i9-13980HX, GeForce RTX 4090 Laptop GPU, 97 Wh | Razer Blade 18 RTX 4070 i9-13950HX, GeForce RTX 4070 Laptop GPU, 91.7 Wh | Asus ROG Strix Scar 18 2023 G834JY-N6005W i9-13980HX, GeForce RTX 4090 Laptop GPU, 90 Wh | Eluktronics Mech-17 GP2 i9-13900HX, GeForce RTX 4090 Laptop GPU, 99 Wh | MSI Titan GT77 HX 13VI i9-13950HX, GeForce RTX 4090 Laptop GPU, 99.9 Wh | Alienware x17 R2 P48E i9-12900HK, GeForce RTX 3080 Ti Laptop GPU, 87 Wh | |
|---|---|---|---|---|---|---|
| Batteridrifttid | 35% | 47% | 19% | 62% | -23% | |
| Reader / Idle (h) | 5.6 | 7 25% | 3.9 -30% | |||
| WiFi v1.3 (h) | 4.3 | 4 -7% | 7.1 65% | 5.1 19% | 5.3 23% | 2 -53% |
| Load (h) | 0.7 | 1.3 86% | 0.9 29% | 1.4 100% | 0.8 14% | |
| H.264 (h) | 7 | 6 | ||||
| Witcher 3 ultra (h) | 0.9 |
För
Emot
Bedömning - Nine Pounds Of Pure Power (nio pund ren kraft)
Alienwares bärbara datorer har alltid haft den där "prestanda till varje pris"-mentaliteten och Alienware m18 R1 är inget undantag. Den här maskinen är inte rädd för att vara en av de största, tyngsta eller till och med mest högljudda bärbara datorerna på marknaden om det innebär att den kan pressa ut bara lite mer prestanda ur CPU och GPU eller införliva fler funktioner som ivriga gamers kan uppskatta. Användare som har för avsikt att utnyttja 4x M.2 SSD-enheterna, de enorma portalternativen, den integrerade numplattan och den snabba uppdateringsfrekvensen på 480 Hz och som inte har något emot den skrymmande vikten eller den gigantiska nätadaptern kommer att ha mycket mer att glädjas åt med Alienware m18 R1.
Om du vill maximera prestanda och funktioner även om det innebär en mycket tyngre och större bärbar dator är Alienware m18 R1 något för dig.
Om ovanstående tilläggsfunktioner inte entusiasmerar dig kan du få nästan samma kärnprestanda från den märkbart lättare Razer Blade 18 eller Asus ROG Strix 18. Vi skulle också vilja se förbättringar av den nya programvaran Alienware Command Center eftersom den laddas ovanligt långsamt ibland.
Pris och tillgänglighet
Alienware m18 R1 levereras nu direkt från Dell från 2100 USD för Core i7/RTX 4060-konfigurationen och upp till över 5000 USD om den är fullt konfigurerad. Vår enhet som vi har granskat säljs för cirka 3 700 USD. Modellen är ännu inte allmänt tillgänglig hos andra större återförsäljare i skrivande stund.
Alienware m18 R1
- 04/01/2023 v7 (old)
Allen Ngo
Genomskinlighet
Valet av enheter som ska granskas görs av vår redaktion. Testprovet gavs till författaren som ett lån av tillverkaren eller återförsäljaren för denna recension. Långivaren hade inget inflytande på denna recension och inte heller fick tillverkaren en kopia av denna recension innan publiceringen. Det fanns ingen skyldighet att publicera denna recension. Som ett oberoende medieföretag är Notebookcheck inte föremål för auktoritet från tillverkare, återförsäljare eller förlag.
This is how Notebookcheck is testingEvery year, Notebookcheck independently reviews hundreds of laptops and smartphones using standardized procedures to ensure that all results are comparable. We have continuously developed our test methods for around 20 years and set industry standards in the process. In our test labs, high-quality measuring equipment is utilized by experienced technicians and editors. These tests involve a multi-stage validation process. Our complex rating system is based on hundreds of well-founded measurements and benchmarks, which maintains objectivity.
Price comparison

