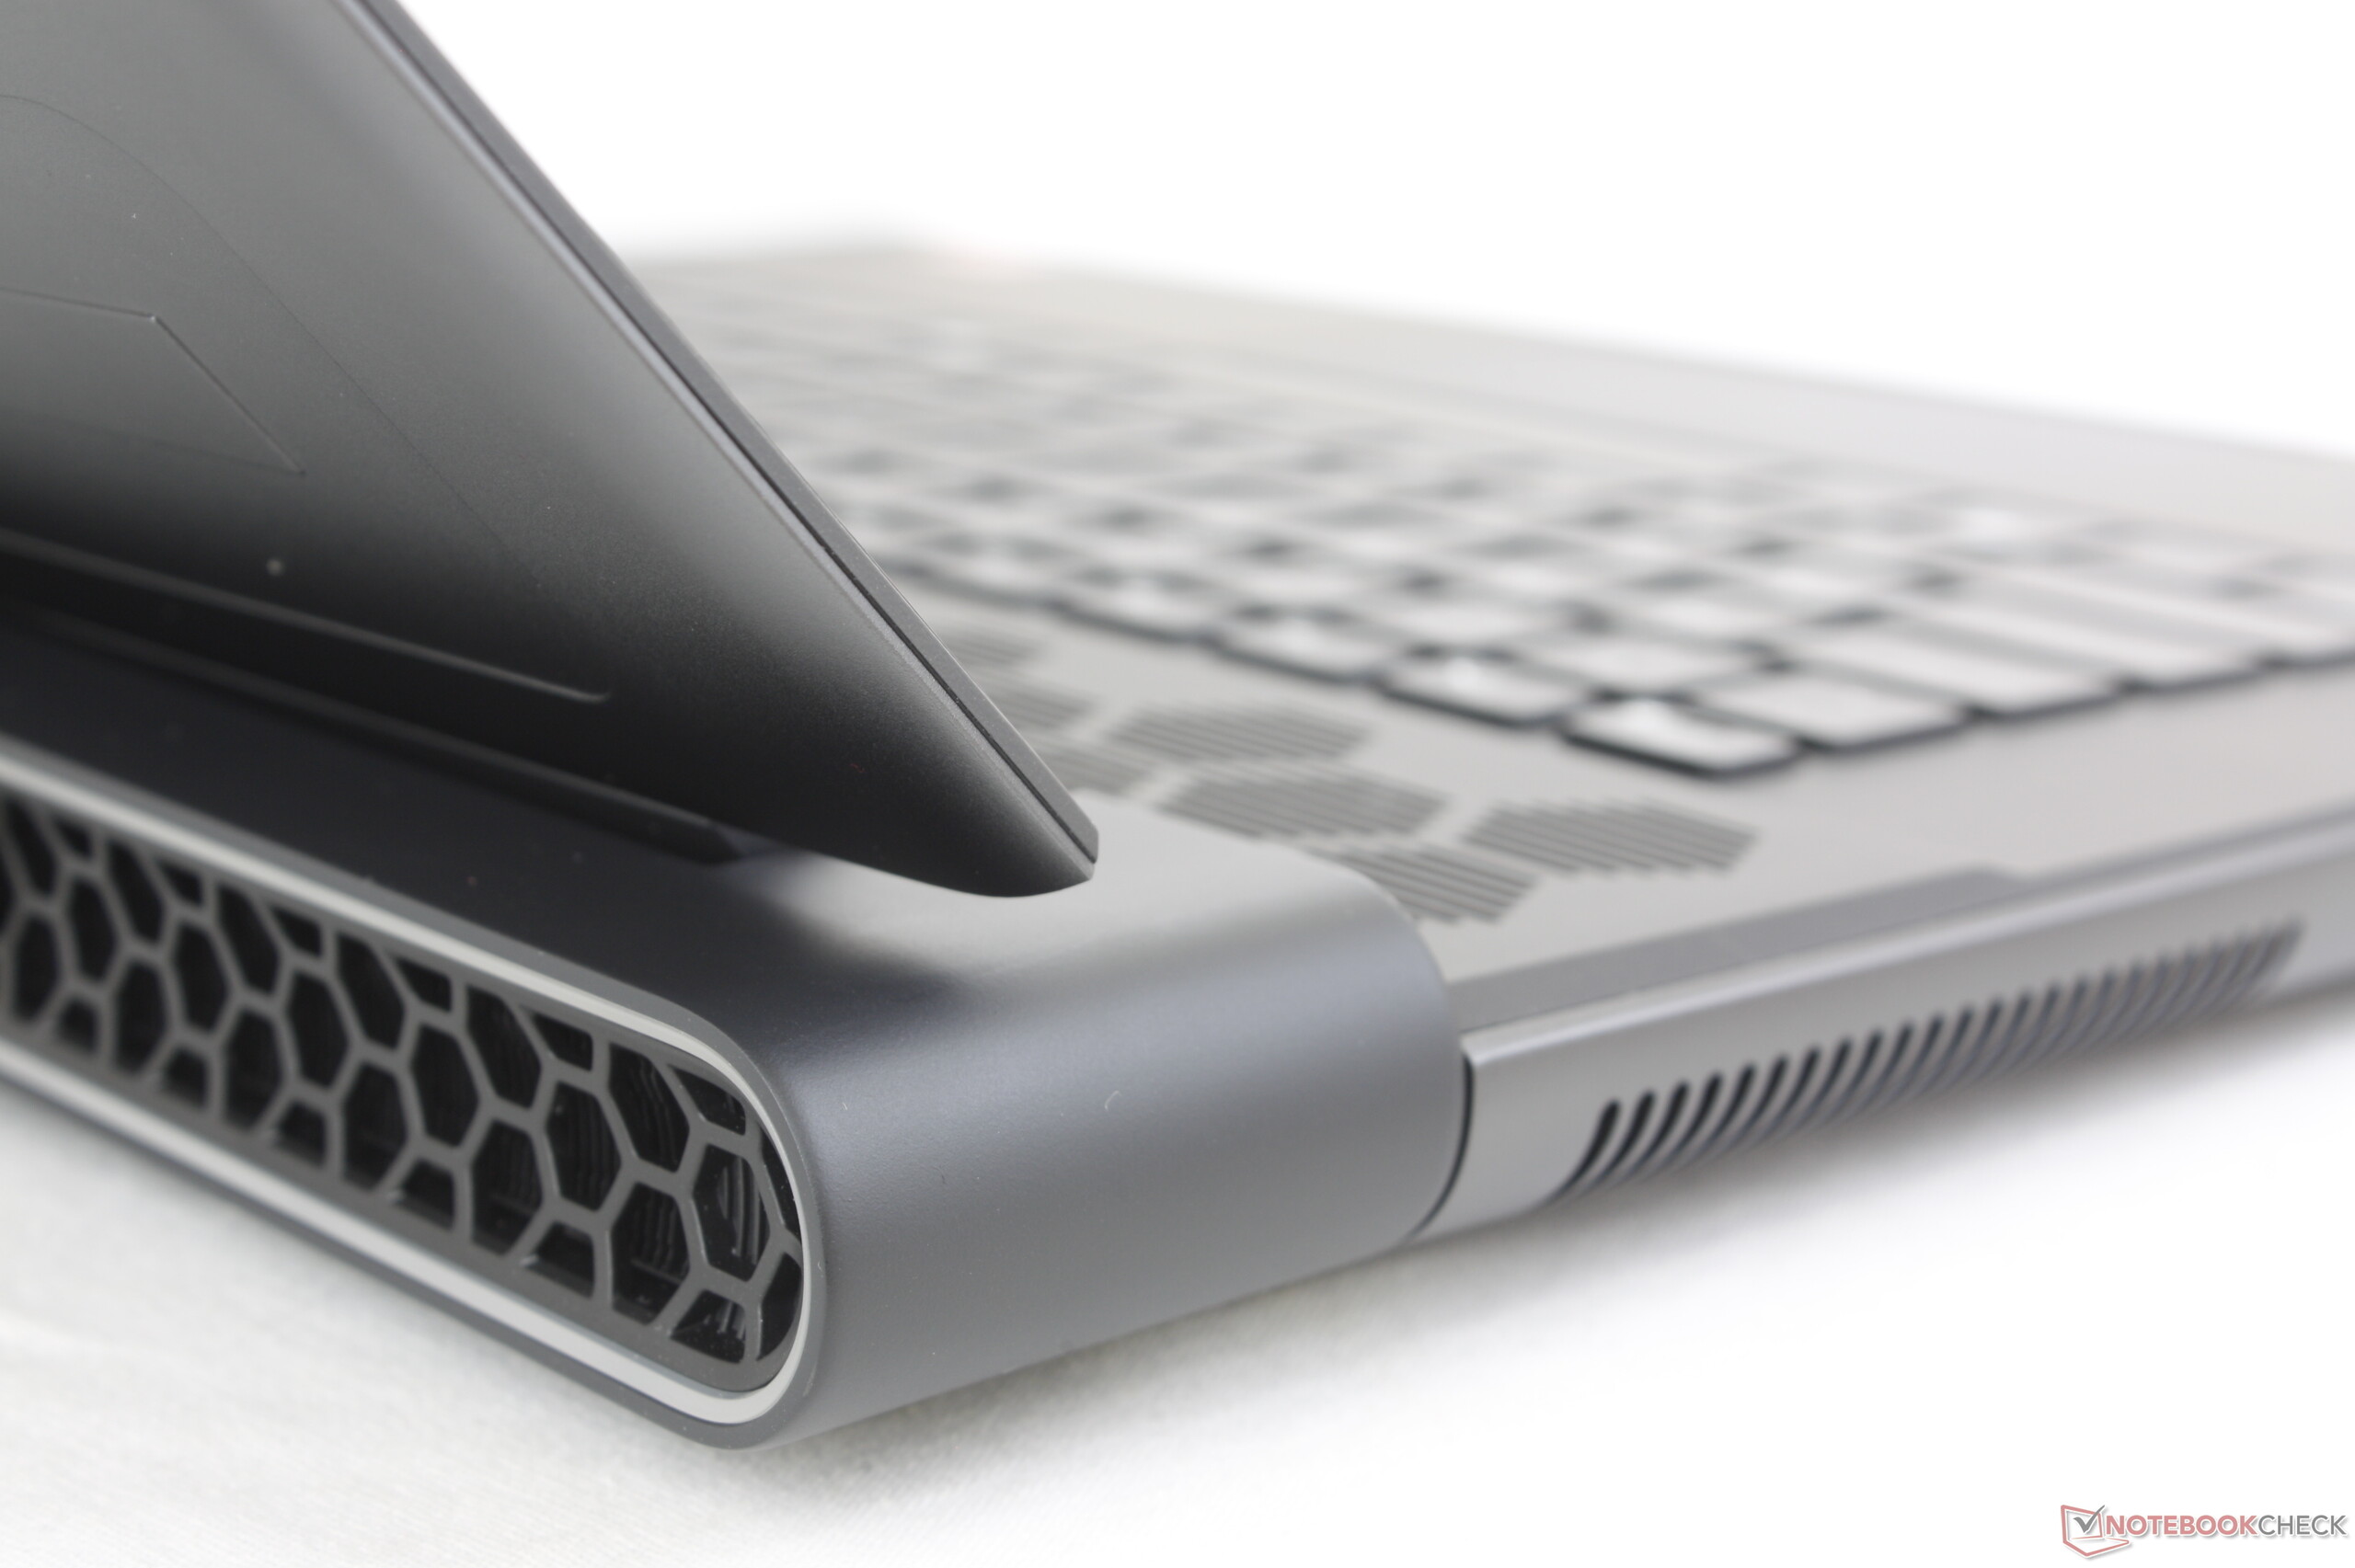
Alienware m16 R1 recension: QHD-spelmaskin med RTX 4060 och Thunderbolt 4
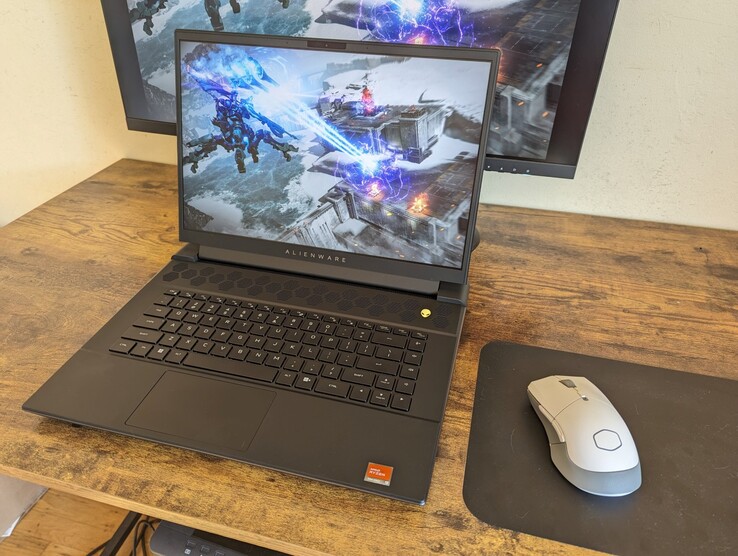
Spel, rendering och skapande av innehåll kommer sannolikt att vara de viktigaste användningsområdena för Alienware m16 R1. Raptor Lake och Ada Lovelace ger den nödvändiga datorkraften. Vår variant är en nybörjarmodell från m16-R1-serien; vi hade nyligen ensystermodell från den övre änden av prestandaskalan. Konkurrerande enheter inkluderar Acer Predator Helios 16 PH16-71, den Medion Erazer Defender P40den Lenovo Legion Pro 5 16IRX8, den XMG Pro 15 (E23) ochAorus 15 BSF.
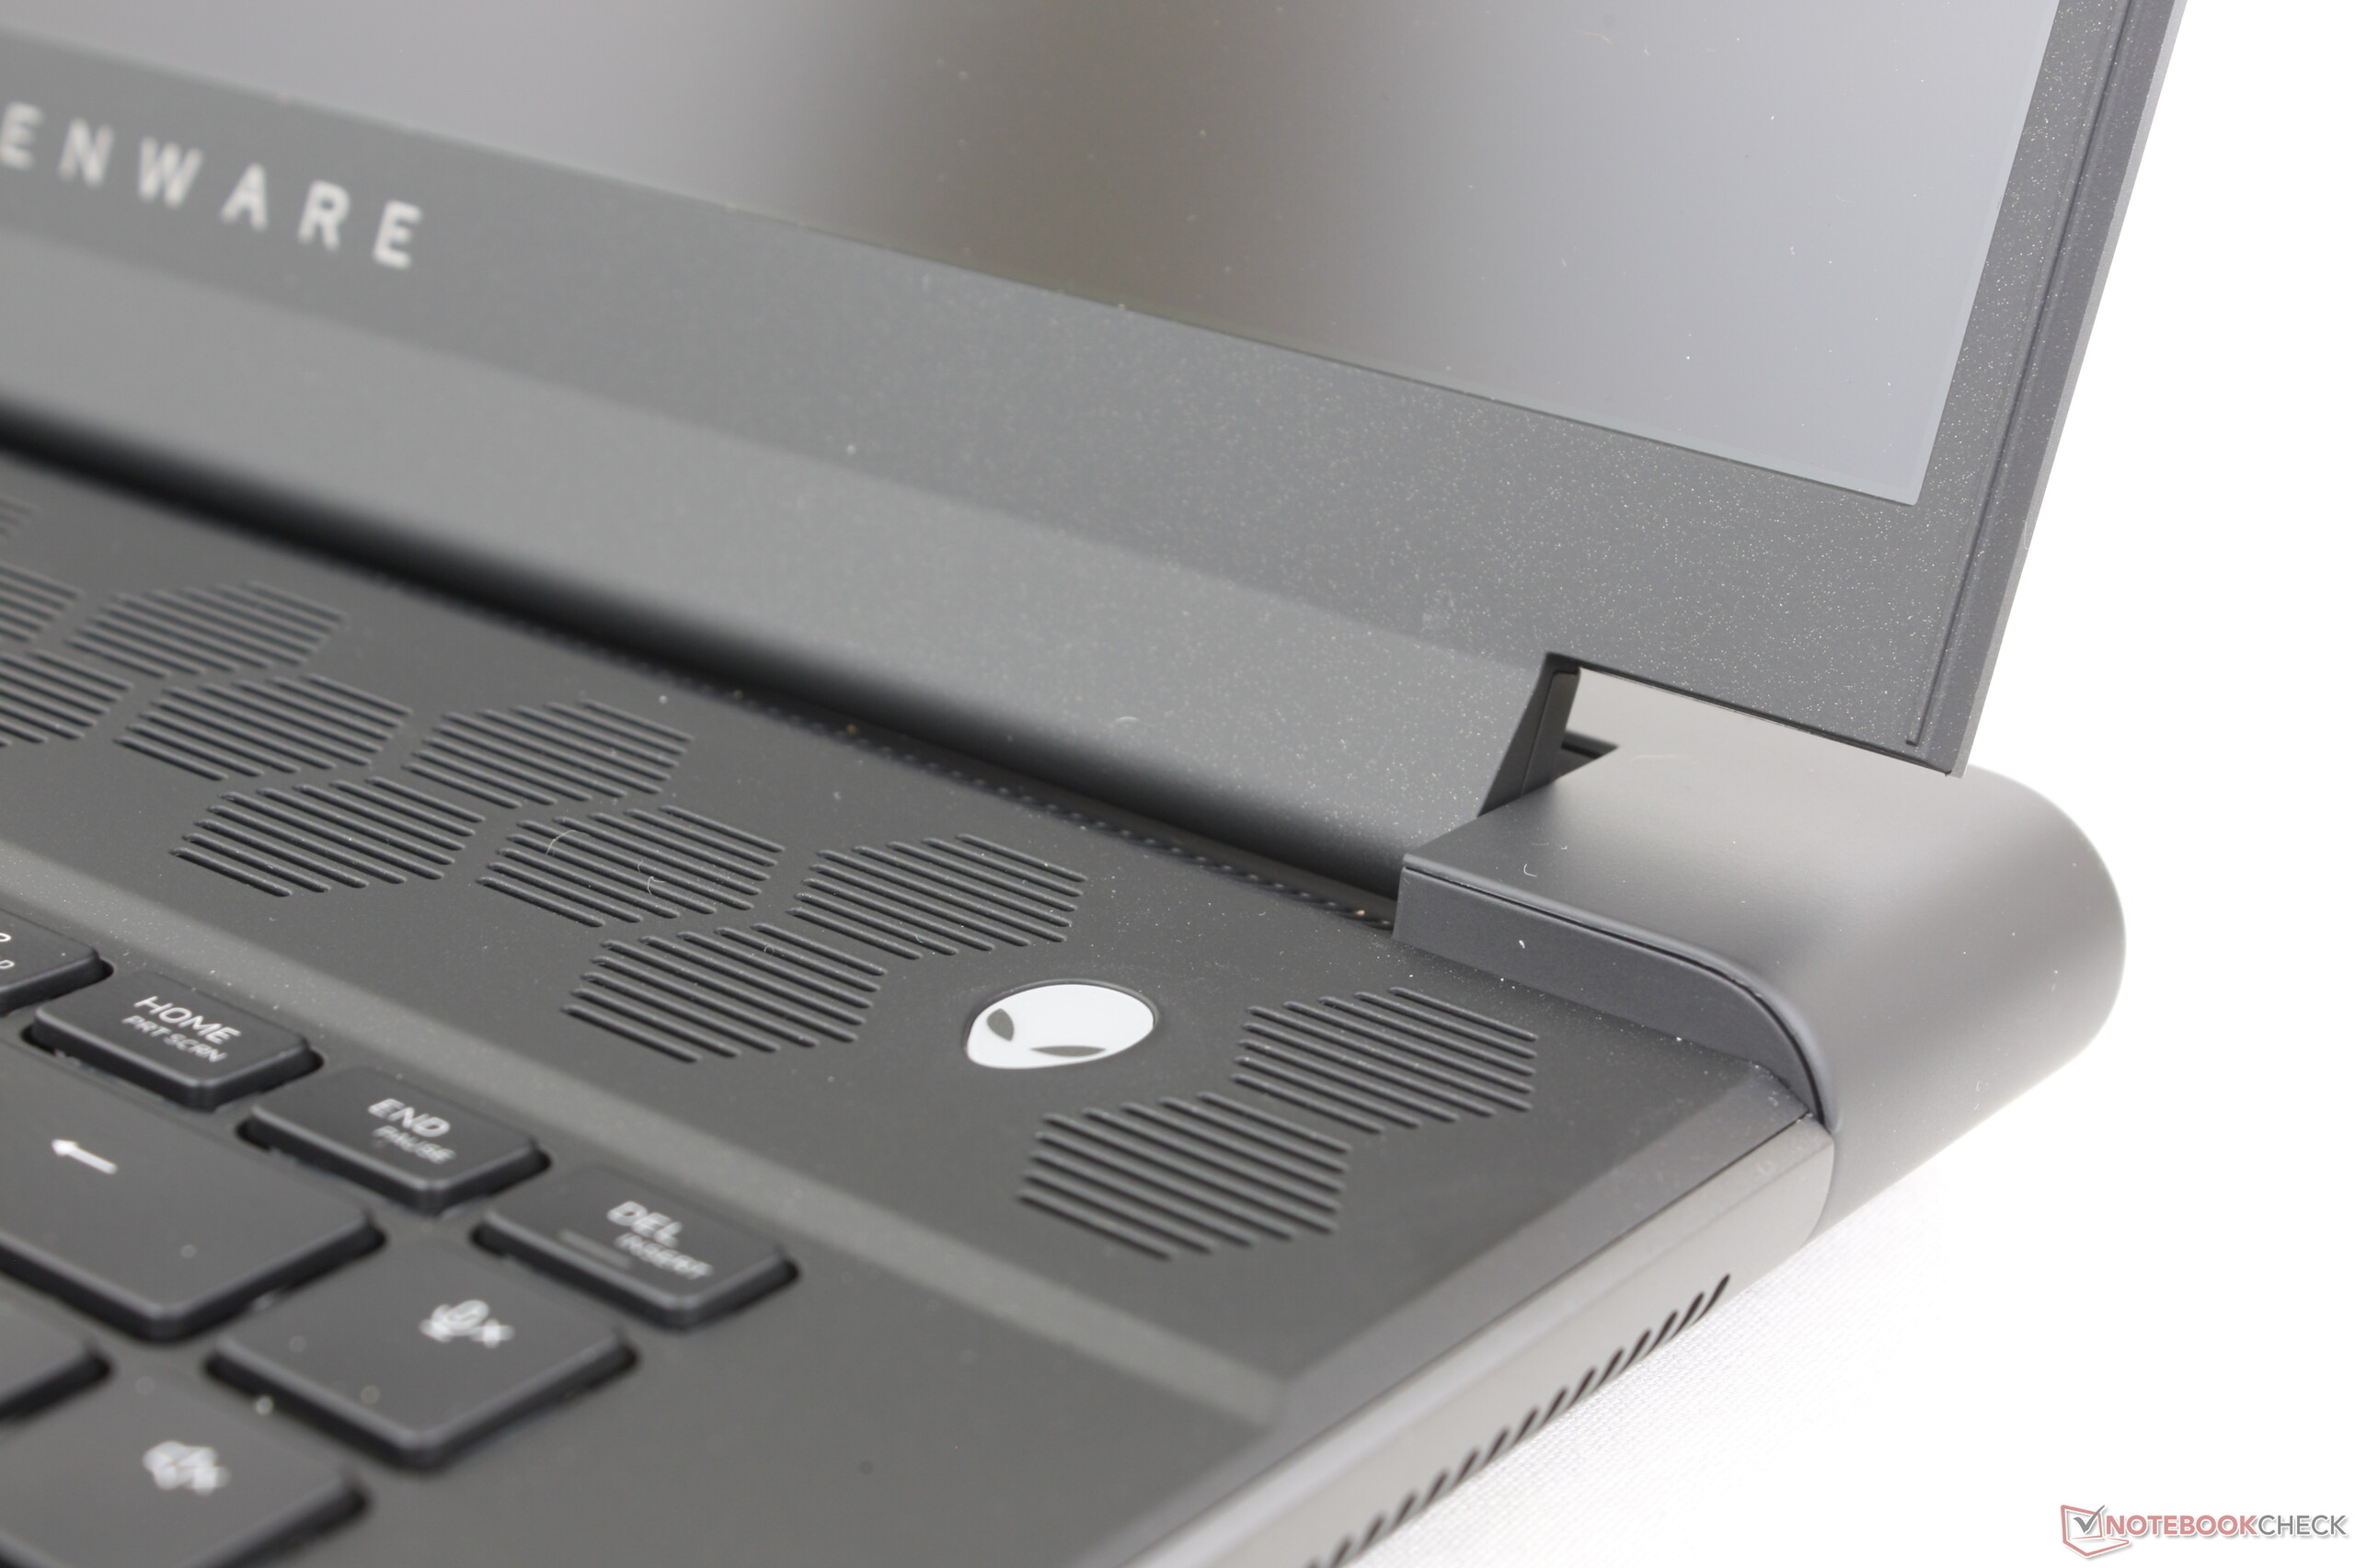
Information om fodral, utrustning och inmatningsenheter finns ivår recension av den nästan identiska systermodellen.
Potentiella konkurrenter i jämförelse
Gradering | Datum | Modell | Vikt | Höjd | Storlek | Upplösning | Pris |
|---|---|---|---|---|---|---|---|
| 88.3 % v7 (old) | 09/2023 | Alienware m16 R1 Intel i7-13700HX, GeForce RTX 4060 Laptop GPU | 3 kg | 25.4 mm | 16.00" | 2560x1600 | |
| 89.5 % v7 (old) | 07/2023 | Acer Predator Helios 16 PH16-71-731Q i7-13700HX, GeForce RTX 4060 Laptop GPU | 2.6 kg | 26.9 mm | 16.00" | 2560x1600 | |
| 84.6 % v7 (old) | 05/2023 | Medion Erazer Defender P40 i7-13700HX, GeForce RTX 4060 Laptop GPU | 2.9 kg | 33 mm | 17.30" | 2560x1440 | |
| 87.9 % v7 (old) | 05/2023 | Lenovo Legion Pro 5 16IRX8 i7-13700HX, GeForce RTX 4060 Laptop GPU | 2.5 kg | 26.8 mm | 16.00" | 2560x1600 | |
| 86.2 % v7 (old) | 07/2023 | Schenker XMG Pro 15 (E23) i9-13900HX, GeForce RTX 4060 Laptop GPU | 2.4 kg | 24.9 mm | 15.60" | 2560x1440 | |
| 85.7 % v7 (old) | 08/2023 | Aorus 15 BSF i7-13700H, GeForce RTX 4070 Laptop GPU | 2.4 kg | 20.9 mm | 15.60" | 2560x1440 |
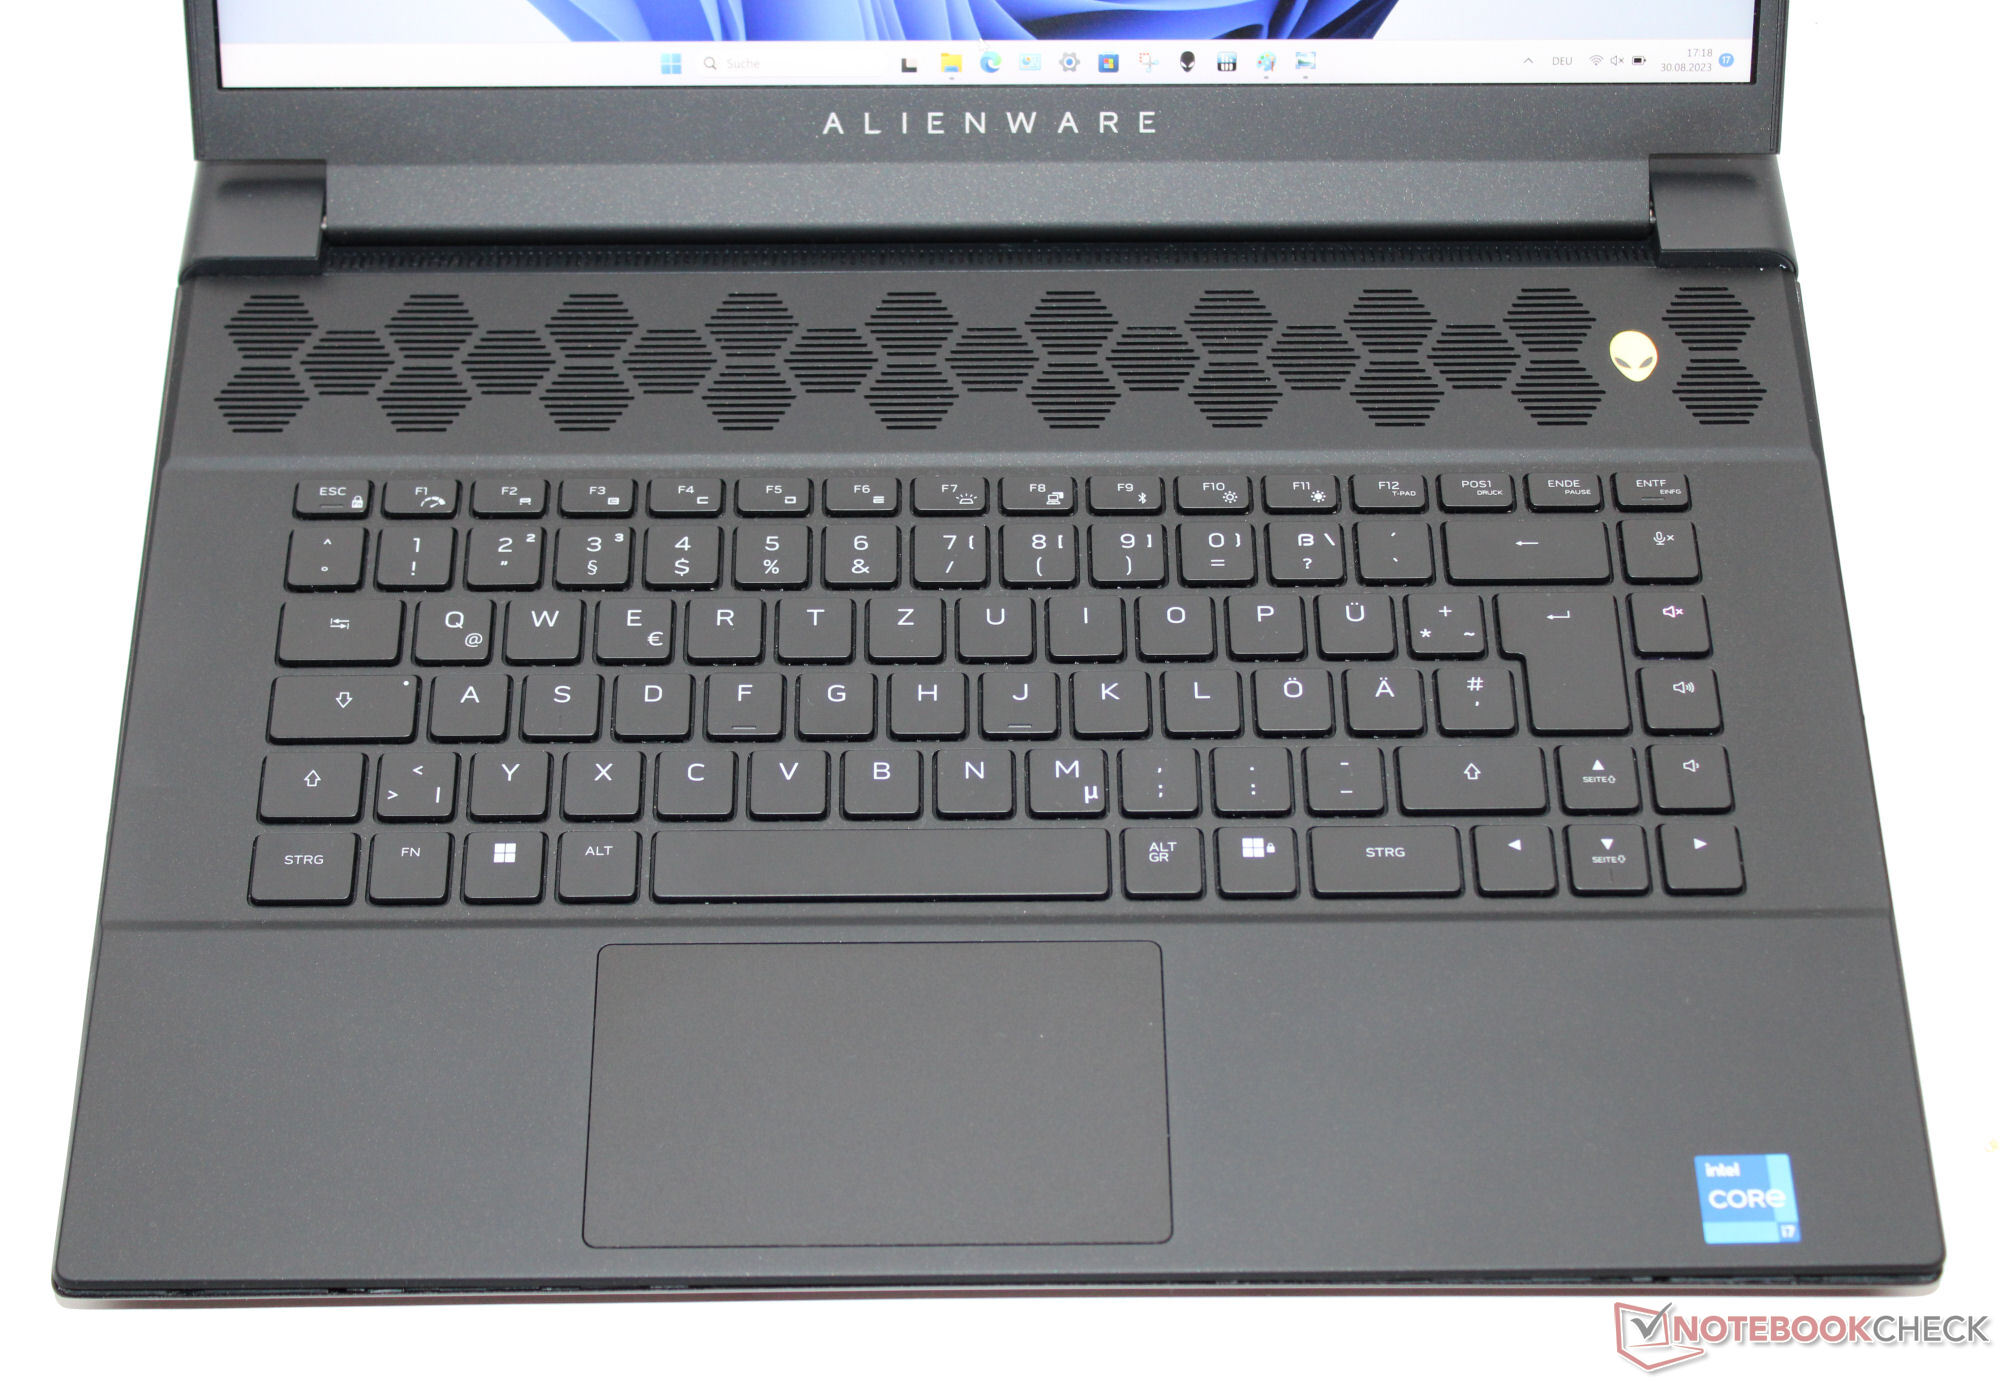
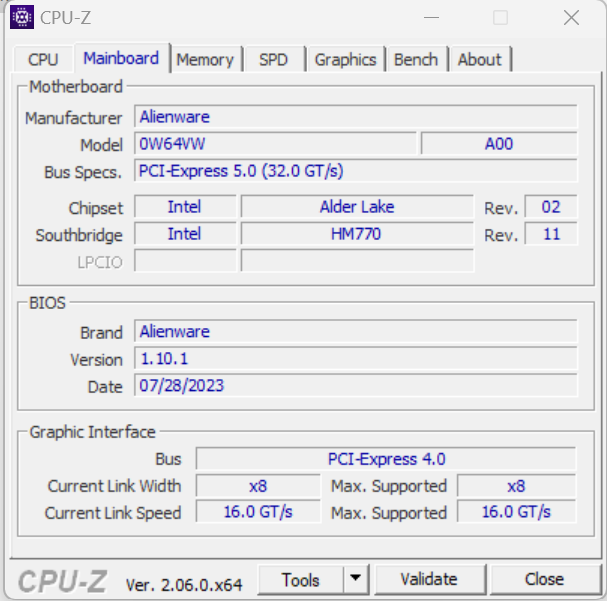
Utrustning och inmatningsenheter - Skillnader mot AMD-modellen
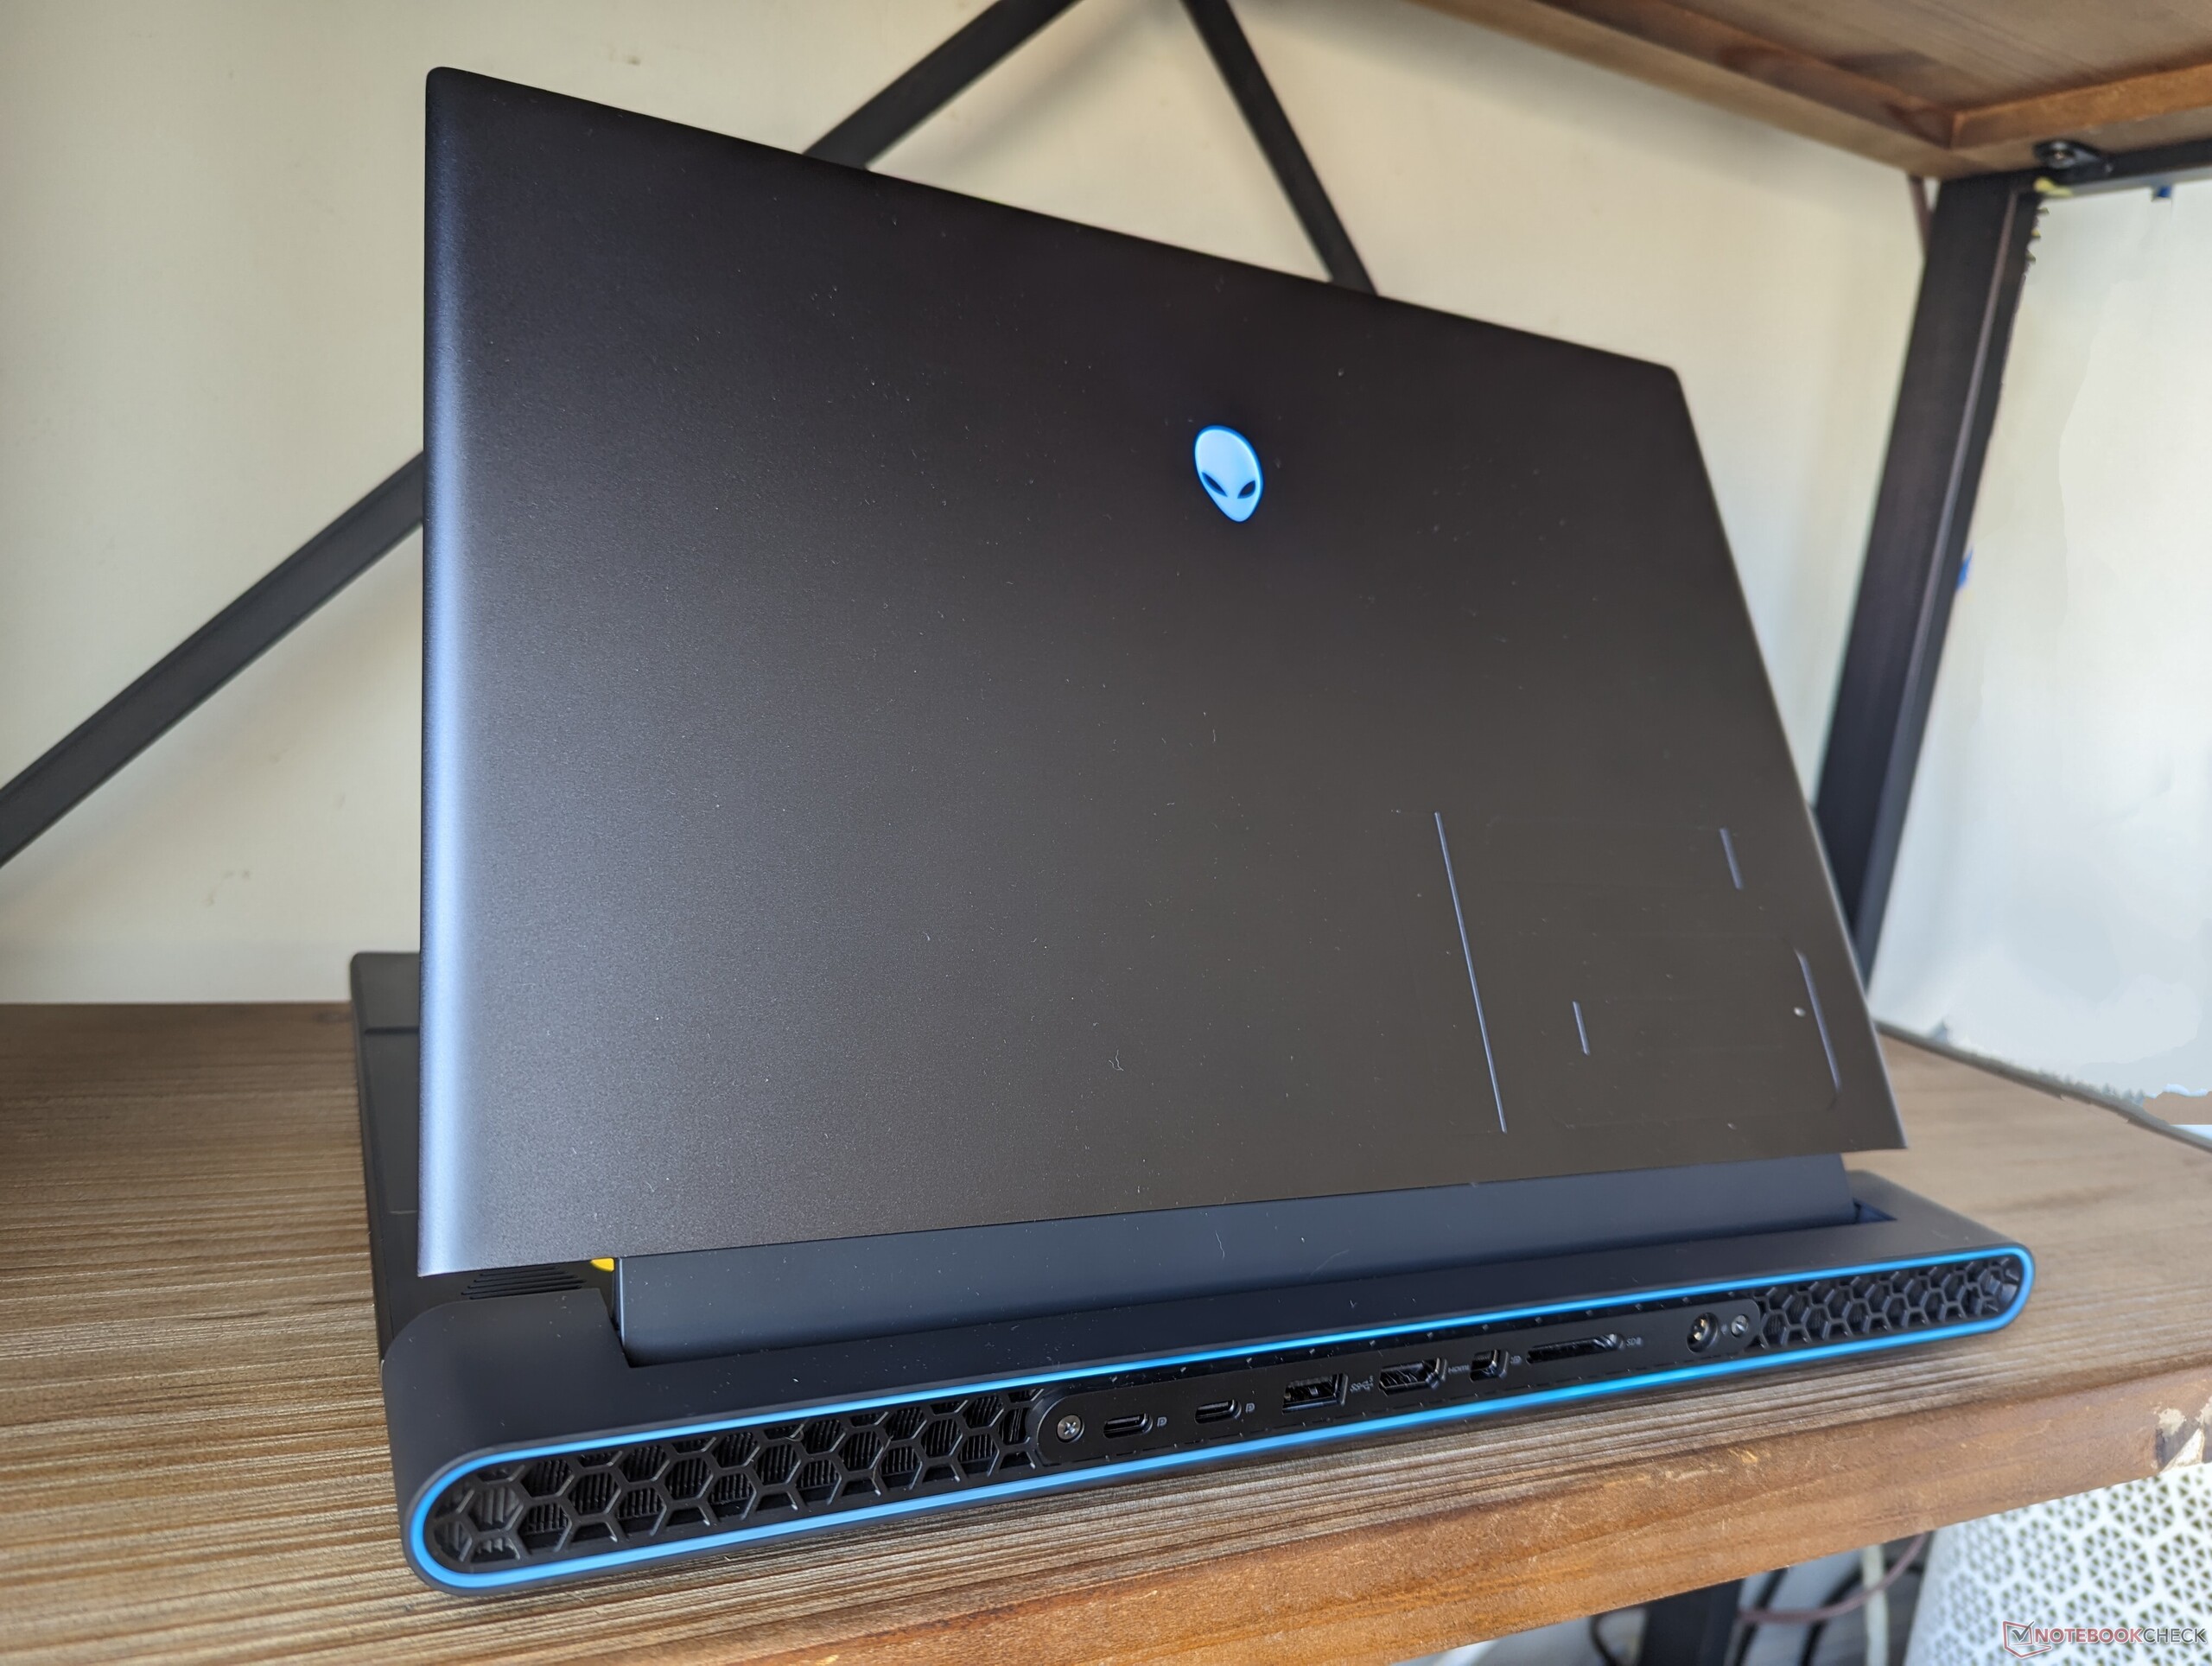
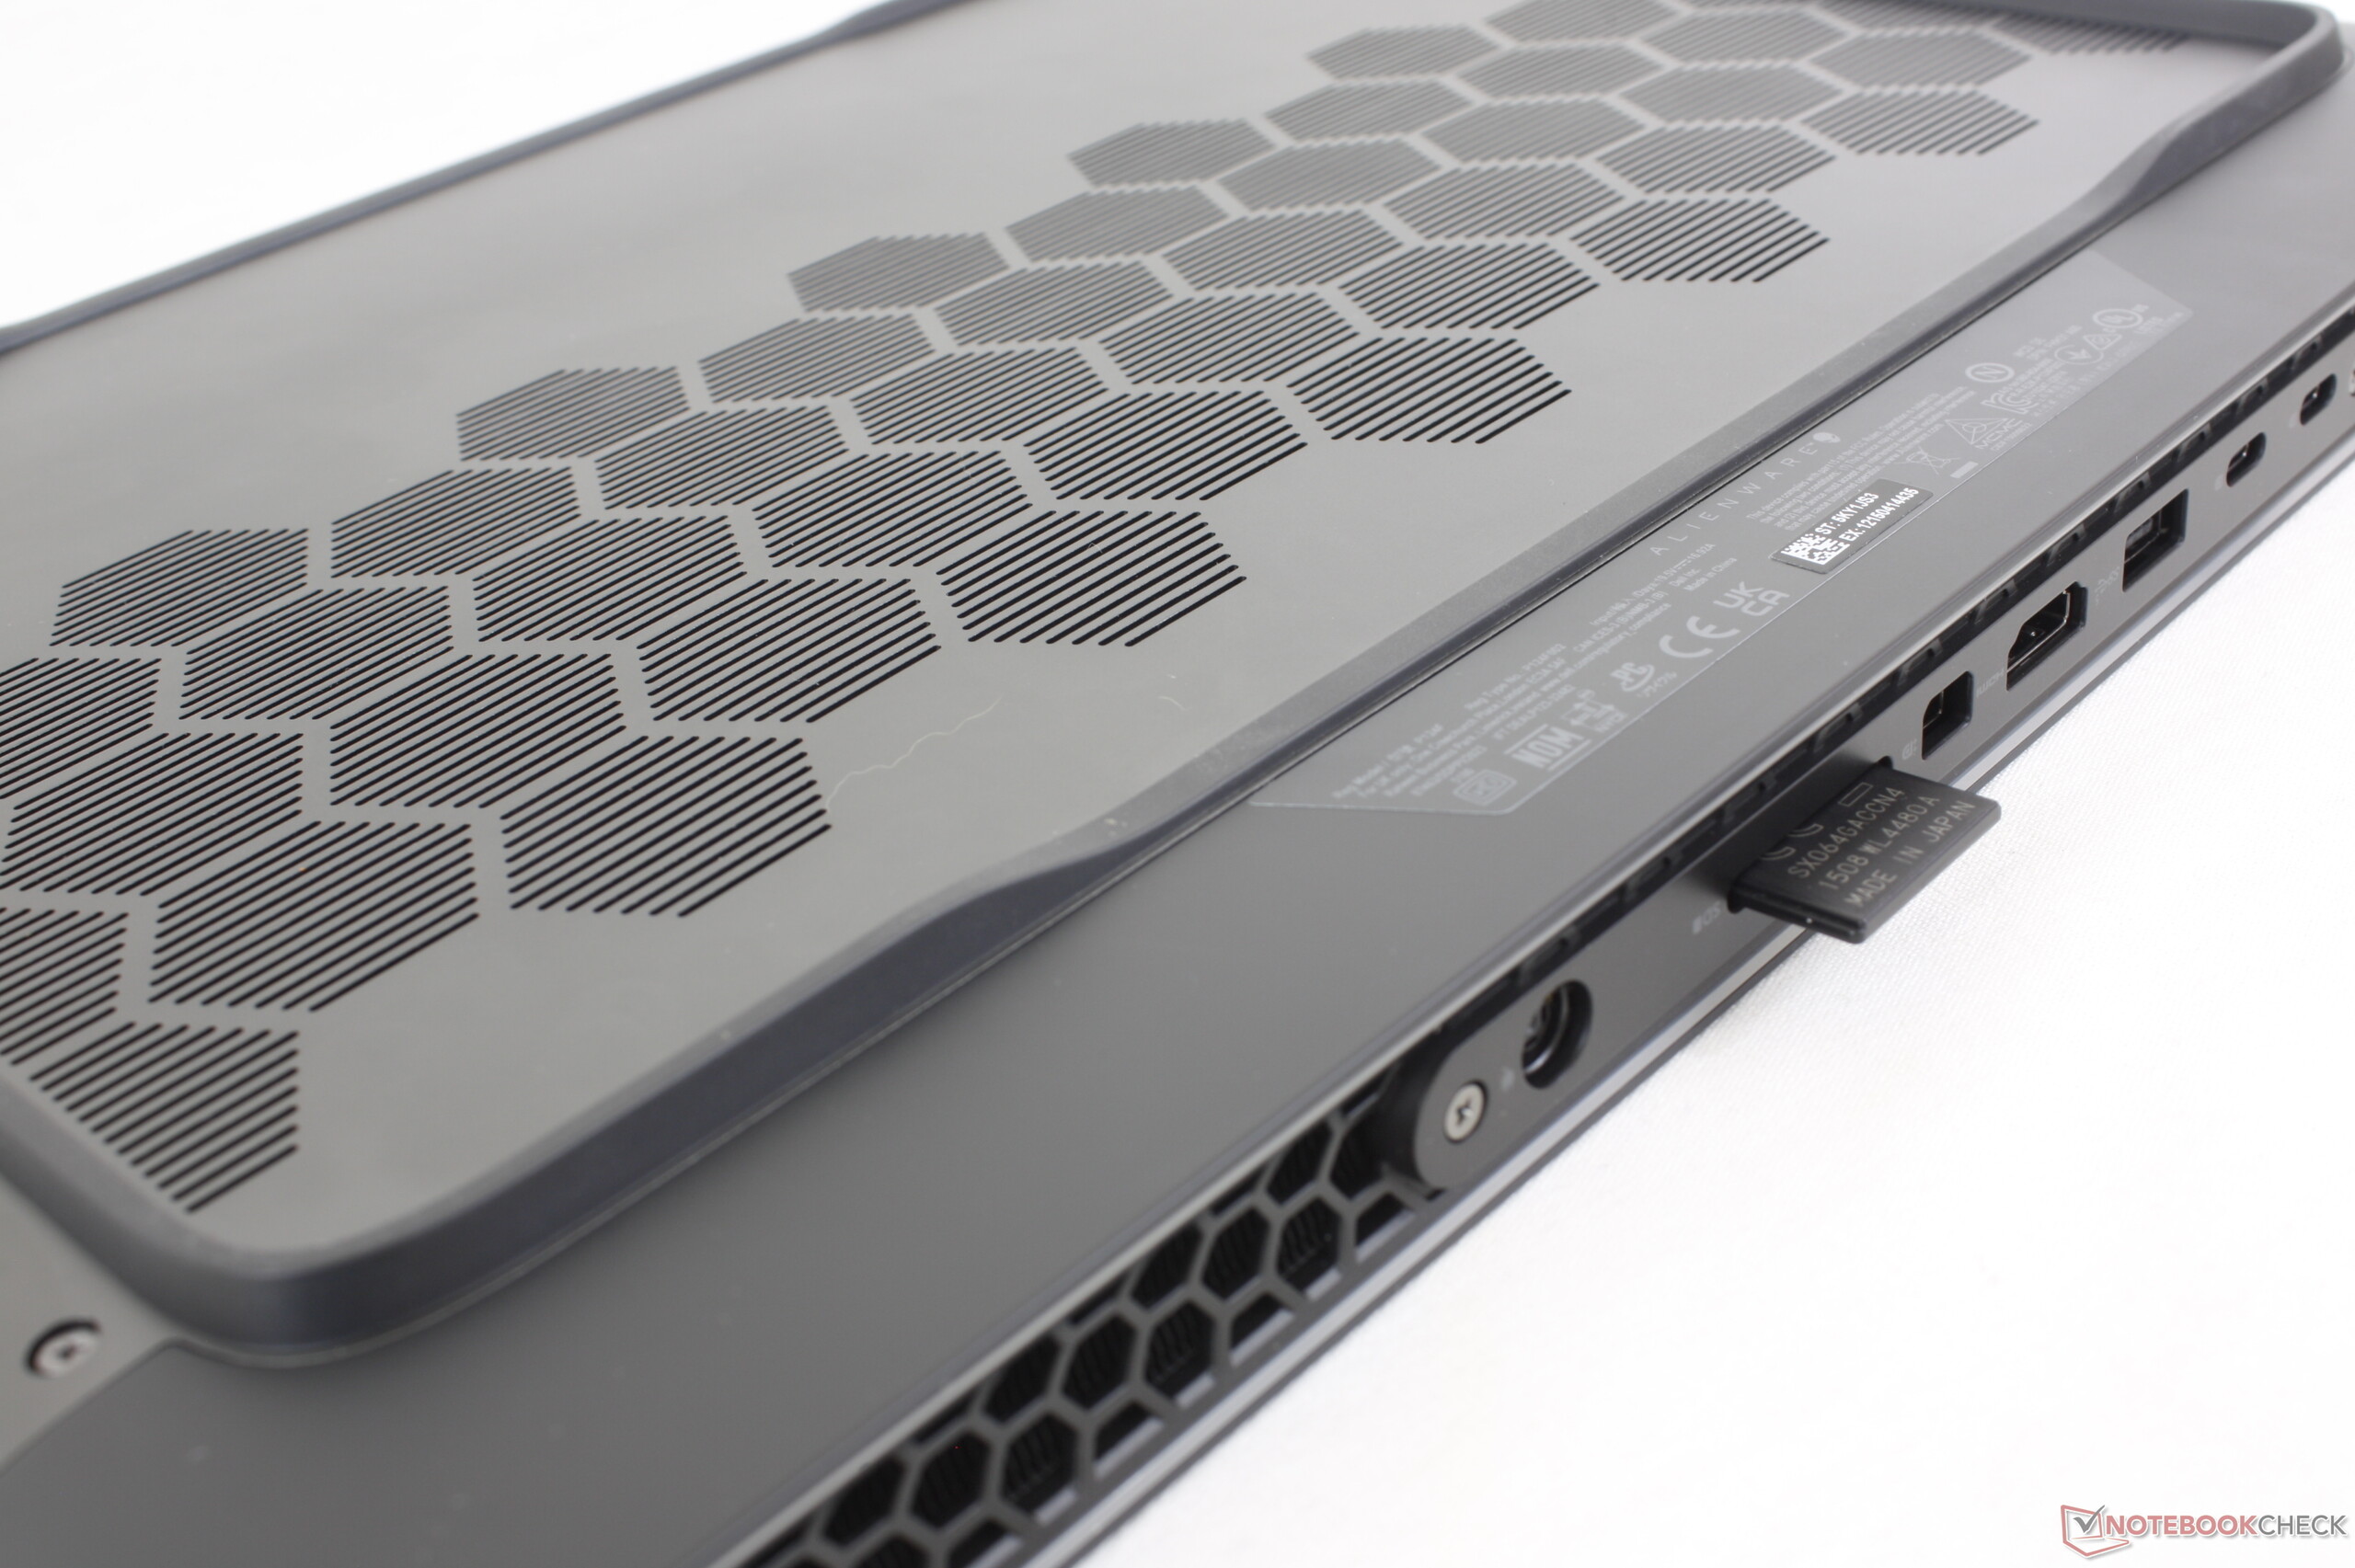
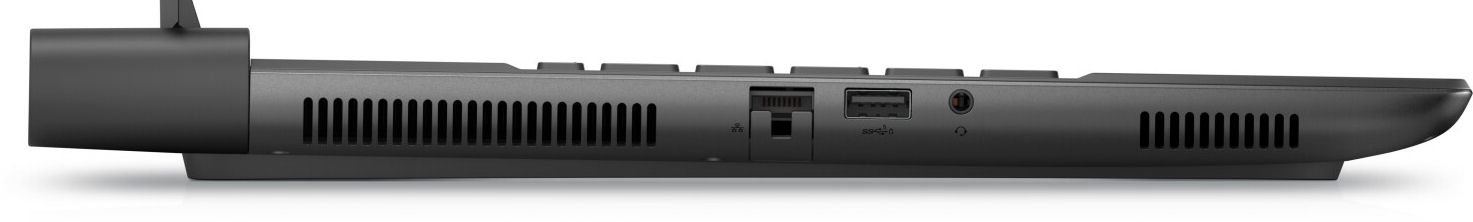
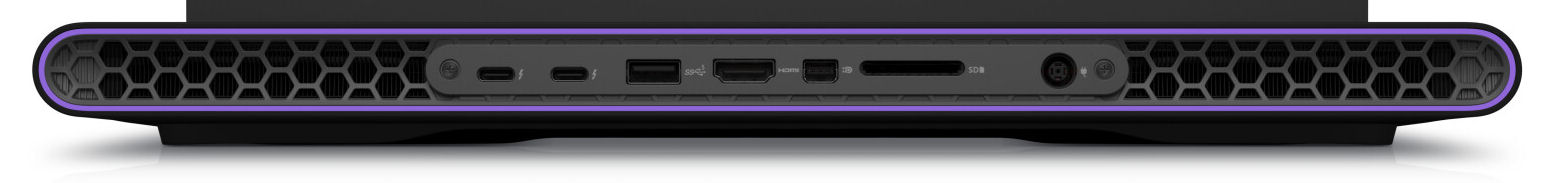
- De två USB-C-portarna på de Intel-baserade m16-modellerna stöder Thunderbolt 4 (AMD: endast USB 3.2 Gen 2), inklusive DisplayPort och Power Delivery. Men var försiktig: det går inte att strömförsörja den bärbara datorn eller ladda batteriet via USB-C. USB-C-portarna kan bara leverera energi.
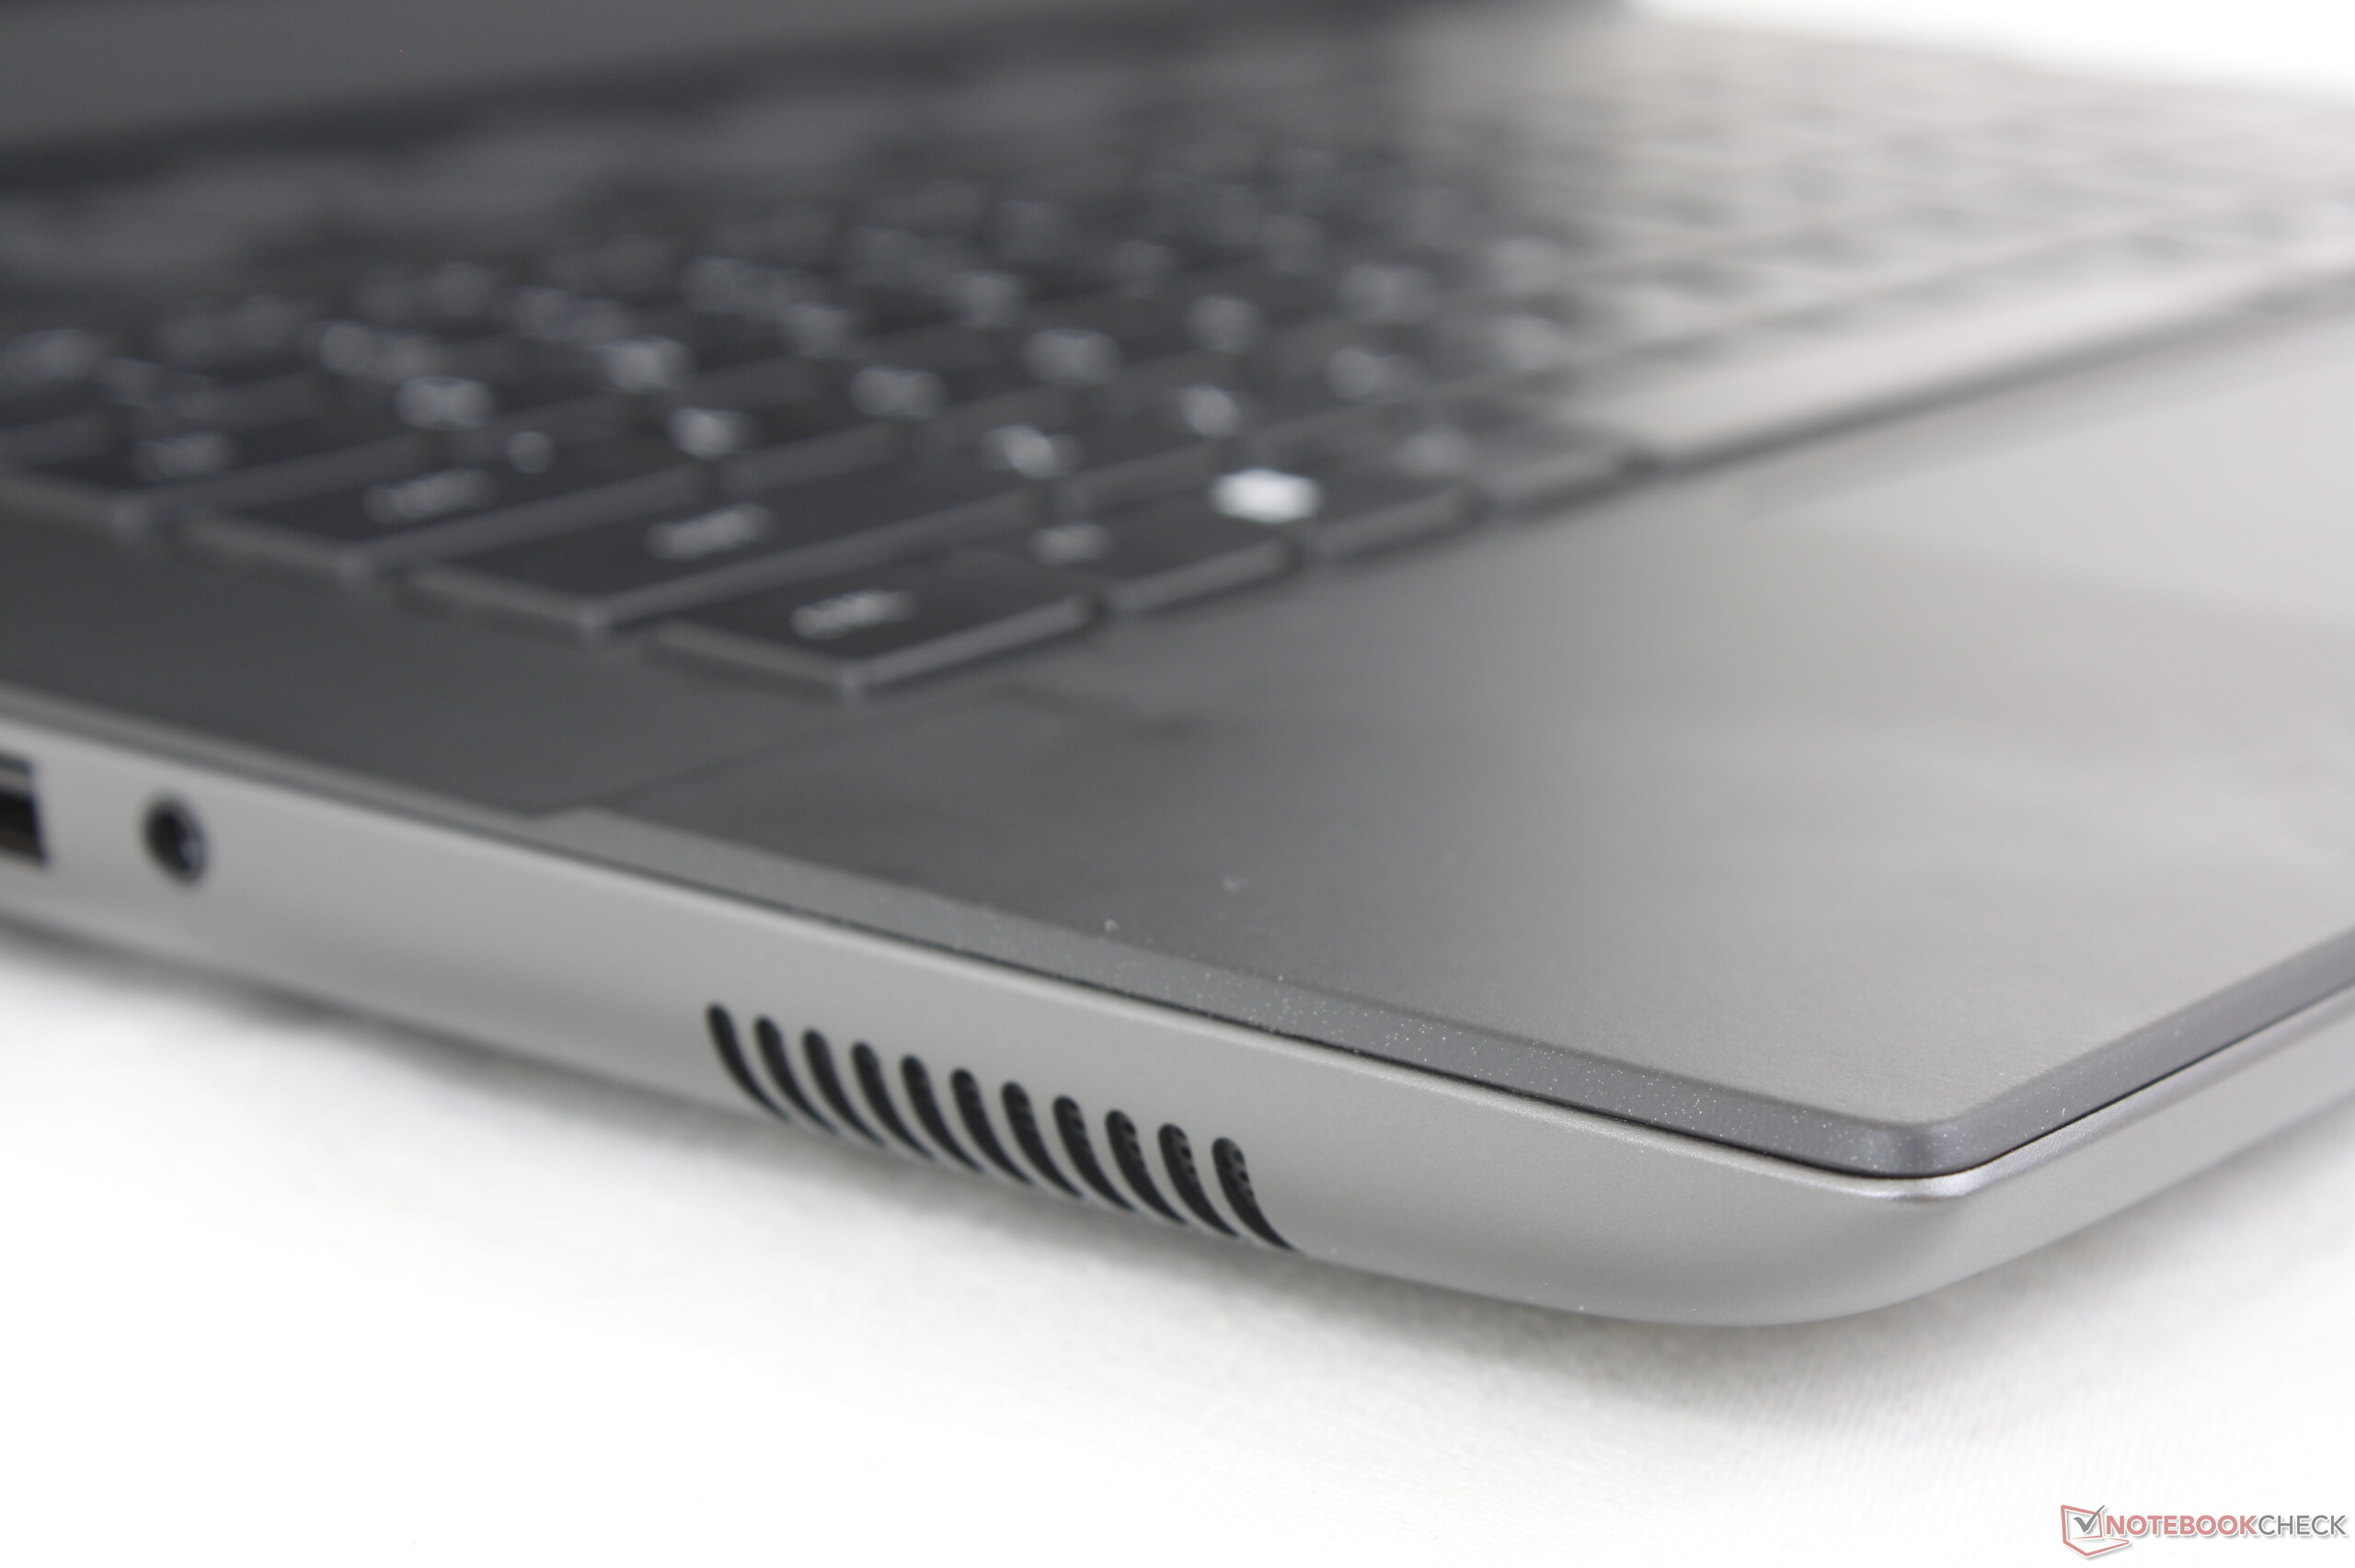
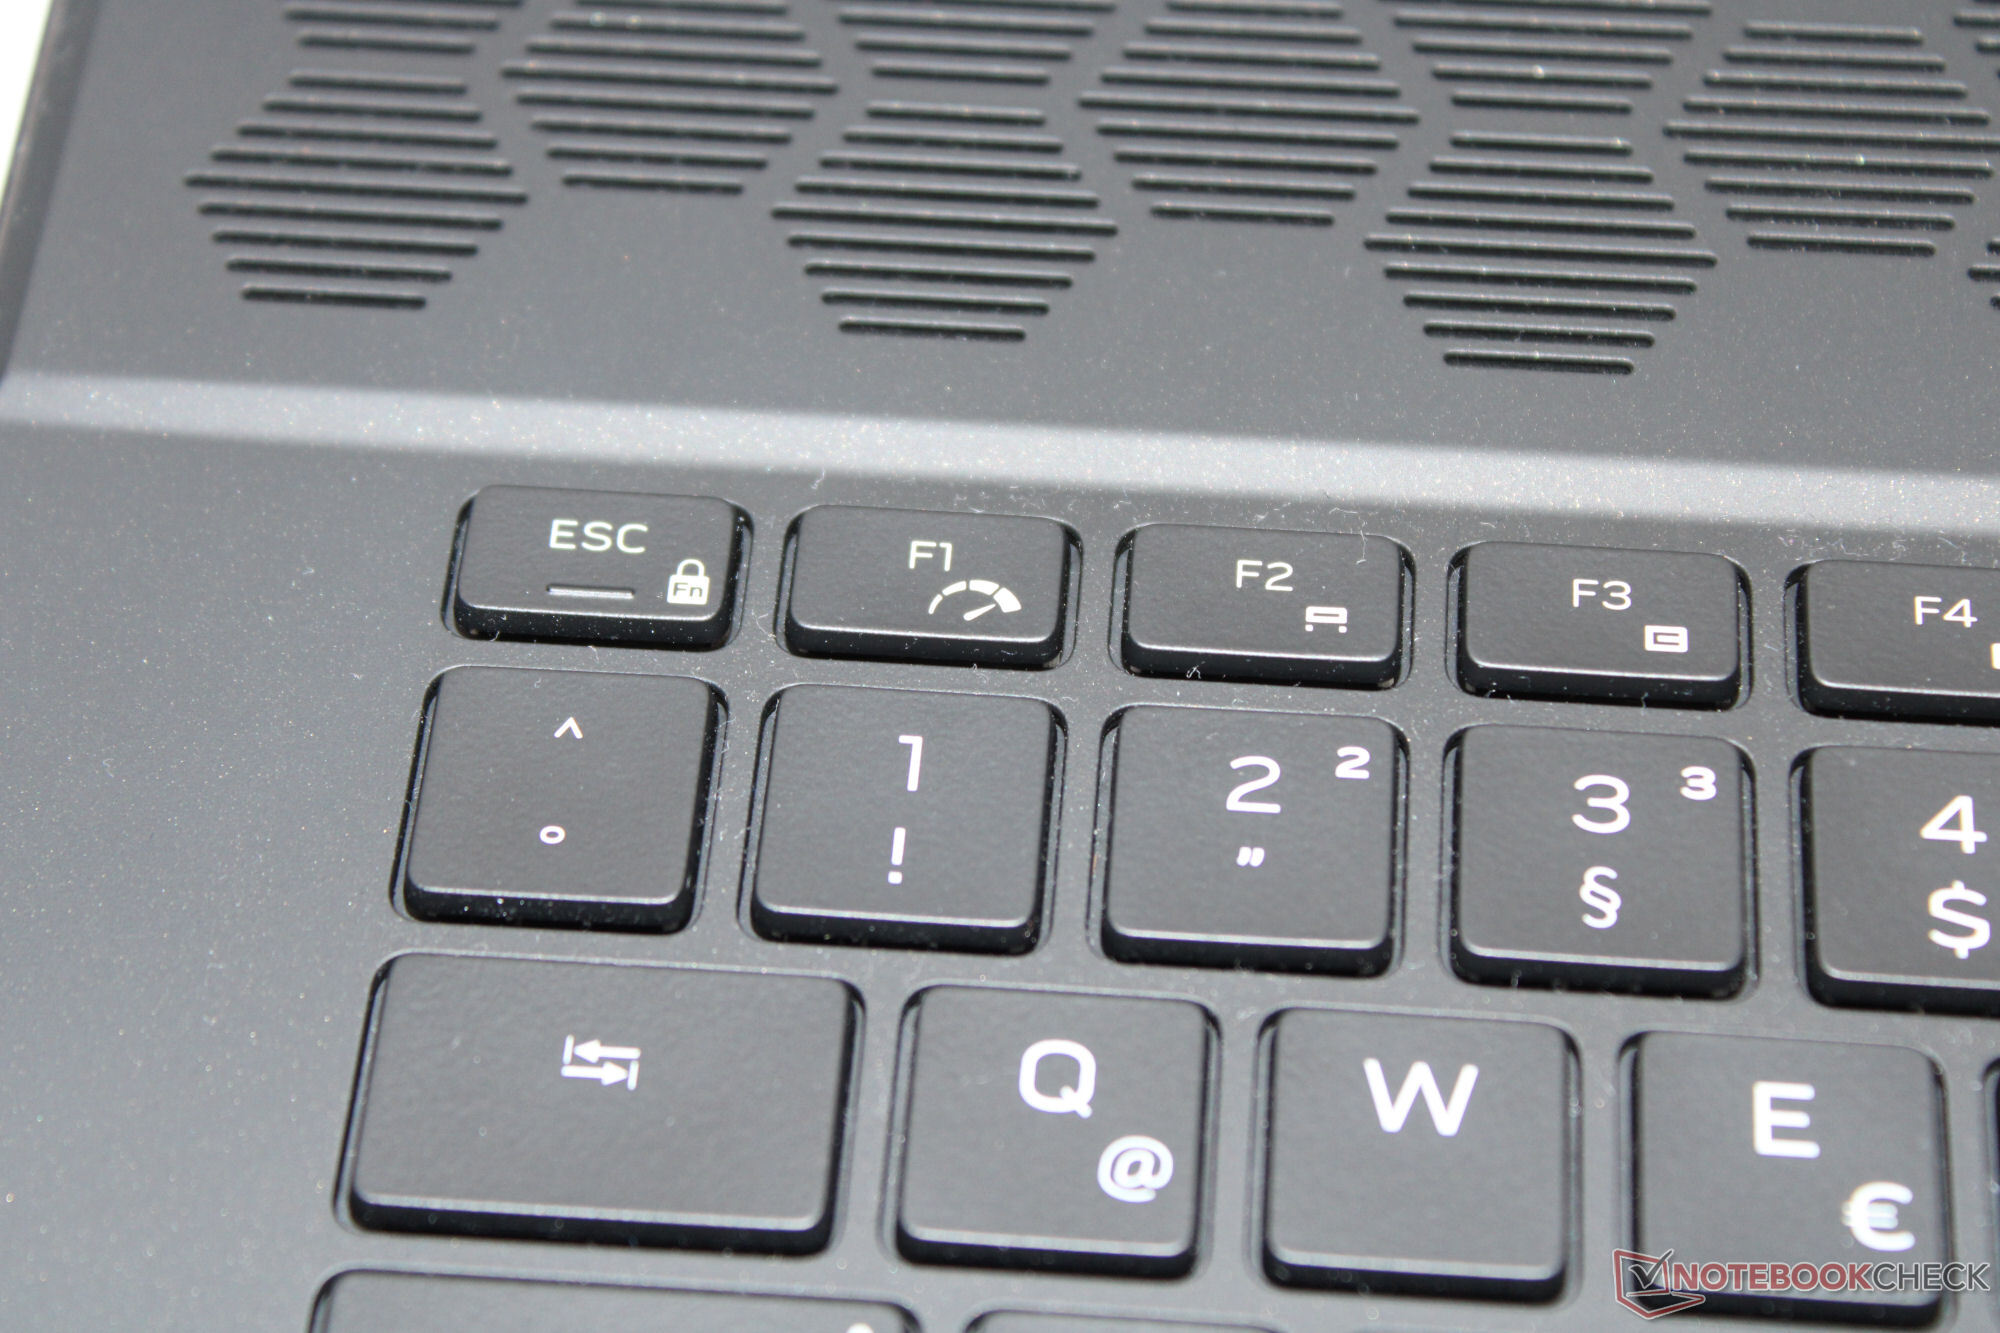
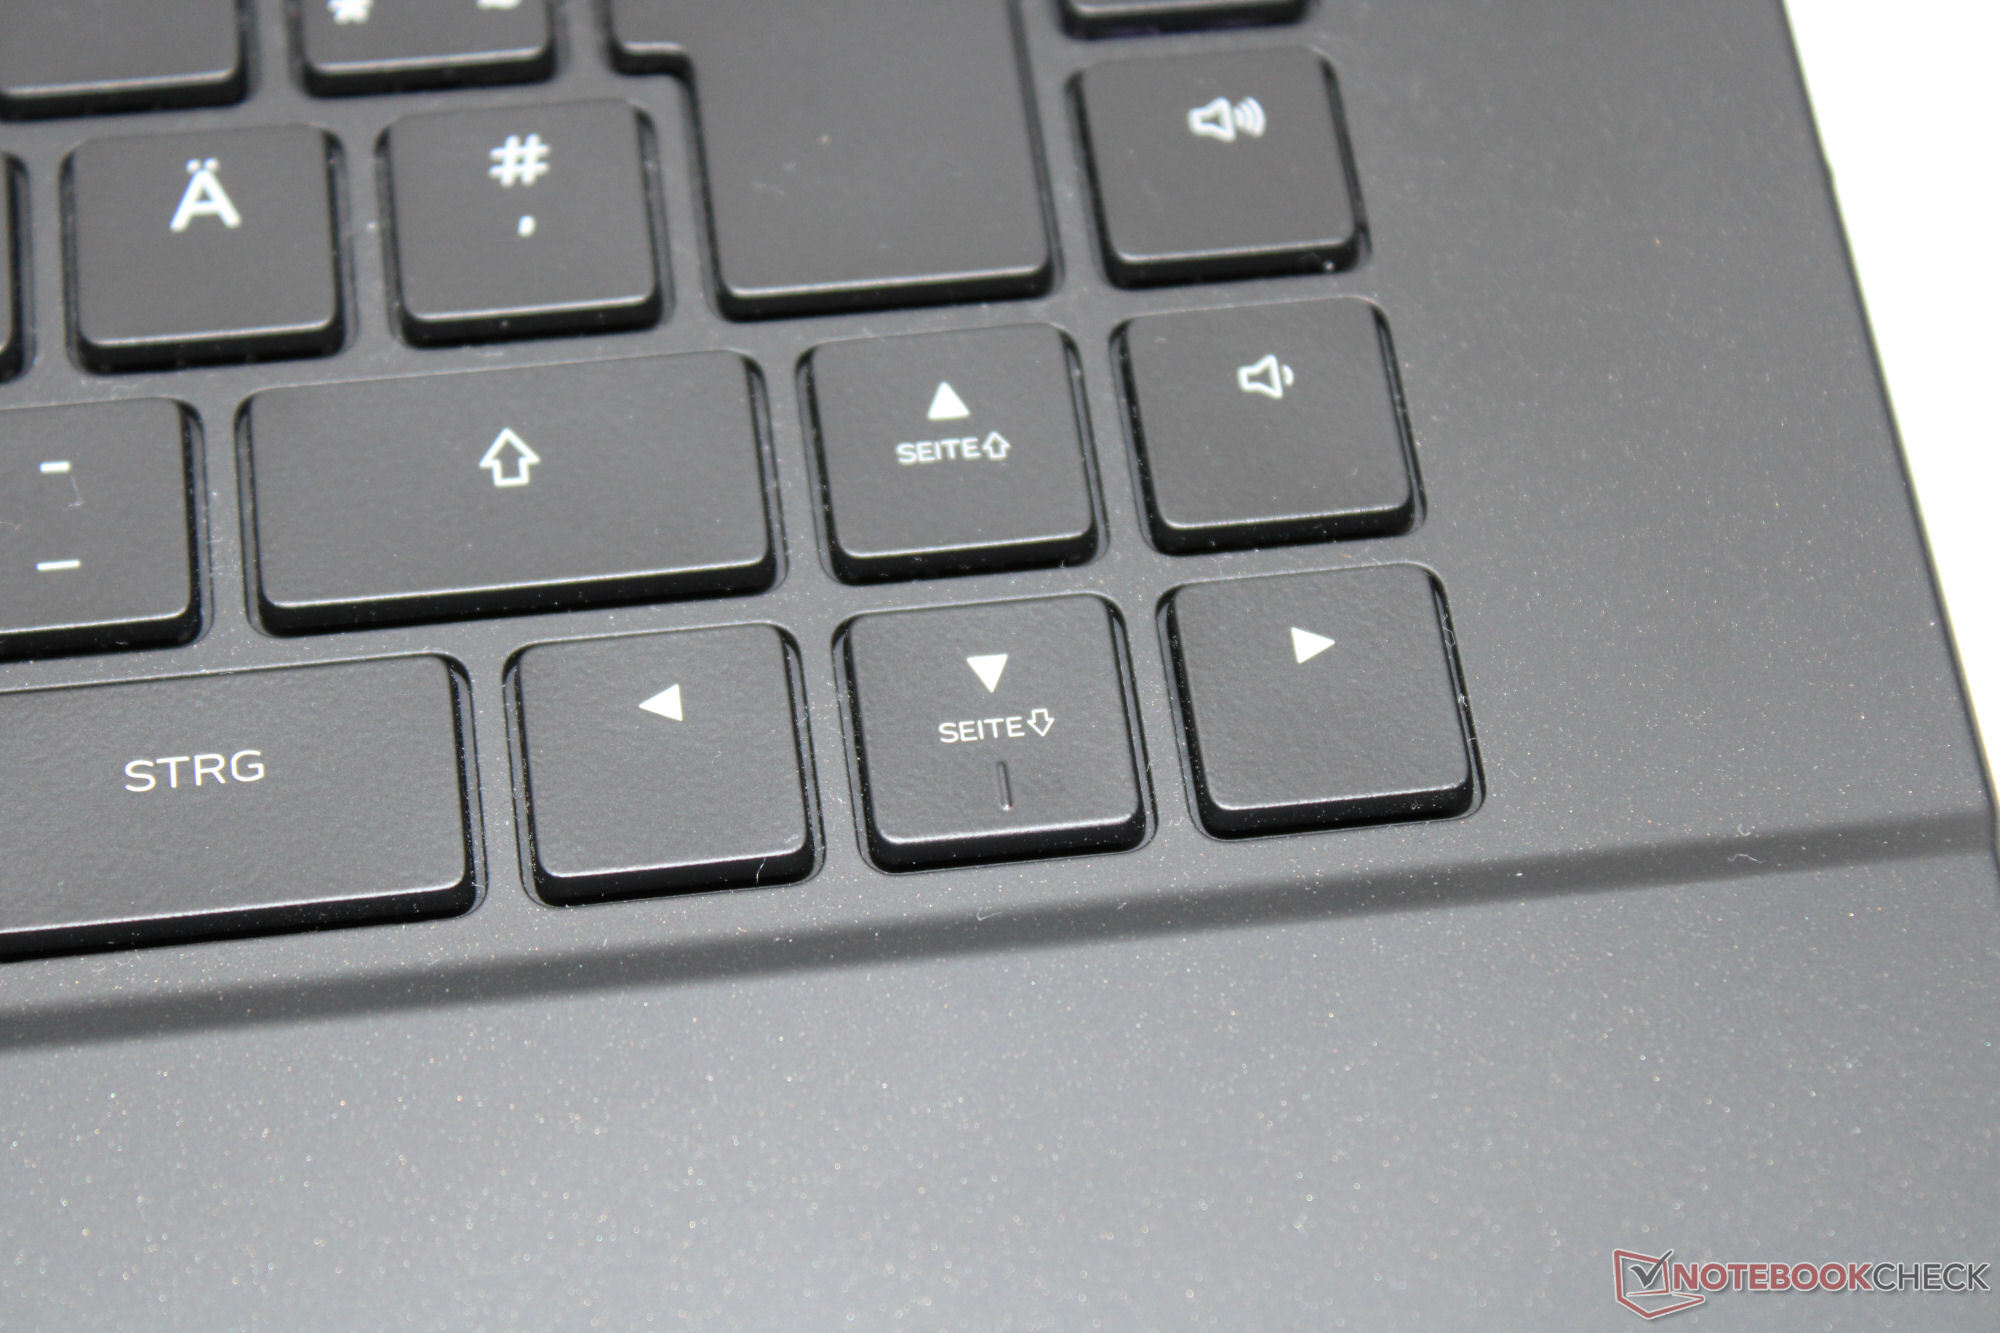
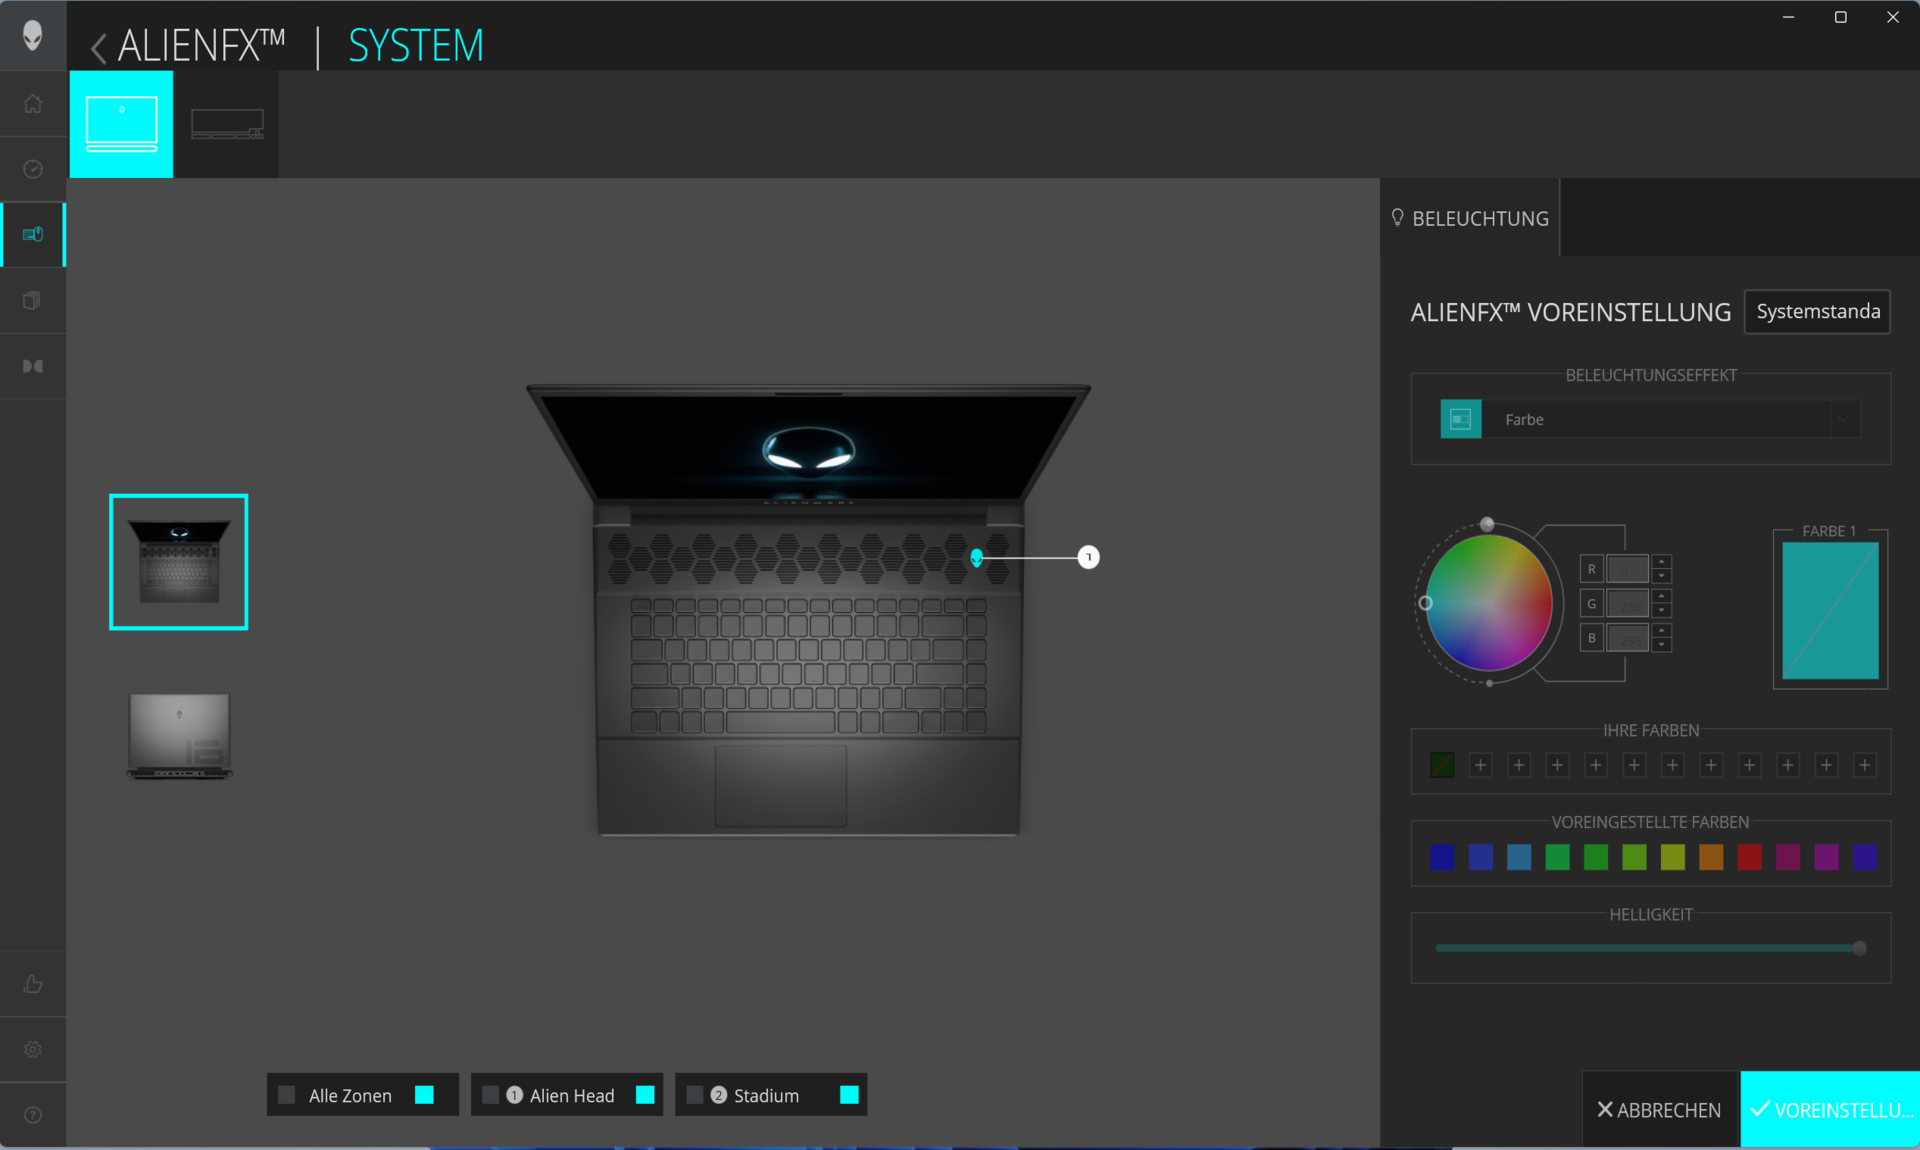
- Istället för det mekaniska tangentbordet (CherryMX) påsystermodellenhar vår testenhet ett membrantangentbord. Dess tangenter erbjuder medium resor, en mycket tydlig tryckpunkt och mycket fast motstånd. Individuell nyckelbelysning (RGB) är också möjlig.
| SD Card Reader | |
| average JPG Copy Test (av. of 3 runs) | |
| Alienware m16 R1 AMD (Toshiba Exceria Pro SDXC 64 GB UHS-II) | |
| Alienware m16 R1 Intel (AV PRO microSD 128 GB V60) | |
| Genomsnitt av klass Gaming (20.9 - 210, n=55, senaste 2 åren) | |
| Medion Erazer Defender P40 (AV PRO microSD 128 GB V60) | |
| Schenker XMG Pro 15 (E23) | |
| Acer Predator Helios 16 PH16-71-731Q | |
| maximum AS SSD Seq Read Test (1GB) | |
| Alienware m16 R1 AMD (Toshiba Exceria Pro SDXC 64 GB UHS-II) | |
| Alienware m16 R1 Intel (AV PRO microSD 128 GB V60) | |
| Genomsnitt av klass Gaming (25.5 - 261, n=52, senaste 2 åren) | |
| Medion Erazer Defender P40 (AV PRO microSD 128 GB V60) | |
| Schenker XMG Pro 15 (E23) | |
| Acer Predator Helios 16 PH16-71-731Q | |


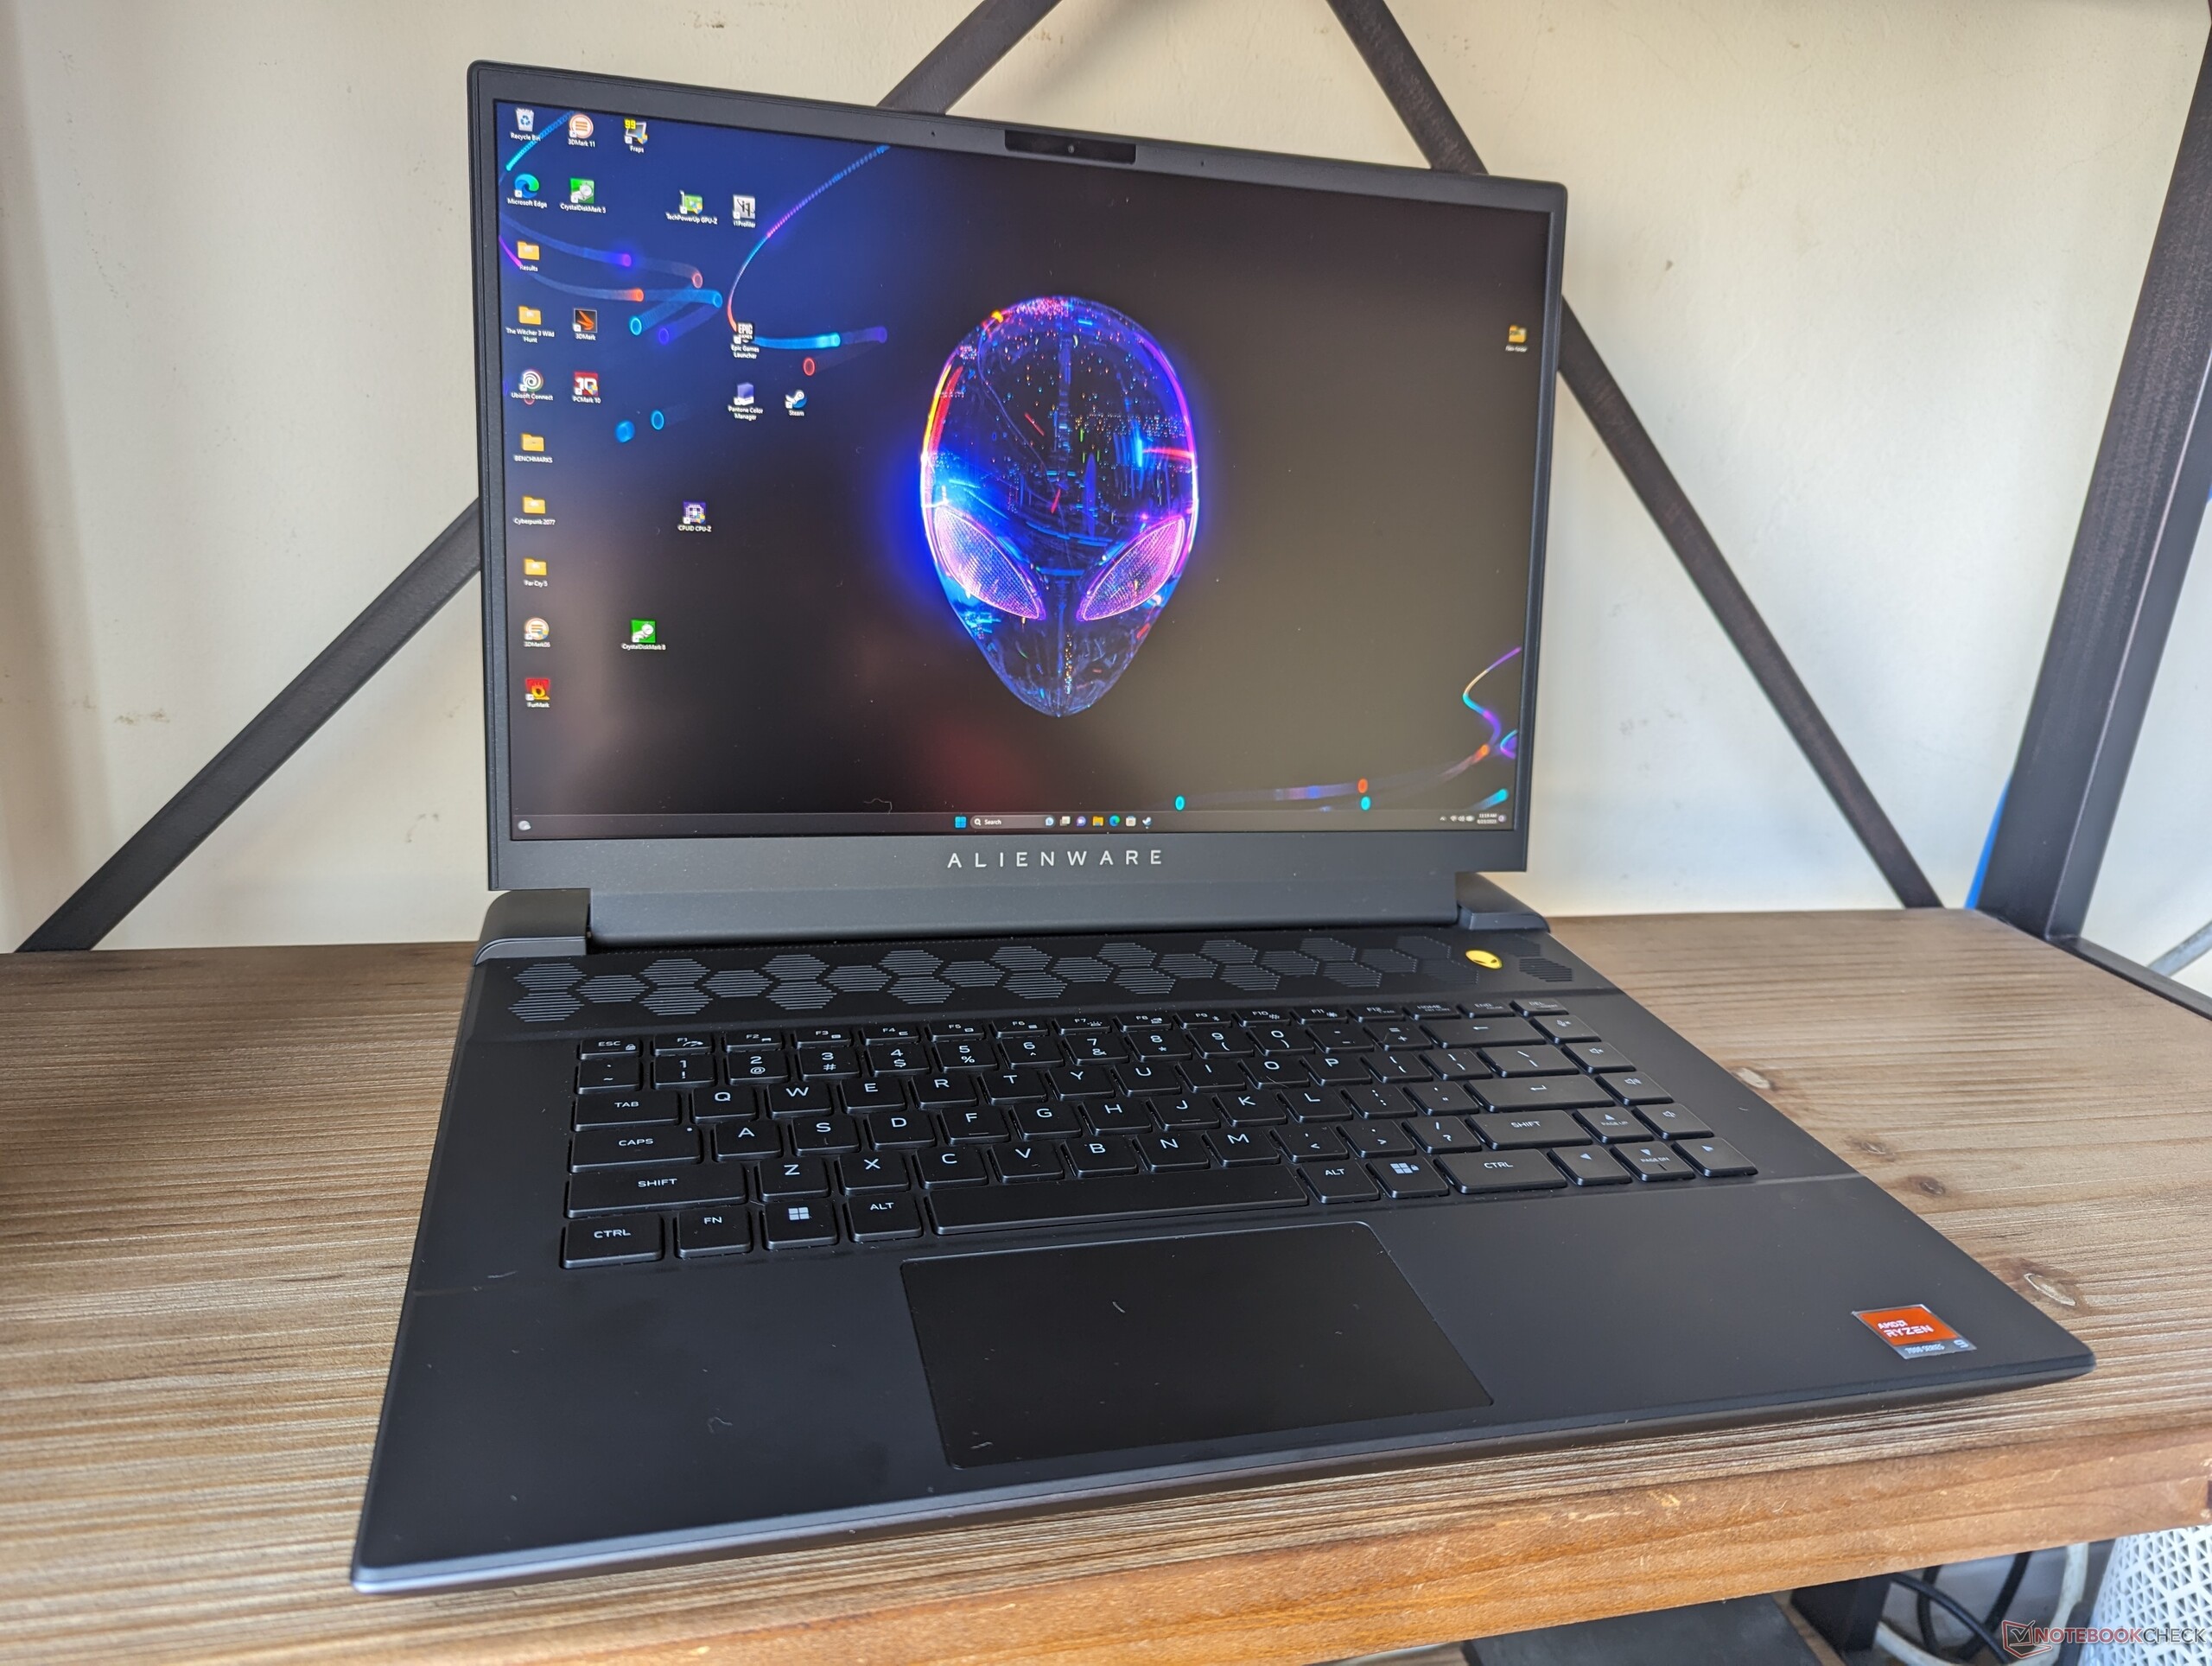
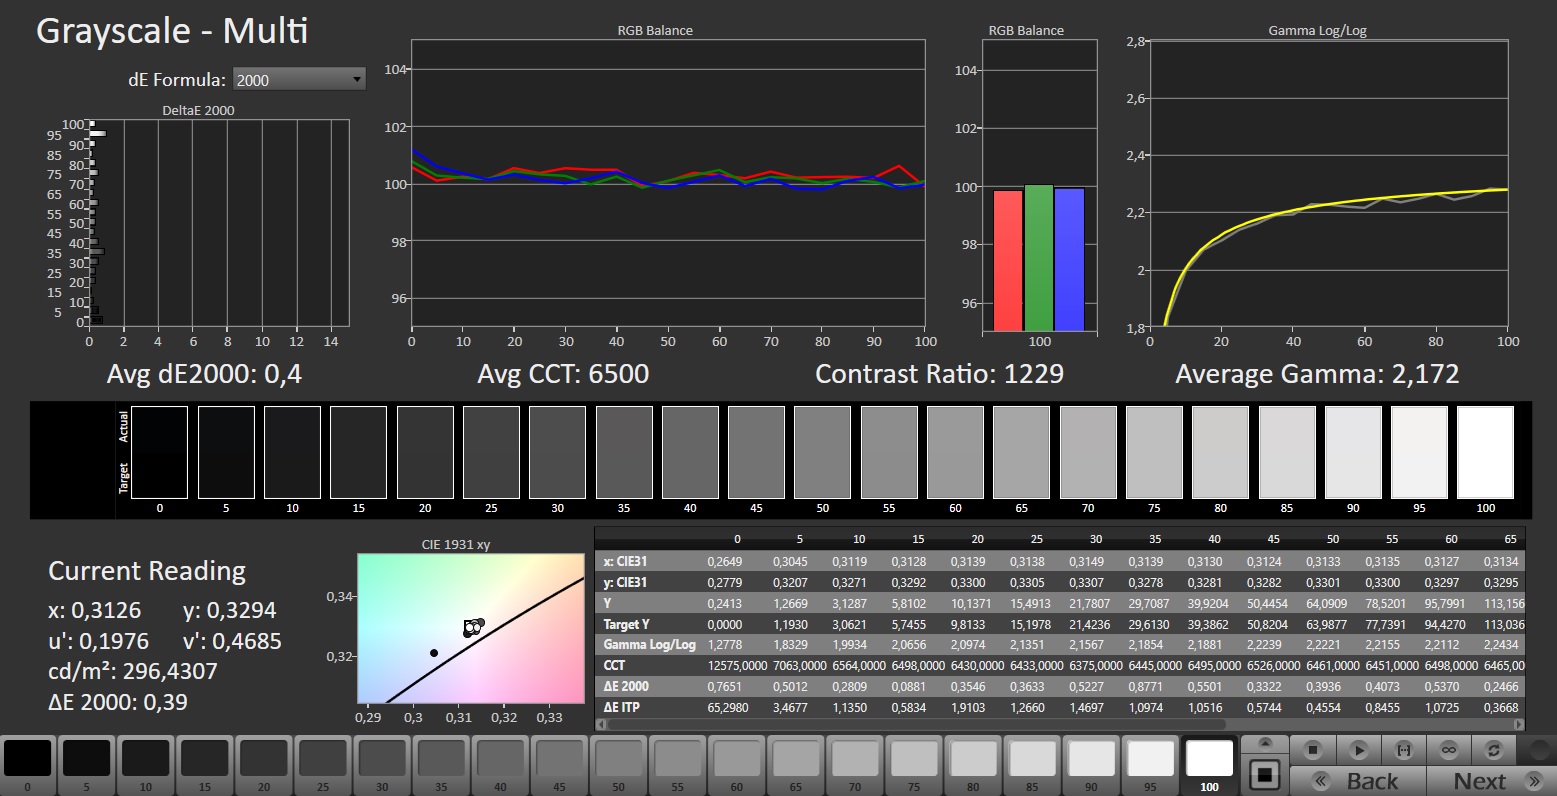
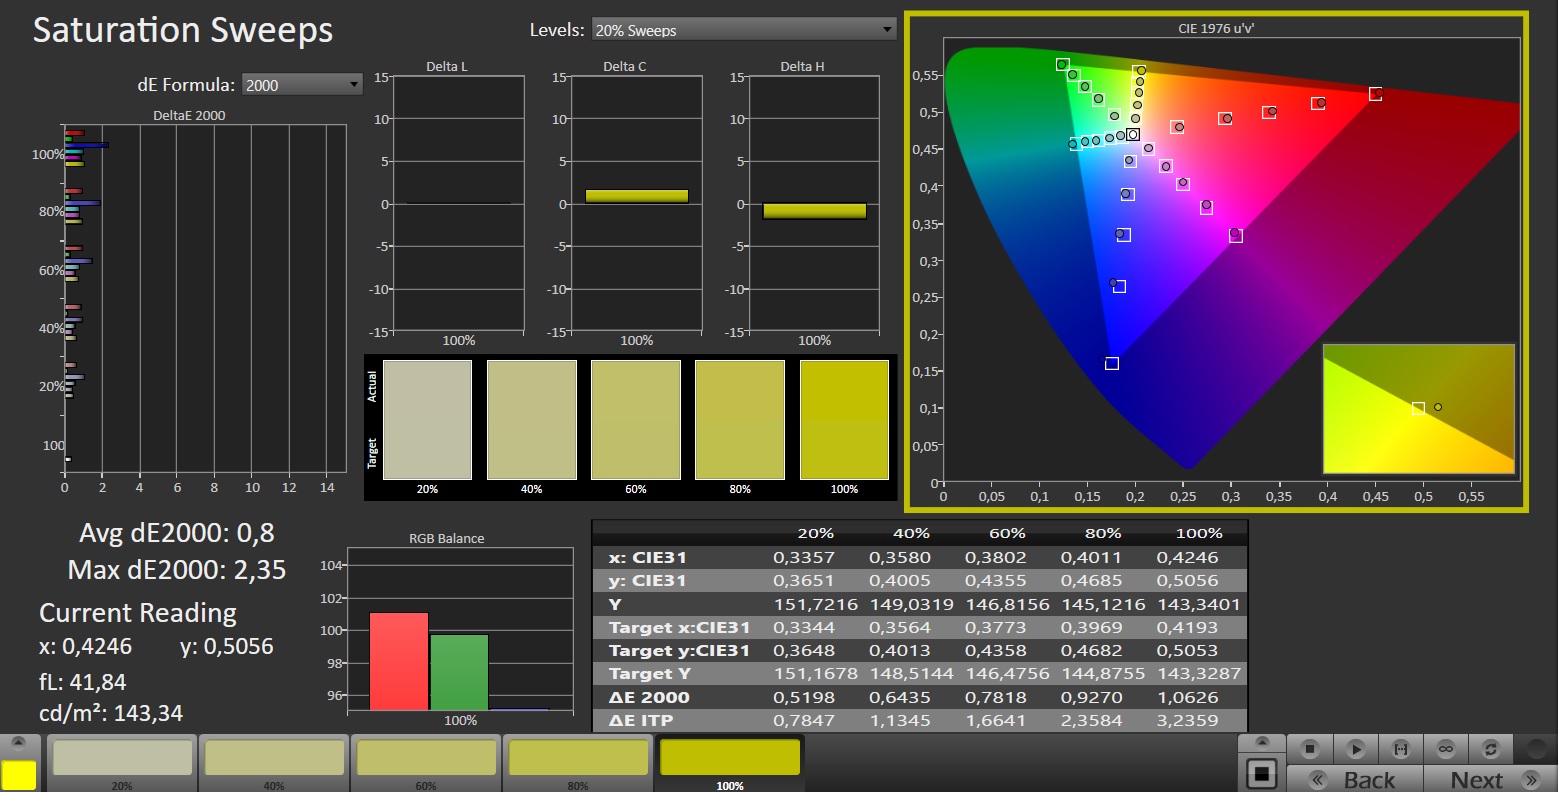
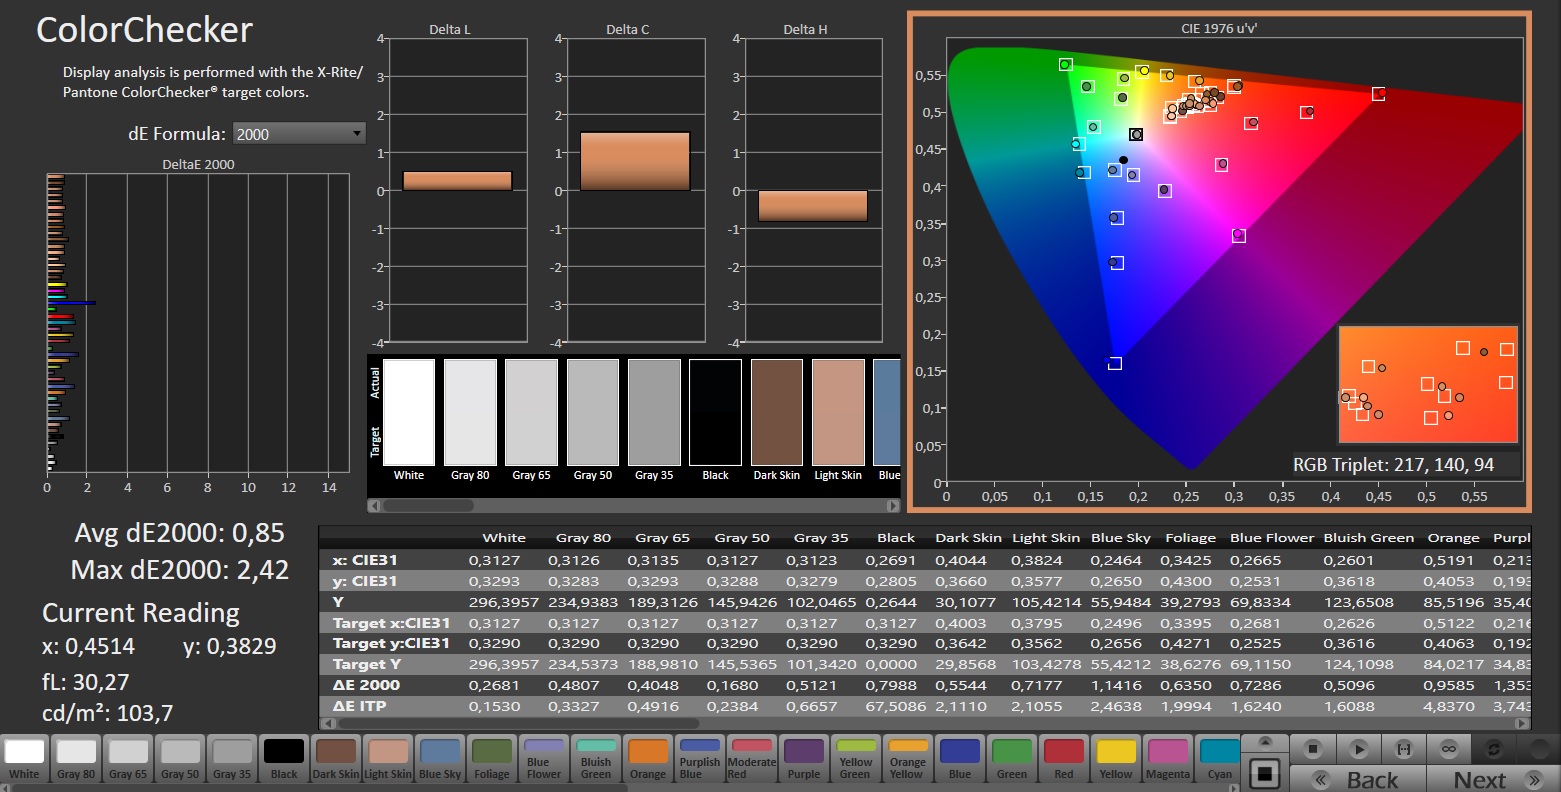
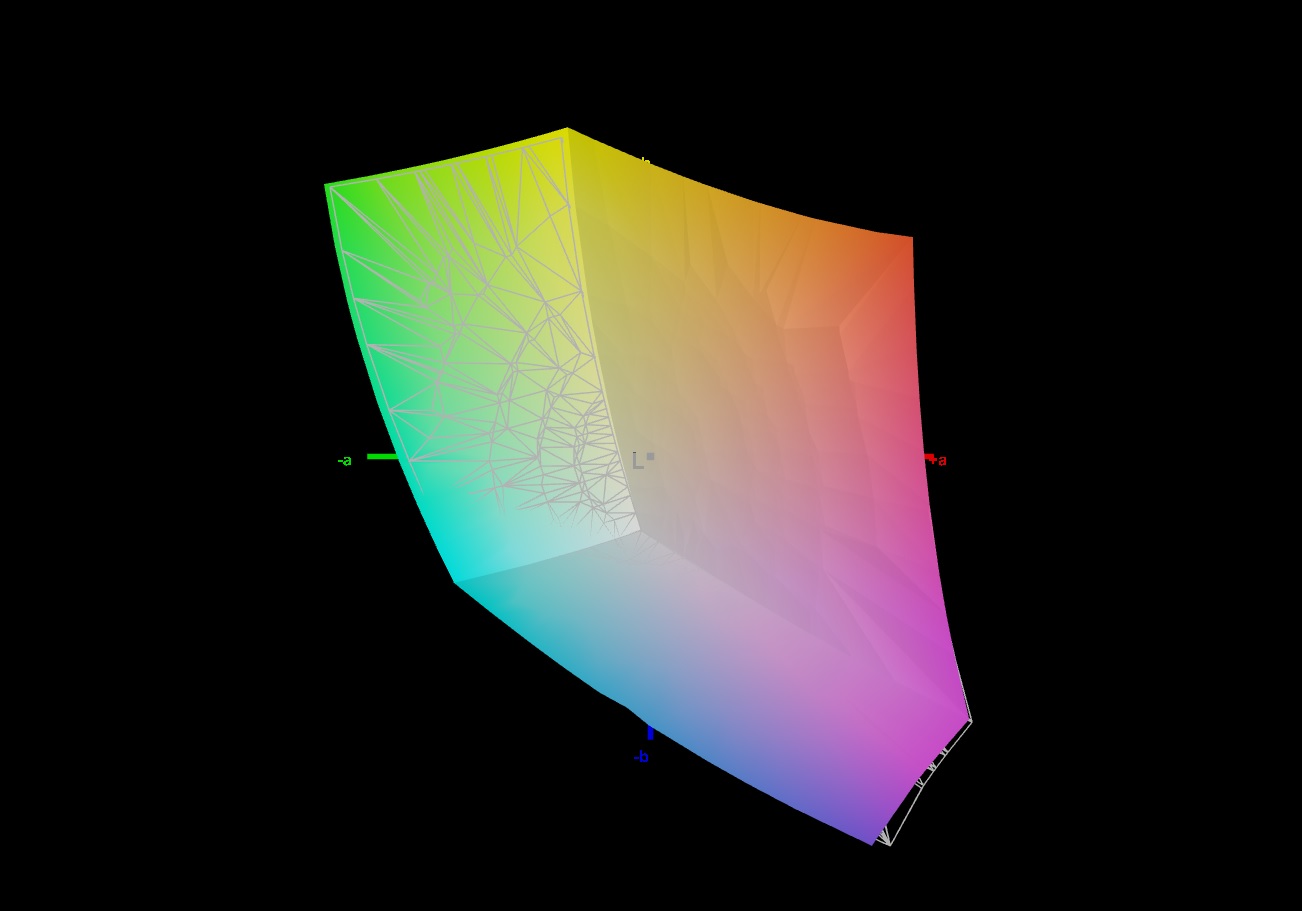
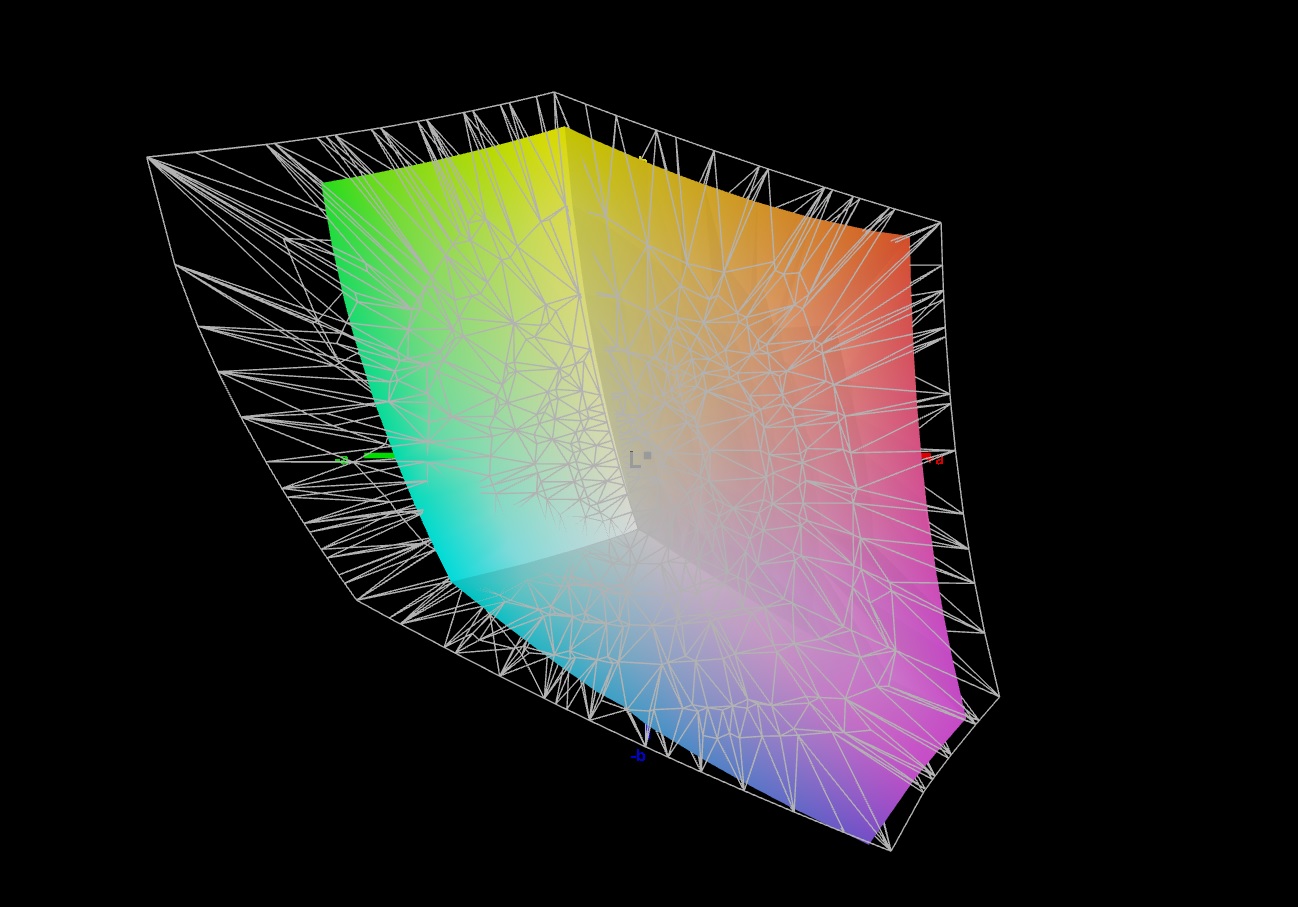
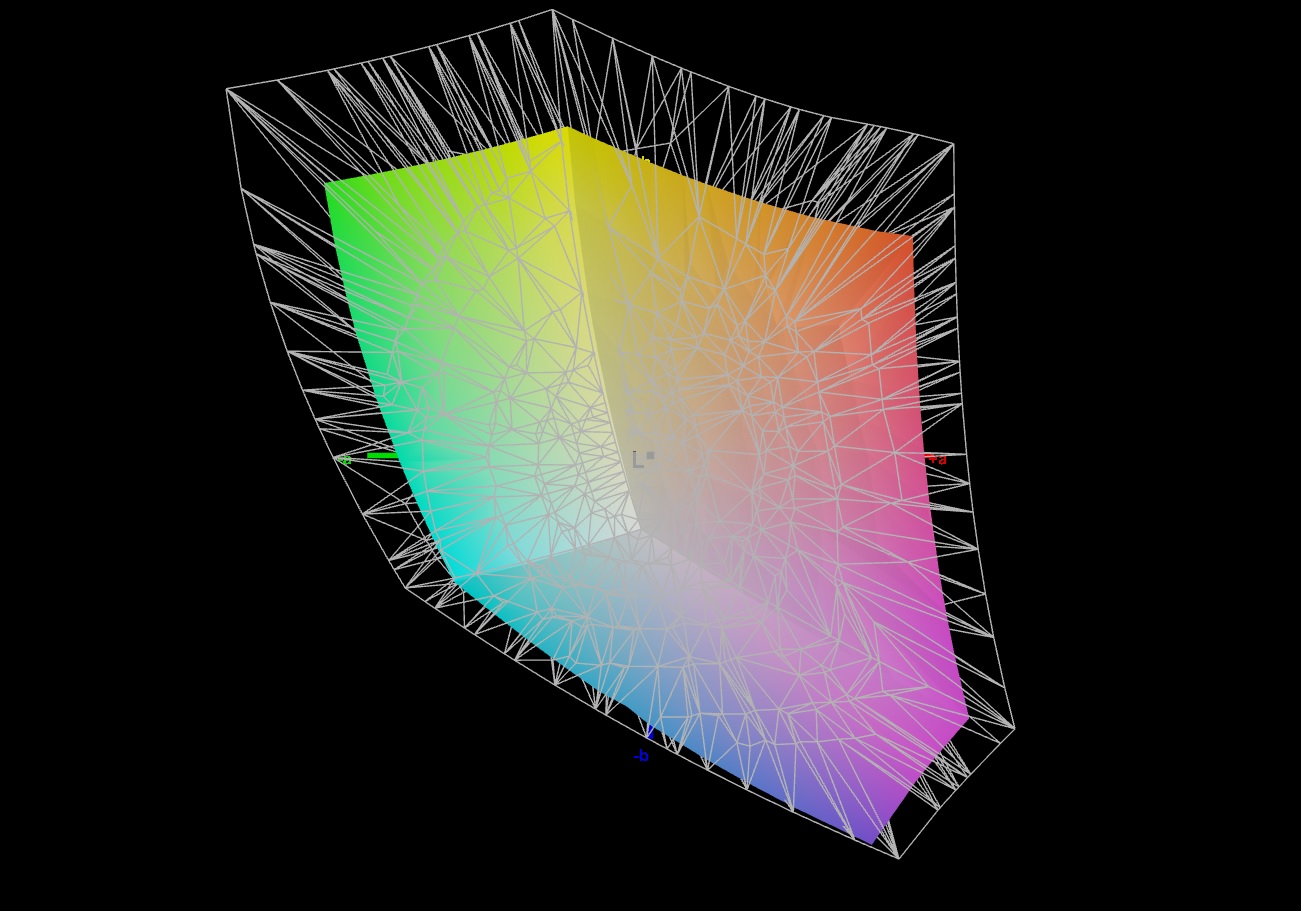
Display - QHD+ med sRGB-täckning
På plussidan för den matta 16-tumsskärmen (2560x1600, IPS) i 16:10-format finns frånvaron av PWM-flimmer, stöd för G-Sync (endast för Intel m16-modeller) och korta svarstider. Ljusstyrkan och kontrasten på 165 Hz-panelen når respektive mål (> 300 cd/m² eller 1000:1).
Alternativt finns det två andra skärmar (1x QHD+, 1x FHD+) som erbjuder högre uppdateringsfrekvens och större färgrymdstäckning. 4k-, OLED- eller mini-LED-alternativ är inte tillgängliga.
| |||||||||||||||||||||||||
Distribution av ljusstyrkan: 89 %
Mitt på batteriet: 306 cd/m²
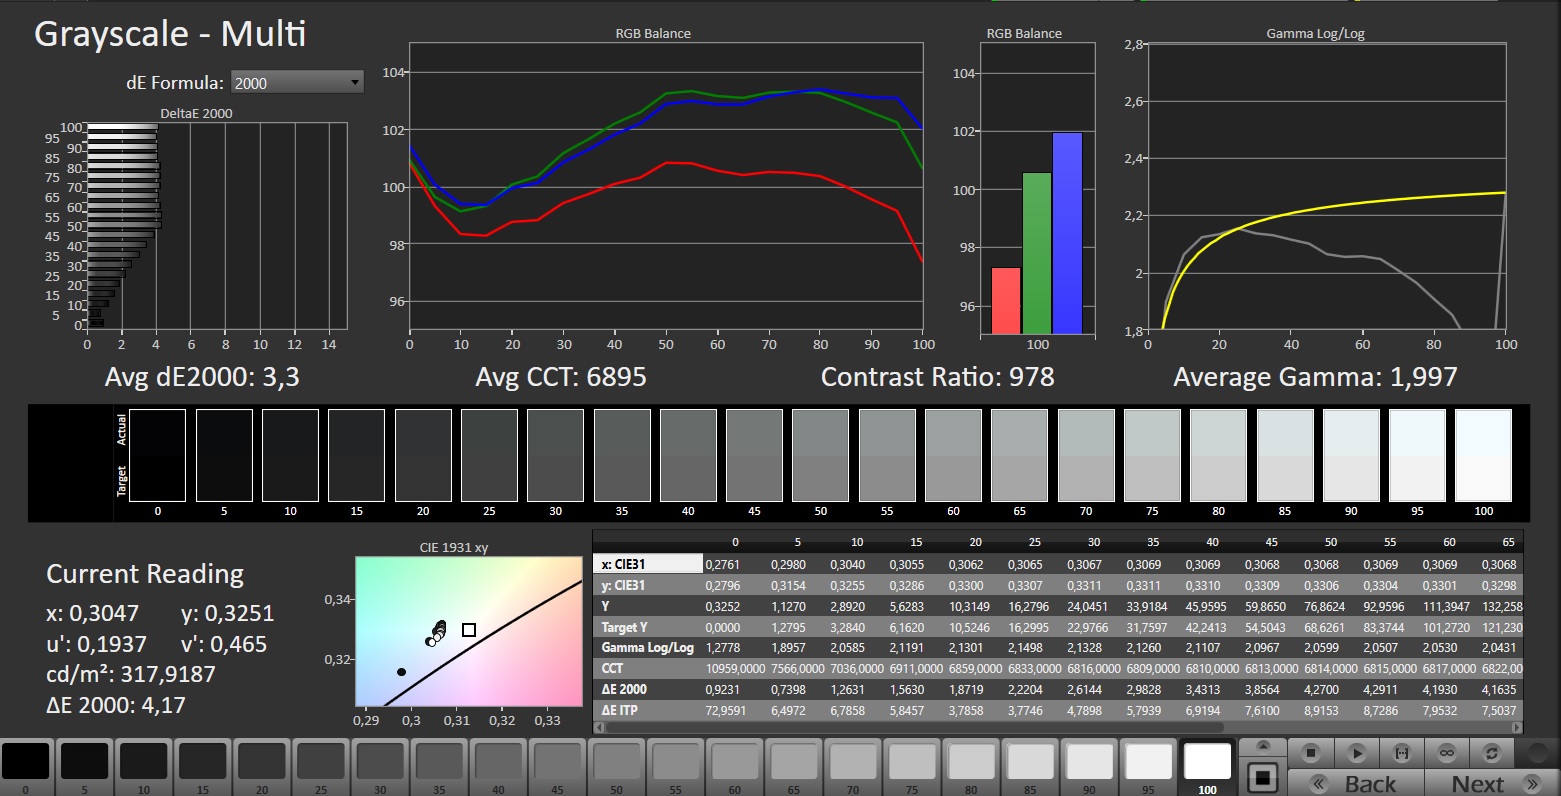
Kontrast: 1020:1 (Svärta: 0.3 cd/m²)
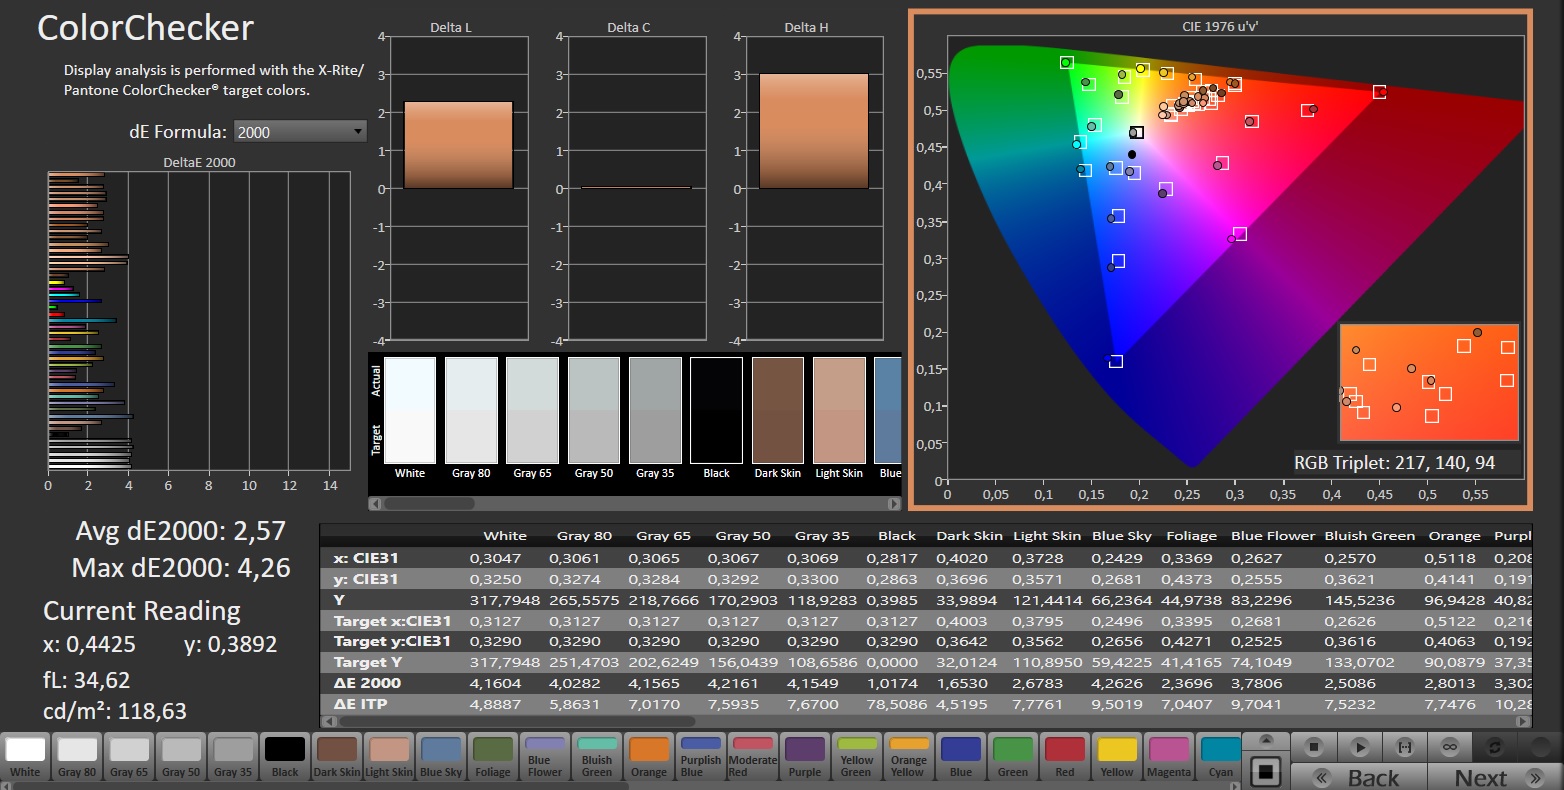
ΔE ColorChecker Calman: 2.57 | ∀{0.5-29.43 Ø4.73}
calibrated: 0.85
ΔE Greyscale Calman: 3.3 | ∀{0.09-98 Ø4.97}
70% AdobeRGB 1998 (Argyll 3D)
97.2% sRGB (Argyll 3D)
67.7% Display P3 (Argyll 3D)
Gamma: 1.997
CCT: 6895 K
| Alienware m16 R1 Intel BOE NE16NYB, IPS, 2560x1600, 16" | Acer Predator Helios 16 PH16-71-731Q BOE NE160QDM-NZ2, IPS-LED, 2560x1600, 16" | Medion Erazer Defender P40 BOE CQ NE173QHM-NZ3, IPS, 2560x1440, 17.3" | Lenovo Legion Pro 5 16IRX8 AU Optronics B160QAN03.1, IPS, 2560x1600, 16" | Schenker XMG Pro 15 (E23) BOE0AD1, IPS, 2560x1440, 15.6" | Aorus 15 BSF Sharp LQ156T1JW05, IPS, 2560x1440, 15.6" | Alienware m16 R1 AMD BOE NE16NZ4, IPS, 2560x1600, 16" | |
|---|---|---|---|---|---|---|---|
| Display | 22% | 1% | 4% | 23% | 23% | 25% | |
| Display P3 Coverage (%) | 67.7 | 97.1 43% | 68.3 1% | 71.2 5% | 97.8 44% | 98.2 45% | 98.6 46% |
| sRGB Coverage (%) | 97.2 | 100 3% | 98.1 1% | 98.8 2% | 99.9 3% | 99.9 3% | 99.9 3% |
| AdobeRGB 1998 Coverage (%) | 70 | 84.7 21% | 69.8 0% | 73.3 5% | 85.4 22% | 85.7 22% | 88.9 27% |
| Response Times | -114% | -142% | -153% | -141% | -90% | -25% | |
| Response Time Grey 50% / Grey 80% * (ms) | 4 ? | 13.6 ? -240% | 14.6 ? -265% | 14.5 ? -263% | 14 ? -250% | 11.3 ? -183% | 5.1 ? -27% |
| Response Time Black / White * (ms) | 7.3 ? | 6.4 ? 12% | 8.7 ? -19% | 10.4 ? -42% | 9.6 ? -32% | 7 ? 4% | 9 ? -23% |
| PWM Frequency (Hz) | |||||||
| Screen | 14% | 18% | 19% | -15% | -24% | -34% | |
| Brightness middle (cd/m²) | 306 | 511 67% | 364 19% | 405.7 33% | 322 5% | 299 -2% | 329 8% |
| Brightness (cd/m²) | 302 | 498 65% | 343 14% | 368 22% | 301 0% | 282 -7% | 317 5% |
| Brightness Distribution (%) | 89 | 94 6% | 86 -3% | 87 -2% | 85 -4% | 82 -8% | 89 0% |
| Black Level * (cd/m²) | 0.3 | 0.36 -20% | 0.28 7% | 0.38 -27% | 0.36 -20% | 0.31 -3% | 0.32 -7% |
| Contrast (:1) | 1020 | 1419 39% | 1300 27% | 1068 5% | 894 -12% | 965 -5% | 1028 1% |
| Colorchecker dE 2000 * | 2.57 | 1.76 32% | 1.67 35% | 1.65 36% | 1.98 23% | 2.24 13% | 3.71 -44% |
| Colorchecker dE 2000 max. * | 4.26 | 3.7 13% | 2.78 35% | 4.2 1% | 5.24 -23% | 4.29 -1% | 7.23 -70% |
| Colorchecker dE 2000 calibrated * | 0.85 | 1.56 -84% | 1.14 -34% | 0.53 38% | 1.98 -133% | 2.62 -208% | 2.82 -232% |
| Greyscale dE 2000 * | 3.3 | 3 9% | 1.4 58% | 1.2 64% | 2.44 26% | 3 9% | 2.2 33% |
| Gamma | 1.997 110% | 2.33 94% | 2.091 105% | 2.3 96% | 2.42 91% | 2.086 105% | 2.3 96% |
| CCT | 6895 94% | 6341 103% | 6568 99% | 6453 101% | 6984 93% | 6289 103% | 6270 104% |
| Totalt genomsnitt (program/inställningar) | -26% /
-2% | -41% /
-9% | -43% /
-9% | -44% /
-25% | -30% /
-23% | -11% /
-20% |
* ... mindre är bättre
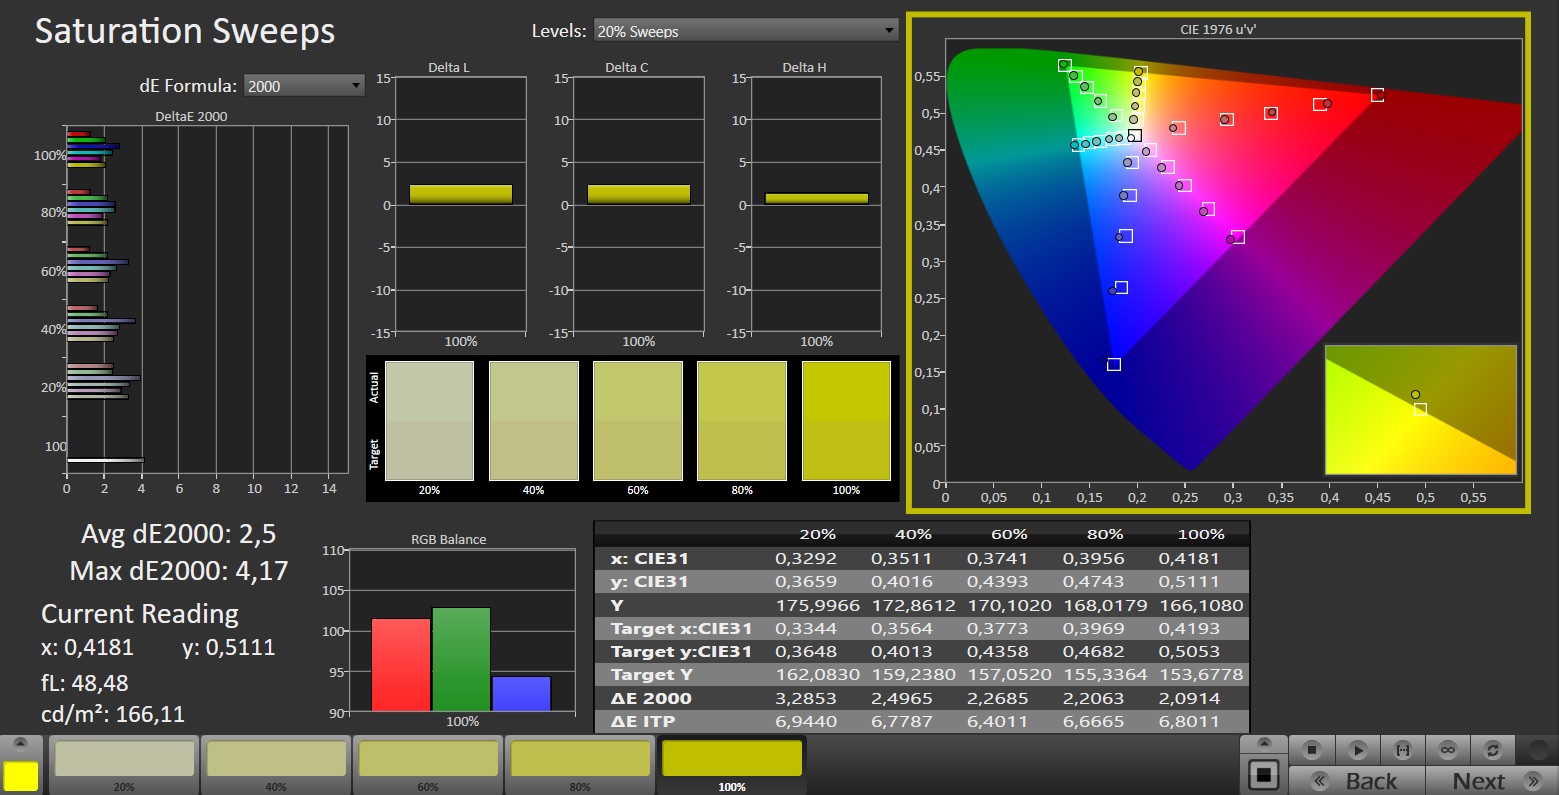
Skärmen visar bra färgåtergivning från fabrik: målet (DeltaE < 3) uppnås med en avvikelse på cirka 2,6. Kalibreringen minskar denna avvikelse ytterligare till 0,85 och säkerställer mer balanserade gråtoner. Panelen kan helt återge sRGB-färgrymden, men inte AdobeRGB och DCI P3-färgrymderna. Å andra sidan kan P3-färgrymden återges på de alternativa skärmarna.
Visa svarstider
| ↔ Svarstid svart till vitt | ||
|---|---|---|
| 7.3 ms ... stiga ↗ och falla ↘ kombinerat | ↗ 3.6 ms stiga | 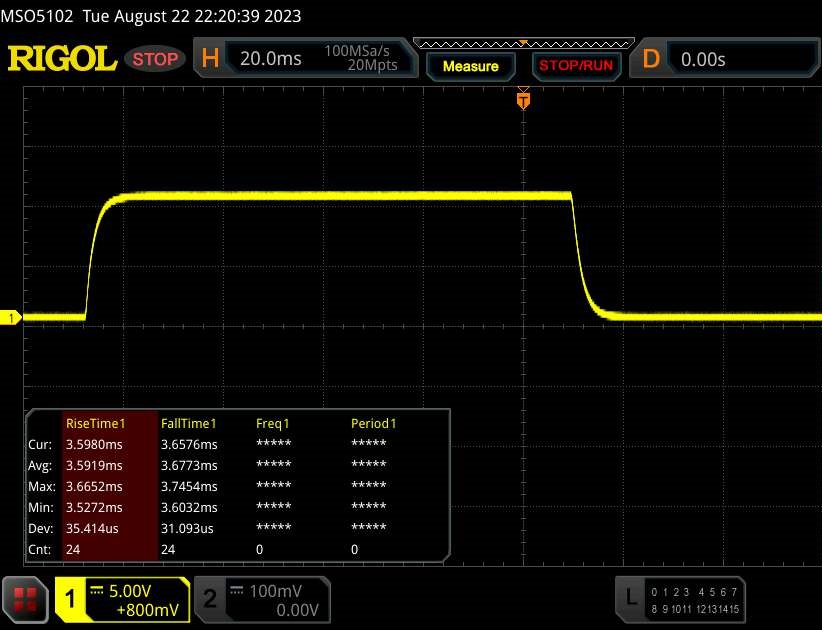 |
| ↘ 3.7 ms hösten | ||
| Skärmen visar väldigt snabba svarsfrekvenser i våra tester och borde vara mycket väl lämpad för fartfyllt spel. I jämförelse sträcker sig alla testade enheter från 0.1 (minst) till 240 (maximalt) ms. » 21 % av alla enheter är bättre. Det betyder att den uppmätta svarstiden är bättre än genomsnittet av alla testade enheter (19.9 ms). | ||
| ↔ Svarstid 50 % grått till 80 % grått | ||
| 4 ms ... stiga ↗ och falla ↘ kombinerat | ↗ 1.7 ms stiga | 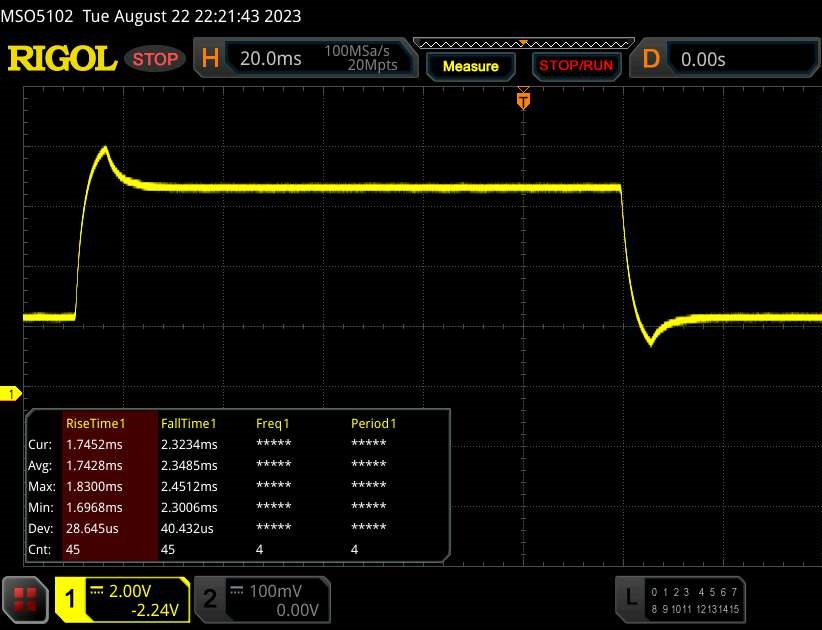 |
| ↘ 2.3 ms hösten | ||
| Skärmen visar väldigt snabba svarsfrekvenser i våra tester och borde vara mycket väl lämpad för fartfyllt spel. I jämförelse sträcker sig alla testade enheter från 0.165 (minst) till 636 (maximalt) ms. » 15 % av alla enheter är bättre. Det betyder att den uppmätta svarstiden är bättre än genomsnittet av alla testade enheter (31.1 ms). | ||
Skärmflimmer / PWM (Puls-Width Modulation)
| Skärmflimmer / PWM upptäcktes inte |  | ||
Som jämförelse: 52 % av alla testade enheter använder inte PWM för att dämpa skärmen. Om PWM upptäcktes mättes ett medelvärde av 7798 (minst: 5 - maximum: 343500) Hz. | |||
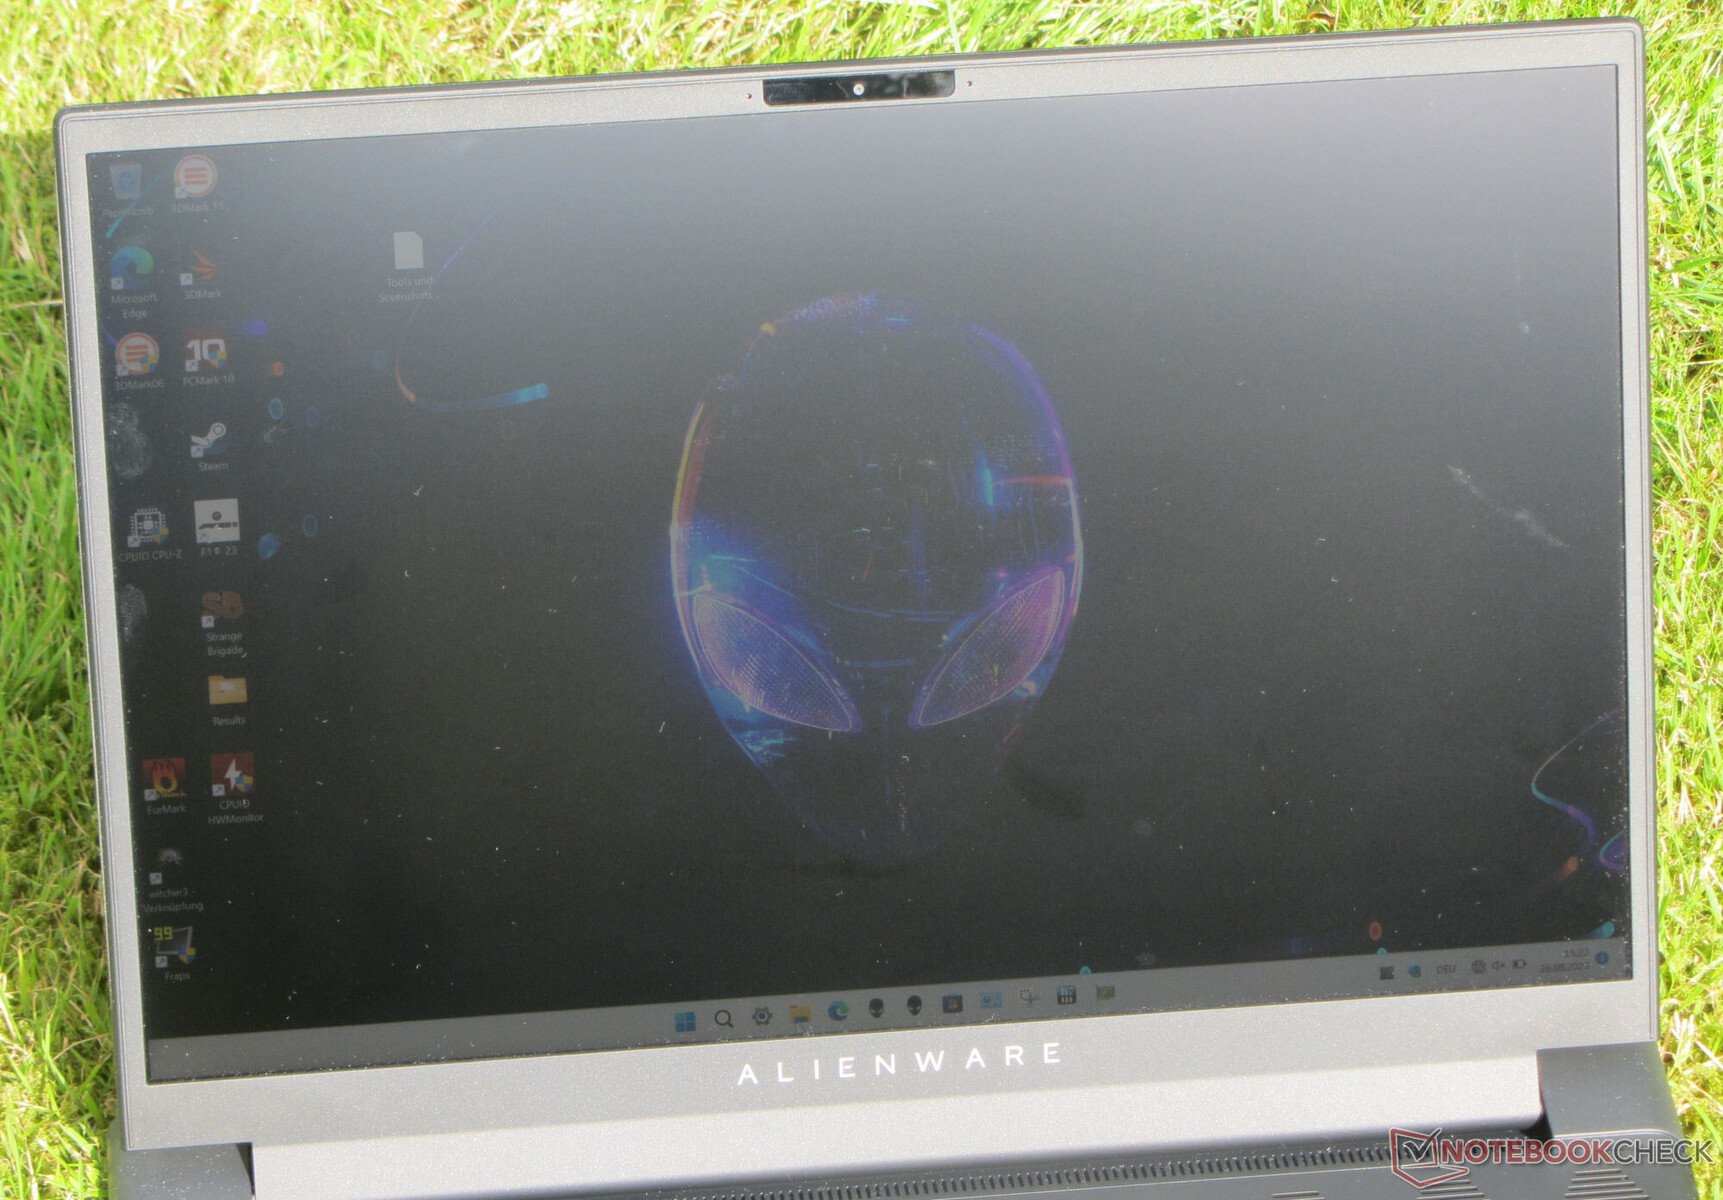
Den betraktningsvinkelstabila IPS-panelen kan läsas från alla positioner. Utomhus är det fullt möjligt att läsa av skärmen så länge solen inte skiner för starkt.

Prestanda - Alienware notebook erbjuder hög systemprestanda
I Alienware m16 R1-serien finns Ada Lovelace GPU:er (RTX 4060, 4070, 4080) kombineras med processorer från Intel eller AMD. Det finns två undantag: vissa AMD-modeller kan endast beställas med en Radeon RX 7600M XT och vissa Intel-modeller med en GeForce RTX 4090. Vår Intel-baserade m16-enhet är tillgänglig för cirka 1 900 euro, vilket för närvarande gör den till en av de billigaste representanterna i serien.
Villkor för testning
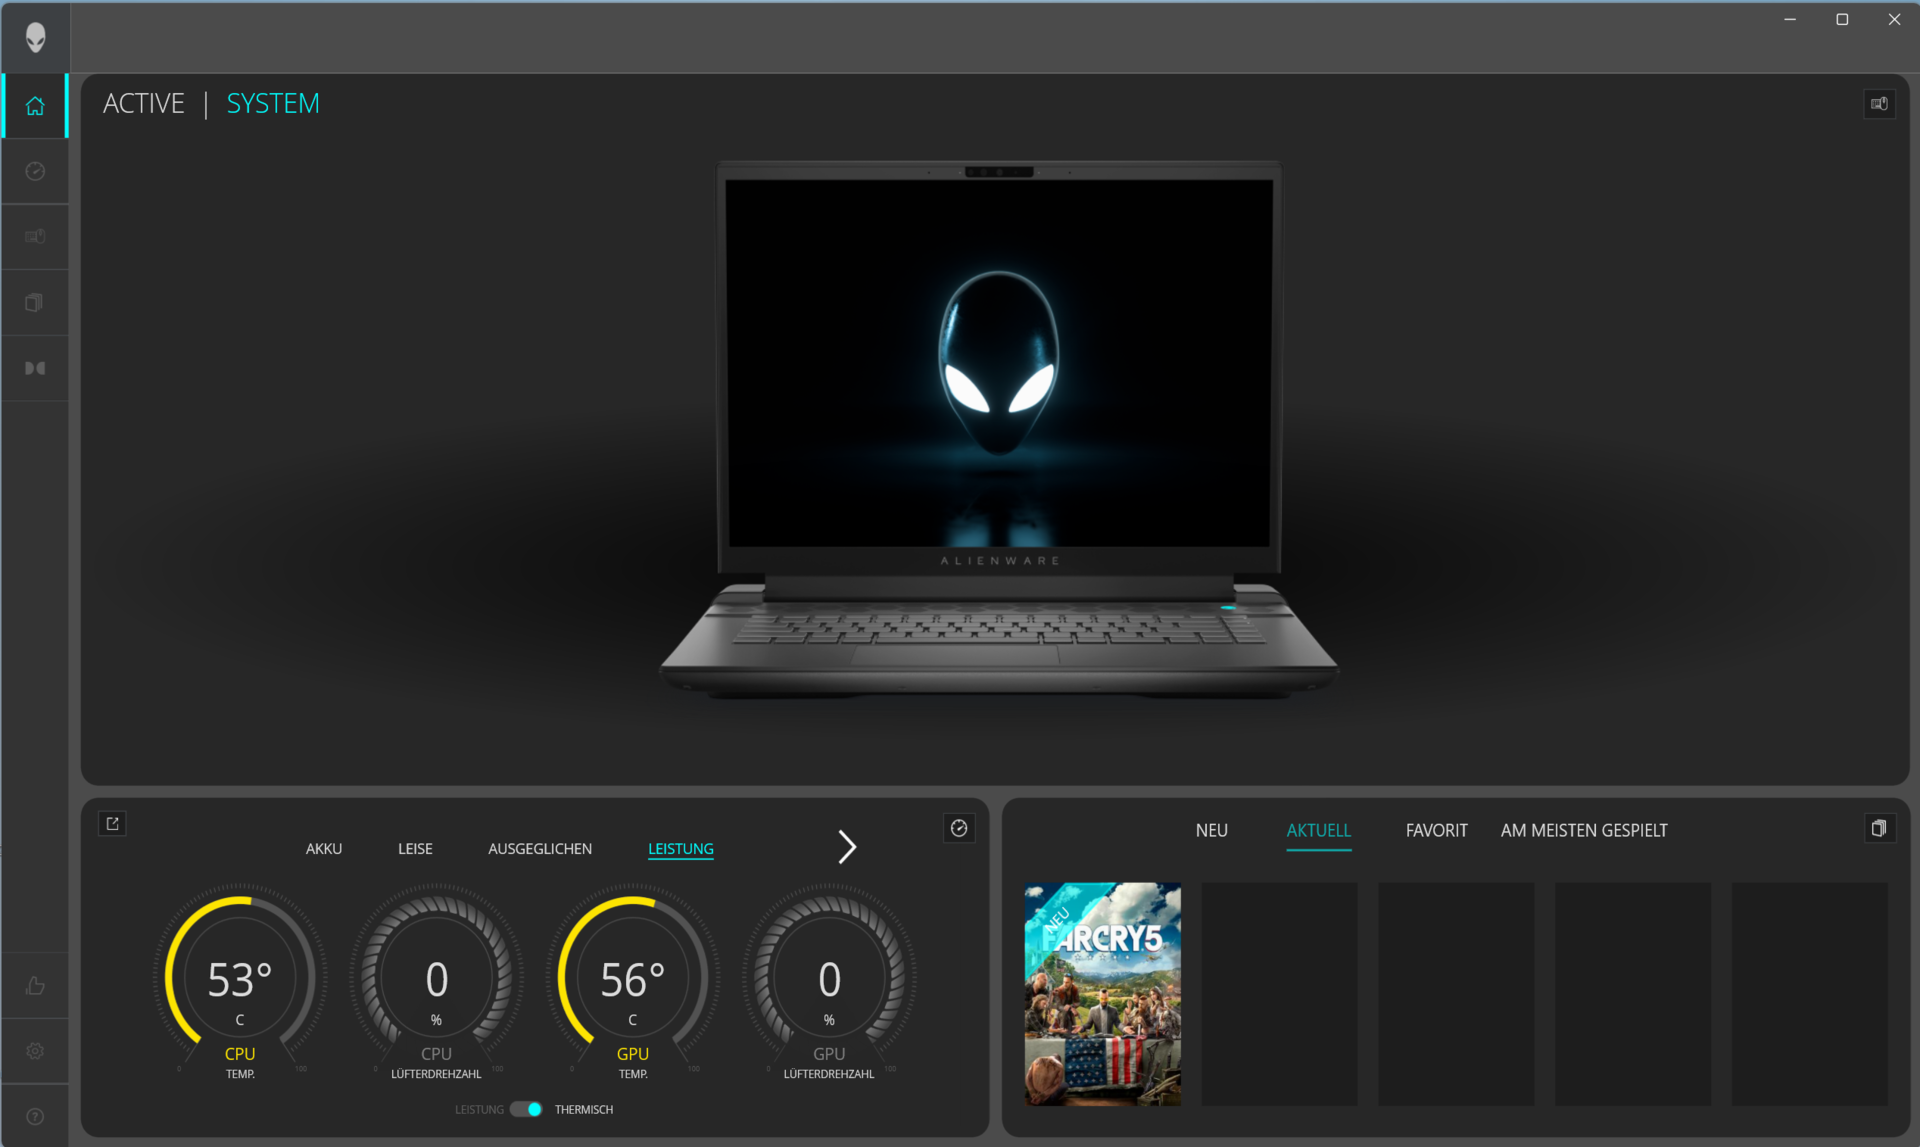
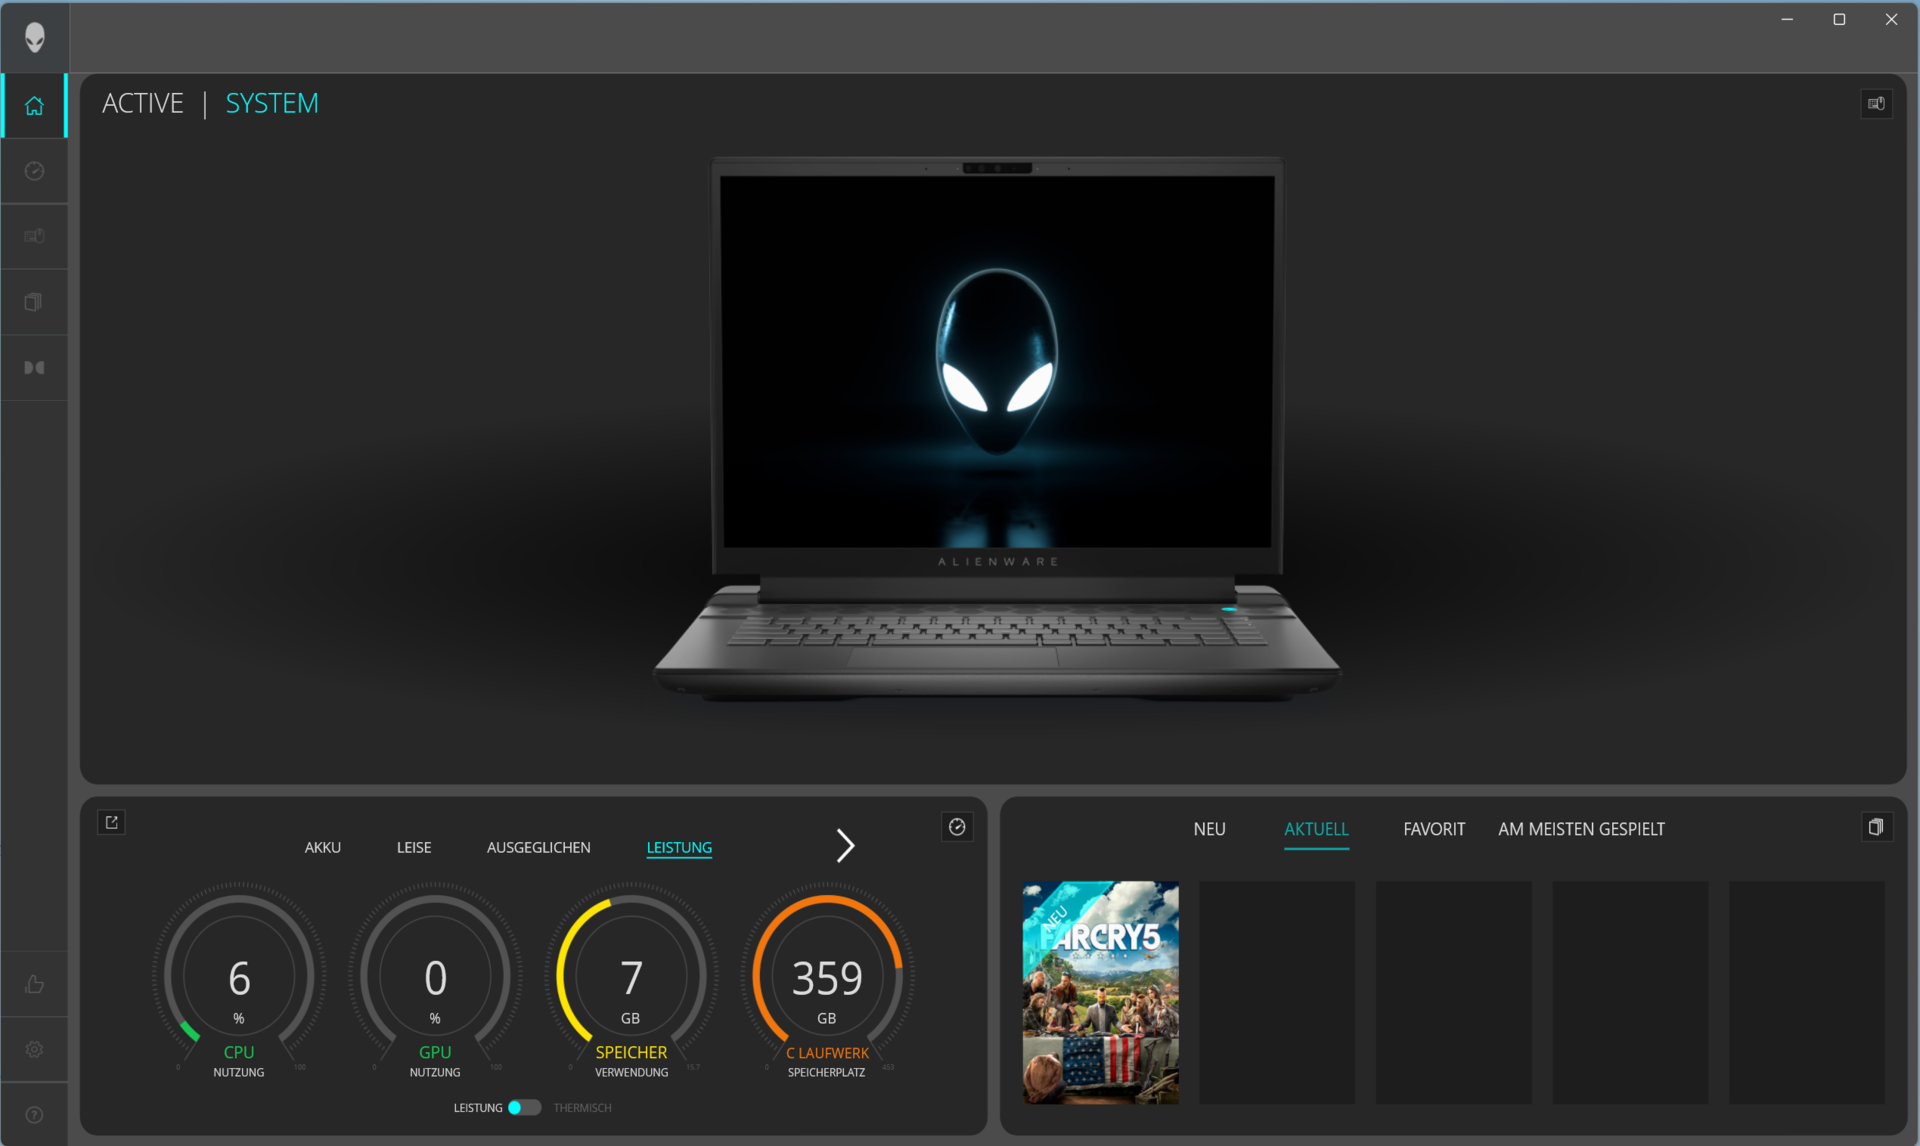
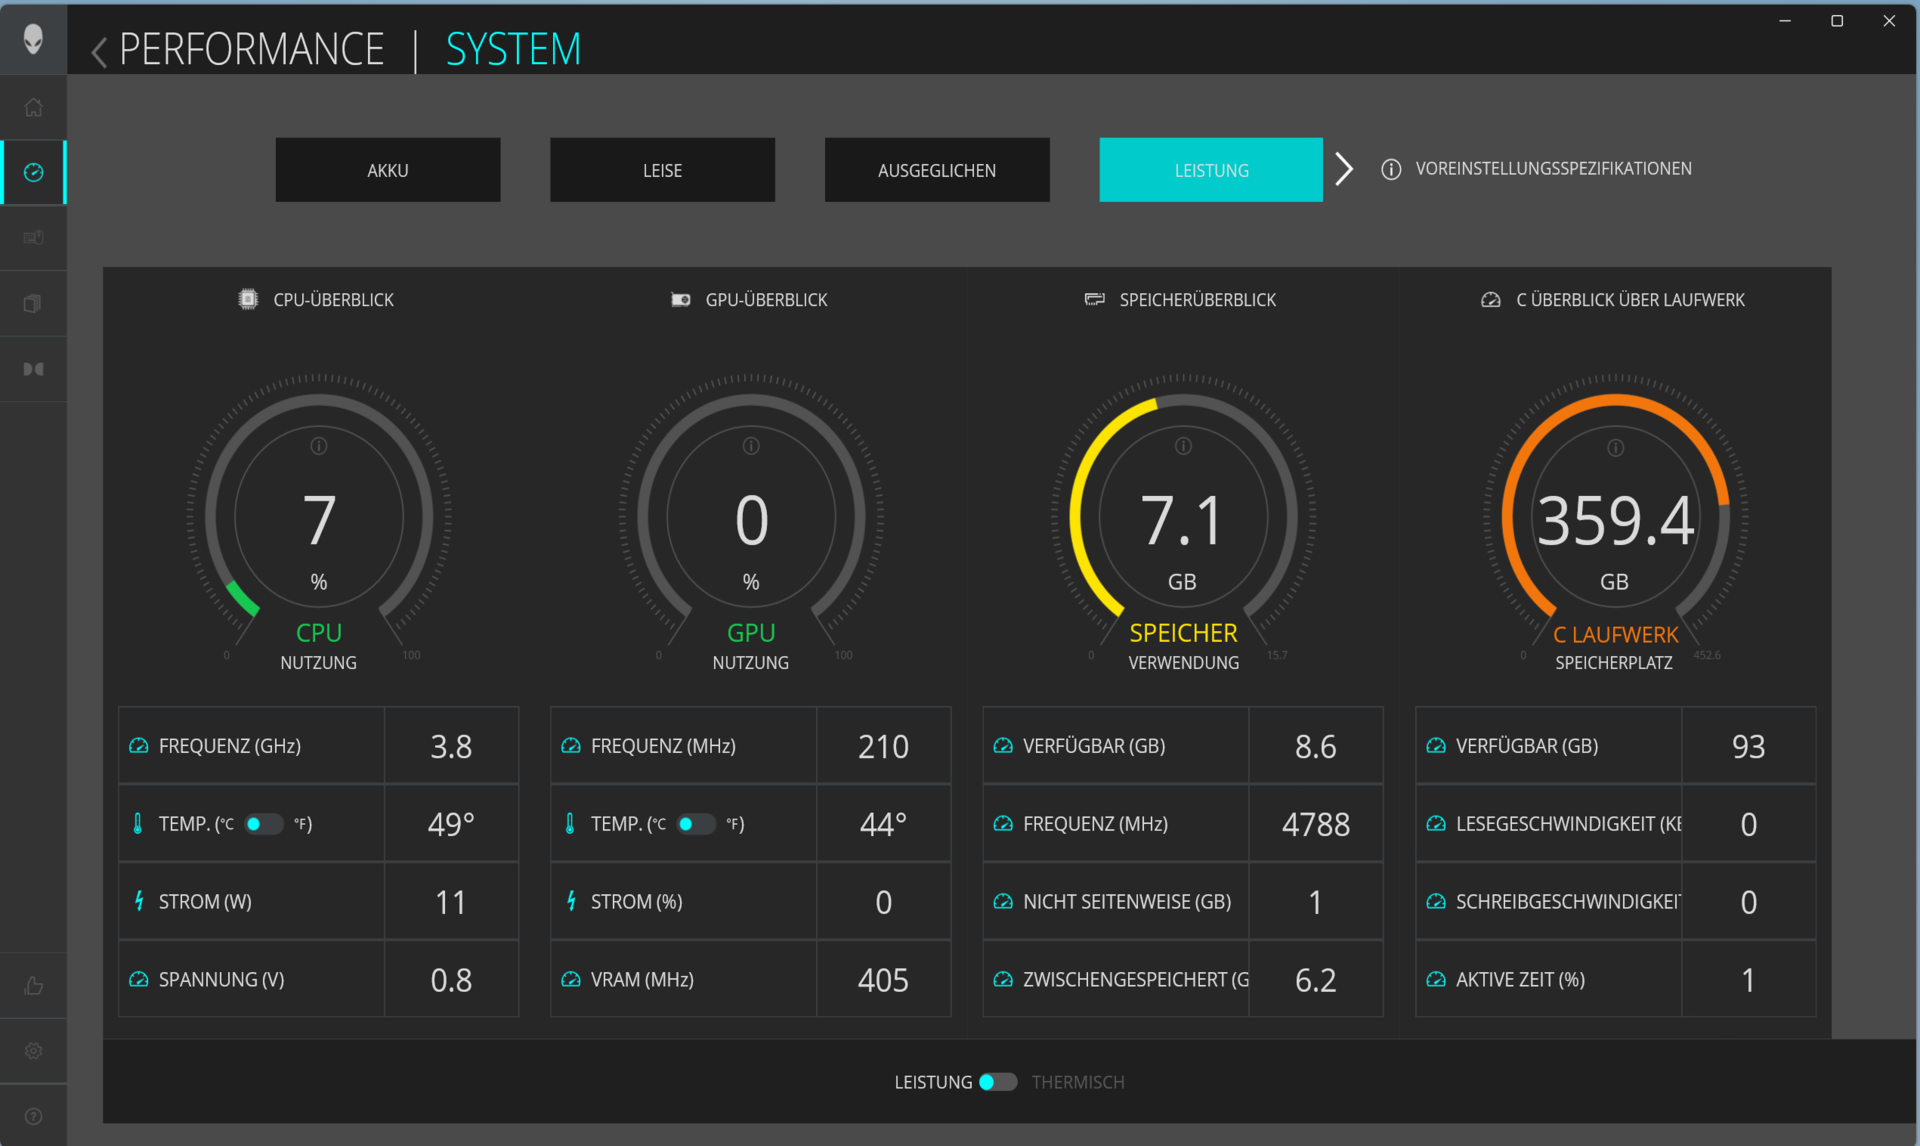
Användaren kan växla mellan fem tillverkarspecifika prestandalägen via Alienware Command Center (kontrollcenter för bärbara datorer). Ett högprestandaläge (maximal prestanda, fullt påslagna fläktar) kan aktiveras via "F1"-tangenten. I våra tester användes lägena "Prestanda" (riktmärken) och "Balanserad" (batteritester).
Obs: systermodell testades med profilen "Overdrive" och det aktiva dGPU-läget. Benchmarkresultaten är därför inte alltid direkt jämförbara.
| Prestanda | Overdrive | Balanserad | Tyst | Batteri | |
|---|---|---|---|---|---|
| Effektgräns 1 (HWInfo) | 157 watt | 165 watt | 157 watt | 50 watt | 55 watt |
| Effektgräns 2 (HWInfo) | 157 watt | 165 watt | 157 watt | 157 watt | 157 watt |
| Prestanda (Witcher 3) | 104fps | 104fps | 103fps | 102fps | 103fps |
| Buller (Witcher 3) | 51dB(A) | 58dB(A) | 49dB(A) | 43dB(A) | 47dB(A) |

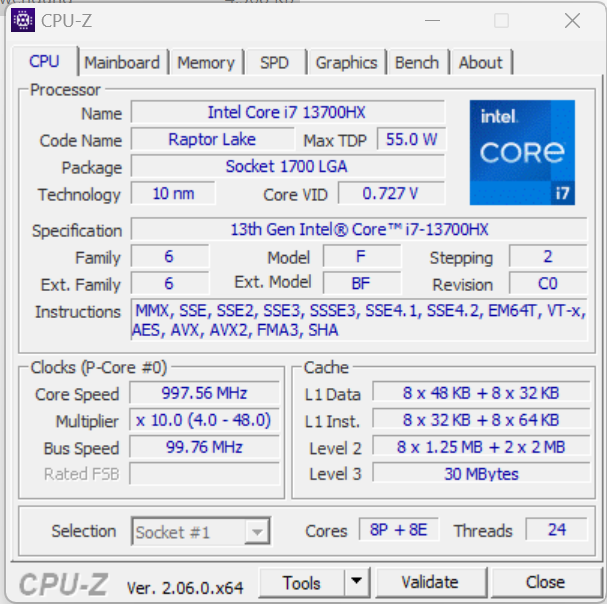
Processor
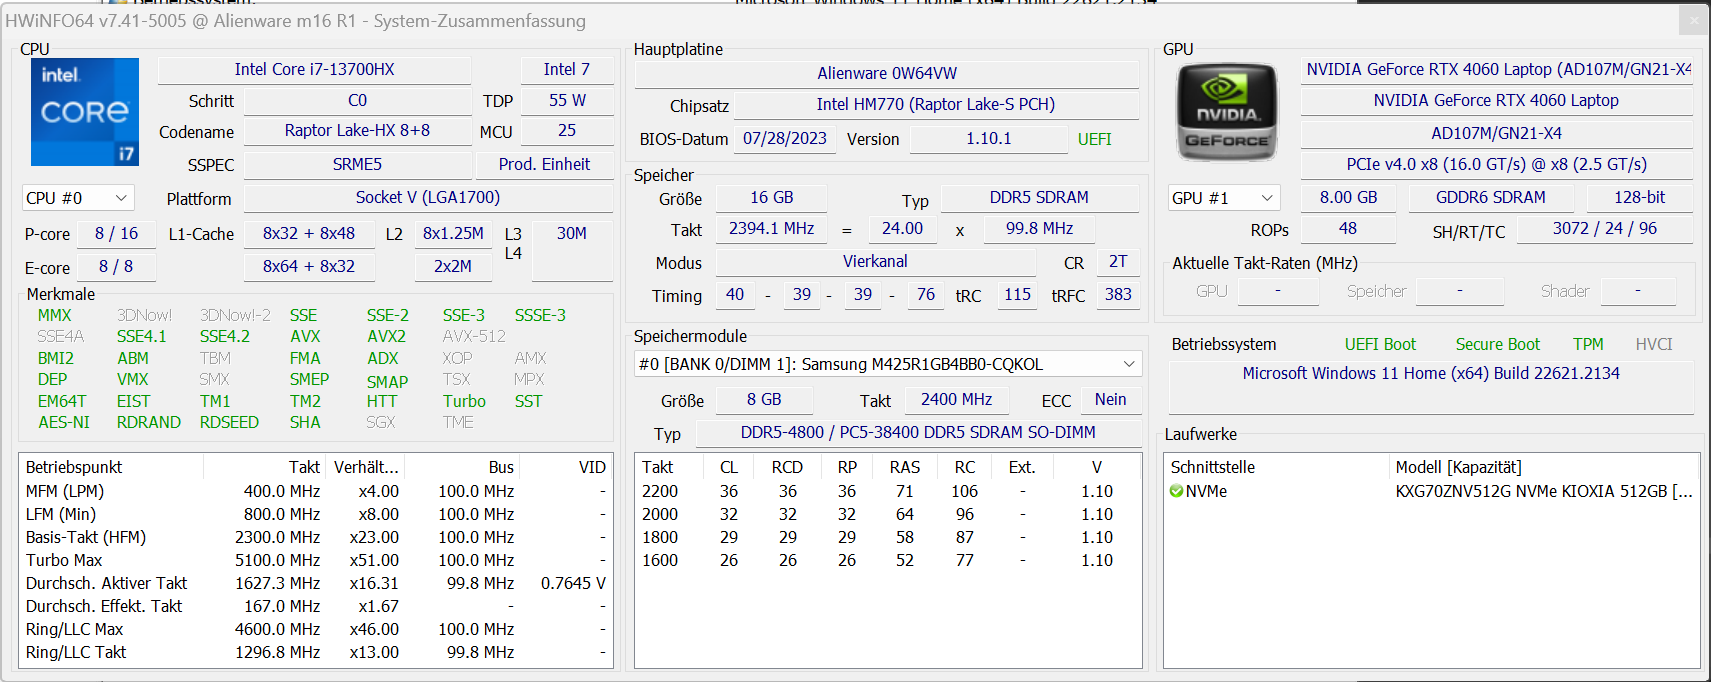
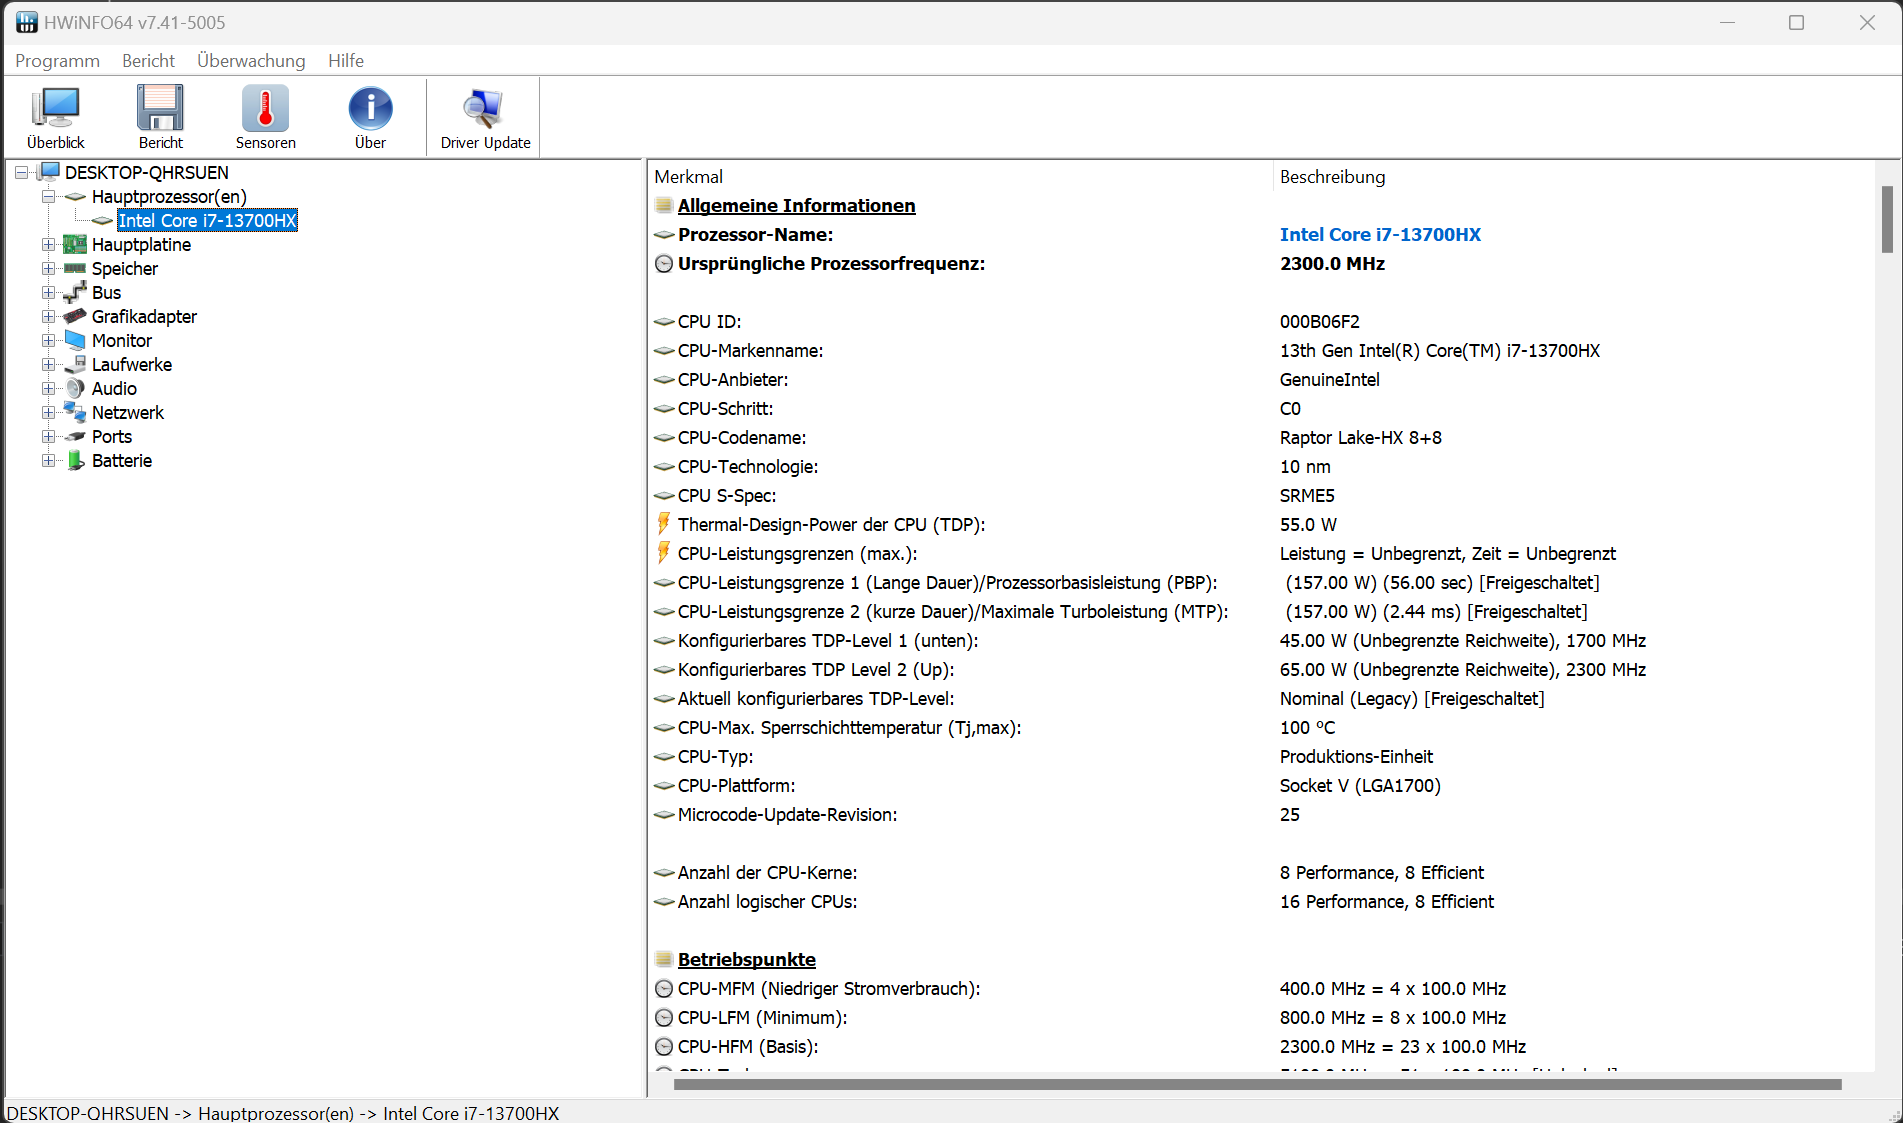
Core-i7-13700HX Core-i7-13700HX (Raptor Lake) består av åtta effektivitetskärnor (ingen hyperthreading, 1,5 till 3,7 GHz) och åtta prestandakärnor (hyperthreading, 2,1 till 5 GHz). Totalt finns det 24 logiska CPU-kärnor.
Benchmarkresultaten ligger över CPU-genomsnittet i nätdrift. I batteriläge sjunker den mer relevanta single-thread-prestandan (160 poäng) på ett liknande sätt som multi-thread-prestandan (2 134 poäng).
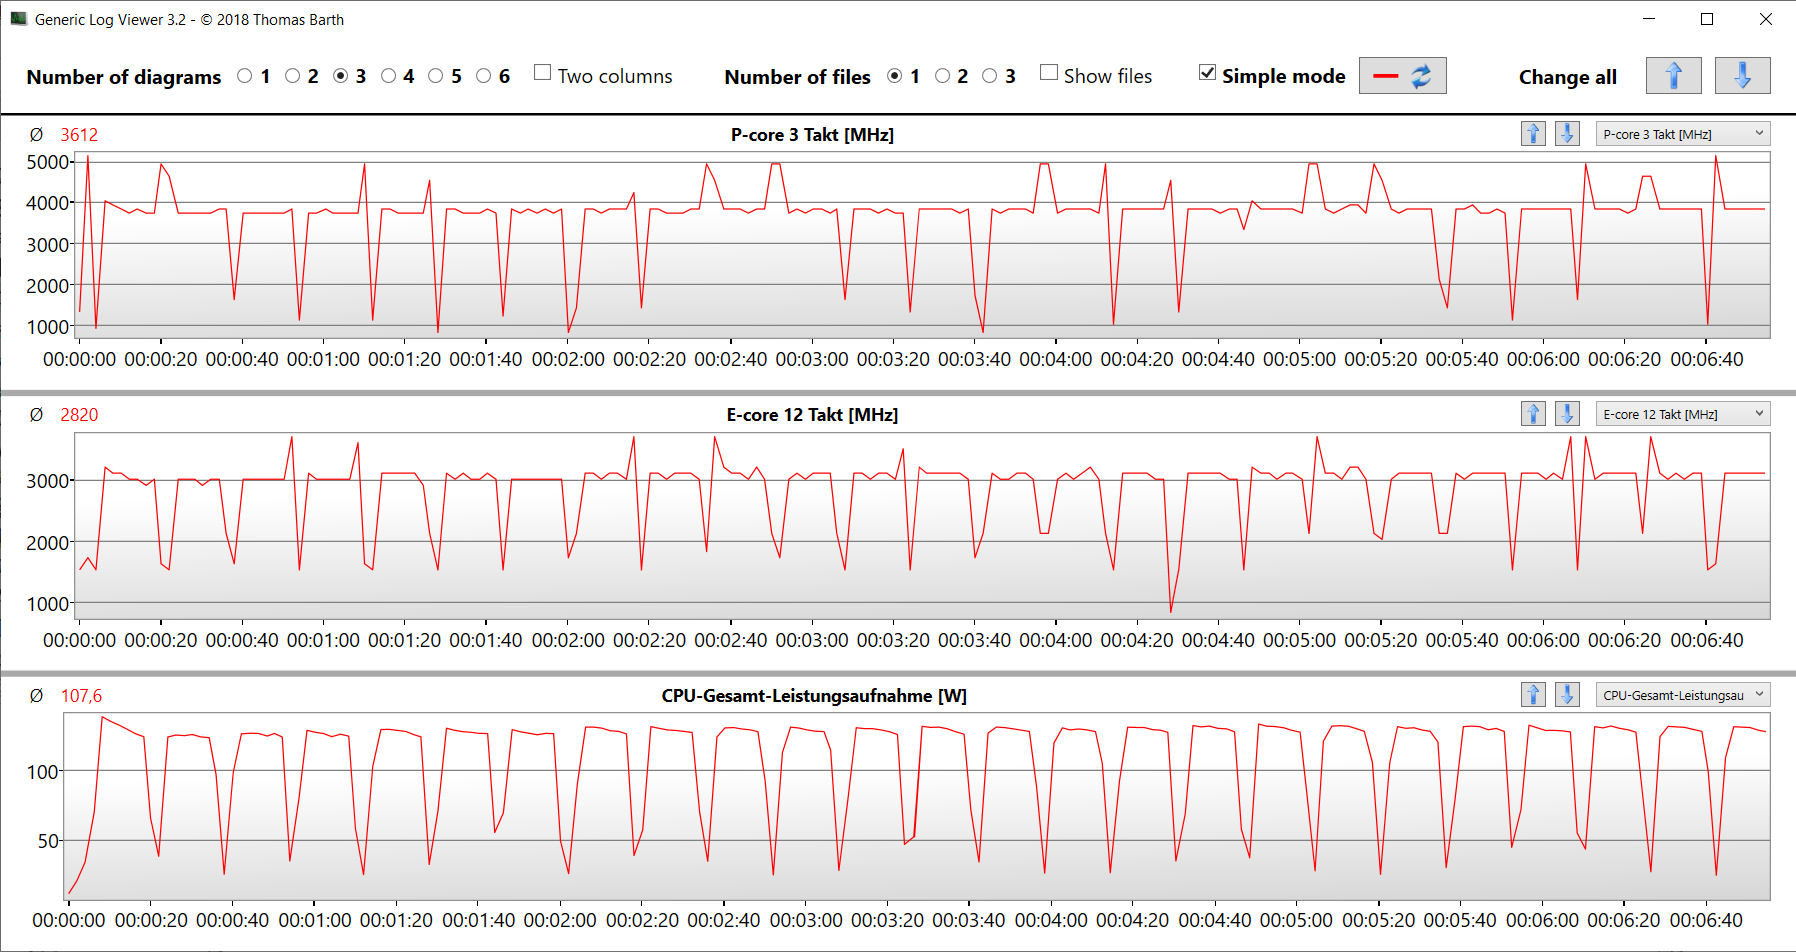
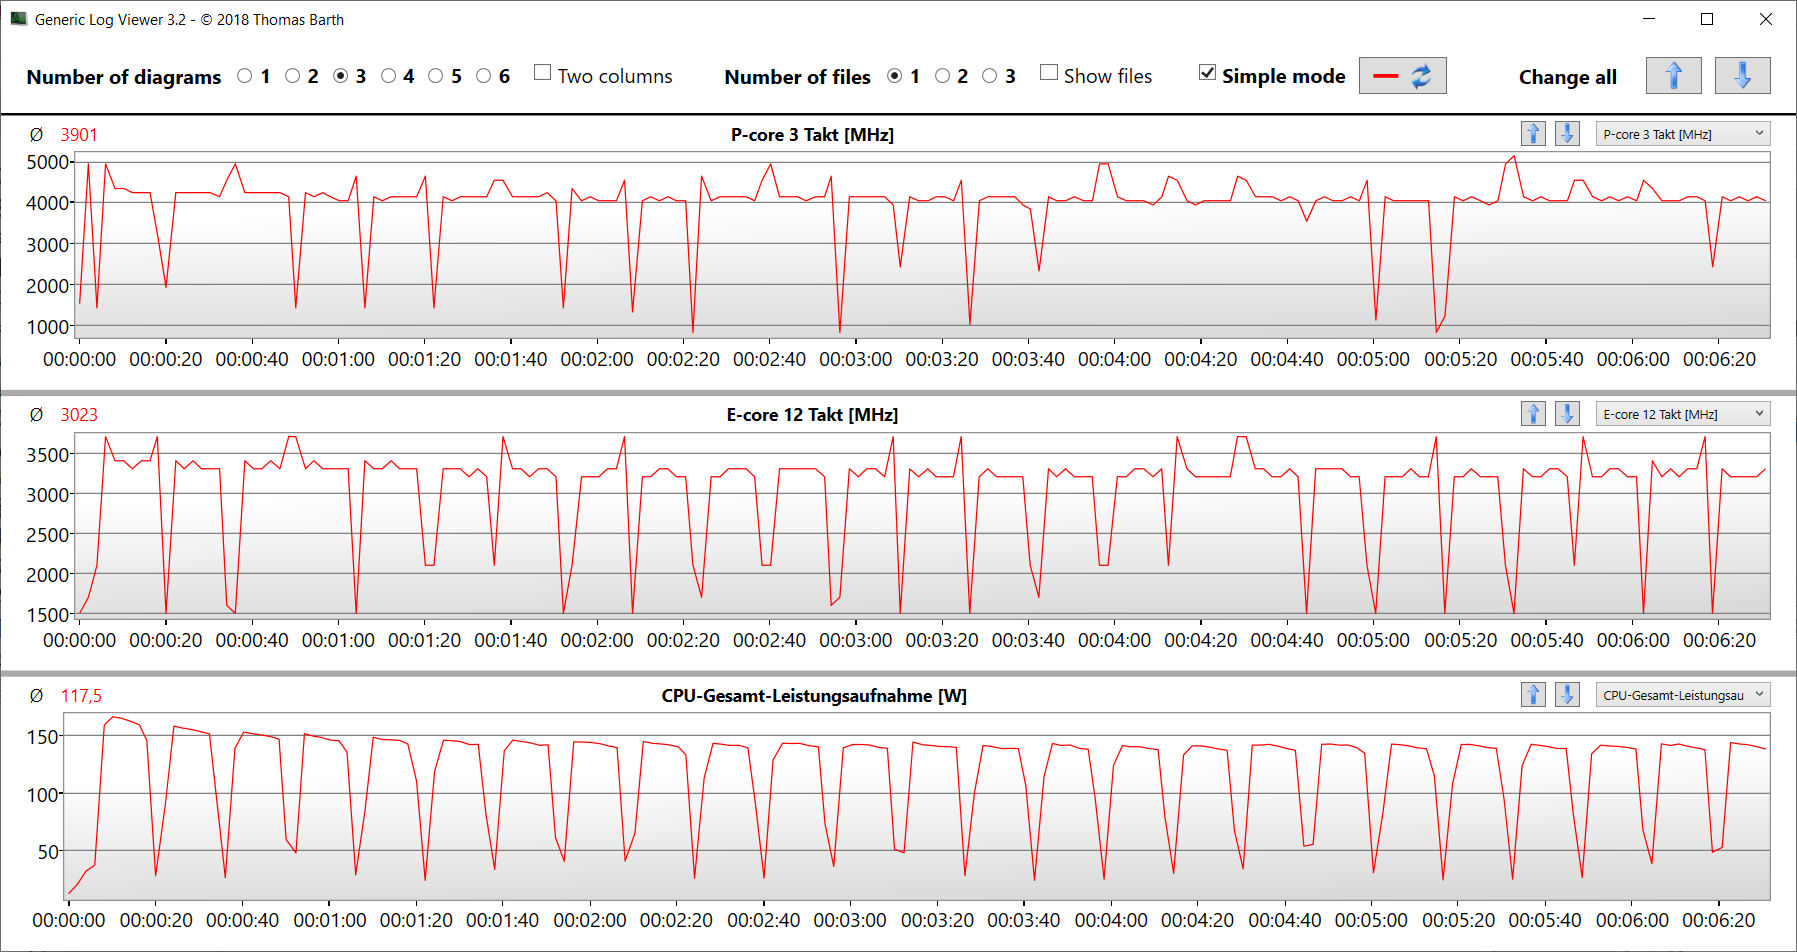
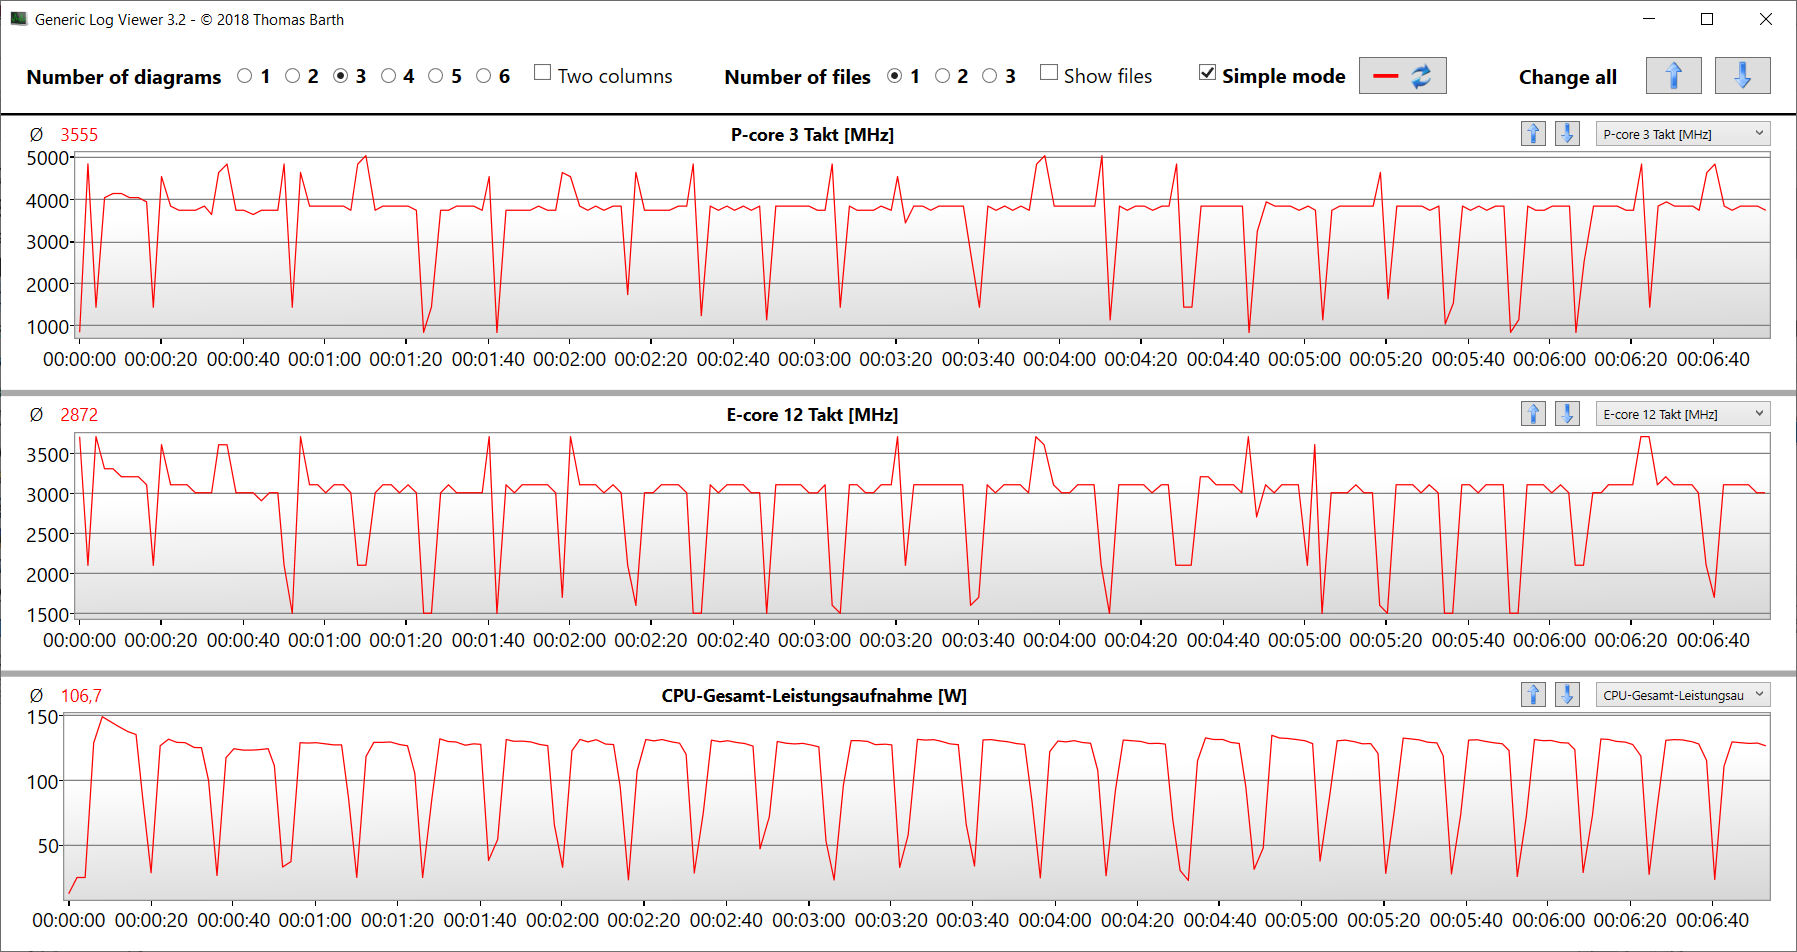
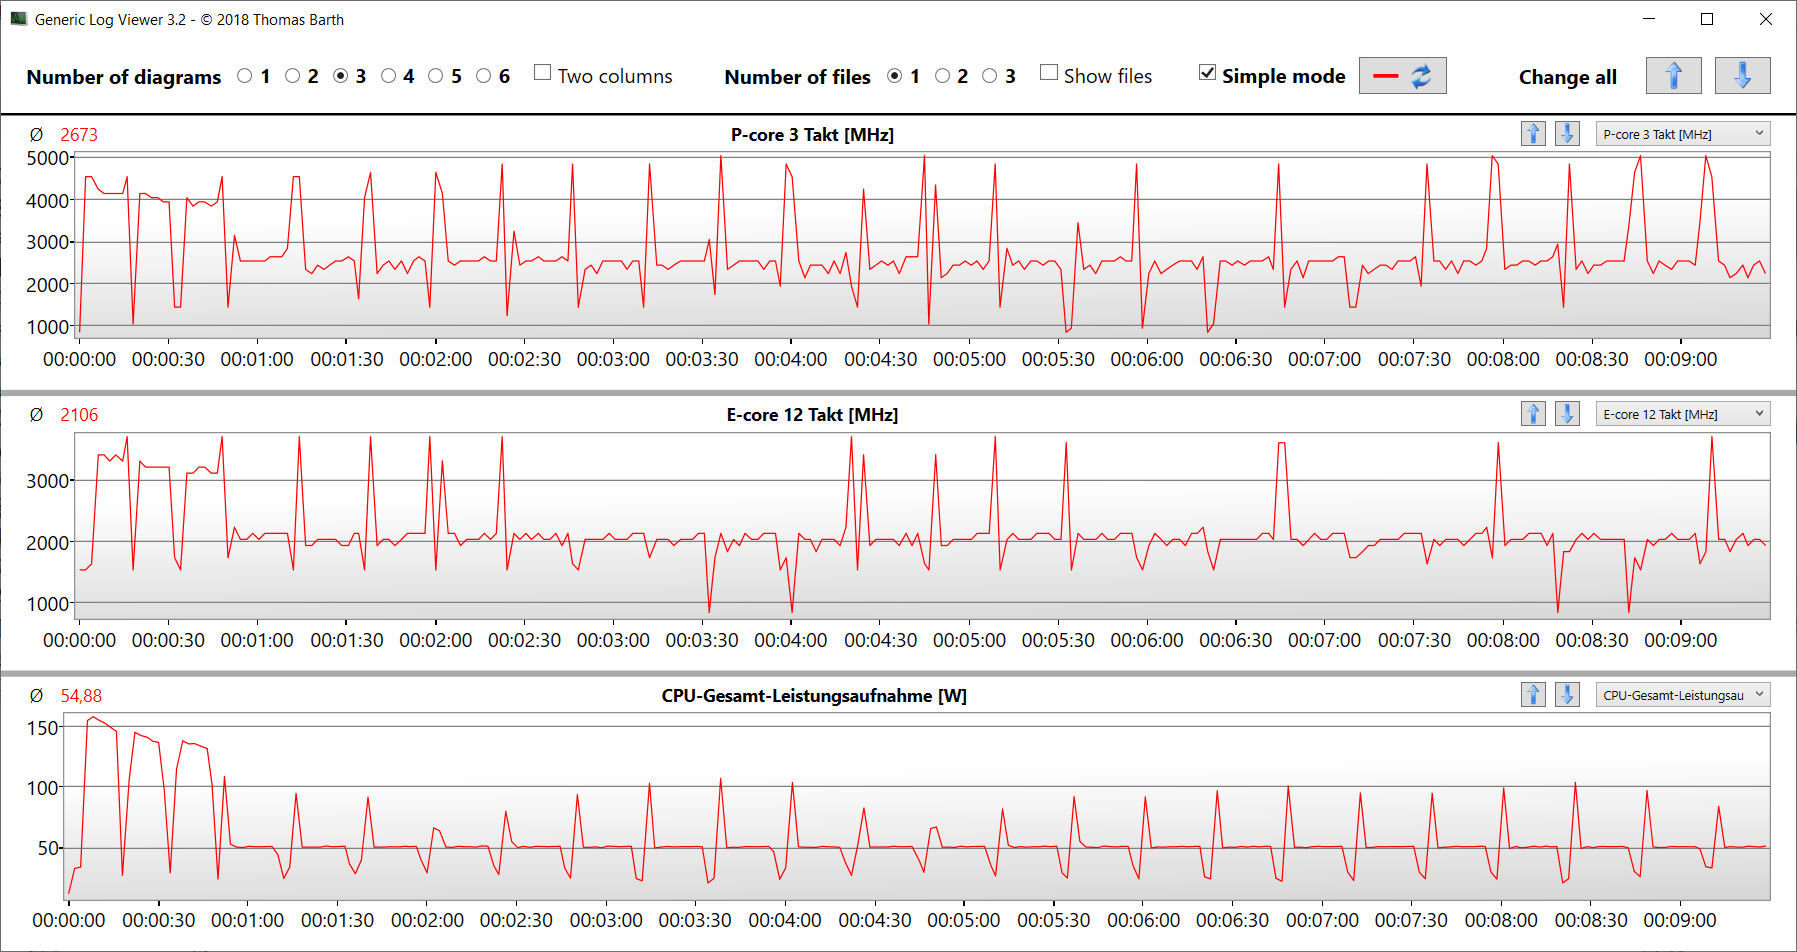
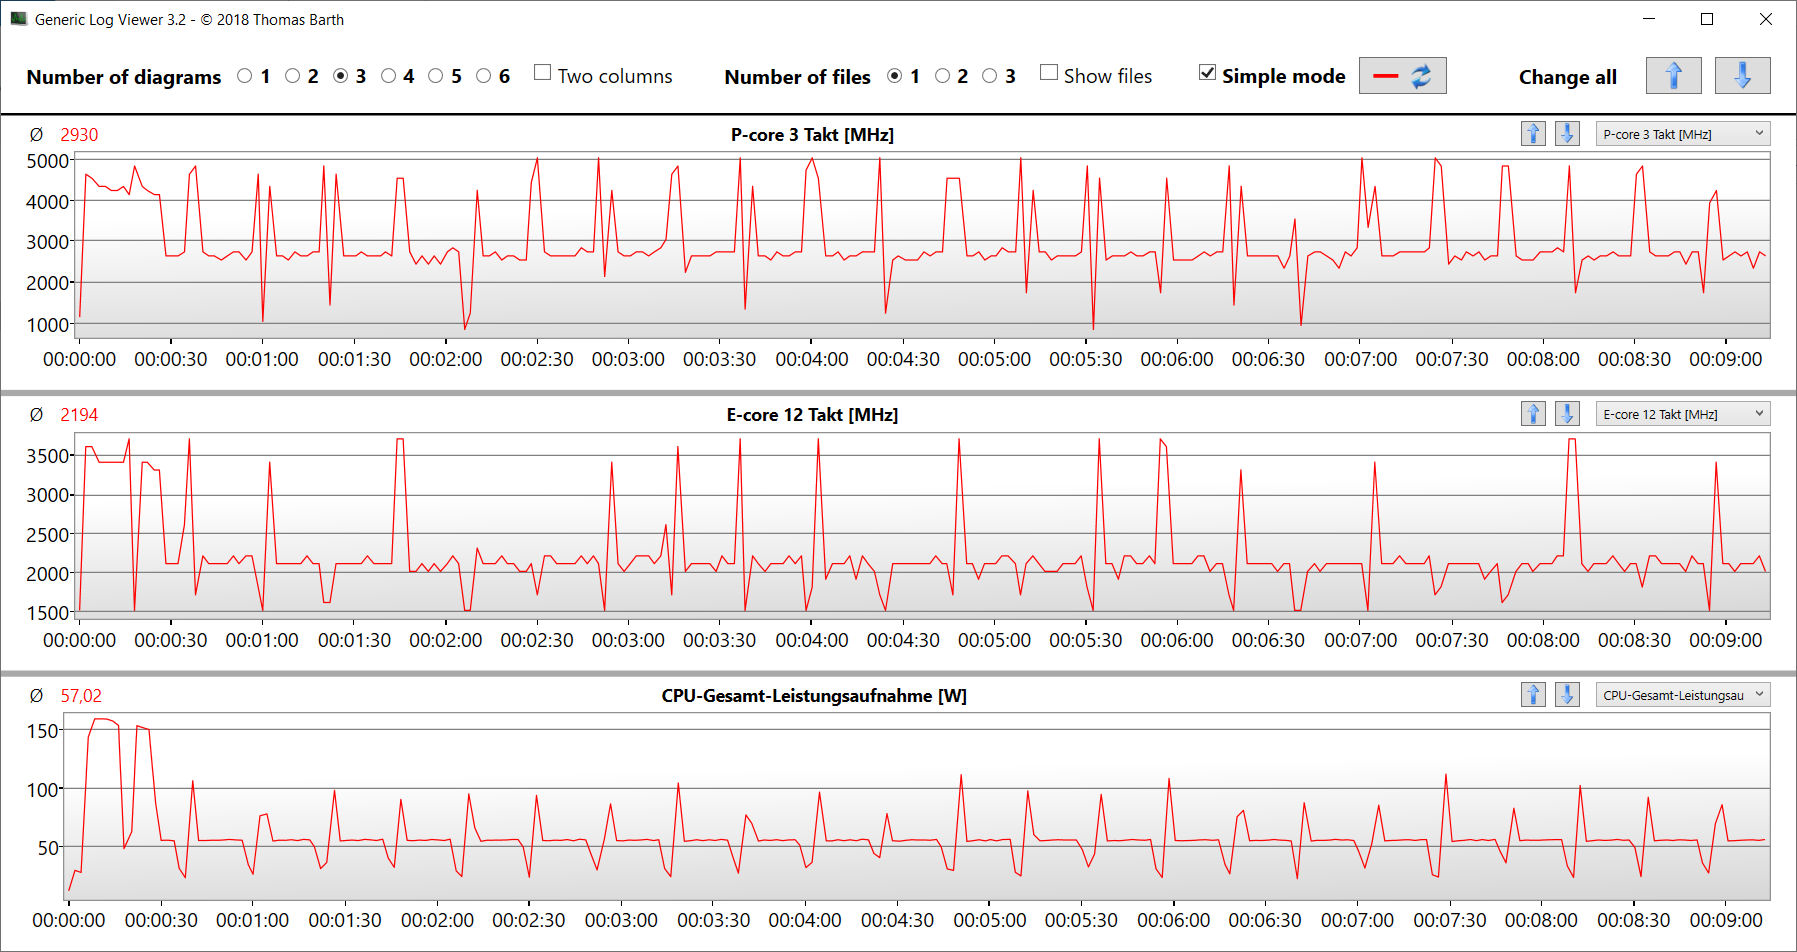
CB15-loop-testet bekräftar att CPU-turbo kan upprätthållas permanent. Klockfrekvensen sjunker dock något efter den första körningen, oavsett vilken profil som används. "Overdrive" säkerställer den högsta övergripande prestandanivån.
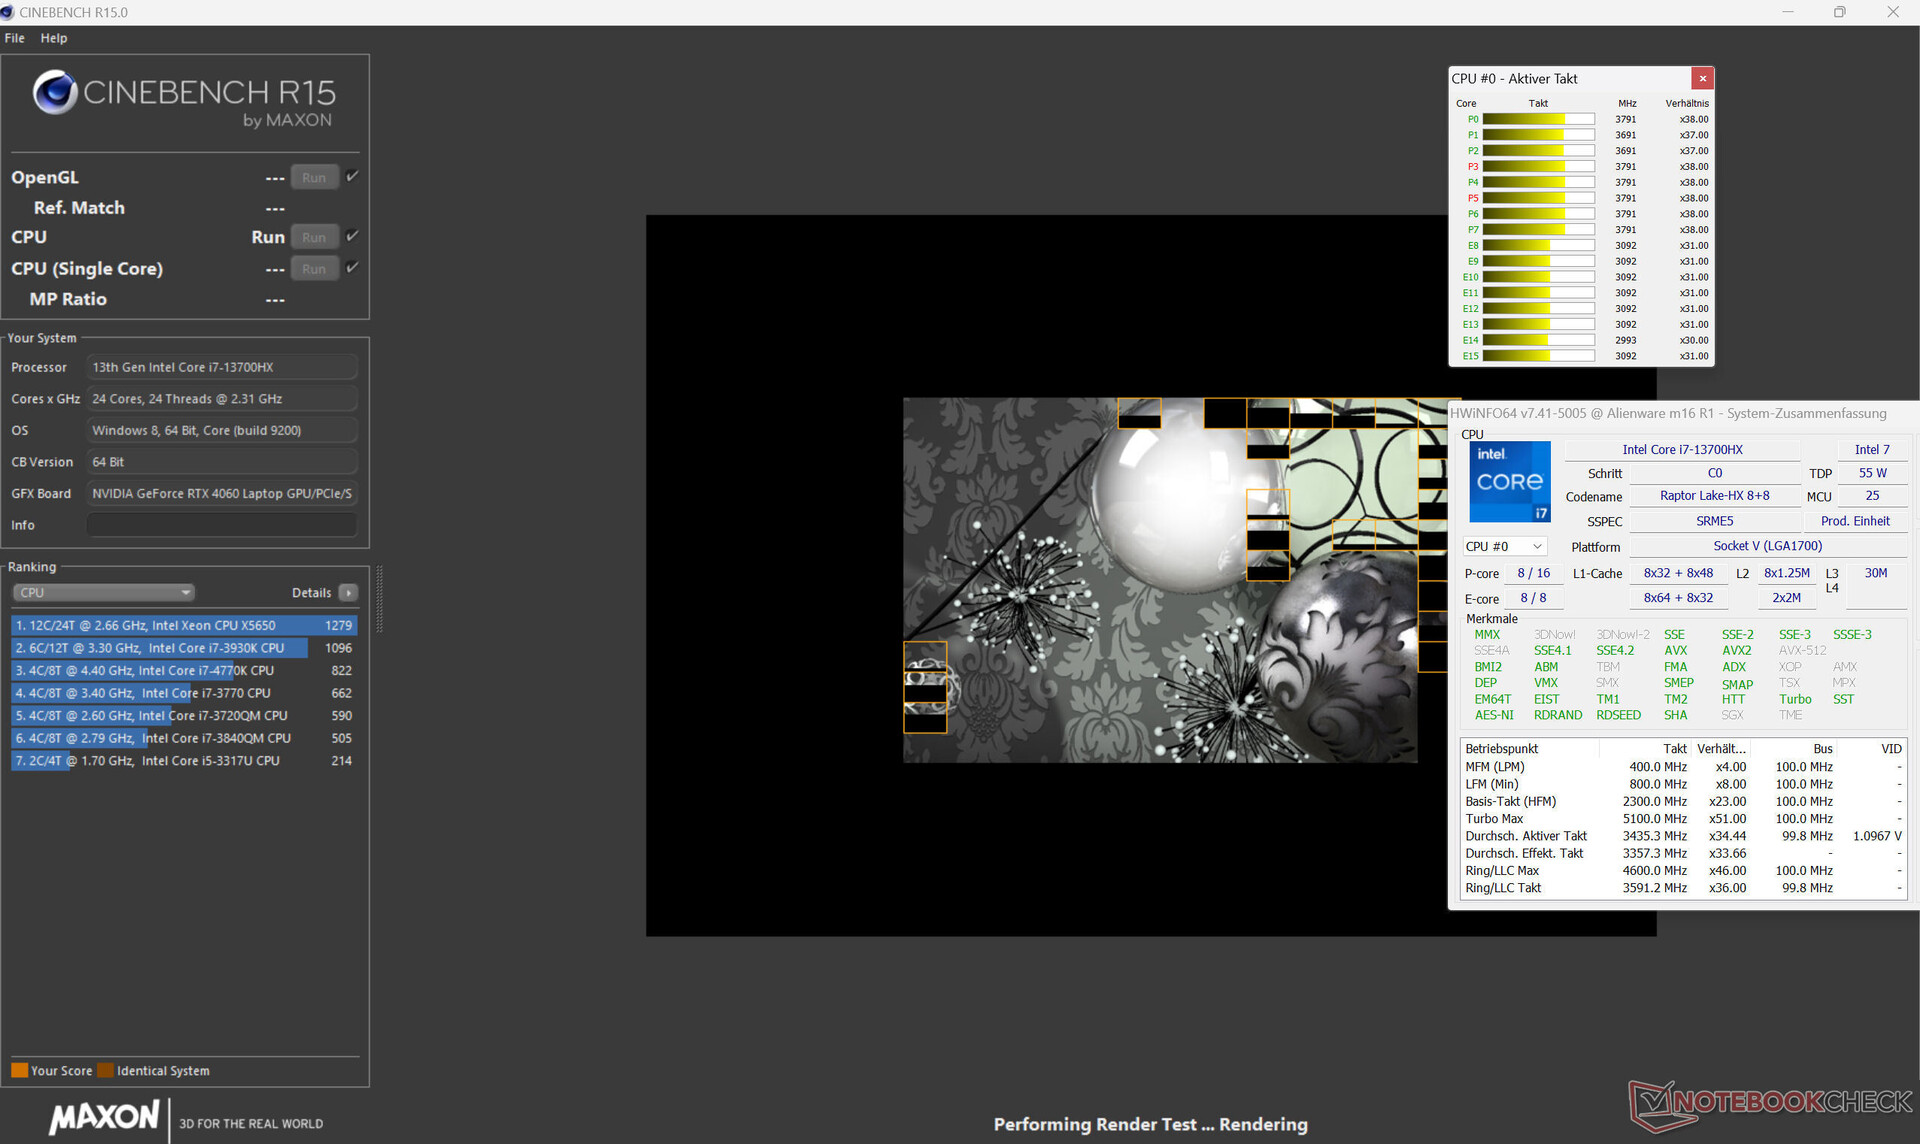
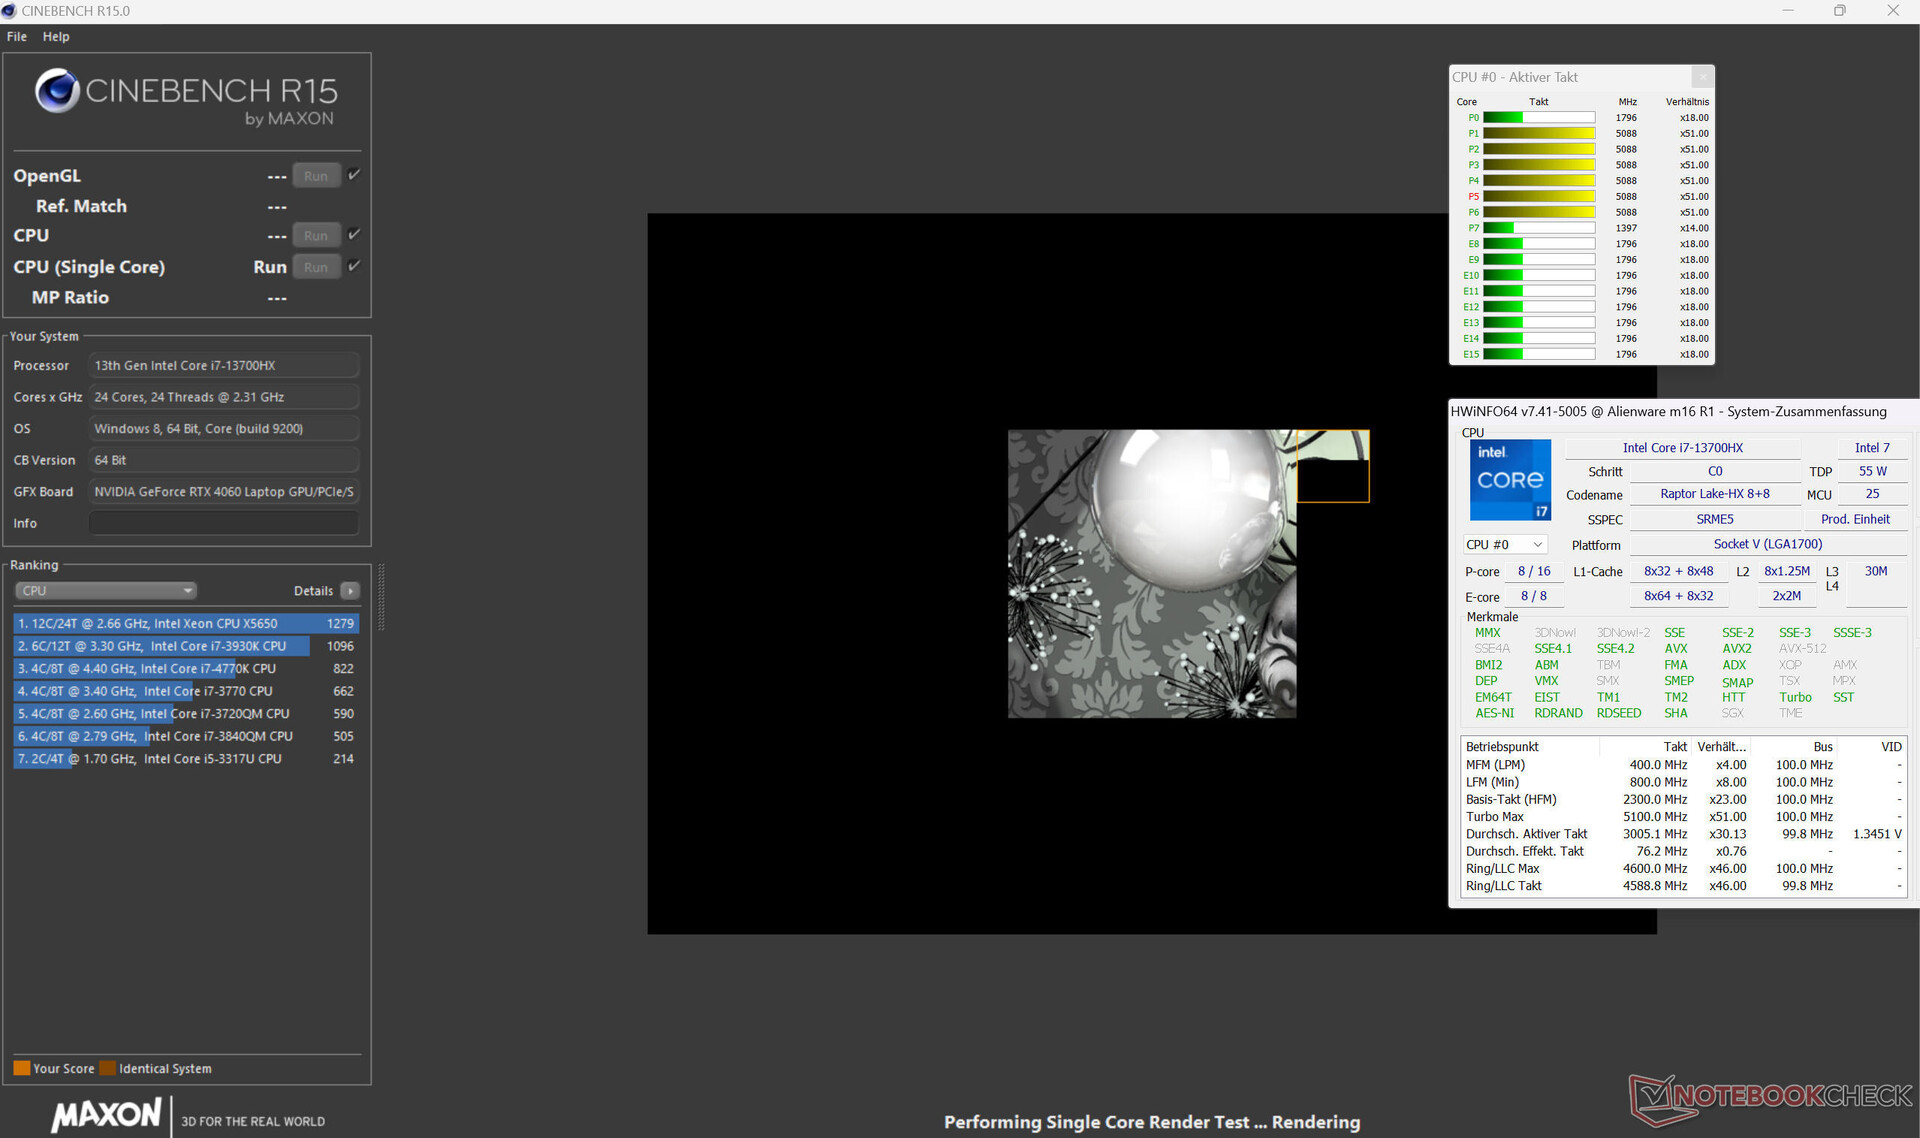
Cinebench R15 Multi Sustained Load
* ... mindre är bättre
AIDA64: FP32 Ray-Trace | FPU Julia | CPU SHA3 | CPU Queen | FPU SinJulia | FPU Mandel | CPU AES | CPU ZLib | FP64 Ray-Trace | CPU PhotoWorxx
| Performance rating | |
| Alienware m16 R1 AMD | |
| Genomsnitt av klass Gaming | |
| Alienware m16 R1 Intel | |
| Acer Predator Helios 16 PH16-71-731Q | |
| Schenker XMG Pro 15 (E23) | |
| Lenovo Legion Pro 5 16IRX8 | |
| Genomsnitt Intel Core i7-13700HX | |
| Medion Erazer Defender P40 | |
| Aorus 15 BSF | |
| AIDA64 / FP32 Ray-Trace | |
| Alienware m16 R1 AMD | |
| Genomsnitt av klass Gaming (10227 - 85542, n=110, senaste 2 åren) | |
| Lenovo Legion Pro 5 16IRX8 | |
| Alienware m16 R1 Intel | |
| Acer Predator Helios 16 PH16-71-731Q | |
| Genomsnitt Intel Core i7-13700HX (14261 - 21999, n=11) | |
| Schenker XMG Pro 15 (E23) | |
| Medion Erazer Defender P40 | |
| Aorus 15 BSF | |
| AIDA64 / FPU Julia | |
| Alienware m16 R1 AMD | |
| Genomsnitt av klass Gaming (51376 - 238426, n=110, senaste 2 åren) | |
| Lenovo Legion Pro 5 16IRX8 | |
| Alienware m16 R1 Intel | |
| Acer Predator Helios 16 PH16-71-731Q | |
| Genomsnitt Intel Core i7-13700HX (74636 - 109364, n=11) | |
| Schenker XMG Pro 15 (E23) | |
| Medion Erazer Defender P40 | |
| Aorus 15 BSF | |
| AIDA64 / CPU SHA3 | |
| Alienware m16 R1 AMD | |
| Genomsnitt av klass Gaming (2180 - 9817, n=110, senaste 2 åren) | |
| Alienware m16 R1 Intel | |
| Schenker XMG Pro 15 (E23) | |
| Lenovo Legion Pro 5 16IRX8 | |
| Acer Predator Helios 16 PH16-71-731Q | |
| Genomsnitt Intel Core i7-13700HX (3359 - 5053, n=11) | |
| Medion Erazer Defender P40 | |
| Aorus 15 BSF | |
| AIDA64 / CPU Queen | |
| Alienware m16 R1 AMD | |
| Schenker XMG Pro 15 (E23) | |
| Genomsnitt av klass Gaming (49785 - 173351, n=101, senaste 2 åren) | |
| Alienware m16 R1 Intel | |
| Acer Predator Helios 16 PH16-71-731Q | |
| Lenovo Legion Pro 5 16IRX8 | |
| Medion Erazer Defender P40 | |
| Genomsnitt Intel Core i7-13700HX (86532 - 114717, n=11) | |
| Aorus 15 BSF | |
| AIDA64 / FPU SinJulia | |
| Alienware m16 R1 AMD | |
| Genomsnitt av klass Gaming (4424 - 33636, n=110, senaste 2 åren) | |
| Alienware m16 R1 Intel | |
| Lenovo Legion Pro 5 16IRX8 | |
| Acer Predator Helios 16 PH16-71-731Q | |
| Schenker XMG Pro 15 (E23) | |
| Genomsnitt Intel Core i7-13700HX (9290 - 13519, n=11) | |
| Medion Erazer Defender P40 | |
| Aorus 15 BSF | |
| AIDA64 / FPU Mandel | |
| Alienware m16 R1 AMD | |
| Genomsnitt av klass Gaming (25115 - 128721, n=110, senaste 2 åren) | |
| Lenovo Legion Pro 5 16IRX8 | |
| Alienware m16 R1 Intel | |
| Acer Predator Helios 16 PH16-71-731Q | |
| Genomsnitt Intel Core i7-13700HX (35751 - 53484, n=11) | |
| Schenker XMG Pro 15 (E23) | |
| Medion Erazer Defender P40 | |
| Aorus 15 BSF | |
| AIDA64 / CPU AES | |
| Alienware m16 R1 Intel | |
| Acer Predator Helios 16 PH16-71-731Q | |
| Aorus 15 BSF | |
| Genomsnitt Intel Core i7-13700HX (67846 - 182575, n=11) | |
| Alienware m16 R1 AMD | |
| Genomsnitt av klass Gaming (39258 - 247074, n=110, senaste 2 åren) | |
| Lenovo Legion Pro 5 16IRX8 | |
| Schenker XMG Pro 15 (E23) | |
| Medion Erazer Defender P40 | |
| AIDA64 / CPU ZLib | |
| Alienware m16 R1 AMD | |
| Genomsnitt av klass Gaming (574 - 2531, n=110, senaste 2 åren) | |
| Acer Predator Helios 16 PH16-71-731Q | |
| Schenker XMG Pro 15 (E23) | |
| Alienware m16 R1 Intel | |
| Lenovo Legion Pro 5 16IRX8 | |
| Genomsnitt Intel Core i7-13700HX (981 - 1451, n=11) | |
| Medion Erazer Defender P40 | |
| Aorus 15 BSF | |
| AIDA64 / FP64 Ray-Trace | |
| Alienware m16 R1 AMD | |
| Genomsnitt av klass Gaming (5509 - 45446, n=110, senaste 2 åren) | |
| Lenovo Legion Pro 5 16IRX8 | |
| Alienware m16 R1 Intel | |
| Acer Predator Helios 16 PH16-71-731Q | |
| Genomsnitt Intel Core i7-13700HX (7728 - 11837, n=11) | |
| Schenker XMG Pro 15 (E23) | |
| Medion Erazer Defender P40 | |
| Aorus 15 BSF | |
| AIDA64 / CPU PhotoWorxx | |
| Schenker XMG Pro 15 (E23) | |
| Genomsnitt av klass Gaming (12271 - 89891, n=110, senaste 2 åren) | |
| Aorus 15 BSF | |
| Lenovo Legion Pro 5 16IRX8 | |
| Medion Erazer Defender P40 | |
| Alienware m16 R1 Intel | |
| Acer Predator Helios 16 PH16-71-731Q | |
| Genomsnitt Intel Core i7-13700HX (19678 - 42415, n=11) | |
| Alienware m16 R1 AMD | |
Systemets prestanda
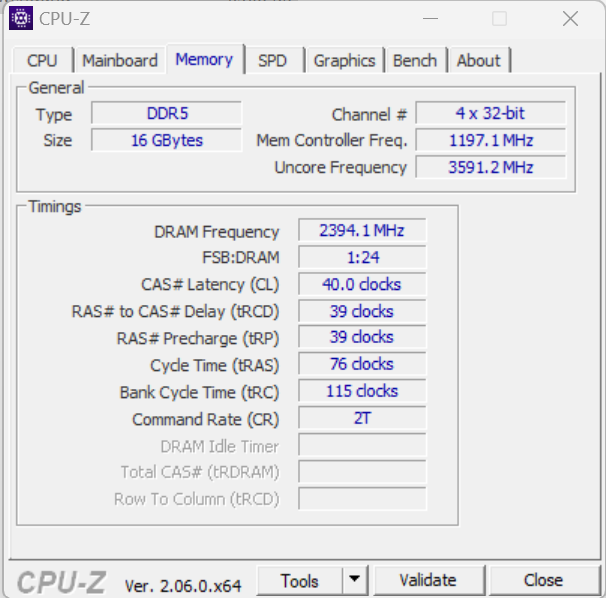
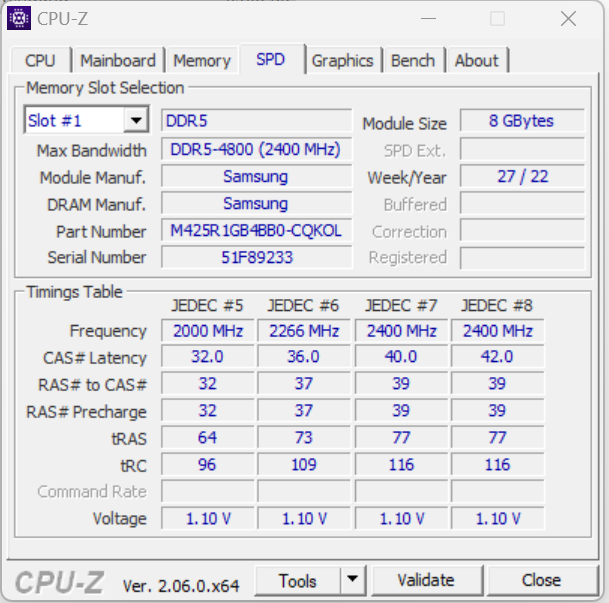
Det smidiga systemet visar ingen brist på datorkraft. Den bärbara datorn hanterar rendering, videoredigering och spel utan problem. RAM-minnets överföringshastigheter ligger på en normal nivå för DDR5-4800-minne.
CrossMark: Overall | Productivity | Creativity | Responsiveness
| PCMark 10 / Score | |
| Alienware m16 R1 AMD | |
| Genomsnitt av klass Gaming (5828 - 11574, n=96, senaste 2 åren) | |
| Acer Predator Helios 16 PH16-71-731Q | |
| Lenovo Legion Pro 5 16IRX8 | |
| Schenker XMG Pro 15 (E23) | |
| Genomsnitt Intel Core i7-13700HX, NVIDIA GeForce RTX 4060 Laptop GPU (6909 - 7743, n=5) | |
| Aorus 15 BSF | |
| Alienware m16 R1 Intel | |
| Medion Erazer Defender P40 | |
| PCMark 10 / Essentials | |
| Alienware m16 R1 AMD | |
| Schenker XMG Pro 15 (E23) | |
| Acer Predator Helios 16 PH16-71-731Q | |
| Lenovo Legion Pro 5 16IRX8 | |
| Aorus 15 BSF | |
| Alienware m16 R1 Intel | |
| Genomsnitt Intel Core i7-13700HX, NVIDIA GeForce RTX 4060 Laptop GPU (9760 - 11313, n=5) | |
| Genomsnitt av klass Gaming (8810 - 12600, n=100, senaste 2 åren) | |
| Medion Erazer Defender P40 | |
| PCMark 10 / Productivity | |
| Acer Predator Helios 16 PH16-71-731Q | |
| Genomsnitt av klass Gaming (6845 - 18766, n=98, senaste 2 åren) | |
| Schenker XMG Pro 15 (E23) | |
| Alienware m16 R1 AMD | |
| Medion Erazer Defender P40 | |
| Genomsnitt Intel Core i7-13700HX, NVIDIA GeForce RTX 4060 Laptop GPU (9131 - 11018, n=5) | |
| Alienware m16 R1 Intel | |
| Lenovo Legion Pro 5 16IRX8 | |
| Aorus 15 BSF | |
| PCMark 10 / Digital Content Creation | |
| Alienware m16 R1 AMD | |
| Genomsnitt av klass Gaming (7602 - 19657, n=98, senaste 2 åren) | |
| Lenovo Legion Pro 5 16IRX8 | |
| Genomsnitt Intel Core i7-13700HX, NVIDIA GeForce RTX 4060 Laptop GPU (9393 - 12434, n=5) | |
| Aorus 15 BSF | |
| Acer Predator Helios 16 PH16-71-731Q | |
| Alienware m16 R1 Intel | |
| Schenker XMG Pro 15 (E23) | |
| Medion Erazer Defender P40 | |
| CrossMark / Overall | |
| Acer Predator Helios 16 PH16-71-731Q | |
| Aorus 15 BSF | |
| Alienware m16 R1 Intel | |
| Alienware m16 R1 AMD | |
| Genomsnitt av klass Gaming (1366 - 2409, n=98, senaste 2 åren) | |
| Schenker XMG Pro 15 (E23) | |
| Genomsnitt Intel Core i7-13700HX, NVIDIA GeForce RTX 4060 Laptop GPU (1663 - 2105, n=5) | |
| Medion Erazer Defender P40 | |
| Lenovo Legion Pro 5 16IRX8 | |
| CrossMark / Productivity | |
| Aorus 15 BSF | |
| Acer Predator Helios 16 PH16-71-731Q | |
| Alienware m16 R1 Intel | |
| Alienware m16 R1 AMD | |
| Genomsnitt av klass Gaming (1386 - 2254, n=98, senaste 2 åren) | |
| Schenker XMG Pro 15 (E23) | |
| Genomsnitt Intel Core i7-13700HX, NVIDIA GeForce RTX 4060 Laptop GPU (1618 - 1989, n=5) | |
| Medion Erazer Defender P40 | |
| Lenovo Legion Pro 5 16IRX8 | |
| CrossMark / Creativity | |
| Acer Predator Helios 16 PH16-71-731Q | |
| Alienware m16 R1 Intel | |
| Genomsnitt av klass Gaming (1343 - 2729, n=98, senaste 2 åren) | |
| Schenker XMG Pro 15 (E23) | |
| Alienware m16 R1 AMD | |
| Aorus 15 BSF | |
| Genomsnitt Intel Core i7-13700HX, NVIDIA GeForce RTX 4060 Laptop GPU (1710 - 2274, n=5) | |
| Medion Erazer Defender P40 | |
| Lenovo Legion Pro 5 16IRX8 | |
| CrossMark / Responsiveness | |
| Aorus 15 BSF | |
| Acer Predator Helios 16 PH16-71-731Q | |
| Alienware m16 R1 Intel | |
| Schenker XMG Pro 15 (E23) | |
| Alienware m16 R1 AMD | |
| Genomsnitt av klass Gaming (1226 - 2334, n=98, senaste 2 åren) | |
| Genomsnitt Intel Core i7-13700HX, NVIDIA GeForce RTX 4060 Laptop GPU (1269 - 1983, n=5) | |
| Lenovo Legion Pro 5 16IRX8 | |
| Medion Erazer Defender P40 | |
| PCMark 10 Score | 7224 poäng | |
Hjälp | ||
| AIDA64 / Memory Copy | |
| Schenker XMG Pro 15 (E23) | |
| Genomsnitt av klass Gaming (21750 - 129946, n=110, senaste 2 åren) | |
| Aorus 15 BSF | |
| Lenovo Legion Pro 5 16IRX8 | |
| Medion Erazer Defender P40 | |
| Alienware m16 R1 Intel | |
| Acer Predator Helios 16 PH16-71-731Q | |
| Genomsnitt Intel Core i7-13700HX (36125 - 63990, n=11) | |
| Alienware m16 R1 AMD | |
| AIDA64 / Memory Read | |
| Schenker XMG Pro 15 (E23) | |
| Genomsnitt av klass Gaming (22956 - 118858, n=110, senaste 2 åren) | |
| Aorus 15 BSF | |
| Lenovo Legion Pro 5 16IRX8 | |
| Medion Erazer Defender P40 | |
| Alienware m16 R1 Intel | |
| Acer Predator Helios 16 PH16-71-731Q | |
| Genomsnitt Intel Core i7-13700HX (36510 - 69729, n=11) | |
| Alienware m16 R1 AMD | |
| AIDA64 / Memory Write | |
| Aorus 15 BSF | |
| Acer Predator Helios 16 PH16-71-731Q | |
| Genomsnitt av klass Gaming (22297 - 135096, n=110, senaste 2 åren) | |
| Schenker XMG Pro 15 (E23) | |
| Lenovo Legion Pro 5 16IRX8 | |
| Genomsnitt Intel Core i7-13700HX (33598 - 85675, n=11) | |
| Alienware m16 R1 Intel | |
| Medion Erazer Defender P40 | |
| Alienware m16 R1 AMD | |
| AIDA64 / Memory Latency | |
| Genomsnitt av klass Gaming (75.3 - 259, n=110, senaste 2 åren) | |
| Medion Erazer Defender P40 | |
| Aorus 15 BSF | |
| Alienware m16 R1 AMD | |
| Alienware m16 R1 Intel | |
| Genomsnitt Intel Core i7-13700HX (81.5 - 97.9, n=11) | |
| Acer Predator Helios 16 PH16-71-731Q | |
| Schenker XMG Pro 15 (E23) | |
| Lenovo Legion Pro 5 16IRX8 | |
* ... mindre är bättre
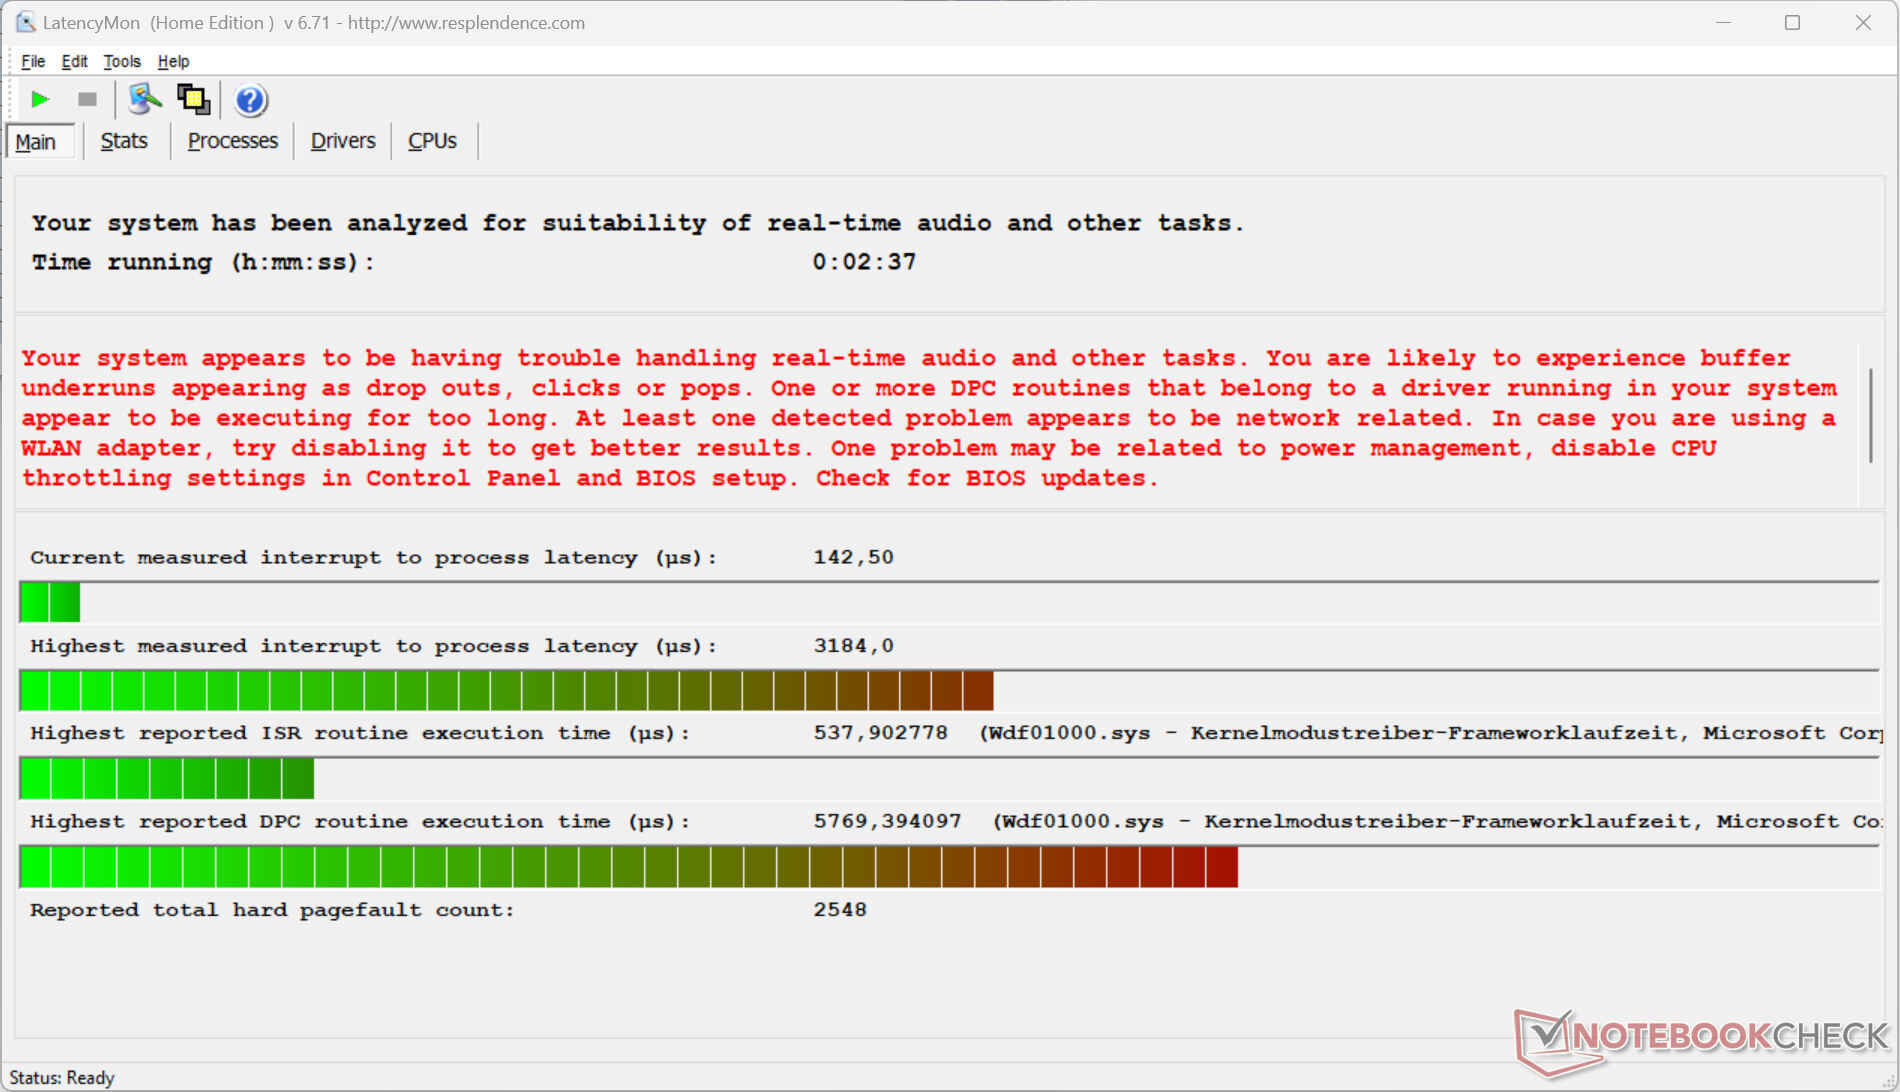
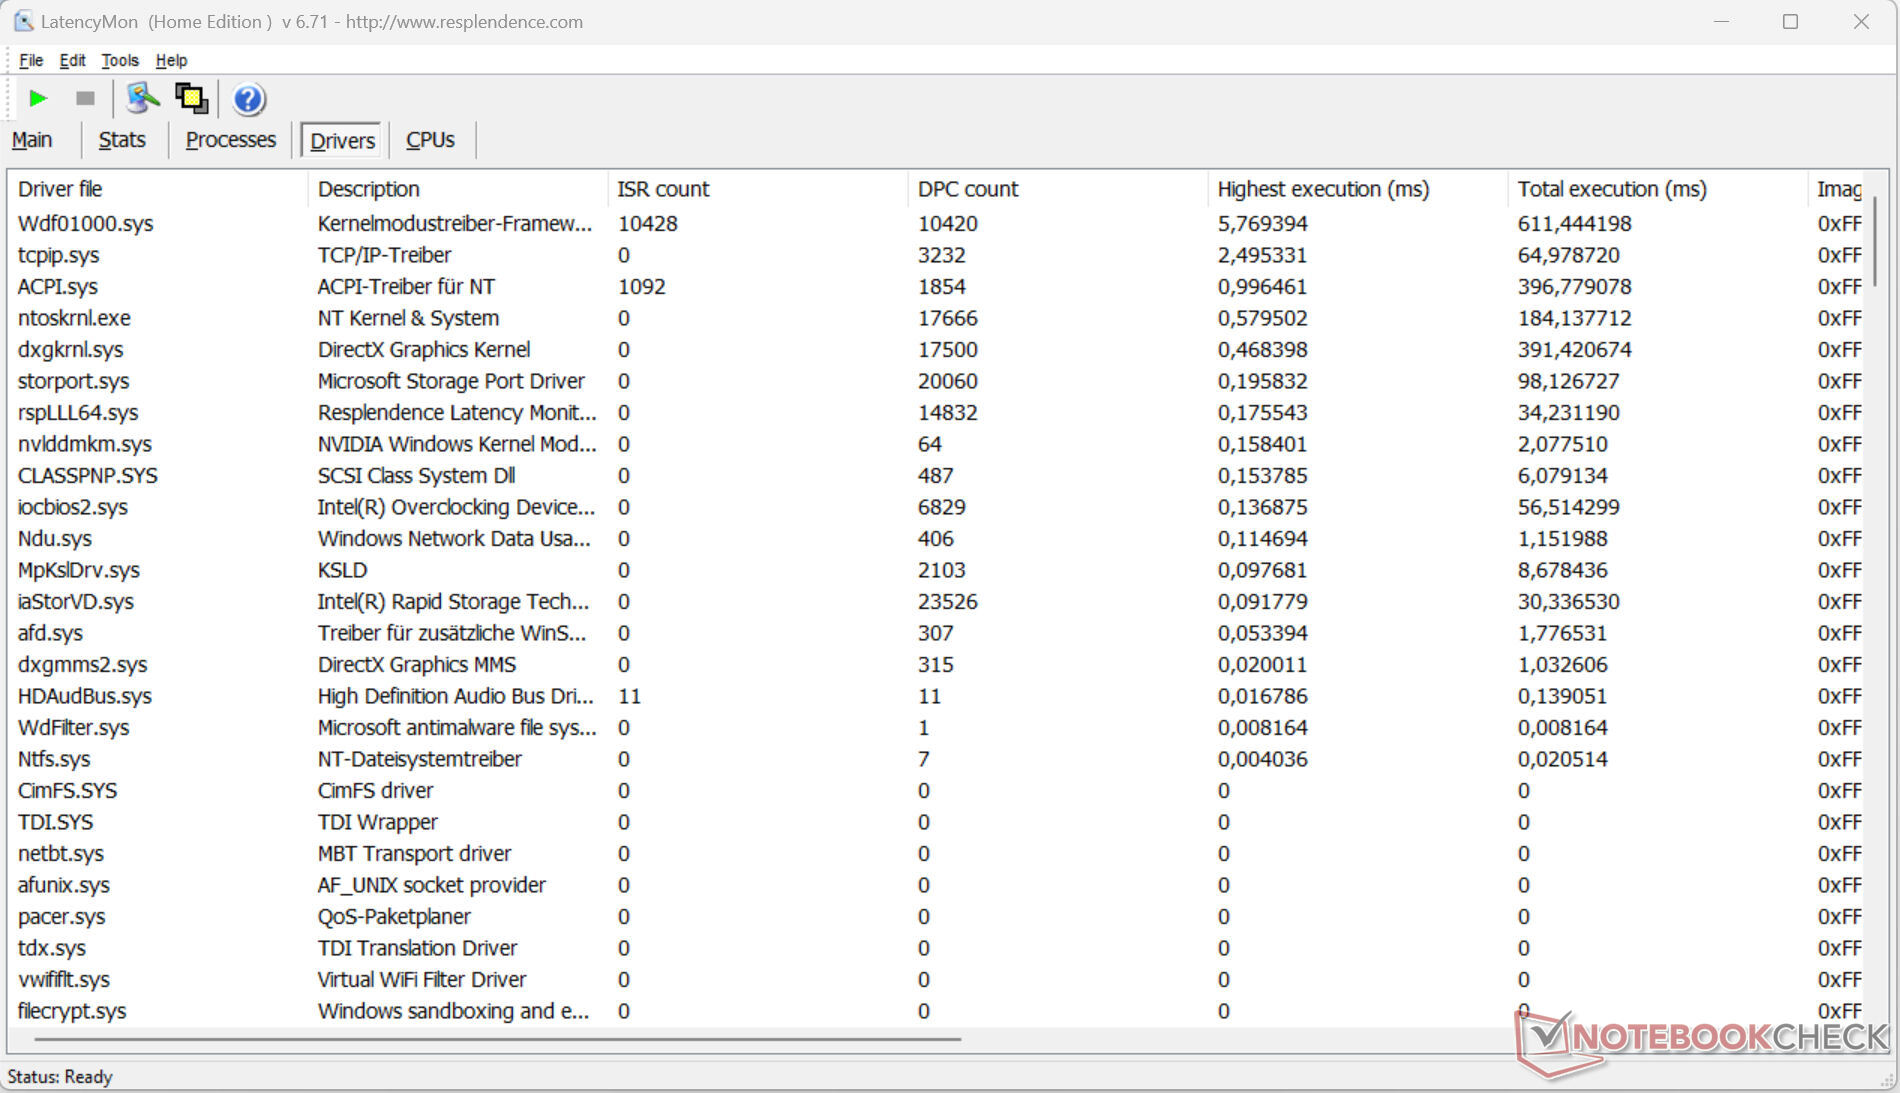
DPC-fördröjning
Det standardiserade latency monitor-testet (webbsurfning, uppspelning av 4k-video, Prime95 hög belastning) avslöjade avvikelser. Systemet verkar inte vara lämpligt för video- och ljudredigering i realtid. Framtida programuppdateringar kan leda till förbättringar eller ytterligare försämringar.
| DPC Latencies / LatencyMon - interrupt to process latency (max), Web, Youtube, Prime95 | |
| Medion Erazer Defender P40 | |
| Alienware m16 R1 Intel | |
| Alienware m16 R1 AMD | |
| Aorus 15 BSF | |
| Acer Predator Helios 16 PH16-71-731Q | |
| Schenker XMG Pro 15 (E23) | |
| Lenovo Legion Pro 5 16IRX8 | |
* ... mindre är bättre
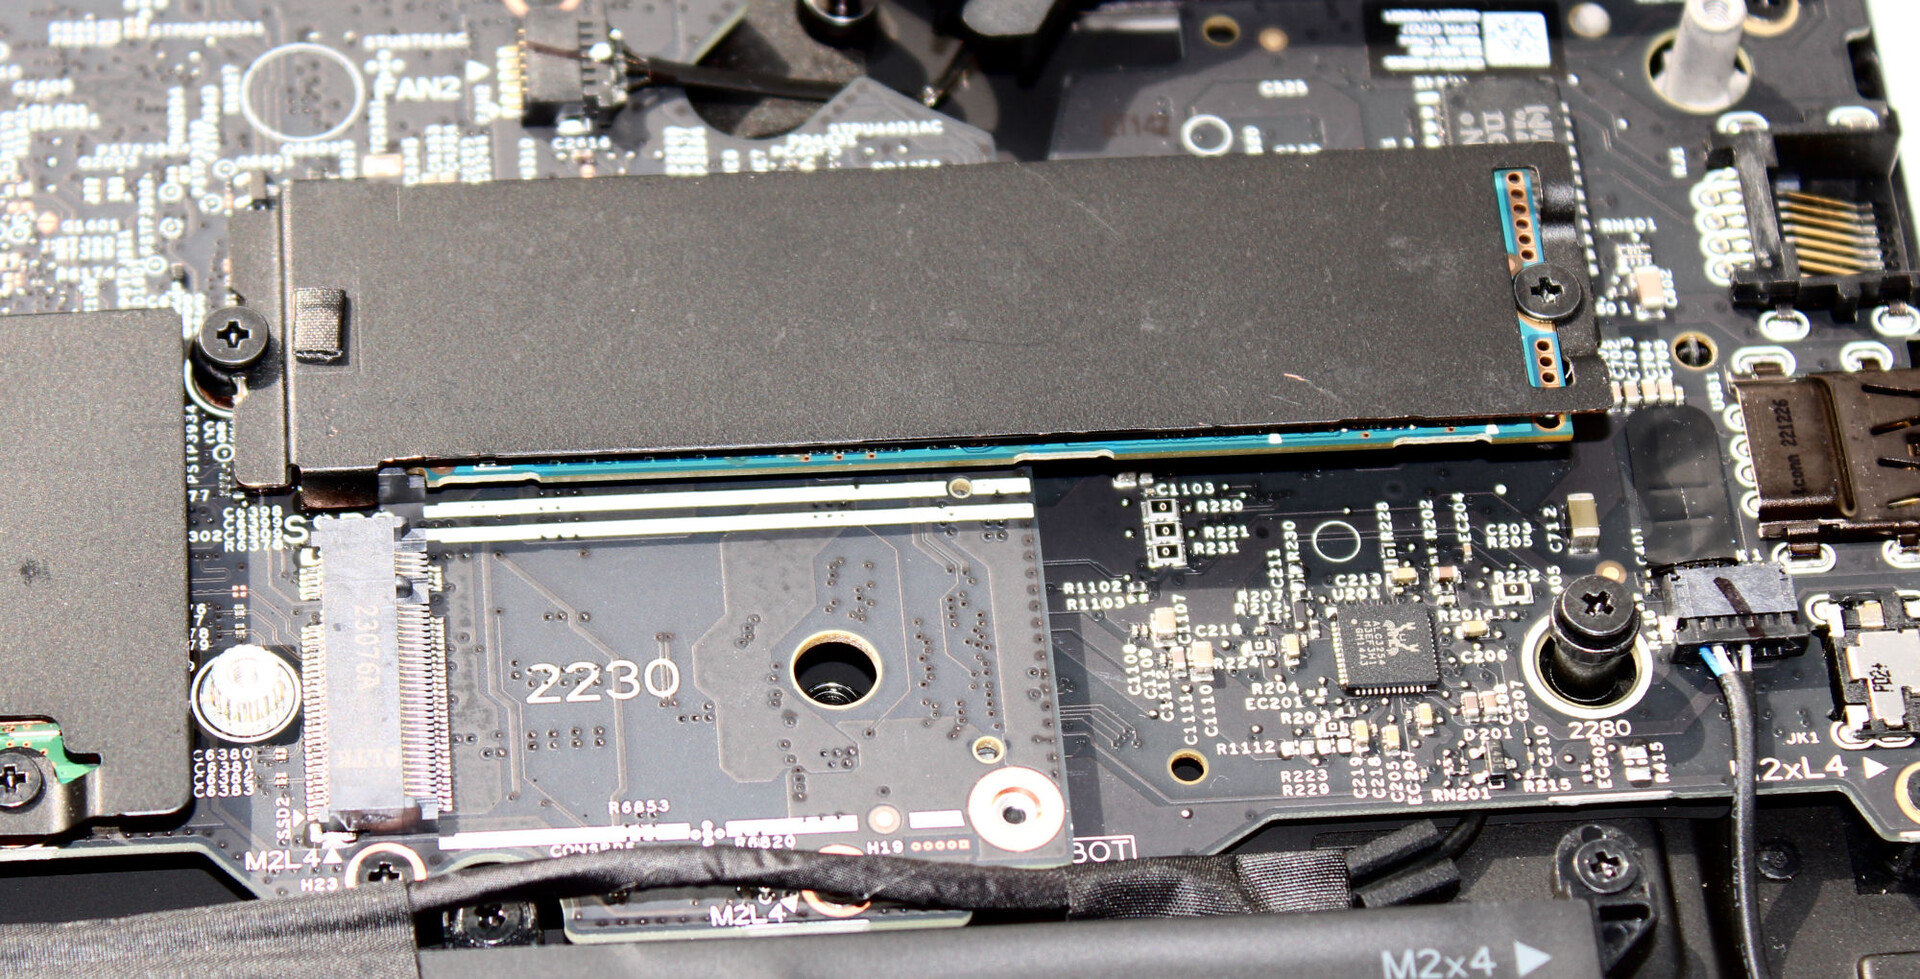
Lagringsenheter
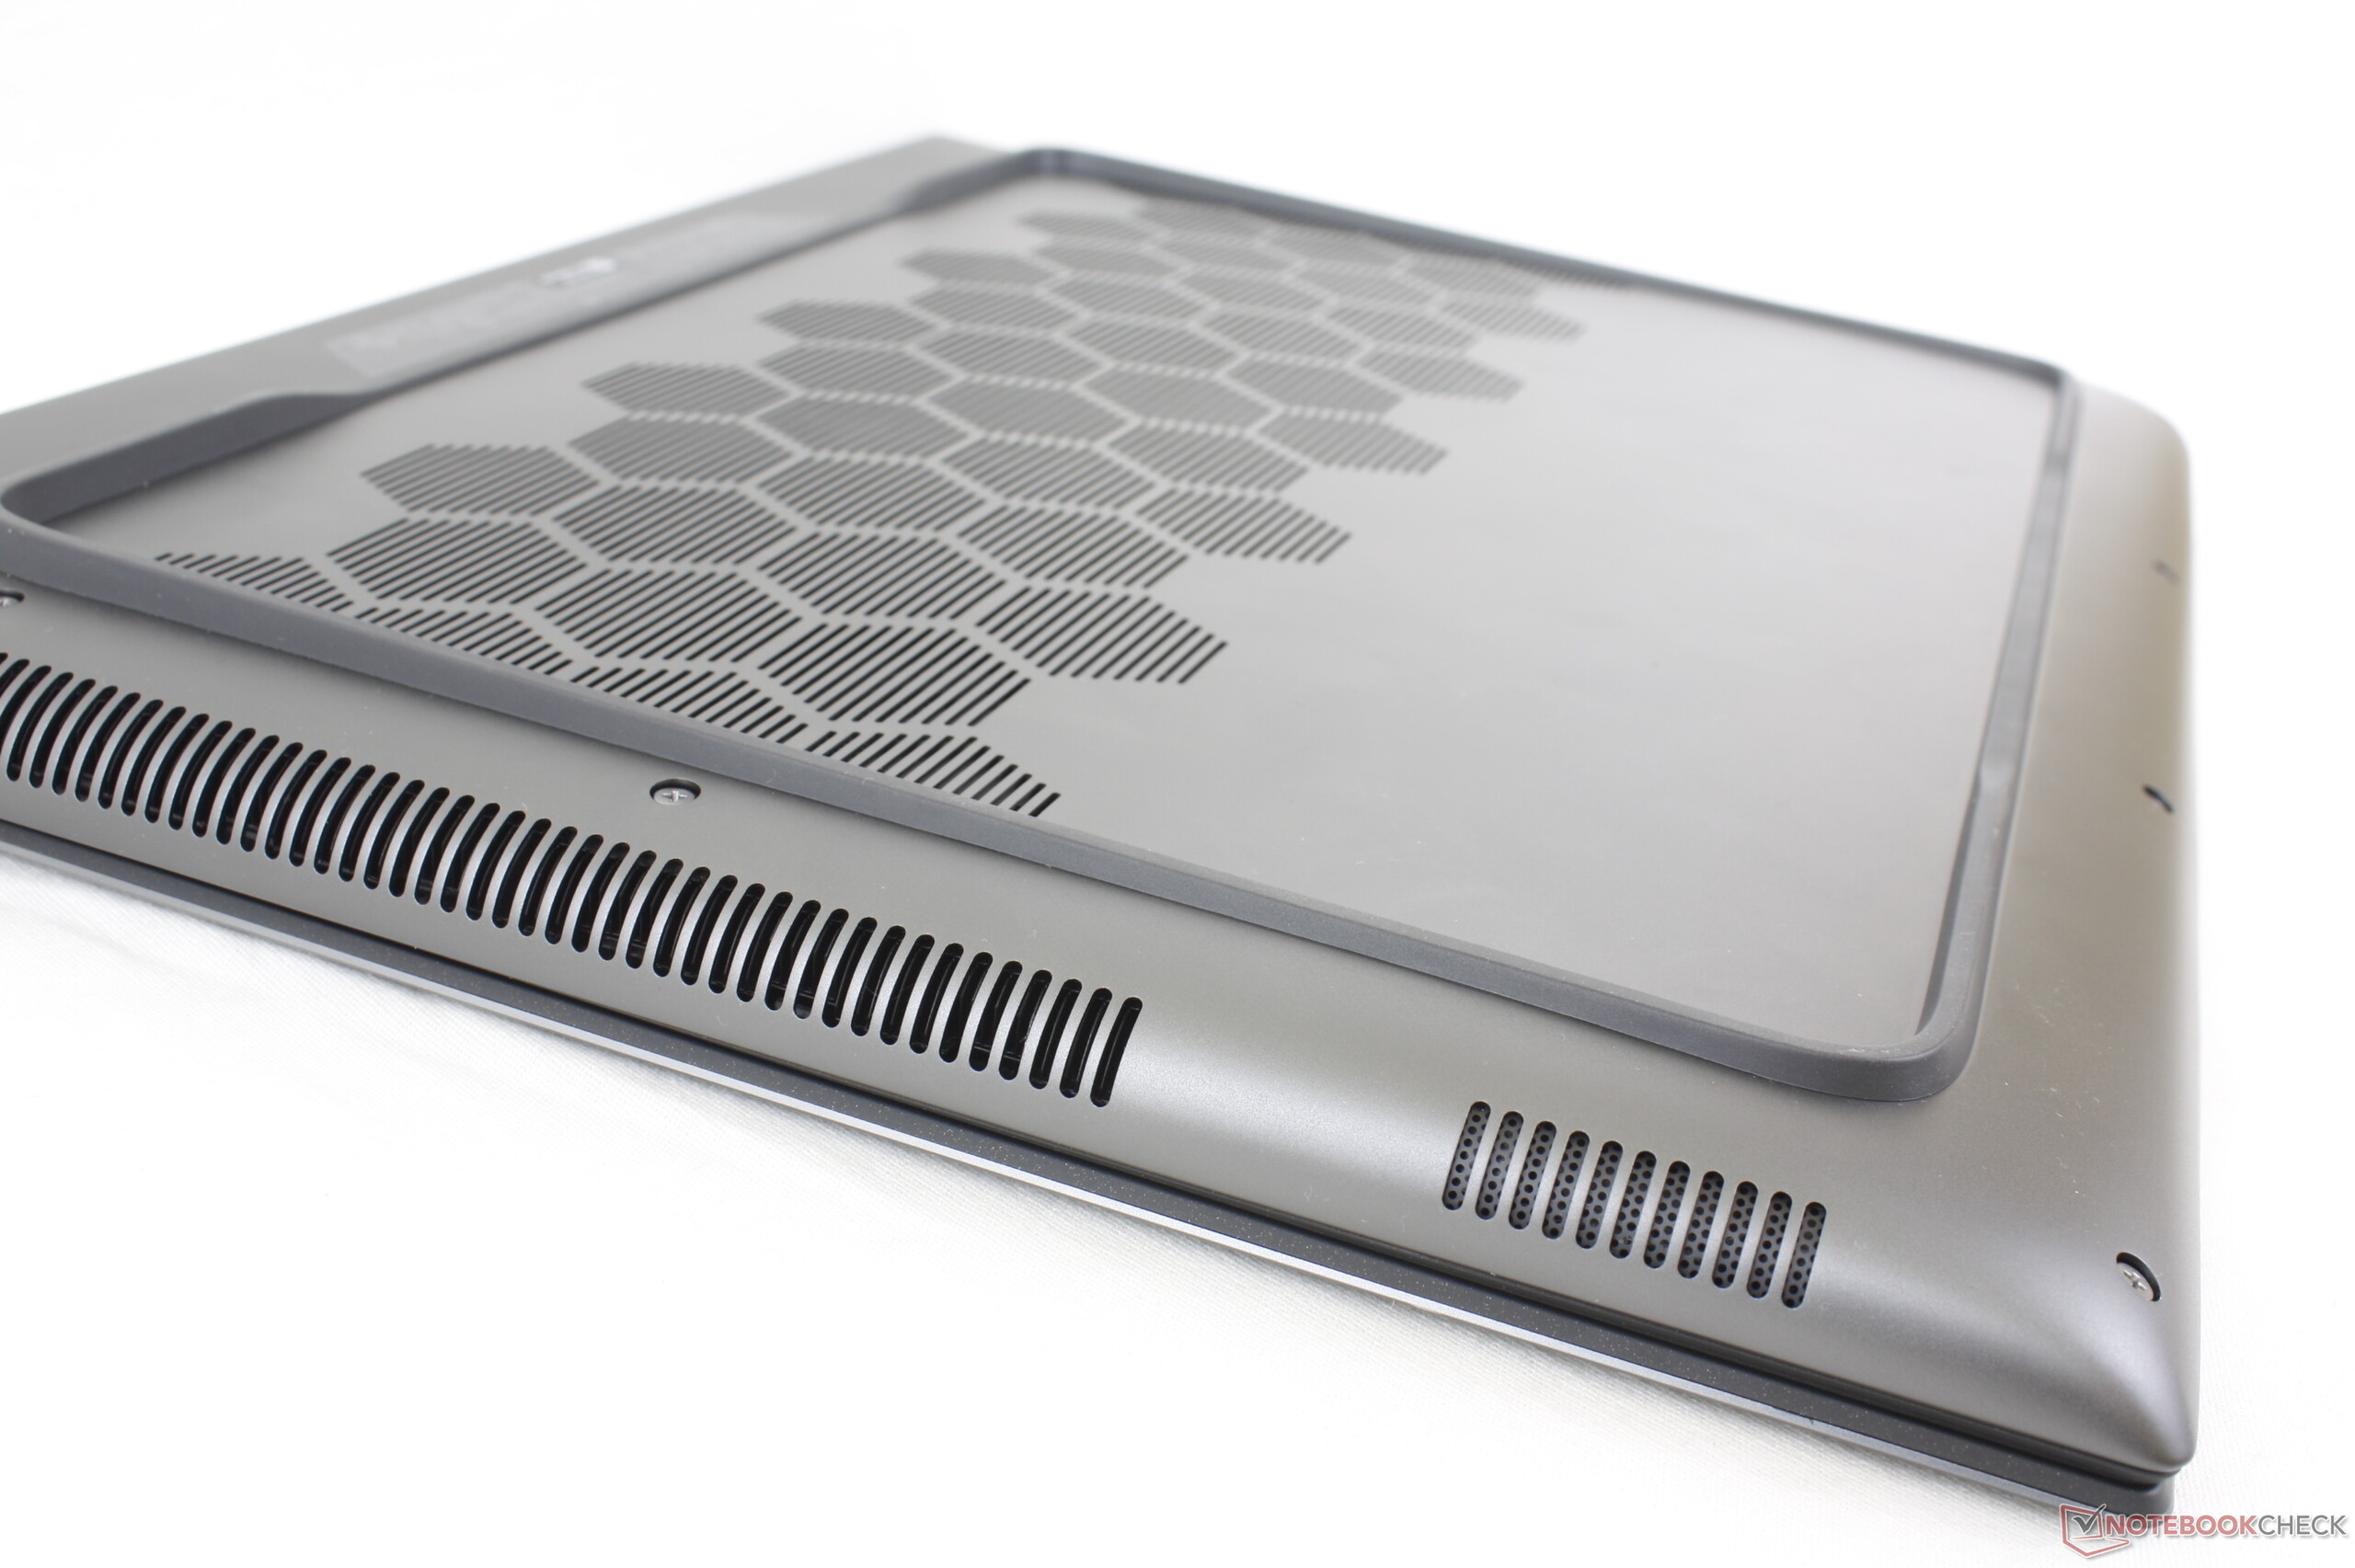
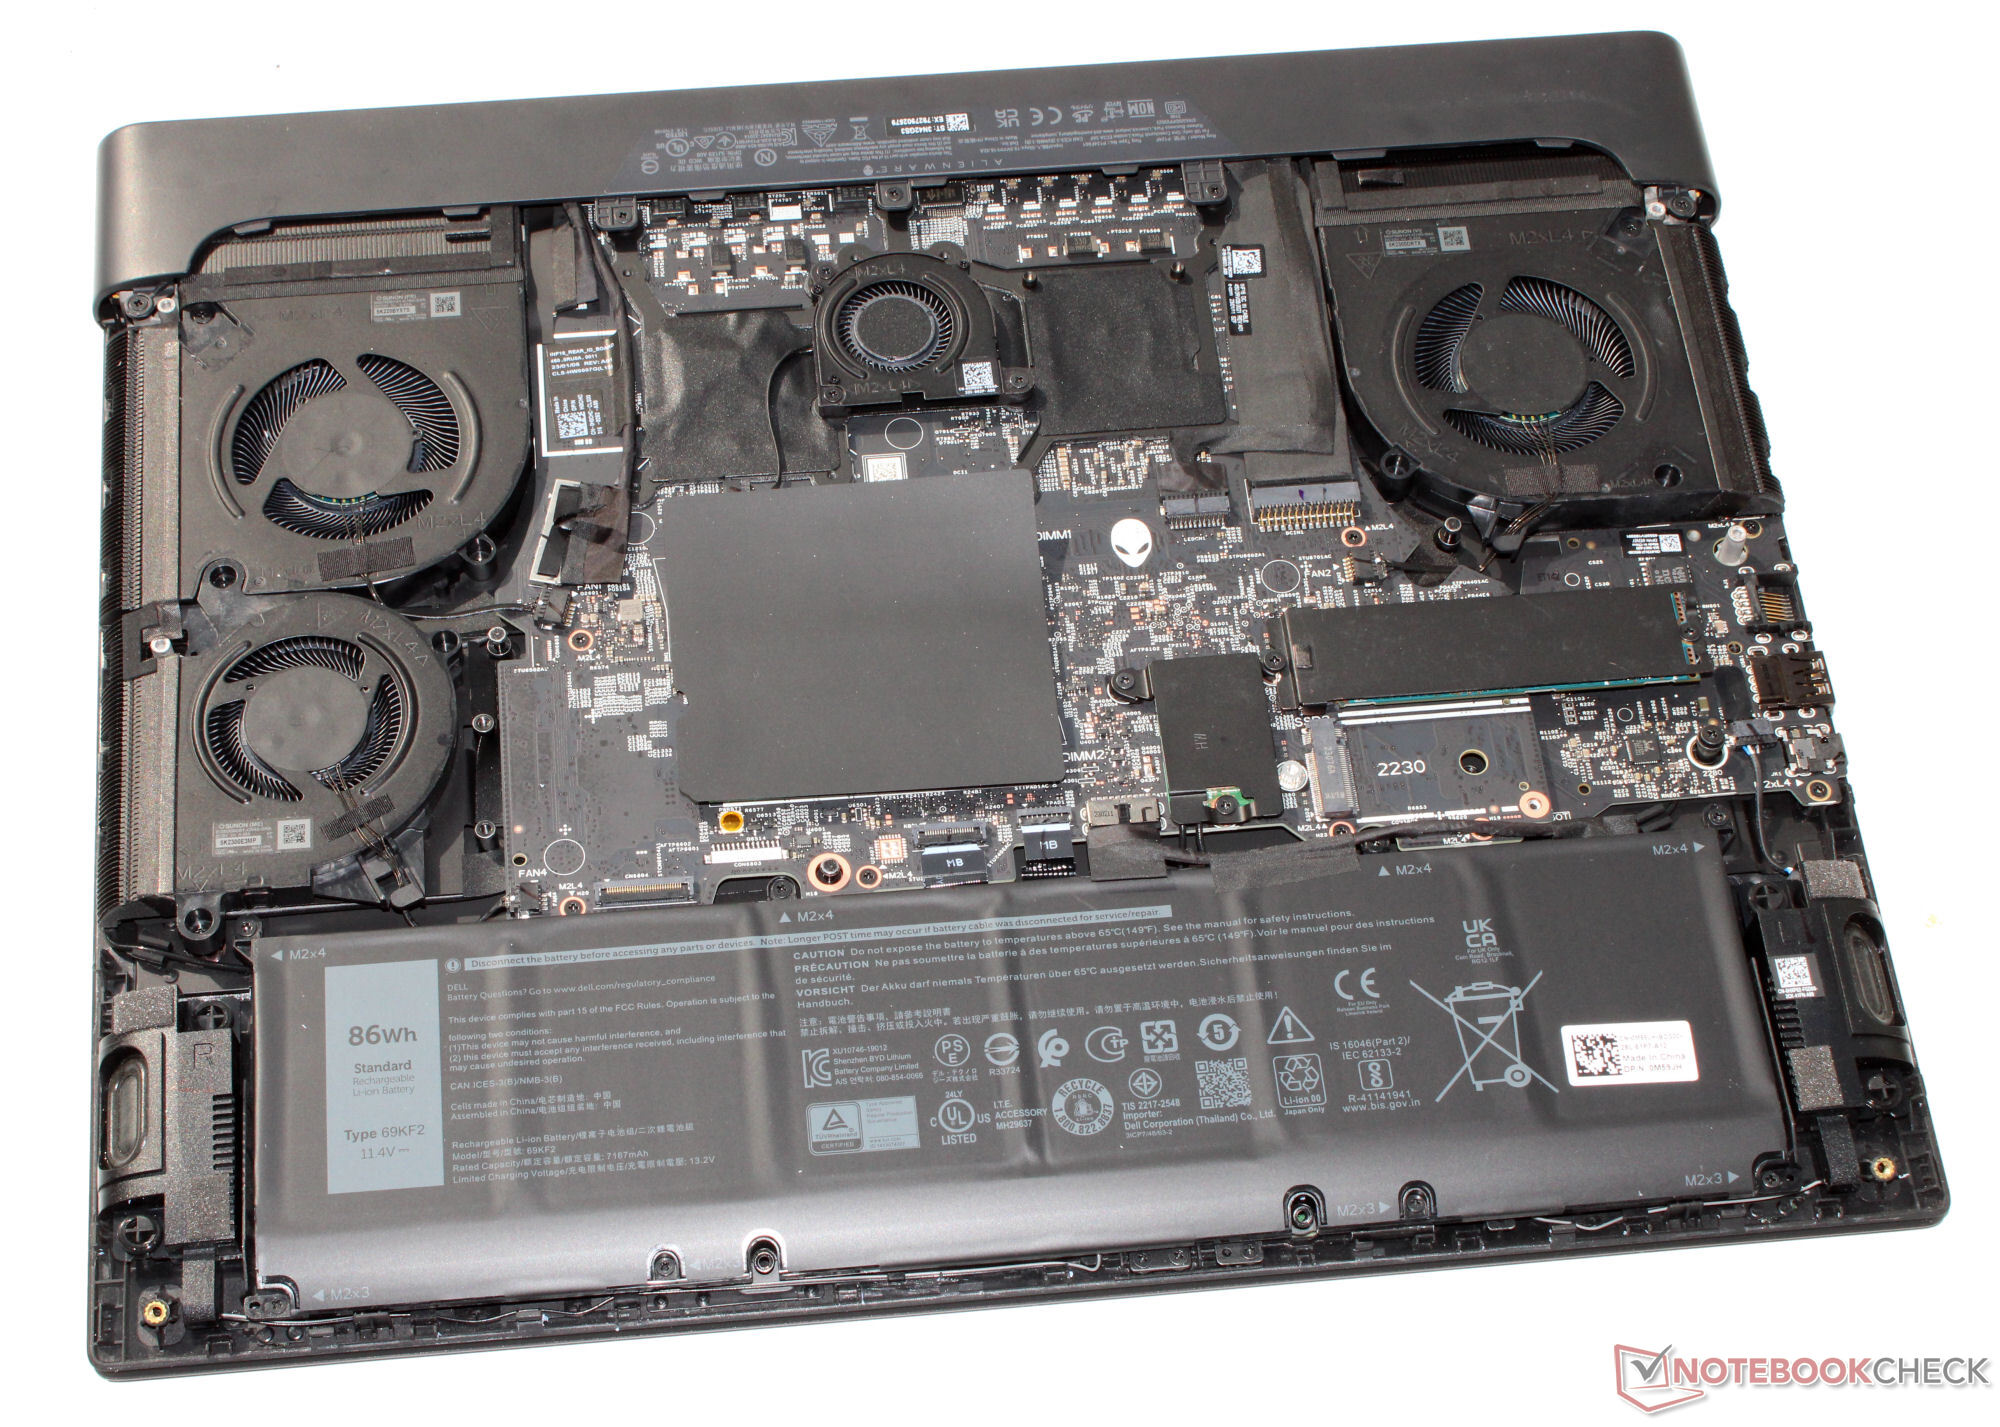
En 512 GB SSD (PCIe 4, M.2 2280) från Kioxia används som systemdisk. Den levererar bra datahastigheter, men är inte en av de bästa SSD-modellerna. Termiskt inducerad strypning inträffade inte. Den bärbara datorn har plats för ytterligare en PCIe-4-SSD (M.2 2230 eller M.2 2280). Andra konfigurationer av m16 kan till och med rymma upp till fyra SSD-enheter.

* ... mindre är bättre
Sustained Read Performance: DiskSpd Read Loop, Queue Depth 8
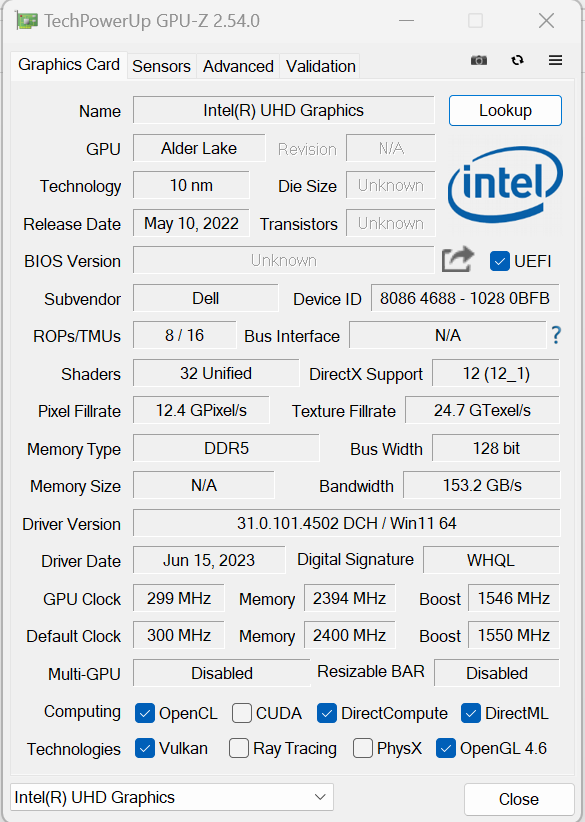
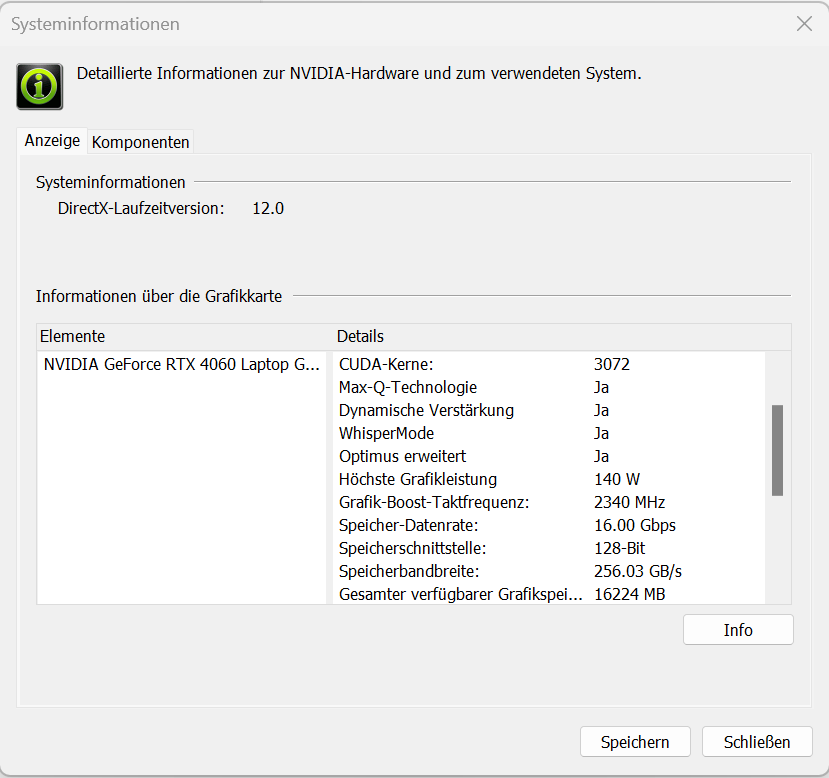
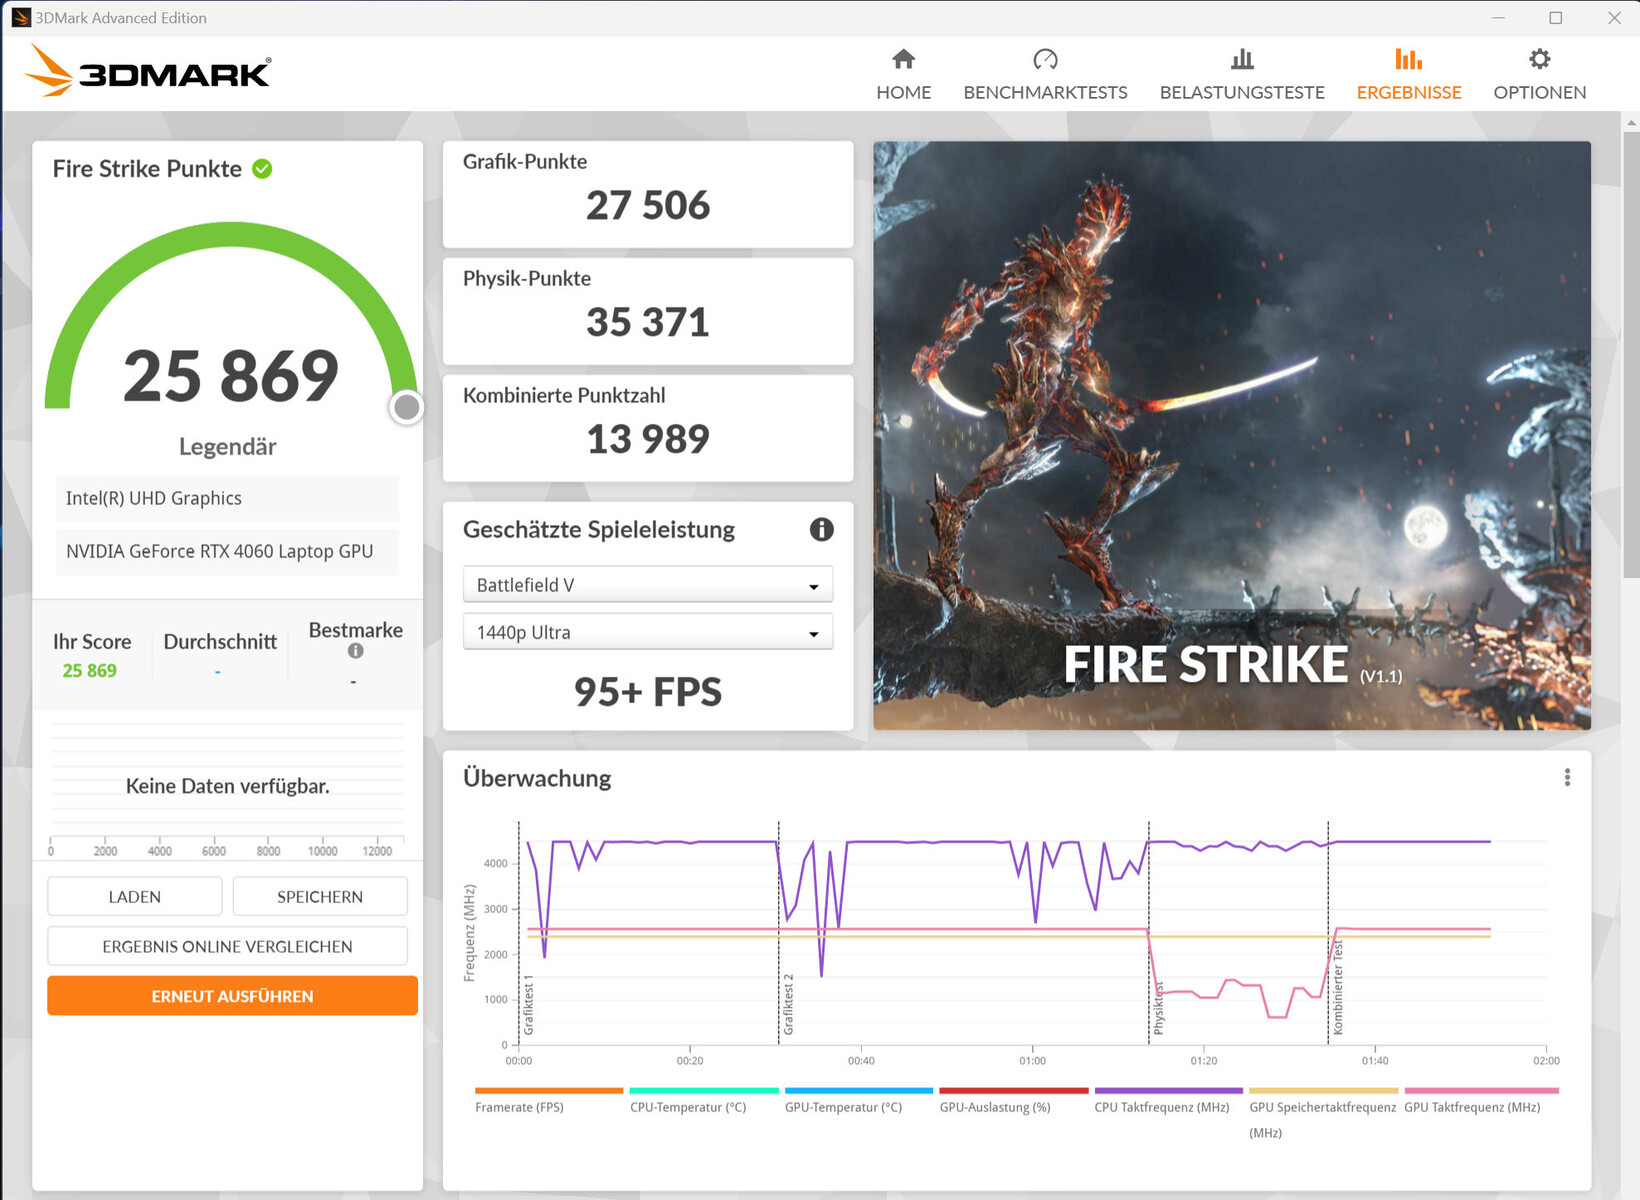
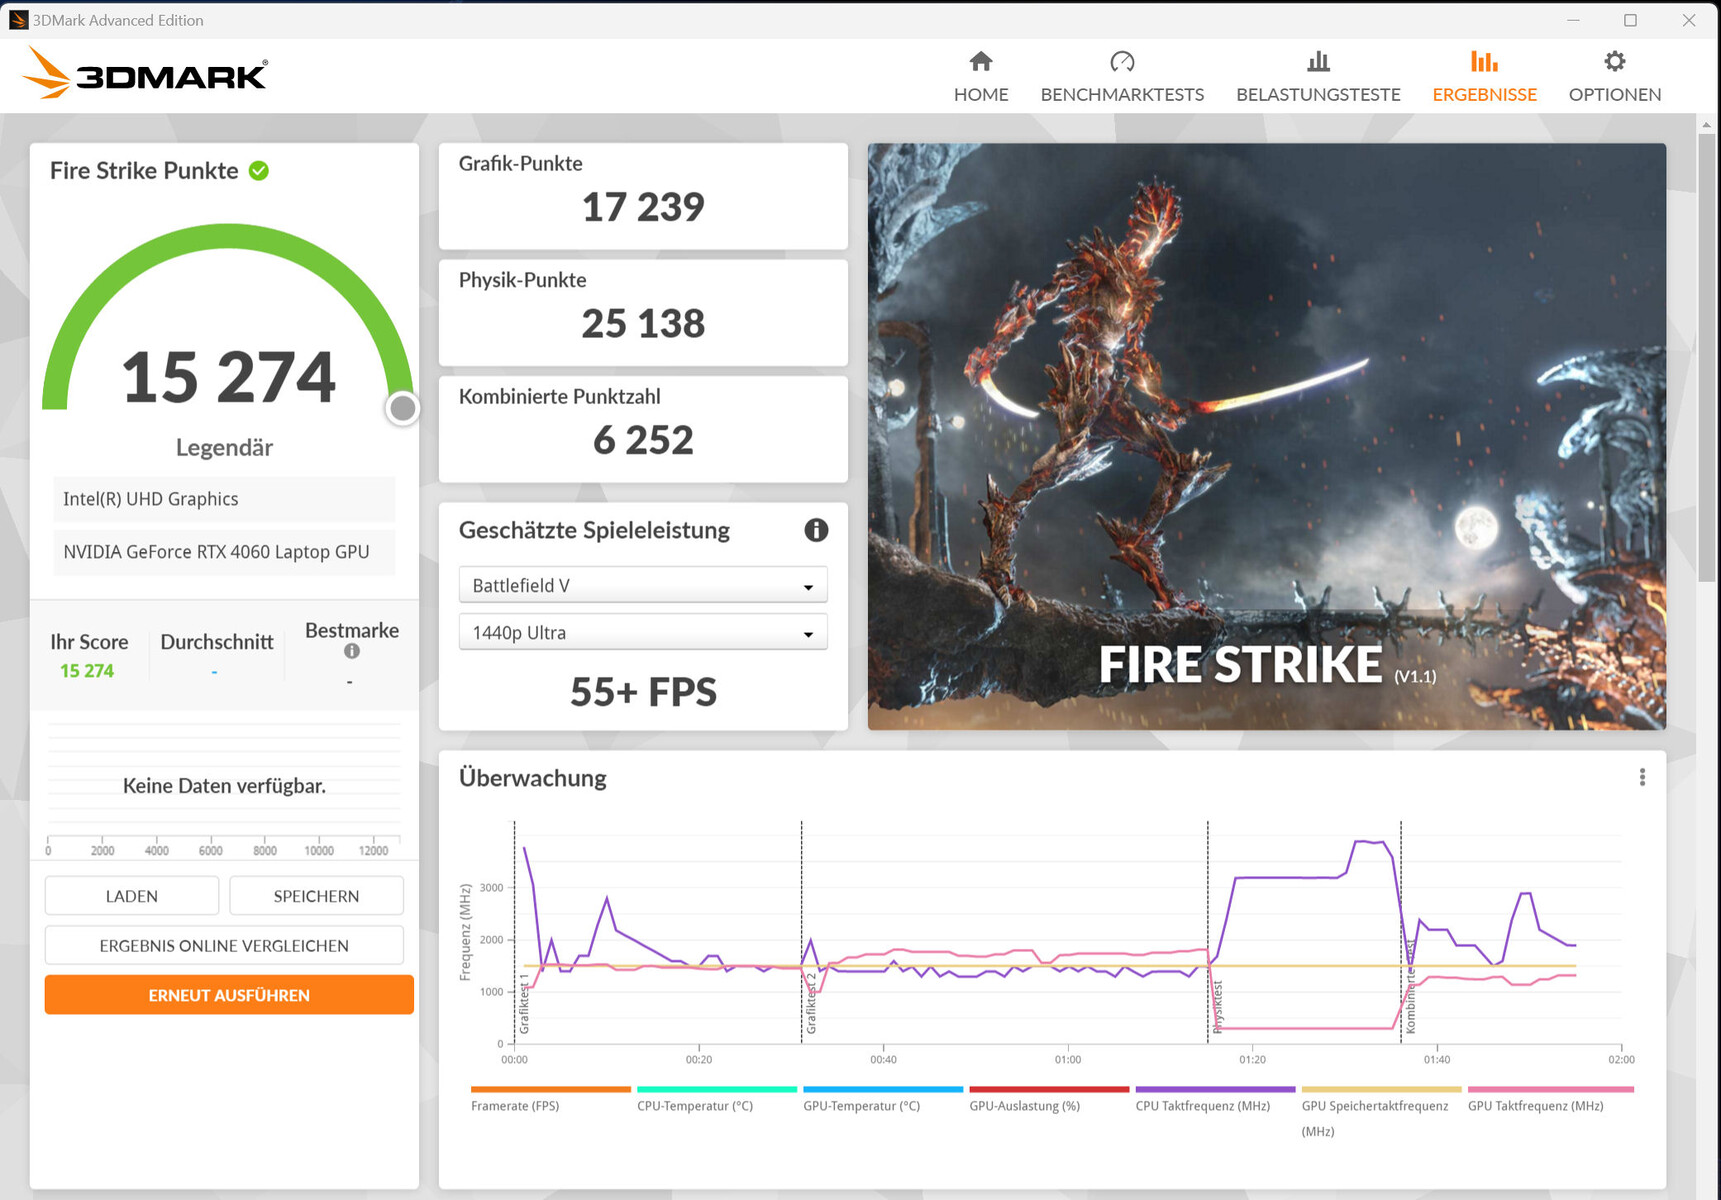
Grafikkort
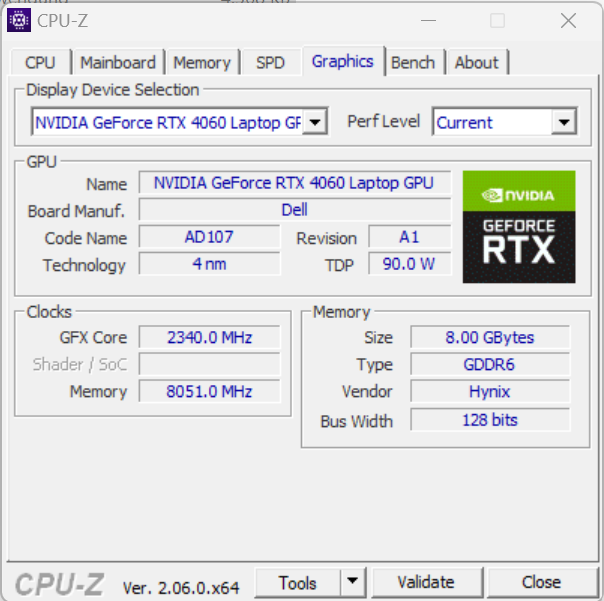
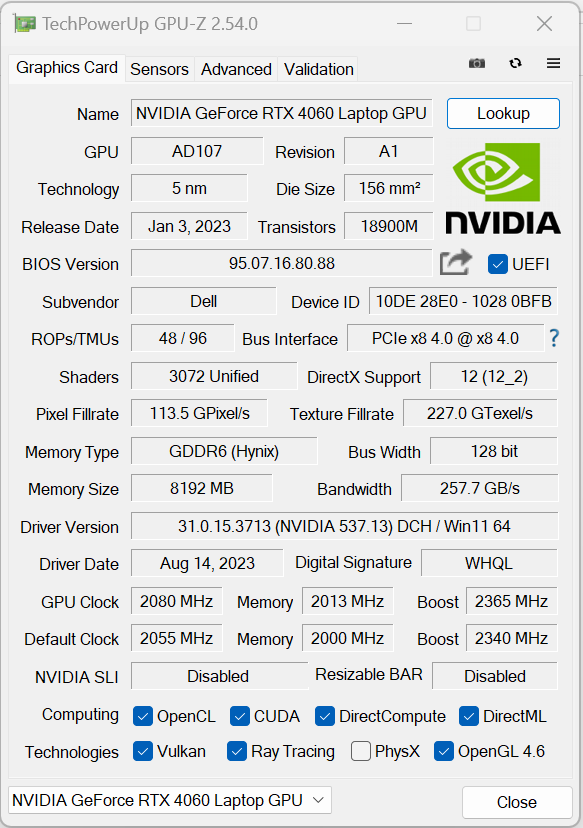
RTX 4060 GeForce RTX 4060erbjuder 3072 shaders, en 128 bitars bred buss och snabbt GDDR6-minne (8 192 MB). Dell tillåter en maximal TGP på 140 watt (115 watt + 25 watt Dynamic Boost) - mer är inte möjligt. Enligt Witcher 3 -testet utnyttjas TGP inte fullt ut. Benchmarkresultaten ligger över det tidigare RTX 4060-genomsnittet och är bland de bästa värdena som hittills registrerats med denna GPU. Att växla mellan dGPU och Optimus kräver ingen omstart - Advanced Optimus stöds.

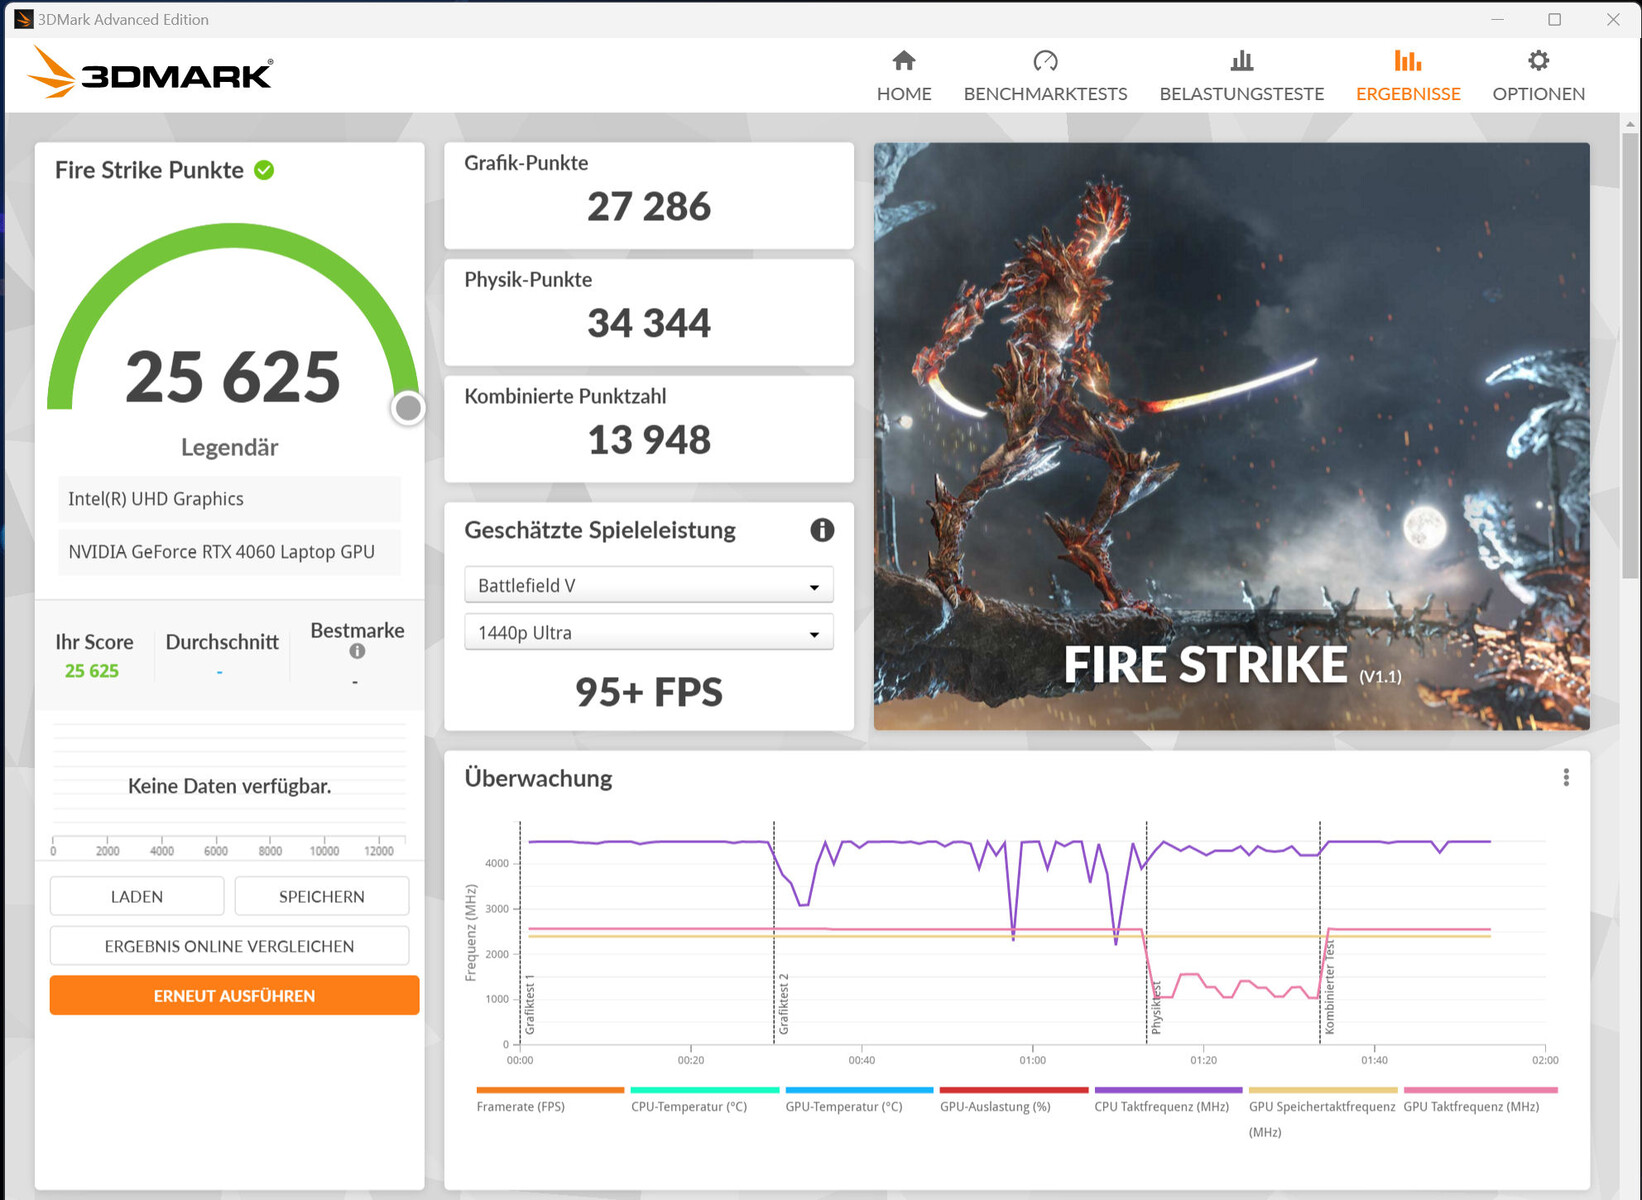
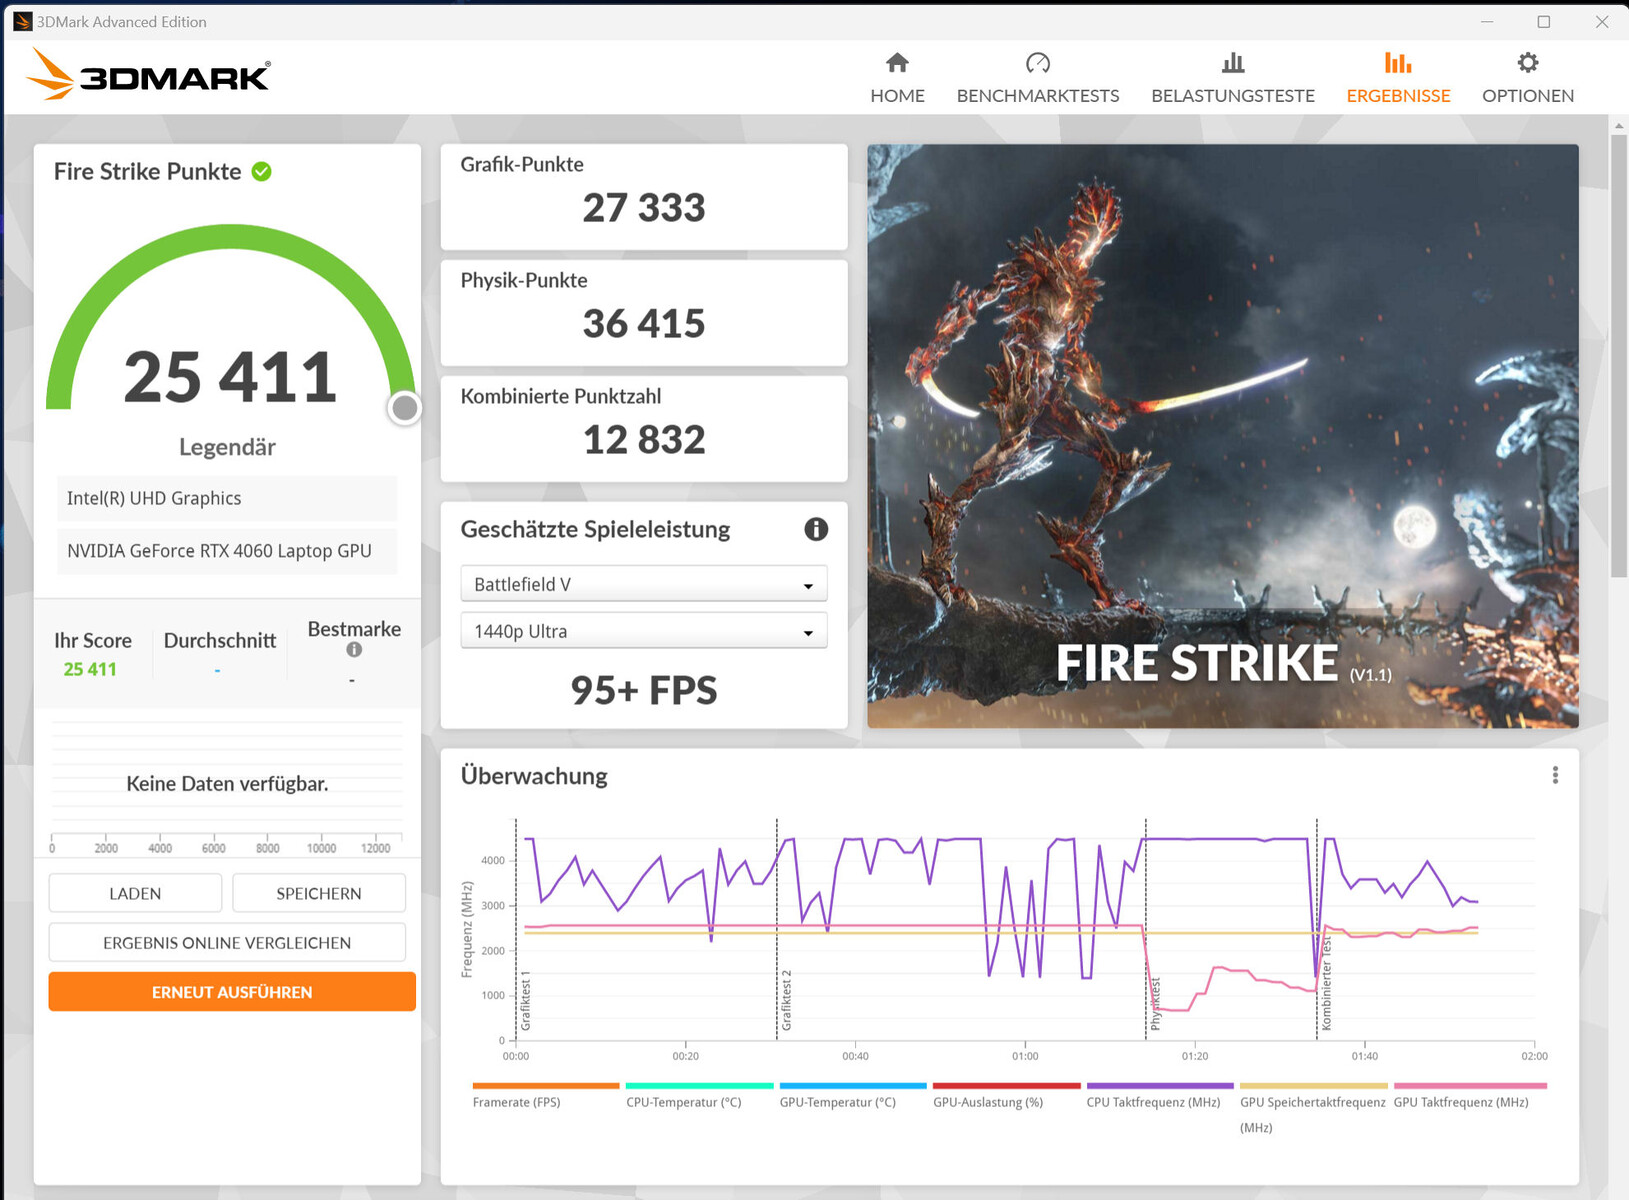
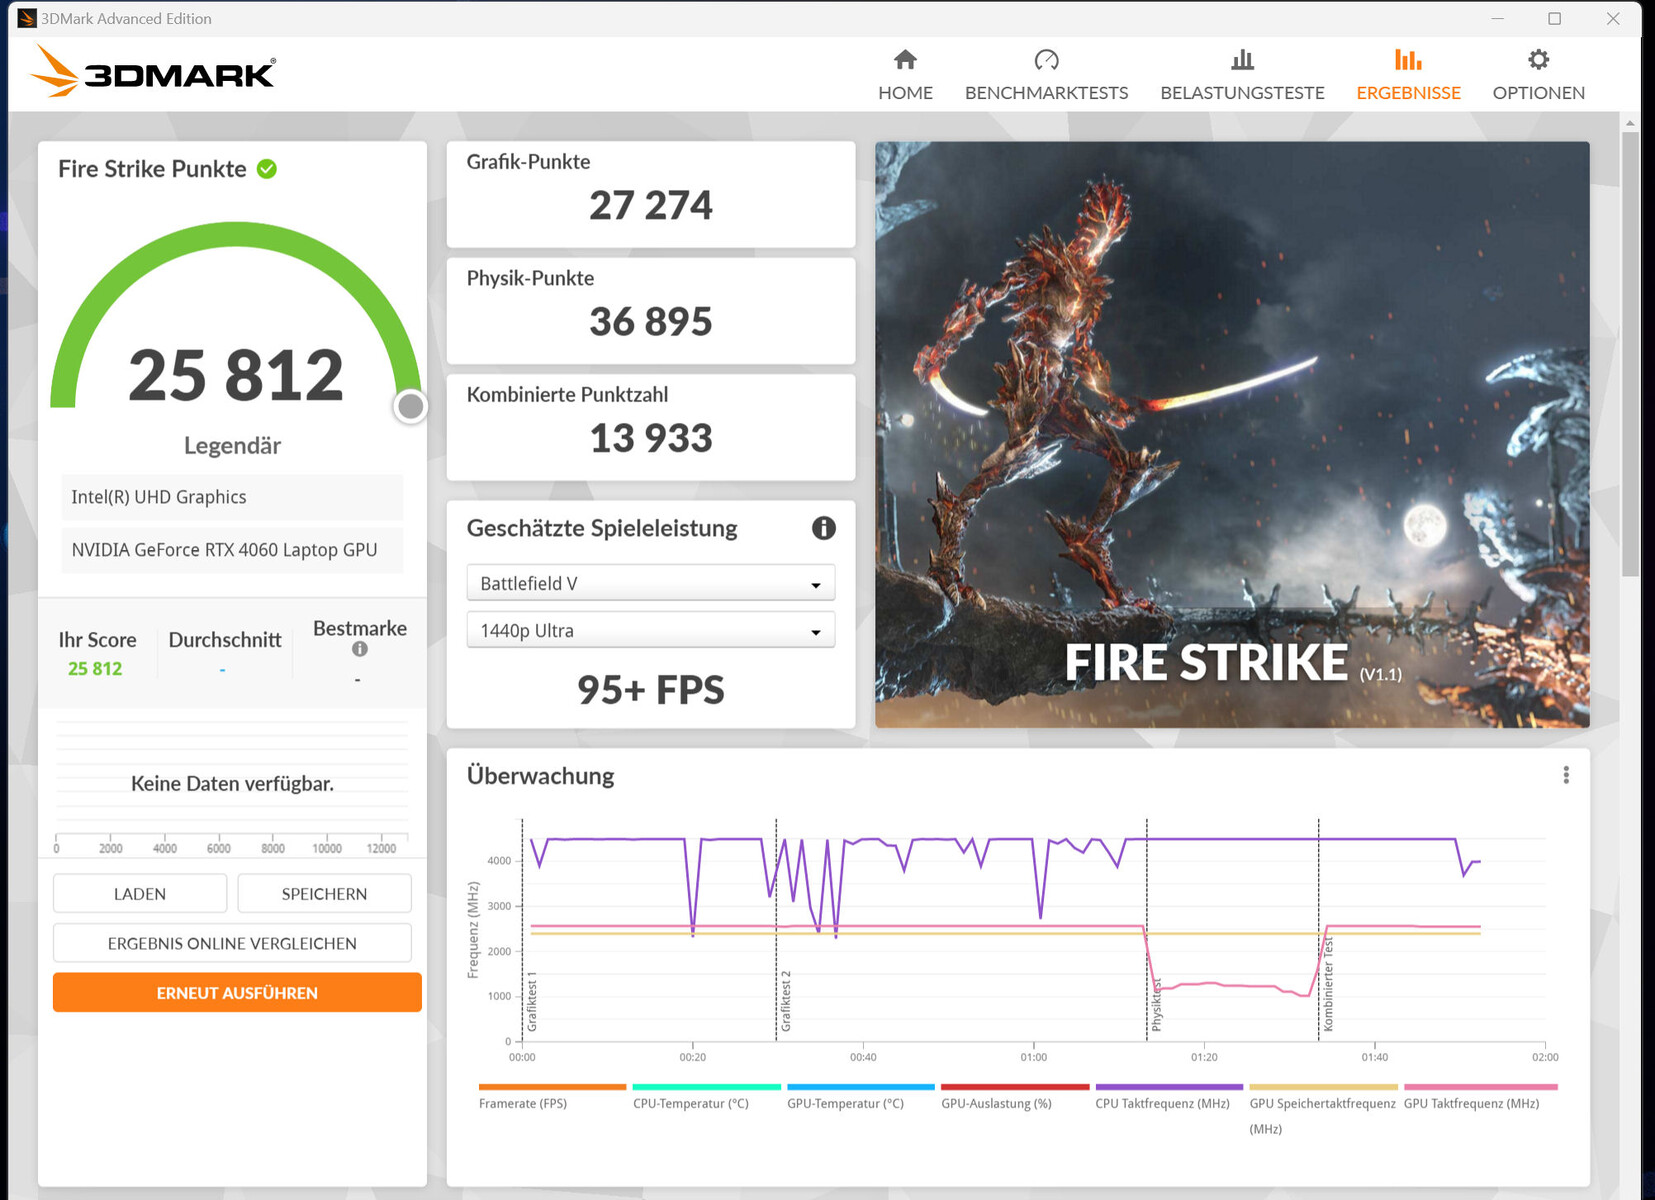
| 3DMark 06 Standard Score | 55811 poäng | |
| 3DMark 11 Performance | 33427 poäng | |
| 3DMark Cloud Gate Standard Score | 67224 poäng | |
| 3DMark Fire Strike Score | 25869 poäng | |
| 3DMark Time Spy Score | 11090 poäng | |
Hjälp | ||
* ... mindre är bättre
Spelprestanda
M16 är utformad för QHD+-spel med höga till maximala inställningar. Högre upplösningar är möjliga om en motsvarande skärm är ansluten - med delvis reducerade inställningar. Bildfrekvenser över RTX 4060-genomsnittet uppnås.
| The Witcher 3 - 1920x1080 Ultra Graphics & Postprocessing (HBAO+) | |
| Genomsnitt av klass Gaming (95 - 240, n=8, senaste 2 åren) | |
| Alienware m16 R1 AMD | |
| Schenker XMG Pro 15 (E23) | |
| Aorus 15 BSF | |
| Lenovo Legion Pro 5 16IRX8 | |
| Alienware m16 R1 Intel | |
| Medion Erazer Defender P40 | |
| Acer Predator Helios 16 PH16-71-731Q | |
| Genomsnitt NVIDIA GeForce RTX 4060 Laptop GPU (77 - 159.7, n=42) | |
| Atlas Fallen - 1920x1080 Very High Preset | |
| Alienware m16 R1 Intel | |
| Genomsnitt NVIDIA GeForce RTX 4060 Laptop GPU (88.2 - 114.4, n=3) | |
| Ratchet & Clank Rift Apart | |
| 1920x1080 Very High Preset AA:T | |
| Aorus 15 BSF | |
| Alienware m16 R1 Intel | |
| Genomsnitt NVIDIA GeForce RTX 4060 Laptop GPU (51.6 - 54.8, n=4) | |
| 1920x1080 Very High Preset + Very High Raytracing AA:T | |
| Aorus 15 BSF | |
| Alienware m16 R1 Intel | |
| Genomsnitt NVIDIA GeForce RTX 4060 Laptop GPU (39.1 - 44.5, n=3) | |
| Immortals of Aveum - 1920x1080 Ultra AF:16x | |
| Alienware m16 R1 Intel | |
| Genomsnitt NVIDIA GeForce RTX 4060 Laptop GPU (33 - 48.9, n=4) | |
| The Callisto Protocol | |
| 1920x1080 Ultra Preset (without FSR Upscaling) | |
| Aorus 15 BSF | |
| Alienware m16 R1 Intel | |
| Genomsnitt NVIDIA GeForce RTX 4060 Laptop GPU (54.4 - 81.1, n=3) | |
| 1920x1080 Ultra Preset (without FSR Upscaling) + Full Ray-Tracing | |
| Aorus 15 BSF | |
| Alienware m16 R1 Intel | |
| Genomsnitt NVIDIA GeForce RTX 4060 Laptop GPU (38.6 - 69.8, n=2) | |
| Star Wars Jedi Survivor | |
| 1920x1080 Epic Preset | |
| Alienware m16 R1 Intel | |
| Medion Erazer Defender P40 | |
| Genomsnitt NVIDIA GeForce RTX 4060 Laptop GPU (45.5 - 66.7, n=10) | |
| 1920x1080 Epic Preset + Ray Tracing | |
| Alienware m16 R1 Intel | |
| Genomsnitt NVIDIA GeForce RTX 4060 Laptop GPU (47 - 52.8, n=4) | |
| Medion Erazer Defender P40 | |
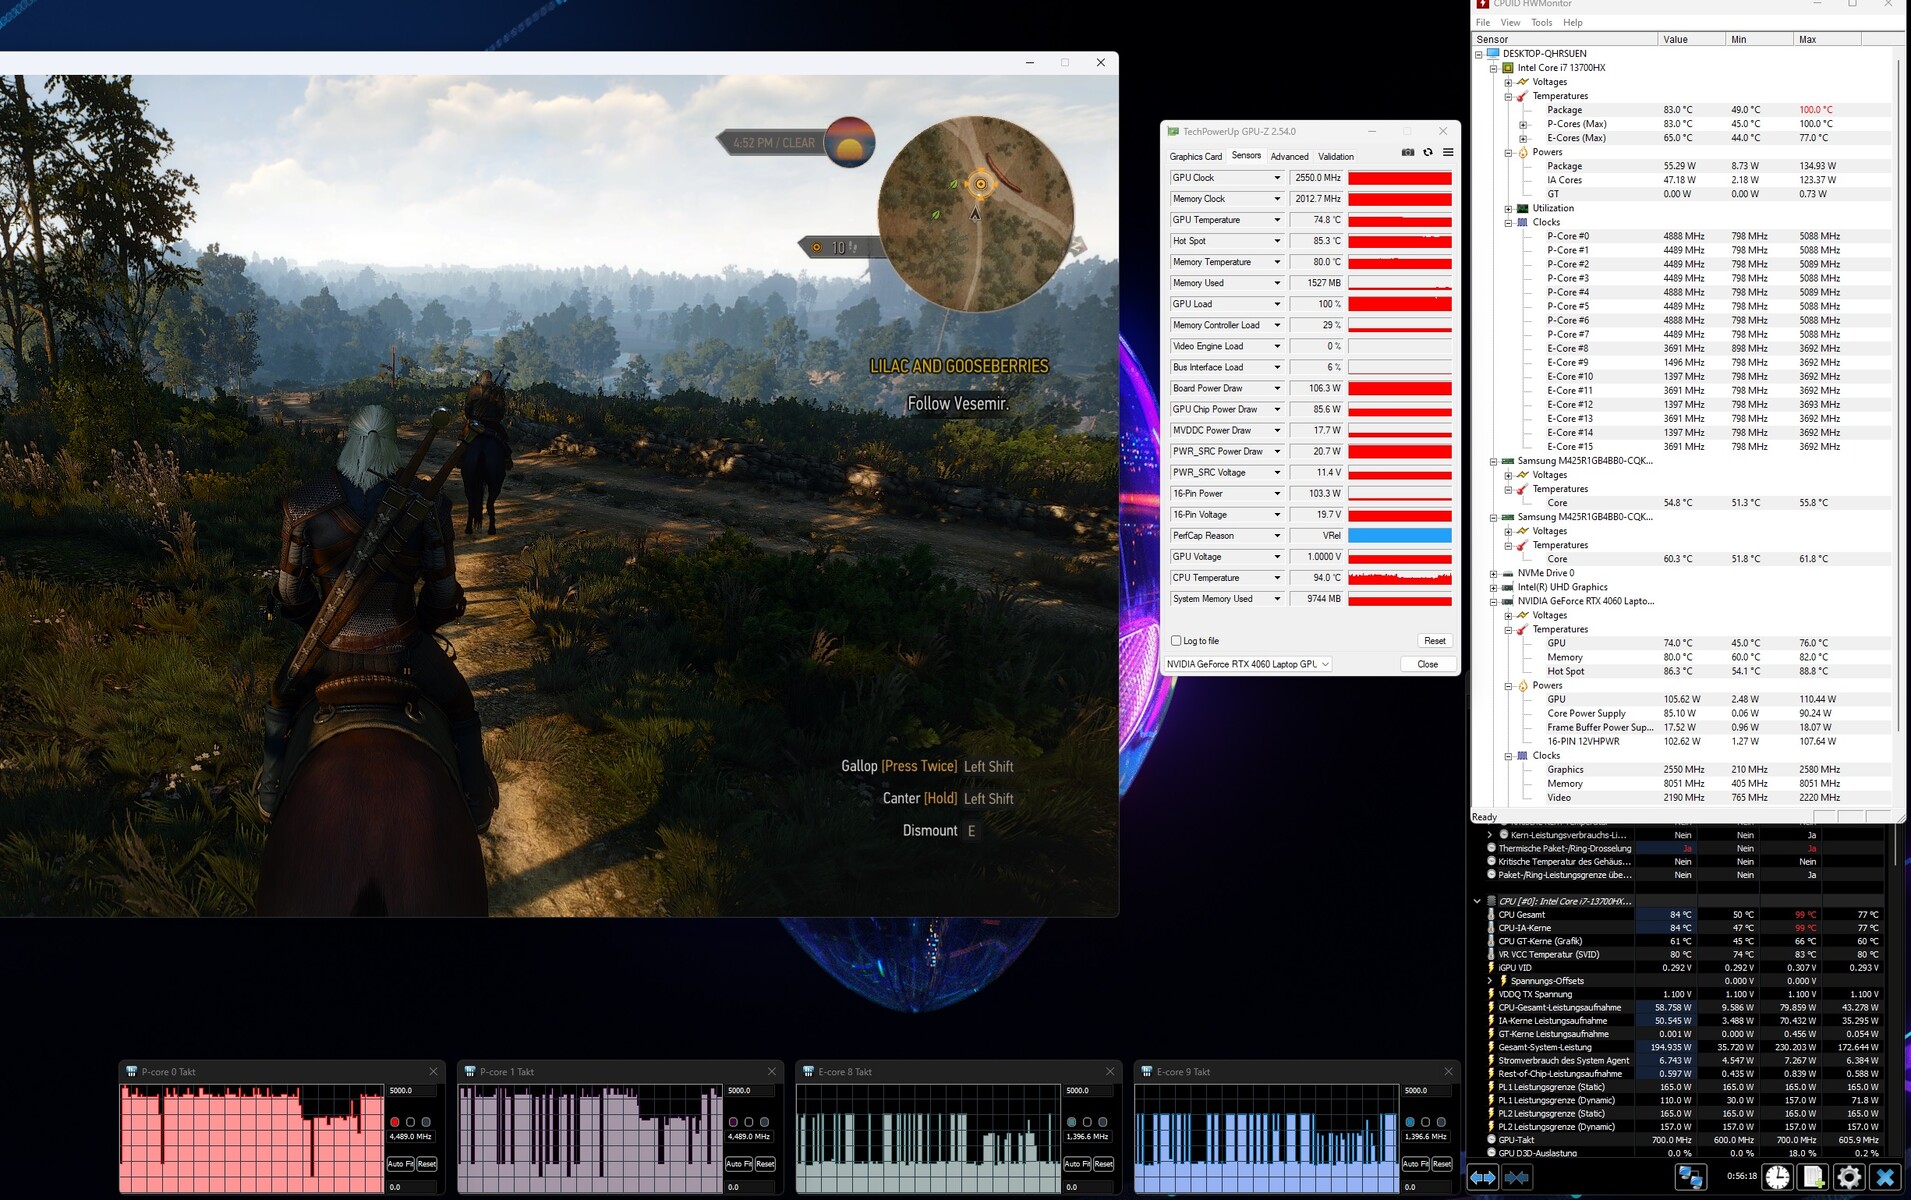
För att kontrollera om bildfrekvensen förblir i stort sett konstant under långa tidsperioder körs "The Witcher 3" i cirka 60 minuter i Full HD-upplösning och med maximala kvalitetsinställningar. Spelkaraktären flyttas inte. Någon minskning av bildfrekvensen observerades inte.
Witcher 3 FPS-Diagramm
| låg | med. | hög | ultra | QHD | |
|---|---|---|---|---|---|
| The Witcher 3 (2015) | 497 | 340.9 | 206.2 | 106.5 | 78.8 |
| Dota 2 Reborn (2015) | 189.5 | 169.6 | 165.8 | 153.2 | |
| Final Fantasy XV Benchmark (2018) | 232 | 150.8 | 104.7 | 77.1 | |
| X-Plane 11.11 (2018) | 170.4 | 156.7 | 120.4 | ||
| Far Cry 5 (2018) | 199 | 163 | 155 | 146 | 107 |
| Strange Brigade (2018) | 580 | 283 | 223 | 190.3 | 128.5 |
| Cyberpunk 2077 1.6 (2022) | 134.6 | 104.5 | 89.3 | 82.1 | 49.9 |
| The Callisto Protocol (2022) | 165.4 | 135.4 | 128 | 81.1 | 62.8 |
| Star Wars Jedi Survivor (2023) | 86 | 75.8 | 70.9 | 66.7 | 41.7 |
| F1 23 (2023) | 291 | 272 | 187.6 | 119.9 | 38.9 |
| Ratchet & Clank Rift Apart (2023) | 86 | 74.7 | 60.6 | 54.8 | 46.6 |
| Atlas Fallen (2023) | 145.9 | 137.5 | 132.1 | 114.4 | 79.2 |
| Immortals of Aveum (2023) | 61.6 | 54.6 | 48.9 | 32.8 |
Utsläpp - Dell laptop kan producera en hel del buller
Buller
Ljudtrycksnivån kan stiga upp till 58 dB(A) ("Overdrive") i spelläget. "Performance"-läget presterar bättre med 51 dB(A). Favoriten bland lägena är profilen "Silent": en nivå på 43 dB(A) kommer på bekostnad av något minskad spelprestanda.
I viloläge och vid daglig användning (kontor, internet) står de fyra fläktarna ofta stilla och tystnad råder.
Ljudnivå
| Låg belastning |
| 25 / 26 / 27 dB(A) |
| Hög belastning |
| 52 / 53 dB(A) |
 | ||
30 dB tyst 40 dB(A) hörbar 50 dB(A) högt ljud |
||
min: | ||
| Alienware m16 R1 Intel GeForce RTX 4060 Laptop GPU, i7-13700HX, Kioxia KXG70ZNV512G | Acer Predator Helios 16 PH16-71-731Q GeForce RTX 4060 Laptop GPU, i7-13700HX, Micron 3400 1TB MTFDKBA1T0TFH | Medion Erazer Defender P40 GeForce RTX 4060 Laptop GPU, i7-13700HX, Phison PS5021-E21 1TB | Lenovo Legion Pro 5 16IRX8 GeForce RTX 4060 Laptop GPU, i7-13700HX, SK hynix PC801 HFS512GEJ9X115N | Schenker XMG Pro 15 (E23) GeForce RTX 4060 Laptop GPU, i9-13900HX, Crucial P5 Plus 1TB CT1000P5PSSD8 | Aorus 15 BSF GeForce RTX 4070 Laptop GPU, i7-13700H, Gigabyte AG470S1TB-SI B10 | Alienware m16 R1 AMD GeForce RTX 4080 Laptop GPU, R9 7845HX, Kioxia XG8 KXG80ZNV1T02 | |
|---|---|---|---|---|---|---|---|
| Noise | 5% | -9% | 9% | 3% | -10% | 4% | |
| av / miljö * (dB) | 25 | 24 4% | 25 -0% | 23 8% | 24 4% | 24 4% | 22.9 8% |
| Idle Minimum * (dB) | 25 | 24 4% | 26 -4% | 23.1 8% | 24 4% | 25 -0% | 22.9 8% |
| Idle Average * (dB) | 26 | 24 8% | 27 -4% | 23.1 11% | 24 8% | 31 -19% | 29.7 -14% |
| Idle Maximum * (dB) | 27 | 32.32 -20% | 32 -19% | 26.6 1% | 24 11% | 37 -37% | 29.7 -10% |
| Load Average * (dB) | 52 | 36.66 29% | 53 -2% | 34.7 33% | 53.65 -3% | 51 2% | 29.8 43% |
| Witcher 3 ultra * (dB) | 51 | 49.06 4% | 56 -10% | 47.6 7% | 53.53 -5% | 54.7 -7% | |
| Load Maximum * (dB) | 53 | 49.49 7% | 64 -21% | 54.8 -3% | 53.65 -1% | 57 -8% | 54.7 -3% |
* ... mindre är bättre
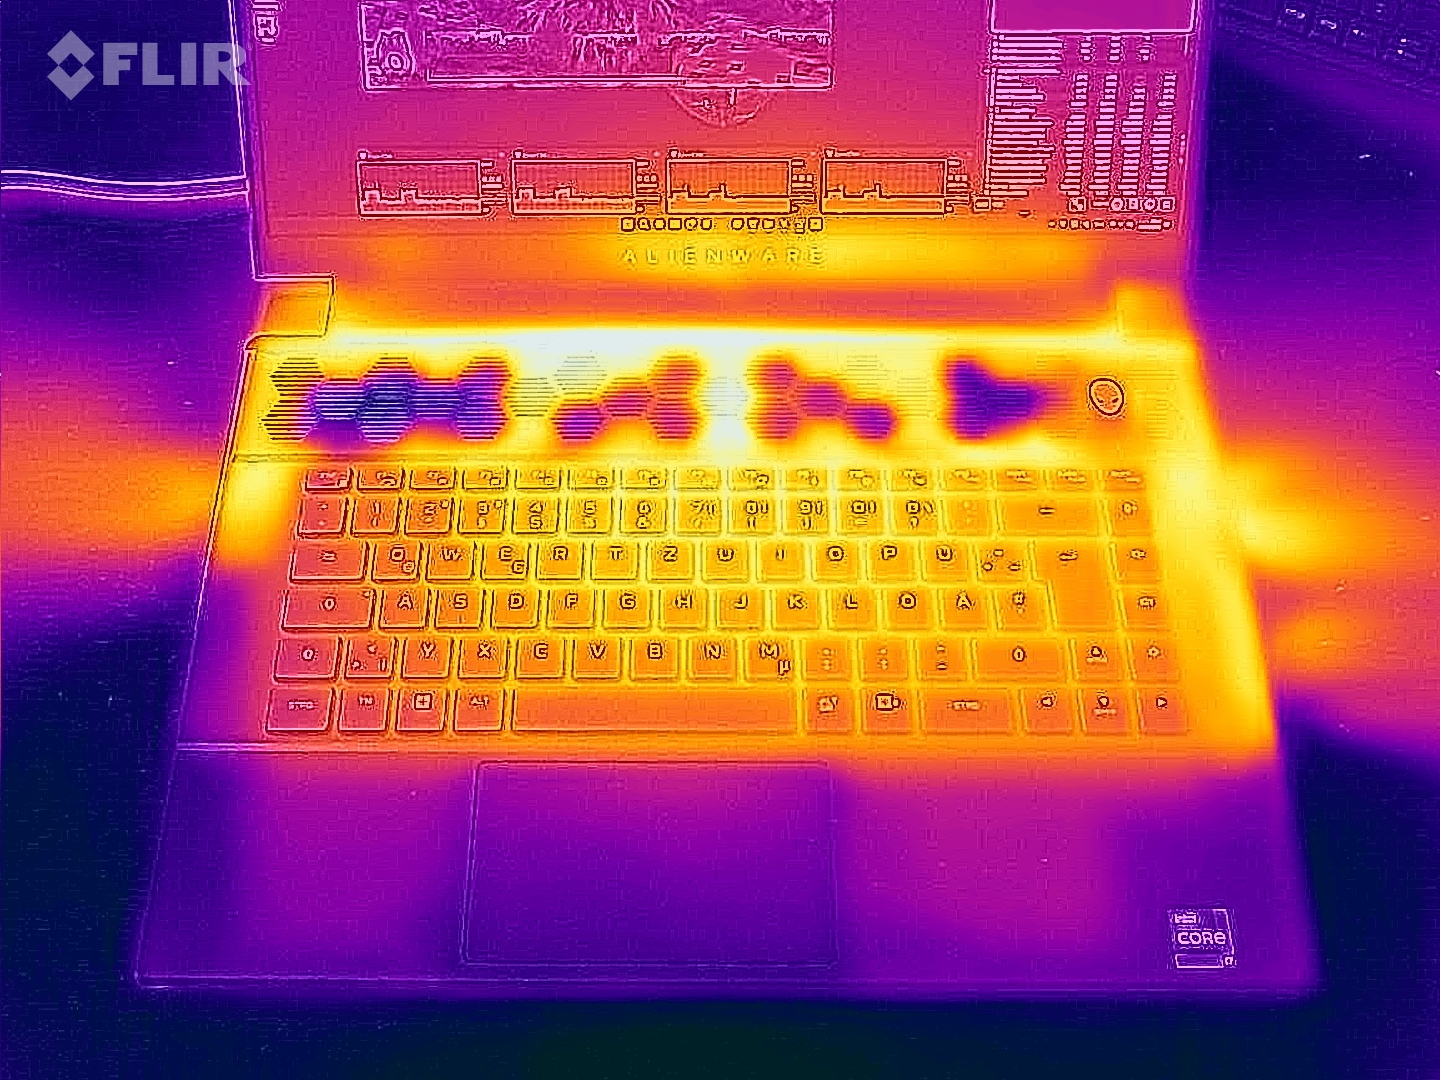
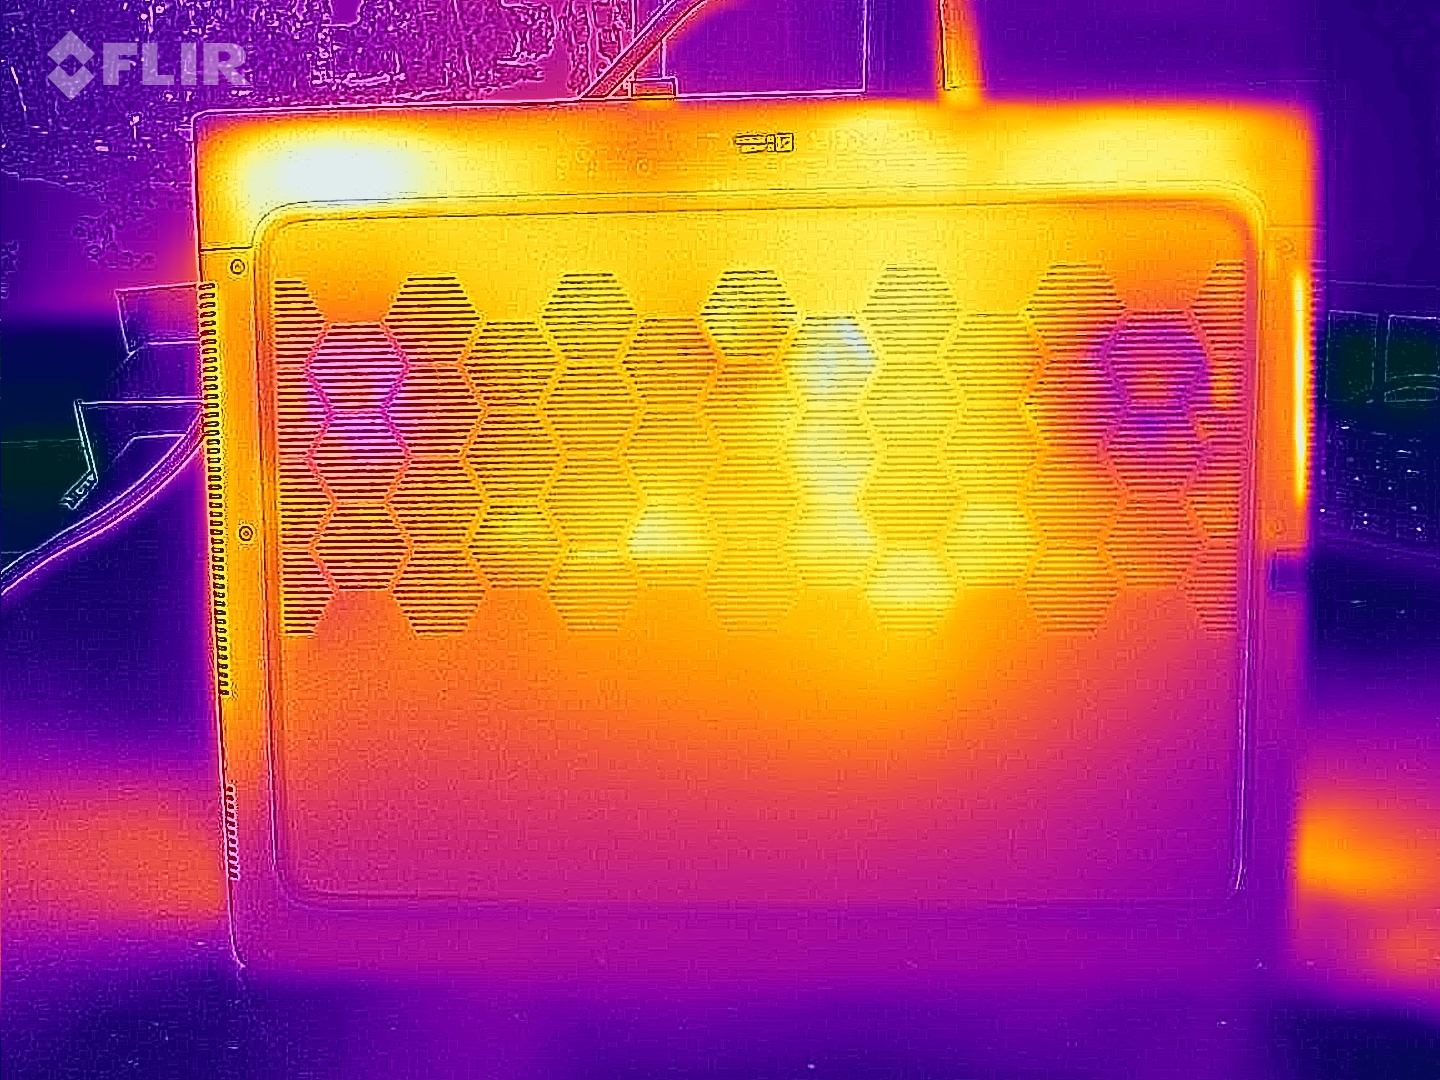
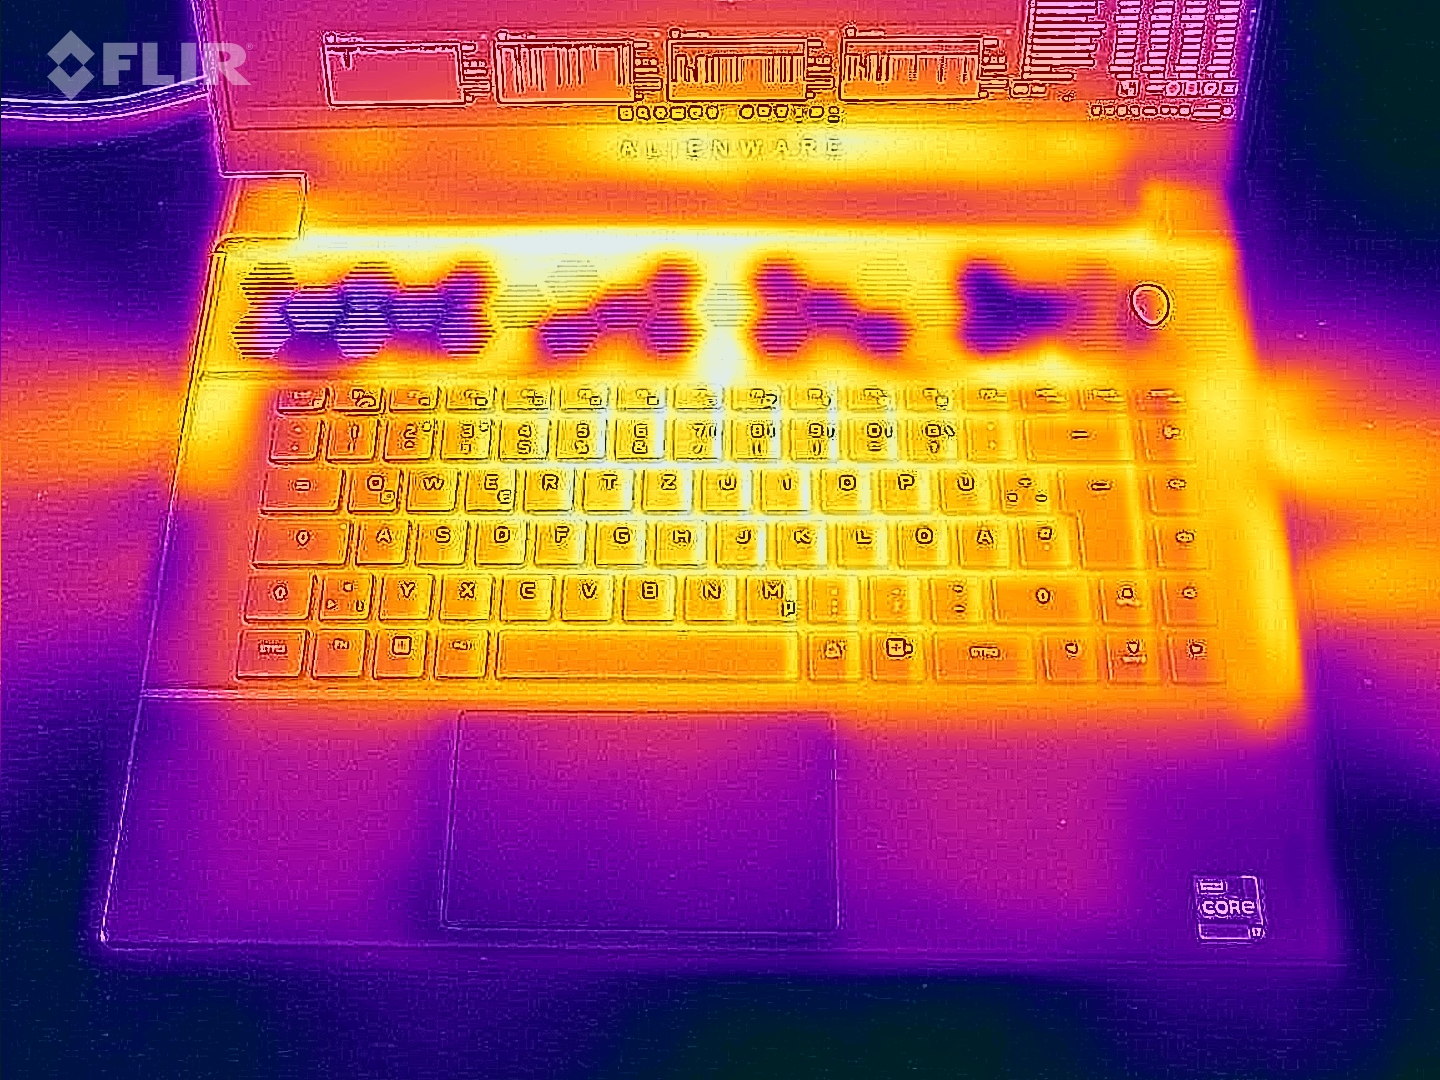
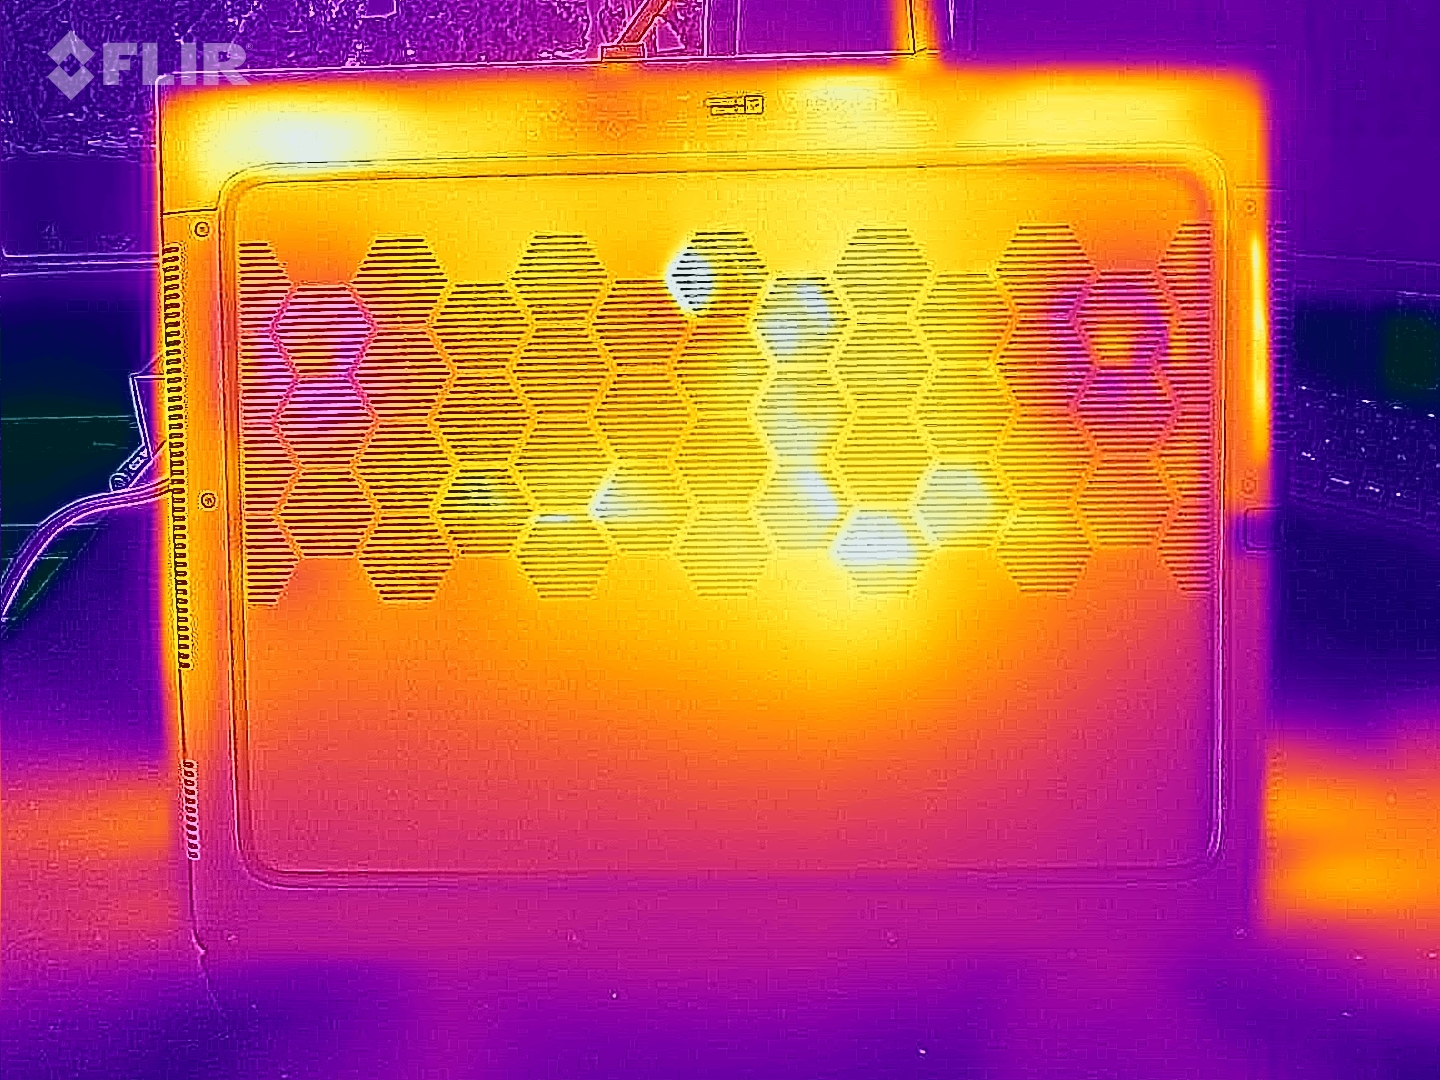
Temperatur
Stresstester och Witcher 3 orsakar märkbar uppvärmning av den bärbara datorn, men allt förblir inom acceptabla gränser. Vid daglig användning (kontor, internet) ligger temperaturen i princip i den gröna zonen, men är på en för hög nivå jämfört med jämförbara bärbara datorer.
Den bärbara datorn värms upp mer under belastning än dess AMD-motsvarighet utrustad med mer kraftfull hårdvara. Den senare drar nytta av den mer sparsamma APU.
(-) Den maximala temperaturen på ovansidan är 49 °C / 120 F, jämfört med genomsnittet av 40.4 °C / 105 F , allt från 21.2 till 68.8 °C för klassen Gaming.
(-) Botten värms upp till maximalt 48 °C / 118 F, jämfört med genomsnittet av 43.2 °C / 110 F
(±) Vid tomgångsbruk är medeltemperaturen för ovansidan 37 °C / 99 F, jämfört med enhetsgenomsnittet på 33.9 °C / ### class_avg_f### F.
(-) När du spelar The Witcher 3 är medeltemperaturen för ovansidan 46 °C / 115 F, jämfört med enhetsgenomsnittet på 33.9 °C / ## #class_avg_f### F.
(-) Handledsstöden och pekplattan kan bli väldigt varma vid beröring med maximalt 44 °C / 111.2 F.
(-) Medeltemperaturen för handledsstödsområdet på liknande enheter var 28.8 °C / 83.8 F (-15.2 °C / -27.4 F).
| Alienware m16 R1 Intel Intel Core i7-13700HX, NVIDIA GeForce RTX 4060 Laptop GPU | Acer Predator Helios 16 PH16-71-731Q Intel Core i7-13700HX, NVIDIA GeForce RTX 4060 Laptop GPU | Medion Erazer Defender P40 Intel Core i7-13700HX, NVIDIA GeForce RTX 4060 Laptop GPU | Lenovo Legion Pro 5 16IRX8 Intel Core i7-13700HX, NVIDIA GeForce RTX 4060 Laptop GPU | Schenker XMG Pro 15 (E23) Intel Core i9-13900HX, NVIDIA GeForce RTX 4060 Laptop GPU | Aorus 15 BSF Intel Core i7-13700H, NVIDIA GeForce RTX 4070 Laptop GPU | Alienware m16 R1 AMD AMD Ryzen 9 7845HX, NVIDIA GeForce RTX 4080 Laptop GPU | |
|---|---|---|---|---|---|---|---|
| Heat | -2% | 18% | 12% | 7% | 4% | 9% | |
| Maximum Upper Side * (°C) | 49 | 41 16% | 42 14% | 42.8 13% | 50 -2% | 48 2% | 48 2% |
| Maximum Bottom * (°C) | 48 | 66 -38% | 45 6% | 50 -4% | 50 -4% | 47 2% | 39 19% |
| Idle Upper Side * (°C) | 40 | 36 10% | 28 30% | 29.6 26% | 33 17% | 39 2% | 37 7% |
| Idle Bottom * (°C) | 39 | 37 5% | 30 23% | 34 13% | 32 18% | 35 10% | 36.2 7% |
* ... mindre är bättre
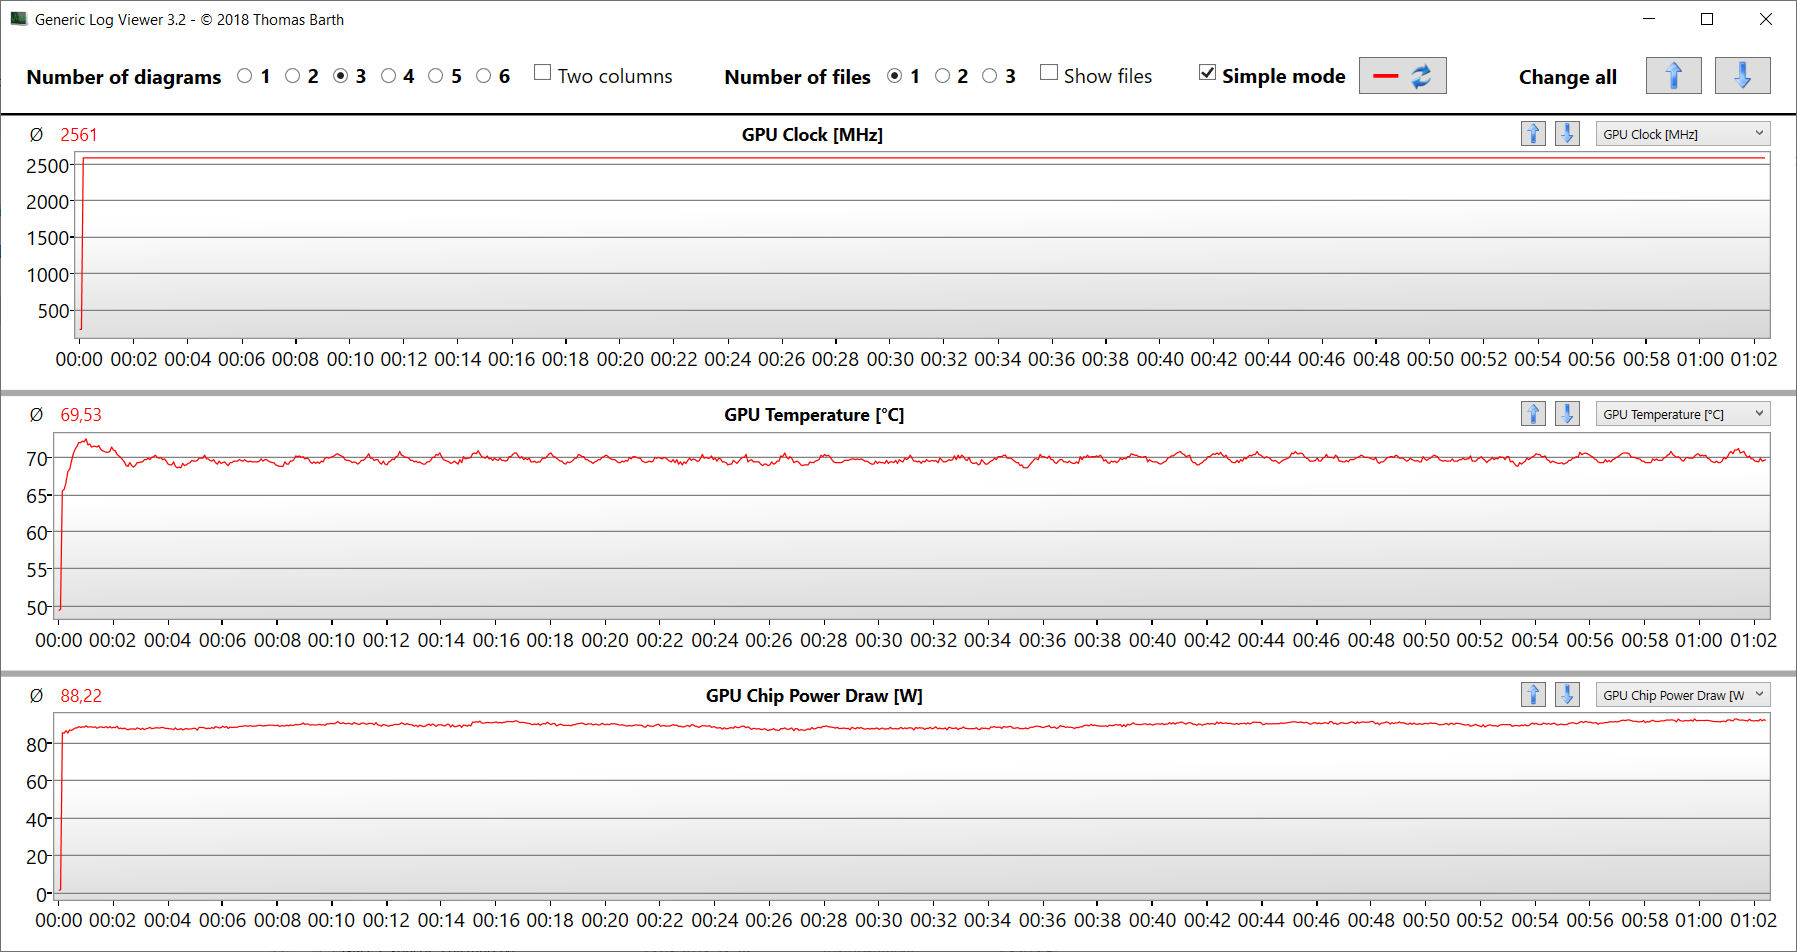
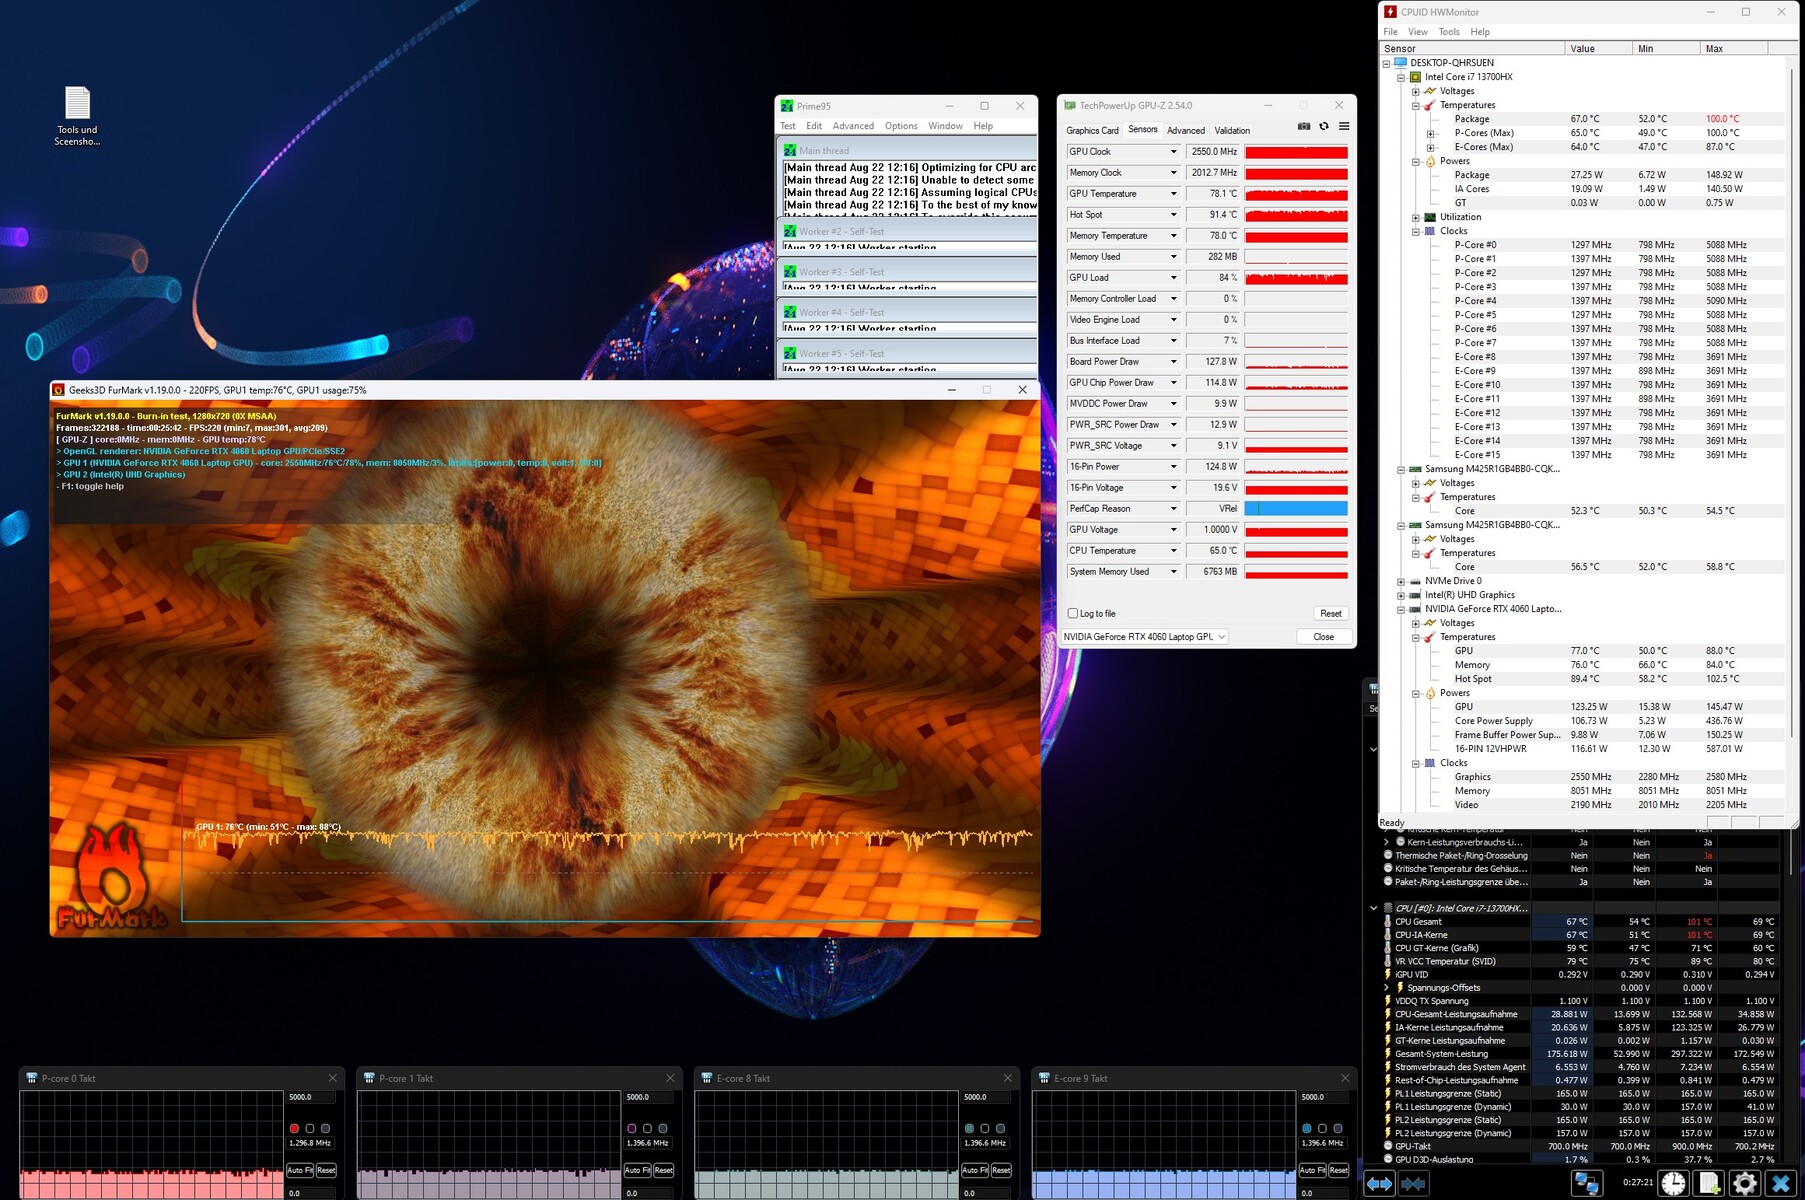
Stresstestning
Stresstestet (Prime95 och Furmark i kontinuerlig drift) representerar ett extremt scenario för att kontrollera systemets stabilitet under full belastning. Processorn (P: 4,2 GHz, E: 3,4 GHz) startar testet med hög klockfrekvens. När testet fortskrider sjunker klockfrekvensen något tills den plötsligt faller till värden under basklockan efter cirka 30 minuter. GPU:n arbetar konstant med full effekt.
Högtalare
Stereohögtalarna ger ett hyfsat ljud, men det finns knappt någon bas. Hörlurar eller externa högtalare rekommenderas för bättre ljudupplevelse.
Alienware m16 R1 Intel ljudanalys
(+) | högtalare kan spela relativt högt (87 dB)
Bas 100 - 315 Hz
(-) | nästan ingen bas - i genomsnitt 24% lägre än medianen
(±) | linjäriteten för basen är genomsnittlig (13.5% delta till föregående frekvens)
Mellan 400 - 2000 Hz
(+) | balanserad mellan - endast 1.4% från medianen
(+) | mids är linjära (3.3% delta till föregående frekvens)
Högsta 2 - 16 kHz
(+) | balanserade toppar - endast 3.5% från medianen
(+) | toppar är linjära (4.6% delta till föregående frekvens)
Totalt 100 - 16 000 Hz
(+) | det totala ljudet är linjärt (13.4% skillnad mot median)
Jämfört med samma klass
» 19% av alla testade enheter i den här klassen var bättre, 7% liknande, 74% sämre
» Den bästa hade ett delta på 6%, genomsnittet var 18%, sämst var 132%
Jämfört med alla testade enheter
» 14% av alla testade enheter var bättre, 4% liknande, 83% sämre
» Den bästa hade ett delta på 4%, genomsnittet var 24%, sämst var 134%
Acer Predator Helios 16 PH16-71-731Q ljudanalys
(±) | högtalarljudstyrkan är genomsnittlig men bra (76.12 dB)
Bas 100 - 315 Hz
(-) | nästan ingen bas - i genomsnitt 15% lägre än medianen
(-) | basen är inte linjär (15% delta till föregående frekvens)
Mellan 400 - 2000 Hz
(+) | balanserad mellan - endast 2.5% från medianen
(+) | mids är linjära (5.9% delta till föregående frekvens)
Högsta 2 - 16 kHz
(+) | balanserade toppar - endast 2.9% från medianen
(±) | linjäriteten för toppar är genomsnittlig (8.4% delta till föregående frekvens)
Totalt 100 - 16 000 Hz
(+) | det totala ljudet är linjärt (13.6% skillnad mot median)
Jämfört med samma klass
» 20% av alla testade enheter i den här klassen var bättre, 7% liknande, 73% sämre
» Den bästa hade ett delta på 6%, genomsnittet var 18%, sämst var 132%
Jämfört med alla testade enheter
» 15% av alla testade enheter var bättre, 4% liknande, 82% sämre
» Den bästa hade ett delta på 4%, genomsnittet var 24%, sämst var 134%
Energihantering - m16 levererar magra drifttider
Strömförbrukning
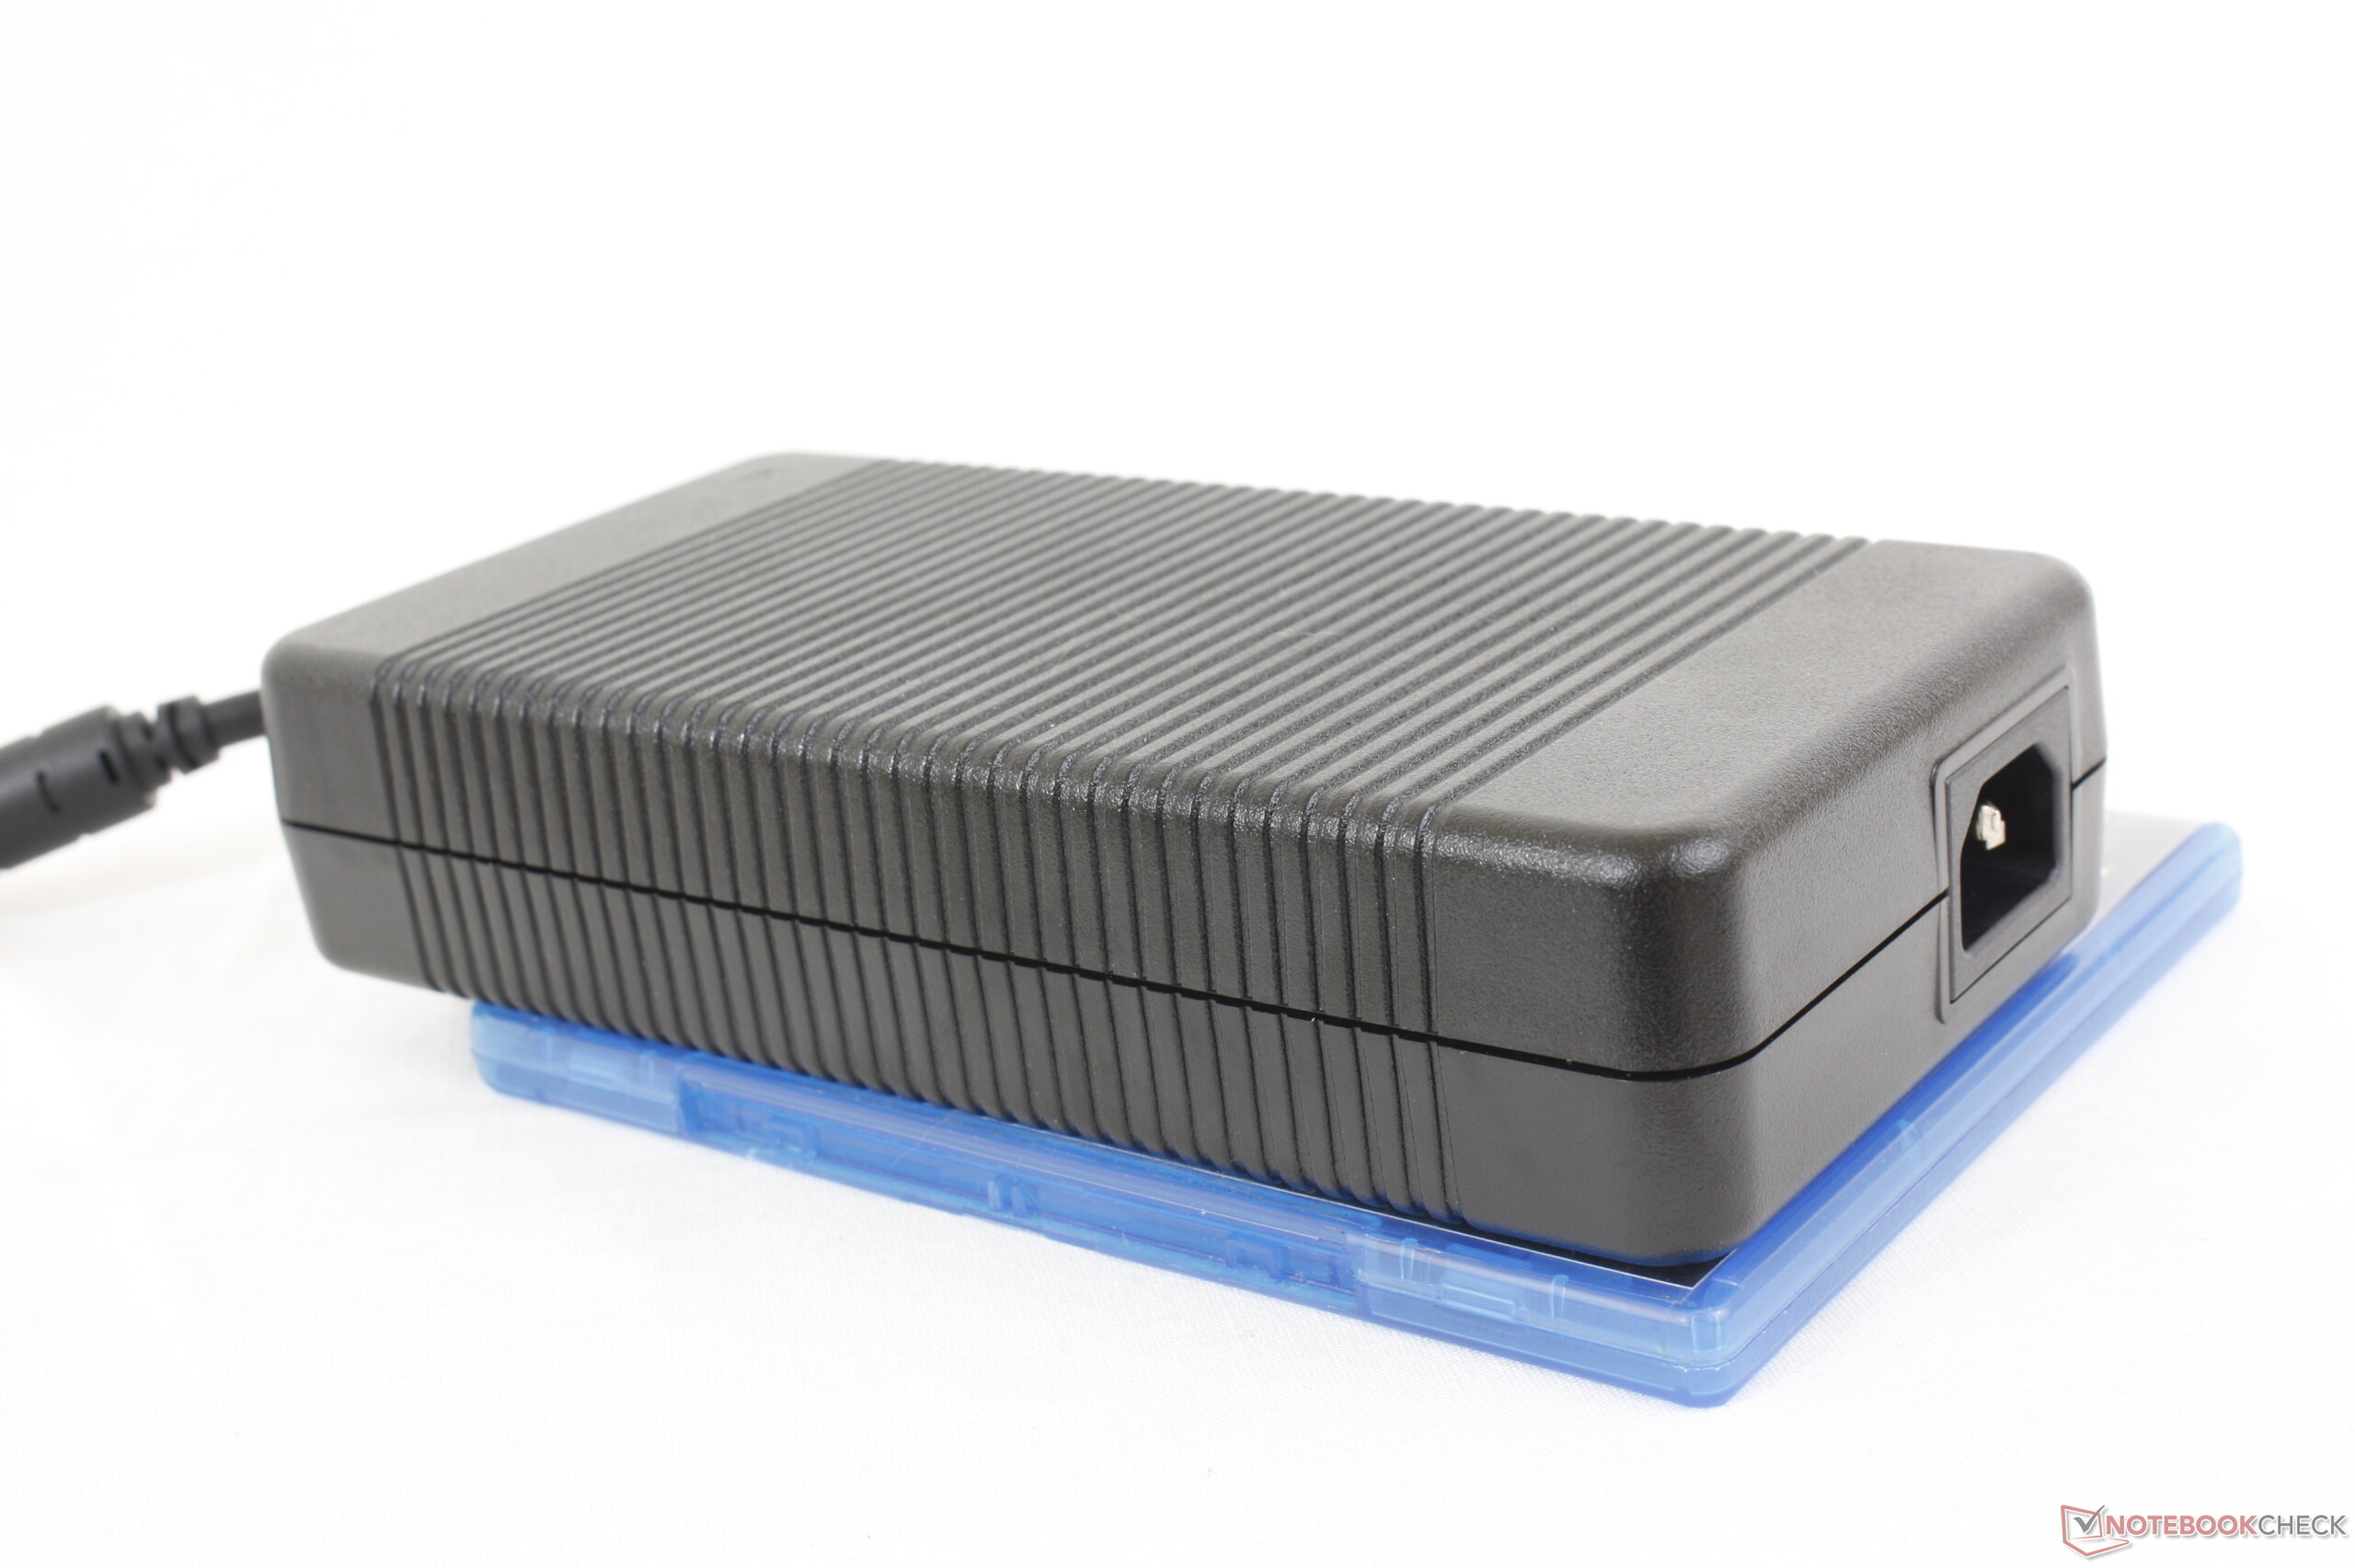
M16 uppvisar inga avvikelser när det gäller energiförbrukning: värdena ligger på en normal nivå för den installerade hårdvaran. Testet Witcher 3 körs med konstant strömförbrukning. Under stresstestet minskar efterfrågan betydligt över tiden. Strömförsörjningen (330 watt) är därmed tillräckligt dimensionerad.
| Av/Standby | |
| Låg belastning | |
| Hög belastning |
|
Förklaring:
min: | |
| Alienware m16 R1 Intel i7-13700HX, GeForce RTX 4060 Laptop GPU | Acer Predator Helios 16 PH16-71-731Q i7-13700HX, GeForce RTX 4060 Laptop GPU | Medion Erazer Defender P40 i7-13700HX, GeForce RTX 4060 Laptop GPU | Lenovo Legion Pro 5 16IRX8 i7-13700HX, GeForce RTX 4060 Laptop GPU | Schenker XMG Pro 15 (E23) i9-13900HX, GeForce RTX 4060 Laptop GPU | Aorus 15 BSF i7-13700H, GeForce RTX 4070 Laptop GPU | Alienware m16 R1 AMD R9 7845HX, GeForce RTX 4080 Laptop GPU | Genomsnitt NVIDIA GeForce RTX 4060 Laptop GPU | Genomsnitt av klass Gaming | |
|---|---|---|---|---|---|---|---|---|---|
| Power Consumption | -12% | 13% | -46% | -62% | 17% | -133% | 6% | -11% | |
| Idle Minimum * (Watt) | 10 | 15.9 -59% | 8 20% | 24.5 -145% | 21.6 -116% | 7 30% | 39 -290% | 11.5 ? -15% | 13.3 ? -33% |
| Idle Average * (Watt) | 14 | 20.5 -46% | 12 14% | 29.2 -109% | 29 -107% | 12 14% | 44.6 -219% | 16 ? -14% | 19 ? -36% |
| Idle Maximum * (Watt) | 21 | 20.9 -0% | 18 14% | 34.3 -63% | 42.7 -103% | 20 5% | 68.1 -224% | 20.3 ? 3% | 24.5 ? -17% |
| Load Average * (Watt) | 119 | 106 11% | 101 15% | 98.7 17% | 190 -60% | 94 21% | 129.8 -9% | 92.9 ? 22% | 108.1 ? 9% |
| Witcher 3 ultra * (Watt) | 186.7 | 175 6% | 180.8 3% | 178.6 4% | 189 -1% | 175.8 6% | 285 -53% | ||
| Load Maximum * (Watt) | 323 | 276 15% | 284 12% | 249.6 23% | 269 17% | 247 24% | 327.3 -1% | 210 ? 35% | 254 ? 21% |
* ... mindre är bättre
Power consumption Witcher 3 / Stress test
Power consumption with an external monitor
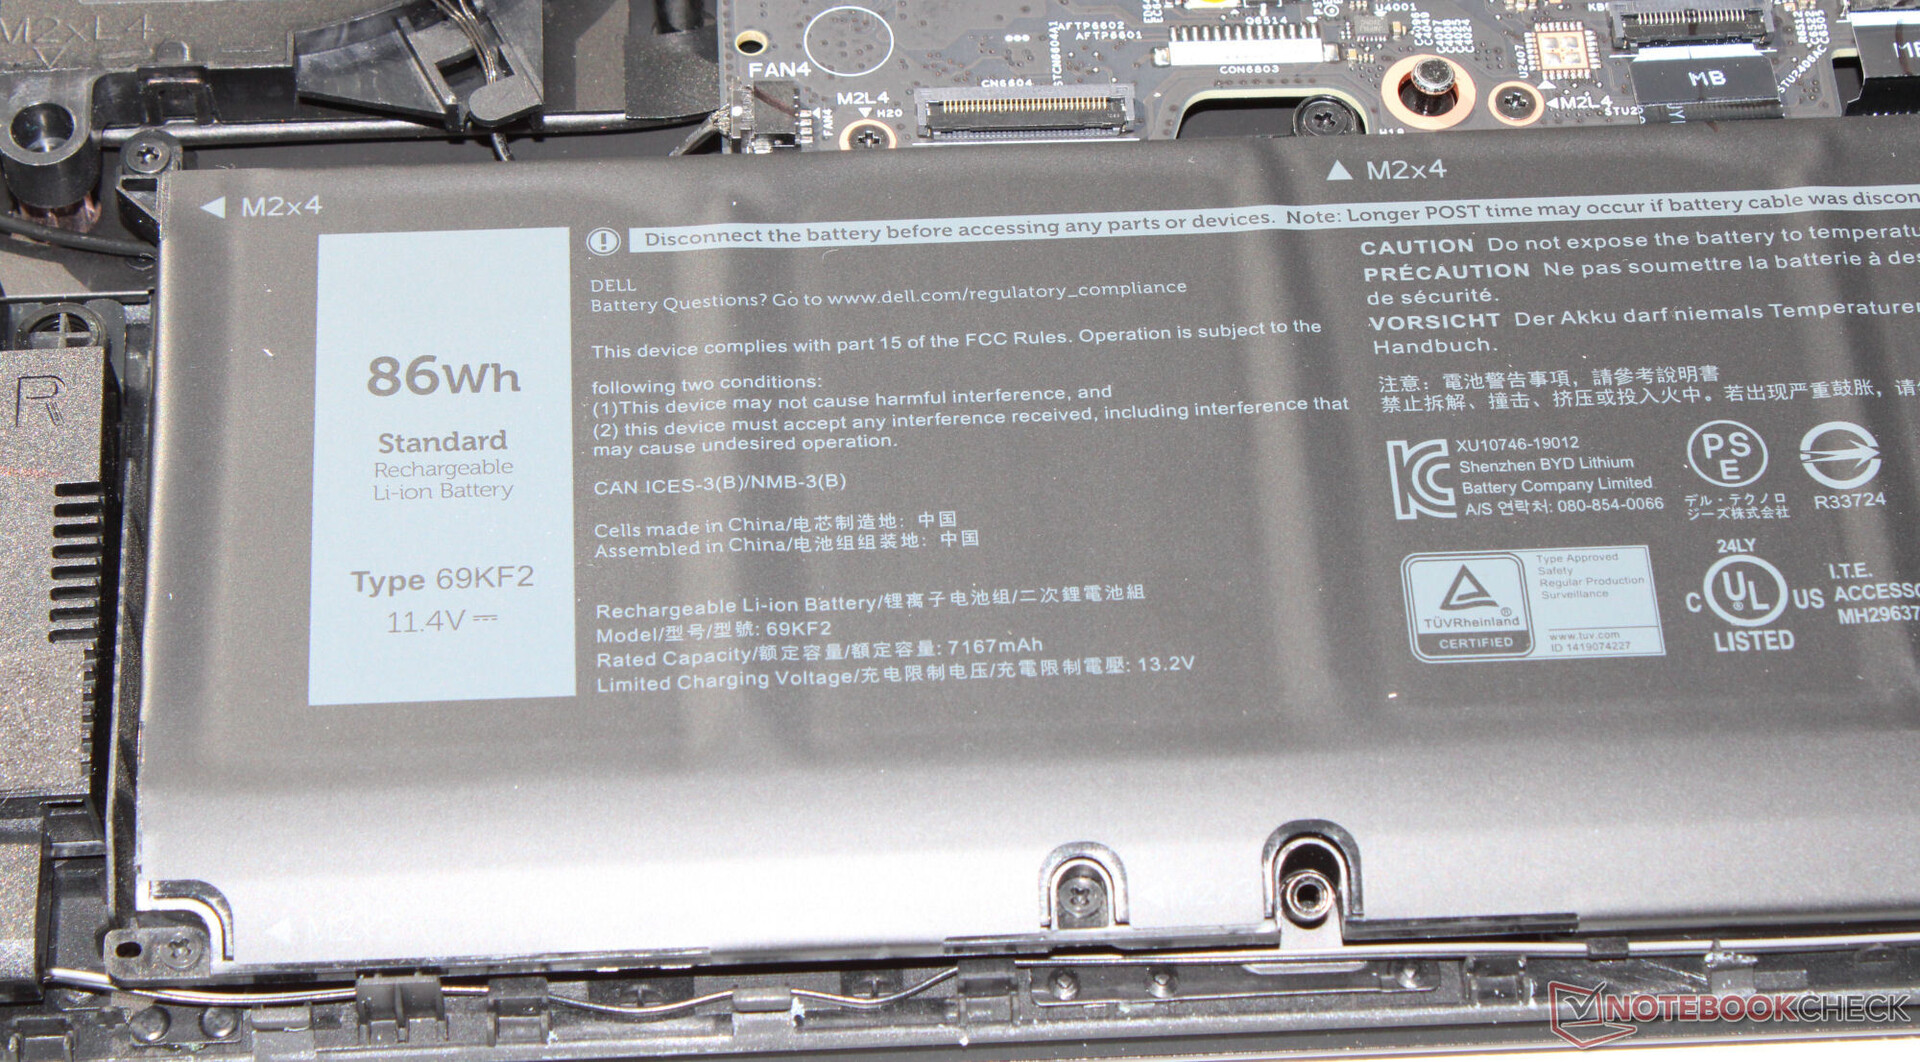
Batteritid
16-tummaren uppnår en körtid på 4:46 h och 5:36 h i WLAN-testet (laddar webbplatser via ett skript) respektive videotestet (kortfilm Big Buck Bunny, H.264-kodning, FHD, i en loop). Under båda testerna var notebookens energisparfunktioner avaktiverade och skärmens ljusstyrka inställd på ca 150 cd/m². De trådlösa modulerna var också inaktiverade för videotestet.
Sammantaget erbjuder m16 magra drifttider. Vissa konkurrenter levererar mycket bättre värden här. Fördelen överAMD: s systermodellberor sannolikt på det senare aktiva dGPU-läget.
| Alienware m16 R1 Intel i7-13700HX, GeForce RTX 4060 Laptop GPU, 86 Wh | Acer Predator Helios 16 PH16-71-731Q i7-13700HX, GeForce RTX 4060 Laptop GPU, 90 Wh | Medion Erazer Defender P40 i7-13700HX, GeForce RTX 4060 Laptop GPU, 73 Wh | Lenovo Legion Pro 5 16IRX8 i7-13700HX, GeForce RTX 4060 Laptop GPU, 80 Wh | Schenker XMG Pro 15 (E23) i9-13900HX, GeForce RTX 4060 Laptop GPU, 80 Wh | Aorus 15 BSF i7-13700H, GeForce RTX 4070 Laptop GPU, 99 Wh | Alienware m16 R1 AMD R9 7845HX, GeForce RTX 4080 Laptop GPU, 86 Wh | Genomsnitt av klass Gaming | |
|---|---|---|---|---|---|---|---|---|
| Batteridrifttid | 18% | 25% | -18% | 55% | 92% | -27% | 44% | |
| Reader / Idle (h) | 6.4 | 8.8 38% | 6.7 5% | 10.9 70% | 4 -37% | 8.71 ? 36% | ||
| H.264 (h) | 5.6 | 4.8 -14% | 5.7 2% | 9 61% | 8.26 ? 48% | |||
| WiFi v1.3 (h) | 4.8 | 5.6 17% | 6.2 29% | 3.4 -29% | 5.7 19% | 10.3 115% | 3.7 -23% | 7.01 ? 46% |
| Load (h) | 1 | 1.5 50% | 1.3 30% | 0.7 -30% | 1.9 90% | 2.2 120% | 0.8 -20% | 1.47 ? 47% |
| Witcher 3 ultra (h) | 1.5 |
För
Emot
Omdöme - Kraftfull spelmaskin
Vår variant av Alienware m16 R1 - instegsmodellen i serien - är utformad för spel och rendering i QHD+. Den Core i7-13700HX och GeForce RTX 4060 ger den nödvändiga kraften. Båda komponenterna arbetar med mestadels höga klockhastigheter och en acceptabel kompromiss mellan prestanda och ljud är möjlig.
Dell levererar en kraftfull QHD + gaming-notebook i Alienware m16 R1. Endast sekundära egenskaper förtjänar kritik.
IPS-panelen (16 tum, 2560x1600, sRGB, G-Sync) gjorde ett gott intryck överlag. Alternativt kan två andra paneler med högre uppdateringsfrekvenser och större färgrymdstäckning (DCI-P3) väljas. Hårddiskutbudet (512 GB) är ganska tunt; 1 TB eller 2 TB skulle vara mer lämpligt för priset på 1900 EUR. Batteritiden är också ganska medioker.
Två Thunderbolt 4-portar (Power Delivery, Displayport) säkerställer rikliga alternativ för expansion (extern GPU, dockning). Strömförsörjning till notebooken via USB C är inte möjlig; USB C-portarna ger bara ström.
Ett alternativ är Acer Predator Helios 16 PH16-71. Den erbjuder i stort sett samma hårdvarukonfiguration, men mer hårddiskutrymme (1 TB). Dessutom har den en ljusstarkare skärm.
Pris och tillgänglighet
En konfiguration som liknar vår variant av Alienware m16 R1, men med en 1 TB hårddisk, är tillgänglig i USA via Best Buy till ett pris av 1 999,99 USD.
Priserna gäller från 05.09.2023 och kan komma att ändras.
Alienware m16 R1 Intel
- 09/04/2023 v7 (old)
Sascha Mölck
Genomskinlighet
Valet av enheter som ska granskas görs av vår redaktion. Testprovet gavs till författaren som ett lån av tillverkaren eller återförsäljaren för denna recension. Långivaren hade inget inflytande på denna recension och inte heller fick tillverkaren en kopia av denna recension innan publiceringen. Det fanns ingen skyldighet att publicera denna recension. Som ett oberoende medieföretag är Notebookcheck inte föremål för auktoritet från tillverkare, återförsäljare eller förlag.
This is how Notebookcheck is testingEvery year, Notebookcheck independently reviews hundreds of laptops and smartphones using standardized procedures to ensure that all results are comparable. We have continuously developed our test methods for around 20 years and set industry standards in the process. In our test labs, high-quality measuring equipment is utilized by experienced technicians and editors. These tests involve a multi-stage validation process. Our complex rating system is based on hundreds of well-founded measurements and benchmarks, which maintains objectivity.
Price comparison

