Intel Core i9-13900HK prestandadebut: Alienware x16 R1 laptop recension

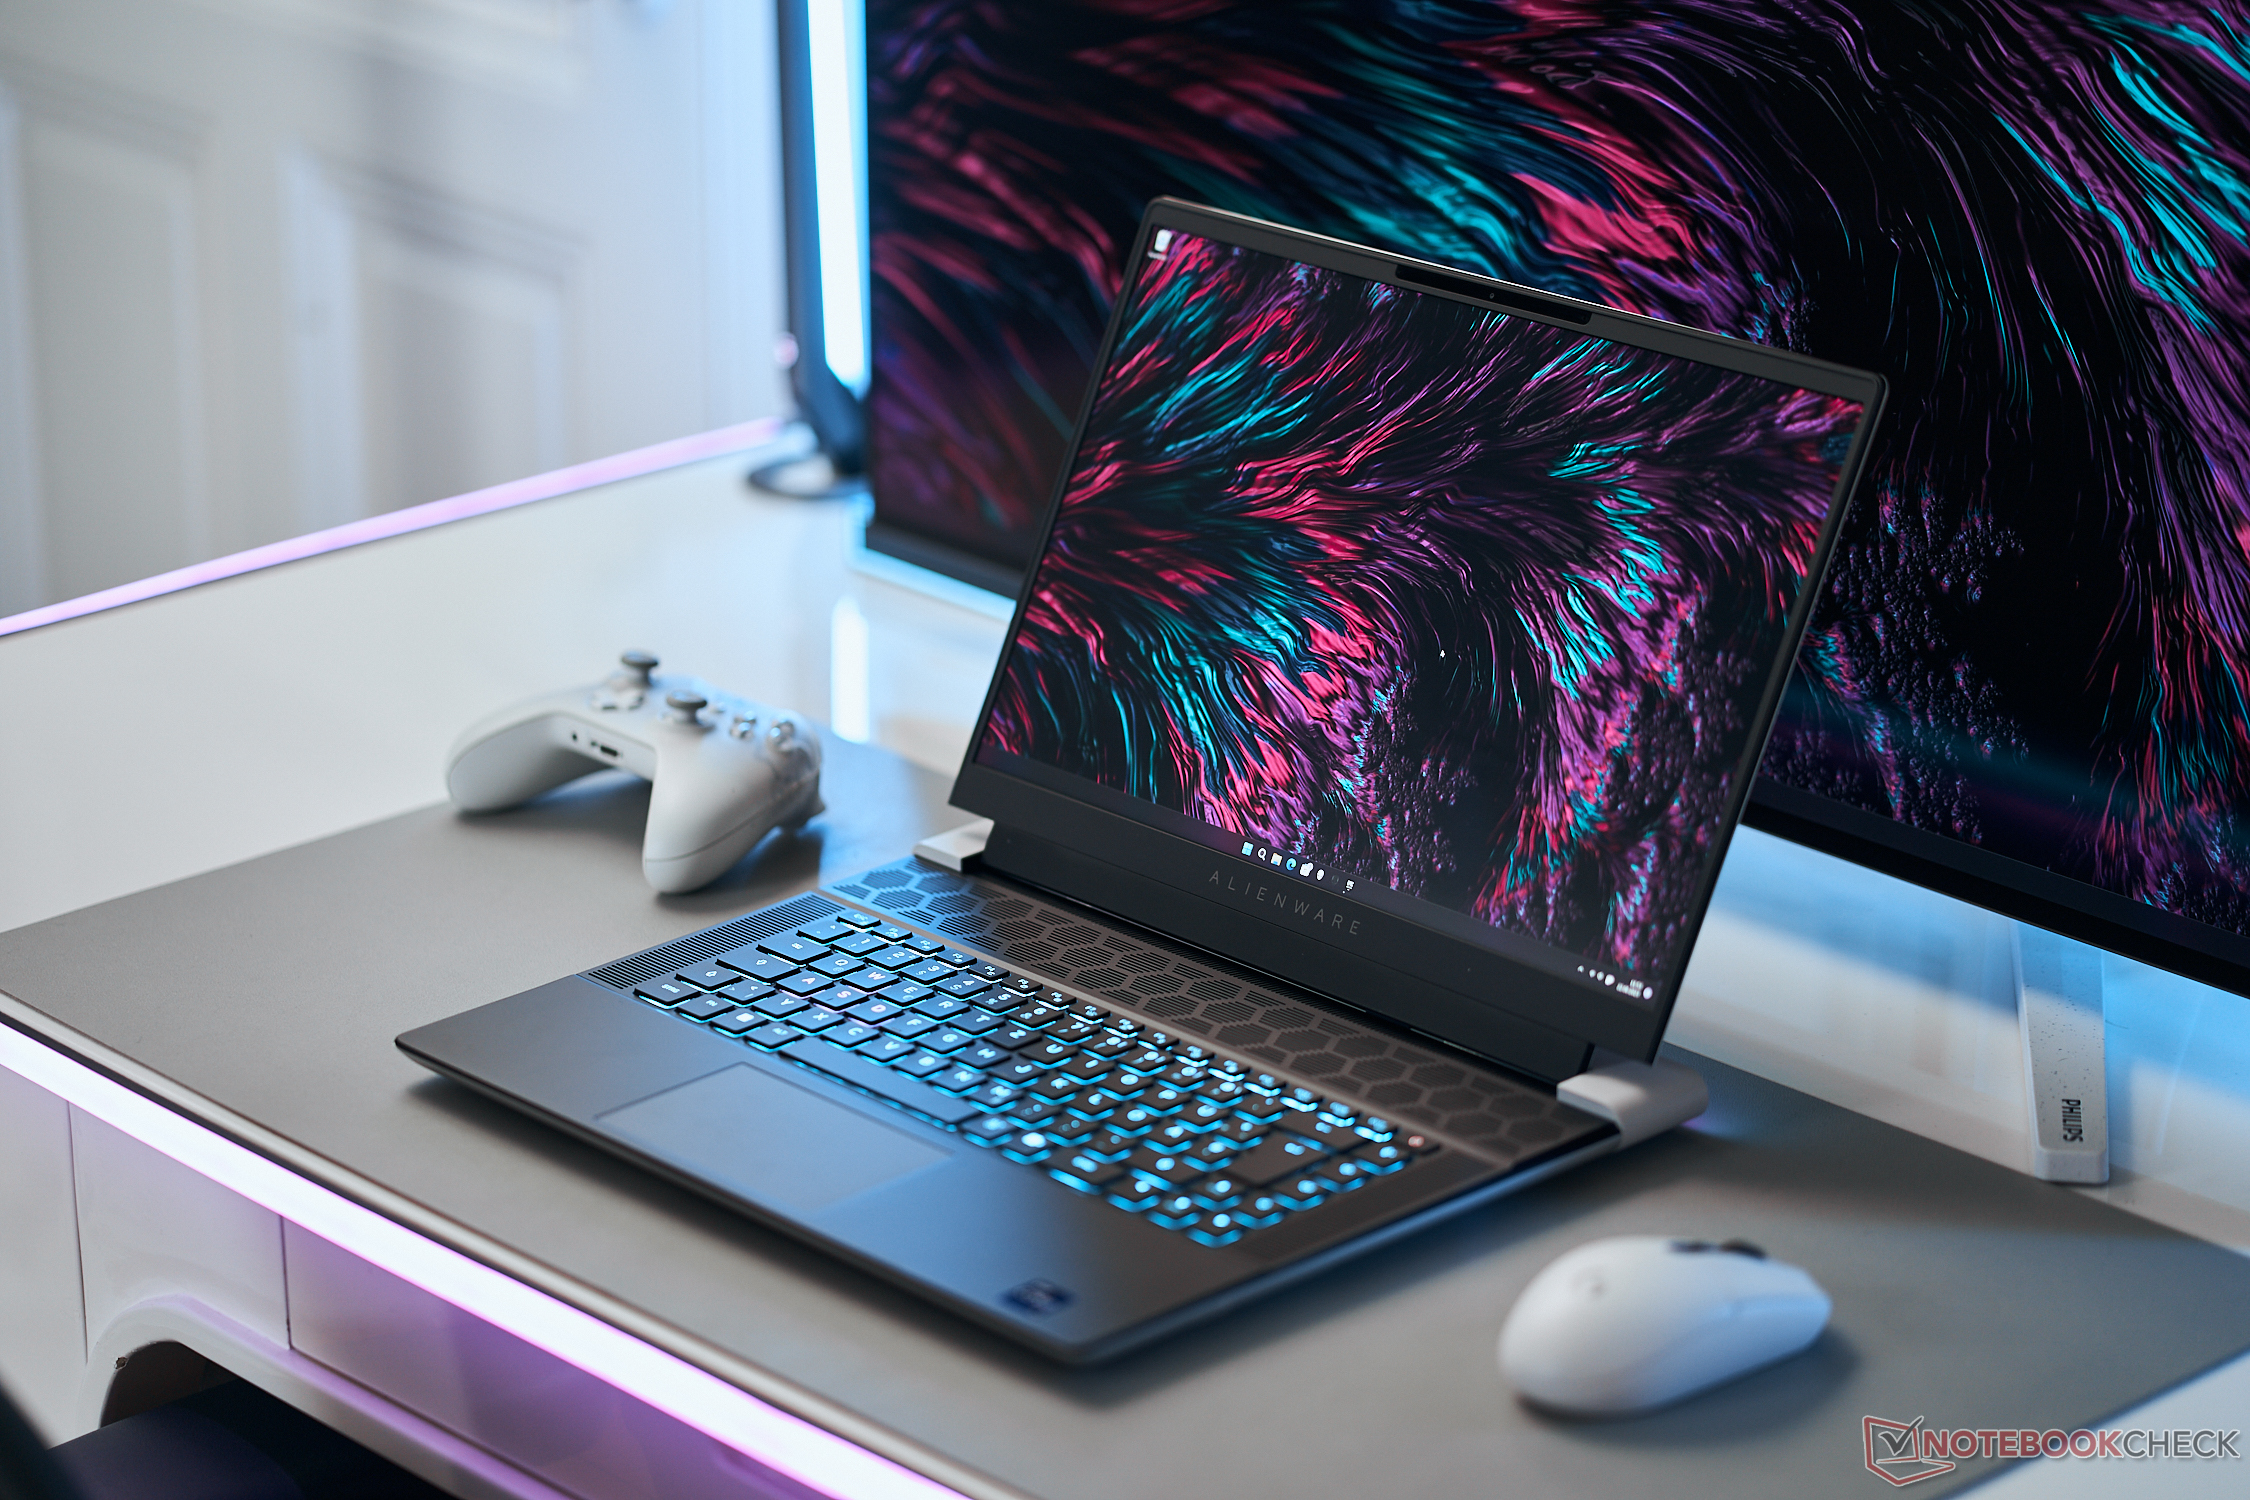
Avtäckt på CES 2023alienware x16 R1 är den andra 16-tumsmodellen i familjen efter den tjockare och kraftfullare Alienware m16 som vi ännu inte har testat. De två modellerna kompletterar den befintliga 14-tums, 15-tums, 17-tums och 18-tums Alienware-alternativ som redan finns på marknaden.
Vår testenhet är en avancerad konfiguration med 13:e generationens Raptor Lake Core i9-13900HK CPU, GeForce RTX 4080 GPU och 16,0-tums 2560 x 1600 240 Hz IPS-skärm för cirka 3350 USD. Billigare eller dyrare konfigurationer finns tillgängliga från Core i7-13620H, 1200p-skärm och RTX 4050 GPU upp till RTX 4090 för $2200 till över $4000.
Alternativ till Alienware x16 R1 inkluderar andra 16-tums bärbara speldatorer som Lenovo Legion Pro 7, Asus ROG Zephyrus M16, Razer Blade 16, eller HP Omen 16. Just denna storlekskategori har ökat i popularitet under de senaste åren.
Fler recensioner av Dell:
Potentiella konkurrenter i jämförelse
Gradering | Datum | Modell | Vikt | Höjd | Storlek | Upplösning | Pris |
|---|---|---|---|---|---|---|---|
| 88.4 % v7 (old) | 06/2023 | Alienware x16 R1 i9-13900HK, GeForce RTX 4080 Laptop GPU | 2.6 kg | 18.57 mm | 16.00" | 2560x1600 | |
| 88.8 % v7 (old) | 06/2023 | Lenovo Legion Pro 7 RTX4090 i9-13900HX, GeForce RTX 4090 Laptop GPU | 2.7 kg | 26 mm | 16.00" | 2560x1600 | |
| 89.4 % v7 (old) | 03/2023 | Asus ROG Zephyrus M16 GU604VY-NM042X i9-13900H, GeForce RTX 4090 Laptop GPU | 2.3 kg | 22.9 mm | 16.00" | 2560x1600 | |
| 91.2 % v7 (old) | 02/2023 | Razer Blade 16 Early 2023 i9-13950HX, GeForce RTX 4080 Laptop GPU | 2.4 kg | 21.99 mm | 16.00" | 2560x1600 | |
| 86.1 % v7 (old) | 10/2022 | Dell G16 7620 i7-12700H, GeForce RTX 3060 Laptop GPU | 2.6 kg | 26.9 mm | 16.00" | 2560x1600 | |
| 86.1 % v7 (old) | 01/2023 | Alienware m17 R5 (R9 6900HX, RX 6850M XT) R9 6900HX, Radeon RX 6850M XT | 3.4 kg | 26.7 mm | 17.00" | 3840x2160 |
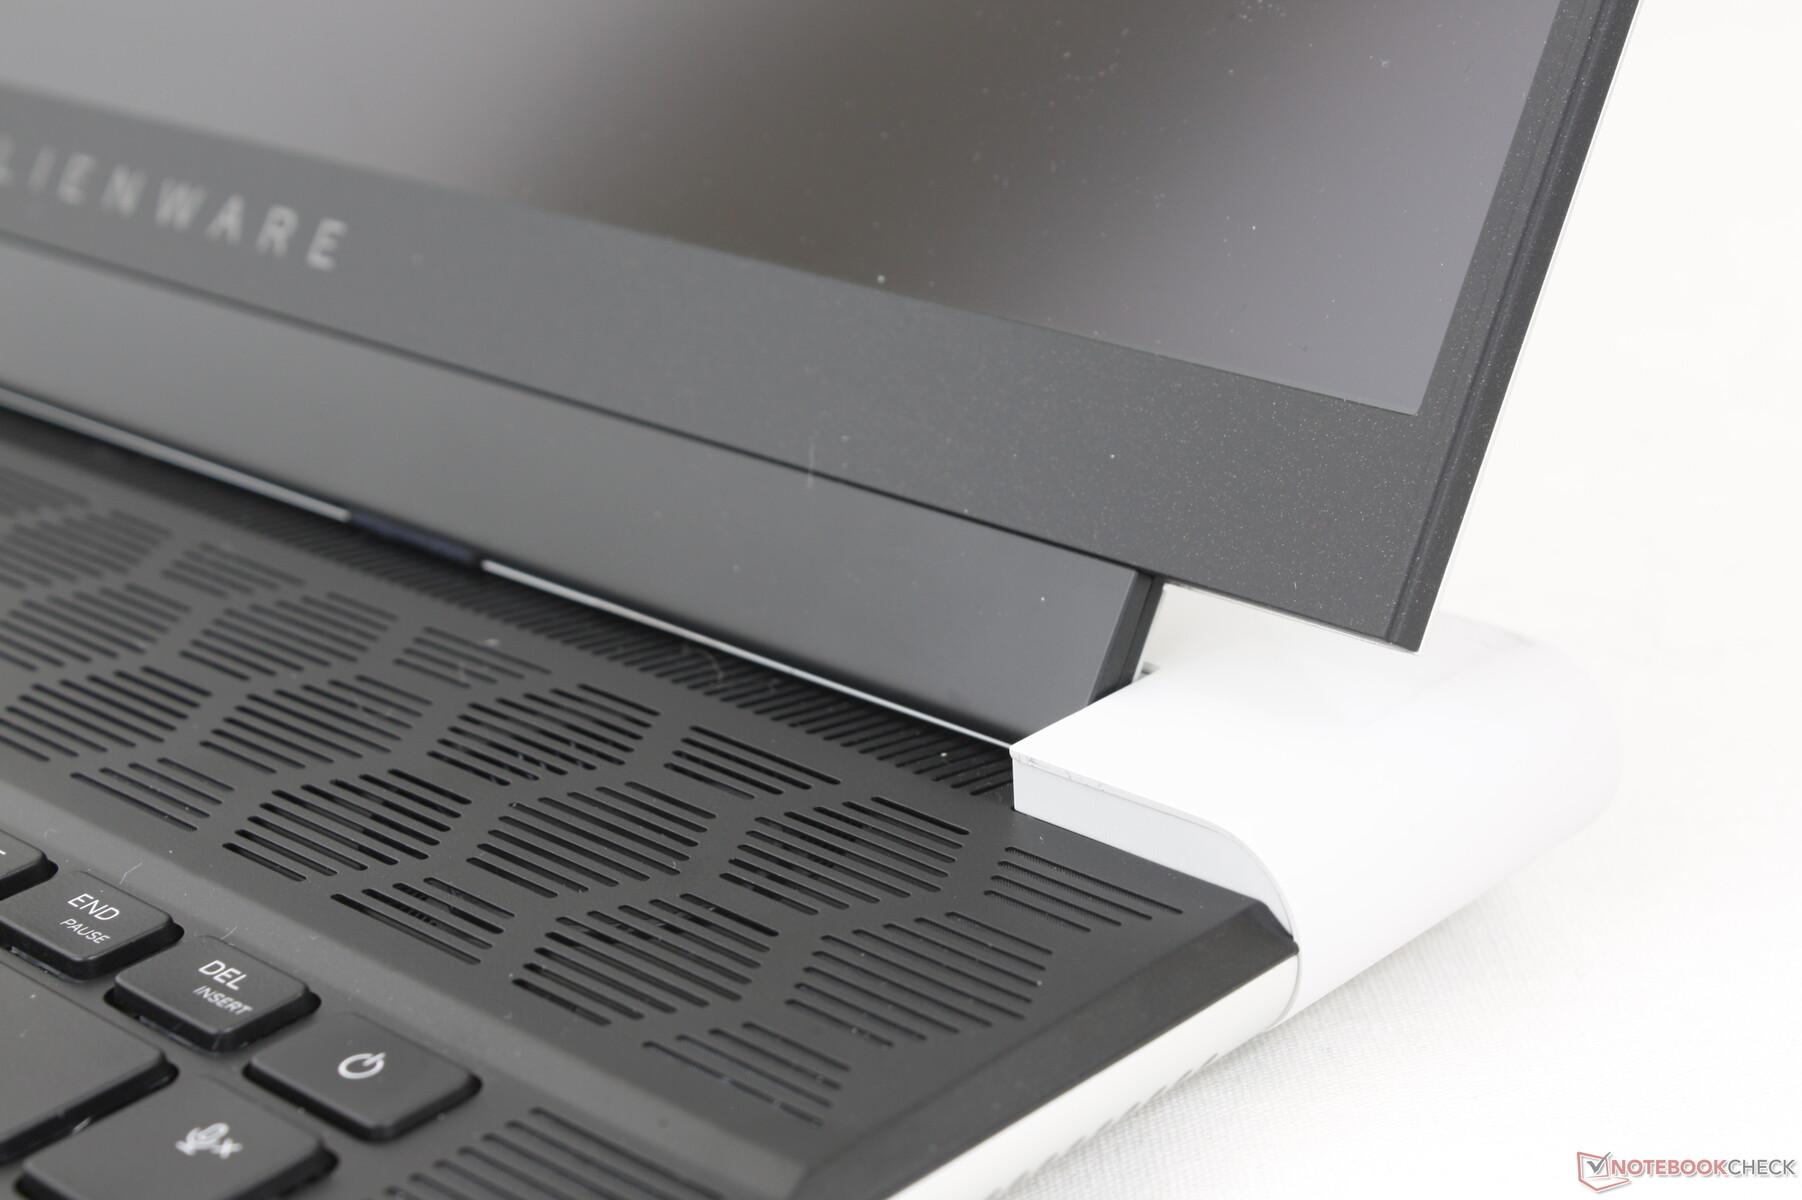
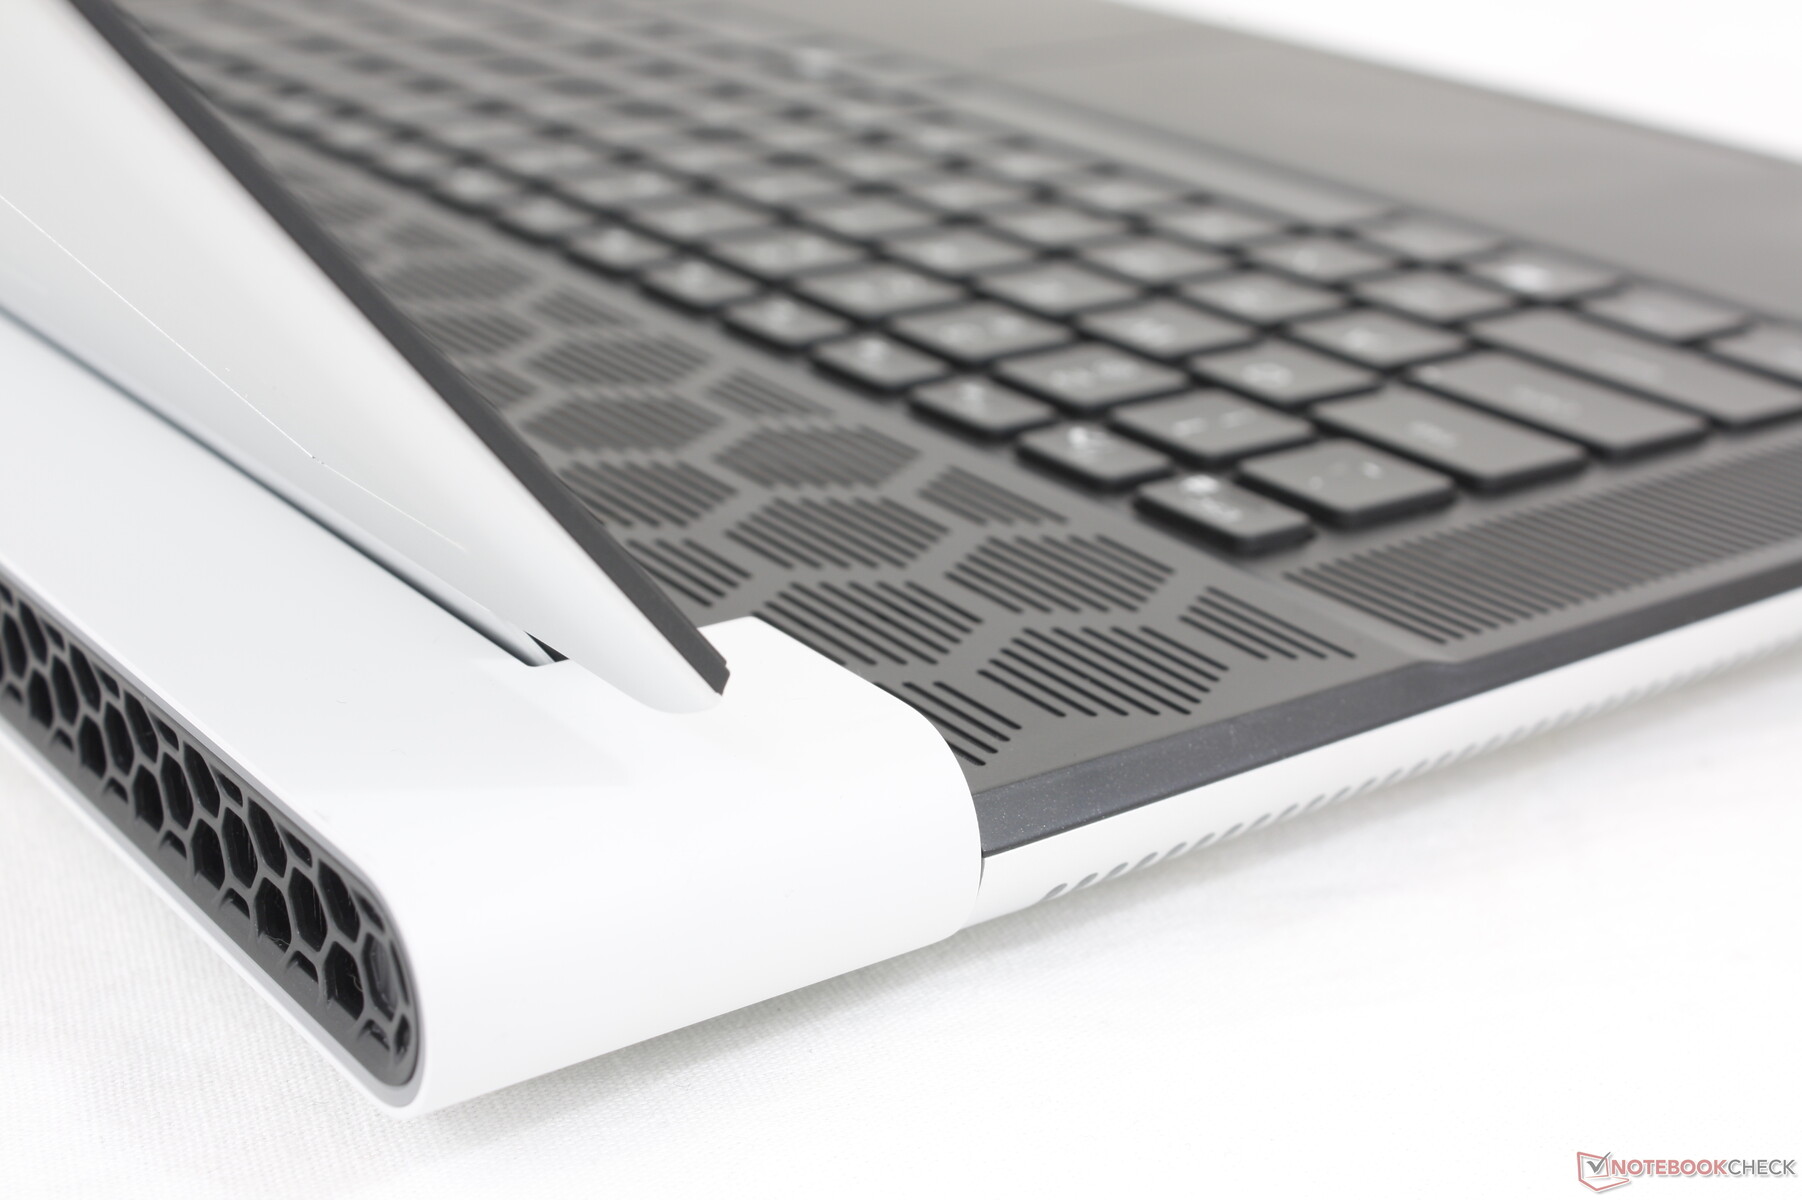
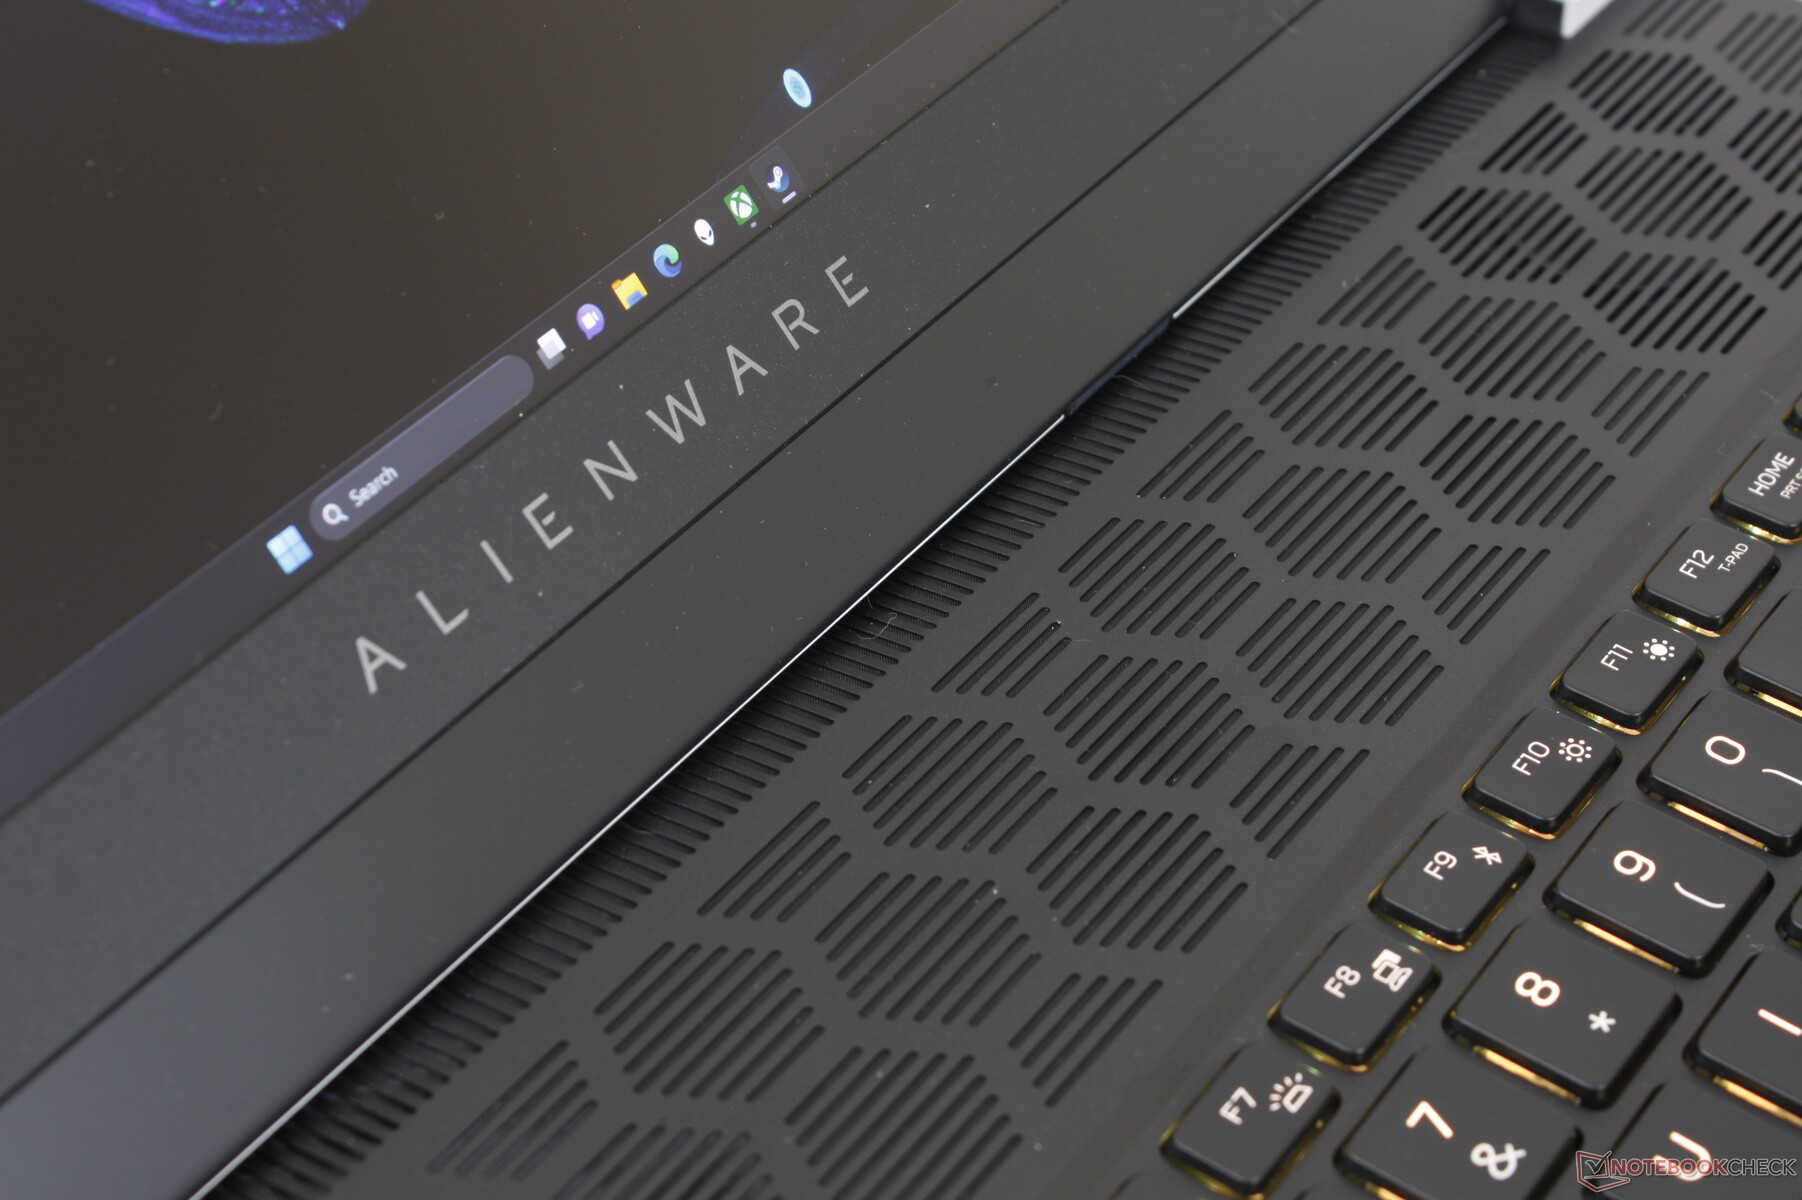
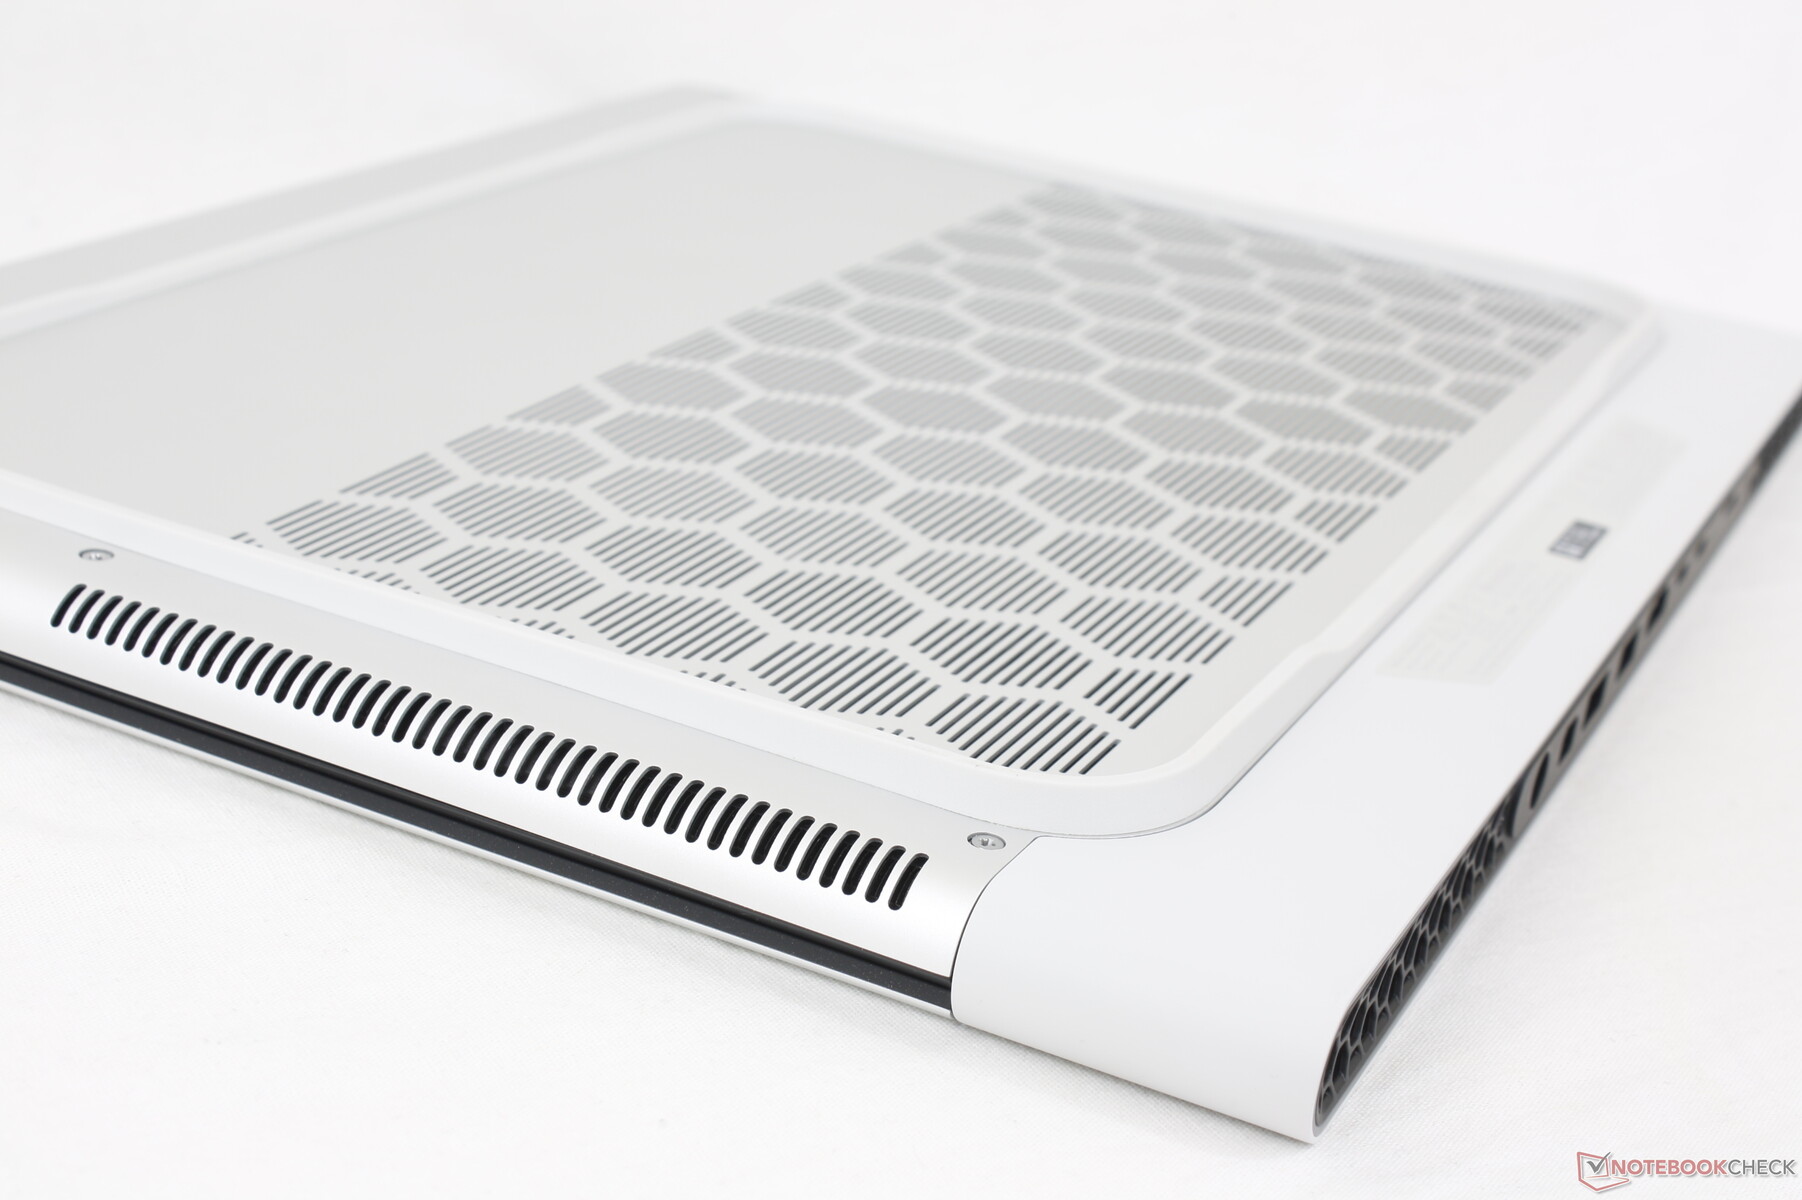
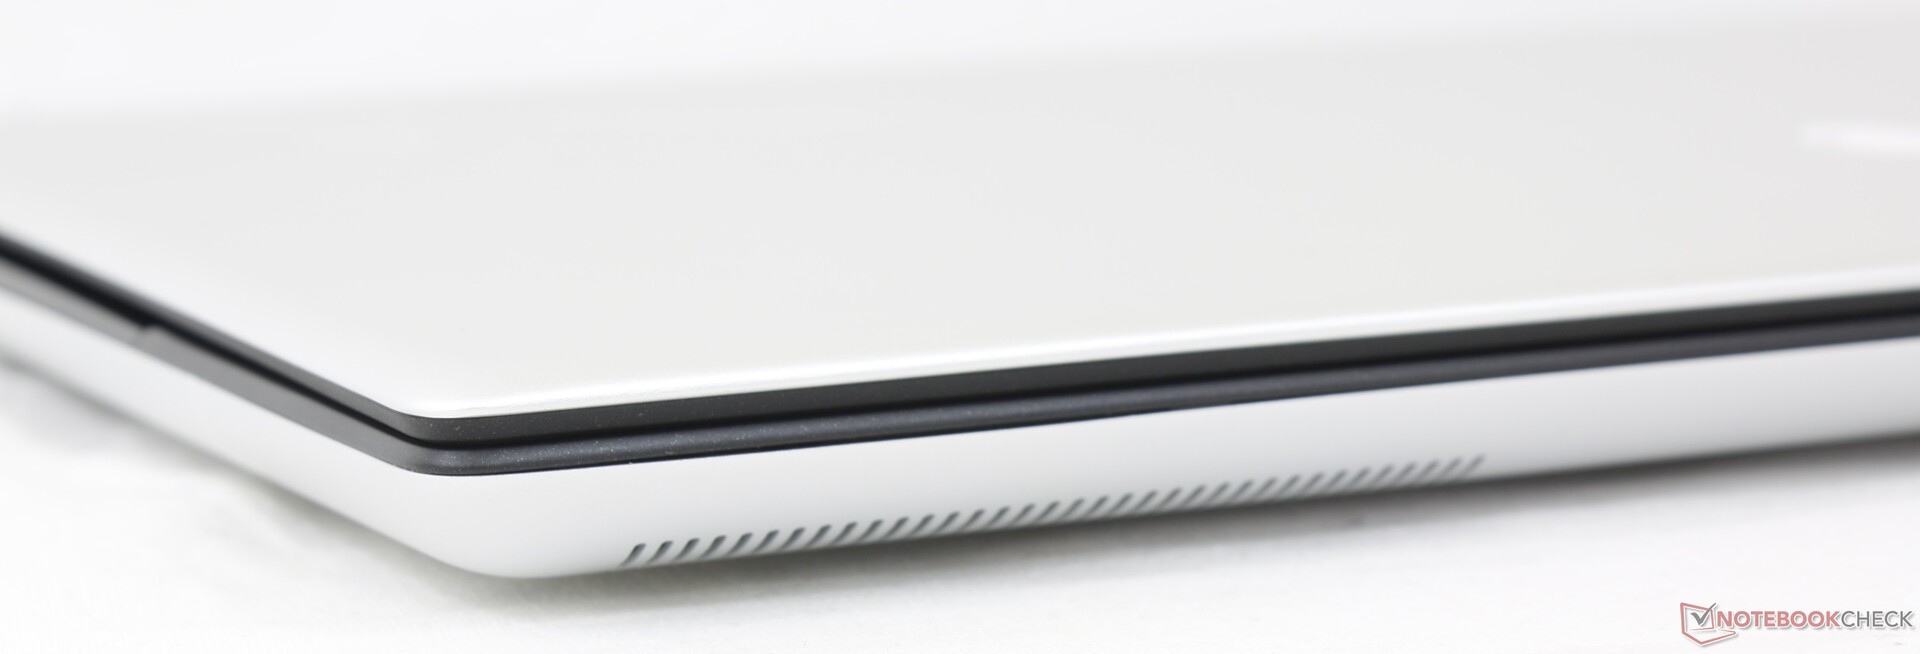
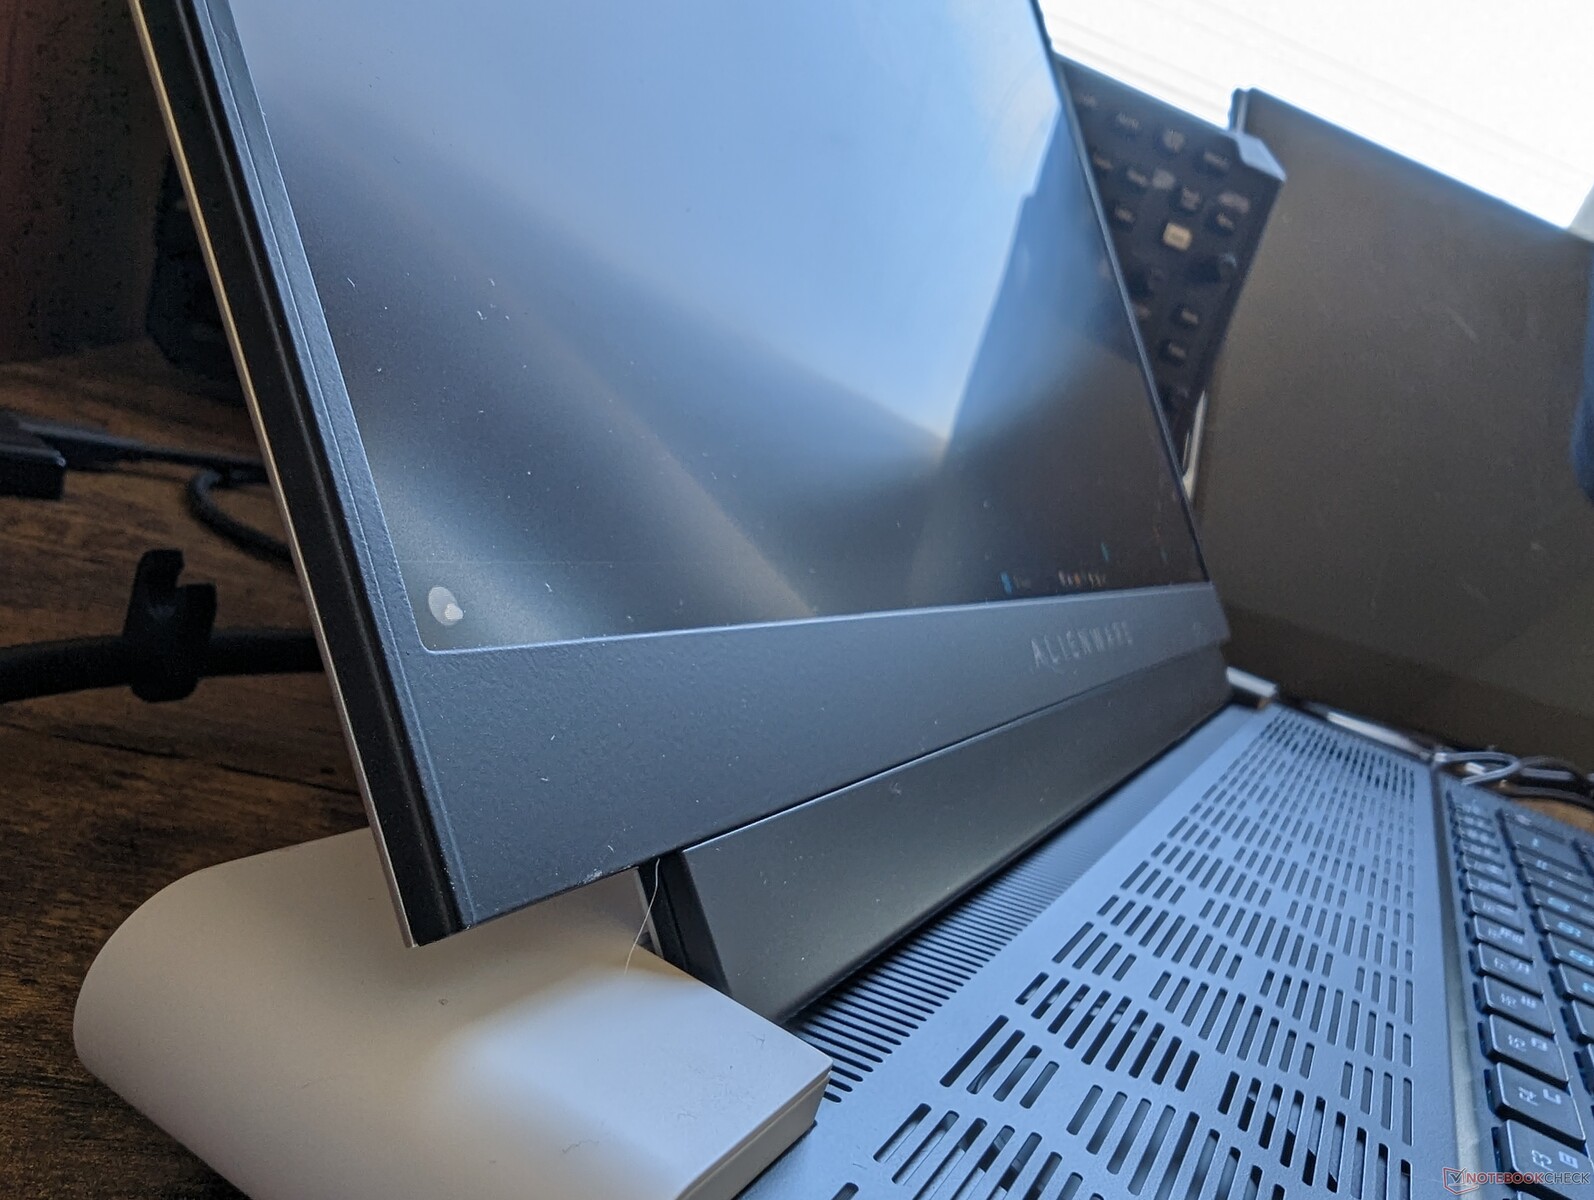
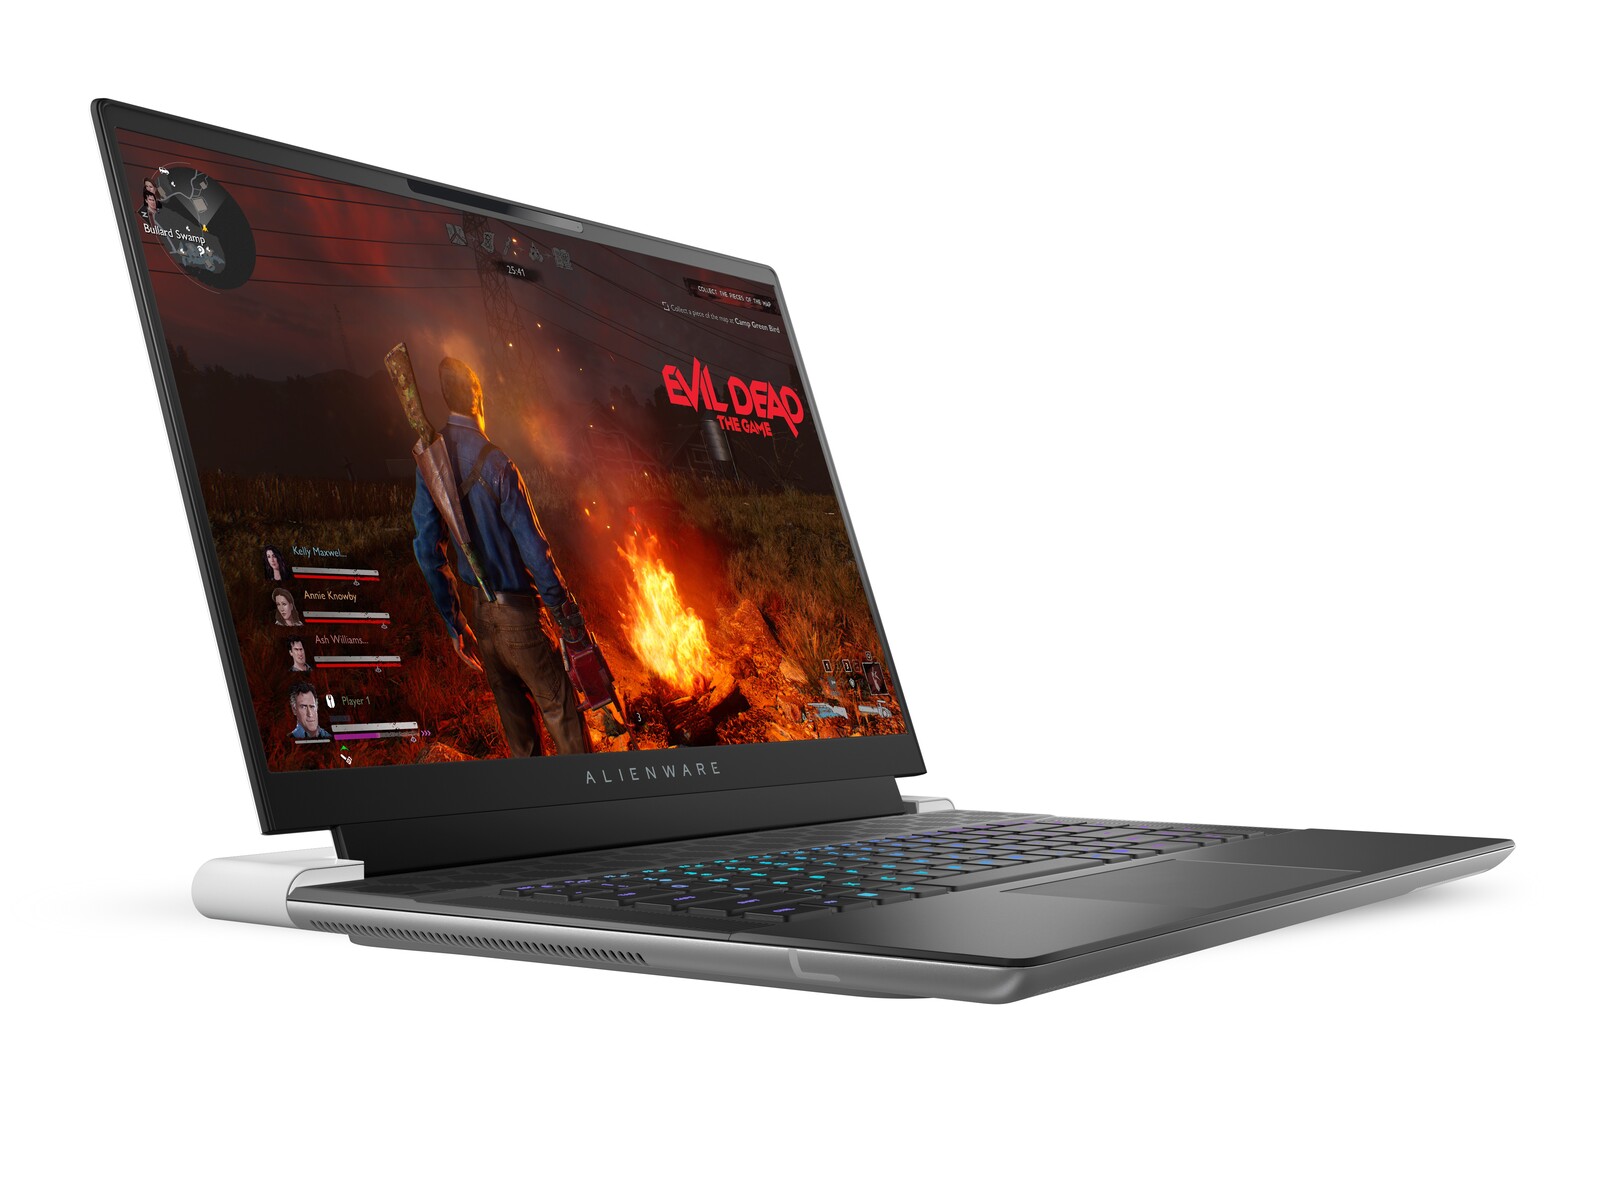
Fodral - Utpräglat Alienware
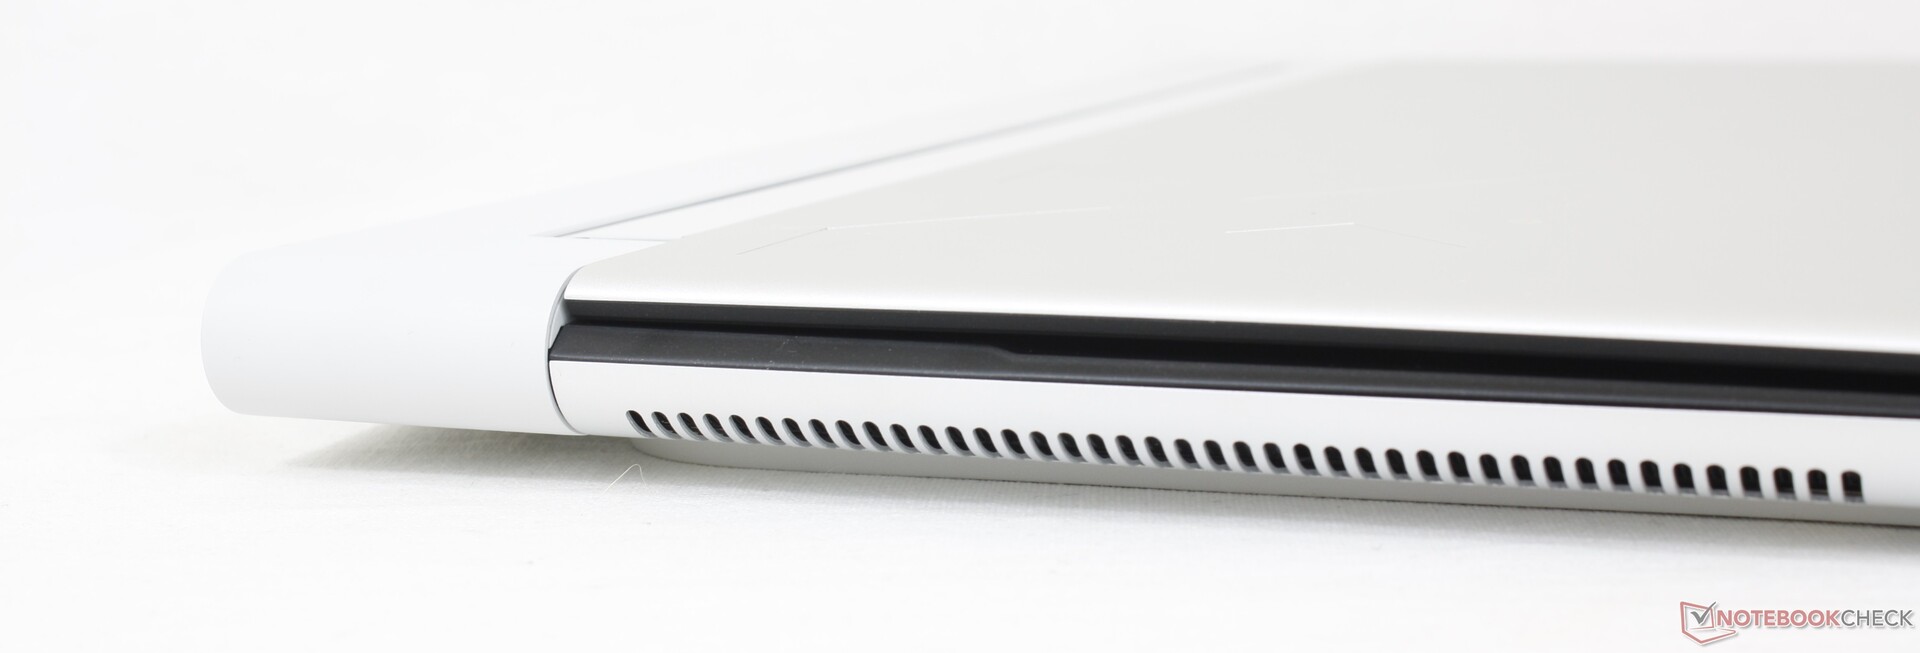
Chassit har mycket gemensamt med Alienware x15 R2 och X17 R2 eftersom de alla delar Legend 3-designspråket. Den tvåfärgade svarta och vita, anodiserade aluminium- och magnesiumlegeringen och RGB-ringen längs baksidan hjälper till att visuellt särskilja Alienware-serien från havet av andra bärbara speldatorer. Huruvida den är mer attraktiv eller önskvärd än konkurrerande modeller beror på användarens preferenser.
Chassits styvhet är utmärkt, särskilt runt basen där vridningar och förvrängningar är minimala. Locket och gångjärnen är dock inte så styva som vi skulle vilja jämfört med de styvare skärmarna på Asus Strix Scar-serien eller Blade 16.
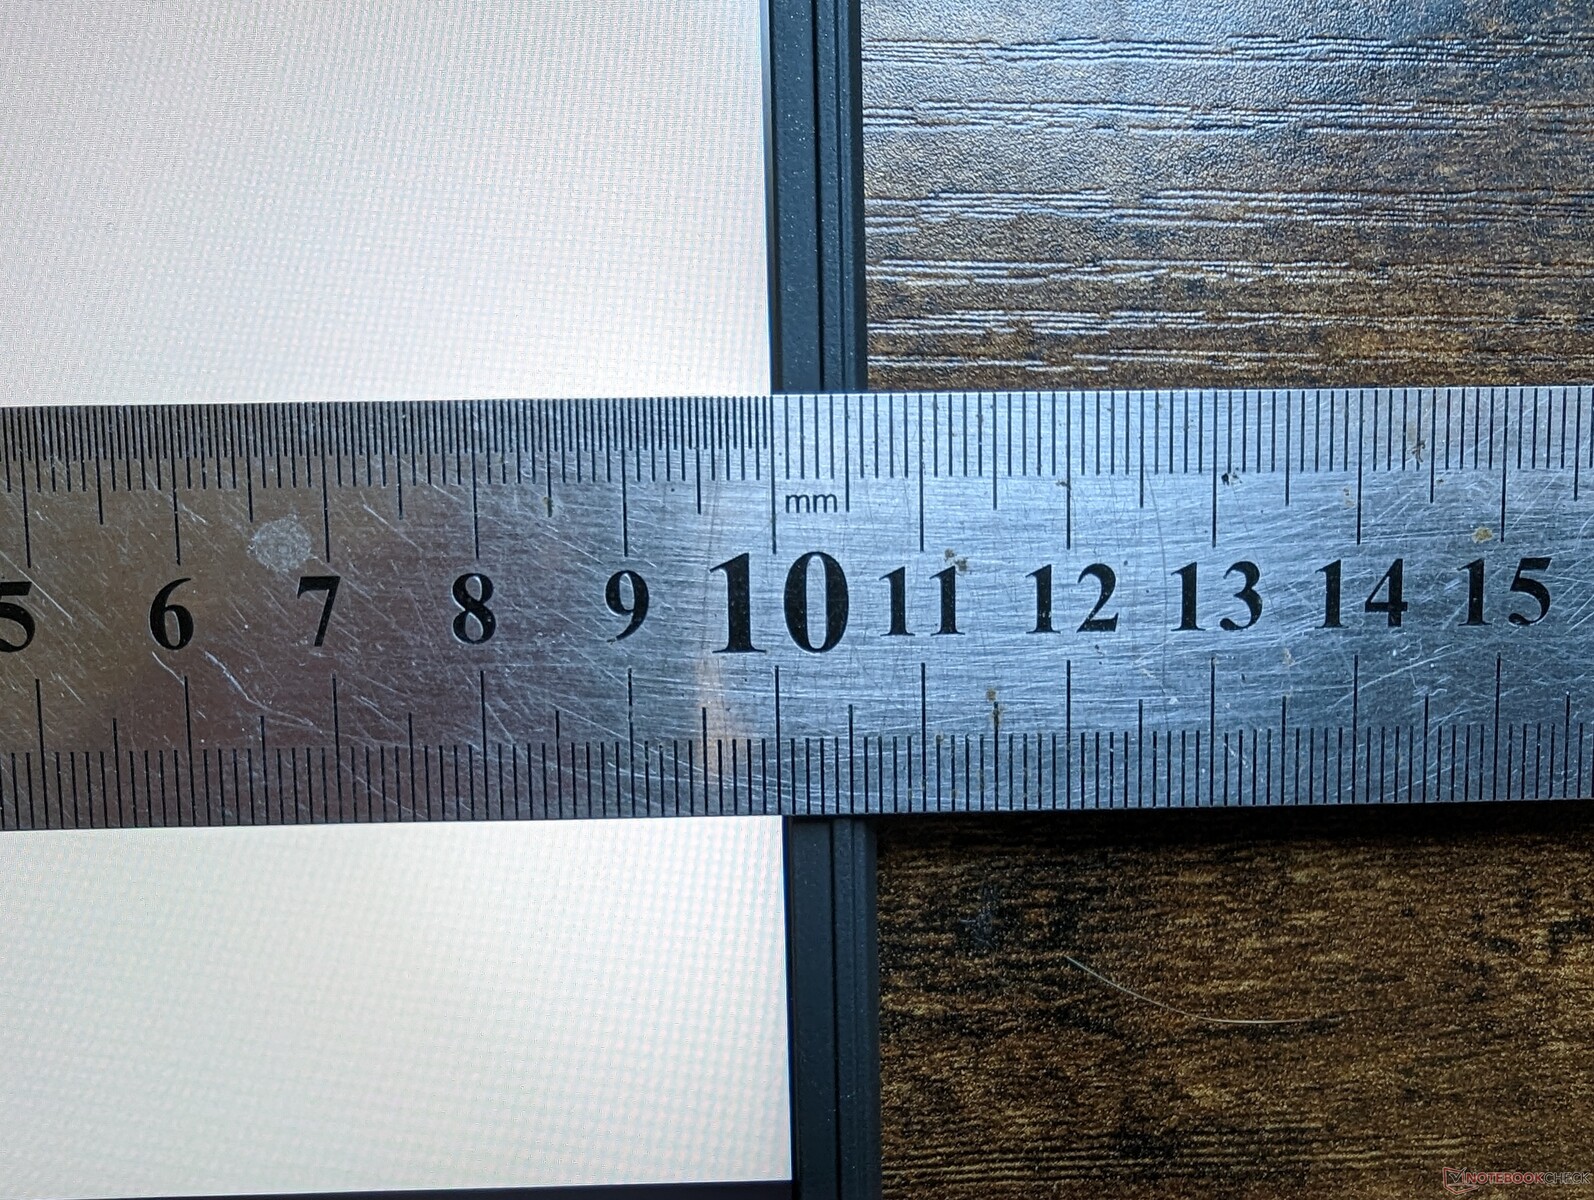
Med sina 19 mm är Alienware x16 en av de tunnaste 16-tums bärbara speldatorerna på marknaden, tunnare än till och med Razer Blade 16. Tyvärr är systemet bredare och längre för ett mycket större fotavtryck och därför är dess totala volym inte mindre än många konkurrenter. Alienware är till exempel nästan 4 mm tunnare än Blade 16, men den är längre med över 40 mm och tyngre med cirka 200 gram som en följd av detta.
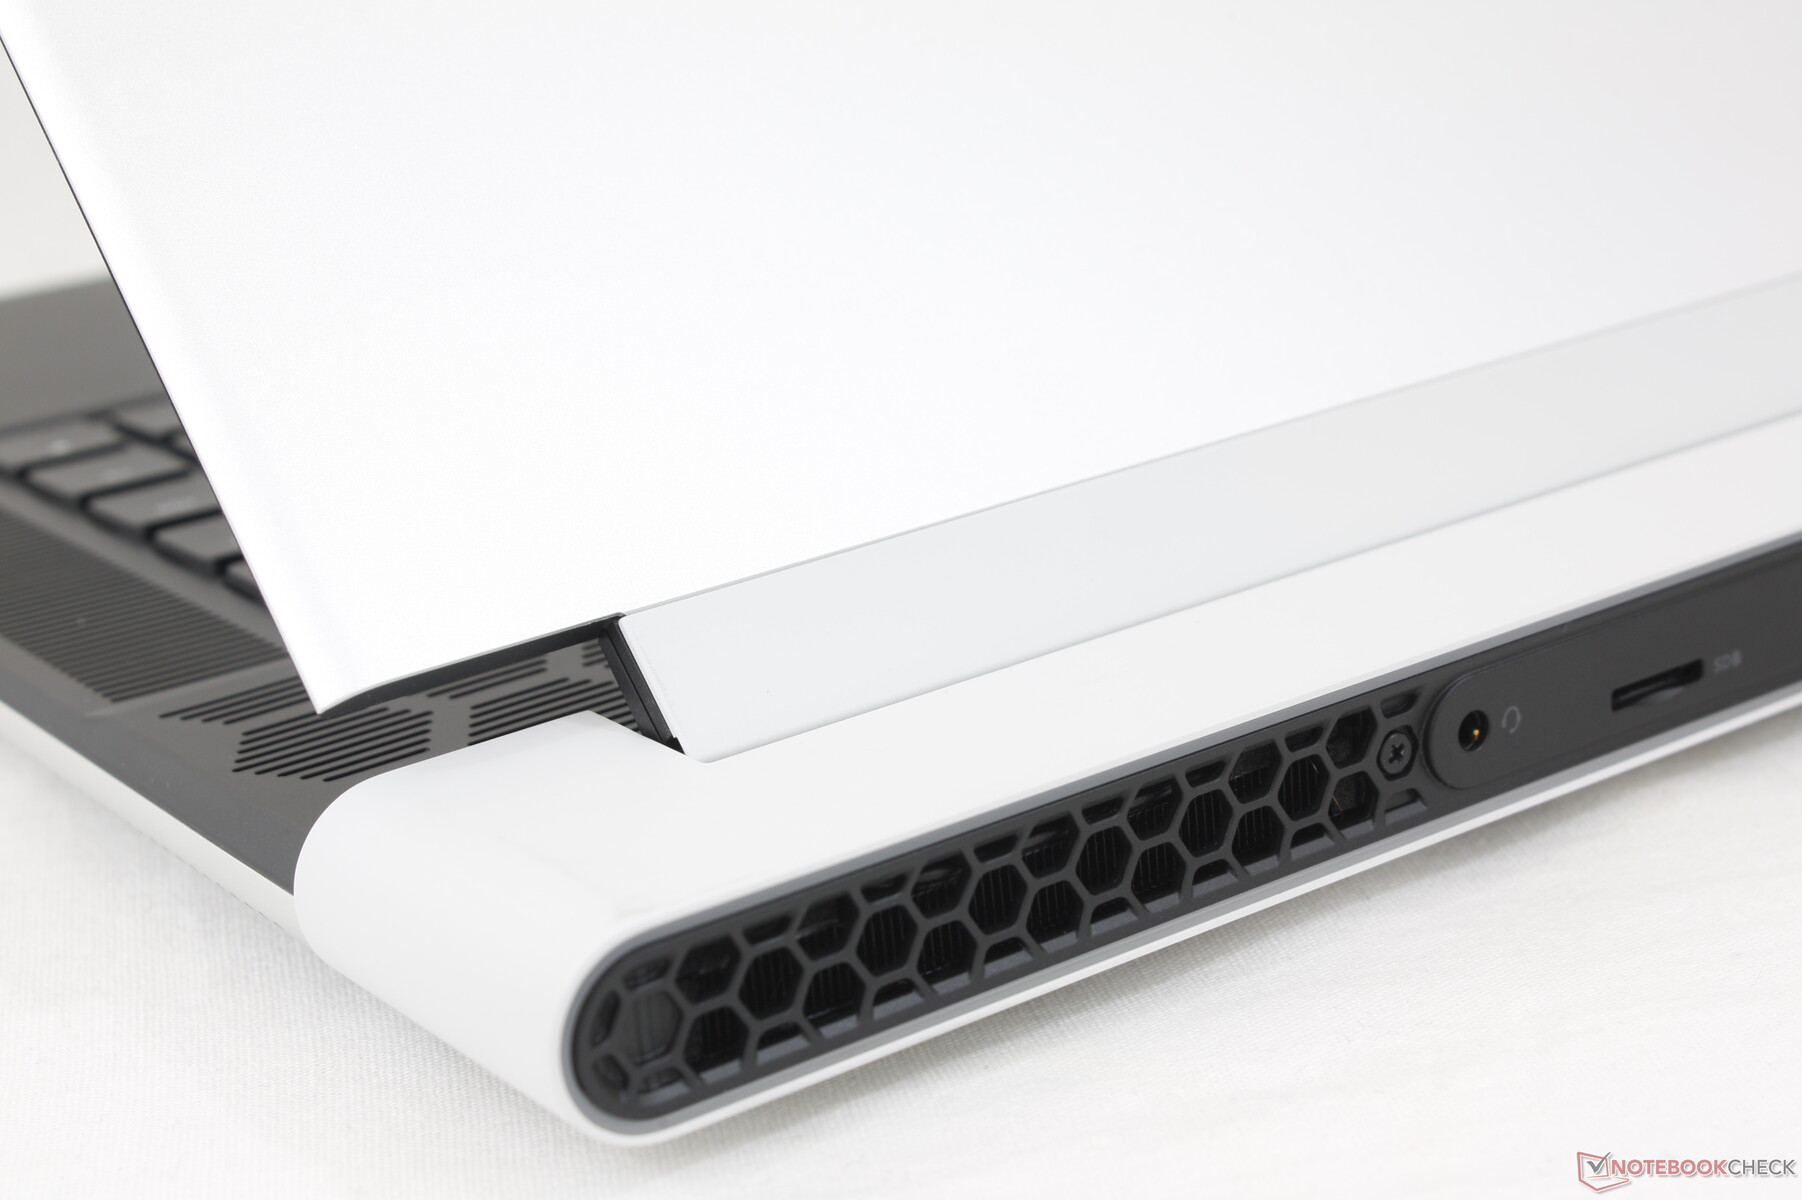
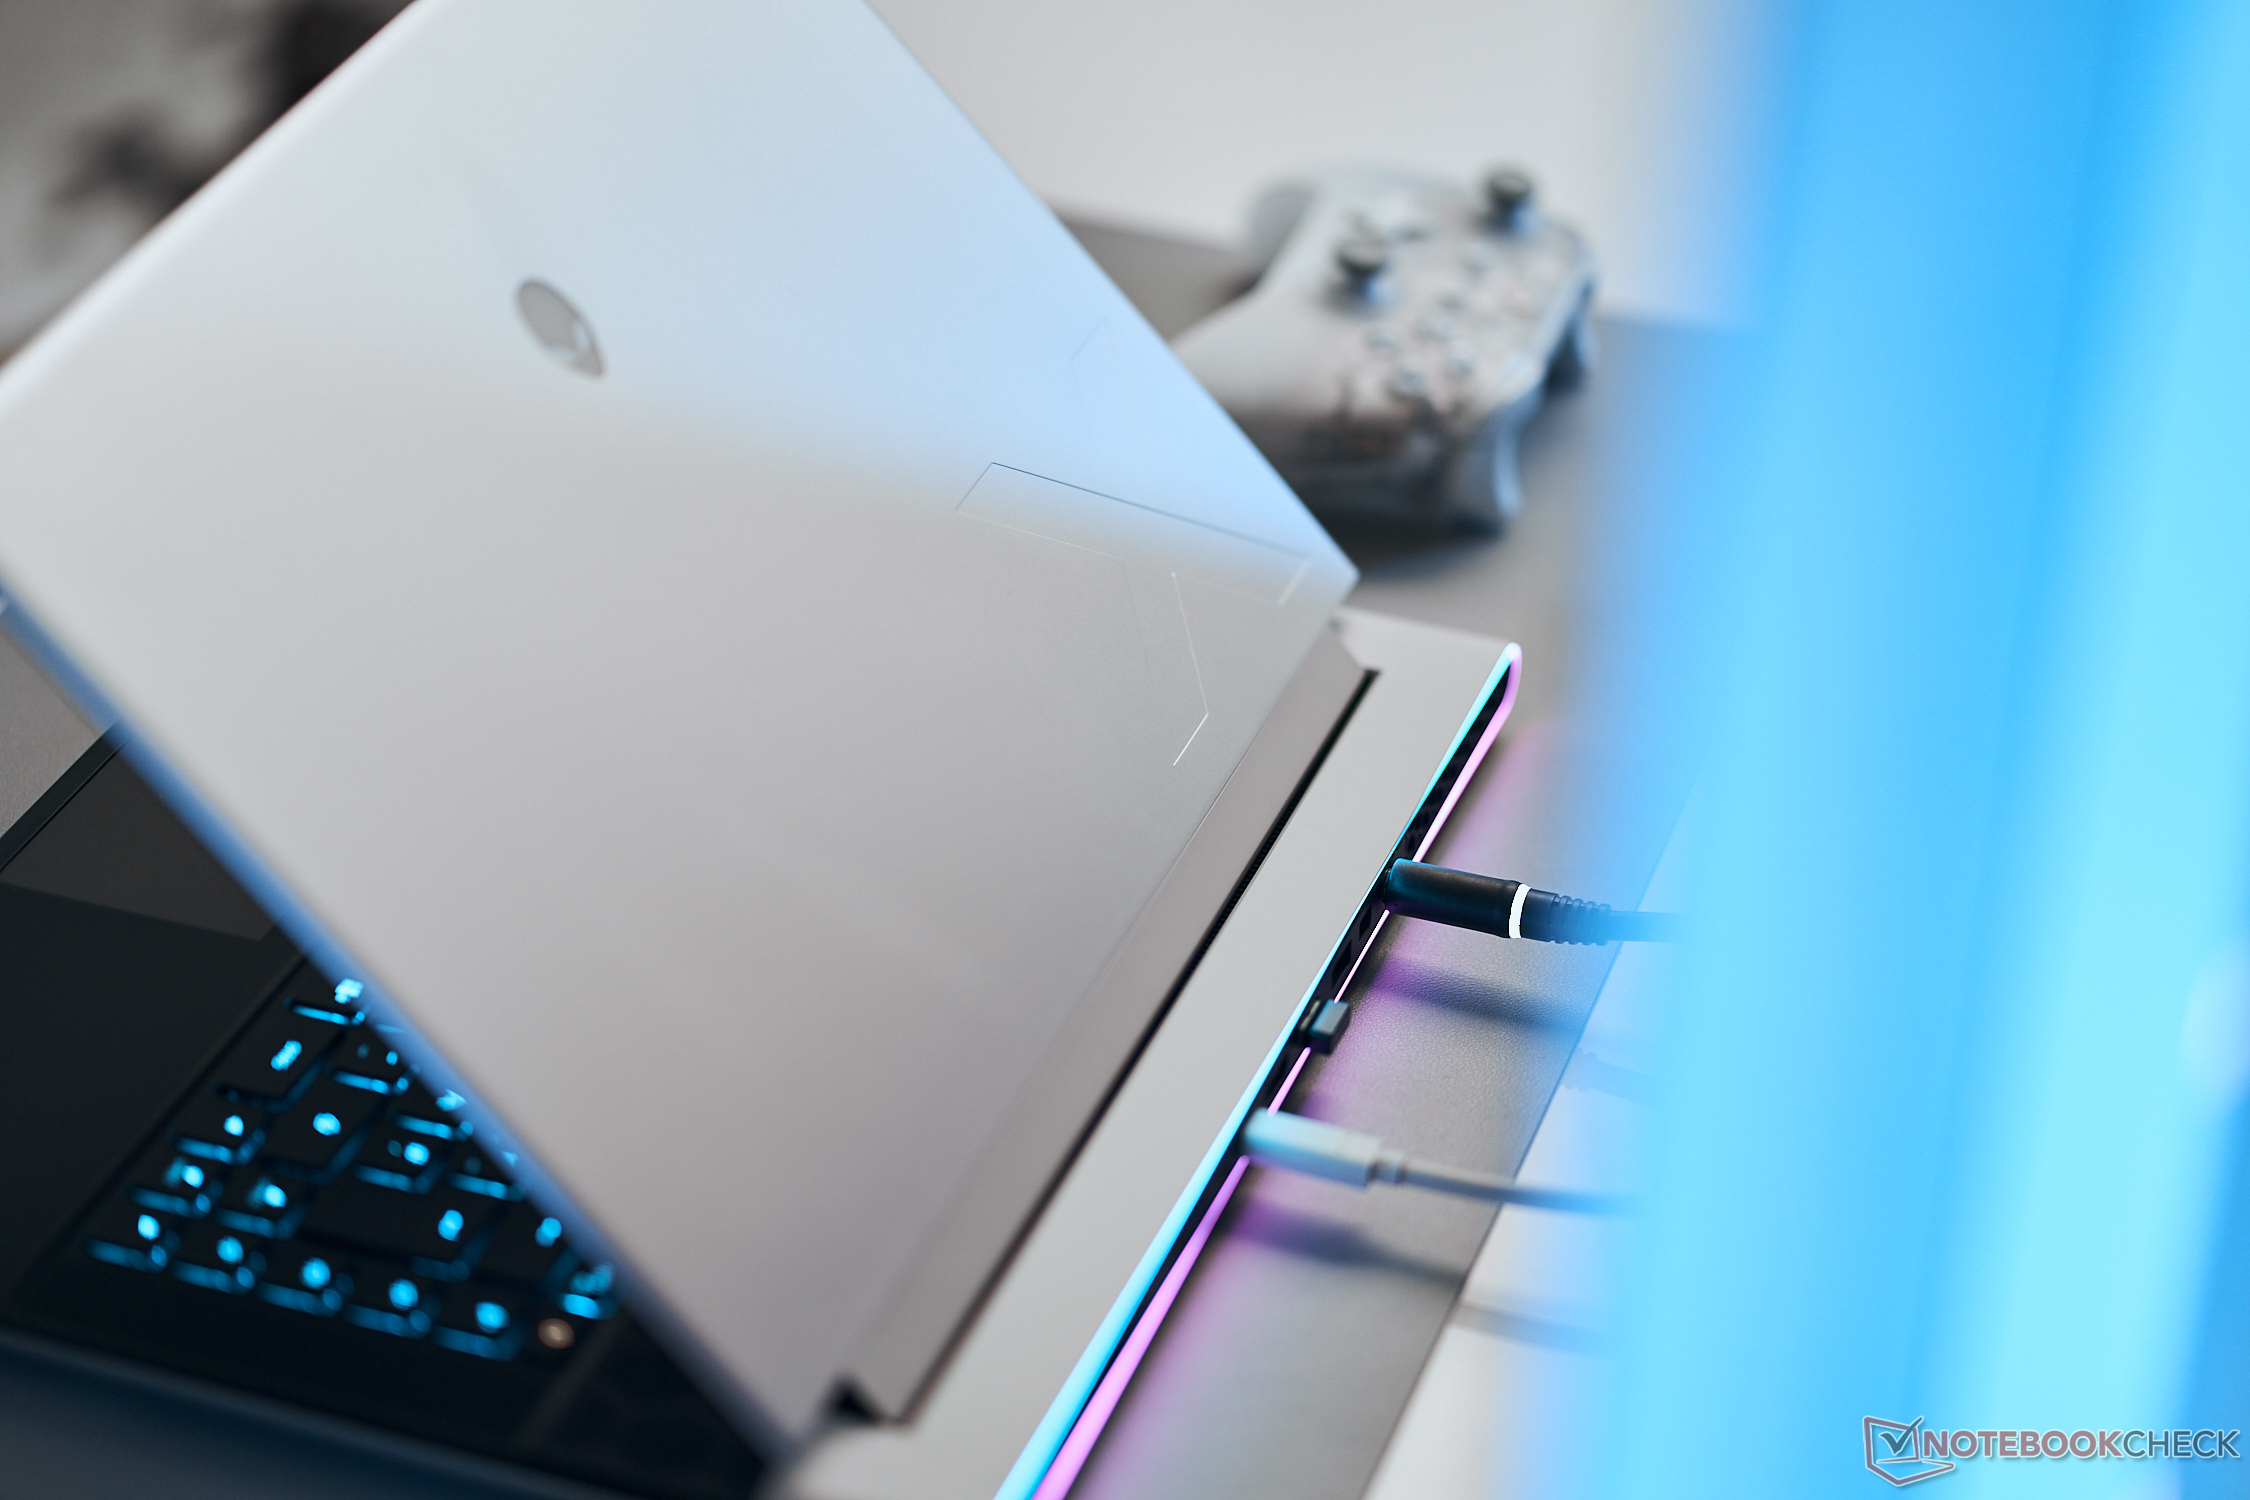
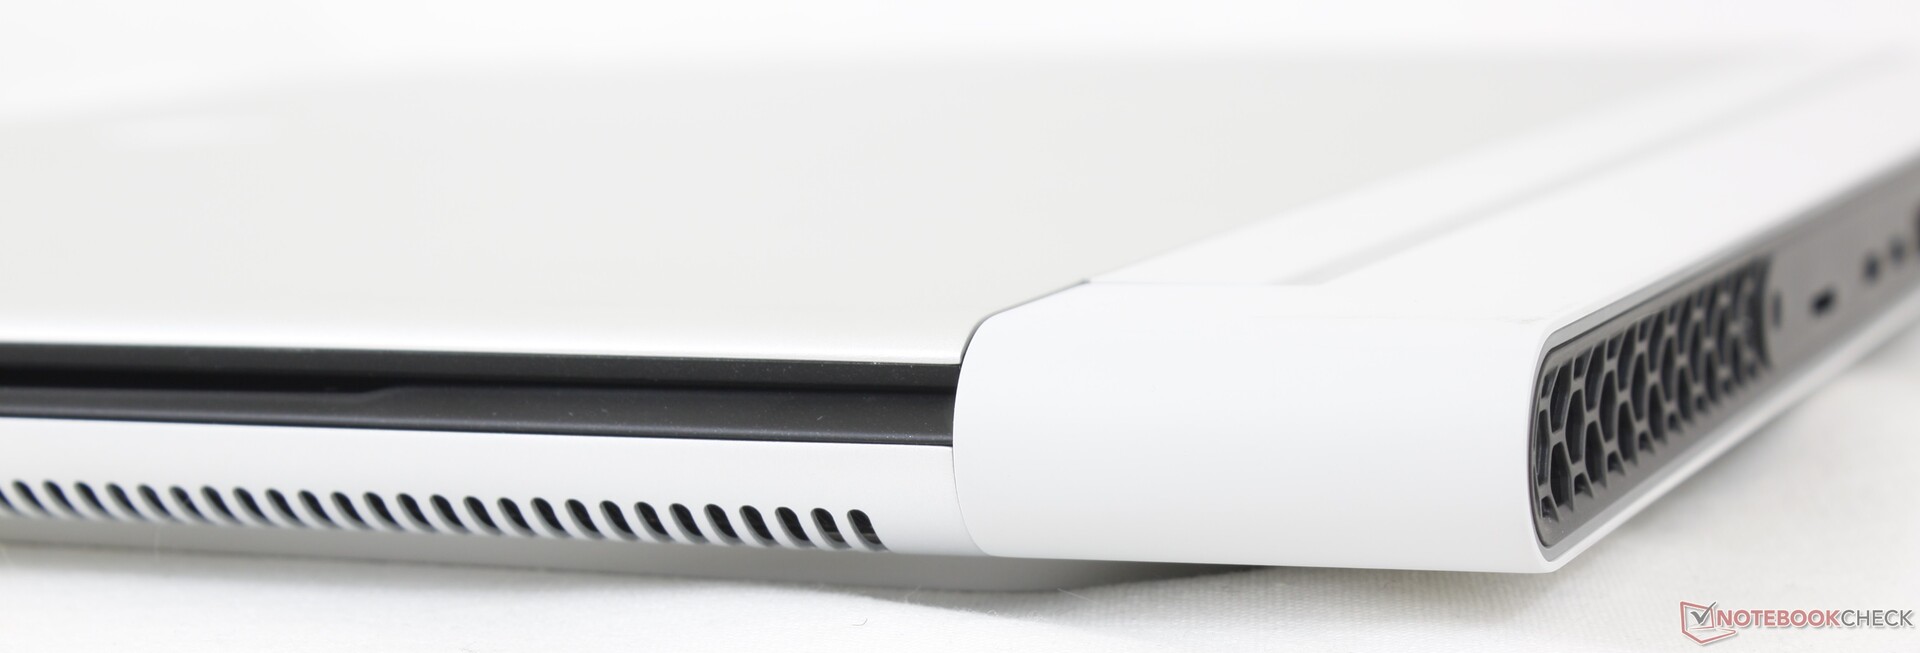
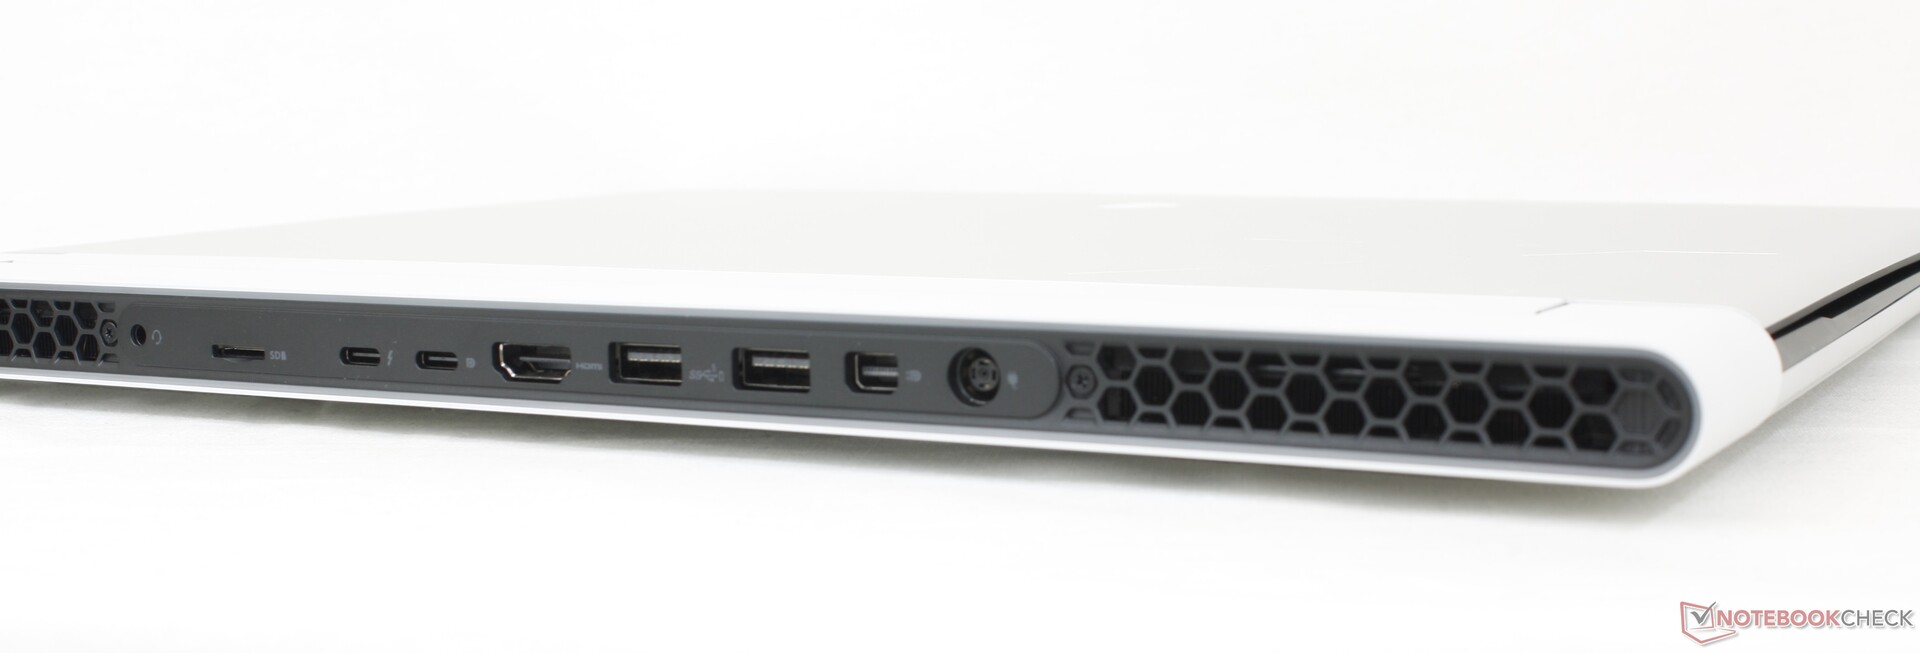
Connectivity - Inget på sidorna
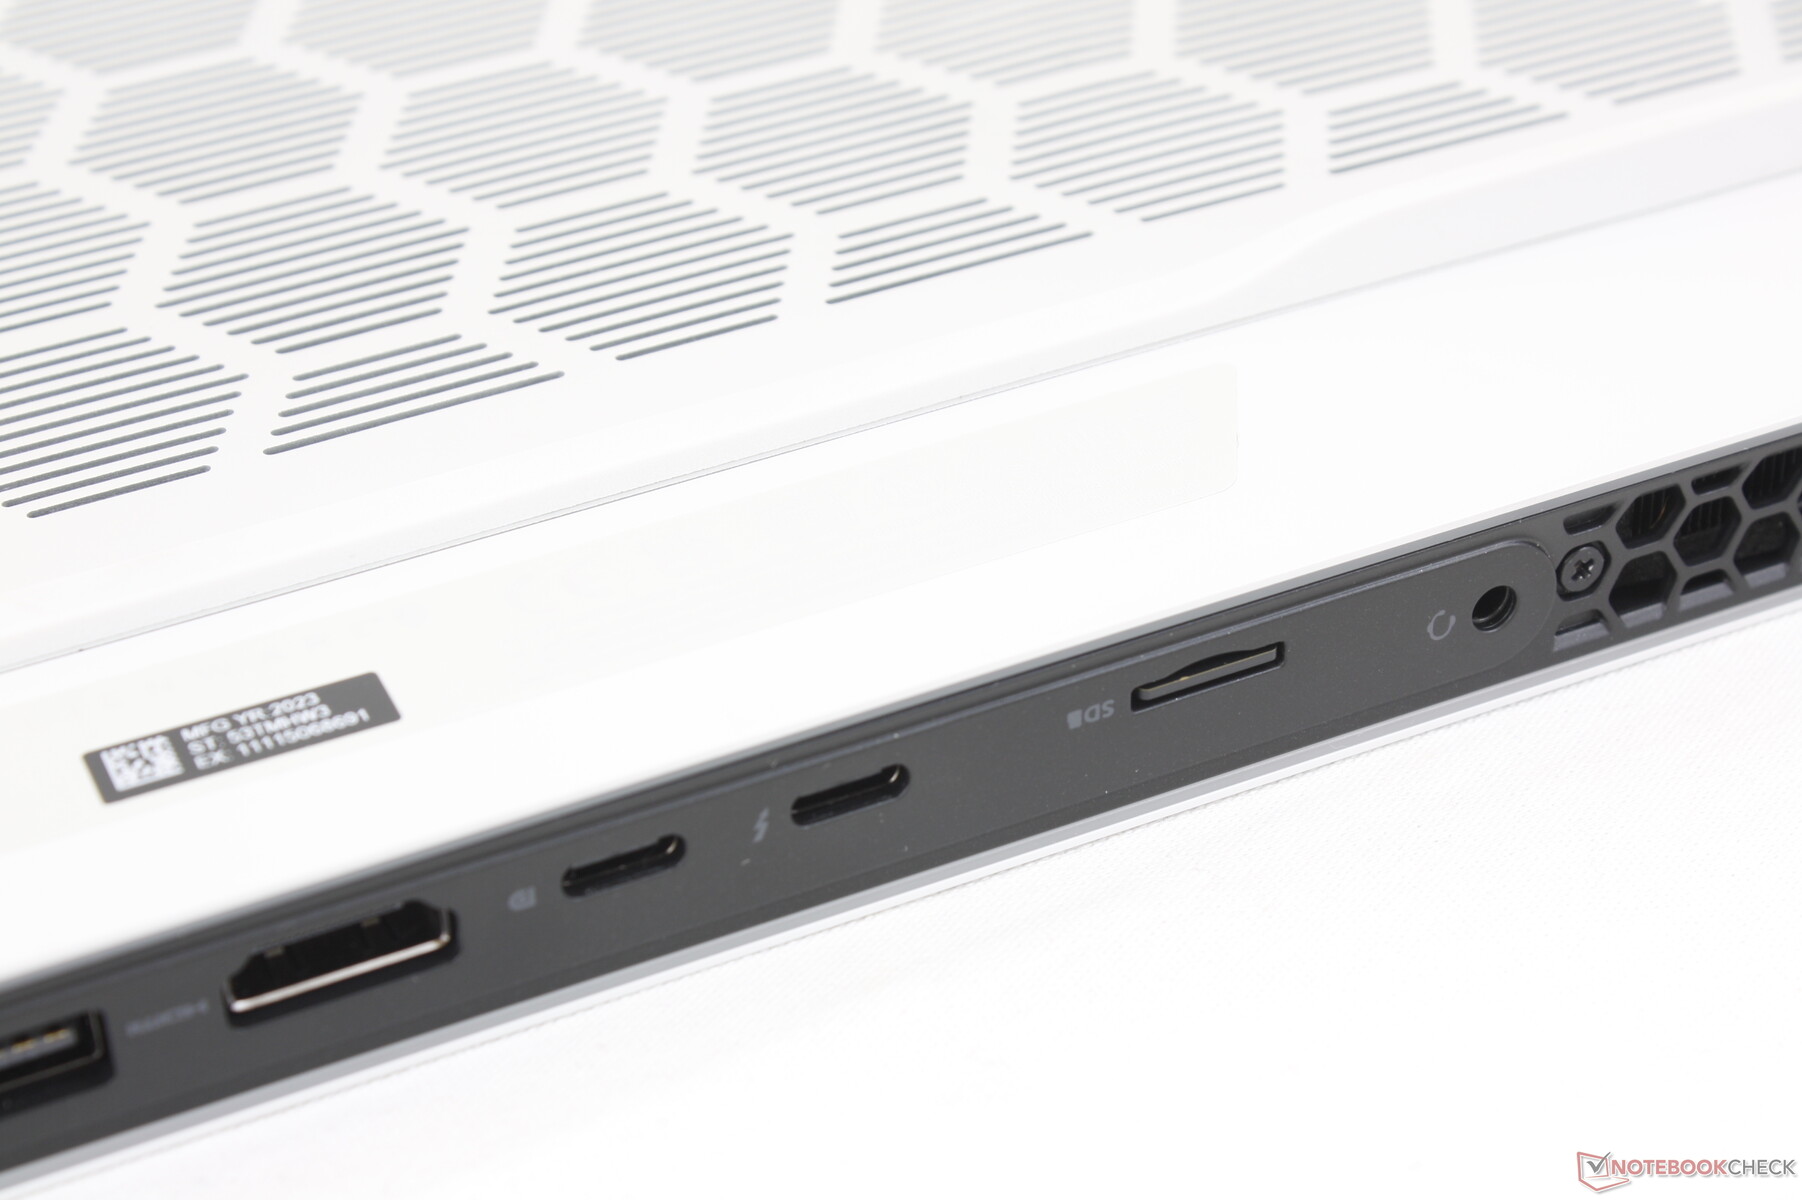
Alla portar sitter längs baksidan, vilket kan vara både en fördel och ett problem. Å ena sidan innebär avsaknaden av sidoportar att man slipper fula eller störande kablar. Å andra sidan är placeringen av portarna inte idealisk, särskilt inte för de vanliga USB-portarna.
Tänk på att Thunderbolt 4 endast stöds av en av de två USB-C-portarna.
SD-kortläsare
AS SSD rapporterar en sekventiell läshastighet på 256,1 MB/s medan ett verkligt test som överför 1 GB foton skulle vara mycket långsammare på bara 57 MB/s med vårt UHS-II MicroSD-testkort även efter flera omförsök.
Till skillnad från de flesta andra bärbara datorer sitter MicroSD-läsaren på baksidan av chassit istället för på sidorna.
| SD Card Reader | |
| average JPG Copy Test (av. of 3 runs) | |
| Asus ROG Zephyrus M16 GU604VY-NM042X | |
| Razer Blade 16 Early 2023 (AV PRO microSD 128 GB V60) | |
| Alienware x16 R1 (AV PRO microSD 128 GB V60) | |
| maximum AS SSD Seq Read Test (1GB) | |
| Alienware x16 R1 (AV PRO microSD 128 GB V60) | |
| Razer Blade 16 Early 2023 (AV PRO microSD 128 GB V60) | |
| Asus ROG Zephyrus M16 GU604VY-NM042X | |
Kommunikation
| Networking | |
| iperf3 transmit AXE11000 | |
| Lenovo Legion Pro 7 16IRX8H | |
| Razer Blade 16 Early 2023 | |
| Alienware x16 R1 | |
| Alienware m17 R5 (R9 6900HX, RX 6850M XT) | |
| Dell G16 7620 | |
| iperf3 receive AXE11000 | |
| Lenovo Legion Pro 7 16IRX8H | |
| Razer Blade 16 Early 2023 | |
| Alienware x16 R1 | |
| Dell G16 7620 | |
| Alienware m17 R5 (R9 6900HX, RX 6850M XT) | |
| iperf3 transmit AXE11000 6GHz | |
| Asus ROG Zephyrus M16 GU604VY-NM042X | |
| Razer Blade 16 Early 2023 | |
| Alienware x16 R1 | |
| iperf3 receive AXE11000 6GHz | |
| Asus ROG Zephyrus M16 GU604VY-NM042X | |
| Razer Blade 16 Early 2023 | |
| Alienware x16 R1 | |
Webbkamera
En 2MP webbkamera är standard tillsammans med IR för Hello-stöd. Det finns dock ingen sekretesslucka alls.


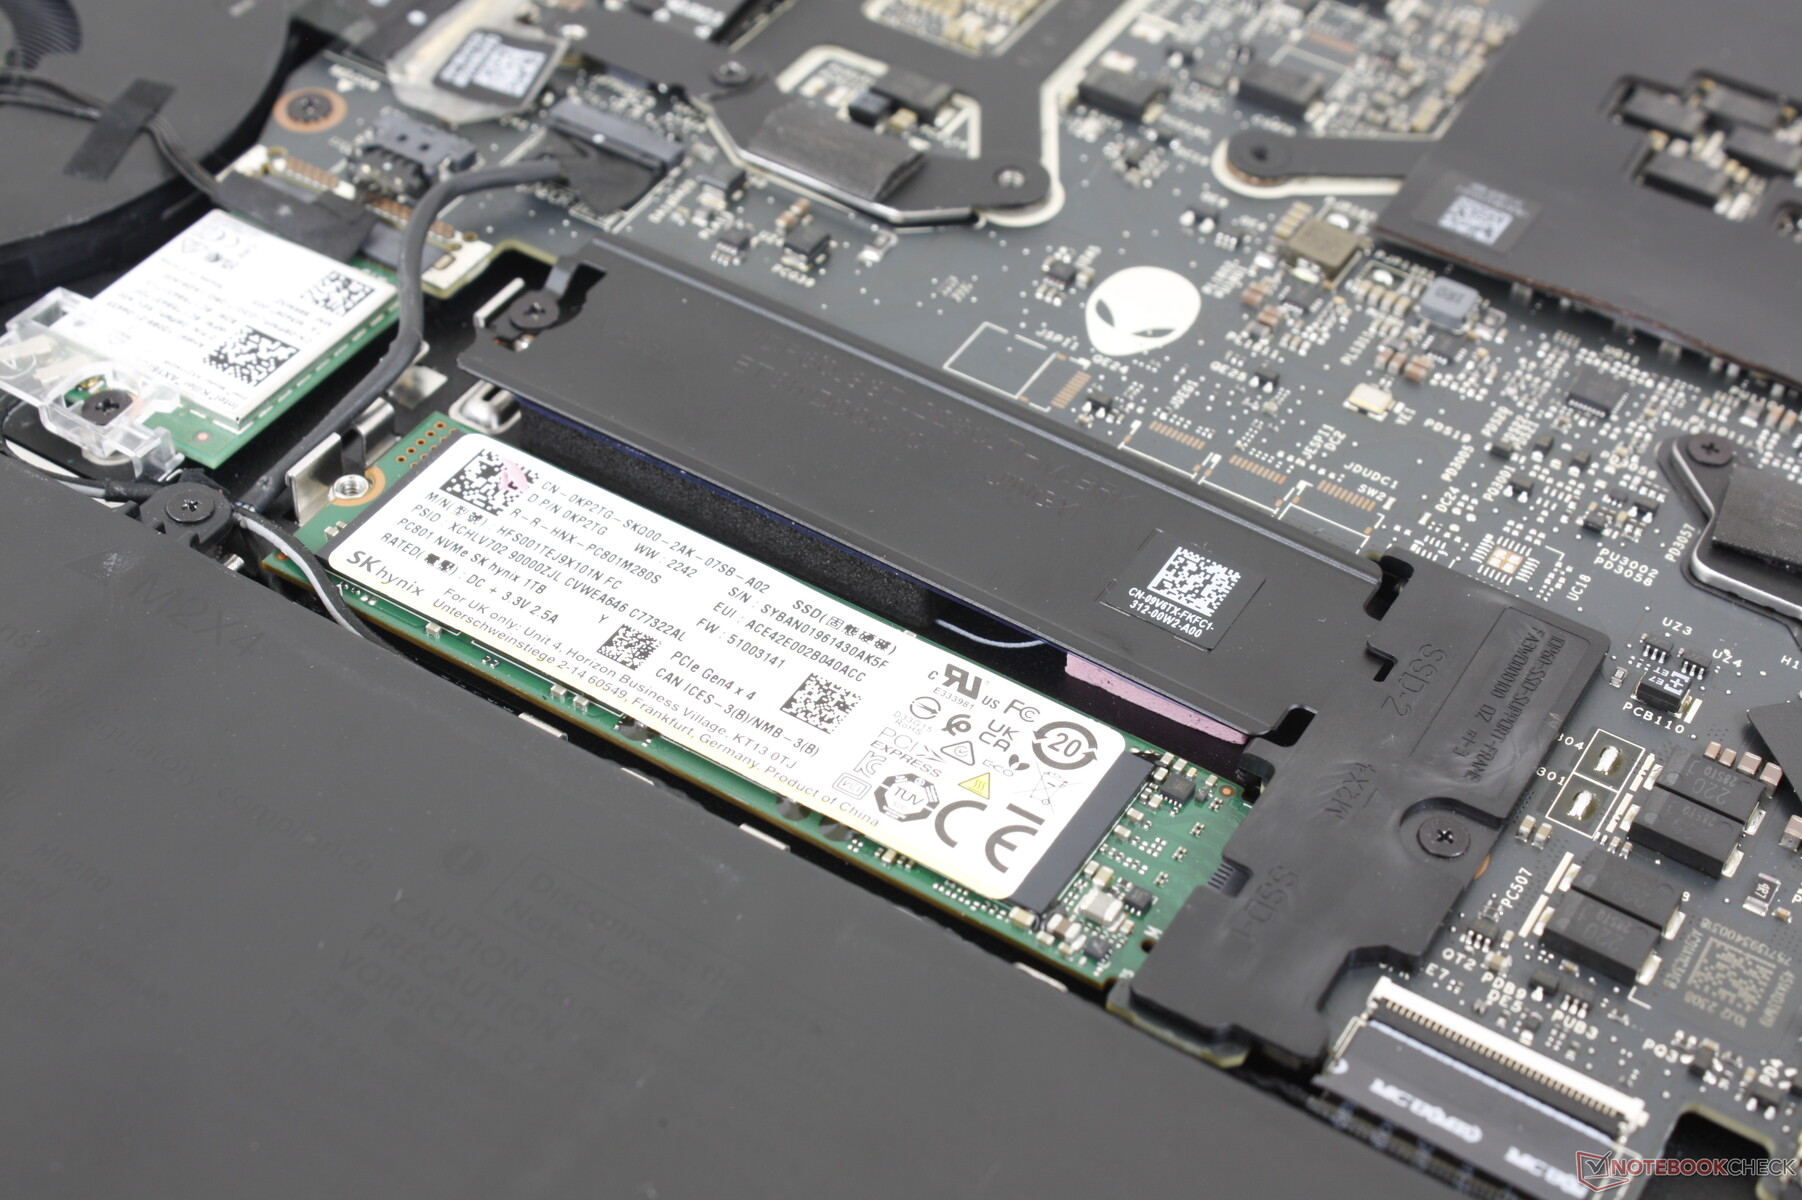
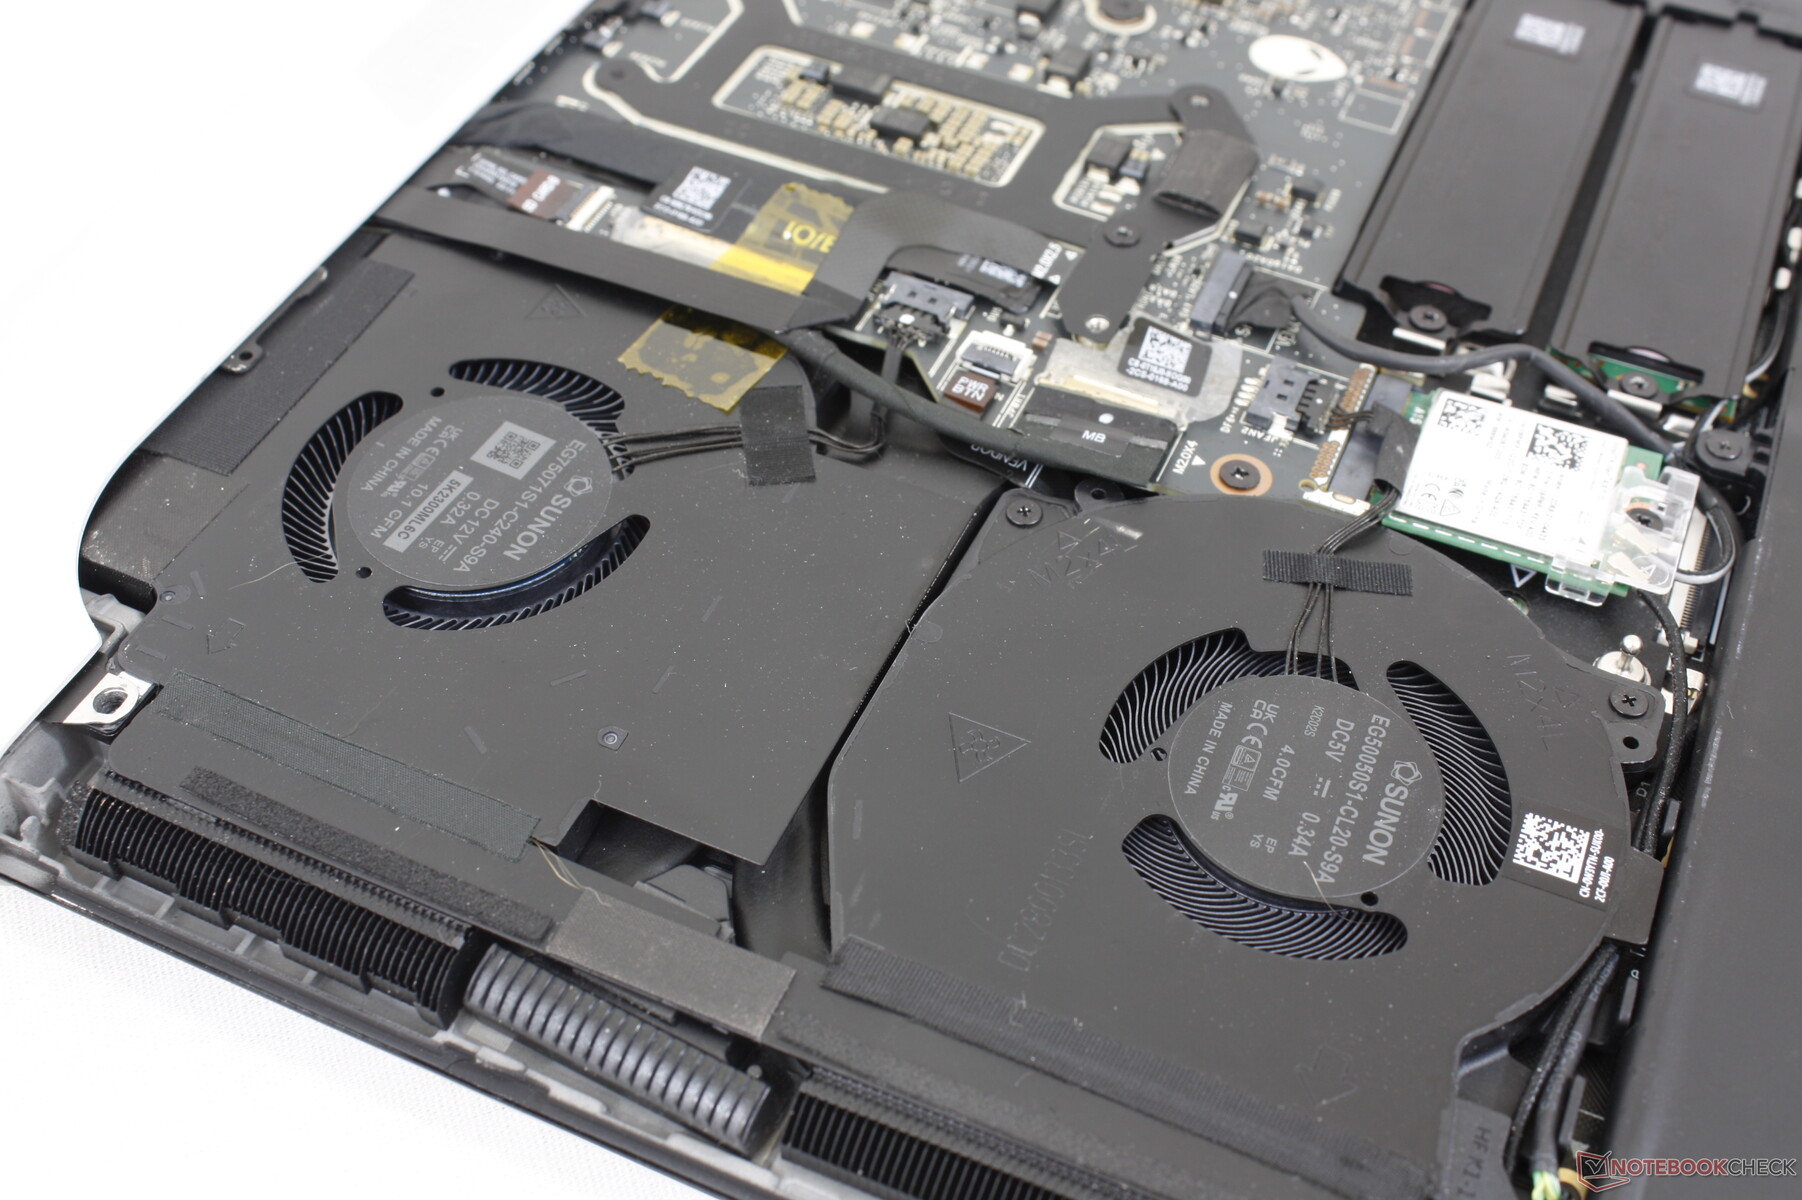
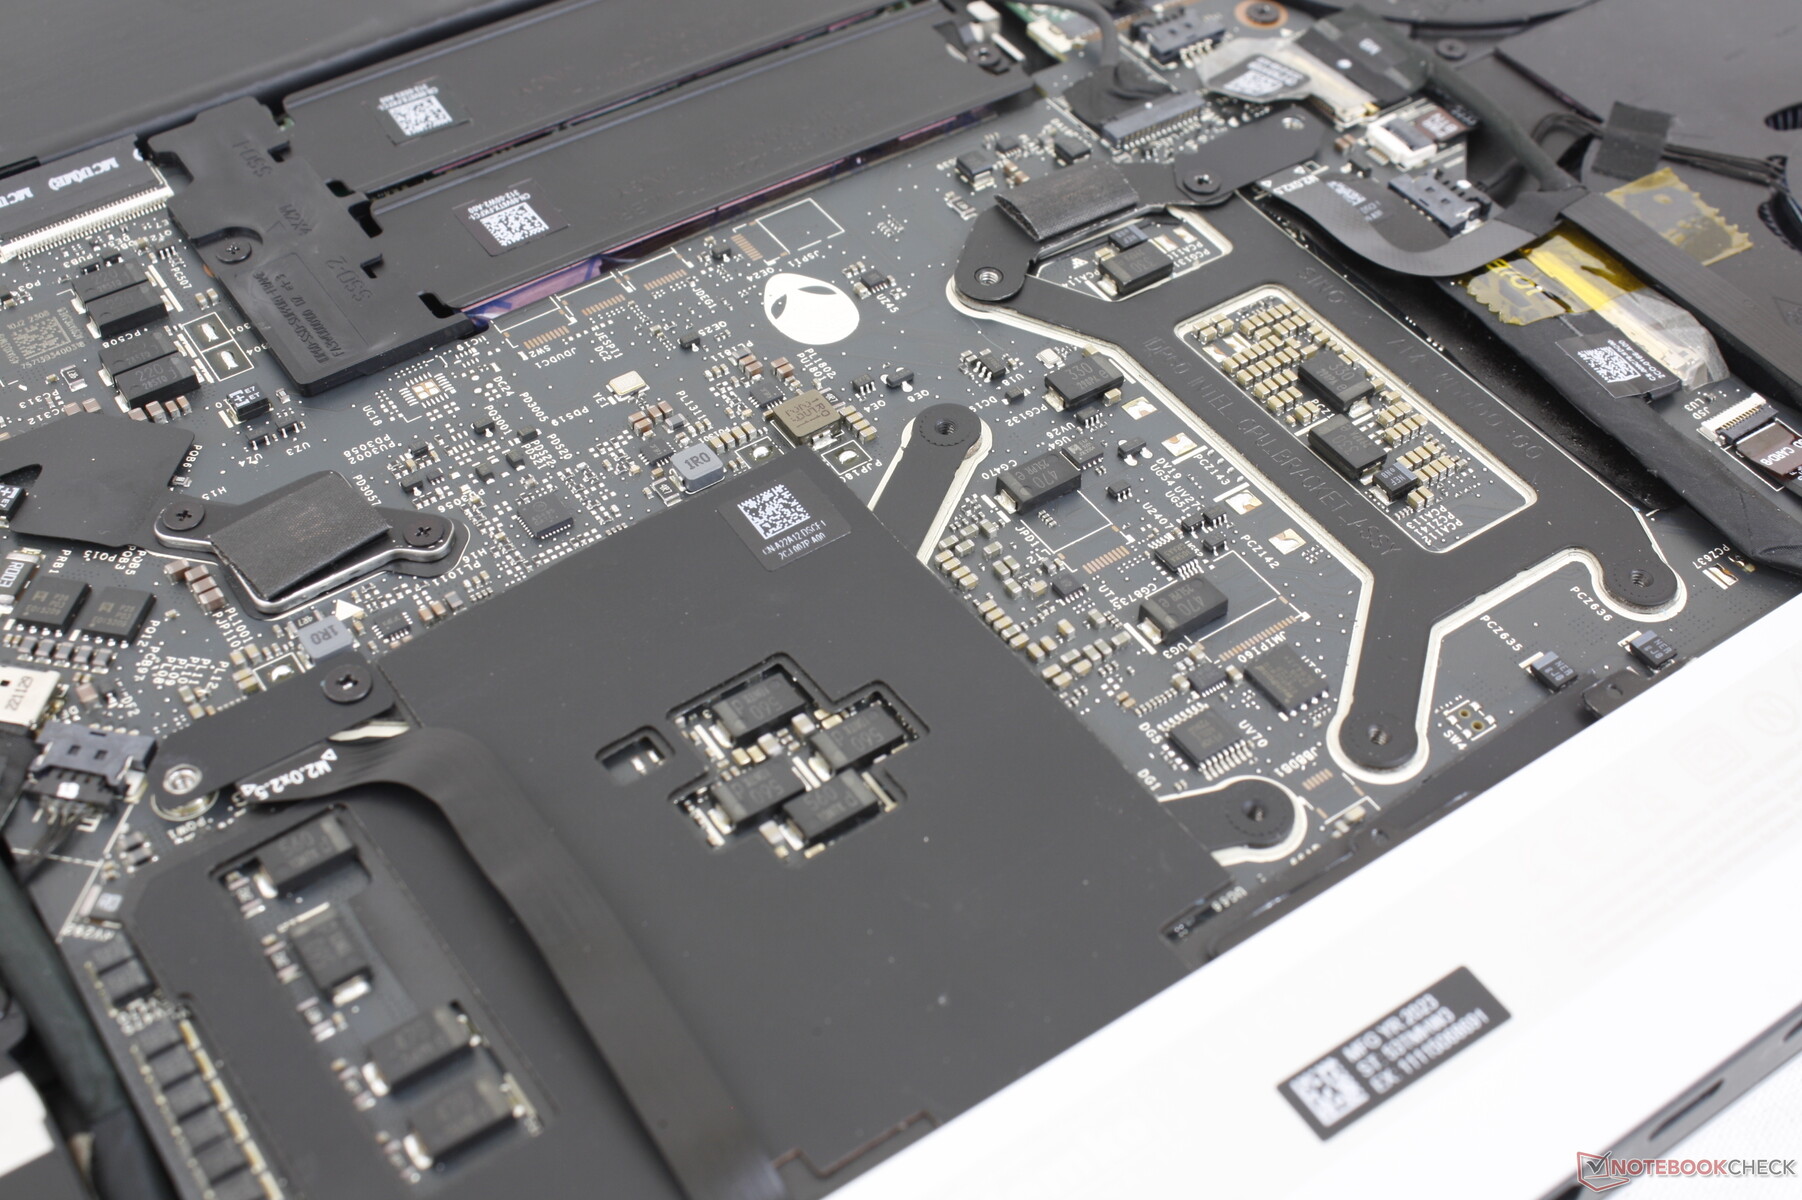
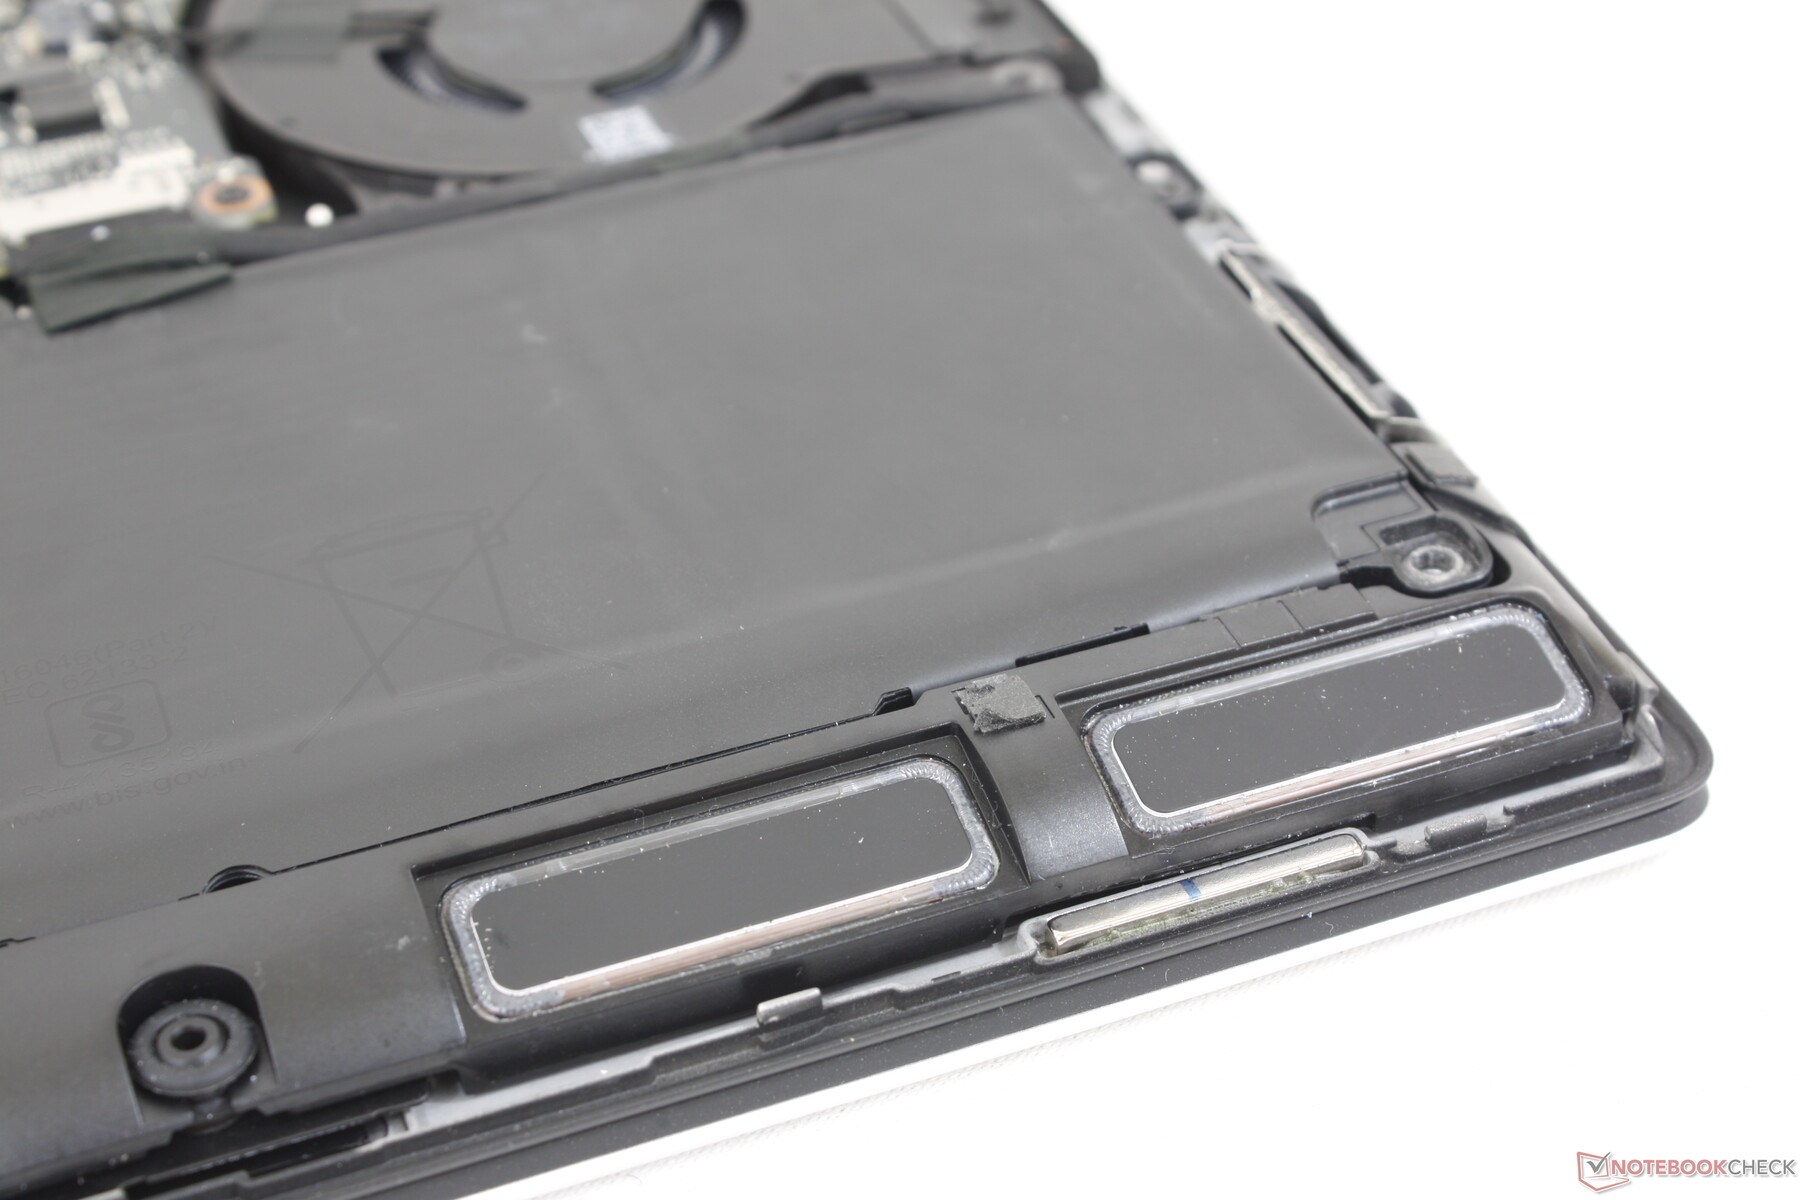
Underhåll
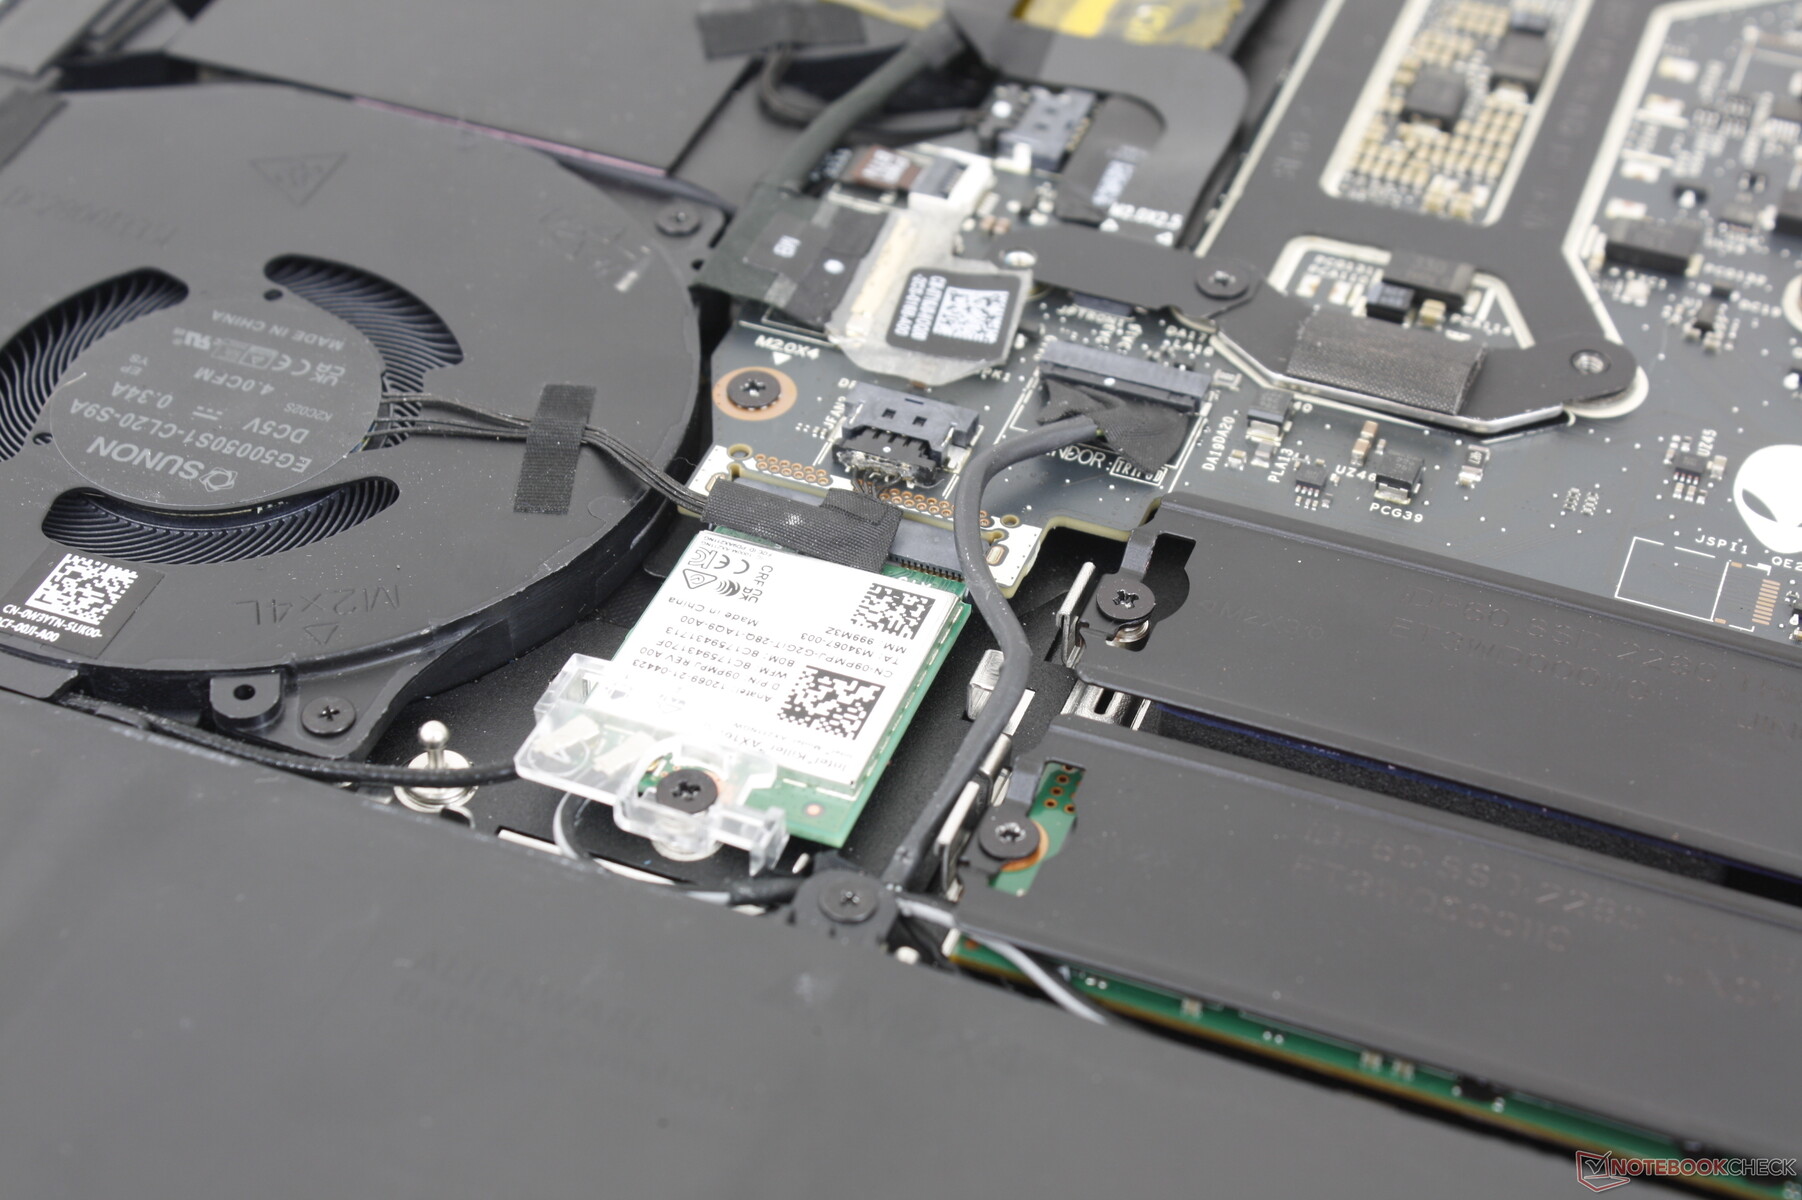
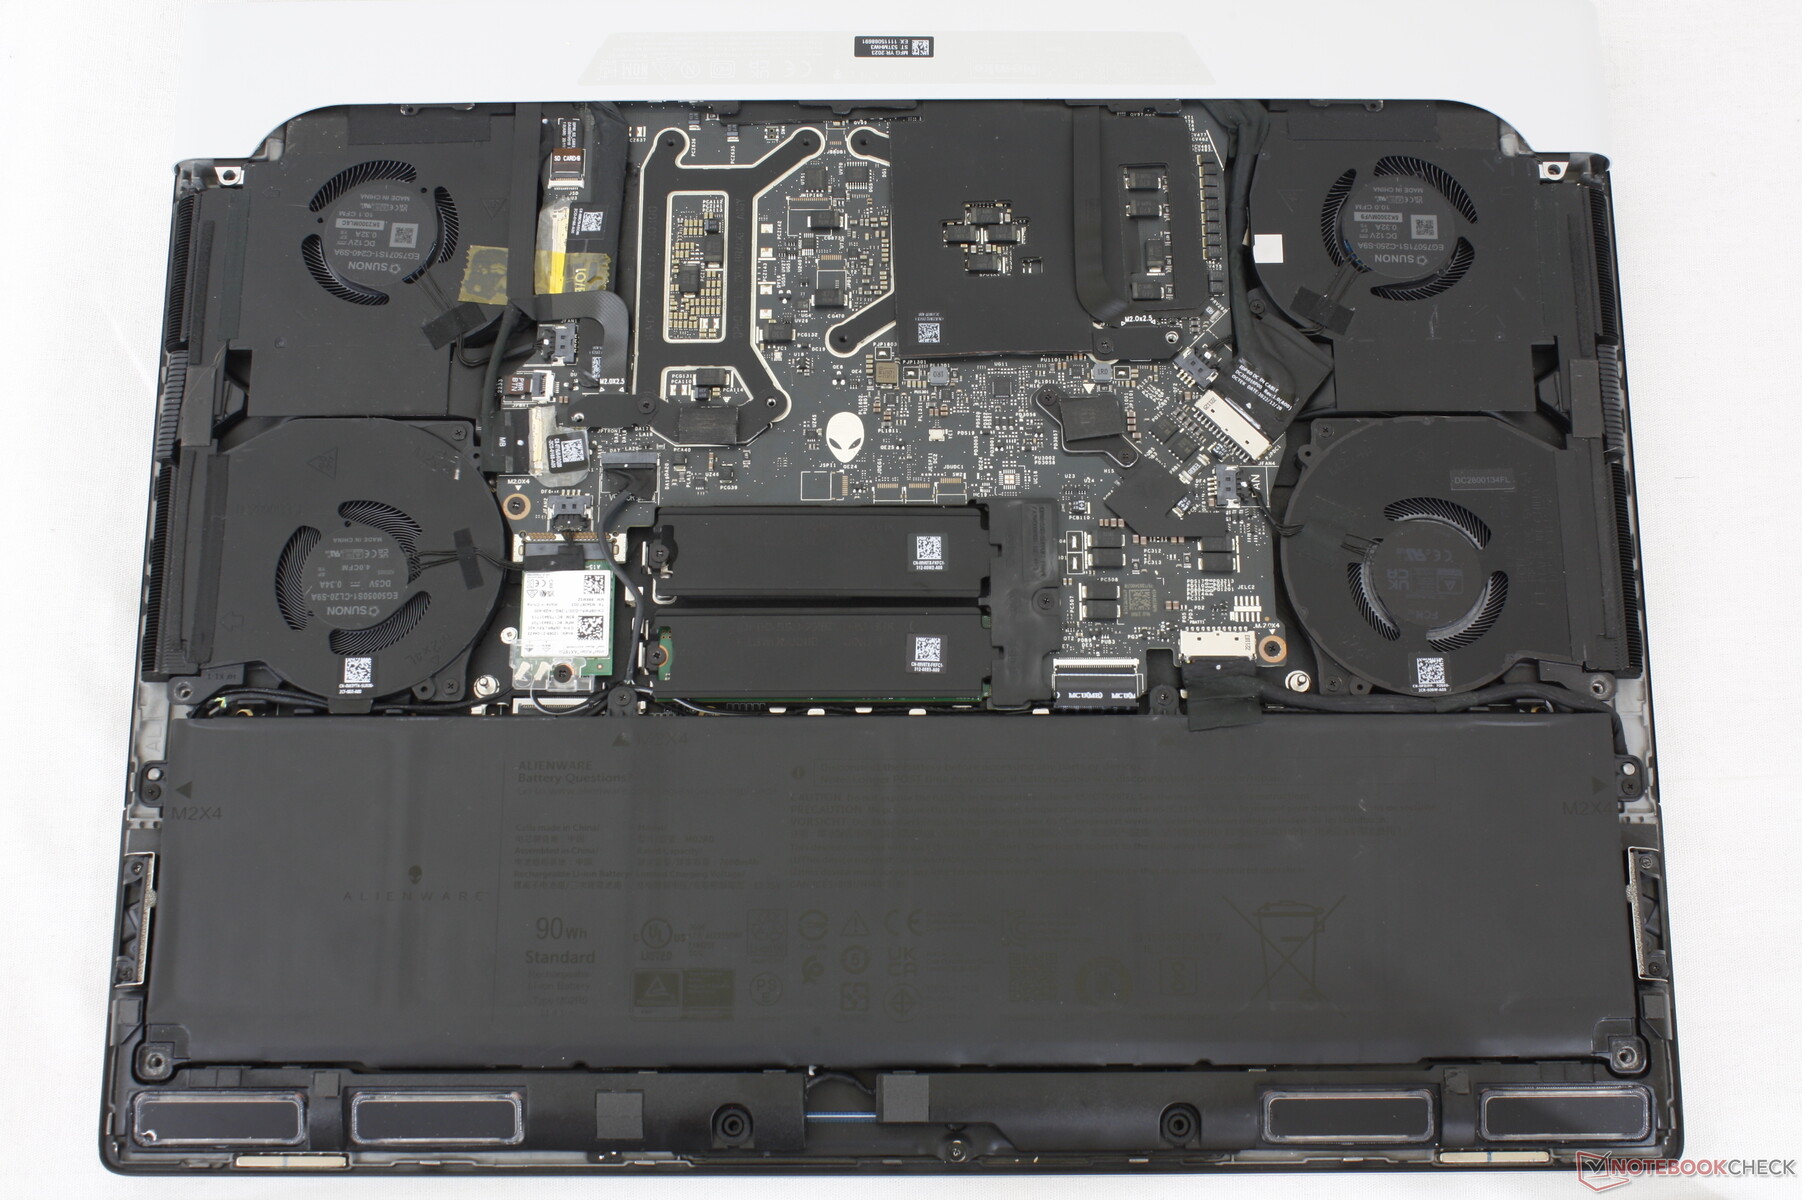
Bottenpanelen är säkrad med bara sex Phillips-skruvar för enkel borttagning. Ägare har direkt tillgång till två M.2 2280 SSD-kortplatser, batteri och den löstagbara WLAN-modulen.
Tillbehör och garanti
Det finns inget extra i förpackningen förutom nätadapter och pappersarbete. Den vanliga ettåriga begränsade tillverkargarantin gäller vid köp i USA.
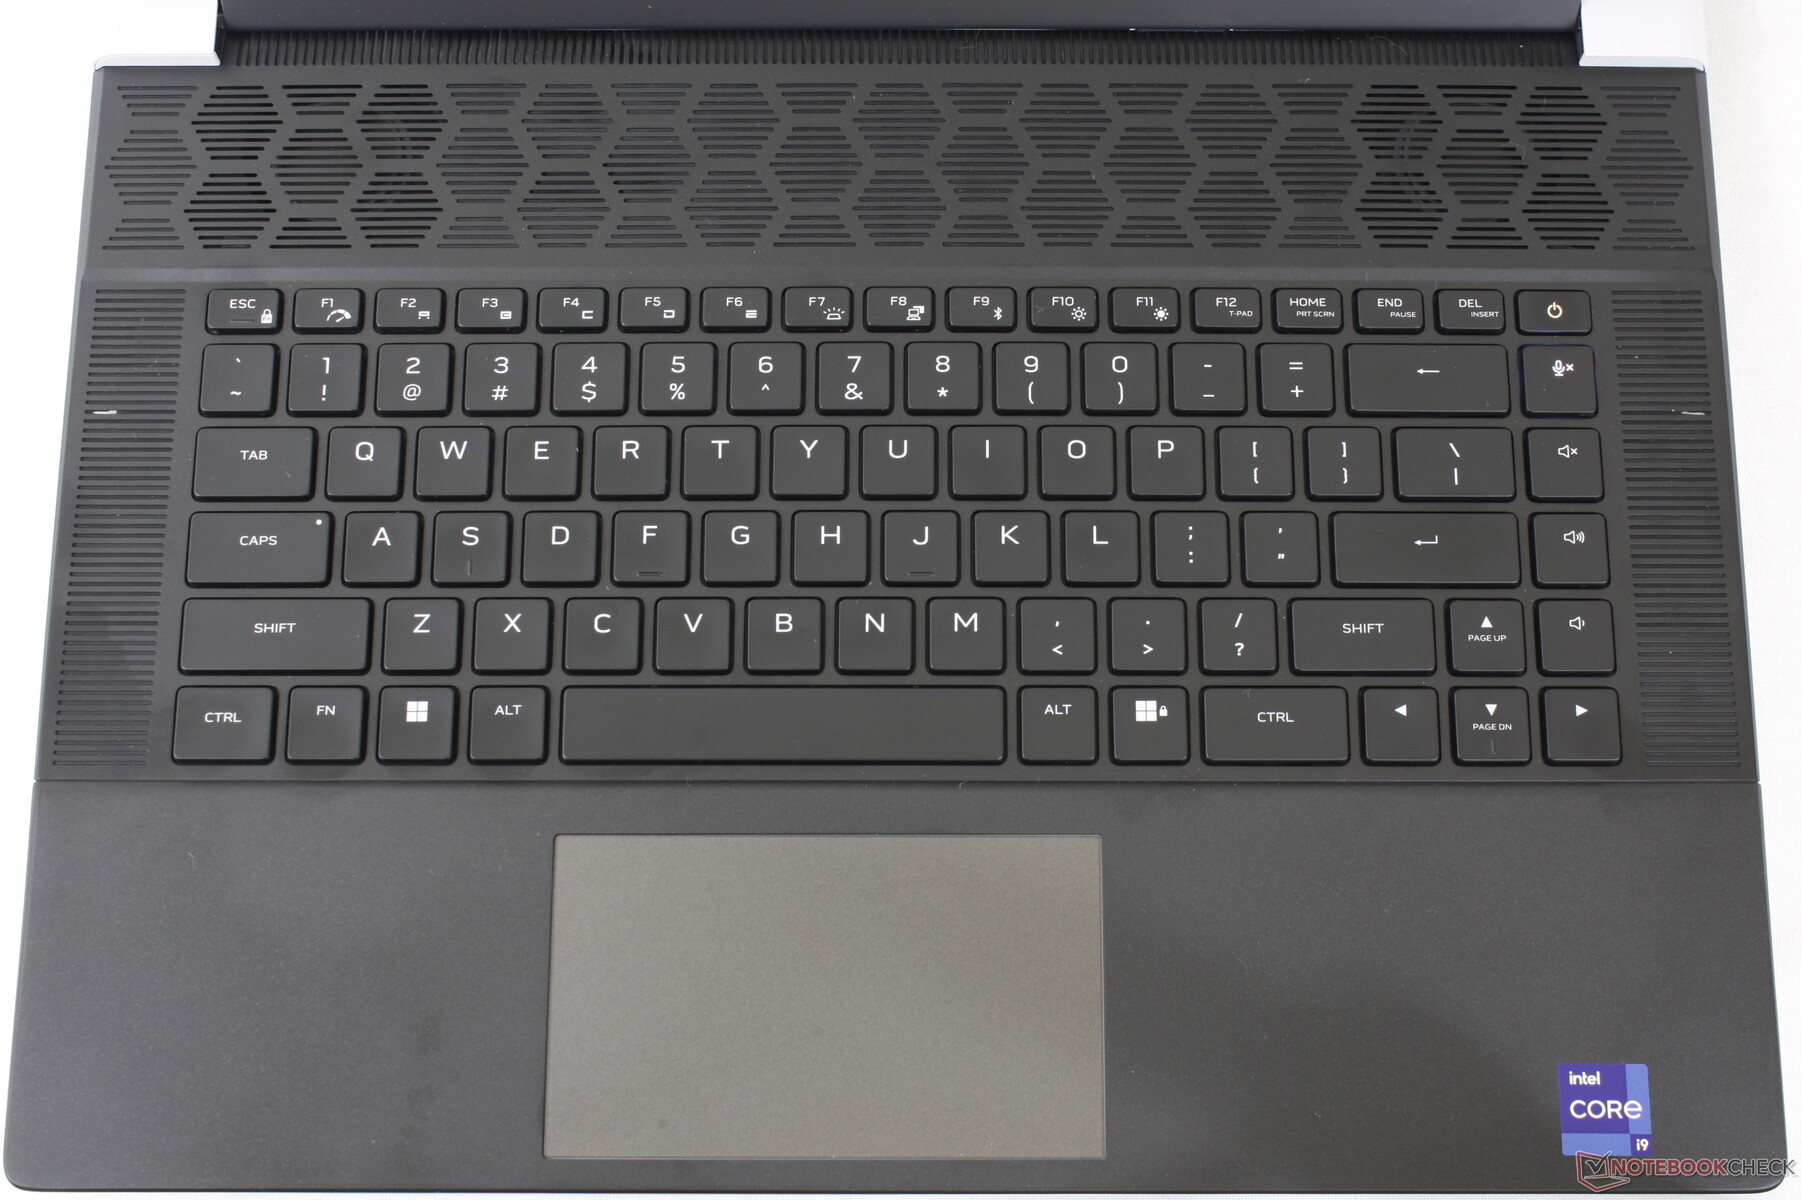
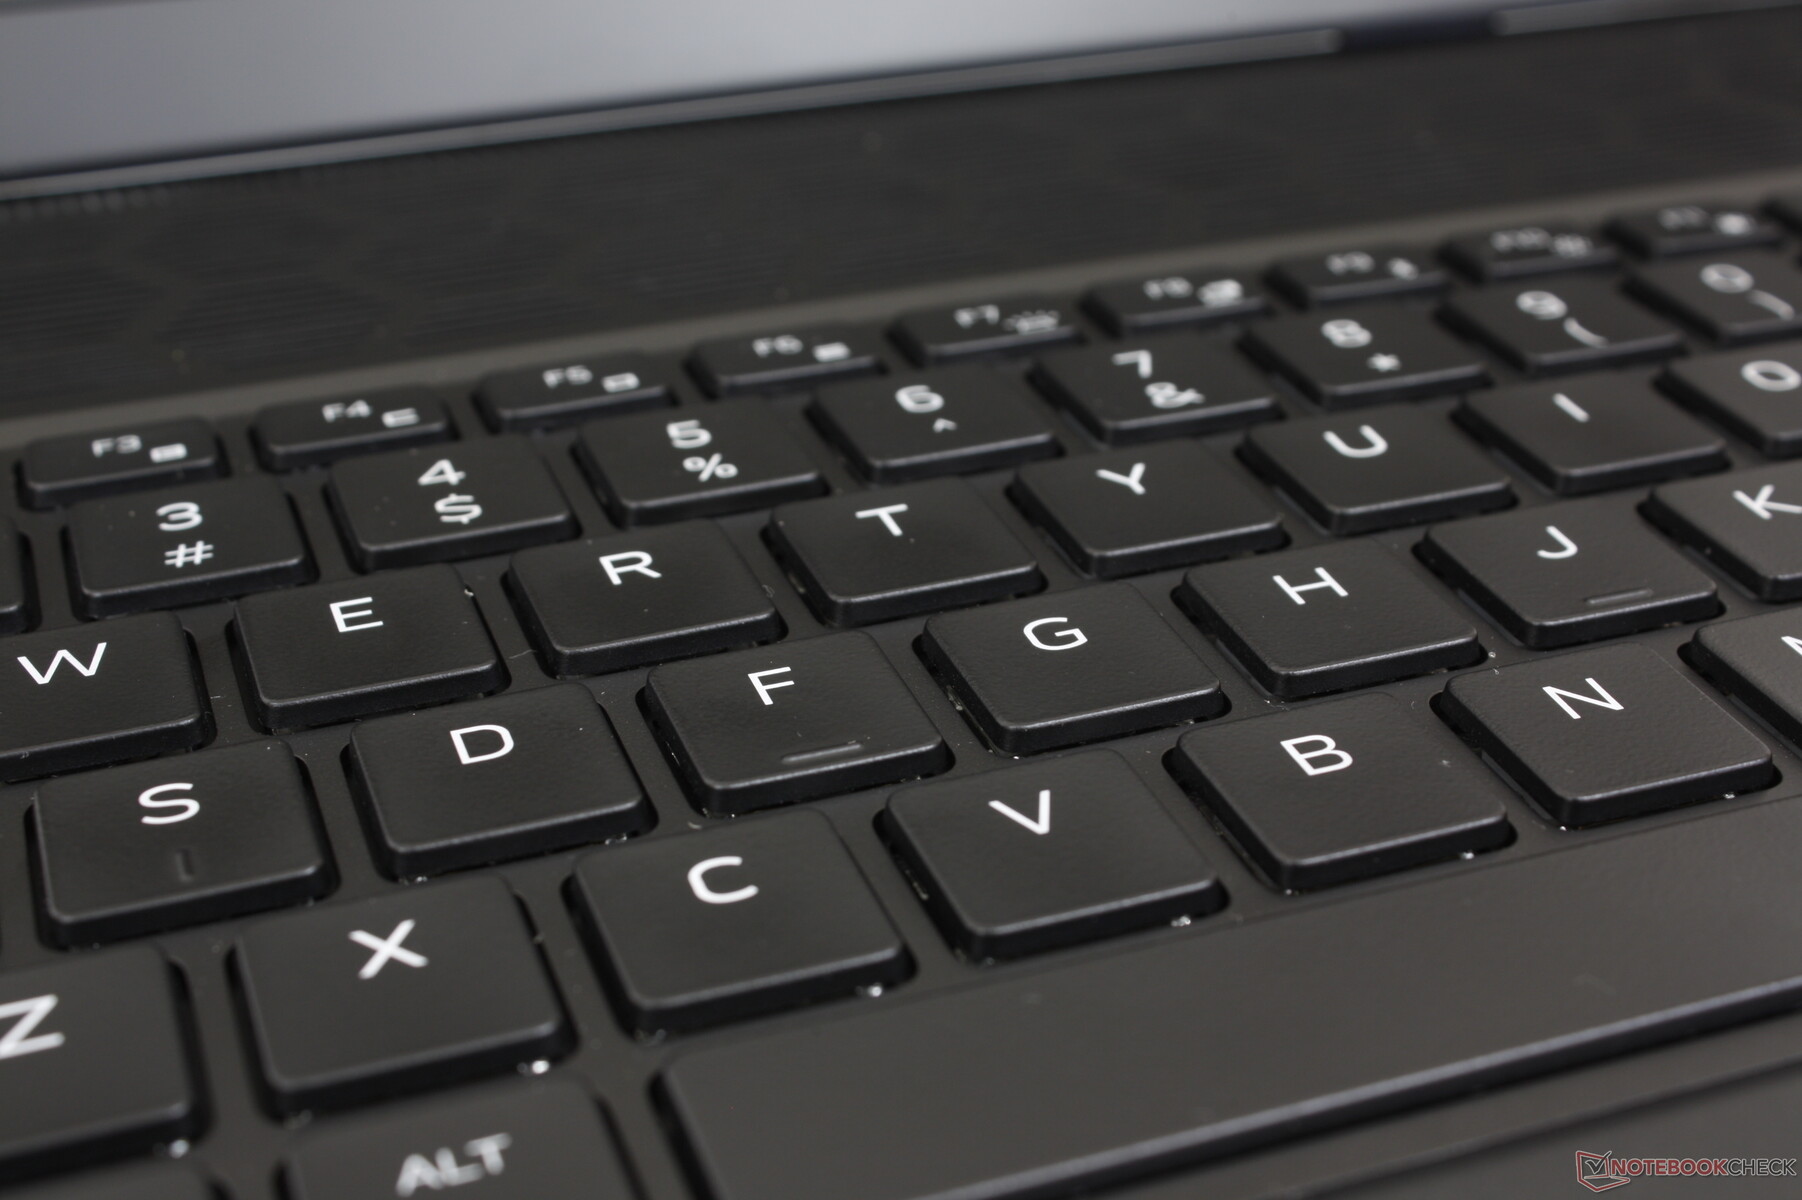
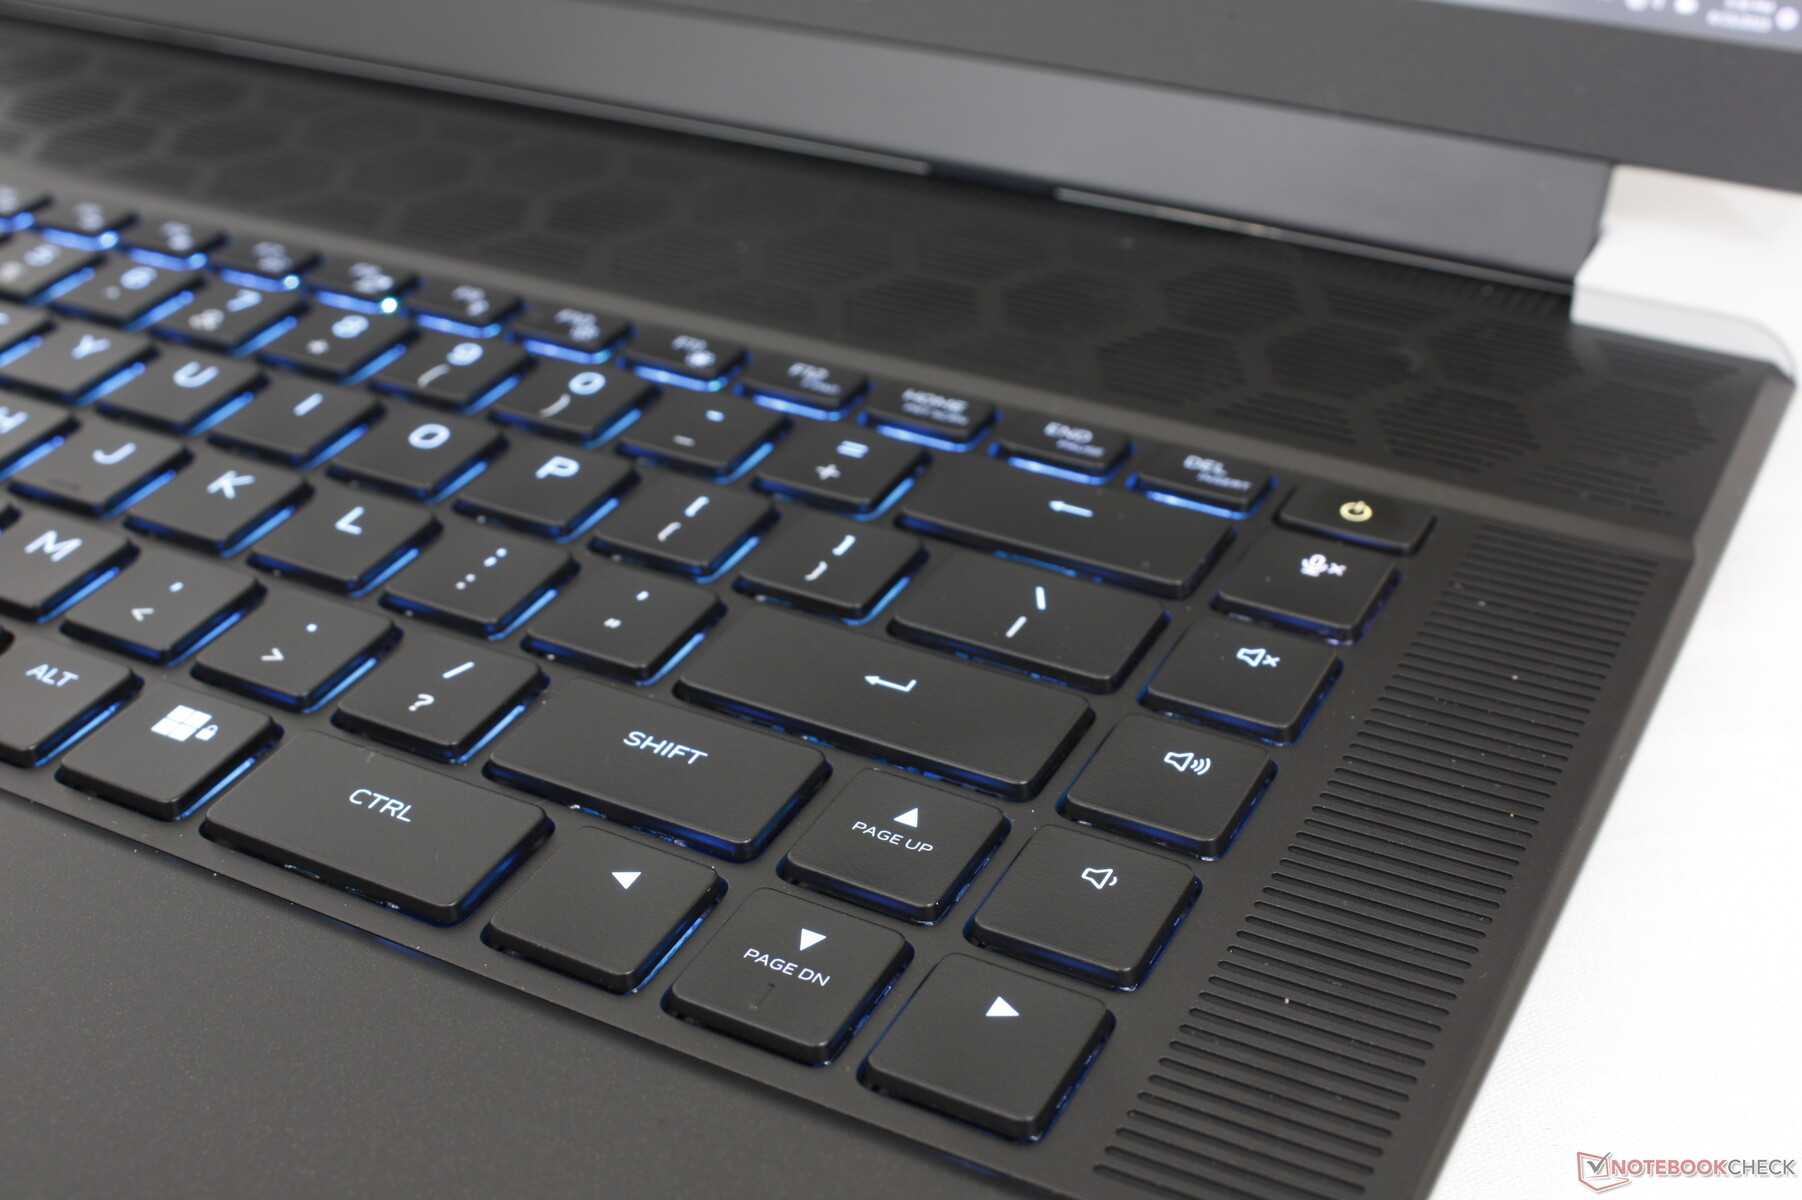
Inmatningsenheter - Mekaniska tangenter är högljudda och stolta
Tangentbord
Dell erbjuder två tangentbordsalternativ: vanliga membranbaserade tangenter och CherryMX ultralågprofilstangenter med RGB-belysning per tangent. Vår testenhet är utrustad med det senare alternativet och skrivupplevelsen är som natt och dag jämfört med de membranbaserade tangenterna på de flesta andra bärbara speldatorer. Den 1,8 mm stora tangentöppningen är djupare än de mer typiska 1,5 mm och återkopplingen är mycket fastare och mer klickande för en mer tillfredsställande känsla. Det är svårt att gå tillbaka till att skriva på något som Razer Blade 16 efter att ha varit van vid CherryMX-tangenterna på Alienware x16.
Den största nackdelen är naturligtvis det betydligt högre ljudet från de mekaniska tangenterna. Därför kanske du vill överväga det icke-mekaniska standardalternativet om du tänker använda den bärbara datorn i ljudkänsliga miljöer som klassrum eller trånga studentrum.
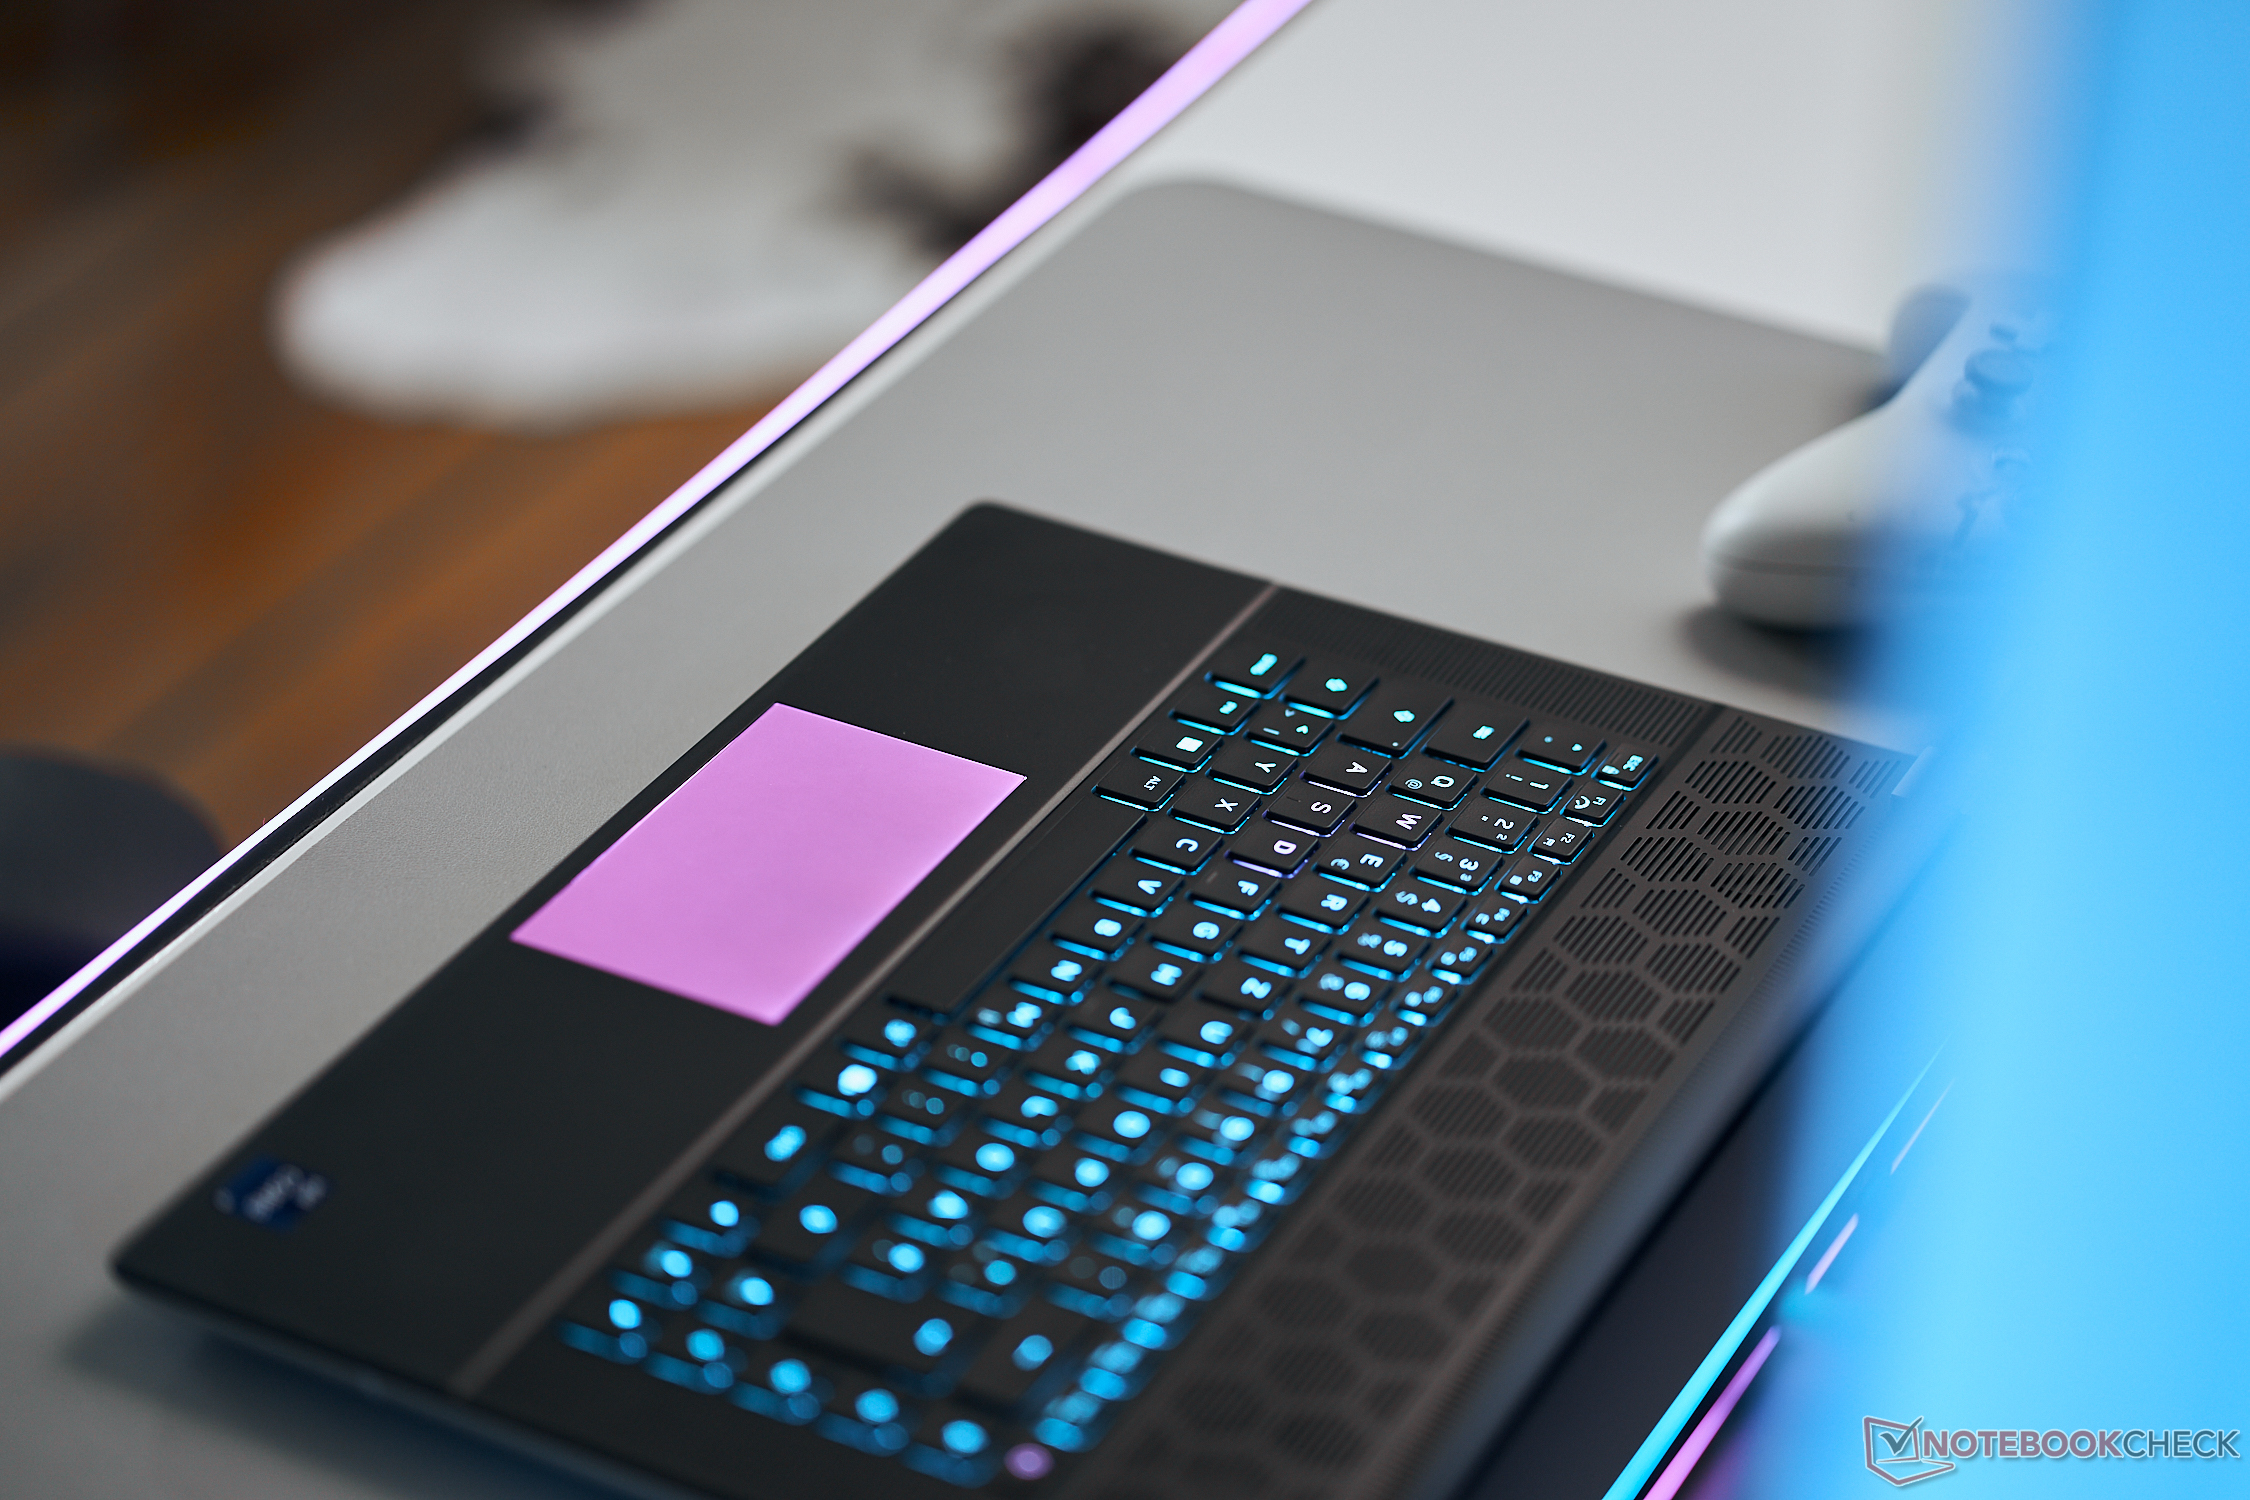
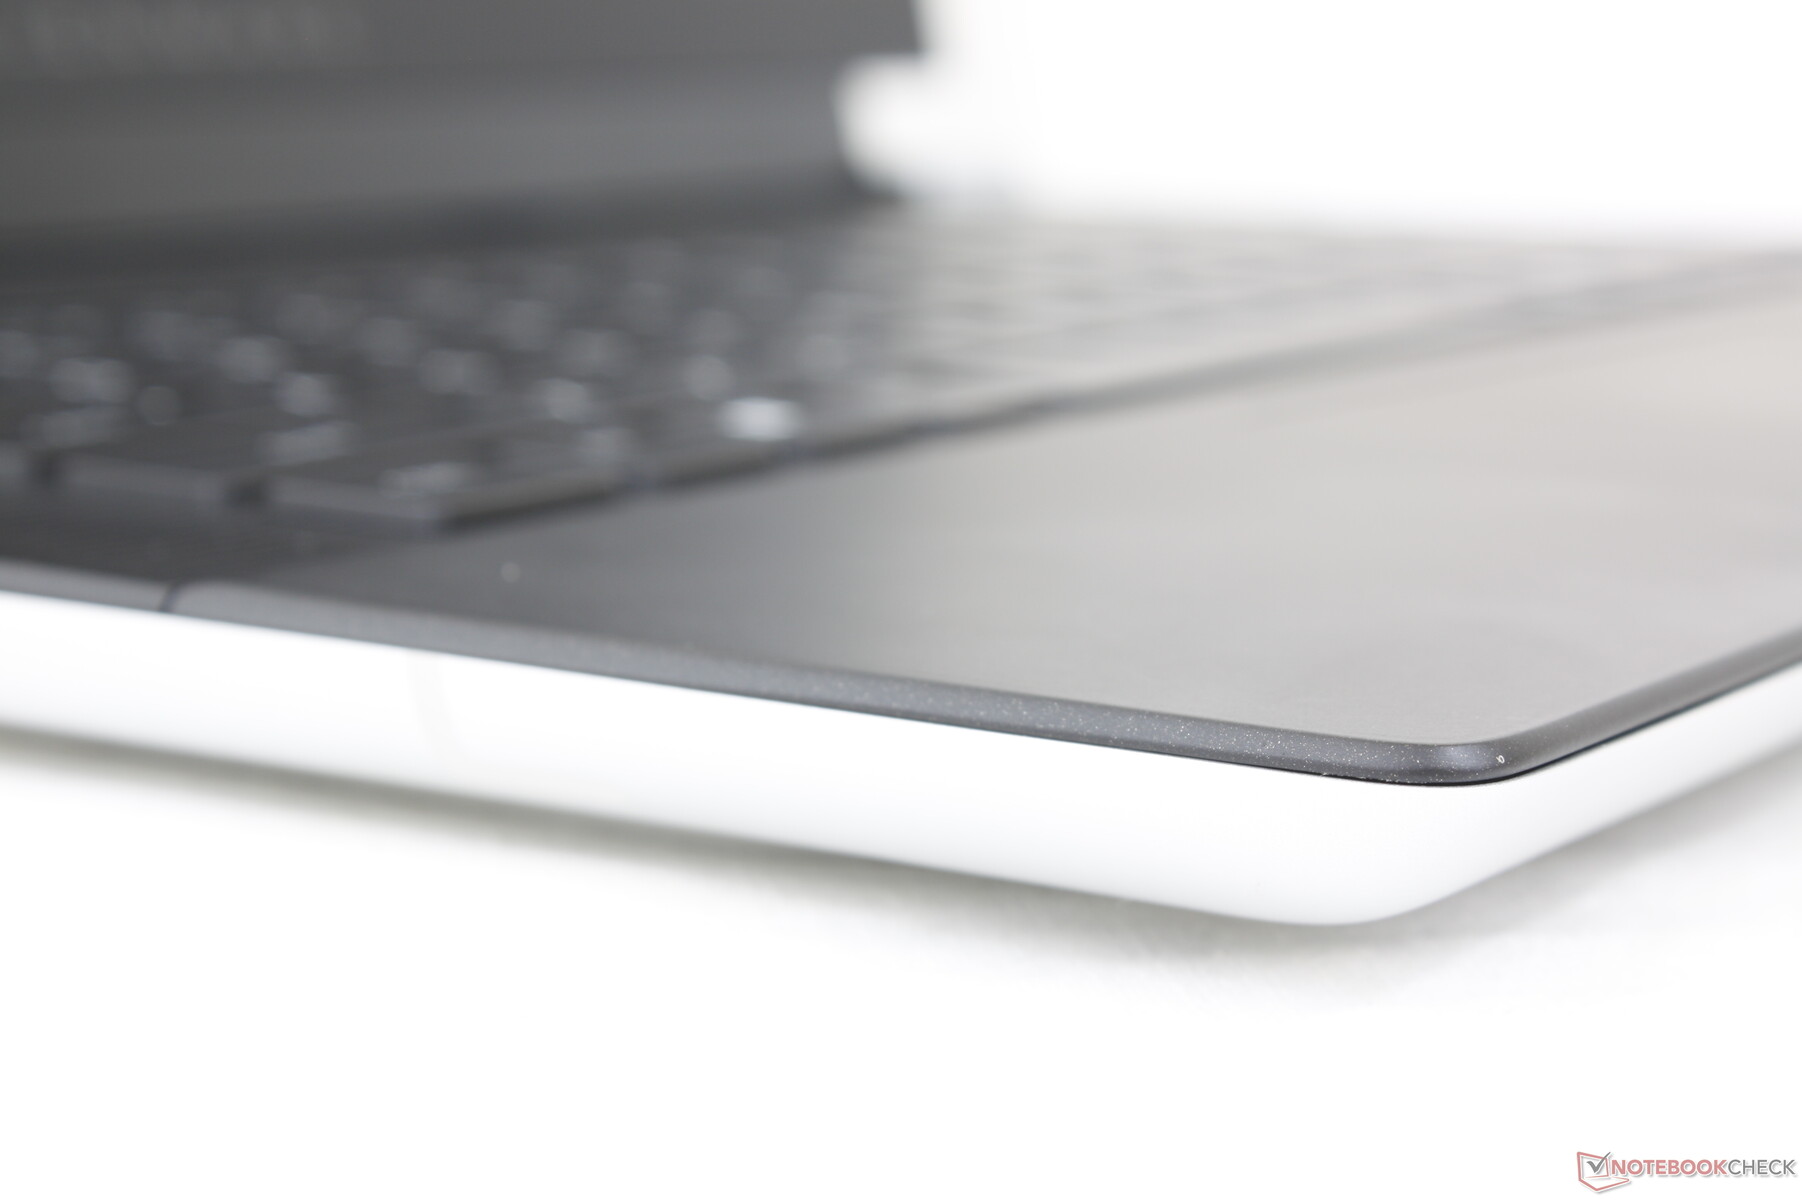
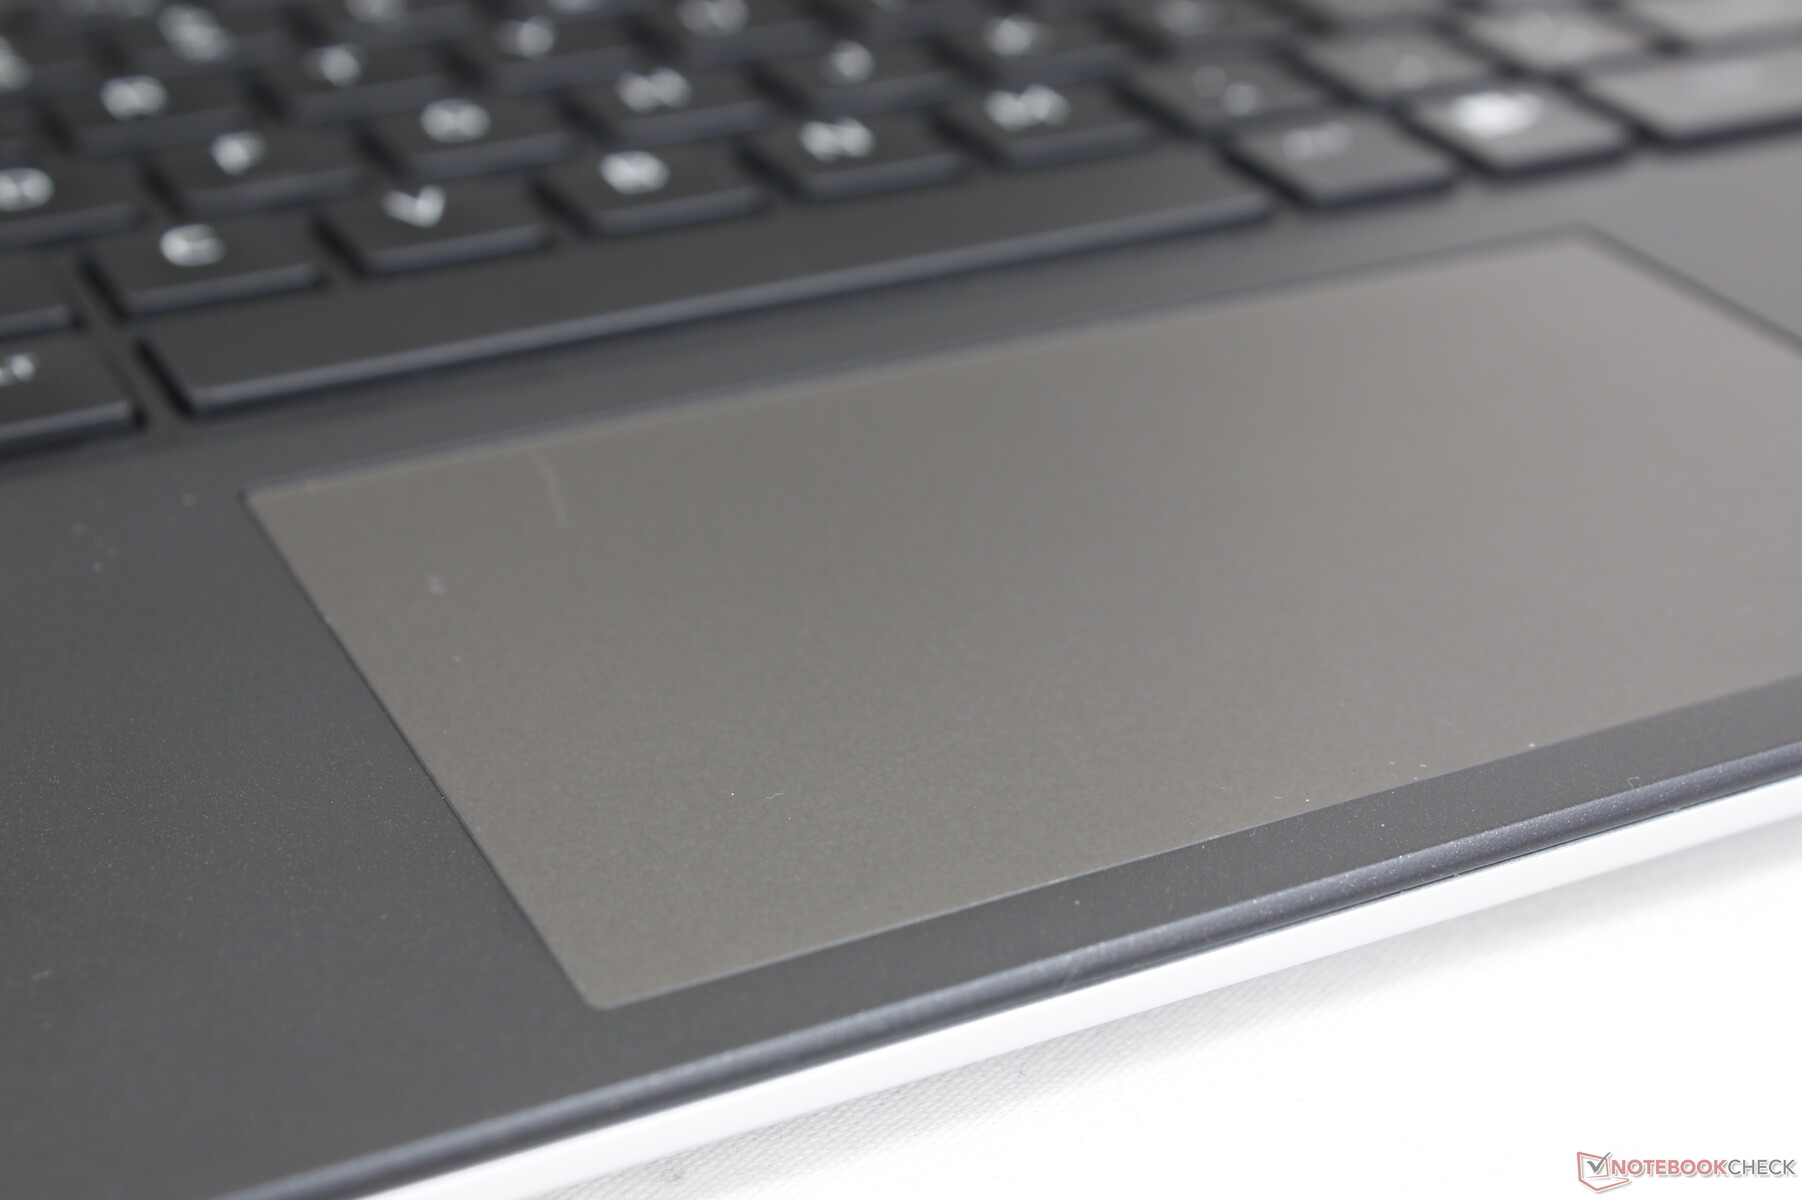
Pekplatta
Klickplattan är en av de minsta för en 16-tums bärbar dator med bara 11,2 x 6,5 cm jämfört med 17 x 9,7 cm och 12 x 7,5 cm på Blade 16 och Legion Pro 5 16respektive. Den mindre storleken beror på att den stora kyllösningen och ventilationsgallren upptar mer utrymme längs systemets bakre halva. Glidningen är mjuk med endast en liten klumpighet när man rör sig i långsammare hastigheter för mer exakta klick.
Återkopplingen när man klickar är lätt och mycket ytlig, vilket ger en otillfredsställande känsla. Baserat på detta och den lilla ytan är det tydligt att Dell förväntar sig att de flesta användare har en USB-mus redo att användas.
Display - inget dåligt alternativ
Tre displayalternativ är tillgängliga och våra mått återspeglar endast det alternativ som är markerat med fetstil:
- 2560 x 1600, 165 Hz, 3 ms, 100% sRGB, G-Sync
- 1920 x 1200, 480 Hz, 3 ms, 100% DCI-P3, G-Sync
- 2560 x 1600, 240 Hz, 3 ms, 100% DCI-P3, G-Sync
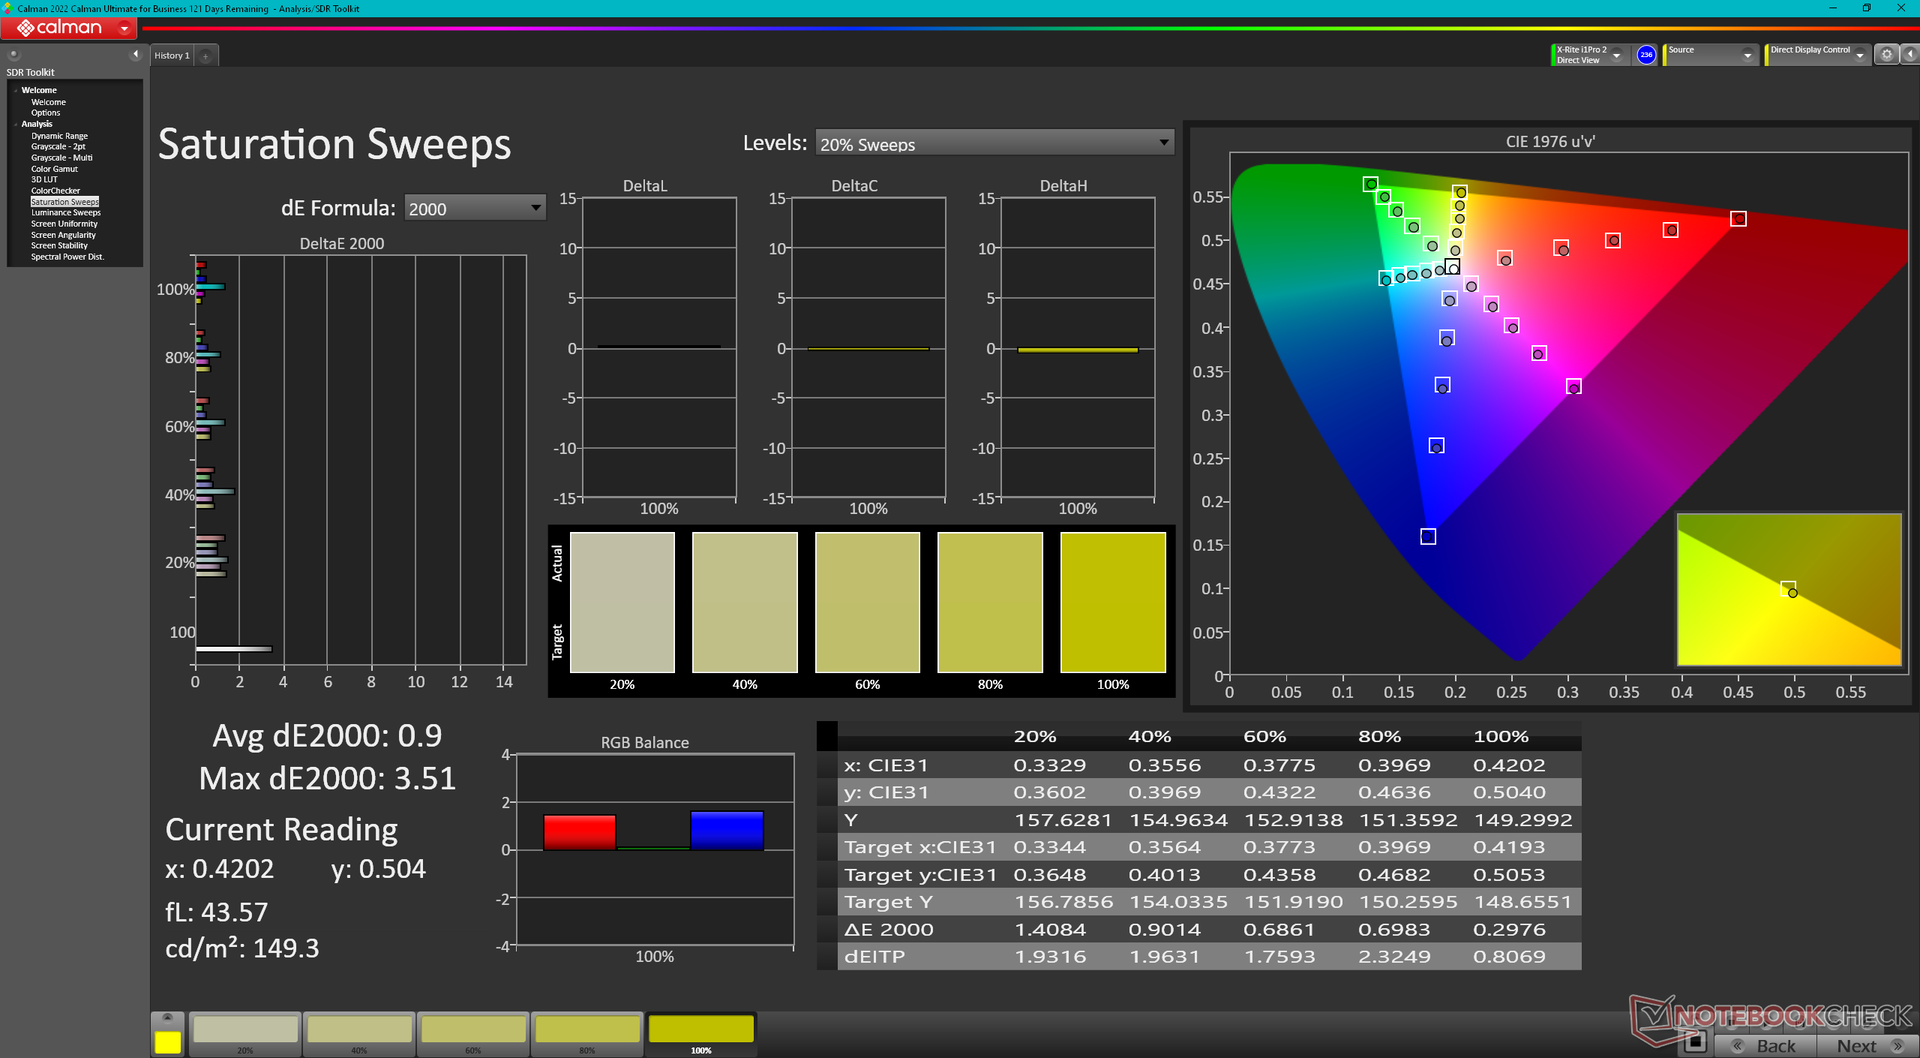
Det finns verkligen ingen dålig eller "fel" panel eftersom alla paneler är lämpliga för speländamål med sina snabba uppdateringsfrekvenser och snabba svarstider. Med det sagt är vår konfigurerade 1600p240-panel den bästa för de flesta användare eftersom 1200p480-alternativet ger sämre upplösning och 1600p165-alternativet har grundare färger. Visningsupplevelsen är jämförbar med Blade 16 medan den är bättre än Dell G16 och Lenovo Legion Pro 7 16 när det gäller färgomfång.
| |||||||||||||||||||||||||
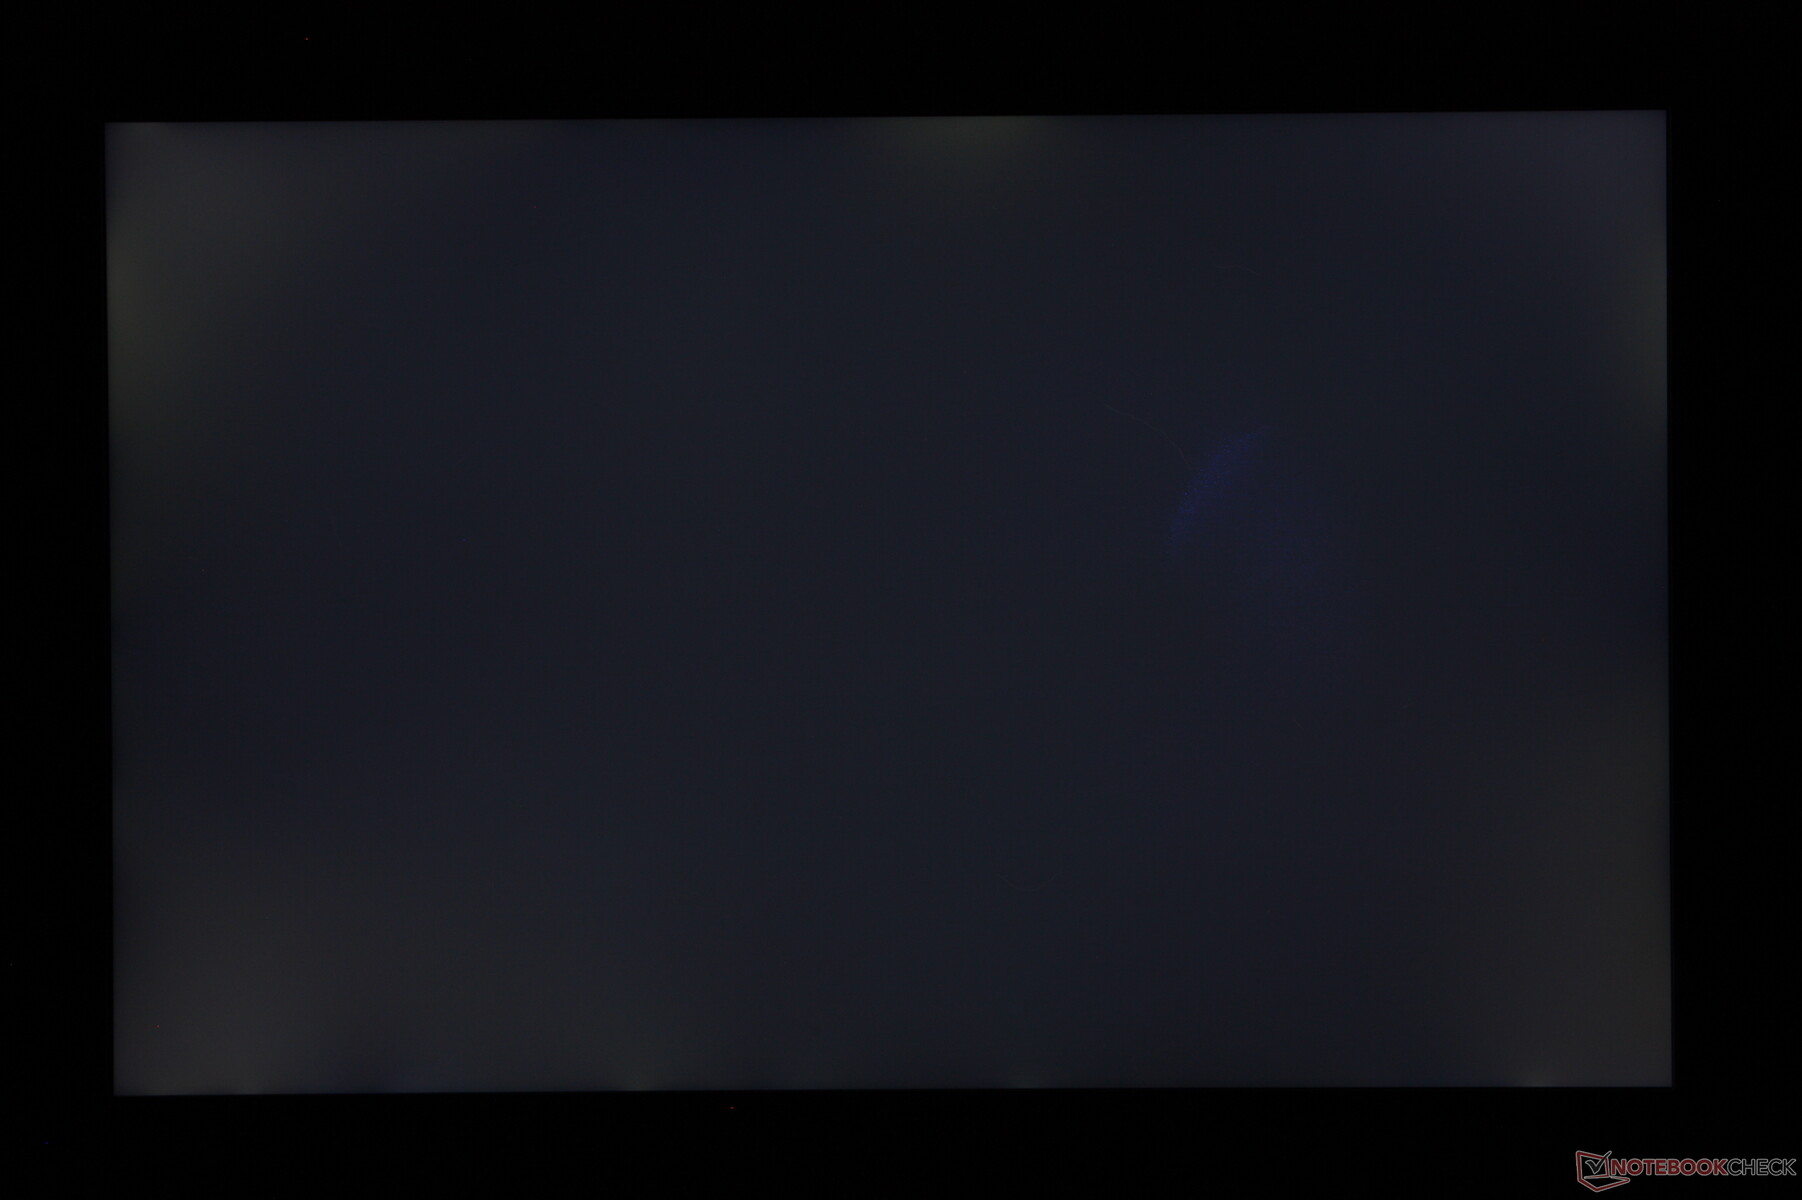
Distribution av ljusstyrkan: 89 %
Mitt på batteriet: 302.2 cd/m²
Kontrast: 1162:1 (Svärta: 0.26 cd/m²)
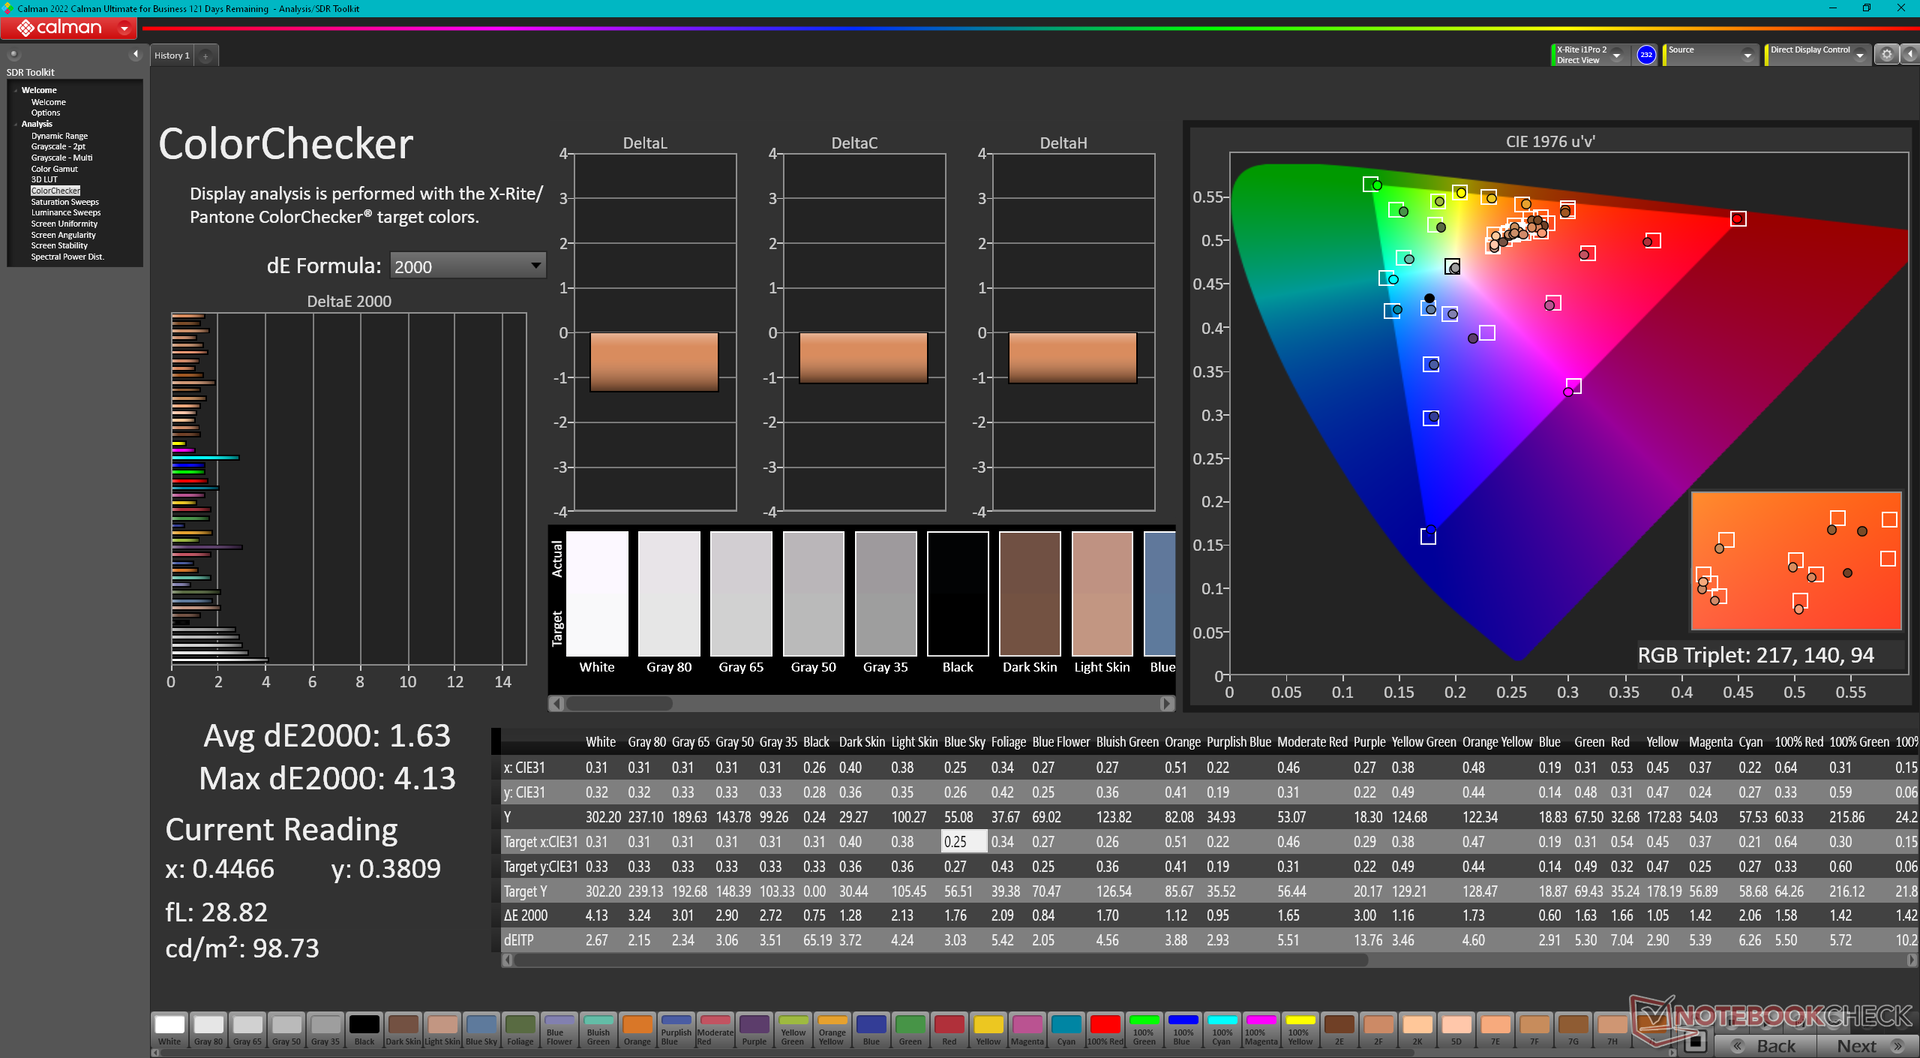
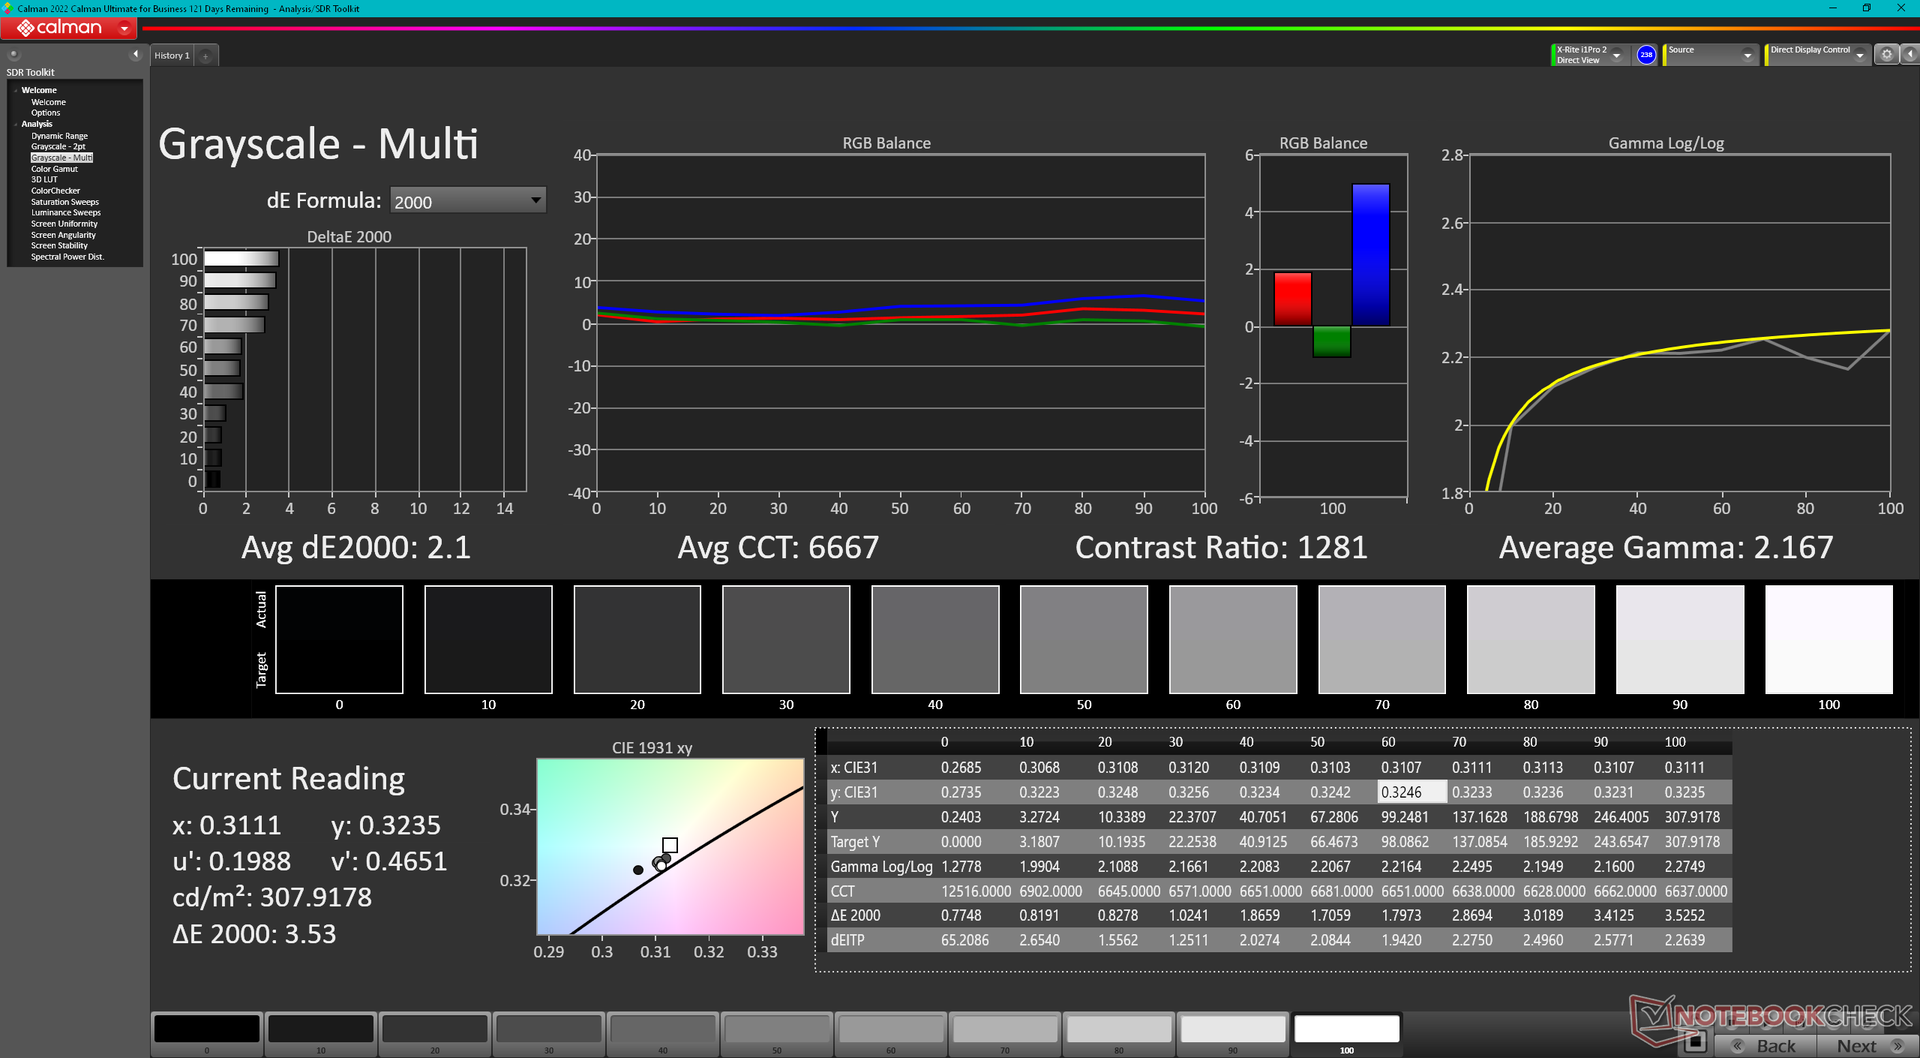
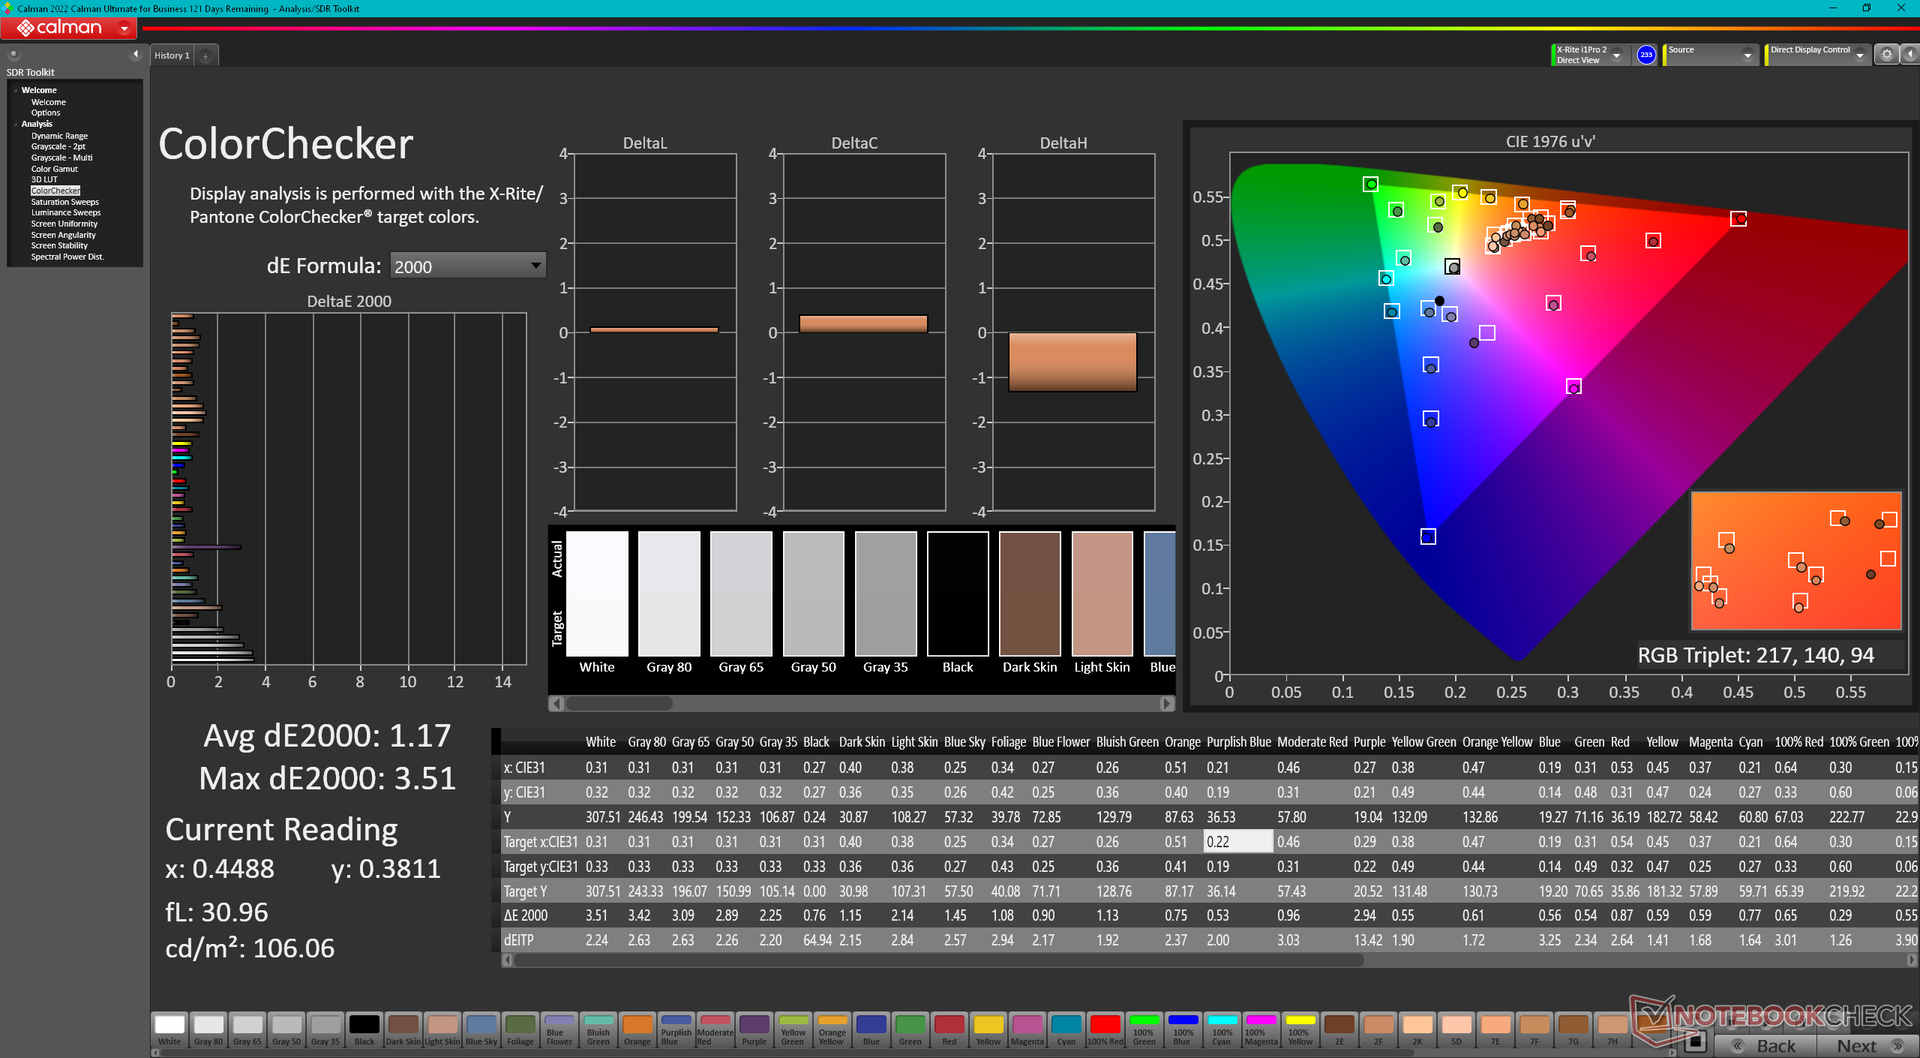
ΔE ColorChecker Calman: 1.63 | ∀{0.5-29.43 Ø4.72}
calibrated: 1.17
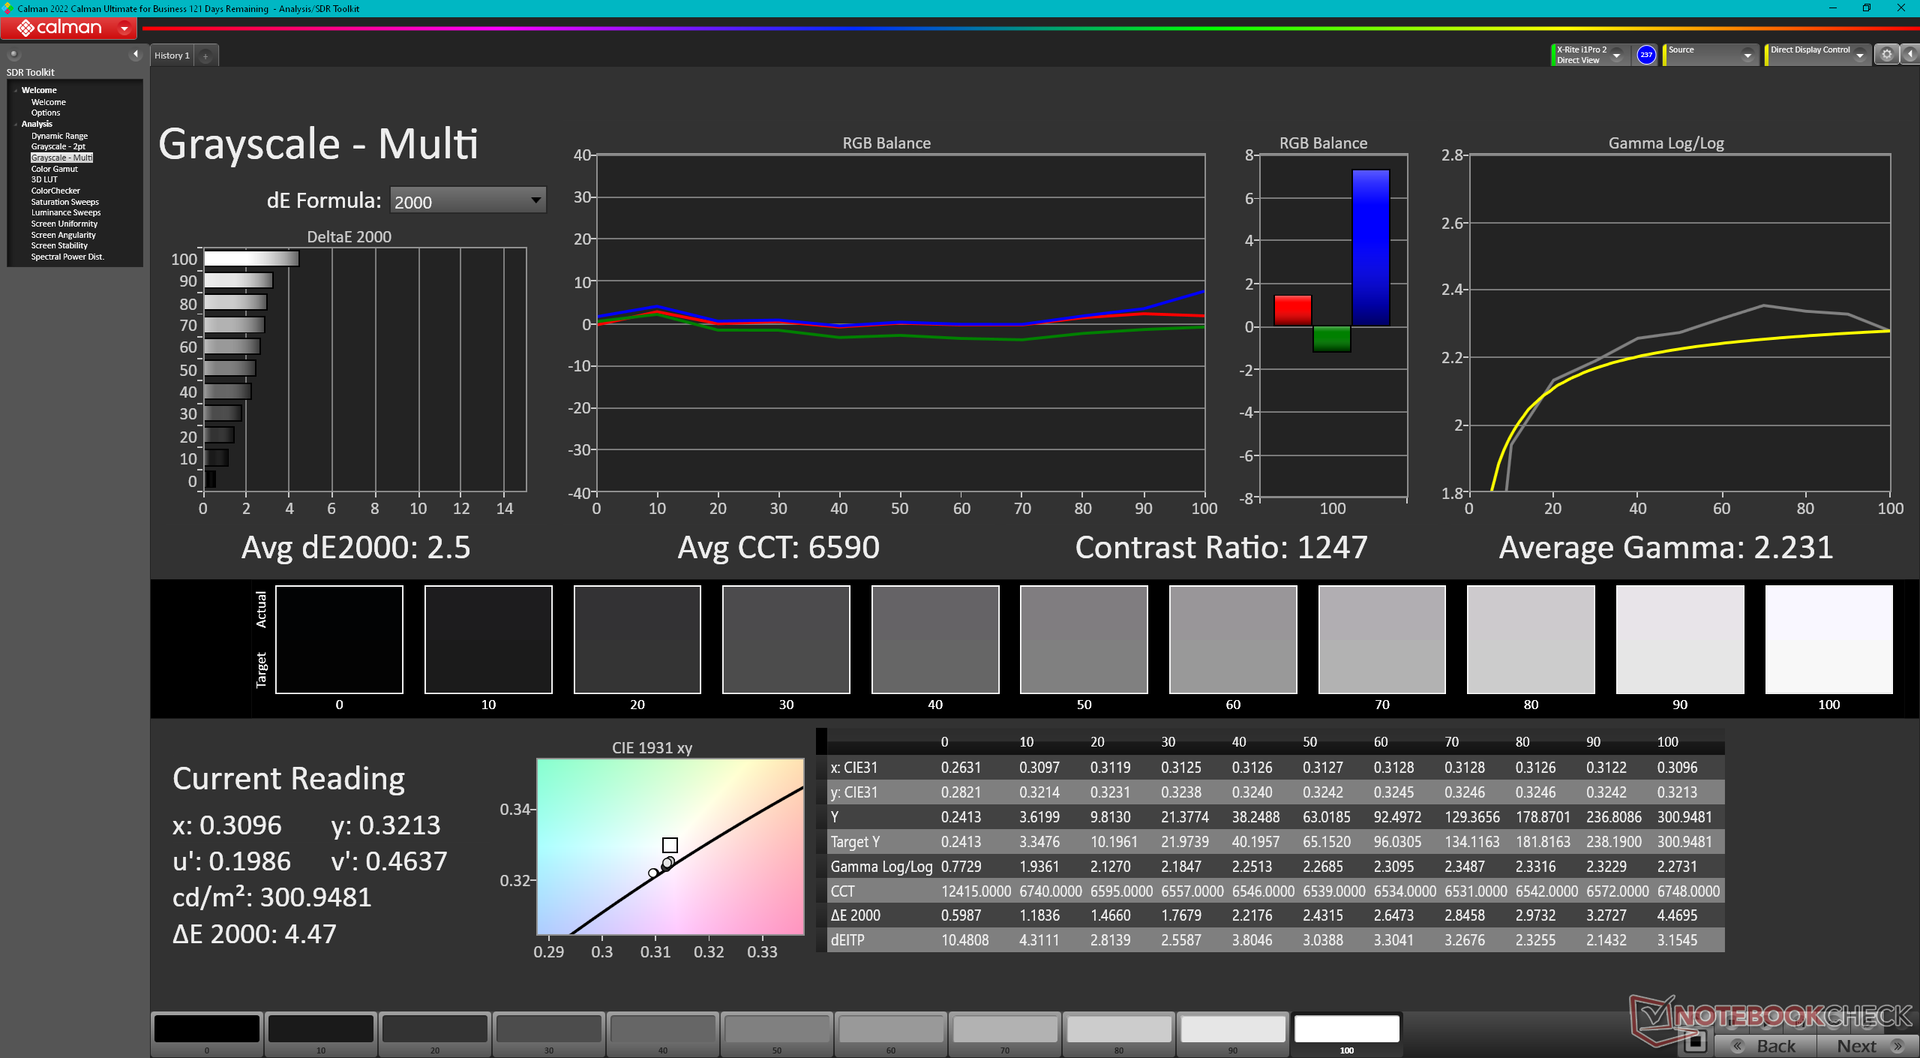
ΔE Greyscale Calman: 2.5 | ∀{0.09-98 Ø4.97}
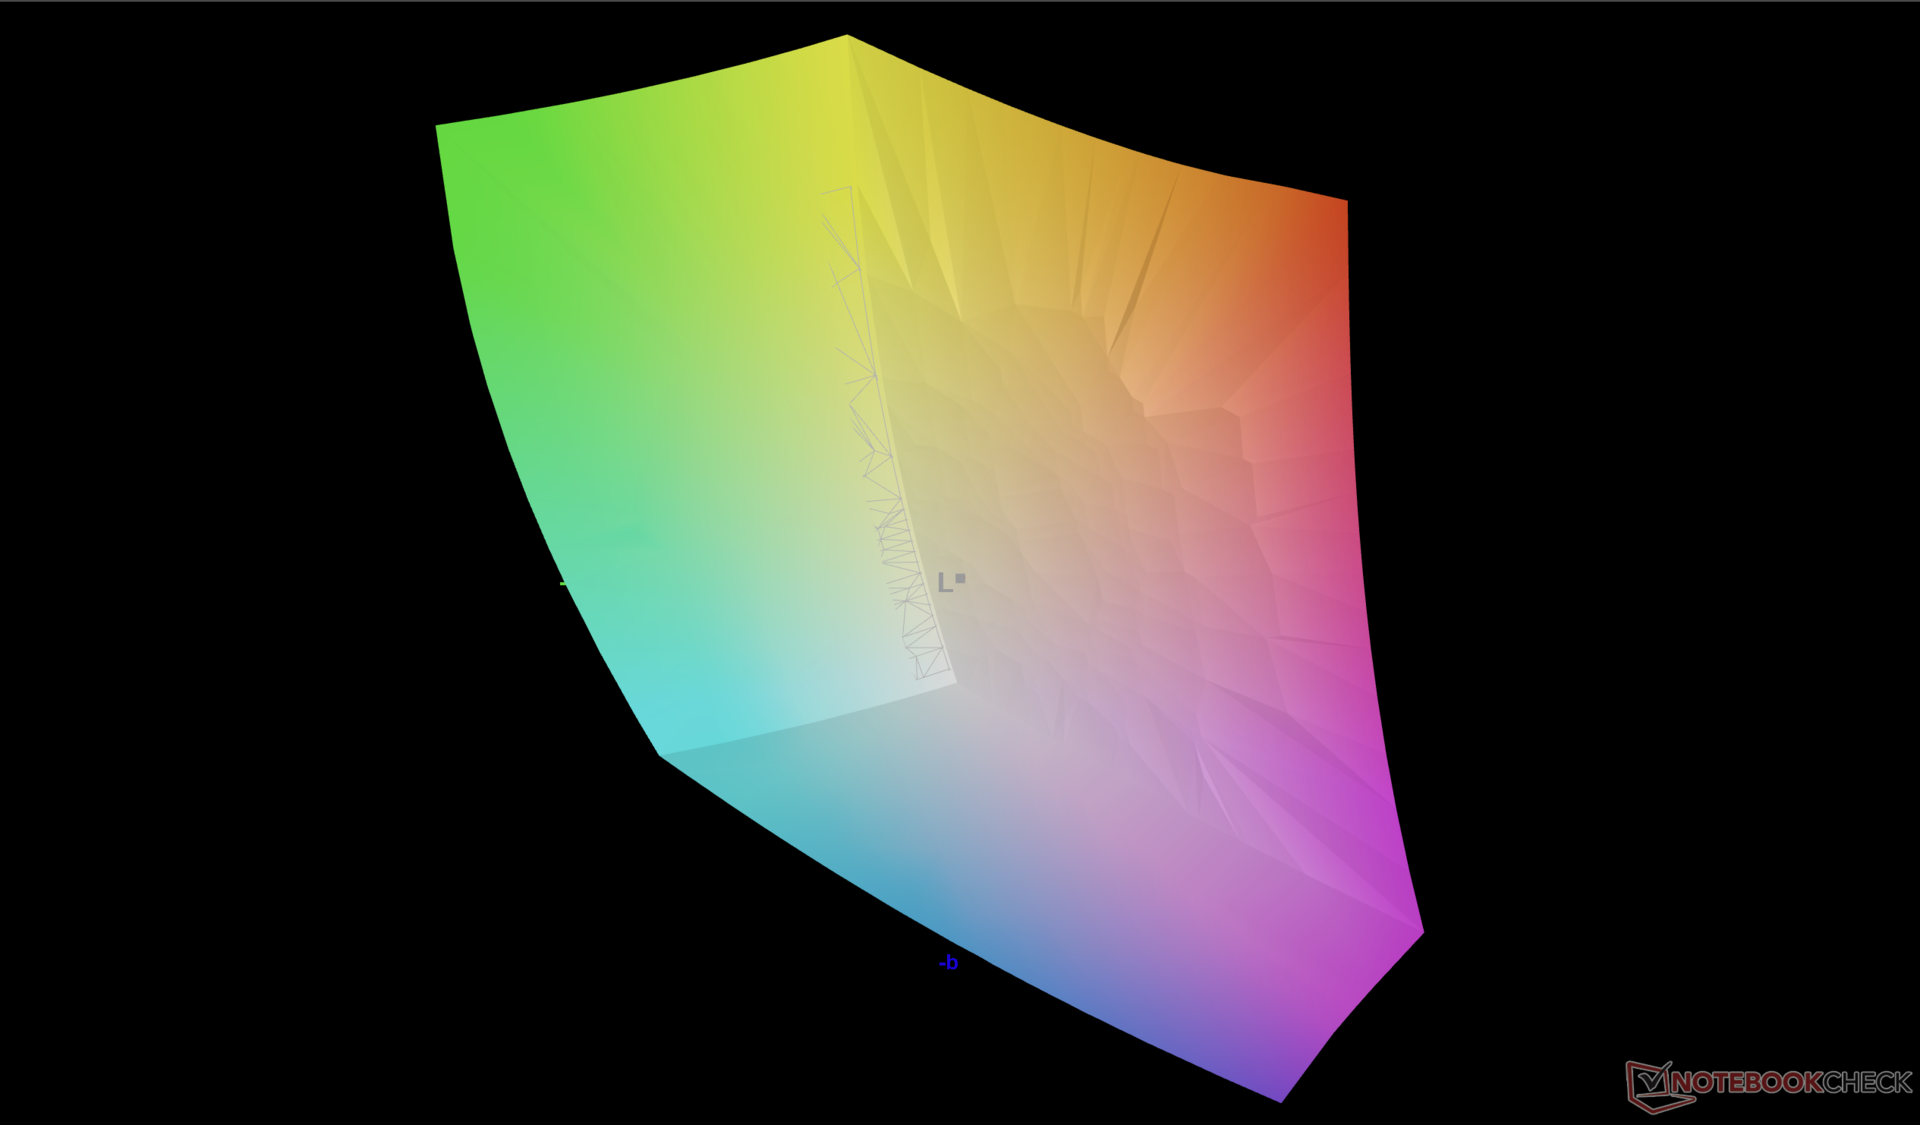
88.6% AdobeRGB 1998 (Argyll 3D)
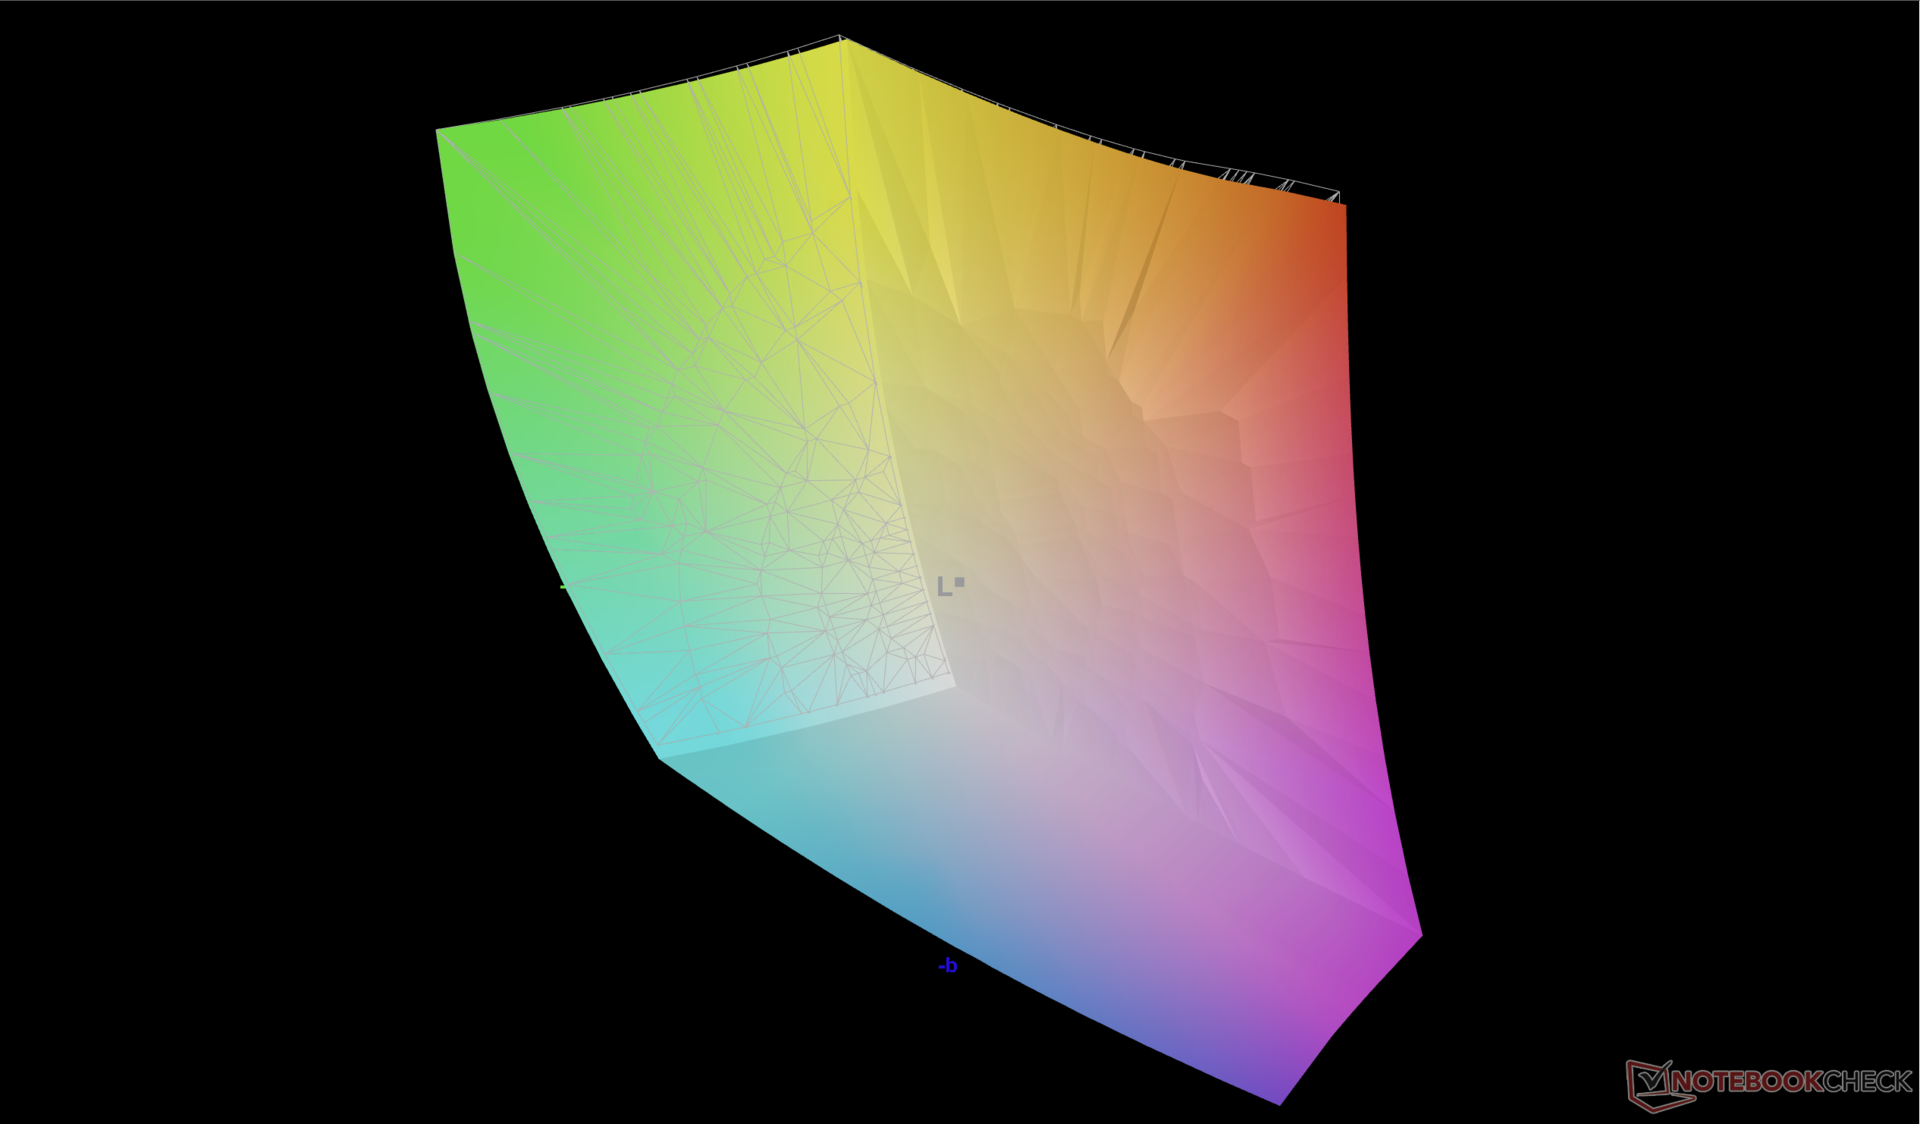
100% sRGB (Argyll 3D)
99.2% Display P3 (Argyll 3D)
Gamma: 2.23
CCT: 6590 K
| Alienware x16 R1 BOE NE16NZ4, IPS, 2560x1600, 16" | Asus ROG Zephyrus M16 GU604VY-NM042X BOE0B74 (NE160QDM-NM4, IPS, 2560x1600, 16" | Razer Blade 16 Early 2023 CSOT T3 MNG007DA4-1, IPS, 2560x1600, 16" | Dell G16 7620 BOE NE16QDM, IPS, 2560x1600, 16" | Alienware m17 R5 (R9 6900HX, RX 6850M XT) AU Optronics AUODBA3, IPS, 3840x2160, 17" | Lenovo Legion Pro 7 16IRX8H MNG007DA2-3 (CSO1628), IPS, 2560x1600, 16" | |
|---|---|---|---|---|---|---|
| Display | 1% | 0% | -18% | -1% | -17% | |
| Display P3 Coverage (%) | 99.2 | 99.33 0% | 98.5 -1% | 68.3 -31% | 97.2 -2% | 69.1 -30% |
| sRGB Coverage (%) | 100 | 99.9 0% | 100 0% | 98 -2% | 99.6 0% | 99.7 0% |
| AdobeRGB 1998 Coverage (%) | 88.6 | 90.01 2% | 89.7 1% | 70.5 -20% | 88.4 0% | 71.2 -20% |
| Response Times | -542% | -23% | -35% | -118% | -49% | |
| Response Time Grey 50% / Grey 80% * (ms) | 5.1 ? | 50.8 ? -896% | 6.6 ? -29% | 8.6 ? -69% | 16.4 ? -222% | 12.3 ? -141% |
| Response Time Black / White * (ms) | 10.3 ? | 29.6 ? -187% | 12 ? -17% | 10.4 ? -1% | 11.6 ? -13% | 5.9 ? 43% |
| PWM Frequency (Hz) | 12000 | |||||
| Screen | 247% | -8% | -4% | -80% | 31% | |
| Brightness middle (cd/m²) | 302.2 | 634 110% | 456.8 51% | 369.4 22% | 484 60% | 511 69% |
| Brightness (cd/m²) | 285 | 627 120% | 437 53% | 348 22% | 449 58% | 469 65% |
| Brightness Distribution (%) | 89 | 92 3% | 83 -7% | 83 -7% | 87 -2% | 86 -3% |
| Black Level * (cd/m²) | 0.26 | 0.03 88% | 0.35 -35% | 0.32 -23% | 0.55 -112% | 0.4 -54% |
| Contrast (:1) | 1162 | 21133 1719% | 1305 12% | 1154 -1% | 880 -24% | 1278 10% |
| Colorchecker dE 2000 * | 1.63 | 0.89 45% | 3.7 -127% | 1.78 -9% | 4.8 -194% | 0.95 42% |
| Colorchecker dE 2000 max. * | 4.13 | 1.79 57% | 6.42 -55% | 4.41 -7% | 7.48 -81% | 2.07 50% |
| Colorchecker dE 2000 calibrated * | 1.17 | 0.91 22% | 0.66 44% | 1.22 -4% | 4.74 -305% | 0.91 22% |
| Greyscale dE 2000 * | 2.5 | 1.13 55% | 2.6 -4% | 3.2 -28% | 5.5 -120% | 0.6 76% |
| Gamma | 2.23 99% | 2.47 89% | 2.3 96% | 2.2 100% | 2.42 91% | 2.176 101% |
| CCT | 6590 99% | 6497 100% | 6108 106% | 6750 96% | 6148 106% | 6545 99% |
| Totalt genomsnitt (program/inställningar) | -98% /
81% | -10% /
-8% | -19% /
-11% | -66% /
-68% | -12% /
9% |
* ... mindre är bättre
Skärmen är väl kalibrerad från start med genomsnittliga deltaE-värden för gråskala och färg på bara 2,5 respektive 1,63. Att försöka kalibrera skärmen ytterligare med vår X-Rite-kolorimeter skulle bara resultera i mycket små förbättringar och därför är en slutanvändarkalibrering inte nödvändig.

Visa svarstider
| ↔ Svarstid svart till vitt | ||
|---|---|---|
| 10.3 ms ... stiga ↗ och falla ↘ kombinerat | ↗ 5.4 ms stiga | 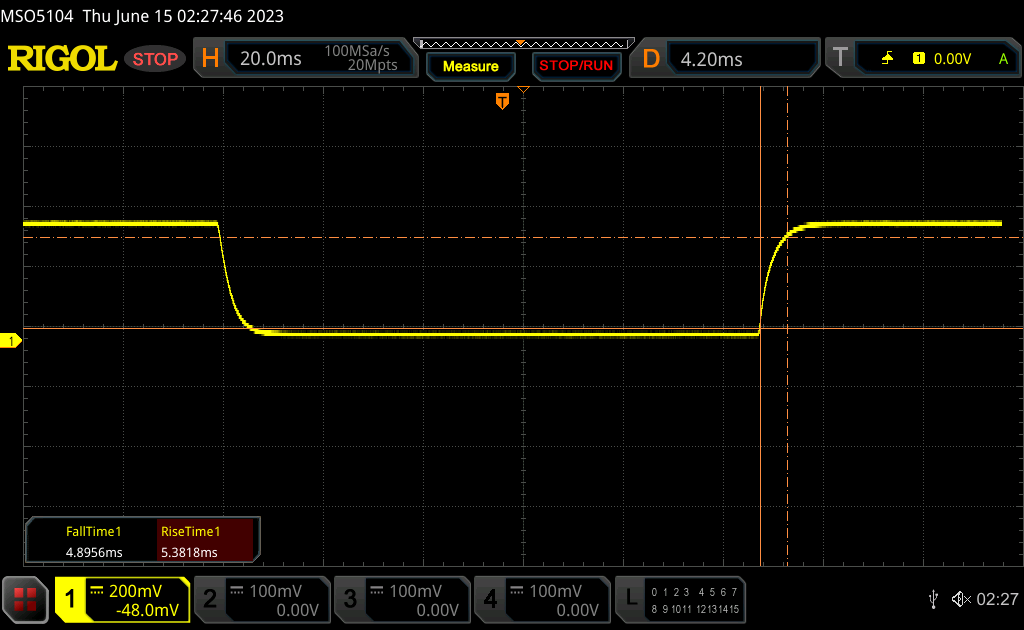 |
| ↘ 4.9 ms hösten | ||
| Skärmen visar bra svarsfrekvens i våra tester, men kan vara för långsam för konkurrenskraftiga spelare. I jämförelse sträcker sig alla testade enheter från 0.1 (minst) till 240 (maximalt) ms. » 28 % av alla enheter är bättre. Det betyder att den uppmätta svarstiden är bättre än genomsnittet av alla testade enheter (19.8 ms). | ||
| ↔ Svarstid 50 % grått till 80 % grått | ||
| 5.1 ms ... stiga ↗ och falla ↘ kombinerat | ↗ 2.4 ms stiga | 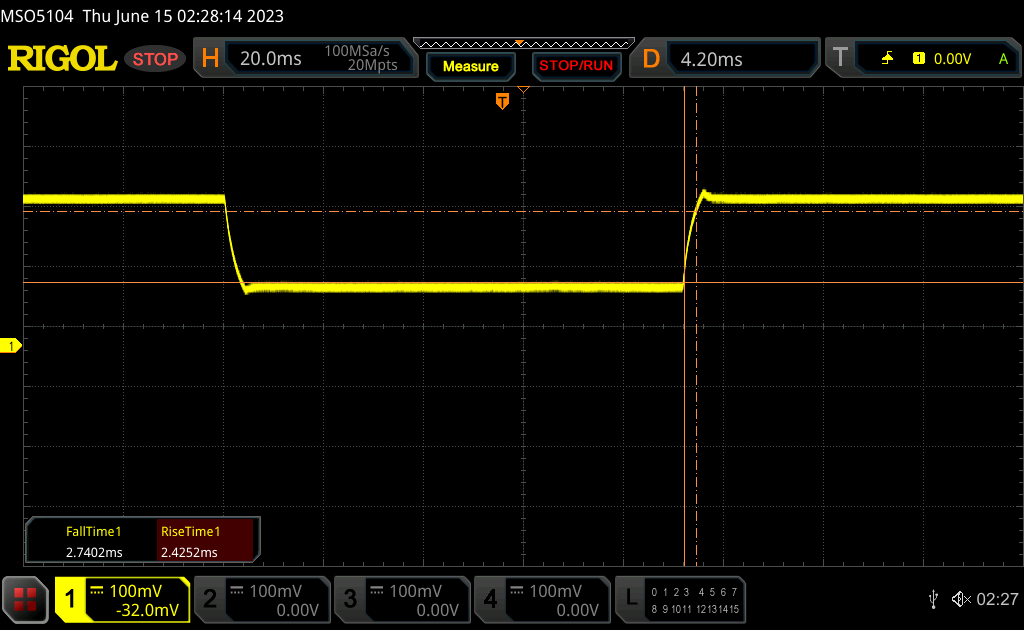 |
| ↘ 2.7 ms hösten | ||
| Skärmen visar väldigt snabba svarsfrekvenser i våra tester och borde vara mycket väl lämpad för fartfyllt spel. I jämförelse sträcker sig alla testade enheter från 0.165 (minst) till 636 (maximalt) ms. » 17 % av alla enheter är bättre. Det betyder att den uppmätta svarstiden är bättre än genomsnittet av alla testade enheter (31 ms). | ||
Skärmflimmer / PWM (Puls-Width Modulation)
| Skärmflimmer / PWM upptäcktes inte | 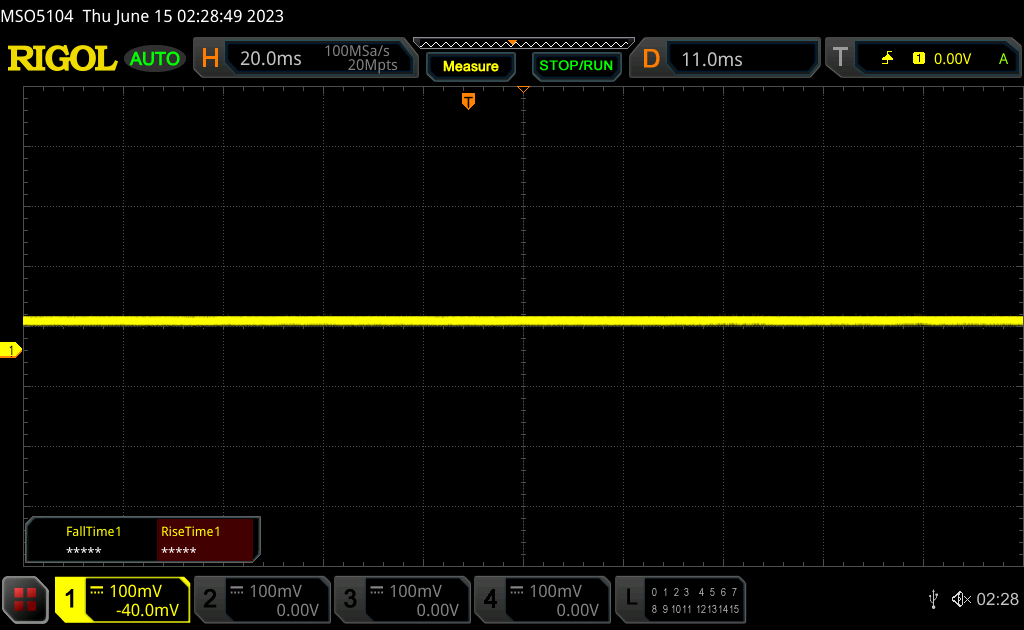 | ||
Som jämförelse: 52 % av alla testade enheter använder inte PWM för att dämpa skärmen. Om PWM upptäcktes mättes ett medelvärde av 7763 (minst: 5 - maximum: 343500) Hz. | |||
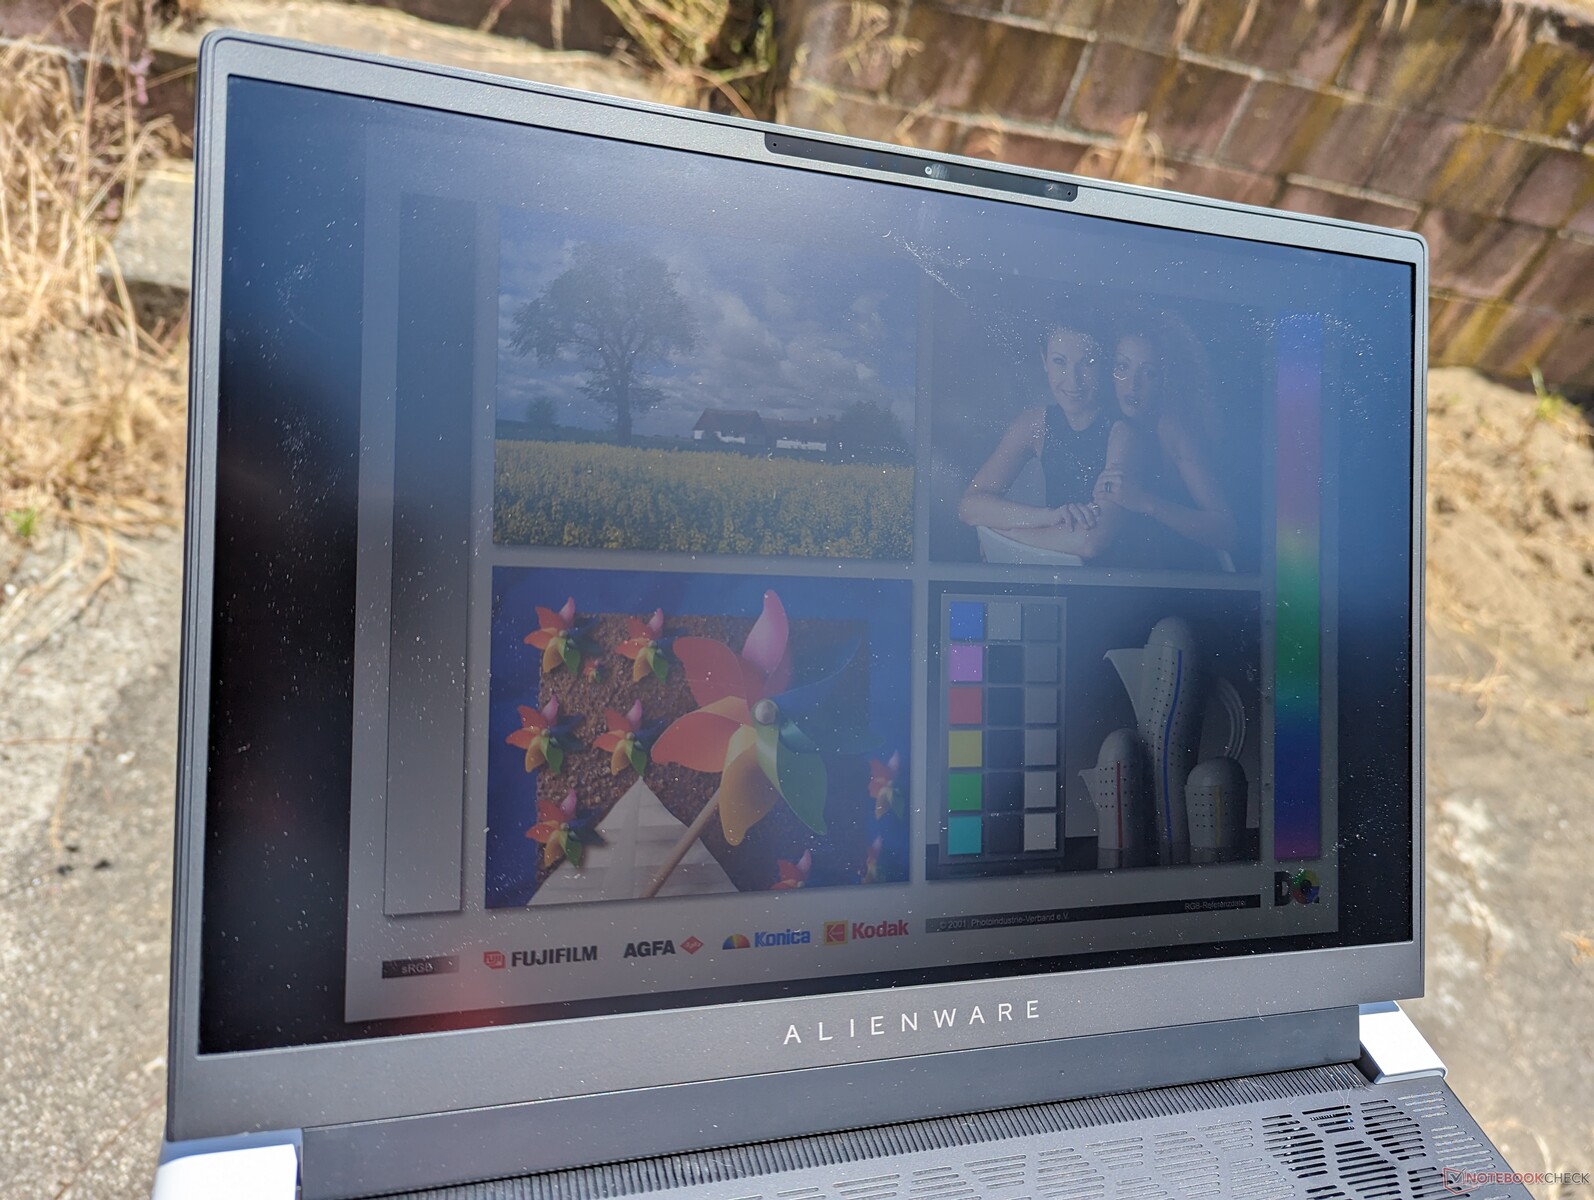
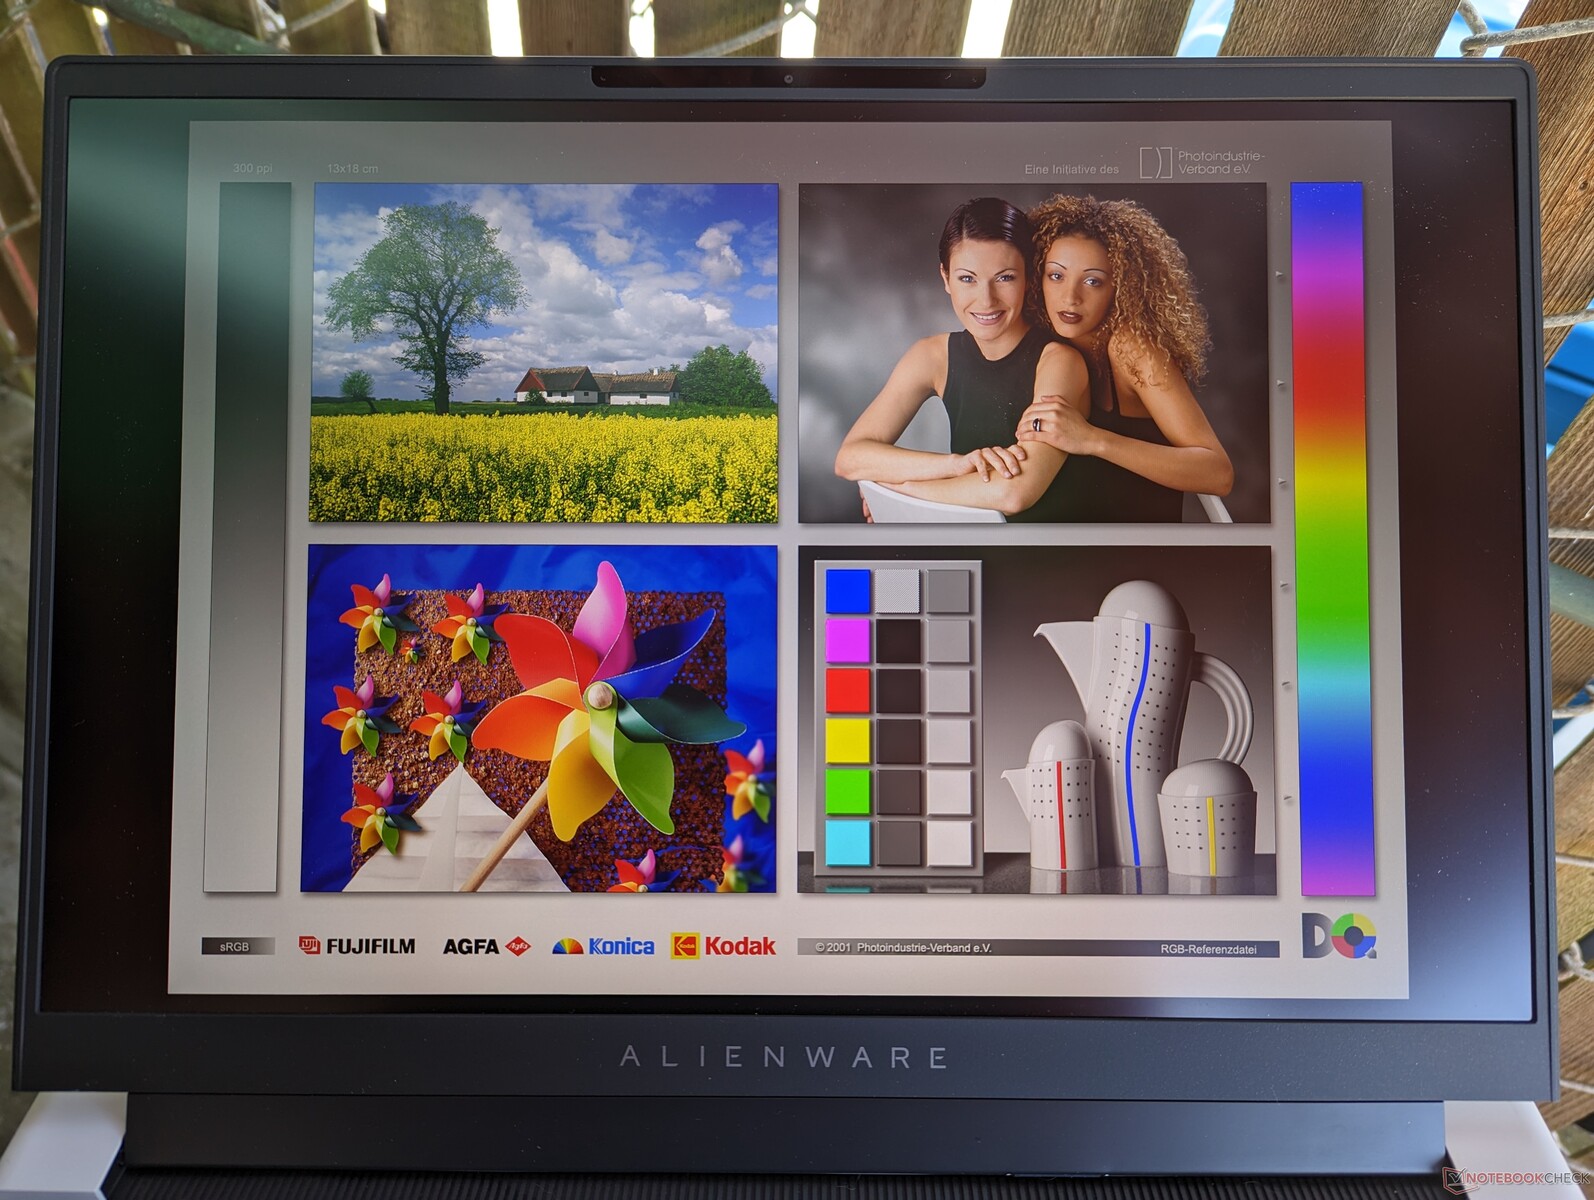
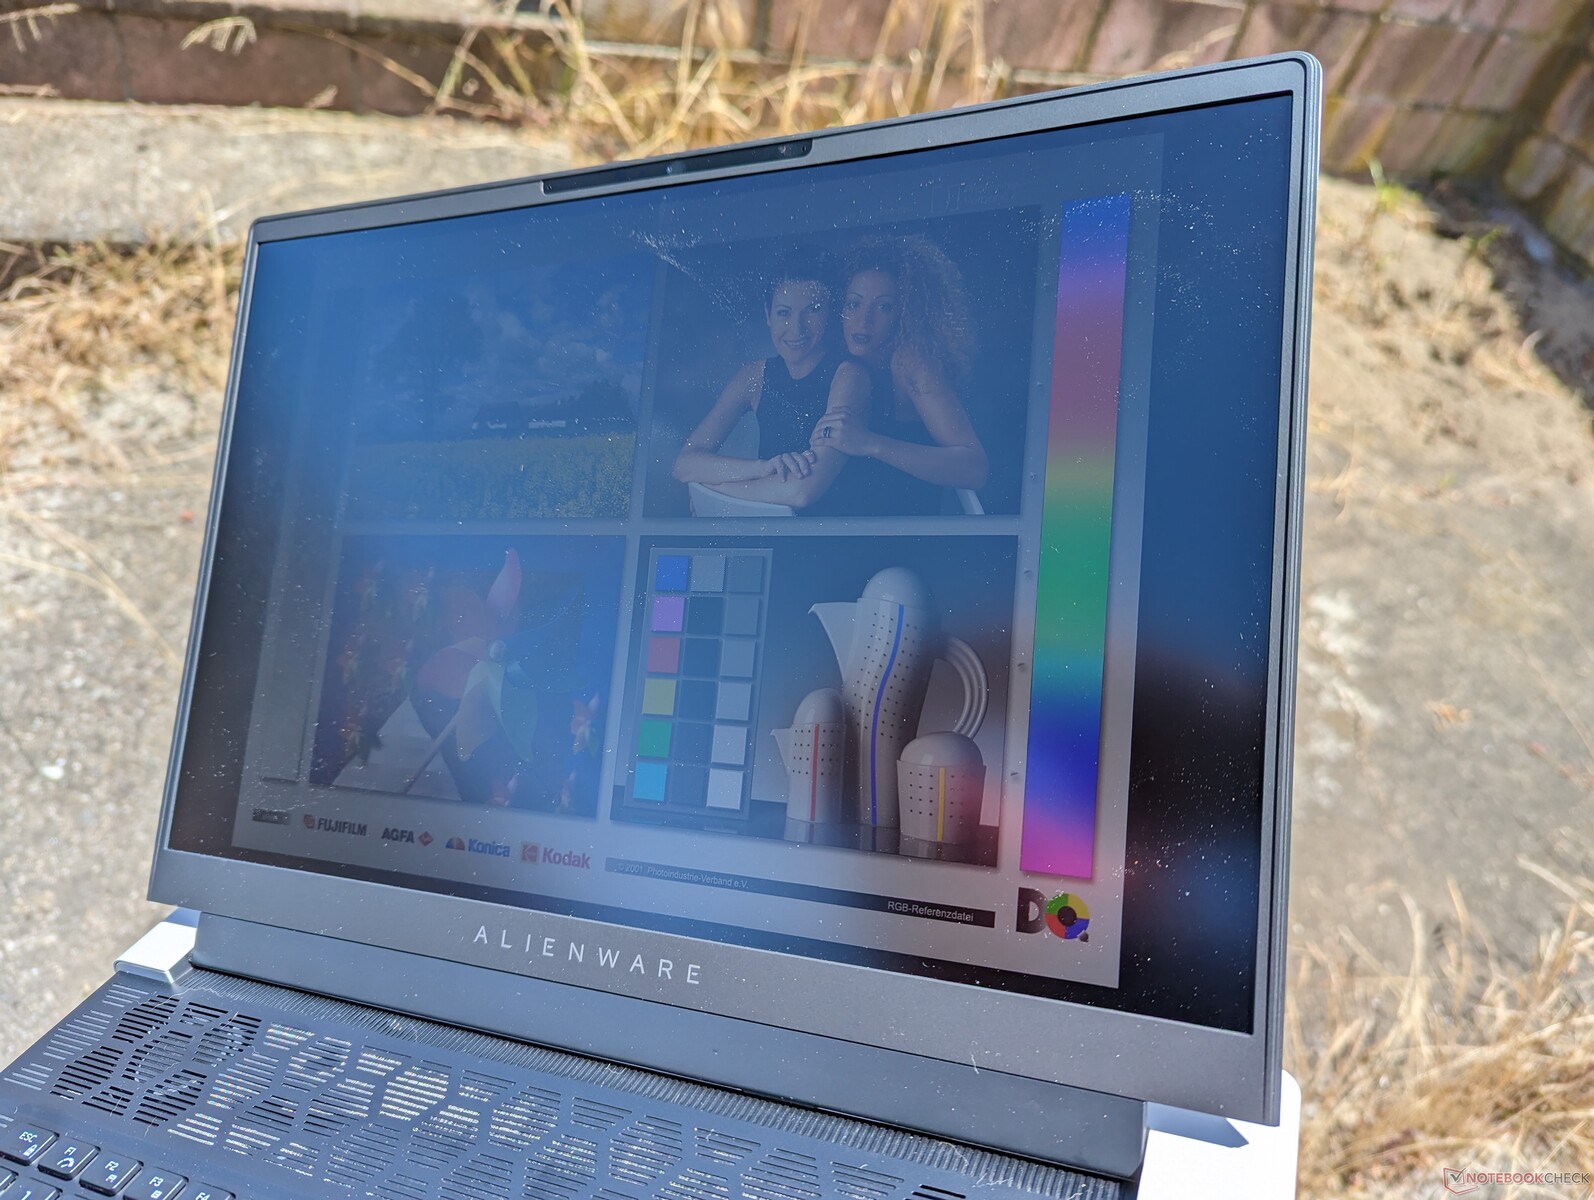
Sikten utomhus är inte lika bra som på andra 16-tums bärbara speldatorer, t.ex.Zephyrus M16blade 16 eller Legion Pro 7 16 eftersom skärmen på Alienware är märkbart mörkare. Kombinera detta med det relativt stora fotavtrycket och Alienware x16 R1 är definitivt inte en utomhusvänlig bärbar dator trots den tunna chassidesignen.
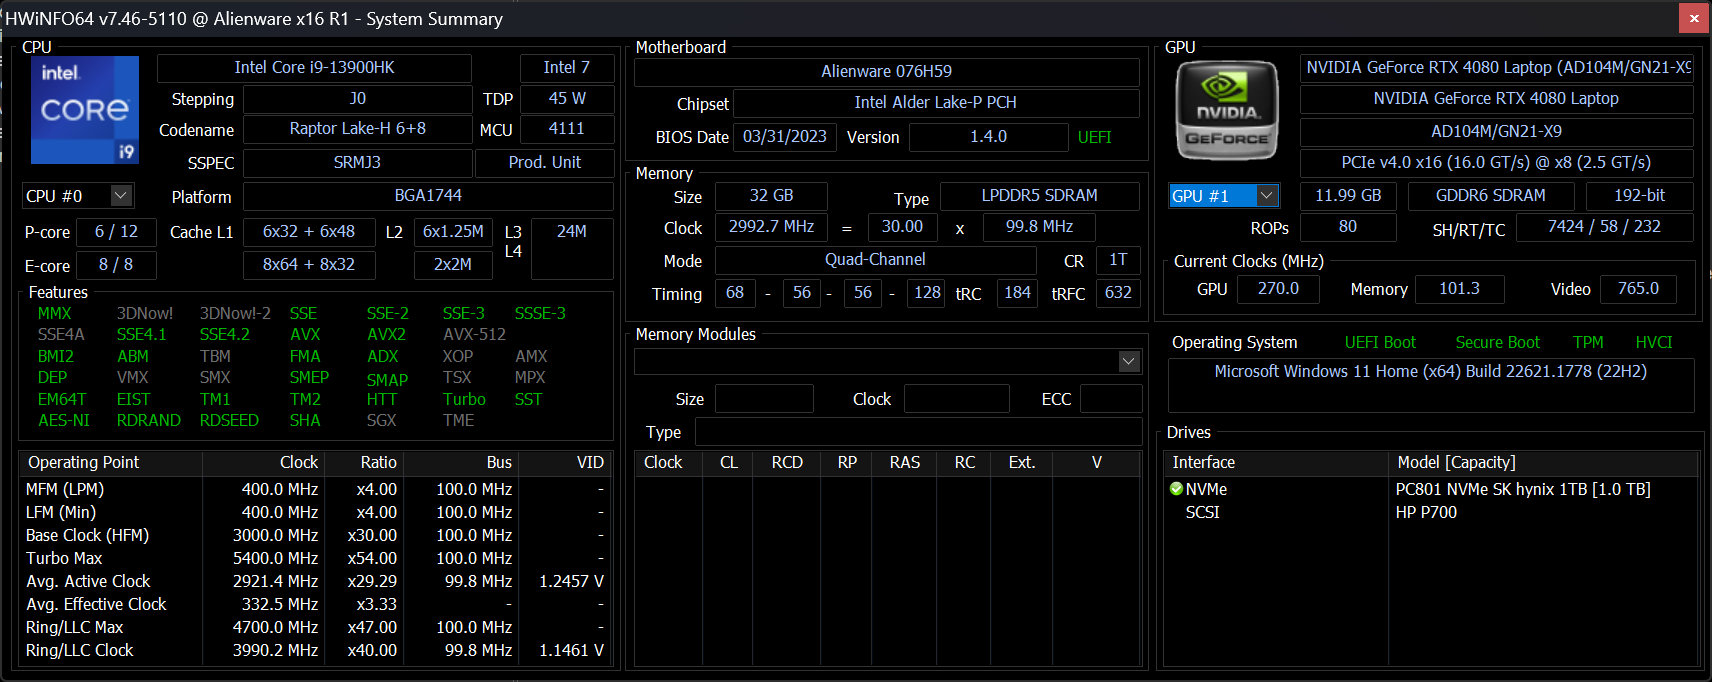
Prestanda - Meh CPU, imponerande GPU
Villkor för testning
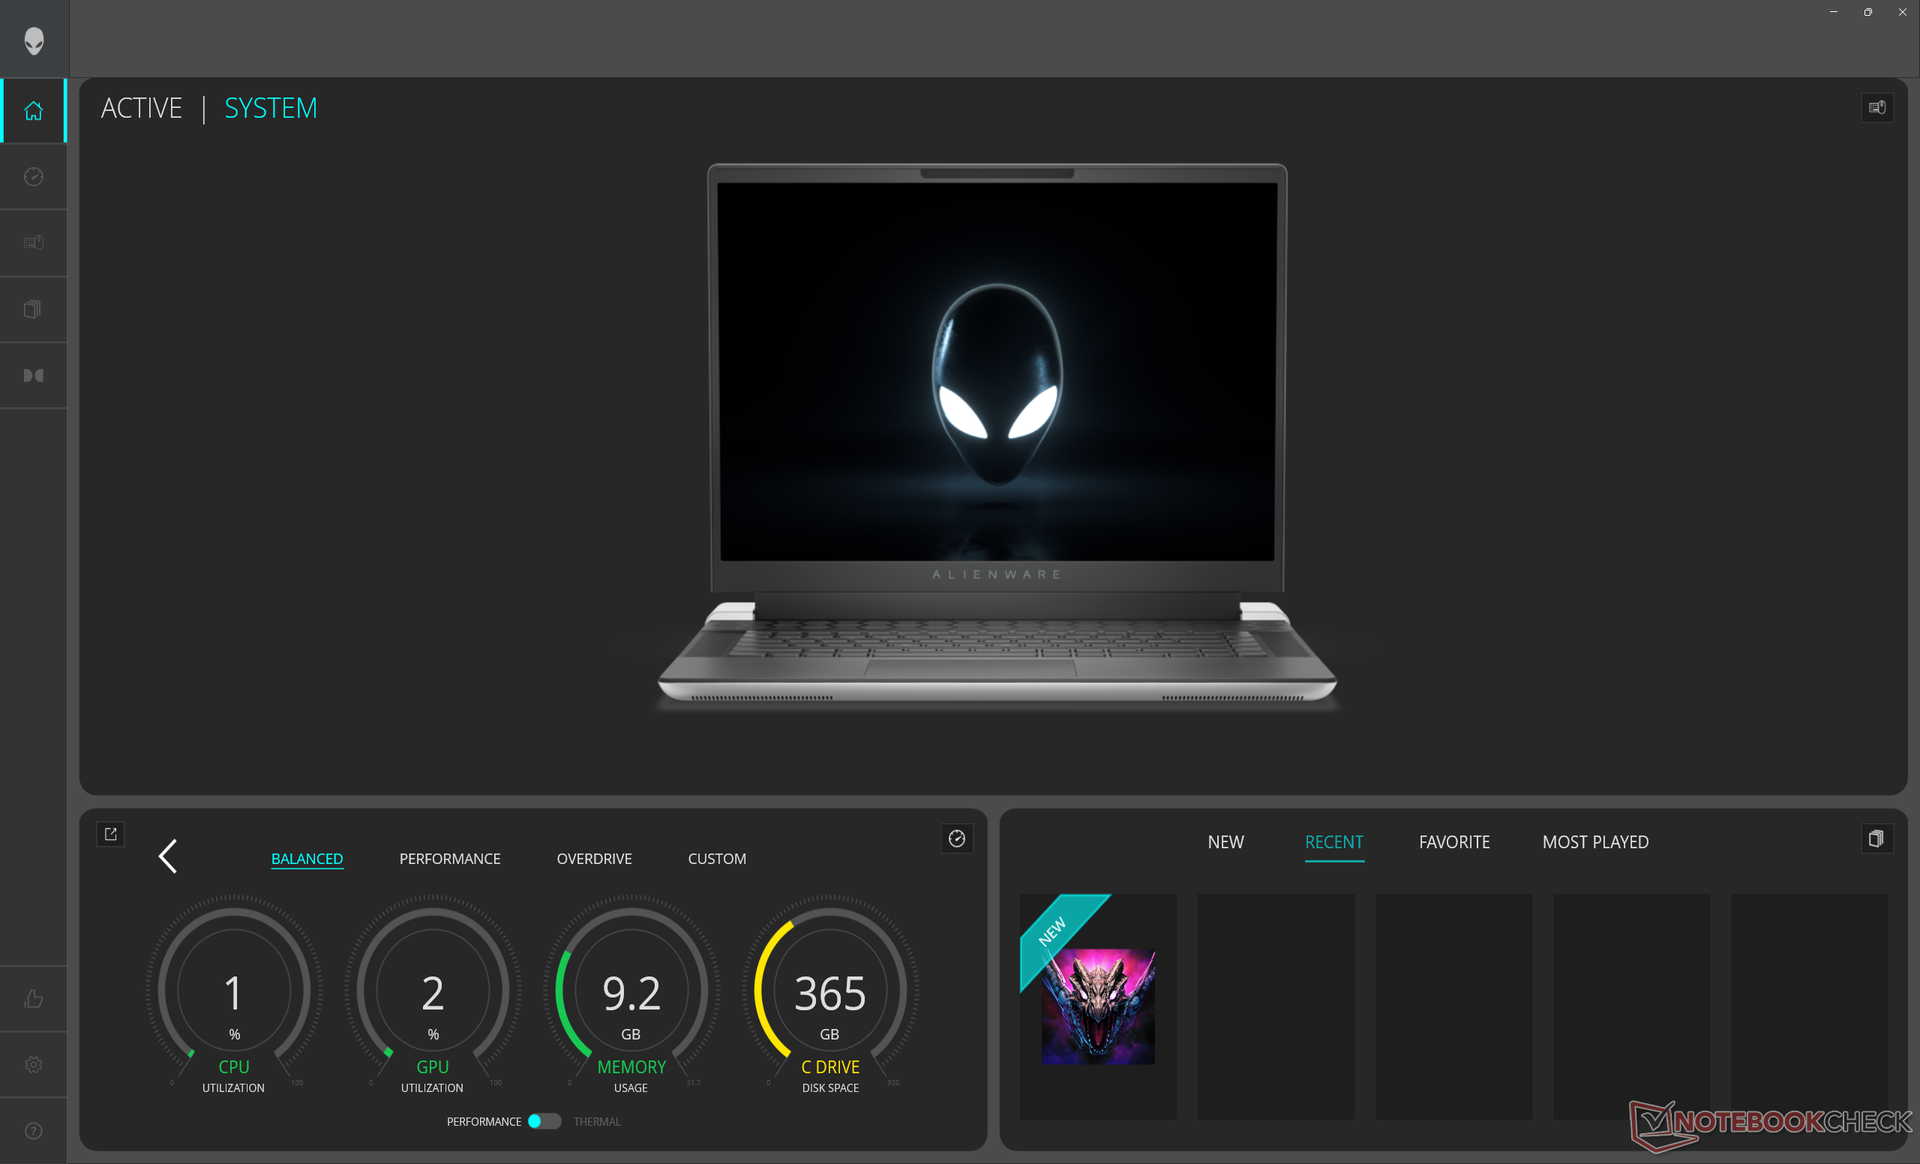
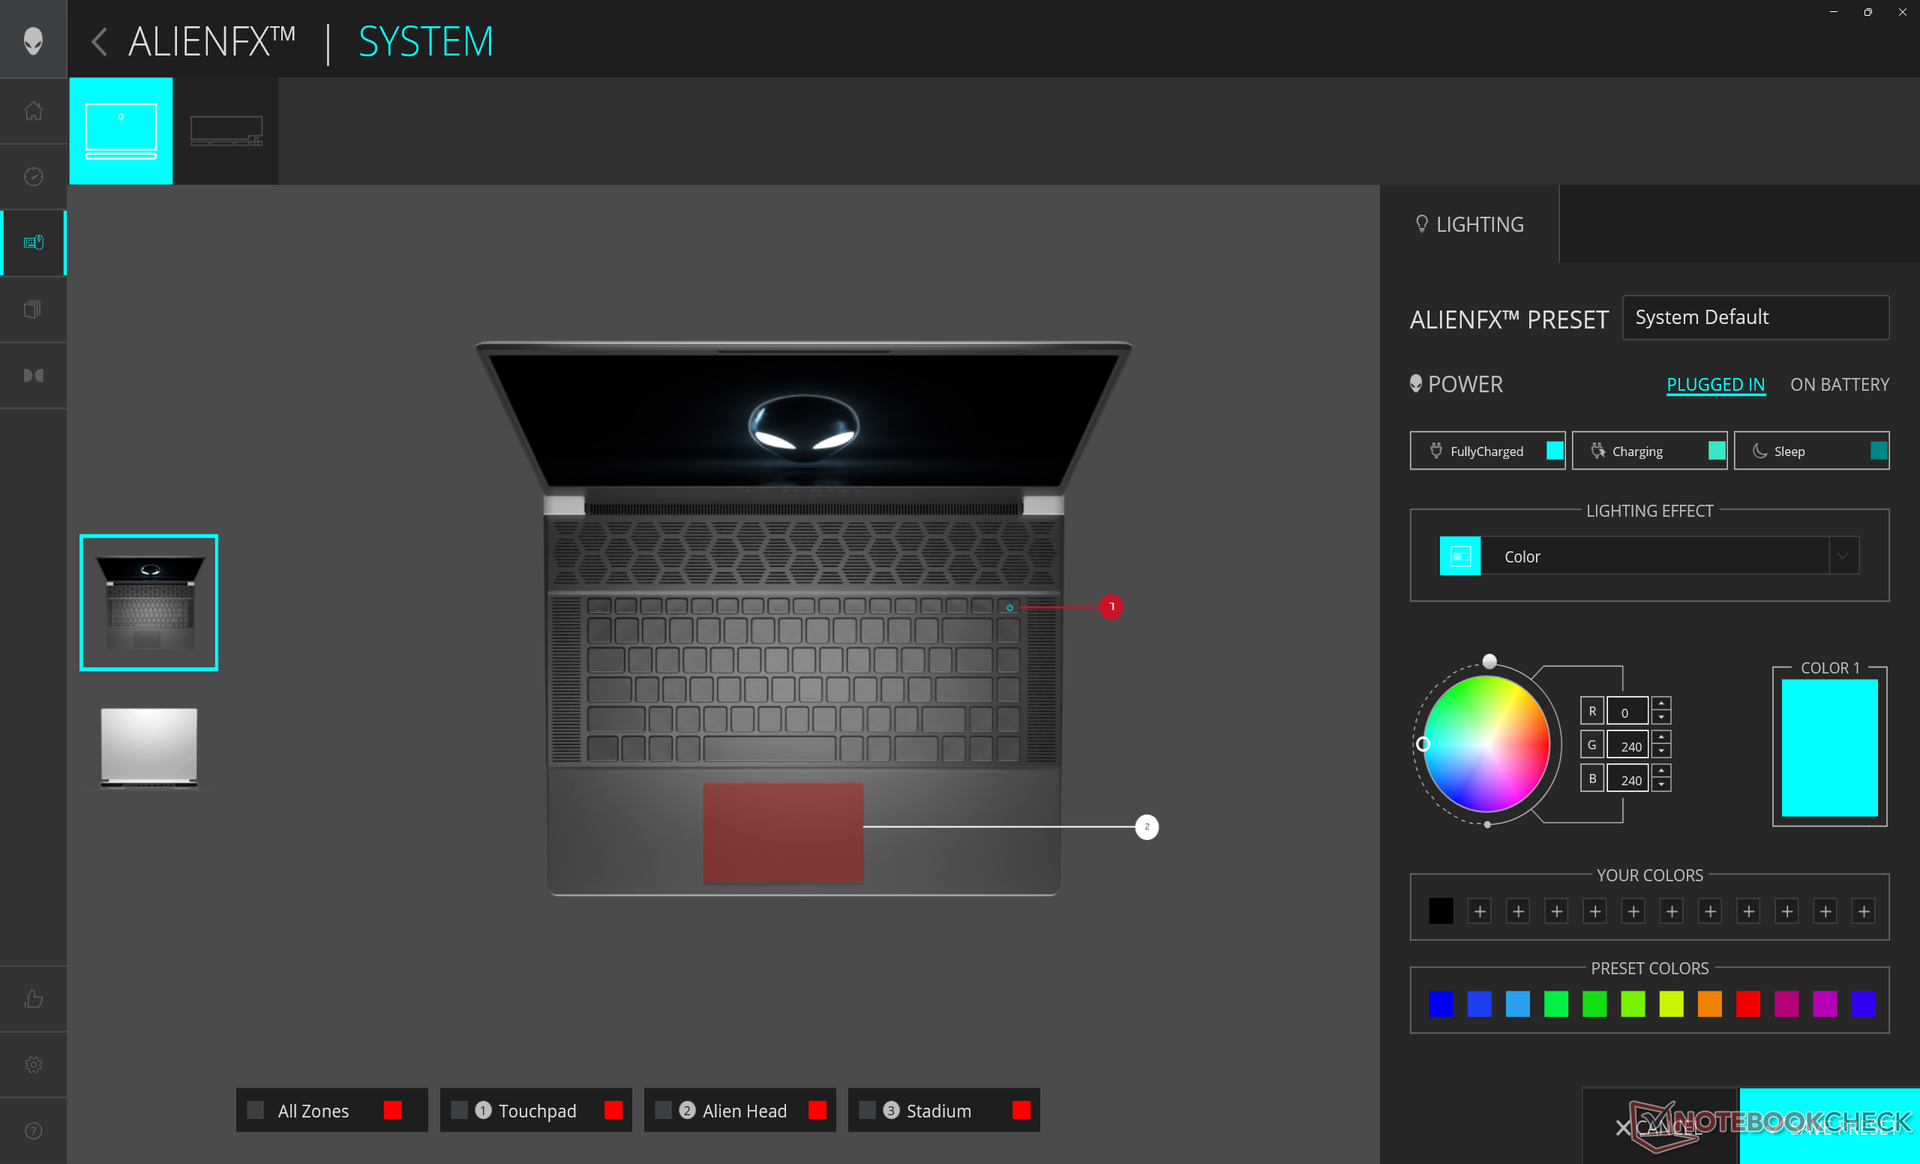
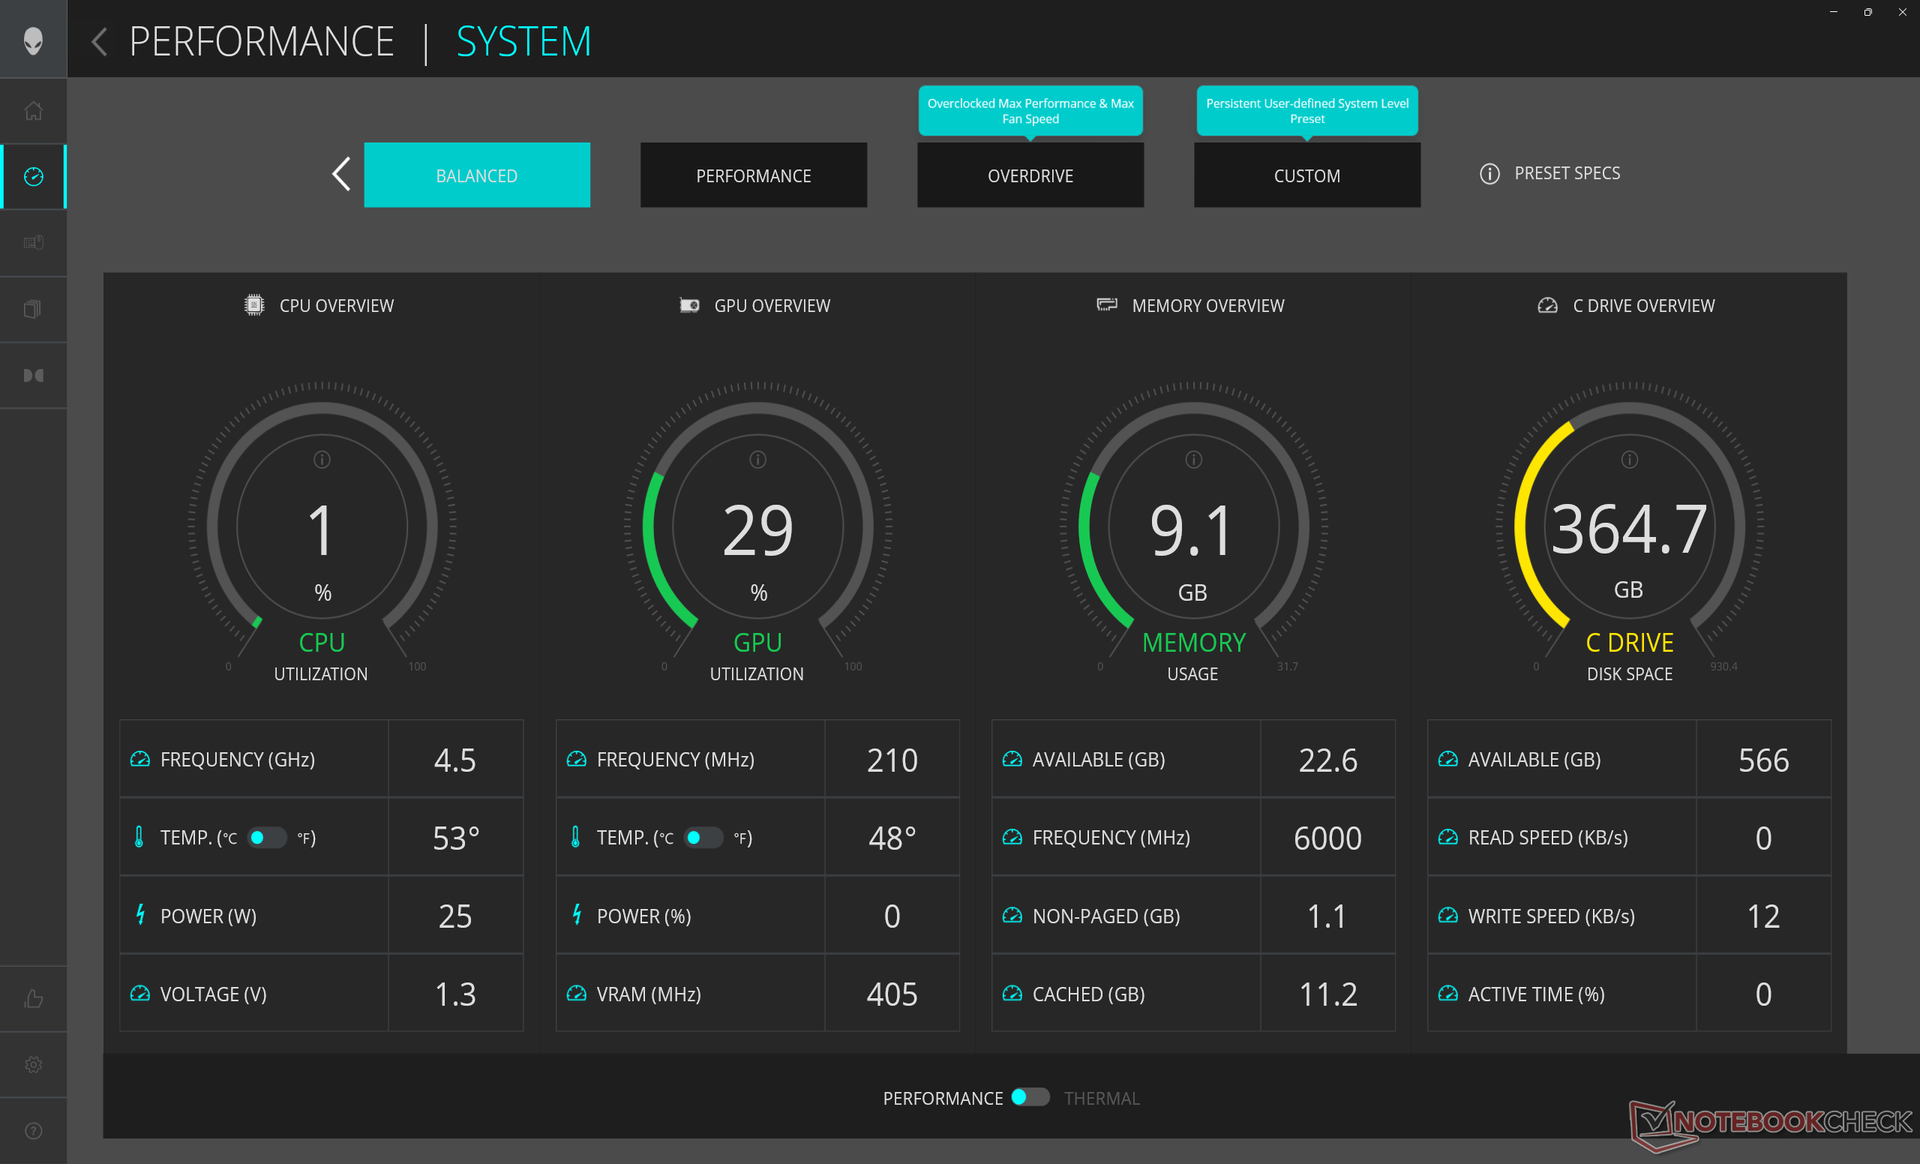
Vi ställde in vår enhet på Overdrive-läge via Alienware Command Center (ACC) och High Performance-läge via Windows innan vi körde riktmärkena nedan. Vi såg också till att ställa in grafiken till endast dGPU-läge i motsats till Optimus via Nvidia Control Panel. Det är irriterande att ACC:s energiprofiler inte synkroniseras med Windows och att det därför är möjligt att ha motstridiga profiler aktiva (dvs. en inställd på Power Saver och den andra på Performance).
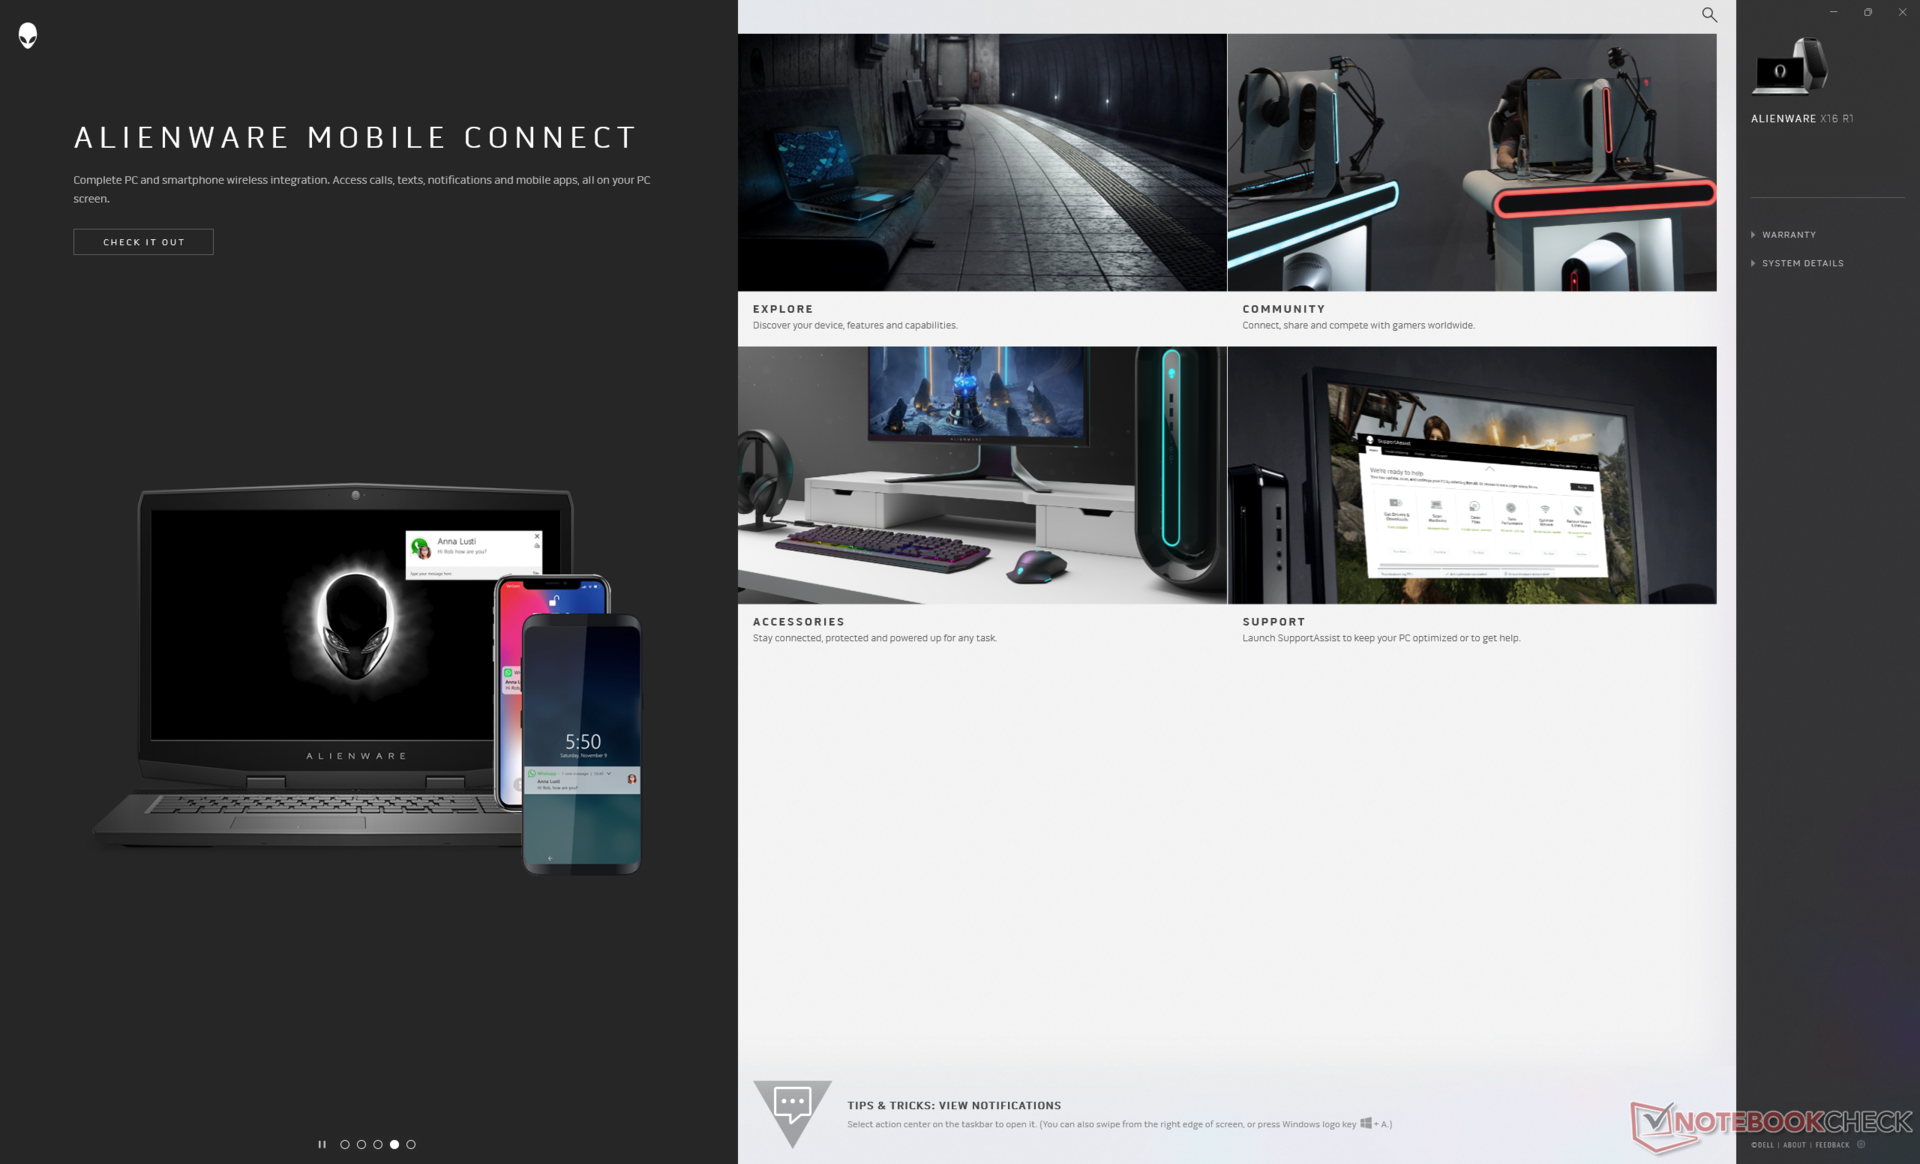
ACC ska inte förväxlas med My Alienware. Den förstnämnda är ett kontrollnav för systemvärden, RGB-inställningar, energiprofiler och spelinställningar, medan den sistnämnda är en knutpunkt för Dell-support, mobilanslutning och valfria tillbehör.
Advanced Optimus eller MUX stöds på alla SKU:er. Tänk på att G-Sync är aktivt för den interna bildskärmen om den endast är inställd på dGPU-läge.
Processor
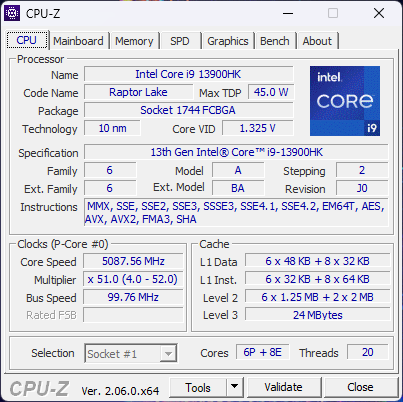
Det är viktigt att notera att modellen maxar ut på Core i9-13900HK och inte Core i9-13900HX den senare kan erbjuda 50 till 60 procent snabbare multi-thread-prestanda. Den övergripande prestandan från vår Core i7-13900HK är därför nästan identisk med den billigare Core i9-13900H och jämförbar med den konkurrerande Ryzen 7 7745HX. För snabbare prestanda kanske spelare vill överväga den tjockare Alienware m16 eller Lenovo Legion Pro 7 istället eftersom de kan konfigureras med Core i7-13900HX.
Nedgradering till den billigare i7-13620H eller i7-13700H förväntas påverka processorprestanda med cirka 15 till 20 procent baserat på vår tid medMSI Katana 17 och Dell XPS 17 9730.
Cinebench R15 Multi Loop
Cinebench R20: CPU (Multi Core) | CPU (Single Core)
Cinebench R23: Multi Core | Single Core
Cinebench R15: CPU Multi 64Bit | CPU Single 64Bit
Blender: v2.79 BMW27 CPU
7-Zip 18.03: 7z b 4 | 7z b 4 -mmt1
Geekbench 5.5: Multi-Core | Single-Core
HWBOT x265 Benchmark v2.2: 4k Preset
LibreOffice : 20 Documents To PDF
R Benchmark 2.5: Overall mean
* ... mindre är bättre
AIDA64: FP32 Ray-Trace | FPU Julia | CPU SHA3 | CPU Queen | FPU SinJulia | FPU Mandel | CPU AES | CPU ZLib | FP64 Ray-Trace | CPU PhotoWorxx
| Performance rating | |
| Lenovo Legion Pro 7 RTX4090 | |
| Razer Blade 16 Early 2023 | |
| Asus ROG Zephyrus M16 GU604VY-NM042X | |
| Alienware x16 R1 | |
| Alienware m17 R5 (R9 6900HX, RX 6850M XT) | |
| Dell G16 7620 | |
| Genomsnitt Intel Core i9-13900HK | |
| AIDA64 / FP32 Ray-Trace | |
| Lenovo Legion Pro 7 RTX4090 | |
| Razer Blade 16 Early 2023 | |
| Razer Blade 16 Early 2023 | |
| Razer Blade 16 Early 2023 | |
| Asus ROG Zephyrus M16 GU604VY-NM042X | |
| Alienware x16 R1 | |
| Alienware m17 R5 (R9 6900HX, RX 6850M XT) | |
| Genomsnitt Intel Core i9-13900HK (12351 - 18326, n=4) | |
| Dell G16 7620 | |
| AIDA64 / CPU Queen | |
| Lenovo Legion Pro 7 RTX4090 | |
| Razer Blade 16 Early 2023 | |
| Razer Blade 16 Early 2023 | |
| Asus ROG Zephyrus M16 GU604VY-NM042X | |
| Alienware x16 R1 | |
| Alienware m17 R5 (R9 6900HX, RX 6850M XT) | |
| Dell G16 7620 | |
| Genomsnitt Intel Core i9-13900HK (75615 - 118166, n=4) | |
| AIDA64 / FPU SinJulia | |
| Razer Blade 16 Early 2023 | |
| Razer Blade 16 Early 2023 | |
| Razer Blade 16 Early 2023 | |
| Lenovo Legion Pro 7 RTX4090 | |
| Alienware m17 R5 (R9 6900HX, RX 6850M XT) | |
| Asus ROG Zephyrus M16 GU604VY-NM042X | |
| Alienware x16 R1 | |
| Dell G16 7620 | |
| Genomsnitt Intel Core i9-13900HK (7427 - 11249, n=4) | |
| AIDA64 / FP64 Ray-Trace | |
| Lenovo Legion Pro 7 RTX4090 | |
| Razer Blade 16 Early 2023 | |
| Razer Blade 16 Early 2023 | |
| Razer Blade 16 Early 2023 | |
| Asus ROG Zephyrus M16 GU604VY-NM042X | |
| Alienware x16 R1 | |
| Alienware m17 R5 (R9 6900HX, RX 6850M XT) | |
| Genomsnitt Intel Core i9-13900HK (6839 - 10018, n=4) | |
| Dell G16 7620 | |
| AIDA64 / CPU PhotoWorxx | |
| Razer Blade 16 Early 2023 | |
| Razer Blade 16 Early 2023 | |
| Razer Blade 16 Early 2023 | |
| Lenovo Legion Pro 7 RTX4090 | |
| Alienware x16 R1 | |
| Asus ROG Zephyrus M16 GU604VY-NM042X | |
| Dell G16 7620 | |
| Genomsnitt Intel Core i9-13900HK (15421 - 49539, n=4) | |
| Alienware m17 R5 (R9 6900HX, RX 6850M XT) | |
Systemets prestanda
CrossMark: Overall | Productivity | Creativity | Responsiveness
| PCMark 10 / Score | |
| Alienware x16 R1 | |
| Genomsnitt Intel Core i9-13900HK, NVIDIA GeForce RTX 4080 Laptop GPU (n=1) | |
| Asus ROG Zephyrus M16 GU604VY-NM042X | |
| Lenovo Legion Pro 7 RTX4090 | |
| Razer Blade 16 Early 2023 | |
| Alienware m17 R5 (R9 6900HX, RX 6850M XT) | |
| Dell G16 7620 | |
| PCMark 10 / Essentials | |
| Asus ROG Zephyrus M16 GU604VY-NM042X | |
| Alienware x16 R1 | |
| Genomsnitt Intel Core i9-13900HK, NVIDIA GeForce RTX 4080 Laptop GPU (n=1) | |
| Lenovo Legion Pro 7 RTX4090 | |
| Razer Blade 16 Early 2023 | |
| Dell G16 7620 | |
| Alienware m17 R5 (R9 6900HX, RX 6850M XT) | |
| PCMark 10 / Productivity | |
| Asus ROG Zephyrus M16 GU604VY-NM042X | |
| Alienware x16 R1 | |
| Genomsnitt Intel Core i9-13900HK, NVIDIA GeForce RTX 4080 Laptop GPU (n=1) | |
| Alienware m17 R5 (R9 6900HX, RX 6850M XT) | |
| Lenovo Legion Pro 7 RTX4090 | |
| Dell G16 7620 | |
| Razer Blade 16 Early 2023 | |
| PCMark 10 / Digital Content Creation | |
| Lenovo Legion Pro 7 RTX4090 | |
| Razer Blade 16 Early 2023 | |
| Alienware x16 R1 | |
| Genomsnitt Intel Core i9-13900HK, NVIDIA GeForce RTX 4080 Laptop GPU (n=1) | |
| Asus ROG Zephyrus M16 GU604VY-NM042X | |
| Alienware m17 R5 (R9 6900HX, RX 6850M XT) | |
| Dell G16 7620 | |
| CrossMark / Overall | |
| Asus ROG Zephyrus M16 GU604VY-NM042X | |
| Alienware x16 R1 | |
| Genomsnitt Intel Core i9-13900HK, NVIDIA GeForce RTX 4080 Laptop GPU (n=1) | |
| Dell G16 7620 | |
| Alienware m17 R5 (R9 6900HX, RX 6850M XT) | |
| Razer Blade 16 Early 2023 | |
| CrossMark / Productivity | |
| Asus ROG Zephyrus M16 GU604VY-NM042X | |
| Alienware x16 R1 | |
| Genomsnitt Intel Core i9-13900HK, NVIDIA GeForce RTX 4080 Laptop GPU (n=1) | |
| Dell G16 7620 | |
| Alienware m17 R5 (R9 6900HX, RX 6850M XT) | |
| Razer Blade 16 Early 2023 | |
| CrossMark / Creativity | |
| Asus ROG Zephyrus M16 GU604VY-NM042X | |
| Alienware x16 R1 | |
| Genomsnitt Intel Core i9-13900HK, NVIDIA GeForce RTX 4080 Laptop GPU (n=1) | |
| Dell G16 7620 | |
| Razer Blade 16 Early 2023 | |
| Alienware m17 R5 (R9 6900HX, RX 6850M XT) | |
| CrossMark / Responsiveness | |
| Alienware x16 R1 | |
| Genomsnitt Intel Core i9-13900HK, NVIDIA GeForce RTX 4080 Laptop GPU (n=1) | |
| Asus ROG Zephyrus M16 GU604VY-NM042X | |
| Dell G16 7620 | |
| Razer Blade 16 Early 2023 | |
| Alienware m17 R5 (R9 6900HX, RX 6850M XT) | |
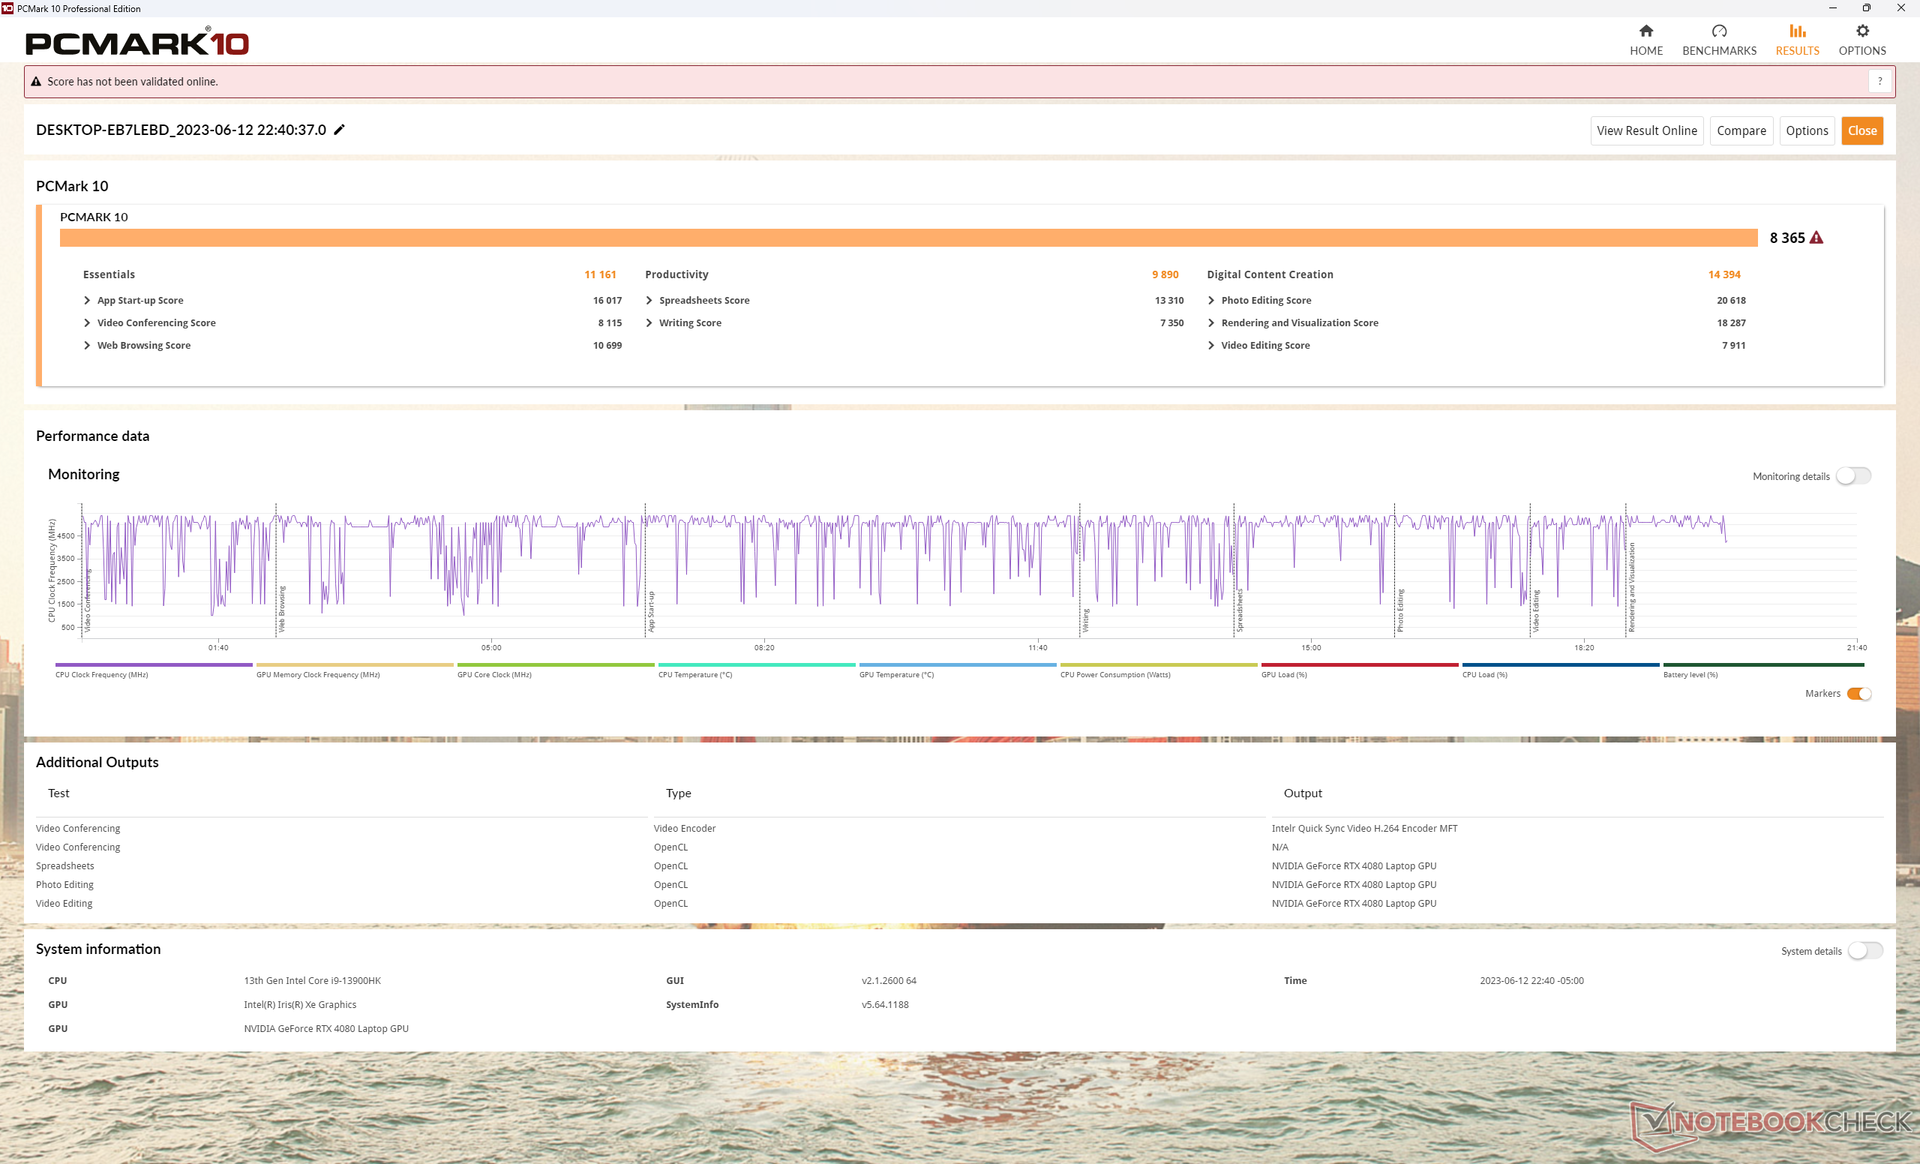
| PCMark 10 Score | 8365 poäng | |
Hjälp | ||
| AIDA64 / Memory Write | |
| Alienware x16 R1 | |
| Razer Blade 16 Early 2023 | |
| Razer Blade 16 Early 2023 | |
| Razer Blade 16 Early 2023 | |
| Lenovo Legion Pro 7 RTX4090 | |
| Asus ROG Zephyrus M16 GU604VY-NM042X | |
| Genomsnitt Intel Core i9-13900HK (47347 - 85917, n=4) | |
| Dell G16 7620 | |
| Alienware m17 R5 (R9 6900HX, RX 6850M XT) | |
| AIDA64 / Memory Latency | |
| Alienware x16 R1 | |
| Dell G16 7620 | |
| Razer Blade 16 Early 2023 | |
| Razer Blade 16 Early 2023 | |
| Razer Blade 16 Early 2023 | |
| Genomsnitt Intel Core i9-13900HK (83 - 115.3, n=4) | |
| Alienware m17 R5 (R9 6900HX, RX 6850M XT) | |
| Asus ROG Zephyrus M16 GU604VY-NM042X | |
| Lenovo Legion Pro 7 RTX4090 | |
* ... mindre är bättre
DPC-fördröjning
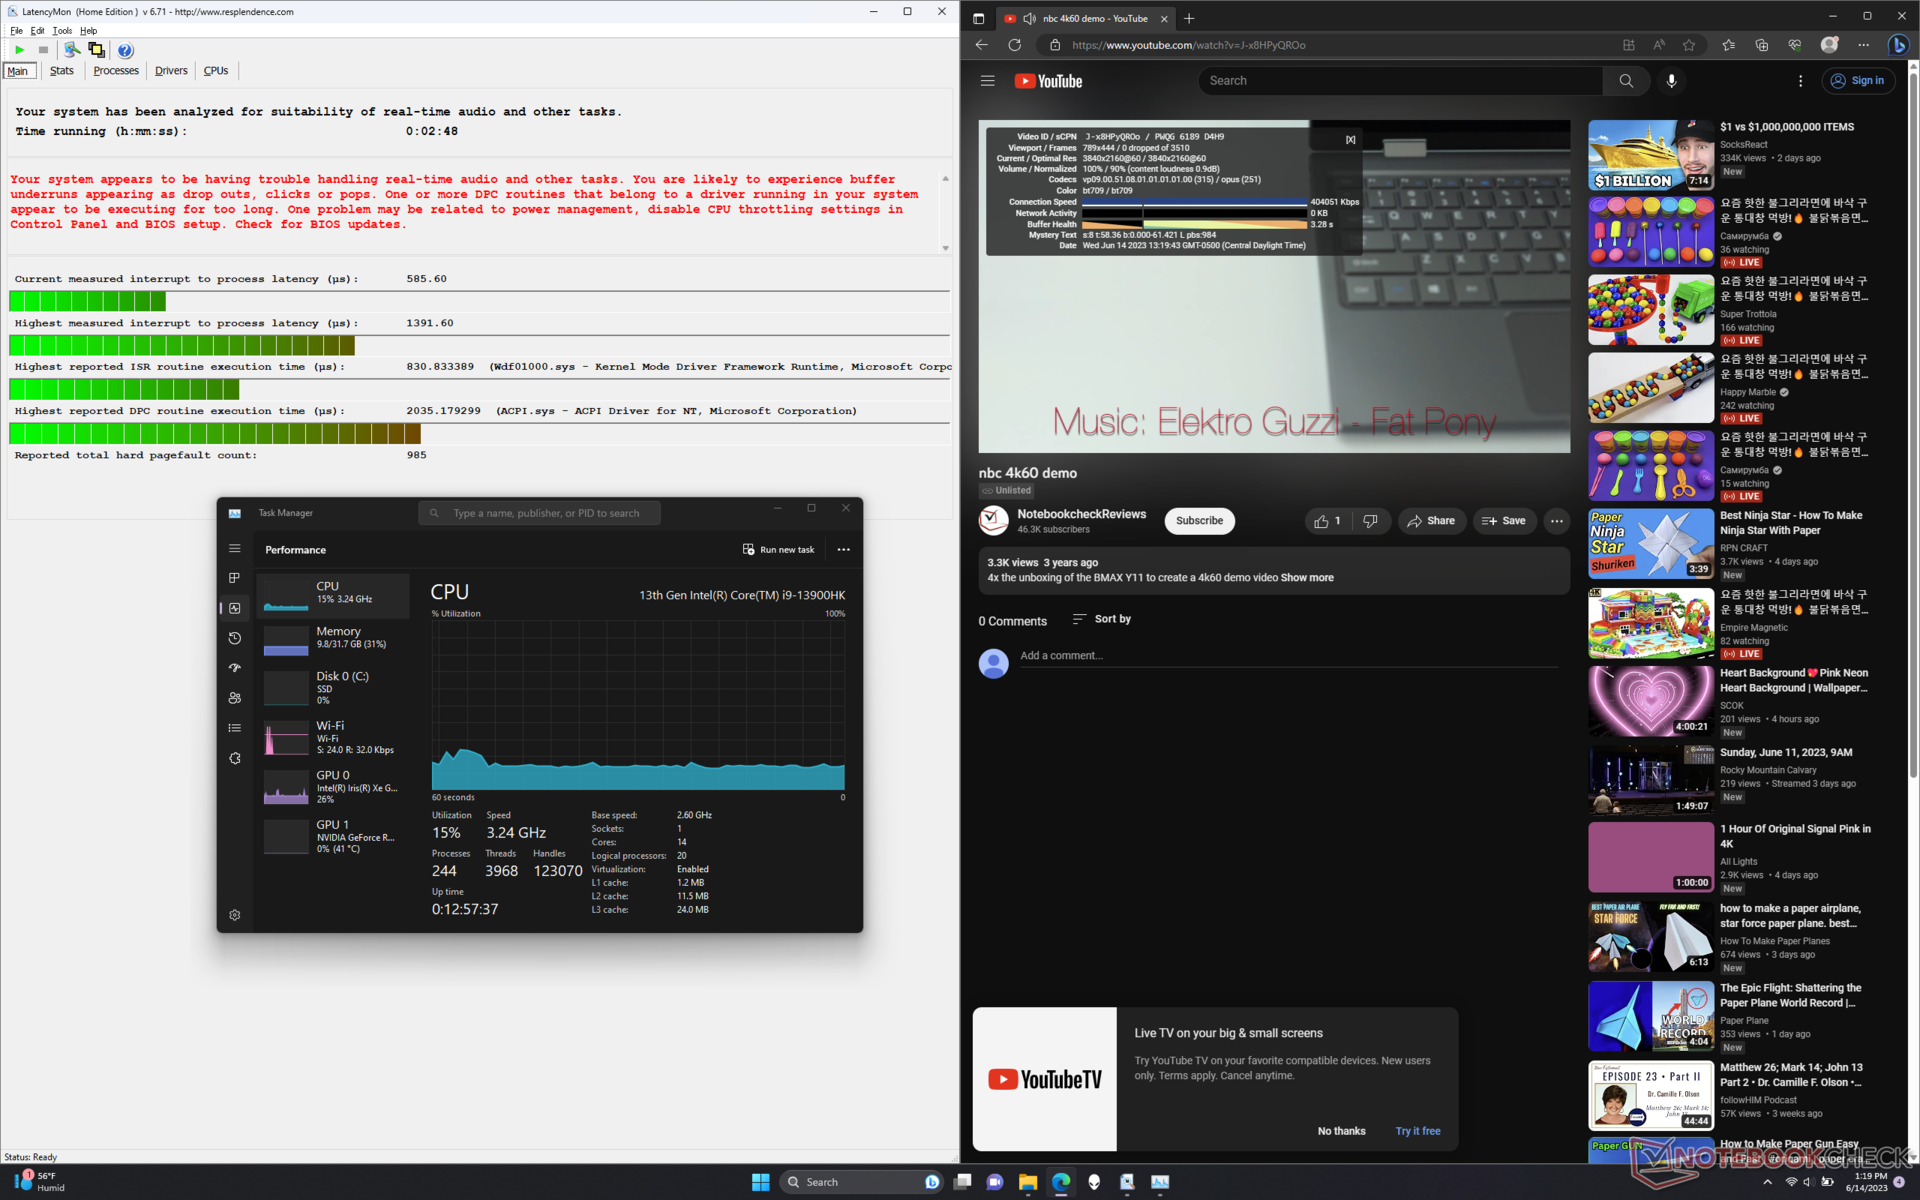
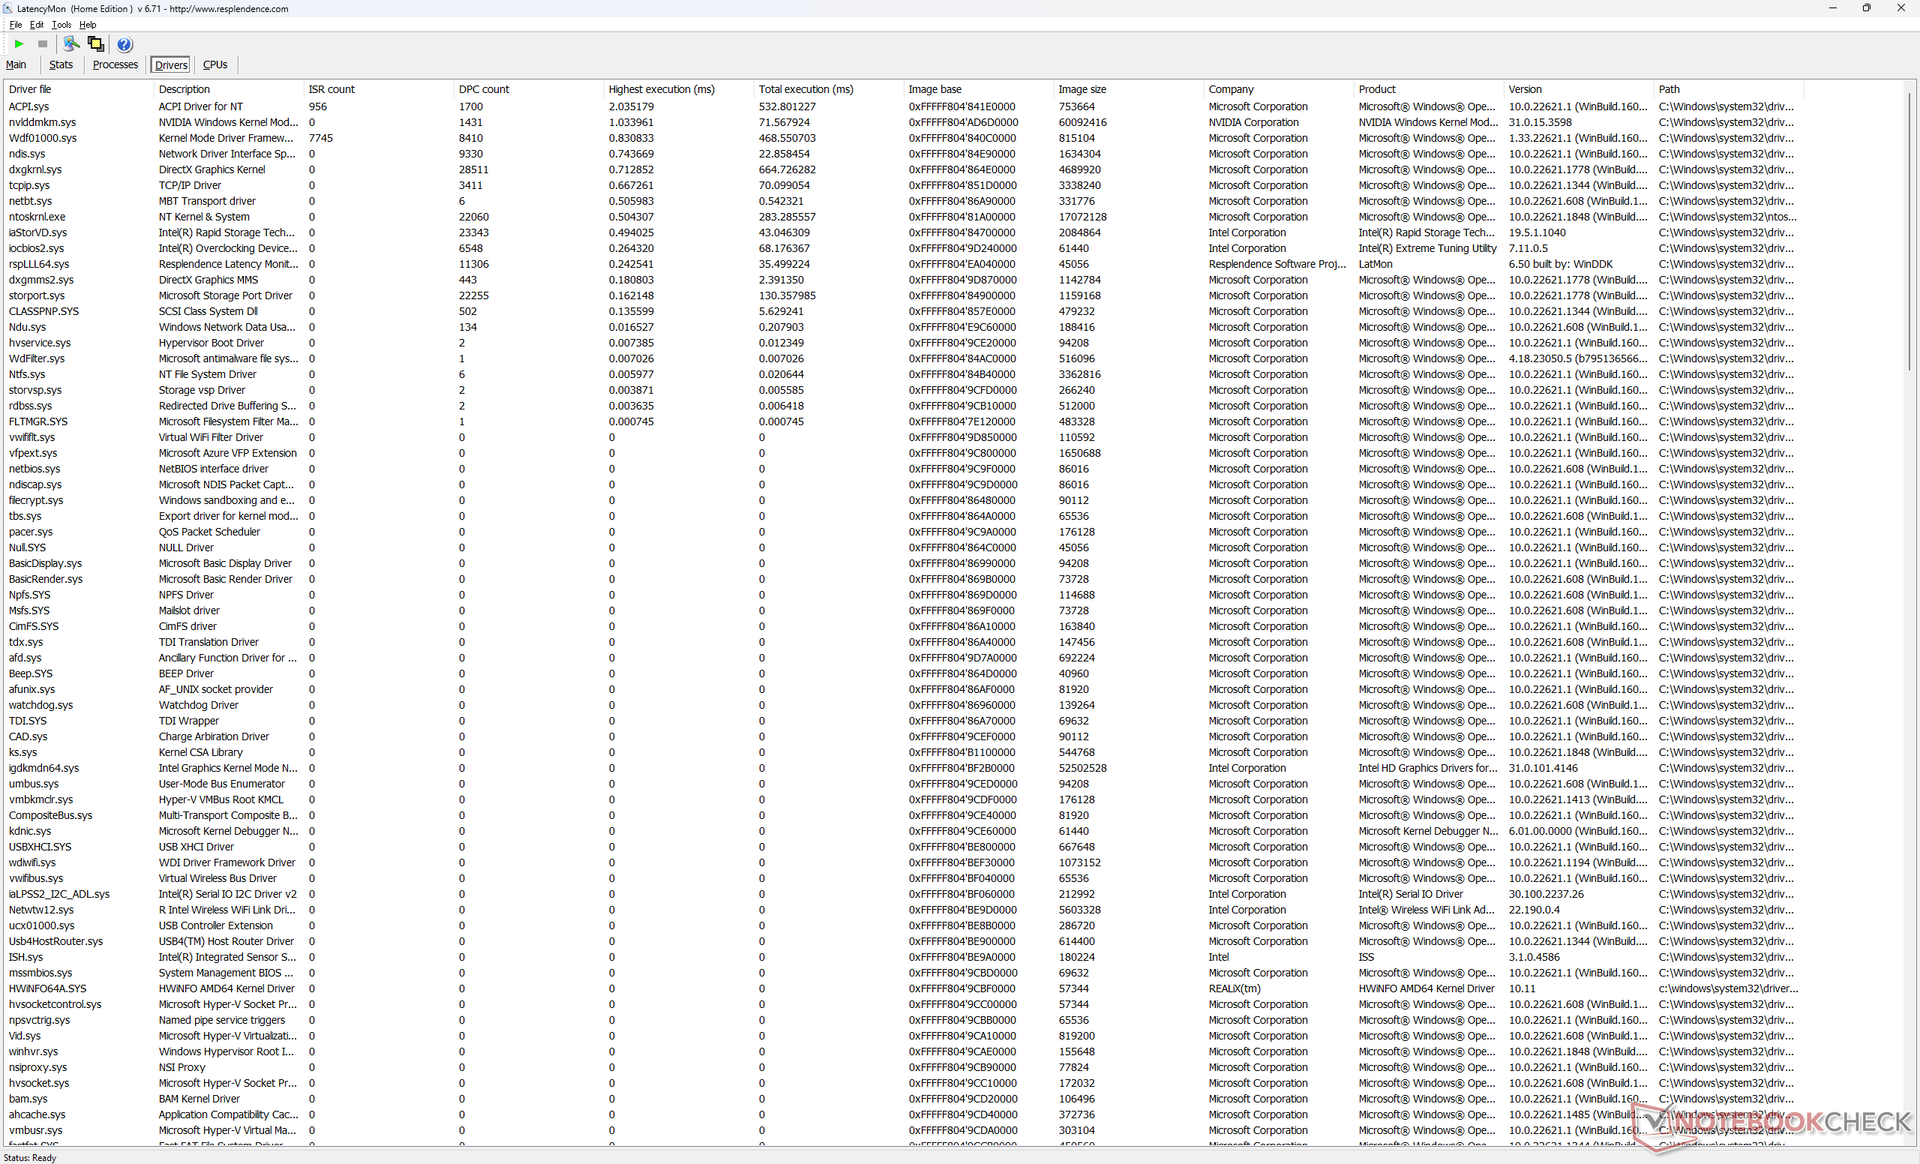
LatencyMon avslöjar DPC-problem när flera webbläsarflikar öppnas på vår hemsida. uppspelning av 4K-video vid 60 FPS är annars perfekt utan tappade bildrutor.
| DPC Latencies / LatencyMon - interrupt to process latency (max), Web, Youtube, Prime95 | |
| Lenovo Legion Pro 7 RTX4090 | |
| Asus ROG Zephyrus M16 GU604VY-NM042X | |
| Razer Blade 16 Early 2023 | |
| Alienware x16 R1 | |
| Alienware m17 R5 (R9 6900HX, RX 6850M XT) | |
| Dell G16 7620 | |
* ... mindre är bättre
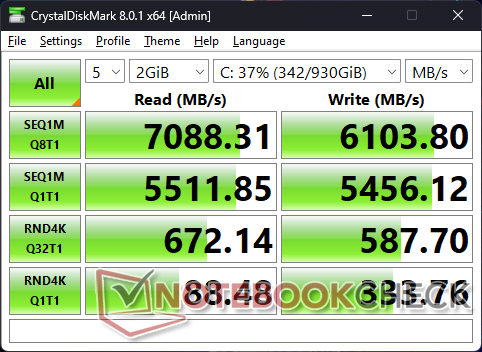
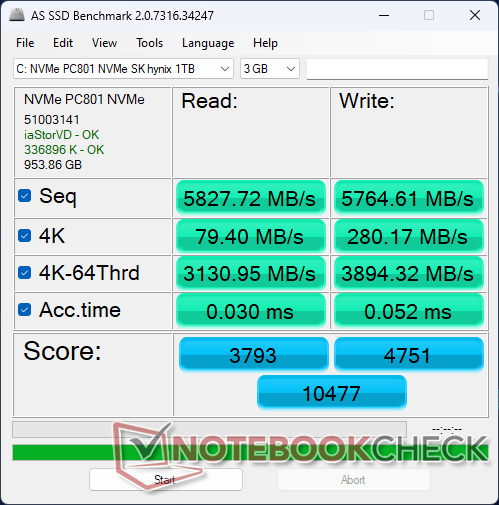
Lagringsenheter
PCIe4 x4 SK Hynix PC801 enheten i vår enhet kan nå läshastigheter på upp till 7100 MB/s för att vara jämförbar med den populära Samsung PM9A1. Tyvärr har enheten problem med att upprätthålla sin maximala överföringshastighet under längre perioder, sannolikt på grund av otillräcklig kylning. När DiskSpd kördes i en loop, till exempel, sjönk läshastigheterna till så låga som 3400 MB/s efter bara några minuter i stresstestet, vilket visas i diagrammet nedan. Resultaten förbättrades inte efter upprepade tester.

| Drive Performance rating - Percent | |
| Alienware x16 R1 | |
| Lenovo Legion Pro 7 RTX4090 | |
| Dell G16 7620 | |
| Asus ROG Zephyrus M16 GU604VY-NM042X | |
| Razer Blade 16 Early 2023 | |
| Alienware m17 R5 (R9 6900HX, RX 6850M XT) | |
* ... mindre är bättre
Disk Throttling: DiskSpd Read Loop, Queue Depth 8
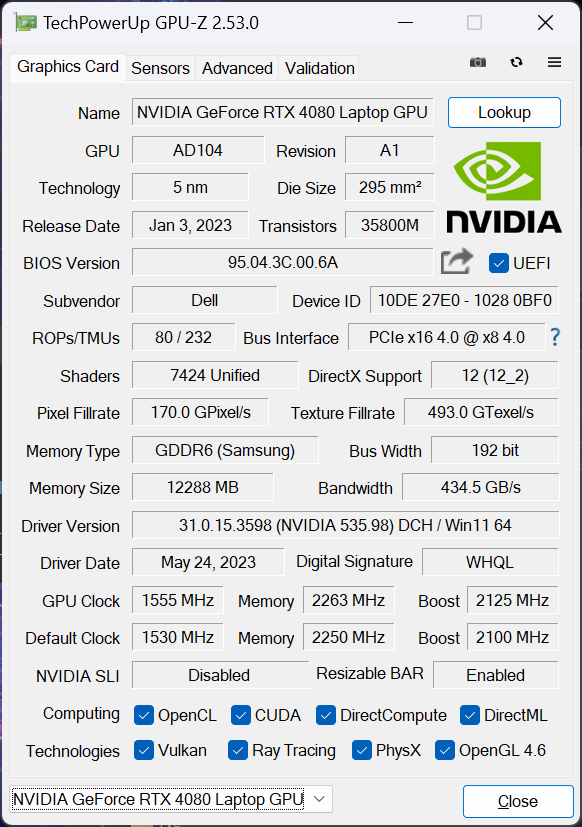
GPU-prestanda - 175 W GeForce RTX 4080
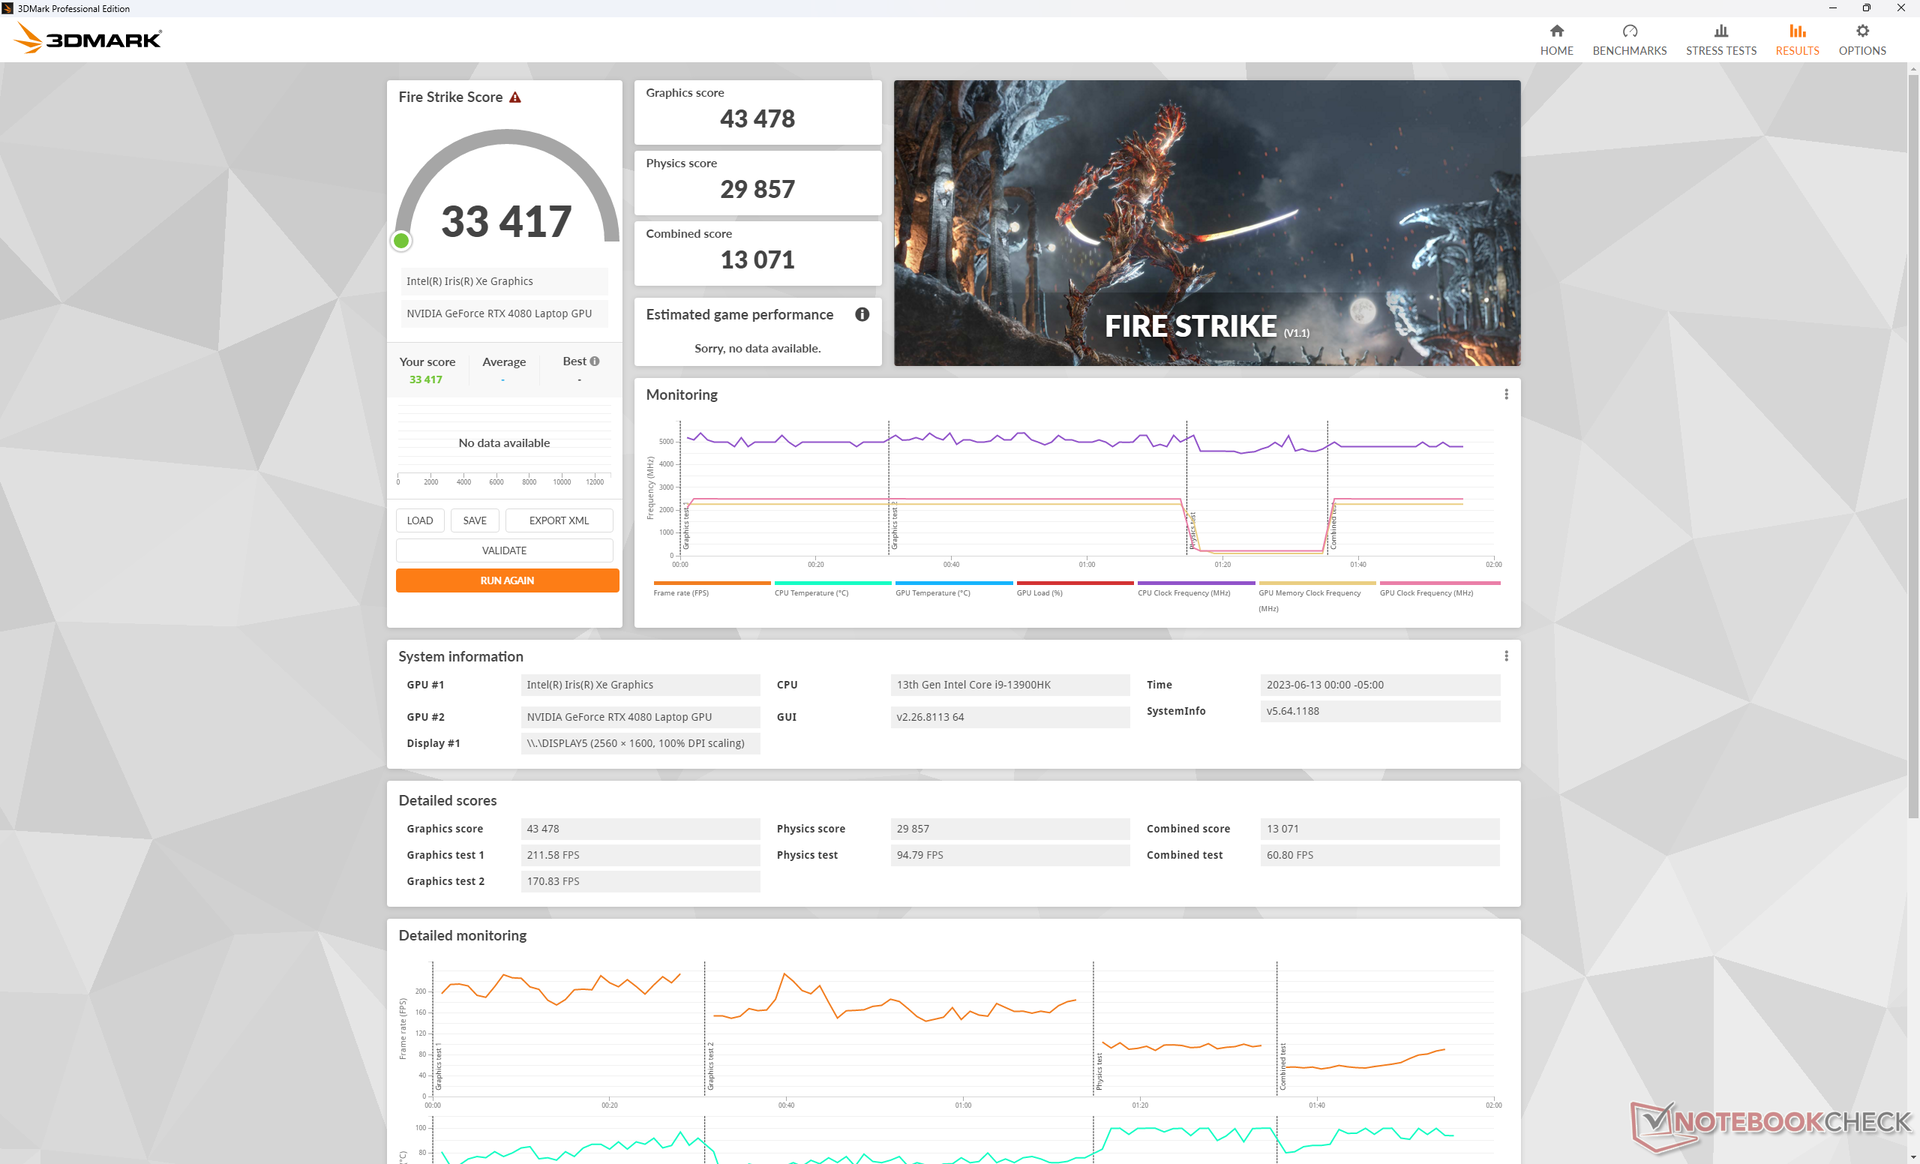
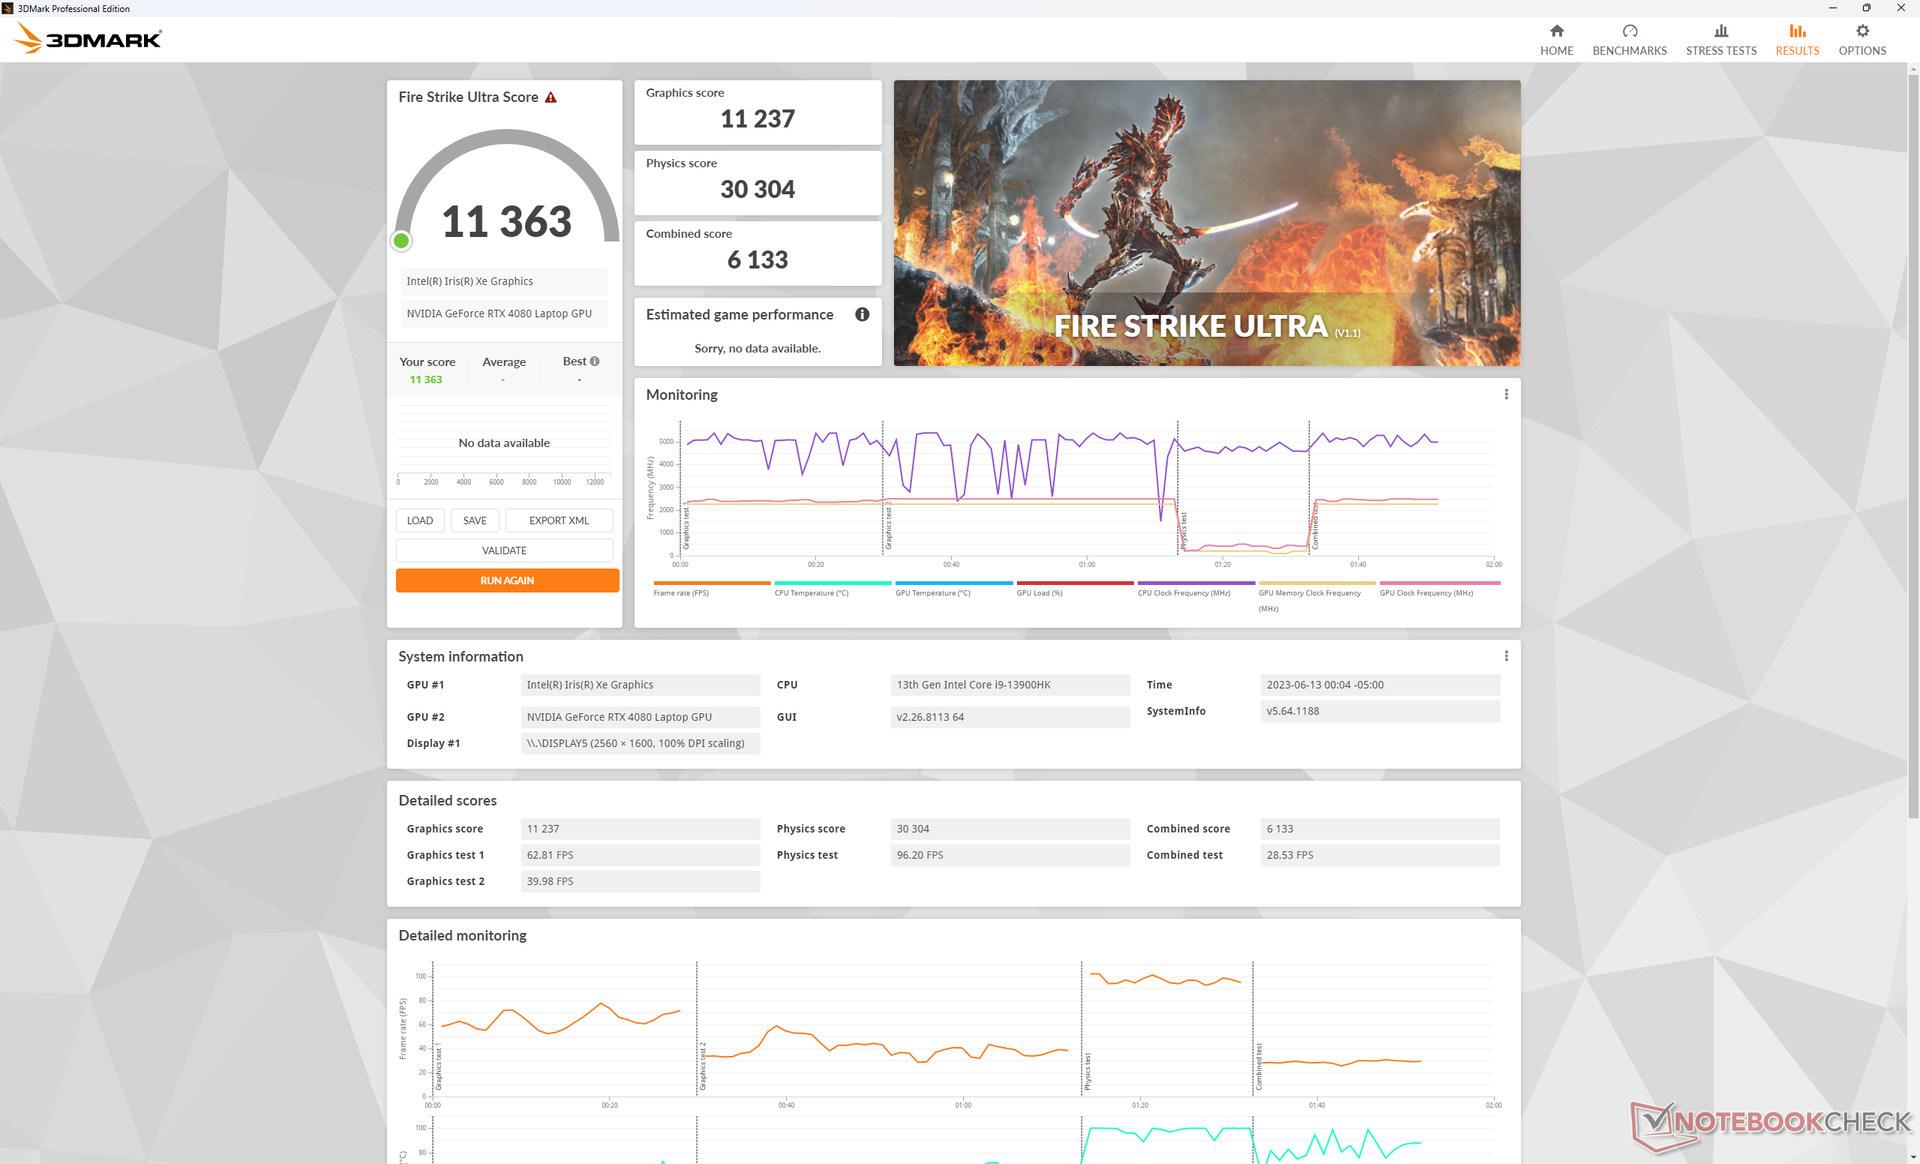
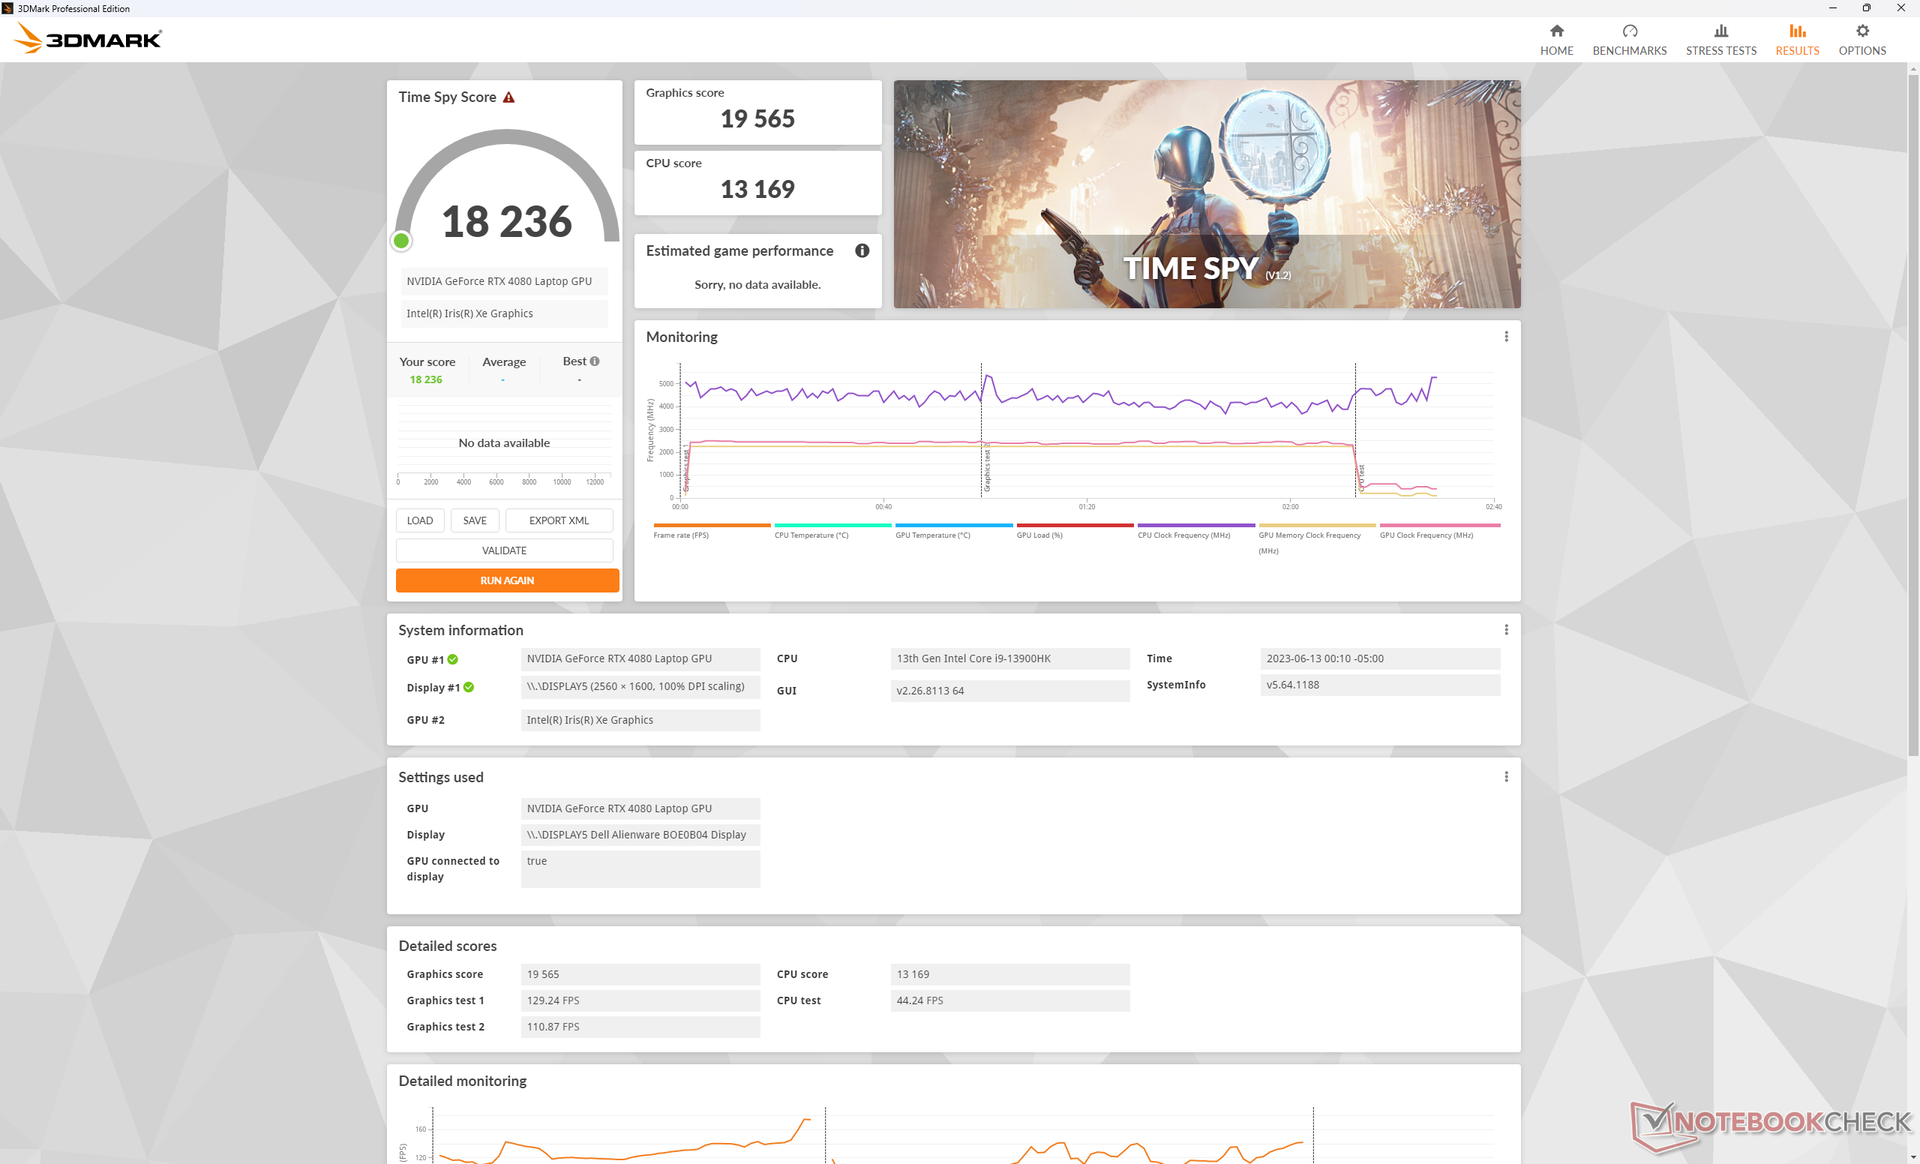
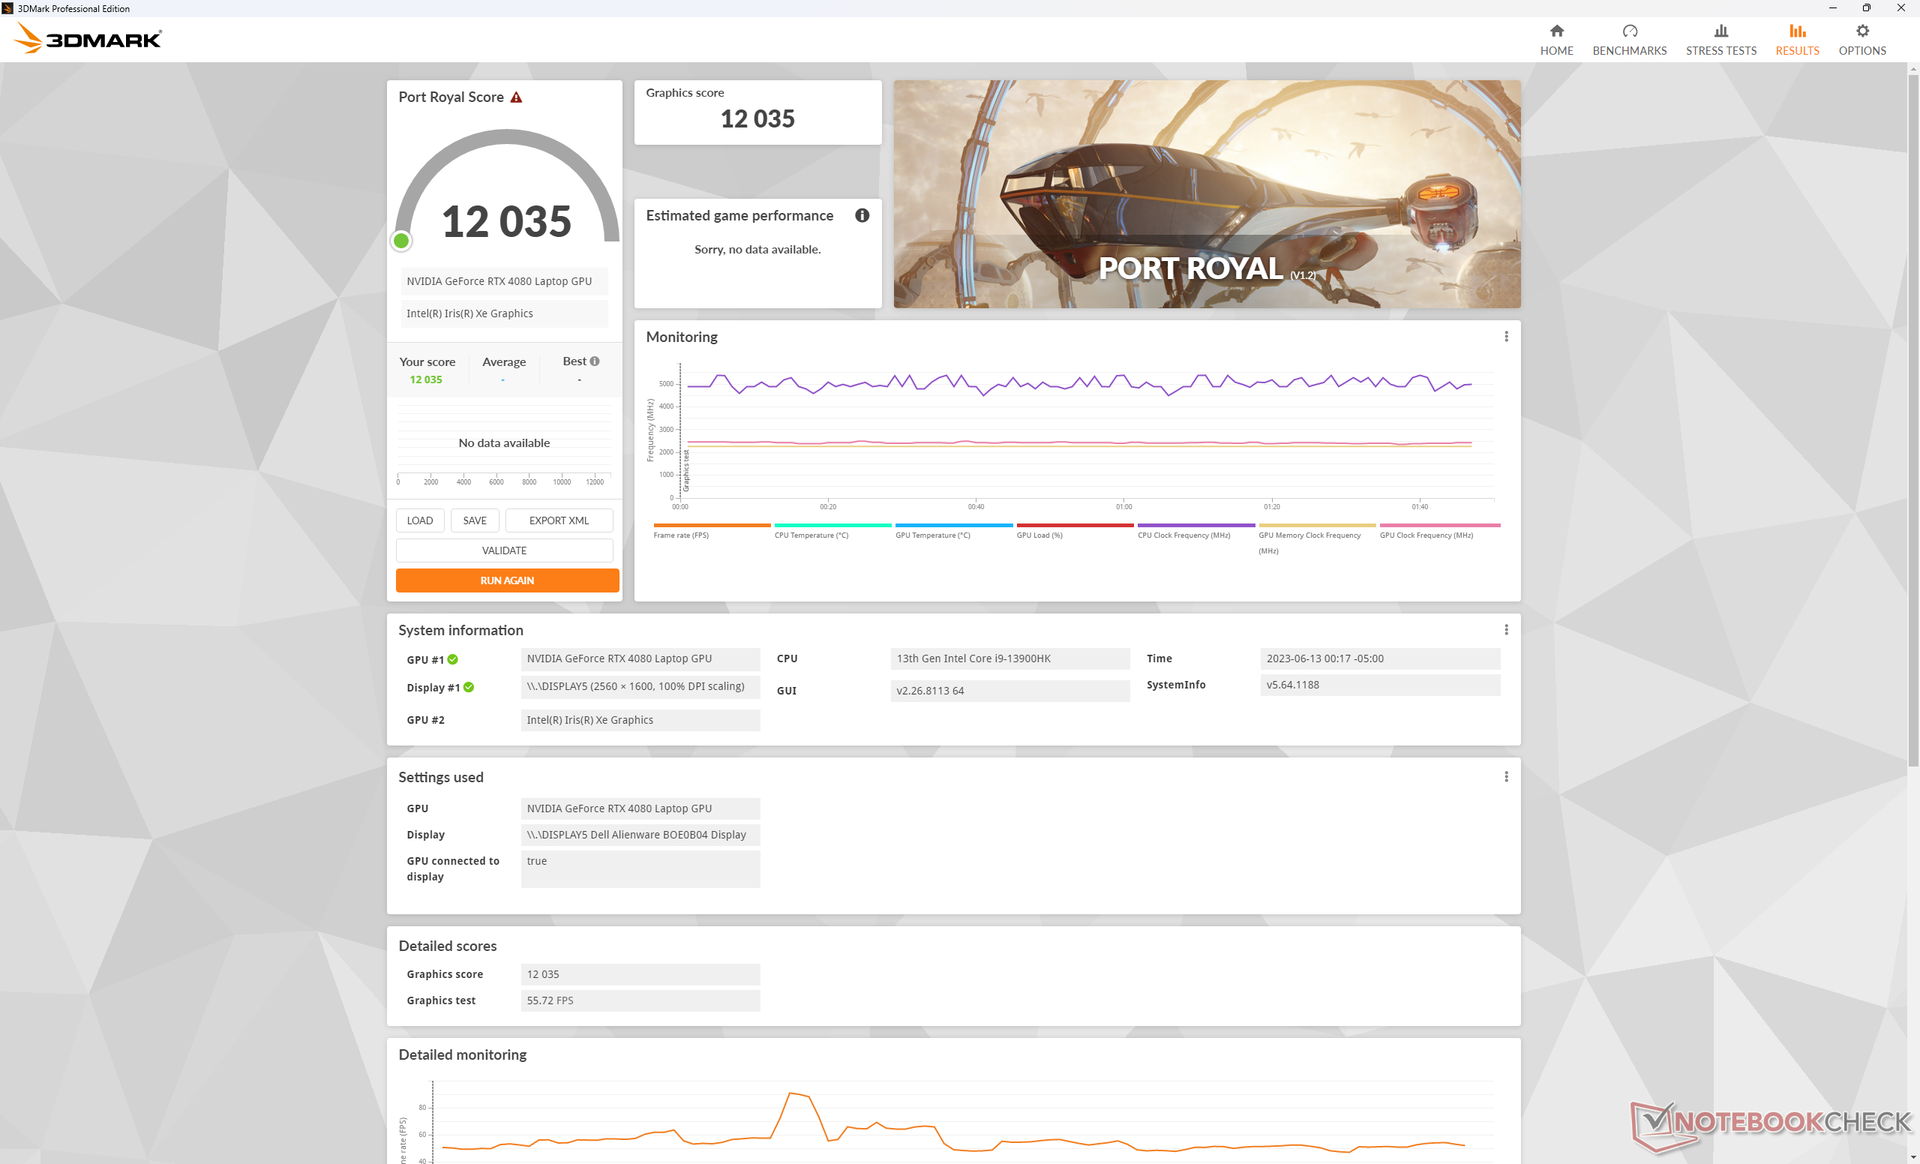
RTX 4080 GeForce RTX 4080 i vår Alienware x16 är cirka 5 till 10 procent snabbare än den genomsnittliga bärbara datorn i vår databas utrustad med samma RTX 4080 GPU. Fördelen kanske inte verkar vara så stor, men den är tillräcklig för att driva systemet till att bli en av de snabbaste RTX 4080 bärbara speldatorerna du kan köpa. 3DMark-resultaten är bara inom 10 procent av RTX 4090 iasus Zephyrus Duo 16till exempel.
Intressant nog sjönk 3DMark-poängen med bara några få procentenheter när man körde i de tystare lägena Performance och Balanced istället för i det högsta läget Overdrive, vilket framgår av tabellen nedan. Detta kommer att vara viktigt att ha i åtanke i avsnitten Stresstest och Systemljud nedan.
Nedgradering till RTX 4070 förväntas påverka prestandan med så mycket som 30 till 35 procent medan uppgradering till RTX 4090 förväntas öka prestandan med cirka 10 procent.
| Inställning för energiprofil | Fire Strike Resultat för fysik | Fire Strike GPU-poäng | Fire Strike Kombinerat resultat |
| Överdrift | 29857 | 43478 | 13071 |
| Prestanda | 27890 (-7%) | 43605 (-0%) | 12961 (-1%) |
| Balanserad | 28704 (-4%) | 41909 (-4%) | 12476 (-5%) |
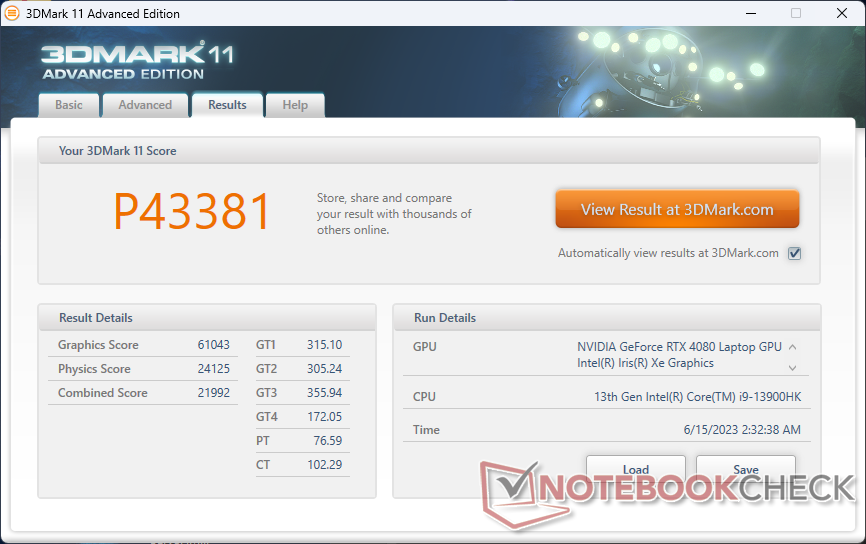
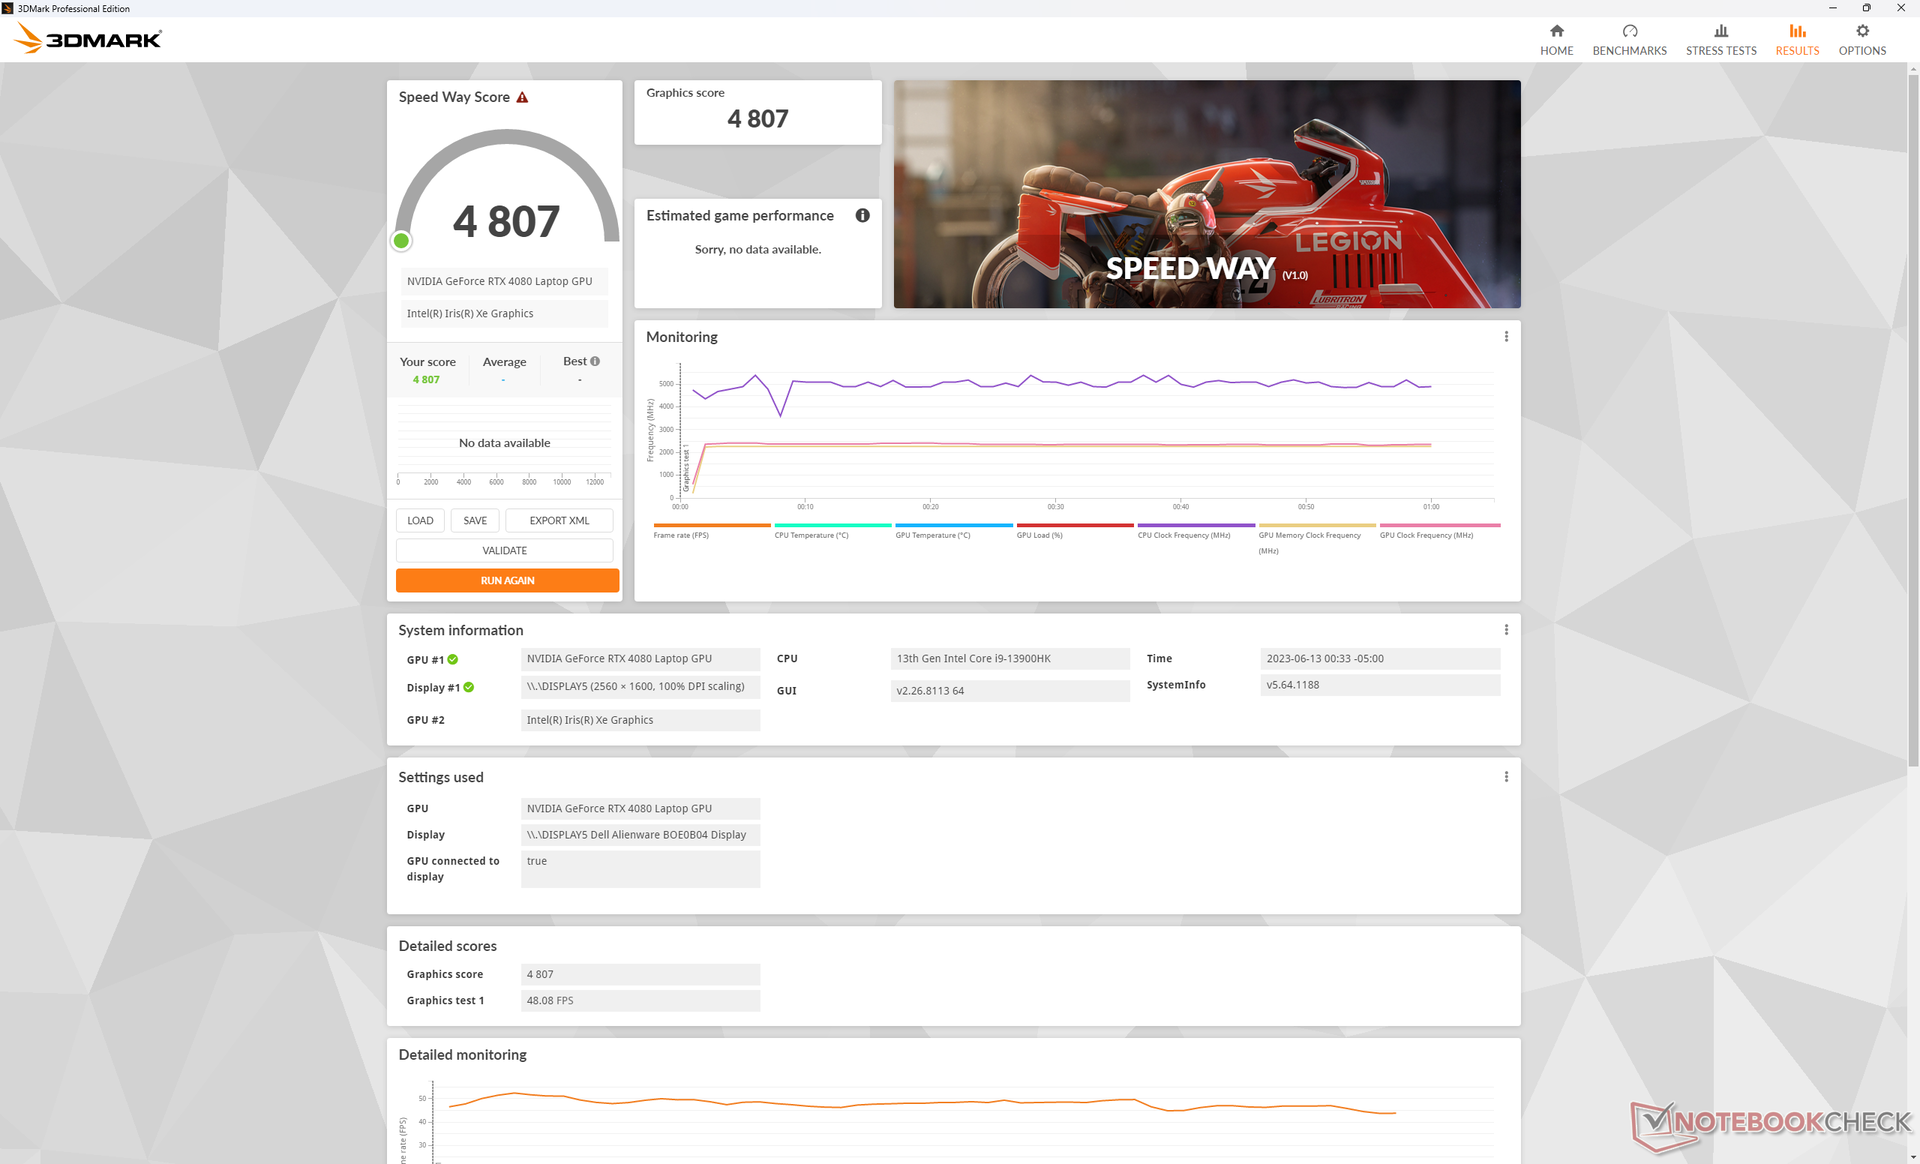
| 3DMark 11 Performance | 43381 poäng | |
| 3DMark Fire Strike Score | 33417 poäng | |
| 3DMark Time Spy Score | 18236 poäng | |
Hjälp | ||
* ... mindre är bättre
Spelprestanda
Alla spel kan spelas i den inbyggda QHD+-upplösningen med stabila bildhastigheter på eller över 60 FPS. Även 4K-spel är möjliga på en extern bildskärm med de flesta inställningar på hög till maximal, inklusive Returnal och F122. För tresiffriga bildfrekvenser bör du dock aktivera DLSS 2 eller DLSS 3 där det är tillgängligt för att bättre utnyttja bildskärmens höga uppdateringsfrekvens.
Witcher 3 FPS Chart
| låg | med. | hög | ultra | QHD | 4K | |
|---|---|---|---|---|---|---|
| GTA V (2015) | 185.8 | 180.4 | 176.4 | 120.3 | 115.4 | 142.9 |
| The Witcher 3 (2015) | 425.6 | 352.7 | 306.5 | 160.2 | 115 | |
| Dota 2 Reborn (2015) | 178.8 | 164 | 159.7 | 146.8 | 129.4 | |
| Final Fantasy XV Benchmark (2018) | 211 | 195.5 | 164.2 | 132.4 | 76.2 | |
| X-Plane 11.11 (2018) | 145.3 | 134.5 | 104.2 | 90.5 | ||
| Strange Brigade (2018) | 469 | 373 | 350 | 325 | 237 | 120.5 |
| Shadow of the Tomb Raider (2018) | 165 | 143 | 84 | |||
| Far Cry 6 (2021) | 121 | 112 | 73 | |||
| Cyberpunk 2077 1.6 (2022) | 158 | 150.9 | 141.2 | 133.6 | 84.4 | 38.5 |
| Tiny Tina's Wonderlands (2022) | 256.6 | 217.3 | 183.3 | 156.4 | 111.1 | 58.6 |
| F1 22 (2022) | 265 | 259 | 244 | 110 | 79 | 39 |
| Call of Duty Modern Warfare 2 2022 (2022) | 139 | 110 | 67 | |||
| Returnal (2023) | 116 | 117 | 114 | 109 | 79 | 43 |
Utsläpp
Systemljud - många alternativ för effektprofil
Fläktljud är direkt kopplat till ACC:s energiprofilinställningar. Om du inte spelar rekommenderas att ACC är inställt på Balanserat läge eller Tyst läge eftersom fläktarna tenderar att pulsera mycket oftare när de är i Performance-läge eller Overdrive-läge.
Körning Witcher 3 i Performance-läge och Overdrive-läge skulle resultera i ett fläktljud på 50 dB(A) respektive 55 dB(A). Eftersom bildfrekvensförlusten är minimal mellan Performance- och Overdrive-lägena, som nämnts i vårt avsnitt om GPU-prestanda ovan, kan du få en märkbart tystare spelupplevelse när du är inställd på Performance-läget. Fläktljudet blir ännu tystare i läget Balanserat utan att bildfrekvensen påverkas nämnvärt. 50+ dB(A) är naturligtvis fortfarande mycket högt, men det är ändå ett vanligt intervall på konkurrerande modeller som Lenovo Legion Pro 7 eller Razer Blade 16.
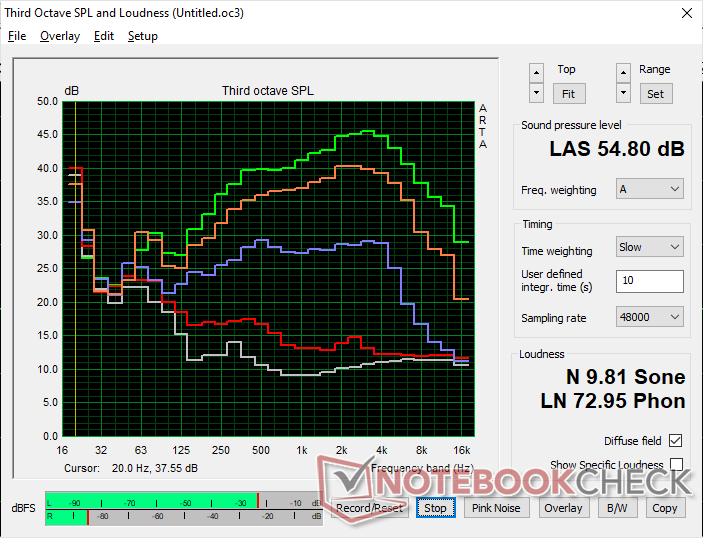
Ljudnivå
| Låg belastning |
| 23.1 / 25.8 / 25.8 dB(A) |
| Hög belastning |
| 39.3 / 54.8 dB(A) |
 | ||
30 dB tyst 40 dB(A) hörbar 50 dB(A) högt ljud |
||
min: | ||
| Alienware x16 R1 GeForce RTX 4080 Laptop GPU, i9-13900HK, SK hynix PC801 HFS001TEJ9X101N | Lenovo Legion Pro 7 RTX4090 GeForce RTX 4090 Laptop GPU, i9-13900HX, Samsung PM9A1 MZVL21T0HCLR | Asus ROG Zephyrus M16 GU604VY-NM042X GeForce RTX 4090 Laptop GPU, i9-13900H, Samsung PM9A1 MZVL22T0HBLB | Razer Blade 16 Early 2023 GeForce RTX 4080 Laptop GPU, i9-13950HX, SSSTC CA6-8D1024 | Dell G16 7620 GeForce RTX 3060 Laptop GPU, i7-12700H, WDC PC SN810 512GB | Alienware m17 R5 (R9 6900HX, RX 6850M XT) Radeon RX 6850M XT, R9 6900HX, SSSTC CA6-8D1024 | |
|---|---|---|---|---|---|---|
| Noise | -17% | -10% | 3% | -2% | 2% | |
| av / miljö * (dB) | 22.7 | 25 -10% | 24 -6% | 23 -1% | 23.2 -2% | 23 -1% |
| Idle Minimum * (dB) | 23.1 | 28 -21% | 24 -4% | 23 -0% | 28.3 -23% | 23 -0% |
| Idle Average * (dB) | 25.8 | 30 -16% | 29.96 -16% | 23 11% | 28.8 -12% | 28.11 -9% |
| Idle Maximum * (dB) | 25.8 | 38 -47% | 34.27 -33% | 23.6 9% | 28.9 -12% | 28.11 -9% |
| Load Average * (dB) | 39.3 | 48 -22% | 35.89 9% | 39 1% | 32.4 18% | 30.62 22% |
| Witcher 3 ultra * (dB) | 49.9 | 53 -6% | 57.5 -15% | 51.6 -3% | 48.3 3% | 49.75 -0% |
| Load Maximum * (dB) | 54.8 | 55 -0% | 57.54 -5% | 51.3 6% | 48.1 12% | 50.17 8% |
* ... mindre är bättre
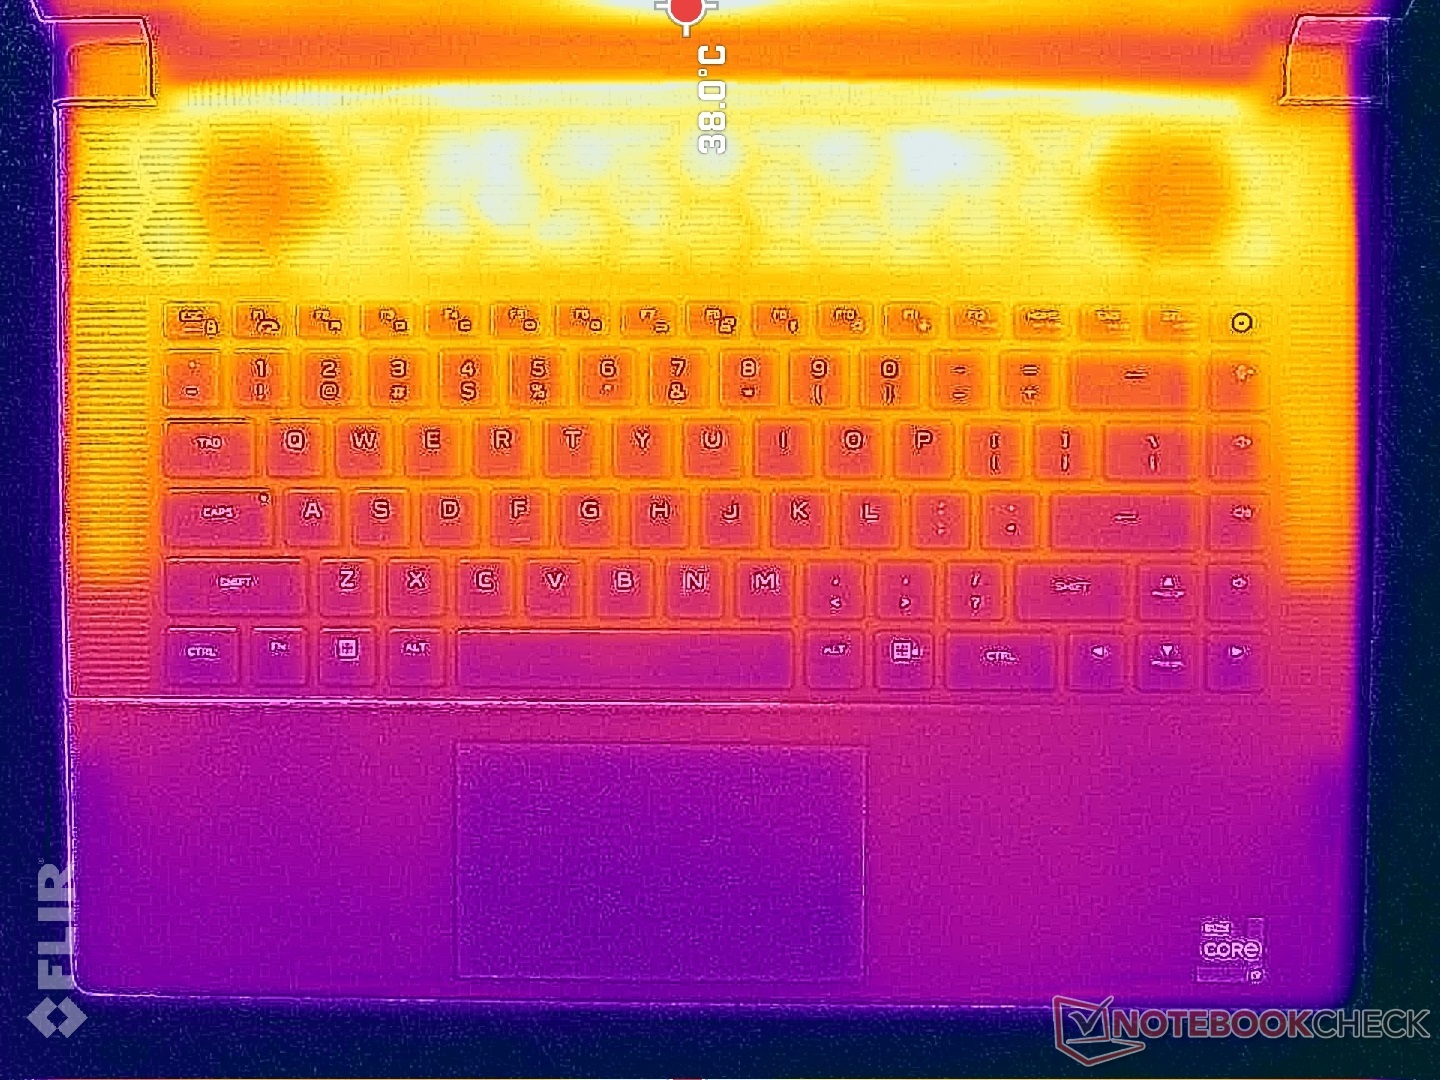
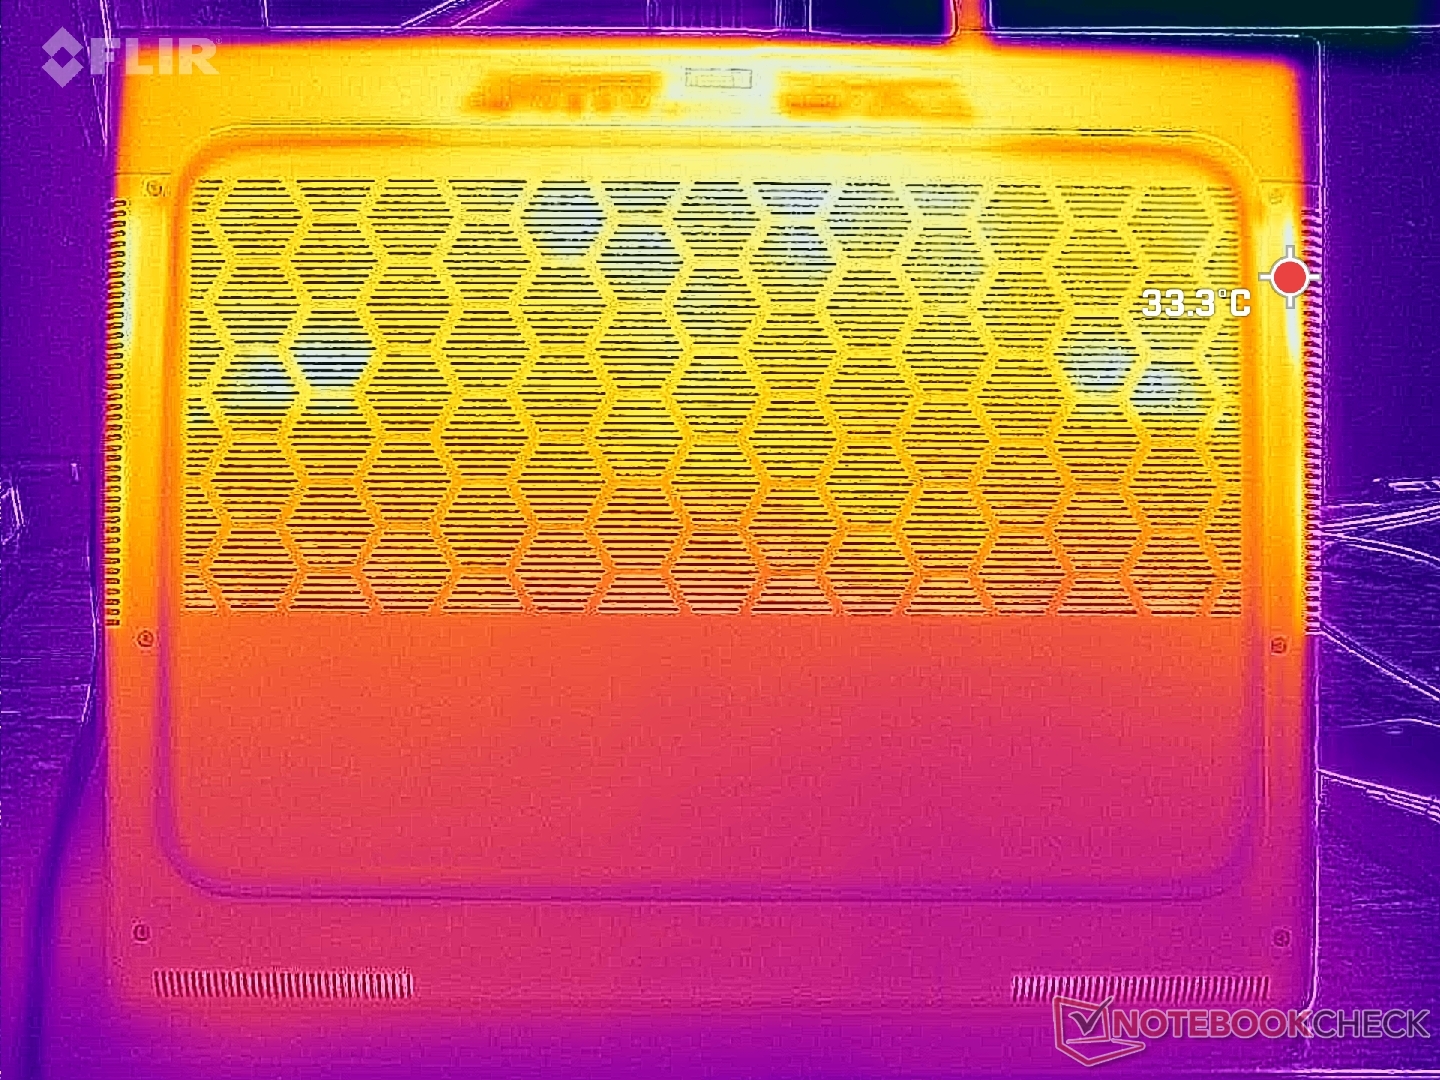
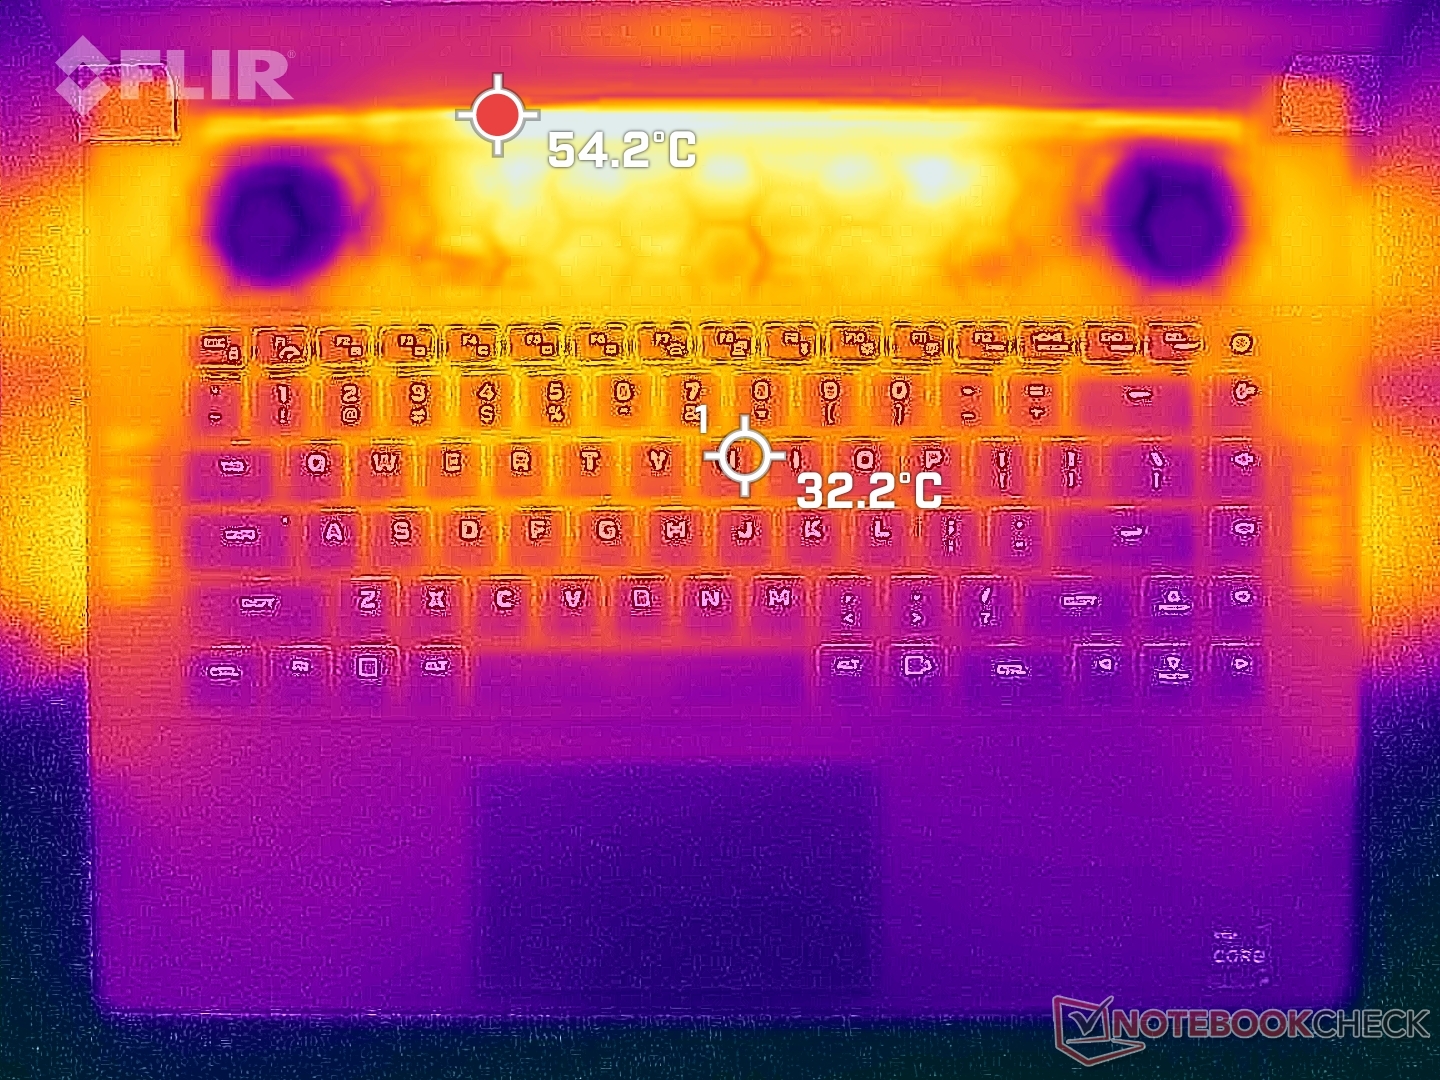
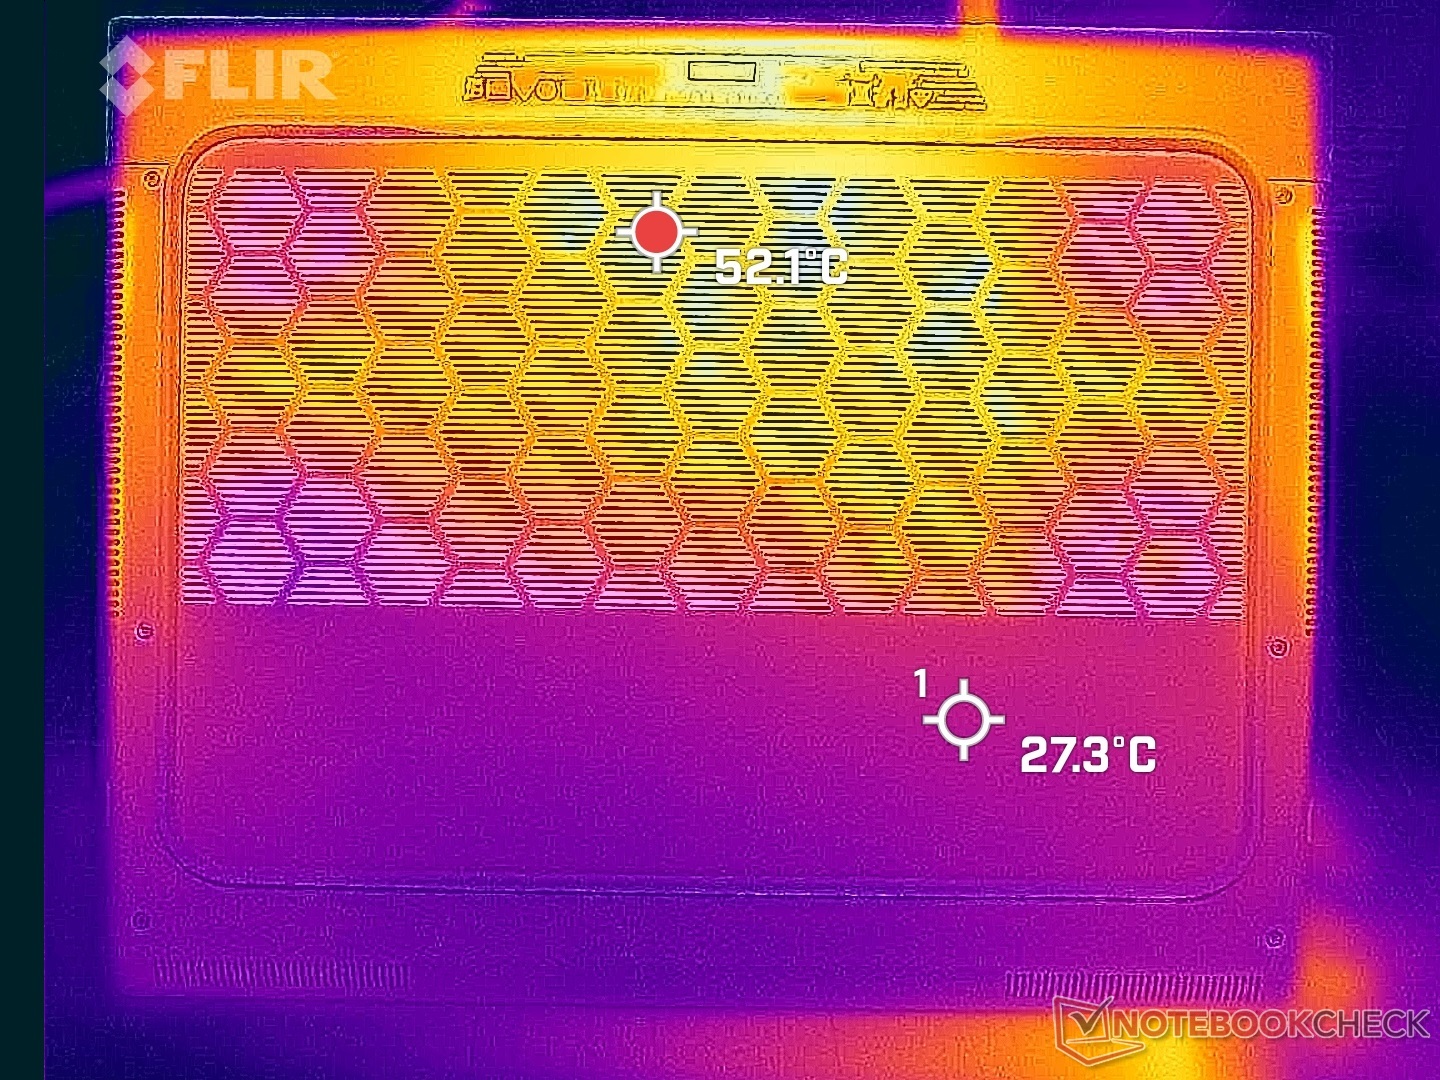
Temperatur
Yttemperaturerna kan bli mycket varma på grund av den tunna profilen. Heta punkter kan nå ca 50 C på ovansidan och undersidan jämfört med bara 40 C på Blade 16. Tack och lov är dessa heta punkter mot baksidan och bort från handledsstöden.
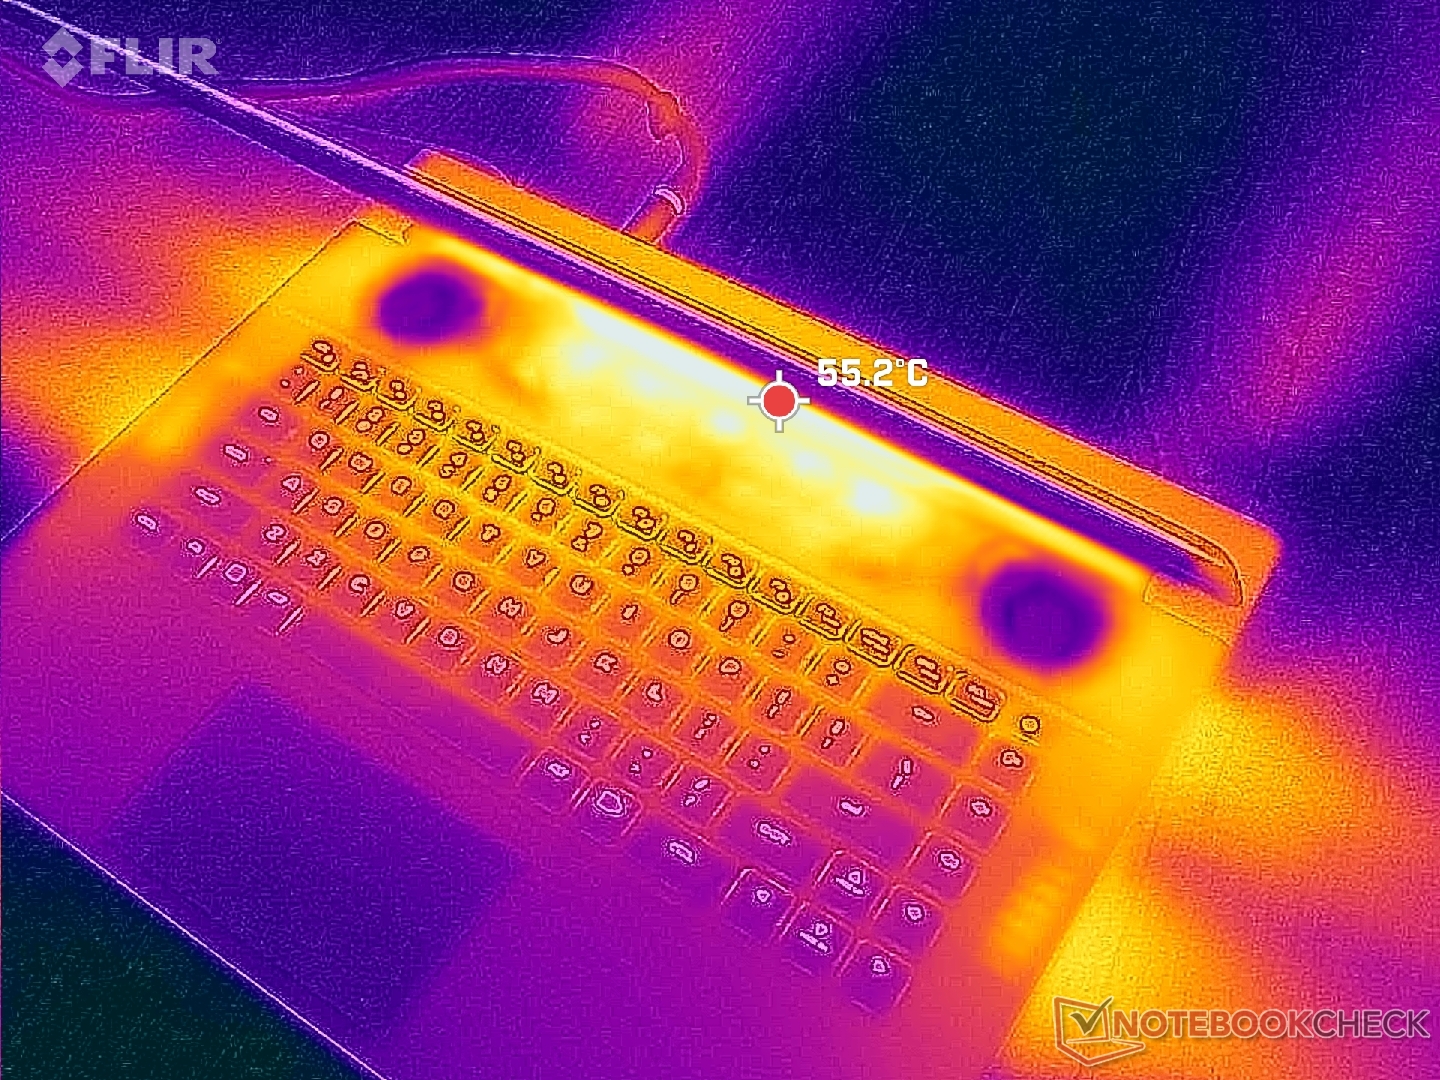
(-) Den maximala temperaturen på ovansidan är 47.2 °C / 117 F, jämfört med genomsnittet av 40.4 °C / 105 F , allt från 21.2 till 68.8 °C för klassen Gaming.
(-) Botten värms upp till maximalt 47.8 °C / 118 F, jämfört med genomsnittet av 43.2 °C / 110 F
(+) Vid tomgångsbruk är medeltemperaturen för ovansidan 30.8 °C / 87 F, jämfört med enhetsgenomsnittet på 33.9 °C / ### class_avg_f### F.
(±) När du spelar The Witcher 3 är medeltemperaturen för ovansidan 38 °C / 100 F, jämfört med enhetsgenomsnittet på 33.9 °C / ## #class_avg_f### F.
(+) Handledsstöden och pekplattan är kallare än hudtemperaturen med maximalt 30.6 °C / 87.1 F och är därför svala att ta på.
(±) Medeltemperaturen för handledsstödsområdet på liknande enheter var 28.8 °C / 83.8 F (-1.8 °C / -3.3 F).
| Alienware x16 R1 Intel Core i9-13900HK, NVIDIA GeForce RTX 4080 Laptop GPU | Lenovo Legion Pro 7 RTX4090 Intel Core i9-13900HX, NVIDIA GeForce RTX 4090 Laptop GPU | Asus ROG Zephyrus M16 GU604VY-NM042X Intel Core i9-13900H, NVIDIA GeForce RTX 4090 Laptop GPU | Razer Blade 16 Early 2023 Intel Core i9-13950HX, NVIDIA GeForce RTX 4080 Laptop GPU | Dell G16 7620 Intel Core i7-12700H, NVIDIA GeForce RTX 3060 Laptop GPU | Alienware m17 R5 (R9 6900HX, RX 6850M XT) AMD Ryzen 9 6900HX, AMD Radeon RX 6850M XT | |
|---|---|---|---|---|---|---|
| Heat | -4% | 6% | 15% | 14% | 2% | |
| Maximum Upper Side * (°C) | 47.2 | 53 -12% | 50 -6% | 40 15% | 47.6 -1% | 53 -12% |
| Maximum Bottom * (°C) | 47.8 | 59 -23% | 58 -21% | 37.6 21% | 54 -13% | 56 -17% |
| Idle Upper Side * (°C) | 36.8 | 34 8% | 26 29% | 32.4 12% | 23 37% | 30 18% |
| Idle Bottom * (°C) | 35.8 | 32 11% | 28 22% | 31.4 12% | 24.6 31% | 29 19% |
* ... mindre är bättre
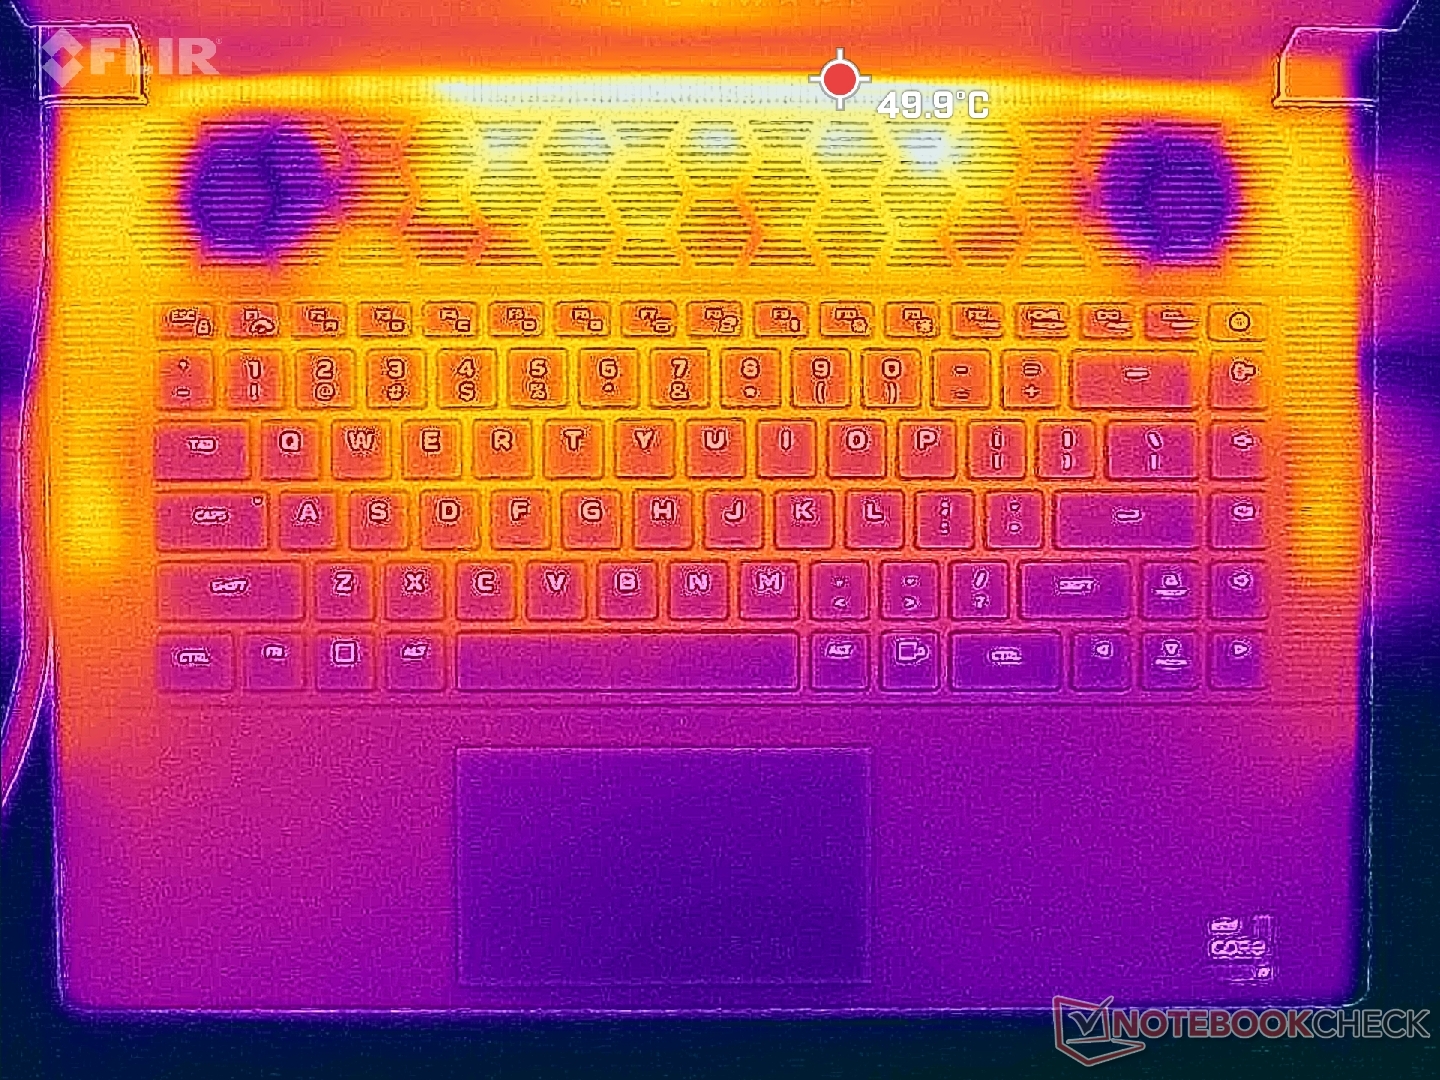
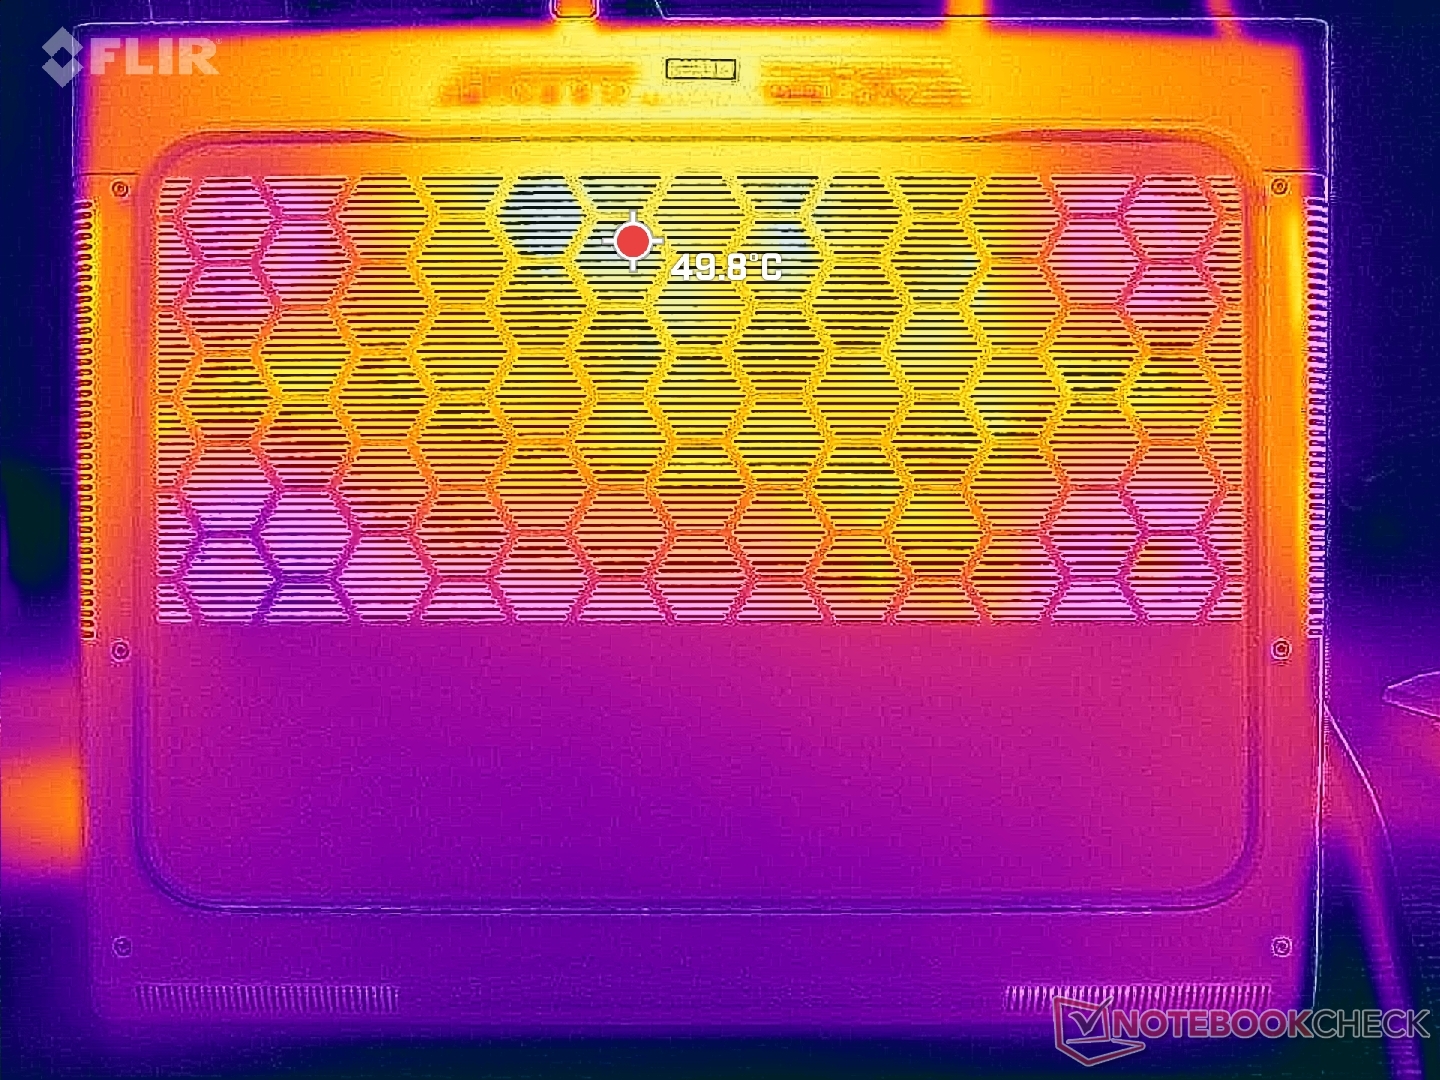
Stresstest
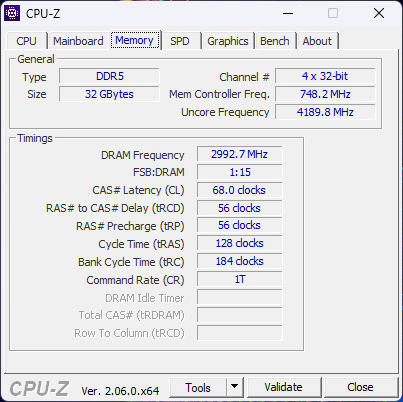
CPU-klockfrekvensen, kortets strömförbrukning och kärntemperaturen steg till 4,5 GHz, 178 W respektive 99 C när Prime95-belastningen initierades. Efter bara ett par minuter stabiliserades CPU:n till 3,8 GHz, 123 W och 99 C. Med så höga kärntemperaturer är det tydligt att processorn pressar kylningslösningen till det yttersta för att upprätthålla de högsta möjliga Turbo Boost-klockfrekvenserna. Att upprepa samma test på Blade 16, till exempel, skulle resultera i en svalare stabil kärntemperatur på 82 C.
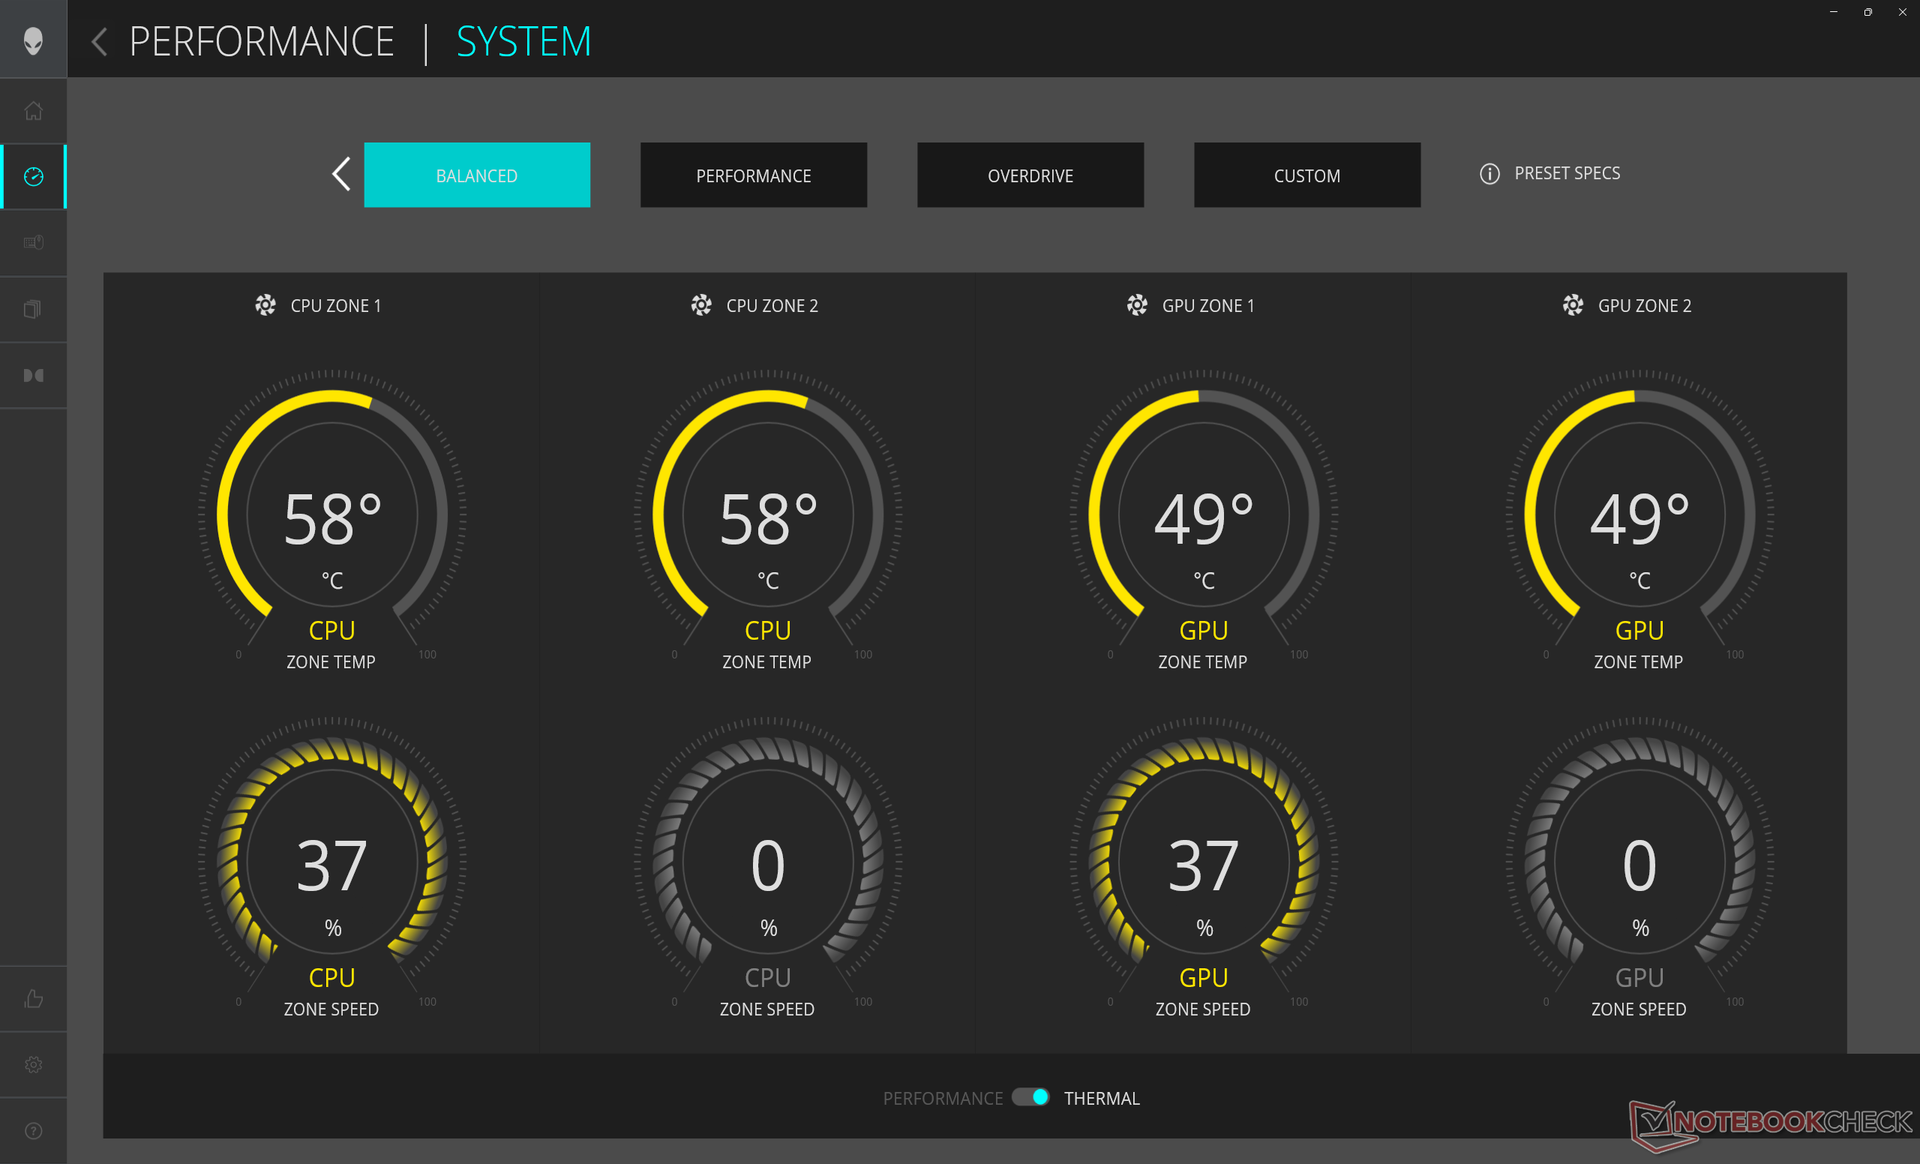
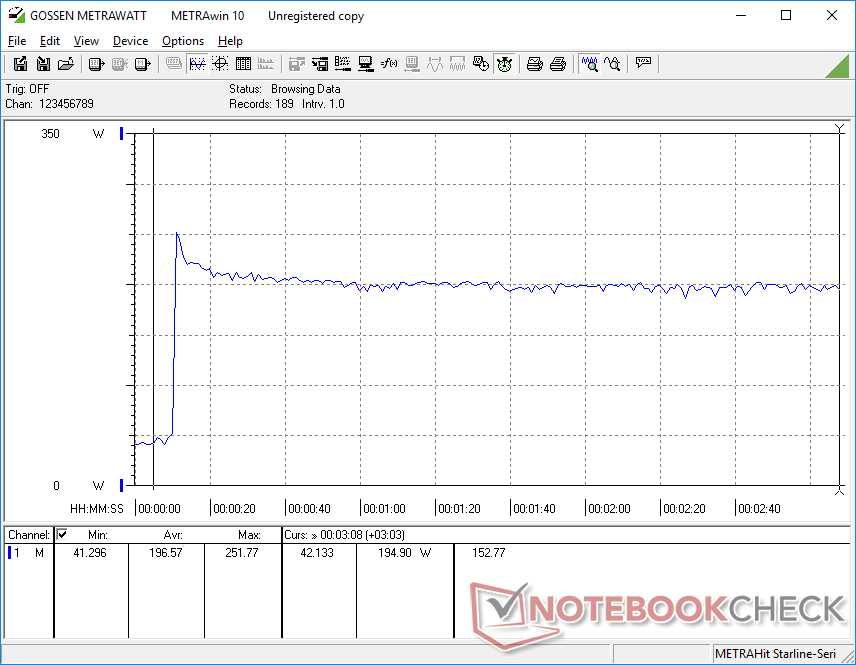
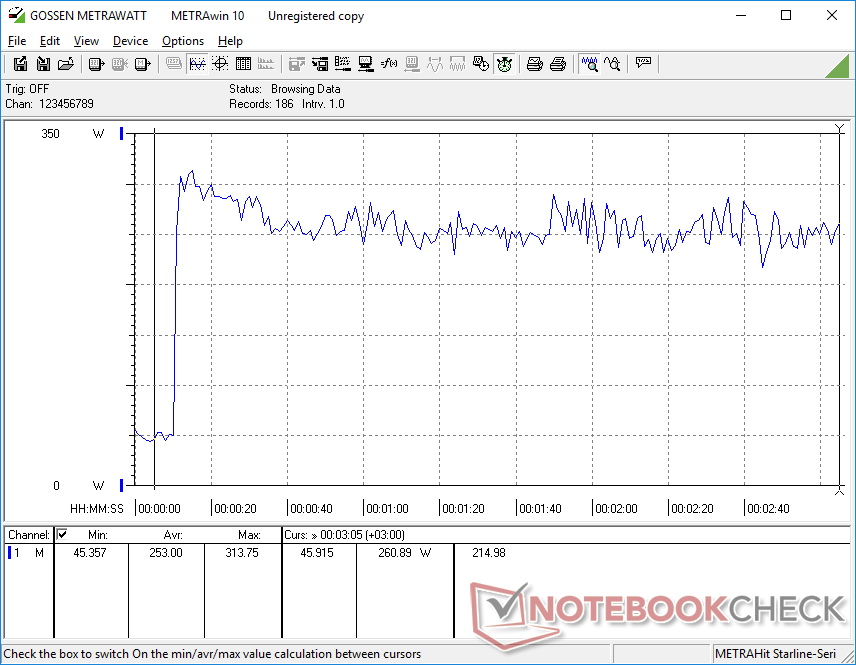
När Witcher 3 körs i Overdrive-läget för att representera typiska spelbelastningar stabiliseras GPU:n på ca 166 W mot ett mål på 175 W. Intressant nog minskar kortets strömförbrukning knappt till bara 161 W i Balanced-läget, vilket framgår av skärmdumparna nedan, vilket representerar en mycket marginell prestandaförlust i förhållande till det betydligt tystare fläktljudet jämfört med Overdrive-läget. Ägare kan därför överväga att spela i balanserat läge istället för de mer högljudda Performance- eller Overdrive-lägena.
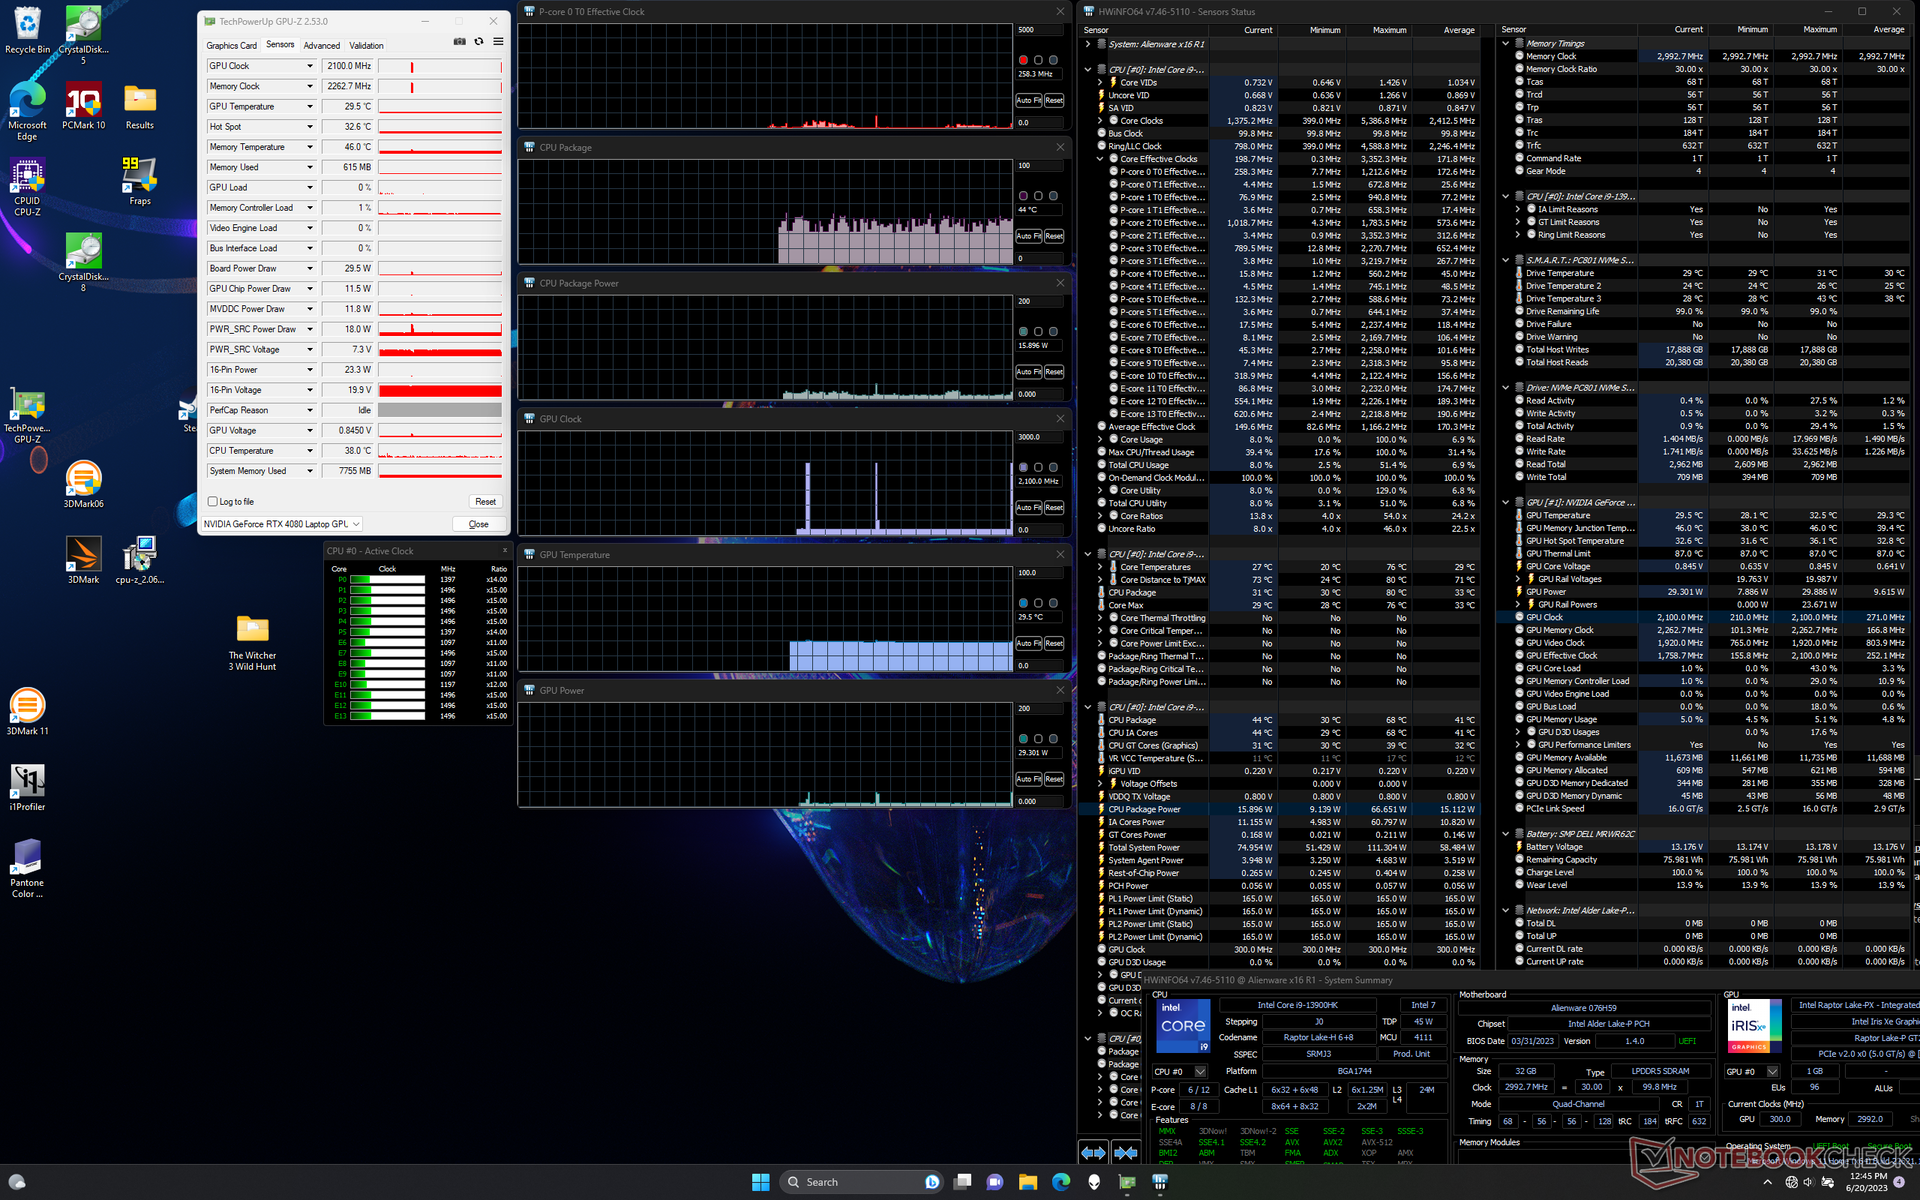
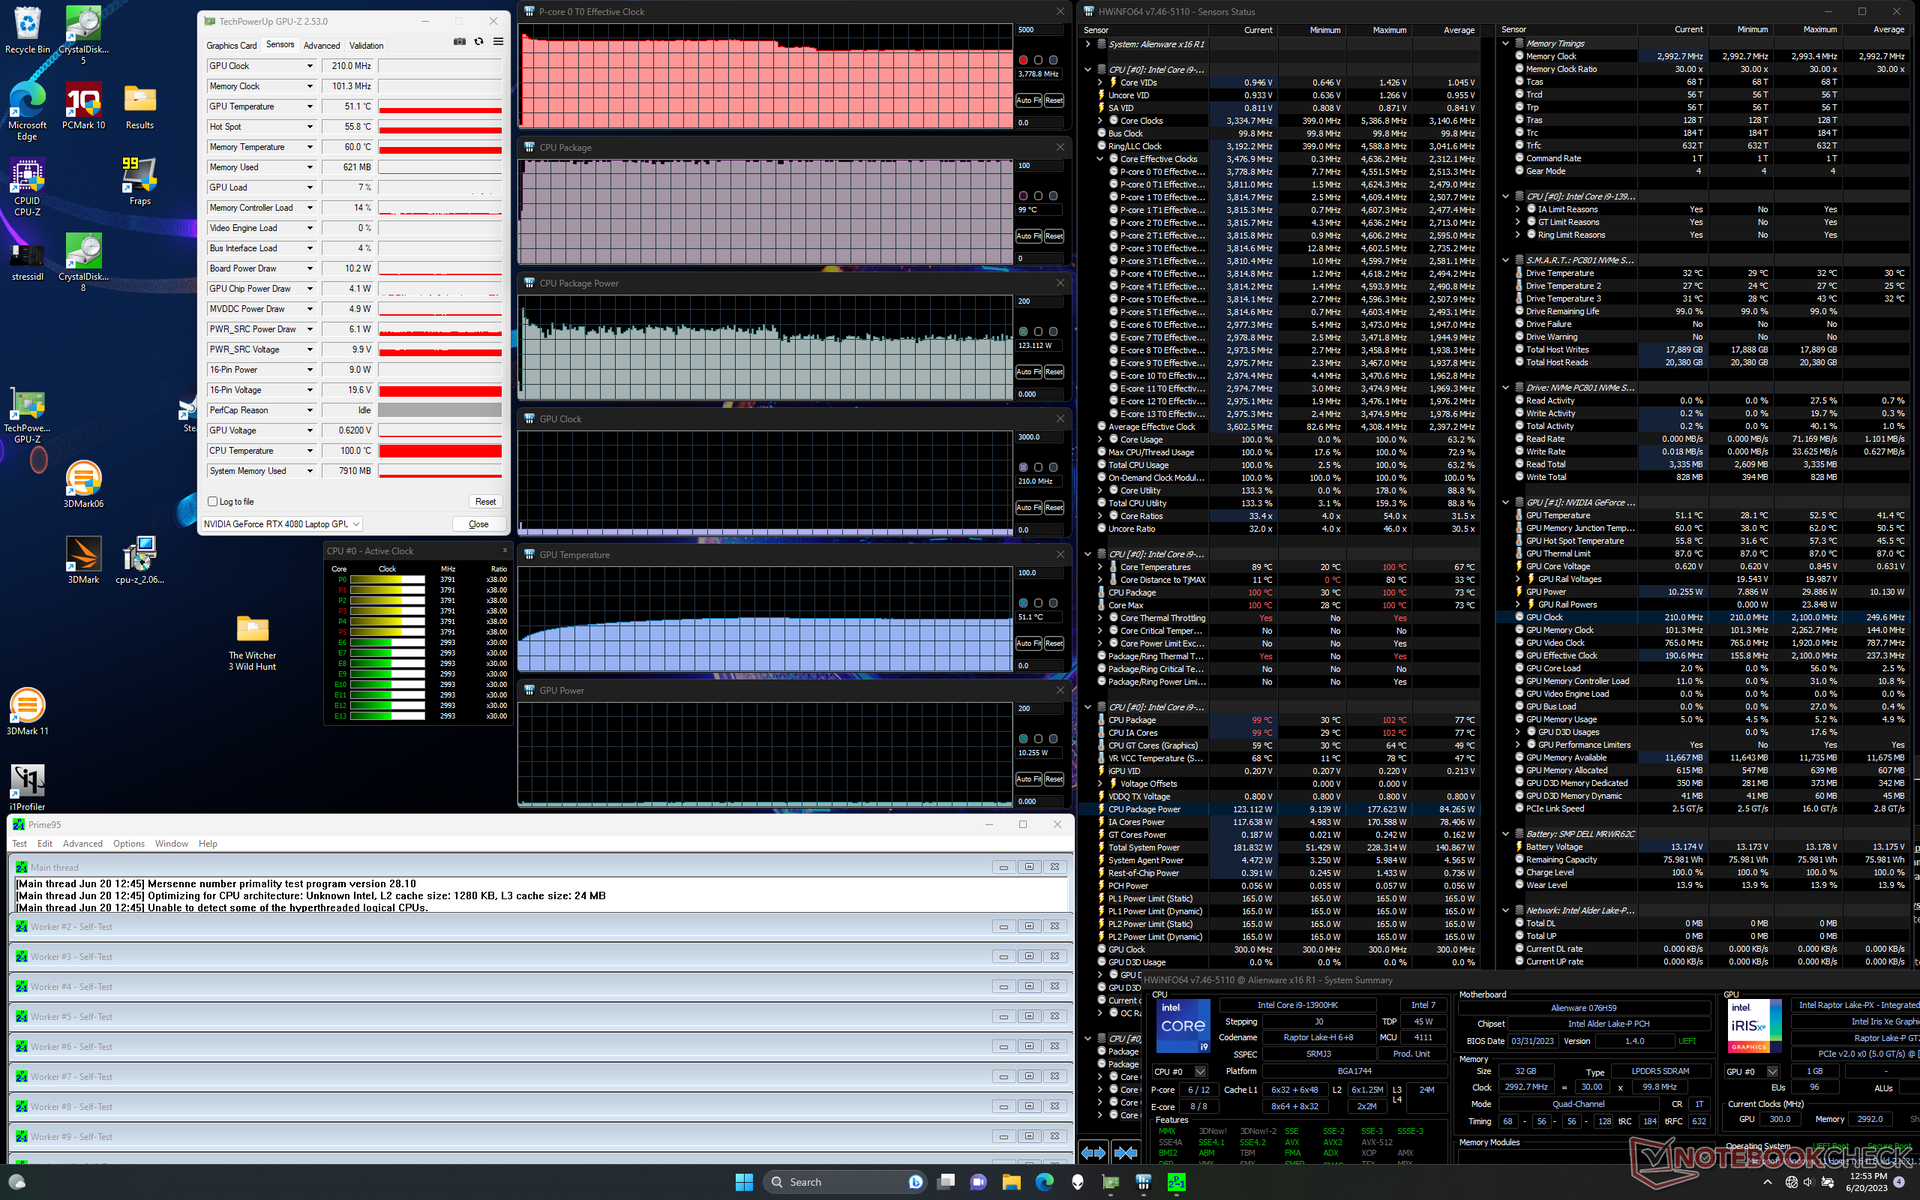
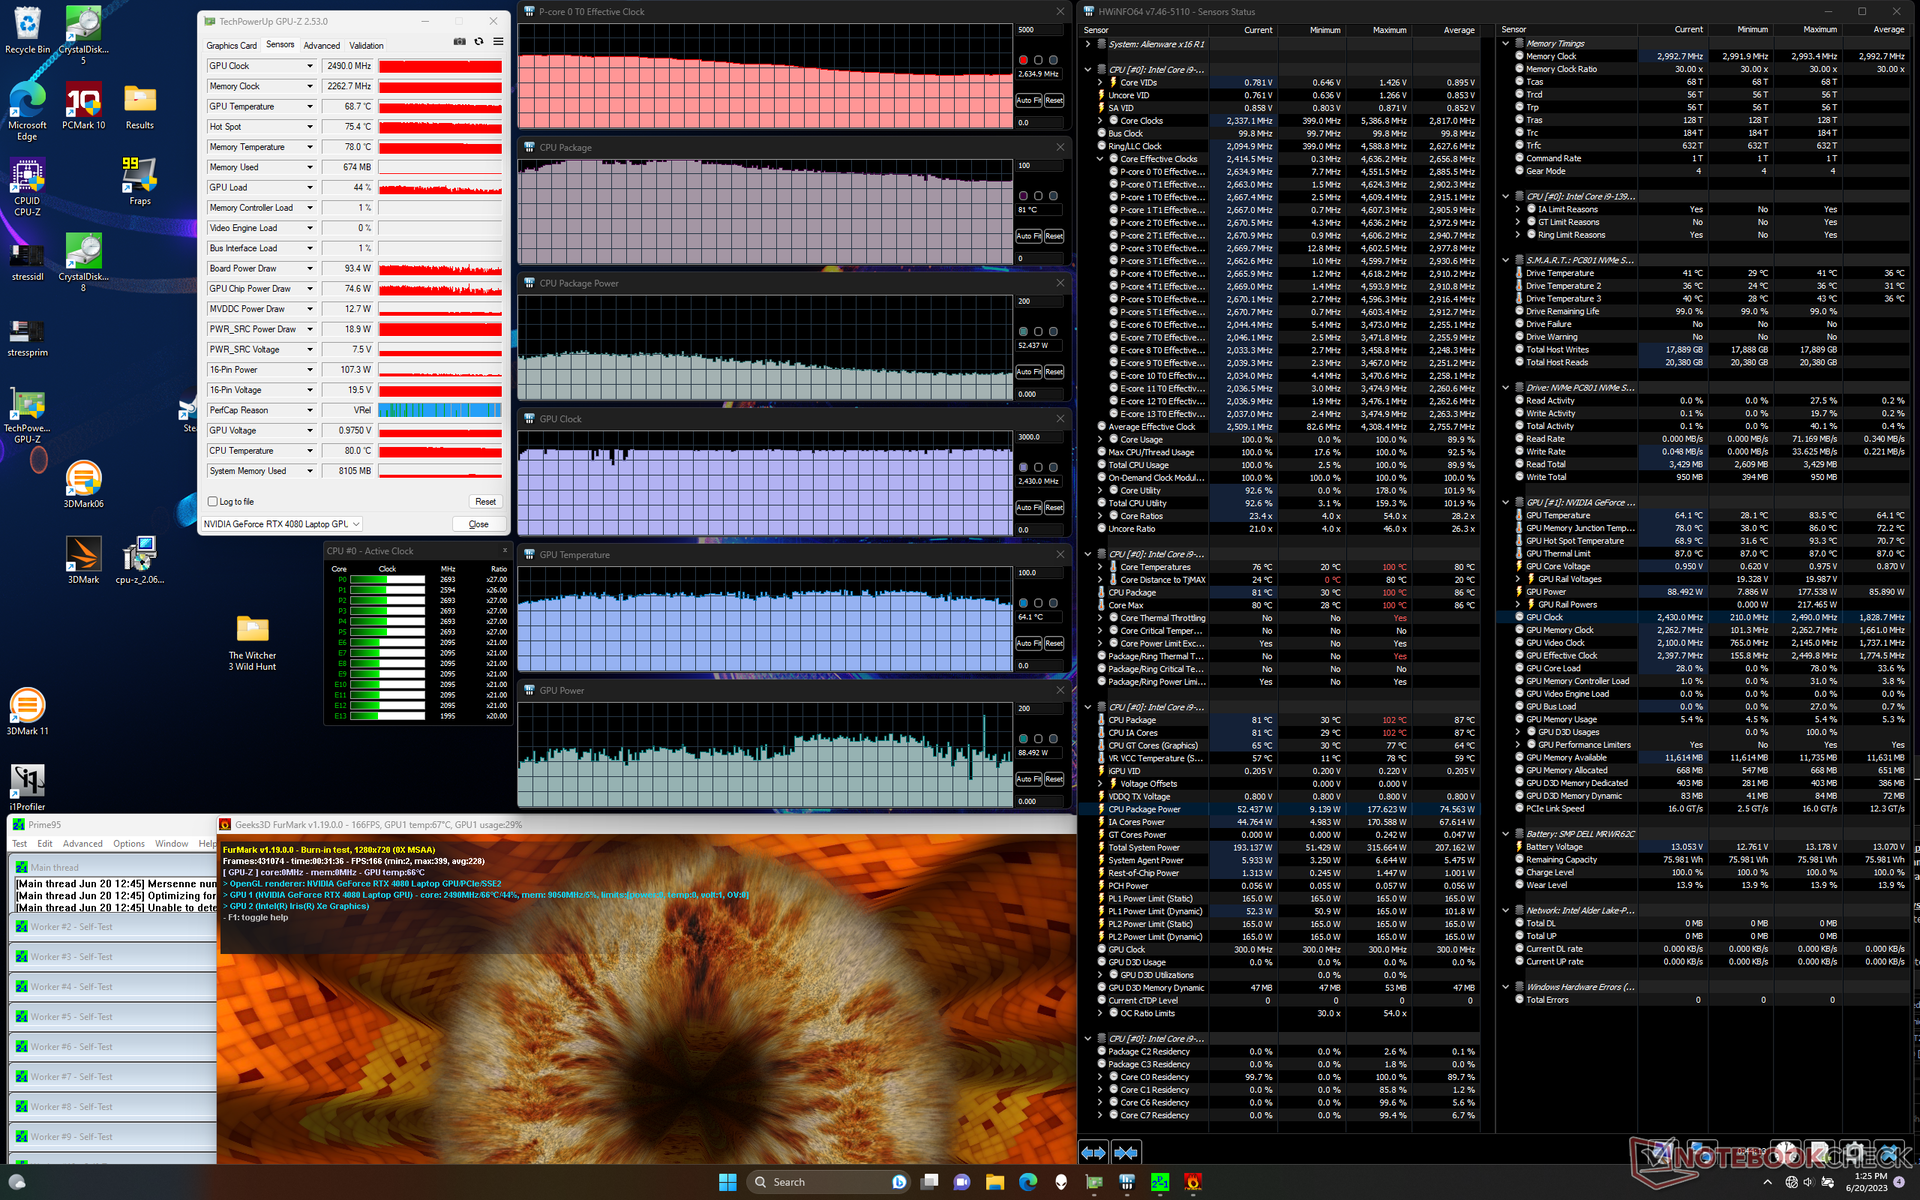

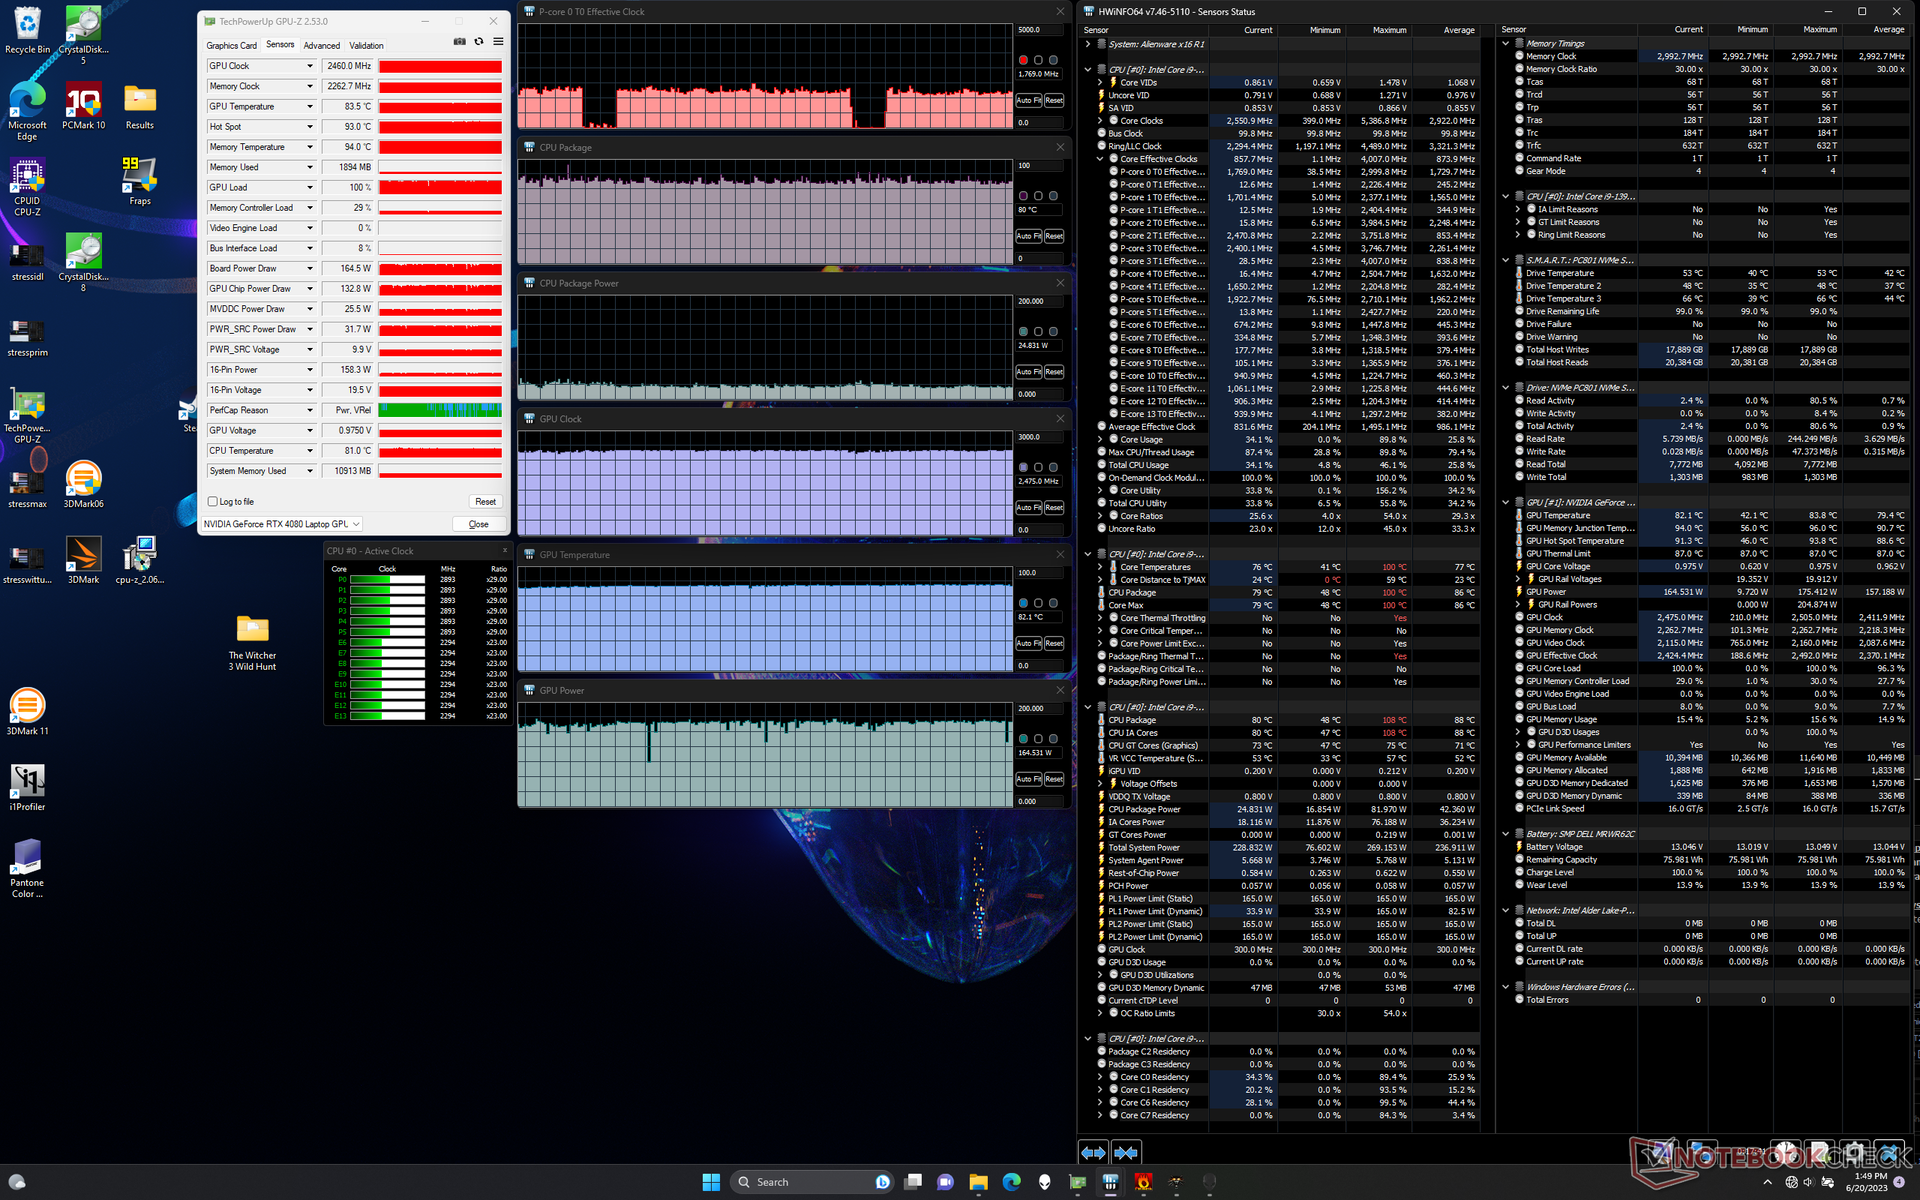
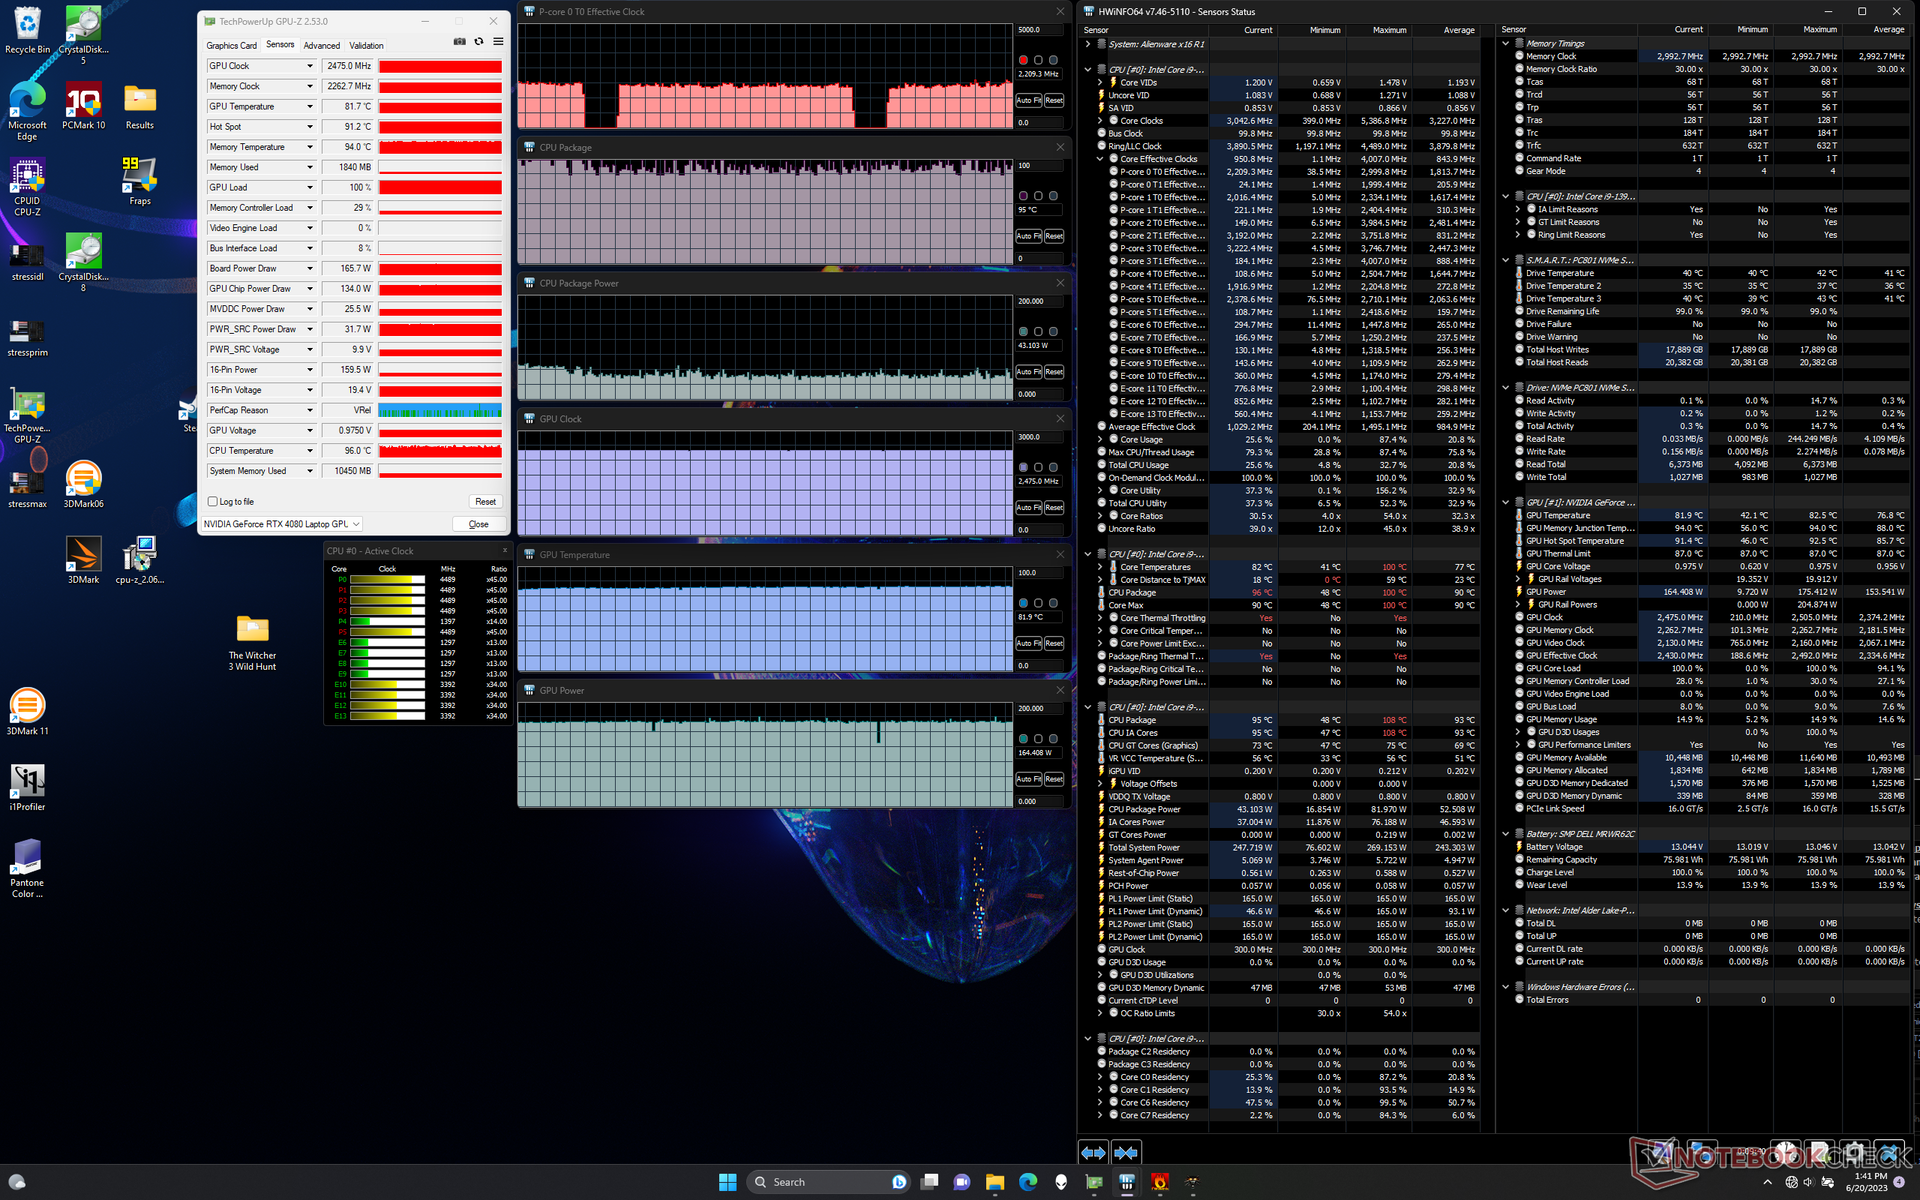
| CPU-klocka (GHz) | GPU-klocka (MHz) | Genomsnittlig CPU-temperatur (°C) | Genomsnittlig GPU-temperatur (°C) | |
| System i viloläge | -- | -- | 44 | 30 |
| Prime95 Stress | 3.8 | -- | 99 | 51 |
| Prime95 + FurMark Stress | 2,5 - 3,6 | 2475 | 82 - 100 | 72 - 77 |
| Witcher 3 Stress (balanserat läge) | ~1,8 | 2460 | 81 | 85 |
| Witcher 3 Stress(Performance mode) | ~1.8 | 2460 | 80 | 82 |
| Witcher 3 Stress (lägeOverdrive) | ~2.2 | 2475 | 95 | 82 |
Högtalare
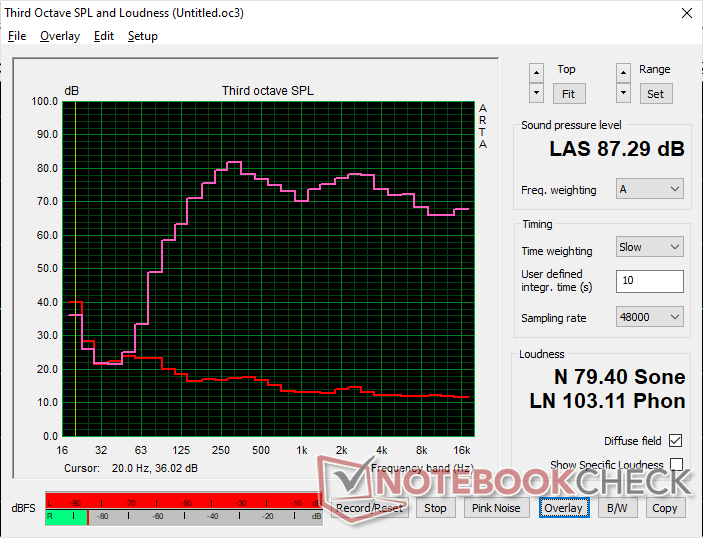
Alienware x16 R1 ljudanalys
(+) | högtalare kan spela relativt högt (87.3 dB)
Bas 100 - 315 Hz
(±) | reducerad bas - i genomsnitt 7.3% lägre än medianen
(±) | linjäriteten för basen är genomsnittlig (9.1% delta till föregående frekvens)
Mellan 400 - 2000 Hz
(+) | balanserad mellan - endast 2.2% från medianen
(+) | mids är linjära (3.8% delta till föregående frekvens)
Högsta 2 - 16 kHz
(+) | balanserade toppar - endast 3.6% från medianen
(+) | toppar är linjära (3.3% delta till föregående frekvens)
Totalt 100 - 16 000 Hz
(+) | det totala ljudet är linjärt (7.9% skillnad mot median)
Jämfört med samma klass
» 1% av alla testade enheter i den här klassen var bättre, 1% liknande, 98% sämre
» Den bästa hade ett delta på 6%, genomsnittet var 18%, sämst var 132%
Jämfört med alla testade enheter
» 2% av alla testade enheter var bättre, 1% liknande, 98% sämre
» Den bästa hade ett delta på 4%, genomsnittet var 23%, sämst var 134%
Apple MacBook Pro 16 2021 M1 Pro ljudanalys
(+) | högtalare kan spela relativt högt (84.7 dB)
Bas 100 - 315 Hz
(+) | bra bas - bara 3.8% från medianen
(+) | basen är linjär (5.2% delta till föregående frekvens)
Mellan 400 - 2000 Hz
(+) | balanserad mellan - endast 1.3% från medianen
(+) | mids är linjära (2.1% delta till föregående frekvens)
Högsta 2 - 16 kHz
(+) | balanserade toppar - endast 1.9% från medianen
(+) | toppar är linjära (2.7% delta till föregående frekvens)
Totalt 100 - 16 000 Hz
(+) | det totala ljudet är linjärt (4.6% skillnad mot median)
Jämfört med samma klass
» 0% av alla testade enheter i den här klassen var bättre, 0% liknande, 100% sämre
» Den bästa hade ett delta på 5%, genomsnittet var 17%, sämst var 45%
Jämfört med alla testade enheter
» 0% av alla testade enheter var bättre, 0% liknande, 100% sämre
» Den bästa hade ett delta på 4%, genomsnittet var 23%, sämst var 134%
Energiförvaltning
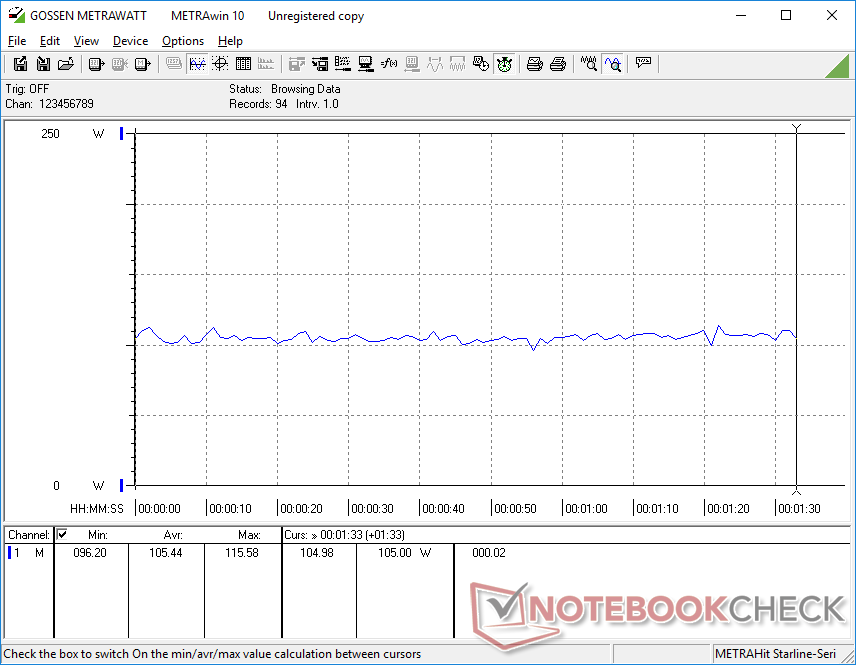
Strömförbrukning - hög som förväntat
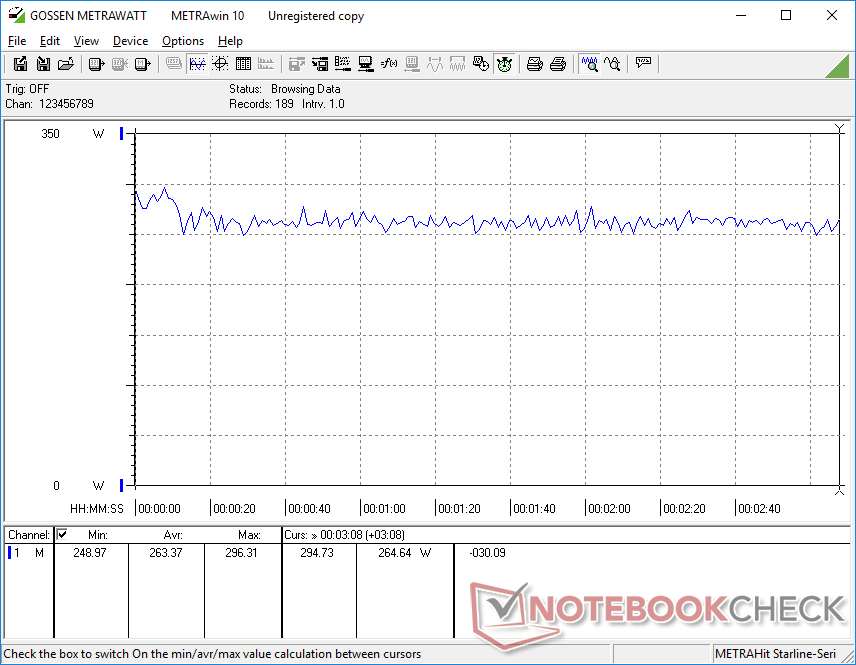
Strömförbrukningen varierar mellan 25 W och 50 W vid tomgång på skrivbordet beroende på inställningar för strömprofil, GPU och ljusstyrka. Detta intervall är på den höga sidan även för kategorin som andra 16-tums modeller som Razer Blade 16 eller Alienware m17 kan nå så lågt som 15 W när de har liknande minsta effektinställningar.
Spel kräver cirka 263 W vilket är mellan Asus ROG Strix G16 och MSI GE78 HX båda med samma RTX 4080 GPU. Kanske mer anmärkningsvärt, den RTX 4090-drivna Asus ROG Zephyrus M16 20 procent mindre ström samtidigt som den ger ungefär samma grafikprestanda som vår RTX 4080-drivna Alienware.
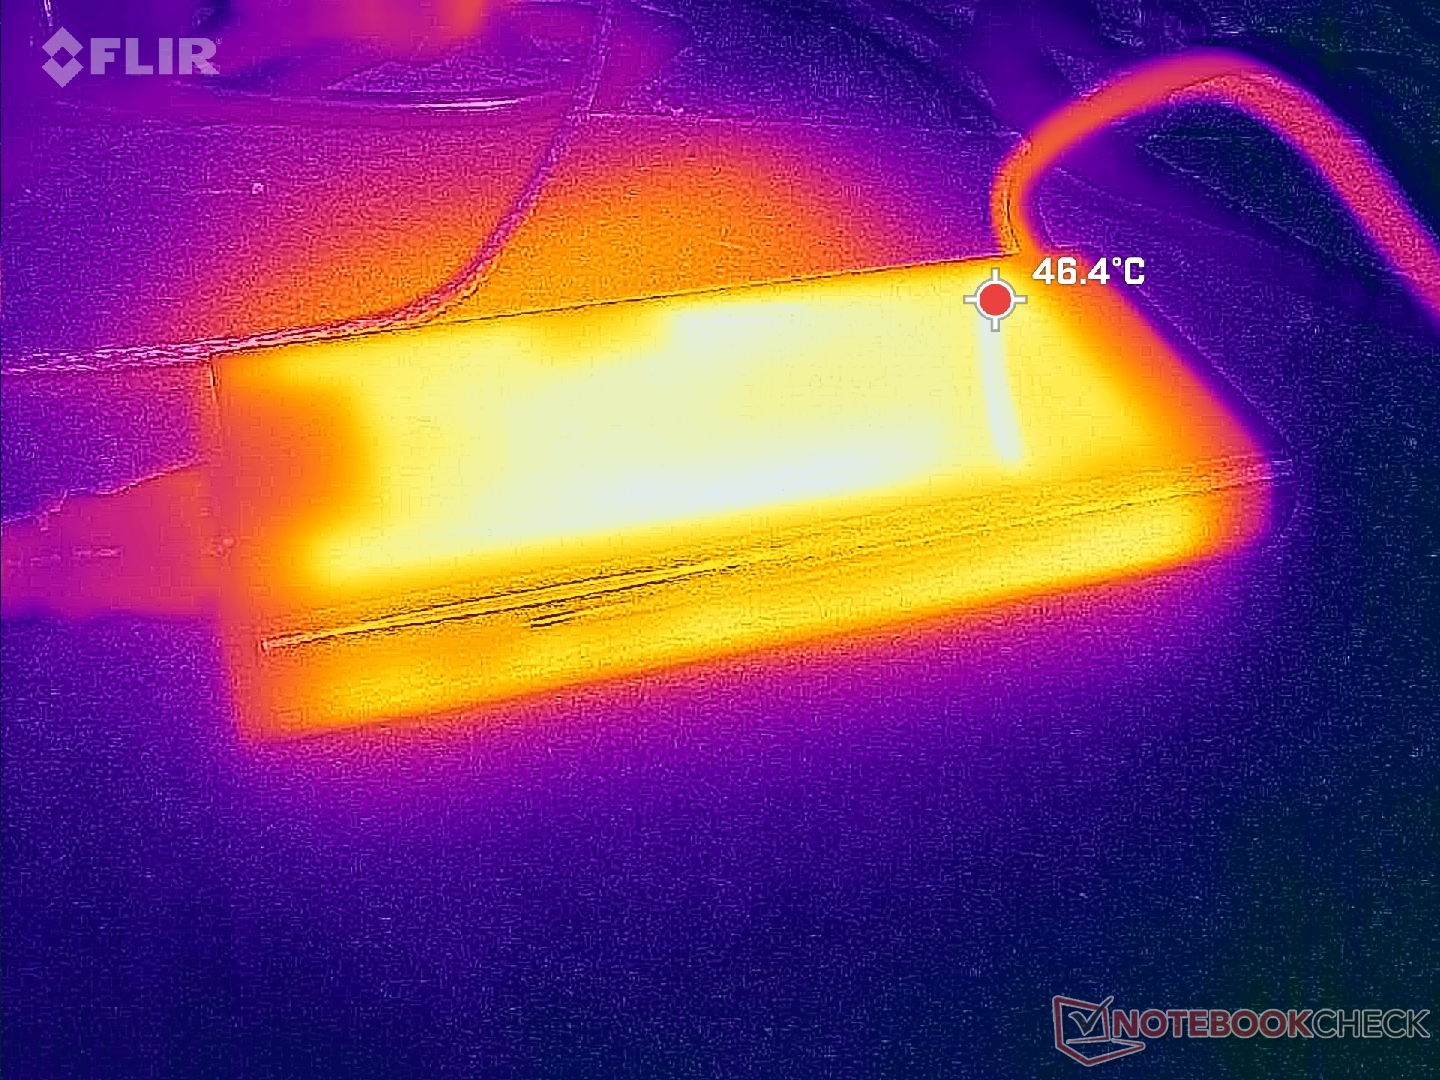
Vi kan mäta en maximal tillfällig förbrukning på 313 W från den medelstora (~18,3 x 8,6 x 2,6 cm) 330 W nätadaptern när både CPU och GPU utnyttjas till 100 procent. Laddningshastigheten saktar ner när man kör sådana krävande belastningar.
| Av/Standby | |
| Låg belastning | |
| Hög belastning |
|
Förklaring:
min: | |
| Alienware x16 R1 i9-13900HK, GeForce RTX 4080 Laptop GPU, SK hynix PC801 HFS001TEJ9X101N, IPS, 2560x1600, 16" | Lenovo Legion Pro 7 RTX4090 i9-13900HX, GeForce RTX 4090 Laptop GPU, Samsung PM9A1 MZVL21T0HCLR, IPS, 2560x1600, 16" | Asus ROG Zephyrus M16 GU604VY-NM042X i9-13900H, GeForce RTX 4090 Laptop GPU, Samsung PM9A1 MZVL22T0HBLB, IPS, 2560x1600, 16" | Razer Blade 16 Early 2023 i9-13950HX, GeForce RTX 4080 Laptop GPU, SSSTC CA6-8D1024, IPS, 2560x1600, 16" | Dell G16 7620 i7-12700H, GeForce RTX 3060 Laptop GPU, WDC PC SN810 512GB, IPS, 2560x1600, 16" | Alienware m17 R5 (R9 6900HX, RX 6850M XT) R9 6900HX, Radeon RX 6850M XT, SSSTC CA6-8D1024, IPS, 3840x2160, 17" | |
|---|---|---|---|---|---|---|
| Power Consumption | 5% | 21% | 12% | 30% | 33% | |
| Idle Minimum * (Watt) | 25.2 | 20 21% | 20 21% | 15.2 40% | 14.4 43% | 13 48% |
| Idle Average * (Watt) | 29.9 | 25 16% | 24 20% | 22.8 24% | 17.8 40% | 16.5 45% |
| Idle Maximum * (Watt) | 49.8 | 35 30% | 25 50% | 49.8 -0% | 31.5 37% | 17 66% |
| Load Average * (Watt) | 105.4 | 136 -29% | 107 -2% | 121.2 -15% | 101.2 4% | 93 12% |
| Witcher 3 ultra * (Watt) | 263 | 282 -7% | 208 21% | 242 8% | 176.9 33% | 239 9% |
| Load Maximum * (Watt) | 313.8 | 320 -2% | 267 15% | 273.7 13% | 242.9 23% | 251 20% |
* ... mindre är bättre
Power Consumption Witcher 3 / Stresstest
Power Consumption external Monitor
Batteritid
Vi kan bara klocka in 2,5 timmars drifttid under vårt WLAN-surfningstest, även med ACC inställt på batteriläge och systemet i iGPU Optimus-läge. Upprepade tester skulle resultera i liknande siffror. Vi förväntar oss inte långa drifttider från bärbara speldatorer, men detta är fortfarande mycket kortare jämfört med konkurrerande plattformar. Dell hävdar en surftid på över 7 timmar, vilket vi bara kan uppnå när vi kör på tomgång på skrivbordet med den lägsta ljusstyrkan. Resultaten är ovanliga eftersom vårAlienware x17 skulle vara dubbelt så länge som vår Alienware x16 när den var under samma WLAN-test.
Laddning från tom till full tar cirka två timmar med den medföljande nätadaptern. Systemet kan även laddas via USB-C-adaptrar, inklusive de 130 W-adaptrar som medföljer XPS-modellerna.
| Alienware x16 R1 i9-13900HK, GeForce RTX 4080 Laptop GPU, 90 Wh | Asus ROG Zephyrus M16 GU604VY-NM042X i9-13900H, GeForce RTX 4090 Laptop GPU, 90 Wh | Razer Blade 16 Early 2023 i9-13950HX, GeForce RTX 4080 Laptop GPU, 95.2 Wh | Dell G16 7620 i7-12700H, GeForce RTX 3060 Laptop GPU, 84 Wh | Alienware m17 R5 (R9 6900HX, RX 6850M XT) R9 6900HX, Radeon RX 6850M XT, 97 Wh | Lenovo Legion Pro 7 16IRX8H i9-13900HX, GeForce RTX 4080 Laptop GPU, 99.9 Wh | |
|---|---|---|---|---|---|---|
| Batteridrifttid | 193% | 89% | 32% | 125% | 97% | |
| Reader / Idle (h) | 7.3 | 8.9 22% | 7.1 -3% | 6.4 -12% | ||
| WiFi v1.3 (h) | 2.5 | 4.3 72% | 6.1 144% | 5 100% | 4.8 92% | 5.1 104% |
| Load (h) | 0.7 | 2.9 314% | 1.4 100% | 0.7 0% | 1.8 157% | 2.1 200% |
| H.264 (h) | 4.8 | 4.9 |
För
Emot
Omdöme - Lyckas jaga både tunnhet och grafik
Det är allmänt känt att en bärbar dators prestanda är omvänt proportionell mot hur tunn den är. Alienware x16 utmanar detta genom att vara en av de tunnaste i sin storlekskategori samtidigt som den överträffar stora konkurrenter som Razer Blade 16, Asus ROG Strix G16eller HP Omen 17 när det gäller grafikprestanda. Det är imponerande att modellen kan klämma in en 175 W GeForce RTX GPU med tanke på den ultratunna profilen.
Om du vill maximera GPU-prestandan samtidigt som du minimerar tunnheten, bör Alienware x16 vara nära toppen av din lista.
Det finns dock flera nackdelar, varav några är unika för Alienware x16. För det första, bara för att det är supertunt betyder det inte att det är superlitet eller lättviktigt eftersom systemet är mycket stort när det gäller längd och bredd för att kompensera för den tunnare Z-höjden. För det andra kan avsaknaden av portar längs sidorna göra det lite krångligt att ansluta bildskärmar eller tillbehör varje gång. Och slutligen, den Core i9-13900HK erbjuder bara marginella förbättringar jämfört med den senaste generationenCore i9-12900H eftersom den inte är i närheten av lika kraftfull somCore i9-13900HX som är tillgänglig på den tjockare Alienware m16 och inte Alienware x16. För att maximera GPU-kraften var det sannolikt nödvändigt att göra avkall på fotavtryck, portpositionering och CPU-prestanda.
Pris och tillgänglighet
Dell levererar nu Alienware x16 till konsumenter från $ 2200 för baskonfigurationen till $ 3350 USD för vår testade konfiguration.
Alienware x16 R1
- 06/22/2023 v7 (old)
Allen Ngo
Genomskinlighet
Valet av enheter som ska granskas görs av vår redaktion. Testprovet gavs till författaren som ett lån av tillverkaren eller återförsäljaren för denna recension. Långivaren hade inget inflytande på denna recension och inte heller fick tillverkaren en kopia av denna recension innan publiceringen. Det fanns ingen skyldighet att publicera denna recension. Som ett oberoende medieföretag är Notebookcheck inte föremål för auktoritet från tillverkare, återförsäljare eller förlag.
This is how Notebookcheck is testingEvery year, Notebookcheck independently reviews hundreds of laptops and smartphones using standardized procedures to ensure that all results are comparable. We have continuously developed our test methods for around 20 years and set industry standards in the process. In our test labs, high-quality measuring equipment is utilized by experienced technicians and editors. These tests involve a multi-stage validation process. Our complex rating system is based on hundreds of well-founded measurements and benchmarks, which maintains objectivity.
Price comparison

