Test av Dell Inspiron 16 Plus 7630 bärbar dator: 60 W GeForce RTX 4060 är inte så illa

Dell Inspiron 16 Plus 7630 2023 efterträder förra årets 2022 Inspiron 16 Plus 7620 med uppdaterade interna och externa delar trots att 2022-modellen redan var en fullständig redesign av 2021 Inspiron 16 Plus 7610. Det är ovanligt att se en serie genomgå tre stora redesigner tre år i rad eftersom tillverkarna vanligtvis bara reviderar exteriören en gång vartannat år. Precis som andra bärbara multimediadatorer från 2023 har Inspiron 16 Plus 7630 Intel 13:e generationens Raptor Lake-H-processorer och Nvidia Ada Lovelace GPU:er.
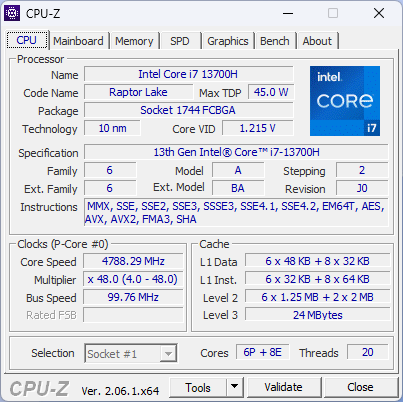
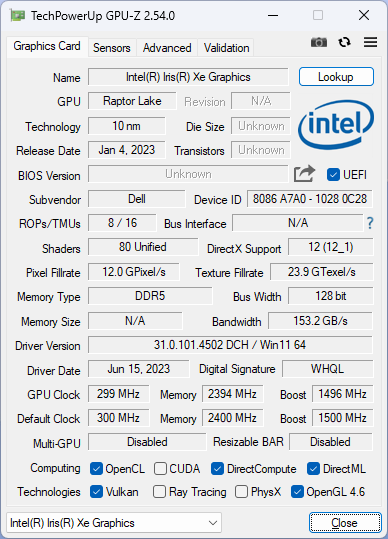
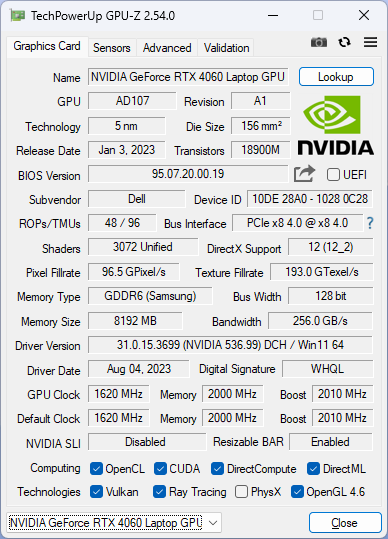
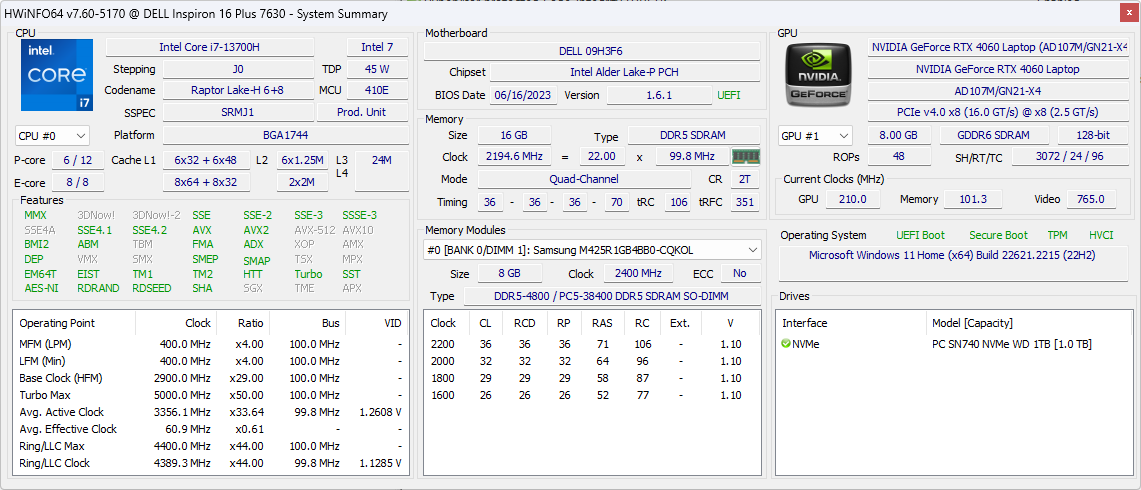
Vår granskningsenhet är en avancerad konfiguration med Core i7-13700H-processor, GeForce RTX 4060 GPU och 2560 x 1600 120 Hz IPS-skärm för cirka 1250 USD. Mindre SKU:er med Core i5-13500H, integrerad iris Xe, RTX 3050, RTX 4050 eller 1200p 60 Hz-skärm är på gång. AMD-varianter med Ryzen 5 7640HS och Ryzen 7 7840HS planeras också under modellnamnet Inspiron 16 Plus 7635.
Alternativ till Inspiron 16 Plus 7630 inkluderar andra 16-tums bärbara multimedia-datorer som Lenovo Slim Pro 9i 16, Asus VivoBook Pro 16X, HP Envy 16, eller MSI Summit E16 Flip. Inspiron 16 Plus 7630 ska inte förväxlas med den vanliga långsammare Inspiron 16 eller Inspiron 16 Plus 7630 2-in-1 som har mycket olika specifikationer och funktioner.
Fler recensioner av Dell:
Potentiella konkurrenter i jämförelse
Gradering | Datum | Modell | Vikt | Höjd | Storlek | Upplösning | Pris |
|---|---|---|---|---|---|---|---|
| 87.1 % v7 (old) | 08/2023 | Dell Inspiron 16 Plus 7630 i7-13700H, GeForce RTX 4060 Laptop GPU | 2.2 kg | 19.95 mm | 16.00" | 2560x1600 | |
| 87.4 % v7 (old) | 08/2022 | Dell Inspiron 16 Plus 7620 i7-12700H, GeForce RTX 3050 Ti Laptop GPU | 2.1 kg | 18.99 mm | 16.00" | 3072x1920 | |
| 88 % v7 (old) | 08/2023 | Lenovo Slim Pro 9i 16IRP8 i9-13905H, GeForce RTX 4050 Laptop GPU | 2.2 kg | 18.2 mm | 16.00" | 3200x2000 | |
| 86.2 % v7 (old) | 07/2023 | Asus Vivobook Pro 16X K6604JV-MX016W i9-13980HX, GeForce RTX 4060 Laptop GPU | 2.1 kg | 22.8 mm | 16.00" | 3200x2000 | |
| 86.9 % v7 (old) | 09/2022 | HP Envy 16 h0112nr i7-12700H, GeForce RTX 3060 Laptop GPU | 2.3 kg | 19.8 mm | 16.00" | 3840x2400 | |
| 84.2 % v7 (old) | 10/2022 | MSI Summit E16 Flip A12UDT-031 i7-1280P, GeForce RTX 3050 Ti Laptop GPU | 1.9 kg | 16.85 mm | 16.00" | 2560x1600 |
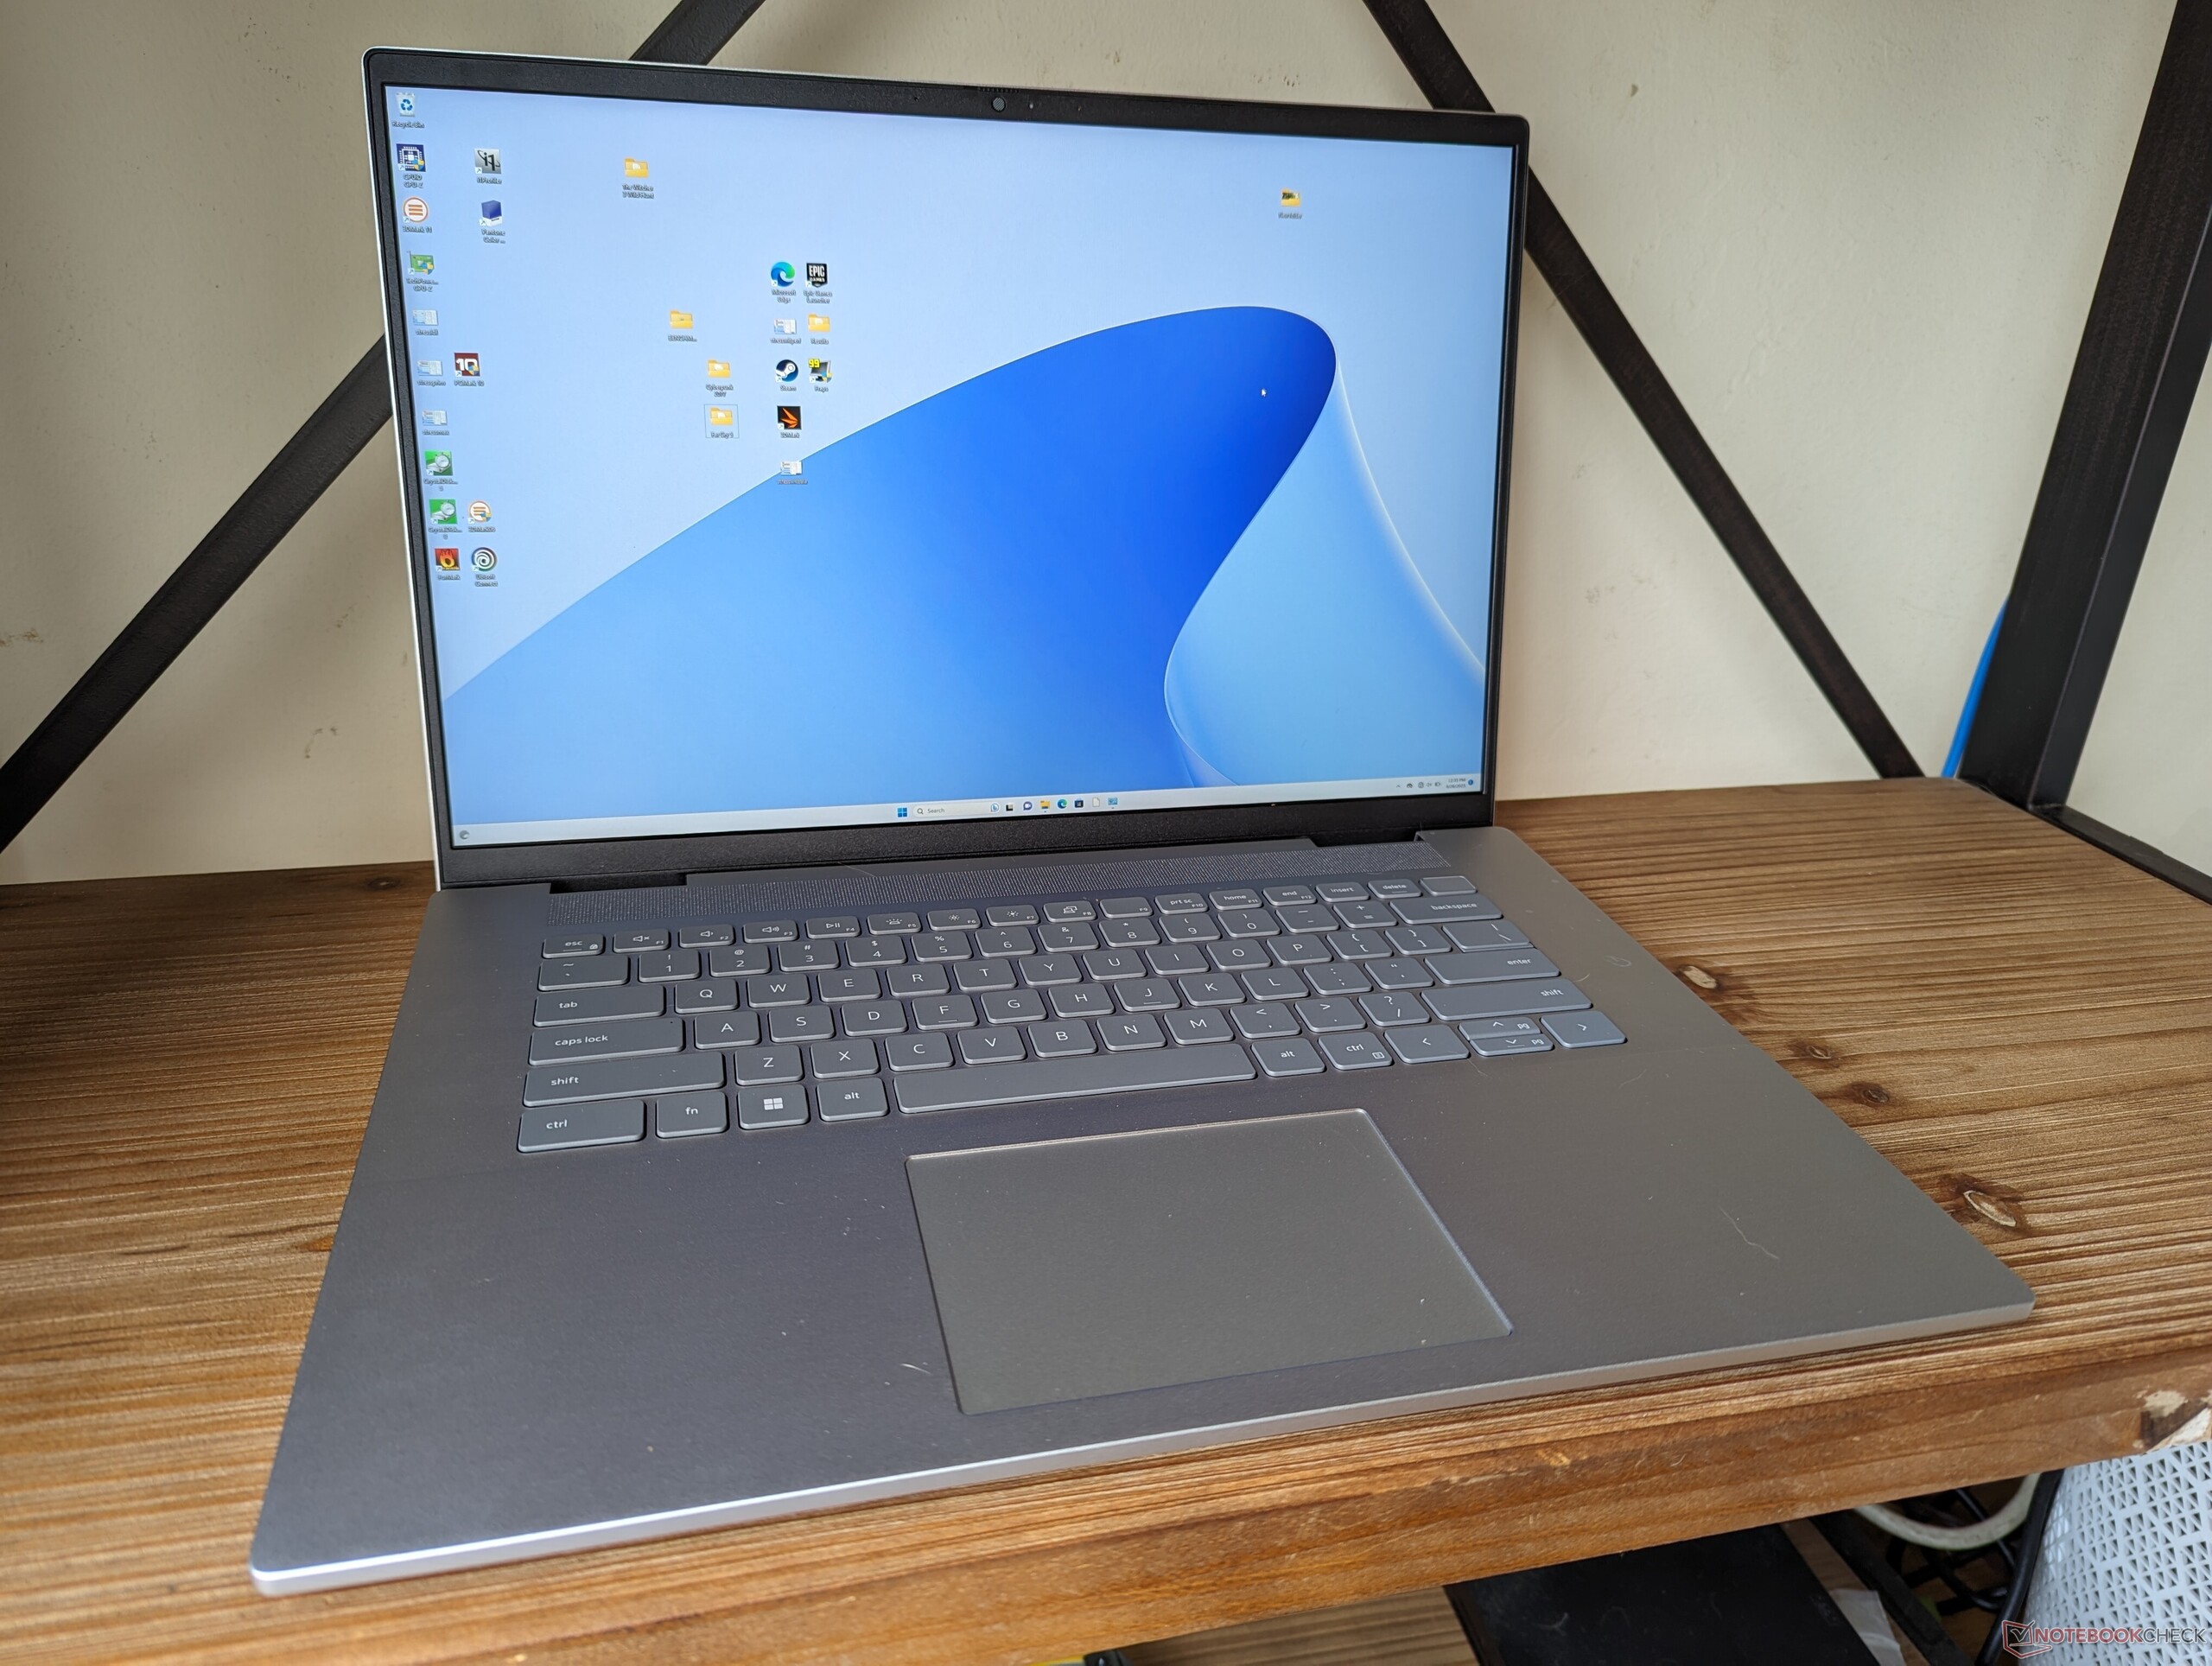
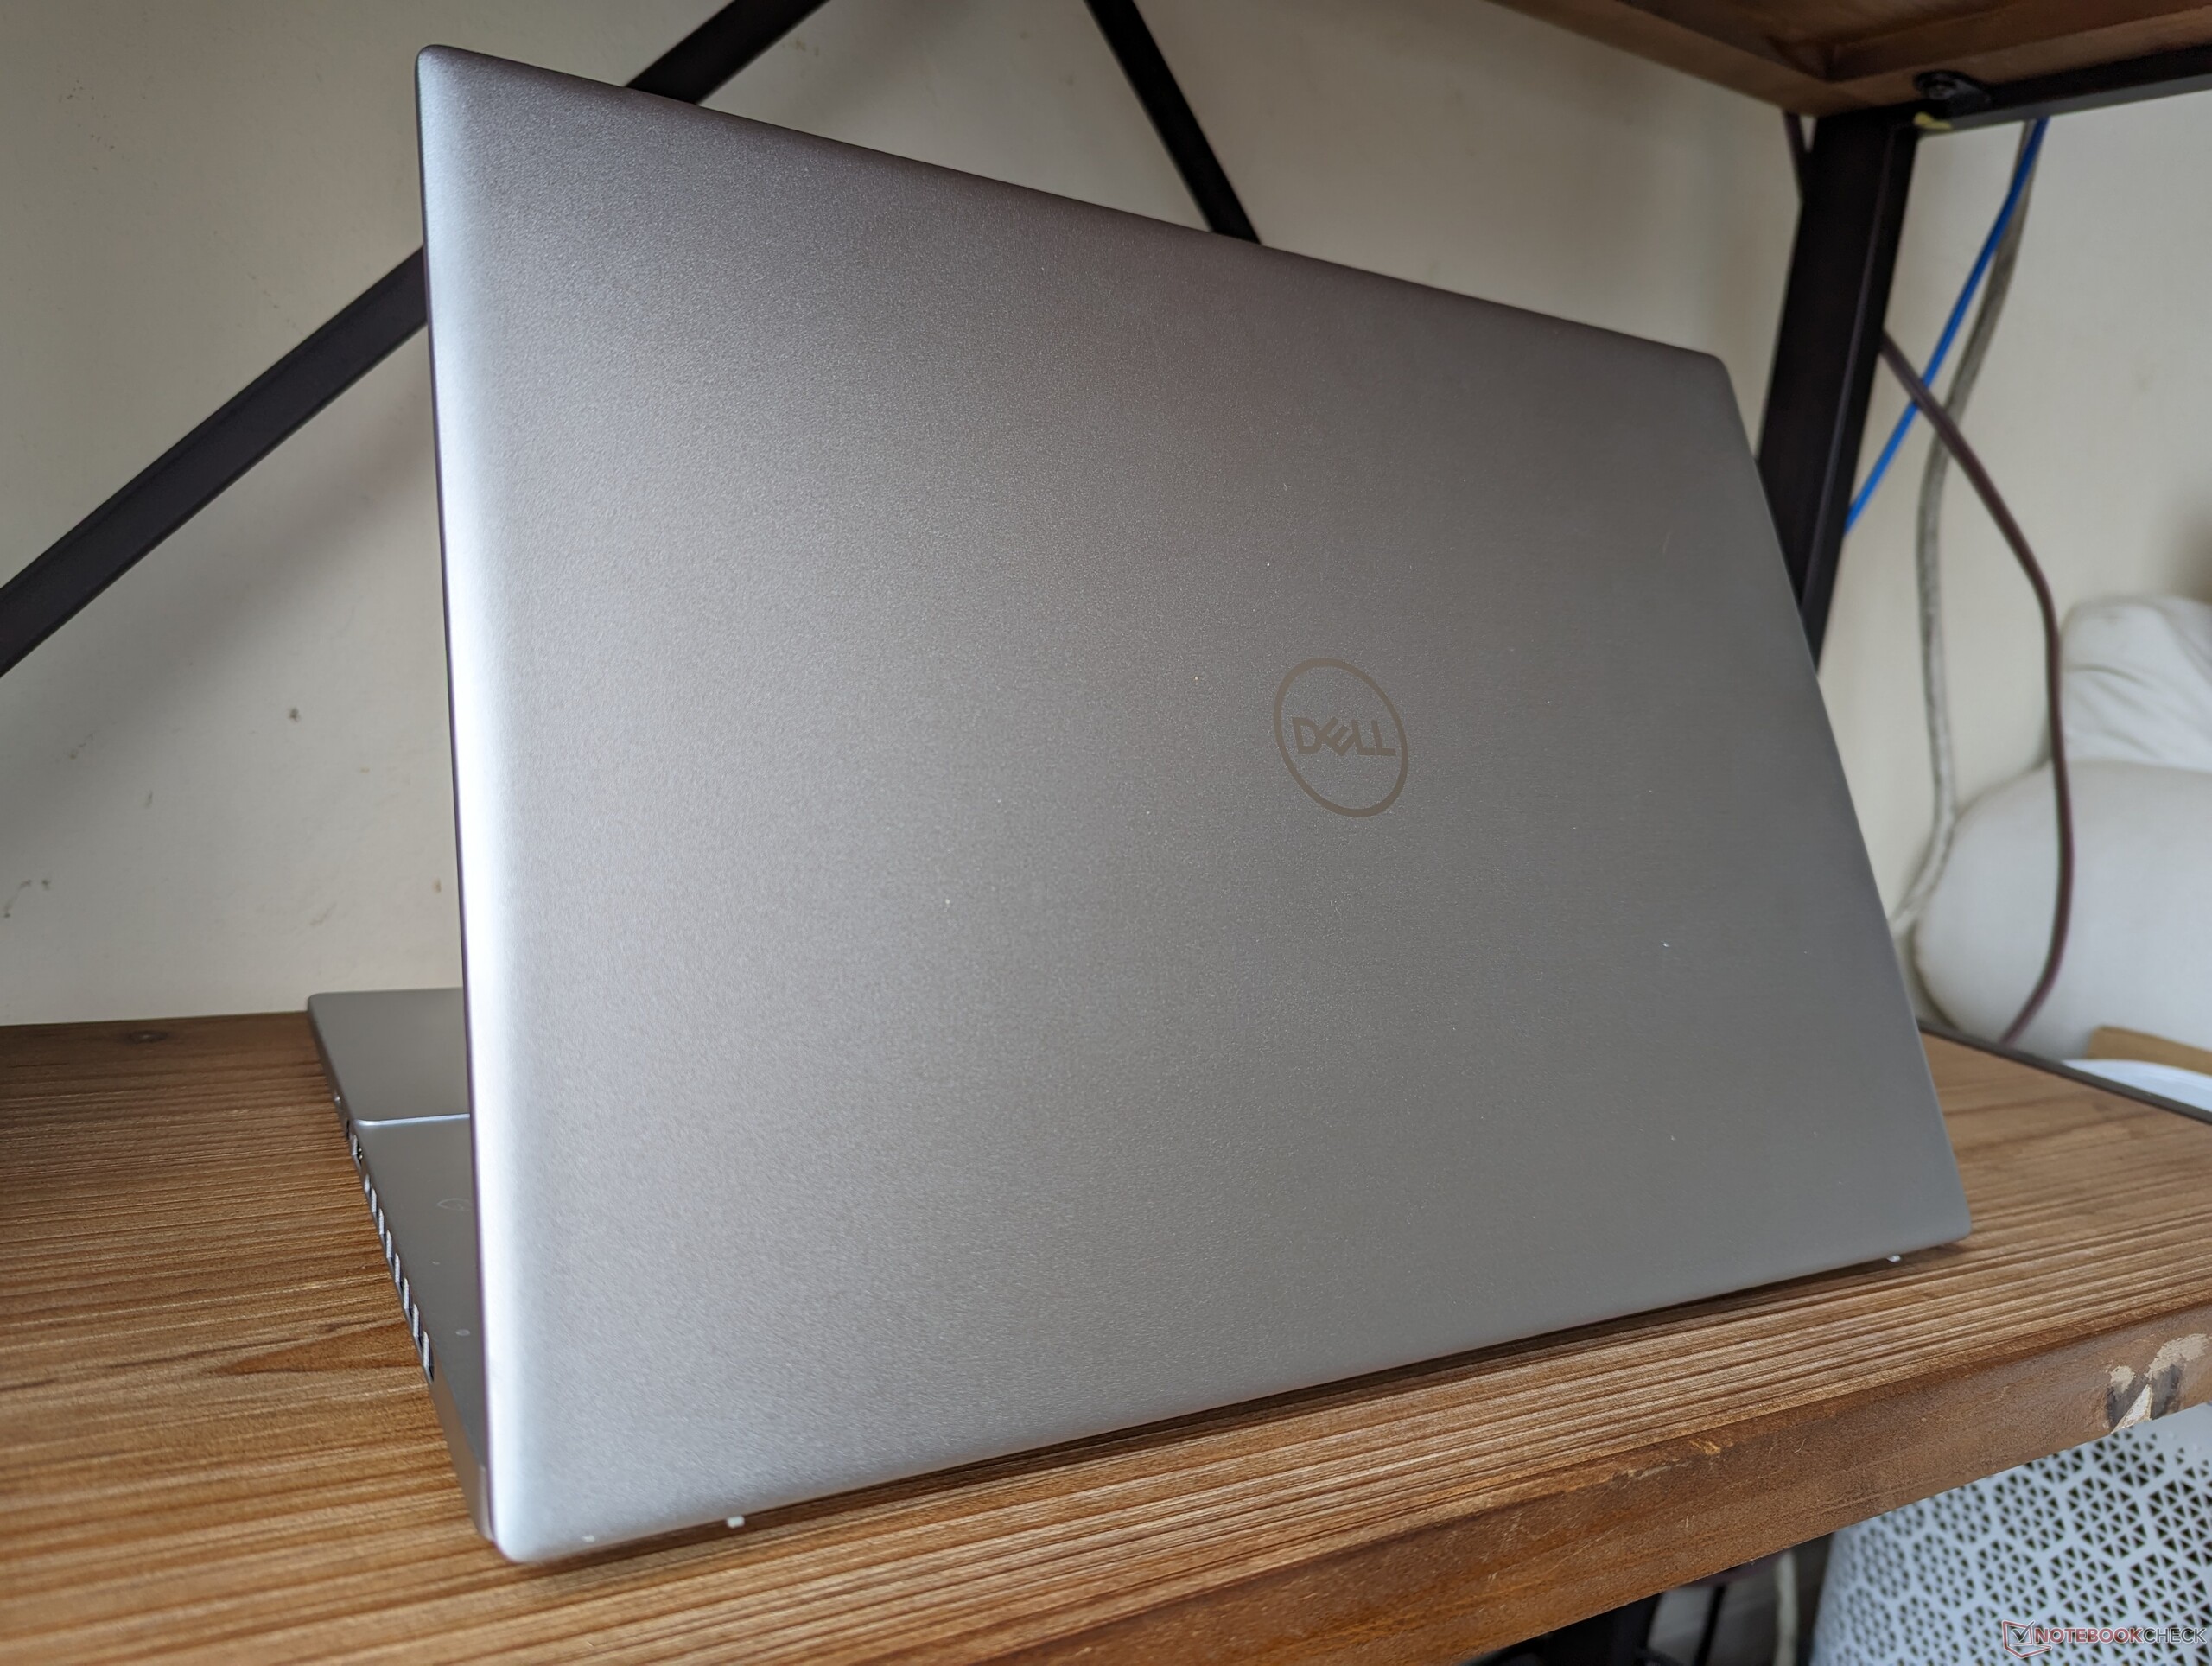
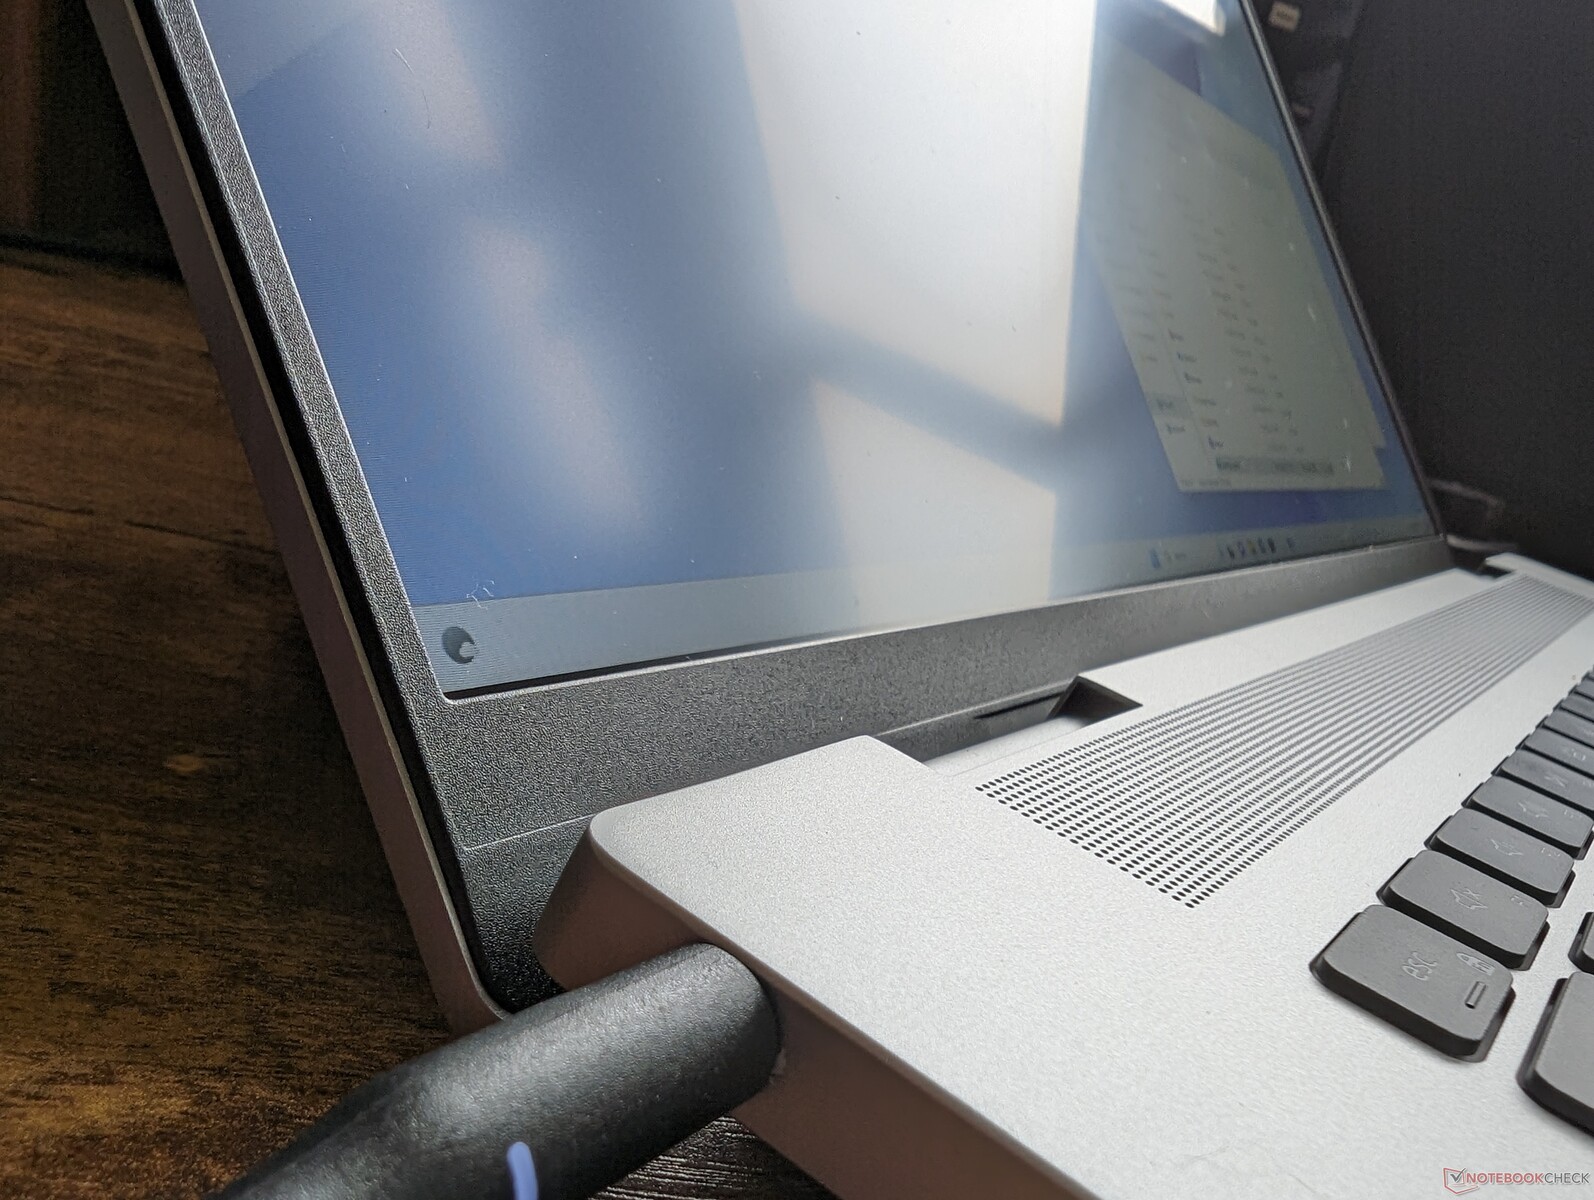
Case - Att hålla det enkelt
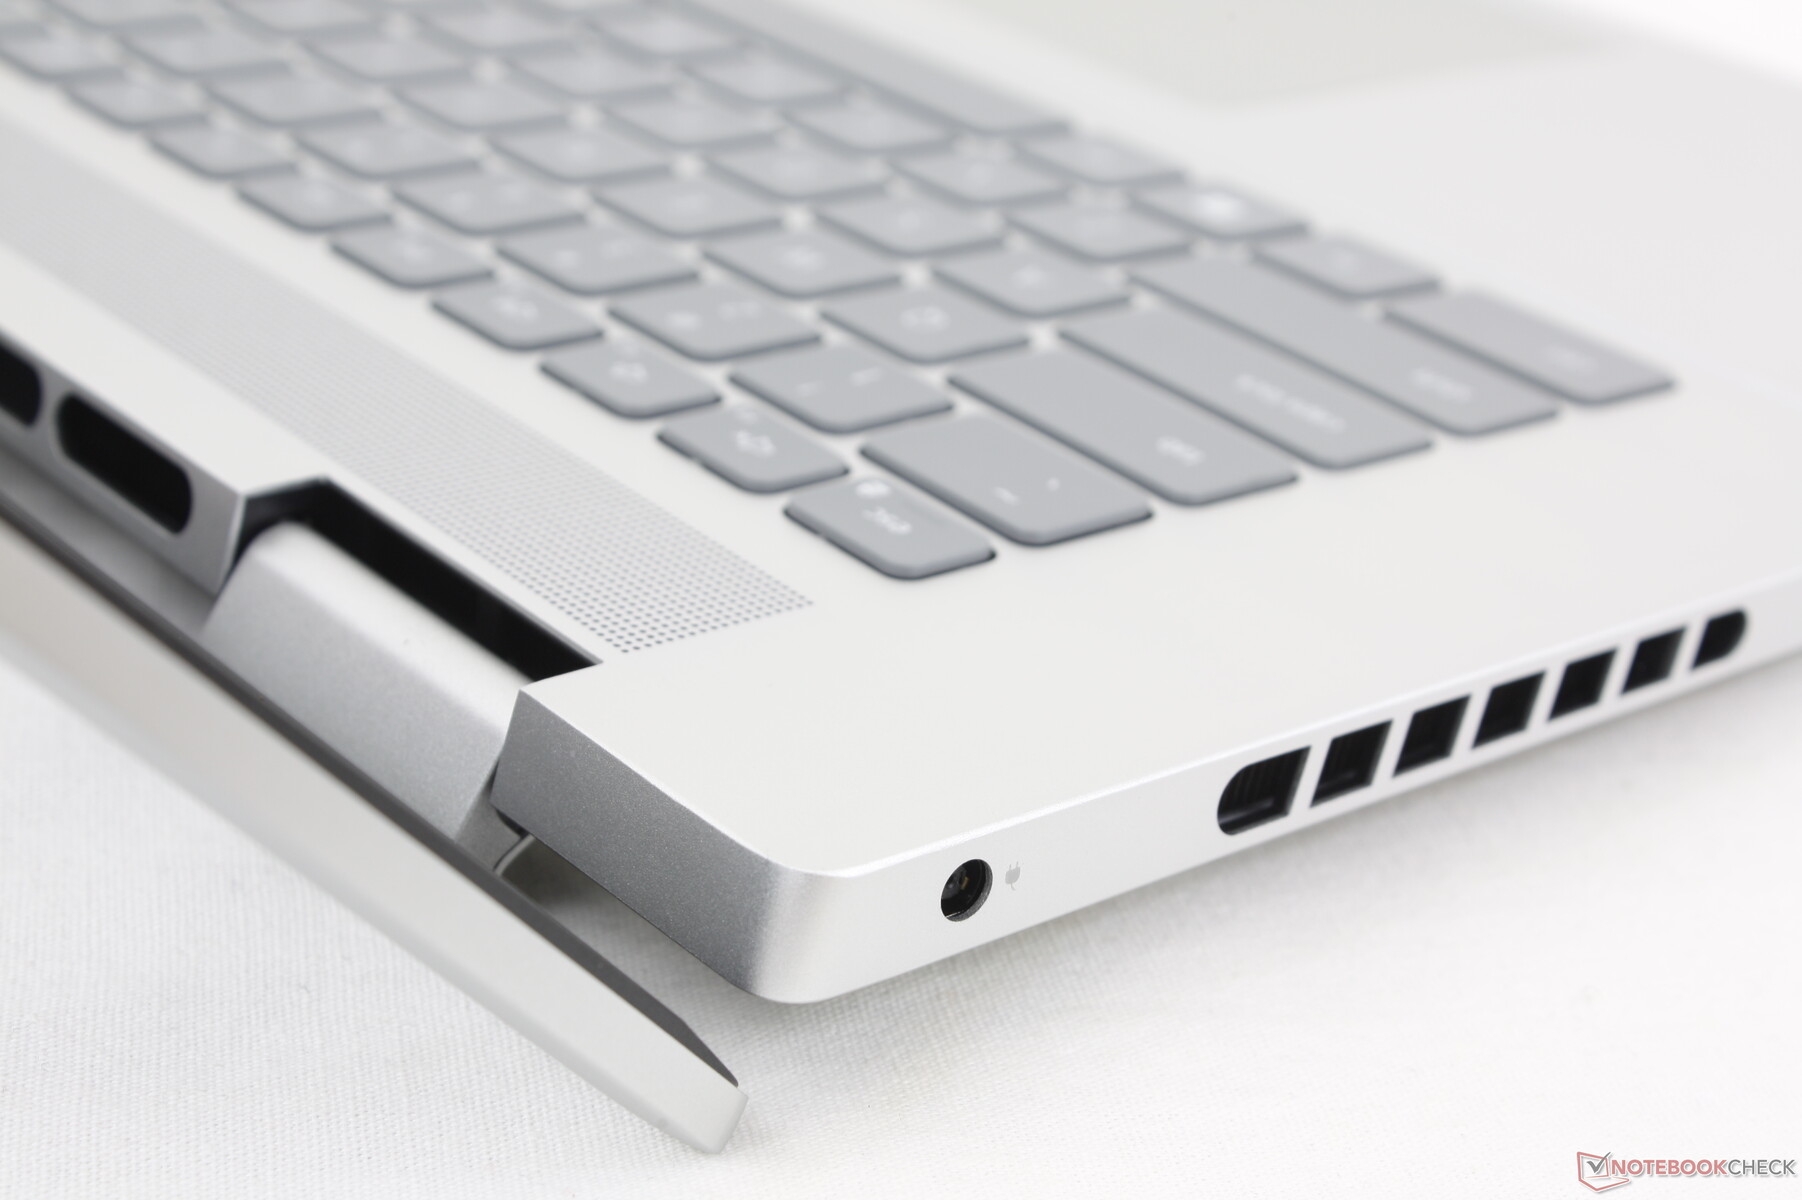
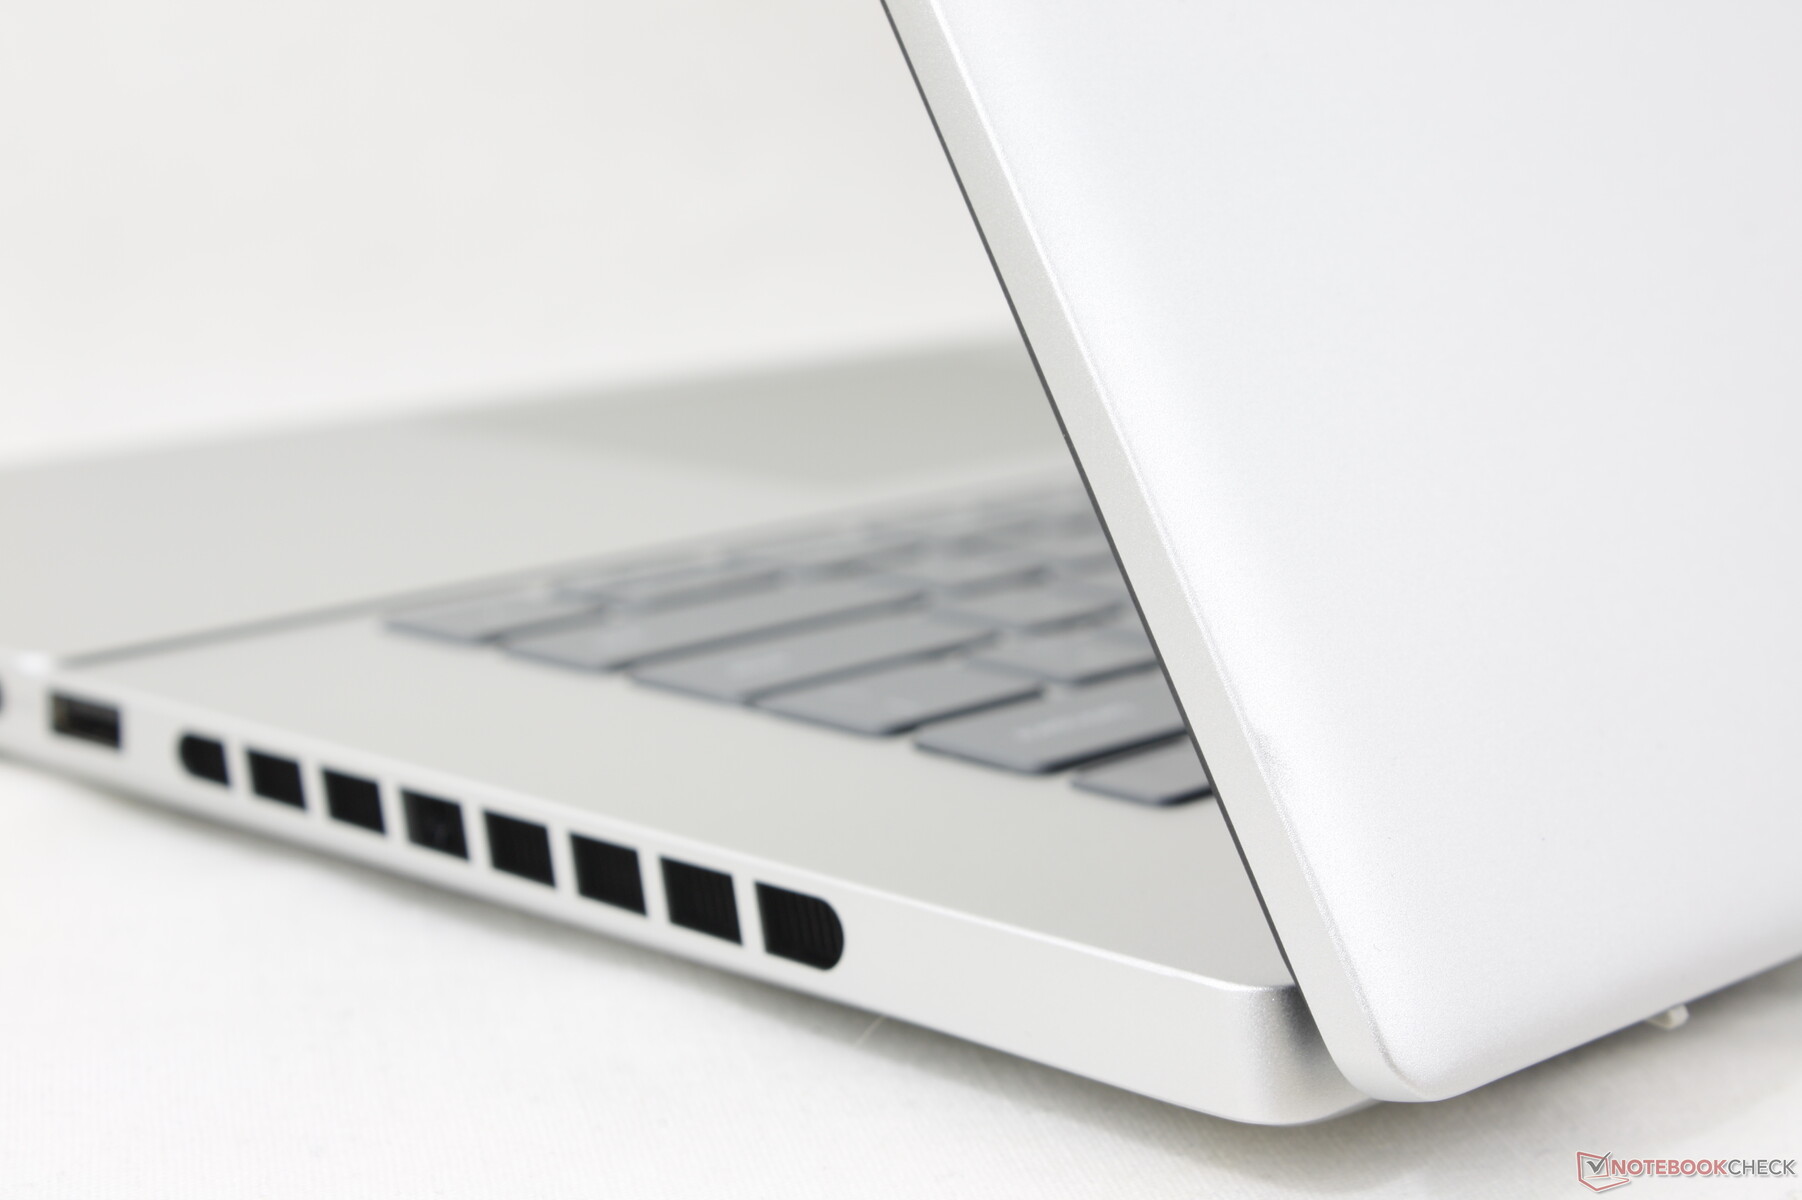
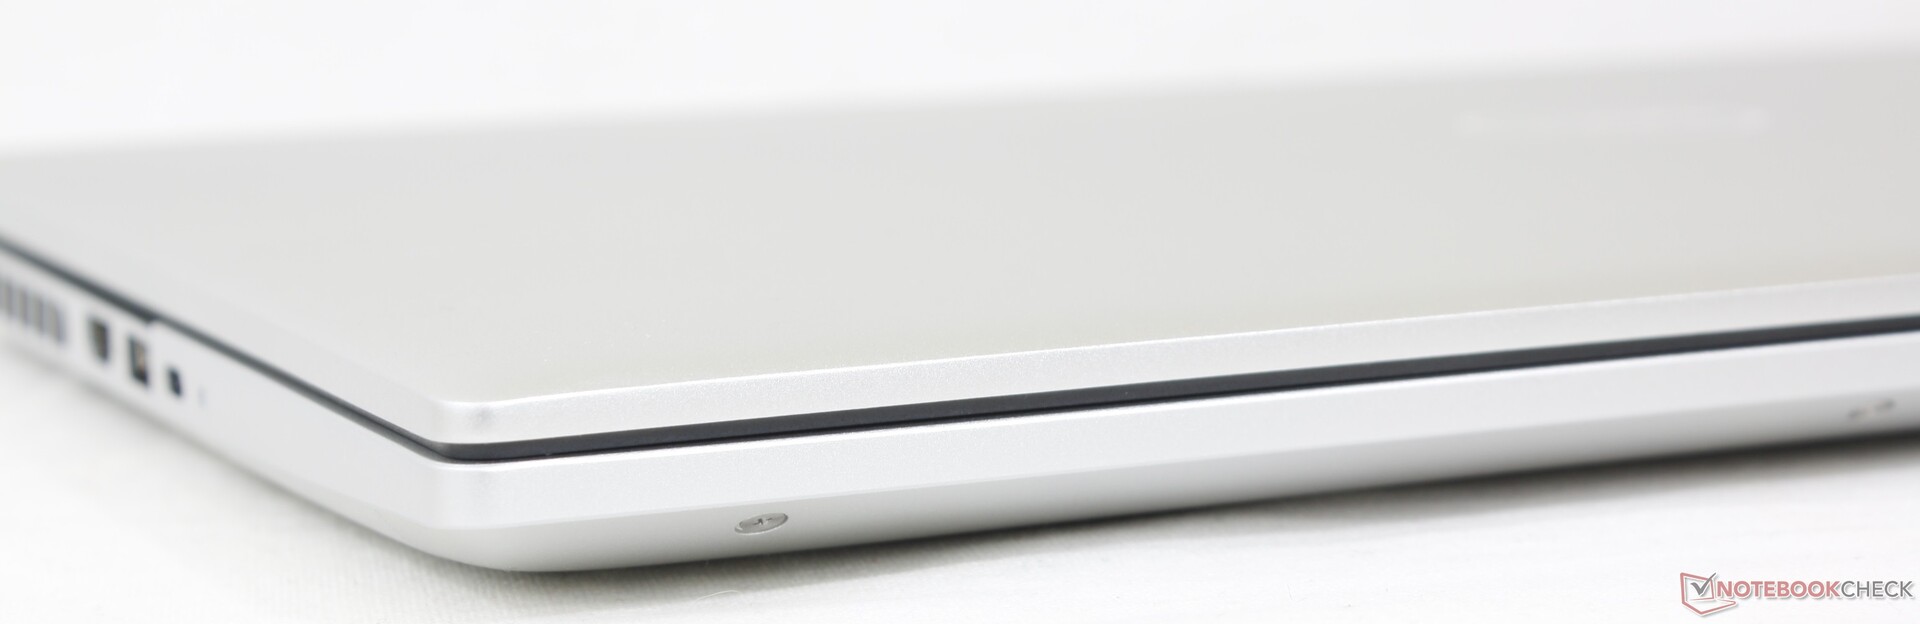
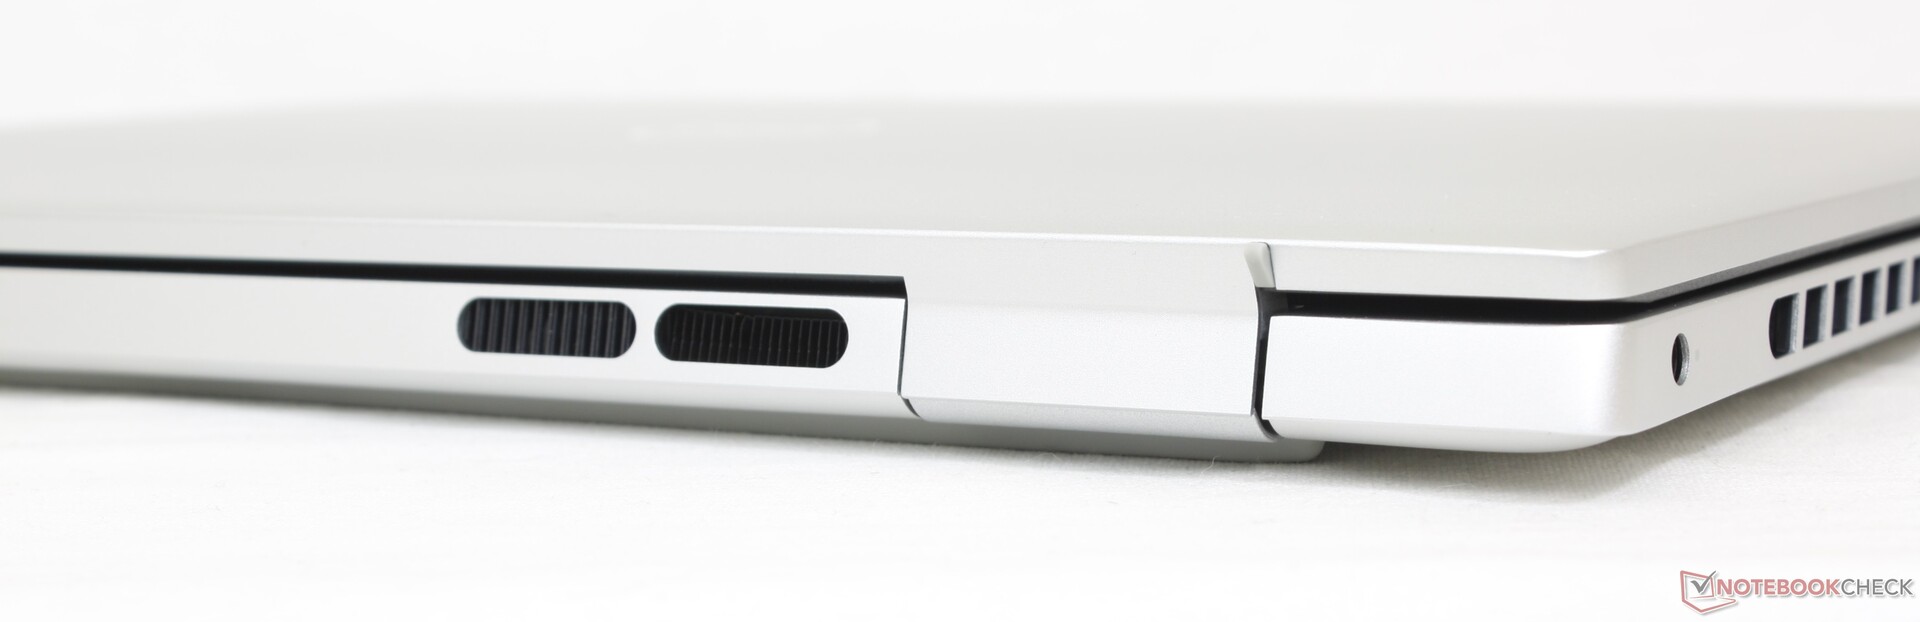
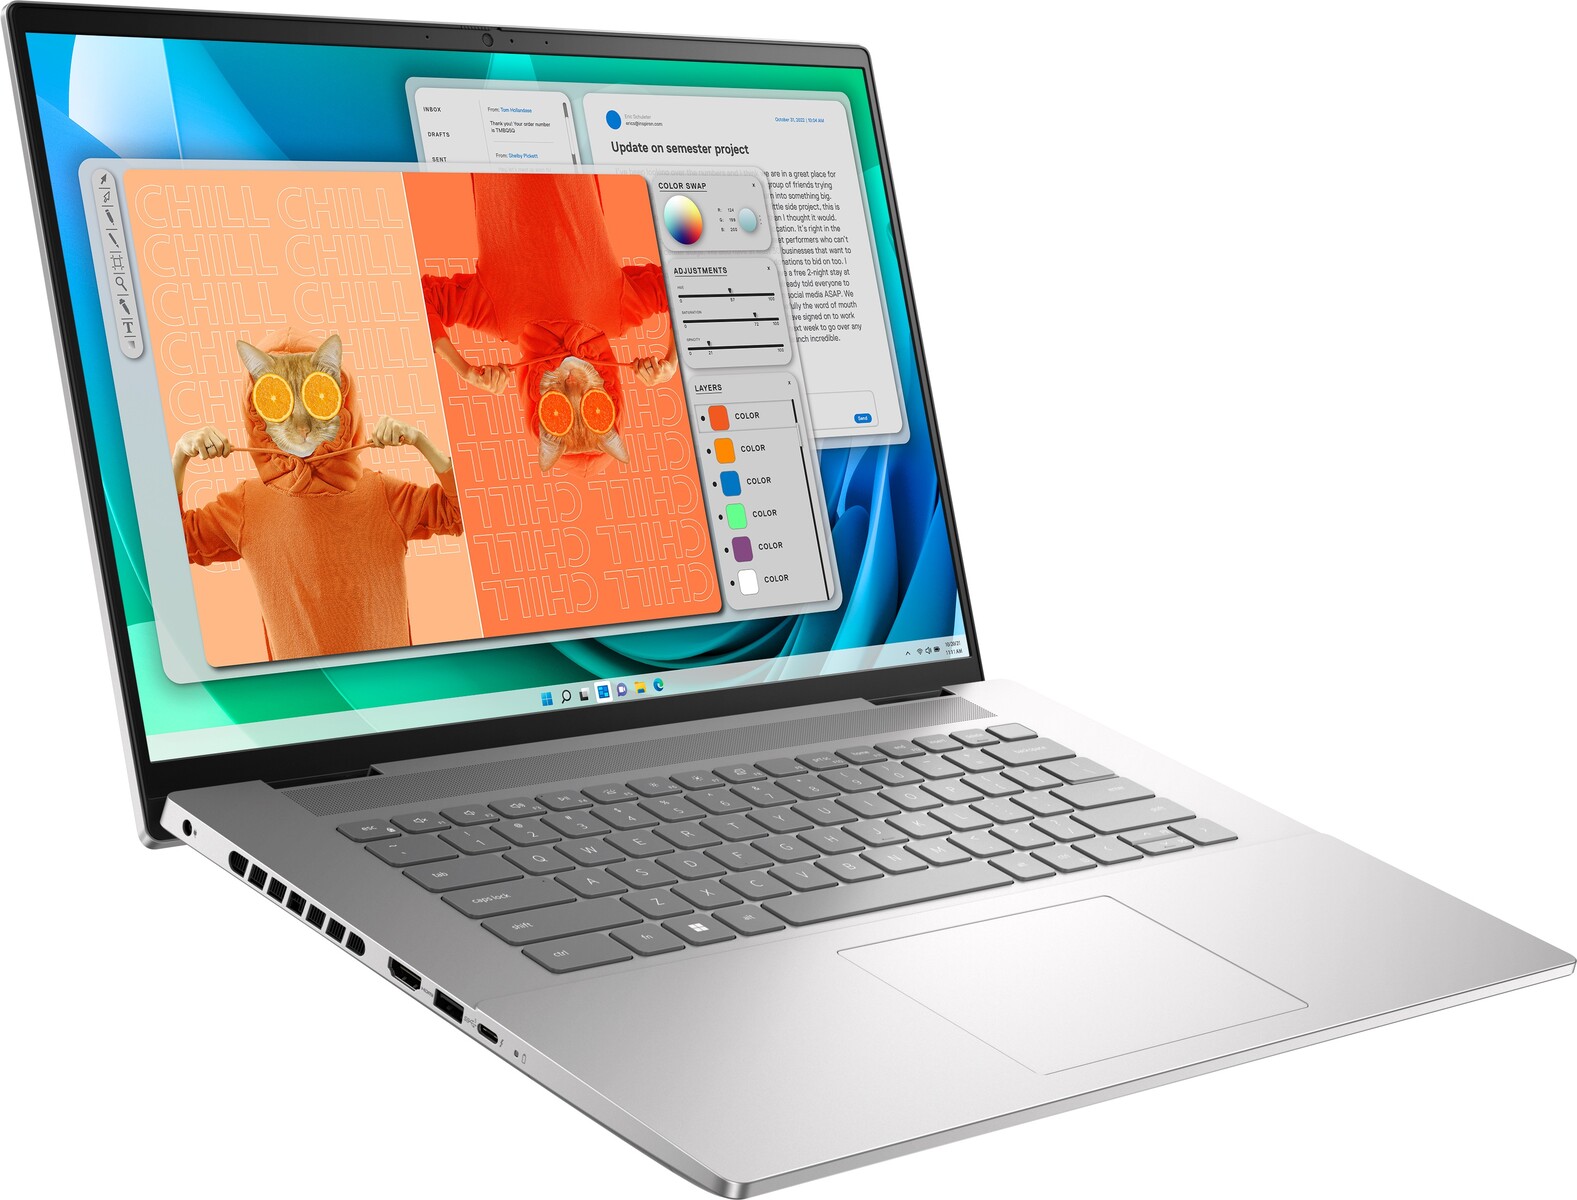
Inspiron 16 Plus 7630 har tre anmärkningsvärda exteriöra förändringar jämfört med förra årets modell. För det första, och kanske viktigast av allt, har gångjärnen fått en ny design och är nu tjockare och starkare än tidigare. För det andra finns det nu ytterligare ventilationsgaller längs kanterna för att underlätta kylningen. Och slutligen har handflatestöden och klickplattan i Mylar tagits bort, precis som på Inspiron 16 Plus 7635 2-i-1. De två första åtgärderna kommer förhoppningsvis att öka systemets livslängd, medan den sista åtgärden sannolikt är en kostnadsbesparande åtgärd.
Chassits totala styvhet är annars ungefär densamma som Inspiron 16 Plus 7620 eftersom deras skelett är tillverkade av samma material. Enheten känns stark i handen på samma sätt som Envy 16men med ett något svagare lock eftersom Dell saknar Gorilla Glass-förstärkning.
Mått och vikt är ungefär desamma som för förra årets modell, om än något tyngre med ca 100 g. Dell är inte precis någon lättviktsmodell, men den är ändå jämförbar med alternativ som Slim Pro 9i 16 eller Envy 16 i detta avseende.
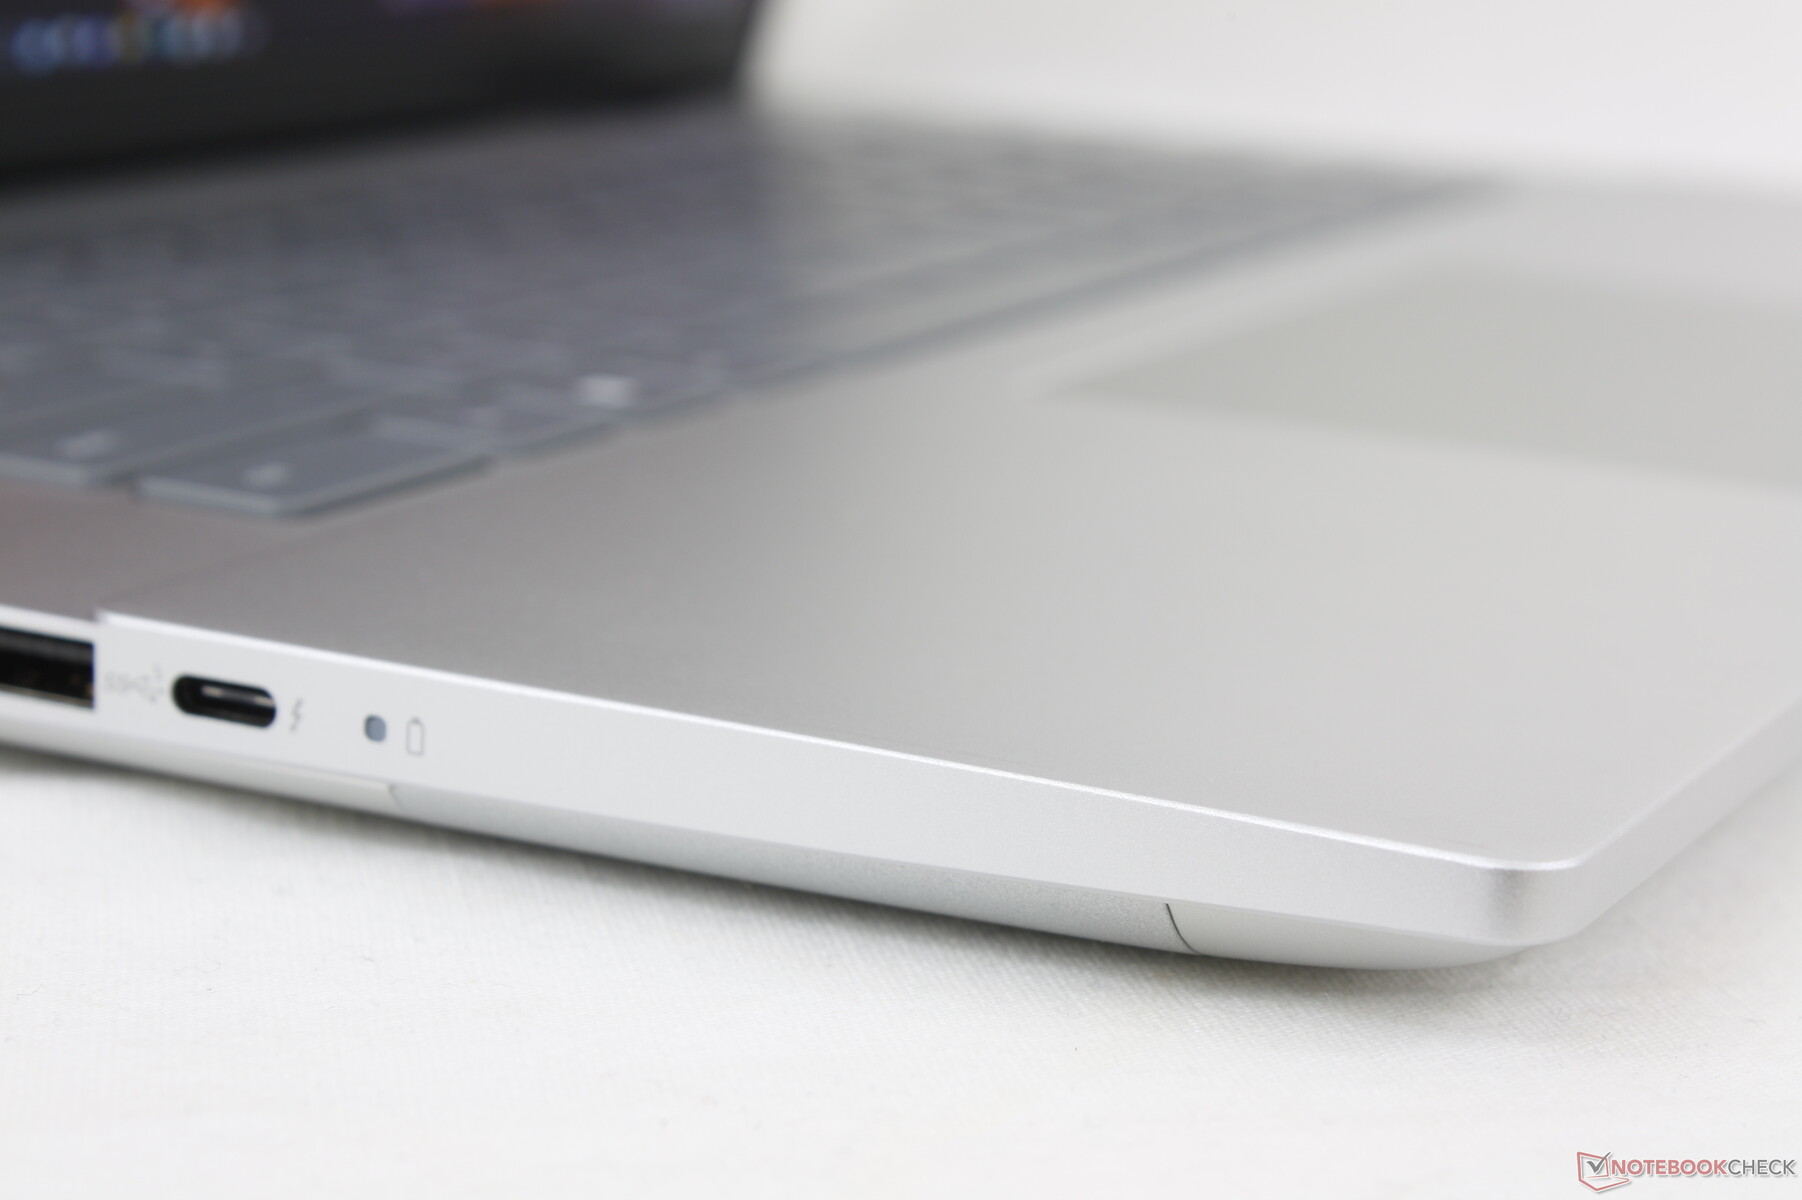
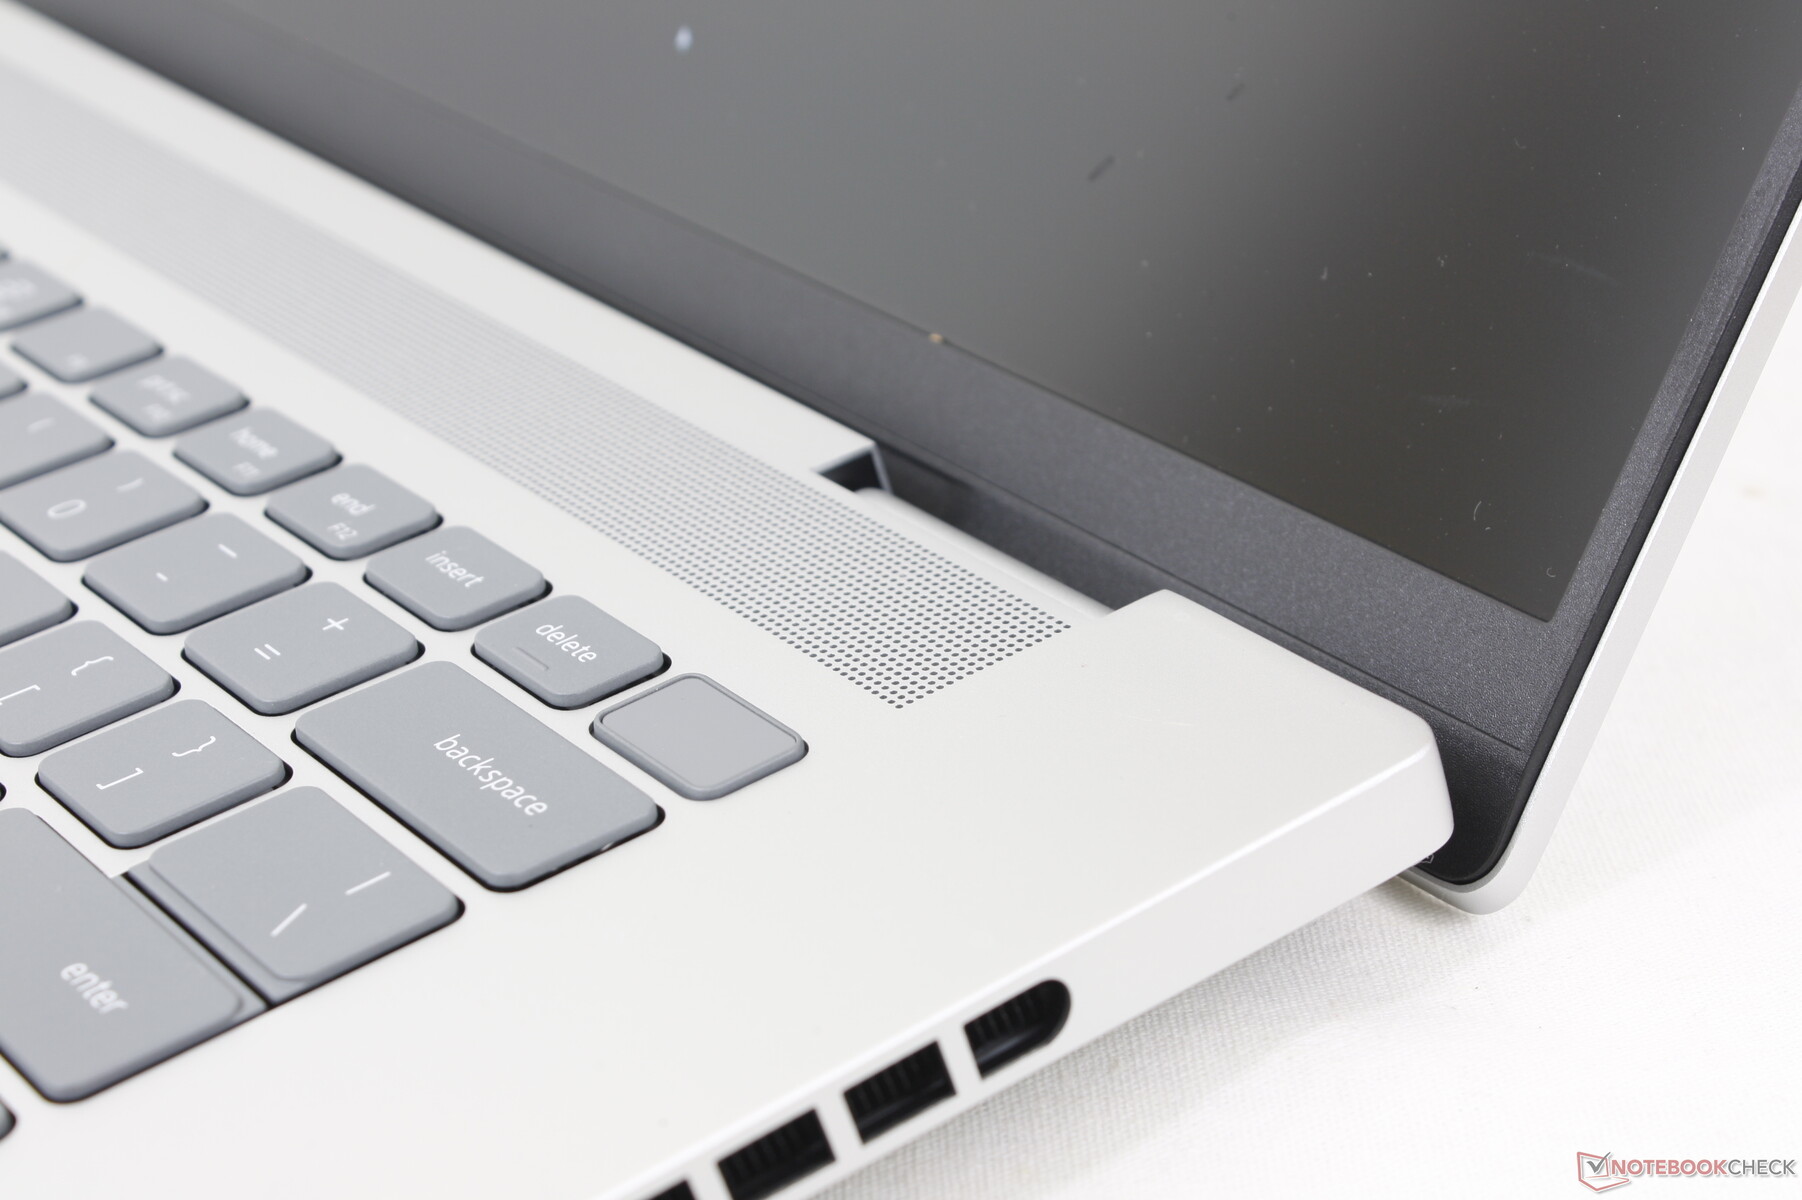
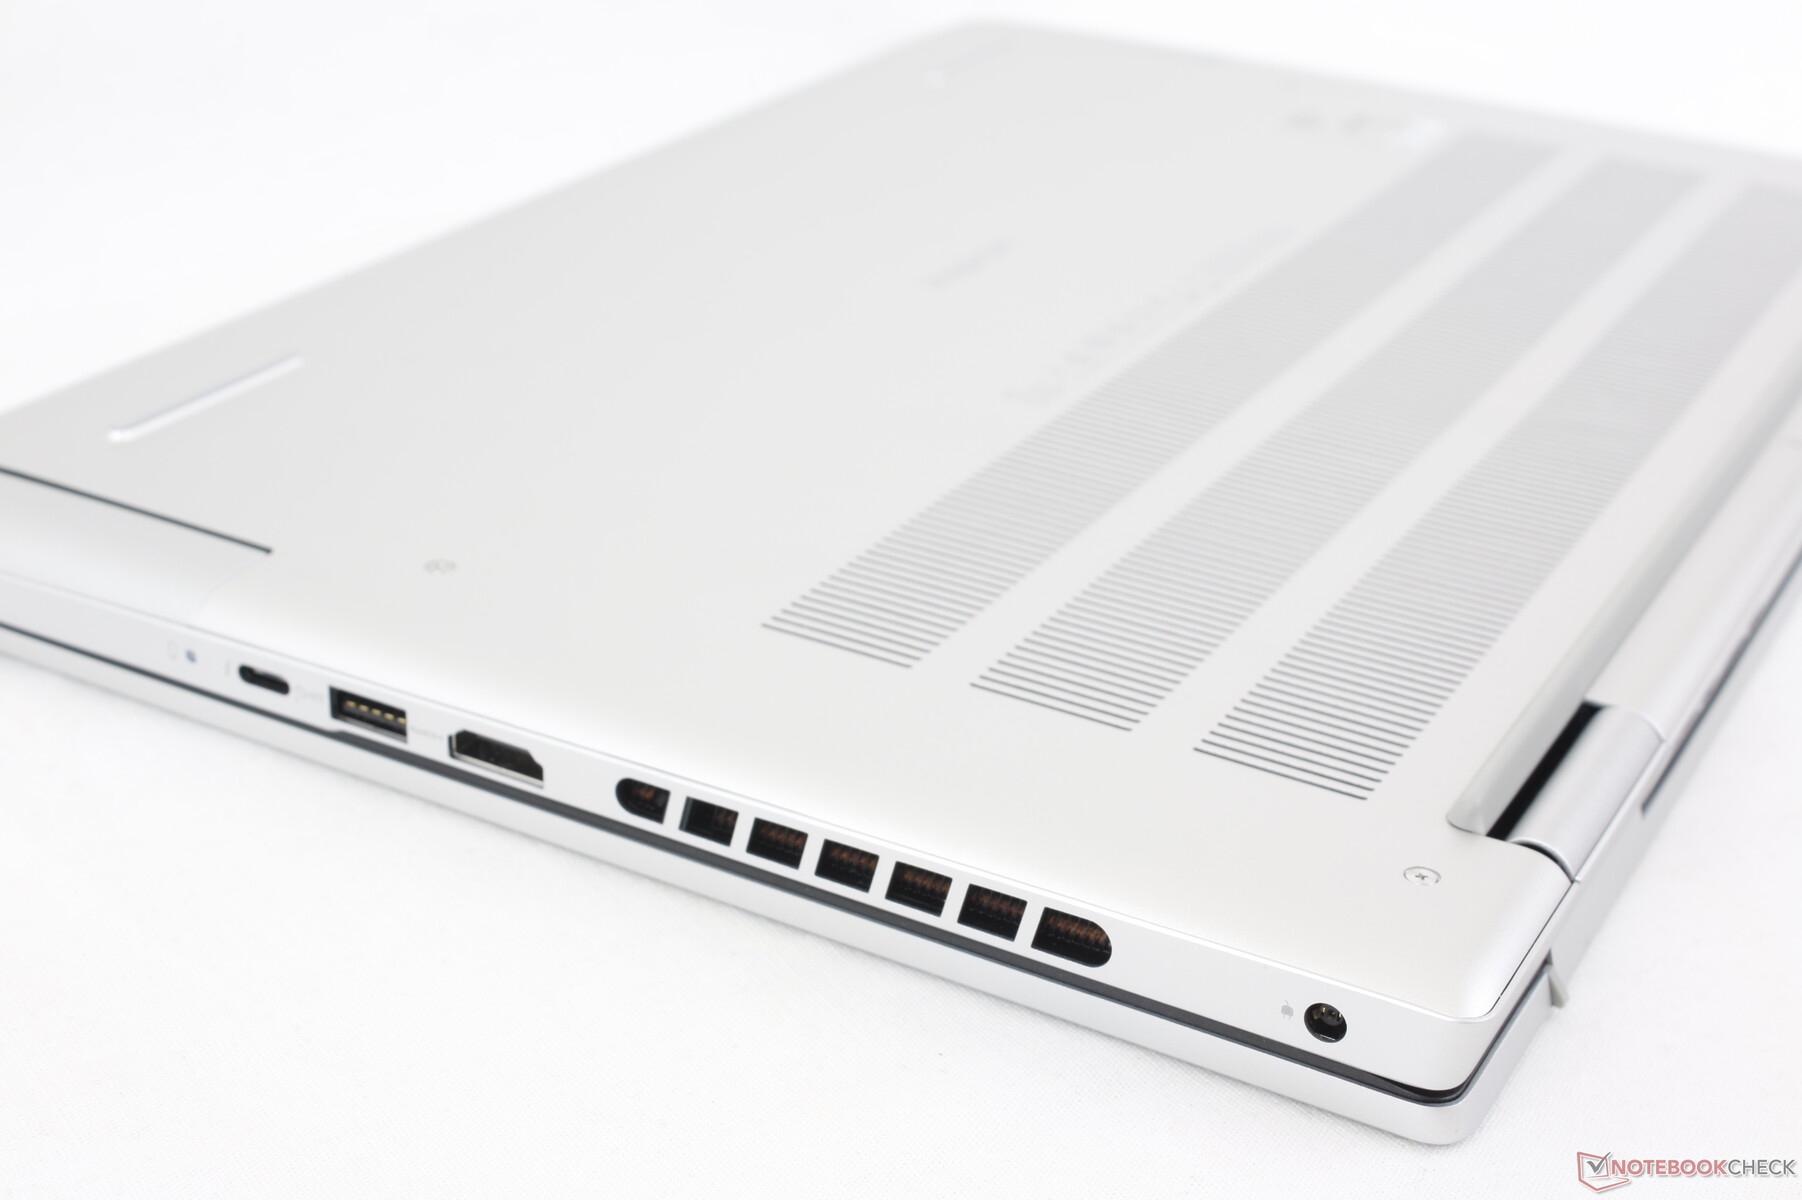
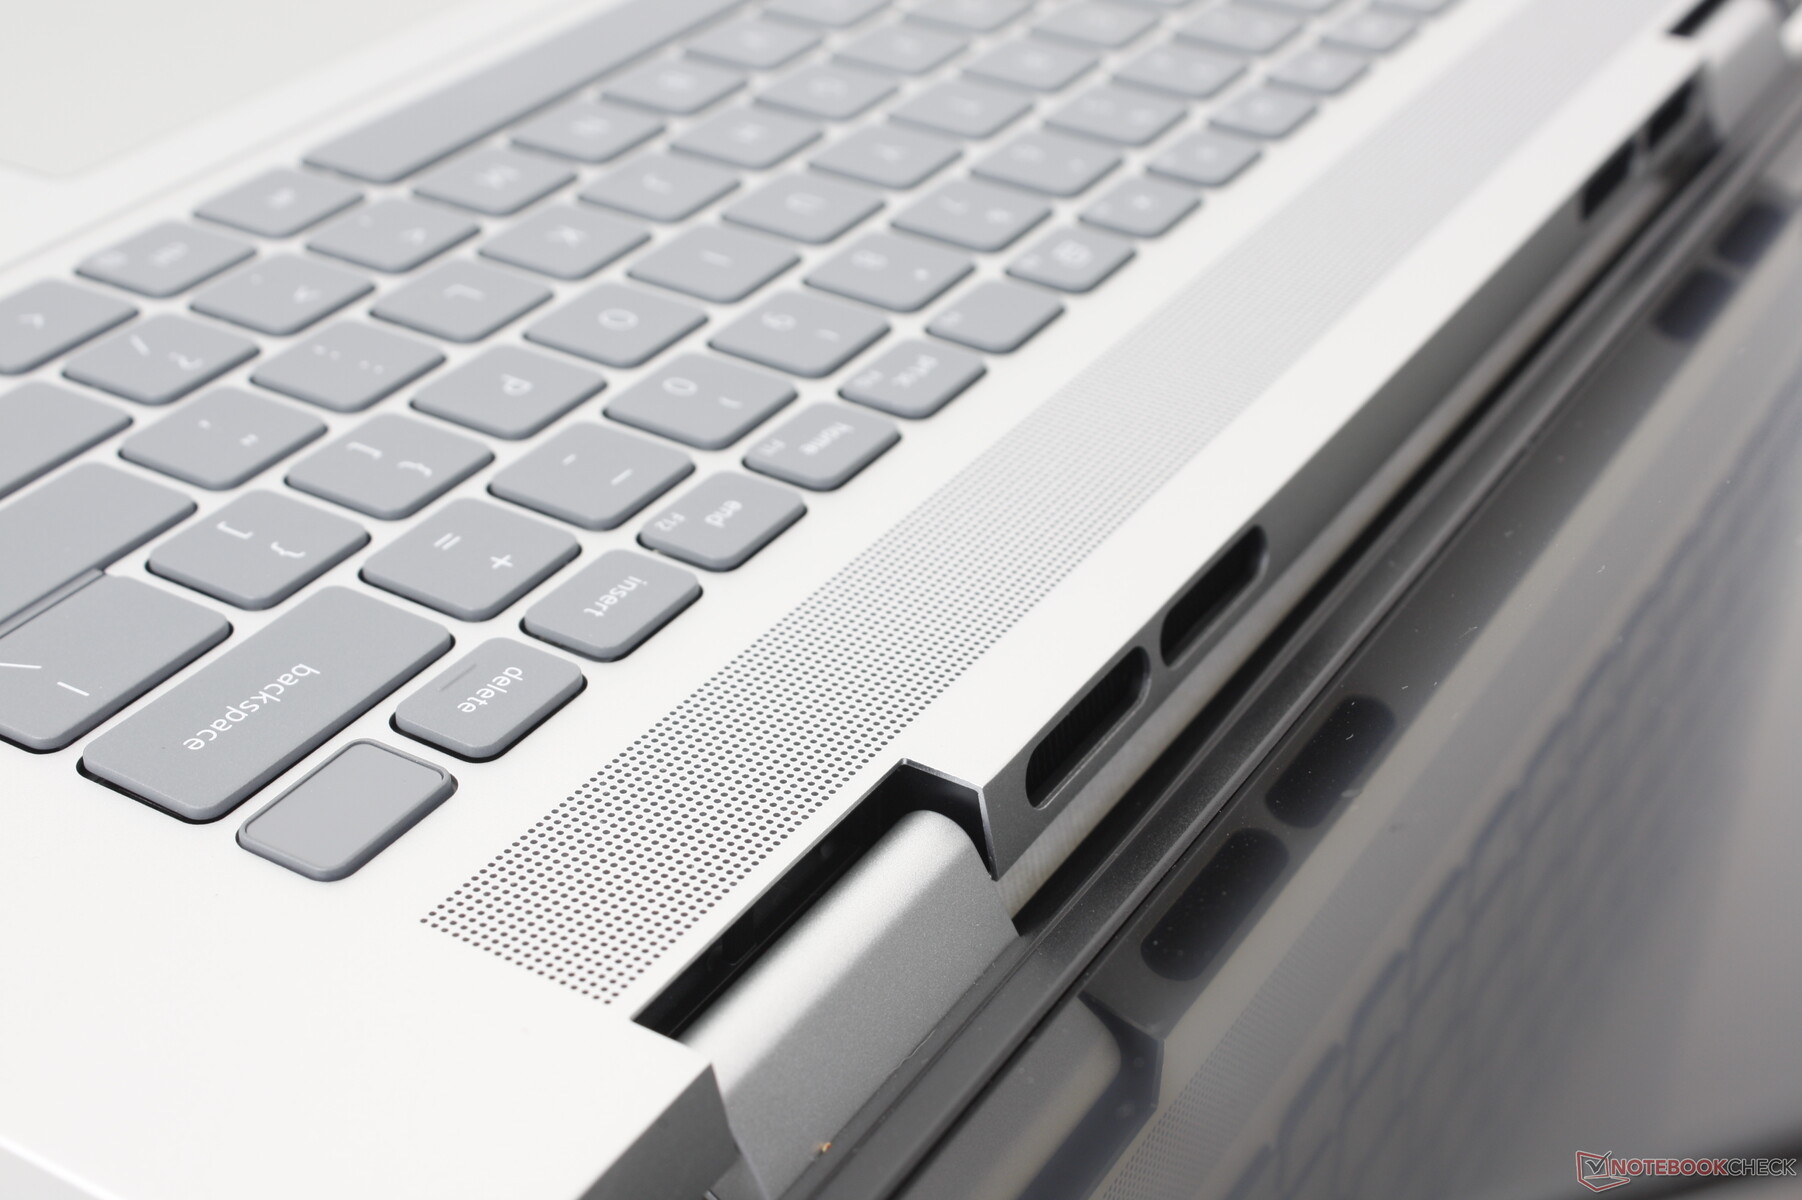
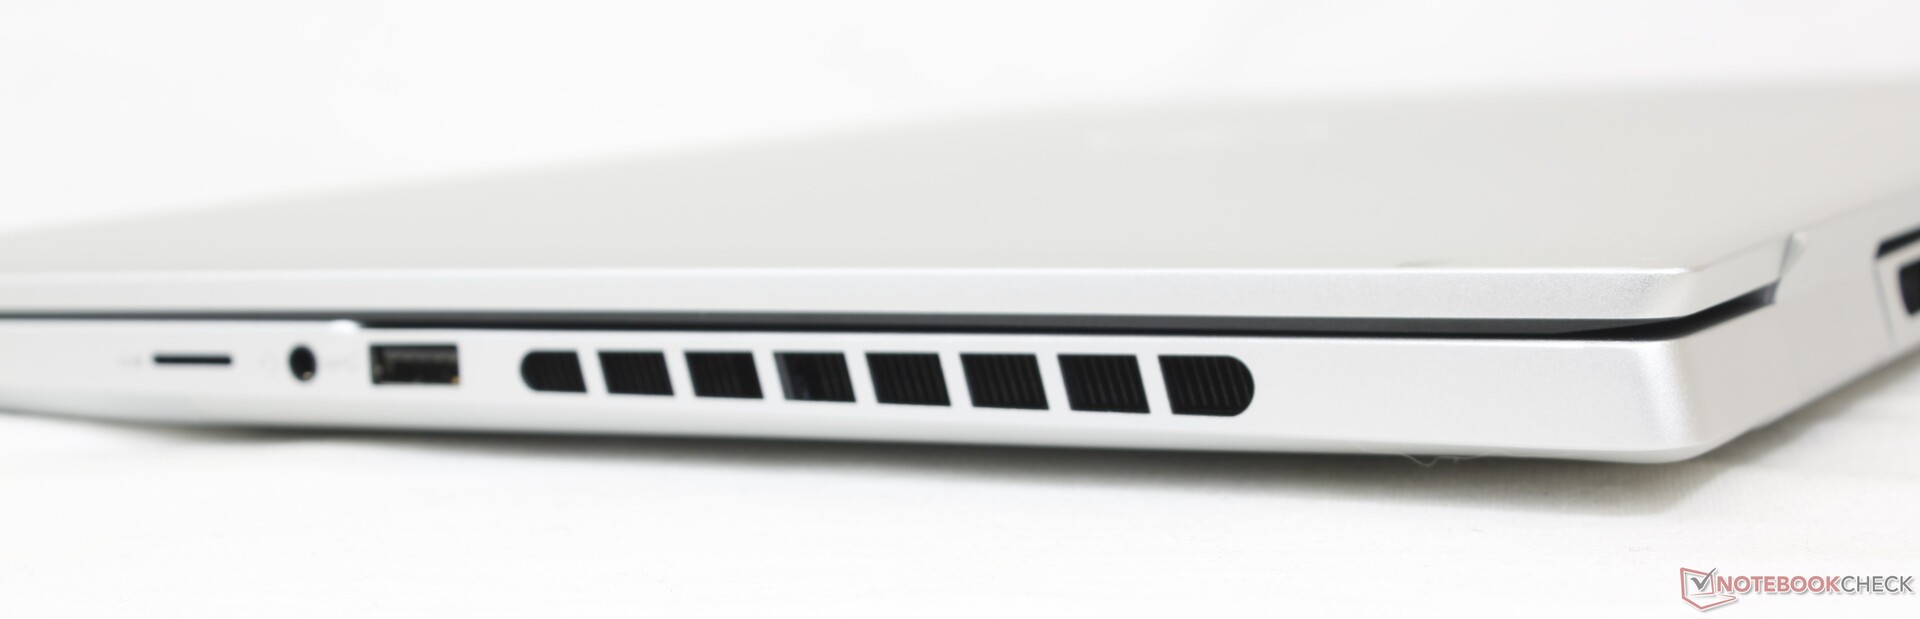
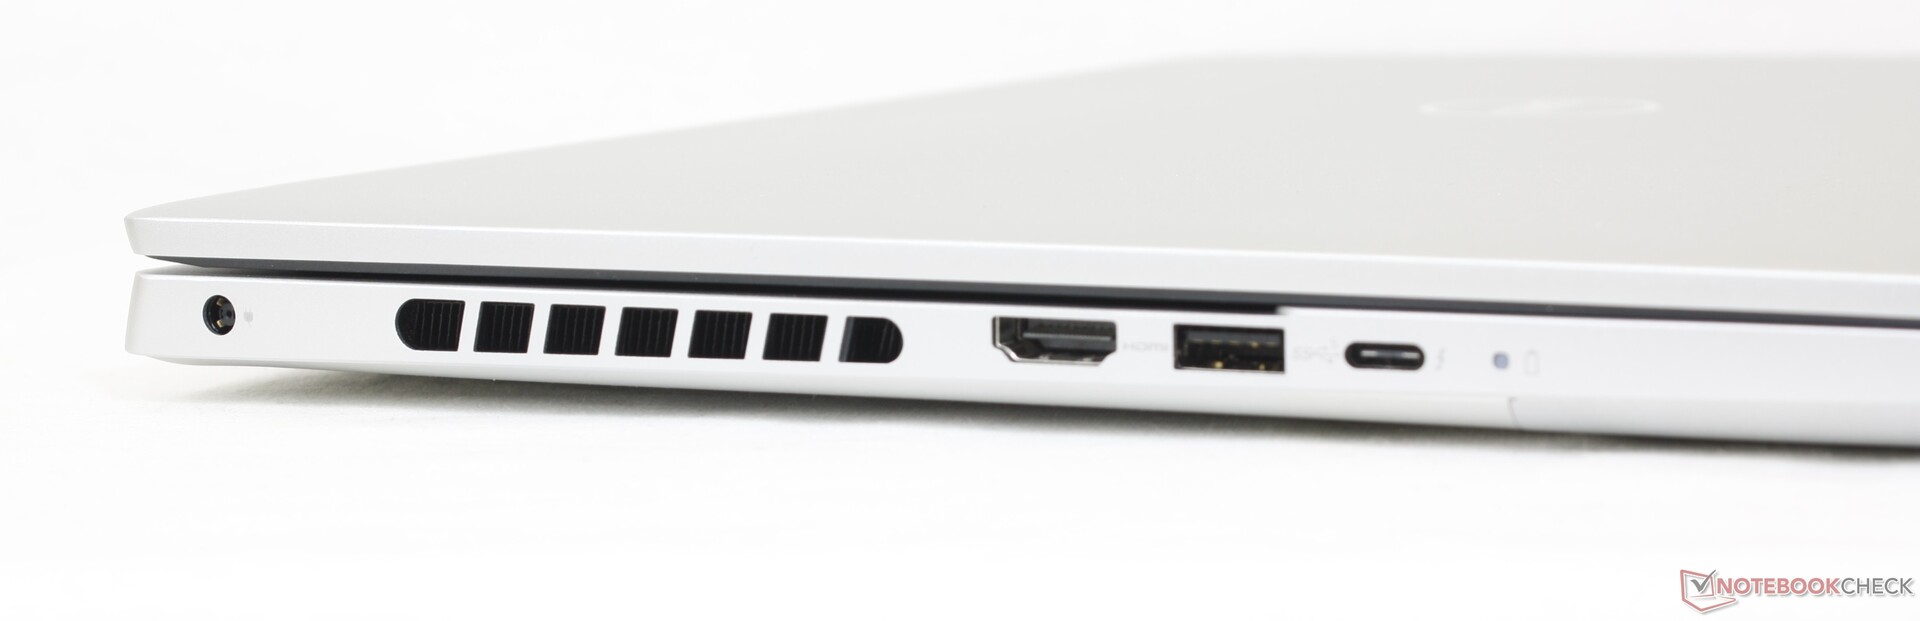
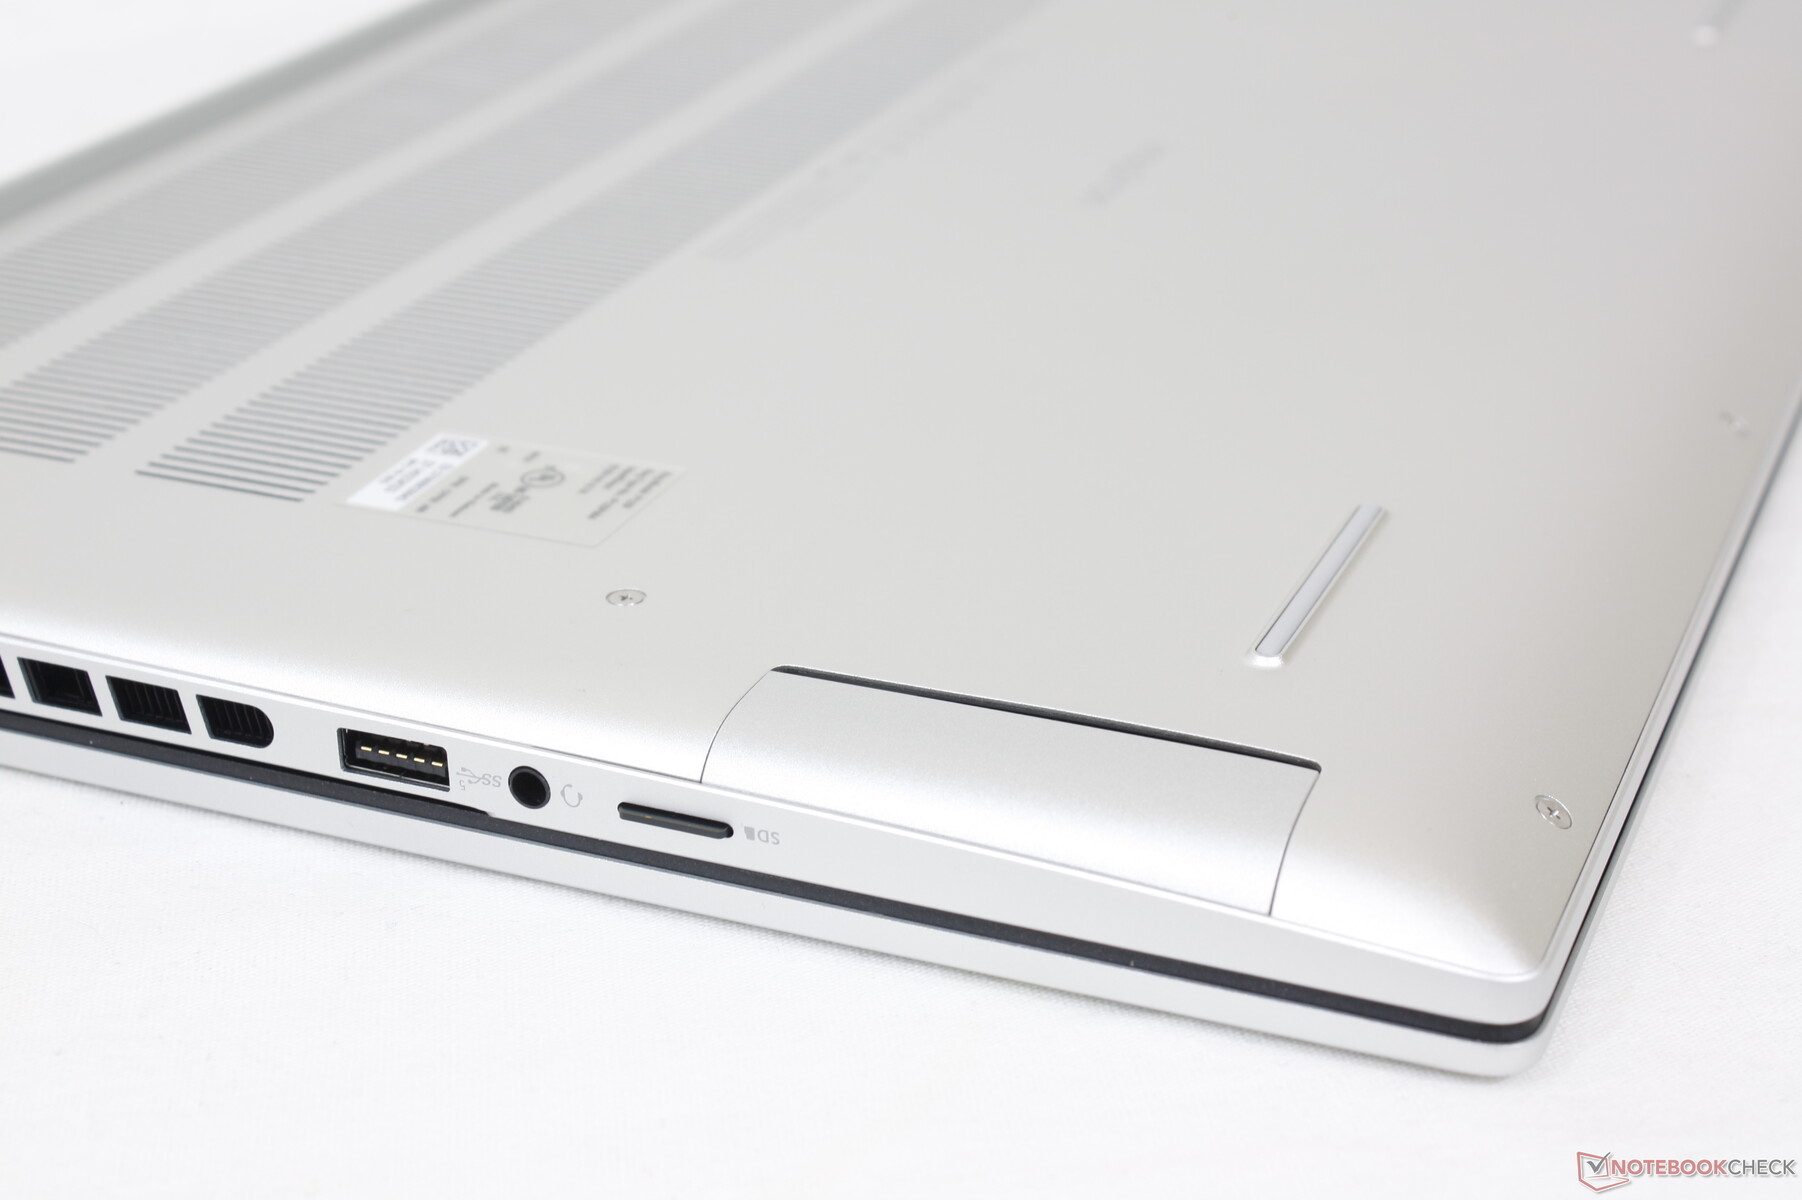
Anslutningsmöjligheter - skulle behöva mer USB-C
Portpositionering och alternativ inkluderar allt från förra årets modell men med en anmärkningsvärd nedgradering: SD-kortläsaren i full storlek har tagits bort för en mindre microSD-läsare på alla RTX 4060-konfigurationer istället. Alternativ som Envy 16 eller VivoBook Pro 16X har fler USB-C-portar än vår Dell eller SD-kortläsare i full storlek.
Vi skulle också gärna se att framtida Inspiron-modeller släpper den proprietära AC-adapterns fatport till förmån för USB-C-laddning ungefär som på XPS 15- och XPS 17-serien.
SD-kortläsare
Medan XPS-serien har några av de snabbaste SD-kortläsarna på en bärbar dator, har Inspiron-serien några av de långsammaste. Att flytta 1 GB bilder från vårt UHS-II-testkort till datorn skulle ta över 50 sekunder jämfört med bara 5 till 6 sekunder på en XPS 15 eller XPS 17.
| SD Card Reader | |
| average JPG Copy Test (av. of 3 runs) | |
| MSI Summit E16 Flip A12UDT-031 (AV Pro SD microSD 128 GB V60) | |
| Asus Vivobook Pro 16X K6604JV-MX016W | |
| Lenovo Slim Pro 9i 16IRP8 (PNY EliteX-Pro60 V60 256 GB) | |
| HP Envy 16 h0112nr (AV Pro SD microSD 128 GB V60) | |
| Dell Inspiron 16 Plus 7620 (Toshiba Exceria Pro SDXC 64 GB UHS-II) | |
| Dell Inspiron 16 Plus 7630 (AV Pro SD microSD 128 GB V60) | |
| maximum AS SSD Seq Read Test (1GB) | |
| MSI Summit E16 Flip A12UDT-031 (AV Pro SD microSD 128 GB V60) | |
| Asus Vivobook Pro 16X K6604JV-MX016W | |
| Lenovo Slim Pro 9i 16IRP8 (PNY EliteX-Pro60 V60 256 GB) | |
| HP Envy 16 h0112nr (AV Pro SD microSD 128 GB V60) | |
| Dell Inspiron 16 Plus 7620 (Toshiba Exceria Pro SDXC 64 GB UHS-II) | |
| Dell Inspiron 16 Plus 7630 (AV Pro SD microSD 128 GB V60) | |
Kommunikation
En Intel AX211 är standard för Wi-Fi 6E och Bluetooth 5.3-anslutning. Vi upplevde stabil och pålitlig prestanda när vi parade ihop den med vårt Asus AXE11000 6GHz testnätverk.
En MediaTek-modul ingår istället om den konfigureras med en AMD-processor.
Webbkamera
Webbkameran på 2 MP har blivit standard på de flesta bärbara multimediadatorer. Dyrare modeller från HP har 5 MP- eller till och med 8 MP-webbkameror om webbkamerans kvalitet är av högsta prioritet.
Ett fysiskt reglage finns för integritetsskydd, men IR stöds inte.


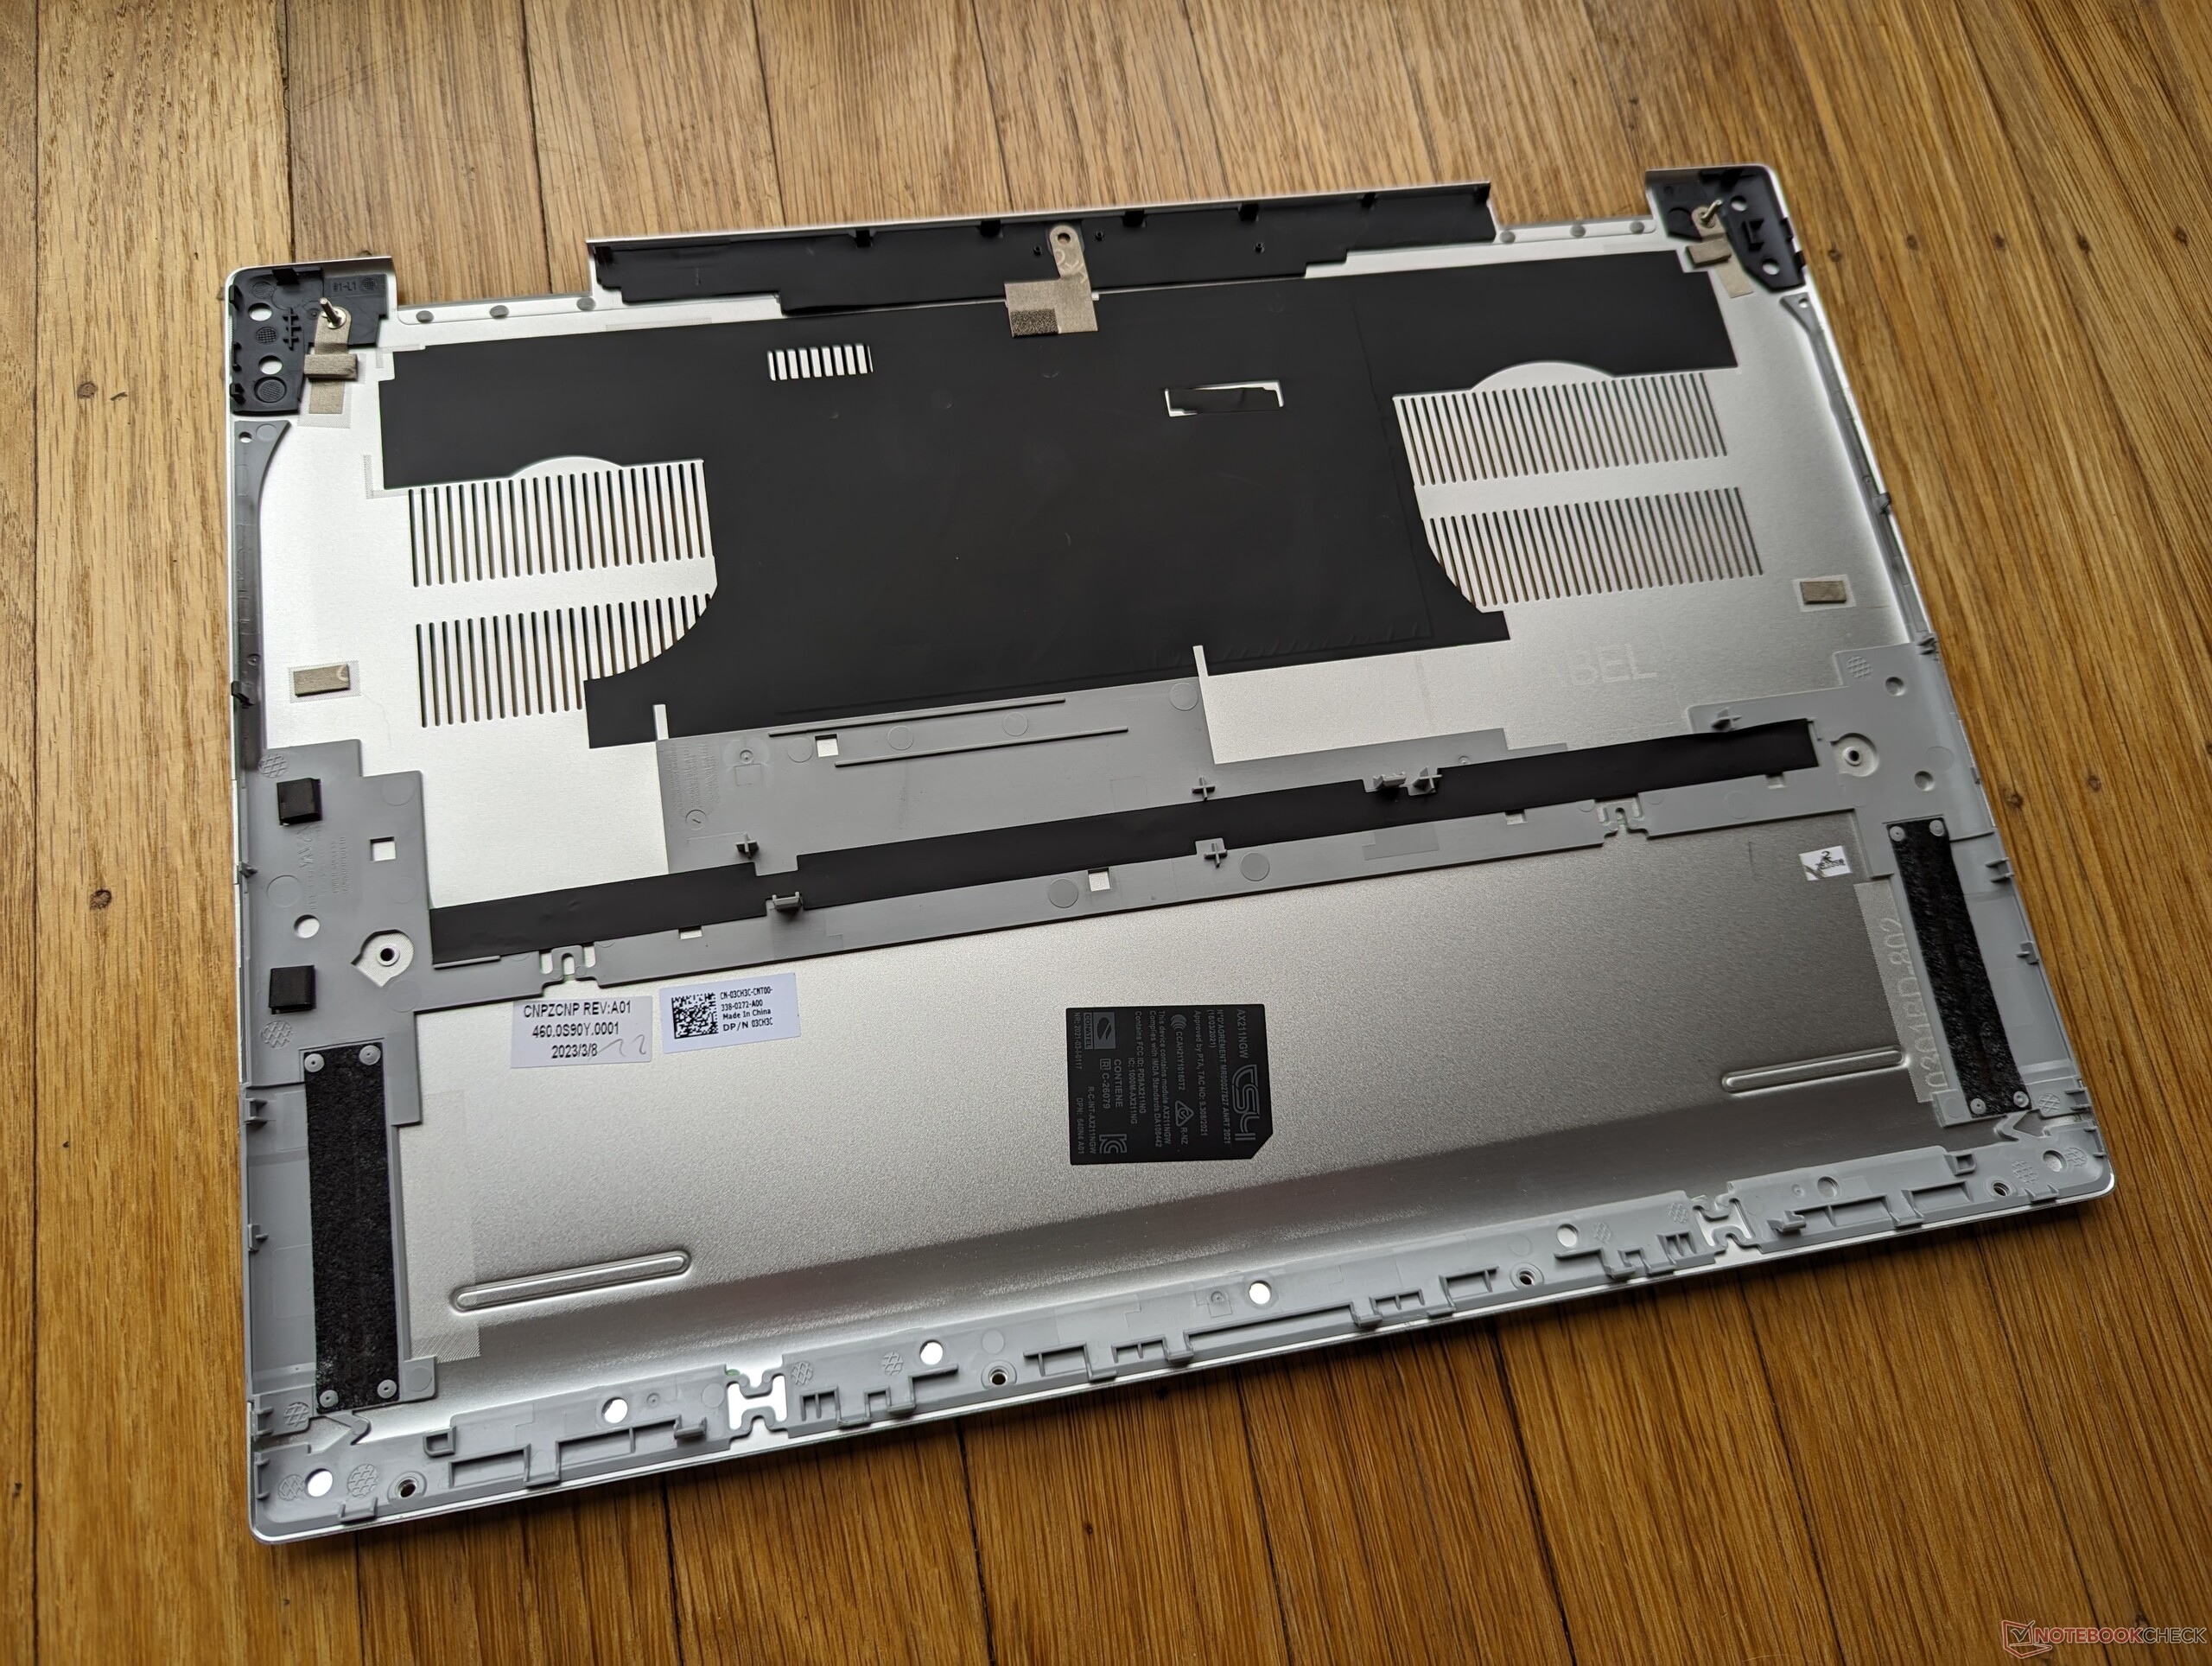
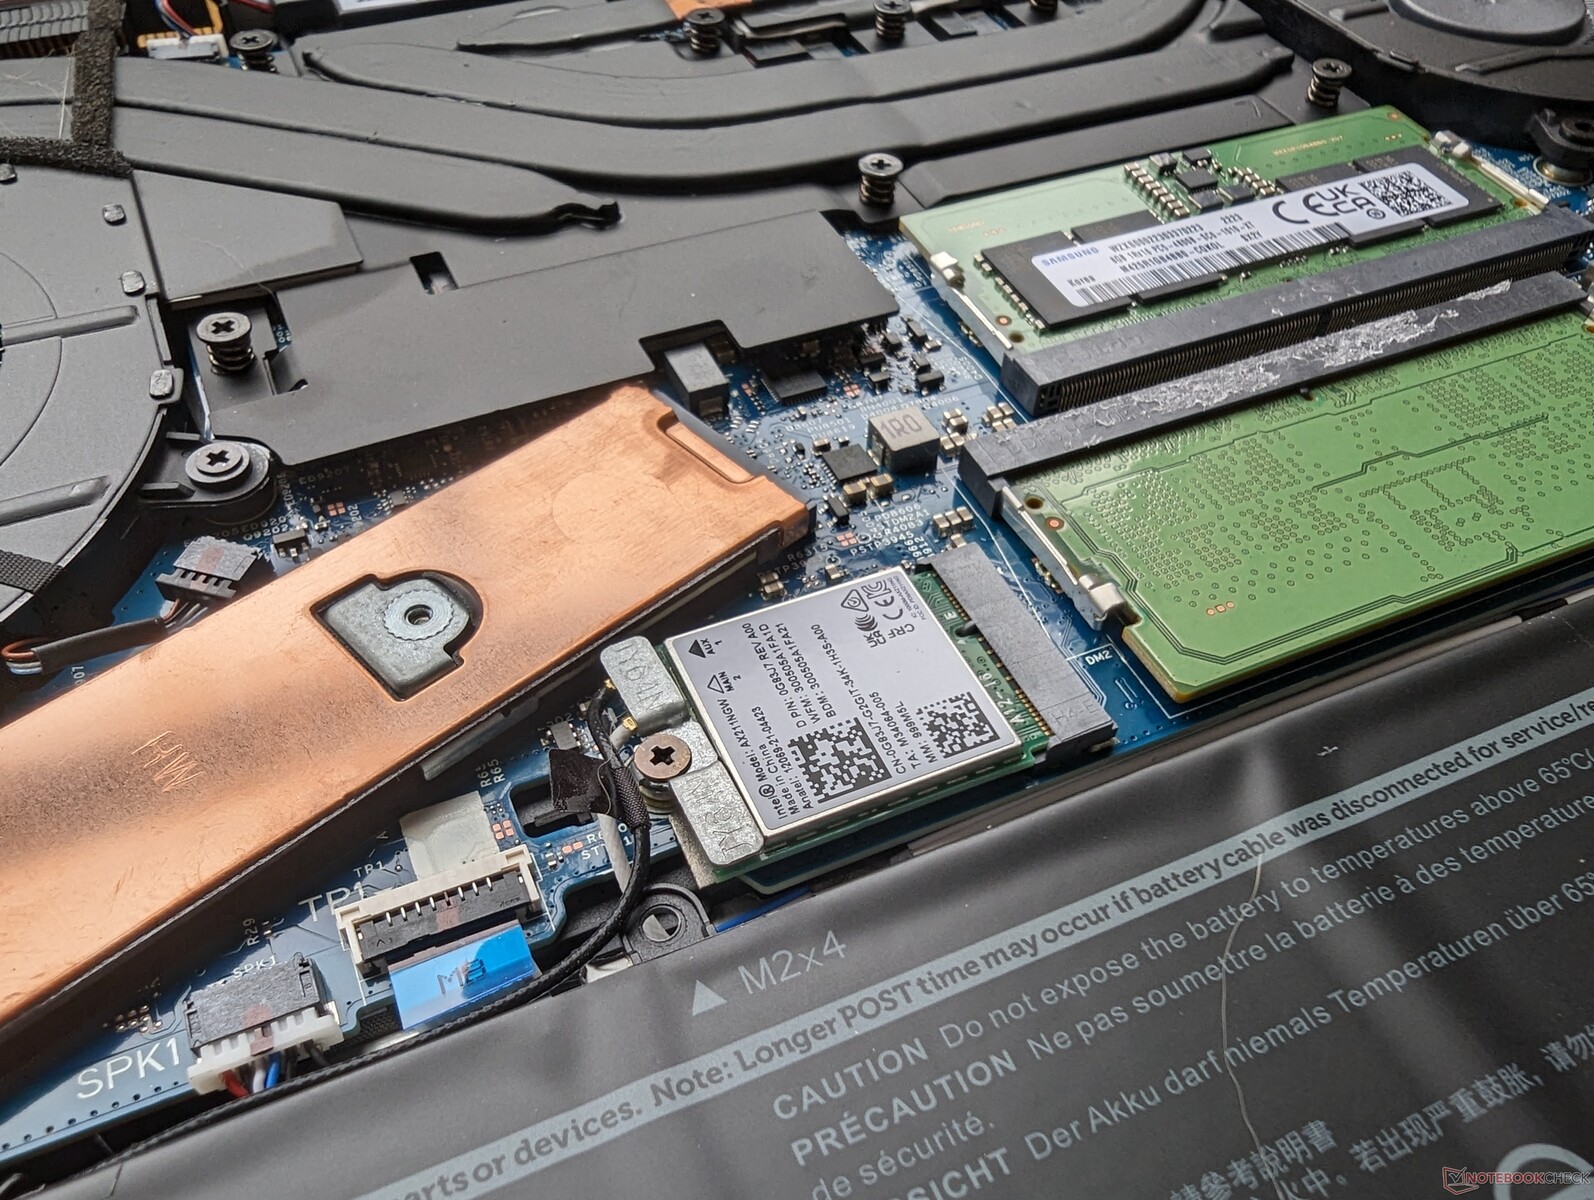
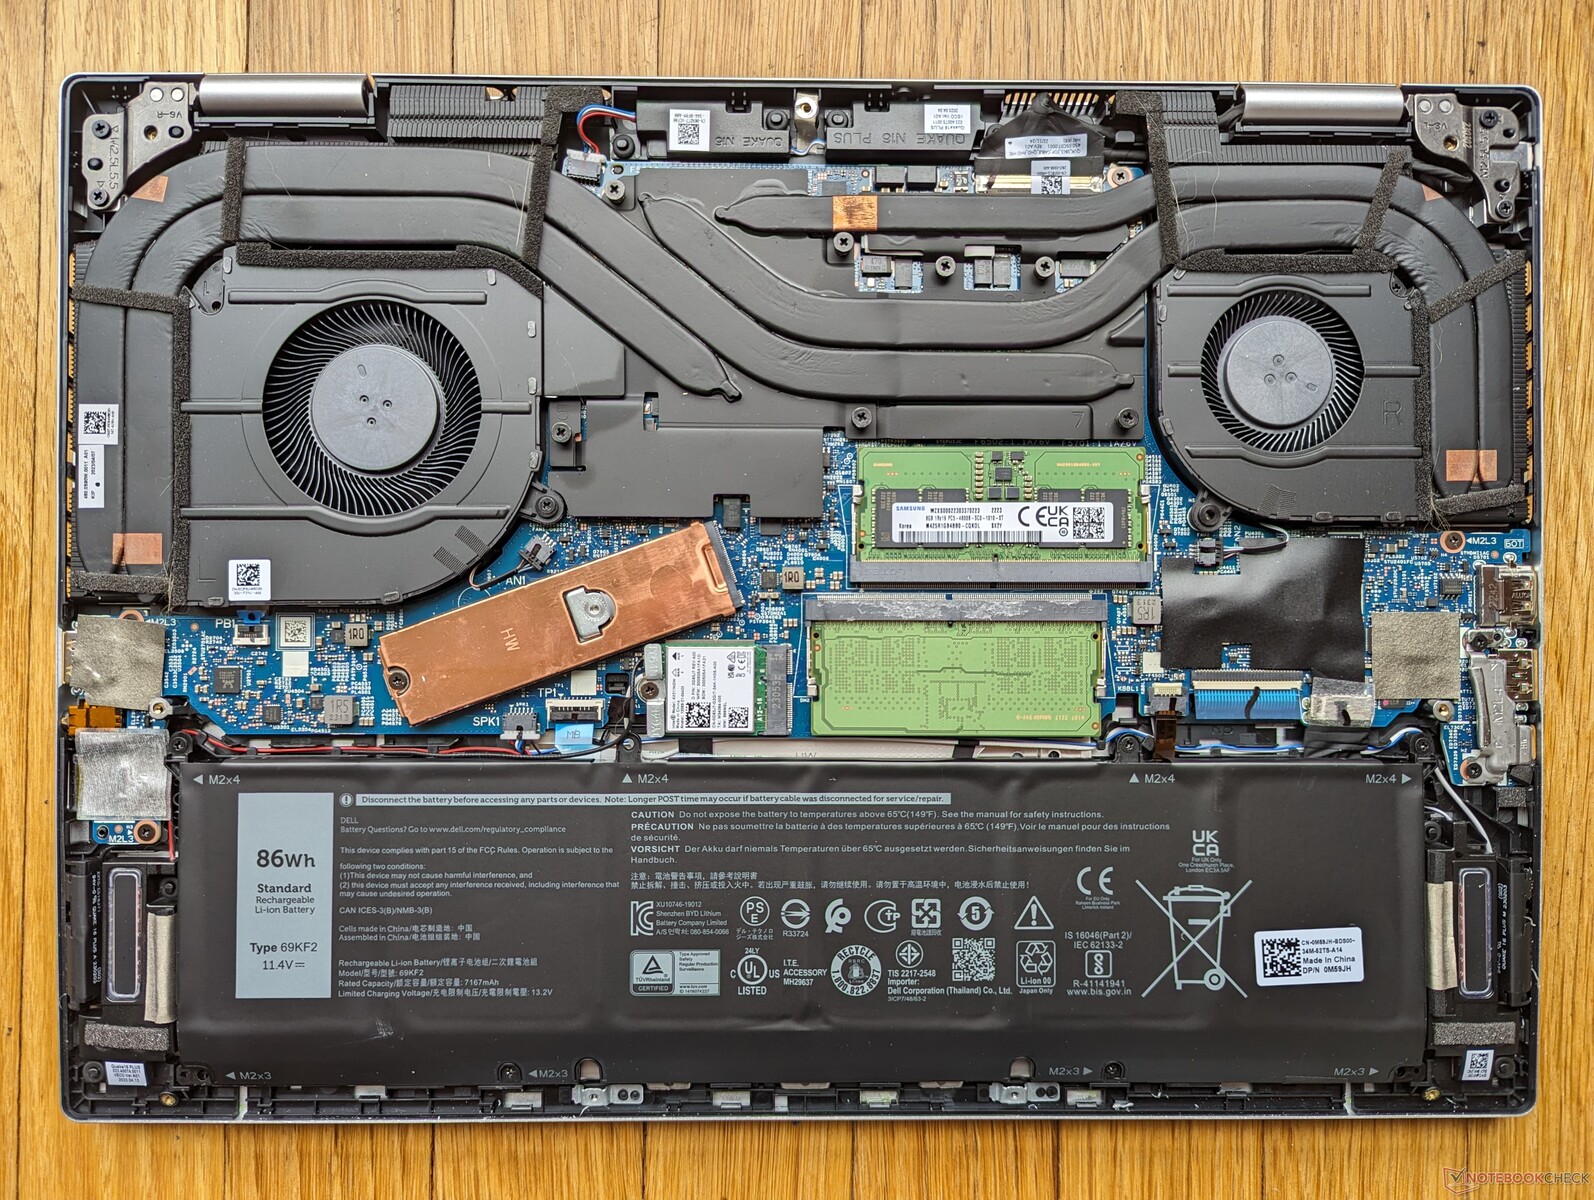
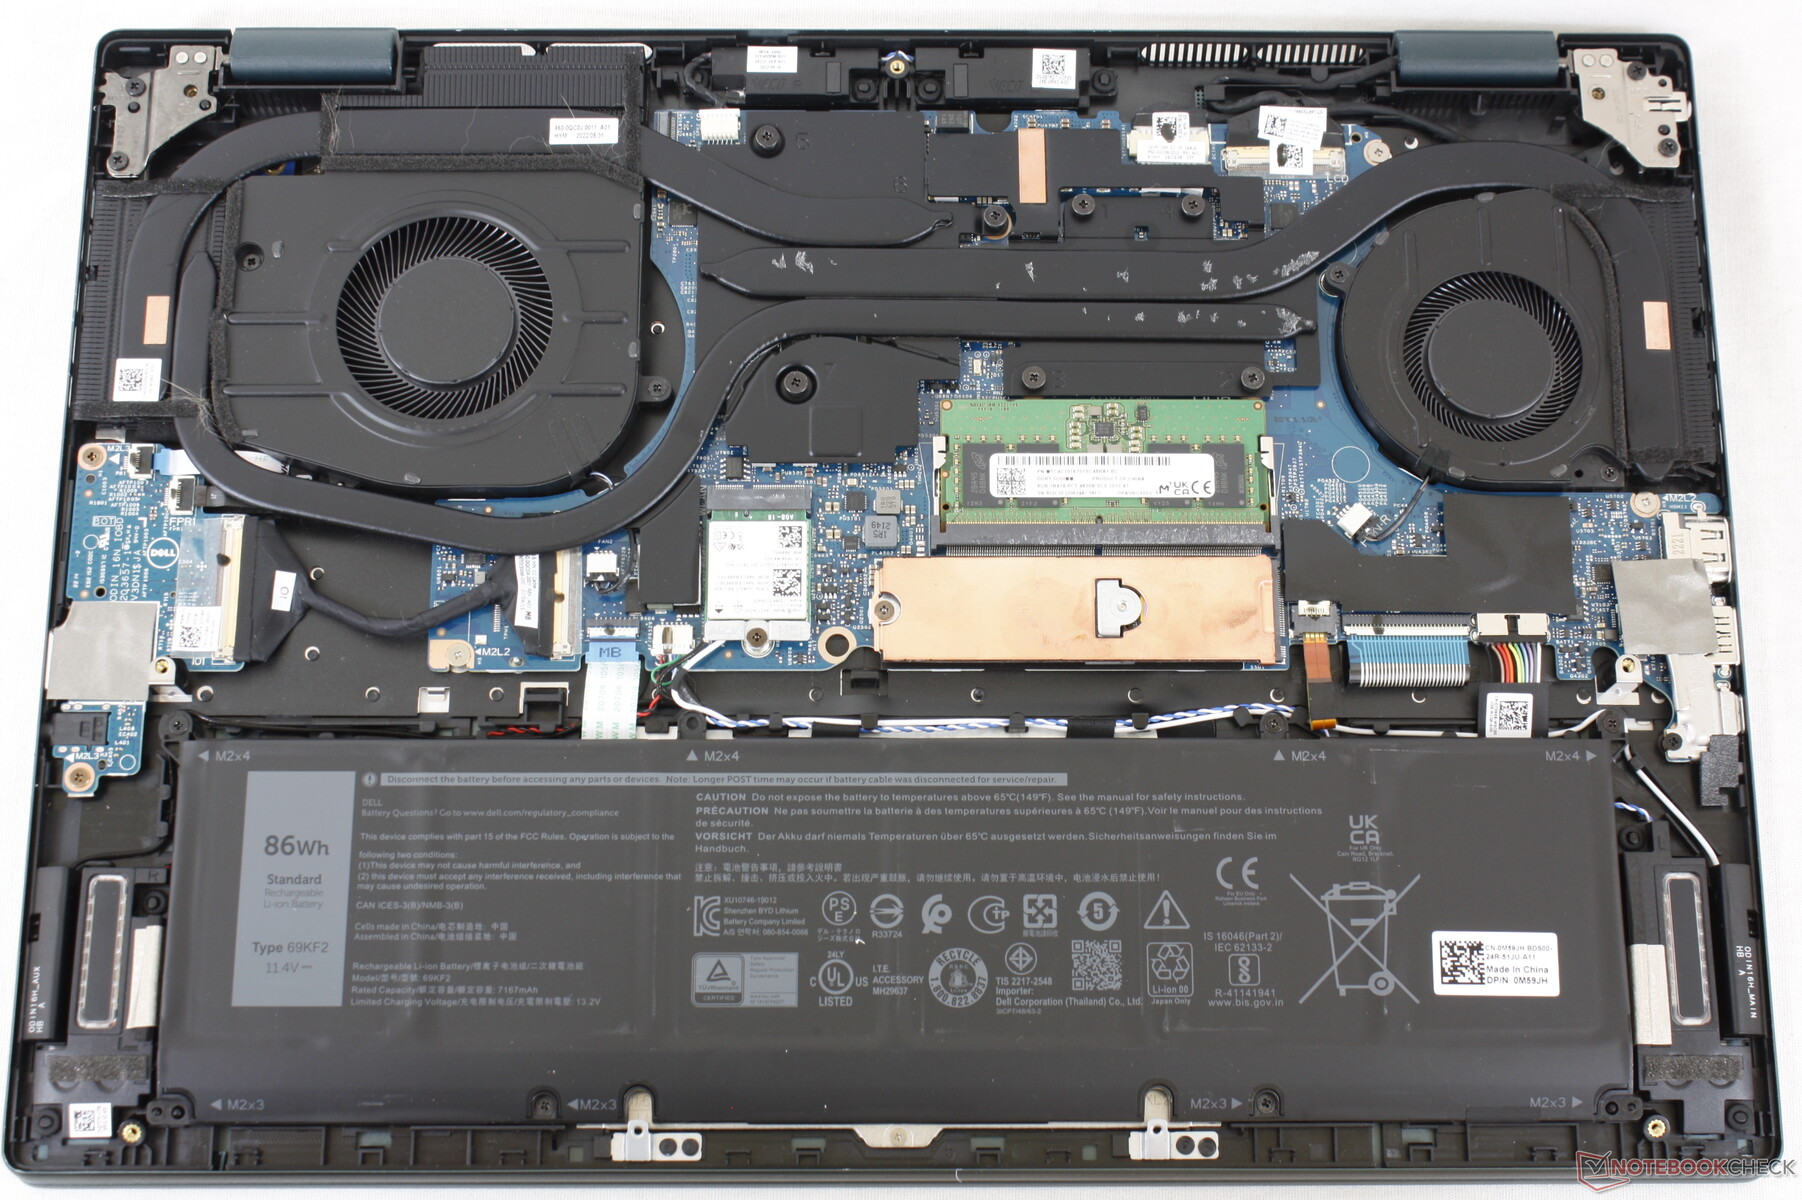
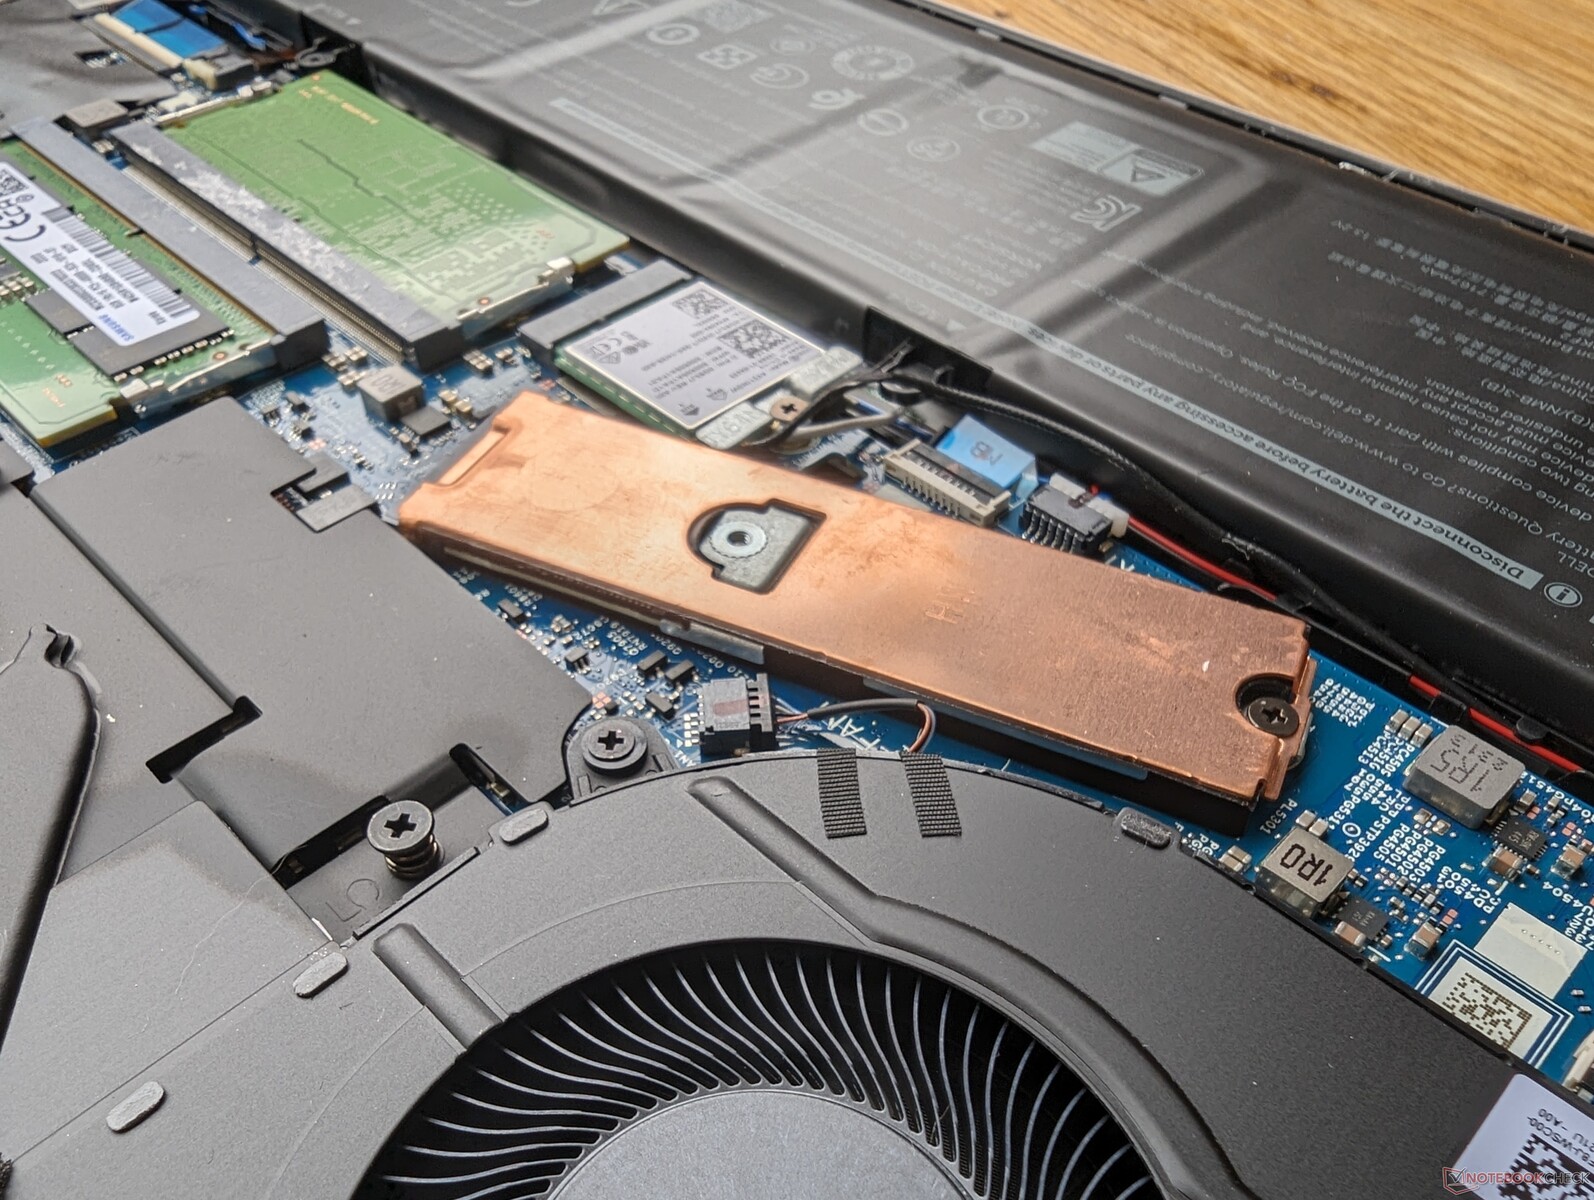
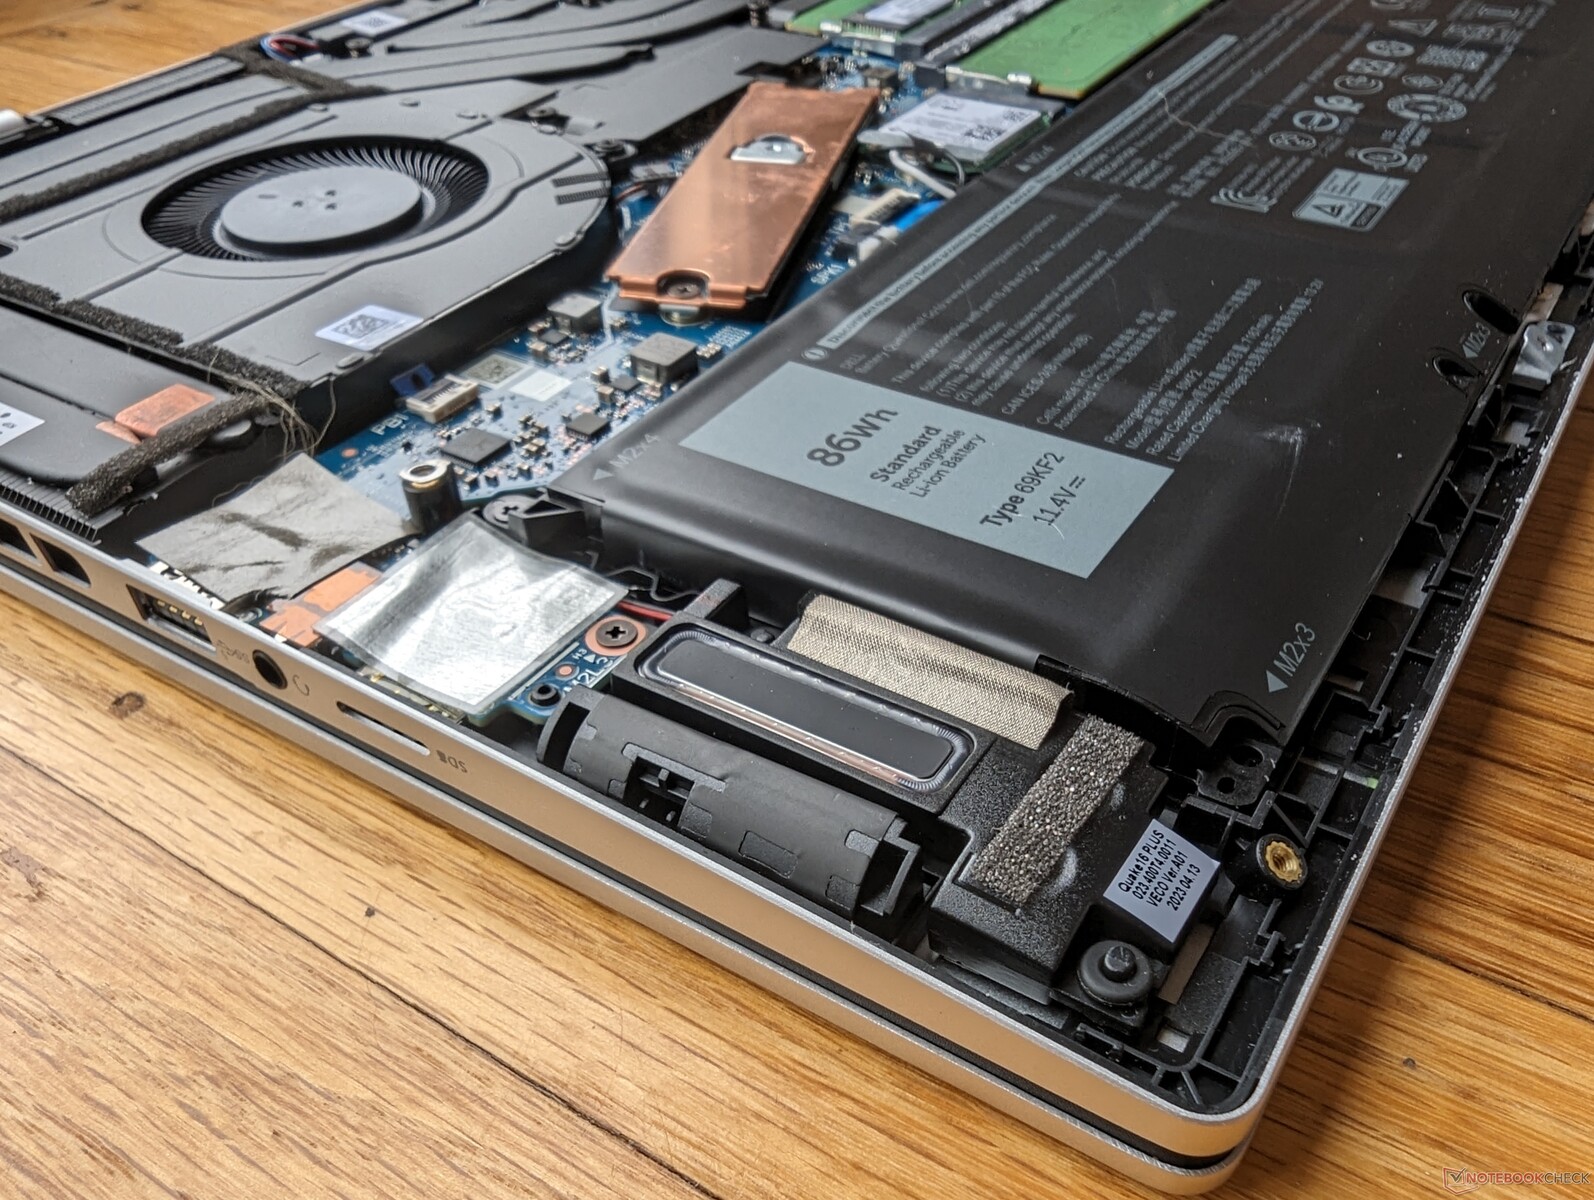
Underhåll
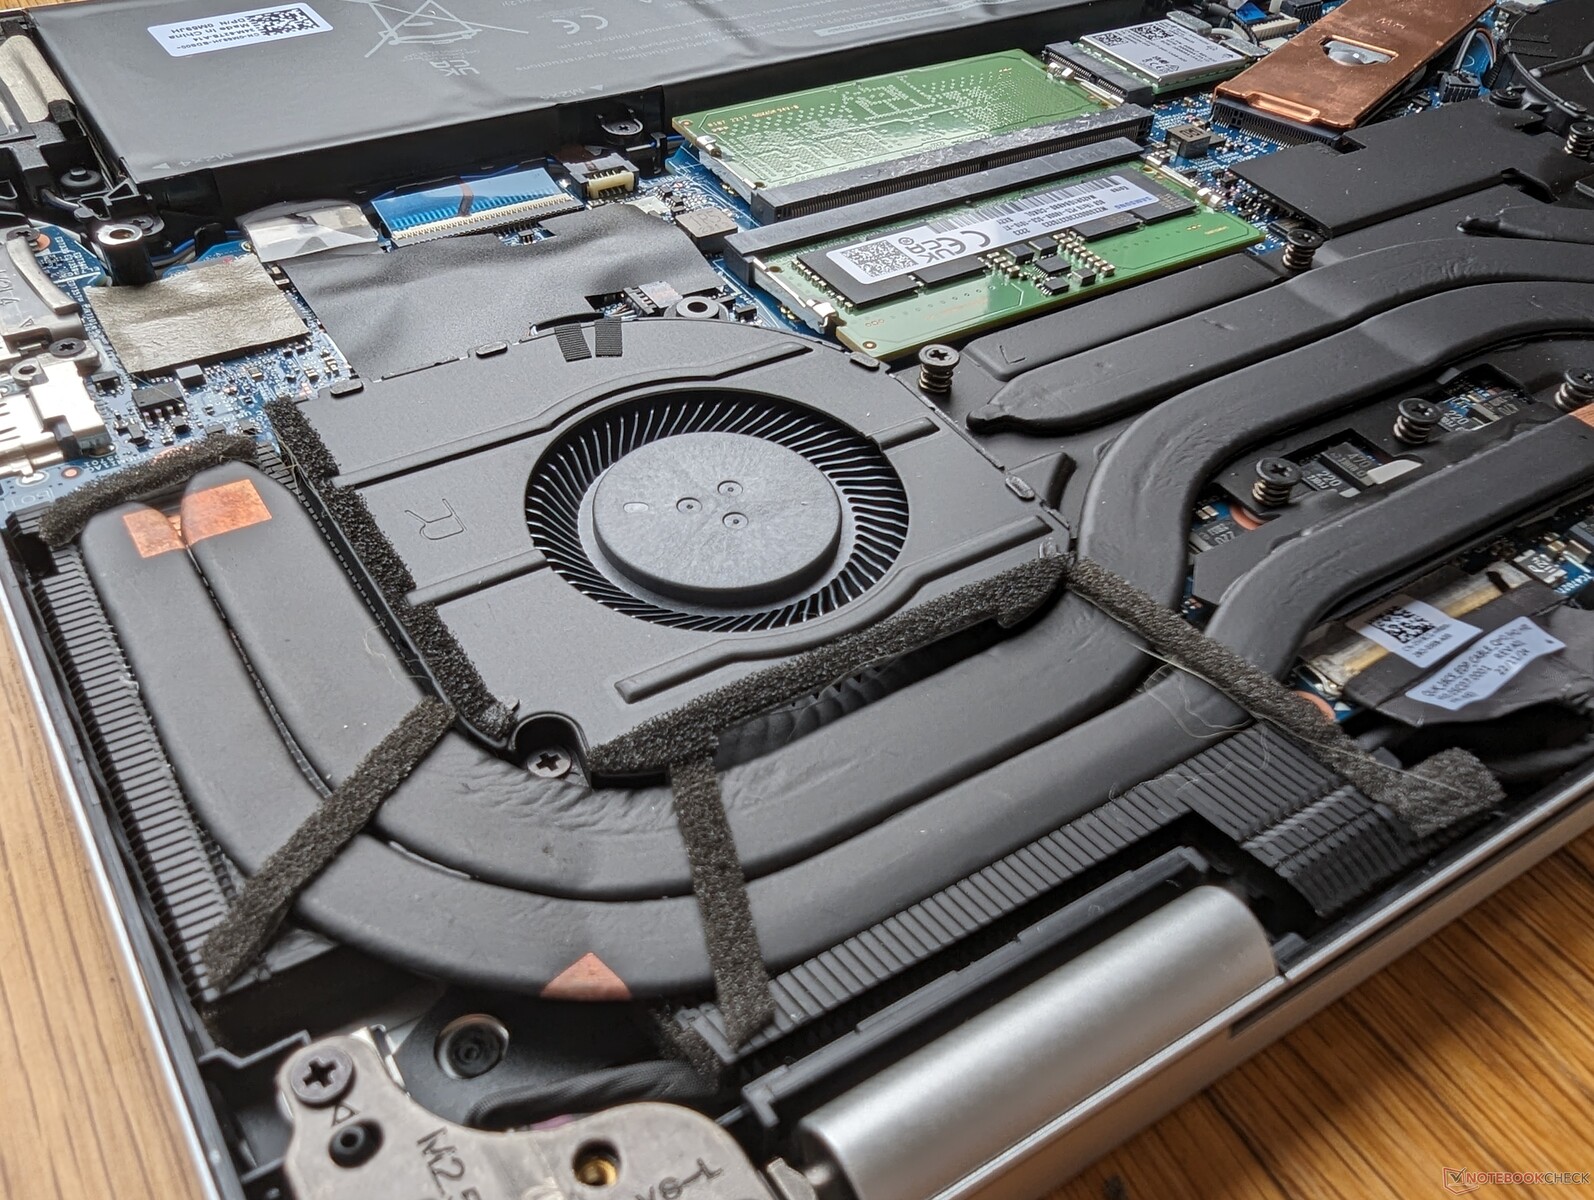
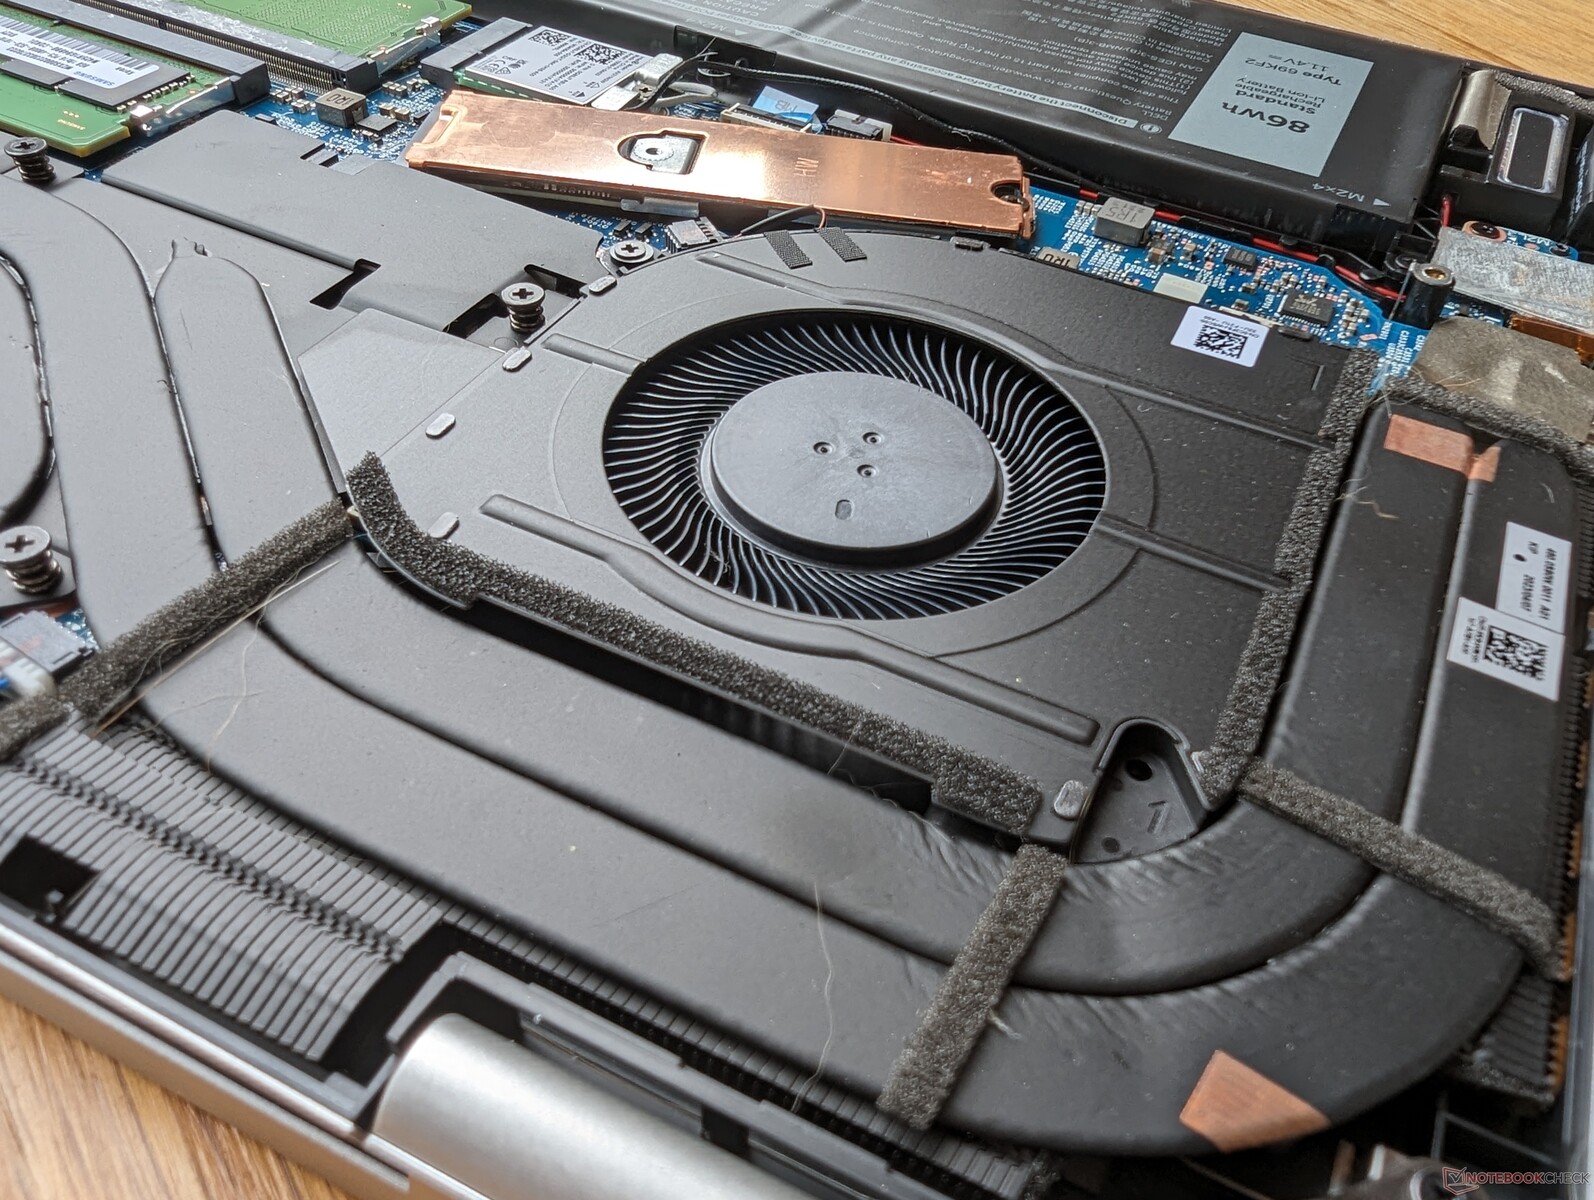
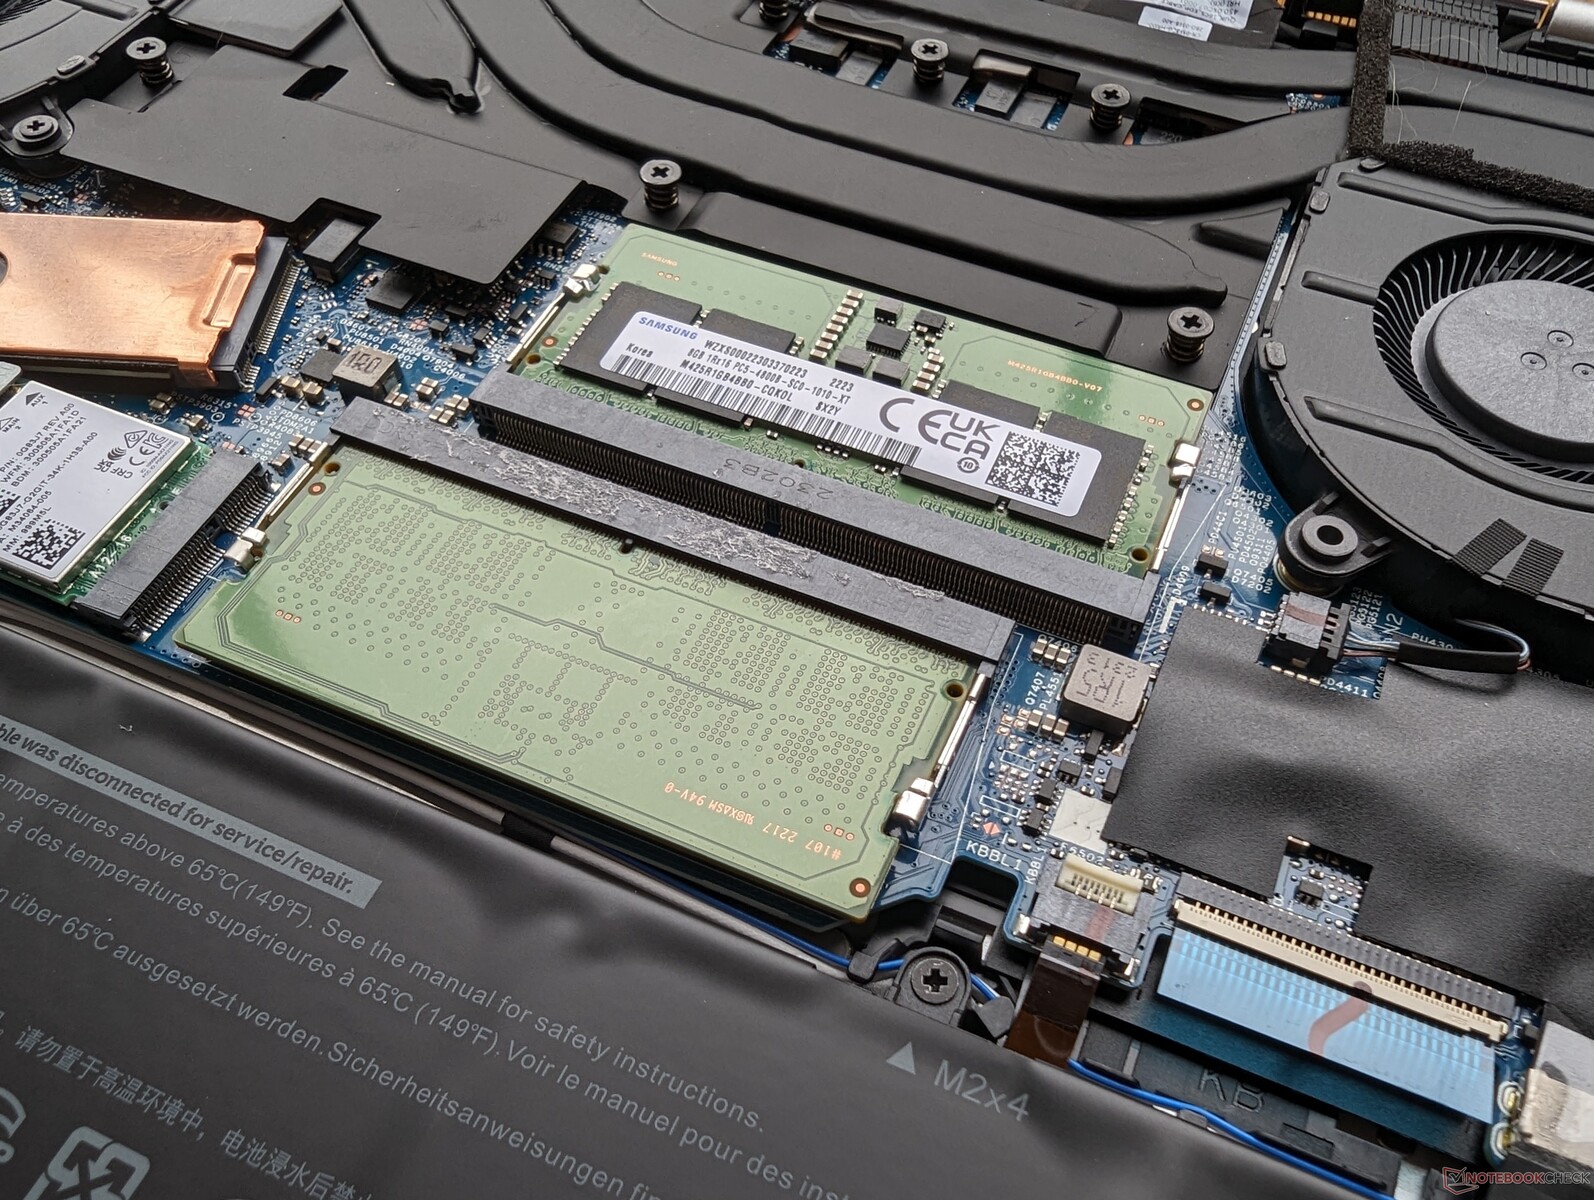
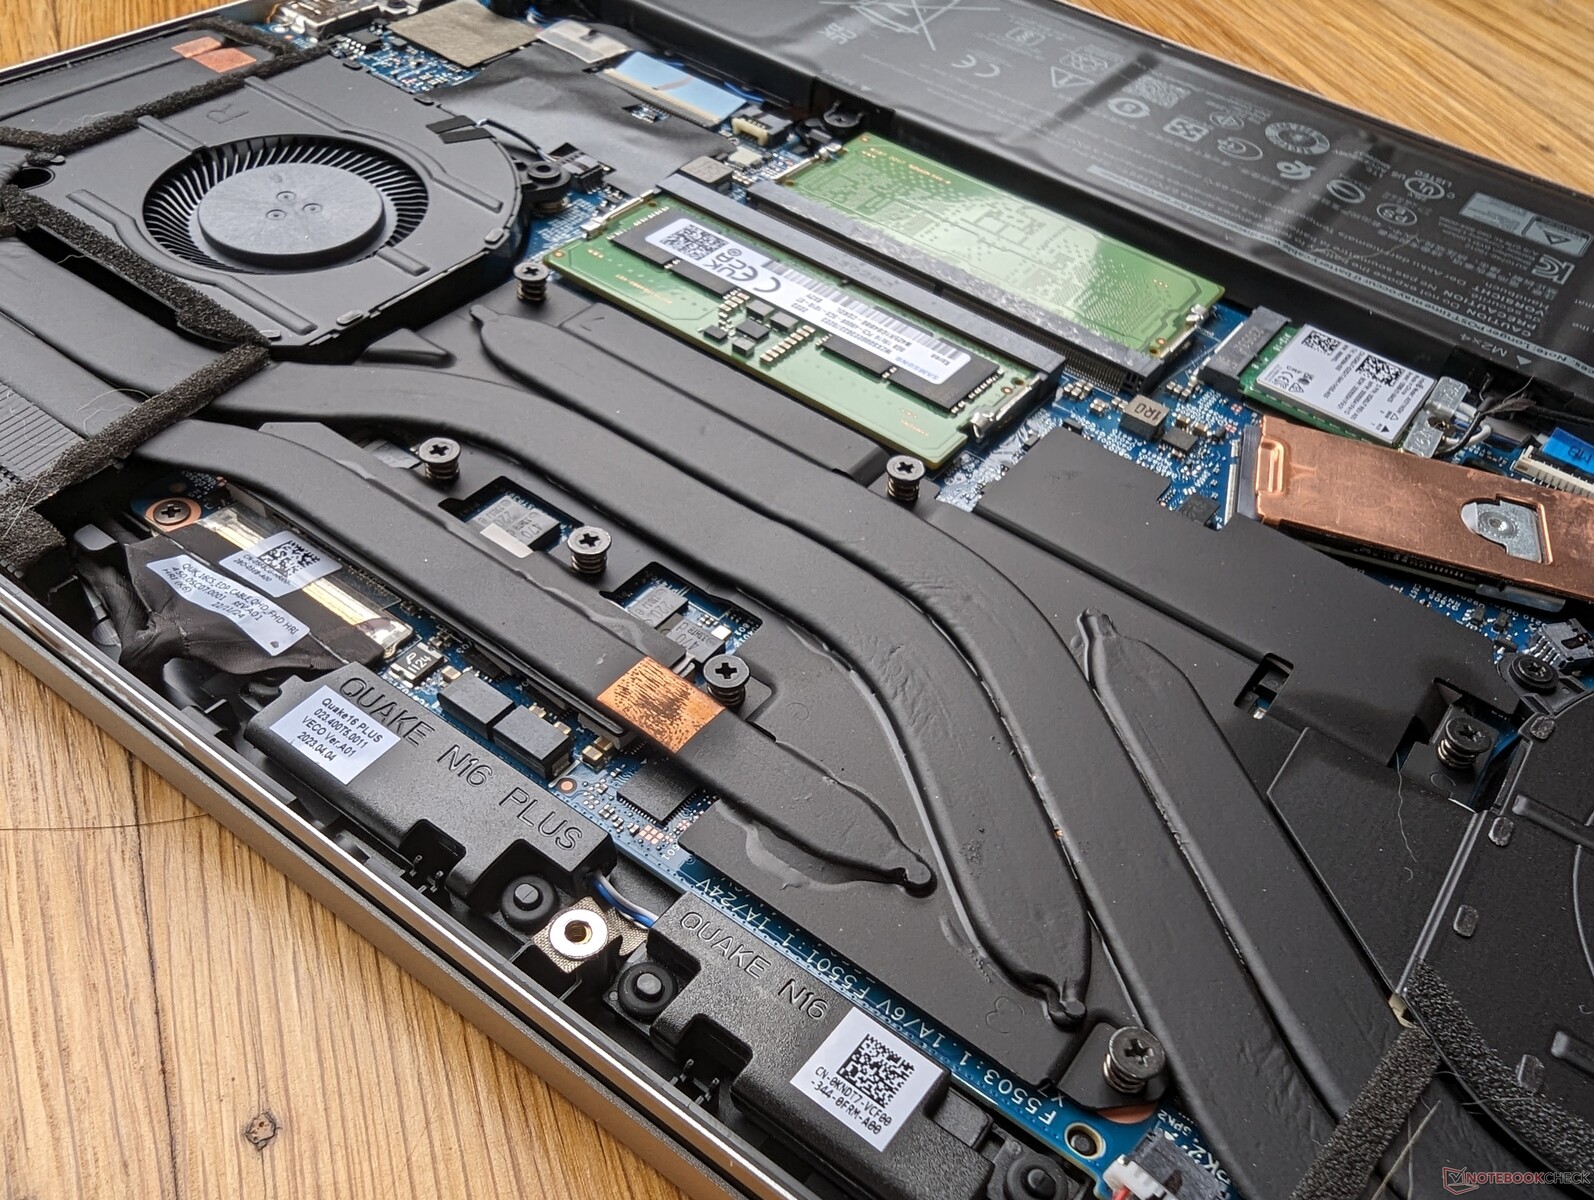
Den nedre panelen kräver endast en stjärnskruvmejsel och en vass kant för relativt enkel service. Ägare har direkt tillgång till SSD, WLAN och 2x SODIMM-platser medan förra årets modell var begränsad till endast 1x SODIMM-plats, vilket framgår av jämförelsebilderna nedan. Fläktarna är också större den här gången och med tjockare kopparvärmerör för förbättrad kylningspotential.
Notera att AMD-versionen av denna modell använder lödda LPDDR5 RAM-minnen i motsats till den fullt expanderbara 2x SODIMM-ansatsen i vår Intel-version.
Tillbehör och garanti
Det finns inget extra i förpackningen förutom nätadapter och pappersarbete. Den vanliga ettåriga begränsade tillverkargarantin gäller vid köp i USA.
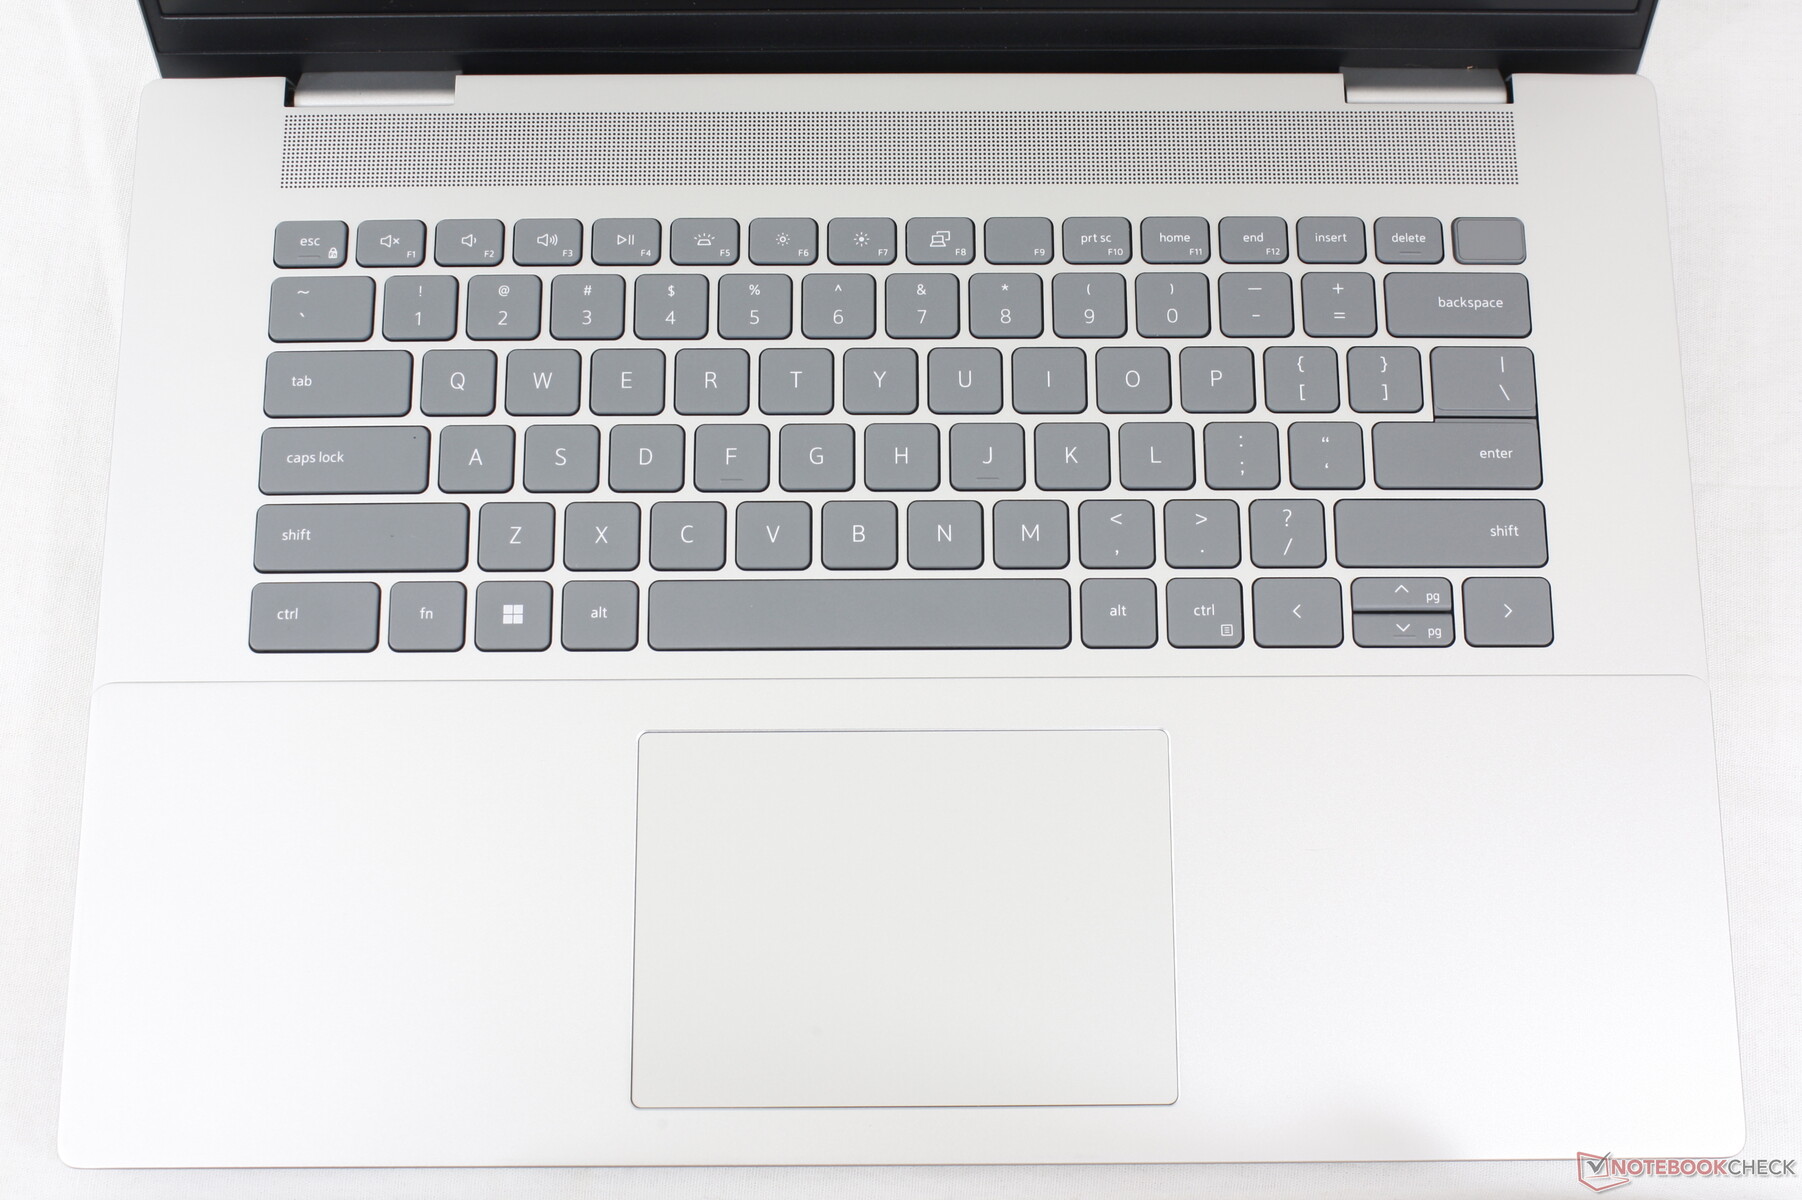
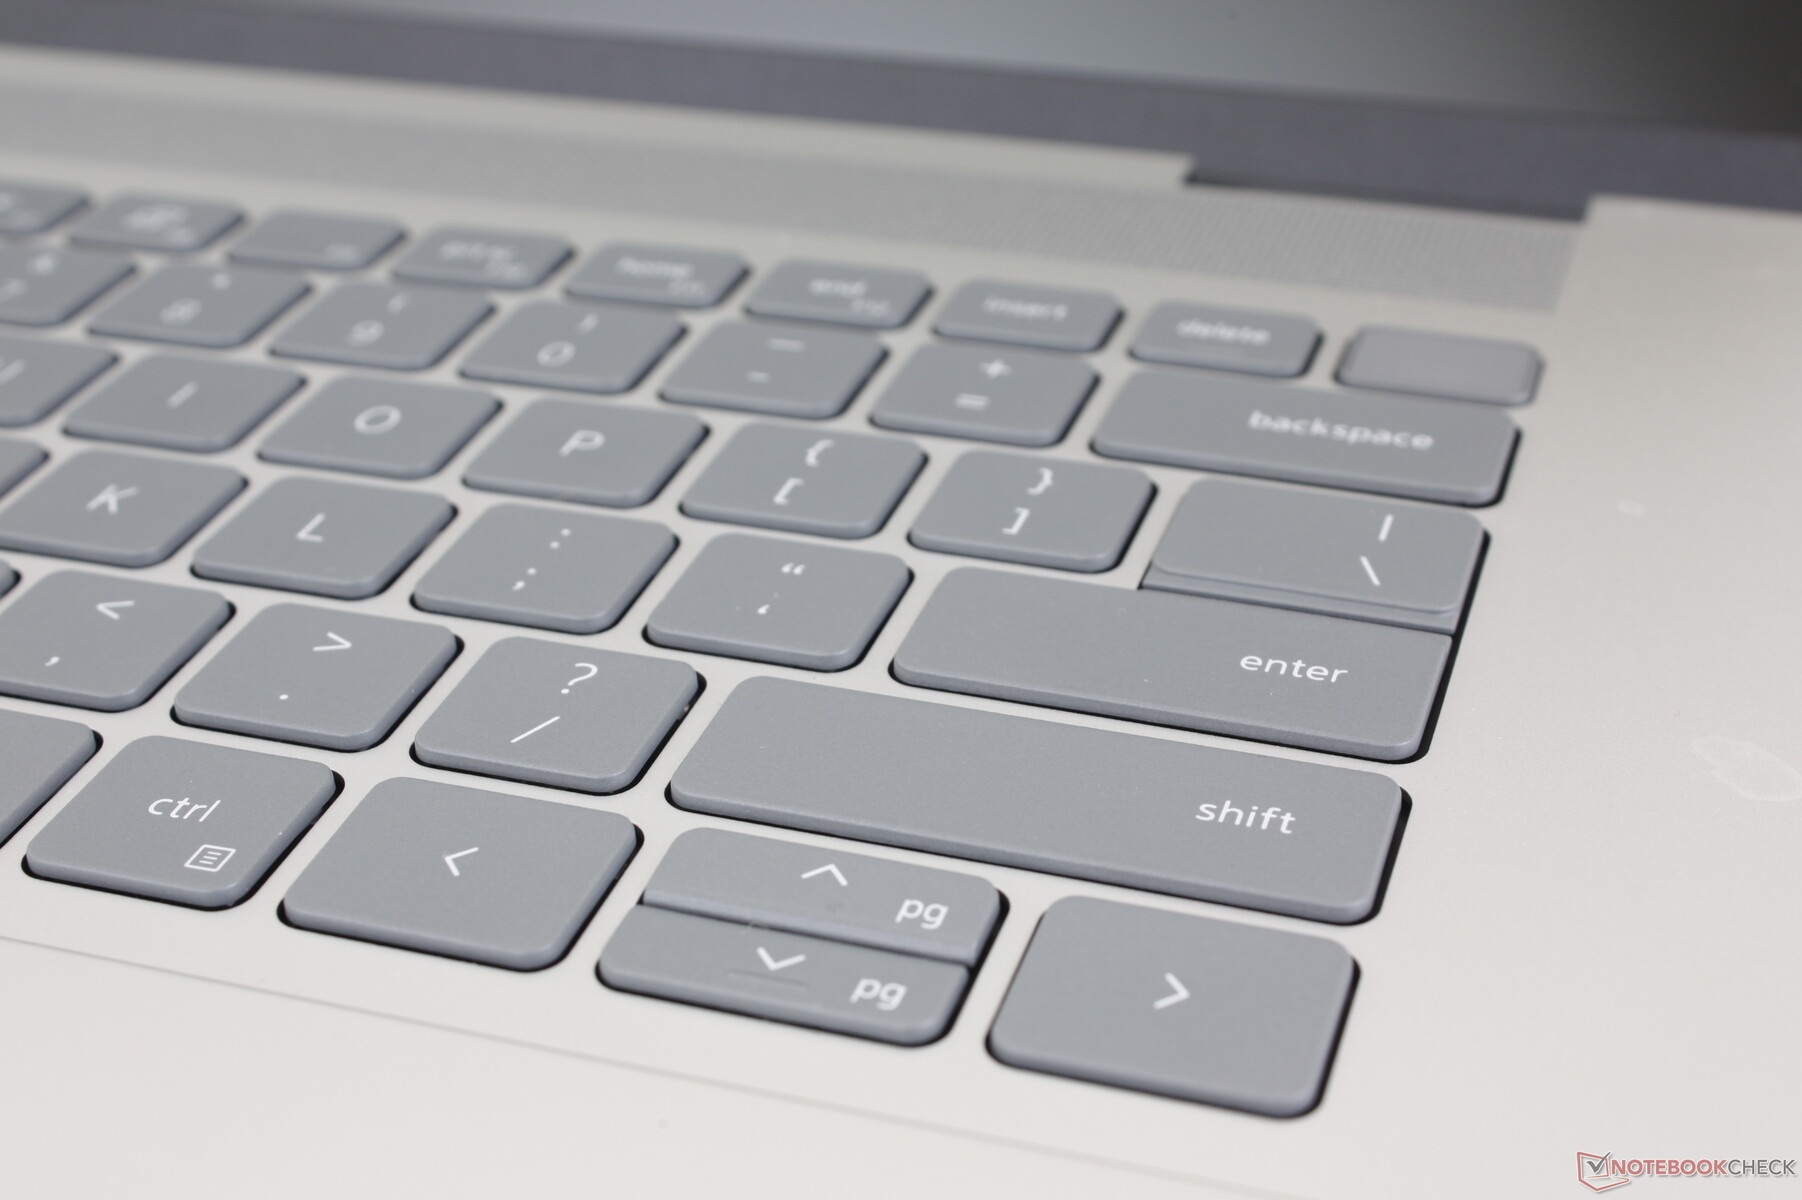
Inmatningsenheter - välbekant Inspiron-känsla
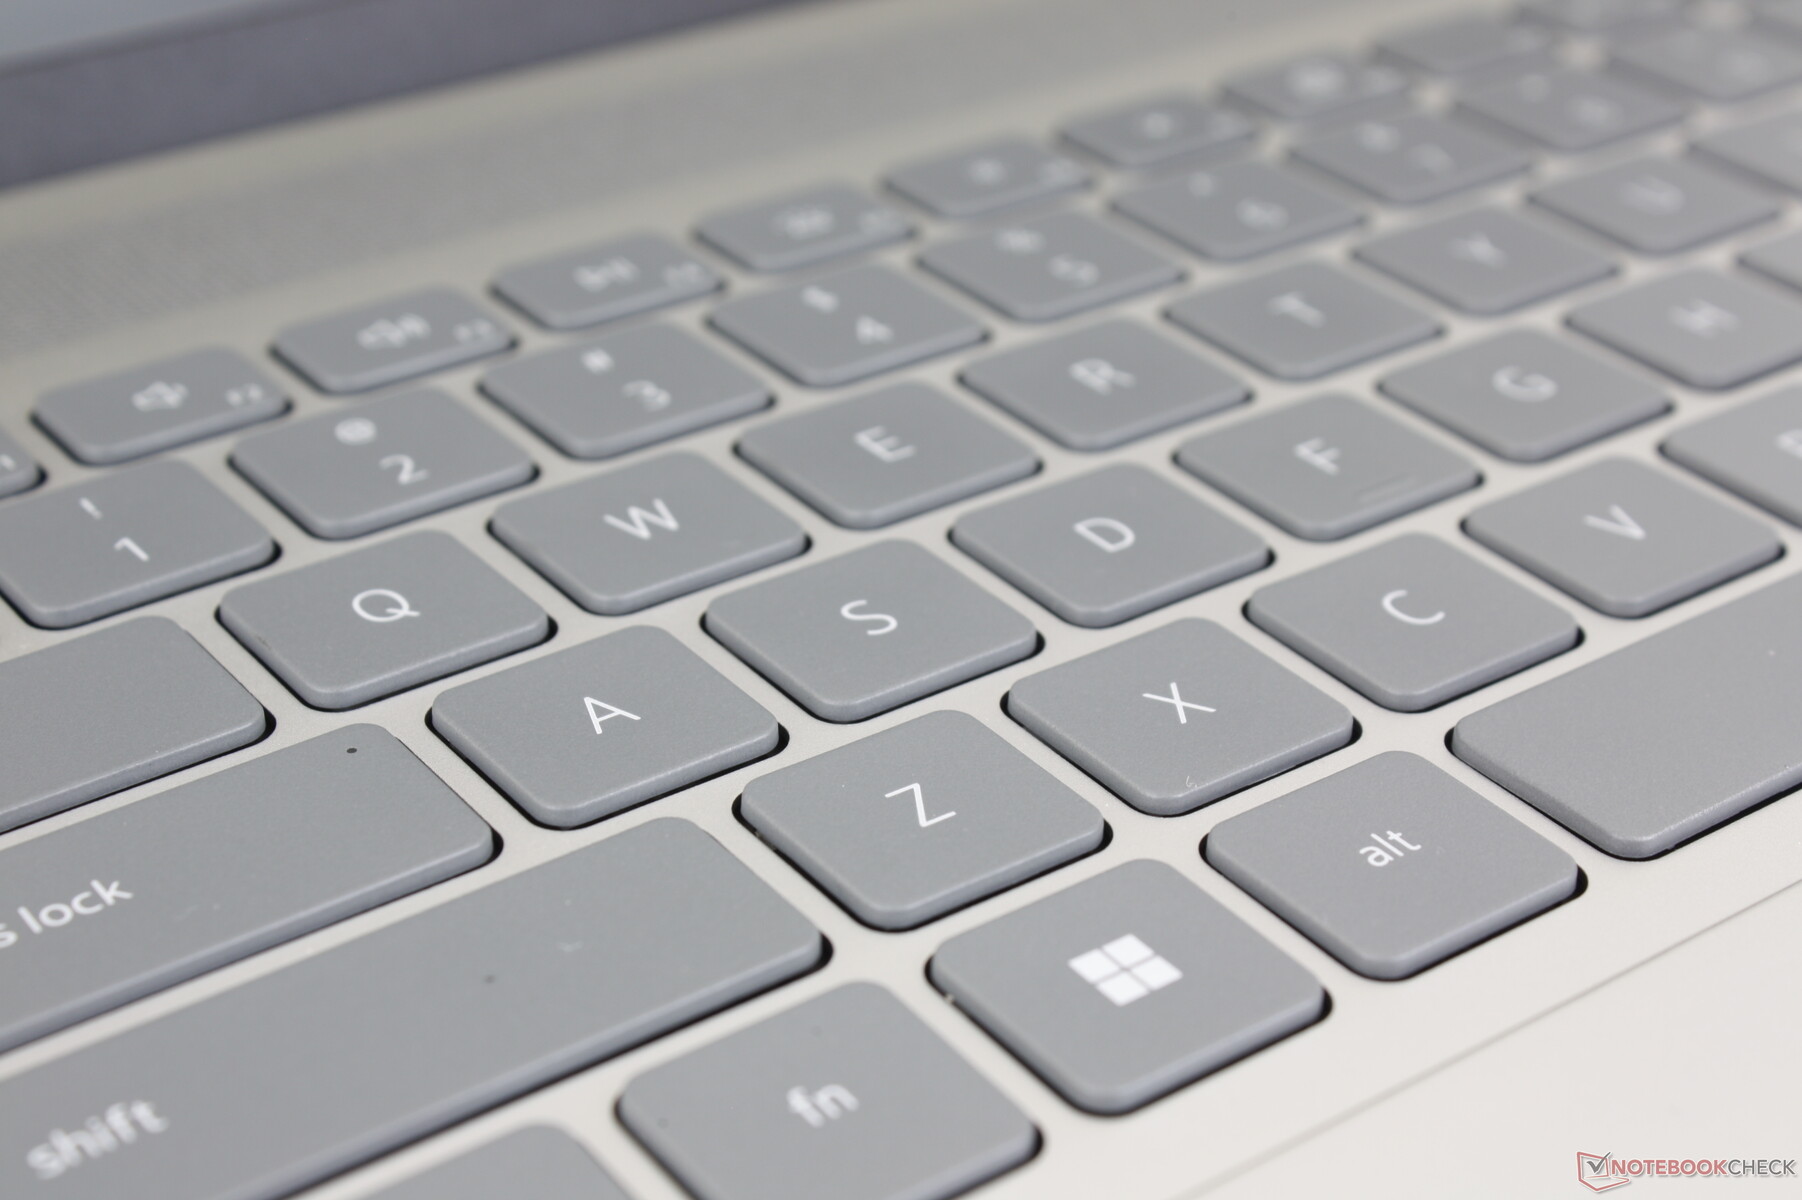
Tangentbord
Skrivupplevelsen är identisk med den hos Inspiron 16 Plus 7620 ner till varje funktionstangent och sekundär åtgärd. Detta är inte nödvändigtvis en dålig sak eftersom konsekvensen mellan olika Inspiron-modeller uppskattas. Men andra bärbara multimediadatorer som LG Gram 16 eller HP Spectre x360 16 har betydligt fastare och bekvämare tangenter.
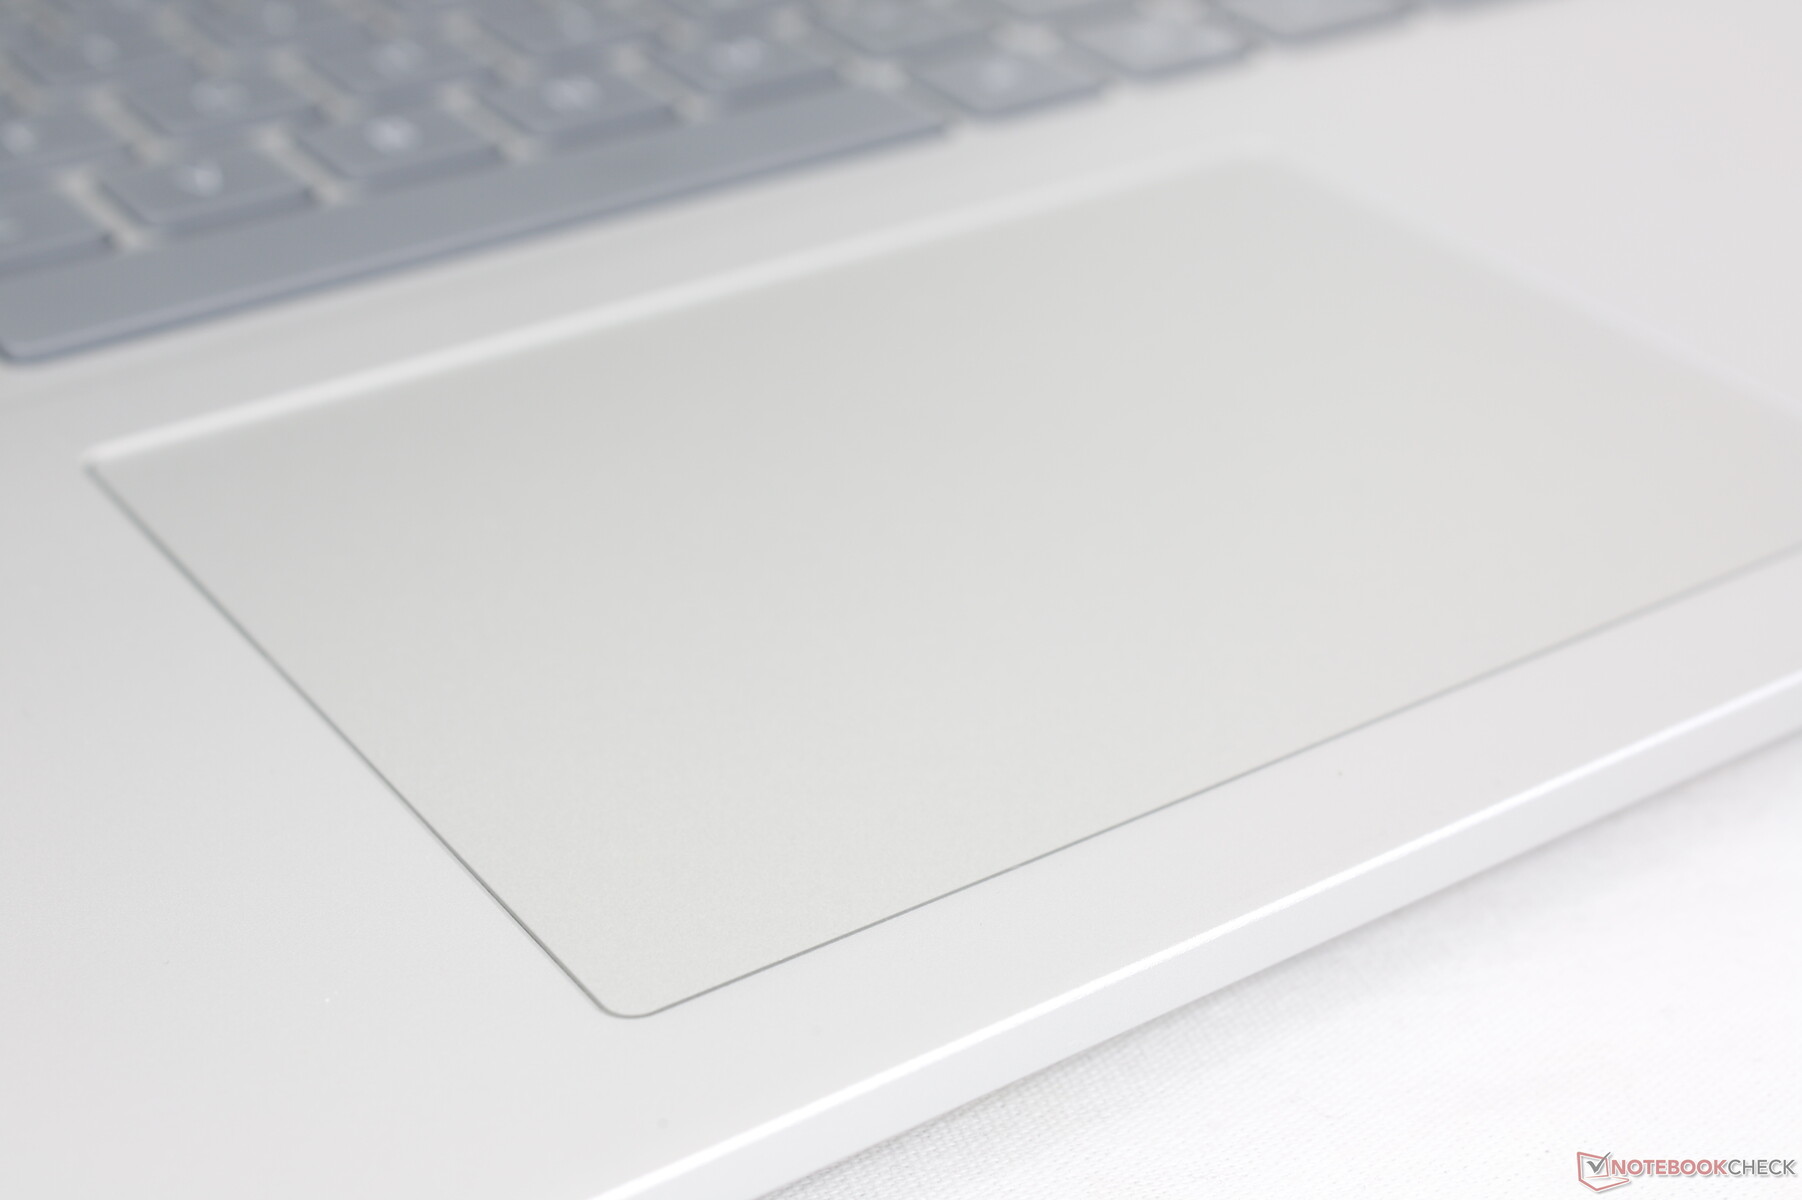
Pekplatta
Klickplattan är lika stor som den på förra årets modell (11,5 x 8 cm). Glidningen är mjuk med lite stickningar vid långsammare hastigheter för mer exakta inmatningar. Återkopplingen när du trycker ned klickplattan är tyvärr på den mjuka sidan trots det höga klicket.
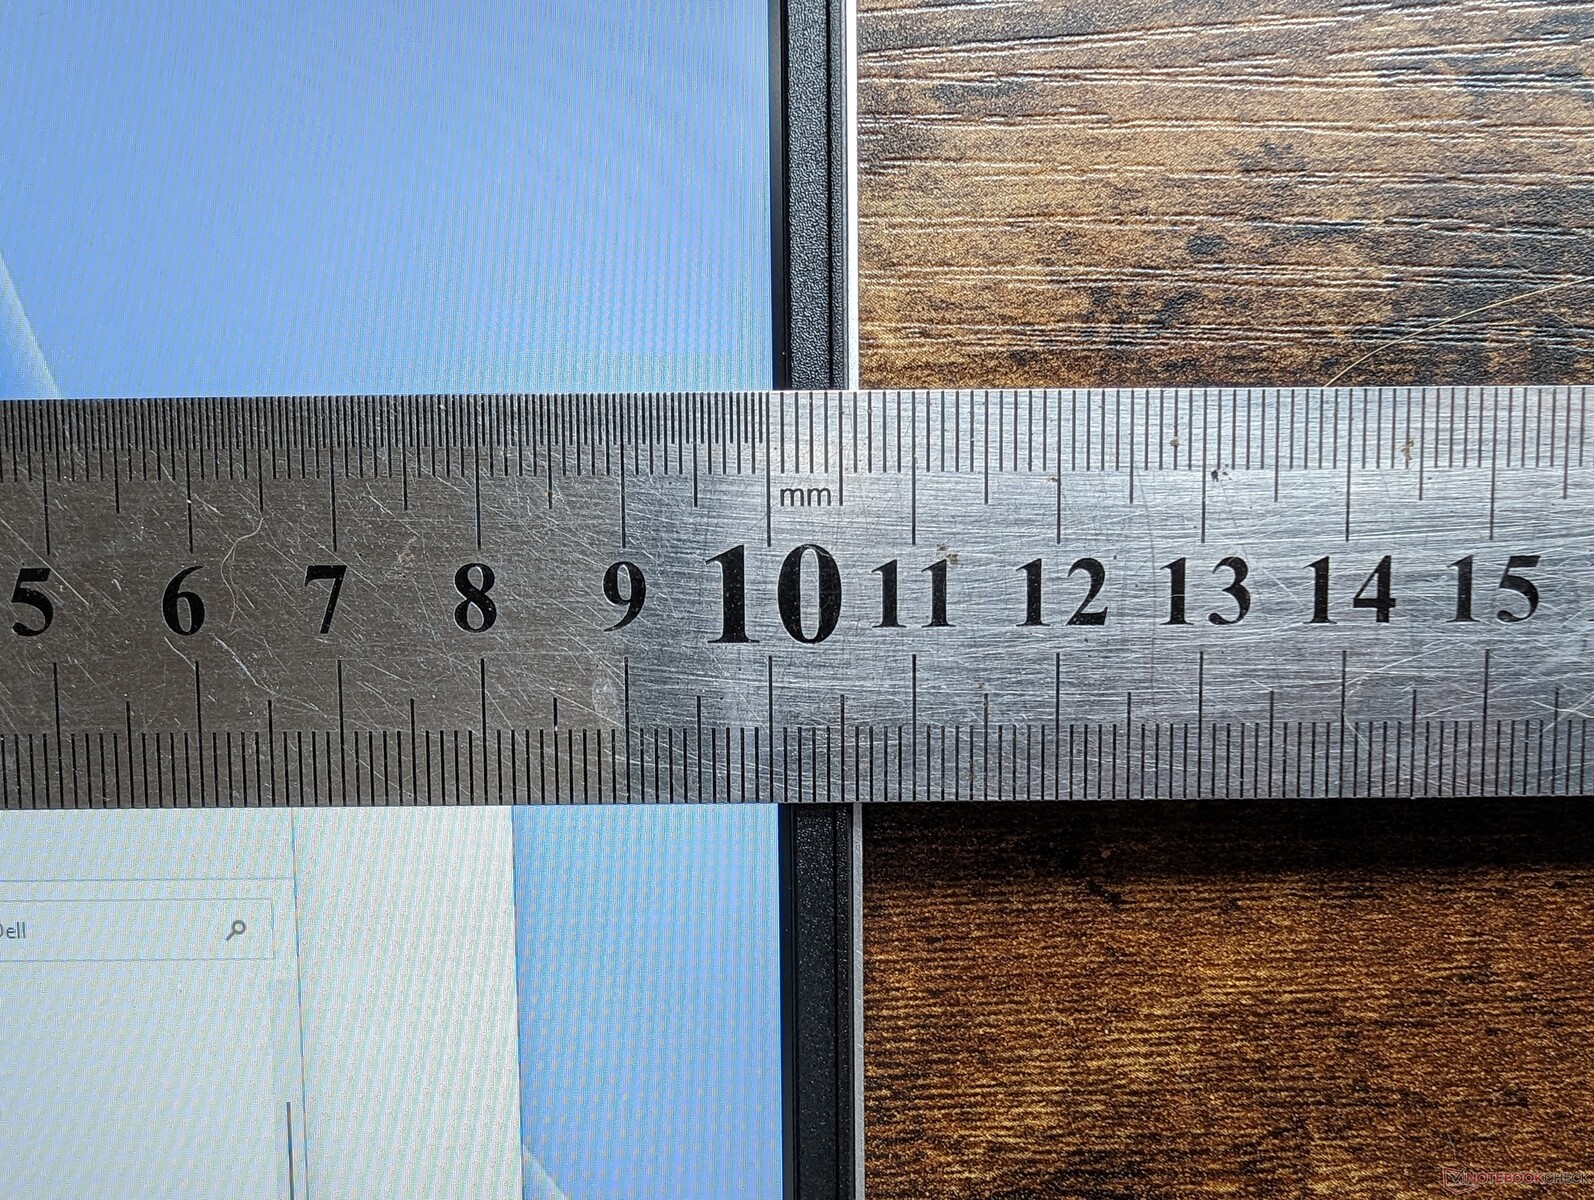
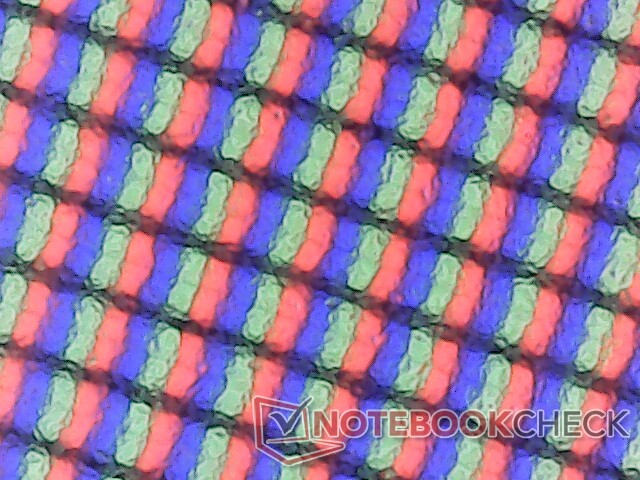
Display - hyfsad men begränsade alternativ
Skärmalternativen har ändrats från den äldre Inspiron 16 Plus 7620. Borta är 3K 3072 x 1920-panelen till förmån för dessa två nya alternativ:
- 2560 x 1600 (2,5K), 120 Hz
- 1920 x 1200, 60 Hz
Båda alternativen är IPS och beröringsfria och ingen av dem stöder G-Sync. Våra mätningar nedan återspeglar endast det fetmarkerade 1600p-alternativet.
Jämfört med förra årets BOE 3K-panel har den nya LG Philips 2,5K-panelen dubbelt så hög inbyggd uppdateringsfrekvens till priset av en lägre inbyggd upplösning. Full sRGB-täckning, 300-nit ljusstyrka, >1000:1 kontrastförhållande och genomsnittliga svarstider är annars ganska lika mellan dem. Icke desto mindre är konkurrerande modeller som Vivobook Pro 16X eller Envy 16 erbjuder alla alternativ med högre upplösning och ännu djupare färger som innehållsskapare kan uppskatta. Vår LG Philips-panel är mer budgetmedveten som ett resultat.
| |||||||||||||||||||||||||
Distribution av ljusstyrkan: 92 %
Mitt på batteriet: 299.4 cd/m²
Kontrast: 1426:1 (Svärta: 0.21 cd/m²)
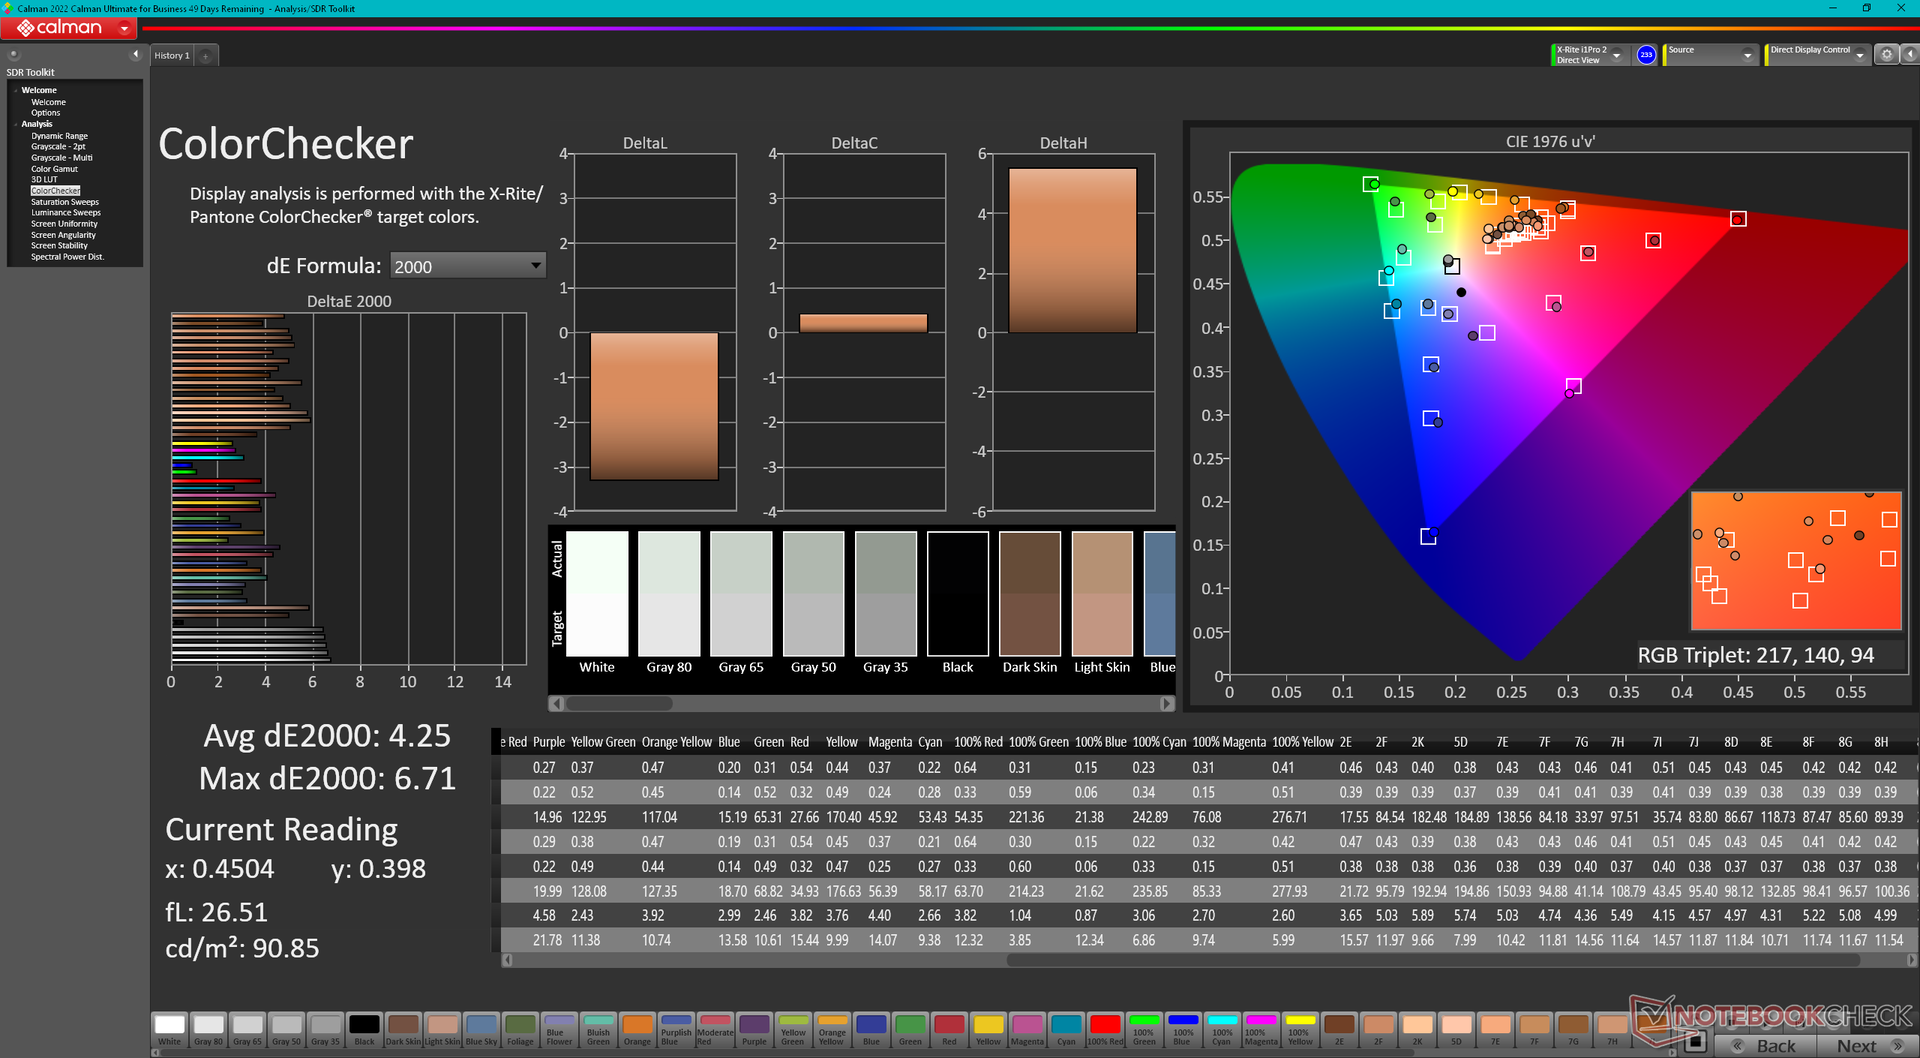
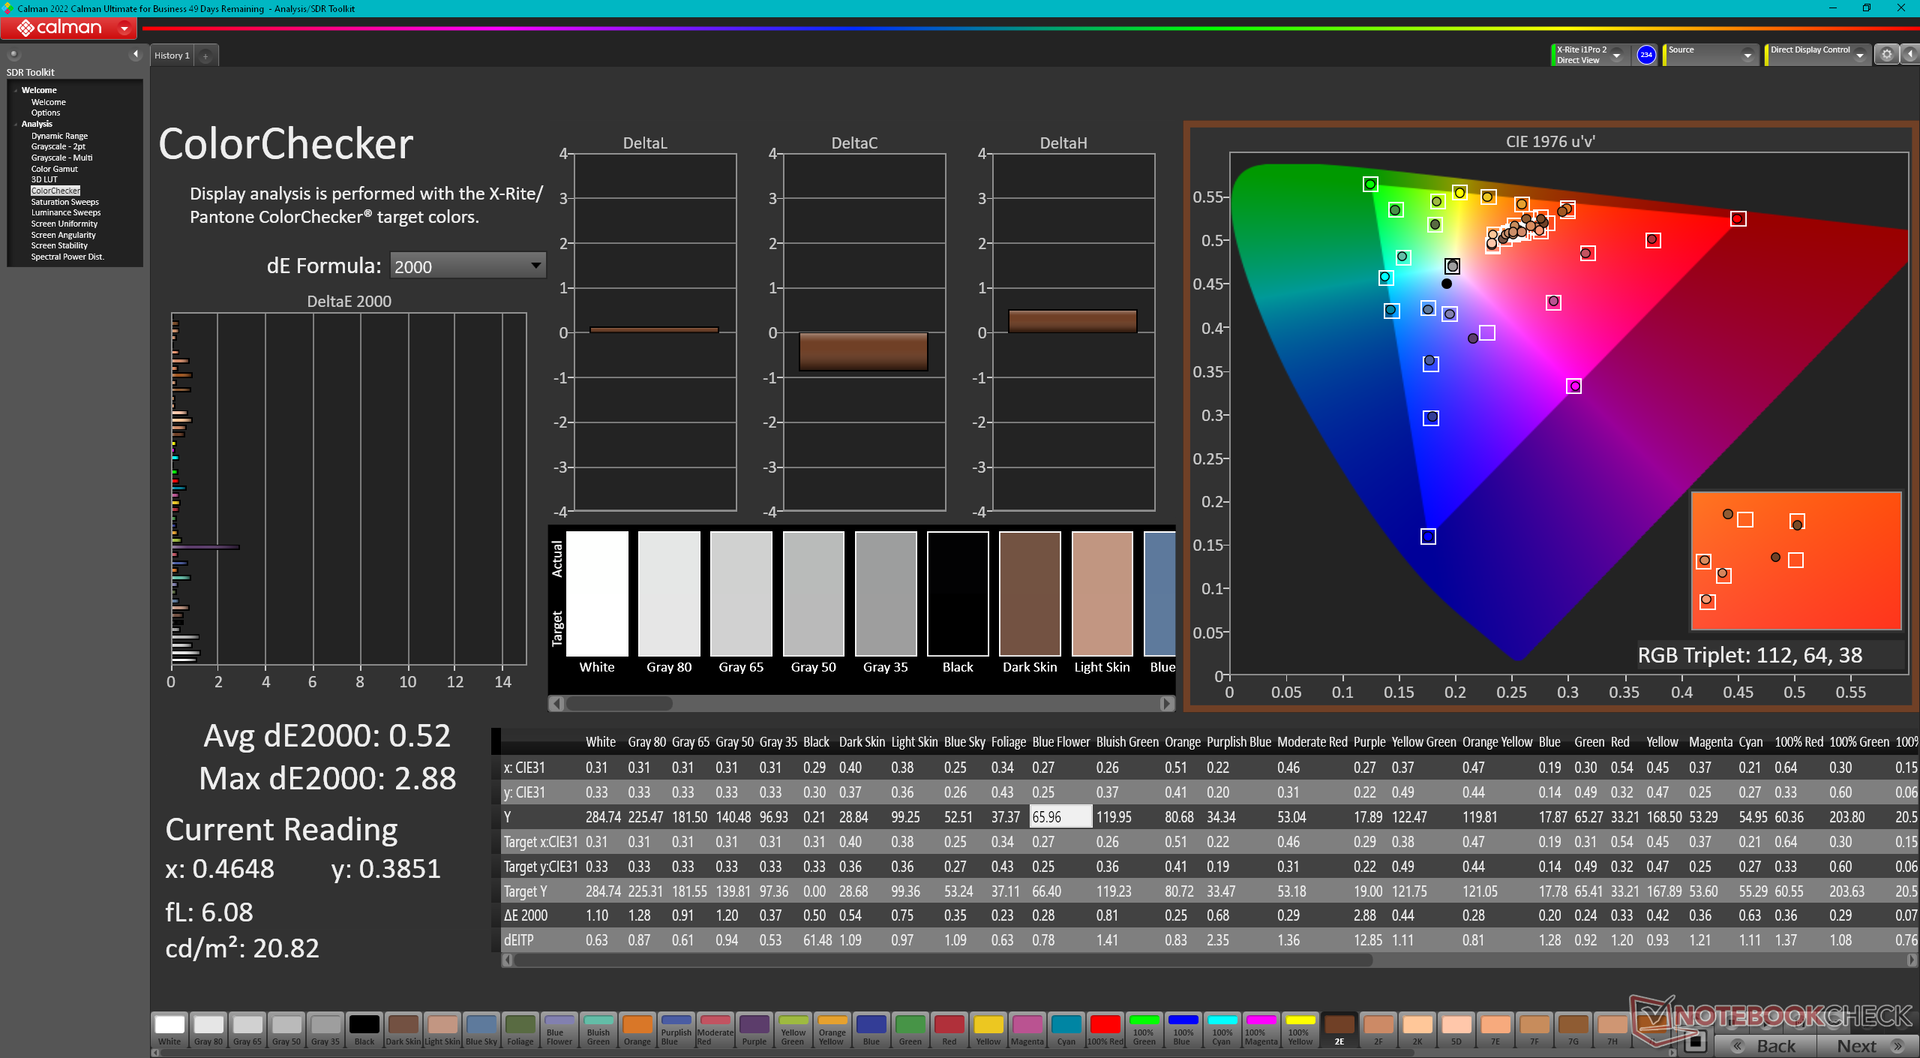
ΔE ColorChecker Calman: 4.25 | ∀{0.5-29.43 Ø4.71}
calibrated: 0.52
ΔE Greyscale Calman: 5.5 | ∀{0.09-98 Ø4.96}
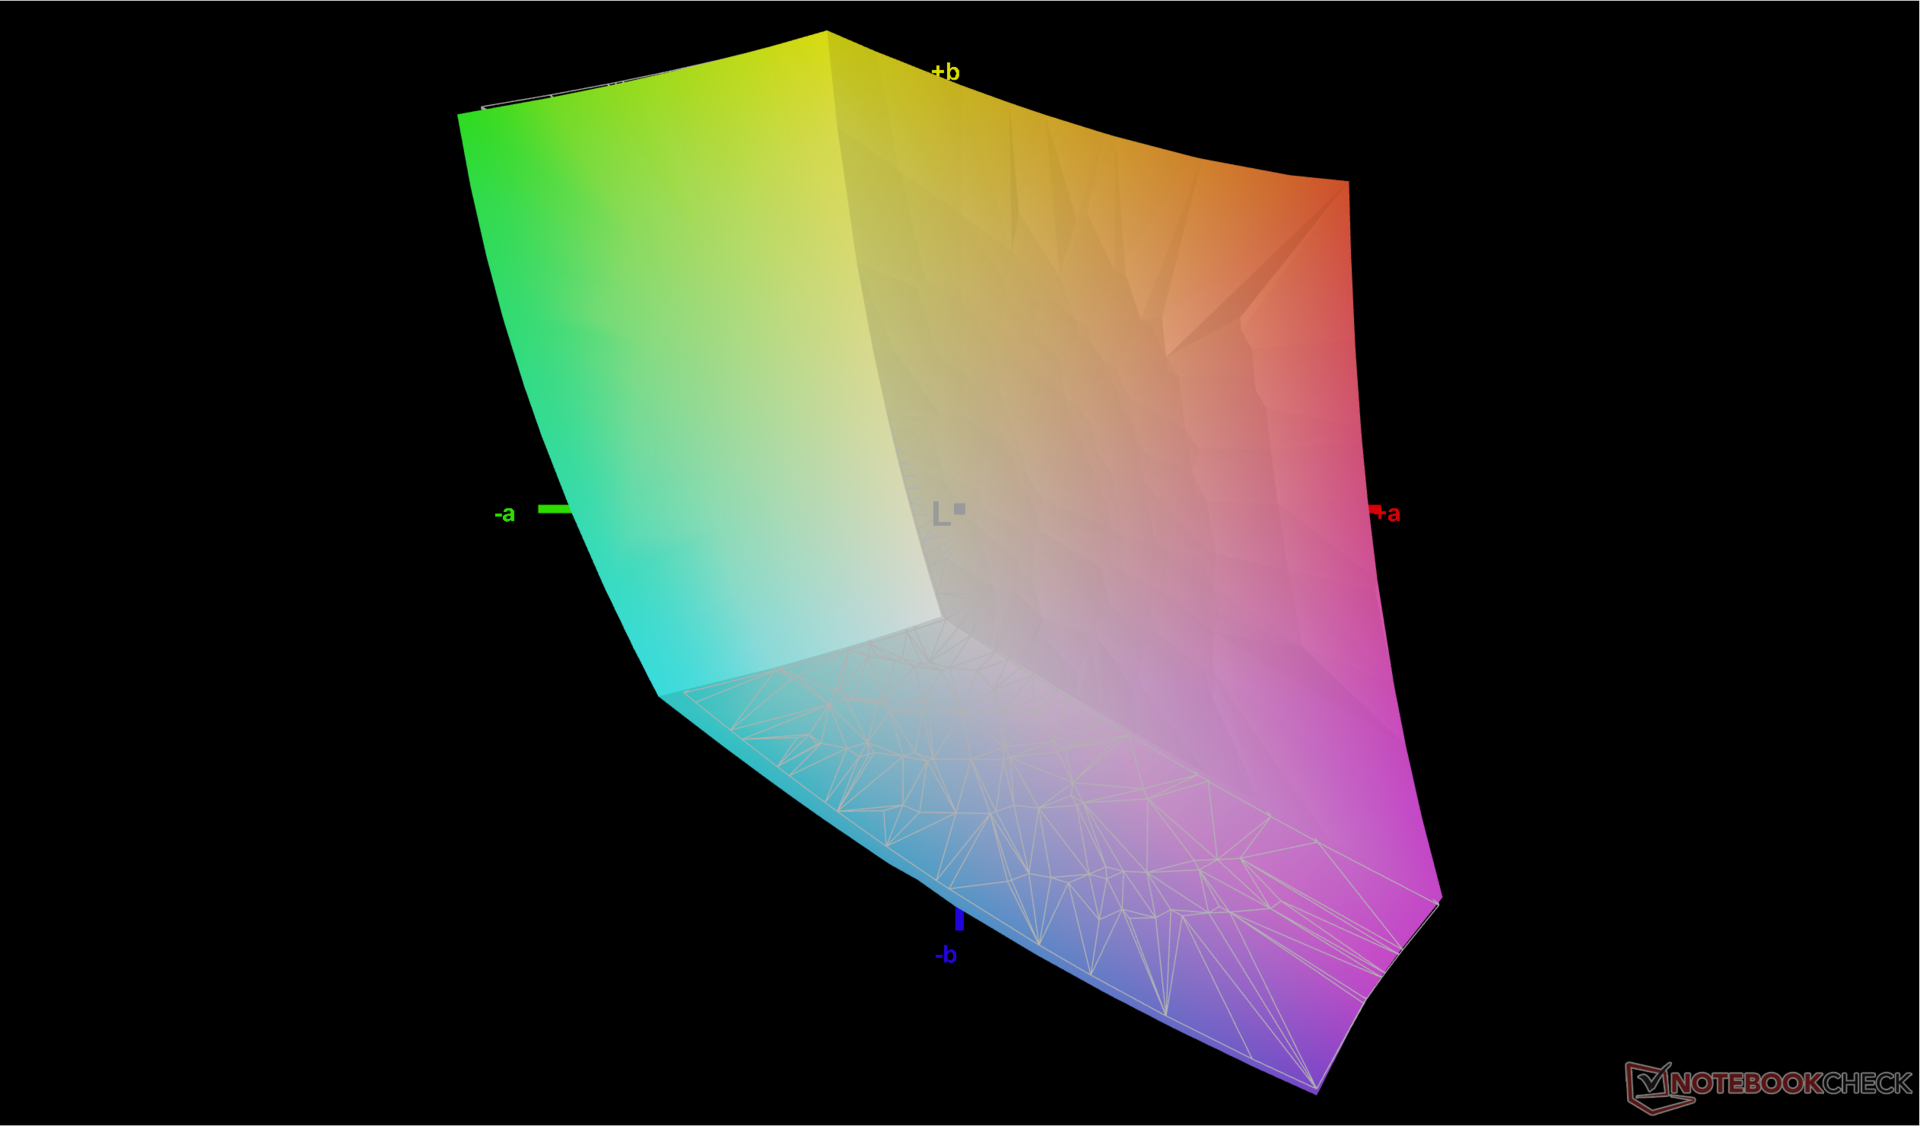
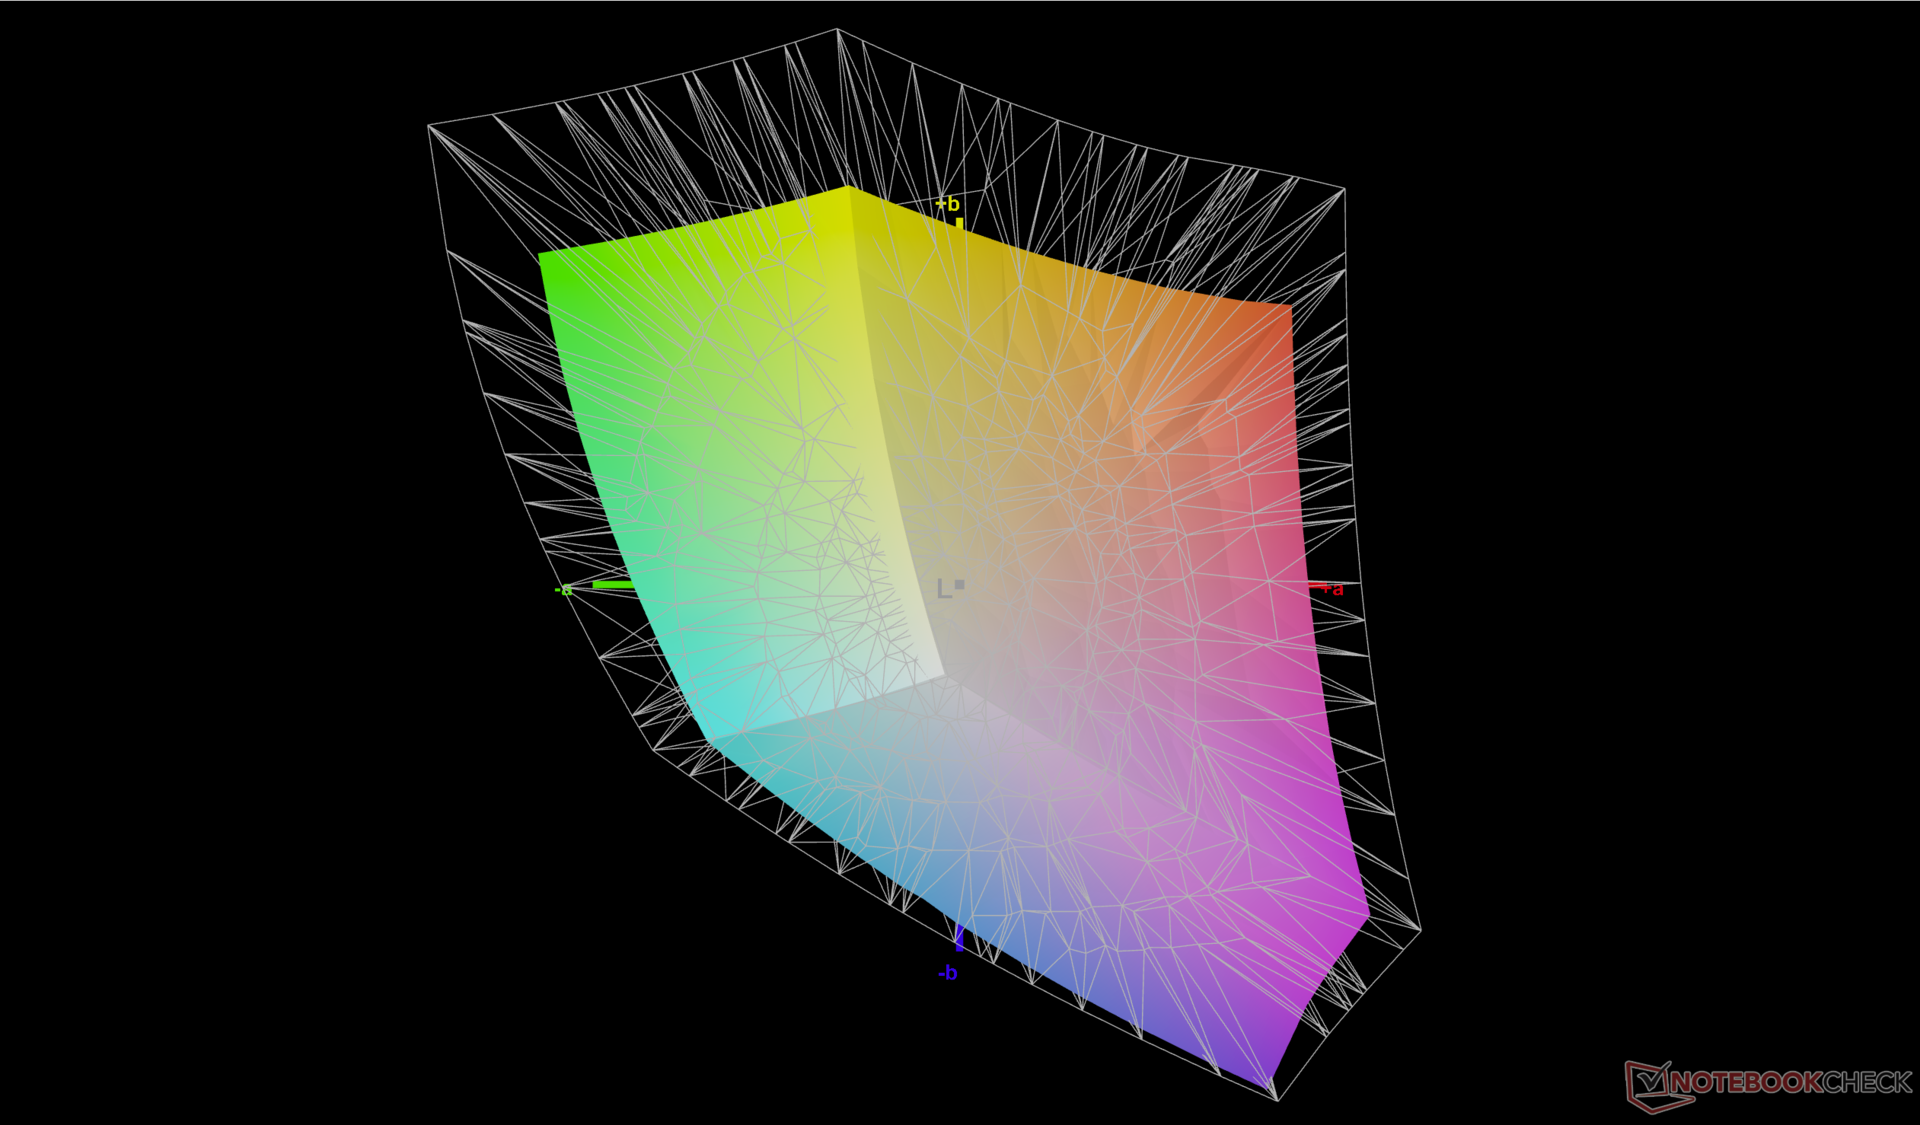
72.3% AdobeRGB 1998 (Argyll 3D)
99.6% sRGB (Argyll 3D)
70.1% Display P3 (Argyll 3D)
Gamma: 2.35
CCT: 6368 K
| Dell Inspiron 16 Plus 7630 LG Philips 160WQ2, IPS, 2560x1600, 16" | Dell Inspiron 16 Plus 7620 BOE NE16N41, IPS, 3072x1920, 16" | Lenovo Slim Pro 9i 16IRP8 LEN160-3.2K, Mini-LED, 3200x2000, 16" | Asus Vivobook Pro 16X K6604JV-MX016W Samsung SDC4178 ATNA60BX01-1, OLED, 3200x2000, 16" | HP Envy 16 h0112nr Samsung SDC4174, OLED, 3840x2400, 16" | MSI Summit E16 Flip A12UDT-031 AU Optronics B16QAN02.N, IPS, 2560x1600, 16" | |
|---|---|---|---|---|---|---|
| Display | 1% | 18% | 24% | 21% | 20% | |
| Display P3 Coverage (%) | 70.1 | 70.8 1% | 95.1 36% | 98.4 40% | 99.3 42% | 98.9 41% |
| sRGB Coverage (%) | 99.6 | 99.5 0% | 99.9 0% | 99.7 0% | 100 0% | 100 0% |
| AdobeRGB 1998 Coverage (%) | 72.3 | 73.2 1% | 84.6 17% | 95.8 33% | 88 22% | 86.5 20% |
| Response Times | -13% | 61% | 95% | 93% | 63% | |
| Response Time Grey 50% / Grey 80% * (ms) | 35 ? | 38 ? -9% | 14 ? 60% | 1.6 ? 95% | 2 ? 94% | 13 ? 63% |
| Response Time Black / White * (ms) | 24.2 ? | 28 ? -16% | 9.2 ? 62% | 1.4 ? 94% | 1.9 ? 92% | 9 ? 63% |
| PWM Frequency (Hz) | 5784 ? | 120 ? | 240.4 ? | |||
| Screen | 14% | -55% | 35% | 30% | -5% | |
| Brightness middle (cd/m²) | 299.4 | 288.9 -4% | 627.4 110% | 347 16% | 328.8 10% | 314 5% |
| Brightness (cd/m²) | 290 | 276 -5% | 618 113% | 346 19% | 332 14% | 294 1% |
| Brightness Distribution (%) | 92 | 92 0% | 95 3% | 97 5% | 97 5% | 89 -3% |
| Black Level * (cd/m²) | 0.21 | 0.26 -24% | 0.19 10% | 0.06 71% | 0.28 -33% | |
| Contrast (:1) | 1426 | 1111 -22% | 3302 132% | 5783 306% | 1121 -21% | |
| Colorchecker dE 2000 * | 4.25 | 1.88 56% | 5.84 -37% | 1.89 56% | 1.53 64% | 3.08 28% |
| Colorchecker dE 2000 max. * | 6.71 | 4.37 35% | 10.22 -52% | 3.26 51% | 6.04 10% | 5.49 18% |
| Colorchecker dE 2000 calibrated * | 0.52 | 0.42 19% | 4.45 -756% | 1.97 -279% | 0.88 -69% | |
| Greyscale dE 2000 * | 5.5 | 1.4 75% | 6.7 -22% | 1.55 72% | 1.3 76% | 3.99 27% |
| Gamma | 2.35 94% | 2.3 96% | 2.77 79% | 2.39 92% | 2.18 101% | 2.3 96% |
| CCT | 6368 102% | 6634 98% | 5795 112% | 6458 101% | 6362 102% | 6219 105% |
| Totalt genomsnitt (program/inställningar) | 1% /
8% | 8% /
-23% | 51% /
41% | 48% /
39% | 26% /
10% |
* ... mindre är bättre
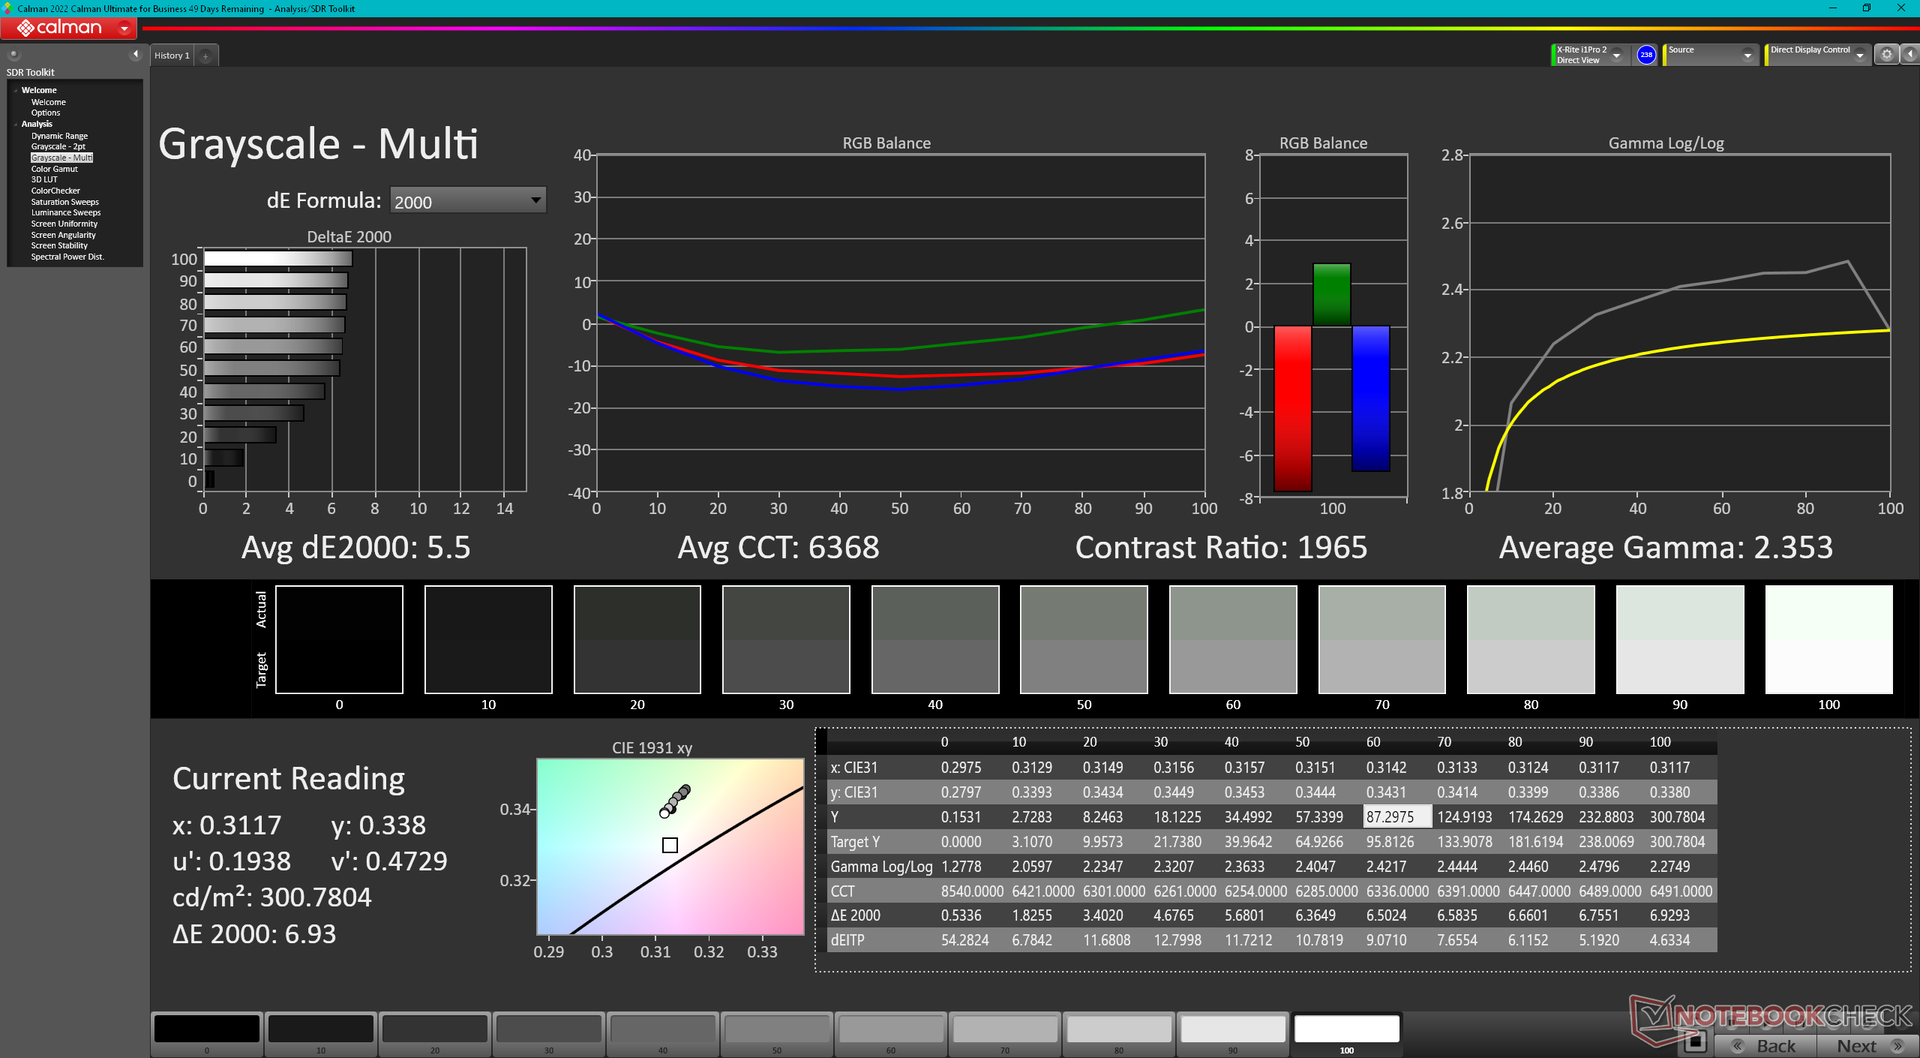
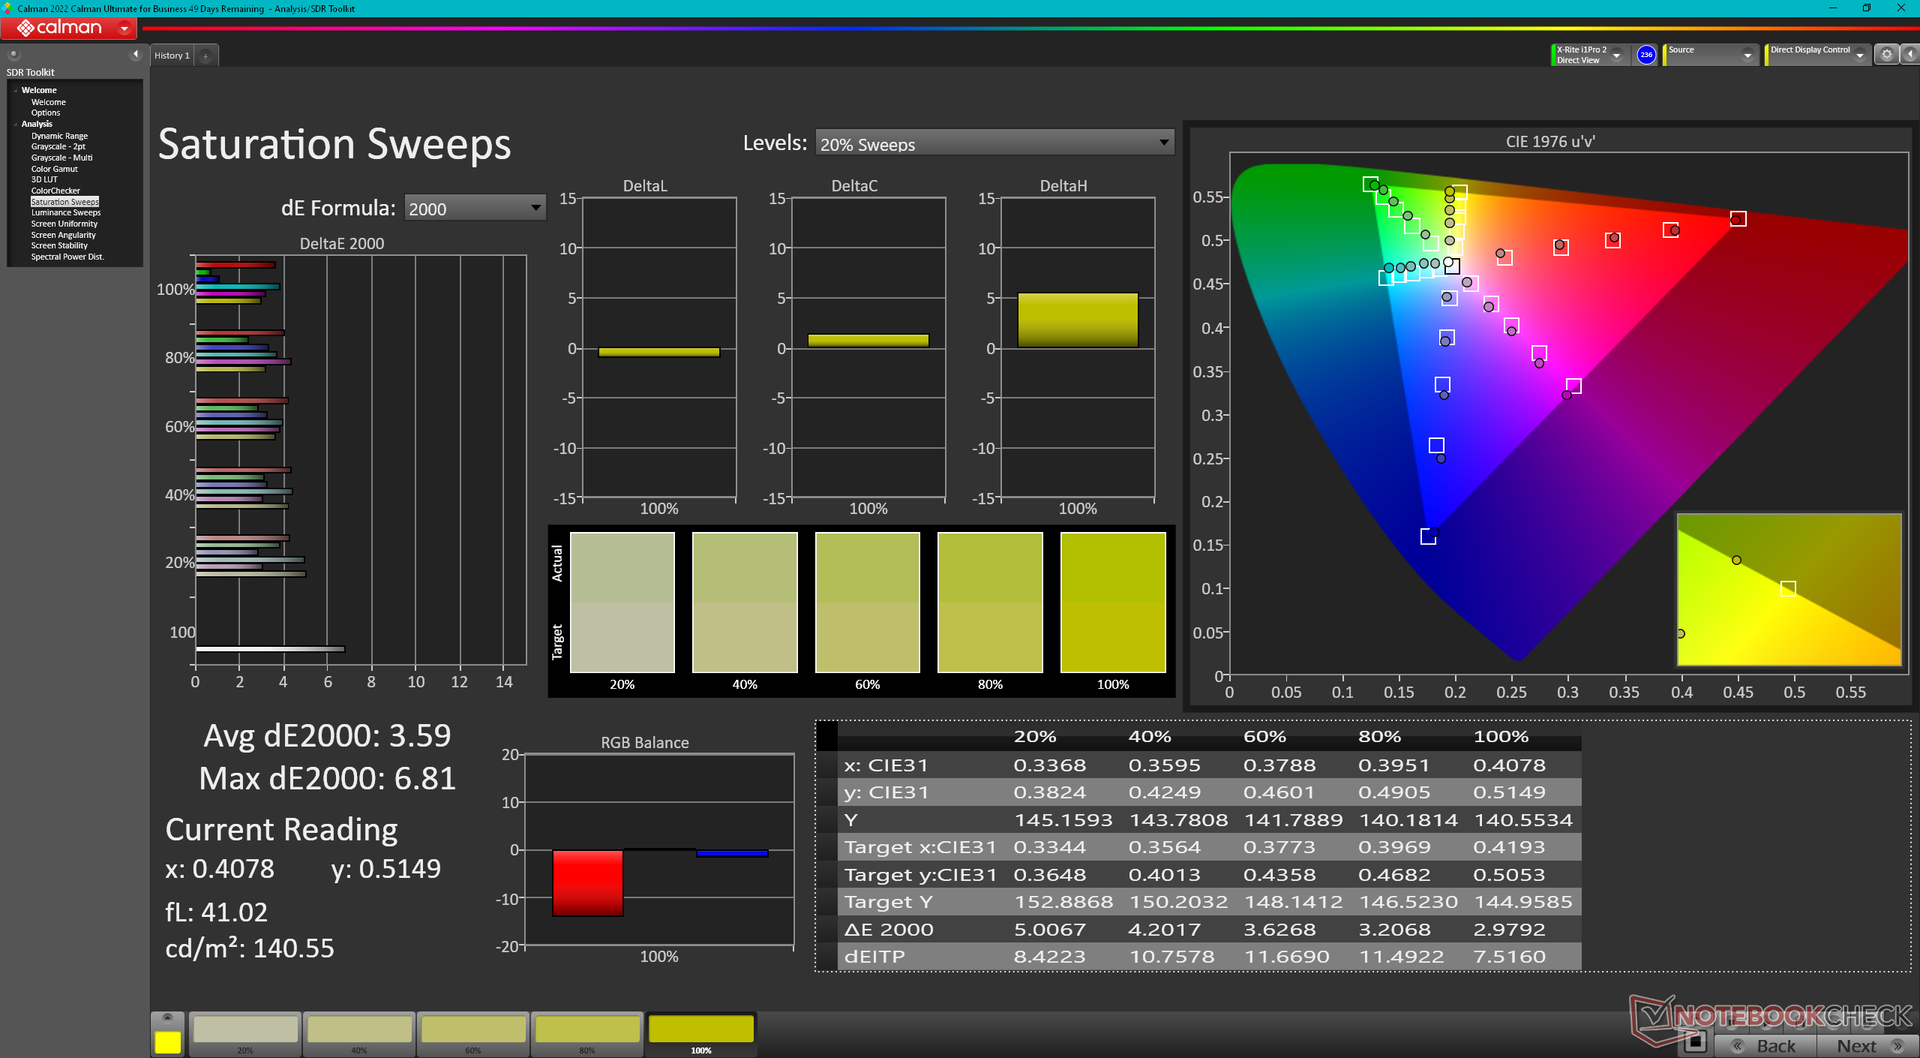
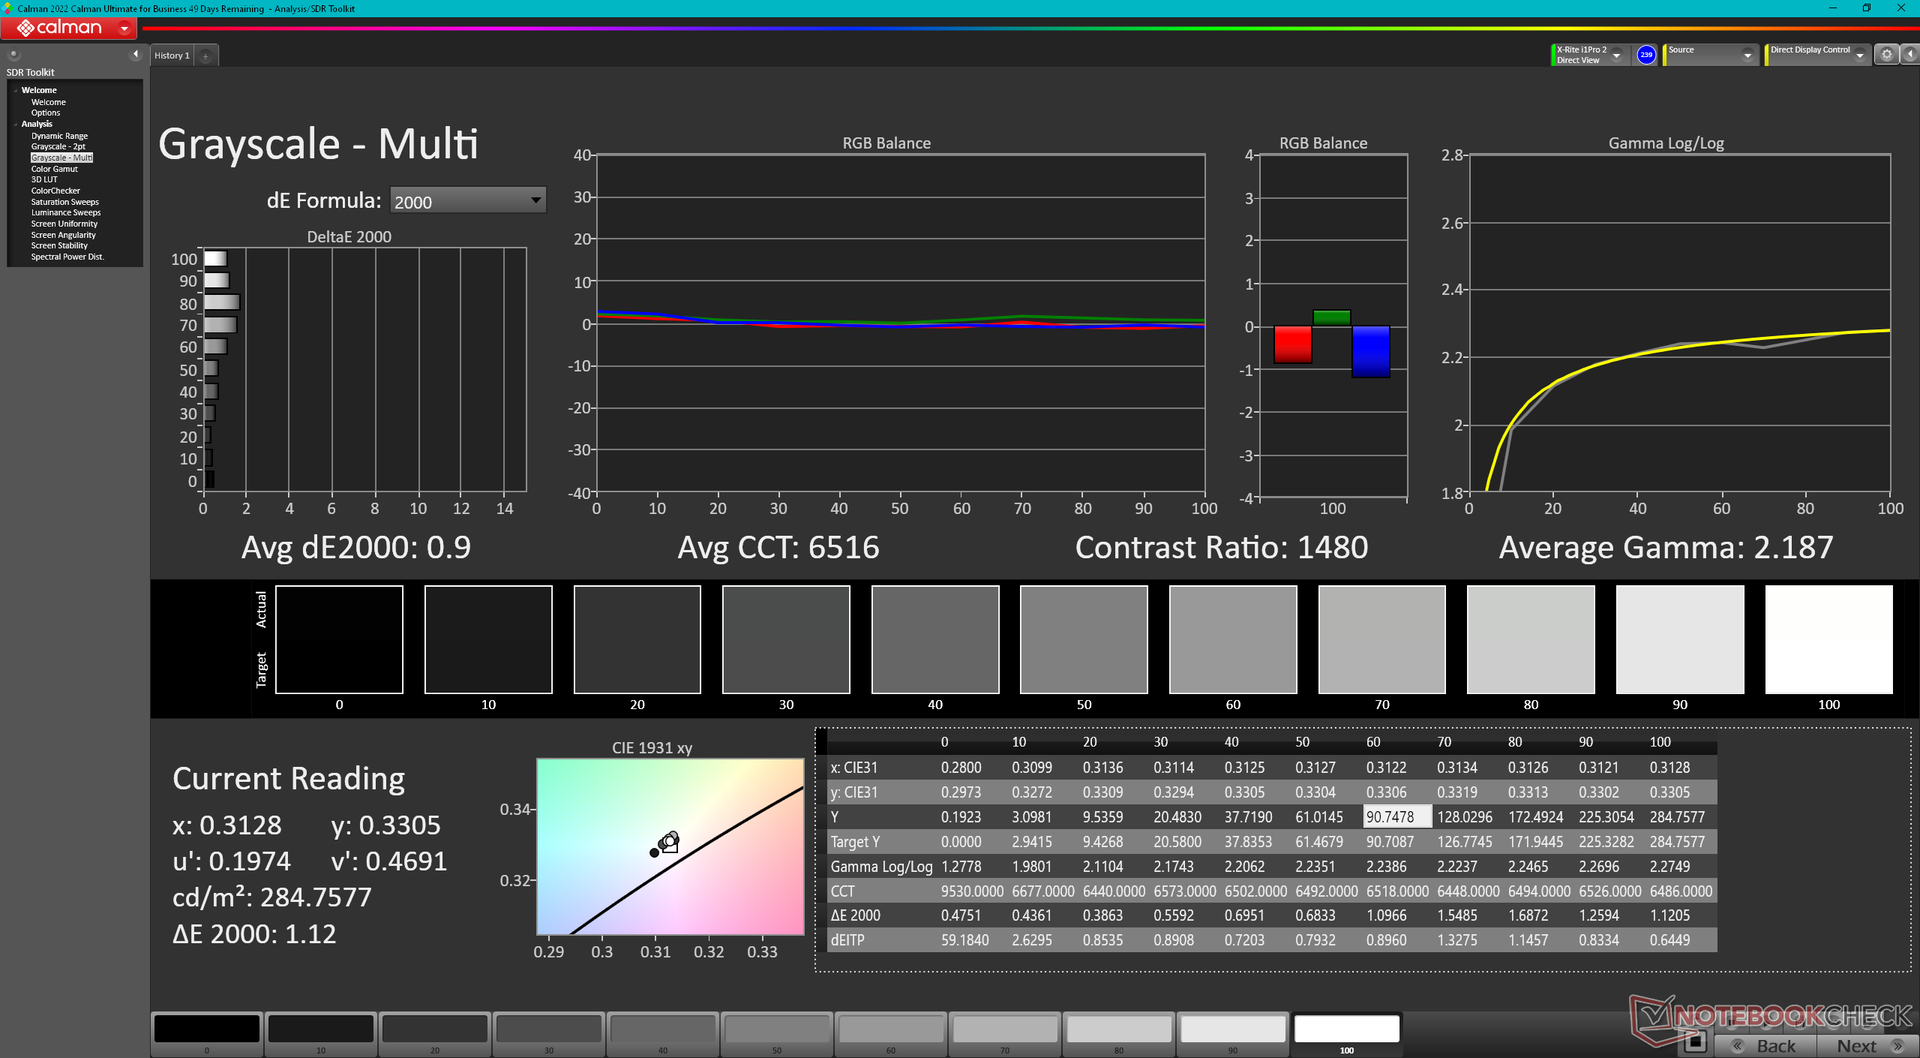
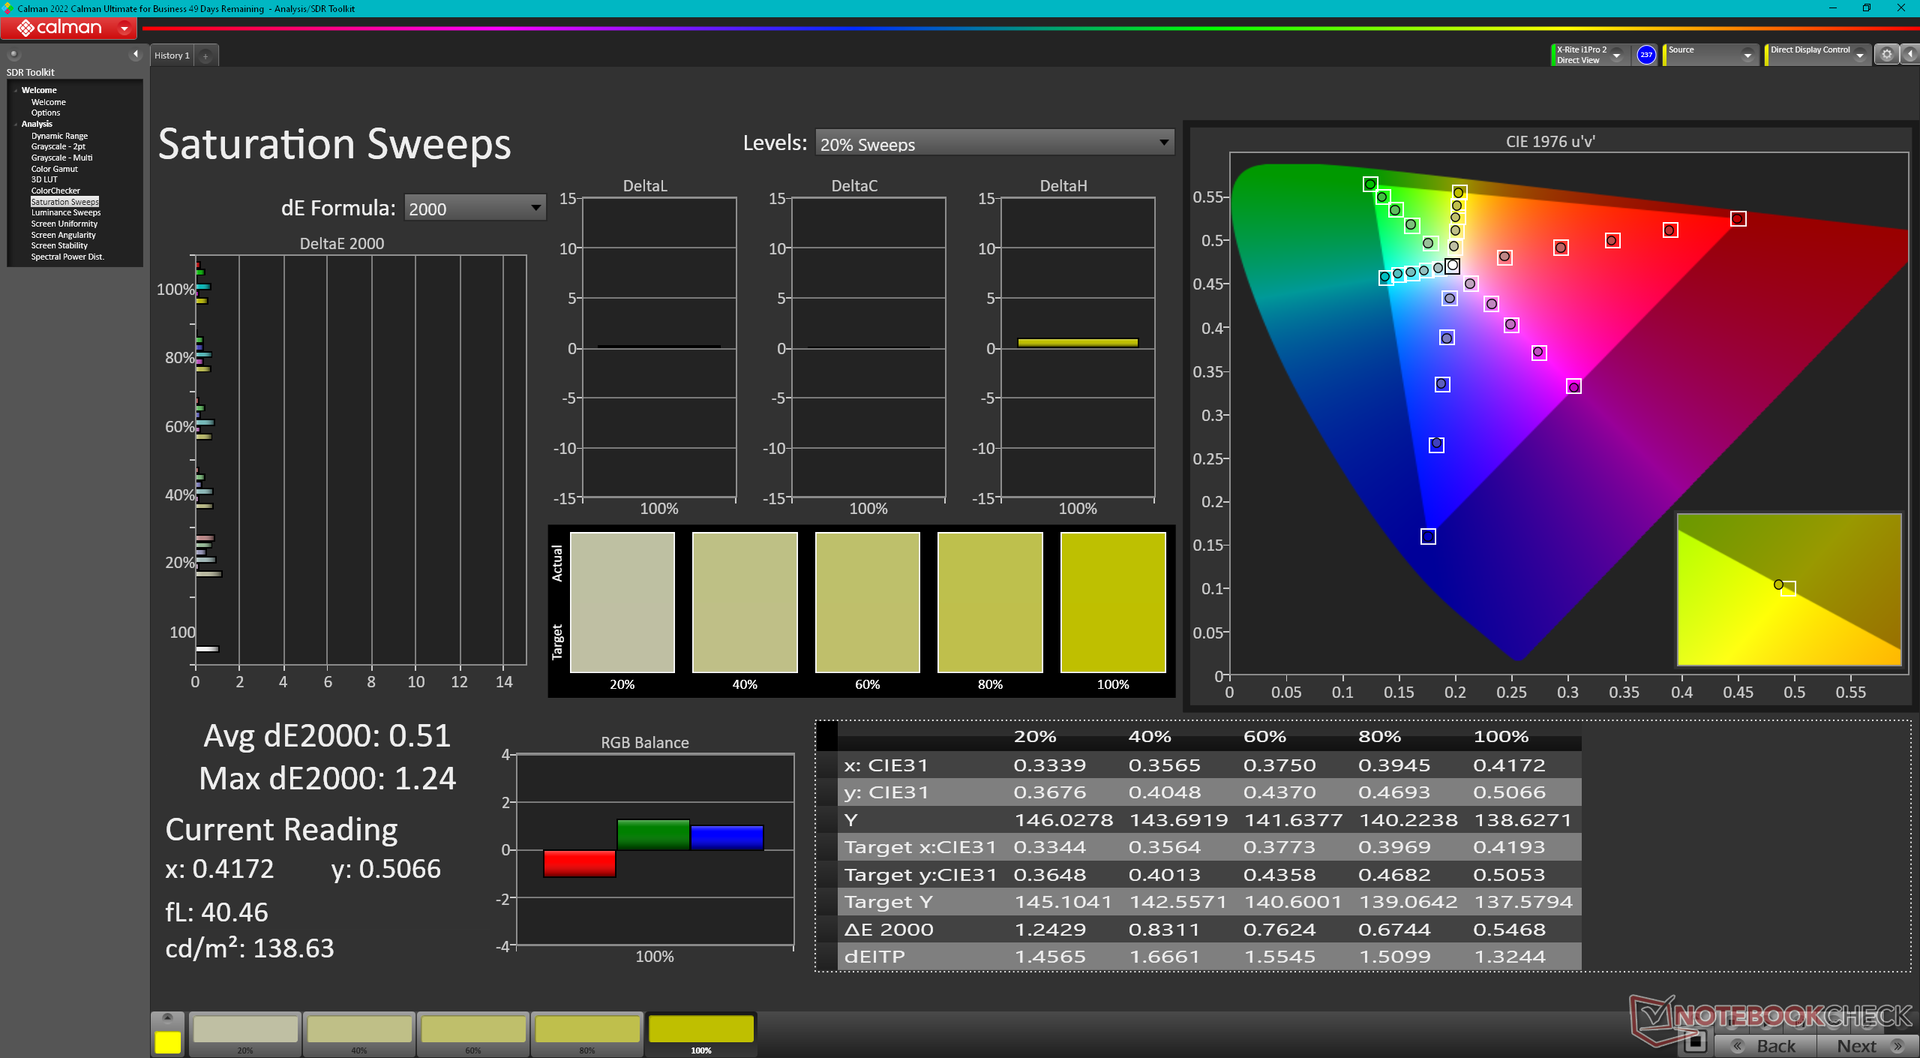
Skärmen är inte förkalibrerad med genomsnittliga deltaE-värden för gråskala och färg på 5,5 respektive 4,25. Färgtemperaturen är också varmare än vanligt på 6368. En korrekt kalibrering med vår X-Rite-kolorimeter skulle åtgärda alla dessa problem och ge en betydligt mer exakt bildskärm, vilket framgår av våra CalMAN-resultat nedan. Vår kalibrerade ICM-profil finns tillgänglig för gratis nedladdning om du inte har egna kalibreringsverktyg.
Visa svarstider
| ↔ Svarstid svart till vitt | ||
|---|---|---|
| 24.2 ms ... stiga ↗ och falla ↘ kombinerat | ↗ 10.8 ms stiga | 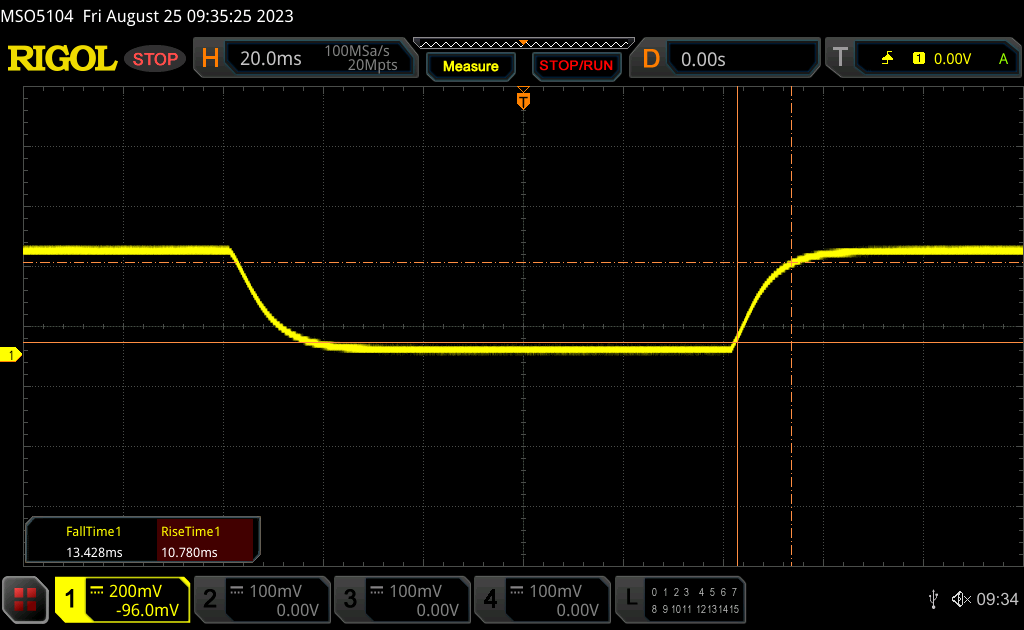 |
| ↘ 13.4 ms hösten | ||
| Skärmen visar bra svarsfrekvens i våra tester, men kan vara för långsam för konkurrenskraftiga spelare. I jämförelse sträcker sig alla testade enheter från 0.1 (minst) till 240 (maximalt) ms. » 57 % av alla enheter är bättre. Detta innebär att den uppmätta svarstiden är sämre än genomsnittet av alla testade enheter (19.8 ms). | ||
| ↔ Svarstid 50 % grått till 80 % grått | ||
| 35 ms ... stiga ↗ och falla ↘ kombinerat | ↗ 15.7 ms stiga | 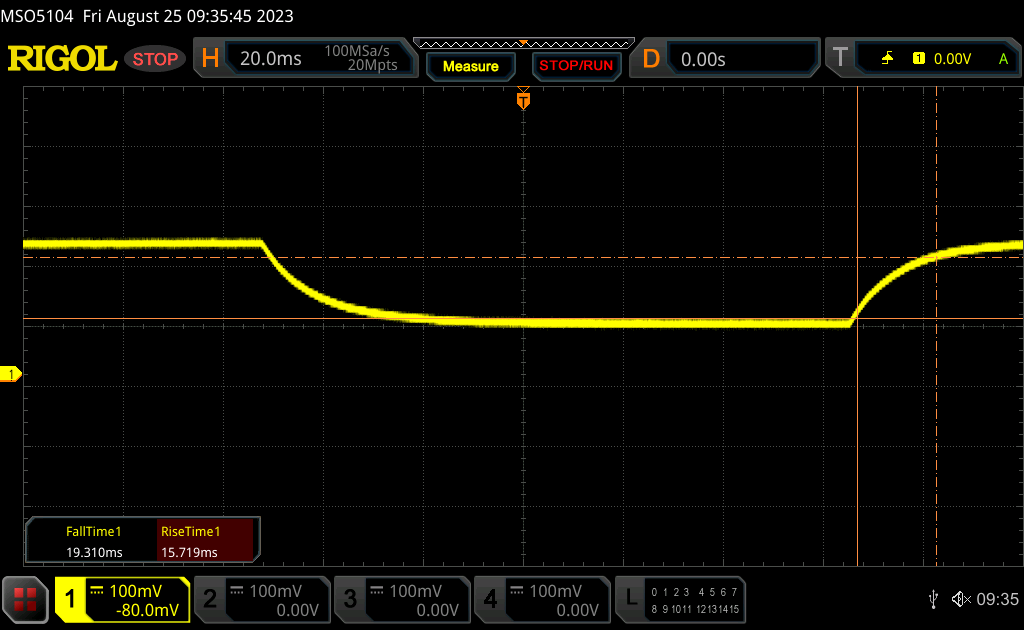 |
| ↘ 19.3 ms hösten | ||
| Skärmen visar långsamma svarsfrekvenser i våra tester och kommer att vara otillfredsställande för spelare. I jämförelse sträcker sig alla testade enheter från 0.165 (minst) till 636 (maximalt) ms. » 49 % av alla enheter är bättre. Detta innebär att den uppmätta svarstiden är sämre än genomsnittet av alla testade enheter (30.9 ms). | ||
Skärmflimmer / PWM (Puls-Width Modulation)
| Skärmflimmer / PWM upptäcktes inte | 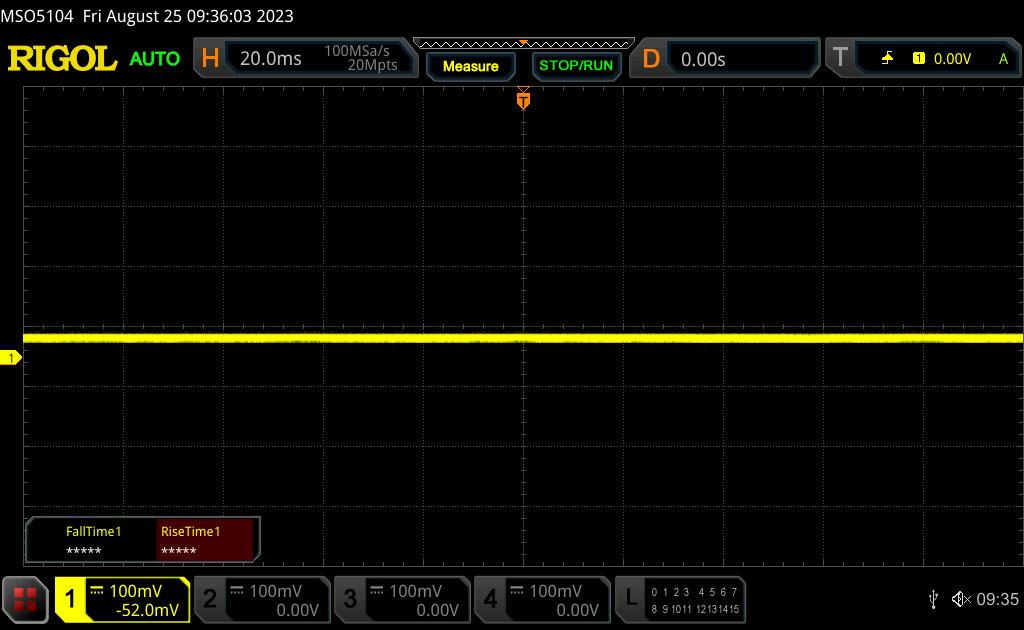 | ||
Som jämförelse: 52 % av alla testade enheter använder inte PWM för att dämpa skärmen. Om PWM upptäcktes mättes ett medelvärde av 7744 (minst: 5 - maximum: 343500) Hz. | |||
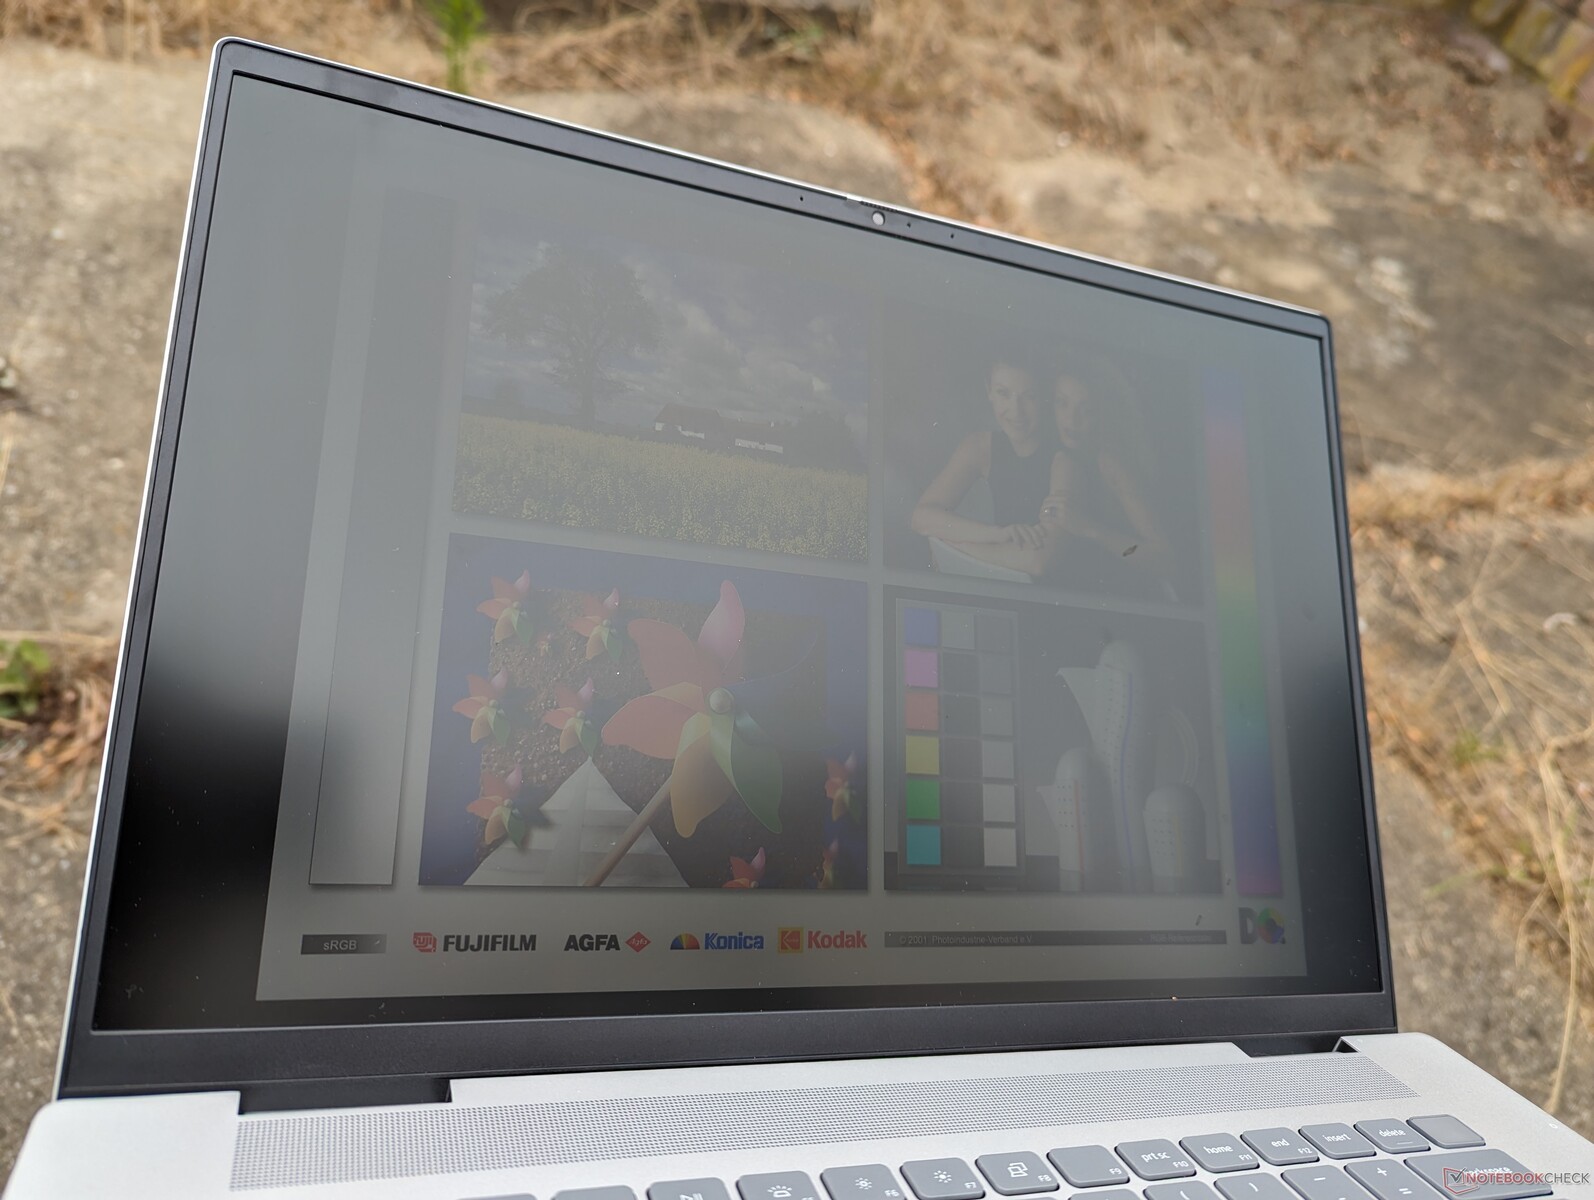
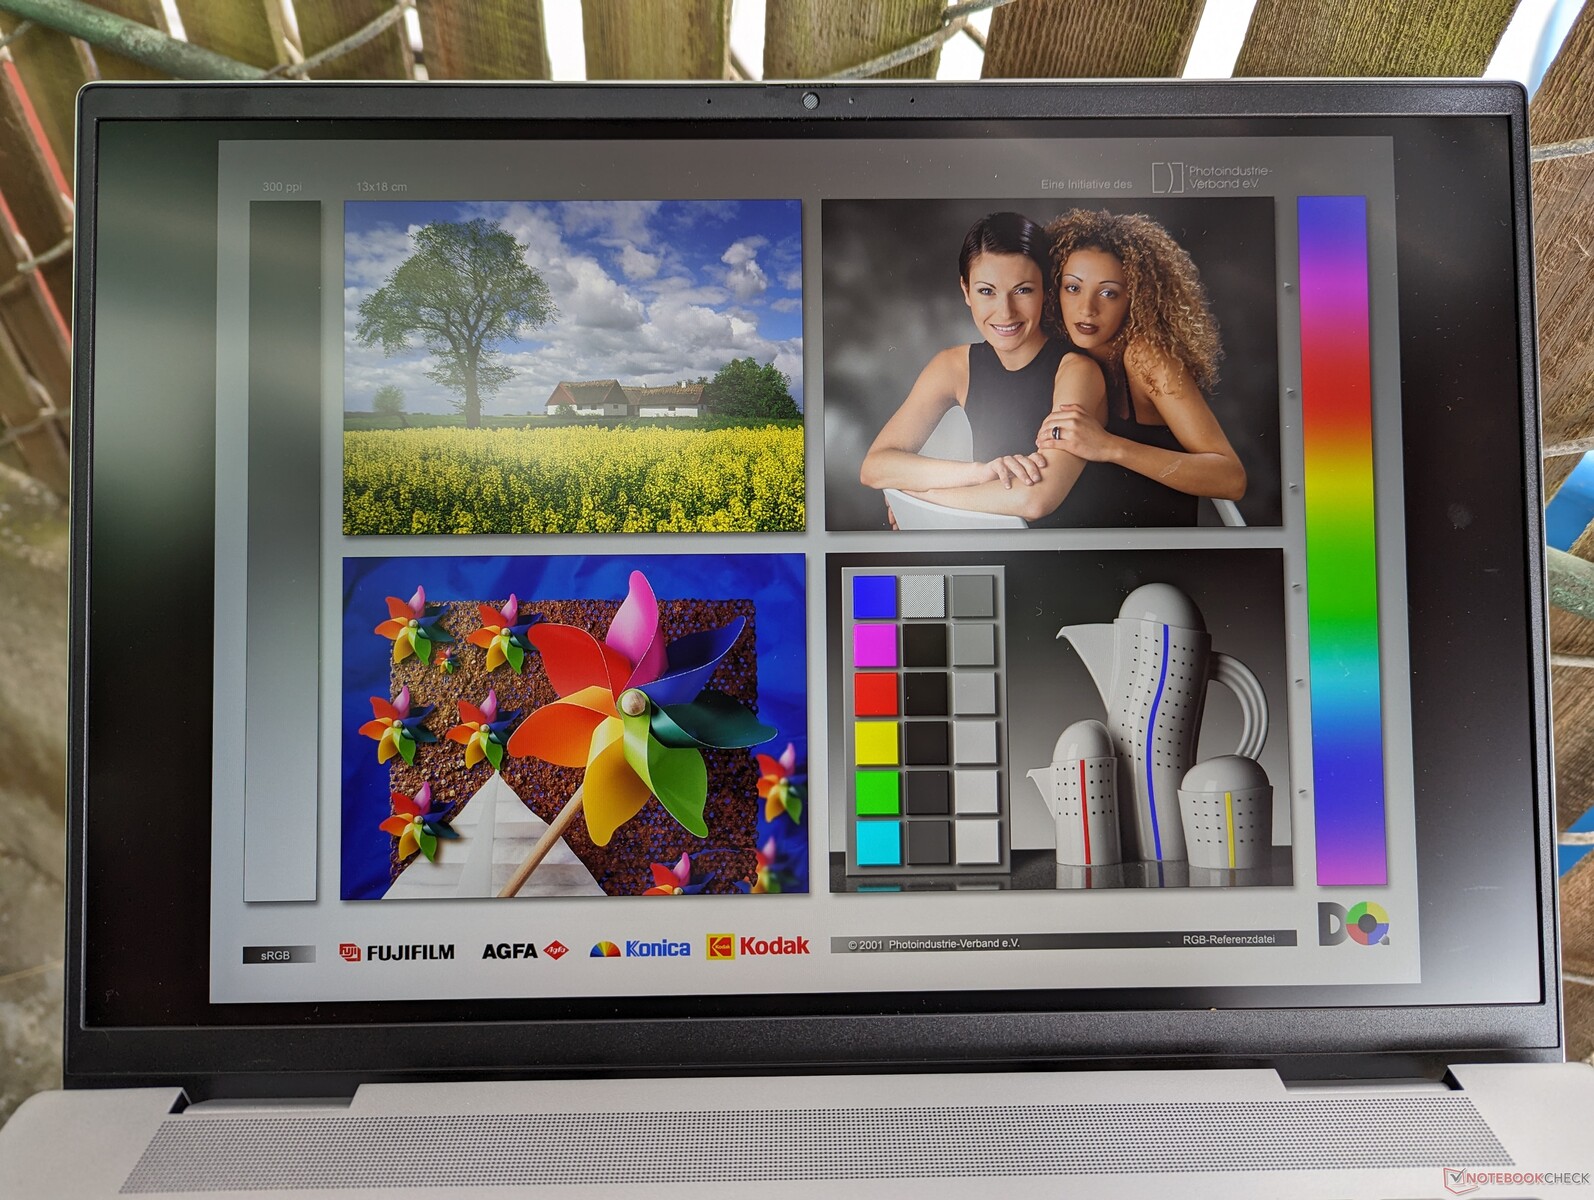
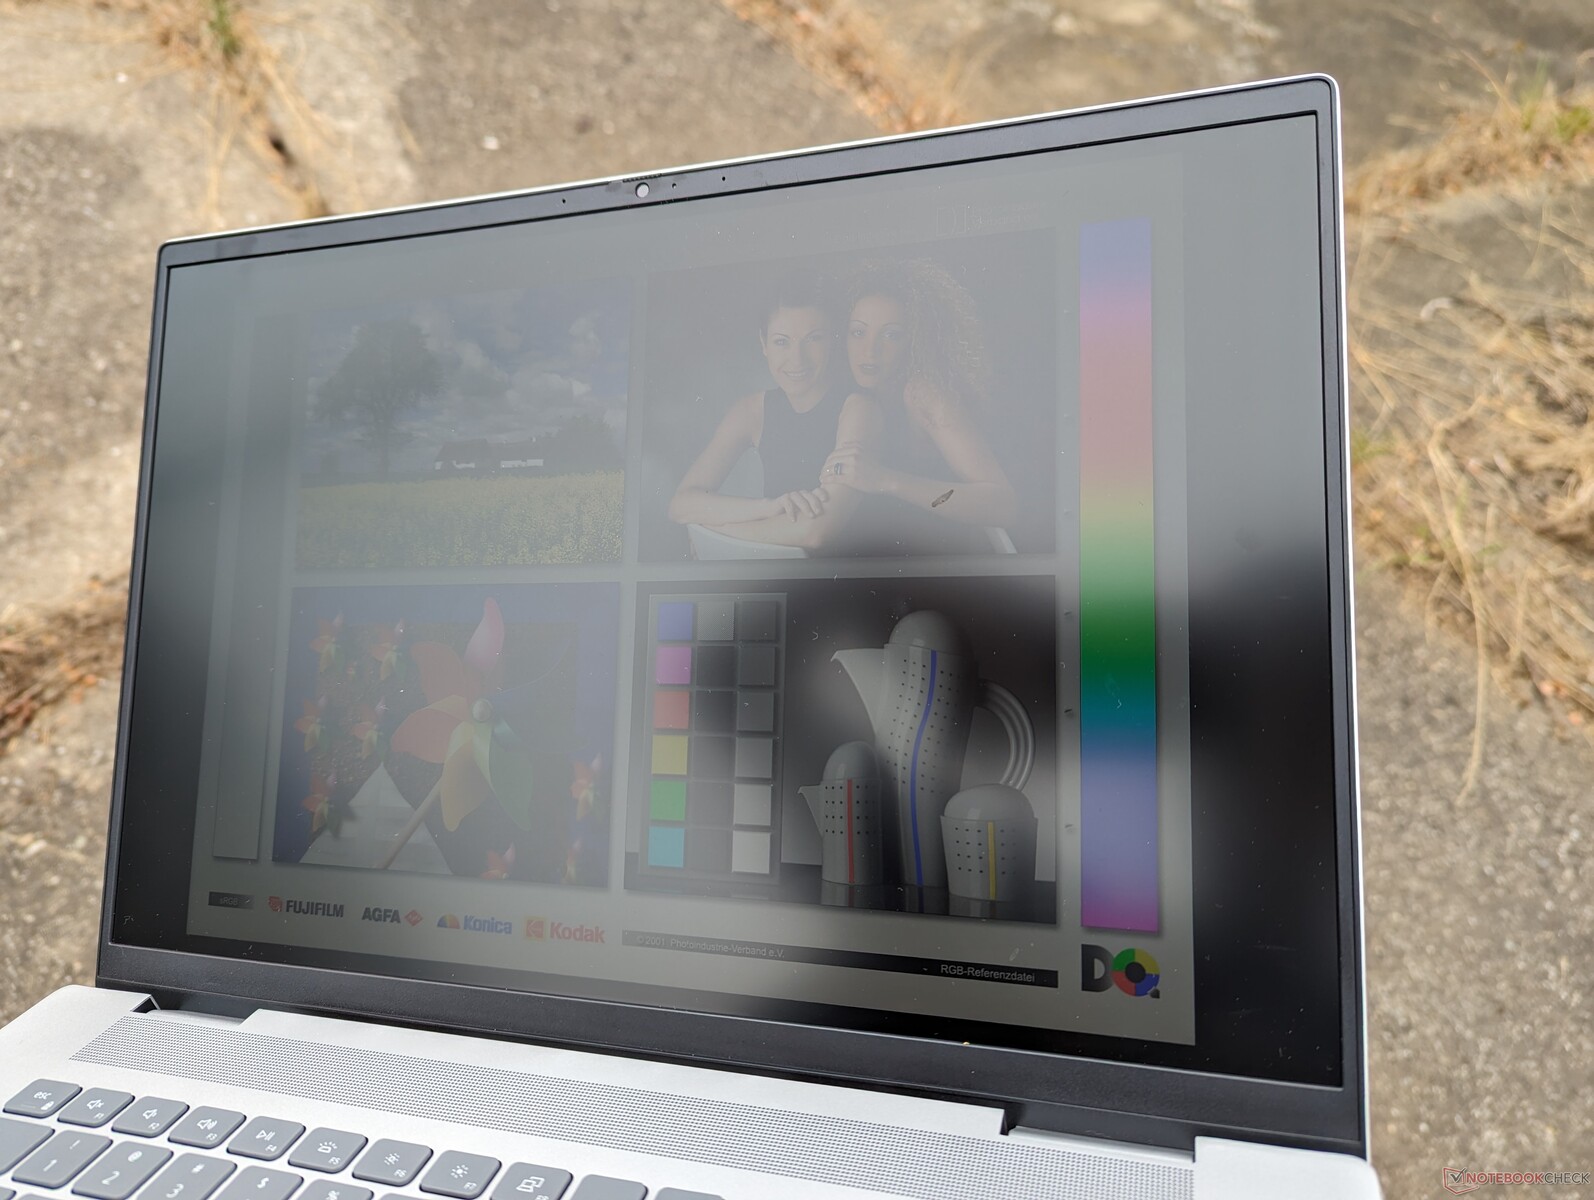
Sikten utomhus är jämförbar med förra årets modell och bra endast när den står i skugga för att minimera bländning. Andra 16-tums laptops med mini-LED eller OLED som Yoga 9i 16 eller Razer Blade 16 tenderar att vara ljusare för förbättrad synlighet utomhus, men de är också mycket dyrare än vår Dell.
Prestanda - Intel 13:e generationens Raptor Lake-H
Villkor för testning
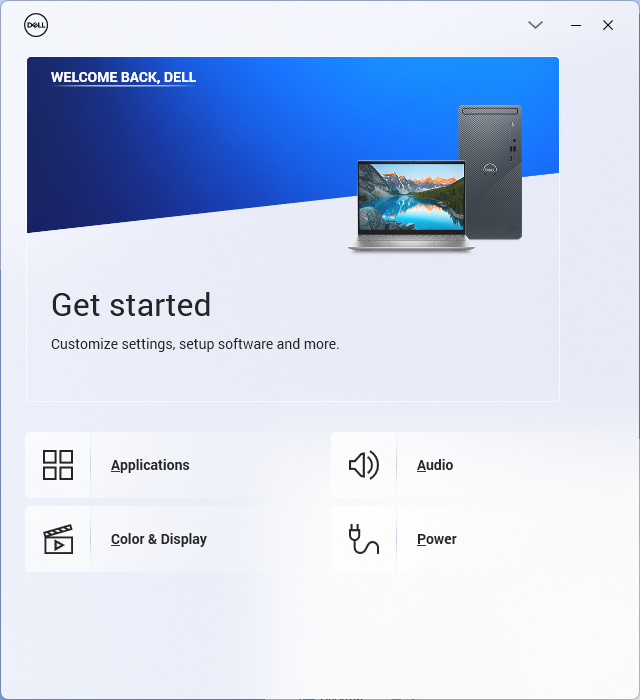
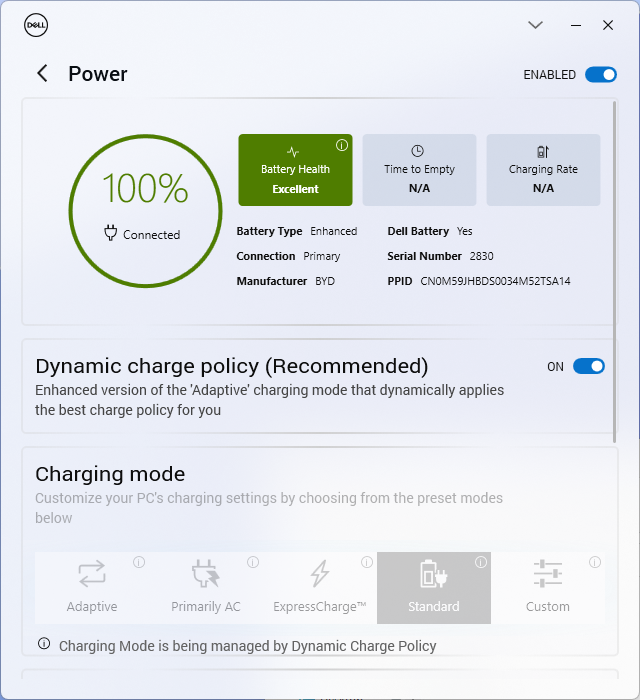
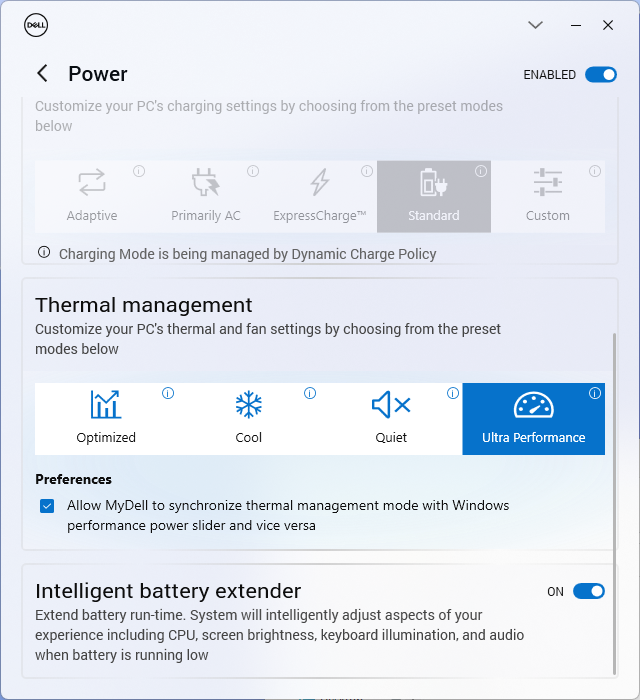
Vi ställde in vår enhet i prestandaläge via den förinstallerade MyDell-programvaran innan vi körde riktmärkena nedan. MyDells energiprofiler kan synkroniseras med Windows energiprofiler för att minska förvirring och undvika motstridiga inställningar.
Inspiron har inte stöd för Advanced Optimus eller MUX, som istället är vanliga funktioner på dedikerade spelmodeller från Dell G-serien eller Alienware-serien.
Processor
CPU-prestanda från vår 13:e generation Core i7-13700H är bara upp till 10 procent snabbare än 12:e generationens Core i7-12700H i förra årets Inspiron 16 Plus 7620. När deras respektive Turbo Boost-fördelar minskar blir dock prestandaskillnaderna ännu mindre, vilket framgår av våra CineBench R15 xT loop-resultat nedan. Med andra ord är Inspiron 16 Plus 7630 i bästa fall bara marginellt snabbare än förra årets modell när det gäller processorprestanda.
Nedgradering till Core i5-13500H förväntas endast påverka processorprestandan med cirka 10 procent baserat på vår erfarenhet med Asus VivoBook 14X. Under tiden har den AMD-baserade Ryzen 7 7840HS konfiguration förväntas prestera lika bra som vår Core i7-13700H.
Cinebench R15 Multi Loop
Cinebench R23: Multi Core | Single Core
Cinebench R20: CPU (Multi Core) | CPU (Single Core)
Cinebench R15: CPU Multi 64Bit | CPU Single 64Bit
Blender: v2.79 BMW27 CPU
7-Zip 18.03: 7z b 4 | 7z b 4 -mmt1
Geekbench 5.5: Multi-Core | Single-Core
HWBOT x265 Benchmark v2.2: 4k Preset
LibreOffice : 20 Documents To PDF
R Benchmark 2.5: Overall mean
* ... mindre är bättre
AIDA64: FP32 Ray-Trace | FPU Julia | CPU SHA3 | CPU Queen | FPU SinJulia | FPU Mandel | CPU AES | CPU ZLib | FP64 Ray-Trace | CPU PhotoWorxx
| Performance rating | |
| Asus Vivobook Pro 16X K6604JV-MX016W | |
| Lenovo Slim Pro 9i 16IRP8 | |
| Genomsnitt Intel Core i7-13700H | |
| Dell Inspiron 16 Plus 7630 | |
| MSI Summit E16 Flip A12UDT-031 | |
| HP Envy 16 h0112nr | |
| Dell Inspiron 16 Plus 7620 | |
| AIDA64 / FP32 Ray-Trace | |
| Asus Vivobook Pro 16X K6604JV-MX016W | |
| Lenovo Slim Pro 9i 16IRP8 | |
| Genomsnitt Intel Core i7-13700H (4986 - 18908, n=29) | |
| Dell Inspiron 16 Plus 7630 | |
| MSI Summit E16 Flip A12UDT-031 | |
| Dell Inspiron 16 Plus 7620 | |
| HP Envy 16 h0112nr | |
| AIDA64 / FPU Julia | |
| Asus Vivobook Pro 16X K6604JV-MX016W | |
| Lenovo Slim Pro 9i 16IRP8 | |
| Genomsnitt Intel Core i7-13700H (25360 - 92359, n=29) | |
| Dell Inspiron 16 Plus 7630 | |
| MSI Summit E16 Flip A12UDT-031 | |
| Dell Inspiron 16 Plus 7620 | |
| HP Envy 16 h0112nr | |
| AIDA64 / CPU SHA3 | |
| Asus Vivobook Pro 16X K6604JV-MX016W | |
| Lenovo Slim Pro 9i 16IRP8 | |
| Genomsnitt Intel Core i7-13700H (1339 - 4224, n=29) | |
| Dell Inspiron 16 Plus 7630 | |
| MSI Summit E16 Flip A12UDT-031 | |
| Dell Inspiron 16 Plus 7620 | |
| HP Envy 16 h0112nr | |
| AIDA64 / CPU Queen | |
| Asus Vivobook Pro 16X K6604JV-MX016W | |
| Lenovo Slim Pro 9i 16IRP8 | |
| Dell Inspiron 16 Plus 7630 | |
| HP Envy 16 h0112nr | |
| MSI Summit E16 Flip A12UDT-031 | |
| Genomsnitt Intel Core i7-13700H (59324 - 107159, n=29) | |
| Dell Inspiron 16 Plus 7620 | |
| AIDA64 / FPU SinJulia | |
| Asus Vivobook Pro 16X K6604JV-MX016W | |
| Lenovo Slim Pro 9i 16IRP8 | |
| Dell Inspiron 16 Plus 7630 | |
| Genomsnitt Intel Core i7-13700H (4800 - 11050, n=29) | |
| MSI Summit E16 Flip A12UDT-031 | |
| Dell Inspiron 16 Plus 7620 | |
| HP Envy 16 h0112nr | |
| AIDA64 / FPU Mandel | |
| Asus Vivobook Pro 16X K6604JV-MX016W | |
| Lenovo Slim Pro 9i 16IRP8 | |
| Genomsnitt Intel Core i7-13700H (12321 - 45118, n=29) | |
| Dell Inspiron 16 Plus 7630 | |
| MSI Summit E16 Flip A12UDT-031 | |
| Dell Inspiron 16 Plus 7620 | |
| HP Envy 16 h0112nr | |
| AIDA64 / CPU AES | |
| HP Envy 16 h0112nr | |
| Asus Vivobook Pro 16X K6604JV-MX016W | |
| Lenovo Slim Pro 9i 16IRP8 | |
| Genomsnitt Intel Core i7-13700H (28769 - 151254, n=29) | |
| Dell Inspiron 16 Plus 7620 | |
| MSI Summit E16 Flip A12UDT-031 | |
| Dell Inspiron 16 Plus 7630 | |
| AIDA64 / CPU ZLib | |
| Asus Vivobook Pro 16X K6604JV-MX016W | |
| Lenovo Slim Pro 9i 16IRP8 | |
| Dell Inspiron 16 Plus 7620 | |
| Genomsnitt Intel Core i7-13700H (389 - 1215, n=29) | |
| MSI Summit E16 Flip A12UDT-031 | |
| Dell Inspiron 16 Plus 7630 | |
| HP Envy 16 h0112nr | |
| AIDA64 / FP64 Ray-Trace | |
| Asus Vivobook Pro 16X K6604JV-MX016W | |
| Lenovo Slim Pro 9i 16IRP8 | |
| Genomsnitt Intel Core i7-13700H (2540 - 10135, n=29) | |
| Dell Inspiron 16 Plus 7630 | |
| MSI Summit E16 Flip A12UDT-031 | |
| Dell Inspiron 16 Plus 7620 | |
| HP Envy 16 h0112nr | |
| AIDA64 / CPU PhotoWorxx | |
| Lenovo Slim Pro 9i 16IRP8 | |
| Asus Vivobook Pro 16X K6604JV-MX016W | |
| MSI Summit E16 Flip A12UDT-031 | |
| Genomsnitt Intel Core i7-13700H (12872 - 52727, n=29) | |
| Dell Inspiron 16 Plus 7630 | |
| HP Envy 16 h0112nr | |
| Dell Inspiron 16 Plus 7620 | |
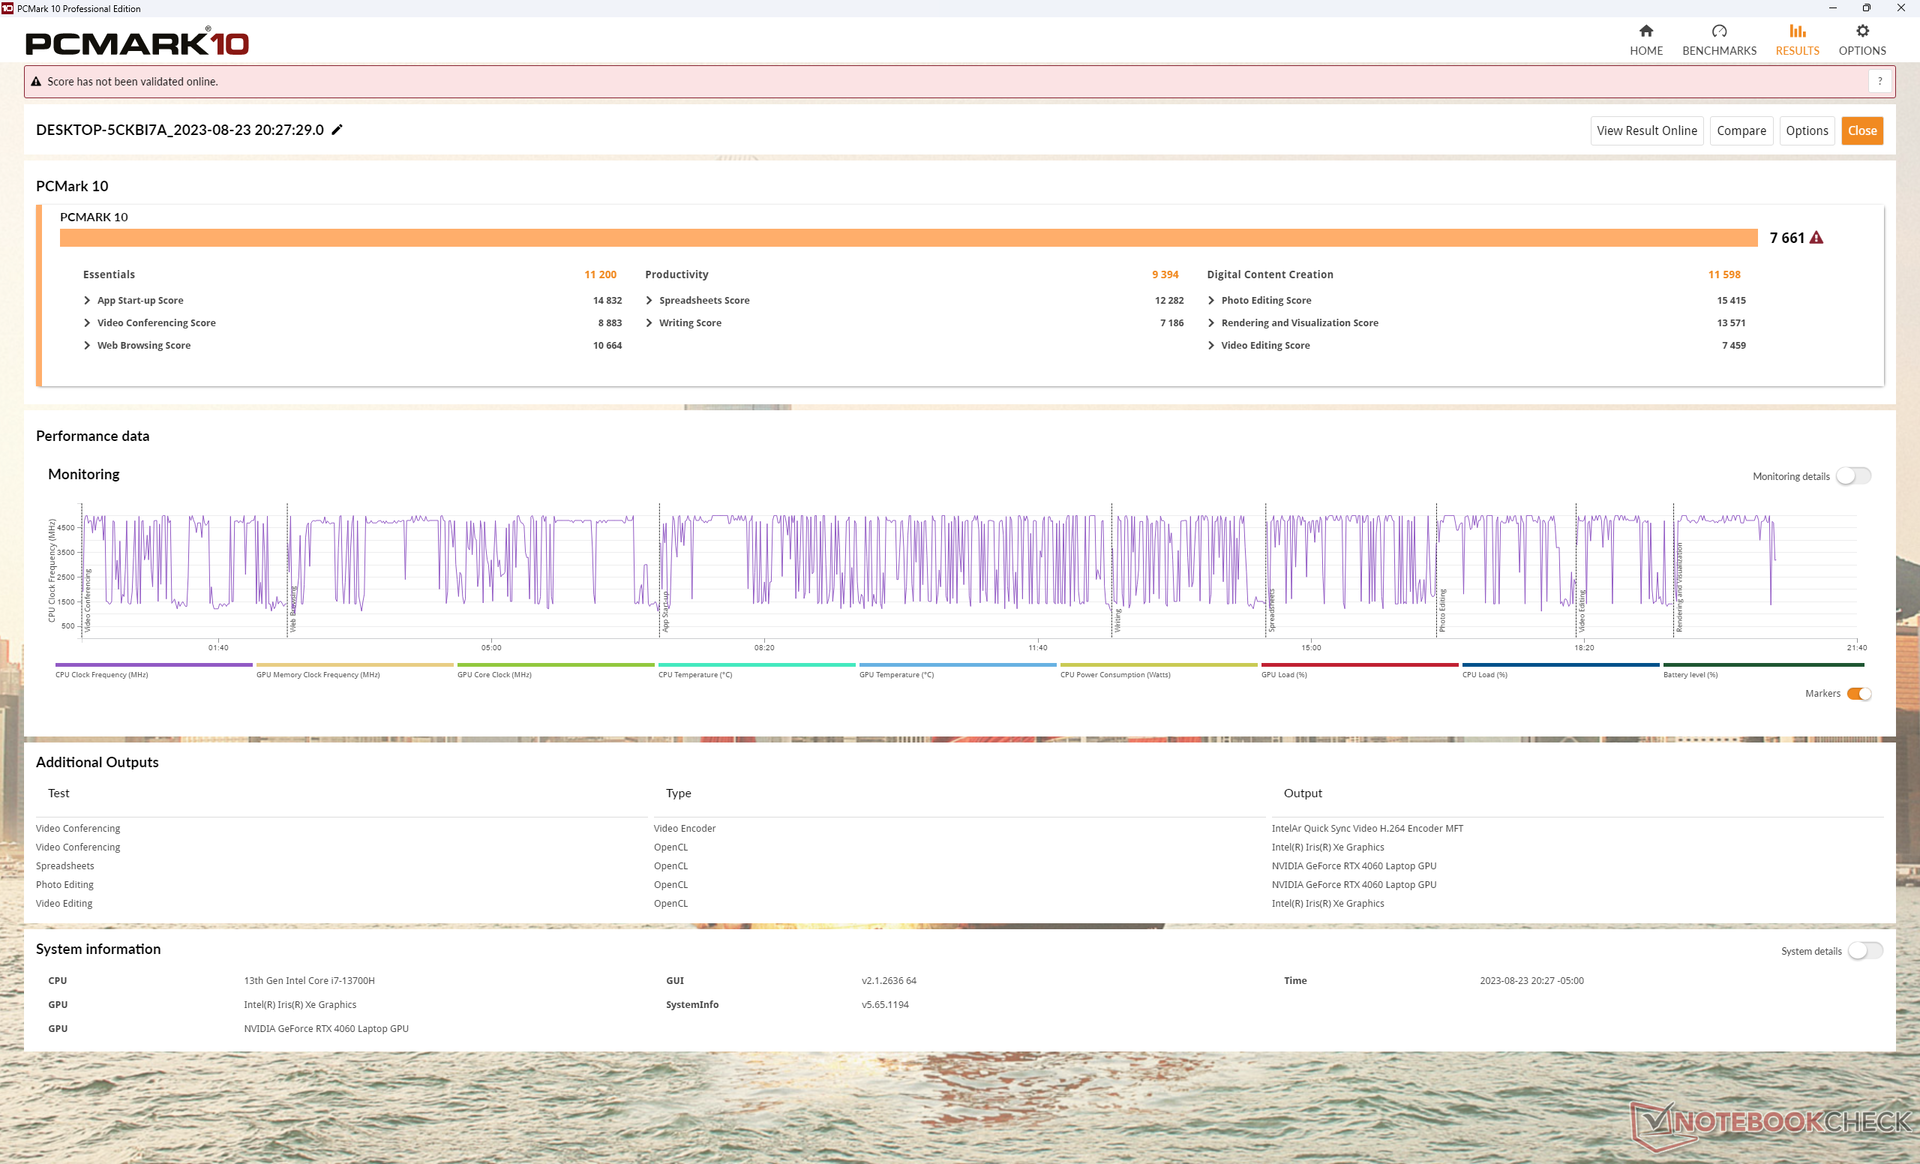
Systemets prestanda
PCMark-resultaten är genomgående högre än på förra årets Inspiron 16 Plus 7620, särskilt i deltestet Digital Content Creation där GPU-prestandan spelar störst roll.
Vi upplevde inga problem med att vakna från sömn eller BSOD till skillnad från den senaste Alienware m16 R1.
CrossMark: Overall | Productivity | Creativity | Responsiveness
| PCMark 10 / Score | |
| Lenovo Slim Pro 9i 16IRP8 | |
| Dell Inspiron 16 Plus 7630 | |
| HP Envy 16 h0112nr | |
| Genomsnitt Intel Core i7-13700H, NVIDIA GeForce RTX 4060 Laptop GPU (7157 - 7661, n=5) | |
| Asus Vivobook Pro 16X K6604JV-MX016W | |
| Dell Inspiron 16 Plus 7620 | |
| MSI Summit E16 Flip A12UDT-031 | |
| PCMark 10 / Essentials | |
| HP Envy 16 h0112nr | |
| Lenovo Slim Pro 9i 16IRP8 | |
| Dell Inspiron 16 Plus 7630 | |
| Genomsnitt Intel Core i7-13700H, NVIDIA GeForce RTX 4060 Laptop GPU (10179 - 11200, n=5) | |
| Asus Vivobook Pro 16X K6604JV-MX016W | |
| Dell Inspiron 16 Plus 7620 | |
| MSI Summit E16 Flip A12UDT-031 | |
| PCMark 10 / Productivity | |
| Lenovo Slim Pro 9i 16IRP8 | |
| Genomsnitt Intel Core i7-13700H, NVIDIA GeForce RTX 4060 Laptop GPU (8238 - 10249, n=5) | |
| Dell Inspiron 16 Plus 7630 | |
| HP Envy 16 h0112nr | |
| Dell Inspiron 16 Plus 7620 | |
| Asus Vivobook Pro 16X K6604JV-MX016W | |
| MSI Summit E16 Flip A12UDT-031 | |
| PCMark 10 / Digital Content Creation | |
| Dell Inspiron 16 Plus 7630 | |
| Lenovo Slim Pro 9i 16IRP8 | |
| Genomsnitt Intel Core i7-13700H, NVIDIA GeForce RTX 4060 Laptop GPU (10308 - 11862, n=5) | |
| HP Envy 16 h0112nr | |
| Dell Inspiron 16 Plus 7620 | |
| Asus Vivobook Pro 16X K6604JV-MX016W | |
| MSI Summit E16 Flip A12UDT-031 | |
| CrossMark / Overall | |
| Asus Vivobook Pro 16X K6604JV-MX016W | |
| Dell Inspiron 16 Plus 7630 | |
| HP Envy 16 h0112nr | |
| Lenovo Slim Pro 9i 16IRP8 | |
| Dell Inspiron 16 Plus 7620 | |
| Genomsnitt Intel Core i7-13700H, NVIDIA GeForce RTX 4060 Laptop GPU (1629 - 1849, n=5) | |
| MSI Summit E16 Flip A12UDT-031 | |
| CrossMark / Productivity | |
| Asus Vivobook Pro 16X K6604JV-MX016W | |
| Dell Inspiron 16 Plus 7630 | |
| HP Envy 16 h0112nr | |
| Dell Inspiron 16 Plus 7620 | |
| Lenovo Slim Pro 9i 16IRP8 | |
| Genomsnitt Intel Core i7-13700H, NVIDIA GeForce RTX 4060 Laptop GPU (1561 - 1743, n=5) | |
| MSI Summit E16 Flip A12UDT-031 | |
| CrossMark / Creativity | |
| Asus Vivobook Pro 16X K6604JV-MX016W | |
| Lenovo Slim Pro 9i 16IRP8 | |
| Dell Inspiron 16 Plus 7630 | |
| HP Envy 16 h0112nr | |
| Dell Inspiron 16 Plus 7620 | |
| Genomsnitt Intel Core i7-13700H, NVIDIA GeForce RTX 4060 Laptop GPU (1691 - 2064, n=5) | |
| MSI Summit E16 Flip A12UDT-031 | |
| CrossMark / Responsiveness | |
| Asus Vivobook Pro 16X K6604JV-MX016W | |
| HP Envy 16 h0112nr | |
| Dell Inspiron 16 Plus 7630 | |
| MSI Summit E16 Flip A12UDT-031 | |
| Dell Inspiron 16 Plus 7620 | |
| Genomsnitt Intel Core i7-13700H, NVIDIA GeForce RTX 4060 Laptop GPU (1381 - 1656, n=5) | |
| Lenovo Slim Pro 9i 16IRP8 | |
| PCMark 10 Score | 7661 poäng | |
Hjälp | ||
| AIDA64 / Memory Copy | |
| Lenovo Slim Pro 9i 16IRP8 | |
| Asus Vivobook Pro 16X K6604JV-MX016W | |
| MSI Summit E16 Flip A12UDT-031 | |
| Genomsnitt Intel Core i7-13700H (24334 - 78081, n=29) | |
| Dell Inspiron 16 Plus 7630 | |
| HP Envy 16 h0112nr | |
| Dell Inspiron 16 Plus 7620 | |
| AIDA64 / Memory Read | |
| Asus Vivobook Pro 16X K6604JV-MX016W | |
| Lenovo Slim Pro 9i 16IRP8 | |
| Dell Inspiron 16 Plus 7630 | |
| HP Envy 16 h0112nr | |
| MSI Summit E16 Flip A12UDT-031 | |
| Genomsnitt Intel Core i7-13700H (23681 - 79656, n=29) | |
| Dell Inspiron 16 Plus 7620 | |
| AIDA64 / Memory Write | |
| Lenovo Slim Pro 9i 16IRP8 | |
| Asus Vivobook Pro 16X K6604JV-MX016W | |
| Genomsnitt Intel Core i7-13700H (22986 - 99898, n=29) | |
| Dell Inspiron 16 Plus 7630 | |
| HP Envy 16 h0112nr | |
| MSI Summit E16 Flip A12UDT-031 | |
| Dell Inspiron 16 Plus 7620 | |
| AIDA64 / Memory Latency | |
| MSI Summit E16 Flip A12UDT-031 | |
| Lenovo Slim Pro 9i 16IRP8 | |
| Dell Inspiron 16 Plus 7620 | |
| Genomsnitt Intel Core i7-13700H (82.4 - 136.8, n=29) | |
| Dell Inspiron 16 Plus 7630 | |
| HP Envy 16 h0112nr | |
| Asus Vivobook Pro 16X K6604JV-MX016W | |
* ... mindre är bättre
DPC-fördröjning
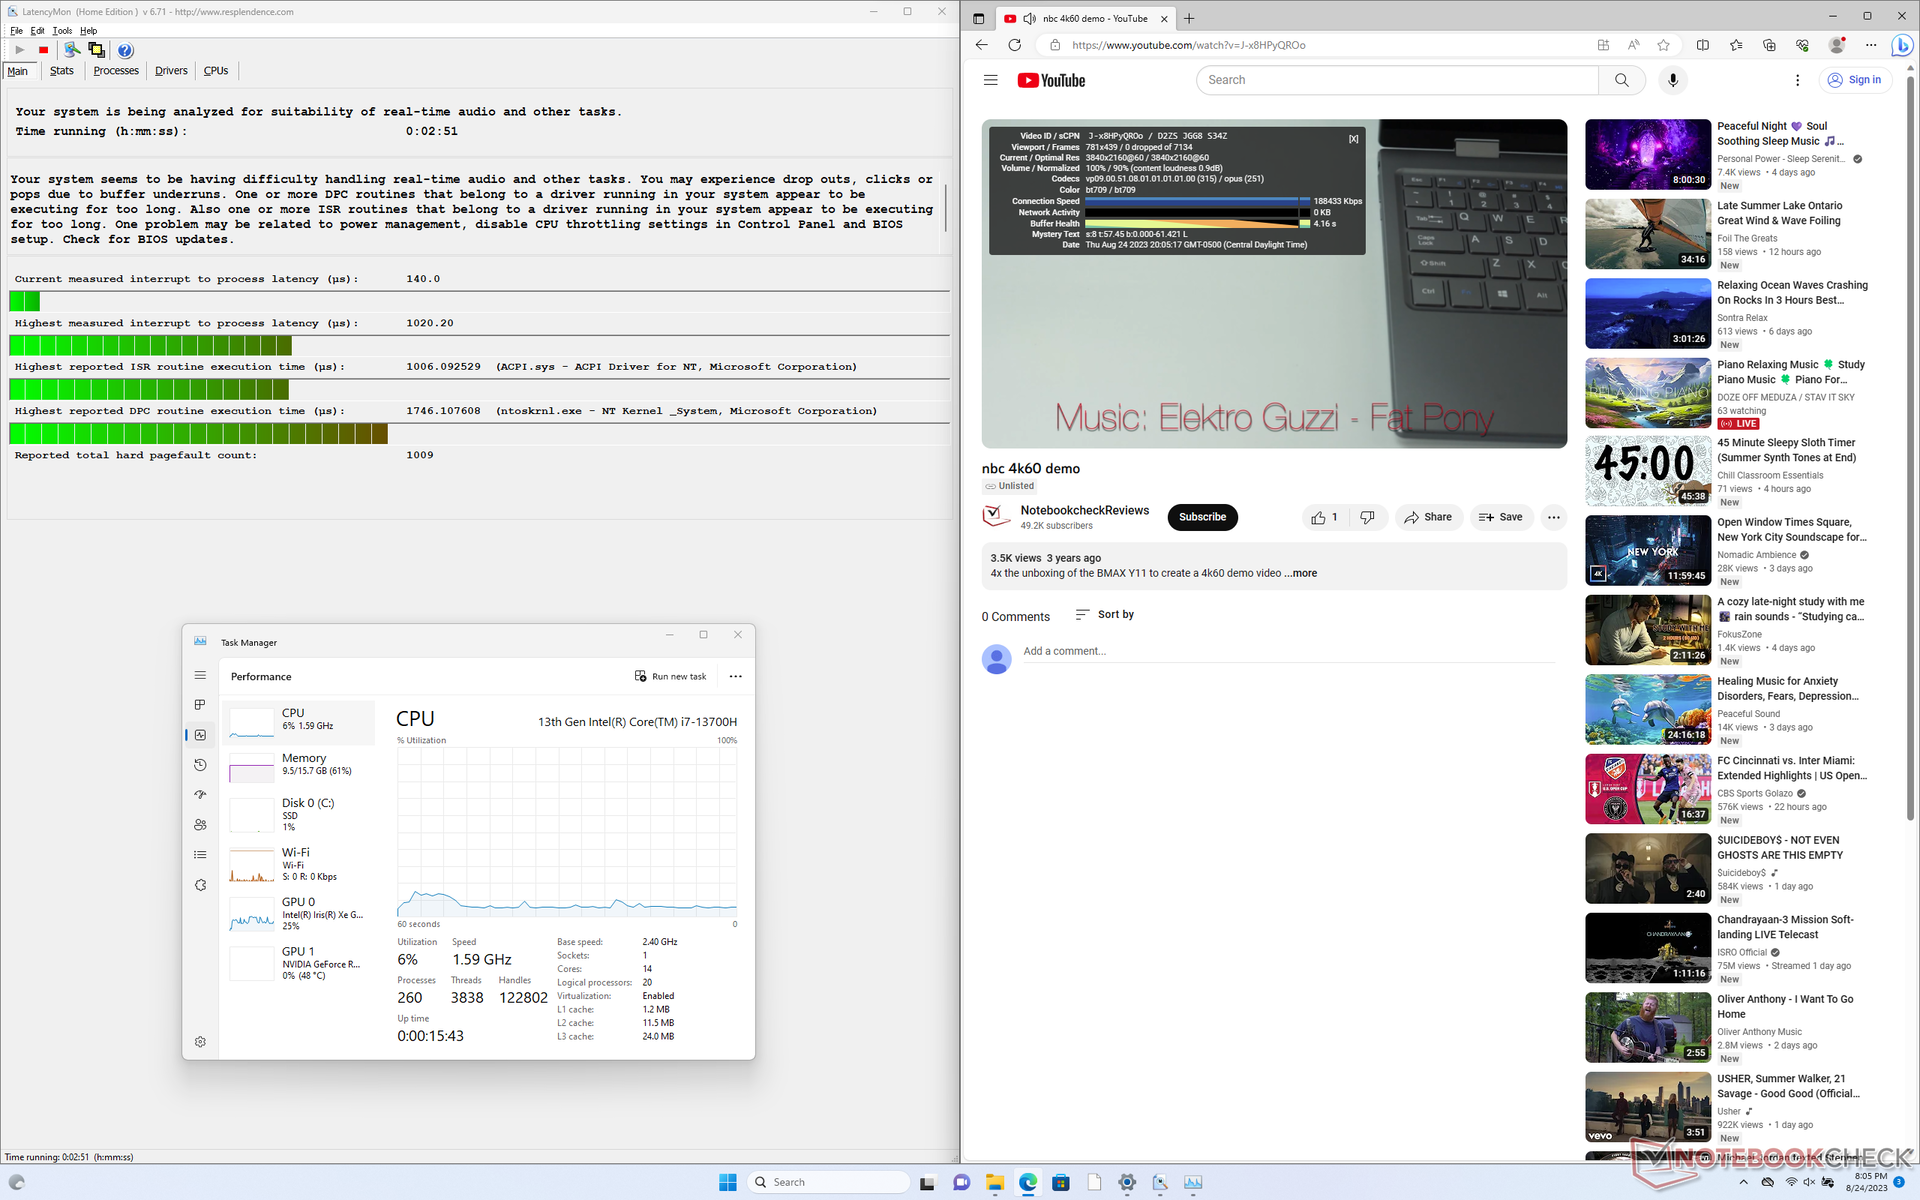
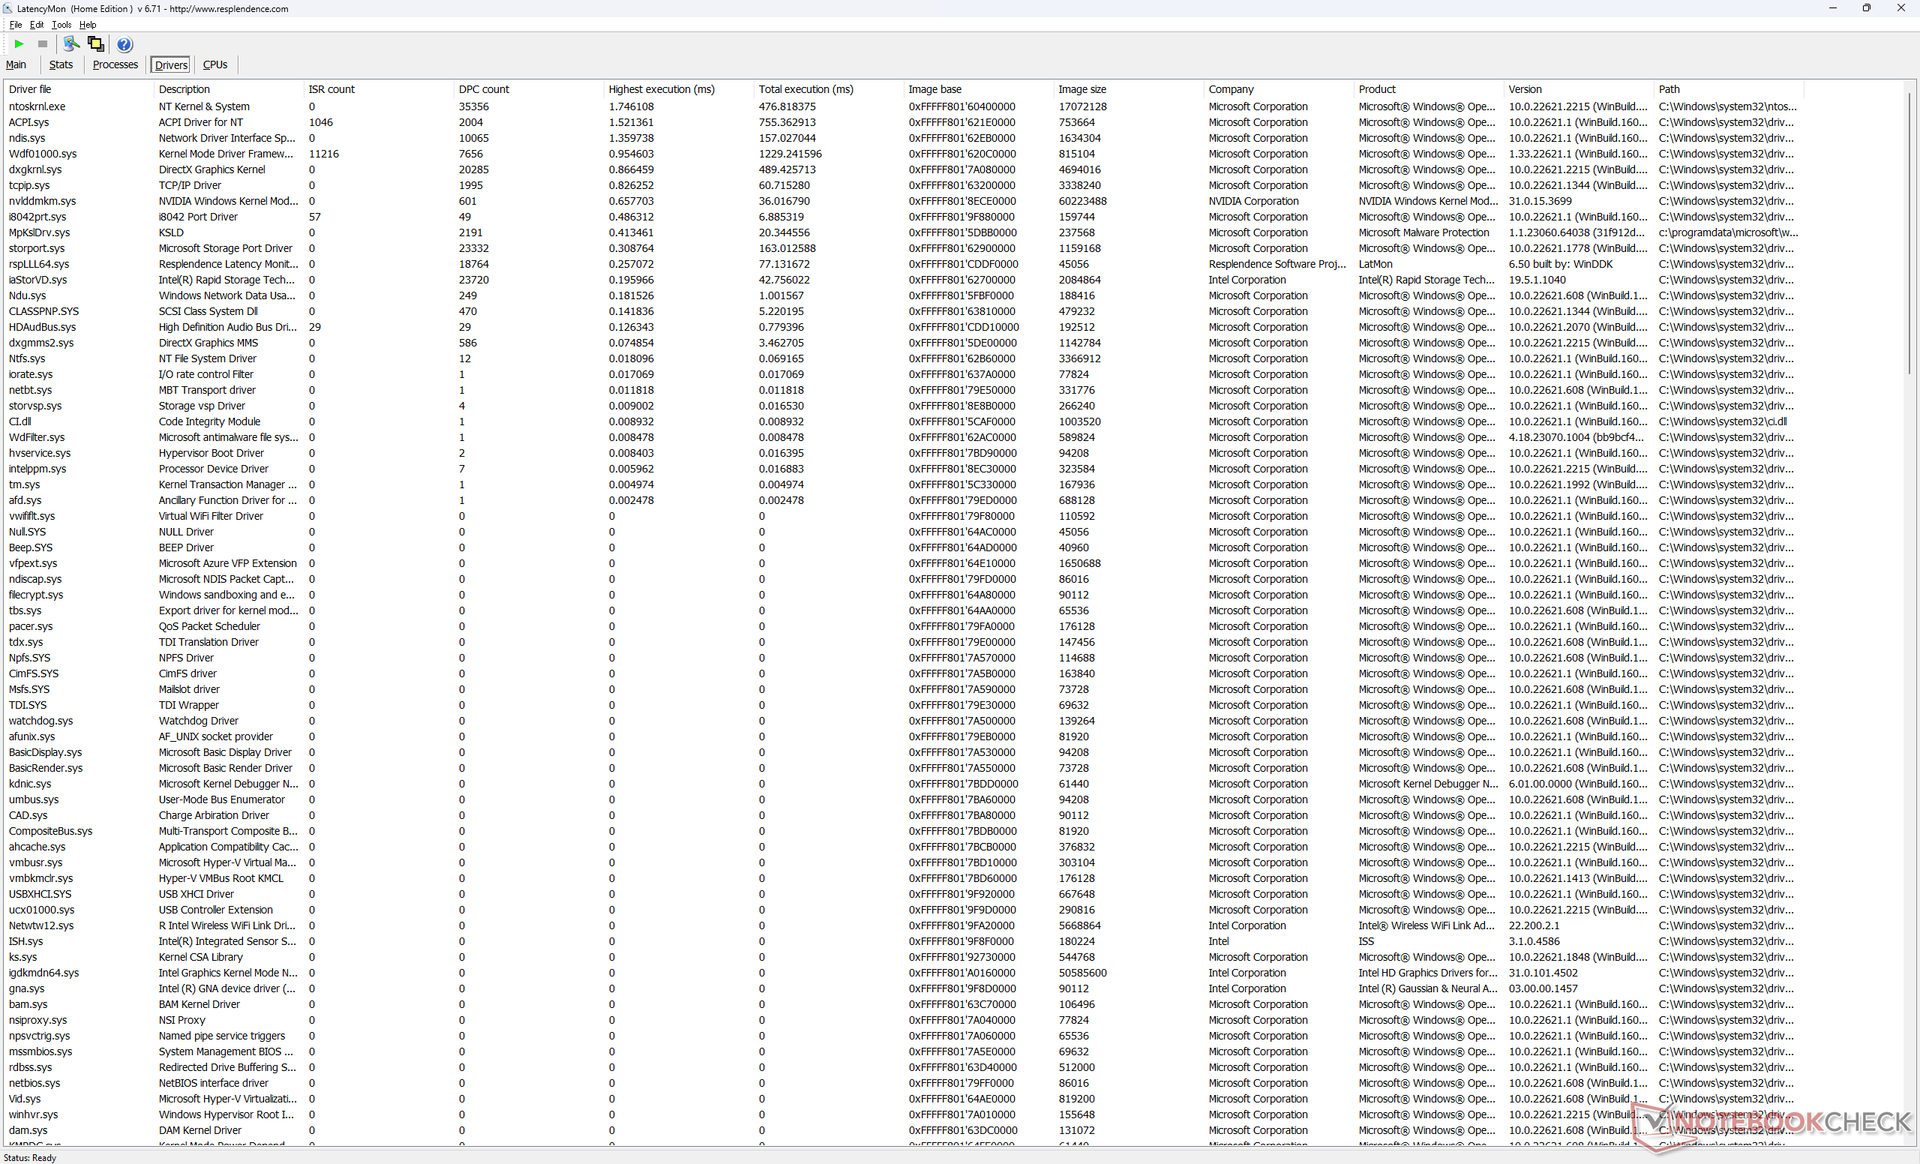
LatencyMon visar endast mindre DPC-problem när du öppnar flera webbläsarflikar på vår hemsida. 4K-videouppspelning vid 60 FPS är annars perfekt utan några tappade bildrutor, till skillnad från den senaste Alienware m16 R1 där bildrutorna hoppade över konstant.
| DPC Latencies / LatencyMon - interrupt to process latency (max), Web, Youtube, Prime95 | |
| Asus Vivobook Pro 16X K6604JV-MX016W | |
| Lenovo Slim Pro 9i 16IRP8 | |
| Dell Inspiron 16 Plus 7630 | |
| Dell Inspiron 16 Plus 7620 | |
| MSI Summit E16 Flip A12UDT-031 | |
| HP Envy 16 h0112nr | |
* ... mindre är bättre
Lagringsenheter - Stödjer endast en SSD
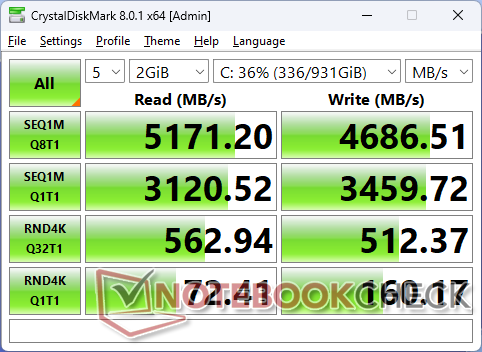
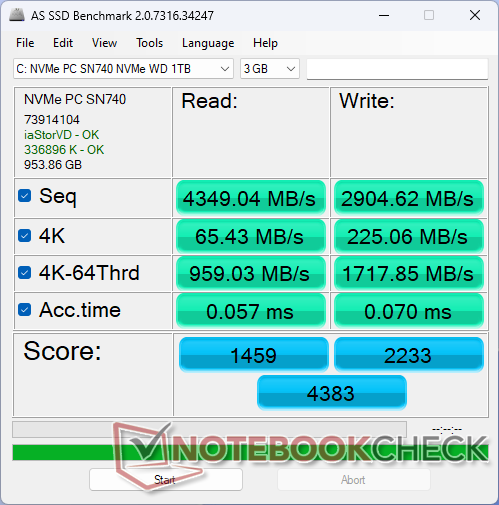
Vår enhet levereras med en mellanklass Western Digital SN740 PCIe4 x4 NVMe SSD som erbjuder överföringshastigheter på upp till 5200 MB/s. Detta maximum är dock bara hållbart i ungefär en minut innan det slutligen stryps till låga 2400 MB/s, vilket visas av våra DiskSpd loop-testresultat nedan. Denna begränsning är inte ett problem för spelprestanda och de allra flesta användningsscenarier.
Modellen stöder endast upp till en intern SSD medan några andra 16-tums bärbara datorer som Envy 16 kan stödja upp till två enheter.

| Drive Performance rating - Percent | |
| MSI Summit E16 Flip A12UDT-031 | |
| Lenovo Slim Pro 9i 16IRP8 | |
| HP Envy 16 h0112nr | |
| Dell Inspiron 16 Plus 7630 | |
| Asus Vivobook Pro 16X K6604JV-MX016W | |
| Dell Inspiron 16 Plus 7620 | |
* ... mindre är bättre
Disk Throttling: DiskSpd Read Loop, Queue Depth 8
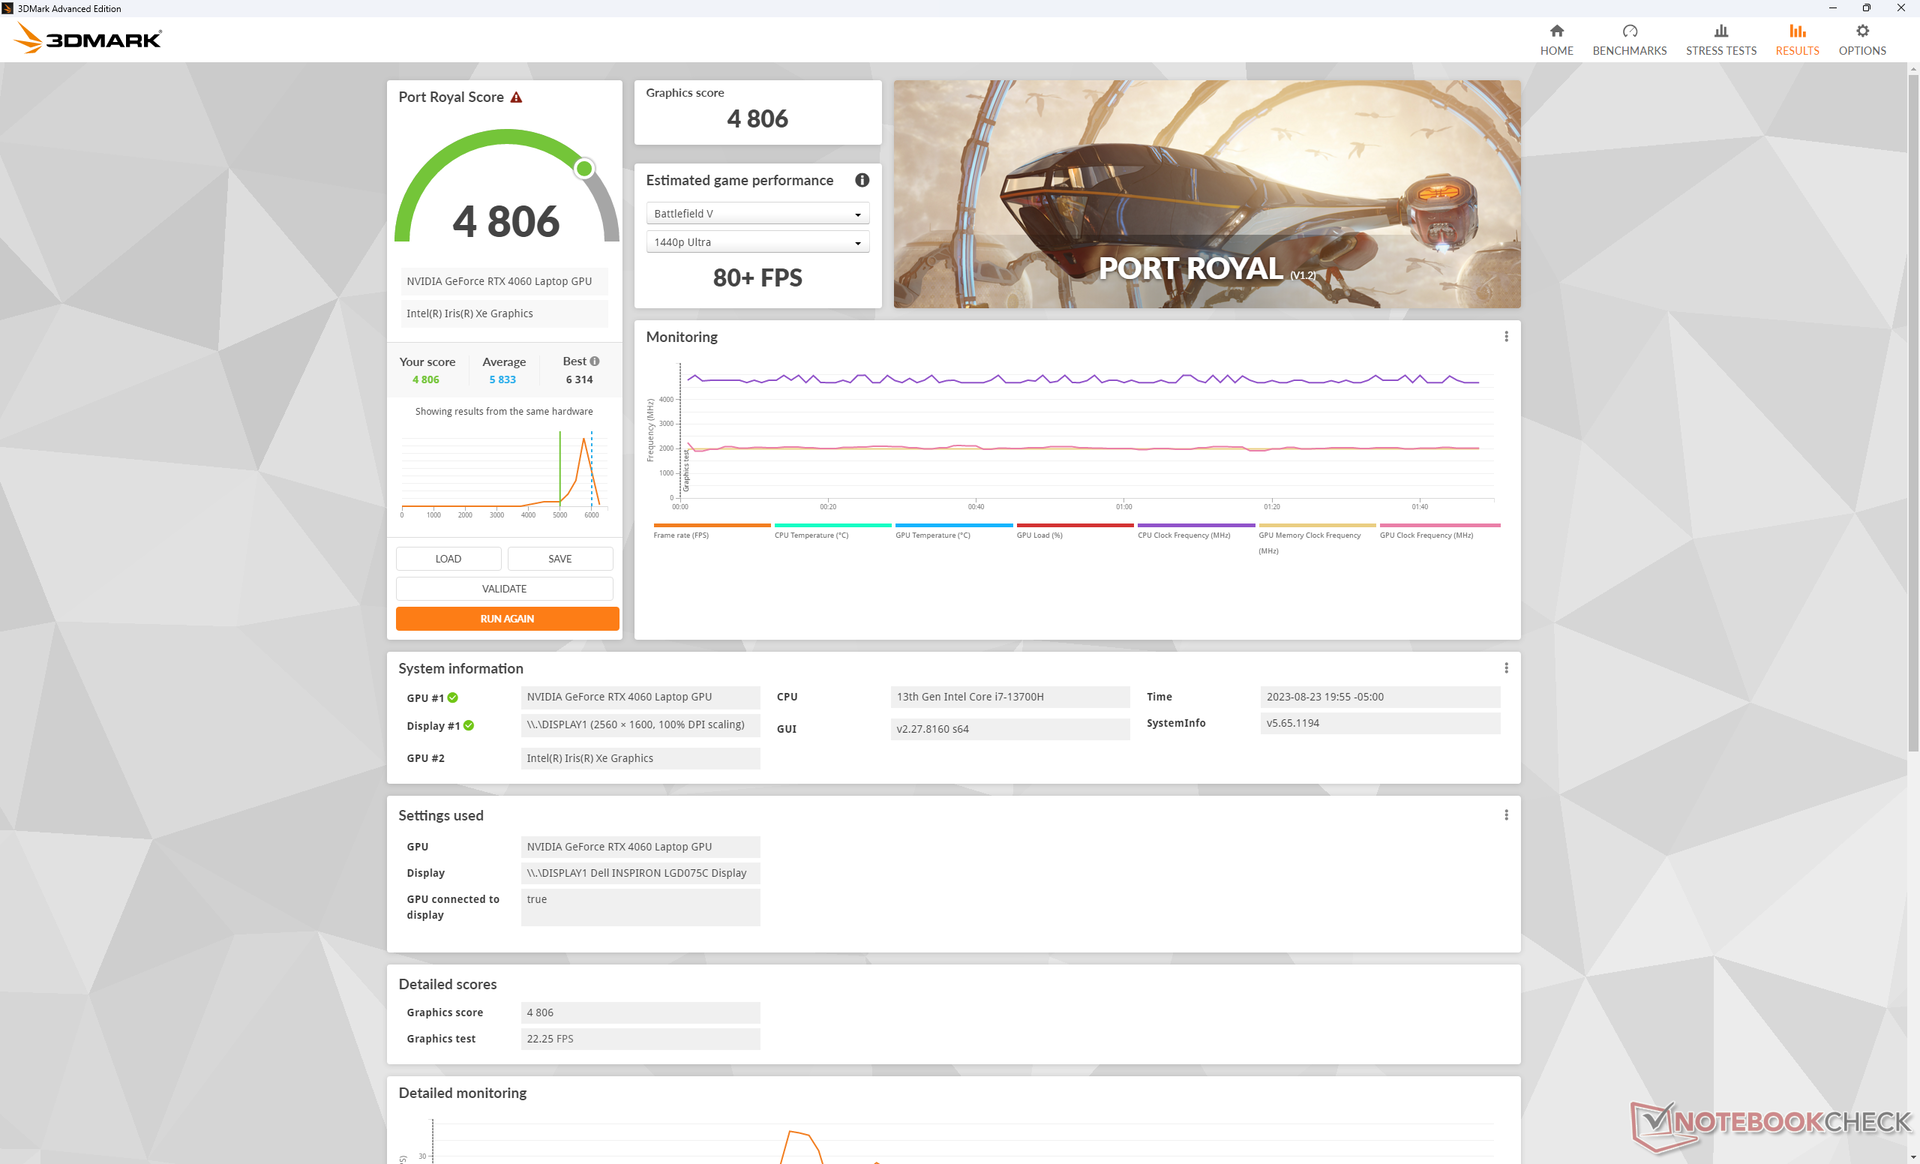
GPU-prestanda
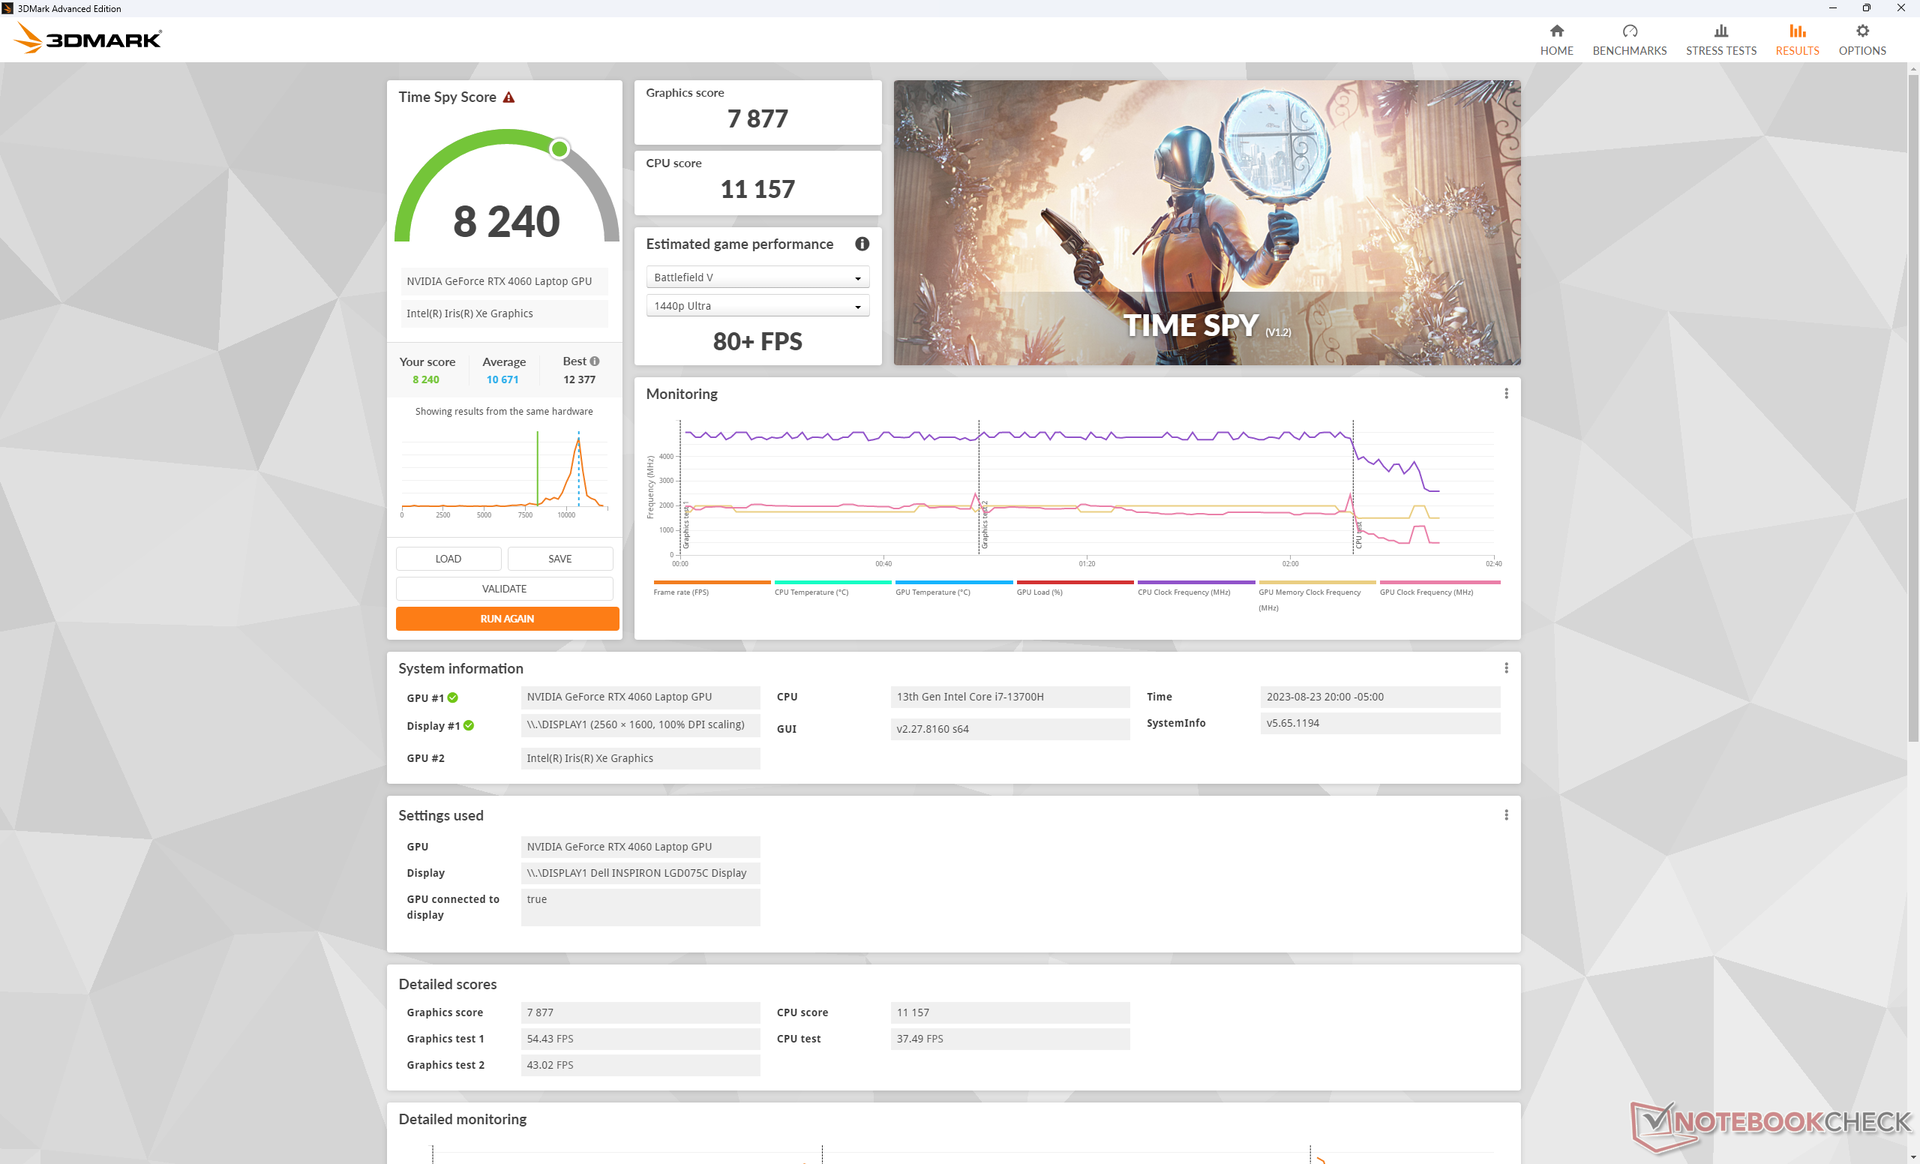
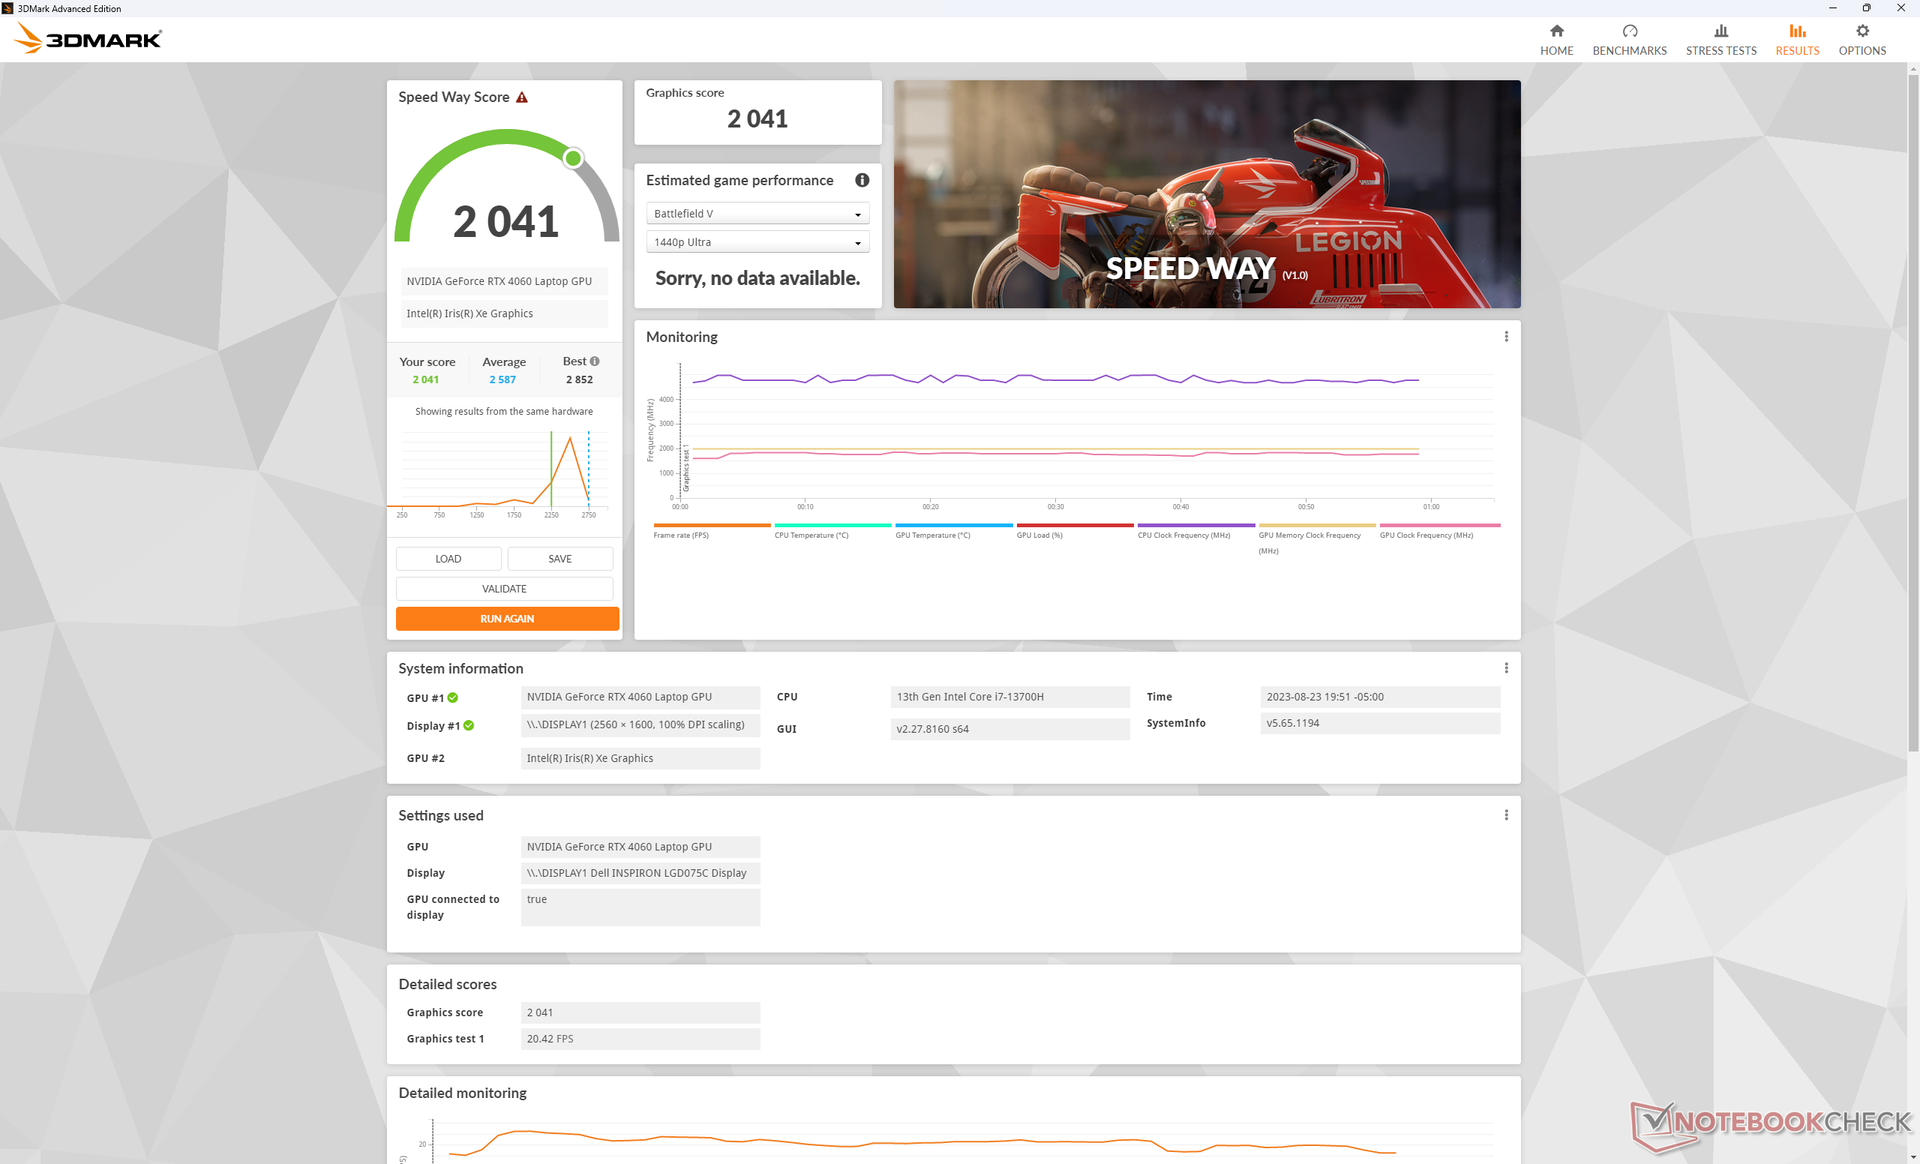
GeForce RTX 4060 i vår Dell är cirka 10 till 15 procent långsammare än den genomsnittliga bärbara datorn i vår databas som är utrustad med samma GPU. Delta beror sannolikt på det relativt låga TGP-målet på 60 W för Inspiron 16 Plus 7630 eftersom de flesta bärbara datorer med RTX 4060 tenderar att vara dedikerade bärbara speldatorer optimerade för högre GPU-effektintervall på 90 W eller högre. Den övergripande prestandan är därför mer jämförbar med GeForce RTX 4050 i Lenovo Slim Pro 9i 16, vilket är lite av en besvikelse att se. Trots detta är prestandauppgraderingen från generation till generation jämfört med RTX 3050 Ti i förra årets Inspiron 16 Plus 7620 fortfarande betydande med 40 till 60 procent.
Användare kanske vill överväga att konfigurera Inspiron 16 Plus 7630 med den billigare RTX 4050 istället eftersom RTX 4060-alternativet är en underpresterare. Alla GPU-alternativ är inriktade på samma 60 W TGP.
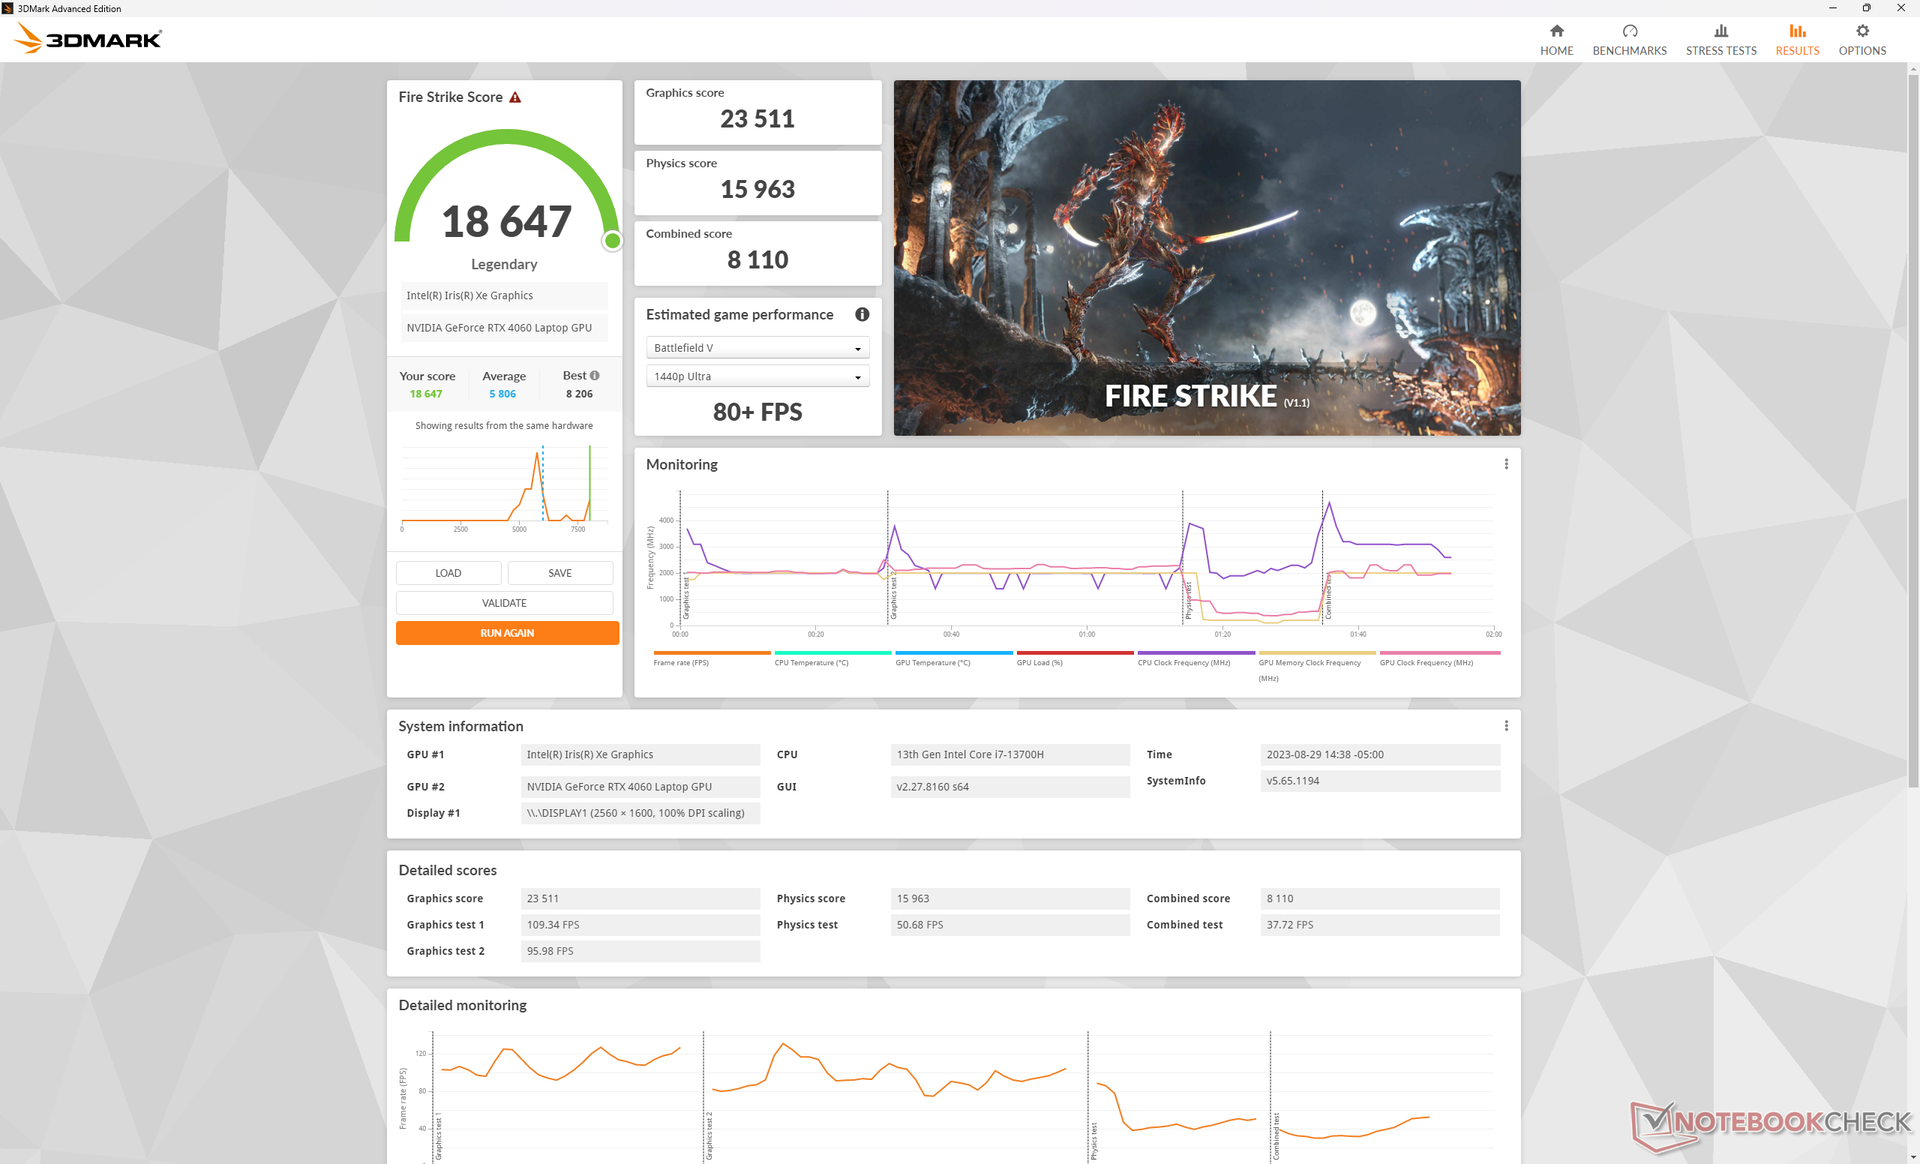
Att byta från Performance-läge till Balanced-läge påverkar CPU-prestandan ganska kraftigt medan GPU-prestandan förblir nästan densamma, vilket visas av våra Fire Strike resultat nedan. Se till att vara i Performance-läge om du kör CPU-intensiva uppgifter.
| Kraftprofil | Grafisk poäng | Poäng för fysik | Kombinerat resultat |
| Batteriets effekt | 19574 (-9%) | 10010 (-61%) | 4793 (-46%) |
| Balanserat läge | 23511 (-2%) | 15963 (-41%) | 8110 (-21%) |
| Prestandaläge | 24008 | 26852 | 10239 |

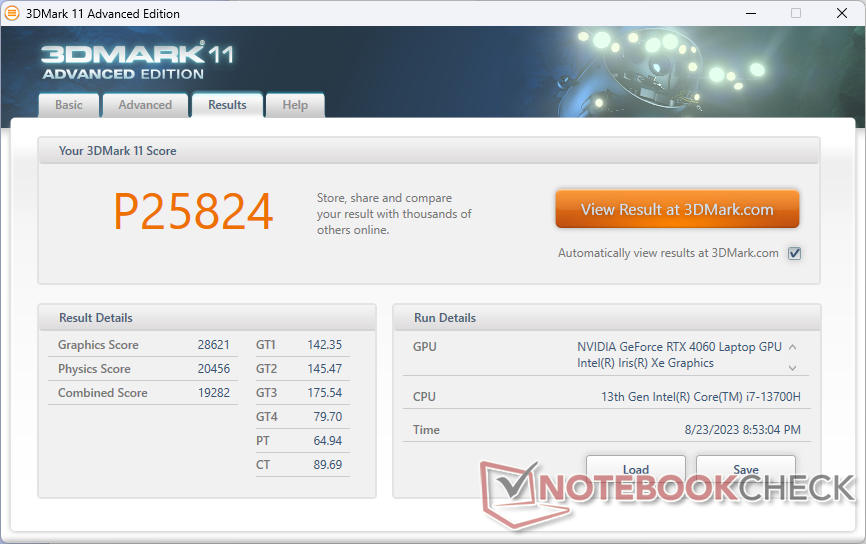
| 3DMark 11 Performance | 25824 poäng | |
| 3DMark Fire Strike Score | 19289 poäng | |
| 3DMark Time Spy Score | 8240 poäng | |
Hjälp | ||
* ... mindre är bättre
Spelprestanda
Som förväntat av 3DMark-resultaten ovan är den övergripande spelprestandan något under genomsnittet för en bärbar dator med RTX 4060-grafik. Tiny Tina's Wonderlands, till exempel, körs med 48 FPS när man använder de maximala 1440p-inställningarna jämfört med 57 FPS på de flesta andra RTX 4060-bärbara datorer. G-Sync stöds tyvärr inte på Inspiron 7630-serien, vilket skulle ha jämnat ut frame tearing.
Witcher 3 FPS Chart
| låg | med. | hög | ultra | QHD | |
|---|---|---|---|---|---|
| The Witcher 3 (2015) | 409.3 | 275.3 | 169.5 | 90.9 | 68 |
| Dota 2 Reborn (2015) | 184.7 | 166.6 | 157.9 | 146.1 | |
| Final Fantasy XV Benchmark (2018) | 172.2 | 122.2 | 88.9 | 64.4 | |
| X-Plane 11.11 (2018) | 153.5 | 135.7 | 109.7 | ||
| Far Cry 5 (2018) | 133 | 120 | 115 | 103 | 83 |
| Strange Brigade (2018) | 378 | 234 | 185.9 | 161 | 110.9 |
| Cyberpunk 2077 1.6 (2022) | 108.1 | 84.2 | 72.9 | 65.7 | 40.8 |
| Tiny Tina's Wonderlands (2022) | 169.5 | 141.5 | 92.1 | 71.4 | 48 |
| F1 22 (2022) | 205 | 201 | 148.4 | 53.8 | 34.1 |
| Returnal (2023) | 71 | 68 | 63 | 57 | 39 |
Utsläpp
System Noise - tystare och mer högljutt än tidigare
De interna fläktarna kan vara tysta när datorn går på tomgång, men de ligger oftast runt 26 till 28 dB(A) när vanliga belastningar körs, som webbläsare eller videoströmmar. Mer imponerande är att de kan förbli relativt tysta ett bra tag även när högre belastningar introduceras medan fläktarna i Inspiron 16 Plus 7620 skulle pulsera snabbare och mer lättvindigt. Vid körning av 3DMark 06, till exempel, skulle fläktljudet bara öka till 35 dB(A) mot slutet av den första 90-sekunders benchmark-scenen.
Fläktljudet ökar betydligt när spel körs. Medan Inspiron 16 Plus 7630 generellt sett är tystare än förra årets modell när man kör enkla belastningar, gäller motsatsen när man spelar. Fläktljudet uppgår till nästan 53 dB(A) när Witcher 3 körs, jämfört med drygt 49 dB(A) på Inspiron 16 Plus 7620. Trots detta är det låga 50 dB(A)-intervallet jämförbart med konkurrenter somSlim Pro 9i 16 eller Envy 16.
Intressant nog påverkas inte fläktens ljudnivå när du ändrar energiprofil mellan lägena Balanserad och Prestanda, eftersom den fortfarande ligger på 52,5 dB(A) i båda inställningarna.
Ljudnivå
| Låg belastning |
| 23.2 / 23.2 / 23.2 dB(A) |
| Hög belastning |
| 35.1 / 52.5 dB(A) |
 | ||
30 dB tyst 40 dB(A) hörbar 50 dB(A) högt ljud |
||
min: | ||
| Dell Inspiron 16 Plus 7630 GeForce RTX 4060 Laptop GPU, i7-13700H, WD PC SN740 SDDPTQD-1T00 | Dell Inspiron 16 Plus 7620 GeForce RTX 3050 Ti Laptop GPU, i7-12700H, Kioxia BG5 KBG50ZNS512G | Lenovo Slim Pro 9i 16IRP8 GeForce RTX 4050 Laptop GPU, i9-13905H, Samsung PM9A1 MZVL21T0HCLR | Asus Vivobook Pro 16X K6604JV-MX016W GeForce RTX 4060 Laptop GPU, i9-13980HX, Solidigm P41 Plus SSDPFKNU010TZ | HP Envy 16 h0112nr GeForce RTX 3060 Laptop GPU, i7-12700H, Micron 3400 1TB MTFDKBA1T0TFH | MSI Summit E16 Flip A12UDT-031 GeForce RTX 3050 Ti Laptop GPU, i7-1280P, Samsung PM9A1 MZVL22T0HBLB | |
|---|---|---|---|---|---|---|
| Noise | -11% | 1% | -21% | -6% | -14% | |
| av / miljö * (dB) | 23.2 | 23.3 -0% | 22.7 2% | 25.2 -9% | 22.8 2% | 25 -8% |
| Idle Minimum * (dB) | 23.2 | 25.7 -11% | 22.7 2% | 26.6 -15% | 22.9 1% | 25 -8% |
| Idle Average * (dB) | 23.2 | 26.1 -13% | 22.7 2% | 26.6 -15% | 22.9 1% | 25 -8% |
| Idle Maximum * (dB) | 23.2 | 30.6 -32% | 27.5 -19% | 29.2 -26% | 30.5 -31% | 28.9 -25% |
| Load Average * (dB) | 35.1 | 46.2 -32% | 28.9 18% | 53.4 -52% | 41.4 -18% | 49.3 -40% |
| Witcher 3 ultra * (dB) | 52.5 | 49.2 6% | 52.6 -0% | 51.1 3% | ||
| Load Maximum * (dB) | 52.5 | 49.4 6% | 52.5 -0% | 56.9 -8% | 51.4 2% | 48.2 8% |
* ... mindre är bättre
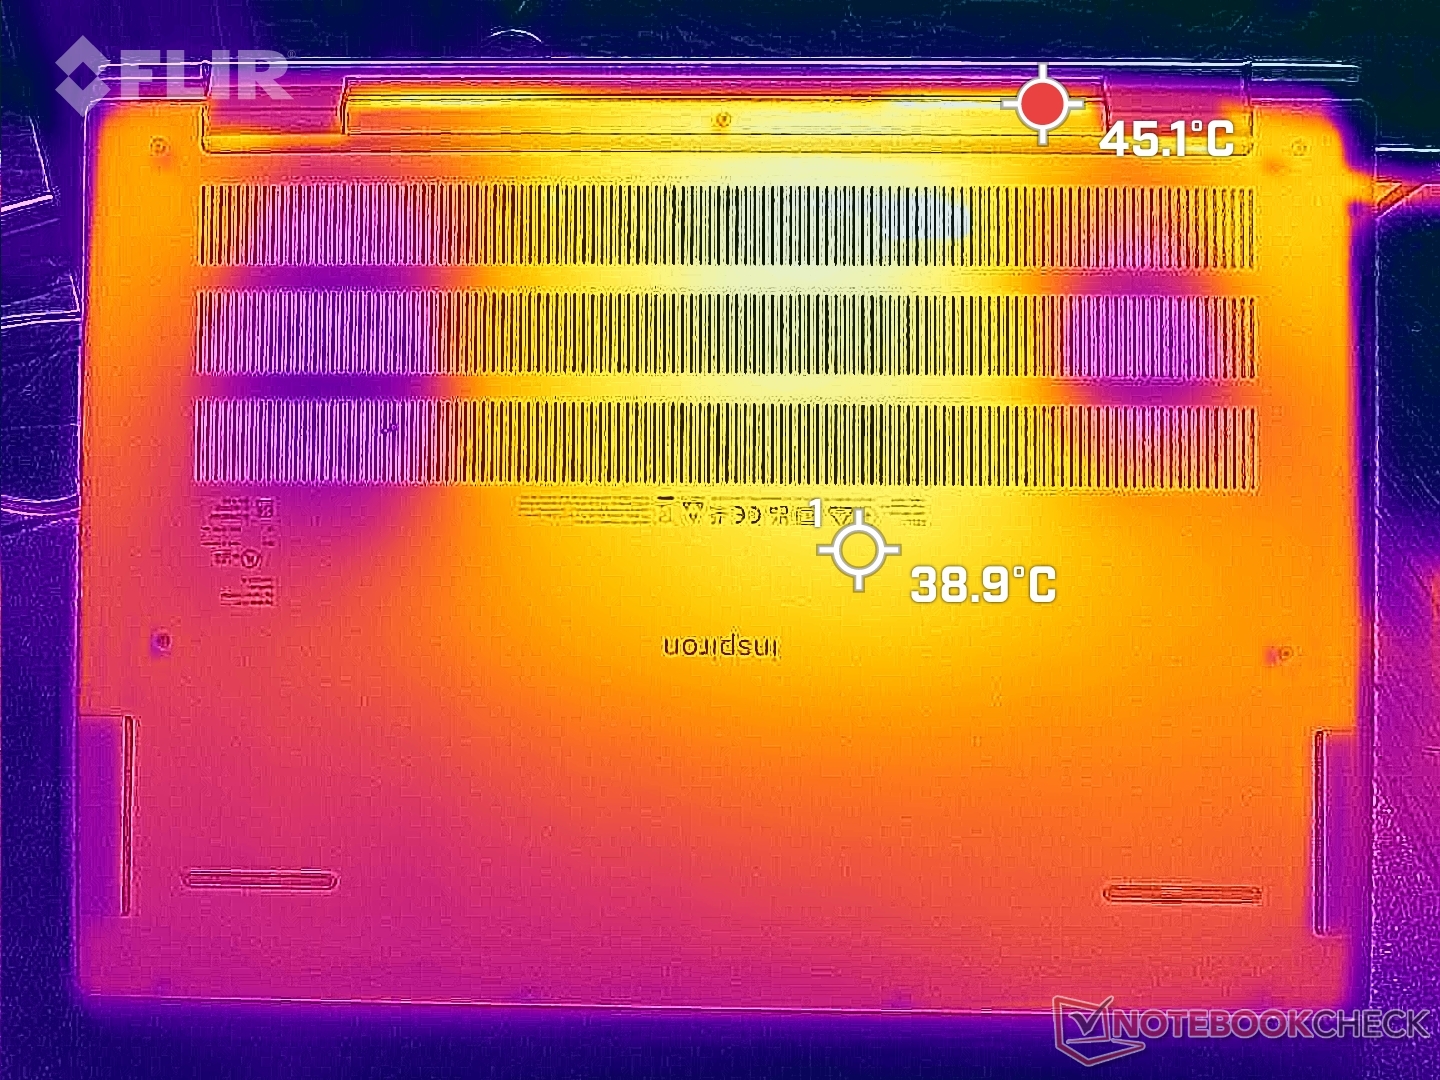
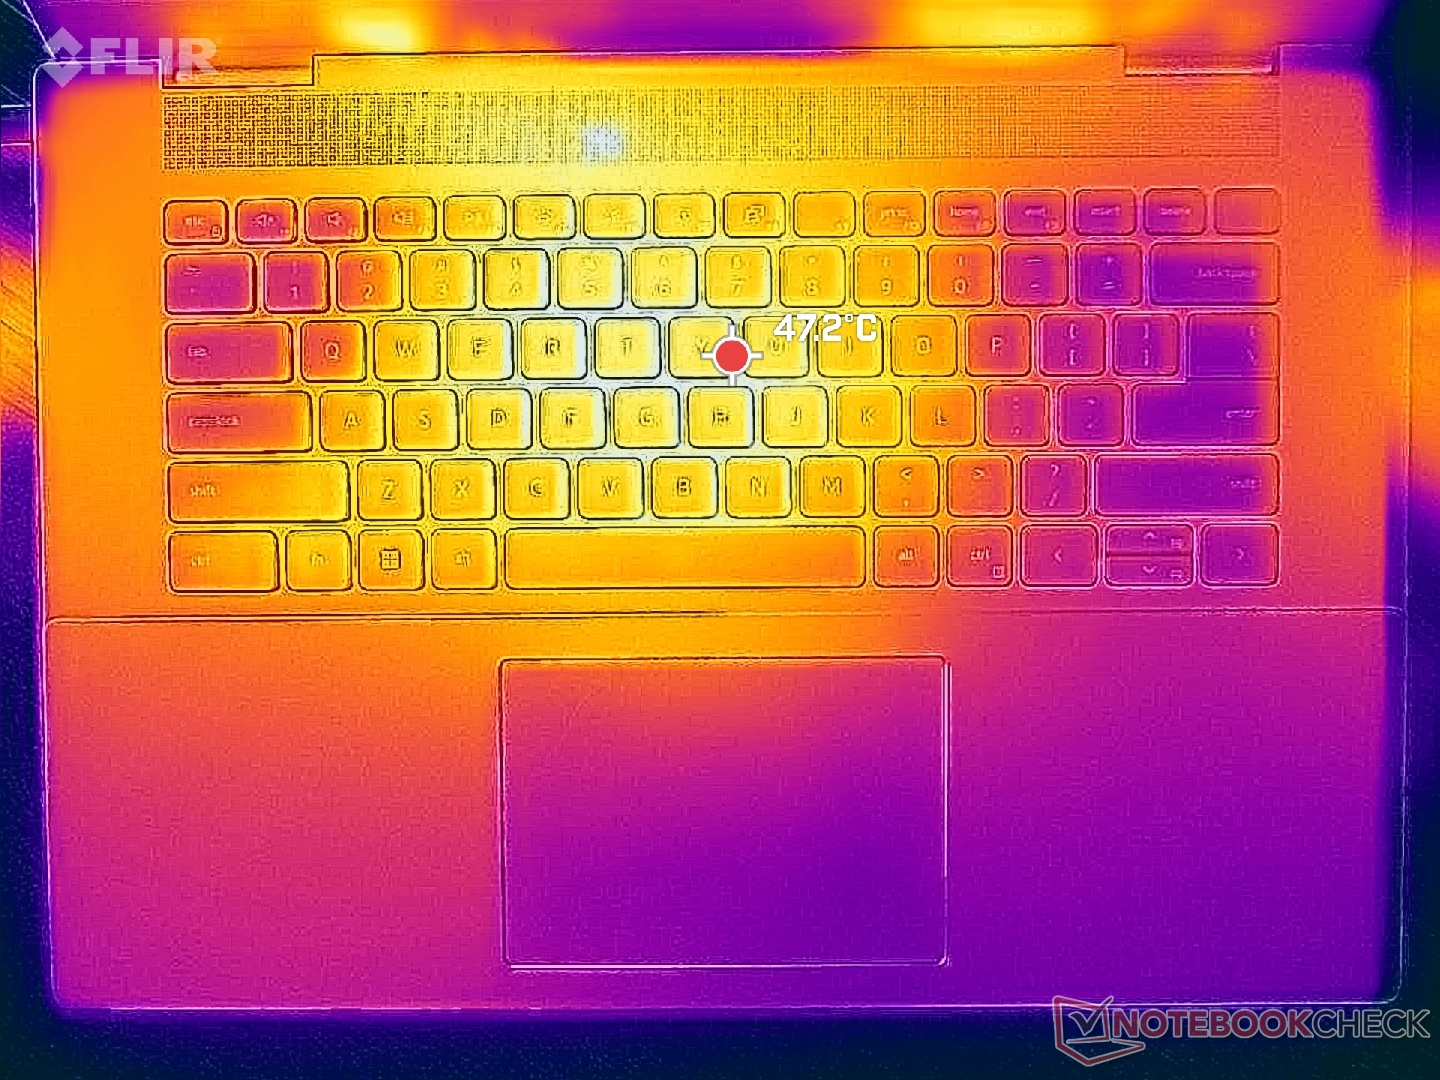
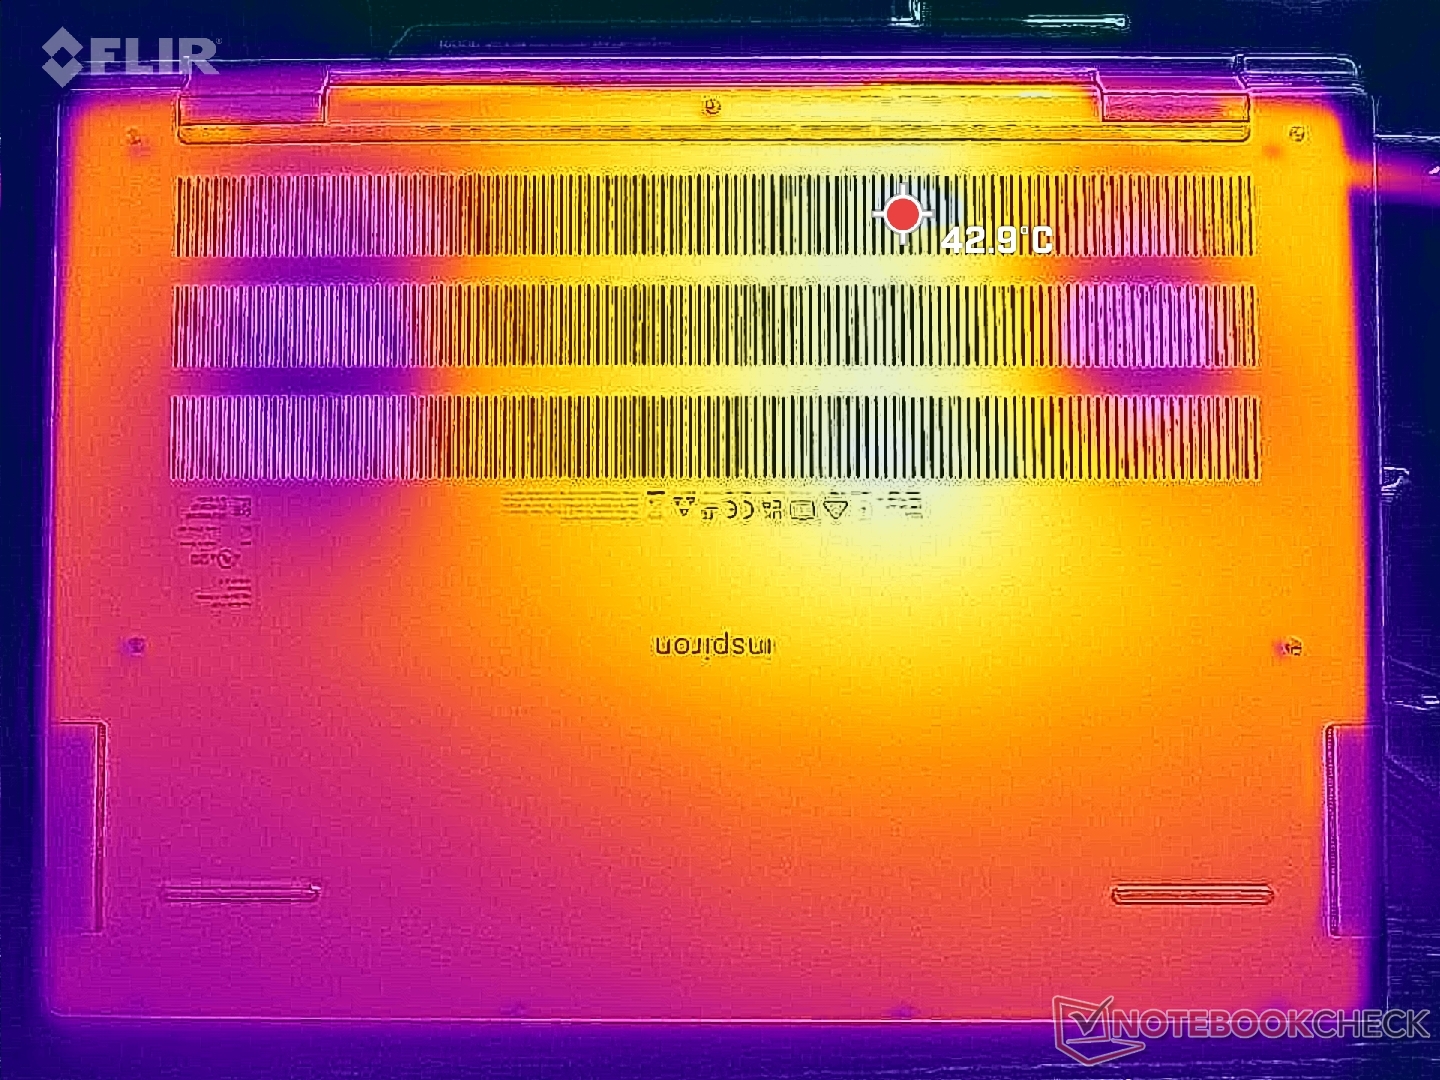
Temperatur
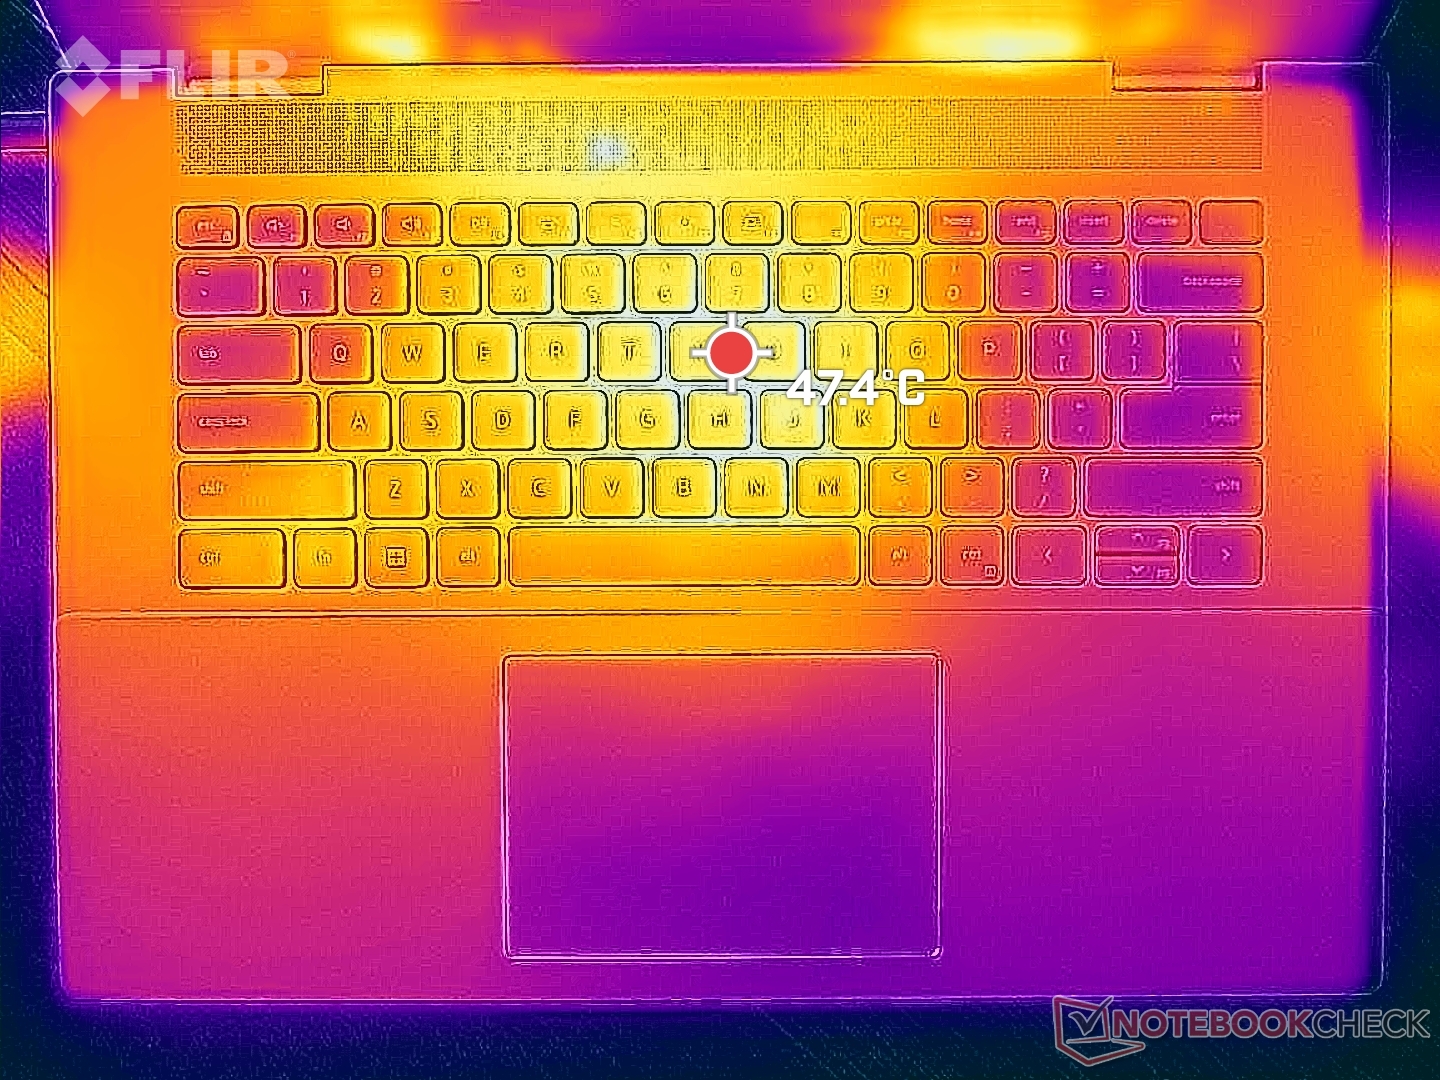
Yttemperaturer vid krävande belastning som spel är varmare än förväntat. Hot spots på ovansidan och undersidan kan bli så varma som 48 C respektive 43 C nära tangentbordets mitt. Handflatestöden kan också vara mycket varma vid upp till 37 C jämfört med bara 31 C påAsus Vivobook Pro 16X eller HP Envy 16. Detta är verkligen mer av en handvärmare jämfört med andra bärbara datorer.
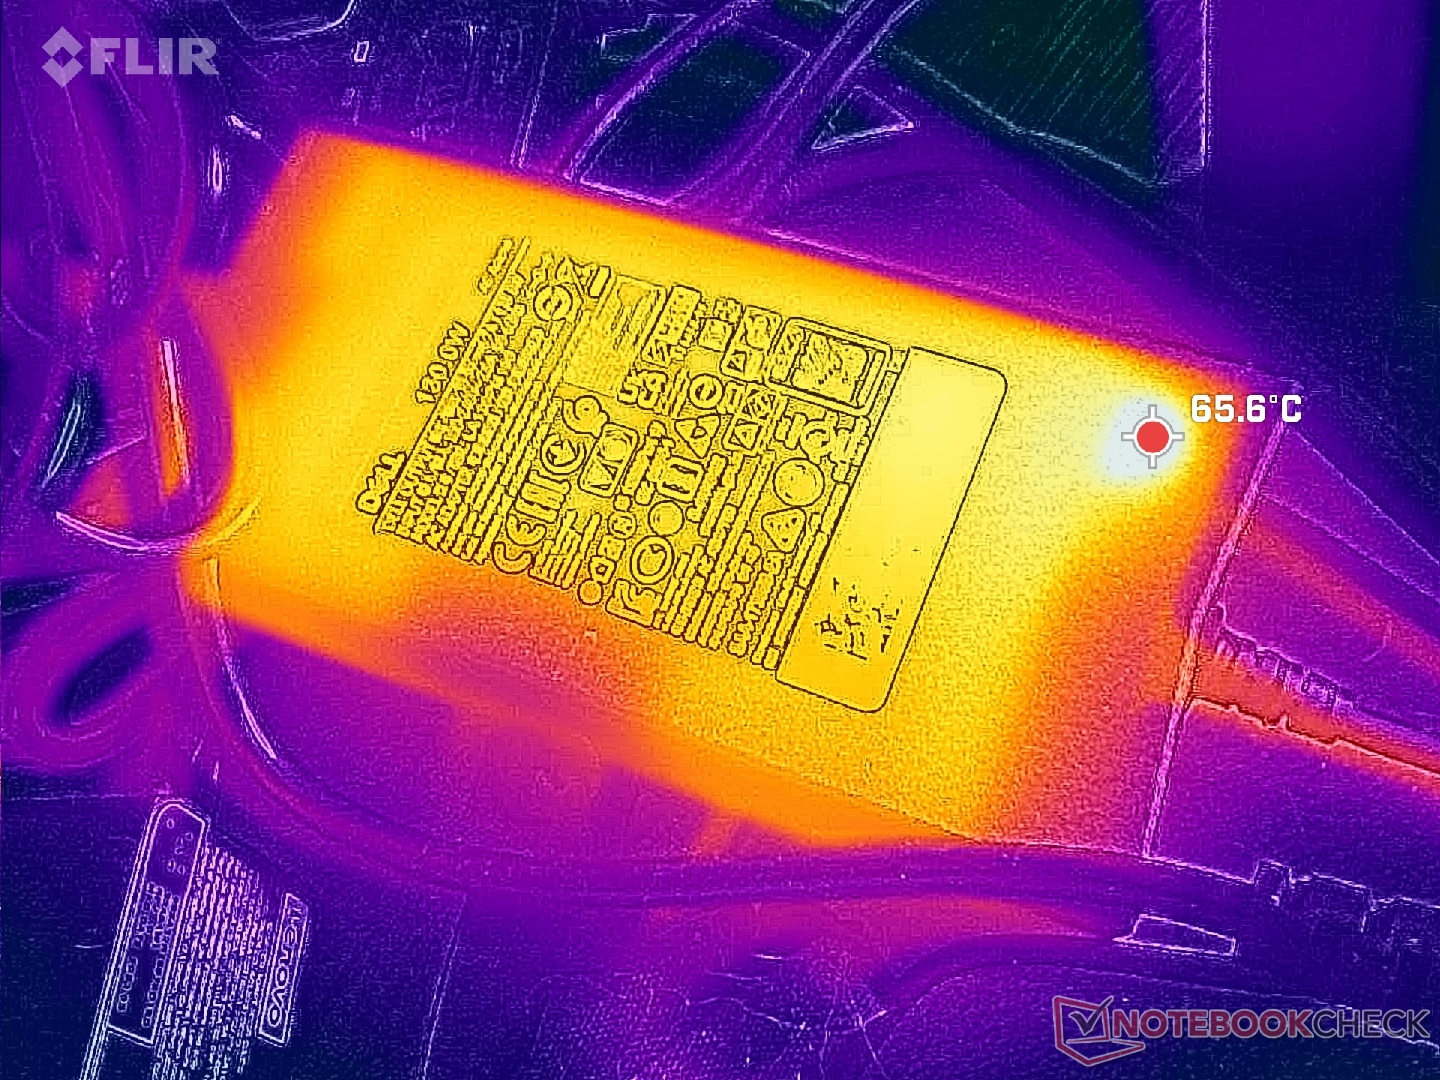
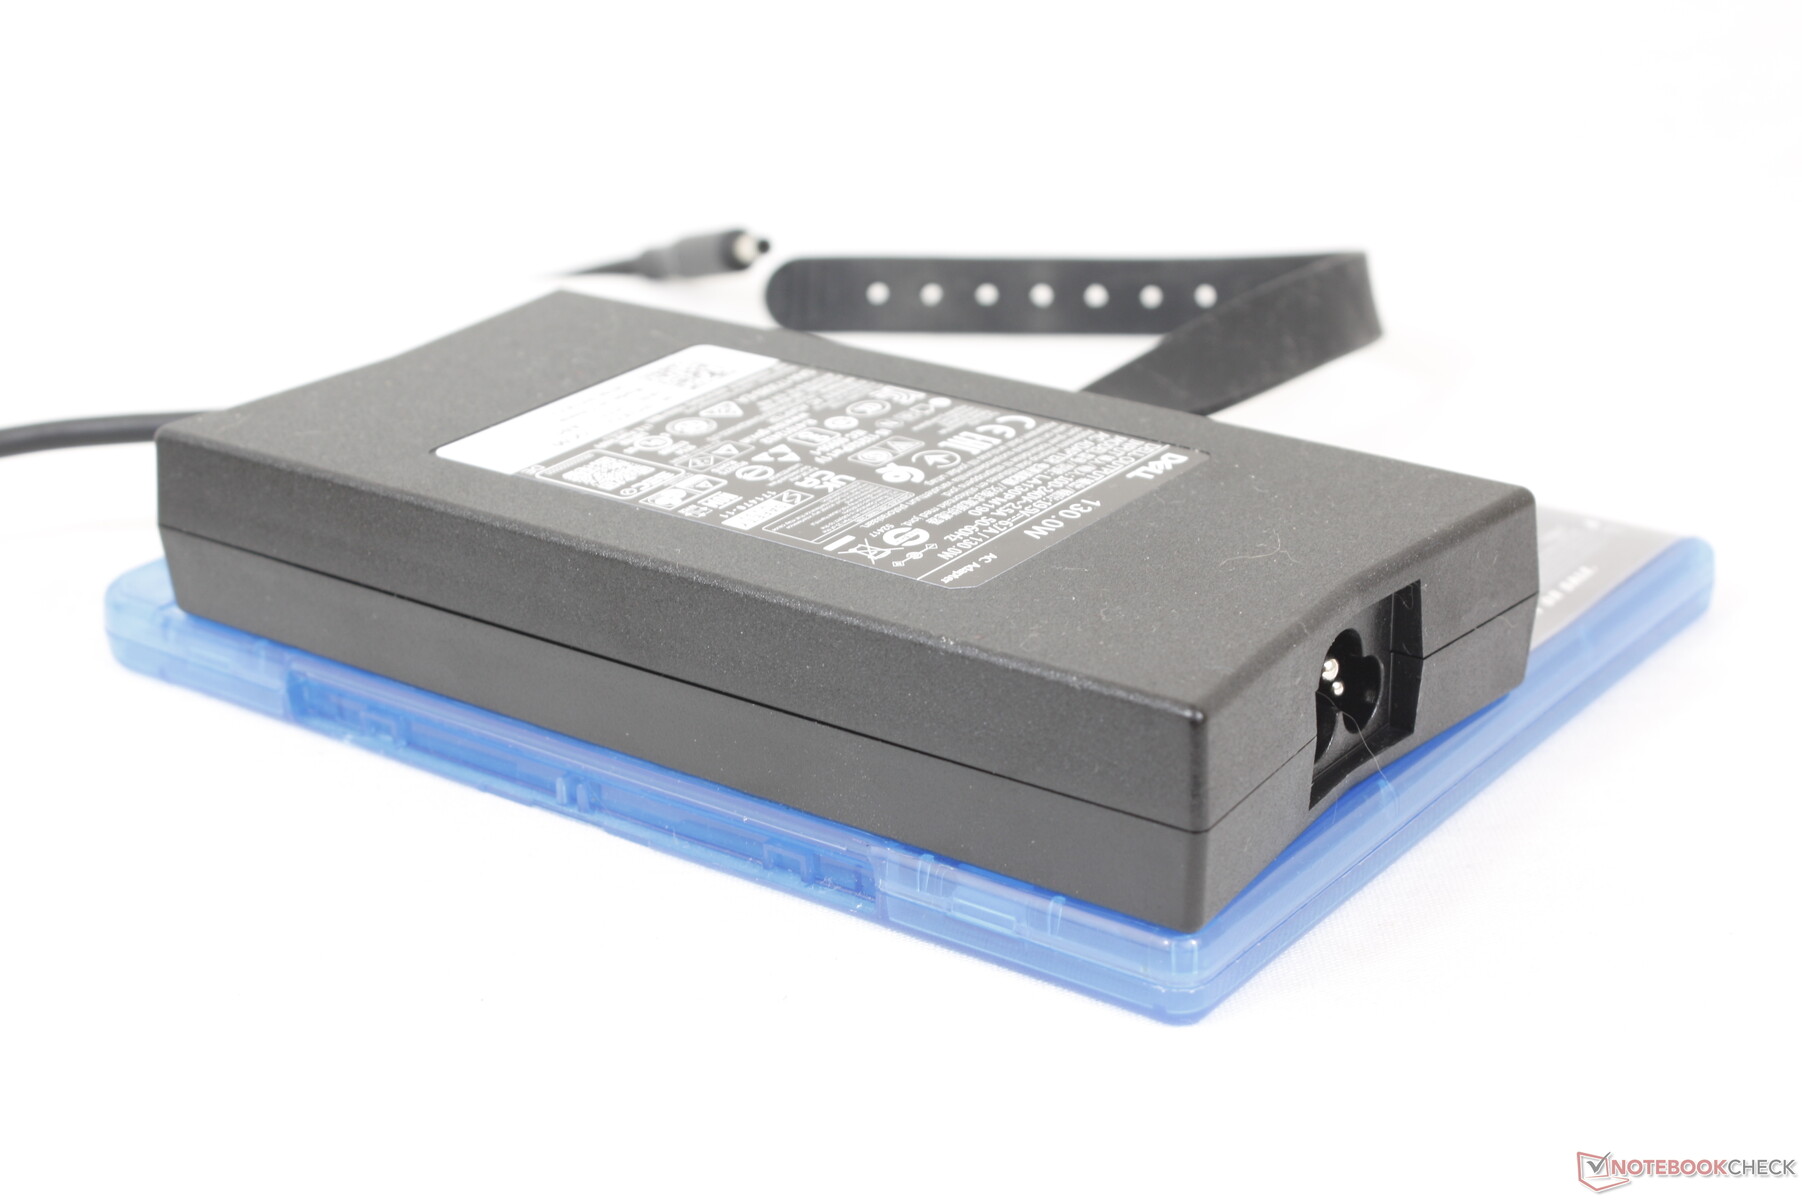
Dessutom är nätadaptern märkbart varmare än genomsnittet vid över 65 C. Du vill ge gott om andningsutrymme för nätadaptern för säkerhets skull.
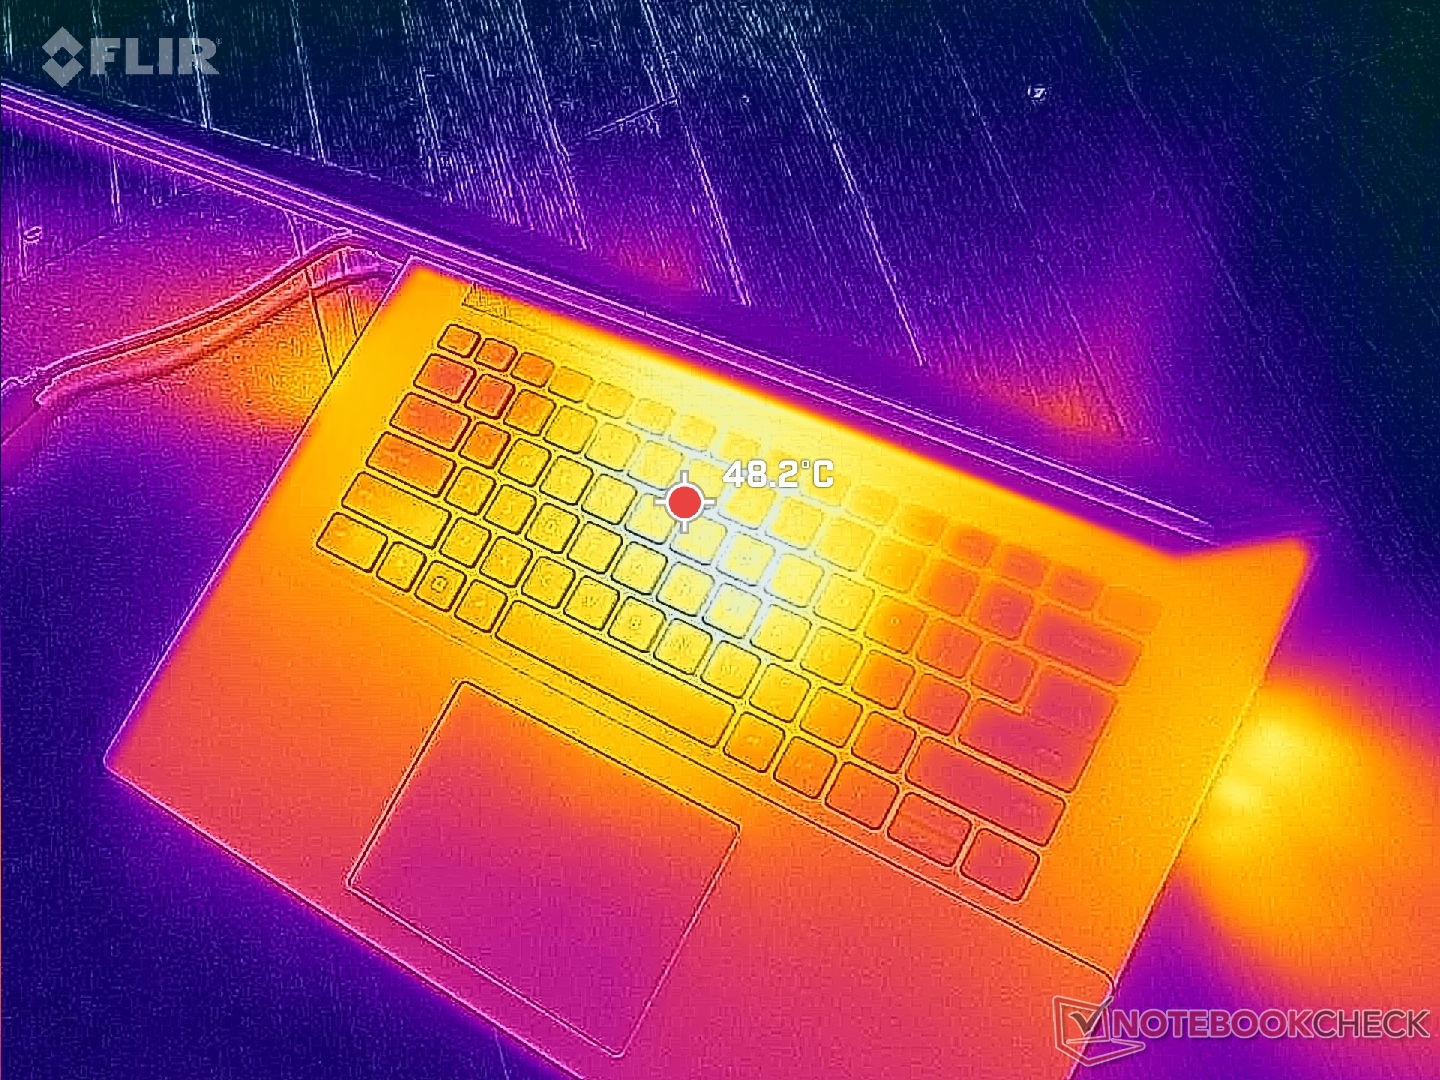
(-) Den maximala temperaturen på ovansidan är 47.8 °C / 118 F, jämfört med genomsnittet av 36.8 °C / 98 F , allt från 21 till 71 °C för klassen Multimedia.
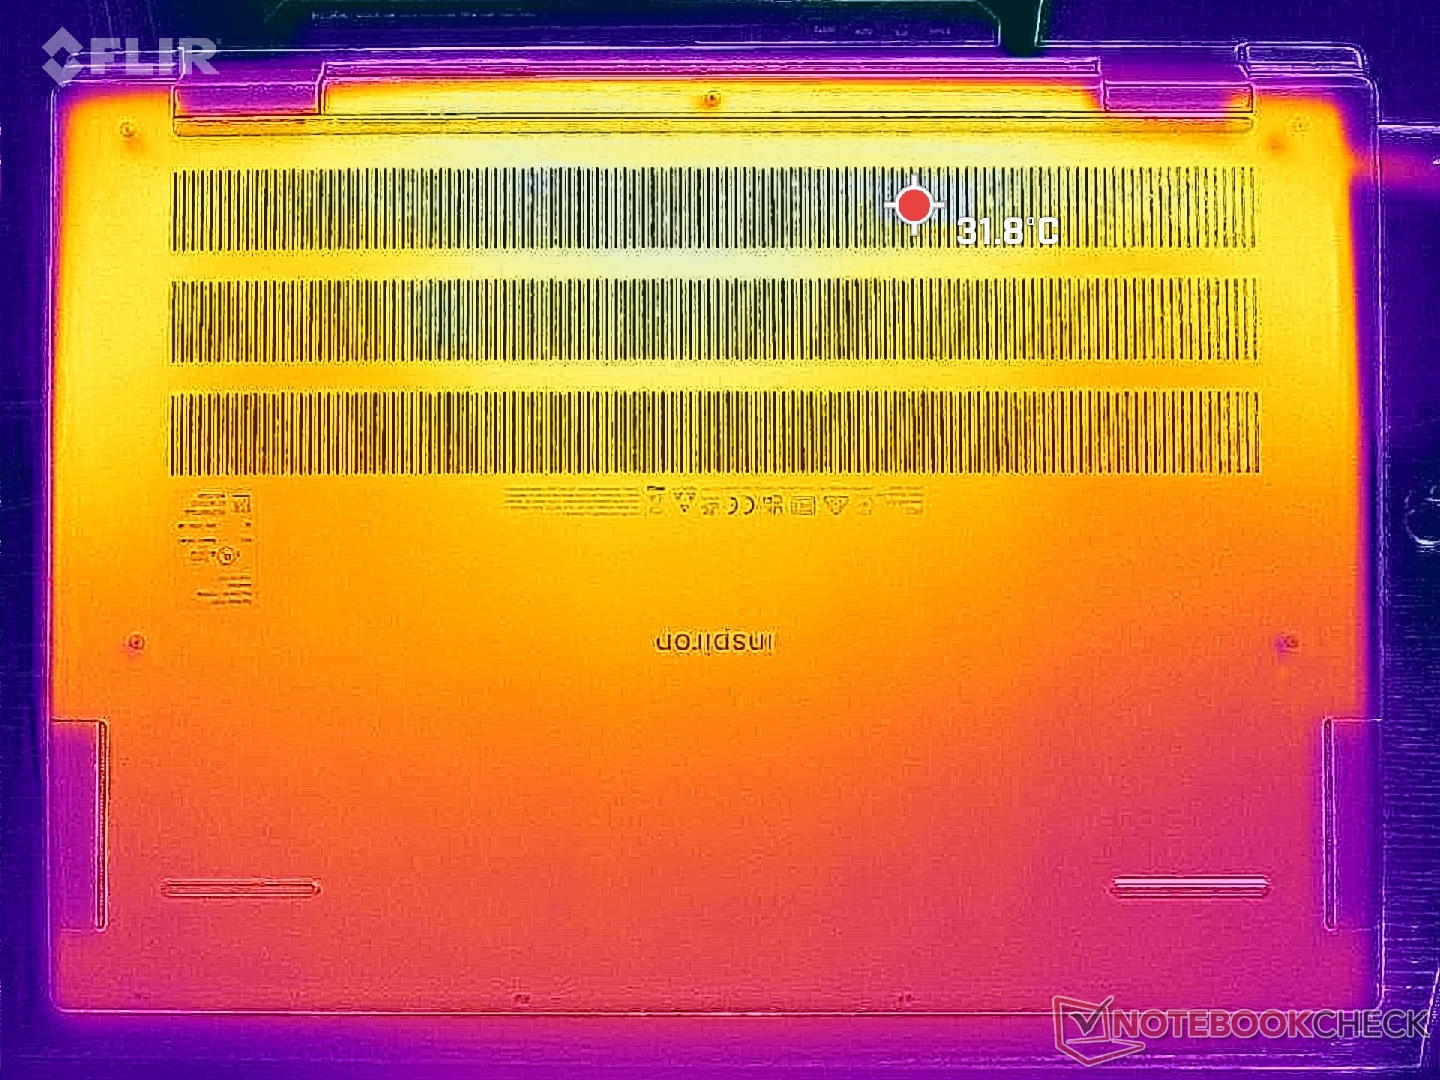
(±) Botten värms upp till maximalt 42.2 °C / 108 F, jämfört med genomsnittet av 39.1 °C / 102 F
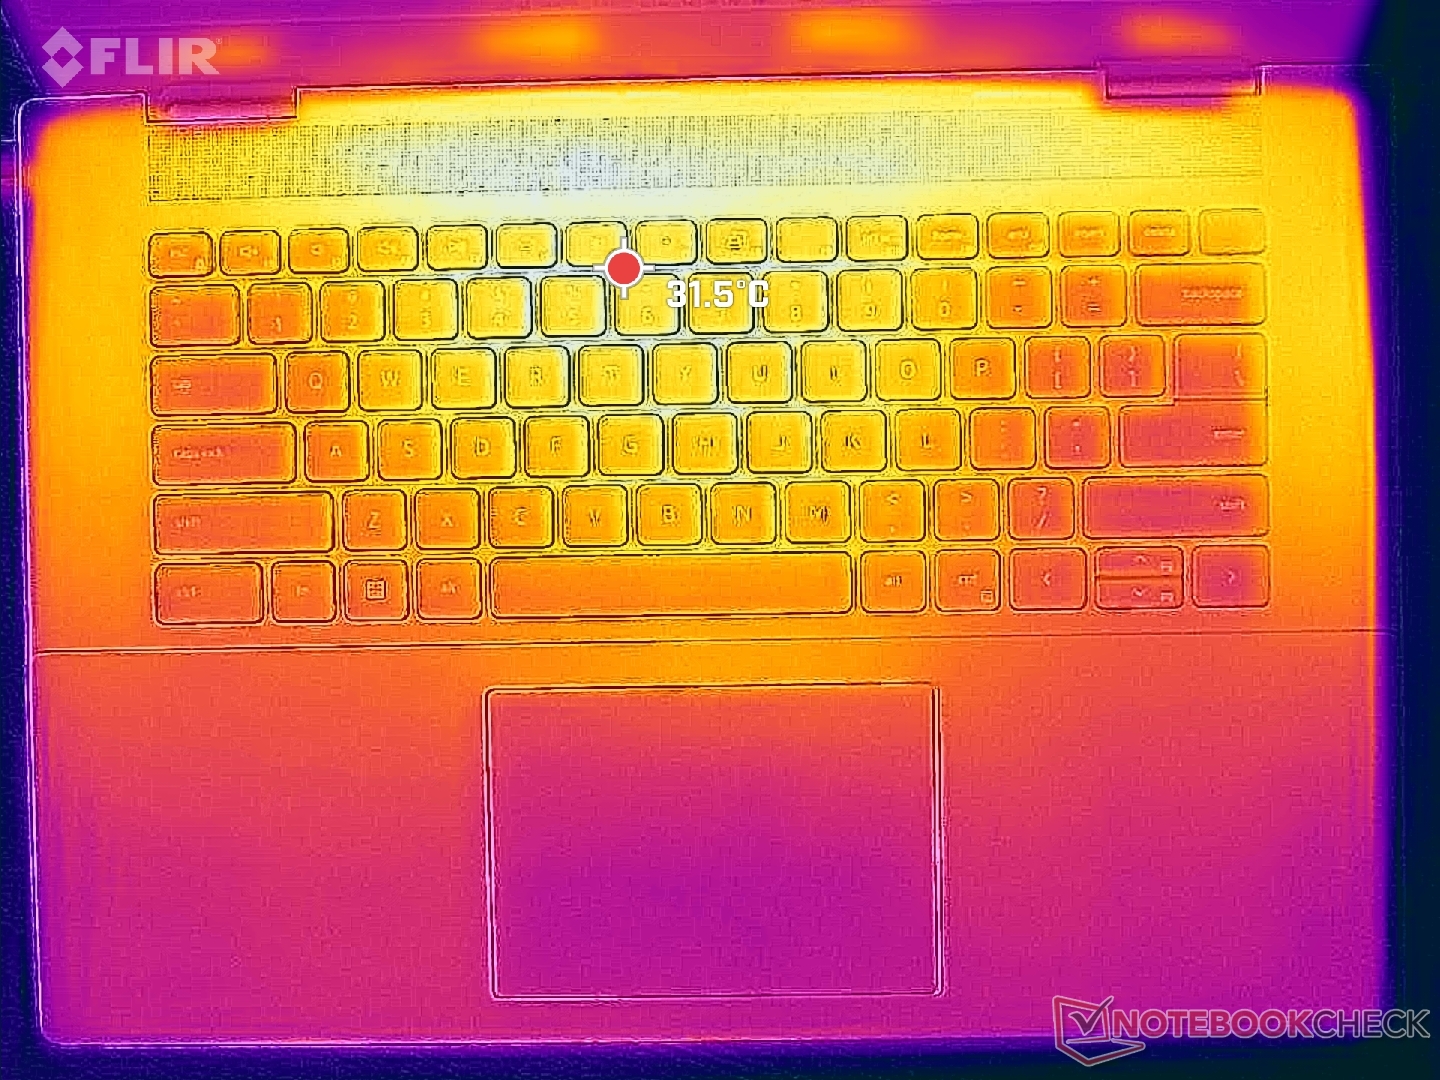
(±) Vid tomgångsbruk är medeltemperaturen för ovansidan 32 °C / 90 F, jämfört med enhetsgenomsnittet på 31.3 °C / ### class_avg_f### F.
(-) När du spelar The Witcher 3 är medeltemperaturen för ovansidan 40.6 °C / 105 F, jämfört med enhetsgenomsnittet på 31.3 °C / ## #class_avg_f### F.
(±) Handledsstöden och pekplattan kan bli väldigt varma vid beröring med maximalt 36.6 °C / 97.9 F.
(-) Medeltemperaturen för handledsstödsområdet på liknande enheter var 28.7 °C / 83.7 F (-7.9 °C / -14.2 F).
| Dell Inspiron 16 Plus 7630 Intel Core i7-13700H, NVIDIA GeForce RTX 4060 Laptop GPU | Dell Inspiron 16 Plus 7620 Intel Core i7-12700H, NVIDIA GeForce RTX 3050 Ti Laptop GPU | Lenovo Slim Pro 9i 16IRP8 Intel Core i9-13905H, NVIDIA GeForce RTX 4050 Laptop GPU | Asus Vivobook Pro 16X K6604JV-MX016W Intel Core i9-13980HX, NVIDIA GeForce RTX 4060 Laptop GPU | HP Envy 16 h0112nr Intel Core i7-12700H, NVIDIA GeForce RTX 3060 Laptop GPU | MSI Summit E16 Flip A12UDT-031 Intel Core i7-1280P, NVIDIA GeForce RTX 3050 Ti Laptop GPU | |
|---|---|---|---|---|---|---|
| Heat | 6% | 10% | -3% | 3% | 2% | |
| Maximum Upper Side * (°C) | 47.8 | 46 4% | 37.8 21% | 39.7 17% | 45.2 5% | 49.2 -3% |
| Maximum Bottom * (°C) | 42.2 | 45.8 -9% | 44.8 -6% | 60 -42% | 44 -4% | 50.2 -19% |
| Idle Upper Side * (°C) | 35.2 | 29.2 17% | 30.6 13% | 30.9 12% | 33.6 5% | 29.4 16% |
| Idle Bottom * (°C) | 35 | 31 11% | 31 11% | 34.7 1% | 32.6 7% | 30 14% |
* ... mindre är bättre
Stresstest
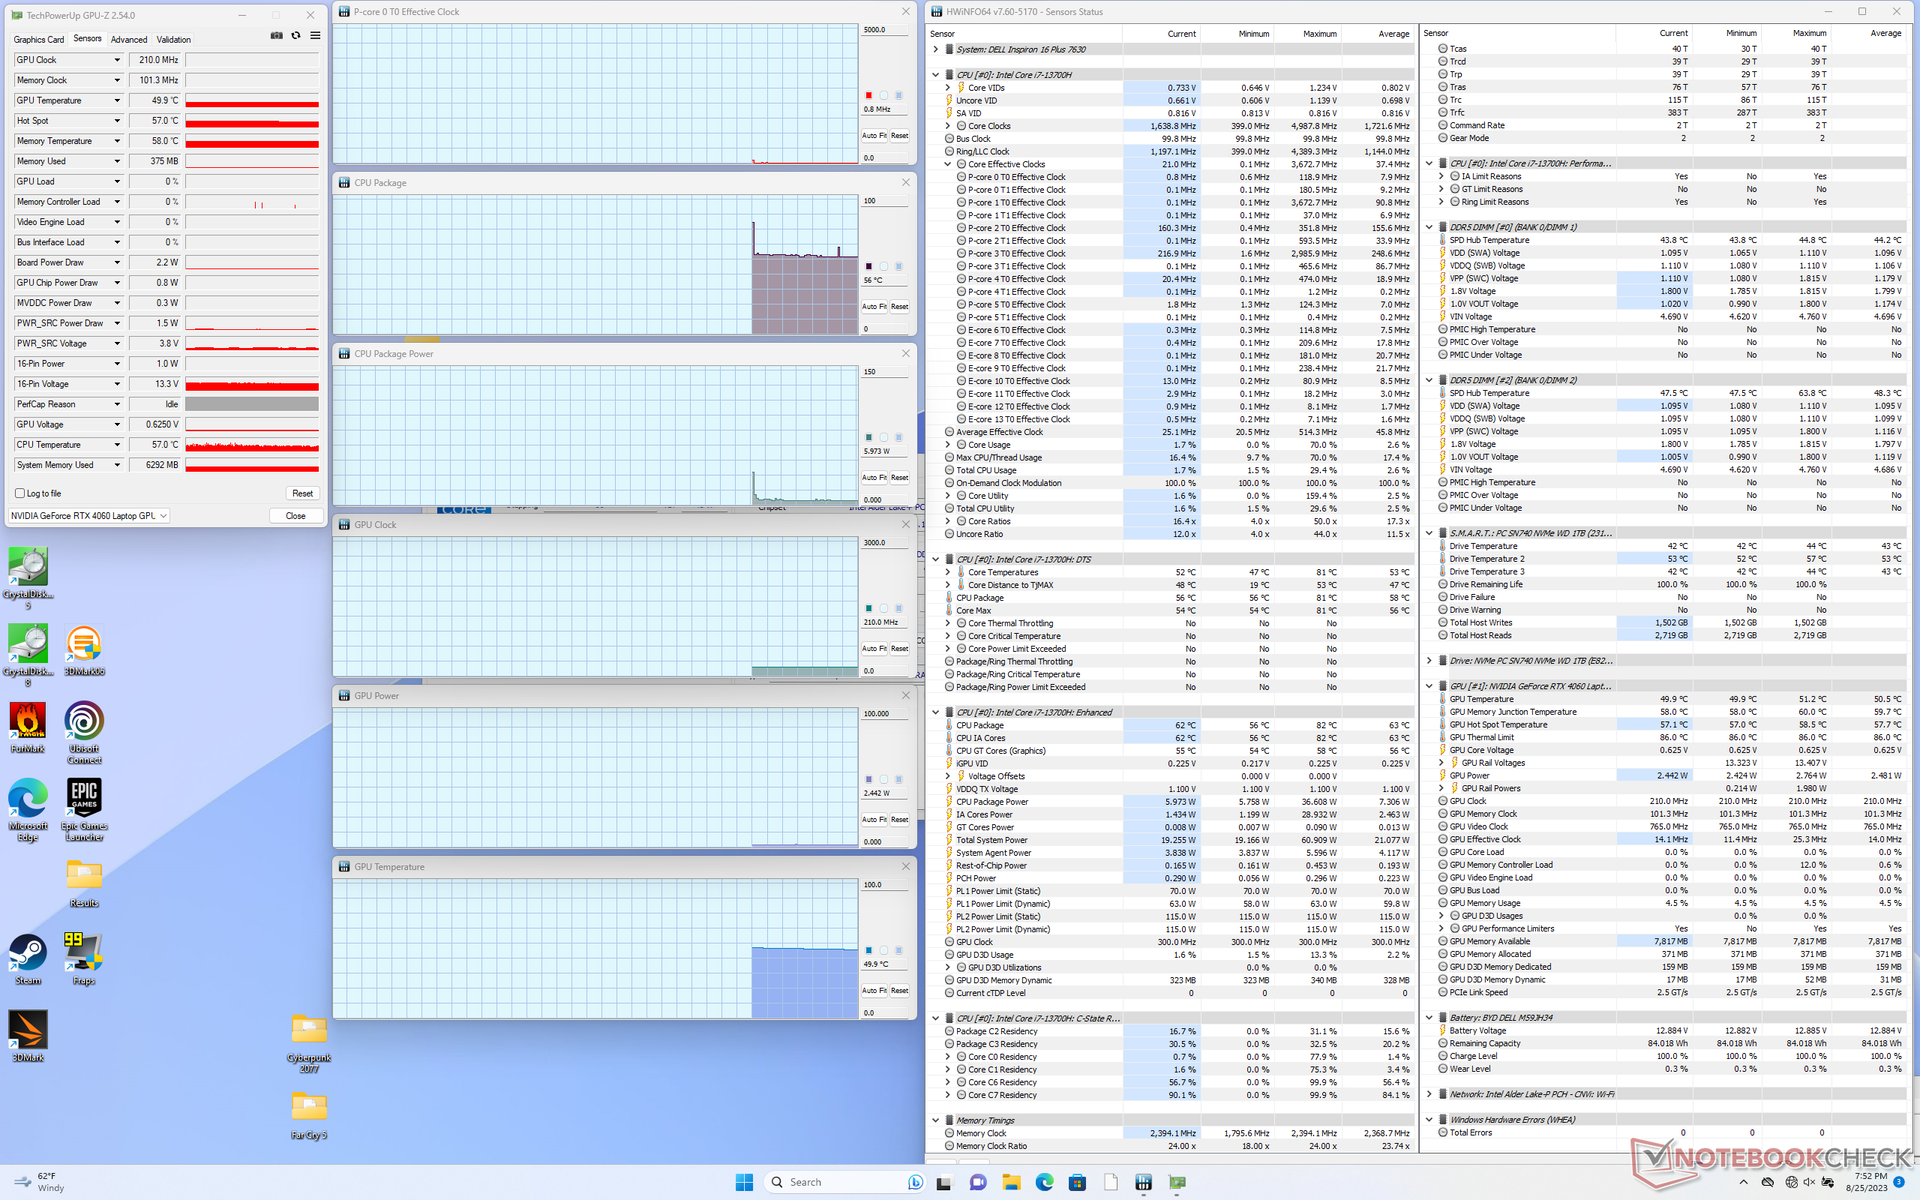
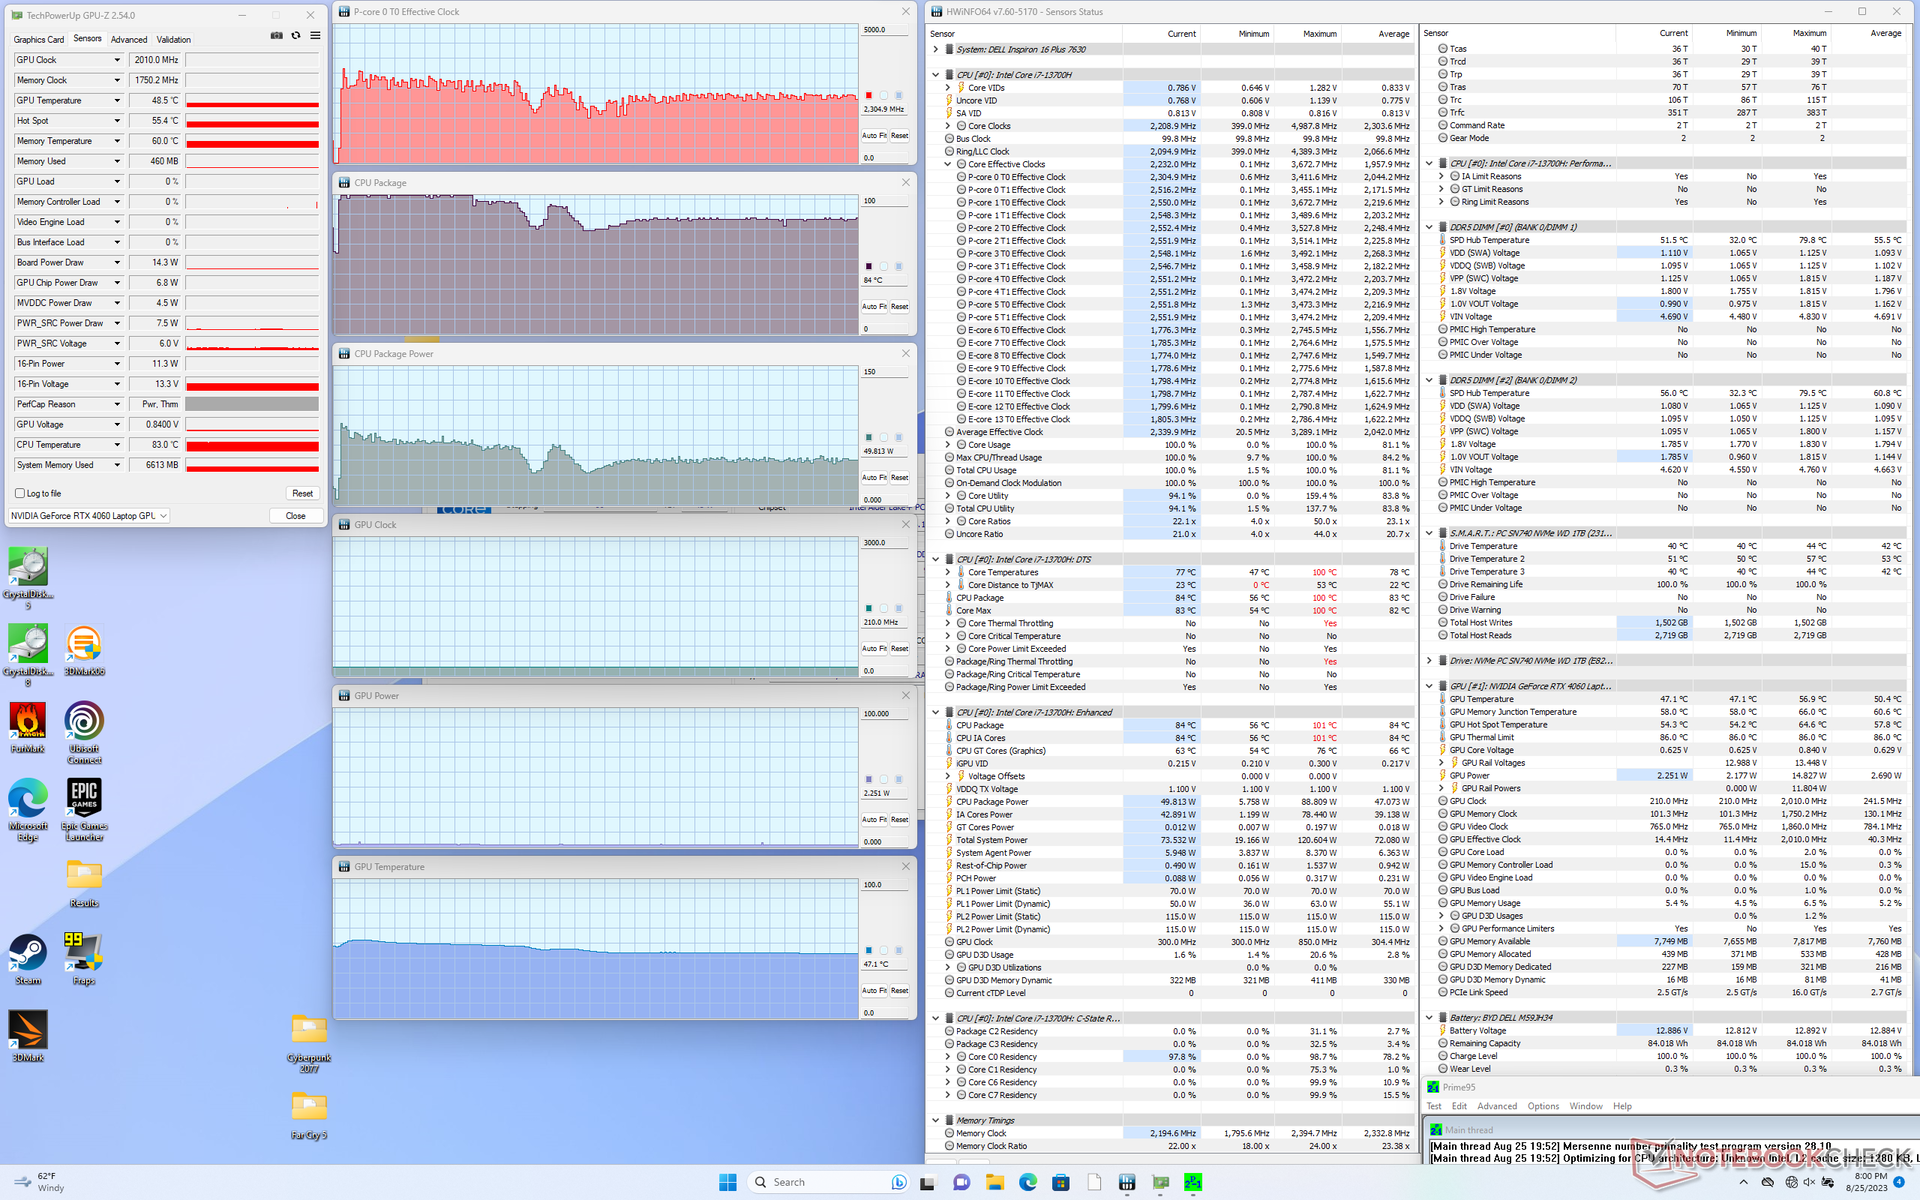
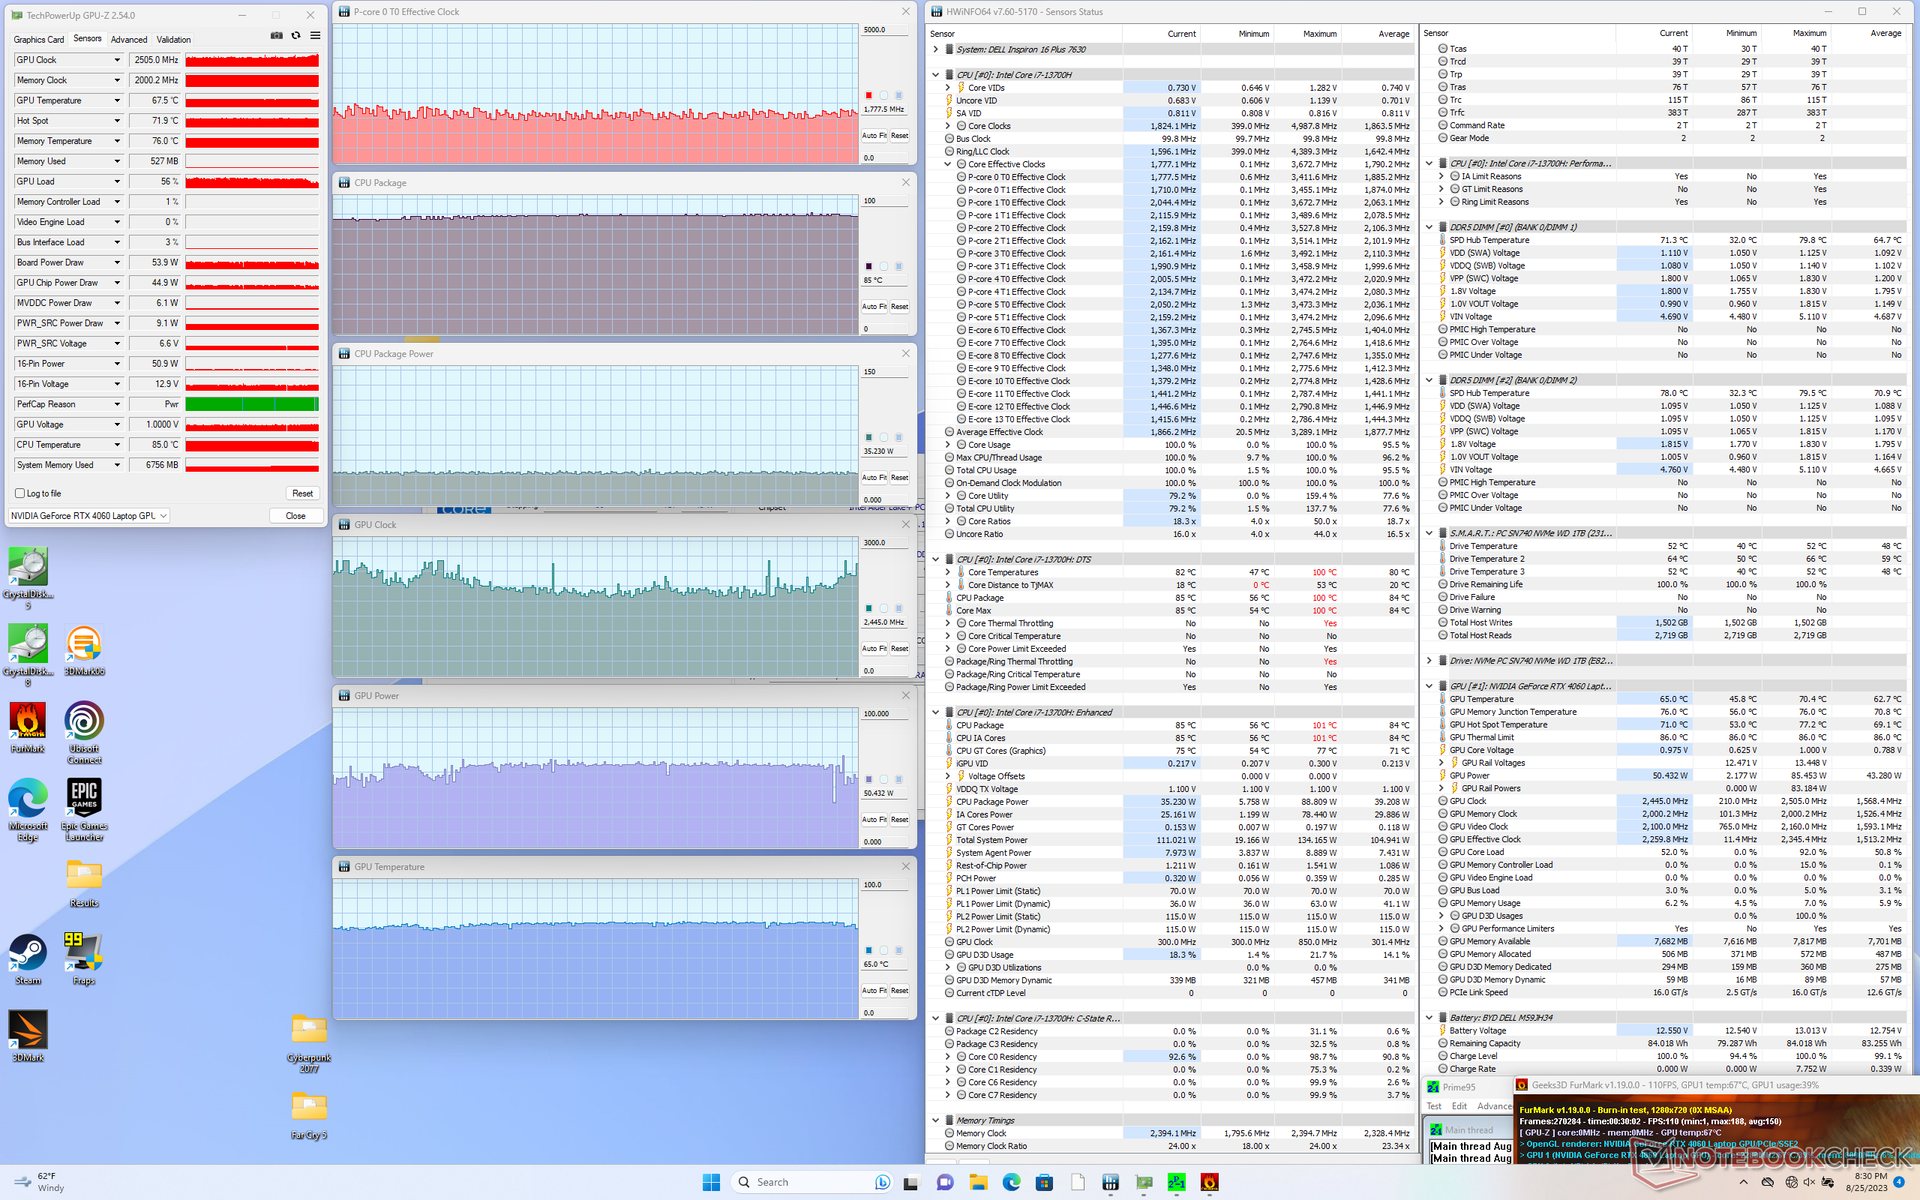
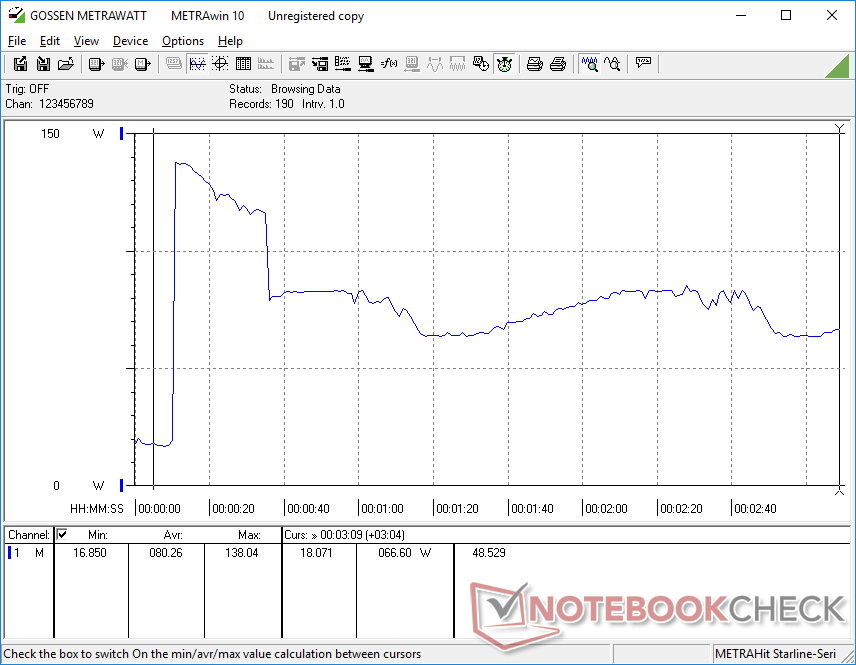
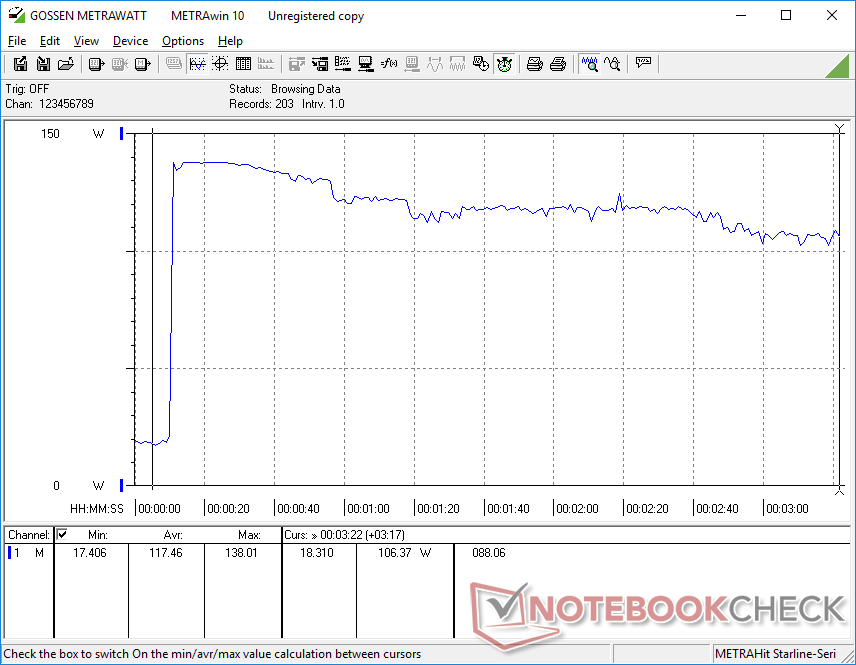
När Prime95 kördes ökade CPU:n till 3,4 GHz, 89 W och en stekhet temperatur på 100 C under bara några sekunder innan den slutligen stabiliserades på runt 2,3 GHz och 50 W för att hålla en mer rimlig kärntemperatur på 84 C. Förra årets modell stabiliserades också på ungefär samma värden när samma test kördes.
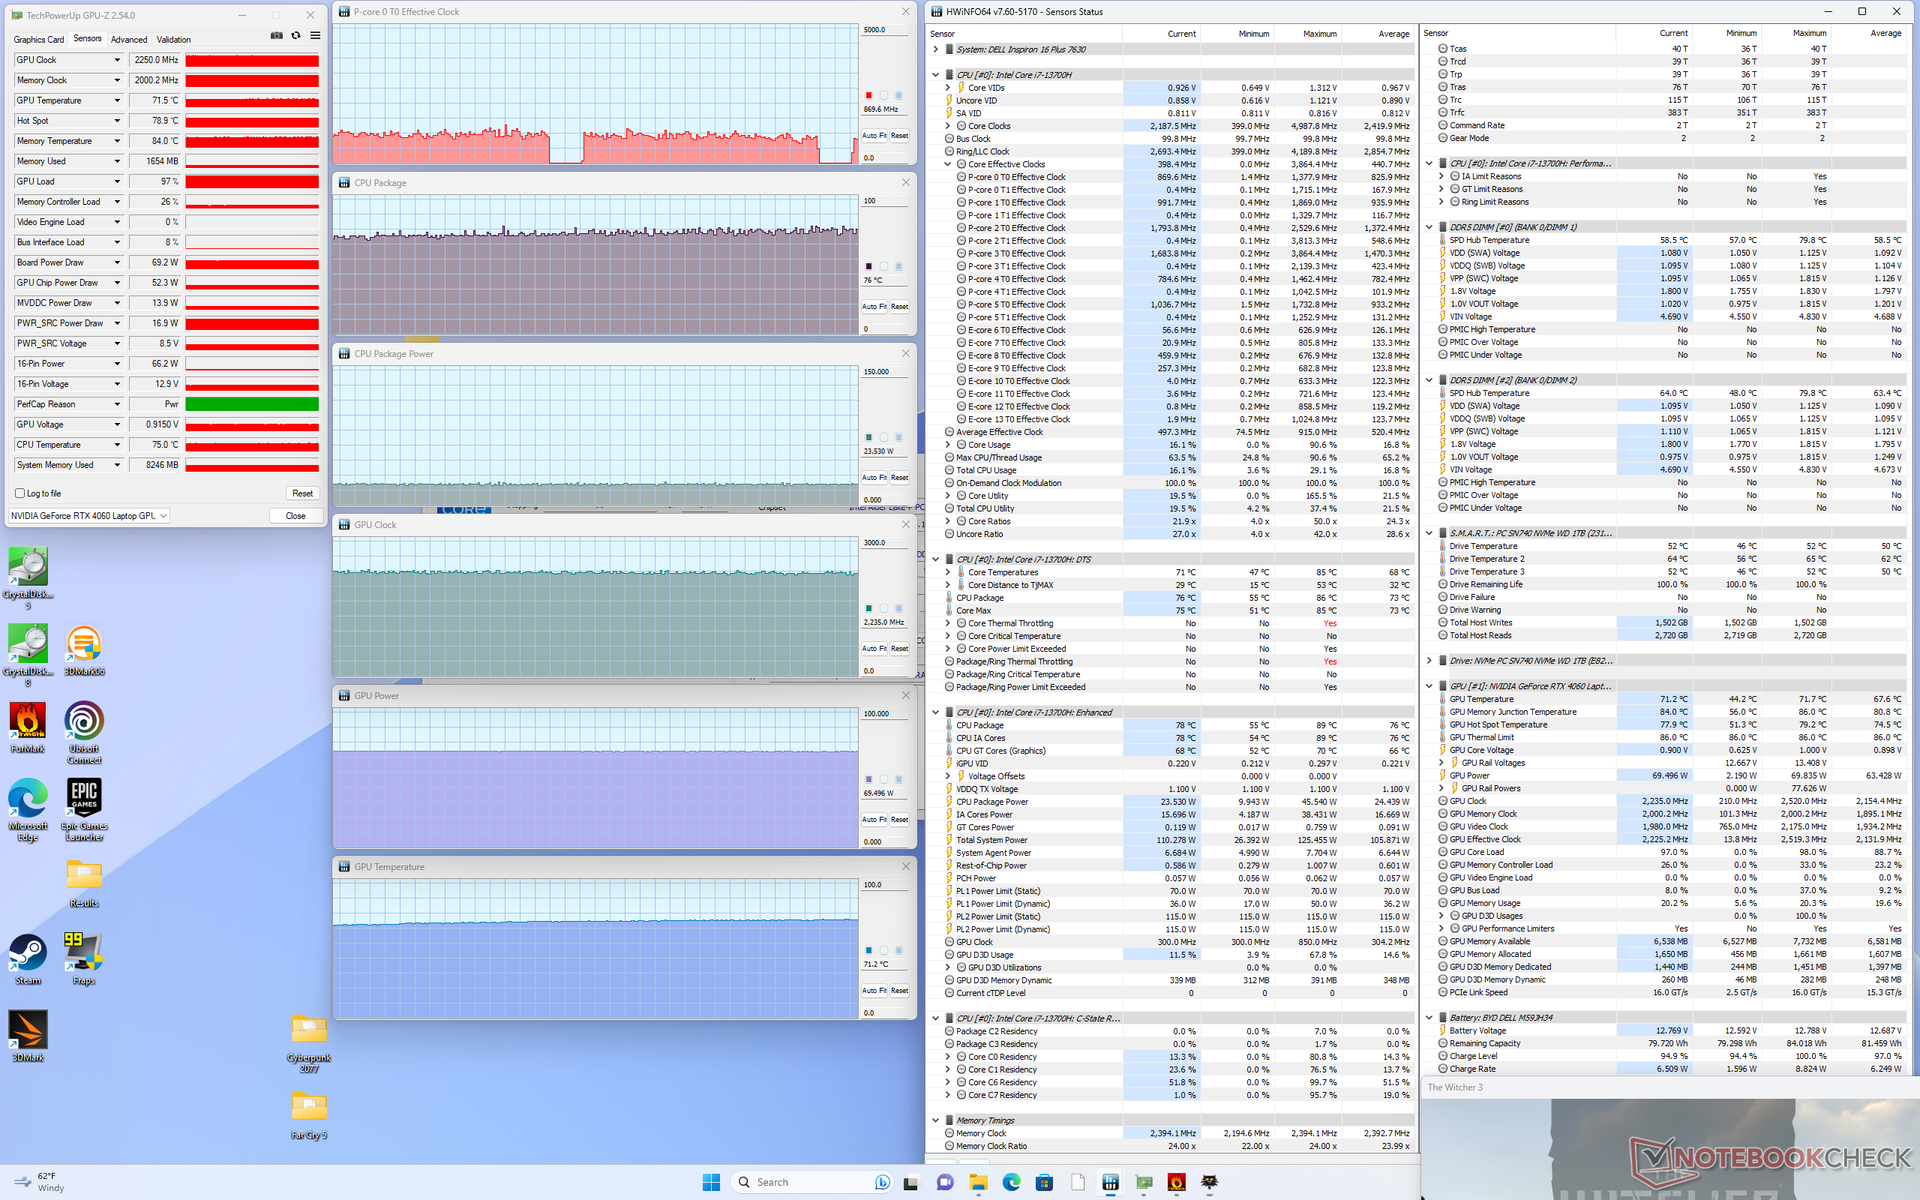
När man kör Witcher 3 i Performance-läge för att representera typiska spelbelastningar, skulle Nvidia GPU stabiliseras vid 2235 MHz, 71 C och 69 W enligt HWiNFO. Att gå ner till balanserat läge påverkar inte dessa värden nämnvärt, vilket stämmer överens med våra Fire Strike observationer ovan. Intressant nog skulle kärntemperaturerna vara mycket svalare än vad vi registrerade på Inspiron 16 Plus 7620 när vi körde samma spel, sannolikt på grund av vårt högre fläktljud och övergripande förbättringar av kyllösningen.
Observera att HWiNFO rapporterar en GPU-effektförbrukning på 69 W vid spel, medan Dell anger en GPU-effekt på endast 60 W. Nvidia Control Panel rapporterar en GPU-effekt på 70 W.
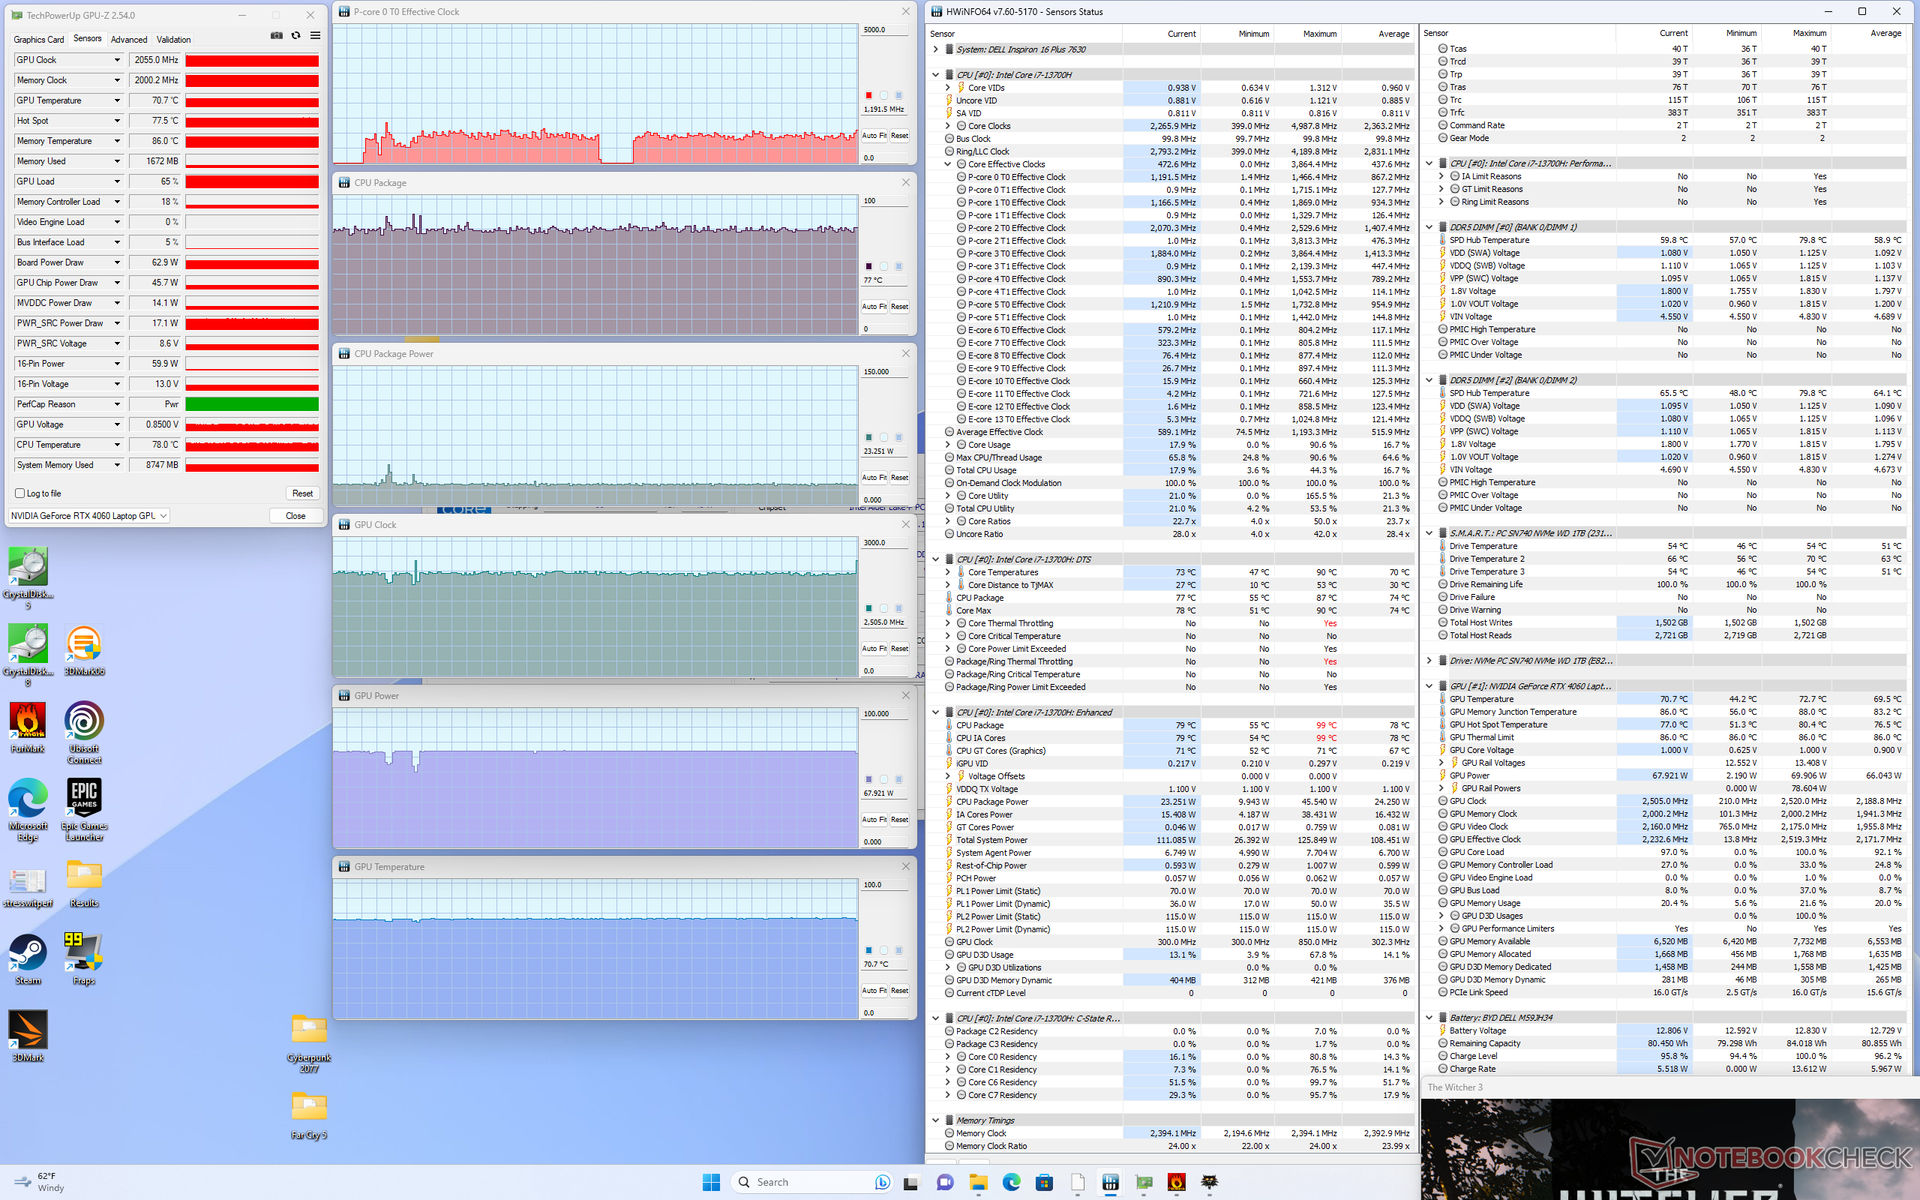
| CPU-klocka (GHz) | GPU-klocka (MHz) | Genomsnittlig CPU-temperatur (°C) | Genomsnittlig GPU-temperatur (°C) | |
| System i viloläge | -- | -- | 56 | 50 |
| Prime95 Stress | 2.3 - 2.4 | -- | 84 | 47 |
| Prime95 + FurMark Stress | ~1.8 | ~2445 | 85 | 65 |
| Witcher 3 Stress(balanserat läge) | ~1.1 | 2055 | 77 | 71 |
| Witcher 3 Stress (Performance mode) | ~1.1 | 2250 | 76 | 71 |
Högtalare
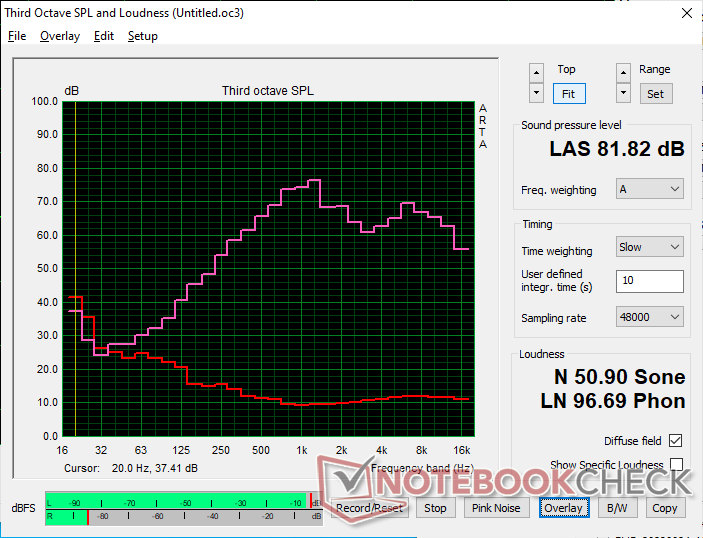
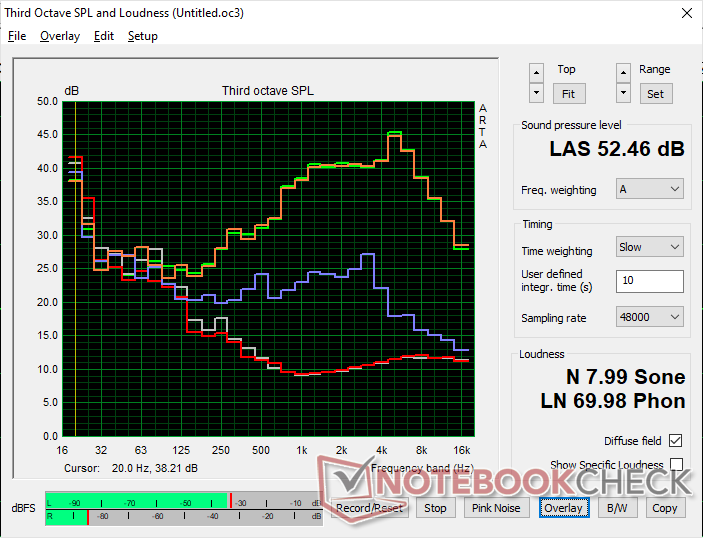
Dell Inspiron 16 Plus 7630 ljudanalys
(±) | högtalarljudstyrkan är genomsnittlig men bra (81.8 dB)
Bas 100 - 315 Hz
(-) | nästan ingen bas - i genomsnitt 17% lägre än medianen
(±) | linjäriteten för basen är genomsnittlig (8.4% delta till föregående frekvens)
Mellan 400 - 2000 Hz
(±) | högre mellan - i genomsnitt 6.3% högre än median
(+) | mids är linjära (6.2% delta till föregående frekvens)
Högsta 2 - 16 kHz
(+) | balanserade toppar - endast 2.2% från medianen
(+) | toppar är linjära (5.6% delta till föregående frekvens)
Totalt 100 - 16 000 Hz
(±) | linjäriteten för det totala ljudet är genomsnittlig (15.9% skillnad mot median)
Jämfört med samma klass
» 40% av alla testade enheter i den här klassen var bättre, 6% liknande, 54% sämre
» Den bästa hade ett delta på 5%, genomsnittet var 17%, sämst var 45%
Jämfört med alla testade enheter
» 25% av alla testade enheter var bättre, 5% liknande, 70% sämre
» Den bästa hade ett delta på 4%, genomsnittet var 23%, sämst var 134%
Apple MacBook Pro 16 2021 M1 Pro ljudanalys
(+) | högtalare kan spela relativt högt (84.7 dB)
Bas 100 - 315 Hz
(+) | bra bas - bara 3.8% från medianen
(+) | basen är linjär (5.2% delta till föregående frekvens)
Mellan 400 - 2000 Hz
(+) | balanserad mellan - endast 1.3% från medianen
(+) | mids är linjära (2.1% delta till föregående frekvens)
Högsta 2 - 16 kHz
(+) | balanserade toppar - endast 1.9% från medianen
(+) | toppar är linjära (2.7% delta till föregående frekvens)
Totalt 100 - 16 000 Hz
(+) | det totala ljudet är linjärt (4.6% skillnad mot median)
Jämfört med samma klass
» 0% av alla testade enheter i den här klassen var bättre, 0% liknande, 100% sämre
» Den bästa hade ett delta på 5%, genomsnittet var 17%, sämst var 45%
Jämfört med alla testade enheter
» 0% av alla testade enheter var bättre, 0% liknande, 100% sämre
» Den bästa hade ett delta på 4%, genomsnittet var 23%, sämst var 134%
Energiförvaltning
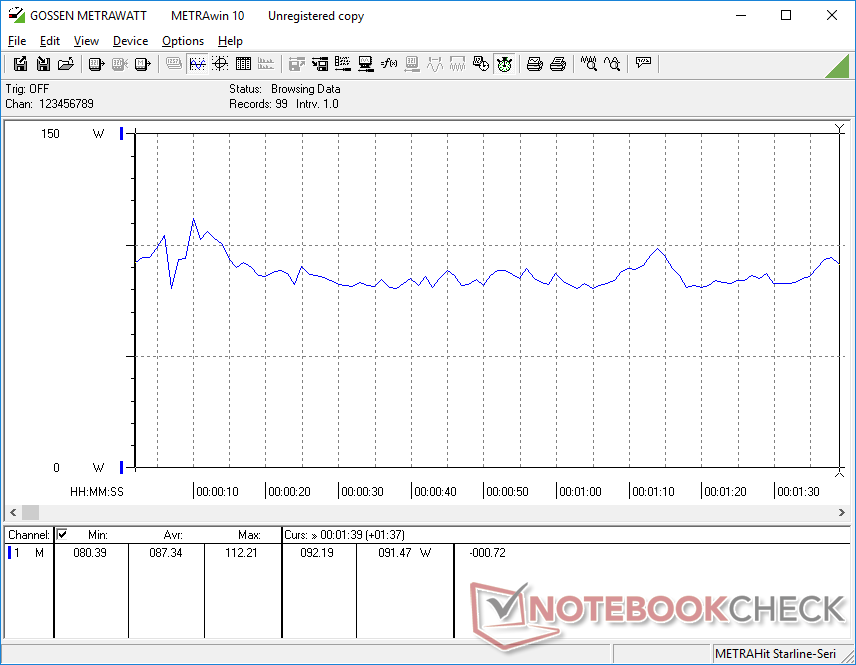
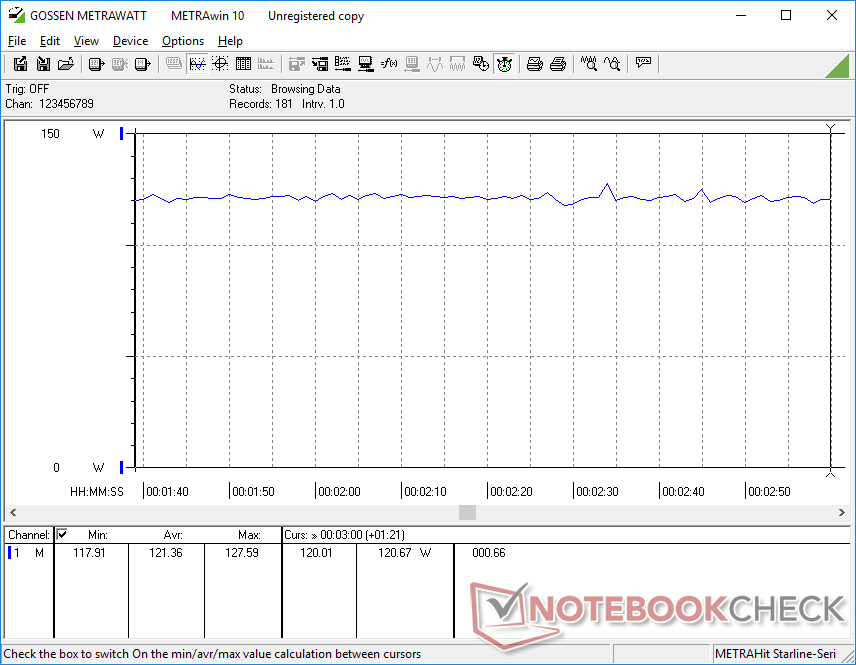
Strömförbrukning - hög GPU-prestanda per watt
Förbrukningen är något högre än för förra årets modell när den går på tomgång på skrivbordet eller när spel körs. Den 8-procentiga ökningen vid spel är dock ingenting jämfört med den 40-60-procentiga ökningen av grafikprestanda jämfört med RTX 3050 Ti. Prestanda per watt gynnar alltså fortfarande vår nyare modell, även om strömförbrukningen kan vara lite högre.
Bärbara speldatorer med samma CPU och GPU som vår Dell Inspiron, t.ex.Acer Nitro 17tenderar att vara mer strömkrävande eftersom de siktar på högre effektnivåer för att pressa ut mer prestanda ur processorerna. Vid spel, till exempel, skulle Acer kräva cirka 30 W mer.
Vi kan mäta en tillfällig maximal förbrukning på 138 W från den medelstora (~15 x 7,4 x 2,5 cm) 130 W AC-adaptern när CPU och GPU utnyttjas till 100 procent. Observera att konfigurationer utan diskret grafik levereras med en mindre 90 W AC-adapter istället.
| Av/Standby | |
| Låg belastning | |
| Hög belastning |
|
Förklaring:
min: | |
| Dell Inspiron 16 Plus 7630 i7-13700H, GeForce RTX 4060 Laptop GPU, WD PC SN740 SDDPTQD-1T00, IPS, 2560x1600, 16" | Dell Inspiron 16 Plus 7620 i7-12700H, GeForce RTX 3050 Ti Laptop GPU, Kioxia BG5 KBG50ZNS512G, IPS, 3072x1920, 16" | Lenovo Slim Pro 9i 16IRP8 i9-13905H, GeForce RTX 4050 Laptop GPU, Samsung PM9A1 MZVL21T0HCLR, Mini-LED, 3200x2000, 16" | Asus Vivobook Pro 16X K6604JV-MX016W i9-13980HX, GeForce RTX 4060 Laptop GPU, Solidigm P41 Plus SSDPFKNU010TZ, OLED, 3200x2000, 16" | HP Envy 16 h0112nr i7-12700H, GeForce RTX 3060 Laptop GPU, Micron 3400 1TB MTFDKBA1T0TFH, OLED, 3840x2400, 16" | MSI Summit E16 Flip A12UDT-031 i7-1280P, GeForce RTX 3050 Ti Laptop GPU, Samsung PM9A1 MZVL22T0HBLB, IPS, 2560x1600, 16" | |
|---|---|---|---|---|---|---|
| Power Consumption | 15% | -28% | -23% | -9% | 22% | |
| Idle Minimum * (Watt) | 15.6 | 6.8 56% | 16 -3% | 13.8 12% | 10 36% | 9.8 37% |
| Idle Average * (Watt) | 17.7 | 9.6 46% | 30 -69% | 16 10% | 10.9 38% | 15.3 14% |
| Idle Maximum * (Watt) | 20.6 | 17 17% | 30.4 -48% | 19 8% | 27.8 -35% | 16.3 21% |
| Load Average * (Watt) | 87.4 | 117.5 -34% | 78.9 10% | 147 -68% | 116.4 -33% | 87 -0% |
| Witcher 3 ultra * (Watt) | 121.7 | 113.1 7% | 155.3 -28% | 147.8 -21% | 133.7 -10% | 86.1 29% |
| Load Maximum * (Watt) | 138 | 137.4 -0% | 180.4 -31% | 244 -77% | 209.8 -52% | 100 28% |
* ... mindre är bättre
Power Consumption Witcher 3 / Stresstest
Power Consumption external Monitor
Batteritid
Både batterikapacitet och batteritid är desamma som tidigare. Vi kan spela in 9,5 timmars verklig WLAN-surfning i balanserat läge, vilket är längre än på konkurrerande modeller somLenovo Slim Pro 9i 16IRP8 eller HP Envy 16 med minst ett par timmar vardera.
Laddning från tom till full kapacitet tar cirka 90 minuter med den medföljande nätadaptern. Systemet kan också laddas med USB-C-adaptrar som de som medföljer XPS-serien.
| Dell Inspiron 16 Plus 7630 i7-13700H, GeForce RTX 4060 Laptop GPU, 86 Wh | Dell Inspiron 16 Plus 7620 i7-12700H, GeForce RTX 3050 Ti Laptop GPU, 86 Wh | Lenovo Slim Pro 9i 16IRP8 i9-13905H, GeForce RTX 4050 Laptop GPU, 75 Wh | Asus Vivobook Pro 16X K6604JV-MX016W i9-13980HX, GeForce RTX 4060 Laptop GPU, 90 Wh | HP Envy 16 h0112nr i7-12700H, GeForce RTX 3060 Laptop GPU, 83 Wh | MSI Summit E16 Flip A12UDT-031 i7-1280P, GeForce RTX 3050 Ti Laptop GPU, 82 Wh | |
|---|---|---|---|---|---|---|
| Batteridrifttid | -2% | -30% | -12% | -0% | -24% | |
| Reader / Idle (h) | 17.6 | 18.6 6% | 17.8 1% | |||
| WiFi v1.3 (h) | 9.4 | 9.6 2% | 6.6 -30% | 6.5 -31% | 7.9 -16% | 7.1 -24% |
| Load (h) | 1.4 | 1.2 -14% | 1.5 7% | 1.6 14% | ||
| H.264 (h) | 5.3 |
För
Emot
Slutsats - Uppgradera för snabbare GPU
Uppgraderingarna jämfört med förra årets Inspiron 16 Plus 7620 är i många avseenden mer betydande än vad som ursprungligen förväntades. Bortsett från den enorma ökningen i grafikprestanda när man hoppar från RTX 3050 Ti till RTX 4060, är det tystare och högre fläktljudet mellan de två modellerna anmärkningsvärt, liksom de svalare kärntemperaturerna på den nyare modellen. Skärmalternativen är annorlunda eftersom de nu inkluderar en valfri 120 Hz uppdateringsfrekvens medan SODIMM-uppgraderingar nu erbjuder två platser istället för en. De styvare gångjärnen är också en välkommen förändring för att minska risken för att de går sönder för tidigt. Användarupplevelsen har förbättrats tillräckligt även om CPU-prestandan är föråldrad och tangentbordet förblir detsamma som tidigare.
Inspiron 16 Plus 7630 handlar om balans. Dess funktioner och prestanda är precis tillräckliga för att tillfredsställa de flesta multimedia- och spelsyften utan att behöva spendera en arm och ett ben.
Inspiron 16 Plus 7630 är en mångsidig bärbar dator för multimedia och spel, men den saknar några funktioner som bärbara datorer för hardcore-multimedia och hardcore-spel tenderar att ha. På multimediasidan kommer Inspiron 16 Plus 7630-ägare att gå miste om fylligare DCi-P3-färger, högre inbyggda upplösningar och en snabb integrerad SD-kortläsare. På spelsidan saknar systemet G-Sync och MUX och dess RTX 4060 är i allmänhet långsammare än genomsnittet. Inspiron 16 Plus 7630 är utmärkt för innehållsskapande och spel, men användare som lutar sig mer mot innehållsskapande bör överväga en HP Envy 16 eller Asus ZenBook Pro Duo medan tunga spelare kommer att vilja titta på dedikerade spelmaskiner som en Dell G-modell eller en Asus ROG.
Pris och tillgänglighet
Dell levererar nu Inspiron 16 Plus 7630 med Core i7 och RTX 4060 för $1250 USD.
Dell Inspiron 16 Plus 7630
- 08/30/2023 v7 (old)
Allen Ngo
Genomskinlighet
Valet av enheter som ska granskas görs av vår redaktion. Testprovet gavs till författaren som ett lån av tillverkaren eller återförsäljaren för denna recension. Långivaren hade inget inflytande på denna recension och inte heller fick tillverkaren en kopia av denna recension innan publiceringen. Det fanns ingen skyldighet att publicera denna recension. Som ett oberoende medieföretag är Notebookcheck inte föremål för auktoritet från tillverkare, återförsäljare eller förlag.
This is how Notebookcheck is testingEvery year, Notebookcheck independently reviews hundreds of laptops and smartphones using standardized procedures to ensure that all results are comparable. We have continuously developed our test methods for around 20 years and set industry standards in the process. In our test labs, high-quality measuring equipment is utilized by experienced technicians and editors. These tests involve a multi-stage validation process. Our complex rating system is based on hundreds of well-founded measurements and benchmarks, which maintains objectivity.
Price comparison

