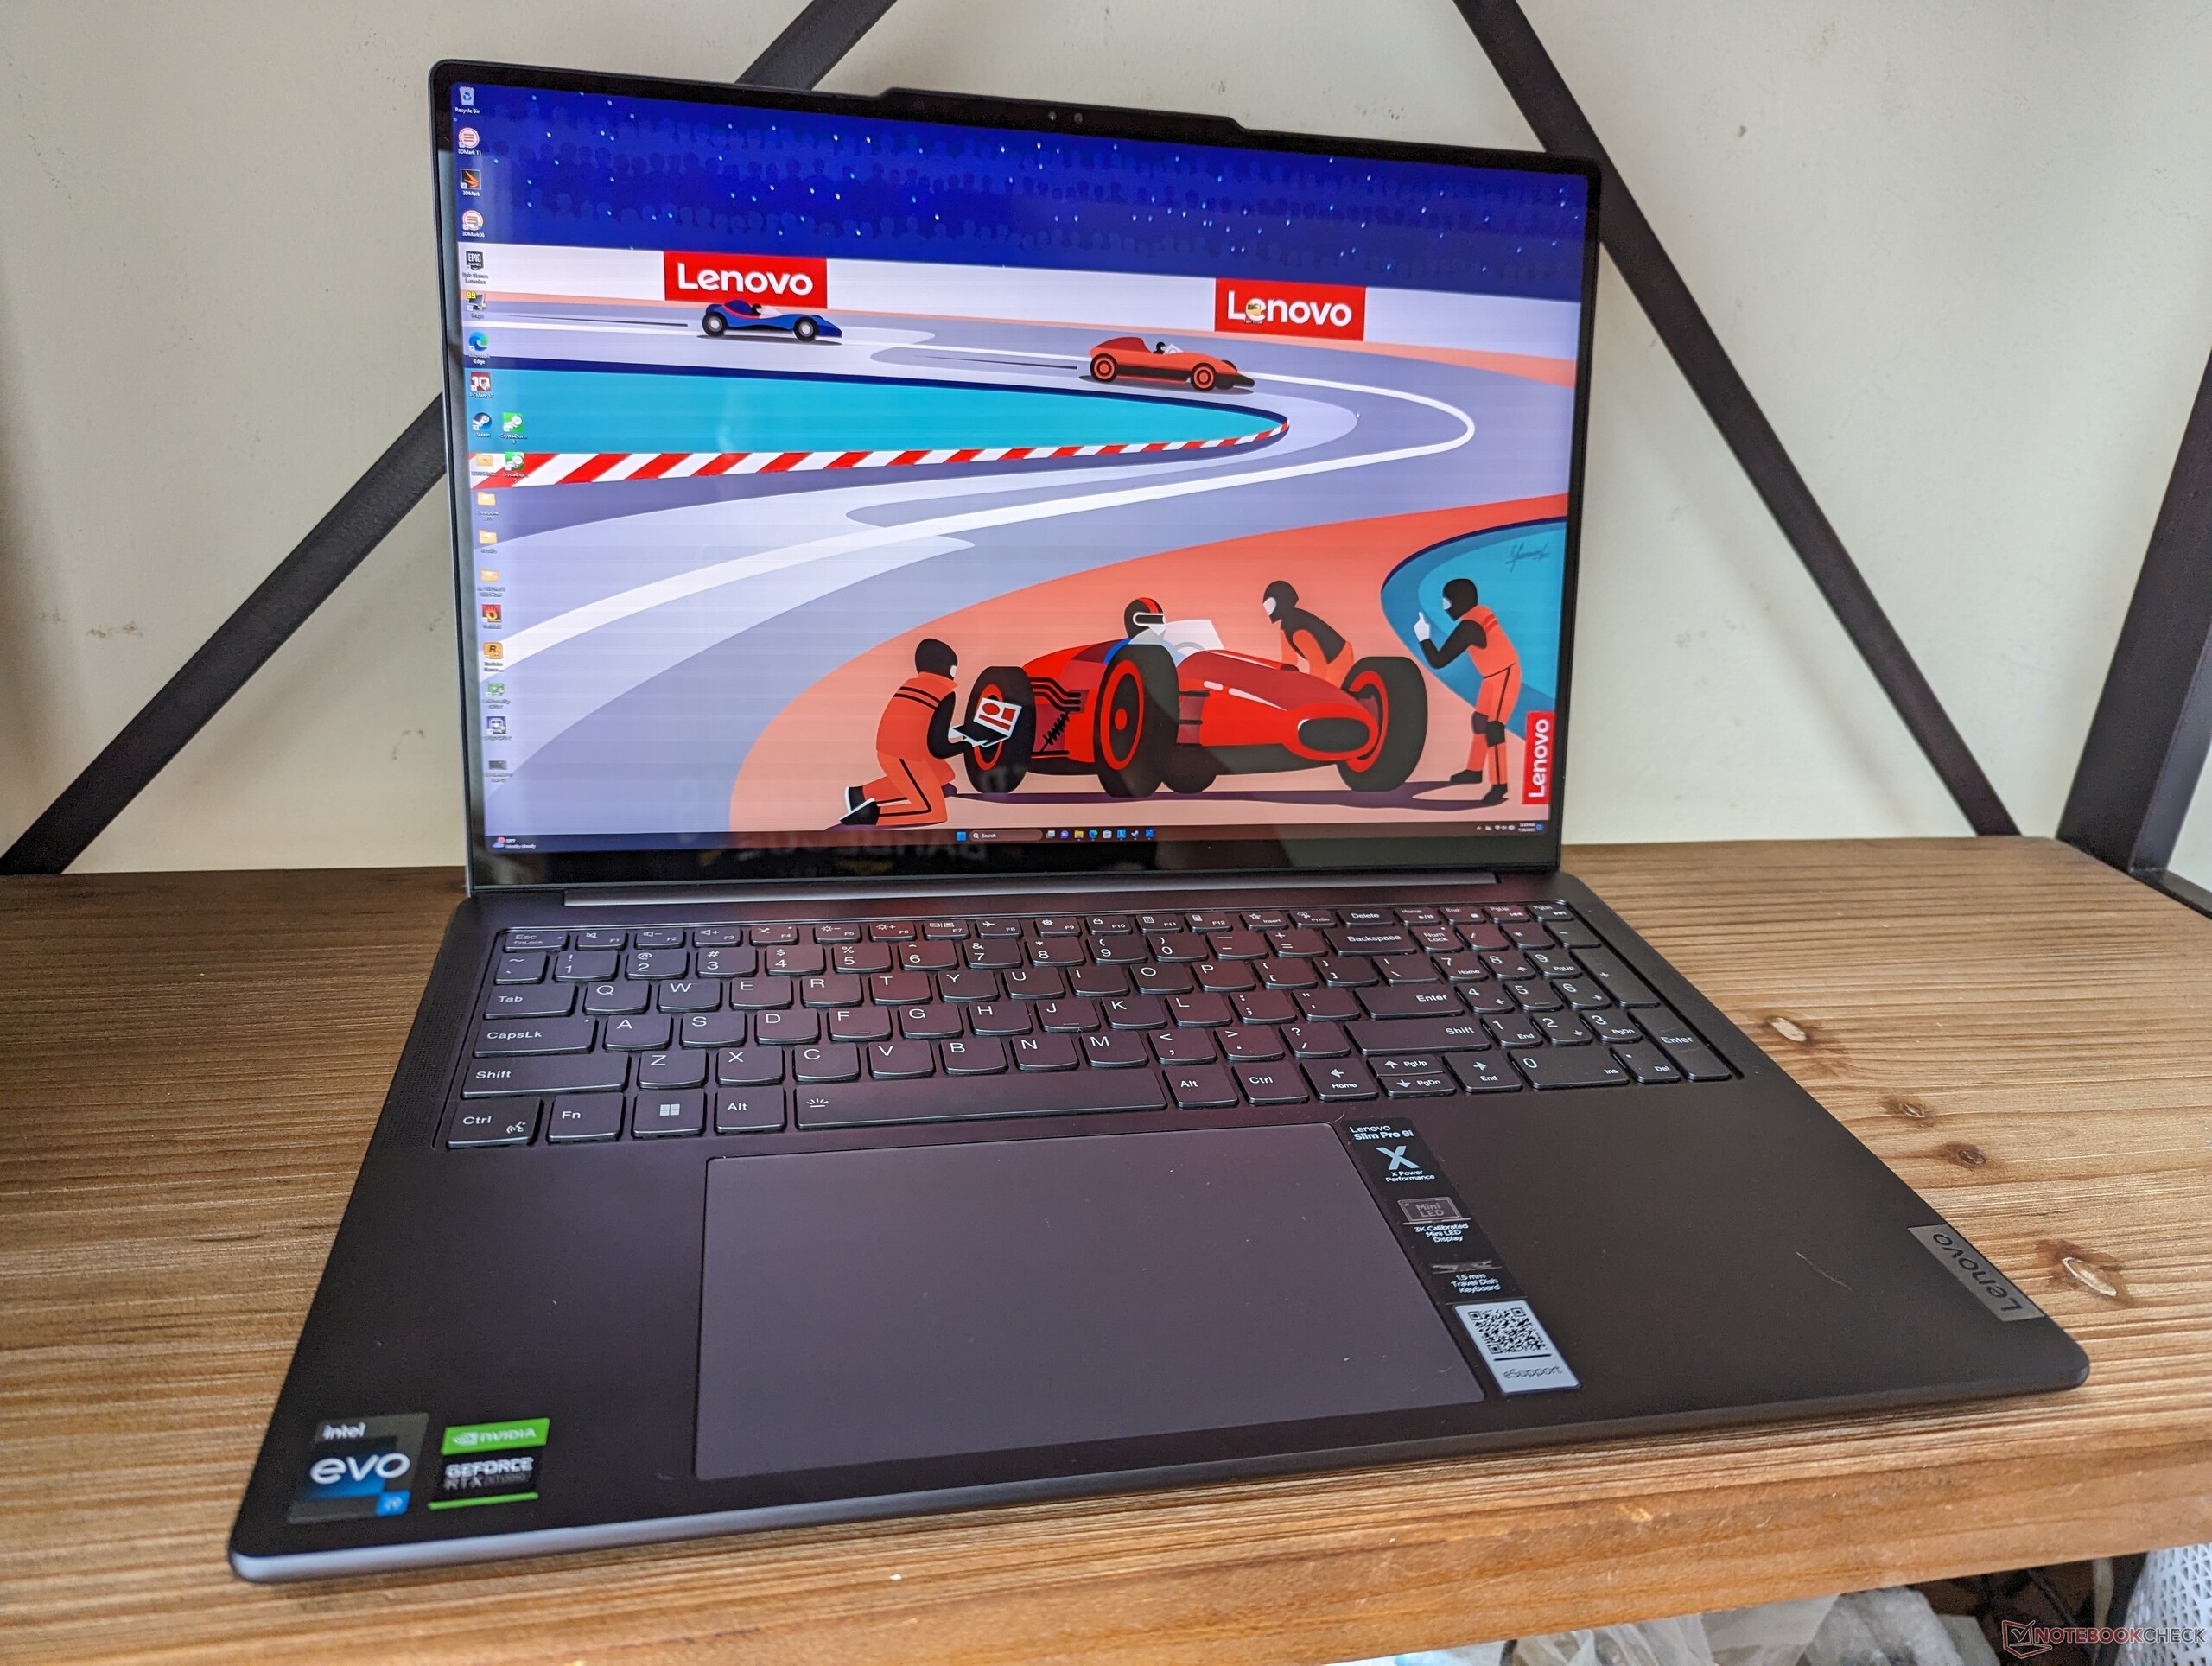
Lenovo Slim Pro 9i 16IRP8 recension av bärbar dator: Alternativet till Apple MacBook Pro 16

Lenovo Slim Pro 9i 16 G8 är en avancerad bärbar dator avsedd för innehållsskapande och multimediaändamål. Den konkurrerar med 16-tums kreatörscentrerade modeller som MSI CreatorPro Z16P, Apple MacBook Pro 16, HP Envy 16eller Asus ProArt StudioBook 16.
Förvirrande nog är namnet på denna modell olika beroende på region. I Europa, till exempel, är denna modell känd som Yoga Pro 9i 16 medan den är Slim Pro 9i 16 i Nordamerika. Vi rekommenderar att du kollar in vår recension av Yoga Pro 9i 16 för att lära dig mer om de fysiska egenskaperna hos denna bärbara dator.
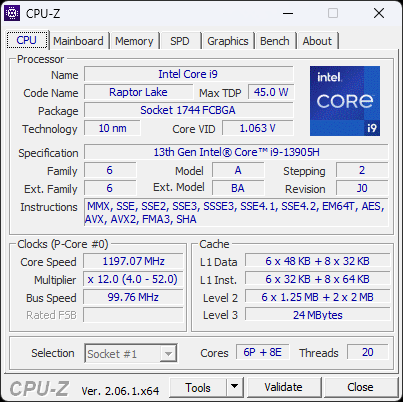
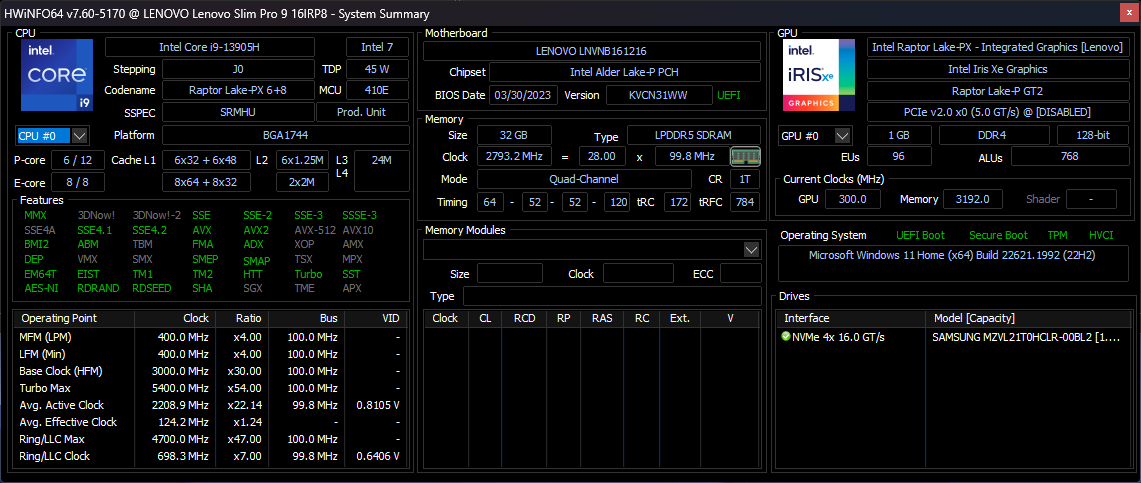
Vår recensionskonfiguration levereras med den ovanliga 13:e generationens Raptor Lake Core i9-13905H CPU och 100 W GeForce RTX 4050 i motsats till Core i7-13705H och RTX 4060 på vår Yoga Pro 9i 16. Båda konfigurationerna levereras i övrigt med samma 3,2K (3200 x 2000) mini-LED-pekskärm med fullständiga DCI-P3-färger.
En 14-tumsversion av denna modell är också tillgänglig och kallas Slim Pro 9i 14 eller Yoga Pro 9i 14.
Fler Lenovo recensioner:
Potentiella konkurrenter i jämförelse
Gradering | Datum | Modell | Vikt | Höjd | Storlek | Upplösning | Pris |
|---|---|---|---|---|---|---|---|
| 88 % v7 (old) | 08/2023 | Lenovo Slim Pro 9i 16IRP8 i9-13905H, GeForce RTX 4050 Laptop GPU | 2.2 kg | 18.2 mm | 16.00" | 3200x2000 | |
| 88.4 % v7 (old) | 08/2023 | Lenovo Yoga Pro 9 16-IRP G8 i7-13705H, GeForce RTX 4060 Laptop GPU | 2.2 kg | 18.2 mm | 16.00" | 3200x2000 | |
| 86.3 % v7 (old) | 05/2023 | Asus VivoBook Pro 16 i7-12700H, GeForce RTX 3050 Ti Laptop GPU | 1.9 kg | 20 mm | 16.00" | 2560x1600 | |
| 87.5 % v7 (old) | 06/2023 | Acer Swift Edge SFE16-42-R1GM R7 7735U, Radeon 680M | 1.2 kg | 13.95 mm | 16.00" | 3840x2400 | |
| 87.4 % v7 (old) | 08/2022 | Dell Inspiron 16 Plus 7620 i7-12700H, GeForce RTX 3050 Ti Laptop GPU | 2.1 kg | 18.99 mm | 16.00" | 3072x1920 | |
| 86.9 % v7 (old) | 09/2022 | HP Envy 16 h0112nr i7-12700H, GeForce RTX 3060 Laptop GPU | 2.3 kg | 19.8 mm | 16.00" | 3840x2400 |
Fall
SD-kortläsare
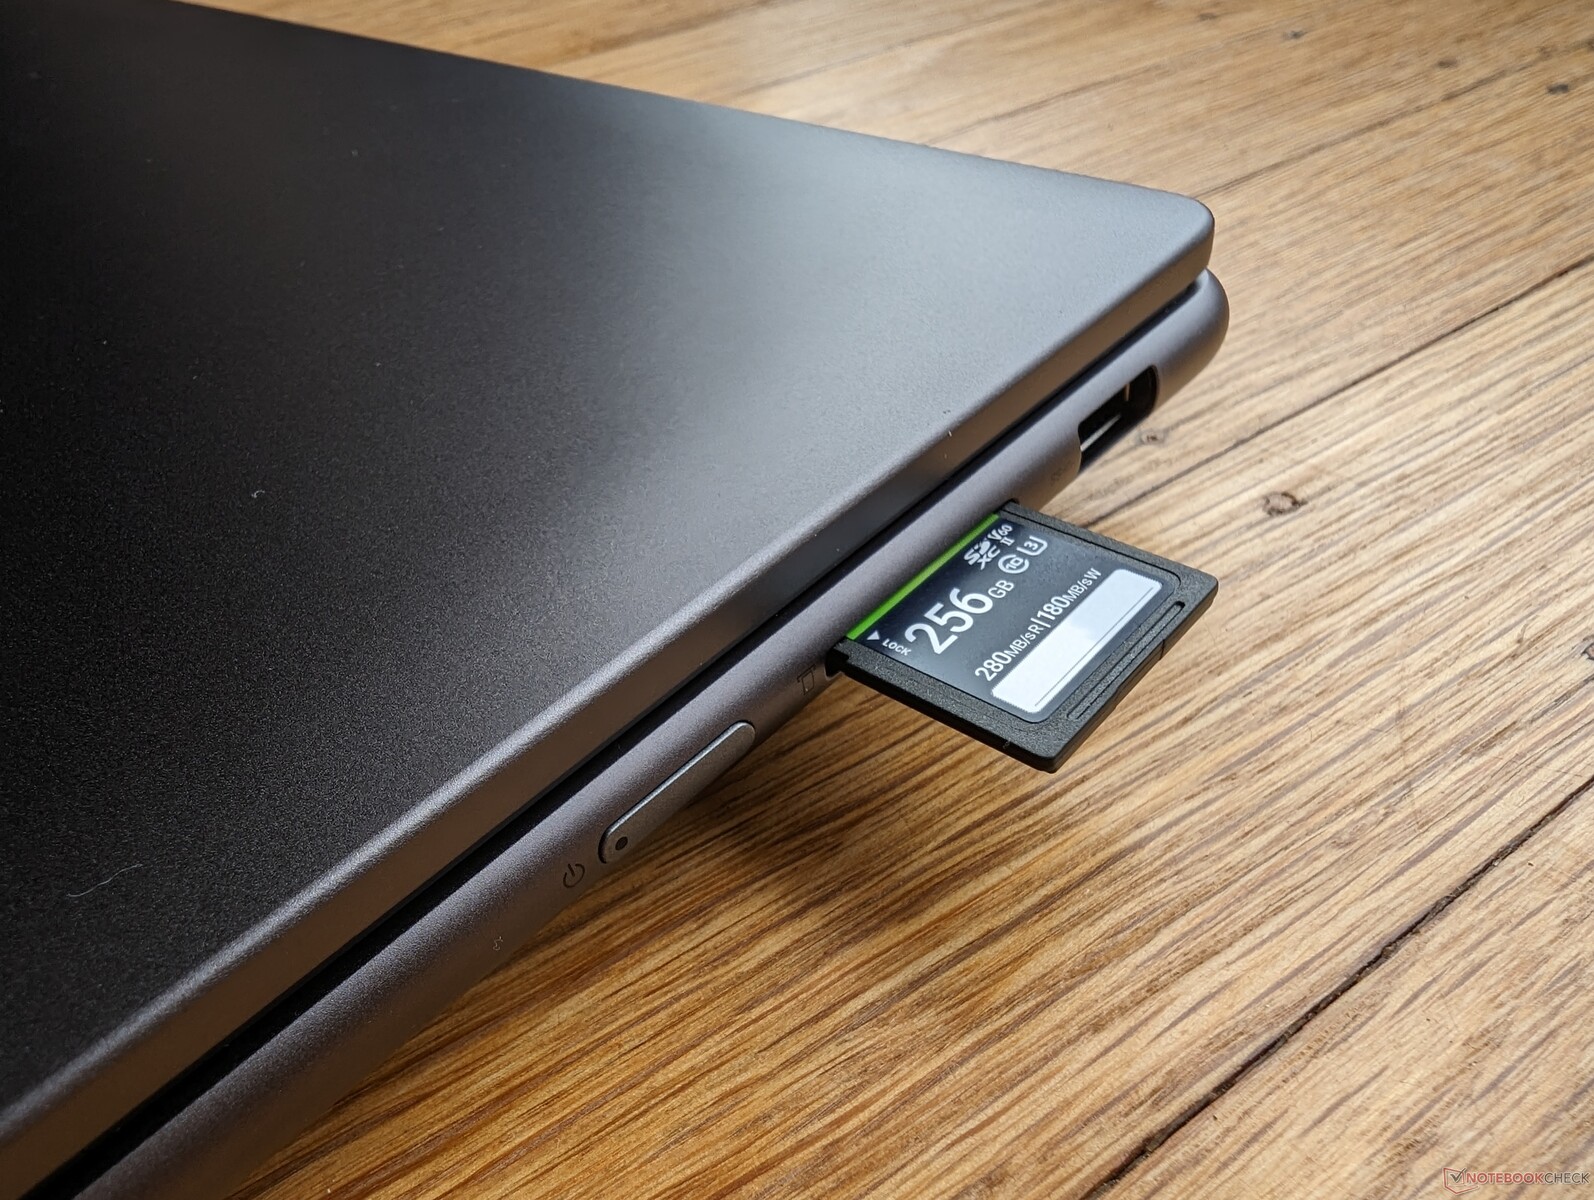
Överföringshastigheterna är genomsnittliga för kategorin med vårt PNY EliteX-Pro60 V60 UHS-II testkort. Tyvärr är kortläsaren på Lenovo grund och SD-kortet skulle därför sticka ut med över halva sin längd för osäker transport.
| SD Card Reader | |
| average JPG Copy Test (av. of 3 runs) | |
| Lenovo Slim Pro 9i 16IRP8 (PNY EliteX-Pro60 V60 256 GB) | |
| Lenovo Yoga Pro 9 16-IRP G8 (Angelibird AV Pro V60) | |
| Asus VivoBook Pro 16 (AV Pro SD microSD 128 GB V60) | |
| HP Envy 16 h0112nr (AV Pro SD microSD 128 GB V60) | |
| Dell Inspiron 16 Plus 7620 (Toshiba Exceria Pro SDXC 64 GB UHS-II) | |
| maximum AS SSD Seq Read Test (1GB) | |
| Lenovo Slim Pro 9i 16IRP8 (PNY EliteX-Pro60 V60 256 GB) | |
| HP Envy 16 h0112nr (AV Pro SD microSD 128 GB V60) | |
| Lenovo Yoga Pro 9 16-IRP G8 (Angelibird AV Pro V60) | |
| Asus VivoBook Pro 16 (AV Pro SD microSD 128 GB V60) | |
| Dell Inspiron 16 Plus 7620 (Toshiba Exceria Pro SDXC 64 GB UHS-II) | |
Kommunikation
| Networking | |
| iperf3 transmit AXE11000 | |
| Lenovo Yoga Pro 9 16-IRP G8 | |
| Asus VivoBook Pro 16 | |
| Lenovo Slim Pro 9i 16IRP8 | |
| Acer Swift Edge SFE16-42-R1GM | |
| iperf3 receive AXE11000 | |
| Lenovo Yoga Pro 9 16-IRP G8 | |
| Lenovo Slim Pro 9i 16IRP8 | |
| Acer Swift Edge SFE16-42-R1GM | |
| iperf3 transmit AXE11000 6GHz | |
| Lenovo Slim Pro 9i 16IRP8 | |
| Acer Swift Edge SFE16-42-R1GM | |
| HP Envy 16 h0112nr | |
| Dell Inspiron 16 Plus 7620 | |
| iperf3 receive AXE11000 6GHz | |
| Asus VivoBook Pro 16 | |
| Acer Swift Edge SFE16-42-R1GM | |
| Lenovo Slim Pro 9i 16IRP8 | |
| HP Envy 16 h0112nr | |
| Dell Inspiron 16 Plus 7620 | |
Webbkamera
5 MP-sensorn är av högre kvalitet än webbkamerorna på de flesta andra bärbara datorer där 2 MP eller 1 MP fortfarande är vanligt förekommande. Både IR och en kameraavstängare ingår.


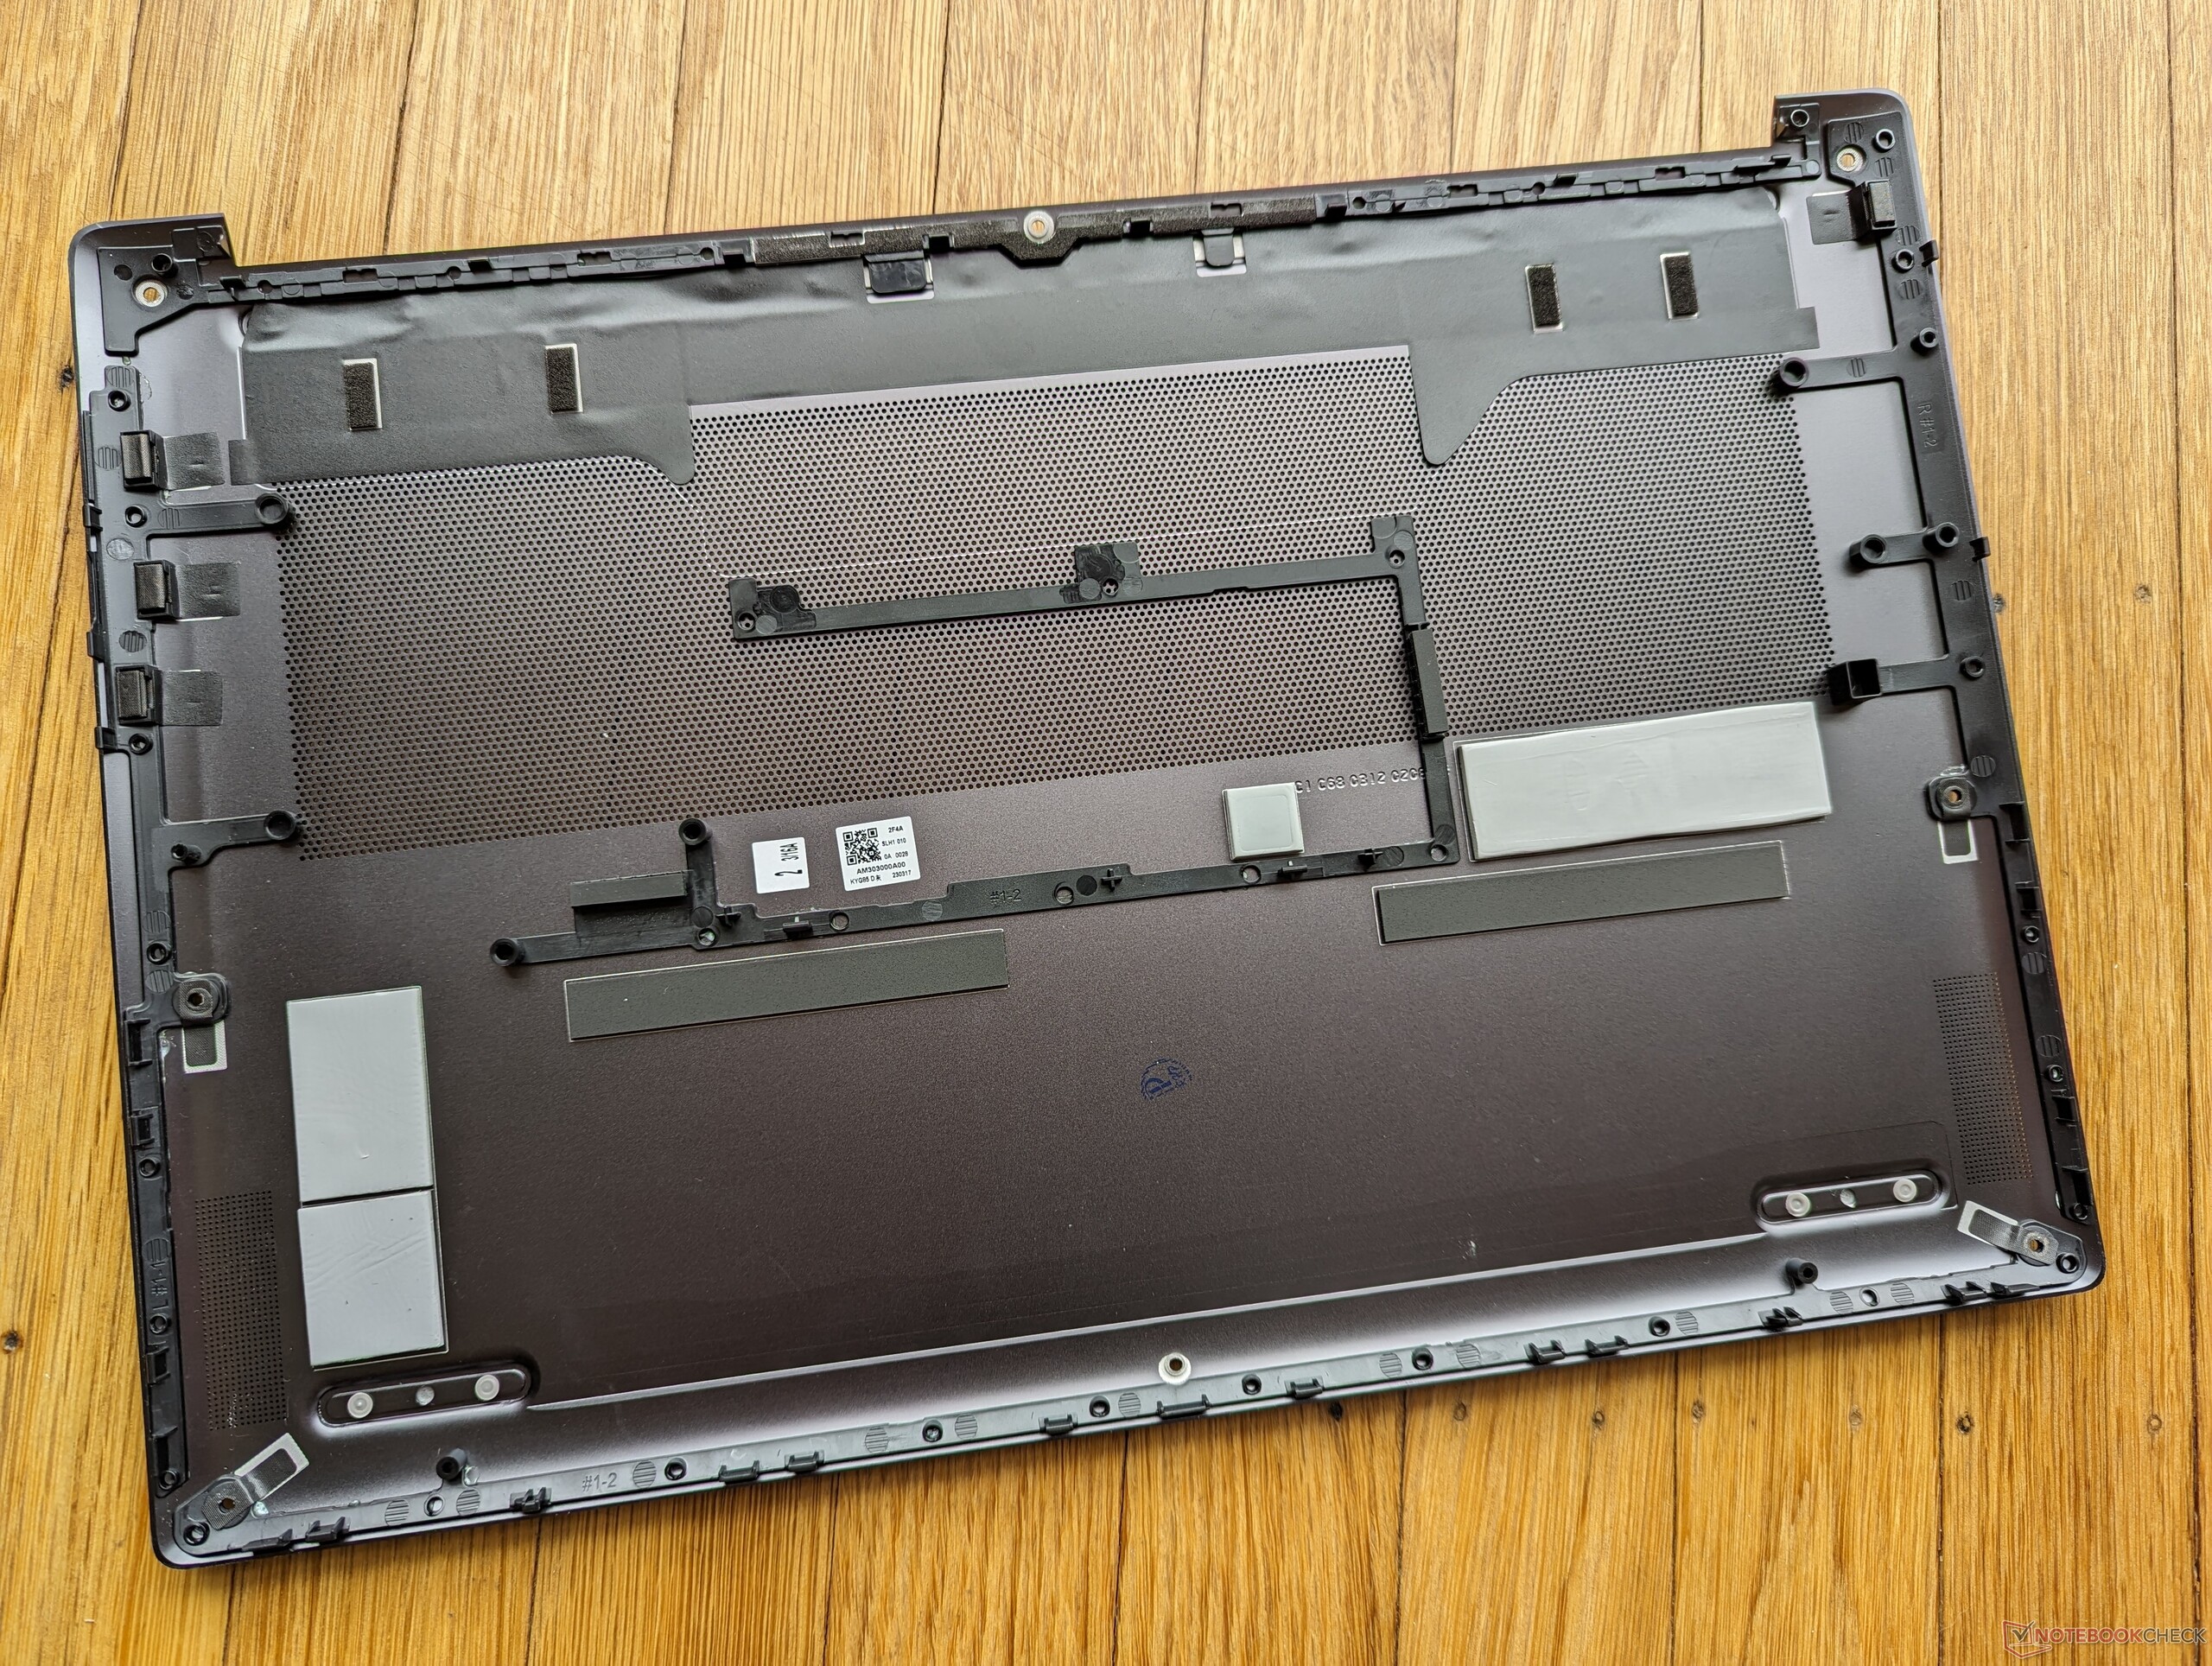
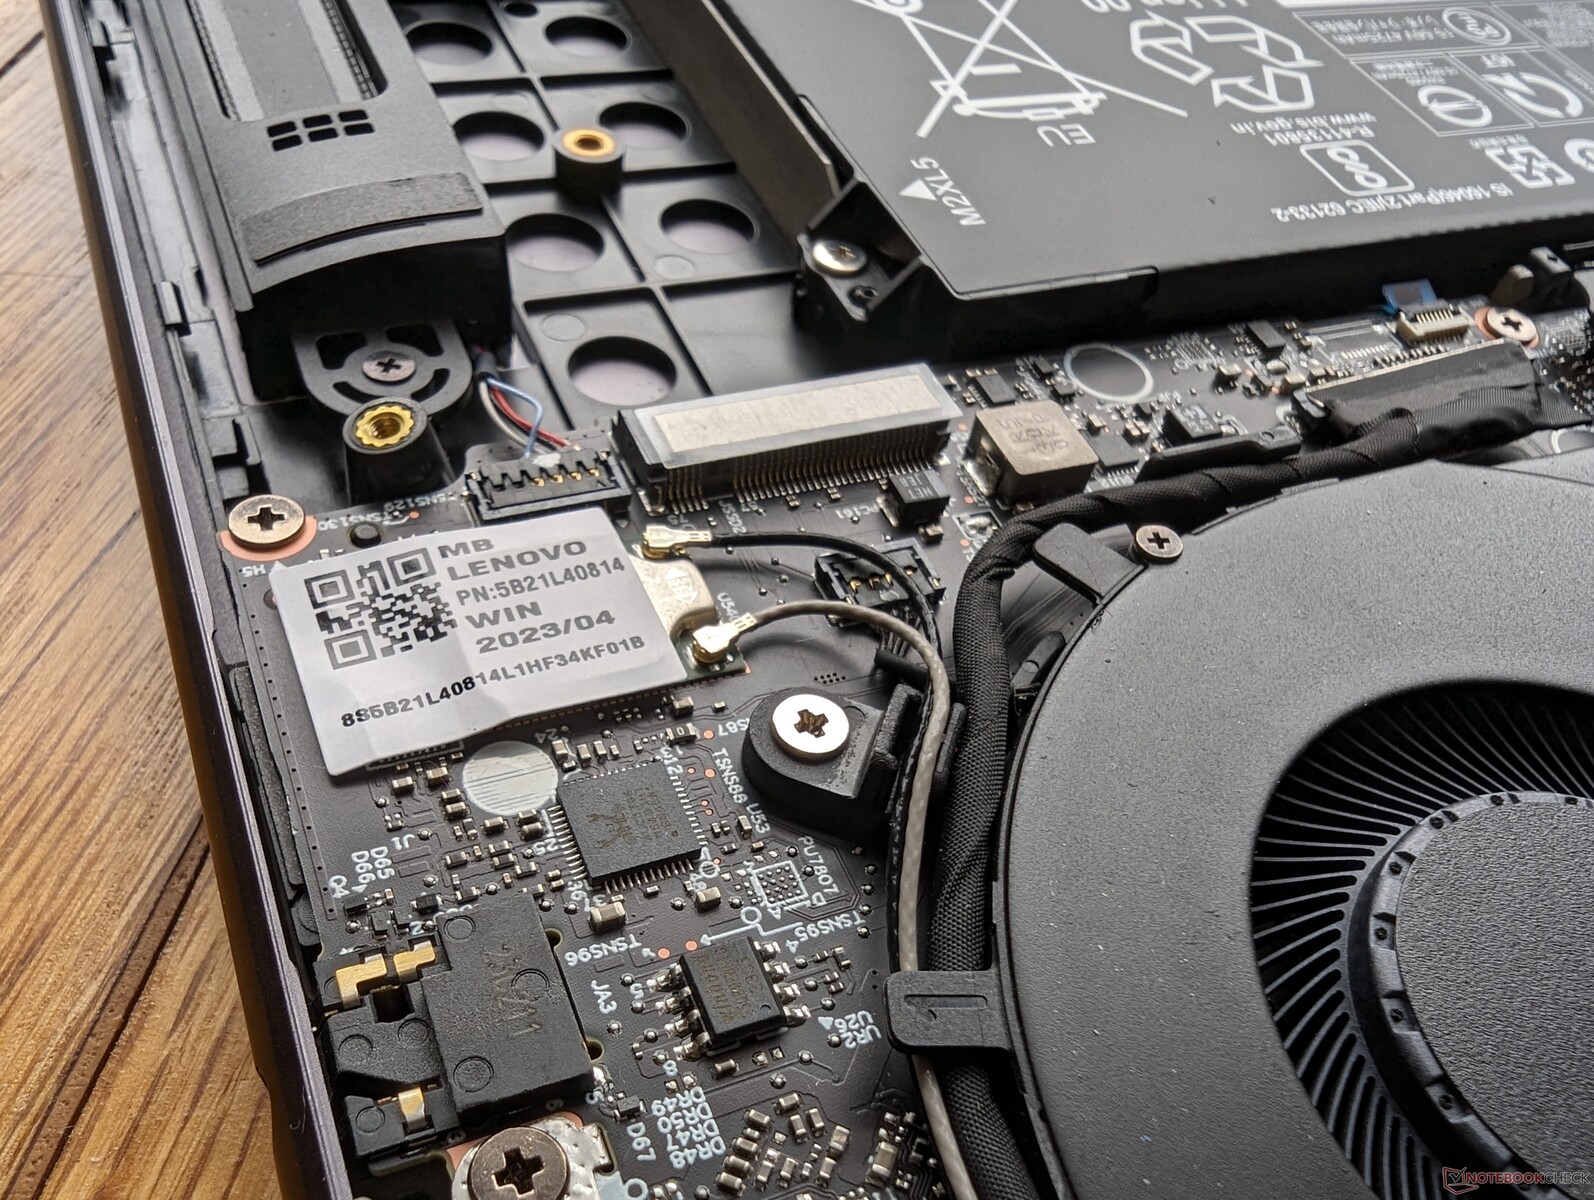
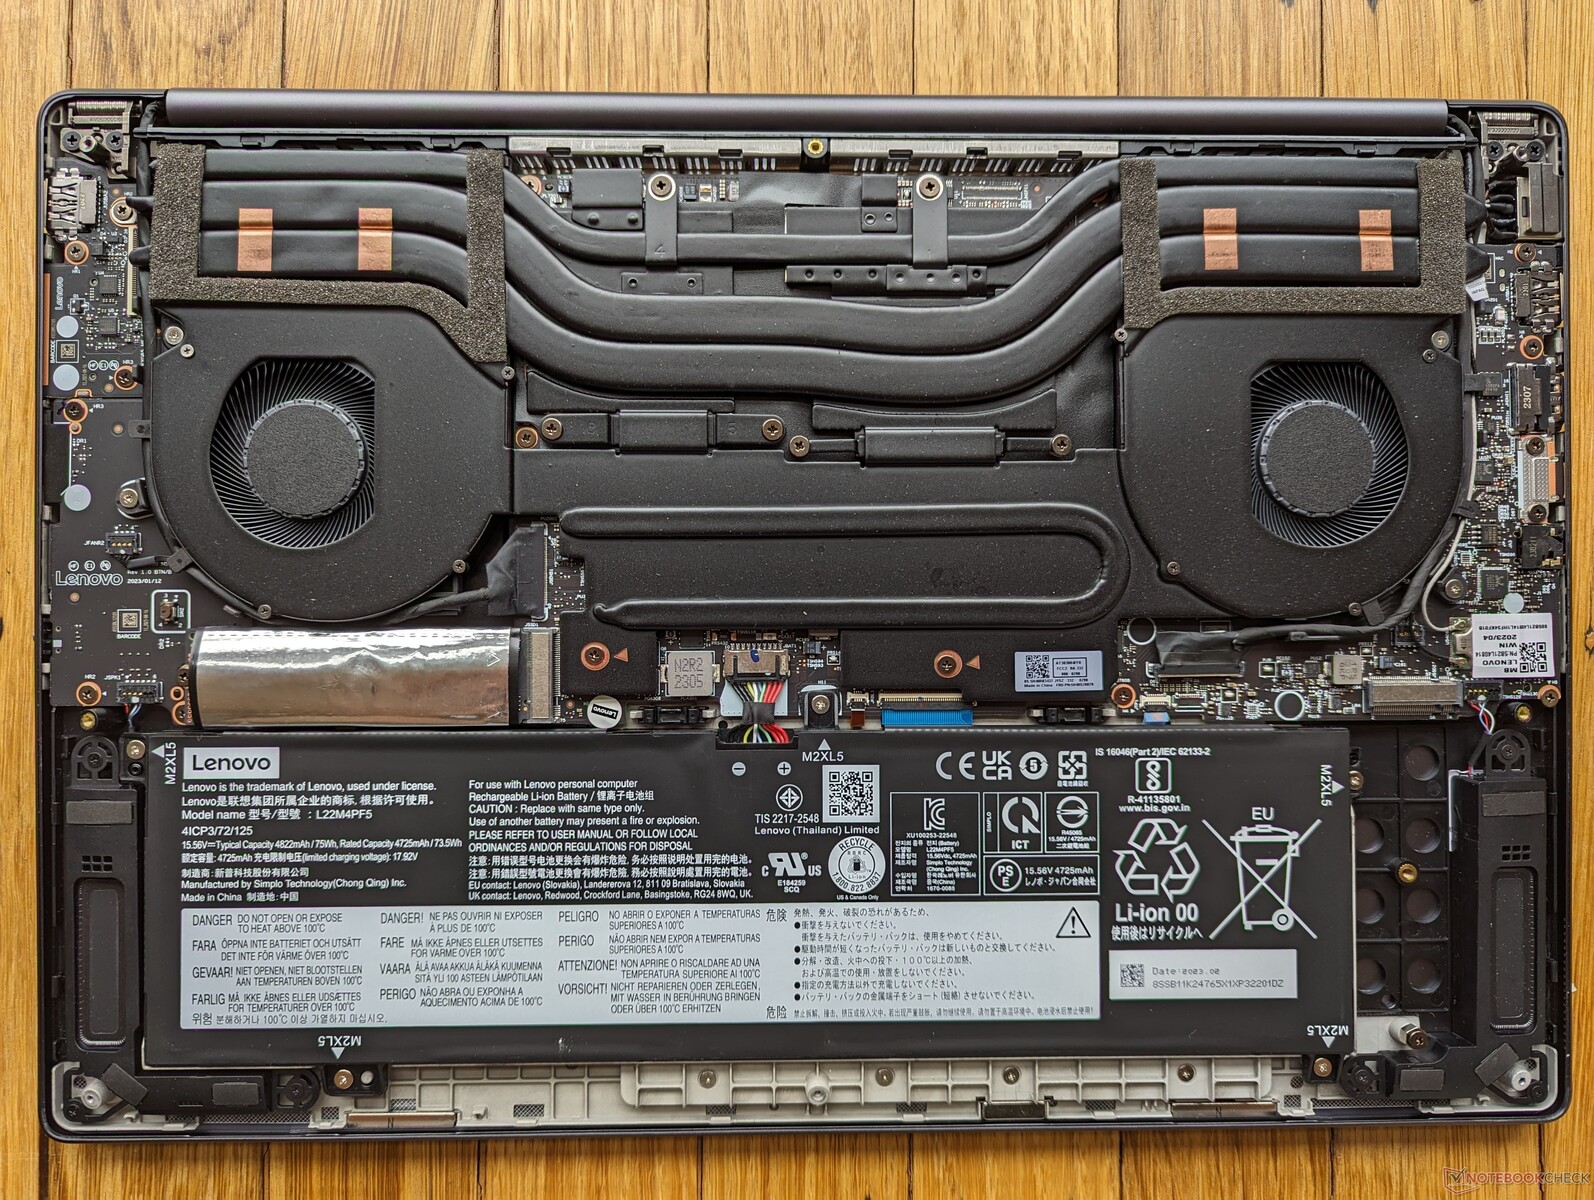
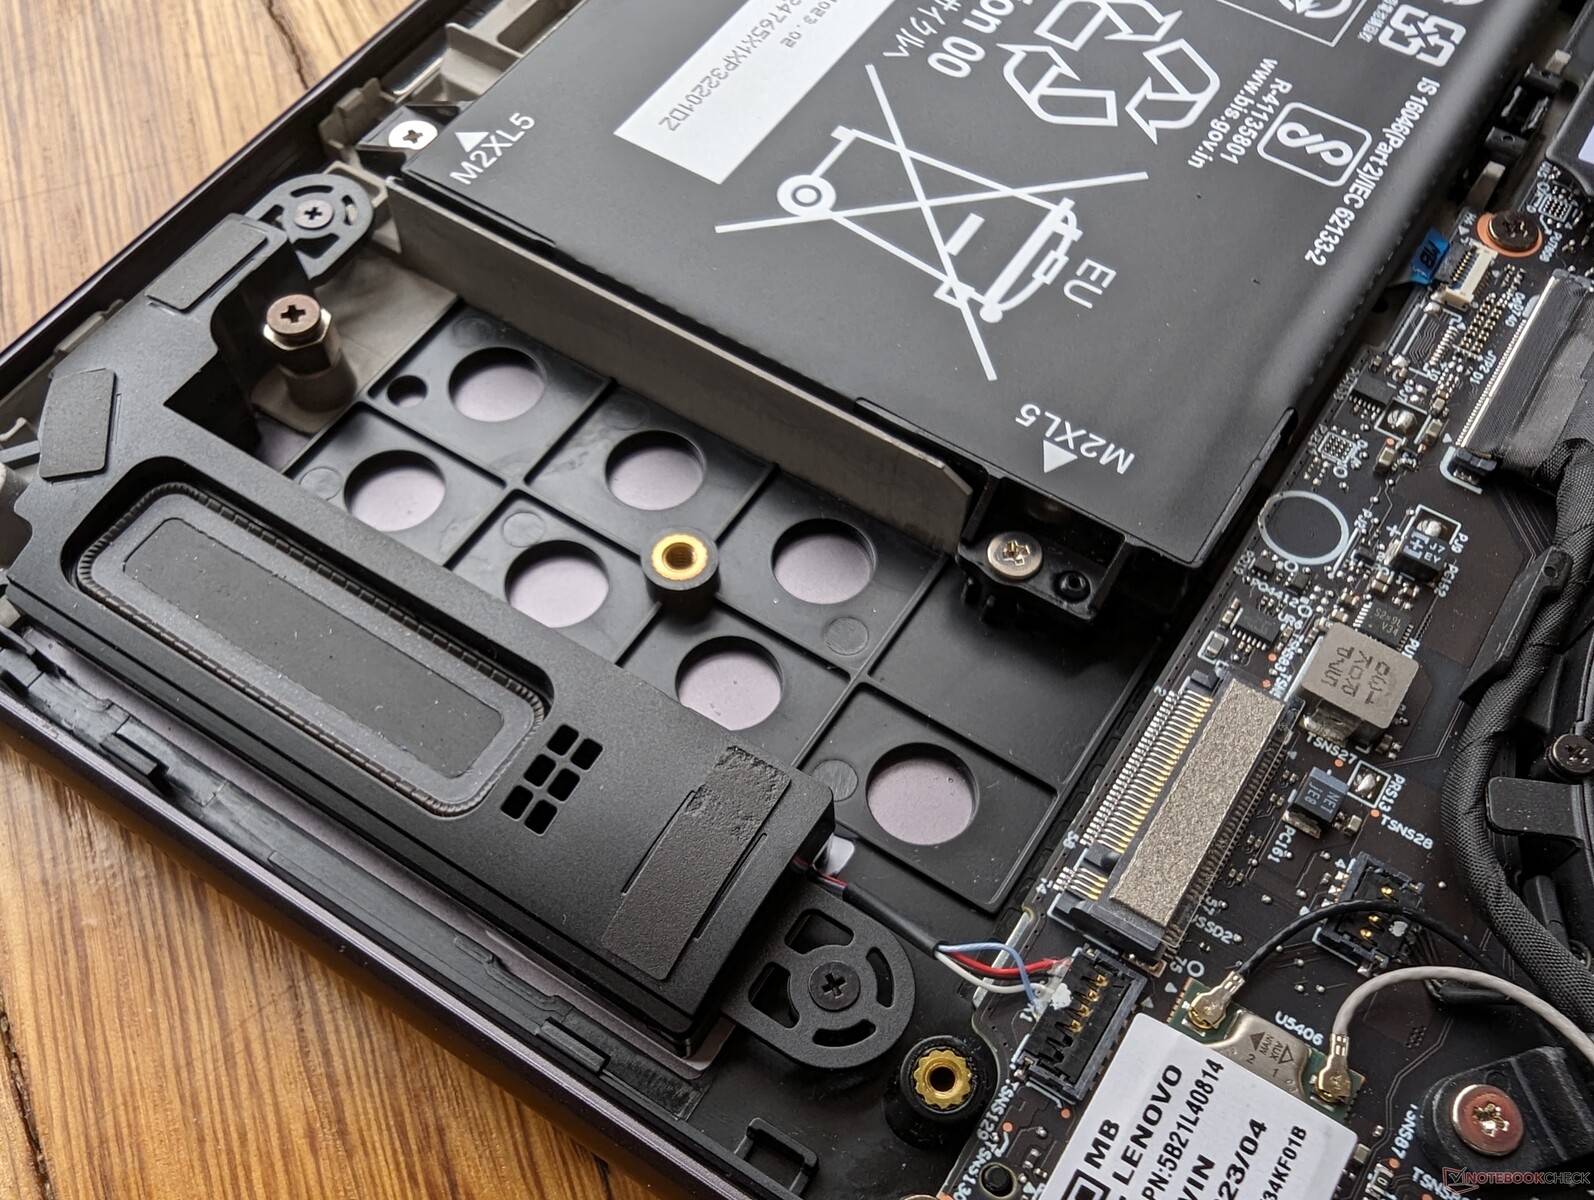
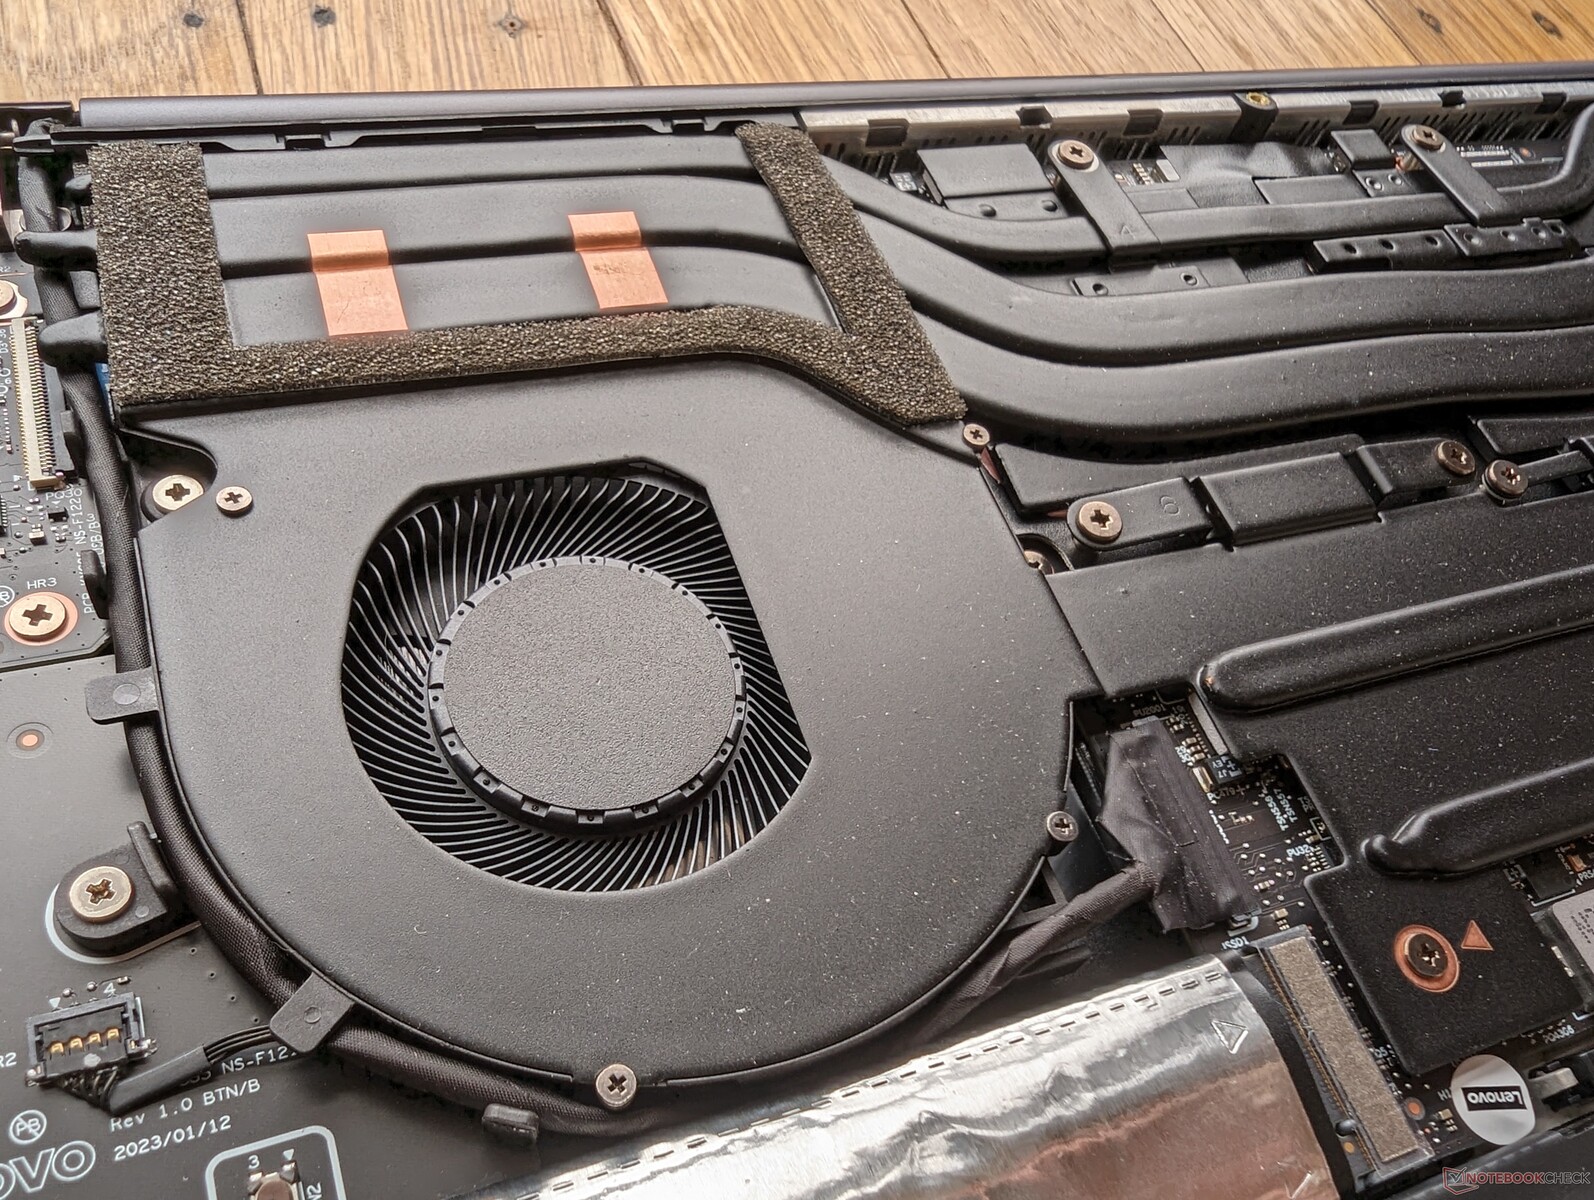
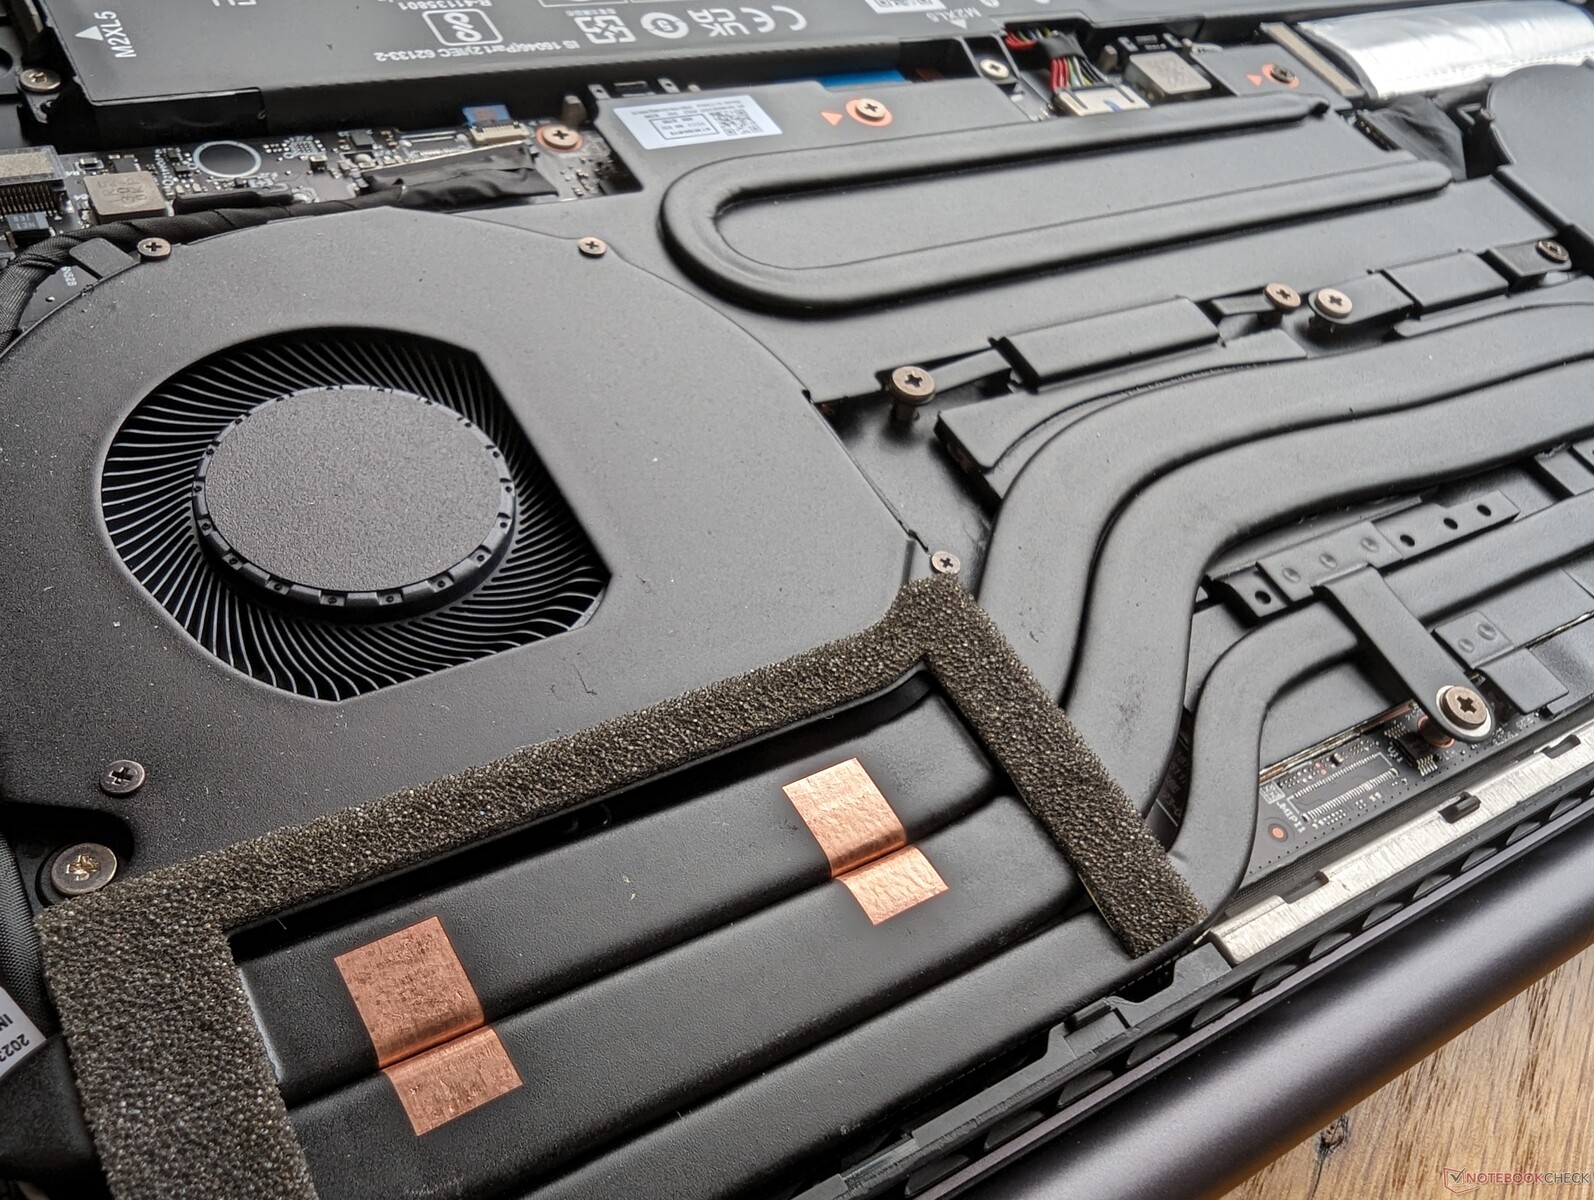
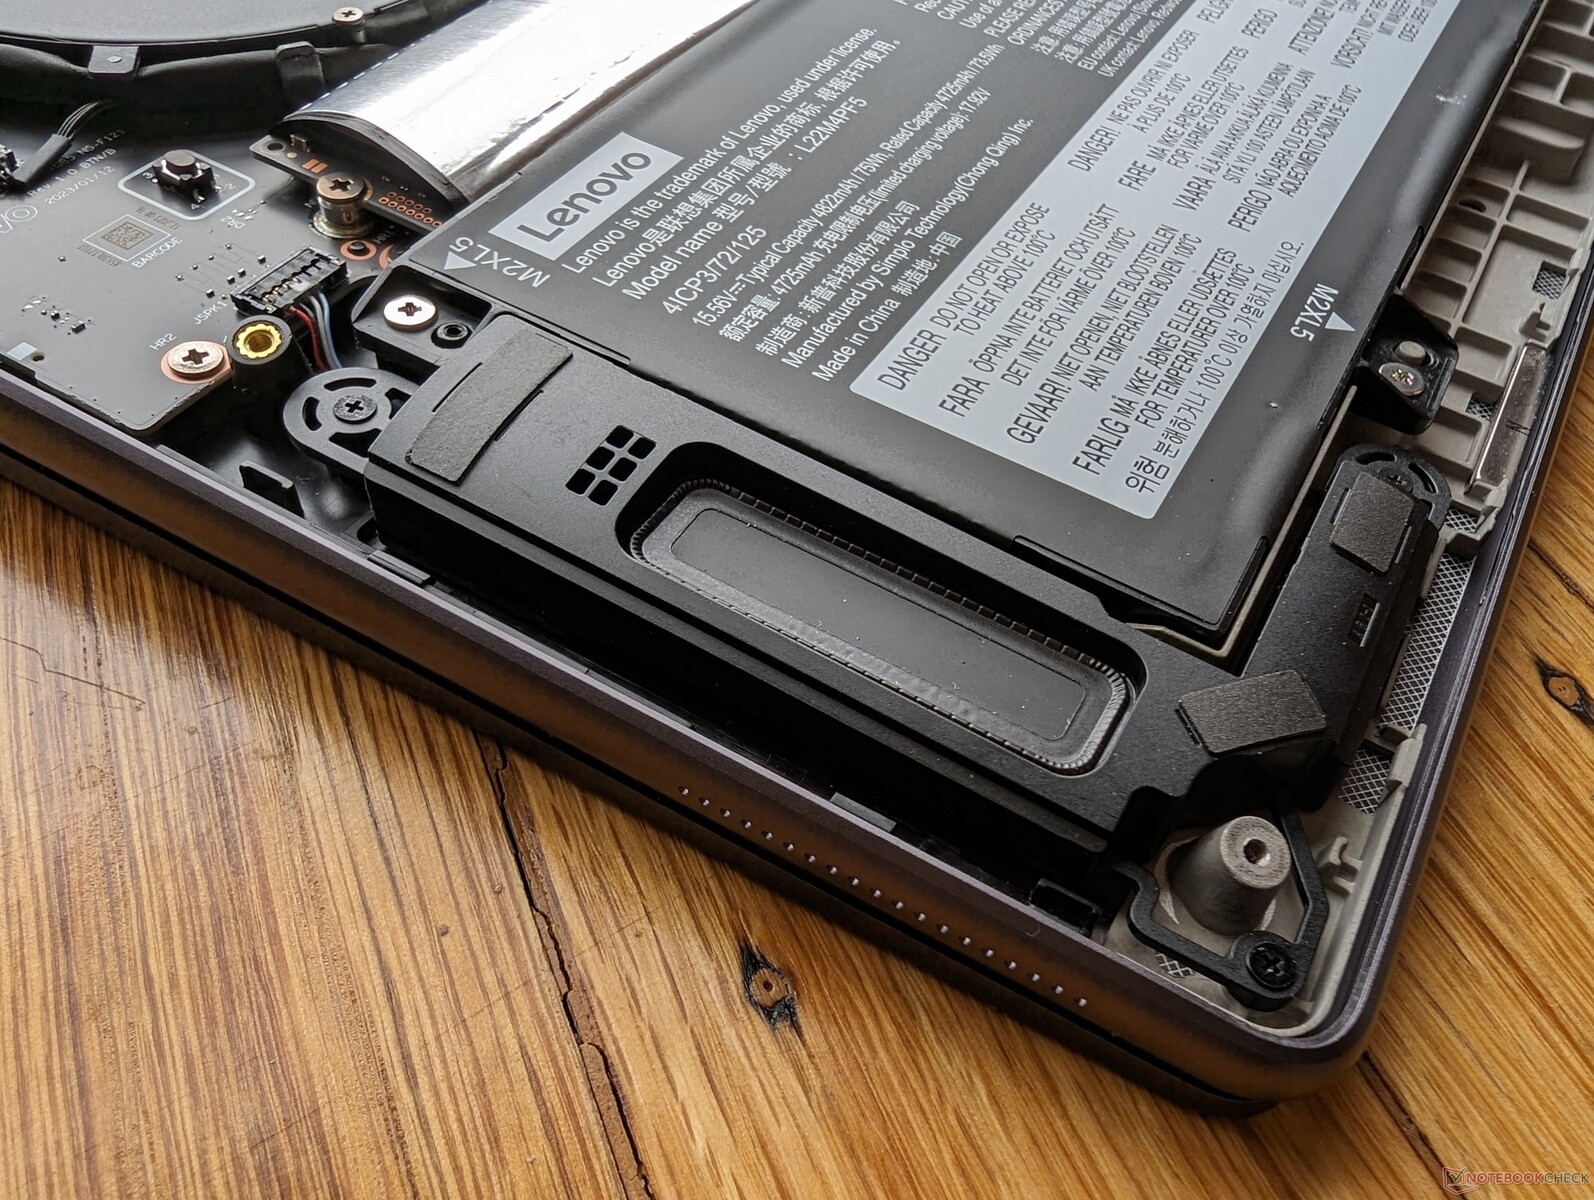
Underhåll
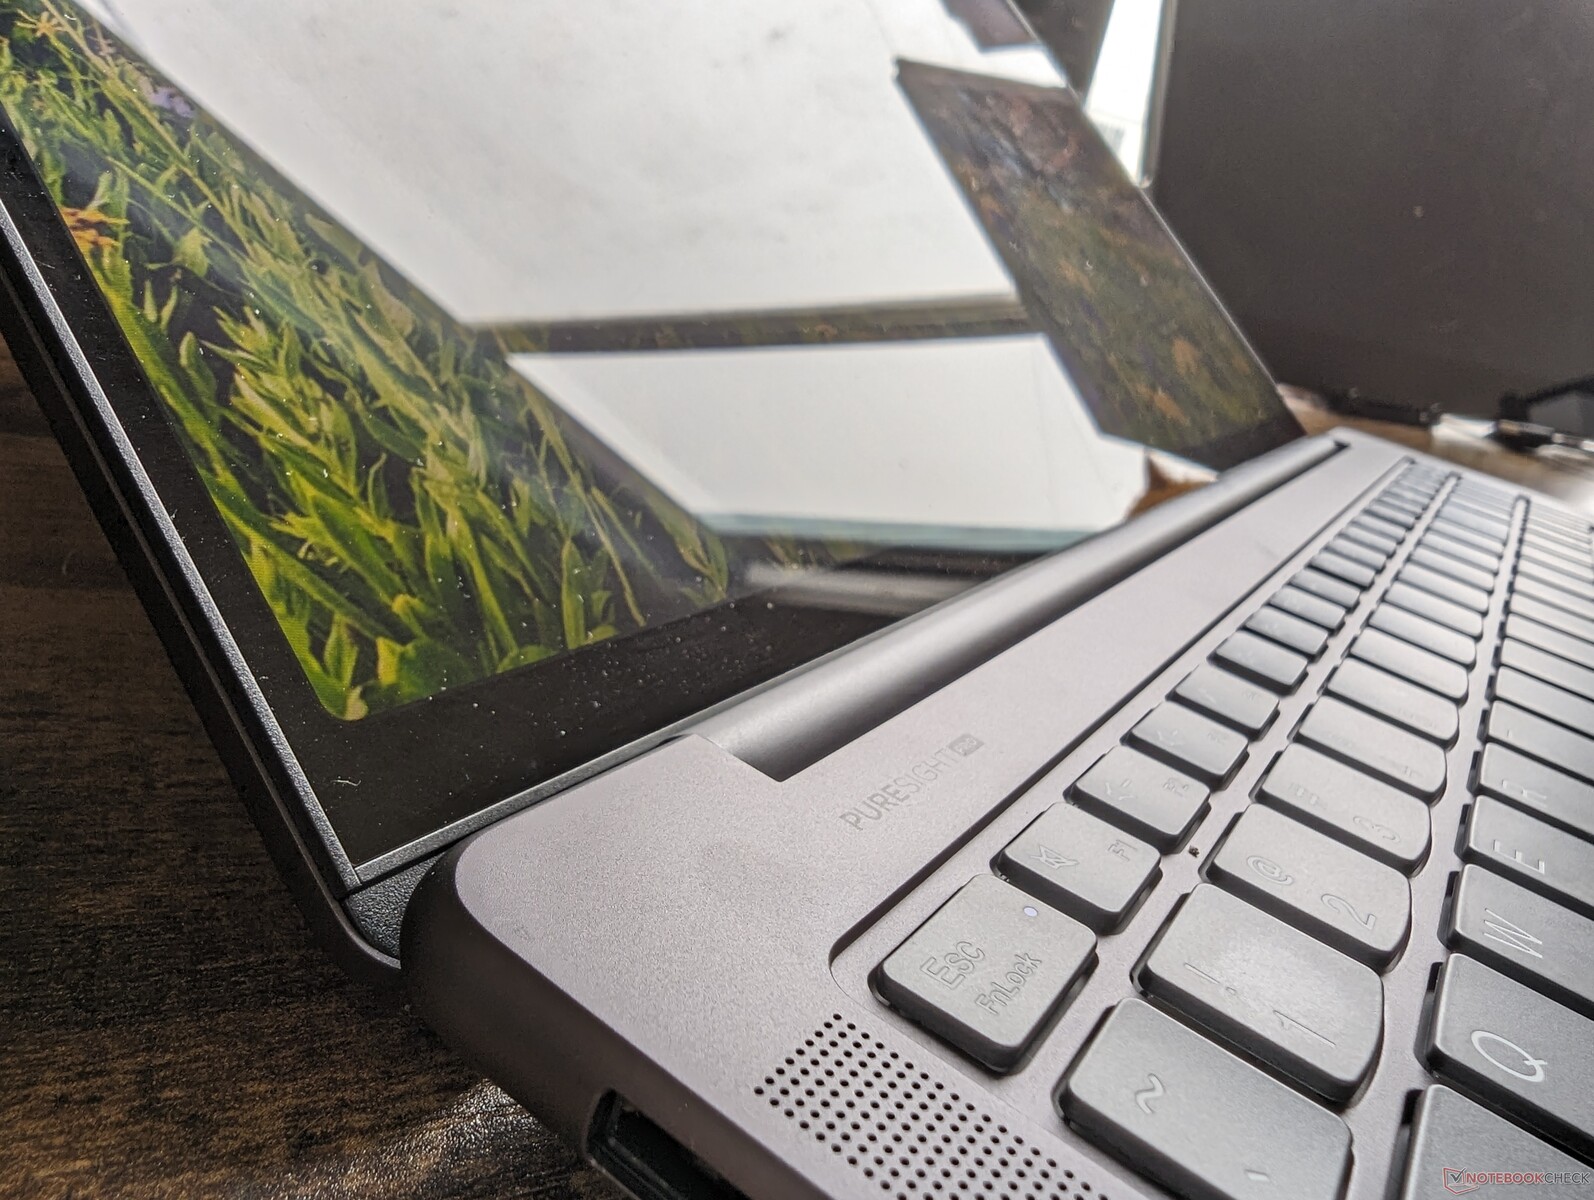
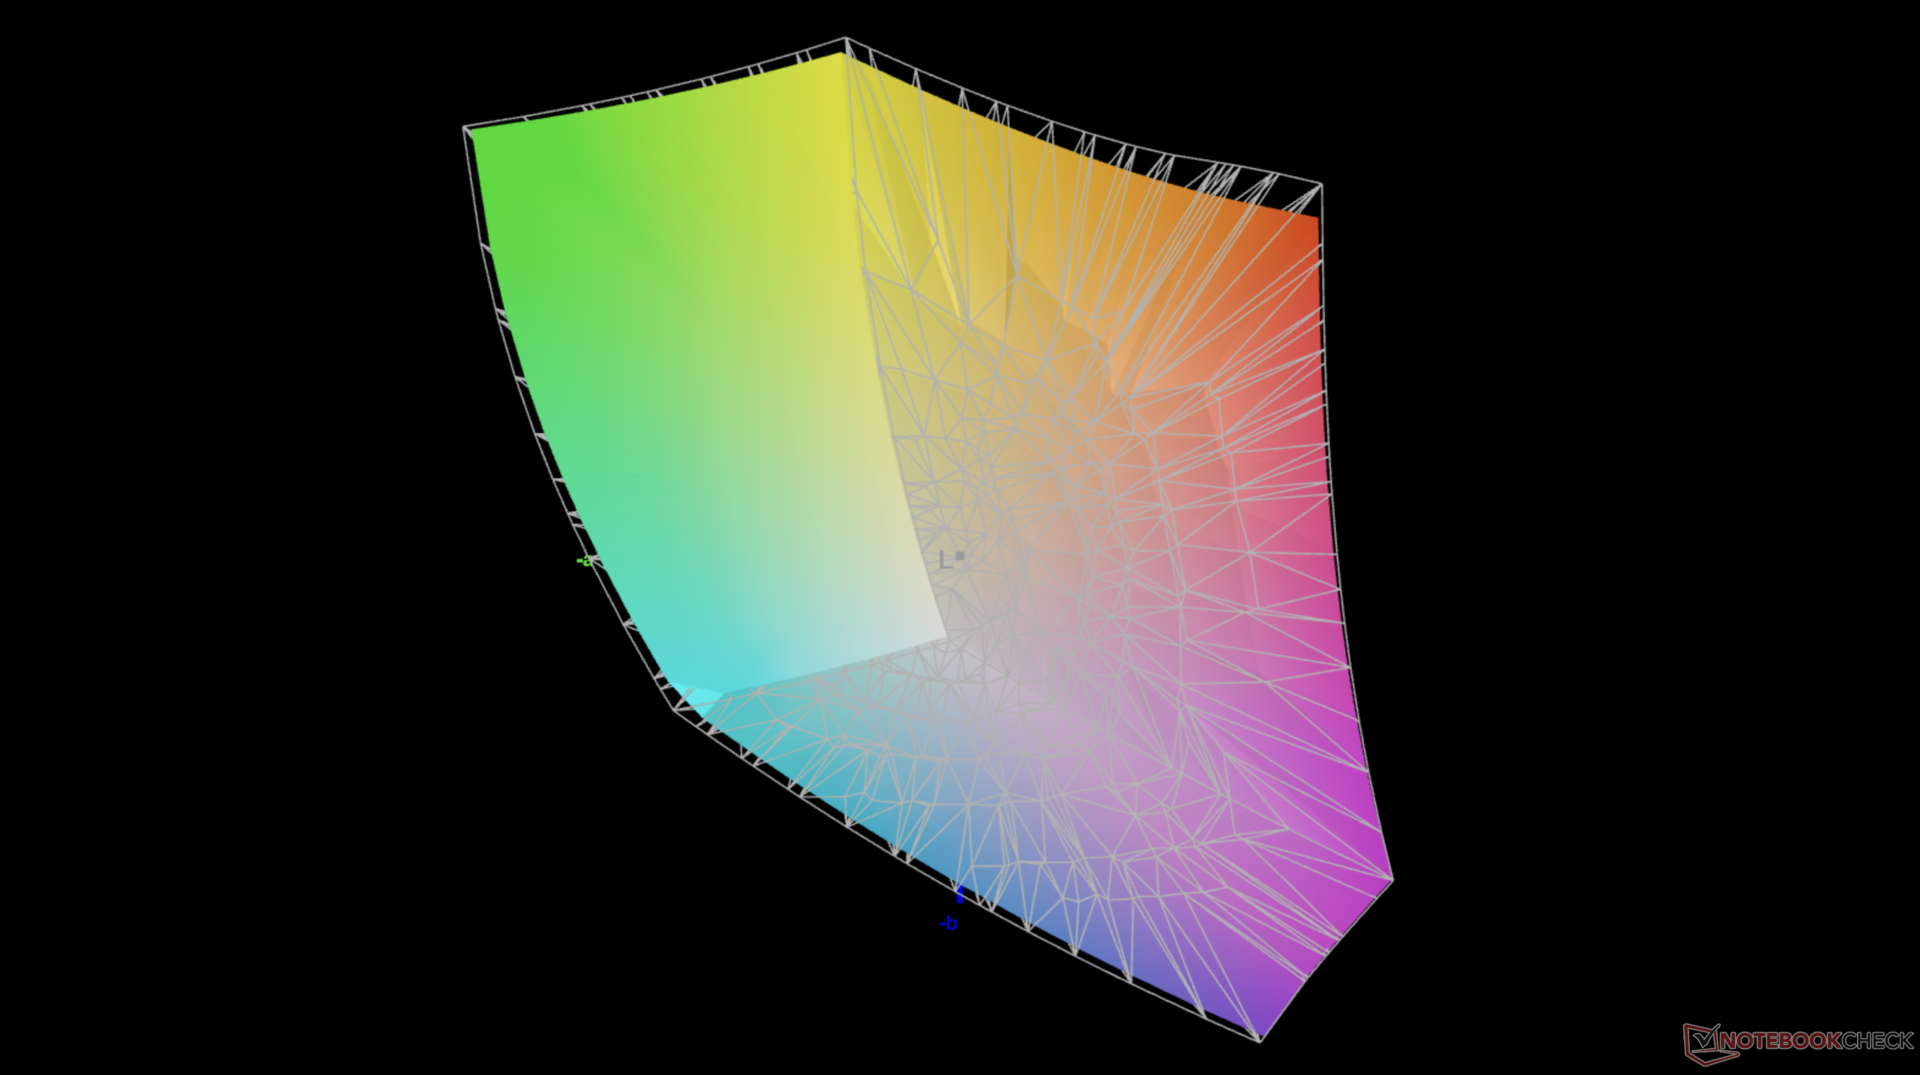
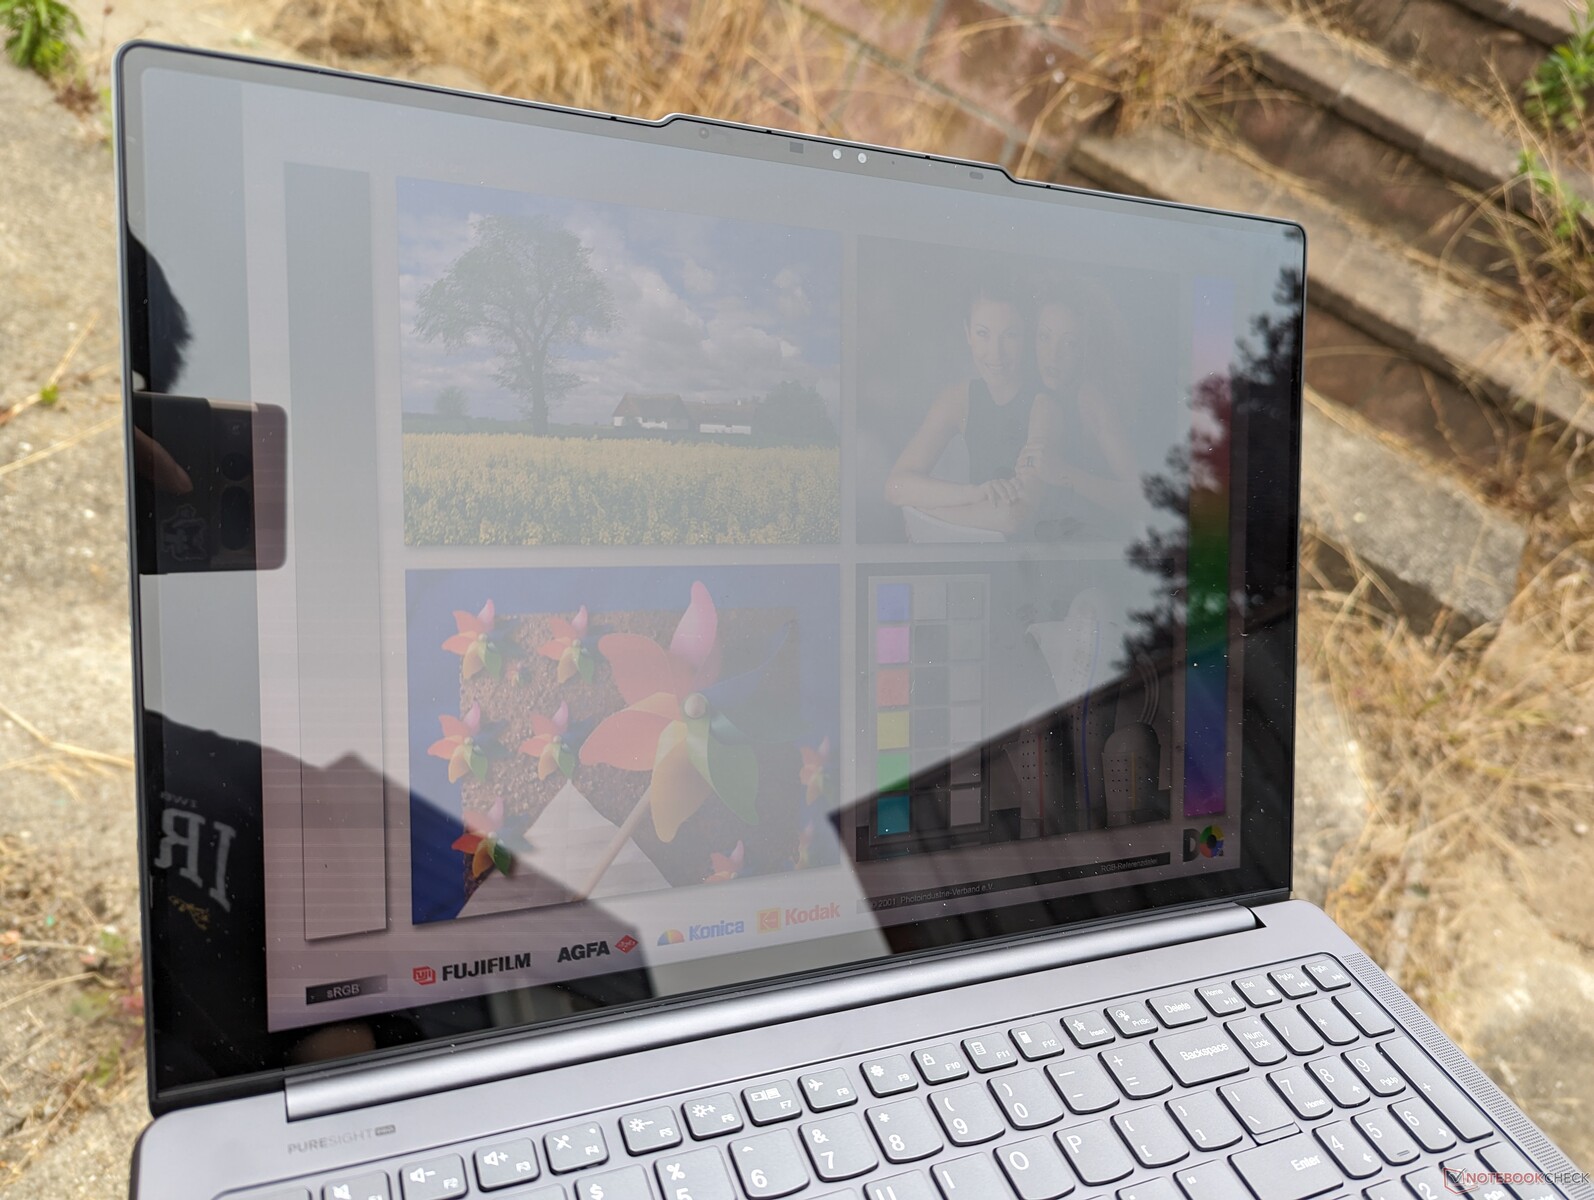
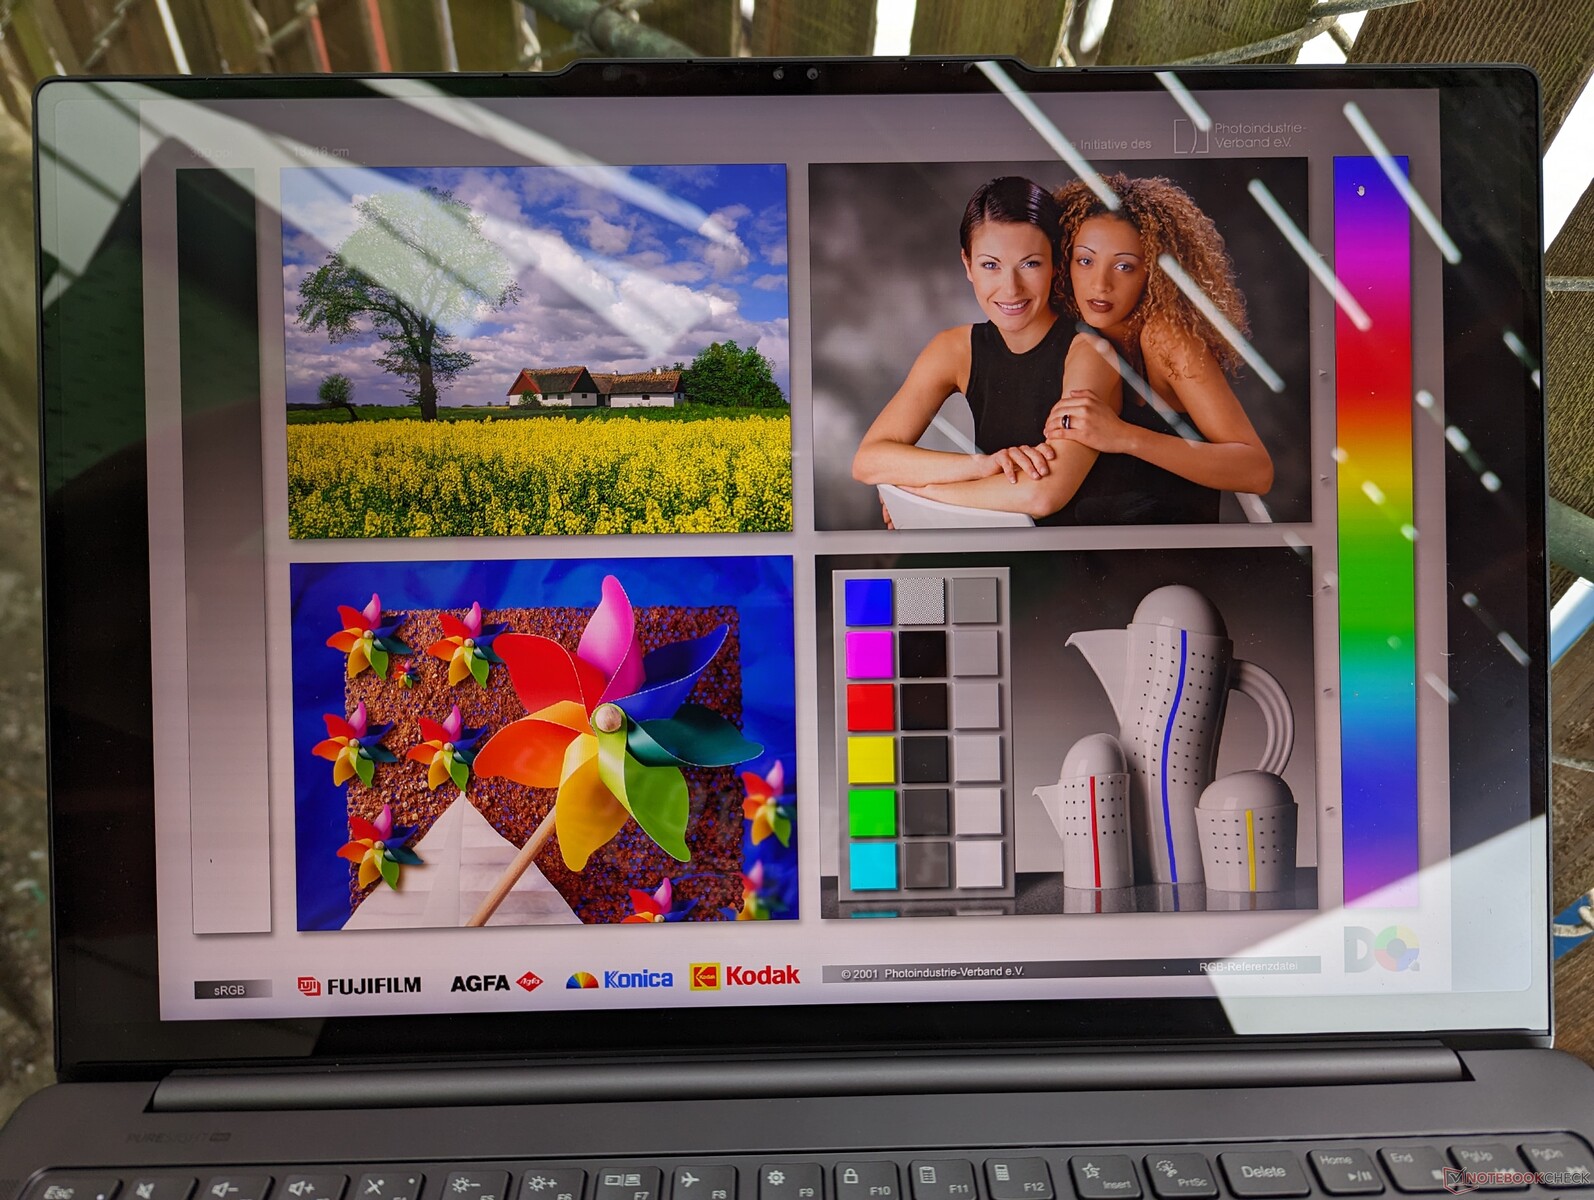
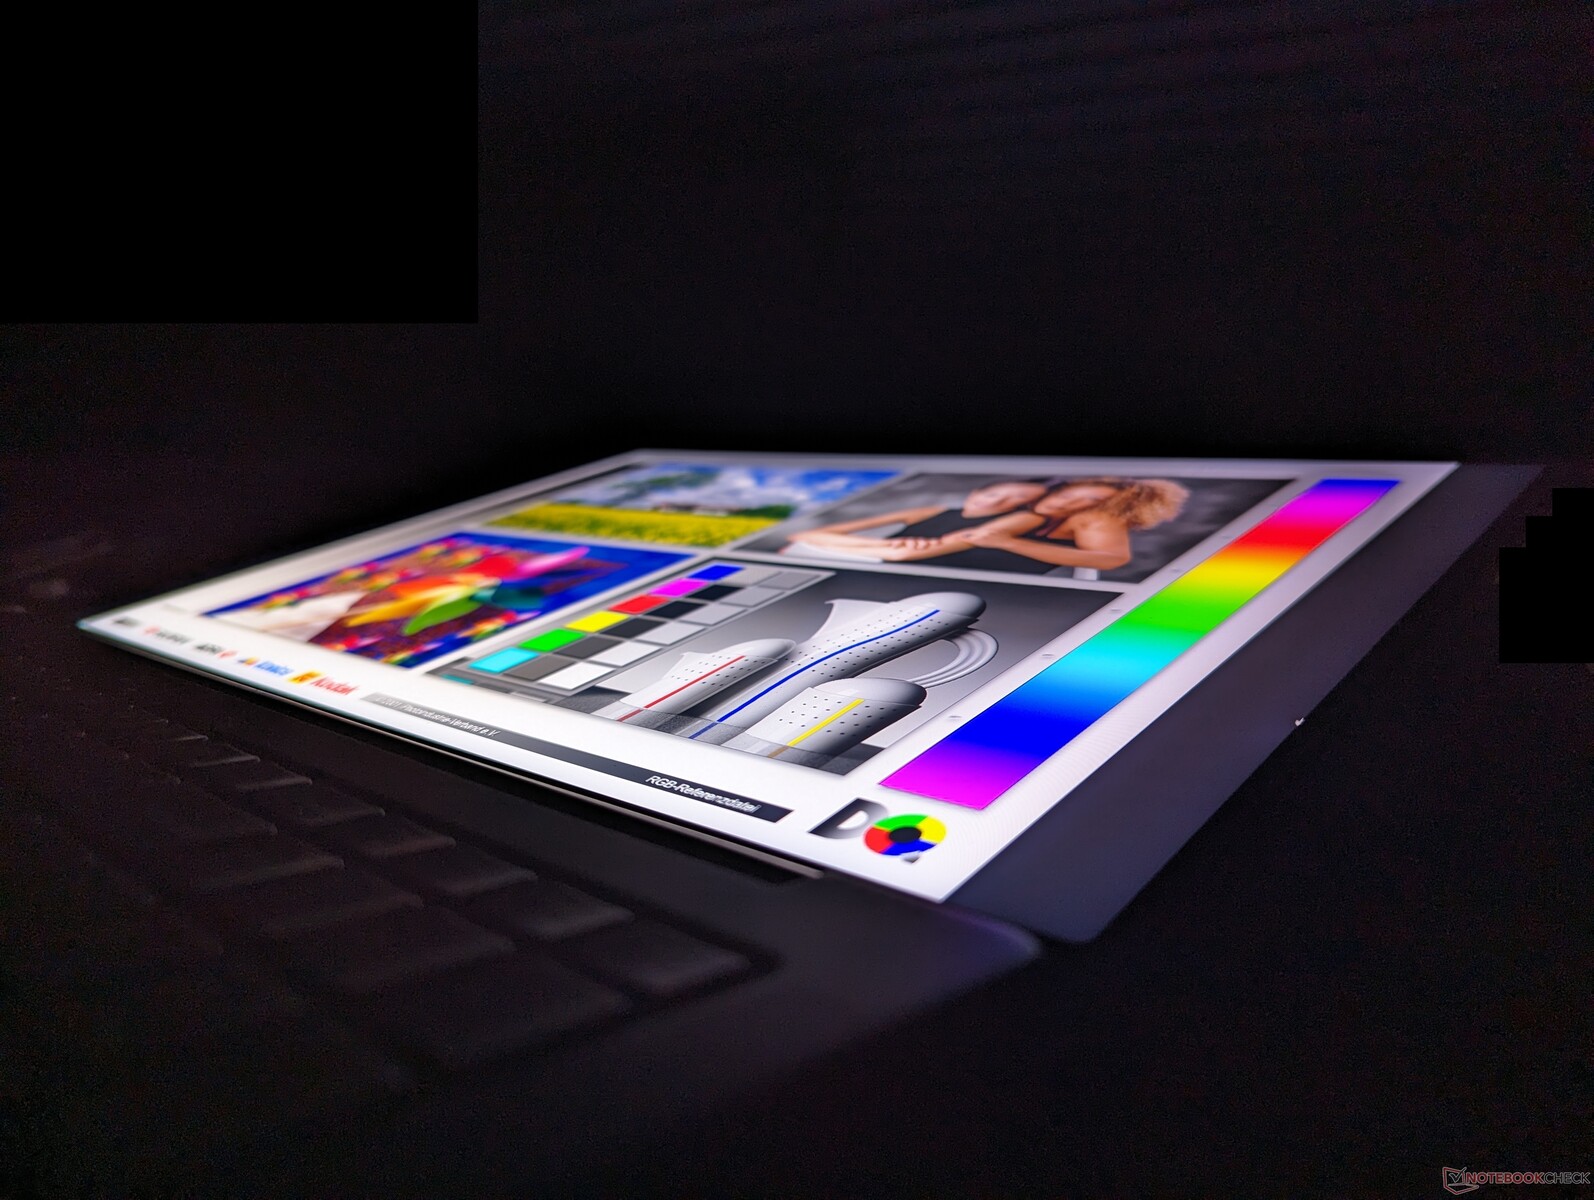
Display - 100% DCI-P3, 165 Hz, Mini-LED, lågt blått ljus, 3,2K
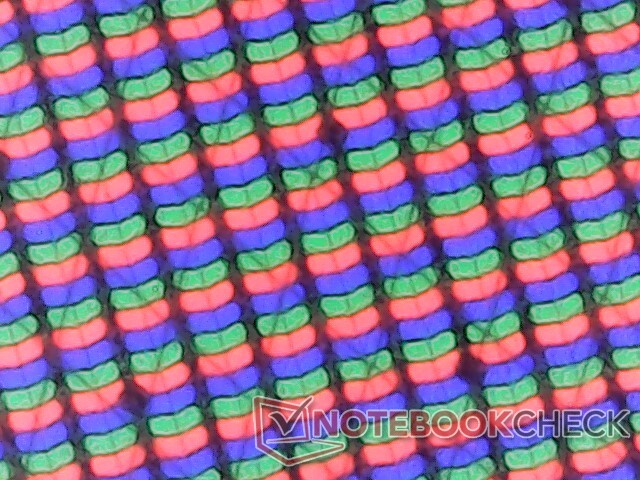
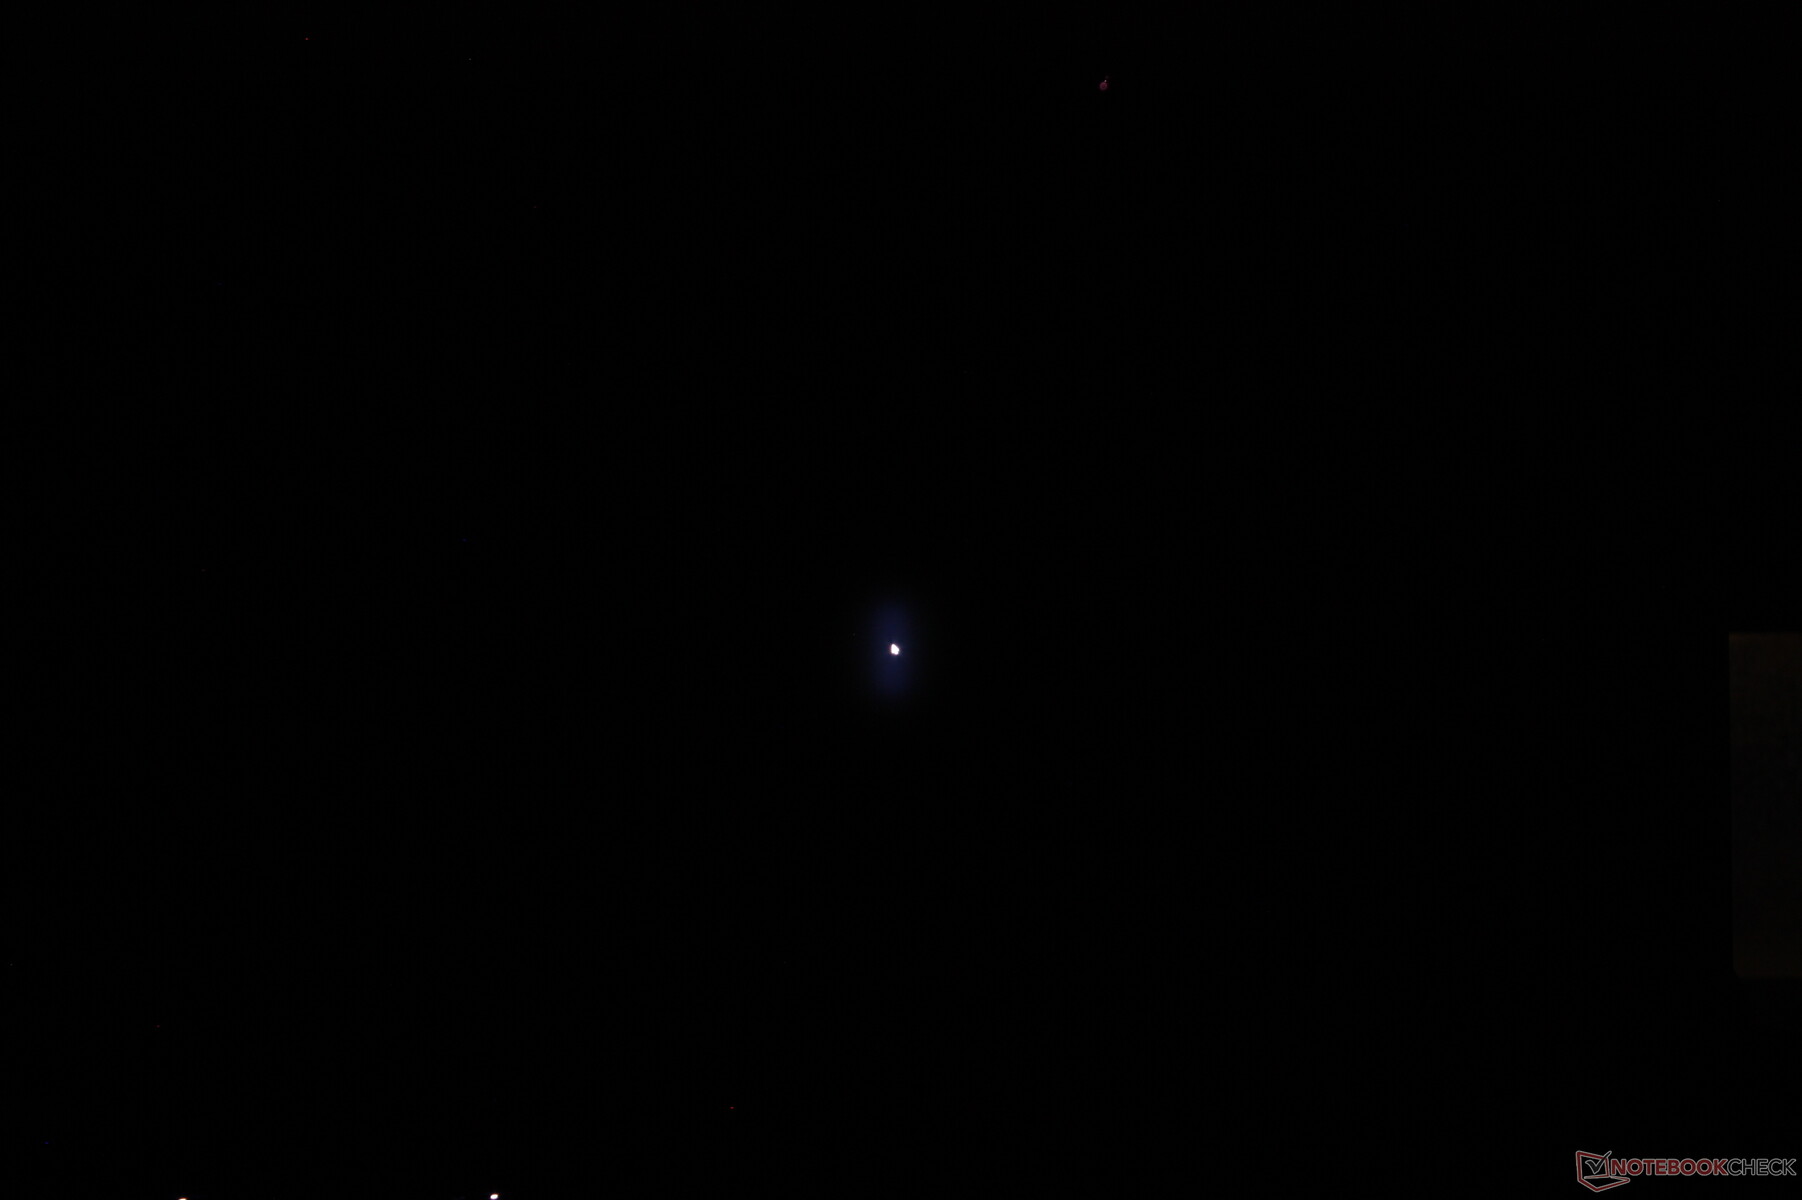
Mini-LED kombinerar fördelarna med billigare IPS och dyrare OLED. Den erbjuder mycket snabba uppdateringsfrekvenser från IPS med den högre maximala ljusstyrkan från OLED via lokal dimning för mer levande färger. Nackdelen är dock en märkbar "halo"-effekt när ett mycket ljust objekt visas mot en mycket mörk bakgrund. Vår skärmdump nedan visar till exempel en vit muspekare mot en helt svart bakgrund. Markören skulle vara skarp med definierade kanter på en OLED-panel, men den lyser istället på mini-LED eftersom den lokala dimningen inte är perfekt.
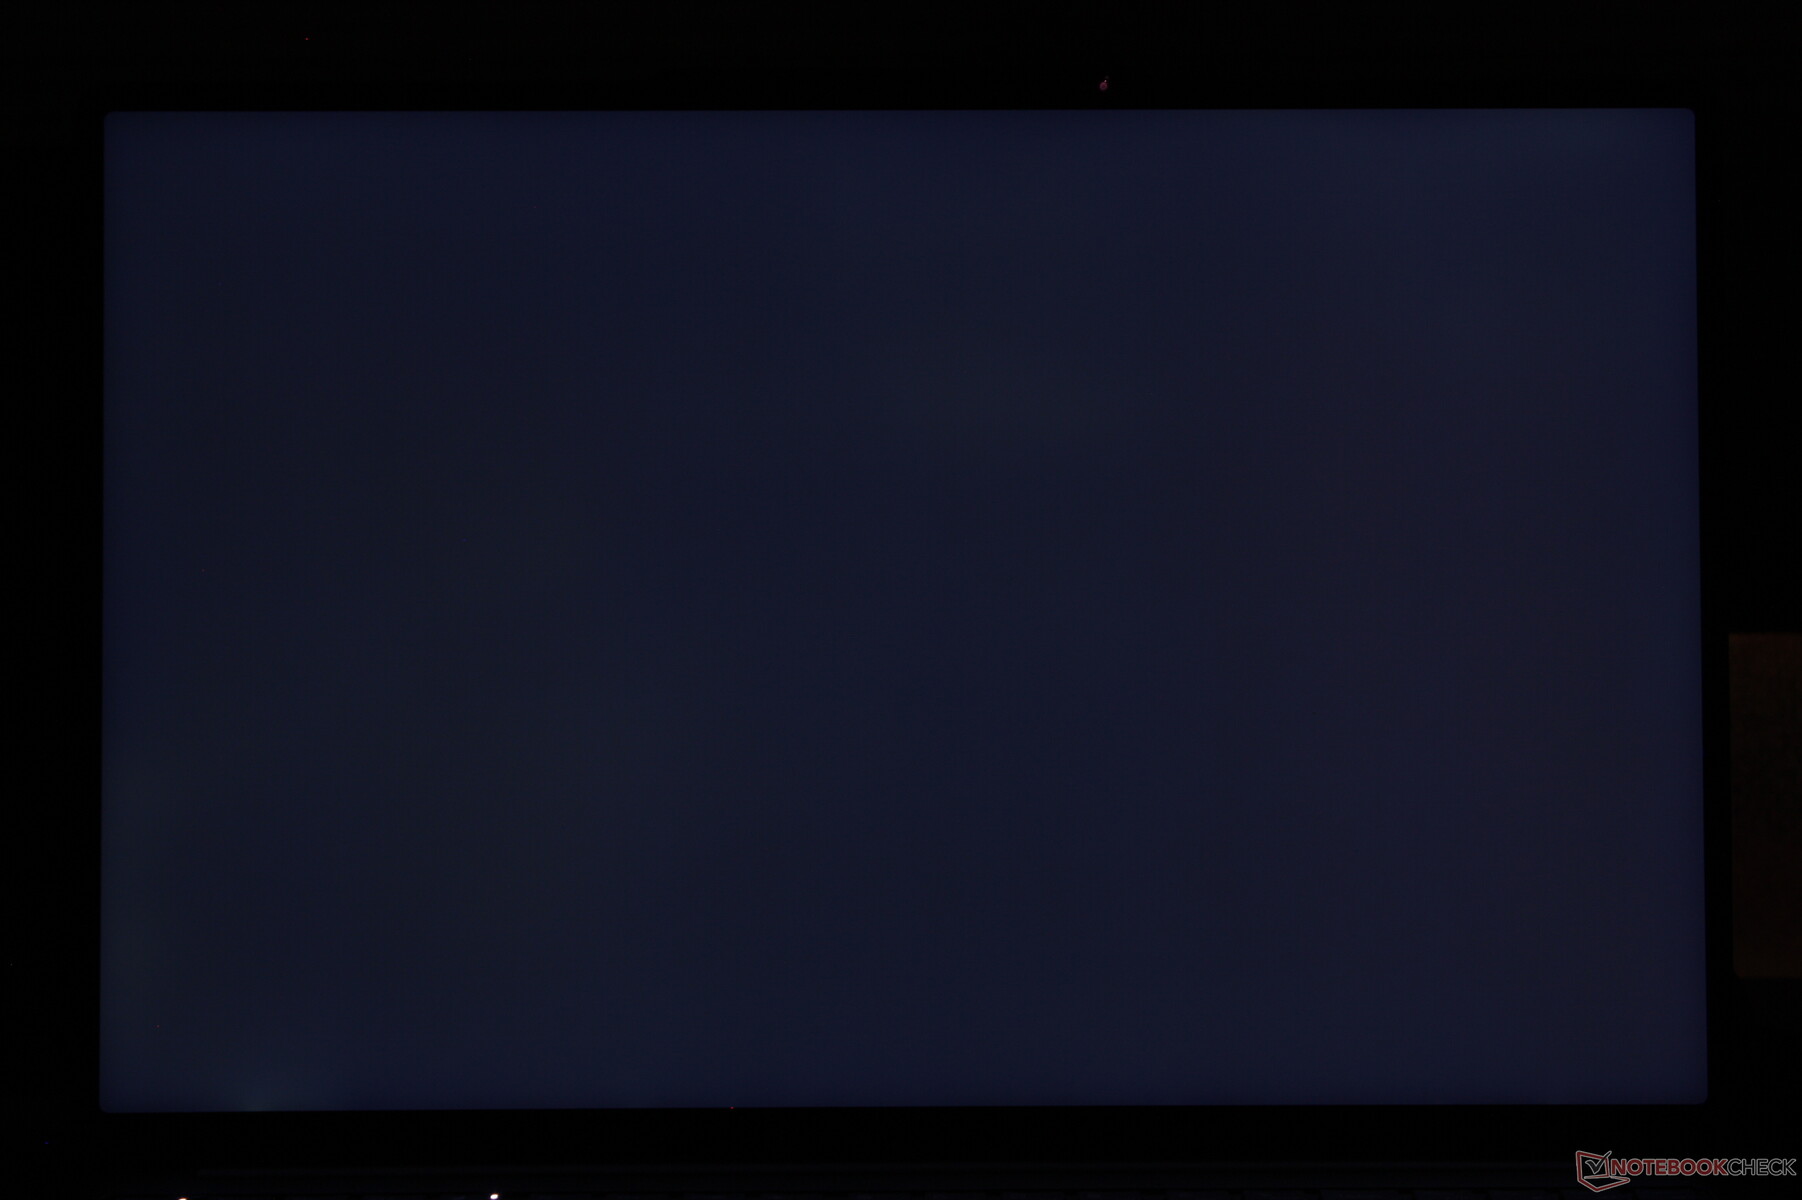
Maximal ljusstyrka är begränsad till cirka 600 nits när en helt vit bild visas. När vi kör detta HDR-testkan vi dock mäta en högre maximal ljusstyrka på 1330 nits, vilket är i linje med Lenovos krav på 1200 nits.
| |||||||||||||||||||||||||
Distribution av ljusstyrkan: 95 %
Mitt på batteriet: 627.4 cd/m²
Kontrast: 3302:1 (Svärta: 0.19 cd/m²)
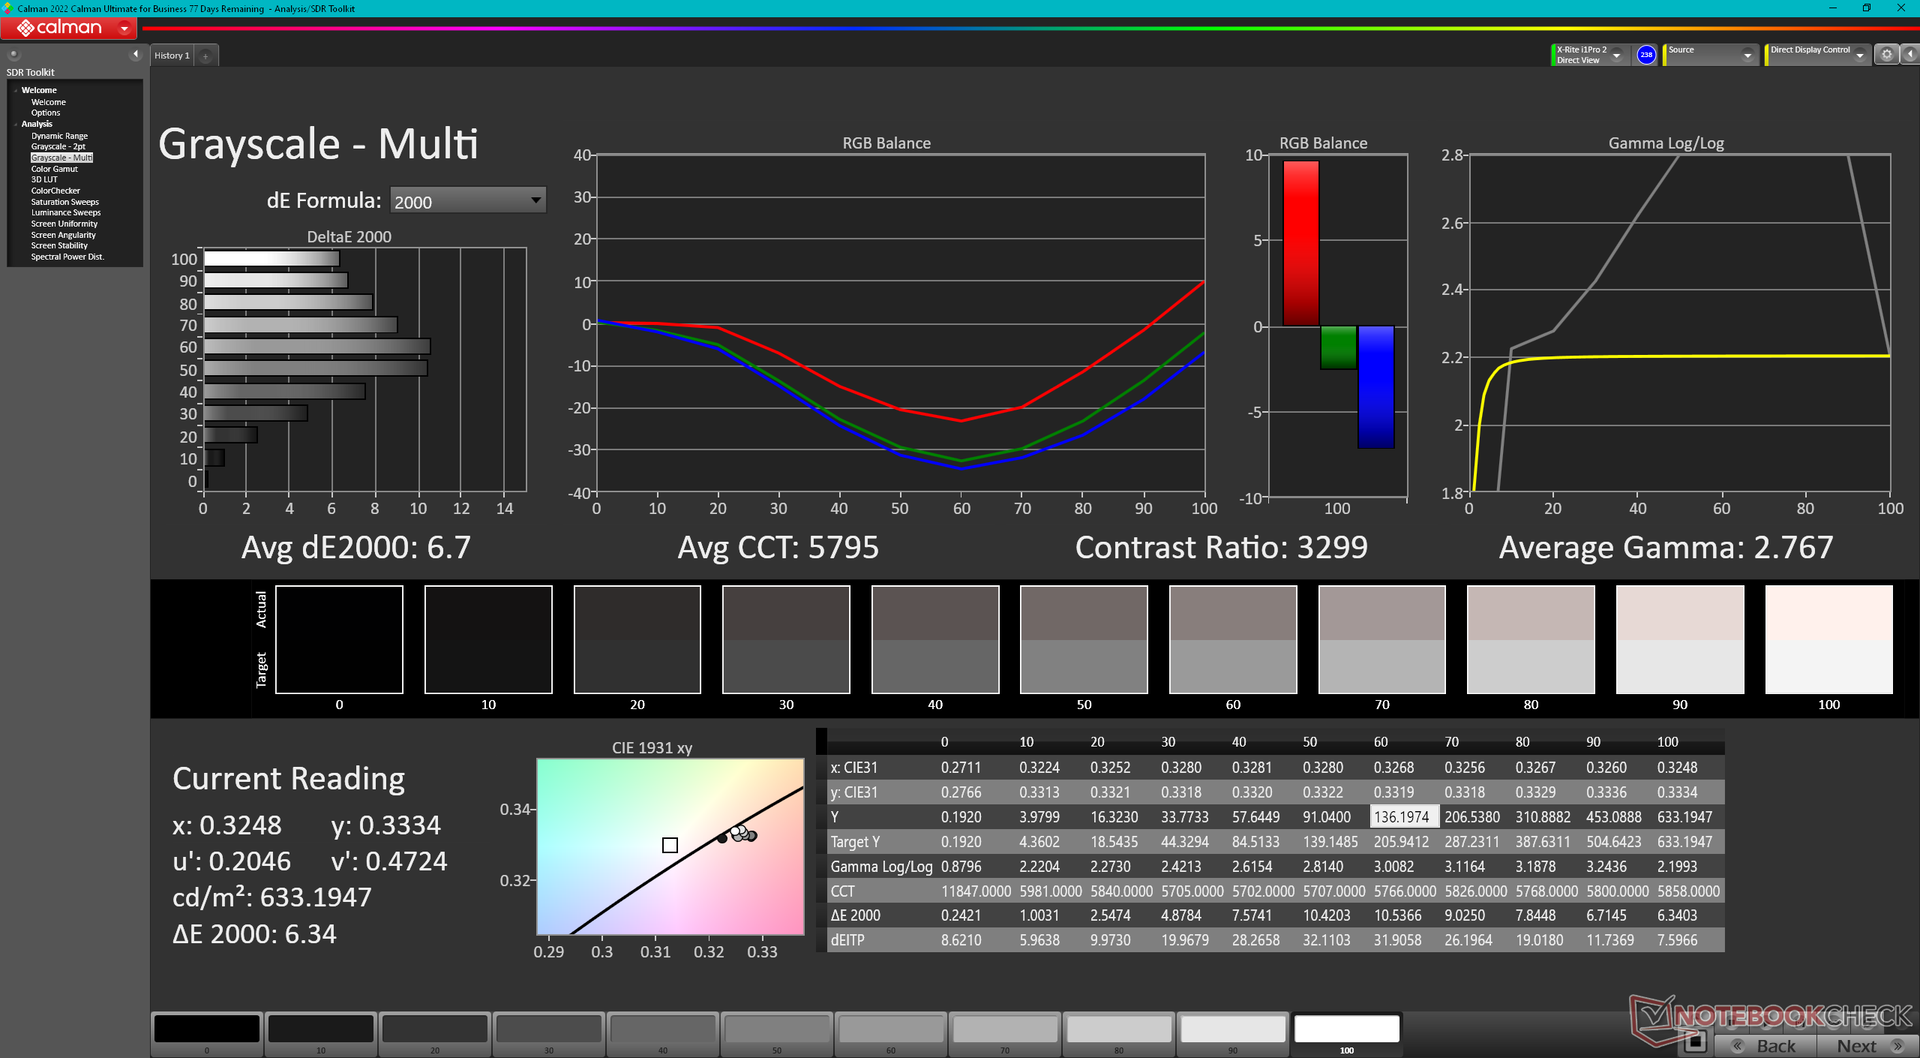
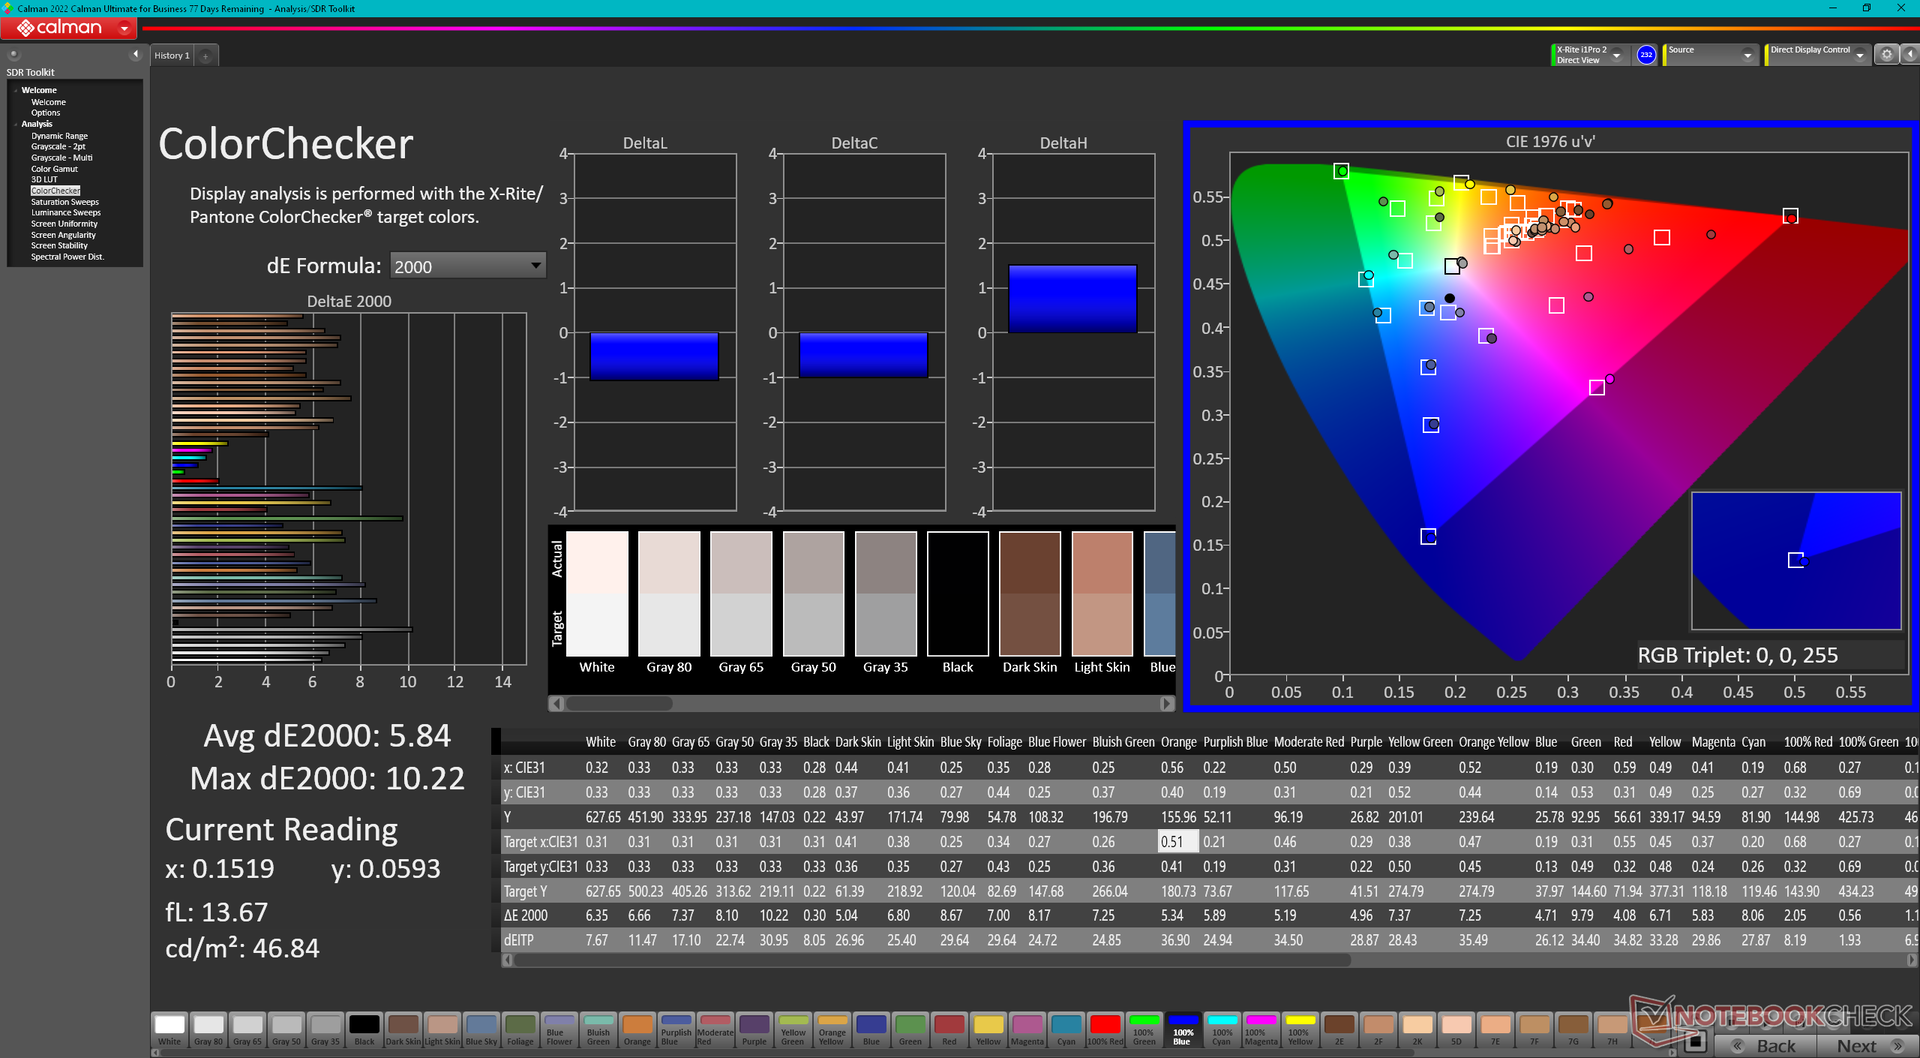
ΔE ColorChecker Calman: 5.84 | ∀{0.5-29.43 Ø4.71}
calibrated: 4.45
ΔE Greyscale Calman: 6.7 | ∀{0.09-98 Ø4.96}
84.6% AdobeRGB 1998 (Argyll 3D)
99.9% sRGB (Argyll 3D)
95.1% Display P3 (Argyll 3D)
Gamma: 2.77
CCT: 5795 K
| Lenovo Slim Pro 9i 16IRP8 LEN160-3.2K, Mini-LED, 3200x2000, 16" | Lenovo Yoga Pro 9 16-IRP G8 LEN160-3.2K, Mini-LED, 3200x2000, 16" | Asus VivoBook Pro 16 Au Optronics B160QAN02.L, IPS, 2560x1600, 16" | Acer Swift Edge SFE16-42-R1GM Samsung SDC4168, OLED, 3840x2400, 16" | Dell Inspiron 16 Plus 7620 BOE NE16N41, IPS, 3072x1920, 16" | HP Envy 16 h0112nr Samsung SDC4174, OLED, 3840x2400, 16" | |
|---|---|---|---|---|---|---|
| Display | 5% | 2% | 7% | -13% | 3% | |
| Display P3 Coverage (%) | 95.1 | 97 2% | 98.5 4% | 99.7 5% | 70.8 -26% | 99.3 4% |
| sRGB Coverage (%) | 99.9 | 99.8 0% | 99.9 0% | 100 0% | 99.5 0% | 100 0% |
| AdobeRGB 1998 Coverage (%) | 84.6 | 95.1 12% | 86.1 2% | 97.2 15% | 73.2 -13% | 88 4% |
| Response Times | 0% | 50% | 77% | -188% | 83% | |
| Response Time Grey 50% / Grey 80% * (ms) | 14 ? | 14 ? -0% | 2 ? 86% | 2 ? 86% | 38 ? -171% | 2 ? 86% |
| Response Time Black / White * (ms) | 9.2 ? | 9.2 ? -0% | 8 ? 13% | 3 ? 67% | 28 ? -204% | 1.9 ? 79% |
| PWM Frequency (Hz) | 5784 ? | 5800 ? | 239 ? | 240.4 ? | ||
| Screen | 24% | 5% | 21% | 9% | 17% | |
| Brightness middle (cd/m²) | 627.4 | 539 -14% | 504 -20% | 369 -41% | 288.9 -54% | 328.8 -48% |
| Brightness (cd/m²) | 618 | 546 -12% | 465 -25% | 371 -40% | 276 -55% | 332 -46% |
| Brightness Distribution (%) | 95 | 96 1% | 87 -8% | 97 2% | 92 -3% | 97 2% |
| Black Level * (cd/m²) | 0.19 | 0.18 5% | 0.35 -84% | 0.26 -37% | ||
| Contrast (:1) | 3302 | 2994 -9% | 1440 -56% | 1111 -66% | ||
| Colorchecker dE 2000 * | 5.84 | 1.4 76% | 1.83 69% | 2.3 61% | 1.88 68% | 1.53 74% |
| Colorchecker dE 2000 max. * | 10.22 | 2.1 79% | 5.51 46% | 4.37 57% | 4.37 57% | 6.04 41% |
| Colorchecker dE 2000 calibrated * | 4.45 | 1.34 70% | 2.87 36% | 0.42 91% | ||
| Greyscale dE 2000 * | 6.7 | 2.2 67% | 3.02 55% | 1.83 73% | 1.4 79% | 1.3 81% |
| Gamma | 2.77 79% | 2.19 100% | 2.39 92% | 2.39 92% | 2.3 96% | 2.18 101% |
| CCT | 5795 112% | 6479 100% | 6688 97% | 6392 102% | 6634 98% | 6362 102% |
| Totalt genomsnitt (program/inställningar) | 10% /
16% | 19% /
11% | 35% /
27% | -64% /
-24% | 34% /
25% |
* ... mindre är bättre
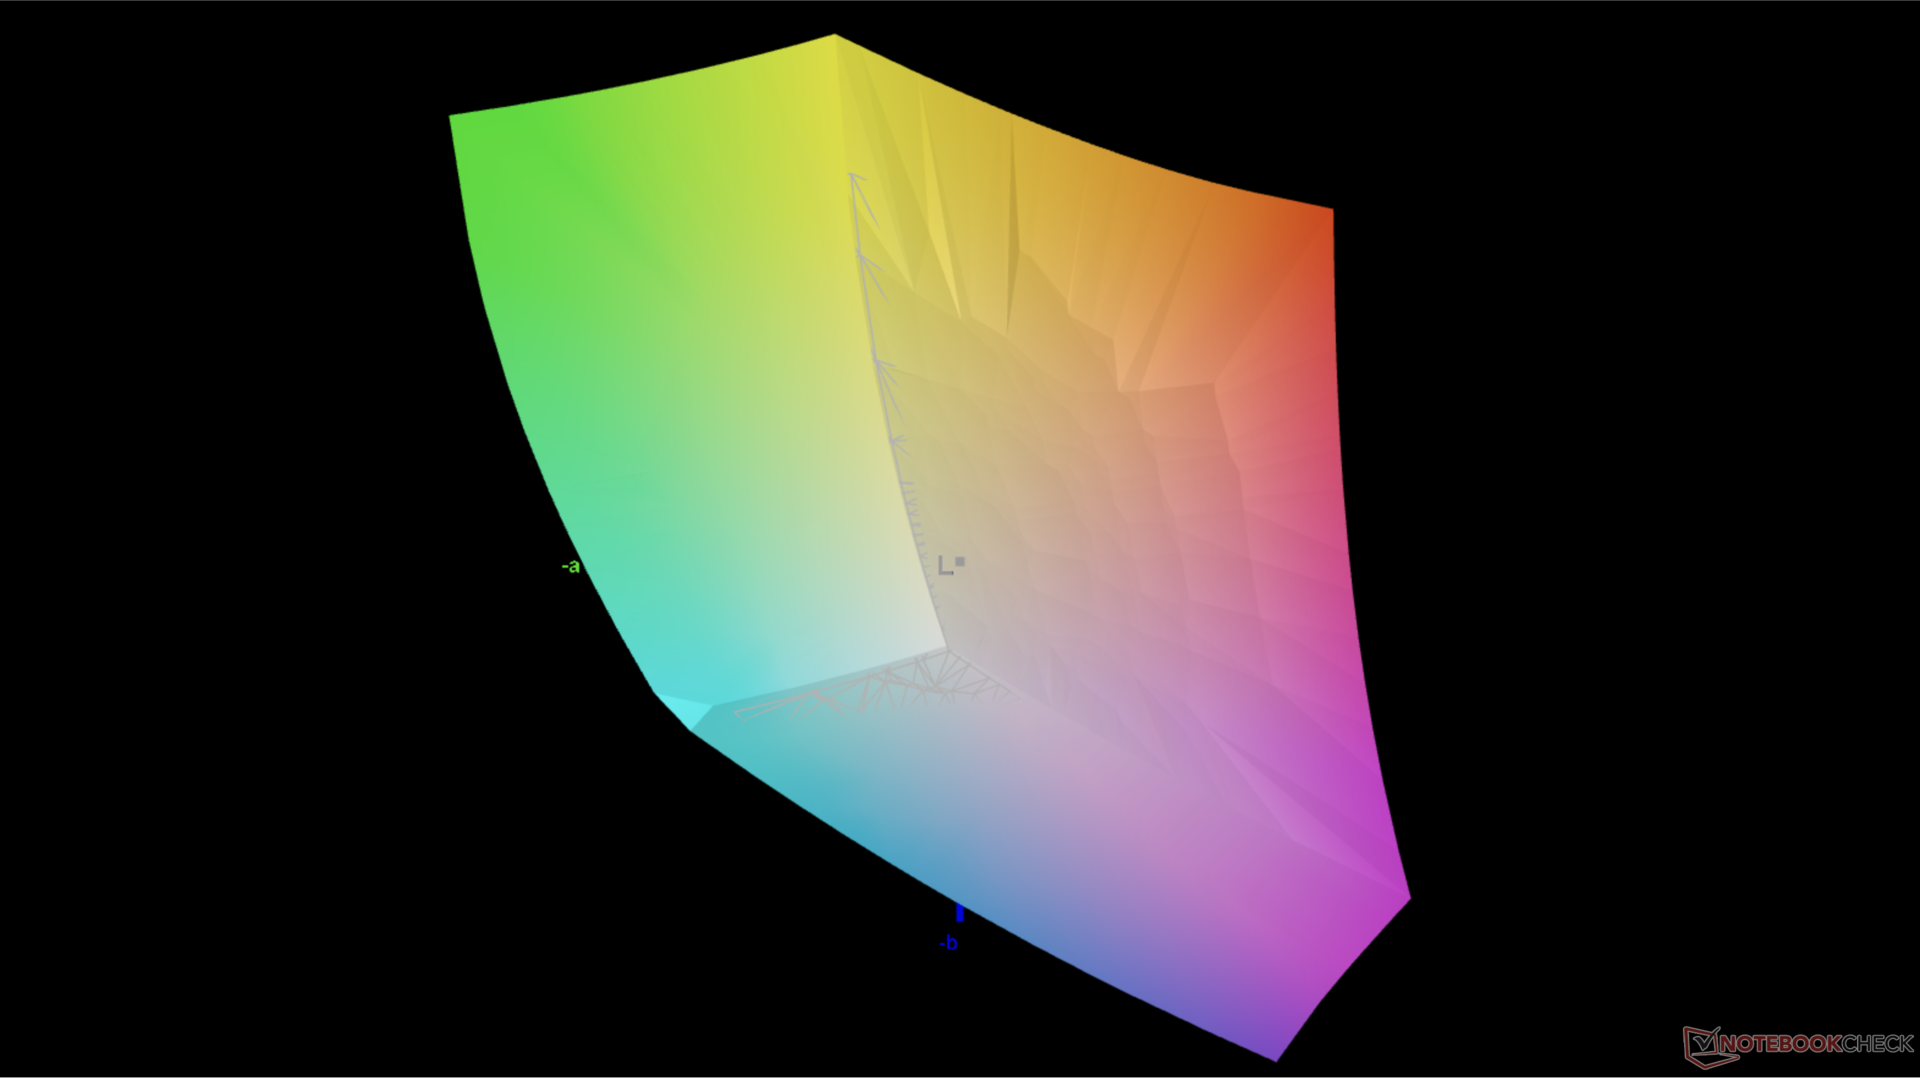
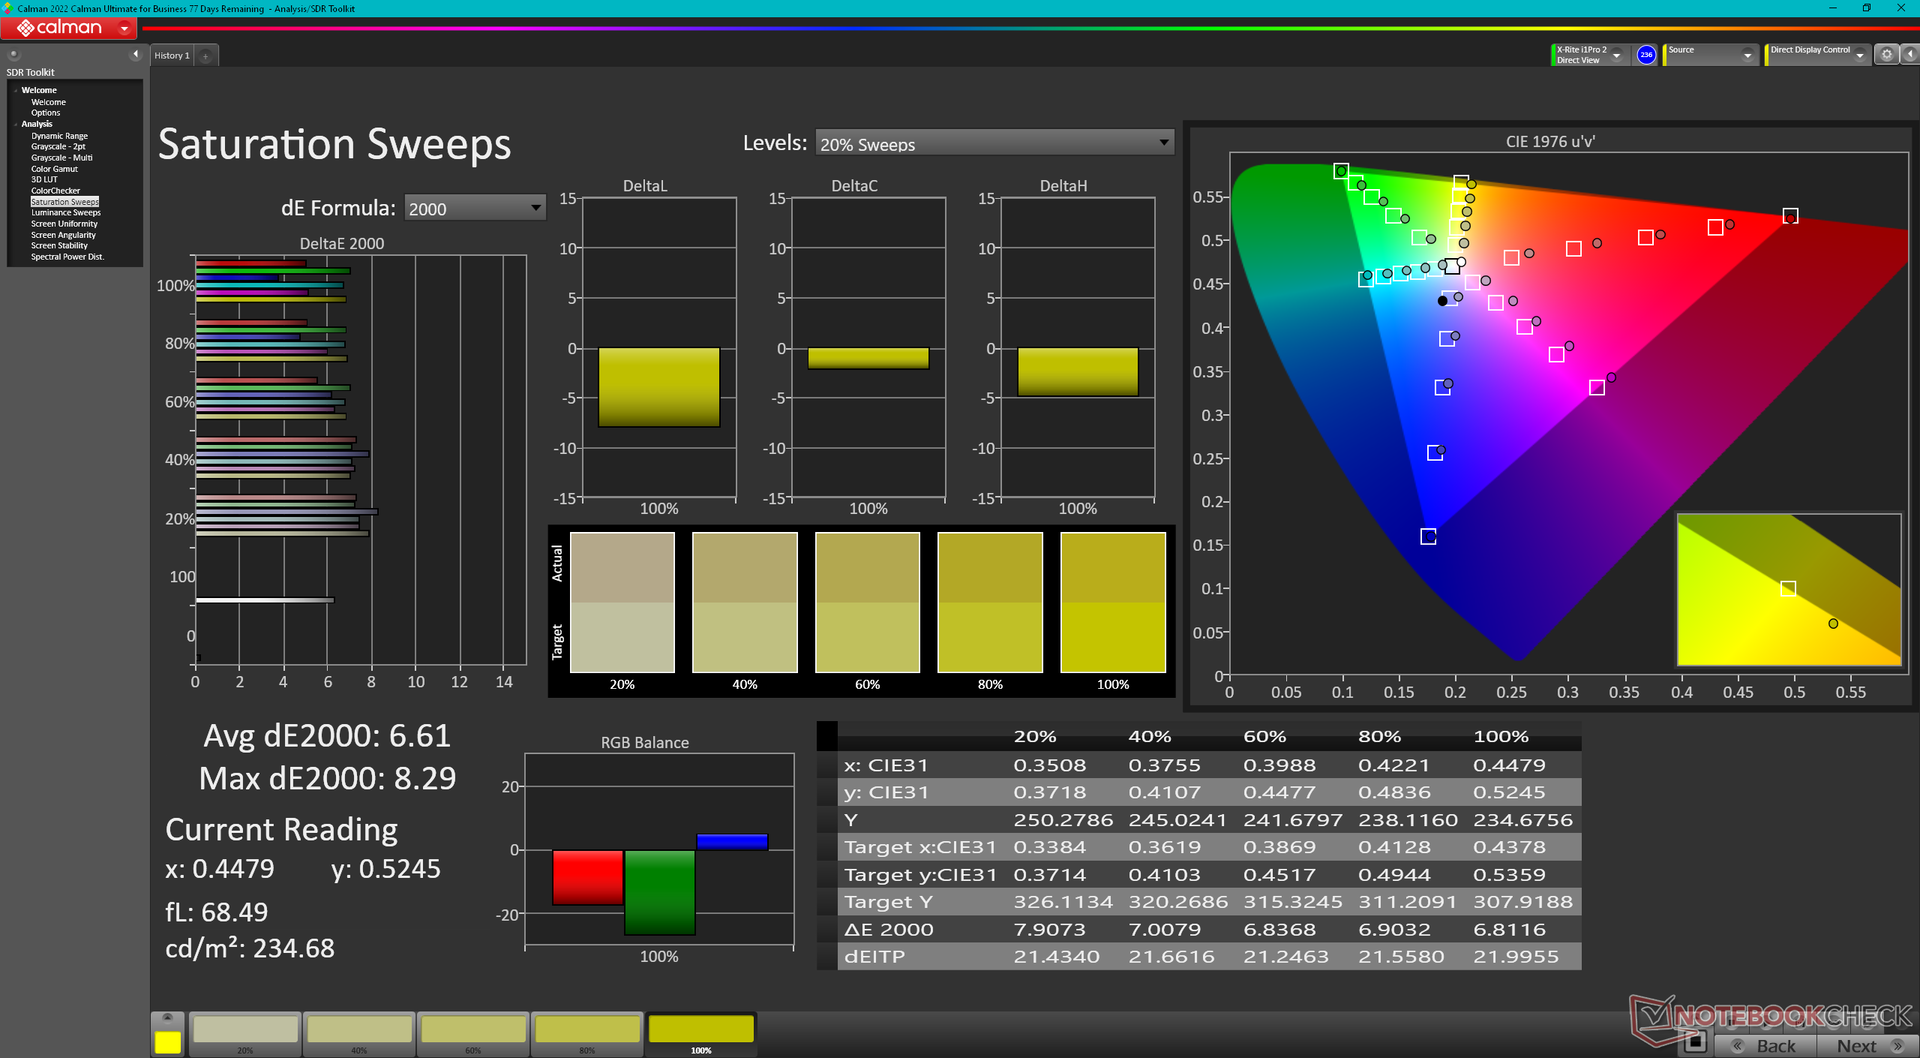
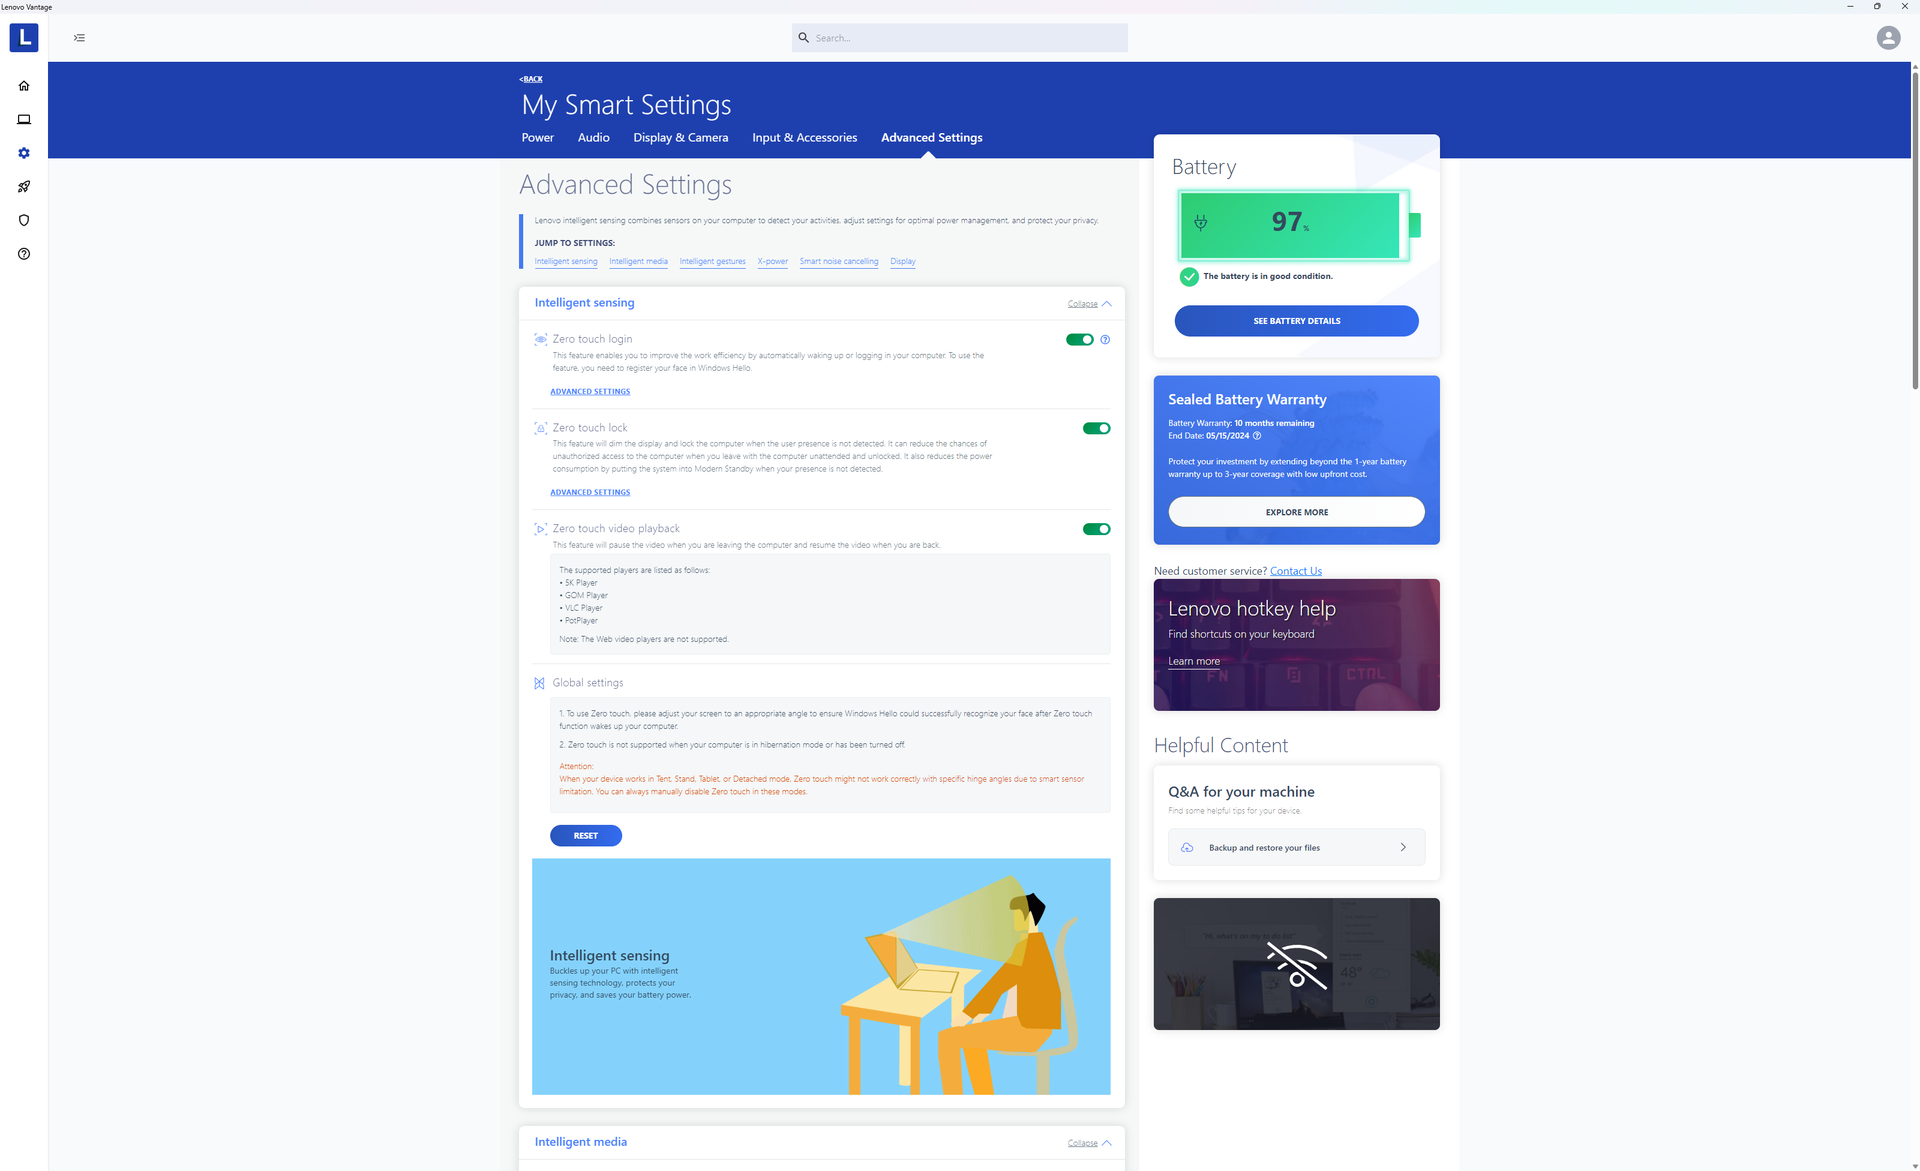
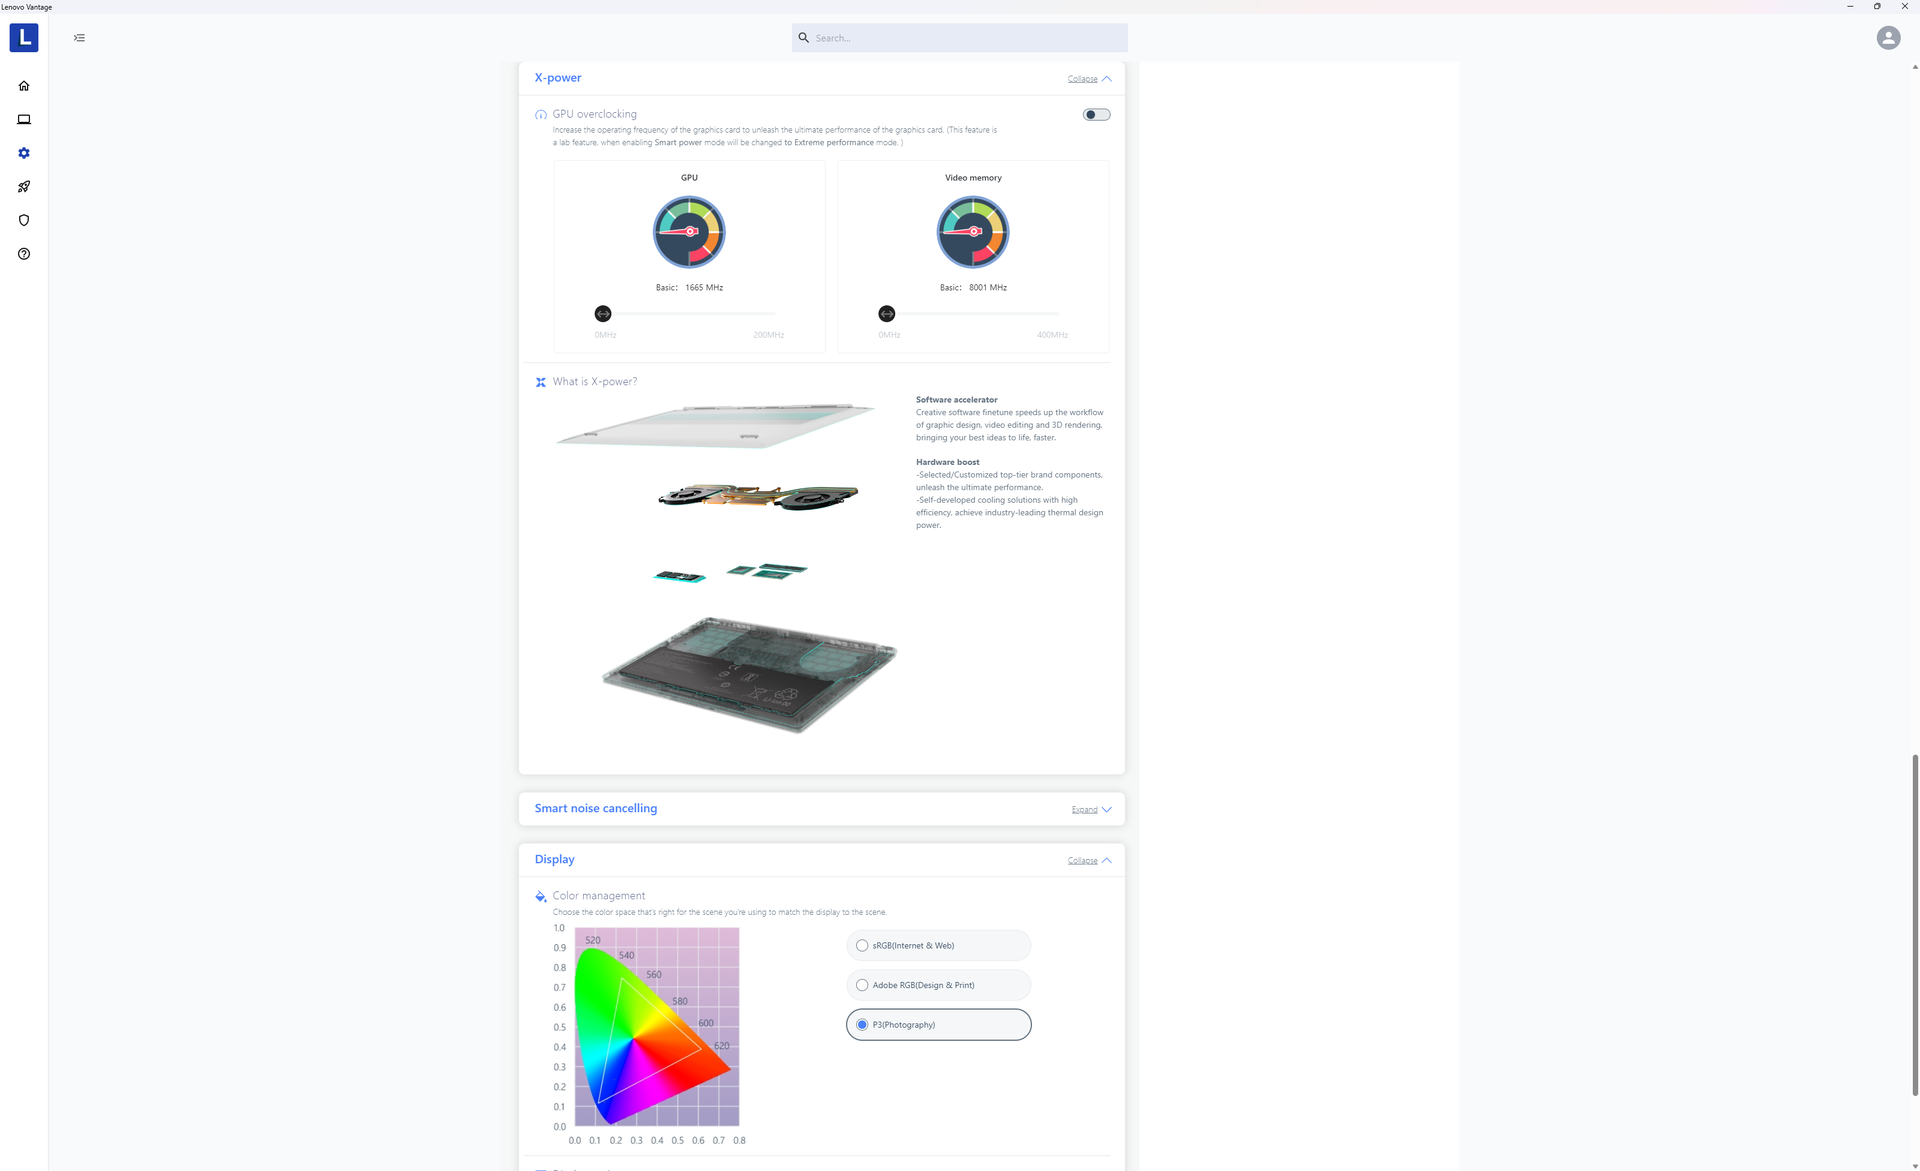
Färgtemperaturen är varmare än förväntat när den är inställd på P3-läge. Till skillnad från många MSI-modeller har Lenovo Vantage-programvaran inget reglage för att justera färgtemperaturen.
Visa svarstider
| ↔ Svarstid svart till vitt | ||
|---|---|---|
| 9.2 ms ... stiga ↗ och falla ↘ kombinerat | ↗ 2.2 ms stiga | 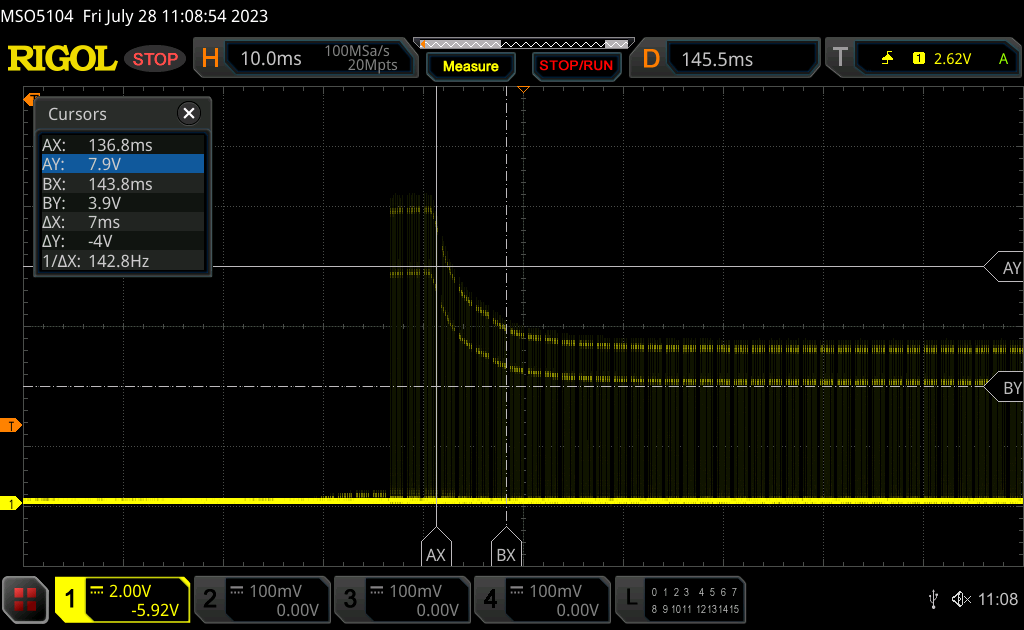 |
| ↘ 7 ms hösten | ||
| Skärmen visar snabba svarsfrekvenser i våra tester och bör passa för spel. I jämförelse sträcker sig alla testade enheter från 0.1 (minst) till 240 (maximalt) ms. » 26 % av alla enheter är bättre. Det betyder att den uppmätta svarstiden är bättre än genomsnittet av alla testade enheter (19.8 ms). | ||
| ↔ Svarstid 50 % grått till 80 % grått | ||
| 14 ms ... stiga ↗ och falla ↘ kombinerat | ↗ 7.4 ms stiga | 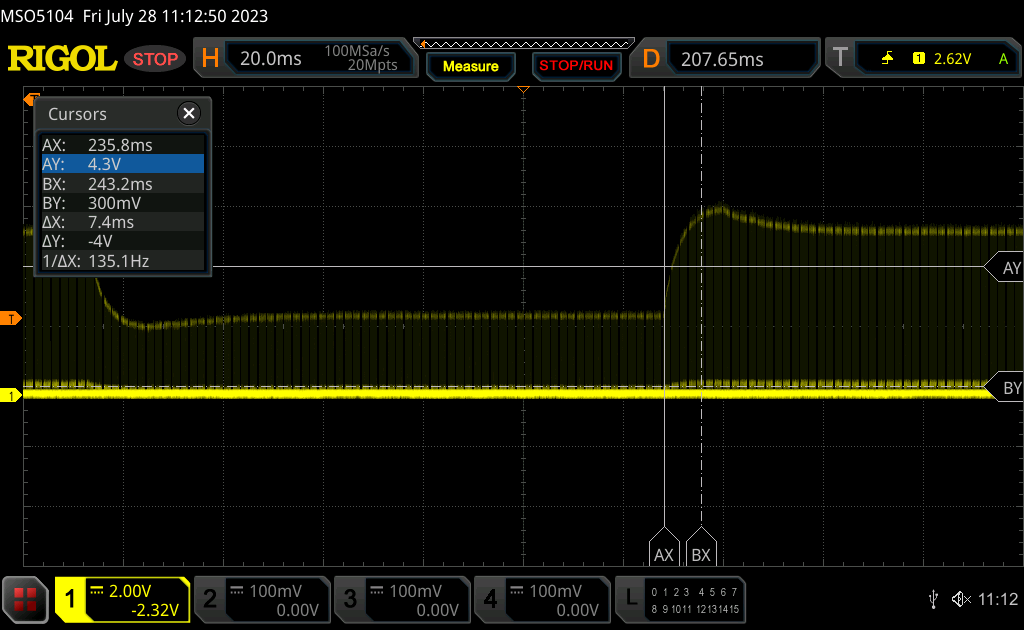 |
| ↘ 6.6 ms hösten | ||
| Skärmen visar bra svarsfrekvens i våra tester, men kan vara för långsam för konkurrenskraftiga spelare. I jämförelse sträcker sig alla testade enheter från 0.165 (minst) till 636 (maximalt) ms. » 28 % av alla enheter är bättre. Det betyder att den uppmätta svarstiden är bättre än genomsnittet av alla testade enheter (31 ms). | ||
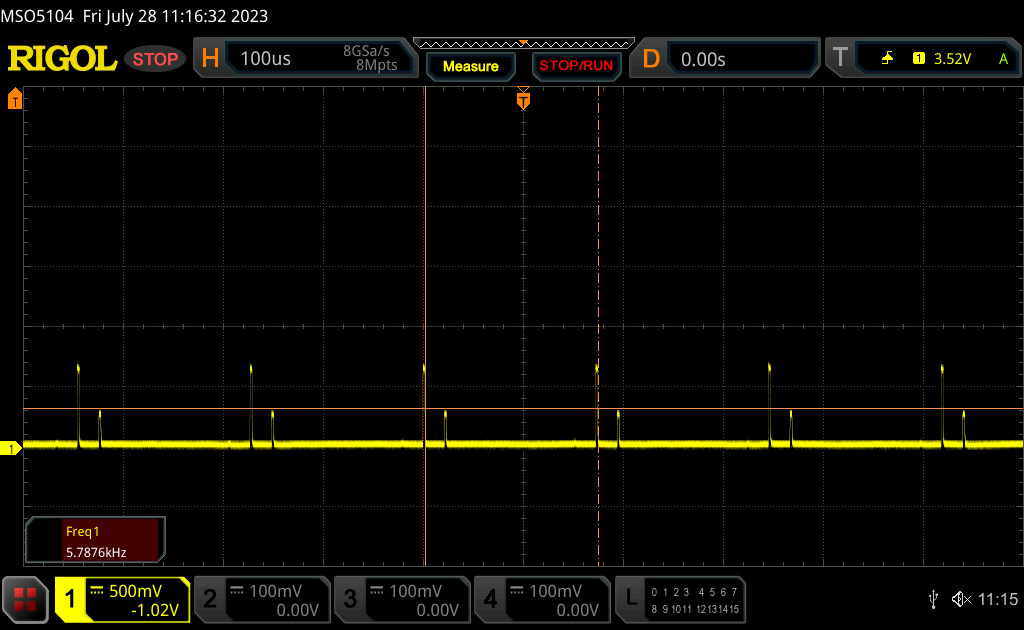
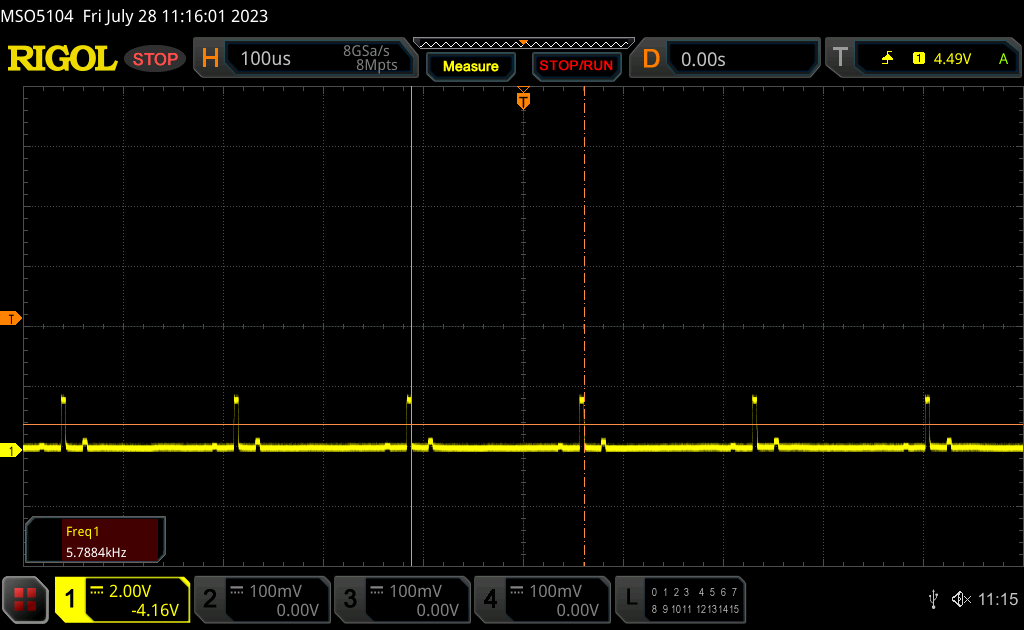
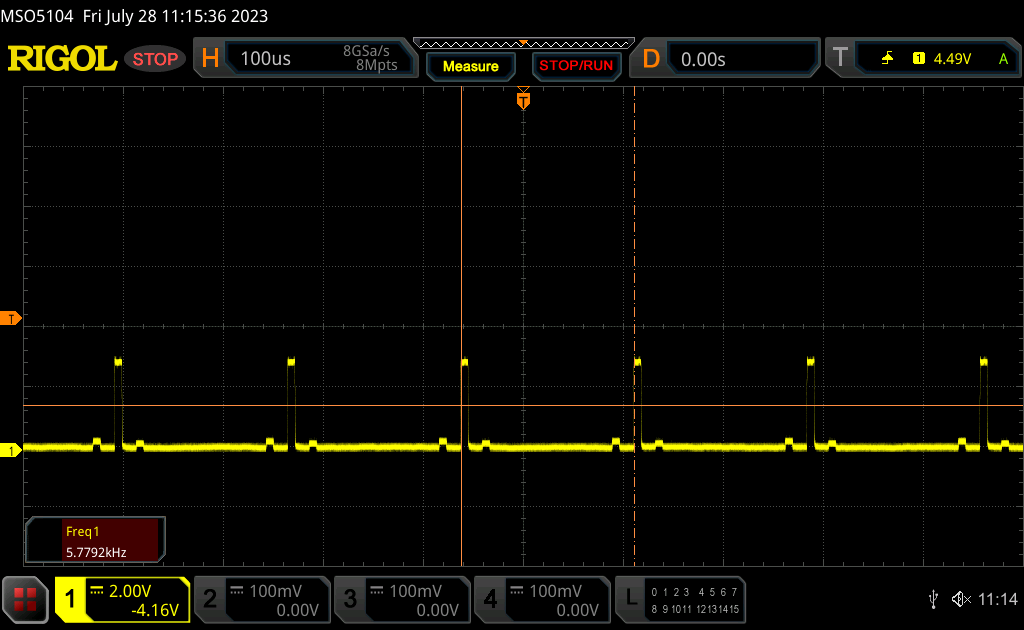
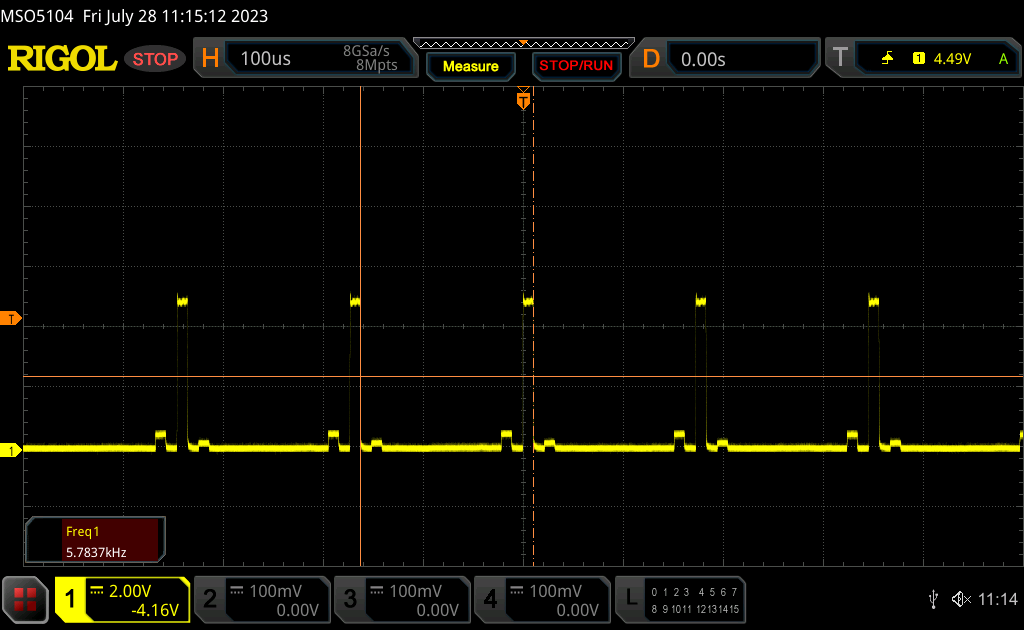
Skärmflimmer / PWM (Puls-Width Modulation)
| Skärmflimmer / PWM upptäckt | 5784 Hz | ≤ 100 % ljusstyrka inställning | 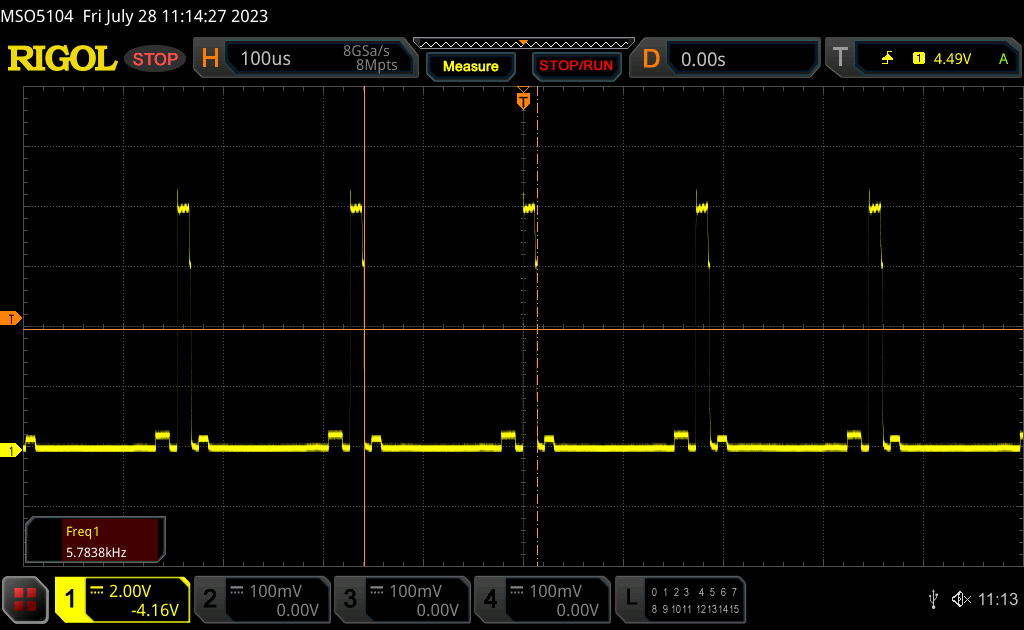 |
Displayens bakgrundsbelysning flimrar vid 5784 Hz (i värsta fall, t.ex. med PWM) Flimrande upptäckt vid en ljusstyrkeinställning på 100 % och lägre. Det ska inte finnas något flimmer eller PWM över denna ljusstyrkeinställning. Frekvensen för 5784 Hz är ganska hög, så de flesta användare som är känsliga för PWM bör inte märka något flimmer. Som jämförelse: 52 % av alla testade enheter använder inte PWM för att dämpa skärmen. Om PWM upptäcktes mättes ett medelvärde av 7757 (minst: 5 - maximum: 343500) Hz. | |||
Flimmer förekommer på alla ljusstyrkenivåer i SDR-läge. Frekvensen är dock relativt hög, 5784 Hz, så det bör inte vara ett problem för de allra flesta användare.
Prestanda - 13:e generationens Raptor Lake-H
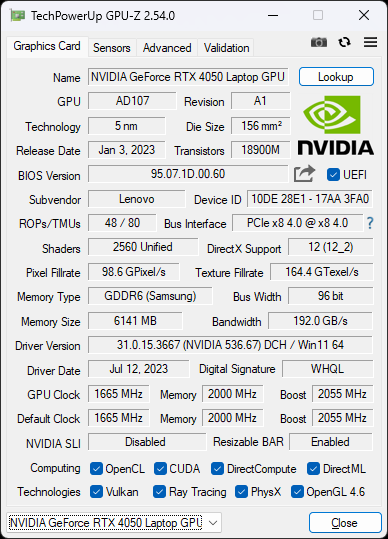
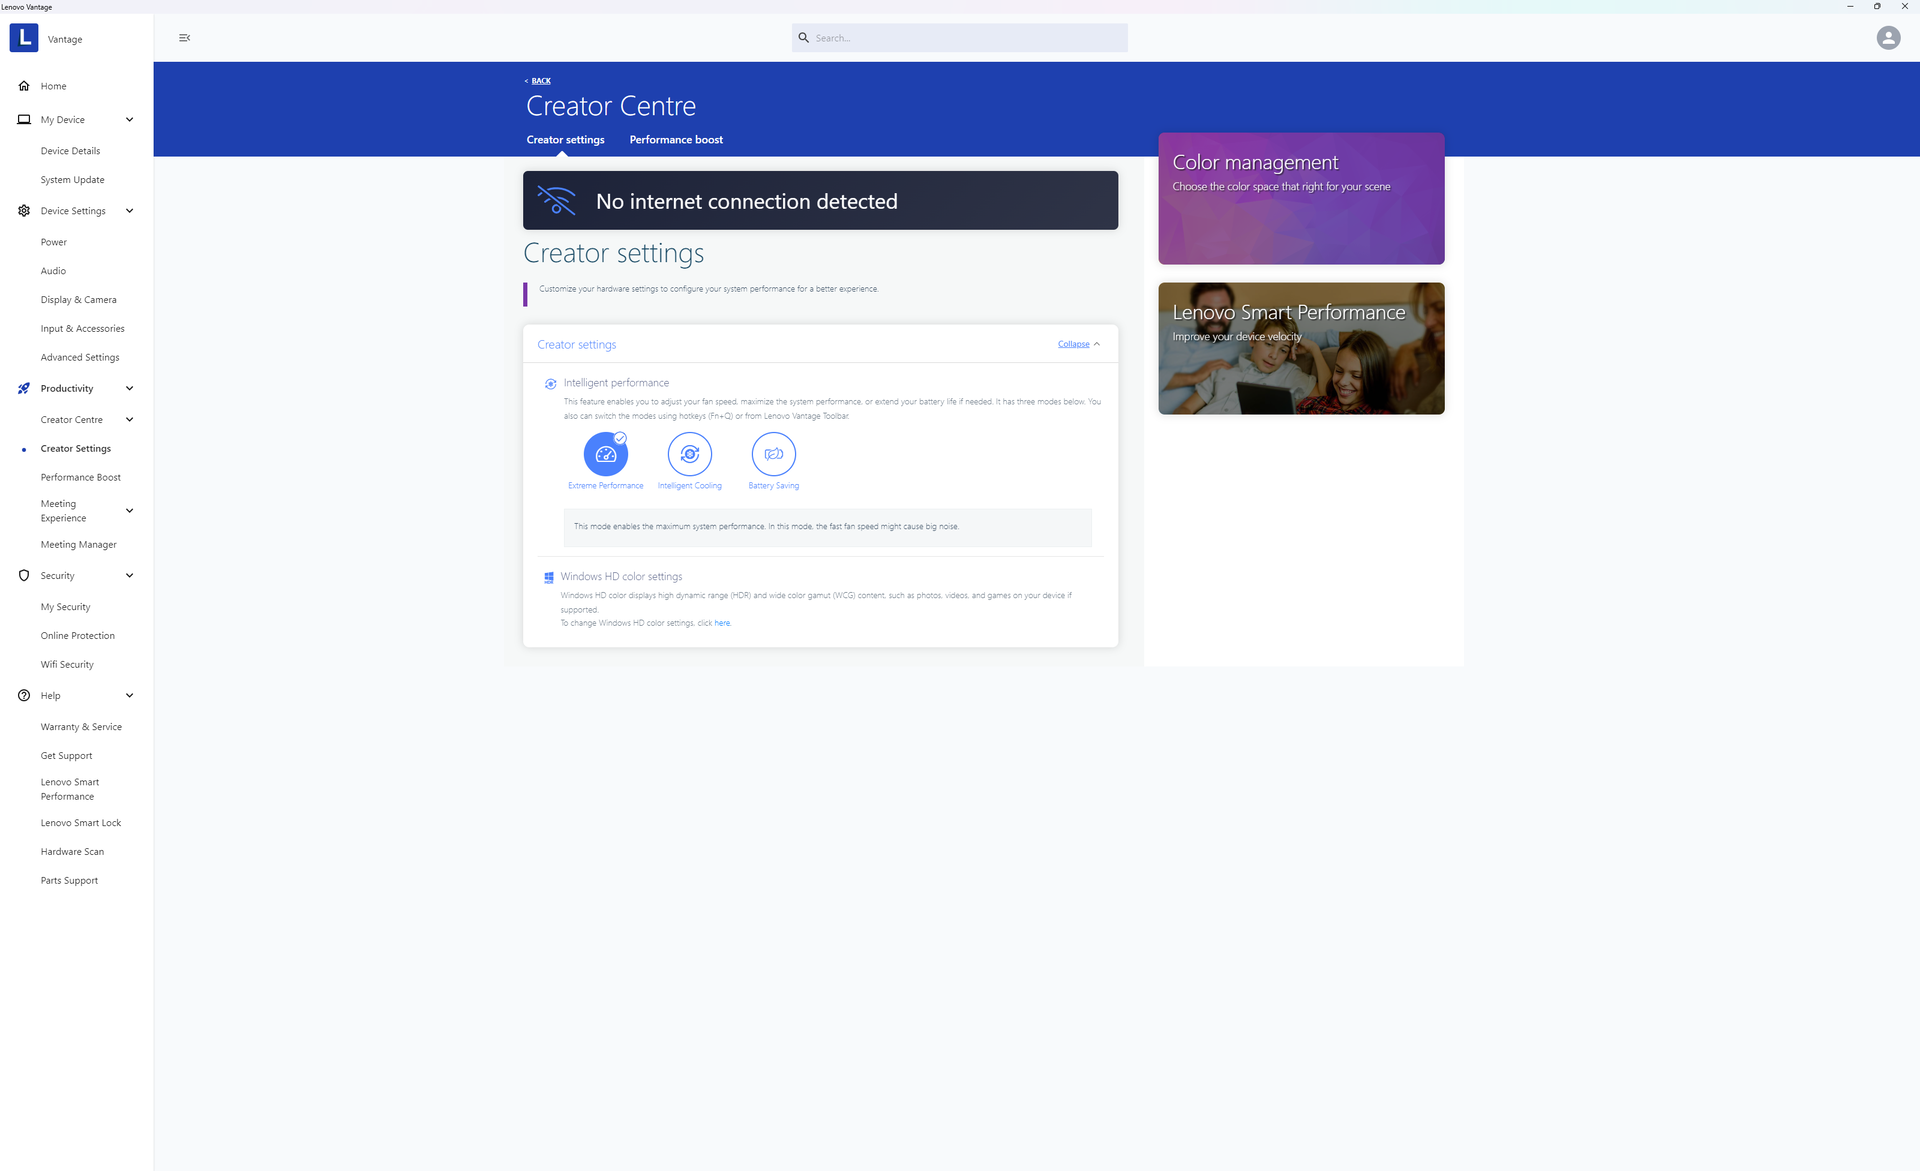
Villkor för testning
Vi ställde in vår enhet till Performance-läge via Windows och Extreme Performance-läge via Lenovo Vantage innan vi körde riktmärkena nedan. Irriterande, Lenovo omdesignar sin Vantage UI ganska ofta och så alla inställningar är under olika undermenyer jämfört med samma programvara på andra Lenovo bärbara datorer.
Processor
DenCore i9-13905H kan vara snabbare änCore i7-13705H på pappret, men fördelarna är i bästa fall små. Multi-thread prestanda är nästan identisk mellan dem medan single-thread prestanda bara är 5 till 10 procent snabbare med vår Core i9.
Cinebench R15 Multi Loop
Cinebench R23: Multi Core | Single Core
Cinebench R20: CPU (Multi Core) | CPU (Single Core)
Cinebench R15: CPU Multi 64Bit | CPU Single 64Bit
Blender: v2.79 BMW27 CPU
7-Zip 18.03: 7z b 4 | 7z b 4 -mmt1
Geekbench 5.5: Multi-Core | Single-Core
HWBOT x265 Benchmark v2.2: 4k Preset
LibreOffice : 20 Documents To PDF
R Benchmark 2.5: Overall mean
* ... mindre är bättre
AIDA64: FP32 Ray-Trace | FPU Julia | CPU SHA3 | CPU Queen | FPU SinJulia | FPU Mandel | CPU AES | CPU ZLib | FP64 Ray-Trace | CPU PhotoWorxx
| Performance rating | |
| Lenovo Slim Pro 9i 16IRP8 | |
| Genomsnitt Intel Core i9-13905H | |
| Lenovo Yoga Pro 9 16-IRP G8 | |
| HP Envy 16 h0112nr | |
| Asus VivoBook Pro 16 | |
| Dell Inspiron 16 Plus 7620 | |
| Acer Swift Edge SFE16-42-R1GM | |
| AIDA64 / FP32 Ray-Trace | |
| Genomsnitt Intel Core i9-13905H (17642 - 19900, n=3) | |
| Lenovo Slim Pro 9i 16IRP8 | |
| Lenovo Yoga Pro 9 16-IRP G8 | |
| Asus VivoBook Pro 16 | |
| Dell Inspiron 16 Plus 7620 | |
| HP Envy 16 h0112nr | |
| Acer Swift Edge SFE16-42-R1GM | |
| AIDA64 / FPU Julia | |
| Lenovo Yoga Pro 9 16-IRP G8 | |
| Lenovo Slim Pro 9i 16IRP8 | |
| Genomsnitt Intel Core i9-13905H (89198 - 94350, n=3) | |
| Asus VivoBook Pro 16 | |
| Acer Swift Edge SFE16-42-R1GM | |
| Dell Inspiron 16 Plus 7620 | |
| HP Envy 16 h0112nr | |
| AIDA64 / CPU SHA3 | |
| Lenovo Slim Pro 9i 16IRP8 | |
| Lenovo Yoga Pro 9 16-IRP G8 | |
| Genomsnitt Intel Core i9-13905H (3945 - 4296, n=3) | |
| Asus VivoBook Pro 16 | |
| Dell Inspiron 16 Plus 7620 | |
| HP Envy 16 h0112nr | |
| Acer Swift Edge SFE16-42-R1GM | |
| AIDA64 / CPU Queen | |
| Lenovo Slim Pro 9i 16IRP8 | |
| Lenovo Yoga Pro 9 16-IRP G8 | |
| Genomsnitt Intel Core i9-13905H (94506 - 117697, n=3) | |
| Asus VivoBook Pro 16 | |
| HP Envy 16 h0112nr | |
| Dell Inspiron 16 Plus 7620 | |
| Acer Swift Edge SFE16-42-R1GM | |
| AIDA64 / FPU SinJulia | |
| Lenovo Slim Pro 9i 16IRP8 | |
| Lenovo Yoga Pro 9 16-IRP G8 | |
| Acer Swift Edge SFE16-42-R1GM | |
| Genomsnitt Intel Core i9-13905H (10478 - 11328, n=3) | |
| Asus VivoBook Pro 16 | |
| Dell Inspiron 16 Plus 7620 | |
| HP Envy 16 h0112nr | |
| AIDA64 / FPU Mandel | |
| Genomsnitt Intel Core i9-13905H (43922 - 48884, n=3) | |
| Lenovo Slim Pro 9i 16IRP8 | |
| Lenovo Yoga Pro 9 16-IRP G8 | |
| Acer Swift Edge SFE16-42-R1GM | |
| Asus VivoBook Pro 16 | |
| Dell Inspiron 16 Plus 7620 | |
| HP Envy 16 h0112nr | |
| AIDA64 / CPU AES | |
| HP Envy 16 h0112nr | |
| Lenovo Slim Pro 9i 16IRP8 | |
| Lenovo Yoga Pro 9 16-IRP G8 | |
| Genomsnitt Intel Core i9-13905H (80275 - 86469, n=3) | |
| Asus VivoBook Pro 16 | |
| Dell Inspiron 16 Plus 7620 | |
| Acer Swift Edge SFE16-42-R1GM | |
| AIDA64 / CPU ZLib | |
| Lenovo Slim Pro 9i 16IRP8 | |
| Lenovo Yoga Pro 9 16-IRP G8 | |
| Genomsnitt Intel Core i9-13905H (1154 - 1234, n=3) | |
| Dell Inspiron 16 Plus 7620 | |
| Asus VivoBook Pro 16 | |
| HP Envy 16 h0112nr | |
| Acer Swift Edge SFE16-42-R1GM | |
| AIDA64 / FP64 Ray-Trace | |
| Genomsnitt Intel Core i9-13905H (9483 - 10804, n=3) | |
| Lenovo Slim Pro 9i 16IRP8 | |
| Lenovo Yoga Pro 9 16-IRP G8 | |
| Asus VivoBook Pro 16 | |
| Dell Inspiron 16 Plus 7620 | |
| HP Envy 16 h0112nr | |
| Acer Swift Edge SFE16-42-R1GM | |
| AIDA64 / CPU PhotoWorxx | |
| Genomsnitt Intel Core i9-13905H (51720 - 60161, n=3) | |
| Lenovo Slim Pro 9i 16IRP8 | |
| Lenovo Yoga Pro 9 16-IRP G8 | |
| HP Envy 16 h0112nr | |
| Dell Inspiron 16 Plus 7620 | |
| Acer Swift Edge SFE16-42-R1GM | |
| Asus VivoBook Pro 16 | |
Systemets prestanda
Vi upplevde problem med att väcka från viloläge och till och med en BSOD under testningen. Ibland var skärmen tom när man försökte väcka från viloläge och då krävdes en hård omstart för att återgå till Windows.
CrossMark: Overall | Productivity | Creativity | Responsiveness
| PCMark 10 / Score | |
| Lenovo Slim Pro 9i 16IRP8 | |
| HP Envy 16 h0112nr | |
| Lenovo Yoga Pro 9 16-IRP G8 | |
| Dell Inspiron 16 Plus 7620 | |
| Asus VivoBook Pro 16 | |
| Acer Swift Edge SFE16-42-R1GM | |
| PCMark 10 / Essentials | |
| HP Envy 16 h0112nr | |
| Lenovo Slim Pro 9i 16IRP8 | |
| Lenovo Yoga Pro 9 16-IRP G8 | |
| Dell Inspiron 16 Plus 7620 | |
| Asus VivoBook Pro 16 | |
| Acer Swift Edge SFE16-42-R1GM | |
| PCMark 10 / Productivity | |
| Lenovo Slim Pro 9i 16IRP8 | |
| HP Envy 16 h0112nr | |
| Acer Swift Edge SFE16-42-R1GM | |
| Dell Inspiron 16 Plus 7620 | |
| Asus VivoBook Pro 16 | |
| Lenovo Yoga Pro 9 16-IRP G8 | |
| PCMark 10 / Digital Content Creation | |
| Lenovo Slim Pro 9i 16IRP8 | |
| Lenovo Yoga Pro 9 16-IRP G8 | |
| HP Envy 16 h0112nr | |
| Dell Inspiron 16 Plus 7620 | |
| Asus VivoBook Pro 16 | |
| Acer Swift Edge SFE16-42-R1GM | |
| CrossMark / Overall | |
| Lenovo Yoga Pro 9 16-IRP G8 | |
| HP Envy 16 h0112nr | |
| Lenovo Slim Pro 9i 16IRP8 | |
| Dell Inspiron 16 Plus 7620 | |
| Asus VivoBook Pro 16 | |
| Acer Swift Edge SFE16-42-R1GM | |
| CrossMark / Productivity | |
| HP Envy 16 h0112nr | |
| Lenovo Yoga Pro 9 16-IRP G8 | |
| Asus VivoBook Pro 16 | |
| Dell Inspiron 16 Plus 7620 | |
| Lenovo Slim Pro 9i 16IRP8 | |
| Acer Swift Edge SFE16-42-R1GM | |
| CrossMark / Creativity | |
| Lenovo Yoga Pro 9 16-IRP G8 | |
| Lenovo Slim Pro 9i 16IRP8 | |
| HP Envy 16 h0112nr | |
| Dell Inspiron 16 Plus 7620 | |
| Asus VivoBook Pro 16 | |
| Acer Swift Edge SFE16-42-R1GM | |
| CrossMark / Responsiveness | |
| Asus VivoBook Pro 16 | |
| HP Envy 16 h0112nr | |
| Lenovo Yoga Pro 9 16-IRP G8 | |
| Dell Inspiron 16 Plus 7620 | |
| Lenovo Slim Pro 9i 16IRP8 | |
| Acer Swift Edge SFE16-42-R1GM | |
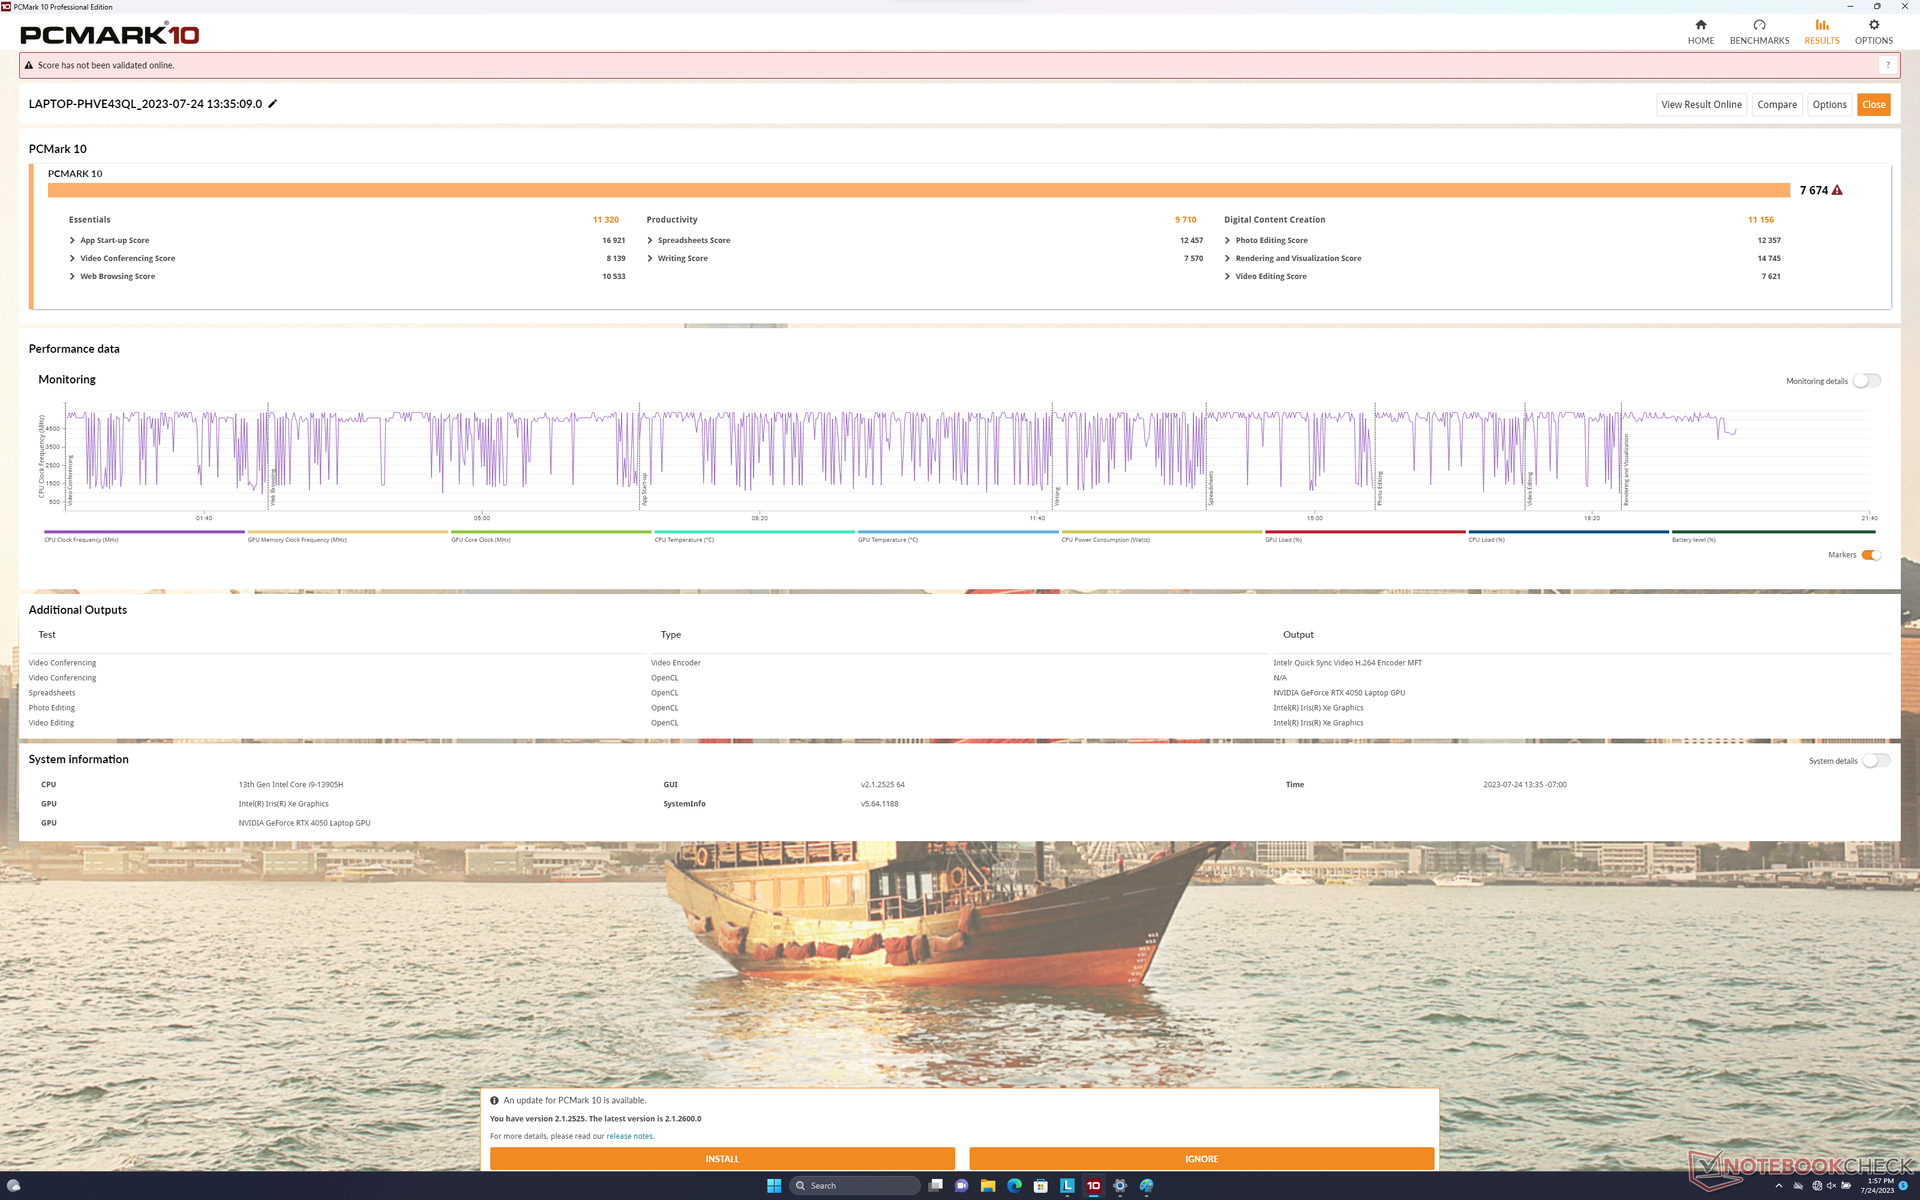
| PCMark 10 Score | 7674 poäng | |
Hjälp | ||
| AIDA64 / Memory Copy | |
| Genomsnitt Intel Core i9-13905H (76905 - 88014, n=3) | |
| Lenovo Slim Pro 9i 16IRP8 | |
| Lenovo Yoga Pro 9 16-IRP G8 | |
| HP Envy 16 h0112nr | |
| Dell Inspiron 16 Plus 7620 | |
| Acer Swift Edge SFE16-42-R1GM | |
| Asus VivoBook Pro 16 | |
| AIDA64 / Memory Read | |
| Lenovo Yoga Pro 9 16-IRP G8 | |
| Genomsnitt Intel Core i9-13905H (68837 - 79123, n=3) | |
| Lenovo Slim Pro 9i 16IRP8 | |
| HP Envy 16 h0112nr | |
| Dell Inspiron 16 Plus 7620 | |
| Acer Swift Edge SFE16-42-R1GM | |
| Asus VivoBook Pro 16 | |
| AIDA64 / Memory Write | |
| Lenovo Yoga Pro 9 16-IRP G8 | |
| Genomsnitt Intel Core i9-13905H (89545 - 103259, n=3) | |
| Lenovo Slim Pro 9i 16IRP8 | |
| HP Envy 16 h0112nr | |
| Dell Inspiron 16 Plus 7620 | |
| Acer Swift Edge SFE16-42-R1GM | |
| Asus VivoBook Pro 16 | |
| AIDA64 / Memory Latency | |
| Lenovo Yoga Pro 9 16-IRP G8 | |
| Genomsnitt Intel Core i9-13905H (101.4 - 134.8, n=3) | |
| Lenovo Slim Pro 9i 16IRP8 | |
| Acer Swift Edge SFE16-42-R1GM | |
| Dell Inspiron 16 Plus 7620 | |
| HP Envy 16 h0112nr | |
| Asus VivoBook Pro 16 | |
* ... mindre är bättre
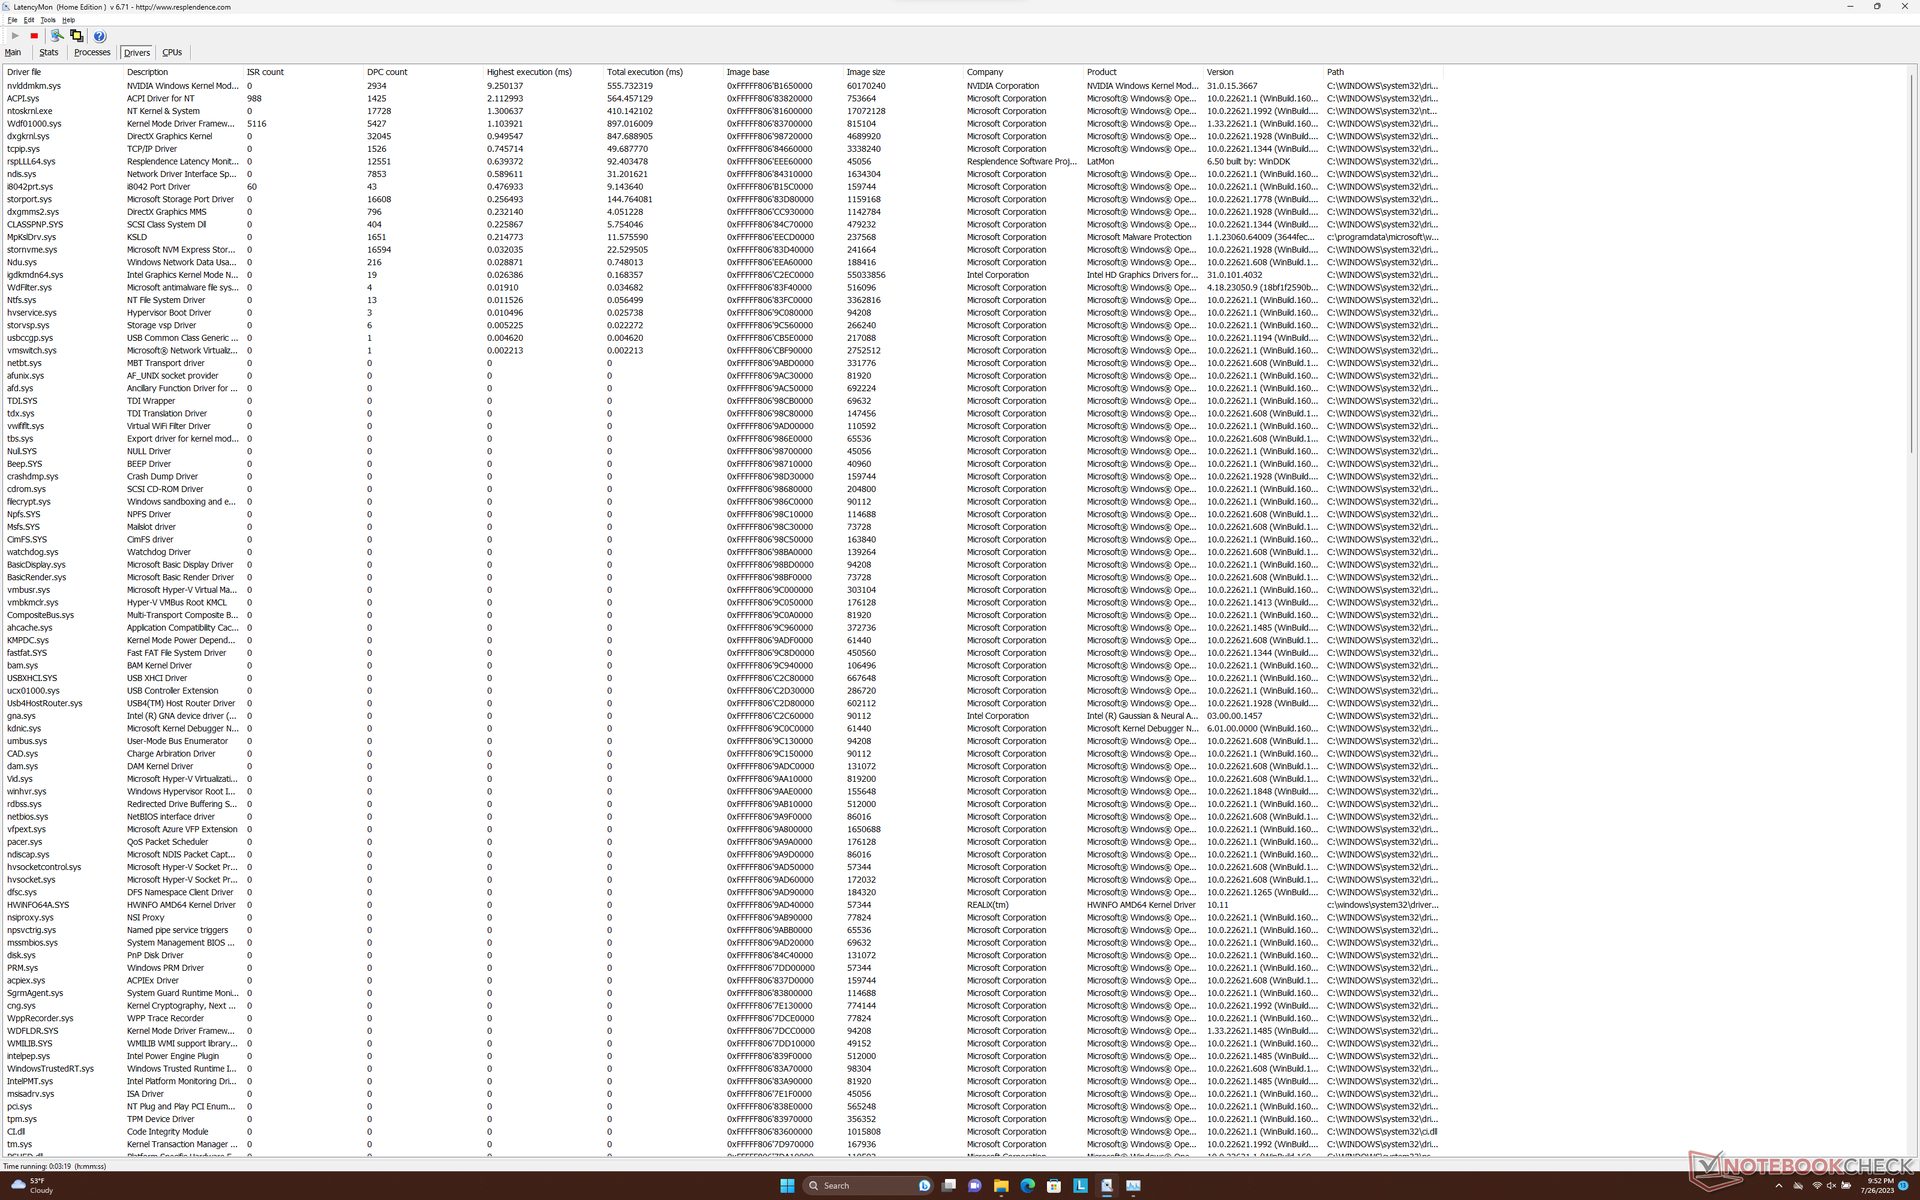
DPC-fördröjning
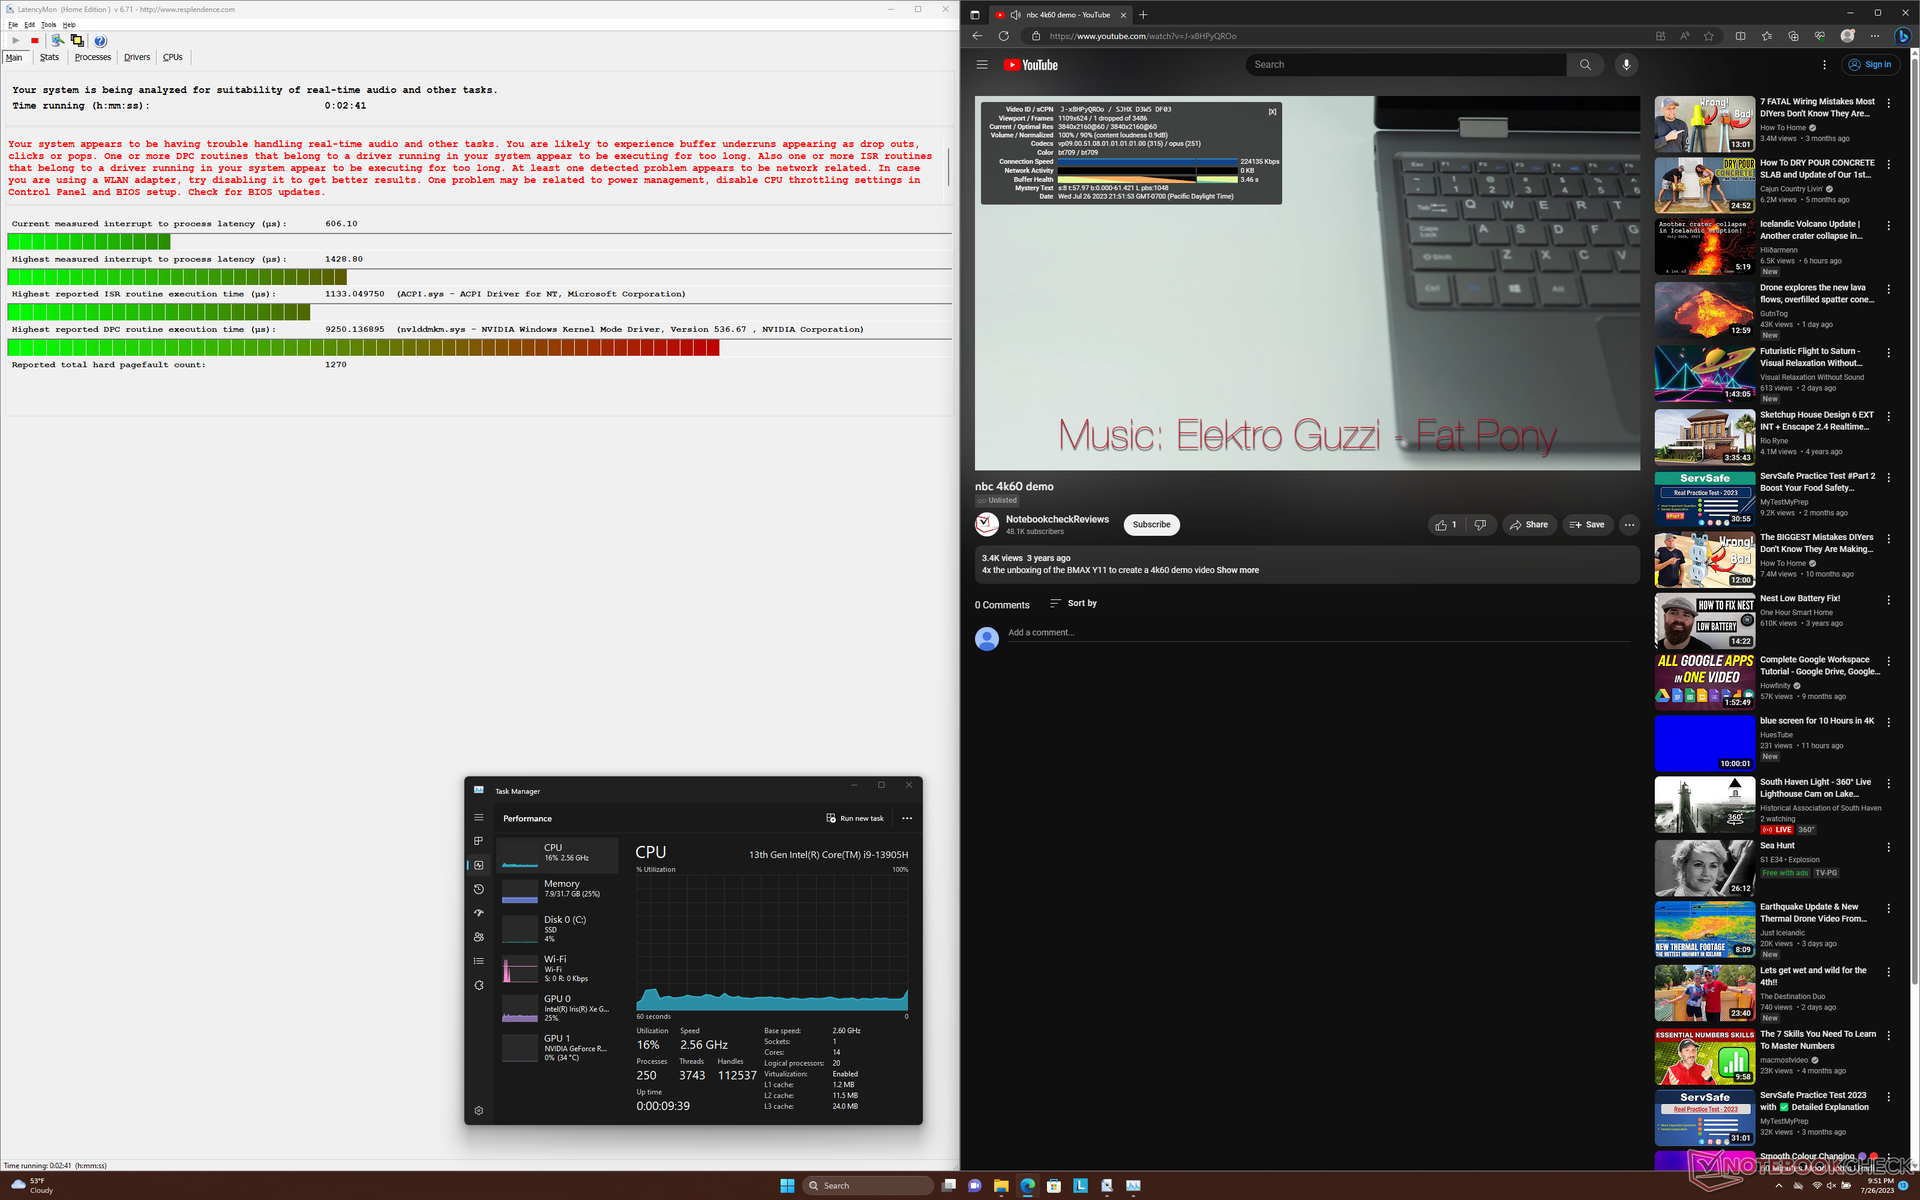
LatencyMon avslöjar DPC-problem när flera webbläsarflikar öppnas på vår hemsida. uppspelning av 4K-video vid 60 FPS är annars utmärkt med bara en tappad bildruta under en 60-sekunders tidsram.
| DPC Latencies / LatencyMon - interrupt to process latency (max), Web, Youtube, Prime95 | |
| Lenovo Yoga Pro 9 16-IRP G8 | |
| Acer Swift Edge SFE16-42-R1GM | |
| Asus VivoBook Pro 16 | |
| Lenovo Slim Pro 9i 16IRP8 | |
| Dell Inspiron 16 Plus 7620 | |
| HP Envy 16 h0112nr | |
* ... mindre är bättre
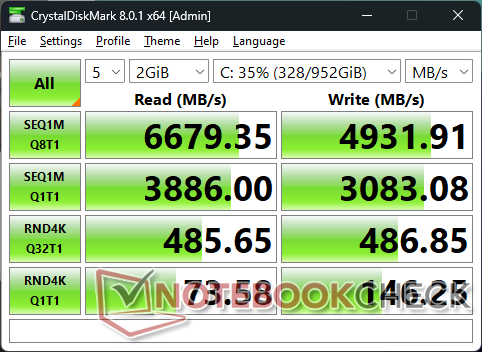
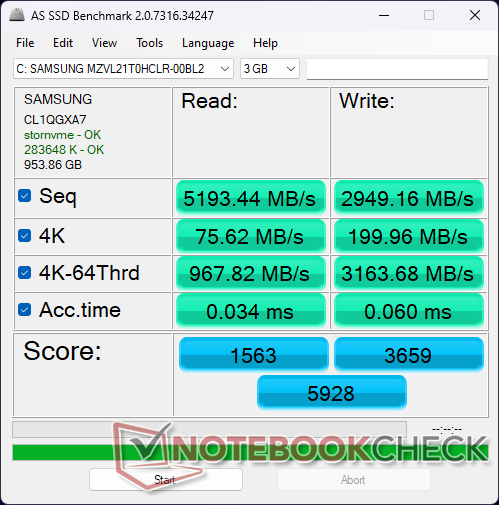
Lagringsenheter

| Drive Performance rating - Percent | |
| Acer Swift Edge SFE16-42-R1GM | |
| Lenovo Yoga Pro 9 16-IRP G8 | |
| Lenovo Slim Pro 9i 16IRP8 | |
| HP Envy 16 h0112nr | |
| Asus VivoBook Pro 16 | |
| Dell Inspiron 16 Plus 7620 | |
* ... mindre är bättre
Disk Throttling: DiskSpd Read Loop, Queue Depth 8
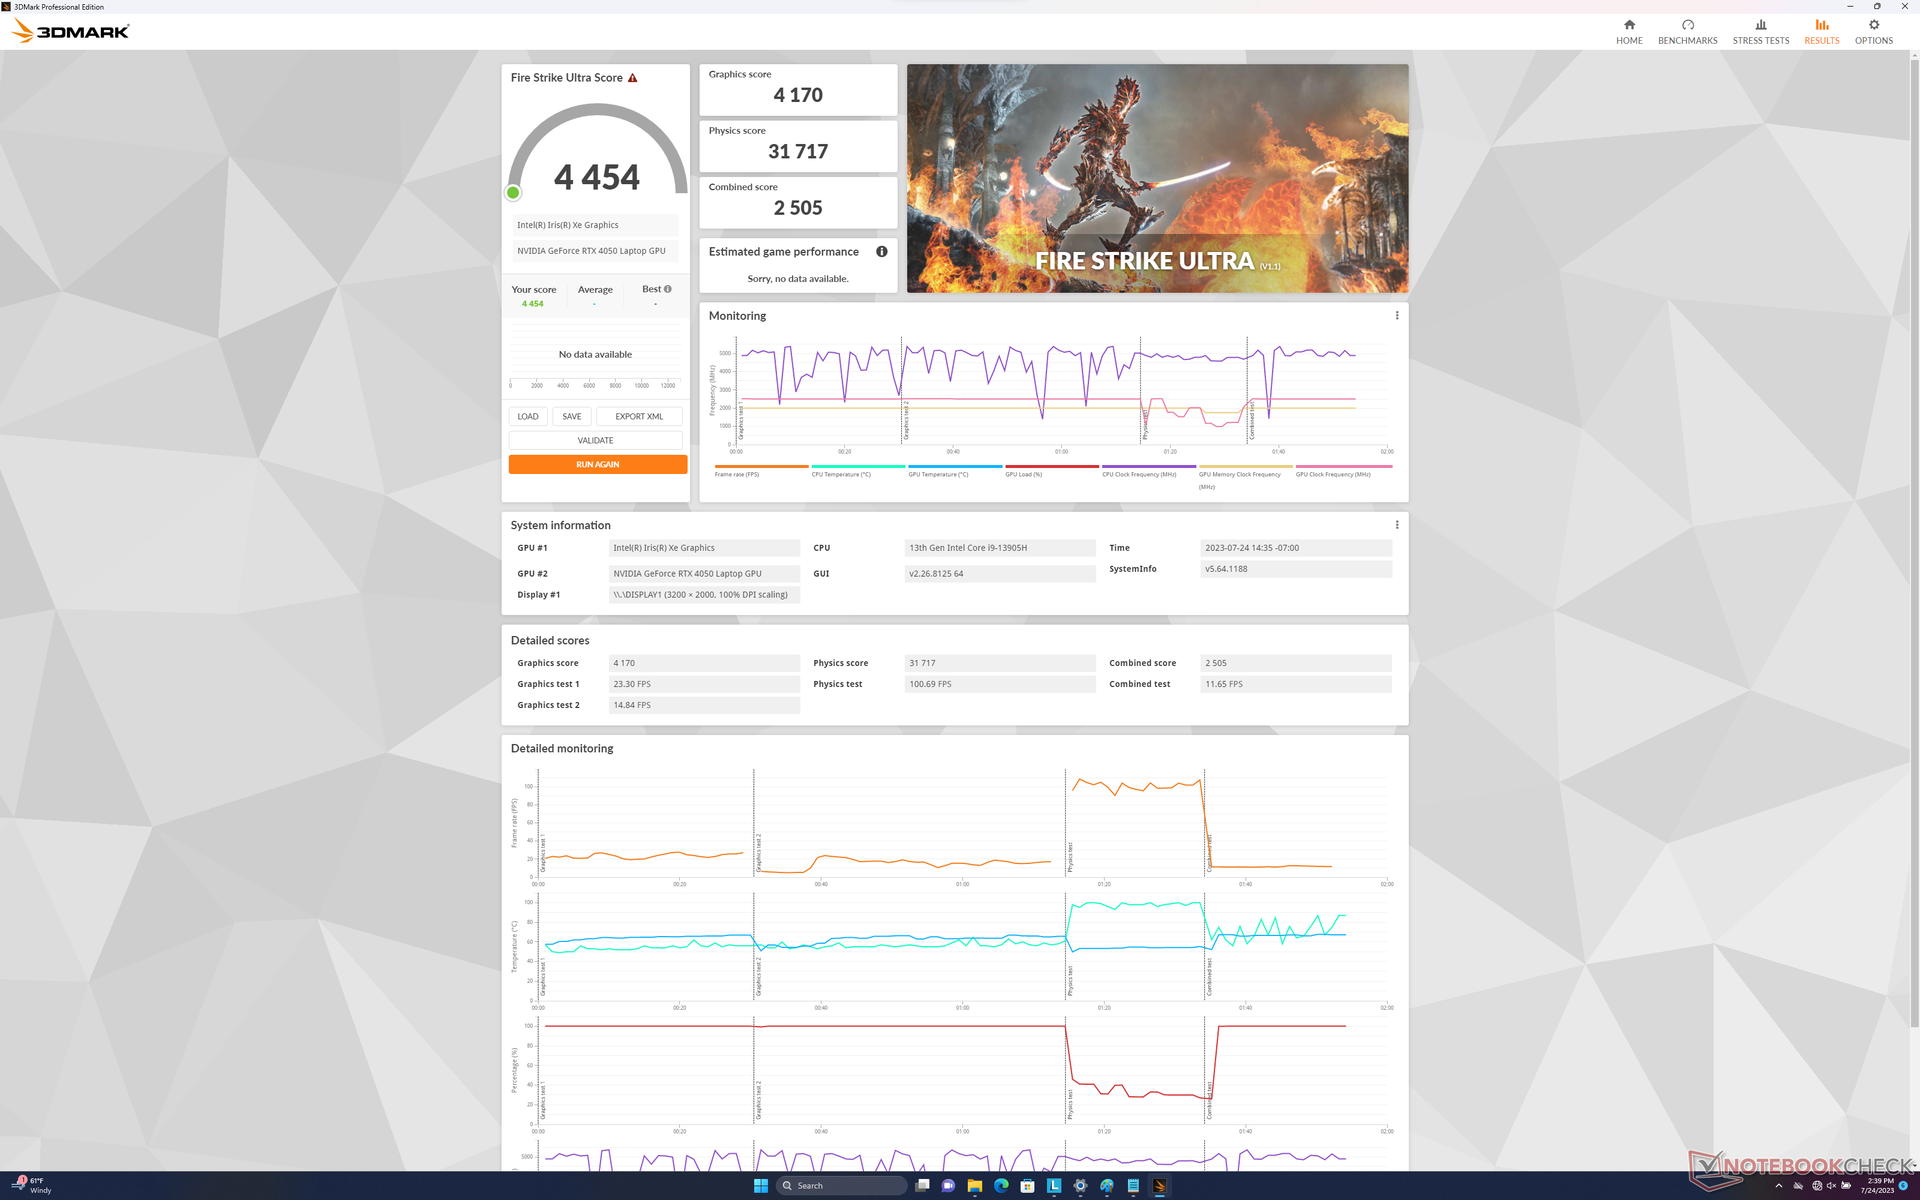
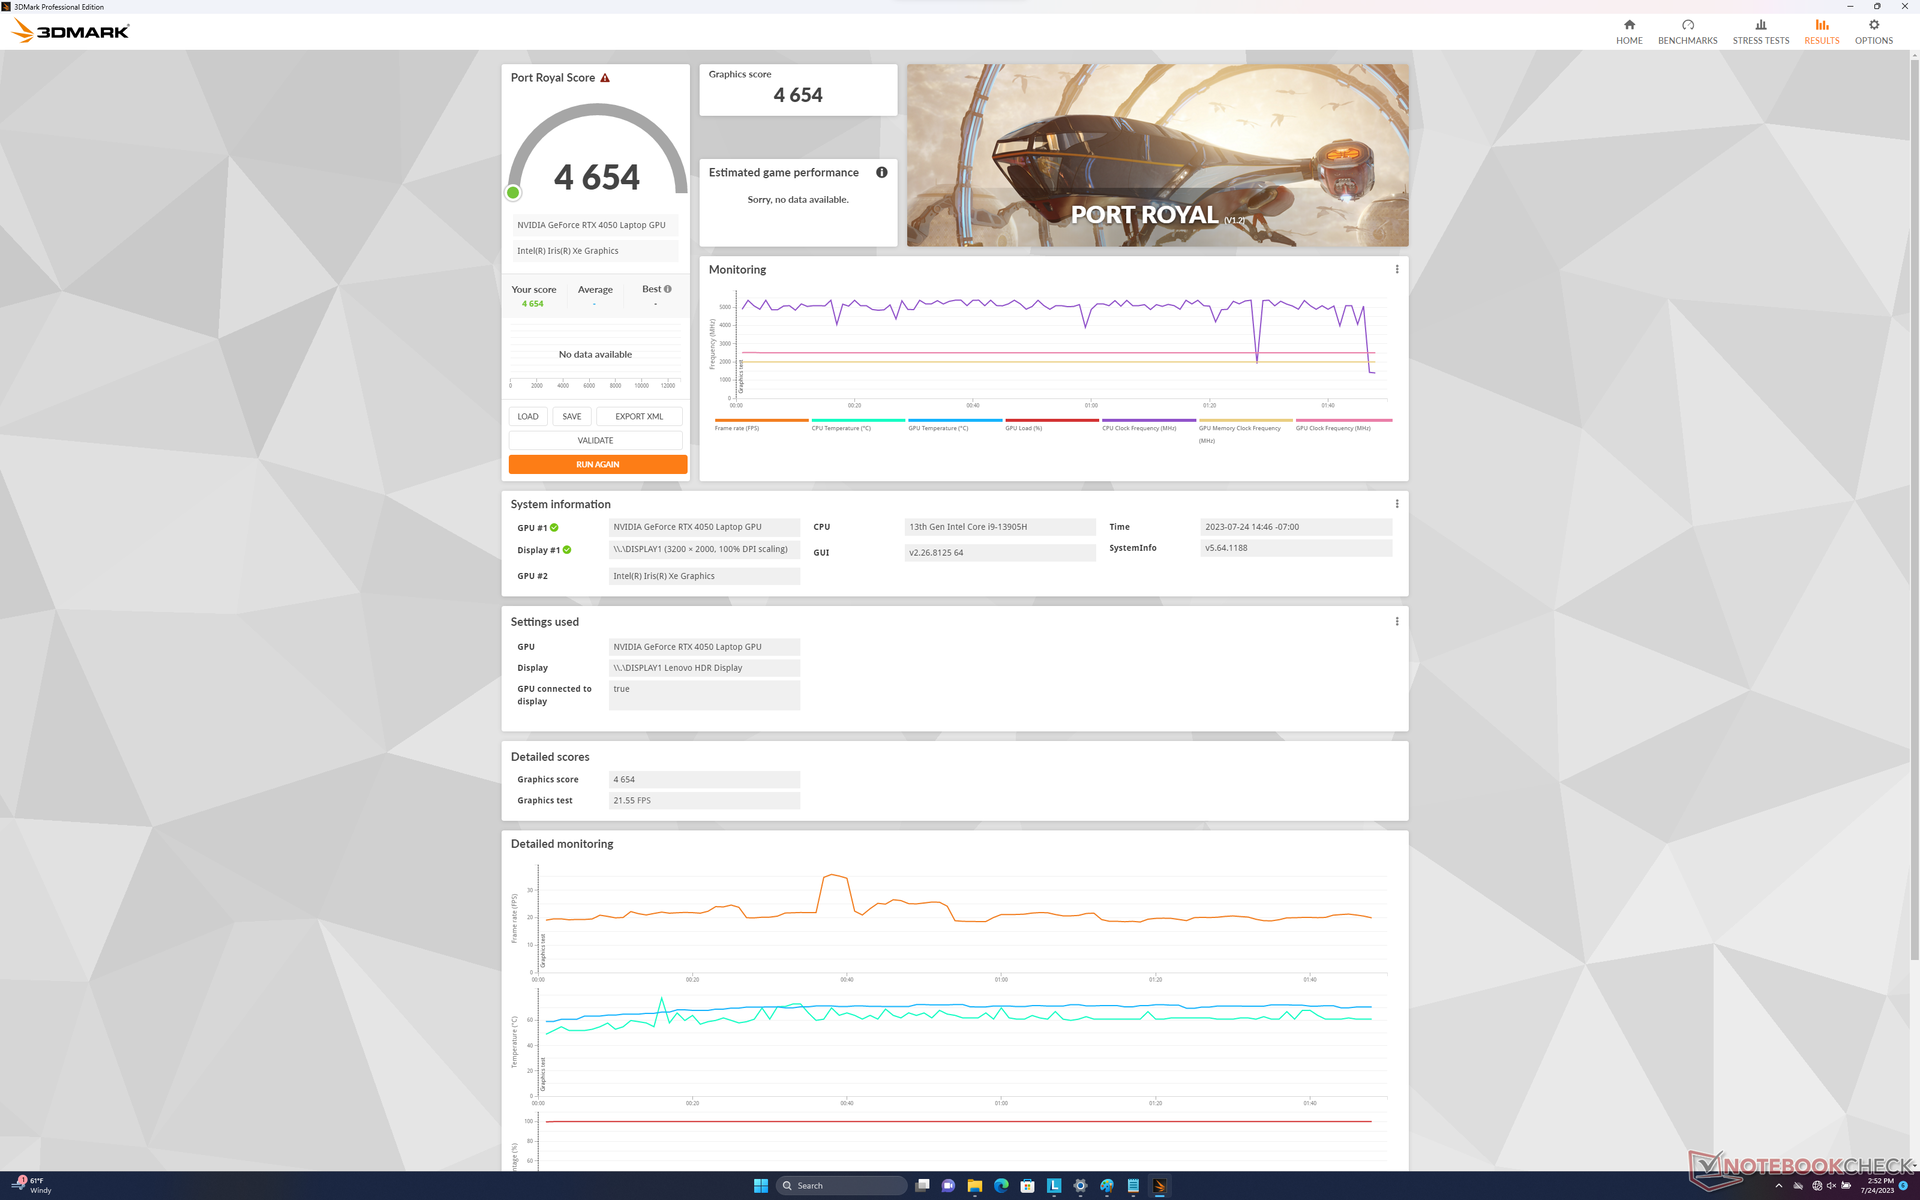
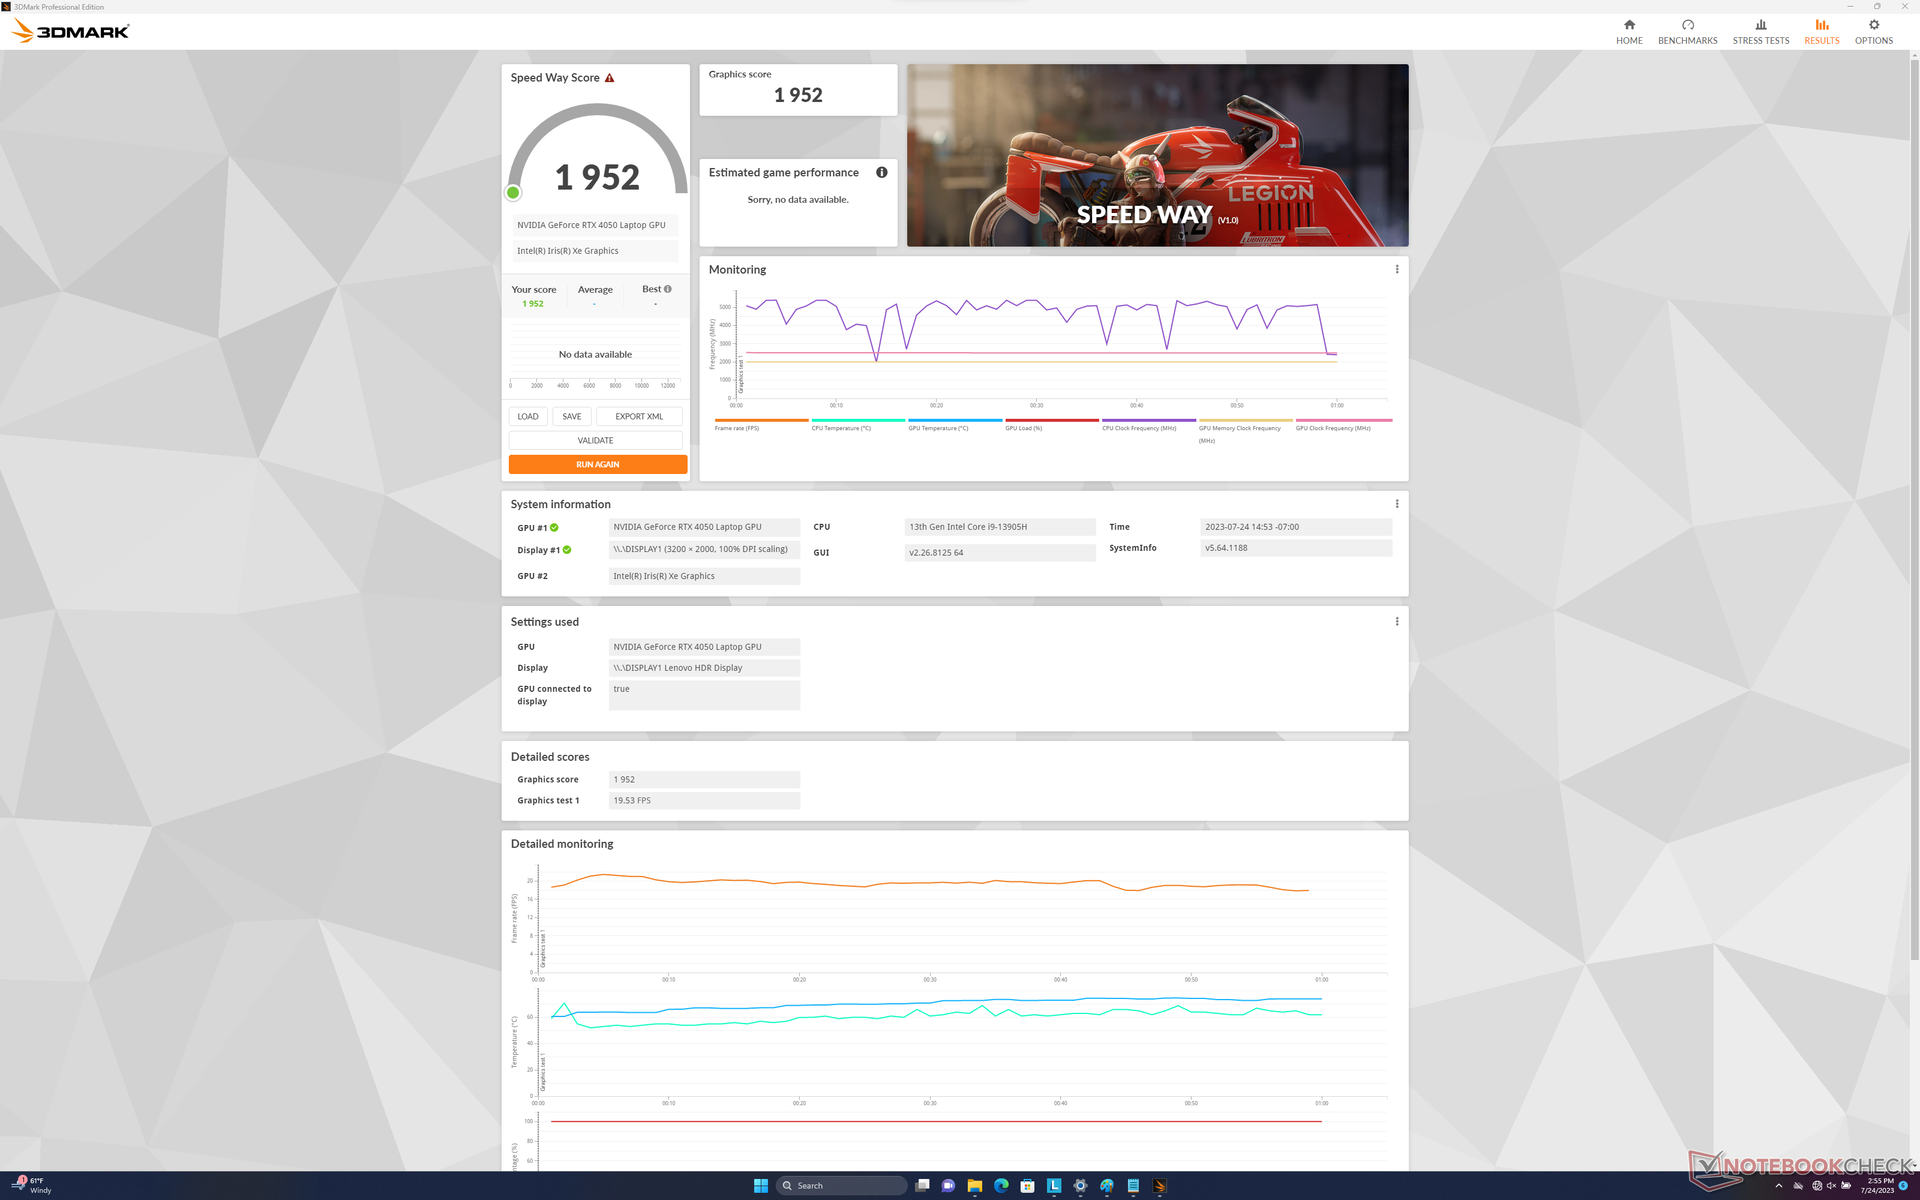
GPU-prestanda
Den mobila GeForce RTX 4050 är en betydande uppgradering jämfört med förra årets besvikelse mobila RTX 3050 serien. Den råa grafikprestandan är cirka 50 till 60 procent snabbare än RTX 3050 Ti för att vara i nivå med mobila RTX 3060.
Uppgradering till RTX 4060 förväntas öka prestandan med cirka 20 procent.
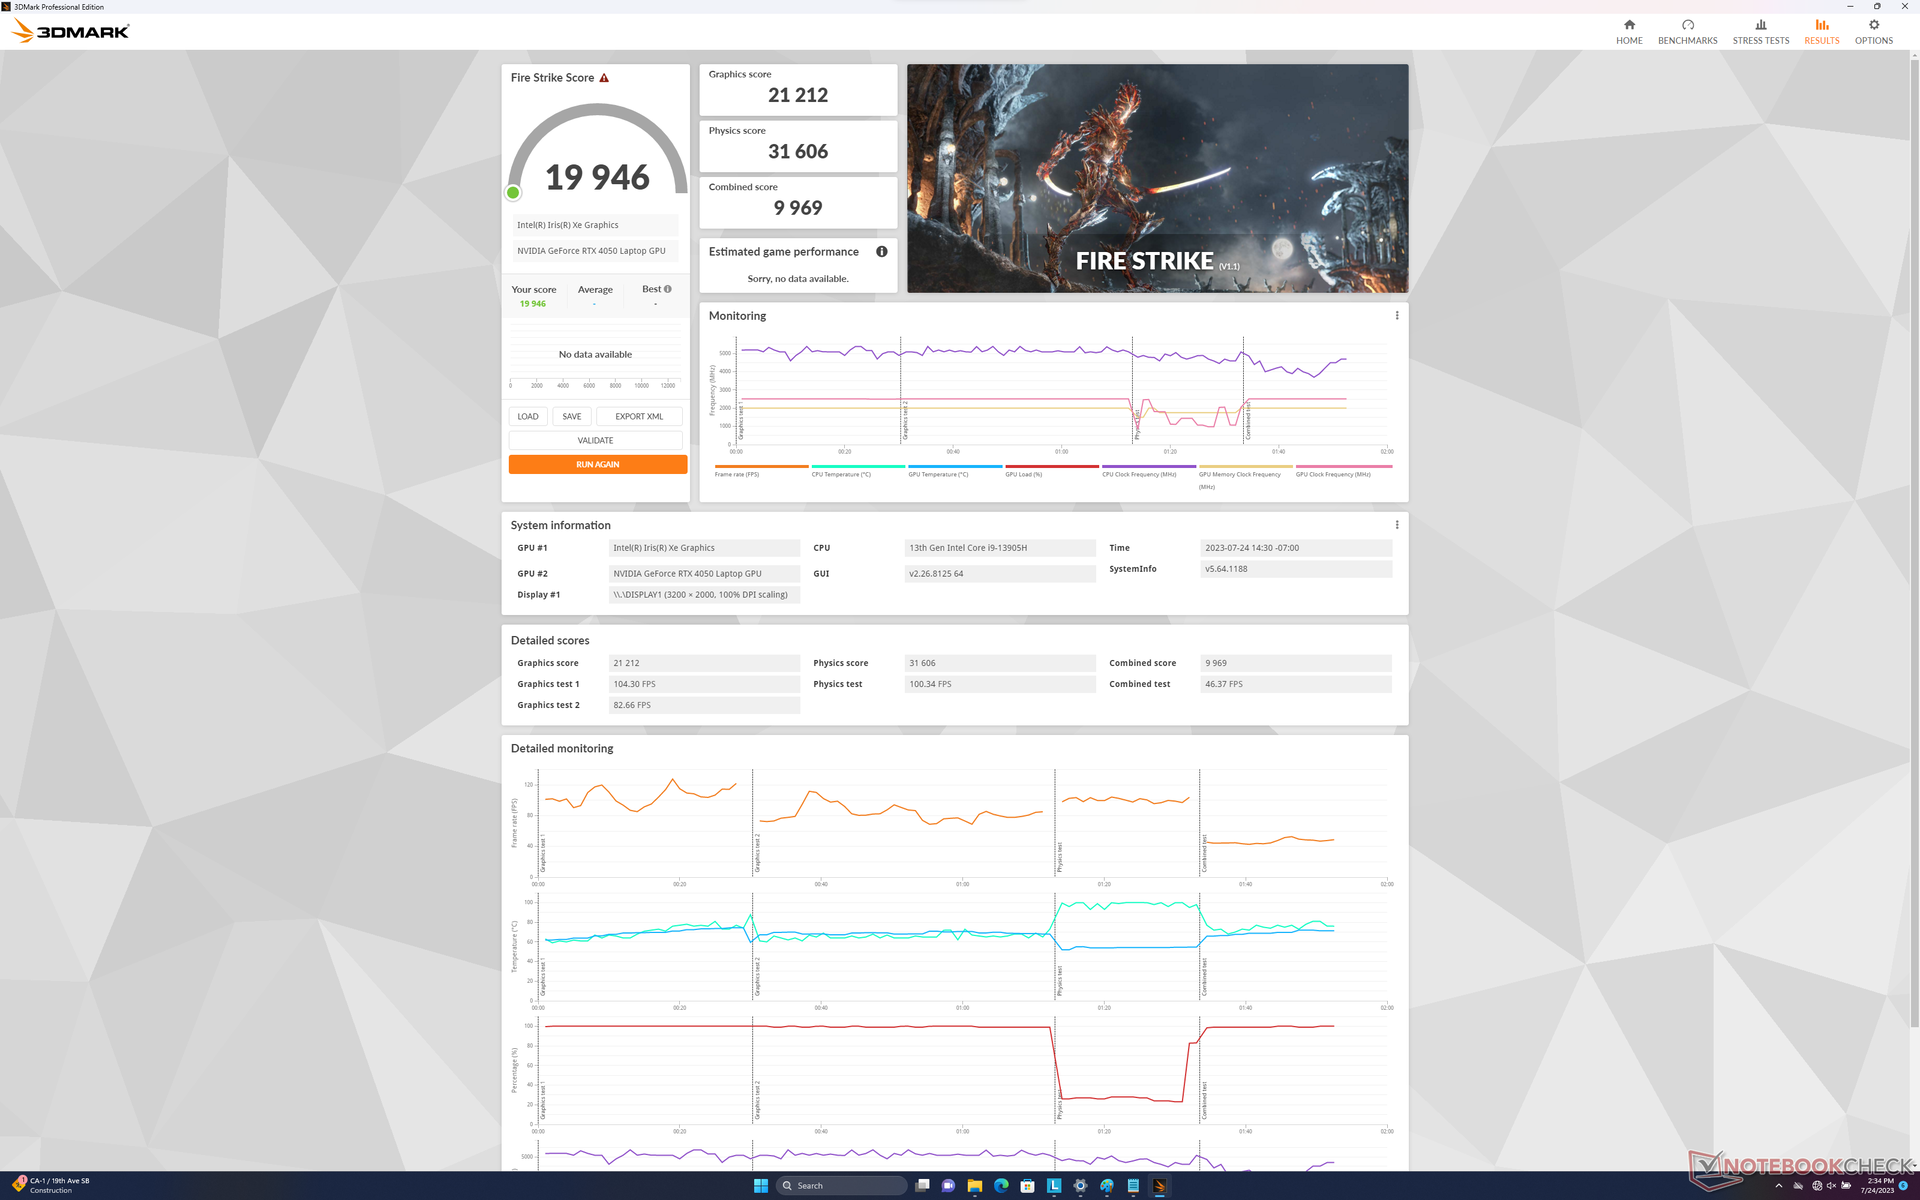
Att köra i läget Balanserat istället för Prestanda påverkar prestandan något, vilket framgår av våra resultat på Fire Strike i tabellen nedan.
| Kraftprofil | Fire Strike Fysikresultat | Poäng för grafik | Kombinerat resultat |
| Batteri | 30199 (-4%) | 12900 (-39%) | 5642 (-43%) |
| Balanserad | 28925 (-8%) | 20047 (-6%) | 7581 (-24%) |
| Prestation | 31606 | 21212 | 9969 |

| 3DMark Performance rating - Percent | |
| MSI GeForce RTX 4060 Ti Gaming X Trio 8G -2! | |
| Lenovo Legion Pro 5 16ARX8 | |
| Lenovo Legion 5 Pro 16ARH7H RTX 3070 Ti -2! | |
| Lenovo Yoga Pro 9 16-IRP G8 | |
| Lenovo Slim Pro 9i 16IRP8 | |
| Genomsnitt NVIDIA GeForce RTX 4050 Laptop GPU | |
| Asus ZenBook Pro 16X OLED UX7602ZM-ME115W -2! | |
| Dell Inspiron 16 Plus 7620 -2! | |
| MSI Stealth 15M A11SEK -2! | |
| Lenovo IdeaPad 5 Pro 16ACH -2! | |
| Acer Swift Edge SFE16-42-R1GM -2! | |
| 3DMark 11 Performance | 28168 poäng | |
| 3DMark Fire Strike Score | 19946 poäng | |
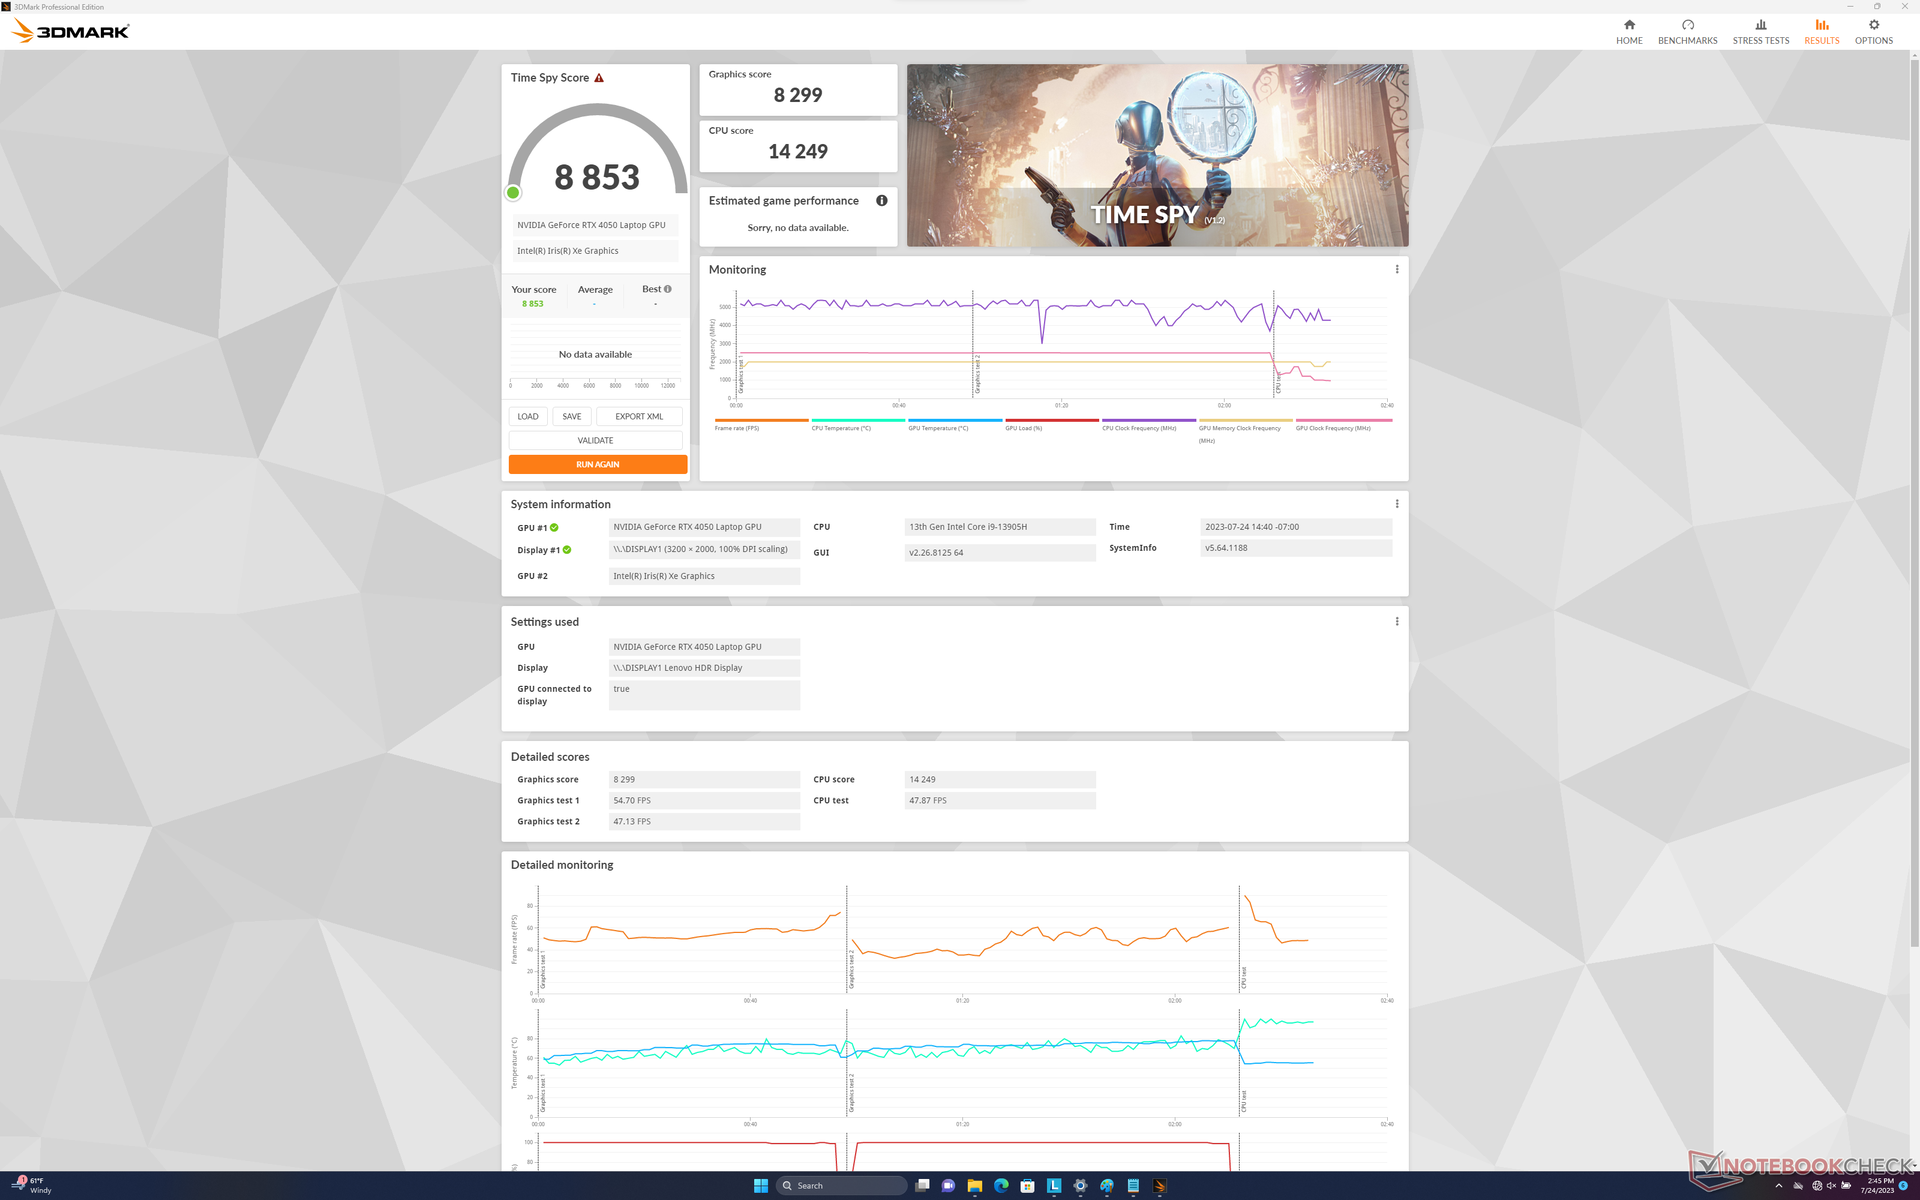
| 3DMark Time Spy Score | 8853 poäng | |
Hjälp | ||
* ... mindre är bättre
Spelprestanda
Även om systemet tekniskt sett inte är en spelmaskin är det mer än kapabelt att spela de senaste titlarna även med den inbyggda QHD+-upplösningen. Nyare och mer krävande titlar som Returnal kan köras med maximala inställningar, men DLSS rekommenderas för mer acceptabla bildhastigheter.
G-Sync stöds tyvärr inte på den interna skärmen.
Witcher 3 FPS Chart
| låg | med. | hög | ultra | QHD | |
|---|---|---|---|---|---|
| GTA V (2015) | 183.7 | 180.6 | 167.8 | 96.8 | 67.5 |
| The Witcher 3 (2015) | 410.2 | 271.1 | 164.7 | 84.9 | 59.2 |
| Dota 2 Reborn (2015) | 180 | 162.5 | 155 | 138.6 | |
| Final Fantasy XV Benchmark (2018) | 186.9 | 118.6 | 83.5 | 60 | |
| X-Plane 11.11 (2018) | 153 | 130.6 | 103.2 | ||
| Strange Brigade (2018) | 429 | 202 | 164.7 | 144.1 | 96.3 |
| Cyberpunk 2077 1.6 (2022) | 121.3 | 105.9 | 78.7 | 64.1 | 38.5 |
| Tiny Tina's Wonderlands (2022) | 183.3 | 142.8 | 91.5 | 70.2 | 47.7 |
| F1 22 (2022) | 214 | 199.8 | 150.8 | 52.6 | 32.3 |
| Returnal (2023) | 64 | 63 | 59 | 52 | 34 |
Utsläpp
Buller från systemet
Fläktljudet tenderar att ligga på tysta 25 till 27 dB(A) mot en tyst bakgrund på 22,7 dB(A) när man kör enkla belastningar som webbläsare eller videoströmmar. När högre belastningar som spel introduceras ökar dock fläktarna stadigt tills de når ett maximum på 52,6 dB(A) för att vara lika högljudda som många bärbara speldatorer.
Det är värt att notera att fläktljudet minskar avsevärt till bara 44,2 dB(A) när du kör spel i balanserat läge istället för prestandaläget. Det lägre fläktljudet kan därför vara värt den något lägre prestandan beroende på användarens preferenser.
Ljudnivå
| Låg belastning |
| 22.7 / 22.7 / 27.5 dB(A) |
| Hög belastning |
| 28.9 / 52.5 dB(A) |
 | ||
30 dB tyst 40 dB(A) hörbar 50 dB(A) högt ljud |
||
min: | ||
| Lenovo Slim Pro 9i 16IRP8 GeForce RTX 4050 Laptop GPU, i9-13905H, Samsung PM9A1 MZVL21T0HCLR | Lenovo Yoga Pro 9 16-IRP G8 GeForce RTX 4060 Laptop GPU, i7-13705H, Samsung PM9A1 MZVL21T0HCLR | Asus VivoBook Pro 16 GeForce RTX 3050 Ti Laptop GPU, i7-12700H, Intel SSD 670p SSDPEKNU010TZ | Acer Swift Edge SFE16-42-R1GM Radeon 680M, R7 7735U, Micron 3400 1TB MTFDKBA1T0TFH | Dell Inspiron 16 Plus 7620 GeForce RTX 3050 Ti Laptop GPU, i7-12700H, Kioxia BG5 KBG50ZNS512G | HP Envy 16 h0112nr GeForce RTX 3060 Laptop GPU, i7-12700H, Micron 3400 1TB MTFDKBA1T0TFH | |
|---|---|---|---|---|---|---|
| Noise | -10% | -22% | -13% | -13% | -7% | |
| av / miljö * (dB) | 22.7 | 24.7 -9% | 25.2 -11% | 25.7 -13% | 23.3 -3% | 22.8 -0% |
| Idle Minimum * (dB) | 22.7 | 24.7 -9% | 25.2 -11% | 25.7 -13% | 25.7 -13% | 22.9 -1% |
| Idle Average * (dB) | 22.7 | 26.2 -15% | 25.2 -11% | 27 -19% | 26.1 -15% | 22.9 -1% |
| Idle Maximum * (dB) | 27.5 | 26.2 5% | 25.2 8% | 29.3 -7% | 30.6 -11% | 30.5 -11% |
| Load Average * (dB) | 28.9 | 39.7 -37% | 55.1 -91% | 42.3 -46% | 46.2 -60% | 41.4 -43% |
| Witcher 3 ultra * (dB) | 52.6 | 53.2 -1% | 49.2 6% | 51.1 3% | ||
| Load Maximum * (dB) | 52.5 | 53.2 -1% | 61.5 -17% | 42.7 19% | 49.4 6% | 51.4 2% |
* ... mindre är bättre
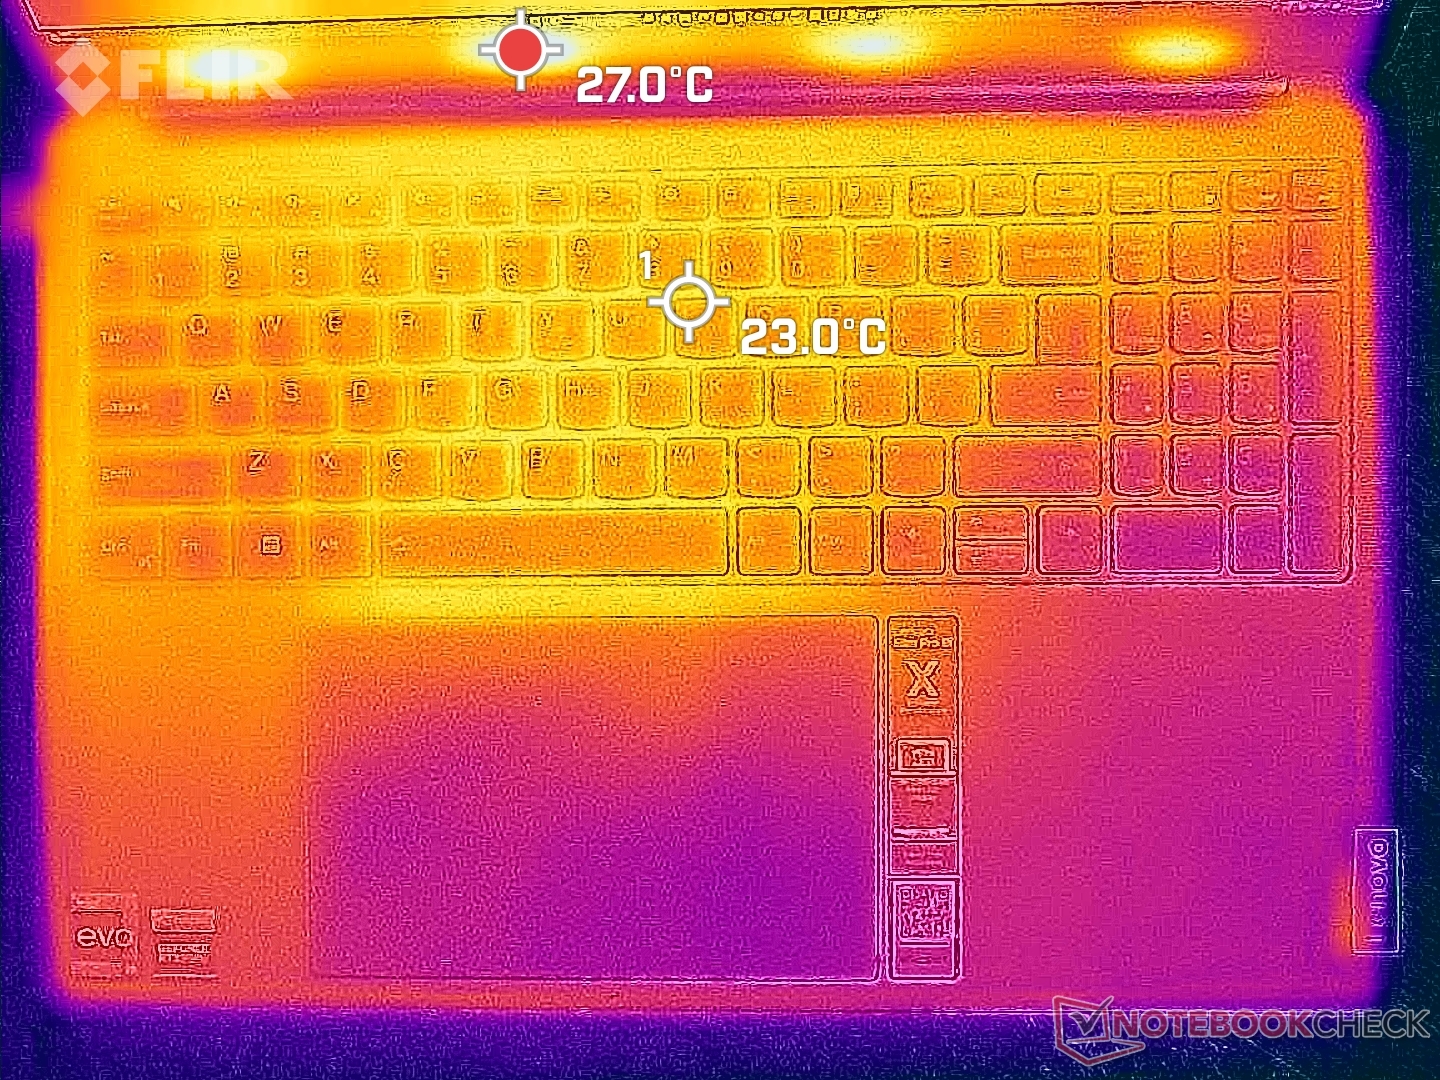
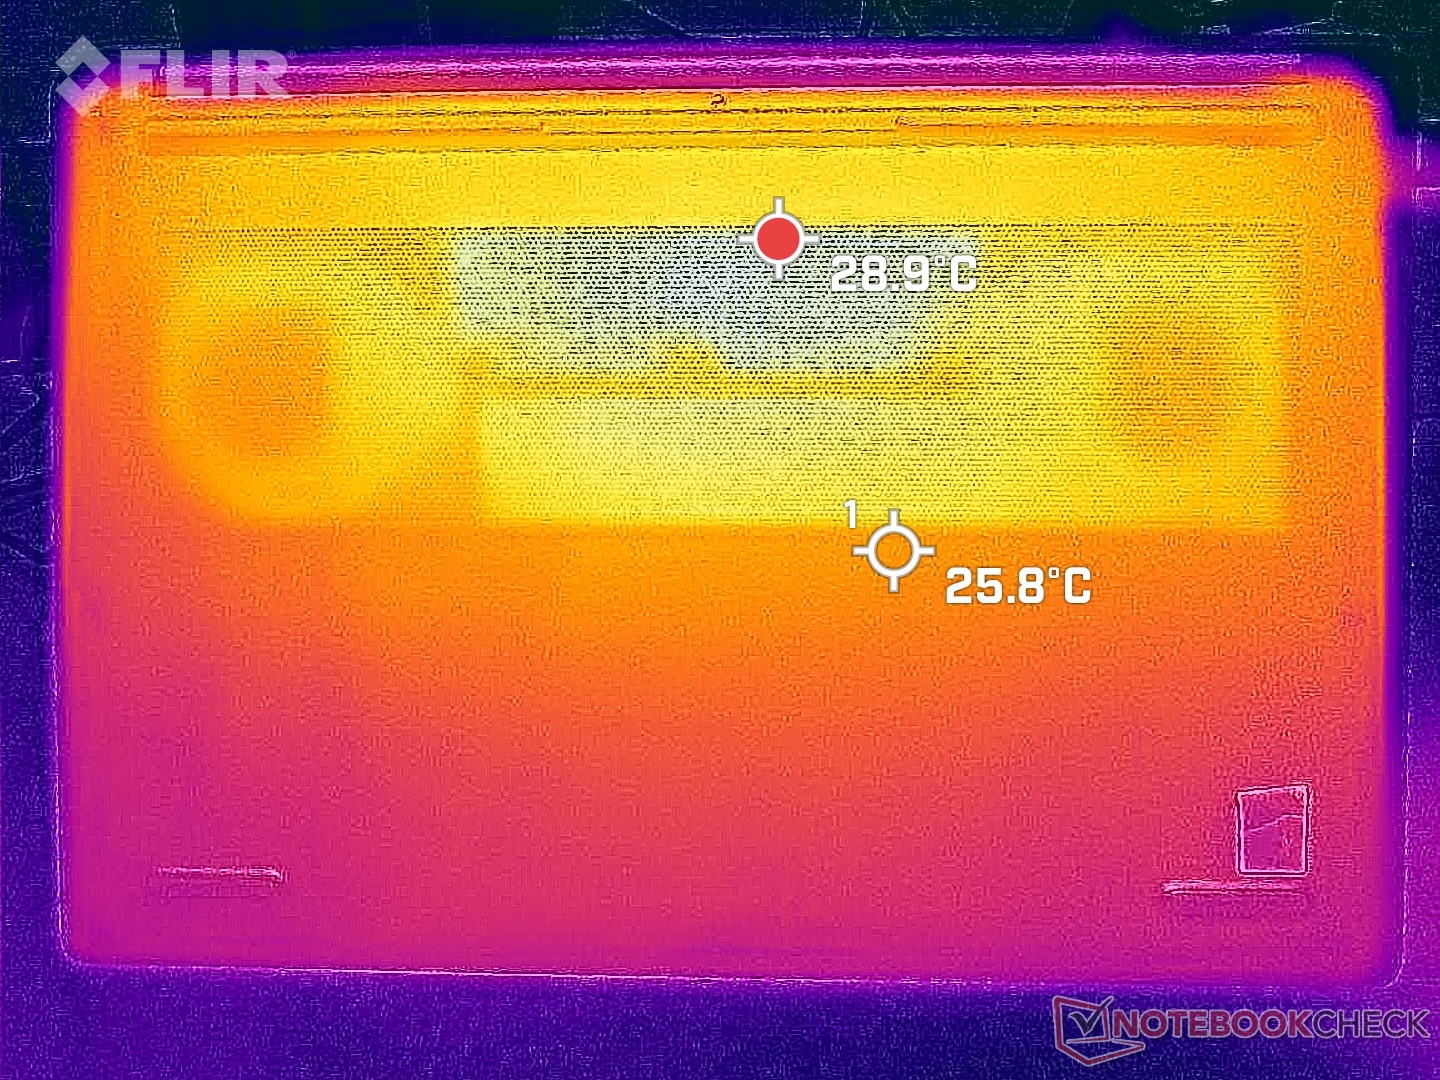
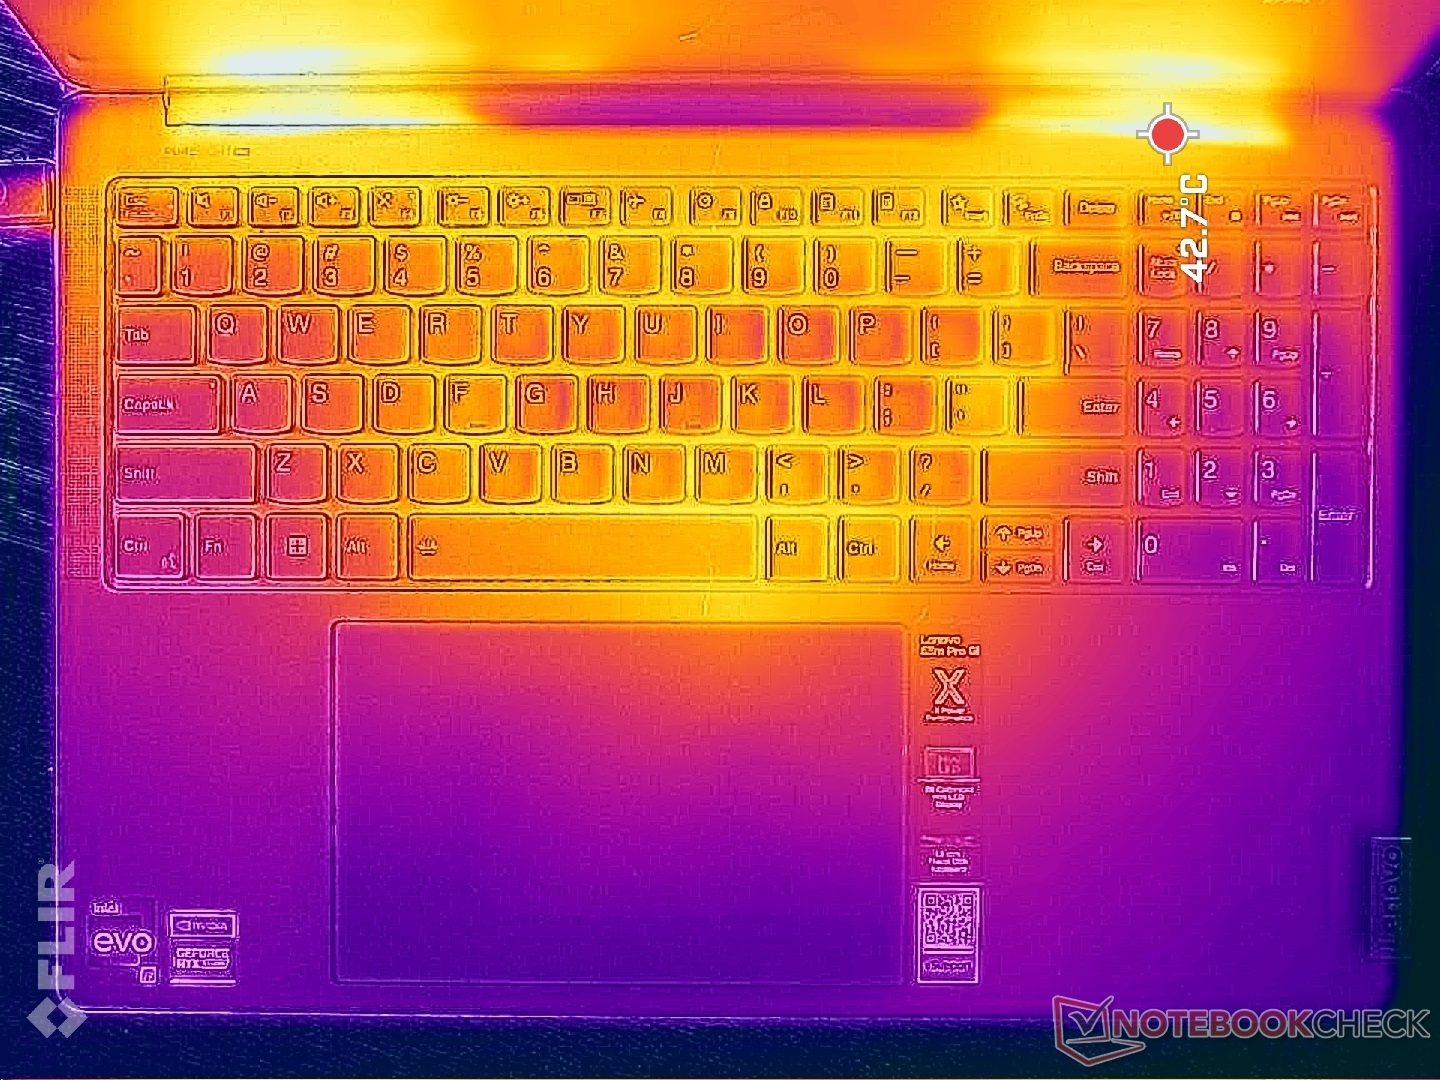
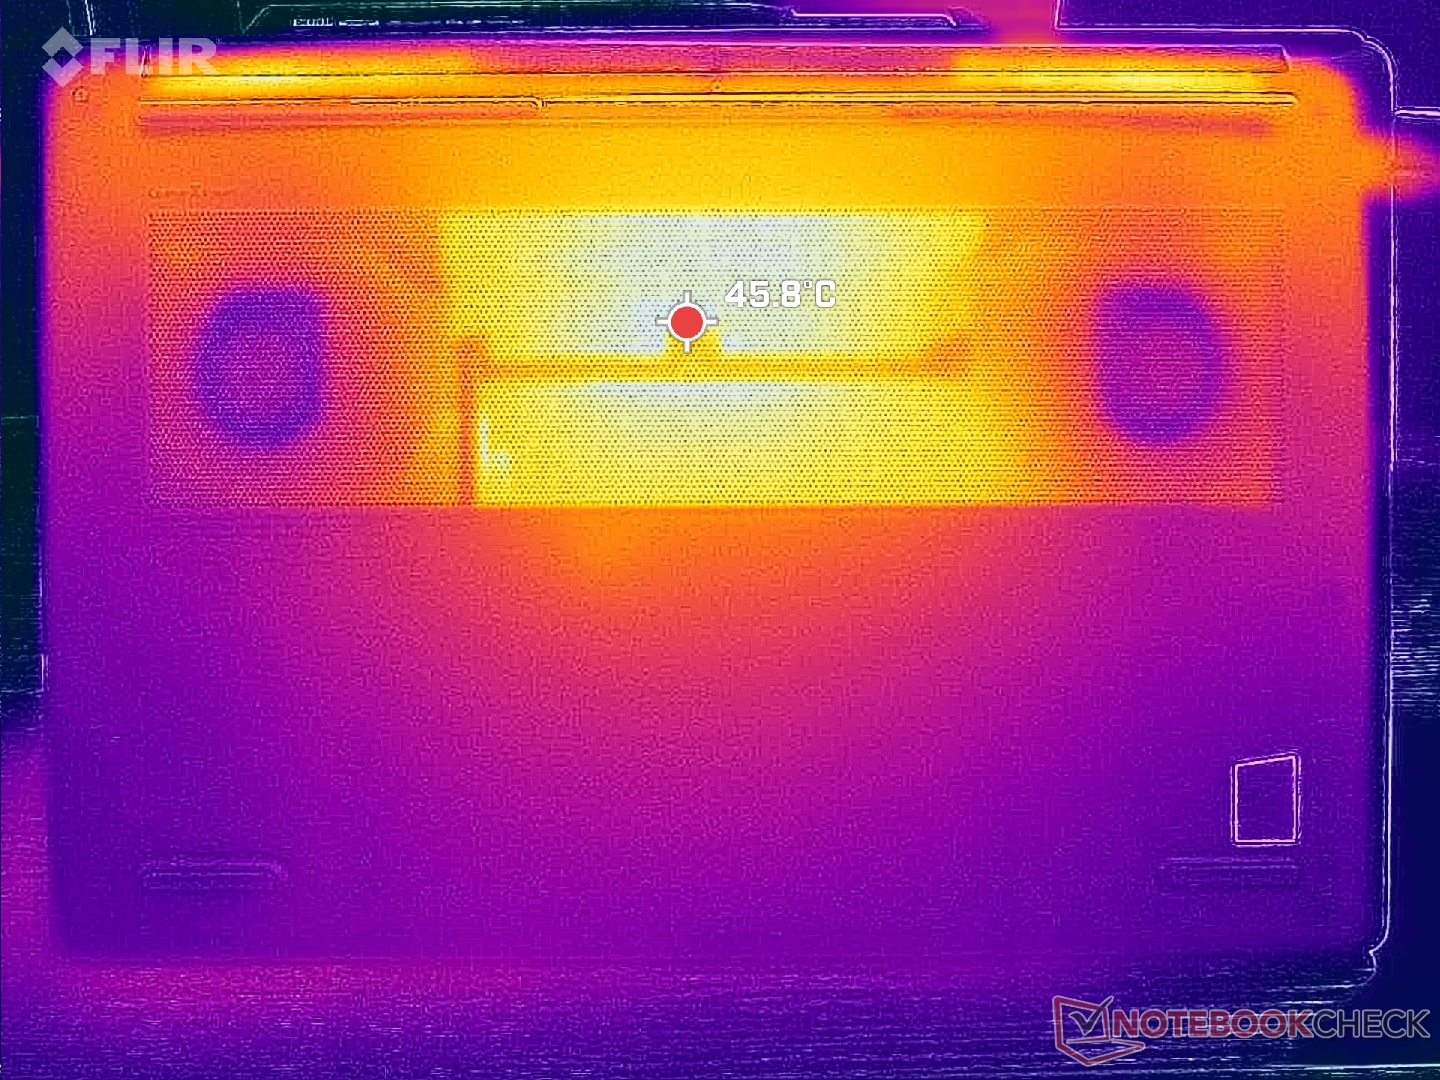
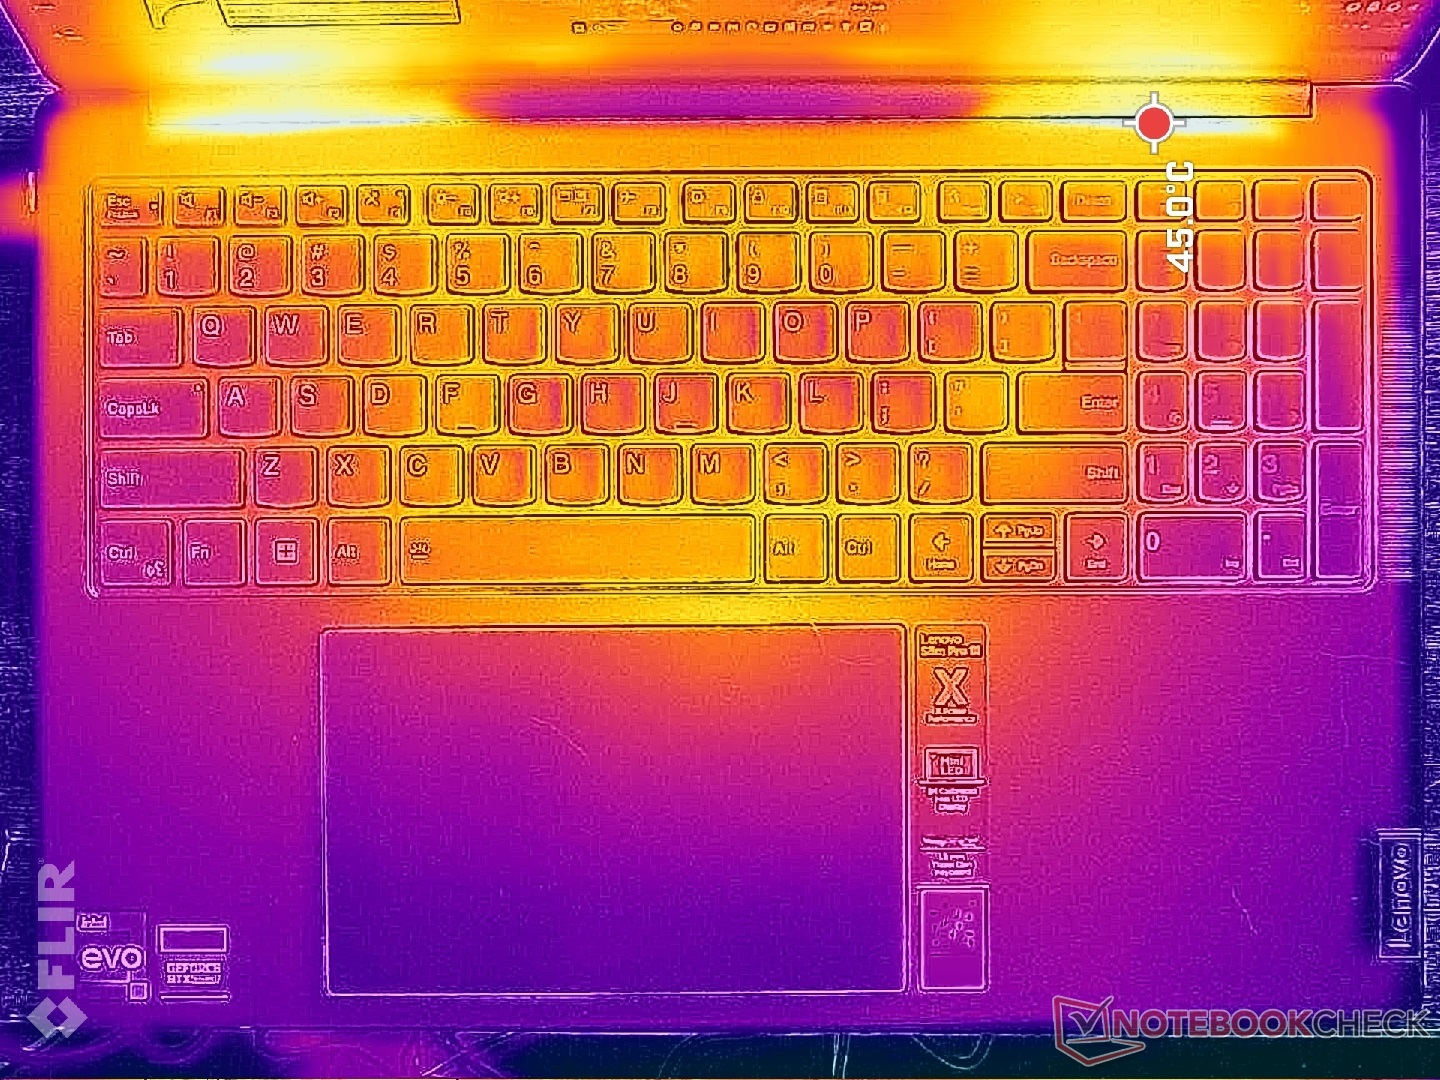
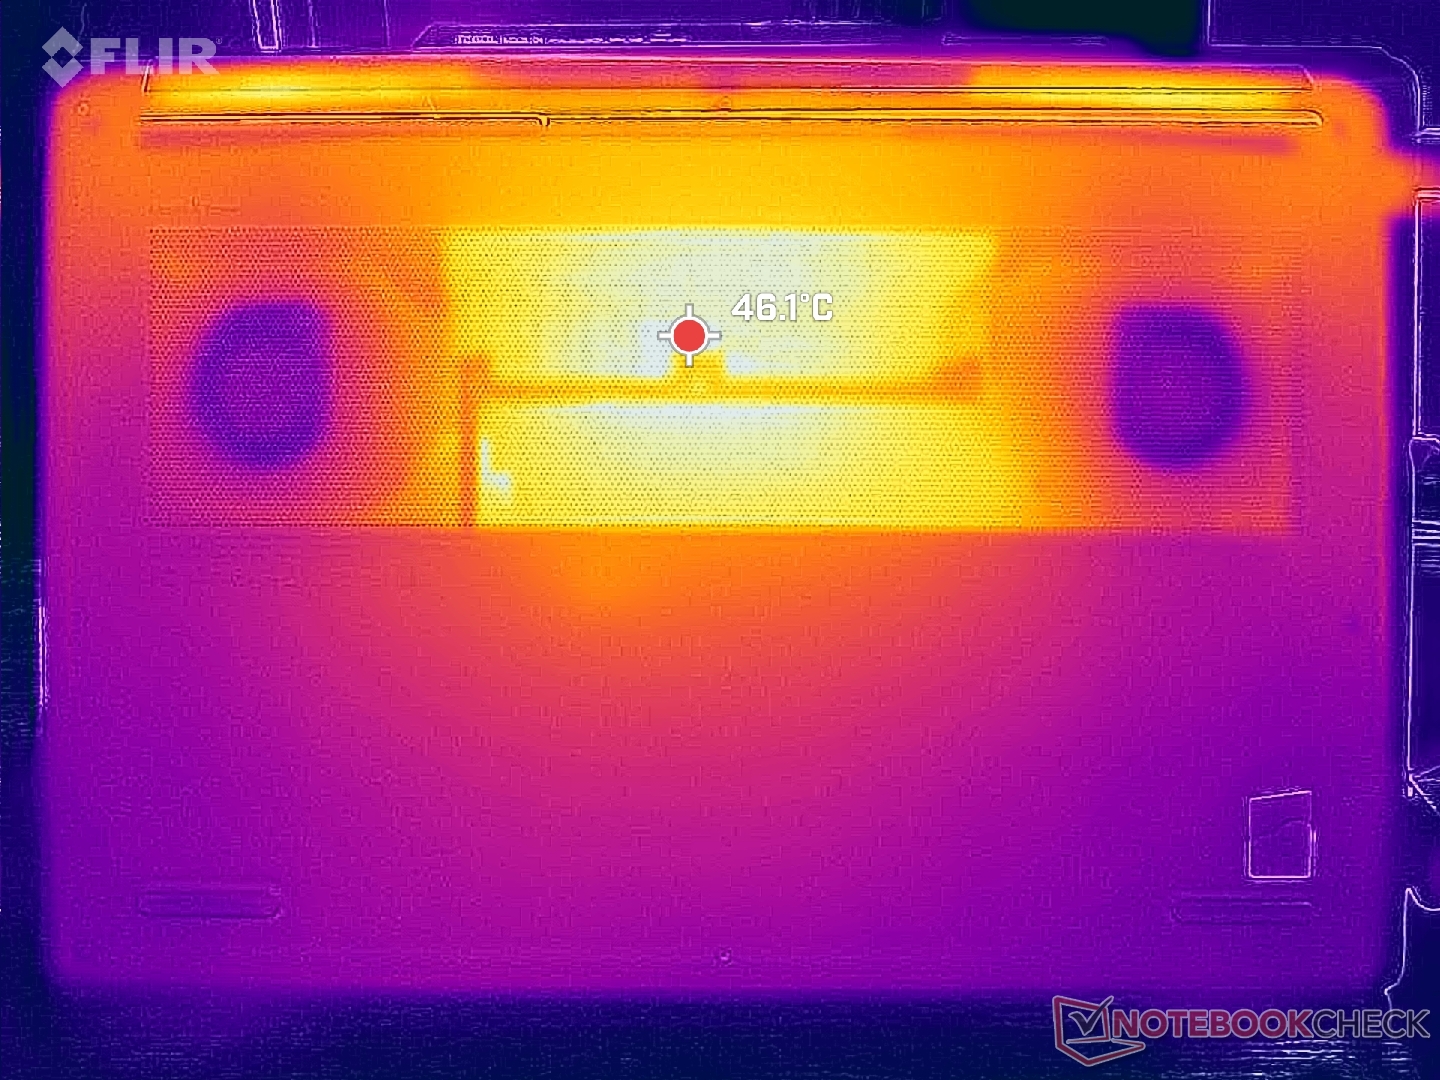
Temperatur
Yttemperaturerna är varmast nära mittenregionerna där hot spots kan nå över 38 C och 44 C på toppen respektive botten. Tangentbordet på Lenovo är inte lika varmt som påInspiron 16 Plus 7620 där mitten kan nå 50 C under belastning.
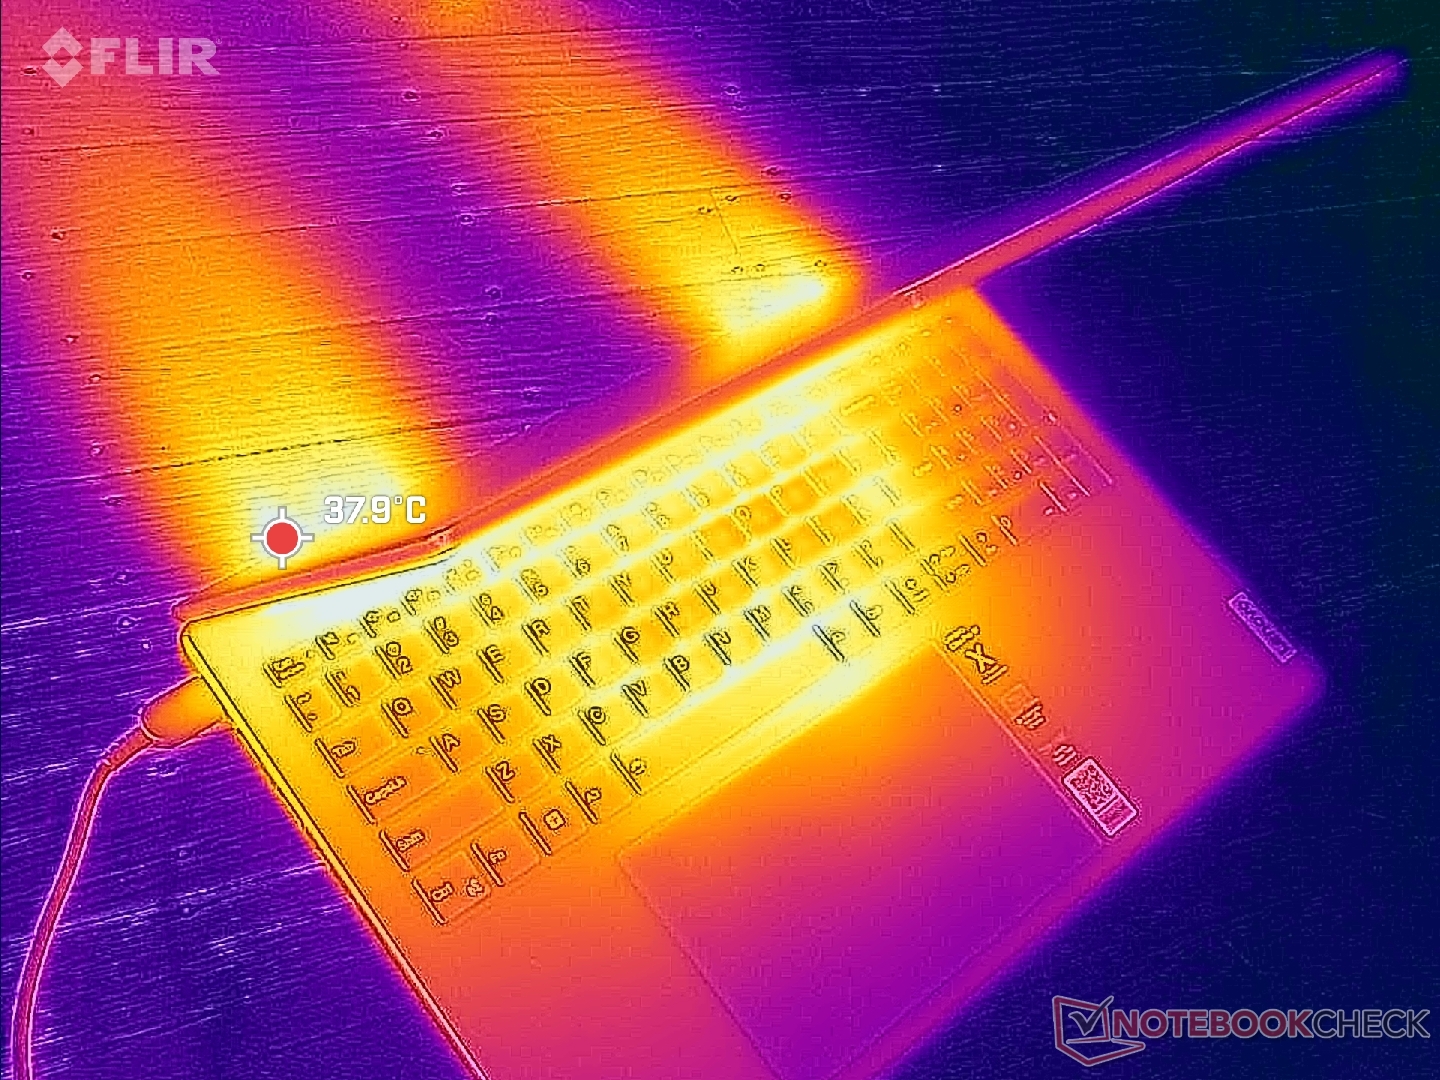
(+) Den maximala temperaturen på ovansidan är 37.8 °C / 100 F, jämfört med genomsnittet av 36.8 °C / 98 F , allt från 21 till 71 °C för klassen Multimedia.
(±) Botten värms upp till maximalt 44.8 °C / 113 F, jämfört med genomsnittet av 39.1 °C / 102 F
(+) Vid tomgångsbruk är medeltemperaturen för ovansidan 28.8 °C / 84 F, jämfört med enhetsgenomsnittet på 31.3 °C / ### class_avg_f### F.
(±) När du spelar The Witcher 3 är medeltemperaturen för ovansidan 35.4 °C / 96 F, jämfört med enhetsgenomsnittet på 31.3 °C / ## #class_avg_f### F.
(+) Handledsstöden och pekplattan når maximal hudtemperatur (32 °C / 89.6 F) och är därför inte varma.
(-) Medeltemperaturen för handledsstödsområdet på liknande enheter var 28.7 °C / 83.7 F (-3.3 °C / -5.9 F).
| Lenovo Slim Pro 9i 16IRP8 Intel Core i9-13905H, NVIDIA GeForce RTX 4050 Laptop GPU | Lenovo Yoga Pro 9 16-IRP G8 Intel Core i7-13705H, NVIDIA GeForce RTX 4060 Laptop GPU | Asus VivoBook Pro 16 Intel Core i7-12700H, NVIDIA GeForce RTX 3050 Ti Laptop GPU | Acer Swift Edge SFE16-42-R1GM AMD Ryzen 7 7735U, AMD Radeon 680M | Dell Inspiron 16 Plus 7620 Intel Core i7-12700H, NVIDIA GeForce RTX 3050 Ti Laptop GPU | HP Envy 16 h0112nr Intel Core i7-12700H, NVIDIA GeForce RTX 3060 Laptop GPU | |
|---|---|---|---|---|---|---|
| Heat | 0% | -16% | -11% | -5% | -8% | |
| Maximum Upper Side * (°C) | 37.8 | 41.6 -10% | 44.2 -17% | 49.4 -31% | 46 -22% | 45.2 -20% |
| Maximum Bottom * (°C) | 44.8 | 50 -12% | 53 -18% | 44.7 -0% | 45.8 -2% | 44 2% |
| Idle Upper Side * (°C) | 30.6 | 26.8 12% | 32.1 -5% | 34 -11% | 29.2 5% | 33.6 -10% |
| Idle Bottom * (°C) | 31 | 27.9 10% | 38.4 -24% | 31.6 -2% | 31 -0% | 32.6 -5% |
* ... mindre är bättre
Stresstest
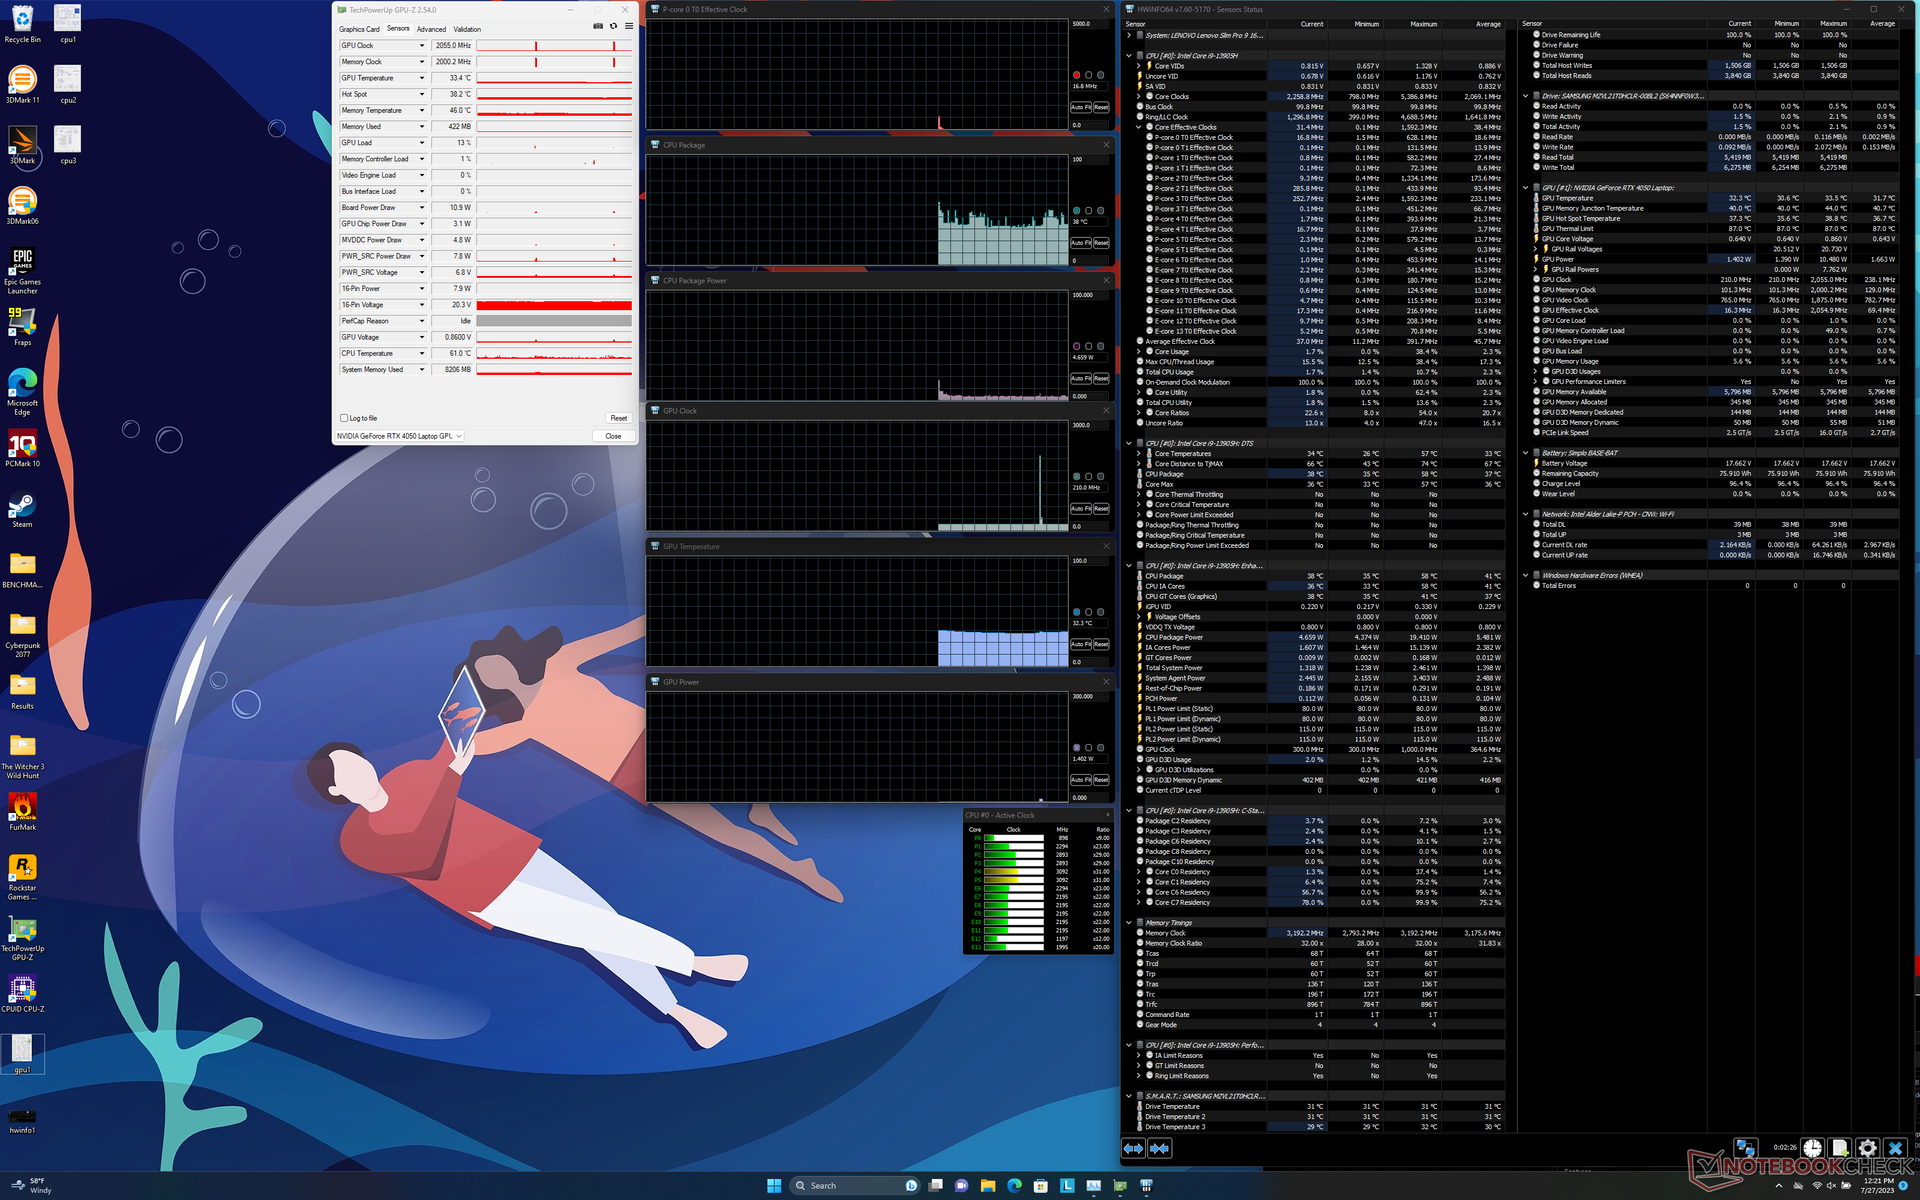
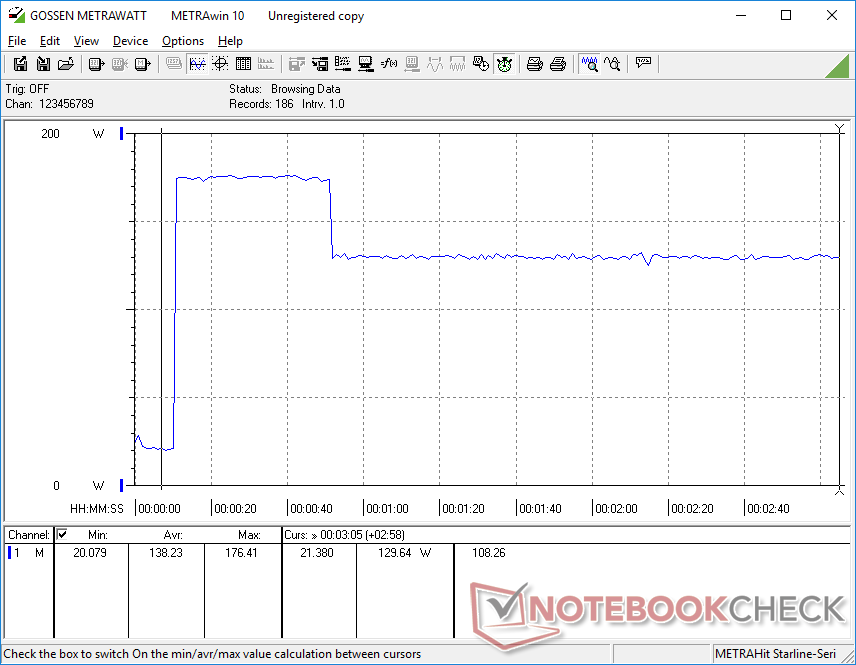
CPU:n ökar till 4 GHz, 120 W och 100 C under de första 40 sekunderna när Prime95-stressen initieras. Eftersom 100 C inte är idealiskt skulle klockfrekvenserna och strömförbrukningen snabbt sjunka till bara 3,0 till 3,2 GHz respektive 85 W för att hålla en mer rimlig kärntemperatur på 82 C. De höga Turbo Boost-klockfrekvenserna hos Core i9-13905H är därför ohållbara på Slim Pro 9i på grund av kylbegränsningar.
Nvidia GPU skulle stabiliseras vid 2505 MHz, 70 C och 72 W när den körs Witcher 3 i prestandaläget jämfört med 2460 MHz, 62 C och 56 W i balanserat läge. GPU:ns strömförbrukning kan närma sig 92 W som mest, jämfört med TGP-målet på 100 W.
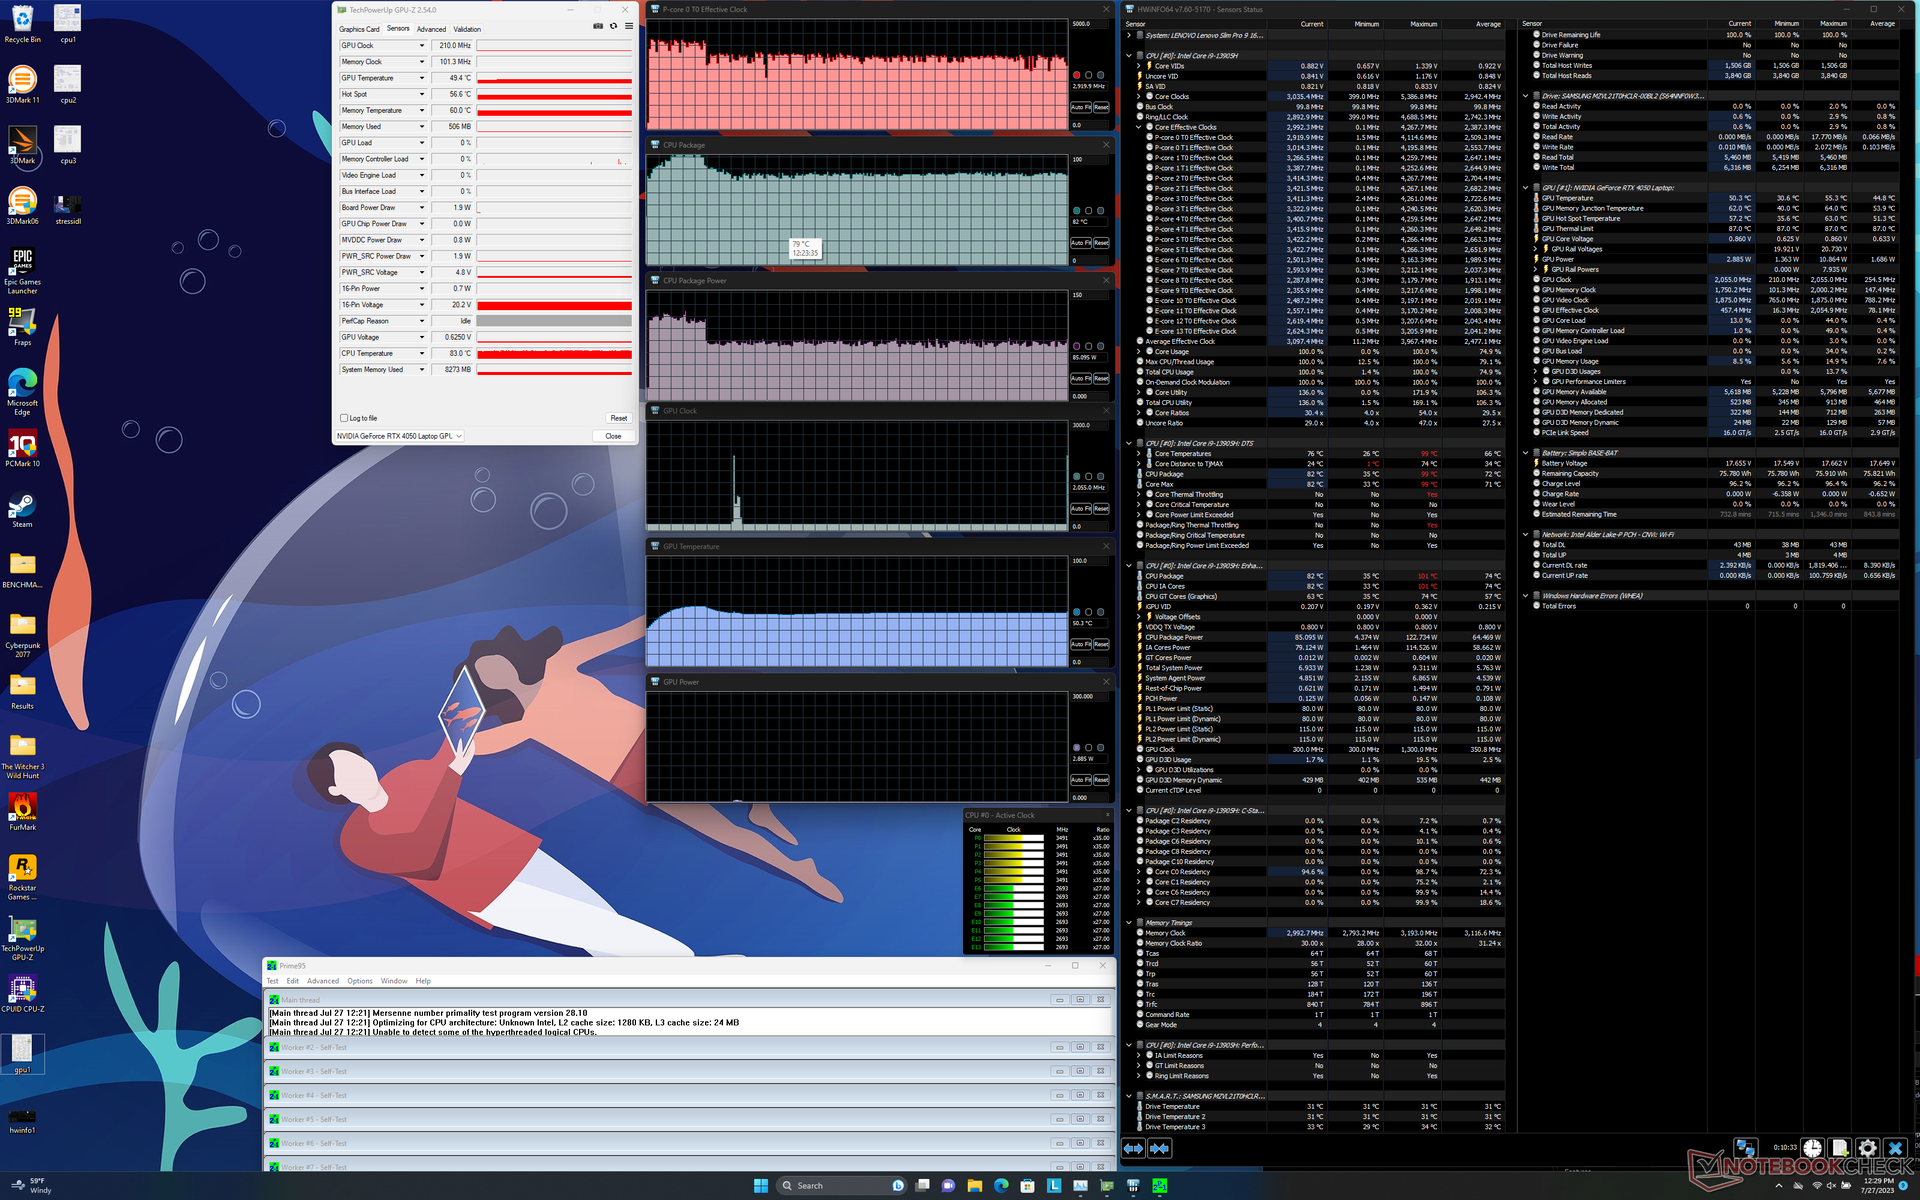
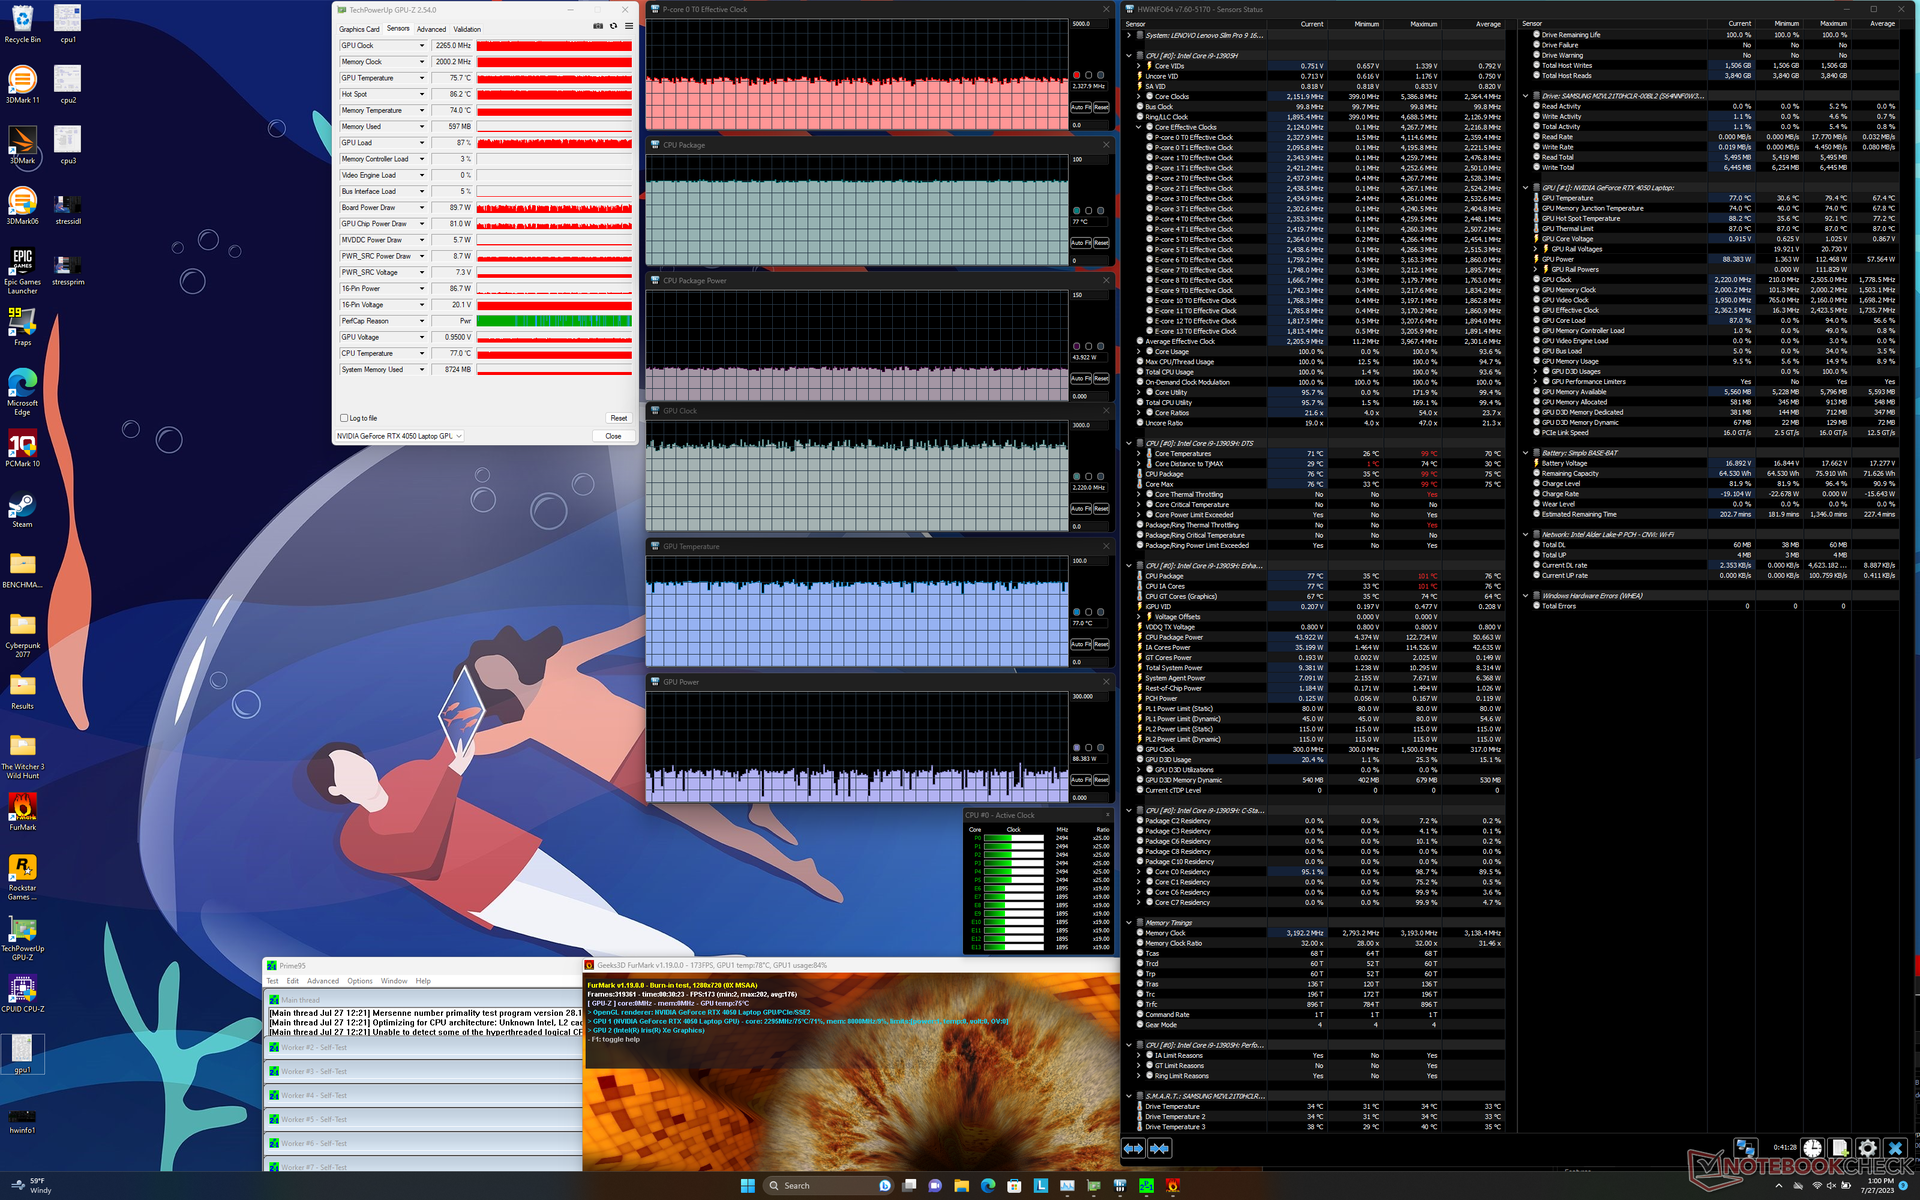
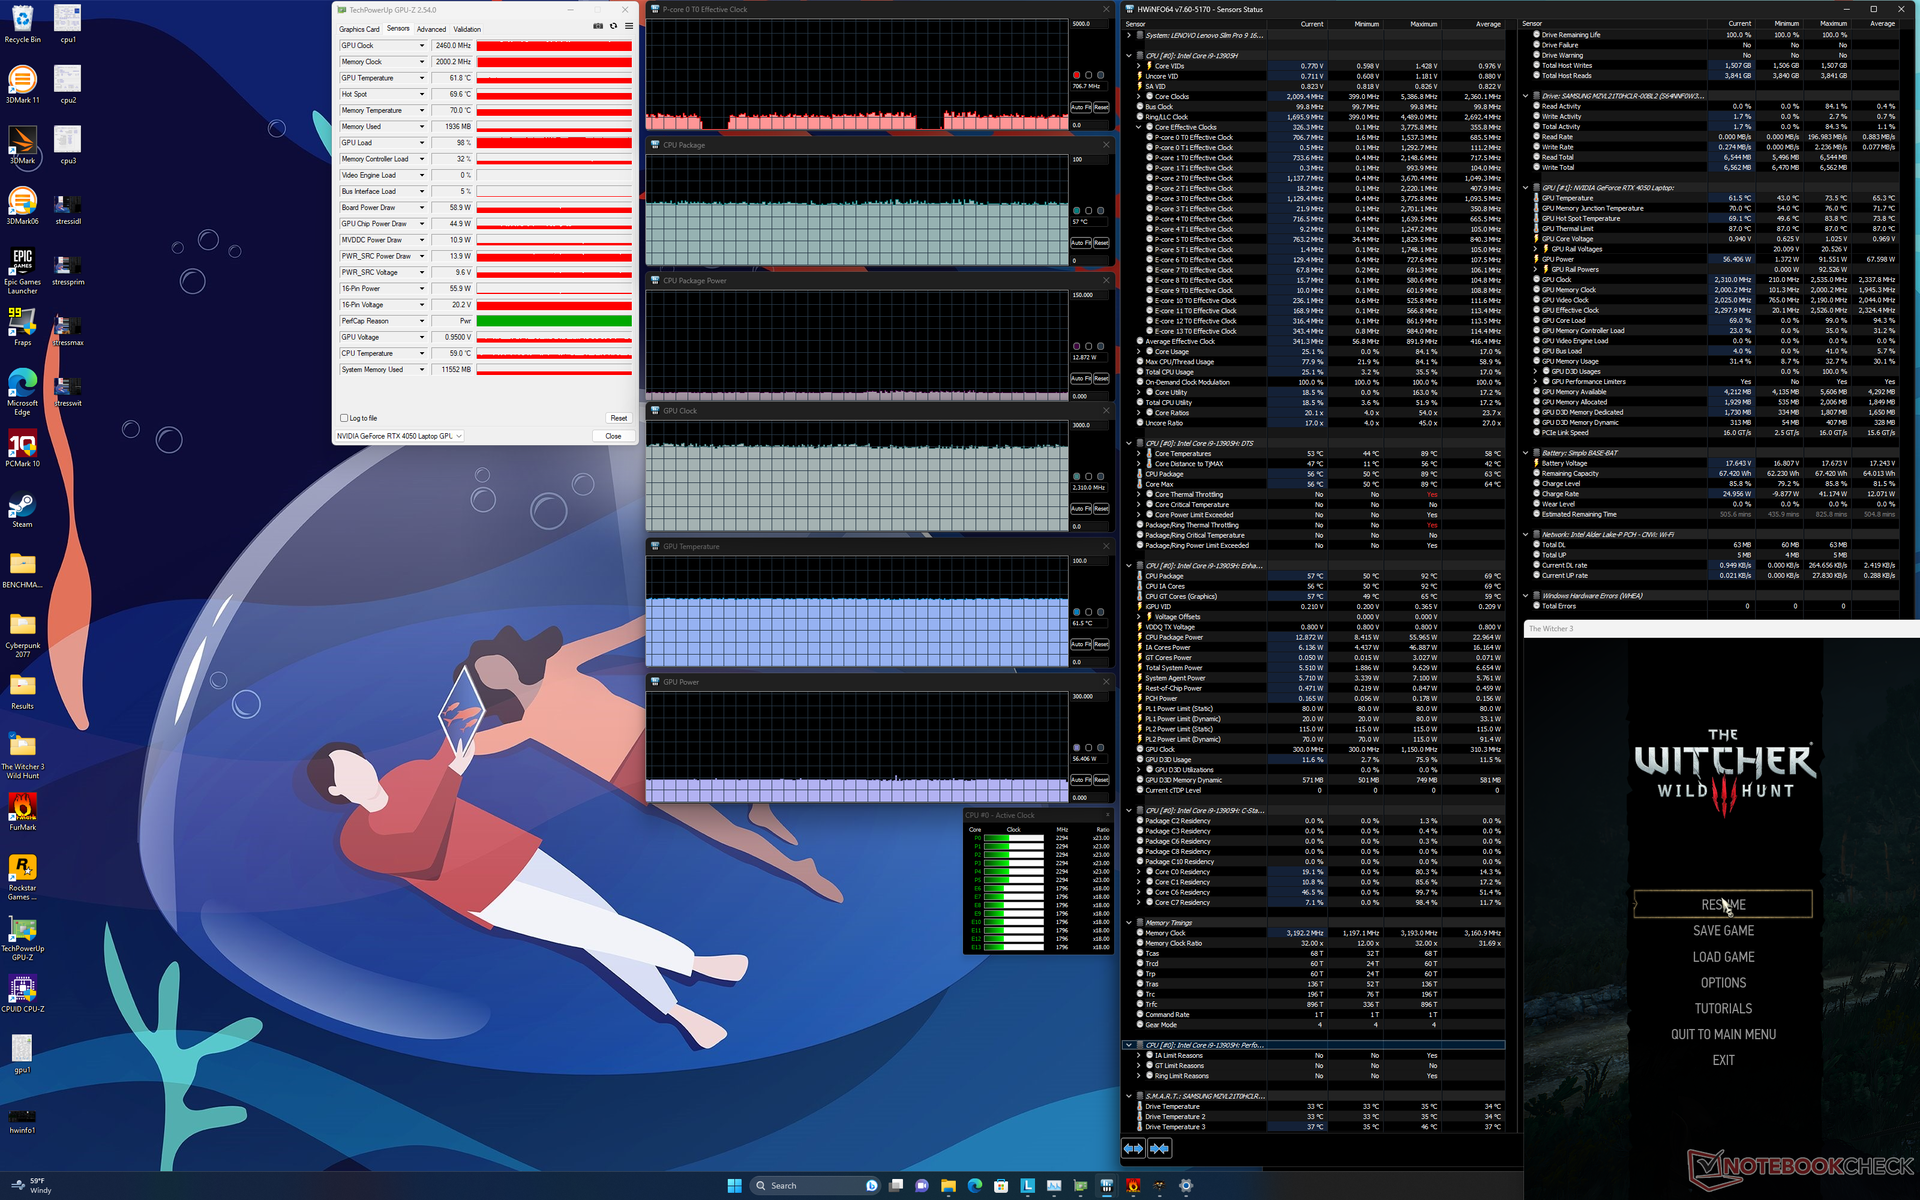
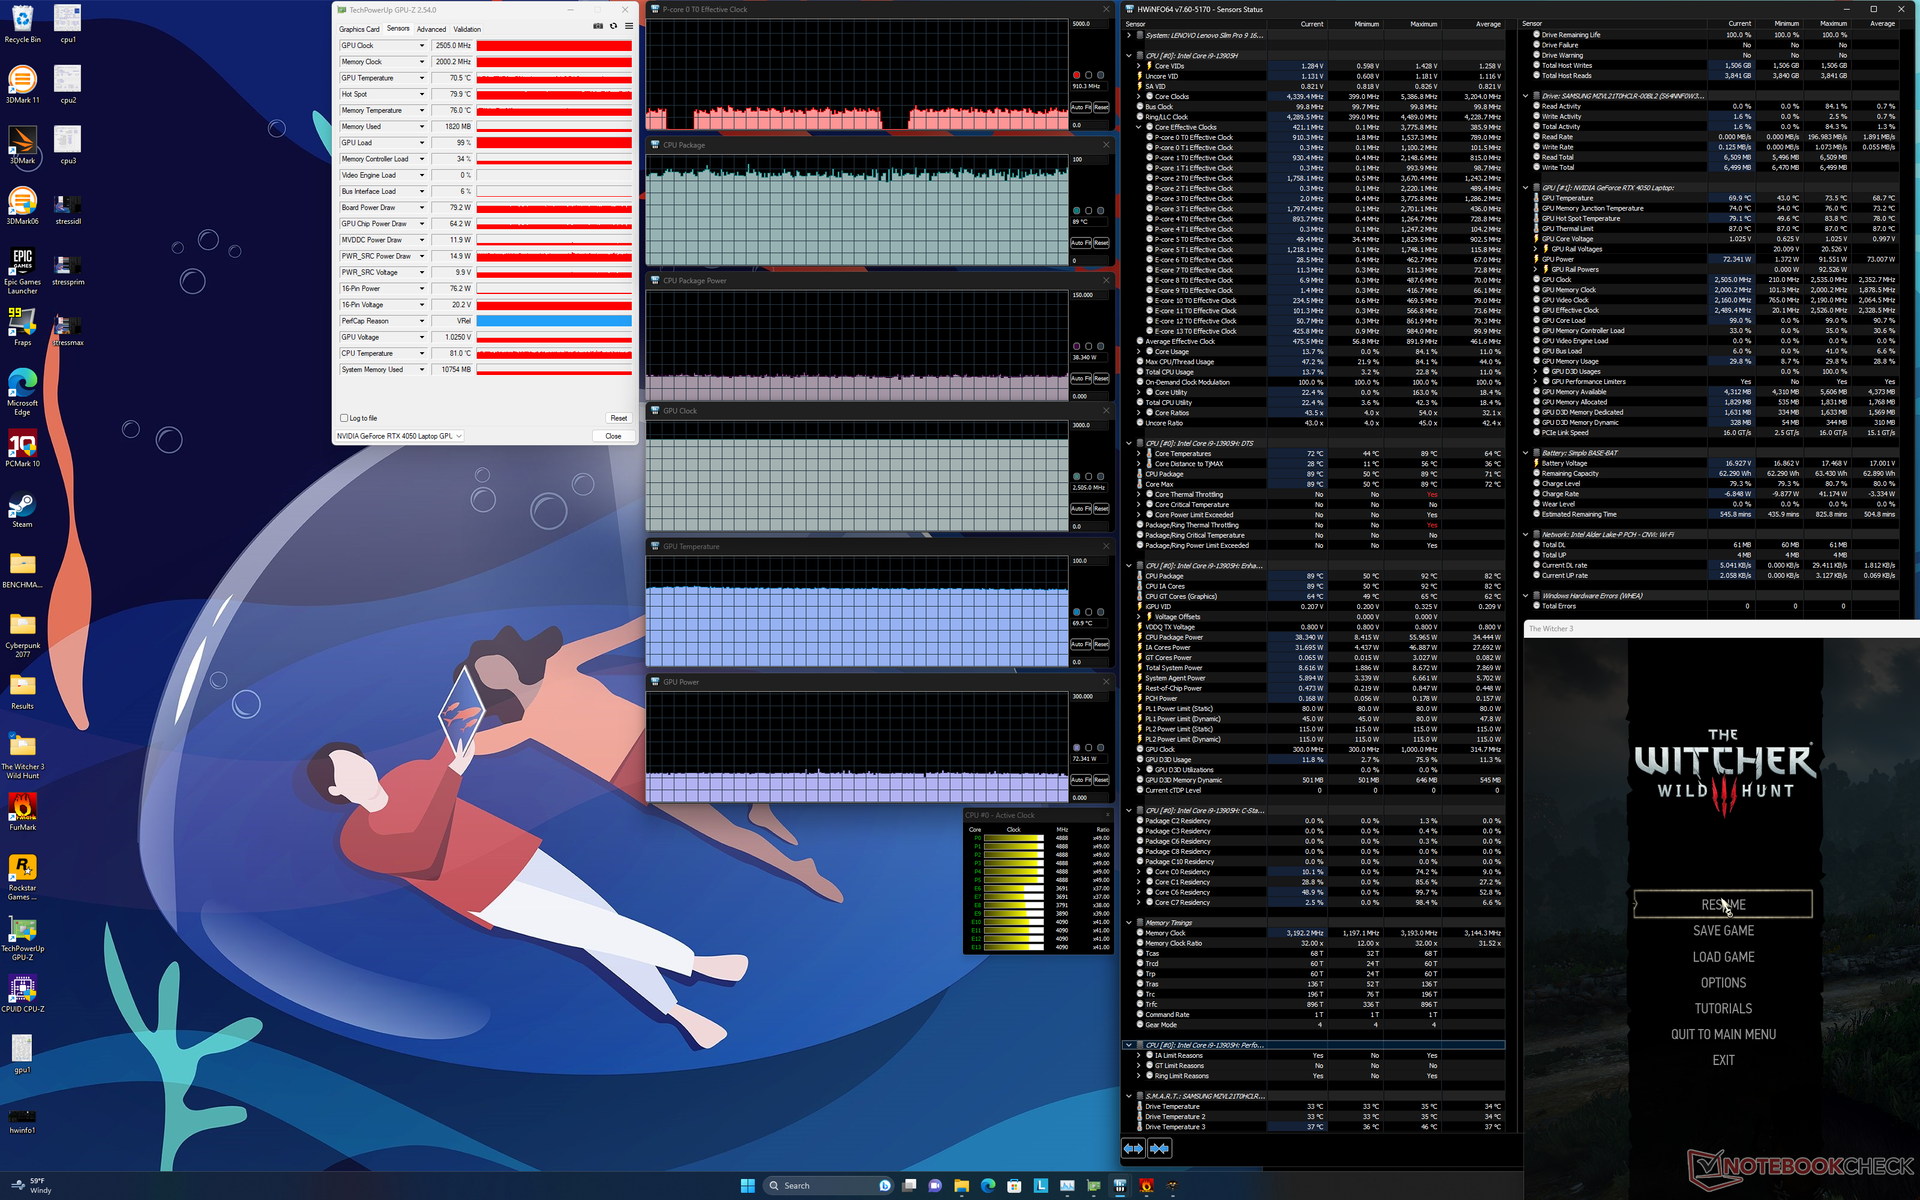
| CPU-klocka (GHz) | GPU-klocka (MHz) | Genomsnittlig CPU-temperatur (°C) | Genomsnittlig GPU-temperatur (°C) | |
| System i viloläge | -- | -- | 38 | 32 |
| Prime95 Stress | ~3.0 | -- | 82 | 50 |
| Prime95 + FurMark Stress | ~2.4 | 2265 | 77 | 77 |
| Witcher 3 Stress (Performance mode) | ~0.9 | 2505 | 89 | 70 |
| Witcher 3 Stress (balanserat läge) | ~0,7 | 2460 | 57 | 62 |
Högtalare
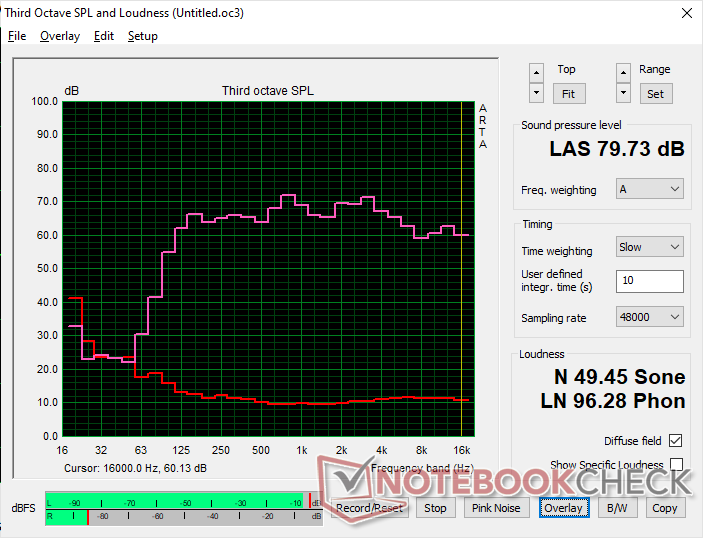
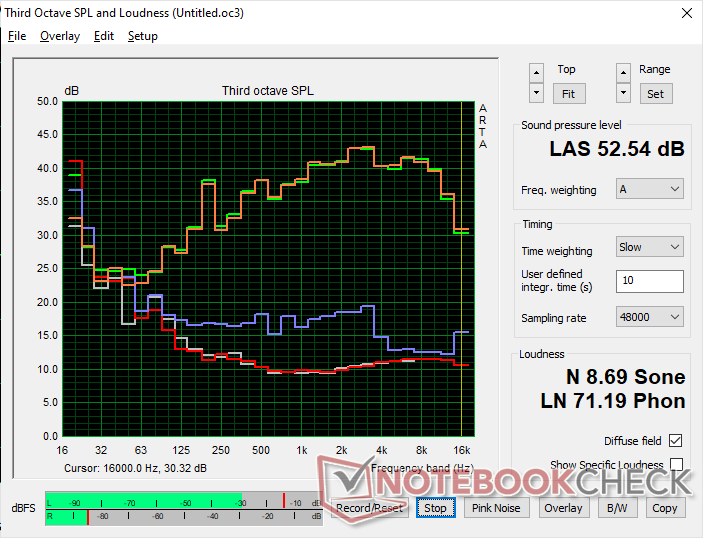
Lenovo Slim Pro 9i 16IRP8 ljudanalys
(±) | högtalarljudstyrkan är genomsnittlig men bra (79.7 dB)
Bas 100 - 315 Hz
(+) | bra bas - bara 2.8% från medianen
(±) | linjäriteten för basen är genomsnittlig (8.9% delta till föregående frekvens)
Mellan 400 - 2000 Hz
(+) | balanserad mellan - endast 2.4% från medianen
(+) | mids är linjära (4.9% delta till föregående frekvens)
Högsta 2 - 16 kHz
(+) | balanserade toppar - endast 3.6% från medianen
(+) | toppar är linjära (4.3% delta till föregående frekvens)
Totalt 100 - 16 000 Hz
(+) | det totala ljudet är linjärt (7.3% skillnad mot median)
Jämfört med samma klass
» 6% av alla testade enheter i den här klassen var bättre, 1% liknande, 94% sämre
» Den bästa hade ett delta på 5%, genomsnittet var 17%, sämst var 45%
Jämfört med alla testade enheter
» 1% av alla testade enheter var bättre, 0% liknande, 99% sämre
» Den bästa hade ett delta på 4%, genomsnittet var 23%, sämst var 134%
Apple MacBook Pro 16 2021 M1 Pro ljudanalys
(+) | högtalare kan spela relativt högt (84.7 dB)
Bas 100 - 315 Hz
(+) | bra bas - bara 3.8% från medianen
(+) | basen är linjär (5.2% delta till föregående frekvens)
Mellan 400 - 2000 Hz
(+) | balanserad mellan - endast 1.3% från medianen
(+) | mids är linjära (2.1% delta till föregående frekvens)
Högsta 2 - 16 kHz
(+) | balanserade toppar - endast 1.9% från medianen
(+) | toppar är linjära (2.7% delta till föregående frekvens)
Totalt 100 - 16 000 Hz
(+) | det totala ljudet är linjärt (4.6% skillnad mot median)
Jämfört med samma klass
» 0% av alla testade enheter i den här klassen var bättre, 0% liknande, 100% sämre
» Den bästa hade ett delta på 5%, genomsnittet var 17%, sämst var 45%
Jämfört med alla testade enheter
» 0% av alla testade enheter var bättre, 0% liknande, 100% sämre
» Den bästa hade ett delta på 4%, genomsnittet var 23%, sämst var 134%
Energiförvaltning
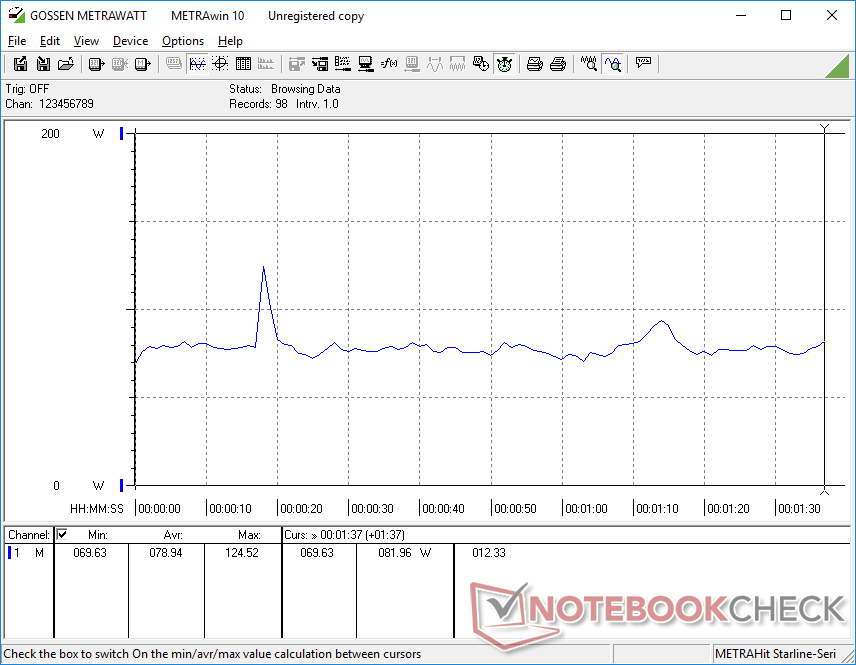
Strömförbrukning
Strömförbrukningen kan variera från 16 W vid lägsta ljusstyrka med iGPU:n aktiv upp till 30 W när en helt vit bild visas vid högsta ljusstyrka med dGPU:n aktiv. Det är därför rekommenderat att vara mer uppmärksam på ljusstyrka och färger om batteritiden är ett bekymmer, precis som på OLED-paneler.
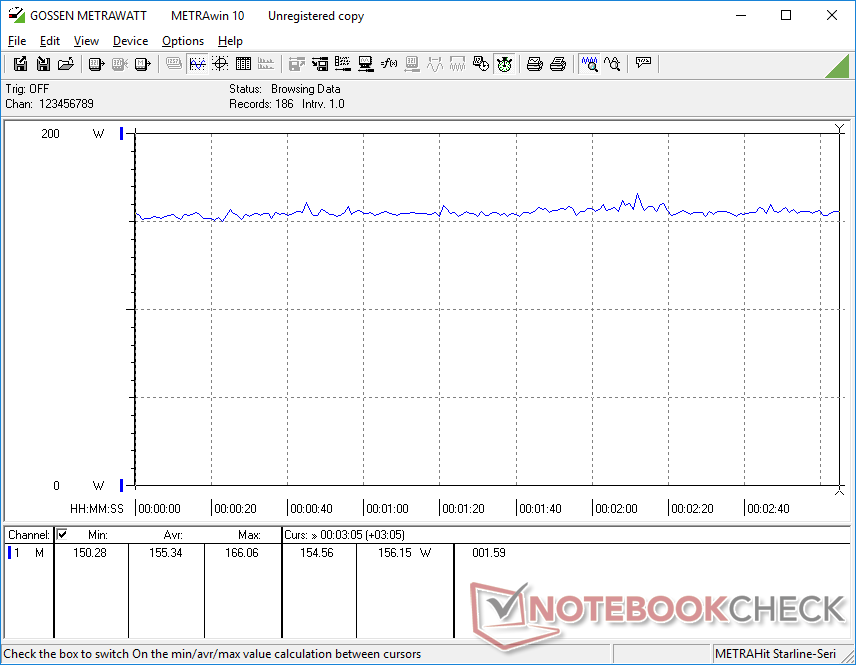
Strömförbrukningen vid spel är nästan identisk med vad vi registrerade på Yoga Pro 9i, även om den senare erbjuder upp till 20 procent snabbare grafikprestanda. Både RTX 4050- och RTX 4060-konfigurationerna siktar på 100 W TGP vardera, vilket skulle förklara deras liknande förbrukningsnivåer när GPU:n är under belastning.
Vår Core i9-13905H toppar något högre än Core i7-13705H vid start av Prime95 innan den slutligen stabiliserar sig på liknande nivåer.
| Av/Standby | |
| Låg belastning | |
| Hög belastning |
|
Förklaring:
min: | |
| Lenovo Slim Pro 9i 16IRP8 i9-13905H, GeForce RTX 4050 Laptop GPU, Samsung PM9A1 MZVL21T0HCLR, Mini-LED, 3200x2000, 16" | Lenovo Yoga Pro 9 16-IRP G8 i7-13705H, GeForce RTX 4060 Laptop GPU, Samsung PM9A1 MZVL21T0HCLR, Mini-LED, 3200x2000, 16" | Asus VivoBook Pro 16 i7-12700H, GeForce RTX 3050 Ti Laptop GPU, Intel SSD 670p SSDPEKNU010TZ, IPS, 2560x1600, 16" | Acer Swift Edge SFE16-42-R1GM R7 7735U, Radeon 680M, Micron 3400 1TB MTFDKBA1T0TFH, OLED, 3840x2400, 16" | Dell Inspiron 16 Plus 7620 i7-12700H, GeForce RTX 3050 Ti Laptop GPU, Kioxia BG5 KBG50ZNS512G, IPS, 3072x1920, 16" | HP Envy 16 h0112nr i7-12700H, GeForce RTX 3060 Laptop GPU, Micron 3400 1TB MTFDKBA1T0TFH, OLED, 3840x2400, 16" | |
|---|---|---|---|---|---|---|
| Power Consumption | 12% | 22% | 61% | 29% | 10% | |
| Idle Minimum * (Watt) | 16 | 10.9 32% | 8.7 46% | 8.6 46% | 6.8 57% | 10 37% |
| Idle Average * (Watt) | 30 | 22.6 25% | 13.1 56% | 7.7 74% | 9.6 68% | 10.9 64% |
| Idle Maximum * (Watt) | 30.4 | 23.5 23% | 18.3 40% | 9.3 69% | 17 44% | 27.8 9% |
| Load Average * (Watt) | 78.9 | 84.6 -7% | 116 -47% | 47.9 39% | 117.5 -49% | 116.4 -48% |
| Witcher 3 ultra * (Watt) | 155.3 | 159.5 -3% | 117.6 24% | 46.3 70% | 113.1 27% | 133.7 14% |
| Load Maximum * (Watt) | 180.4 | 177.3 2% | 162 10% | 56 69% | 137.4 24% | 209.8 -16% |
* ... mindre är bättre
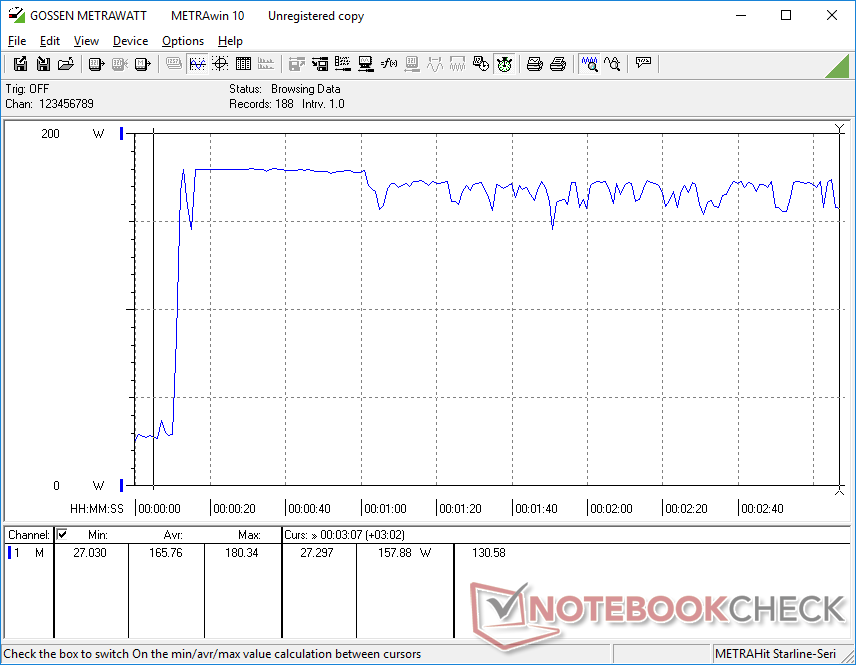
Power Consumption Witcher 3 / Stresstest
Power Consumption external Monitor
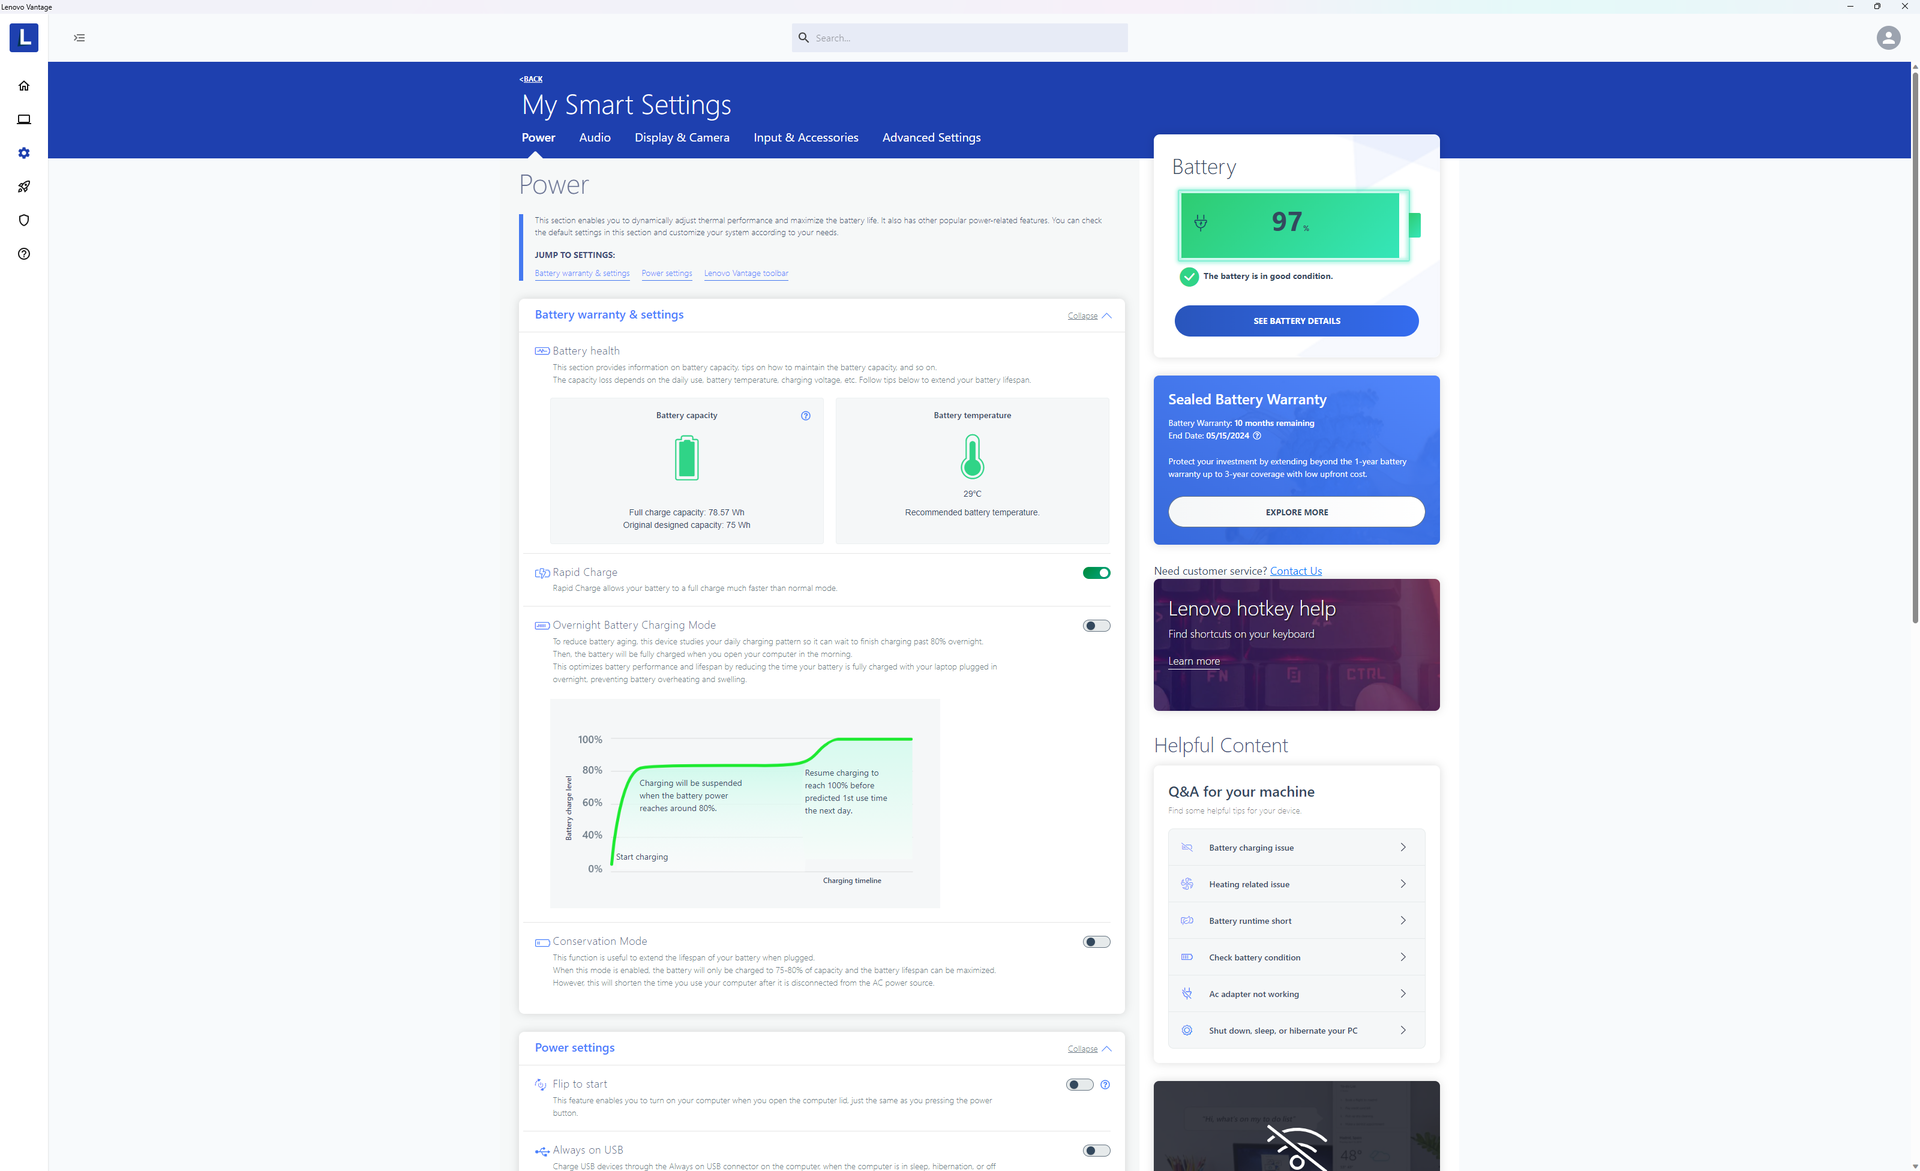
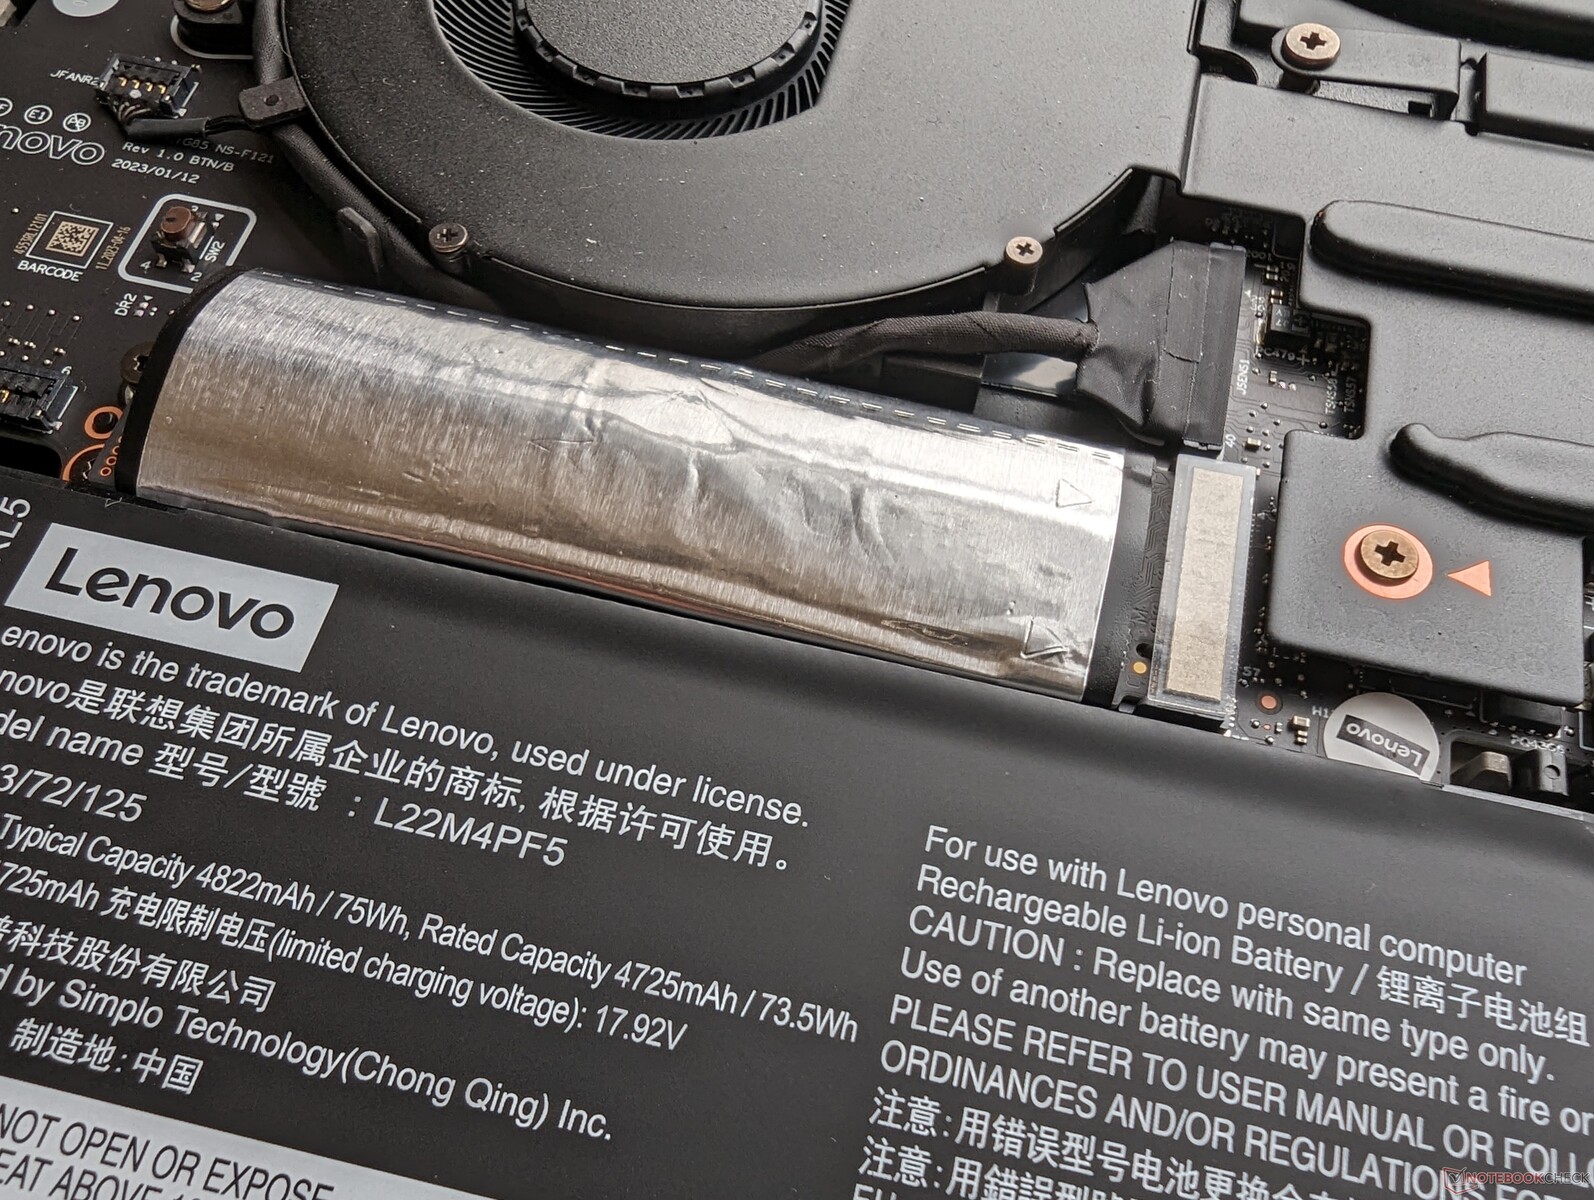
Batteritid
Drifttiderna är i princip identiska med vad vi registrerade på Yoga Pro 9 16 med cirka 6,5 timmars surfande i verkliga världen. Laddning från tomt till fullt batteri tar cirka 90 minuter, även med Rapid Charge aktiverat.
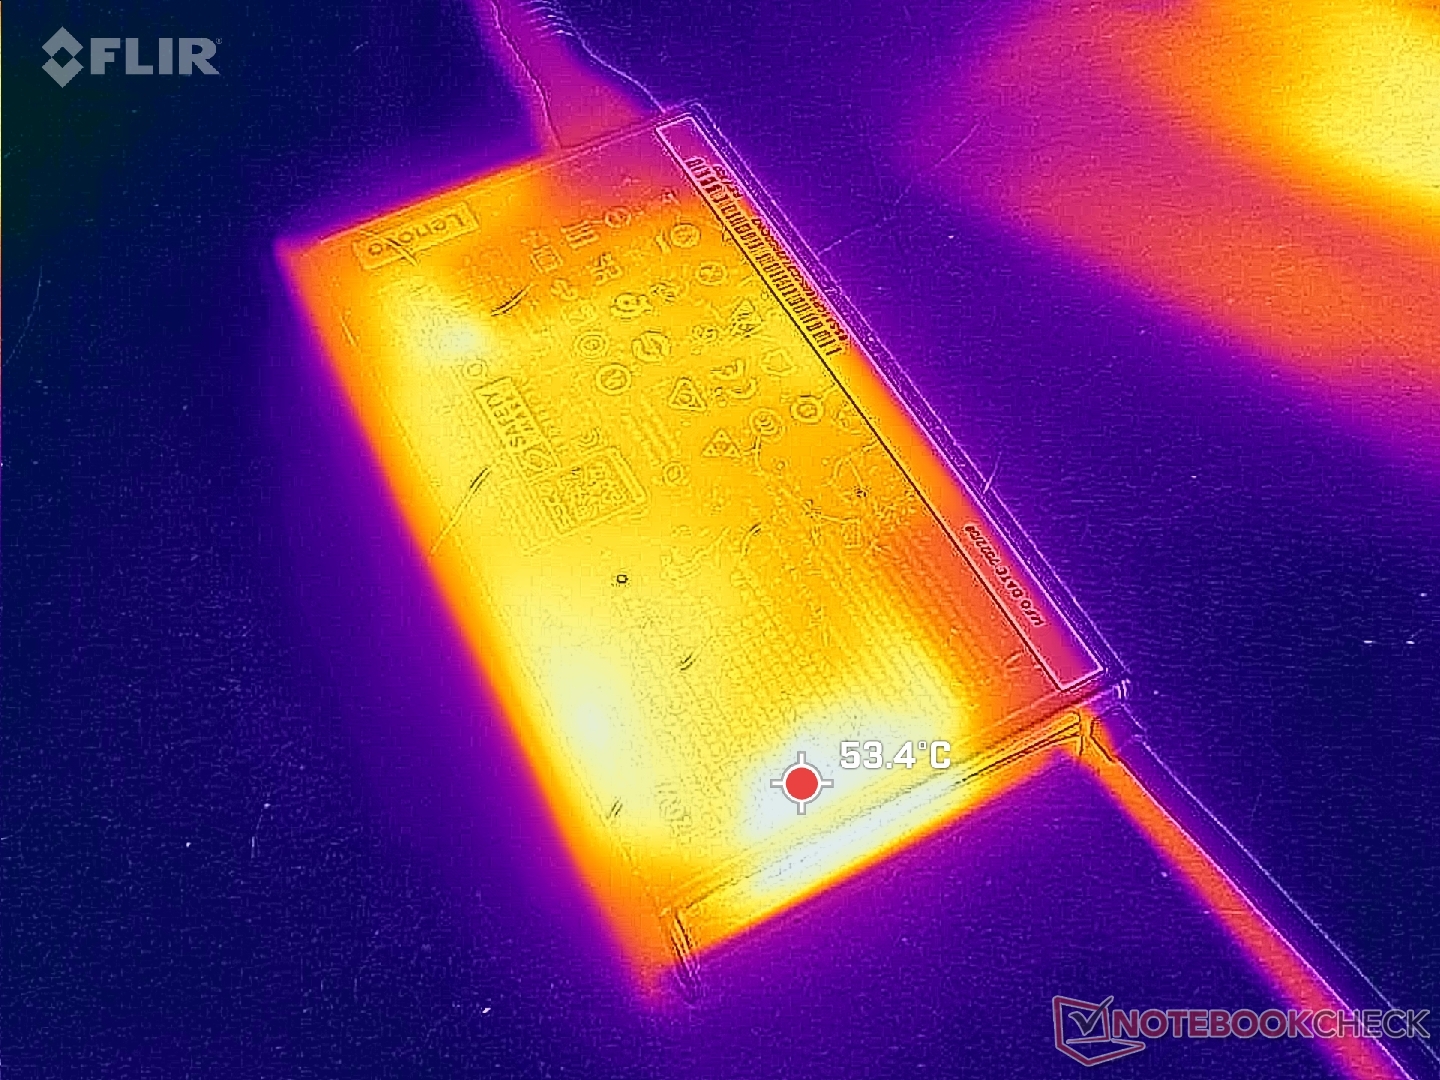
Batteriladdningen kan sjunka om du kör krävande belastningar även när du är ansluten till elnätet. Under vårt timslånga Prime95- och FurMark-test, till exempel, minskade batteriladdningen från 100 procent till 79 procent, vilket tyder på att modellen hade kunnat dra nytta av en nätadapter med högre kapacitet.
Vissa USB-C-adaptrar kan ladda systemet. Vår 130 W Dell XPS 15 USB-C-adapter verkar t.ex. inte vara kompatibel, medan Lenovos 140 W USB-C-adapter fungerar utan problem.
| Lenovo Slim Pro 9i 16IRP8 i9-13905H, GeForce RTX 4050 Laptop GPU, 75 Wh | Lenovo Yoga Pro 9 16-IRP G8 i7-13705H, GeForce RTX 4060 Laptop GPU, 75 Wh | Asus VivoBook Pro 16 i7-12700H, GeForce RTX 3050 Ti Laptop GPU, 70 Wh | Acer Swift Edge SFE16-42-R1GM R7 7735U, Radeon 680M, 54 Wh | Dell Inspiron 16 Plus 7620 i7-12700H, GeForce RTX 3050 Ti Laptop GPU, 86 Wh | HP Envy 16 h0112nr i7-12700H, GeForce RTX 3060 Laptop GPU, 83 Wh | |
|---|---|---|---|---|---|---|
| Batteridrifttid | -3% | 11% | 11% | 45% | 20% | |
| WiFi v1.3 (h) | 6.6 | 6.4 -3% | 7.3 11% | 7.3 11% | 9.6 45% | 7.9 20% |
| H.264 (h) | 7.5 | 8.6 | ||||
| Load (h) | 0.7 | 1.5 | 1.2 | 1.6 | ||
| Reader / Idle (h) | 10.9 | 18.6 | 17.8 |
För
Emot
Bedömning - Core i7 med GeForce RTX 4060 är den bättre affären
Det finns minst två konfigurationer av Slim Pro 9i 16 tillgängliga just nu: en med Core i7-13705H och GeForce RTX 4060 och en med Core i9-13905H och GeForce RTX 4050. Eftersom priserna på båda är så lika rekommenderas Core i7 med RTX 4060-alternativet framför Core i9 med RTX 4050-alternativet eftersom Core i7 presterar nästan identiskt med Core i9. Samtidigt ger hoppet från RTX 4050 till RTX 4060 en större och mer märkbar ökning av grafikprestandan.
Konfigurationen med Core i7 och GeForce RTX 4060 är det bästa alternativet för dem som överväger Lenovo Slim Pro 9i 16
.
Andra aspekter av modellen är jämförbara med alternativ somHP Envy 16 eller MacBook Pro 16 allt från de breda portalternativen till den övergripande snabba prestandan, täta vikten och rimliga dimensioner. Du får dock inte det RAM-minne som kan utökas av användaren i Envy 16 eller den förkalibrerade skärmen och längre batteritiden i MacBook Pro.
Pris och tillgänglighet
Lenovo levererar nu sin Slim Pro 9i 16 för $2200 USD med den mer avancerade GeForce RTX 4060. Modellen är också tillgänglig på Best Buy.
Lenovo Slim Pro 9i 16IRP8
- 08/10/2023 v7 (old)
Allen Ngo
Genomskinlighet
Valet av enheter som ska granskas görs av vår redaktion. Testprovet gavs till författaren som ett lån av tillverkaren eller återförsäljaren för denna recension. Långivaren hade inget inflytande på denna recension och inte heller fick tillverkaren en kopia av denna recension innan publiceringen. Det fanns ingen skyldighet att publicera denna recension. Som ett oberoende medieföretag är Notebookcheck inte föremål för auktoritet från tillverkare, återförsäljare eller förlag.
This is how Notebookcheck is testingEvery year, Notebookcheck independently reviews hundreds of laptops and smartphones using standardized procedures to ensure that all results are comparable. We have continuously developed our test methods for around 20 years and set industry standards in the process. In our test labs, high-quality measuring equipment is utilized by experienced technicians and editors. These tests involve a multi-stage validation process. Our complex rating system is based on hundreds of well-founded measurements and benchmarks, which maintains objectivity.
Price comparison

