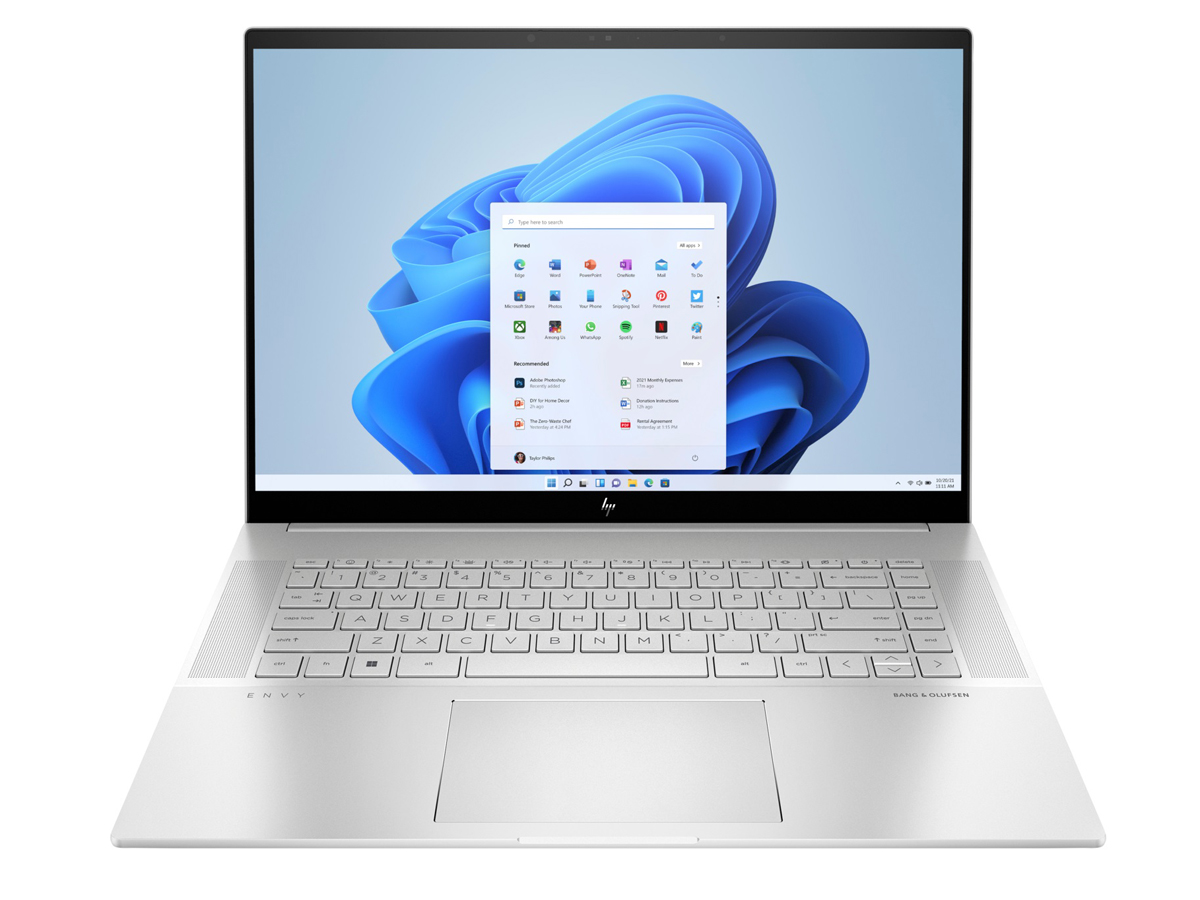
Recension av 2022 års HP Envy 16 - För multimedia, gamers, kreatörer och alla däremellan
Envy 16 ersätter förra årets 15.6-tums Envy 15 genom att gå över till en ny 16-tums formfaktor tillsammans med de senaste Intel 12th gen CPU:erna och diskreta grafikalternativ från Nvidia och Intel. Till skillnad från den billigare Pavilion -serien är Envy-serien hemvist för prosommarmodeller i högre prisklass med generellt högre prestanda, mindre plast och bättre byggkvalitet
Vår specifika konfiguration är en high-end SKU med Core i7-12700H, GeForce RTX 3060 och 2400p OLED touchscreen för cirka 1 700 USD. Andra konfigurationer finns tillgängliga med den långsammare Core i5-12500H, den snabbare i9-12900H, Intel Arc A370M-grafik eller 1600p IPS-skärm för mellan 1180 och 2380 USD
Alternativ till Envy 16 är andra bärbara datorer för prosumenter i den övre prisklassen, t.ex Dell XPS 15-serien, MacBook Pro 16,Huawei MateBook 16s, eller denLG Gram 16.
Fler HP-recensioner:
Potentiella konkurrenter i jämförelse
Gradering | Datum | Modell | Vikt | Höjd | Storlek | Upplösning | Pris |
|---|---|---|---|---|---|---|---|
| 86.9 % v7 (old) | 09/2022 | HP Envy 16 h0112nr i7-12700H, GeForce RTX 3060 Laptop GPU | 2.3 kg | 19.8 mm | 16.00" | 3840x2400 | |
| 88.4 % v7 (old) | 09/2022 | Lenovo ThinkBook 16 G4+ IAP i7-12700H, GeForce RTX 2050 Mobile | 1.8 kg | 16.5 mm | 16.00" | 2560x1600 | |
| 83.7 % v7 (old) | 06/2022 | MSI Creator Z16P B12UHST i9-12900H, GeForce RTX 3080 Ti Laptop GPU | 2.4 kg | 20.4 mm | 16.00" | 2560x1600 | |
| 82.6 % v7 (old) | 11/2021 | Dell Inspiron 16 Plus 7610-MHJ8F i7-11800H, UHD Graphics Xe 32EUs (Tiger Lake-H) | 2 kg | 19 mm | 16.00" | 3072x1920 | |
| 93.2 % v7 (old) | 11/2021 | Apple MacBook Pro 16 2021 M1 Pro M1 Pro, M1 Pro 16-Core GPU | 2.2 kg | 16.8 mm | 16.20" | 3456x2234 | |
| 86.4 % v7 (old) | 07/2022 | Huawei MateBook 16s i7 i7-12700H, Iris Xe G7 96EUs | 2 kg | 17.8 mm | 16.00" | 2520x1680 |
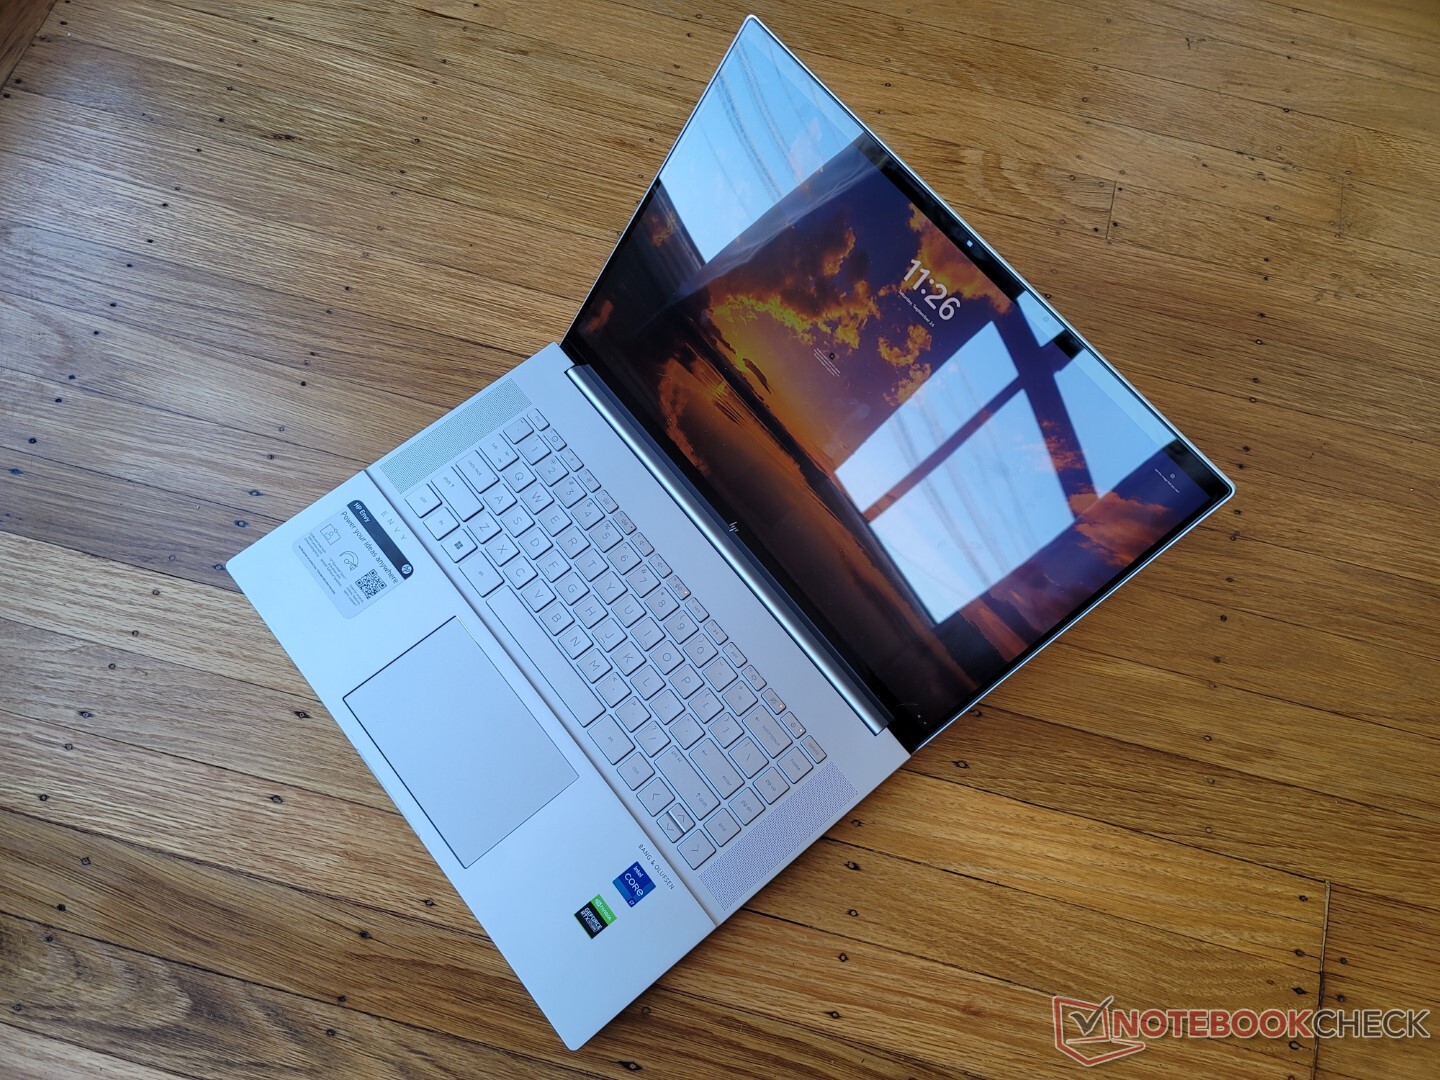
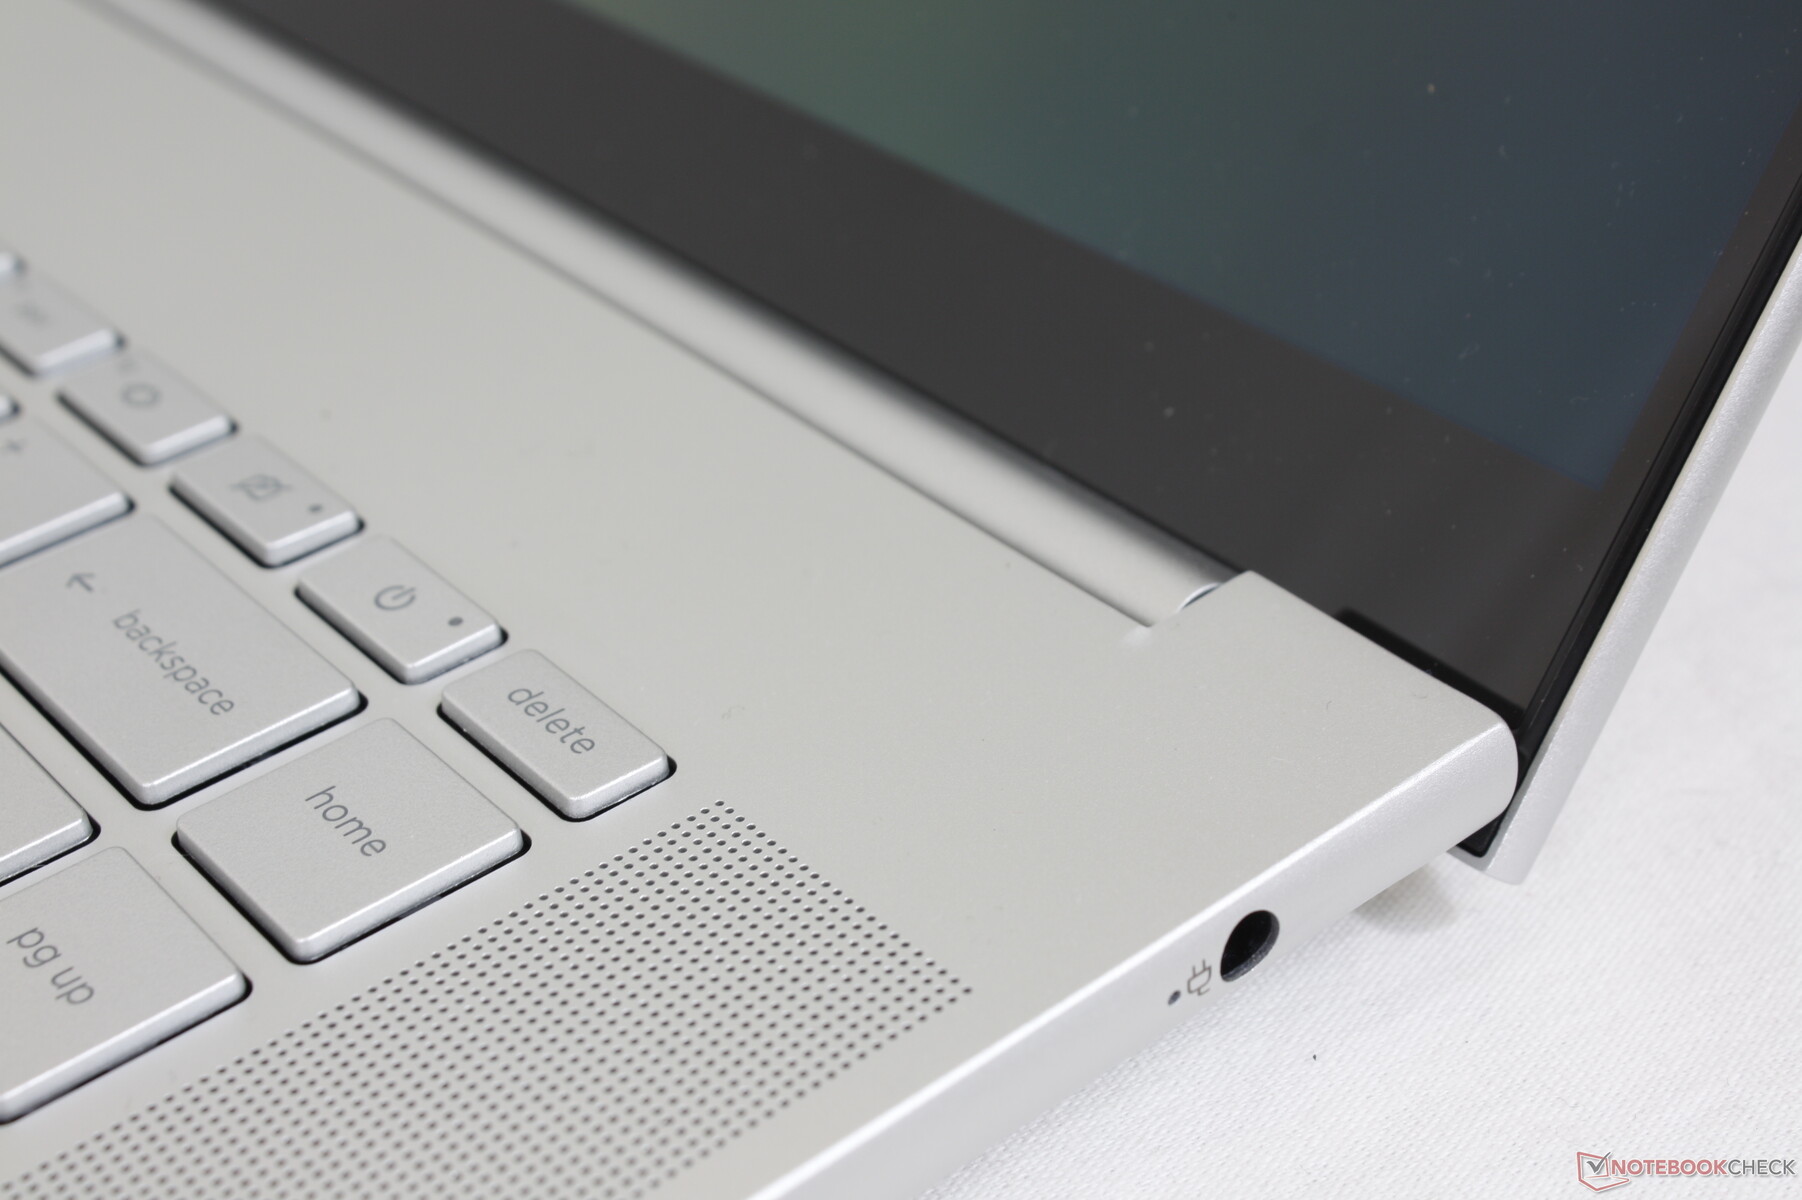
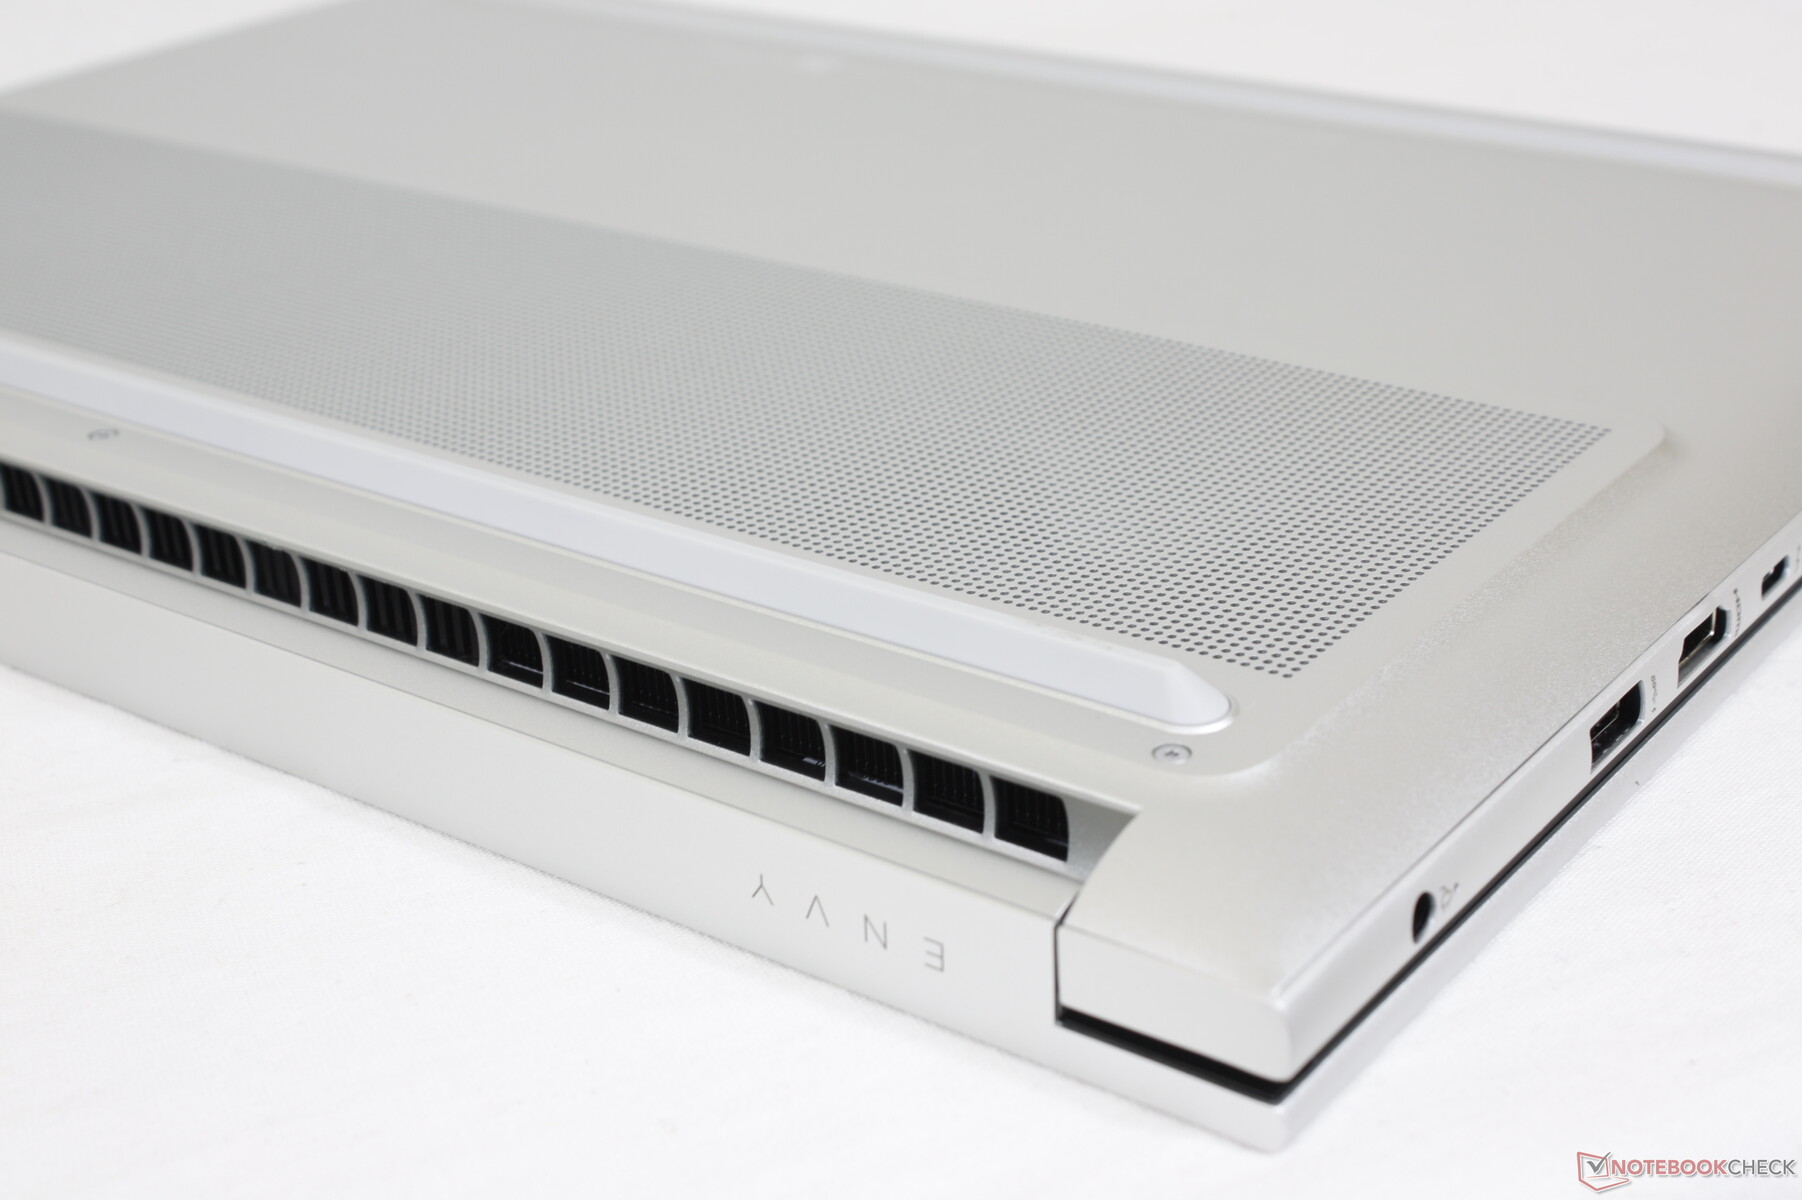
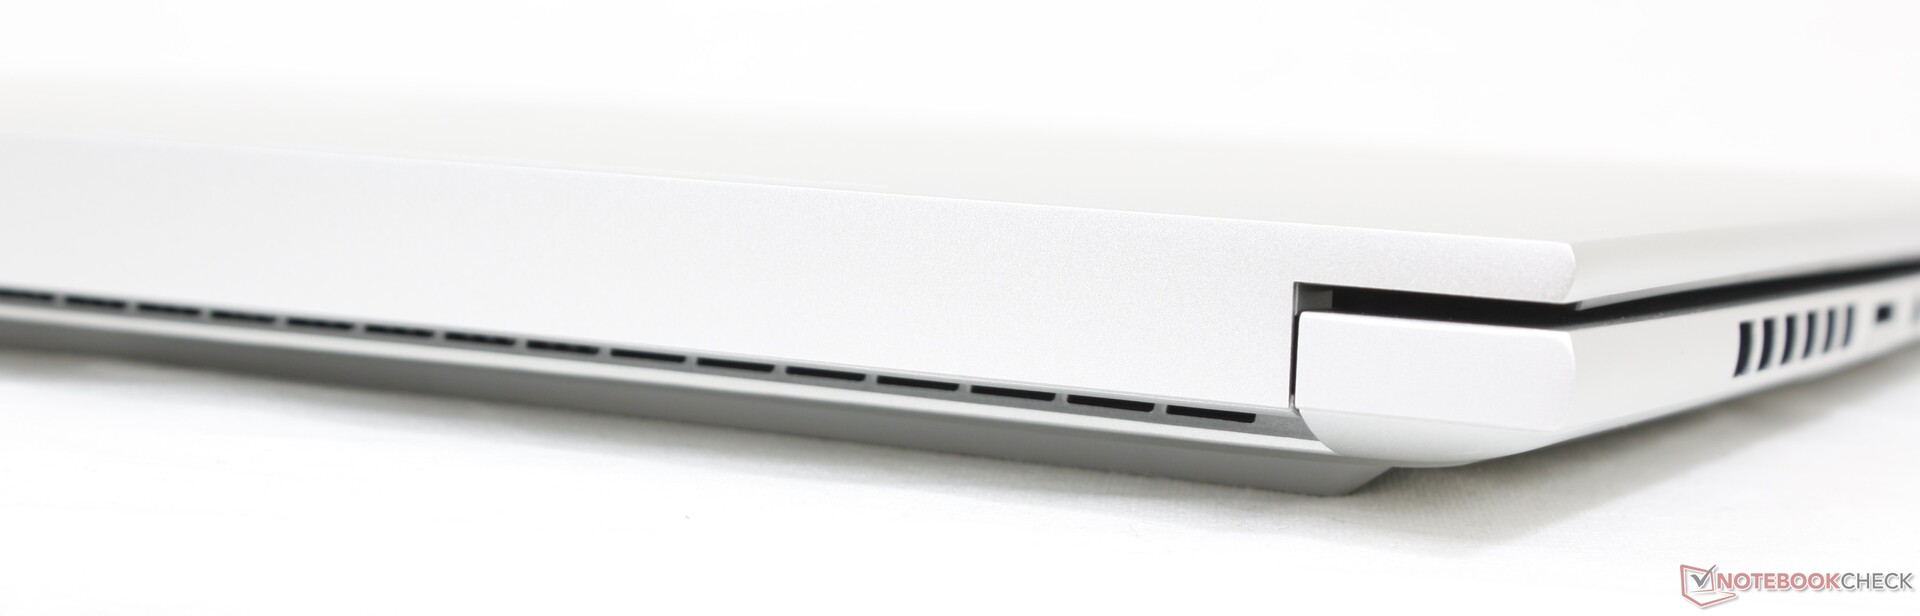
Hölje - samma färger men många ändringar
Envy 16 kan se ut som Envy 15 vid första anblicken på grund av deras liknande färgschema, men det finns faktiskt många förändringar både på insidan och utsidan. Mest märkbart är att Envy 16 är rundare i kanter och hörn, till skillnad från den vassare och plattare Envy 15-designen. Samtidigt är ventilationsdelen av bottenpanelen upphöjd istället för platt, vilket framgår av bilderna nedan. Handflatorstödsdäcket och högtalargallren har också fått en ny utformning. Vissa av dessa förändringar verkar vara ytliga medan andra borde förbättra modellens kylningsmöjligheter.
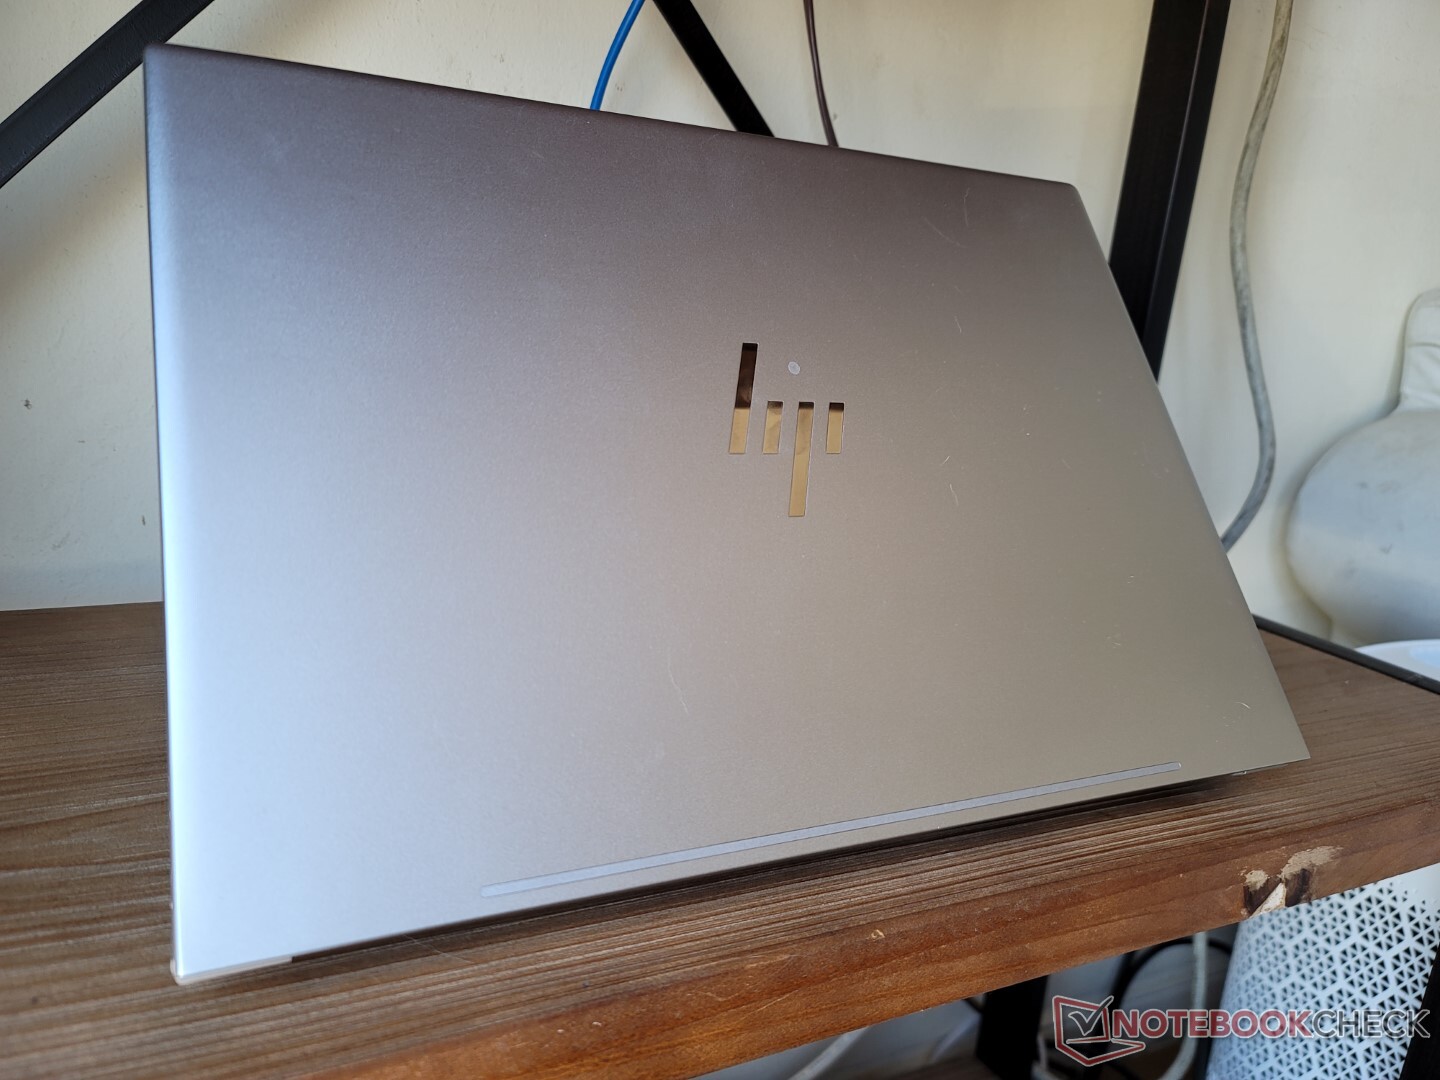
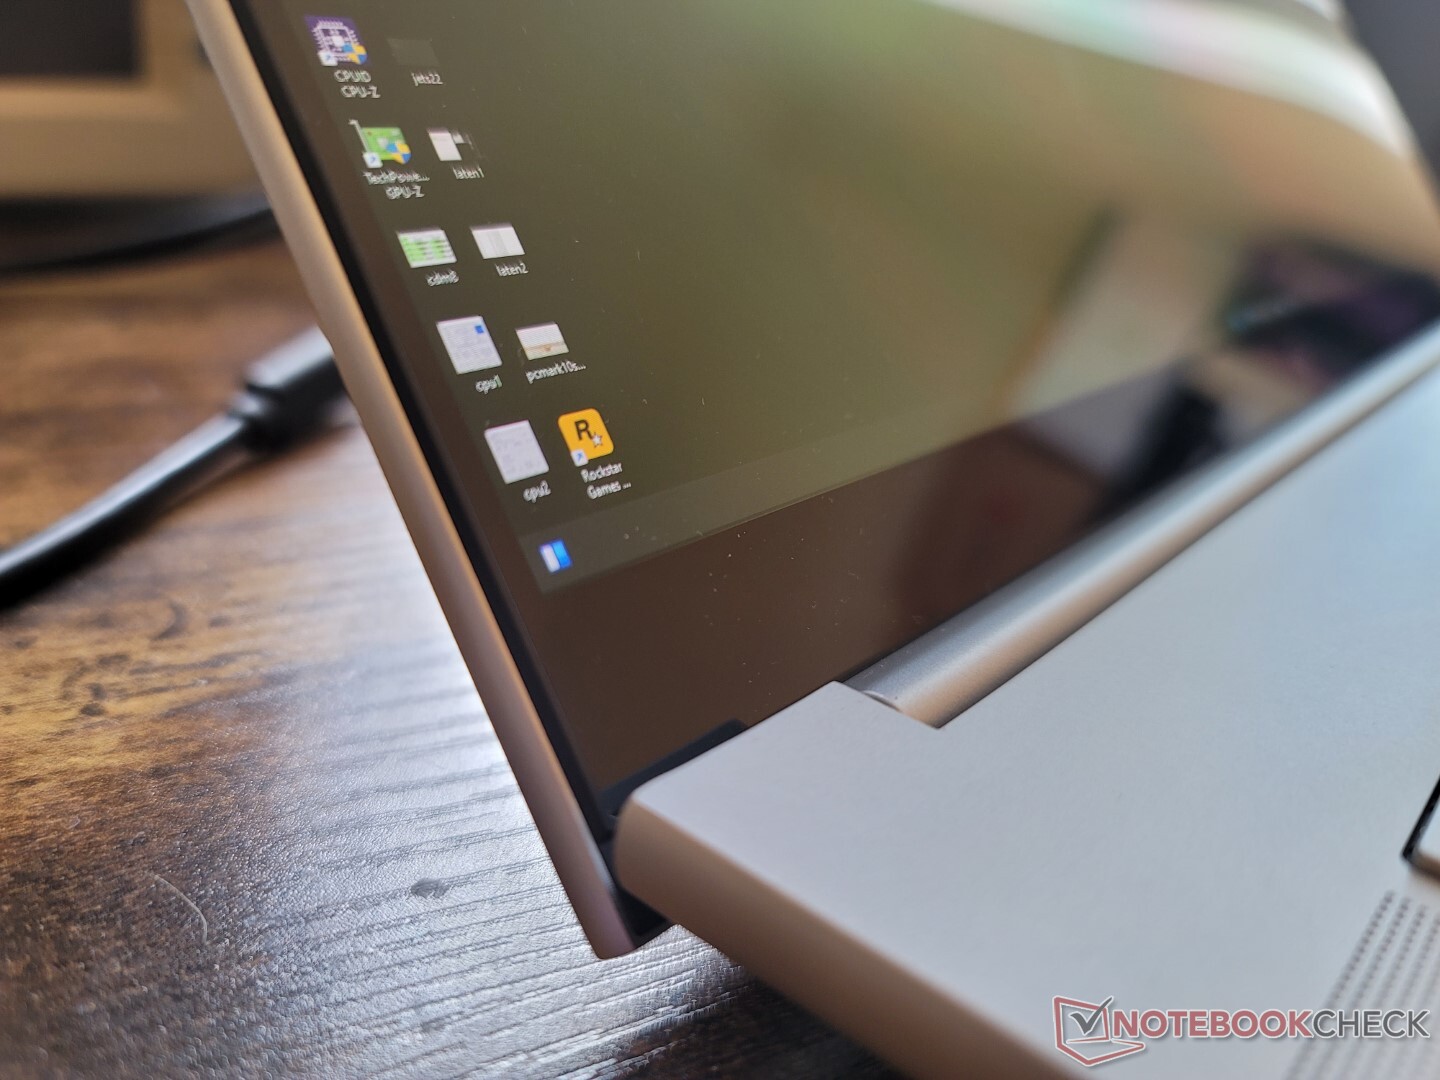
Chassikvaliteten är fortfarande lika stark som den 2020 Envy 15 trots den ökade storleken. Basen uppvisar endast mindre vridningar och förvrängningar och locket är ganska styvt på grund av glaset från kant till kant och baksidan av aluminium. Gångjärnen kunde dock ha varit styvare, eftersom locket vacklar när man justerar vinklarna mer än på ZenBook Pro serien eller Razer Blade 15.
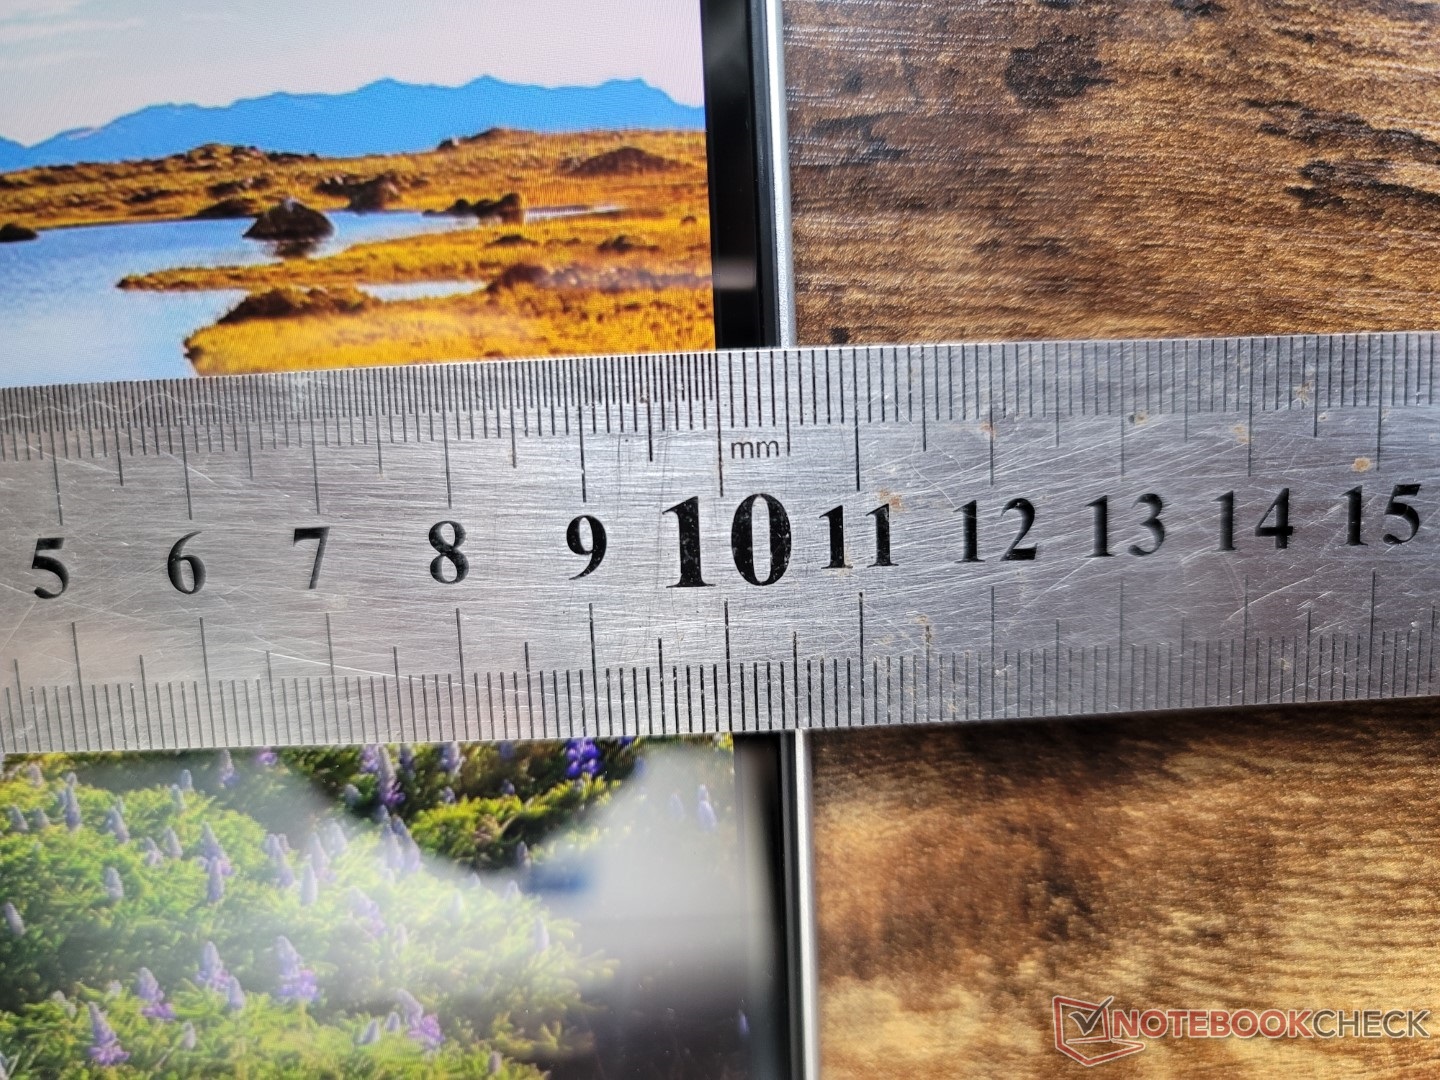
2022 års modell är tjockare, tyngre och större än 2020 års modell, vilket framgår av jämförelsetabellen nedan. Den större storleken är kanske inte oväntad med tanke på hoppet från en 15,6-tumsformfaktor till en 16-tumsformfaktor. Trots detta är HP fortfarande något större och tyngre än många konkurrerande 16-tums bärbara multimedie-datorer med 16-tumsformat, inklusive MacBook Pro 16, Huawei MateBook 16s, ellerDell Inspiron 16 Plus 7610.

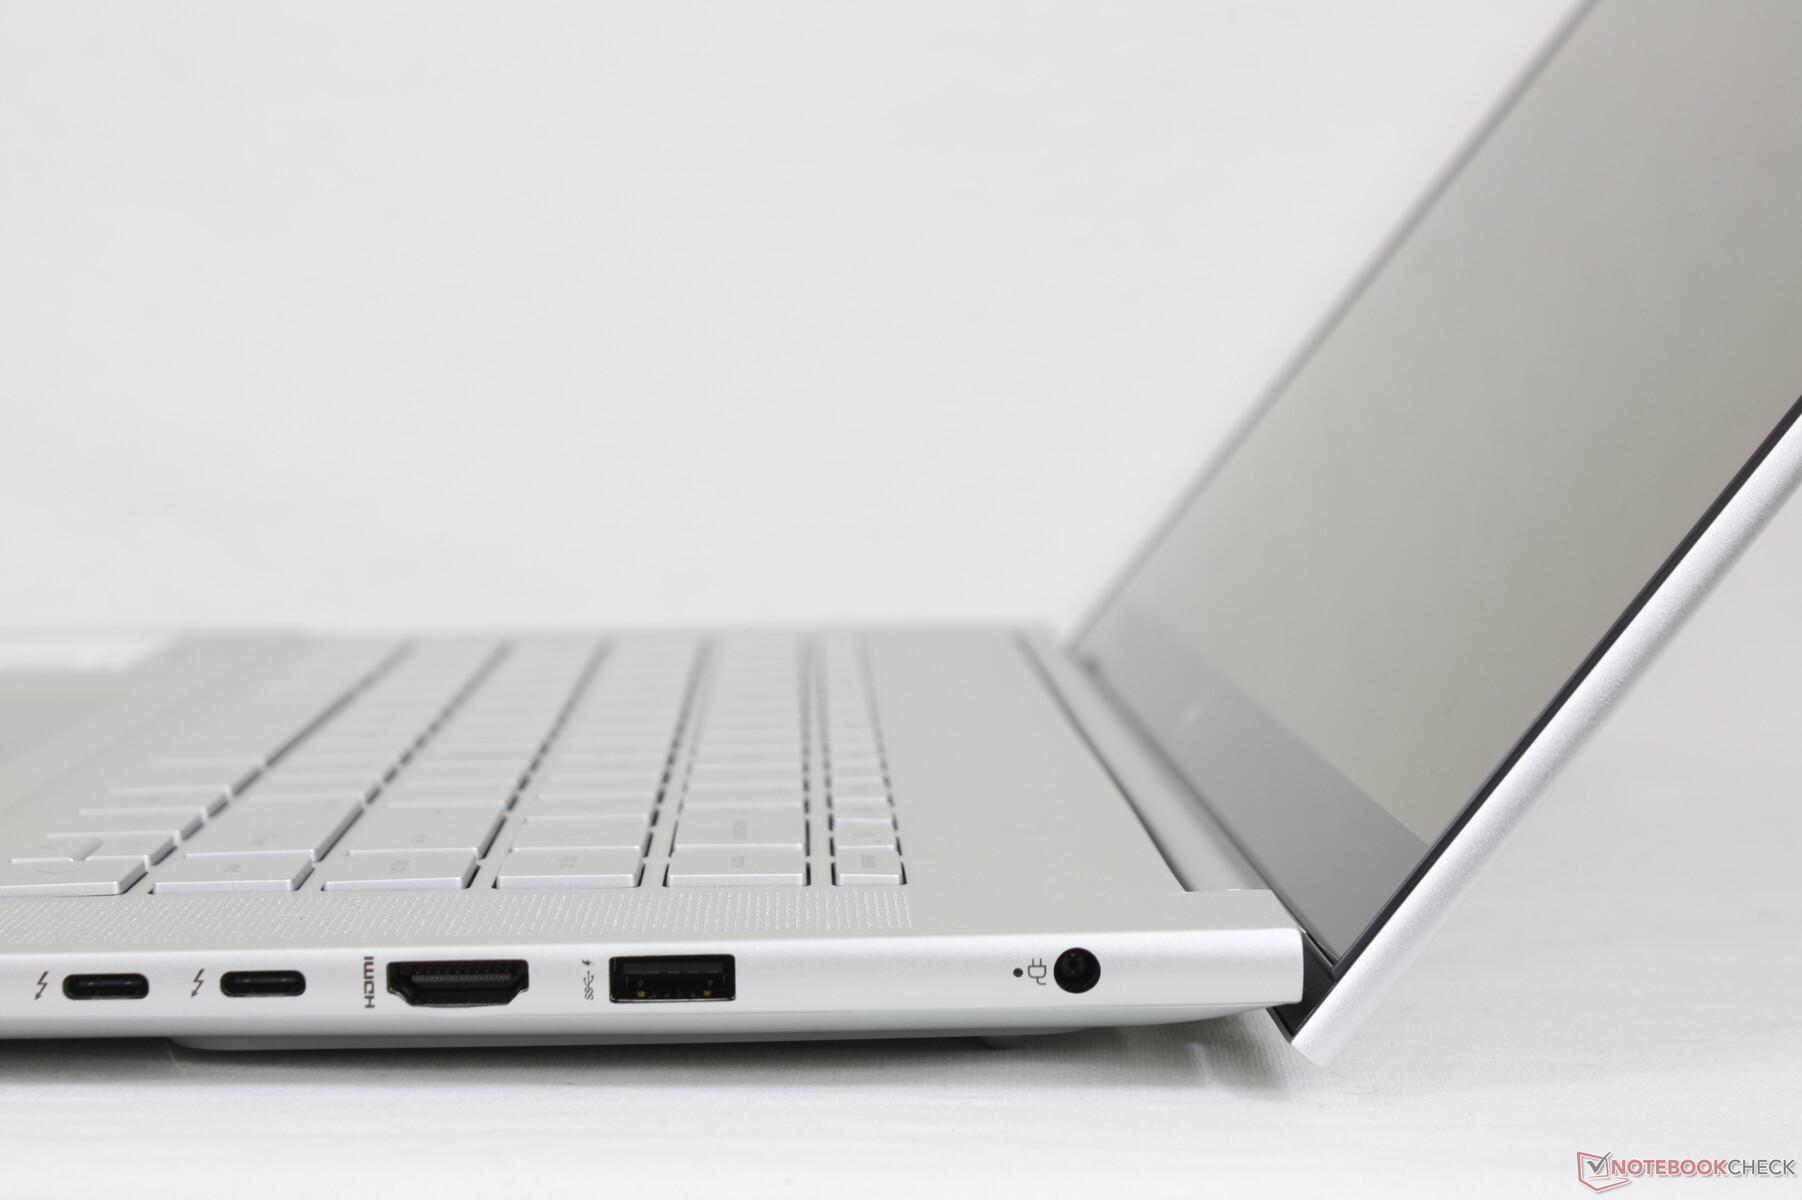
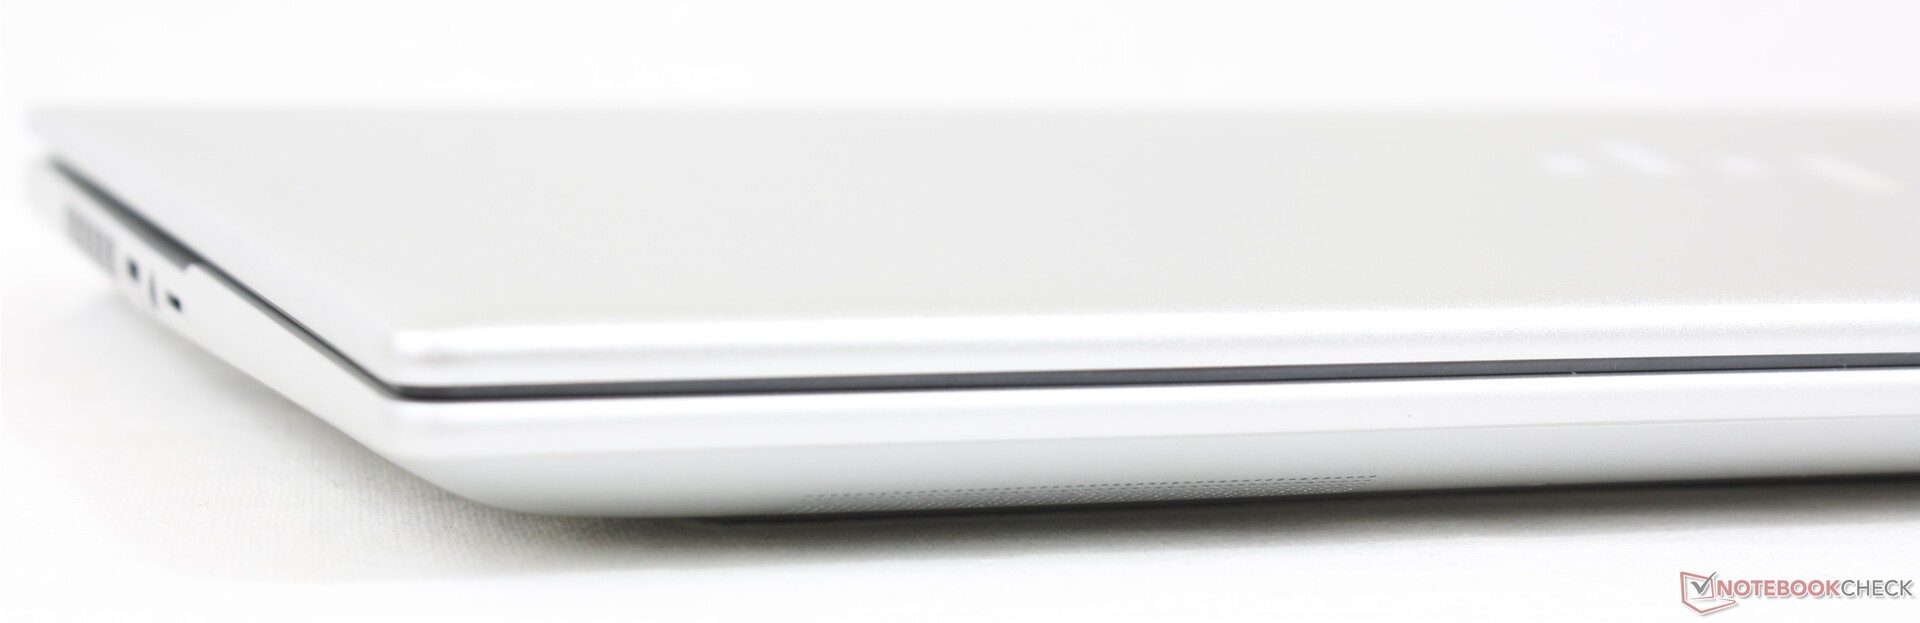
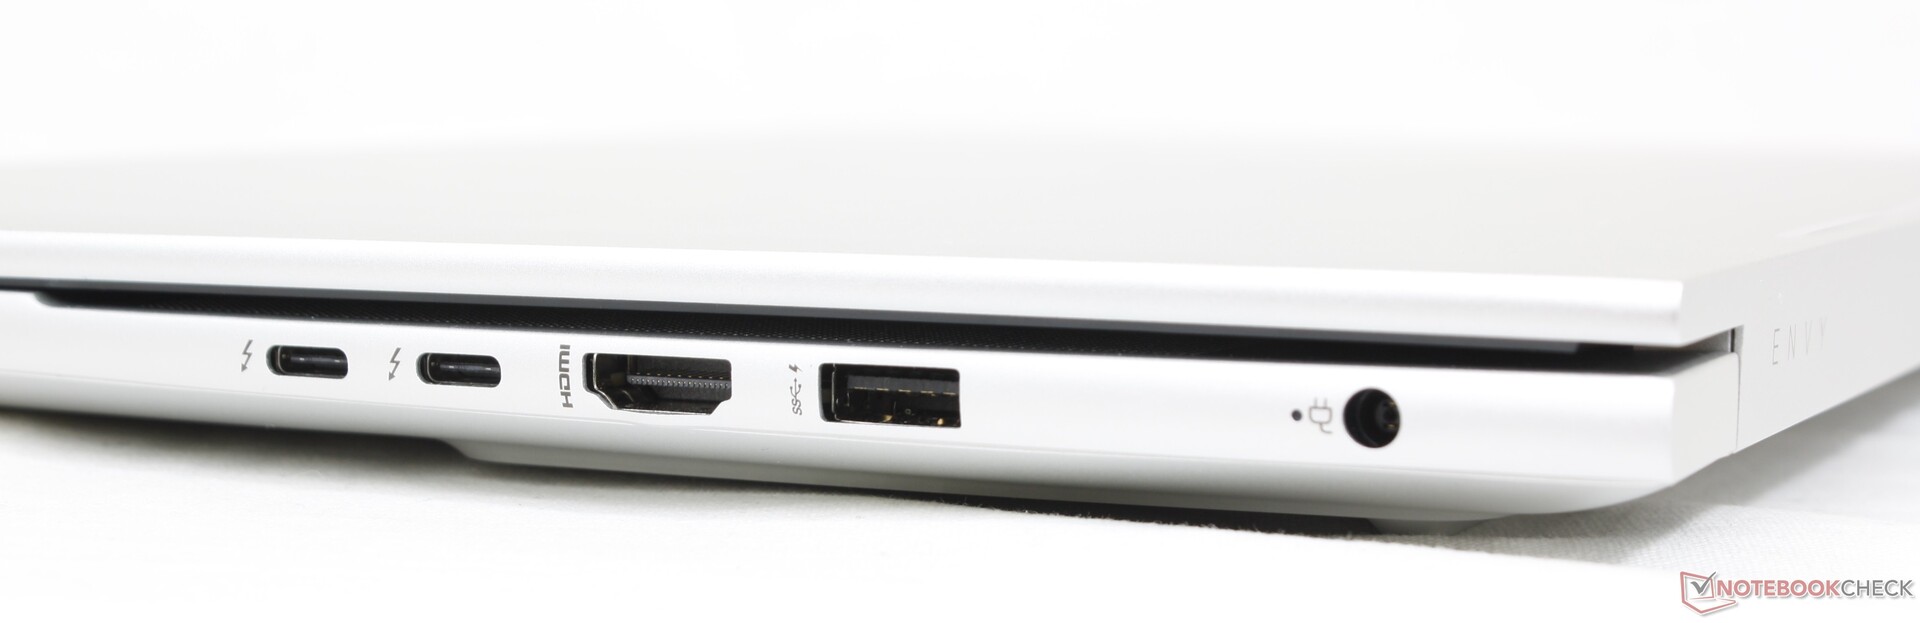
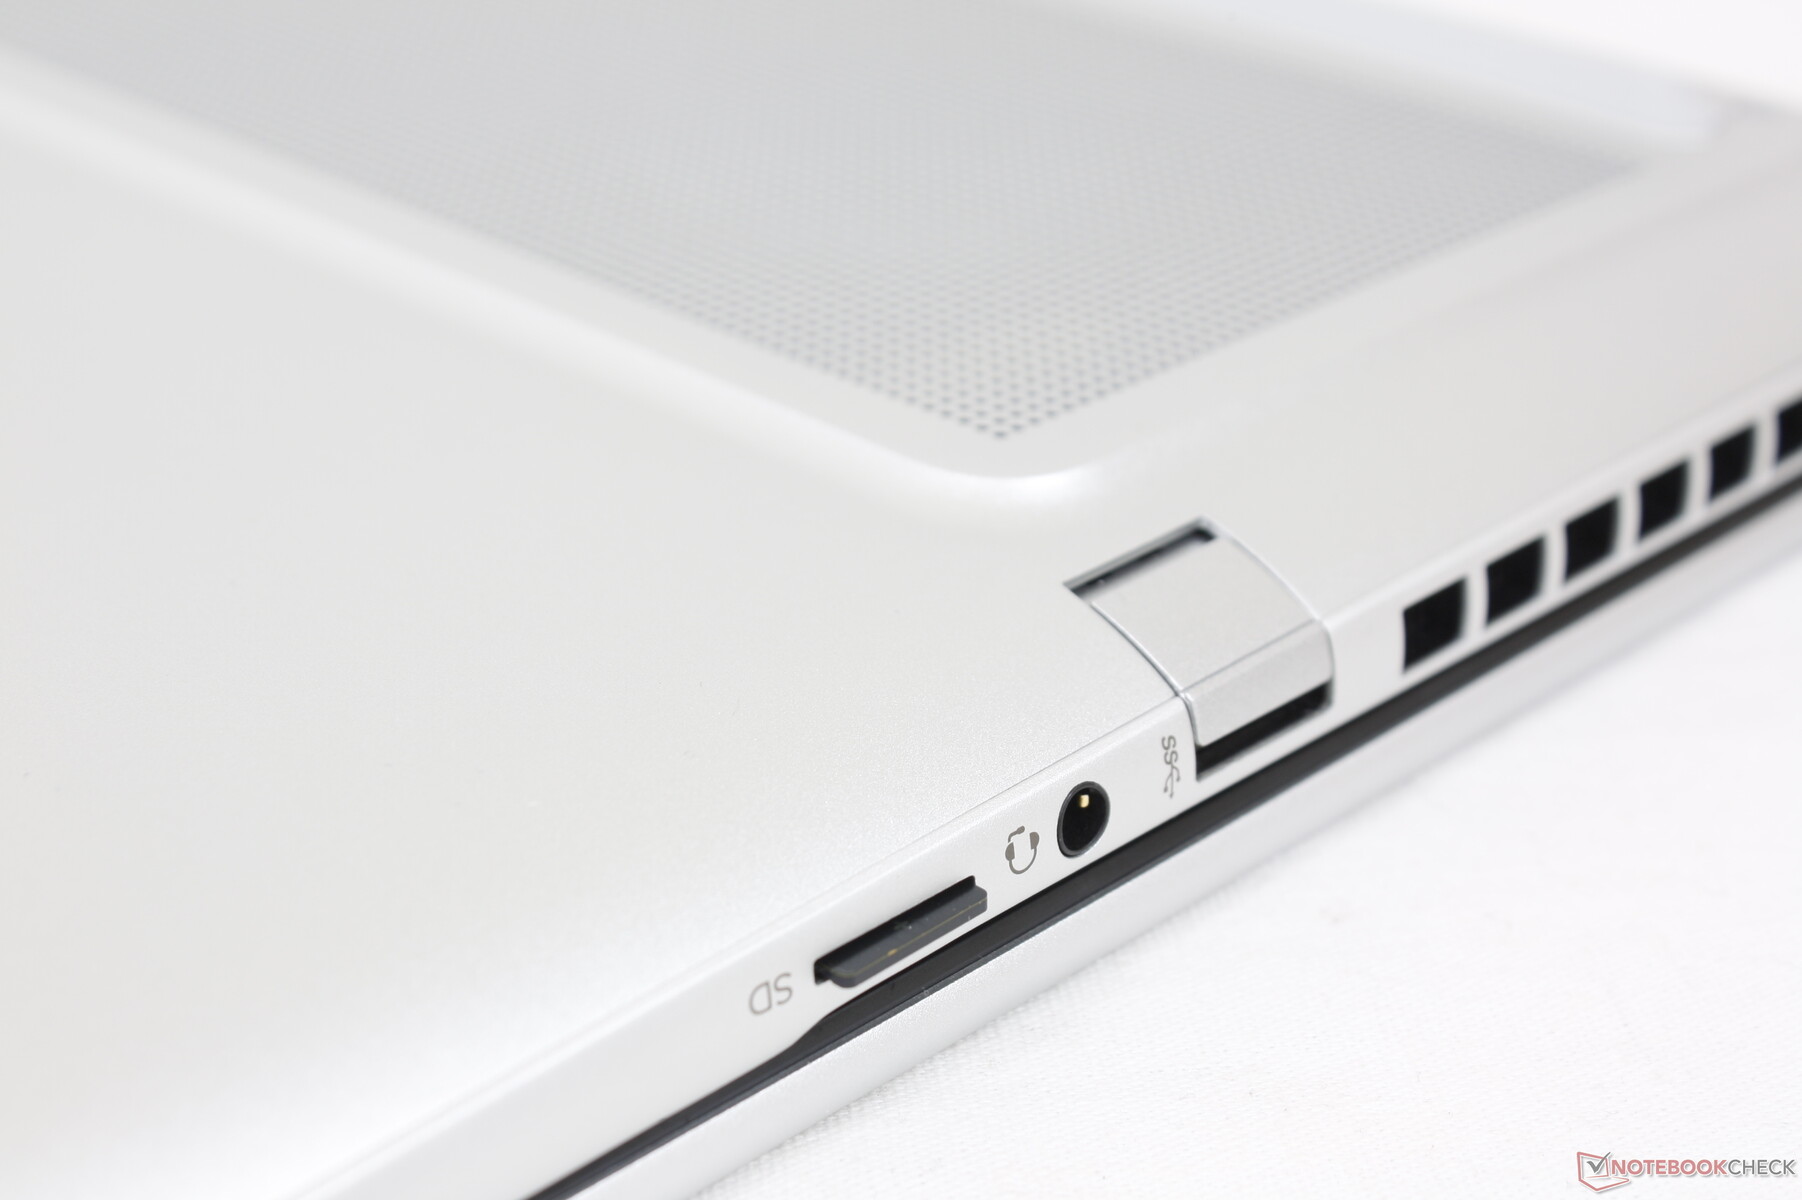
Anslutningsmöjligheter - Thunderbolt 4 Support Standard
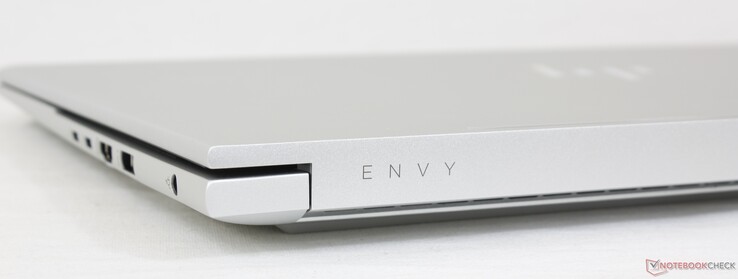
Alla portar från Envy 15 från 2020 har återkommit i denna 2022 års version, om än i en ny ordning. Majoriteten av portarna är nu placerade längs chassits högra kant i stället för den vänstra, på gott och ont. Det finns irriterande nog fortfarande inget Kensington-låsfack.
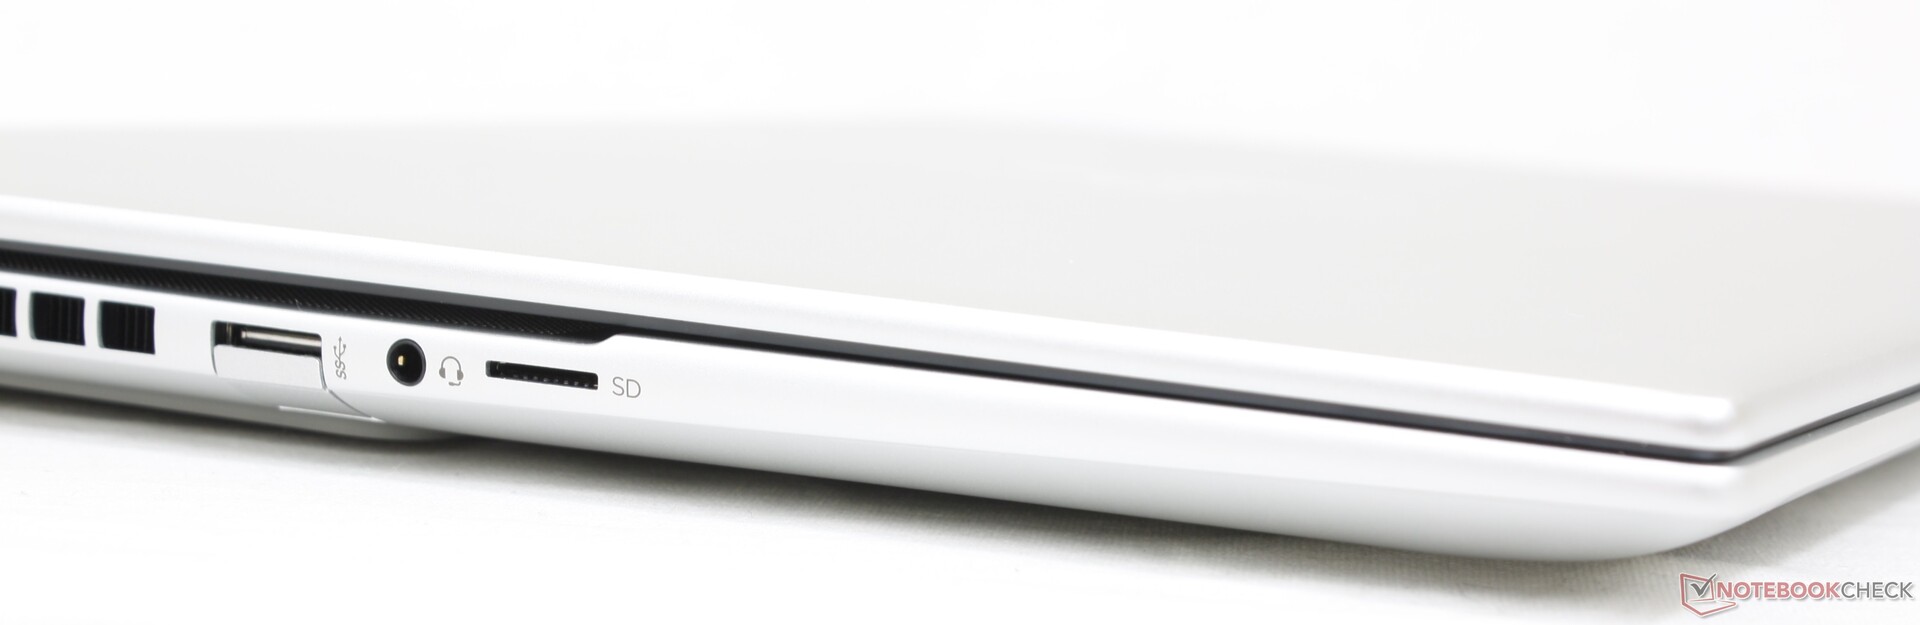
SD-kortläsare
Överföringshastigheten från den integrerade MicroSD-läsaren är genomsnittlig. Att flytta 1 GB bilder från vårt UHS-II-testkort till skrivbordet tar cirka 17 sekunder.
| SD Card Reader | |
| average JPG Copy Test (av. of 3 runs) | |
| Apple MacBook Pro 16 2021 M1 Pro (Angelbird AV Pro V60) | |
| Lenovo ThinkBook 16 G4+ IAP (Angelbird AV Pro V60) | |
| MSI Creator Z16P B12UHST (AV PRO microSD 128 GB V60) | |
| HP Envy 16 h0112nr (AV Pro SD microSD 128 GB V60) | |
| Dell Inspiron 16 Plus 7610-MHJ8F (AV Pro SD microSD 128 GB V60) | |
| maximum AS SSD Seq Read Test (1GB) | |
| Lenovo ThinkBook 16 G4+ IAP (Angelbird AV Pro V60) | |
| HP Envy 16 h0112nr (AV Pro SD microSD 128 GB V60) | |
| Dell Inspiron 16 Plus 7610-MHJ8F (AV Pro SD microSD 128 GB V60) | |
Kommunikation
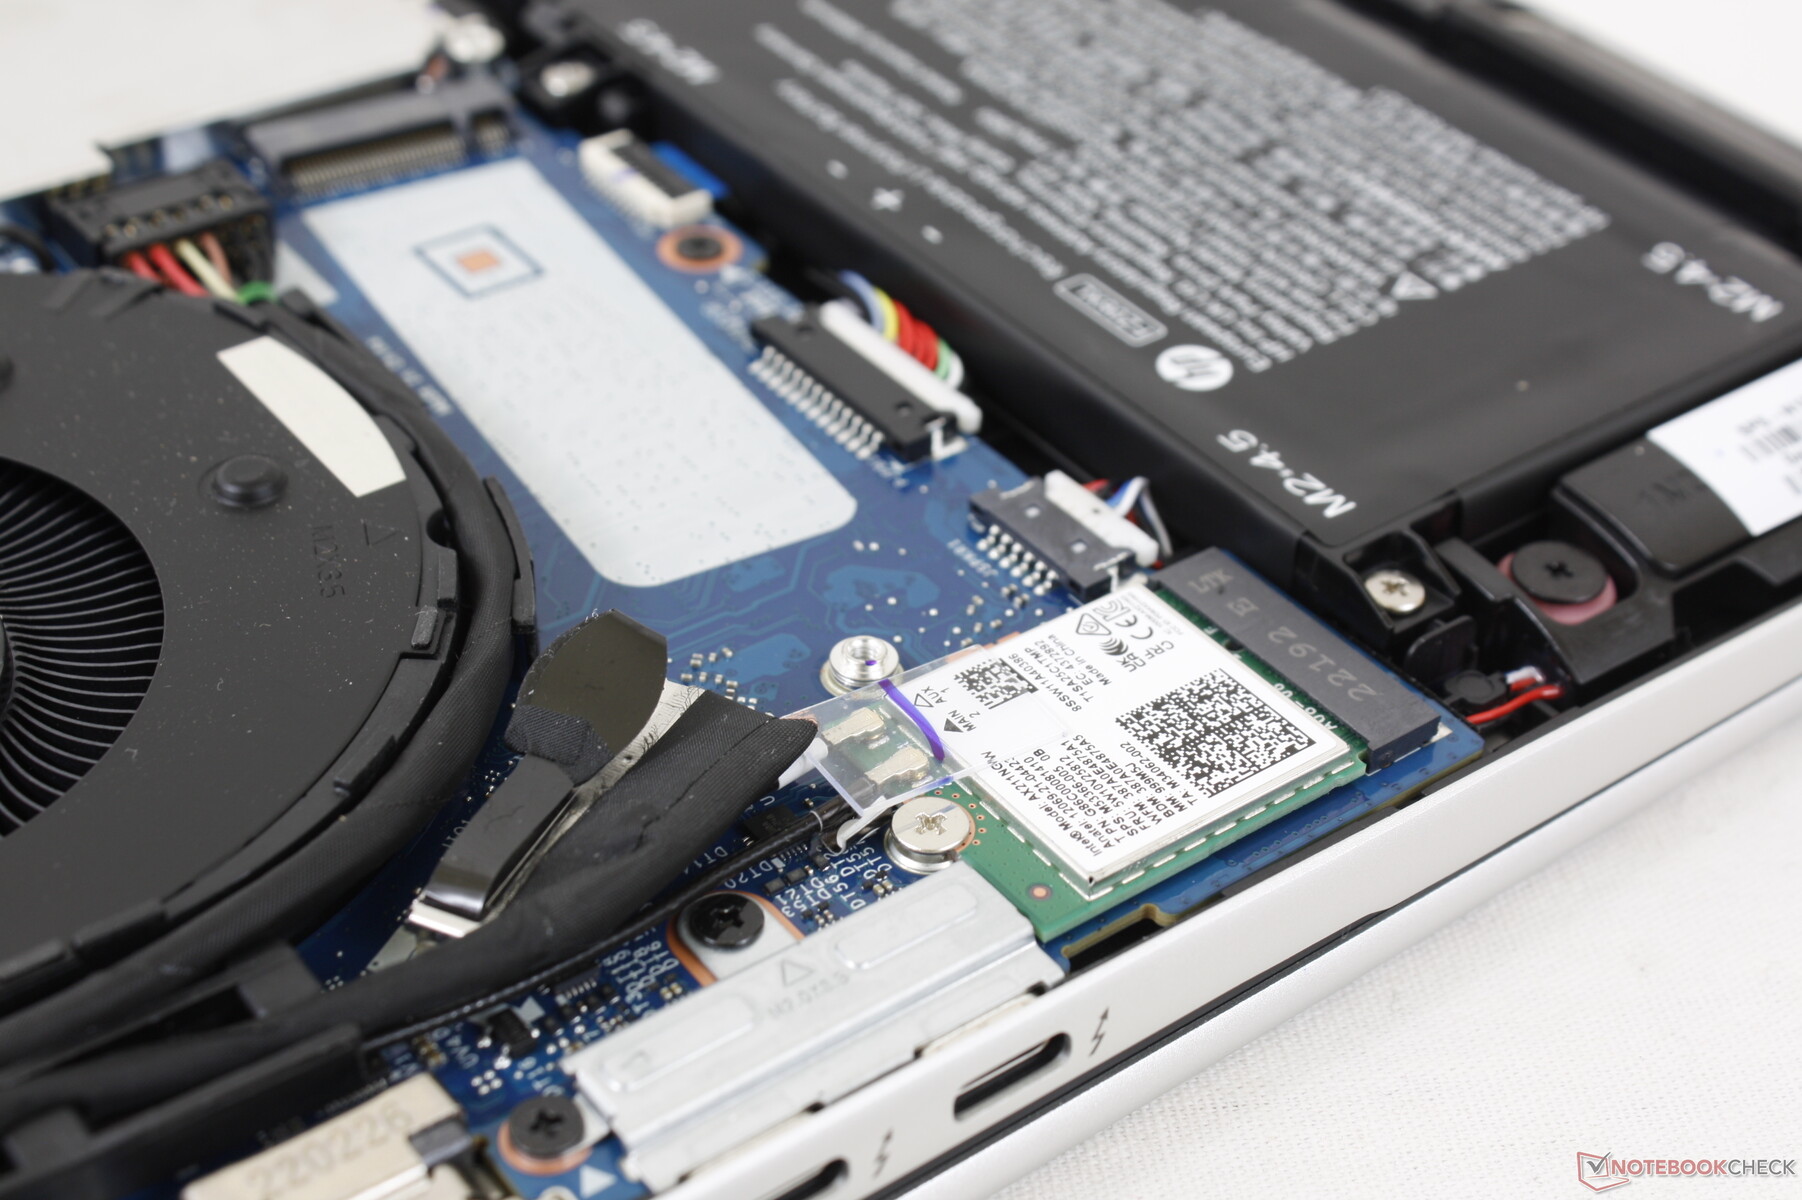
En Intel AX211 är standard för Wi-Fi 6E och Bluetooth 5.2. Vi upplevde inga tillförlitlighetsproblem när vi kopplade till vårt 6 GHz-nätverk.
| Networking | |
| iperf3 transmit AX12 | |
| Dell Inspiron 16 Plus 7610-MHJ8F | |
| Apple MacBook Pro 16 2021 M1 Pro | |
| iperf3 receive AX12 | |
| Dell Inspiron 16 Plus 7610-MHJ8F | |
| Apple MacBook Pro 16 2021 M1 Pro | |
| iperf3 receive AXE11000 6GHz | |
| Huawei MateBook 16s i7 | |
| HP Envy 16 h0112nr | |
| iperf3 receive AXE11000 | |
| MSI Creator Z16P B12UHST | |
| Lenovo ThinkBook 16 G4+ IAP | |
| Apple MacBook Pro 16 2021 M1 Pro | |
| iperf3 transmit AXE11000 6GHz | |
| Huawei MateBook 16s i7 | |
| HP Envy 16 h0112nr | |
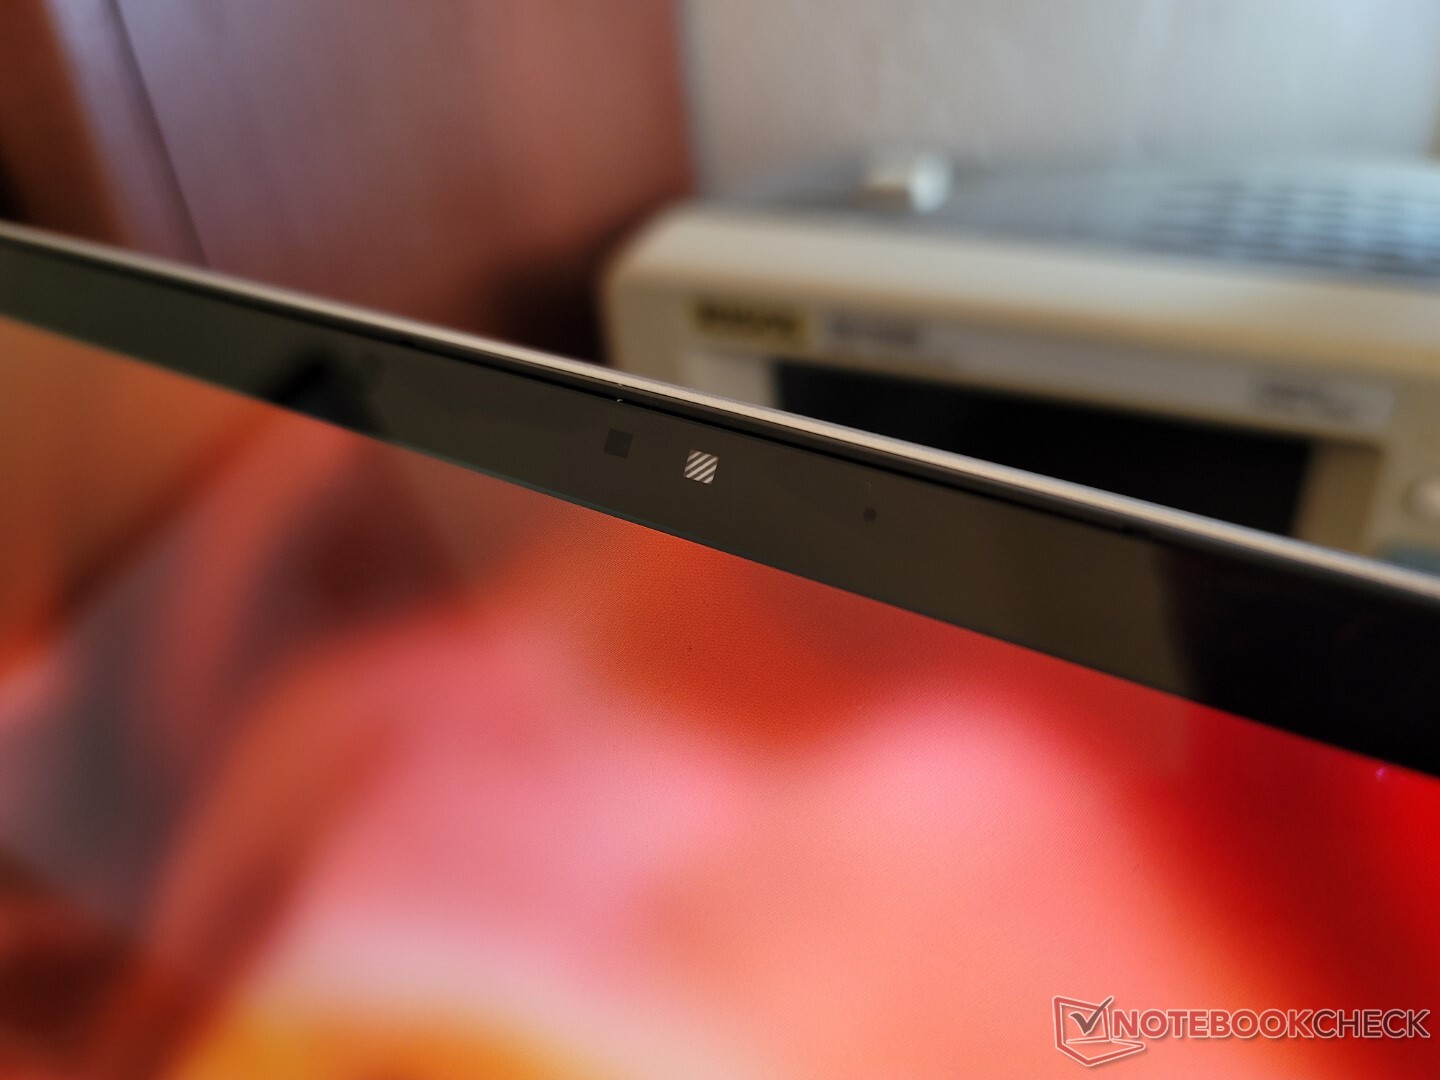
Webbkamera - 5 MP!
Systemet har en 5 MP-kamera som liknar den senaste Spectre och EliteBook-modeller. Bildkvaliteten är märkbart skarpare än på de flesta andra bärbara datorer där 1 MP- och 2 MP-webbkameror fortfarande är normen.
En webbkamerautlösare är standard, liksom IR för Hello-stöd.


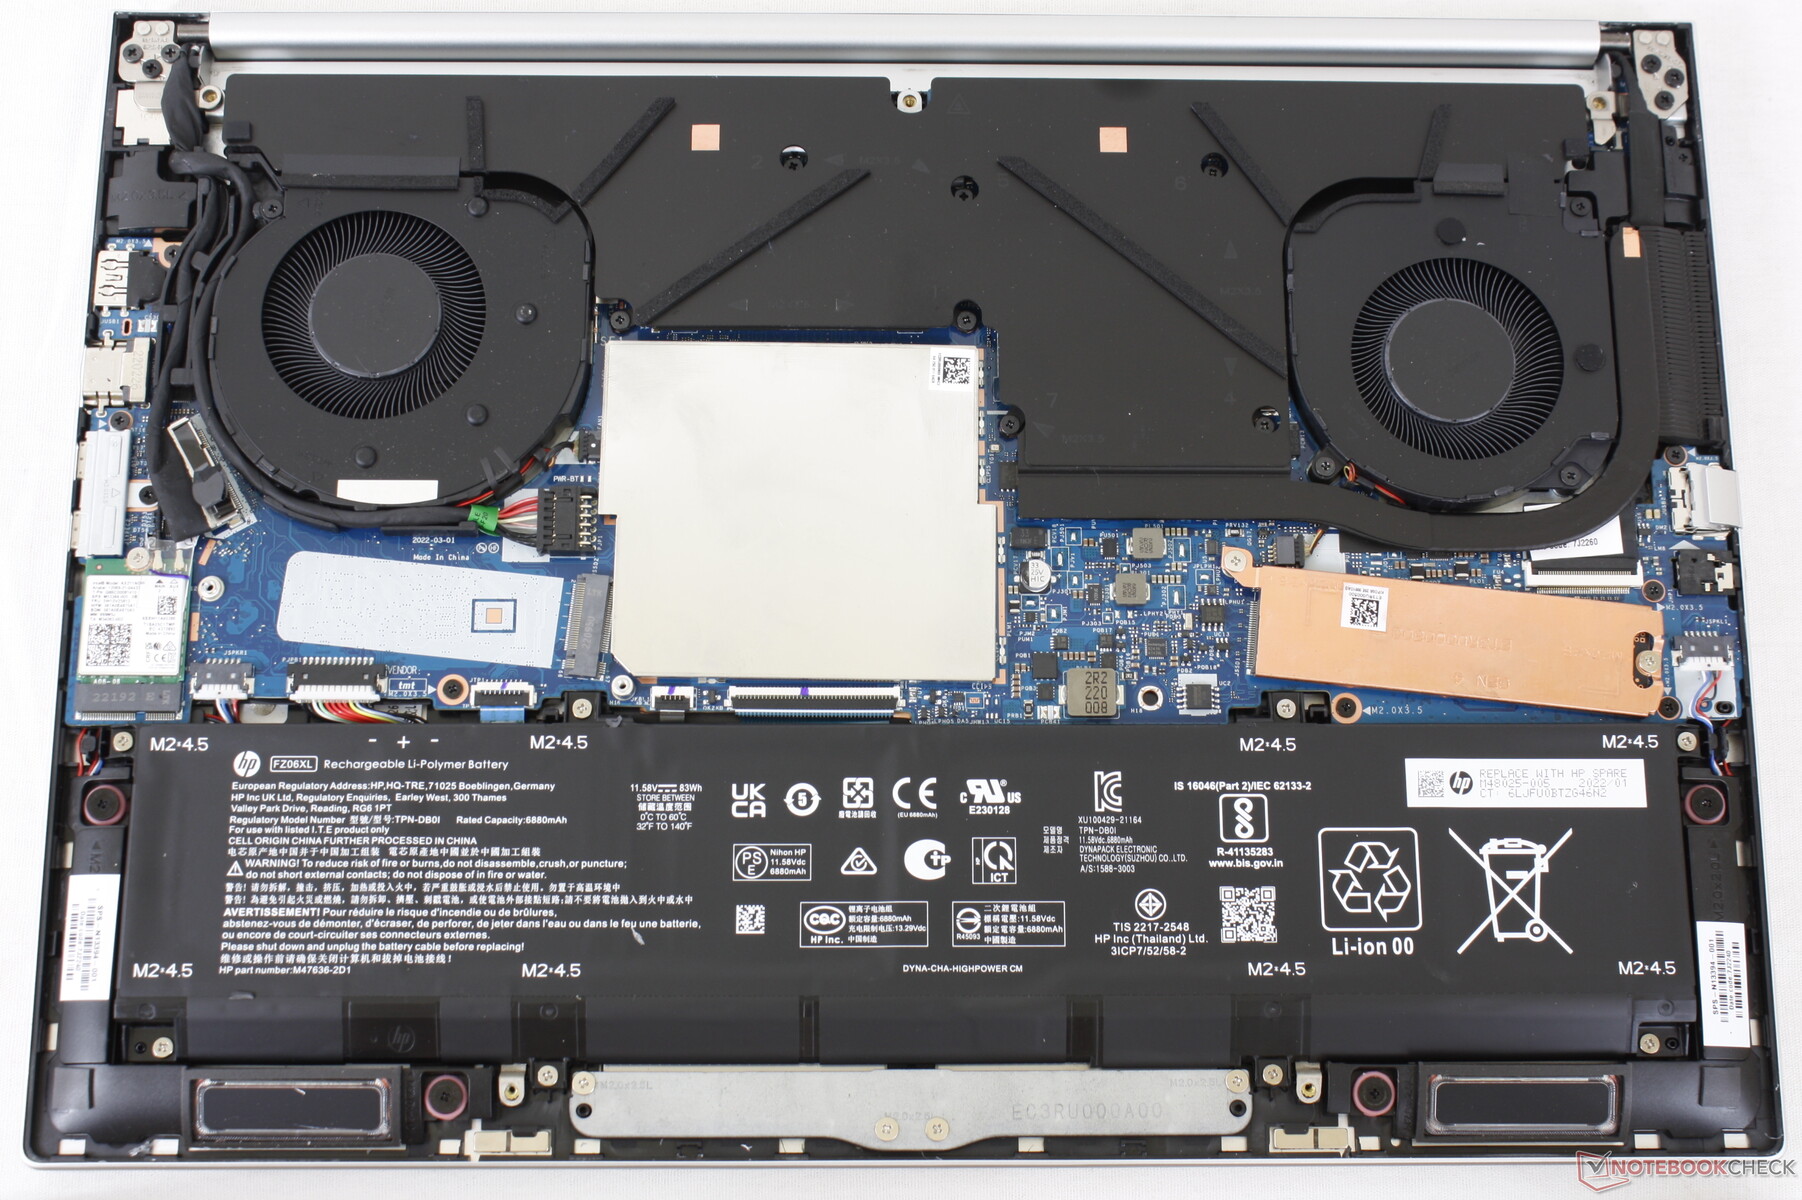
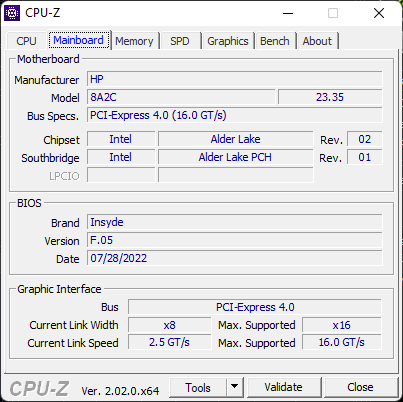
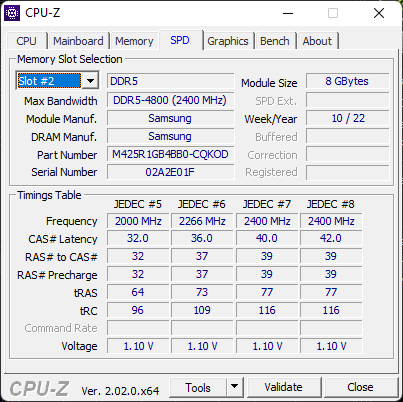
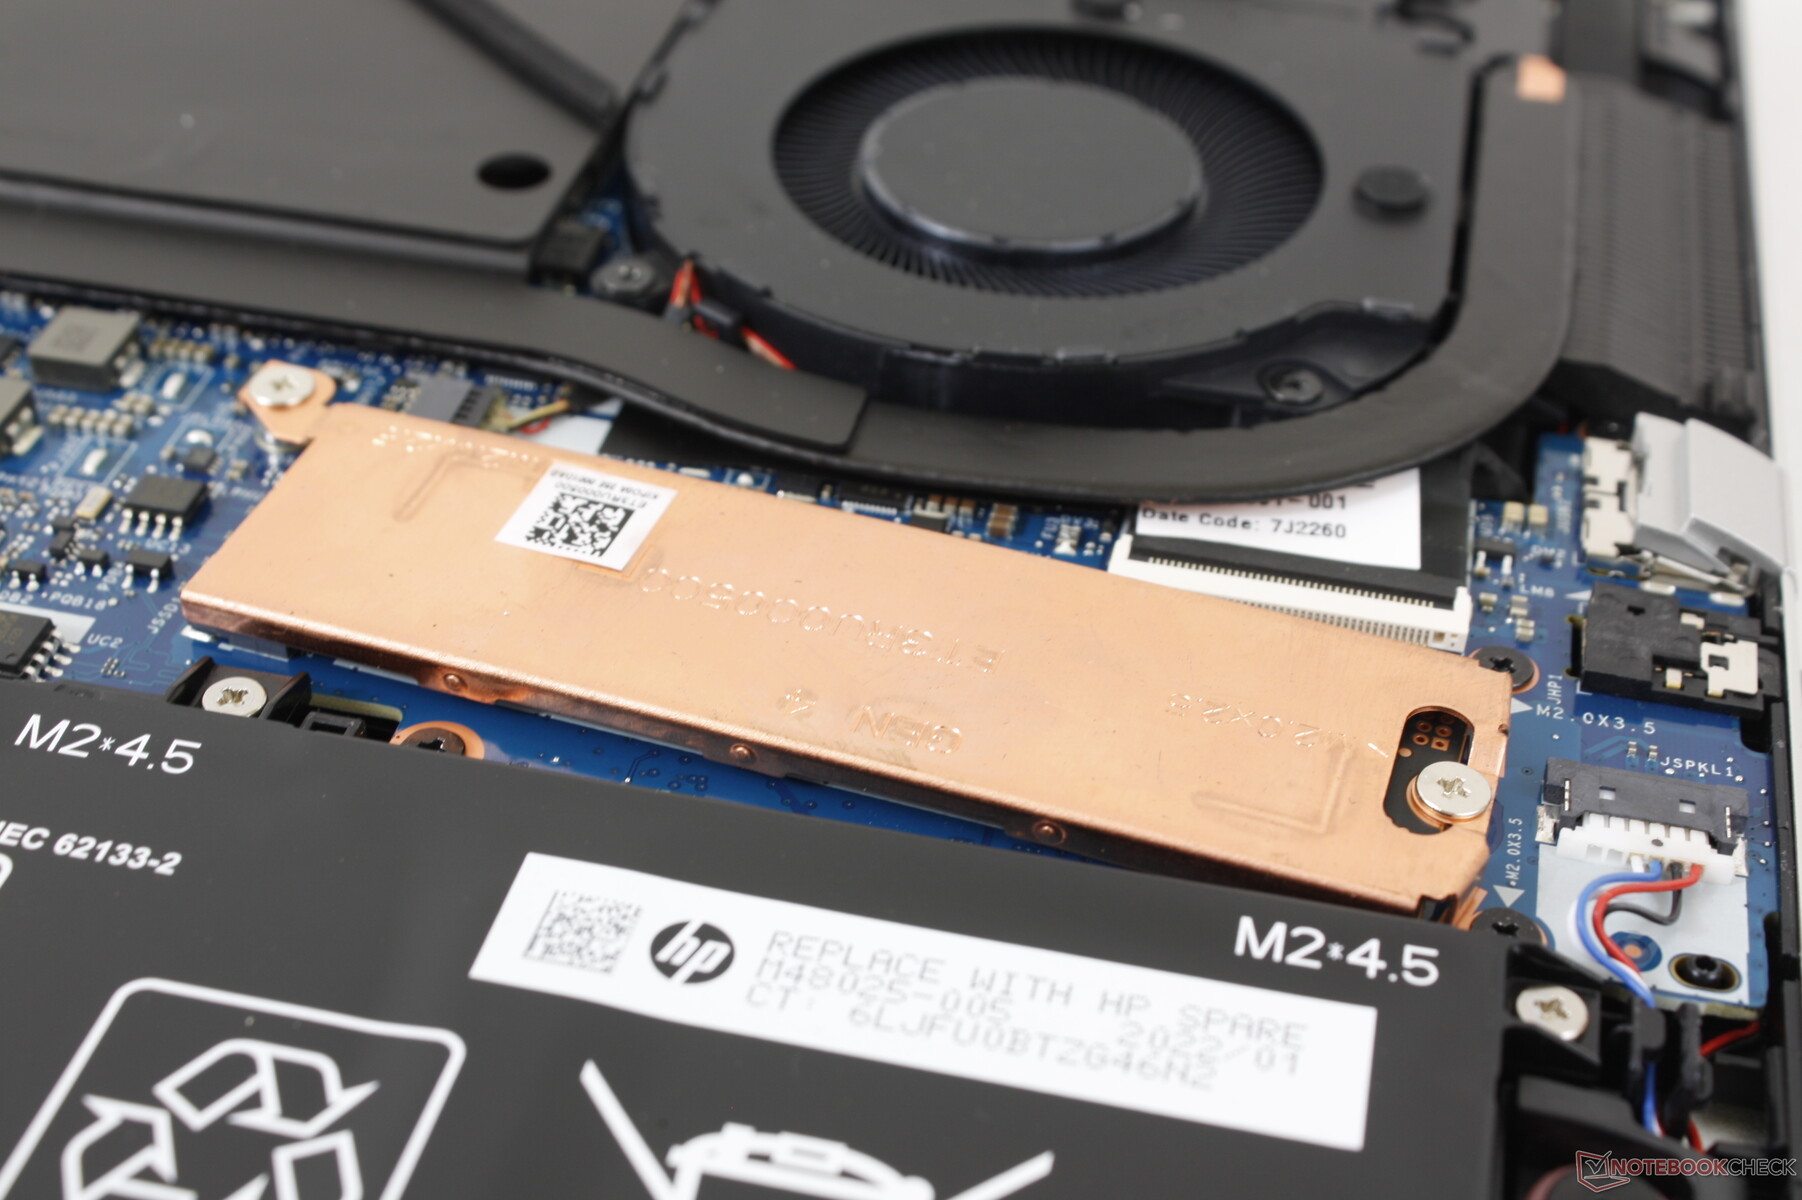
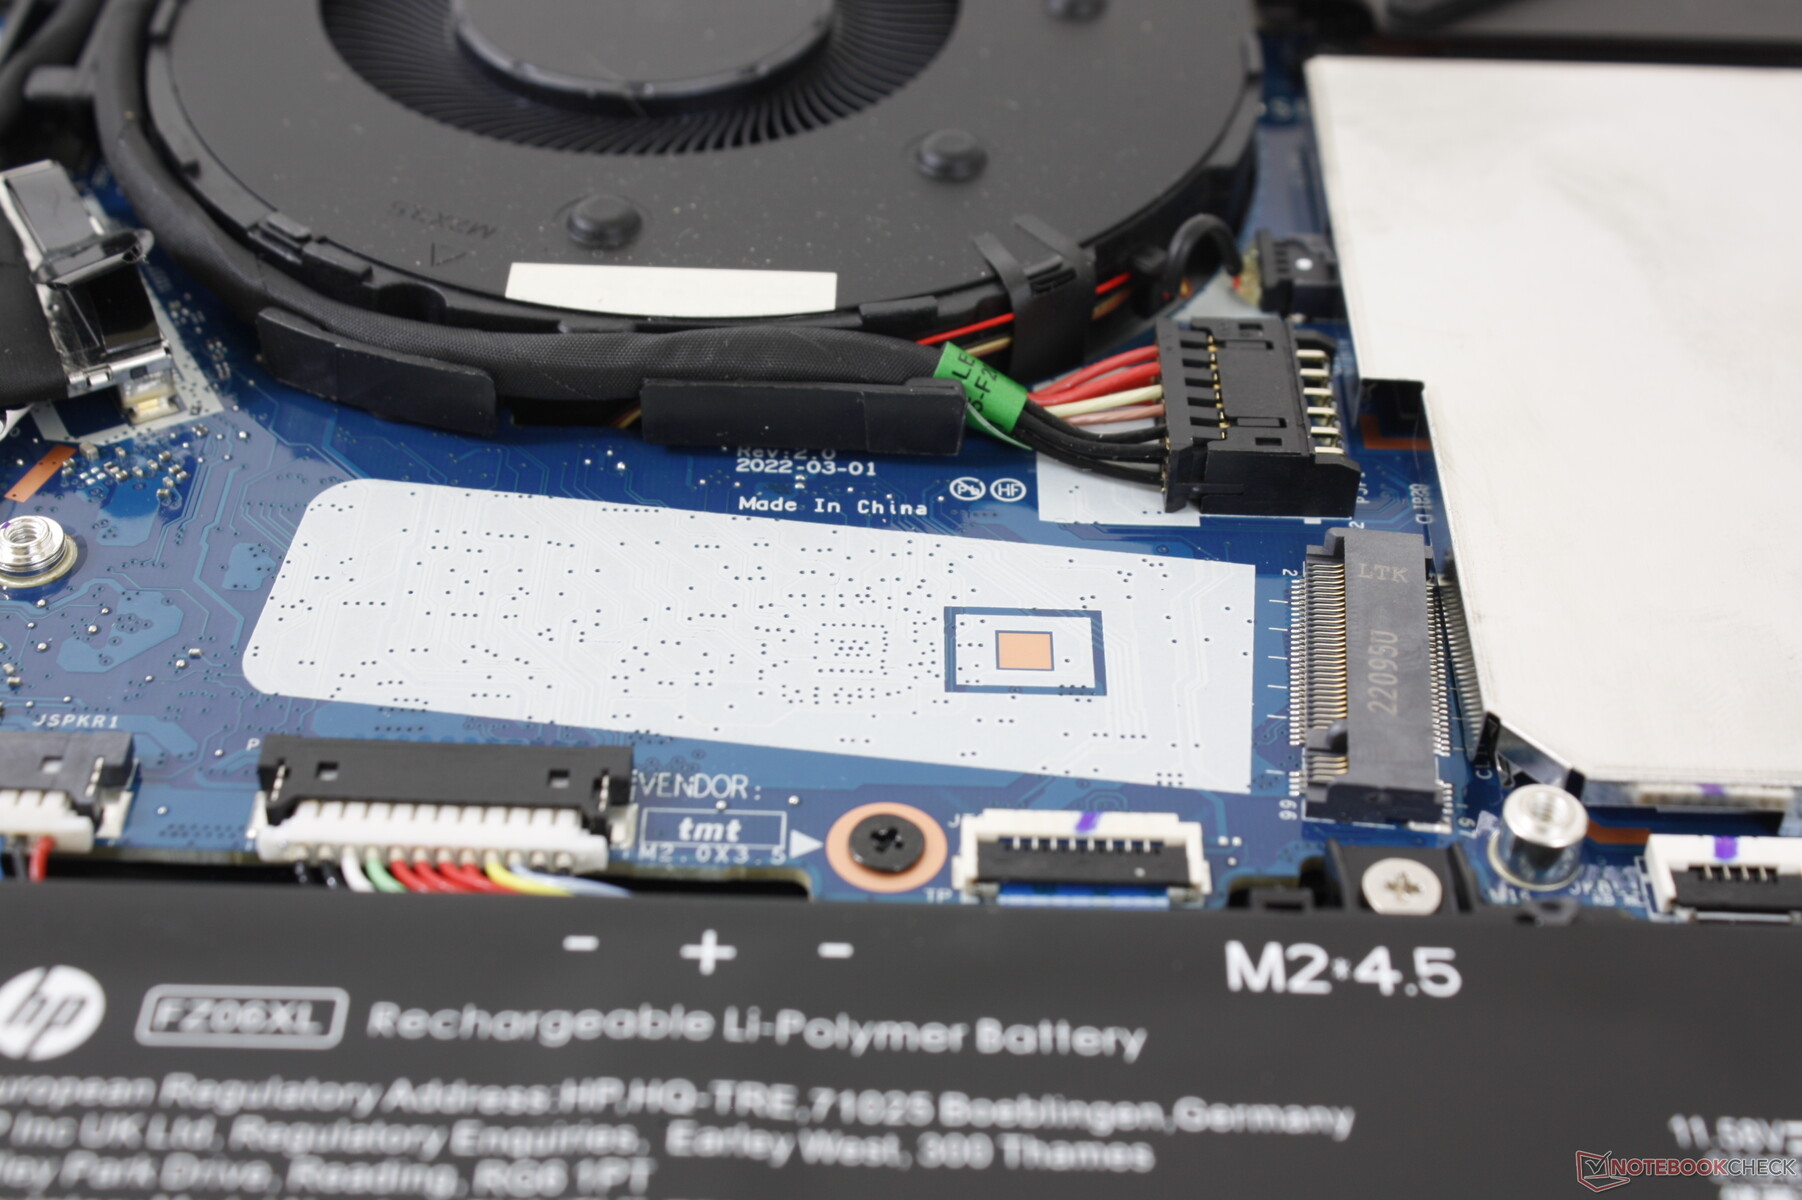
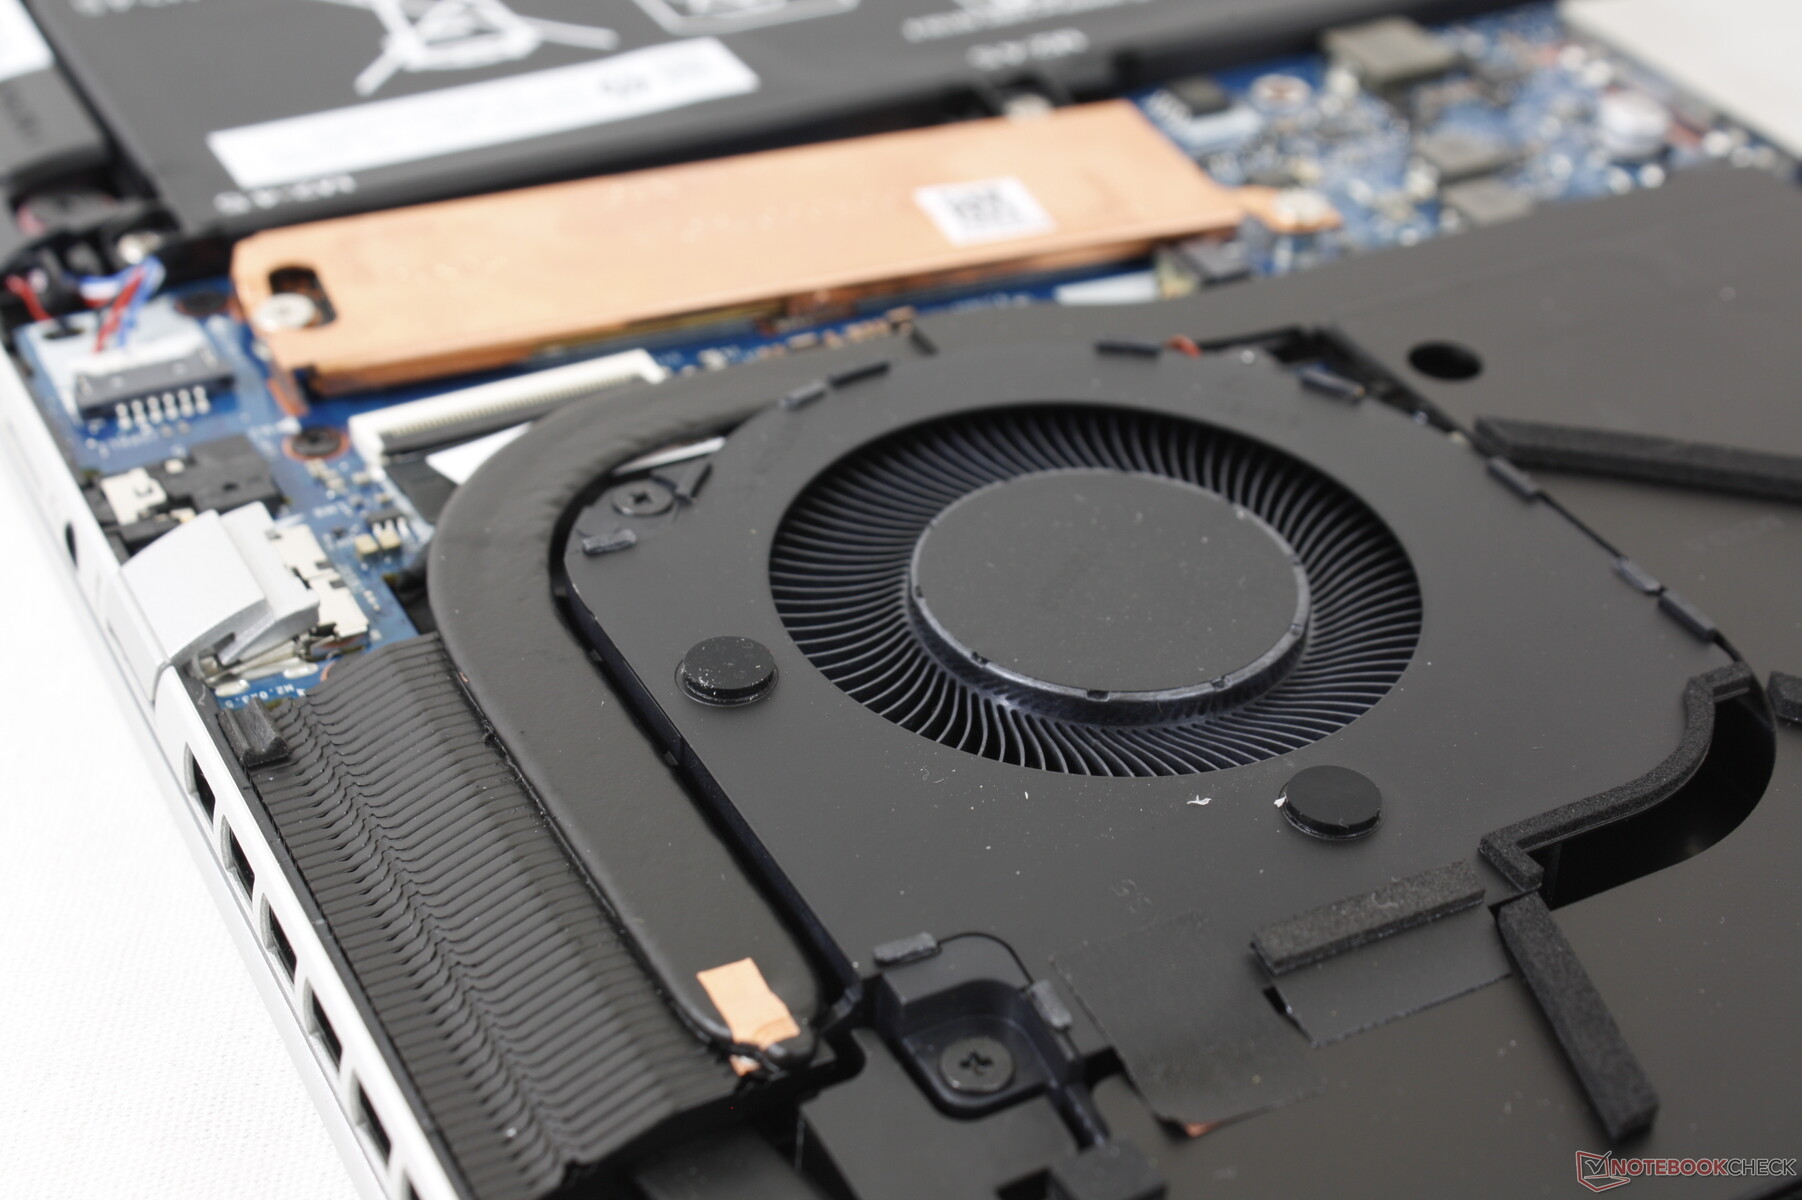
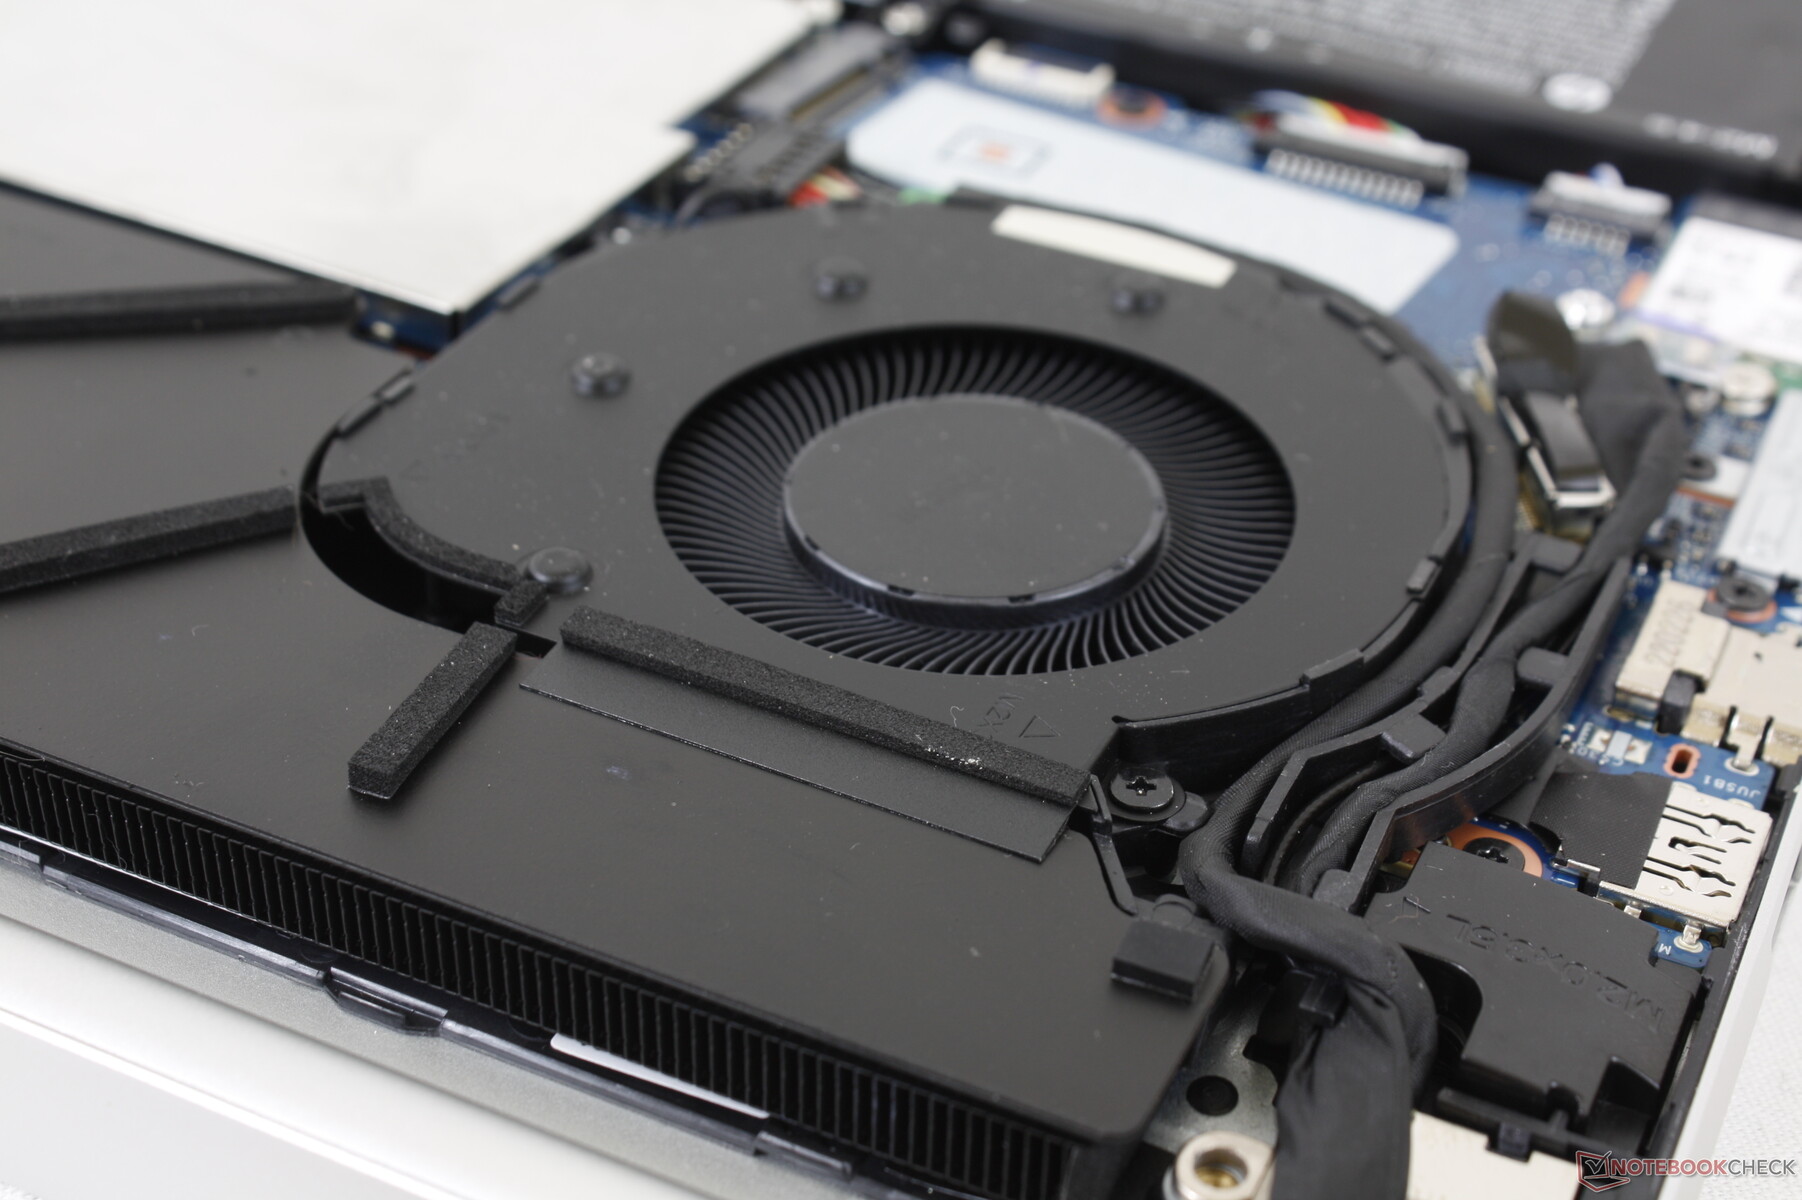
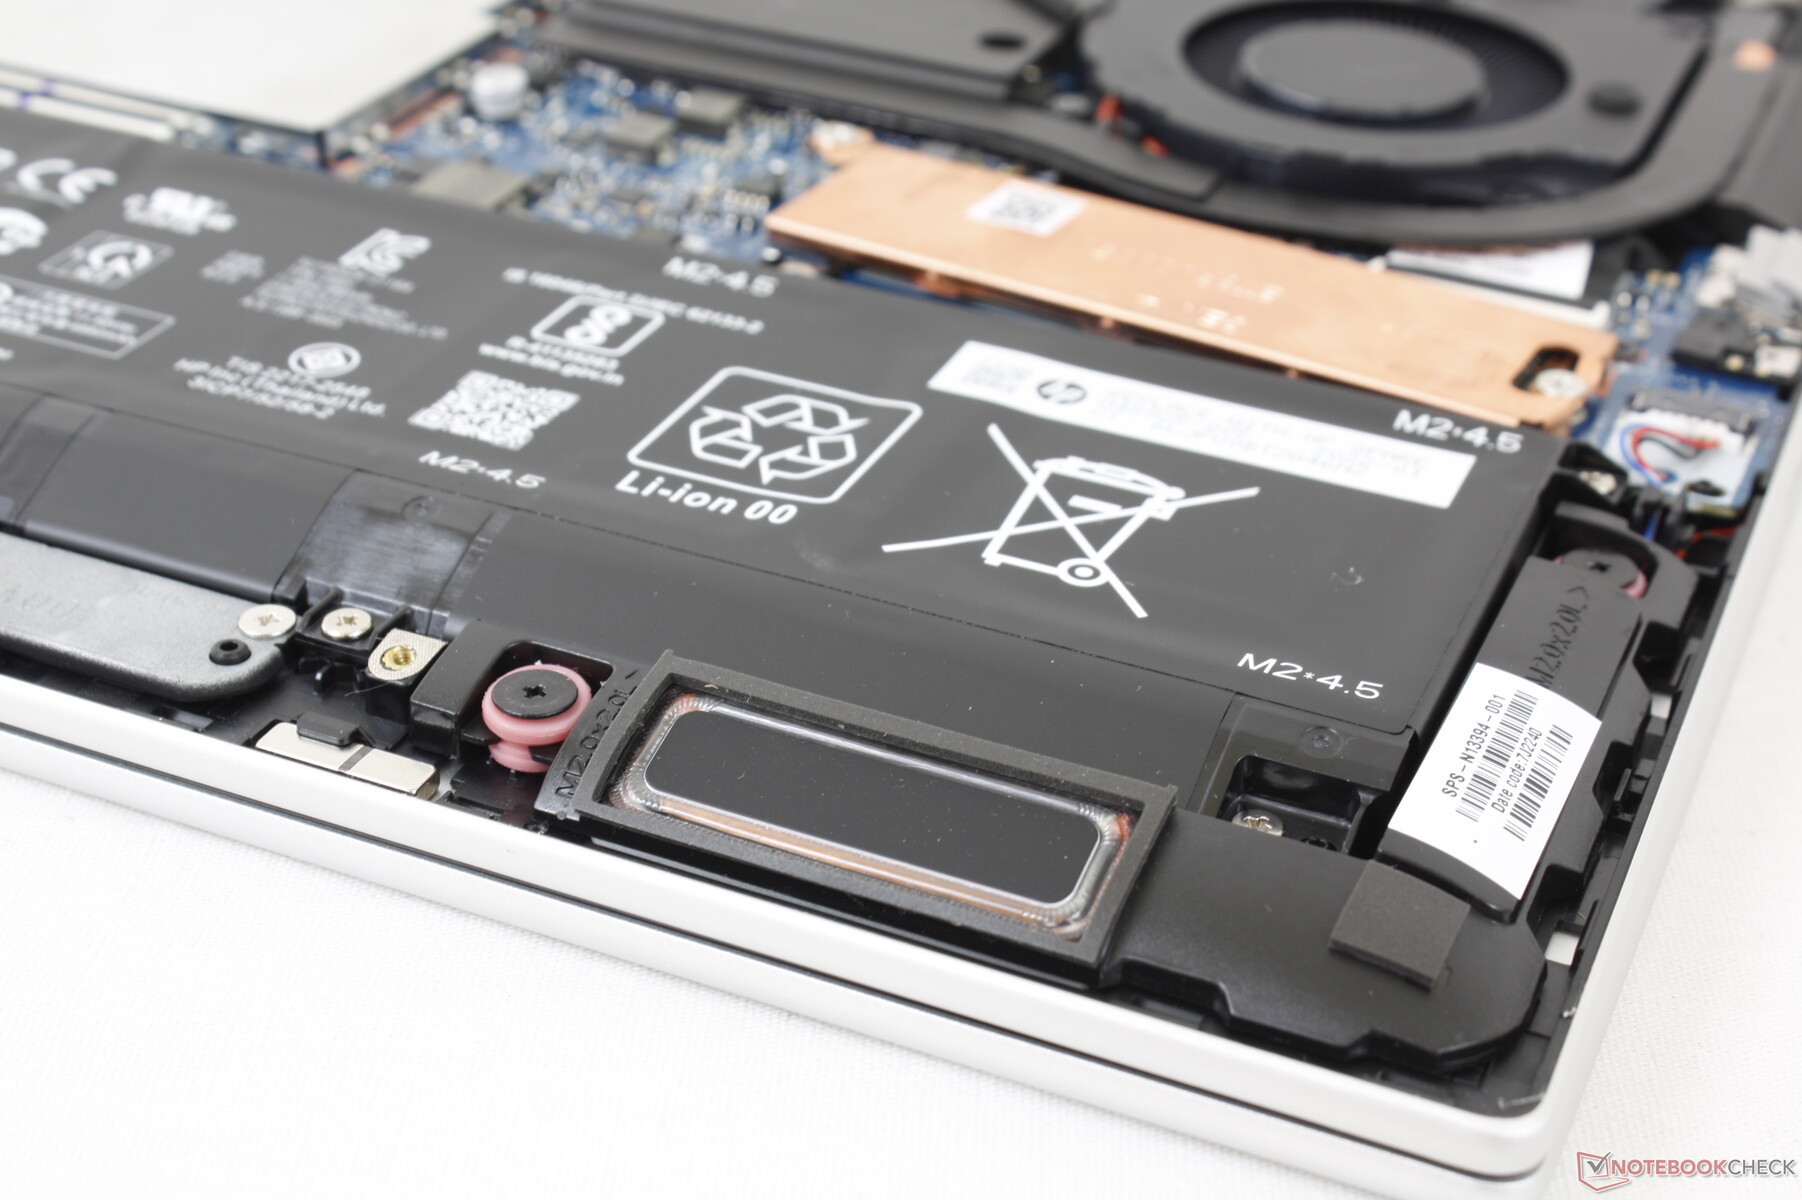
Underhåll
Bottenpanelen är säkrad med endast 5 Torxskruvar för enkel service. HP har faktiskt en mycket hjälpsam YouTube-video om hur man steg för steg tar isär den bärbara datorn. Användarna kan komma åt de två SODIMM-platserna, de två lagringsutrymmena och WLAN-modulen när de väl är inne.
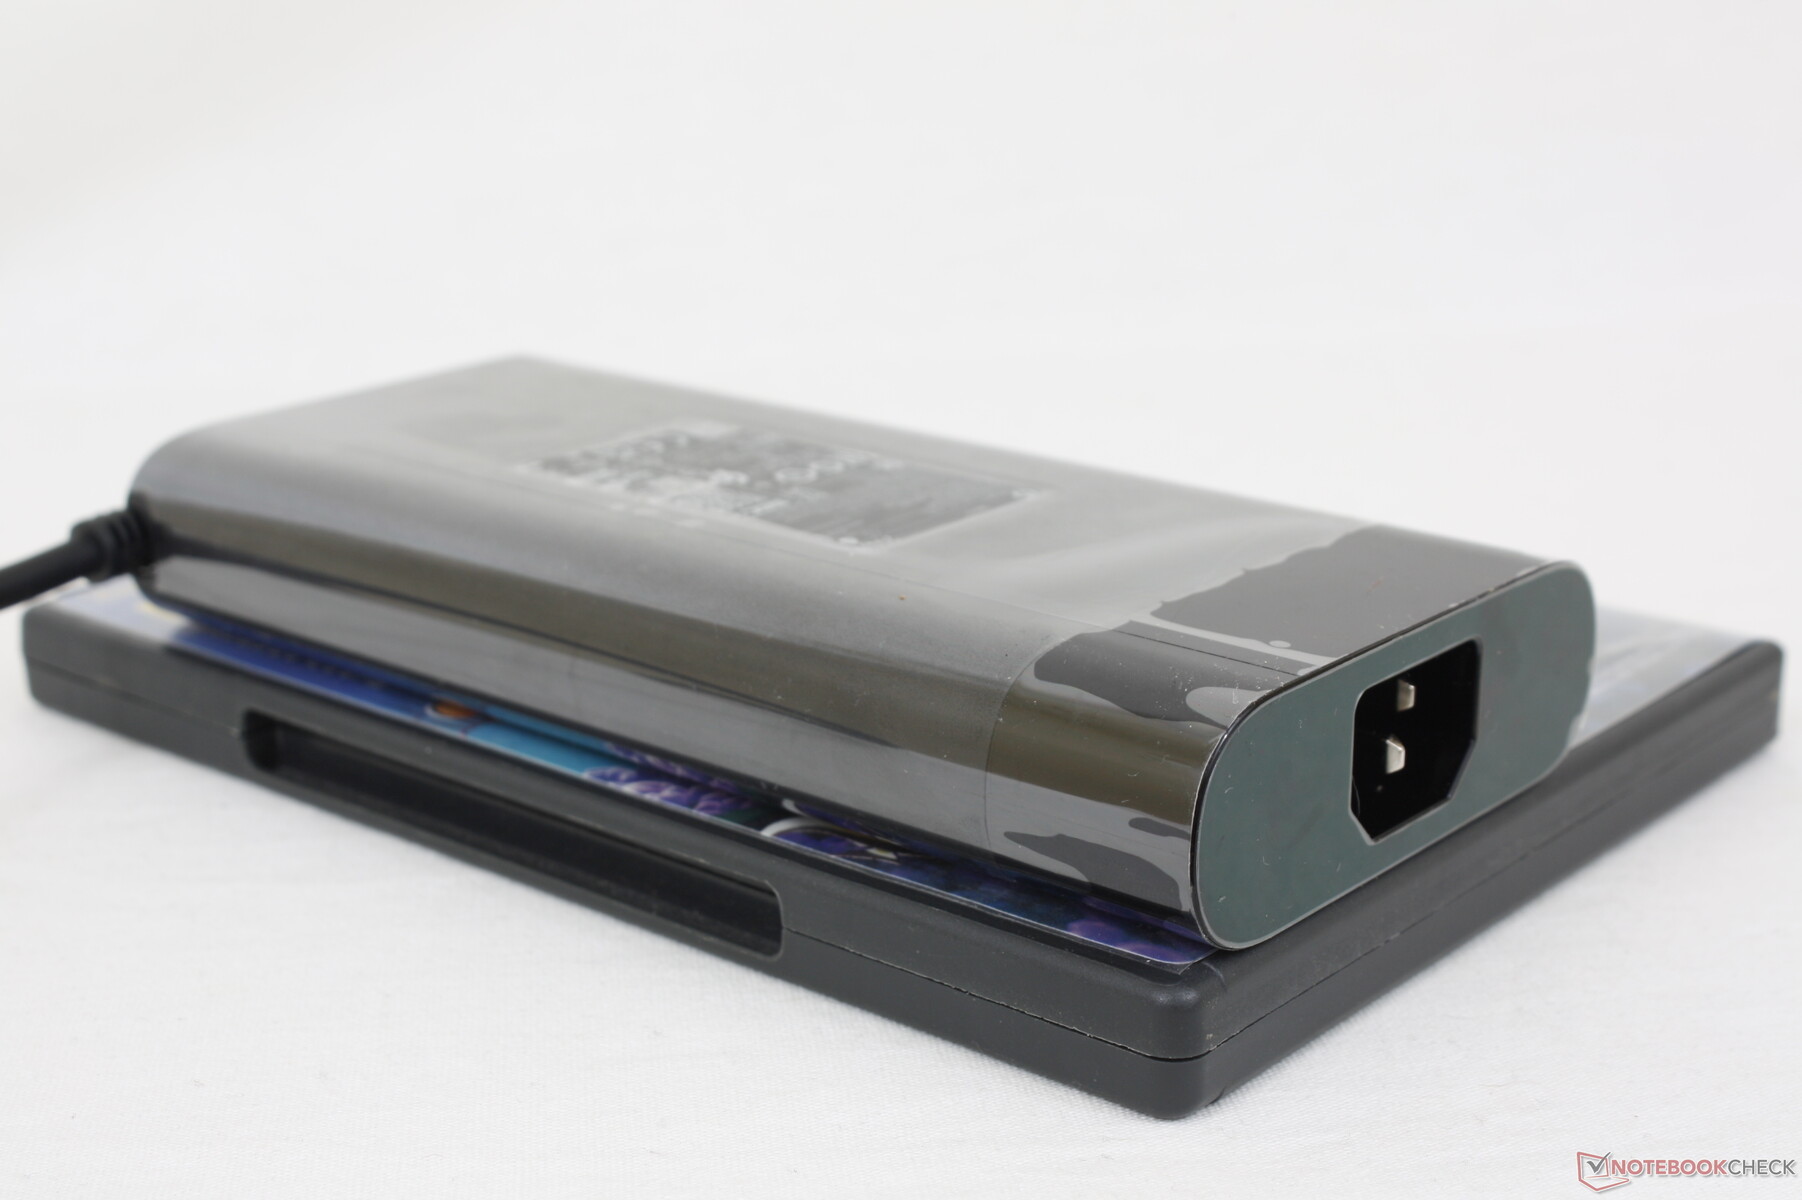
Tillbehör och garanti
Det finns inga extra tillbehör i förpackningen förutom nätadapter och pappersarbete. Den vanliga ettåriga begränsade garantin gäller om den köps i USA.
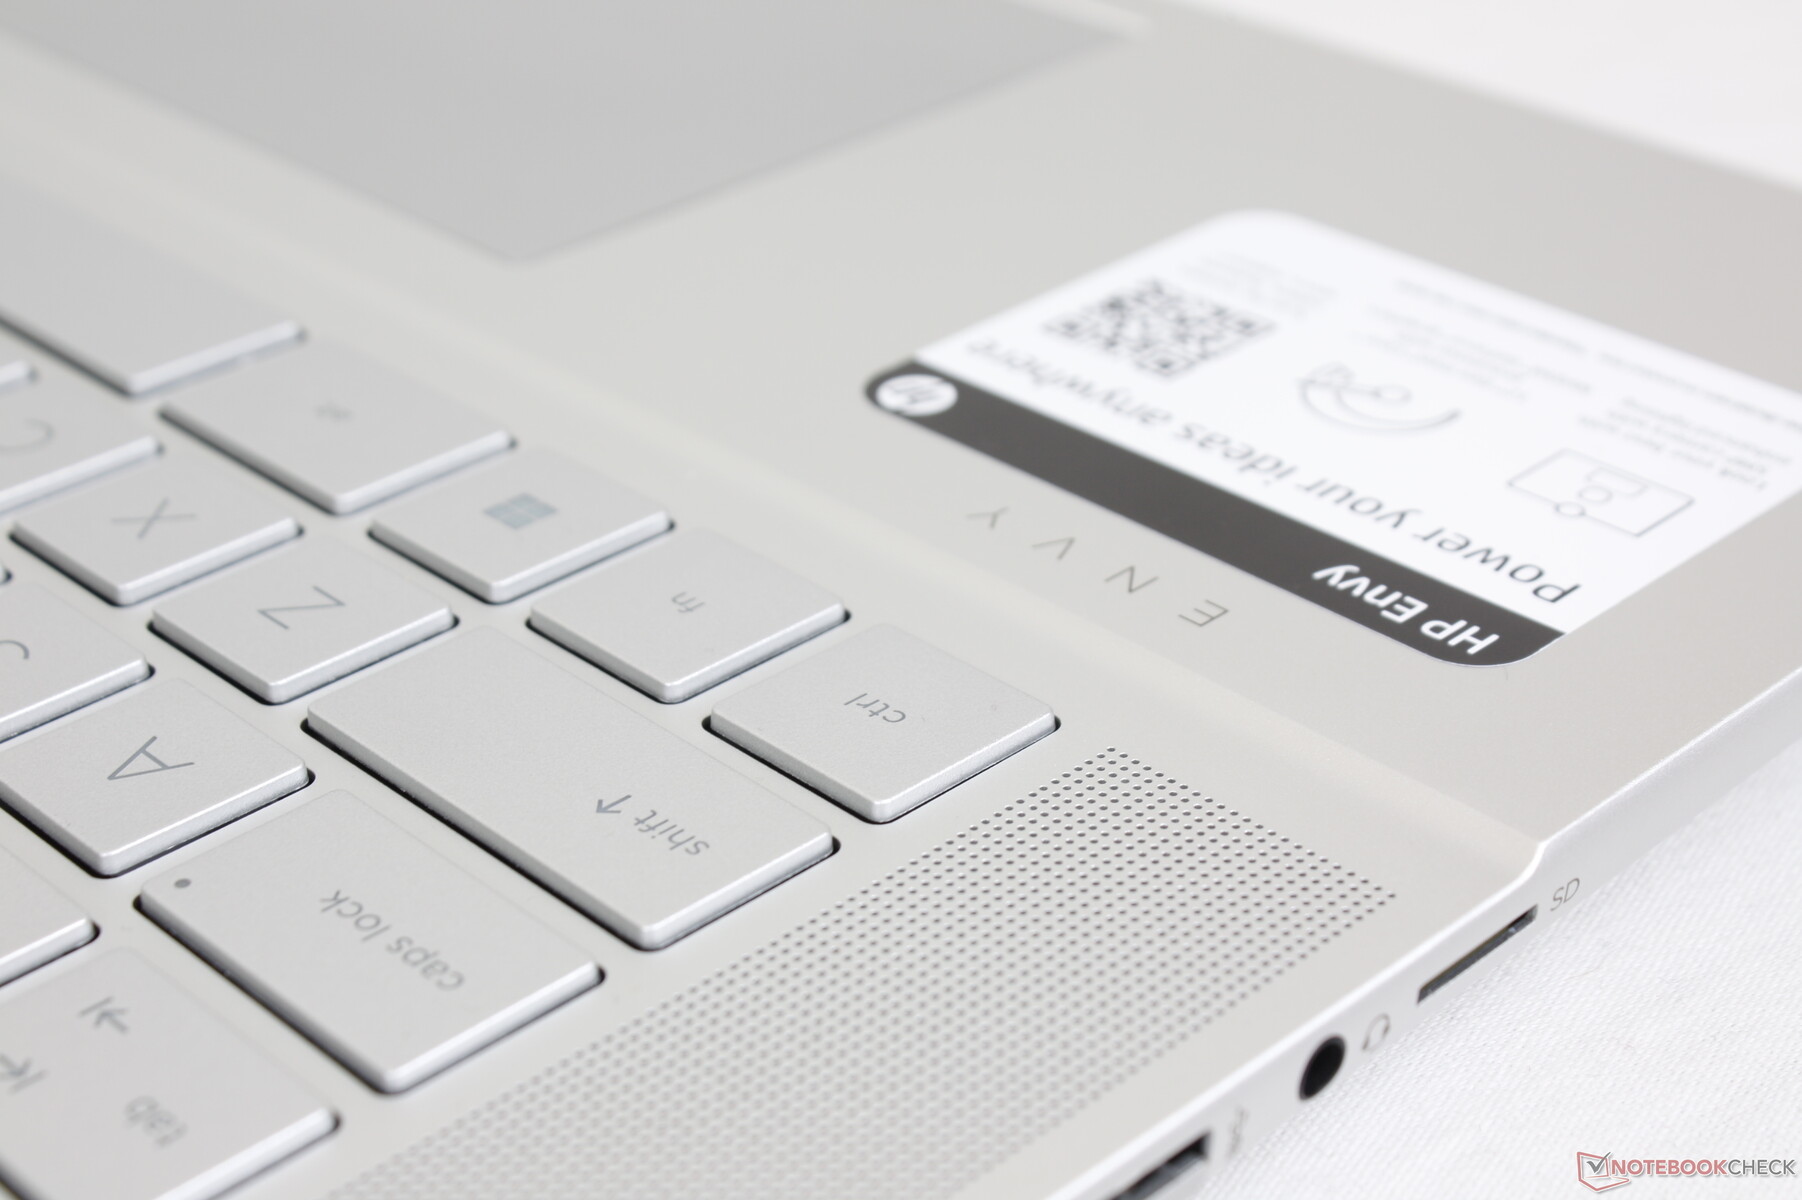
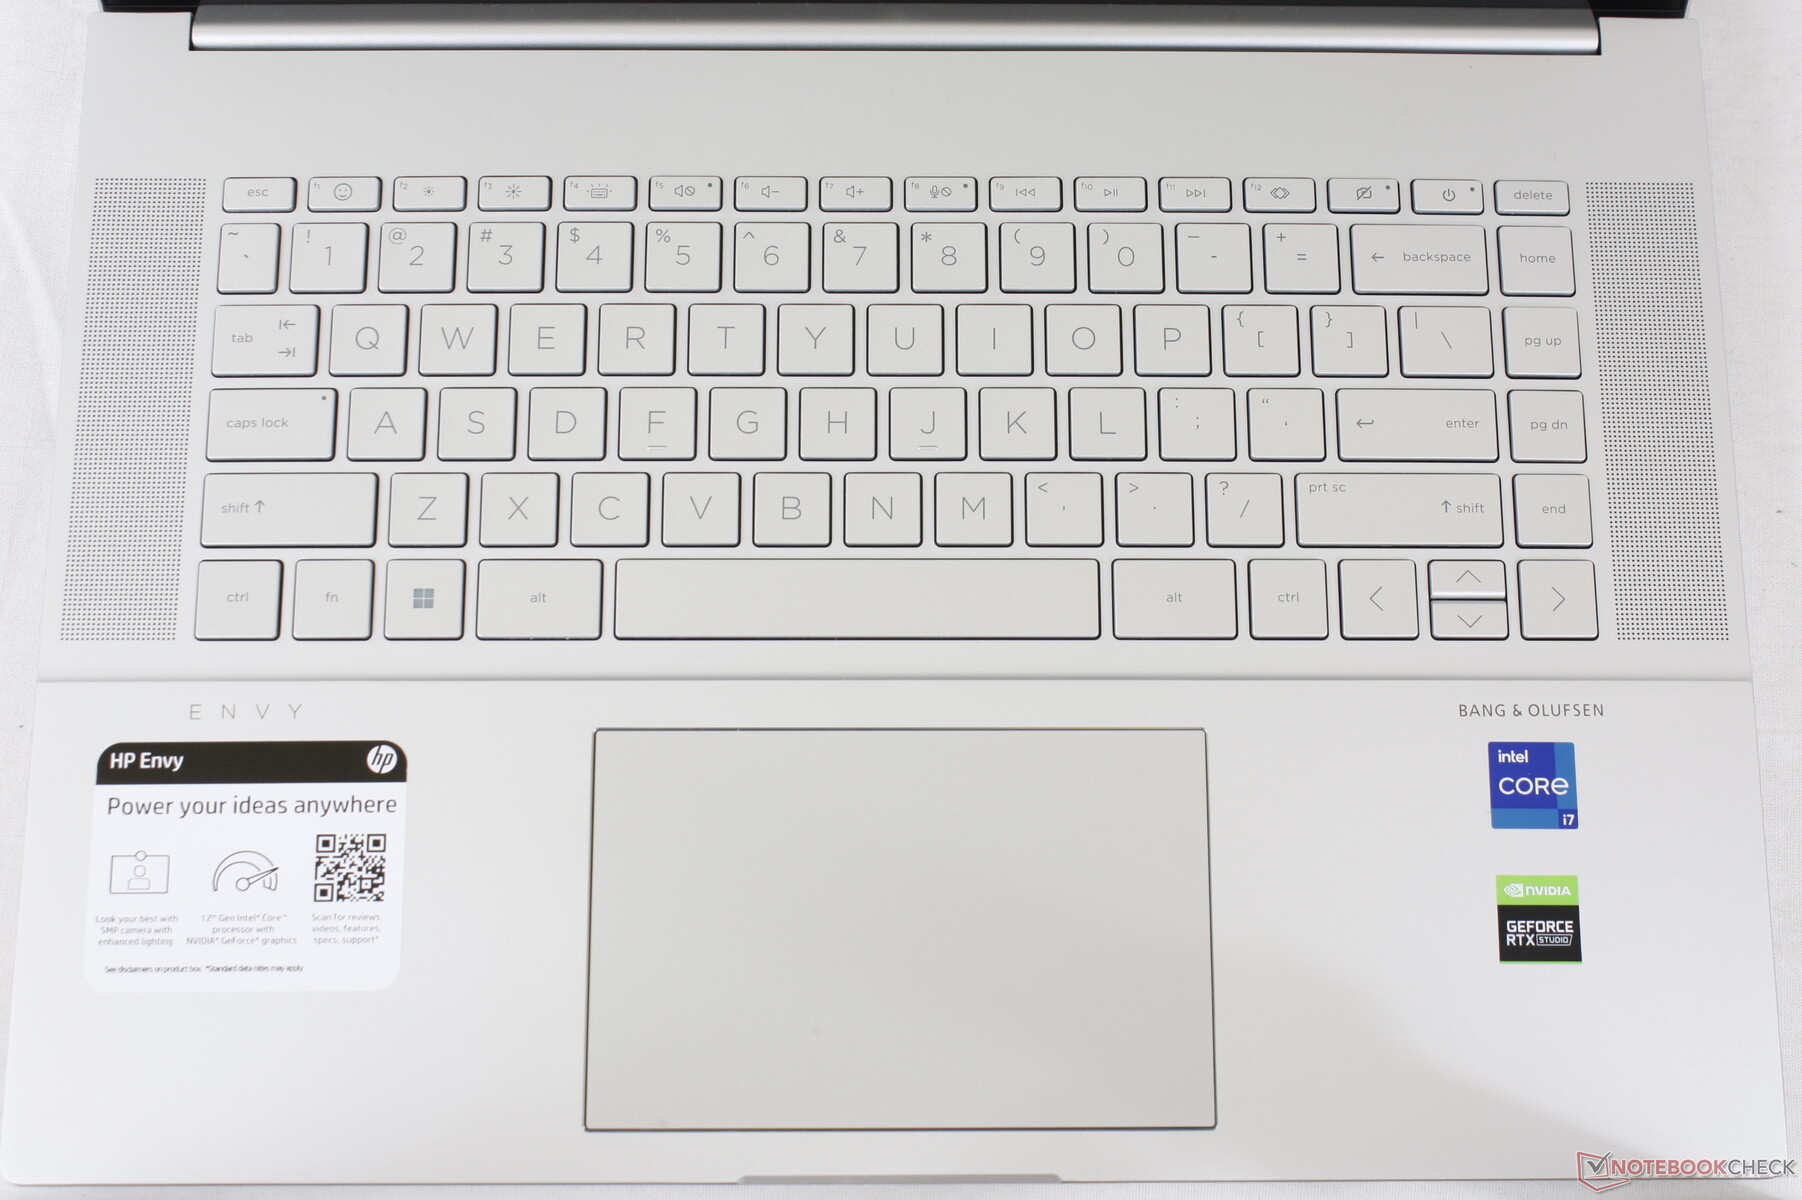
Inmatningsenheter - Större pekplatta, välbekant tangentbord
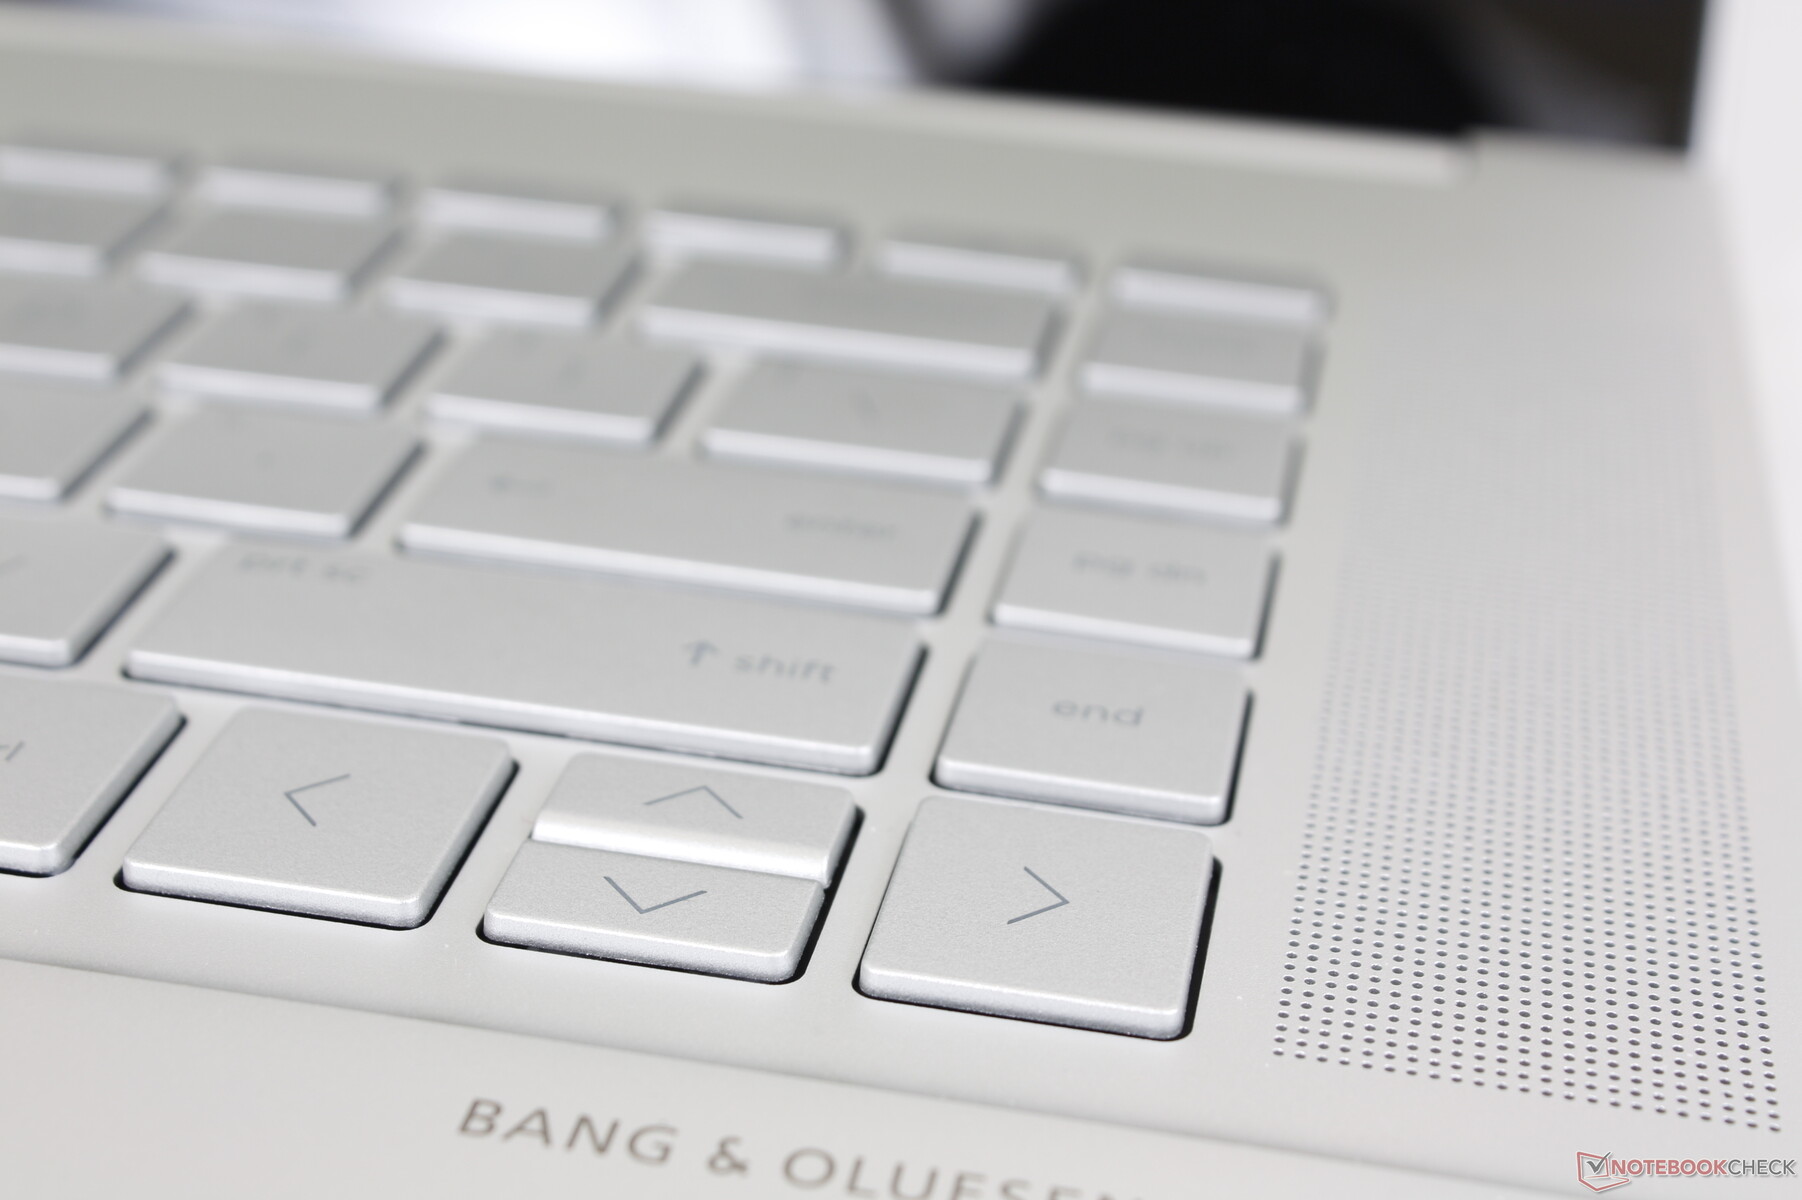
Tangentbord
HP har inte gjort några ändringar i återkopplingen eller känslan av tangentbordet jämfört med Envy 15 från 2020. Å ena sidan kommer användare som är vana vid Envy-tangentbord inte att ha några problem, men å andra sidan hade vi föredragit en skrivupplevelse som låg närmare de fastare och mer tillfredsställande tangenterna i en Spectre 15 eller EliteBook modell
Det finns två mindre ytliga förändringar som är värda att nämna. Den sekundära funktionen för F12-tangenten har nu ändrats till en funktion "System Event Utility" som i huvudsak är en snabbstartstangent för HP Command Center, Omen Gaming Hub, myHP och HP Palette. För det andra startar den sekundära funktionen för F1-tangenten nu en popup-funktion för att välja emojis och GIF:s, ungefär som på senaste Pavilion.
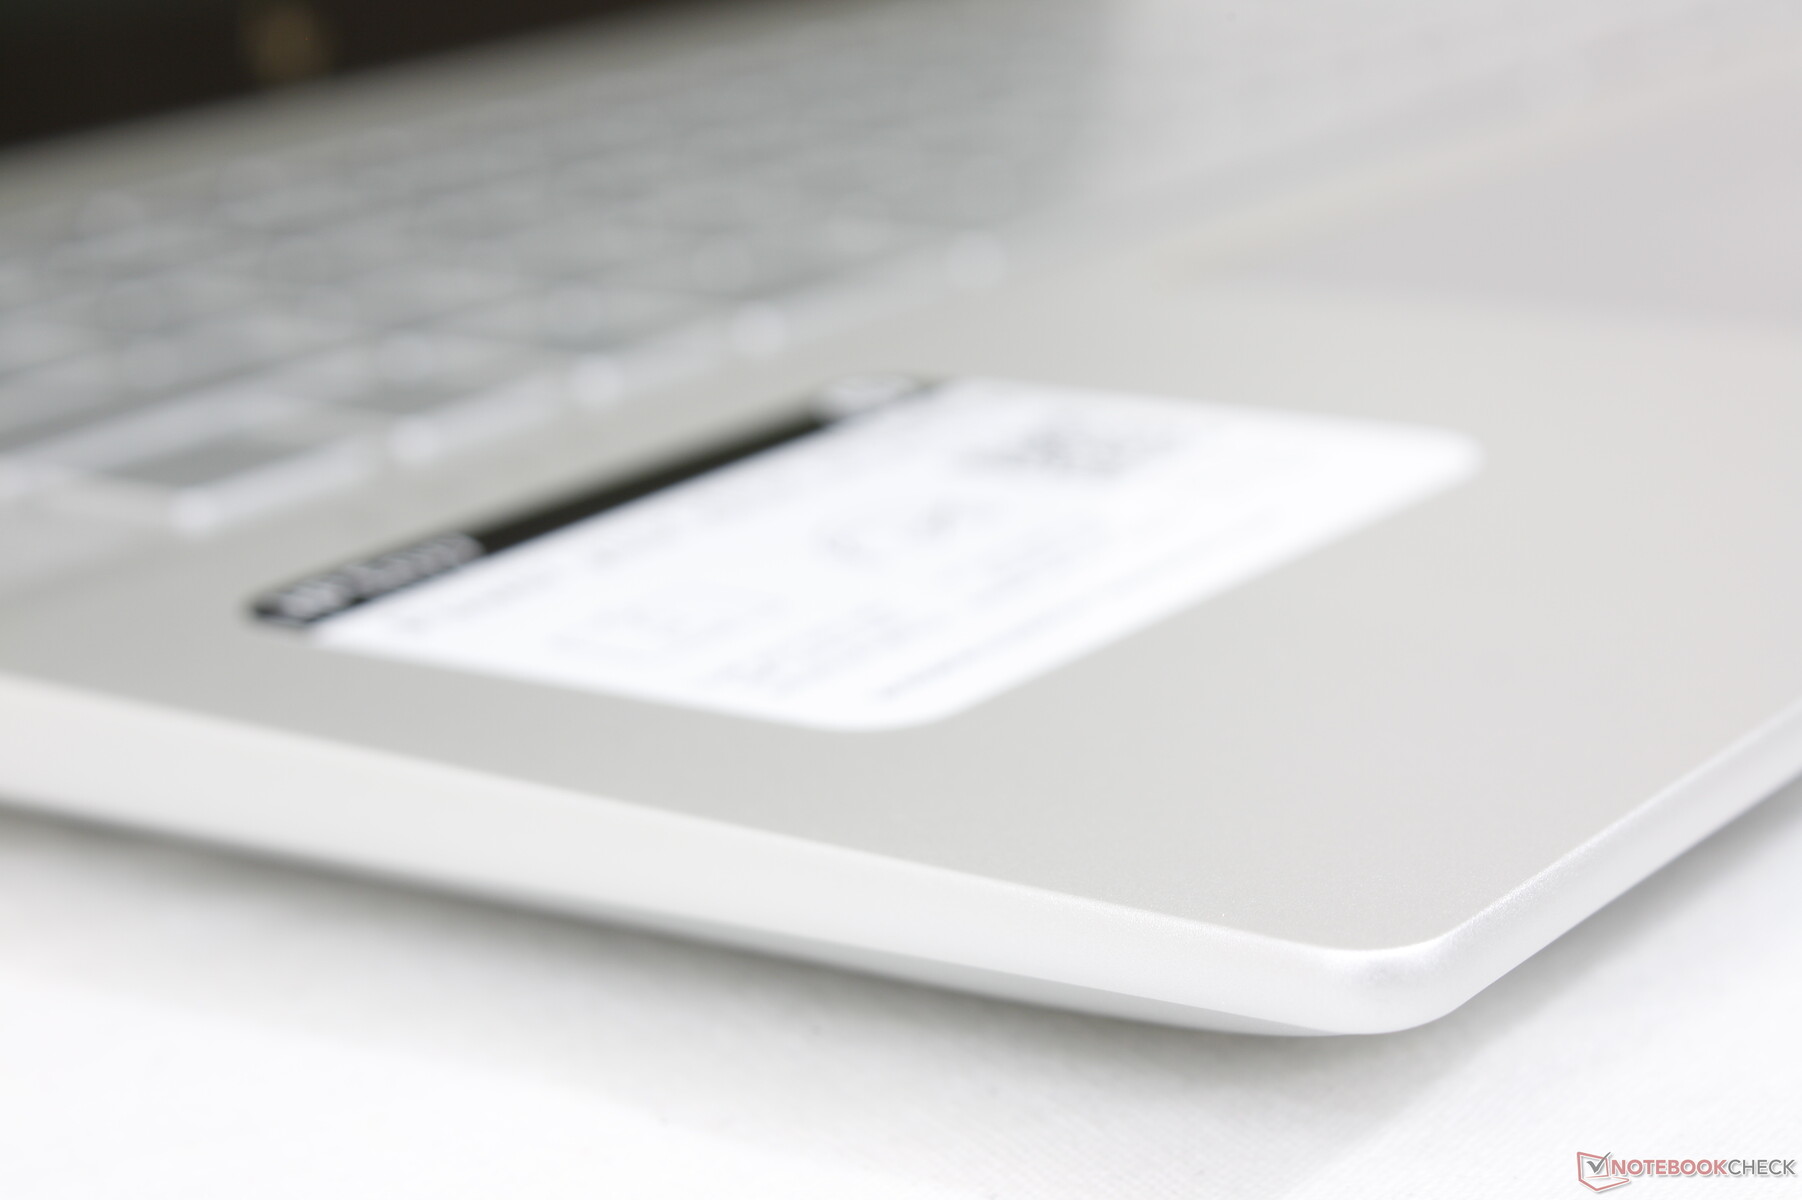
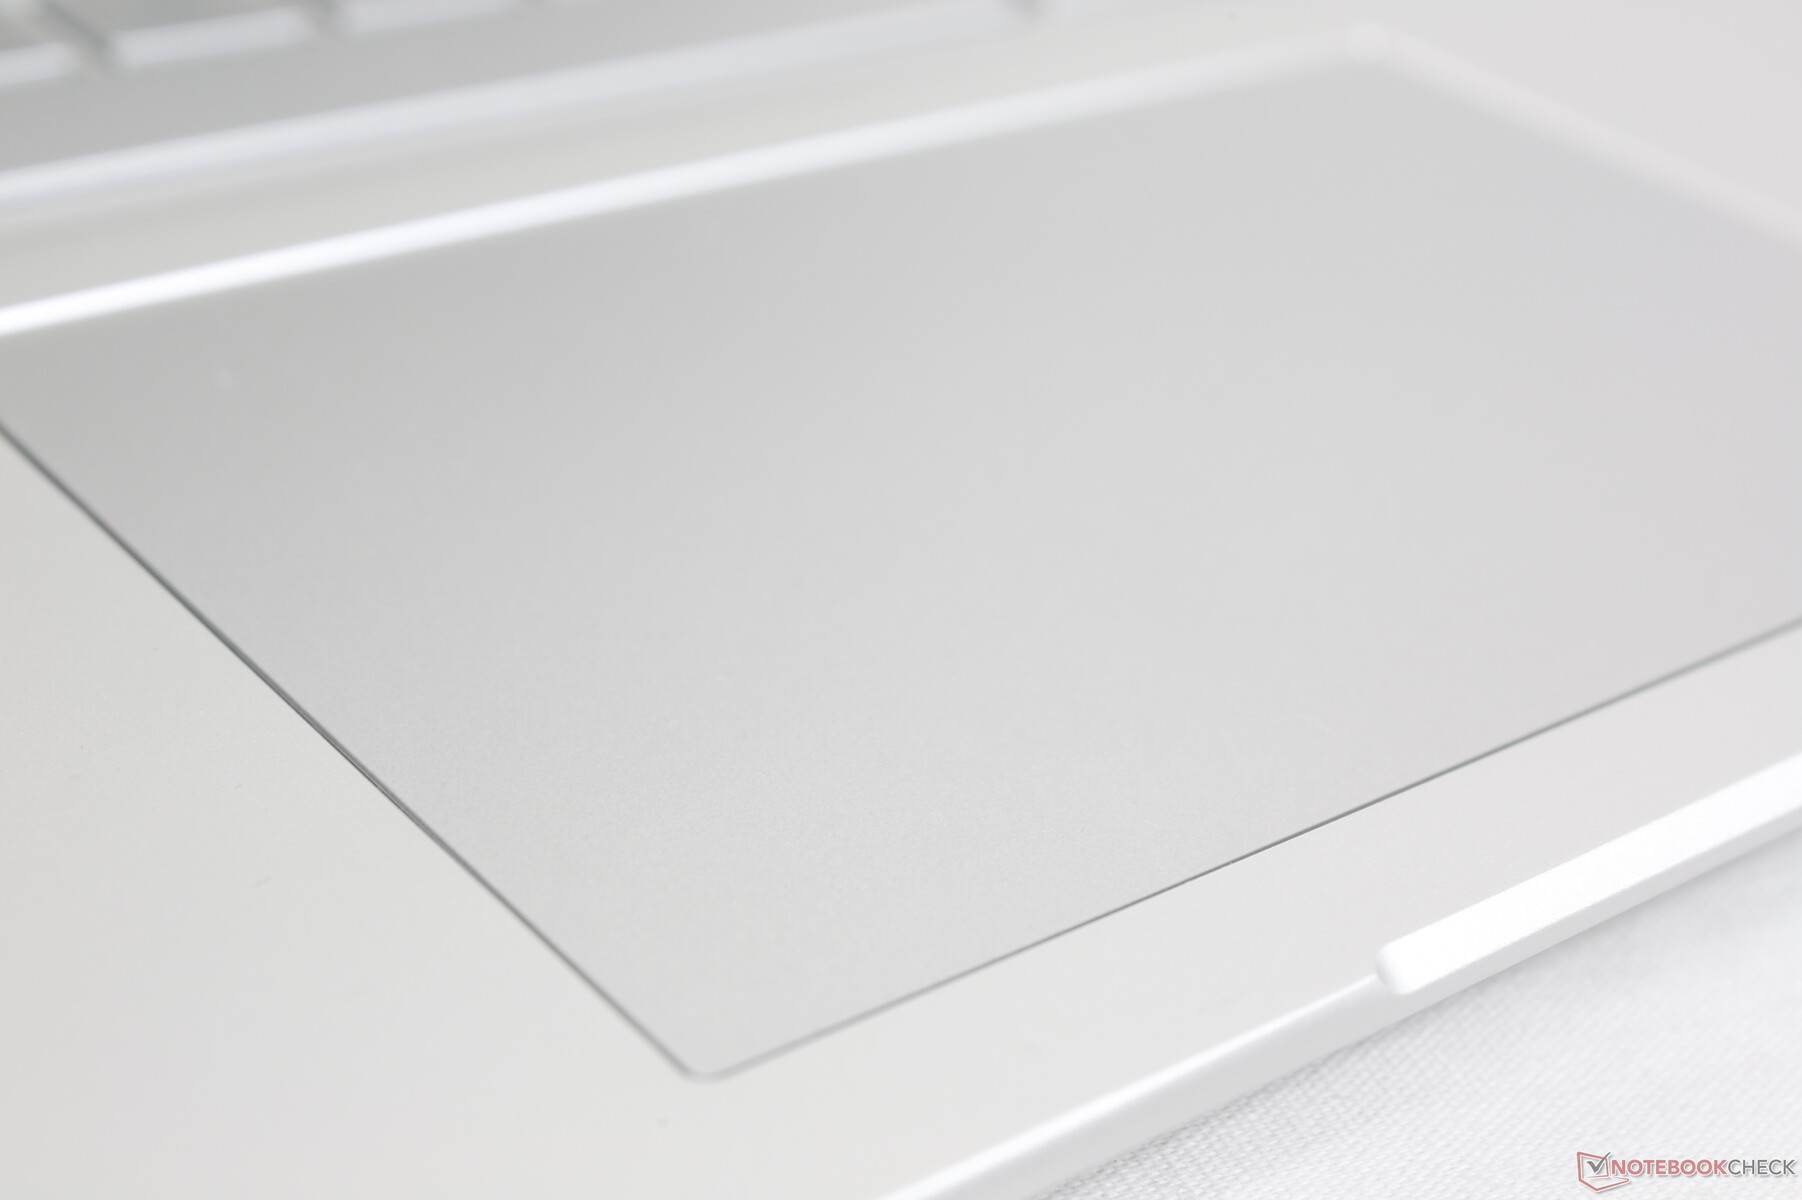
Pekplatta
Klickplattan är större än klickplattan på den utgående Envy 15 (12,5 x 8 cm jämfört med 11,5 x 7,5 cm). Ytan är slät och nästan texturlös med bara minimalt klickande om man glider i långsammare hastigheter för mer exakta klick. Samtidigt är återkopplingen när du klickar på klickplattan relativt mjuk och tyst för en svampig känsla. Ett starkare och mer tillfredsställande klick hade gjort klickplattan lättare att använda.

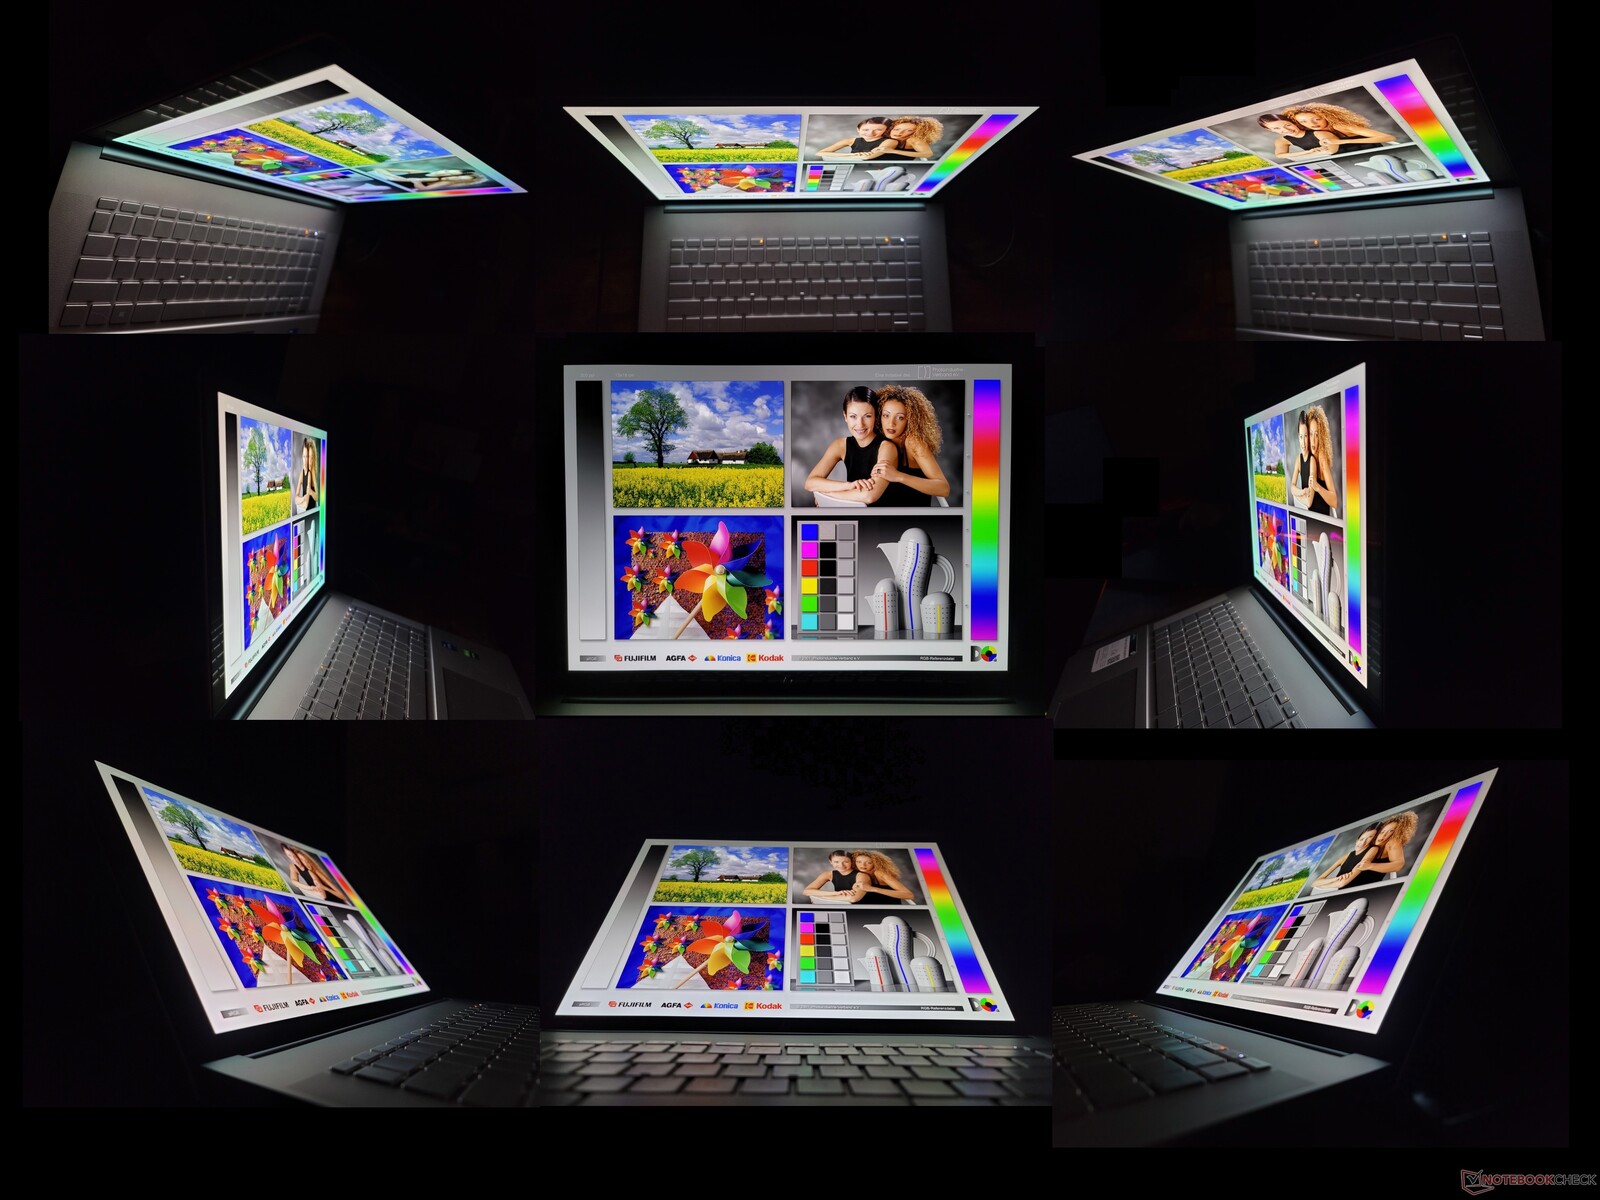
Skärm - IPS eller OLED?
Det finns två bildskärmsalternativ tillgängliga
- 2560 x 1600, 120 Hz, IPS, 100 % sRGB
- 3840 x 2400, 60 Hz, OLED, 100 % P3
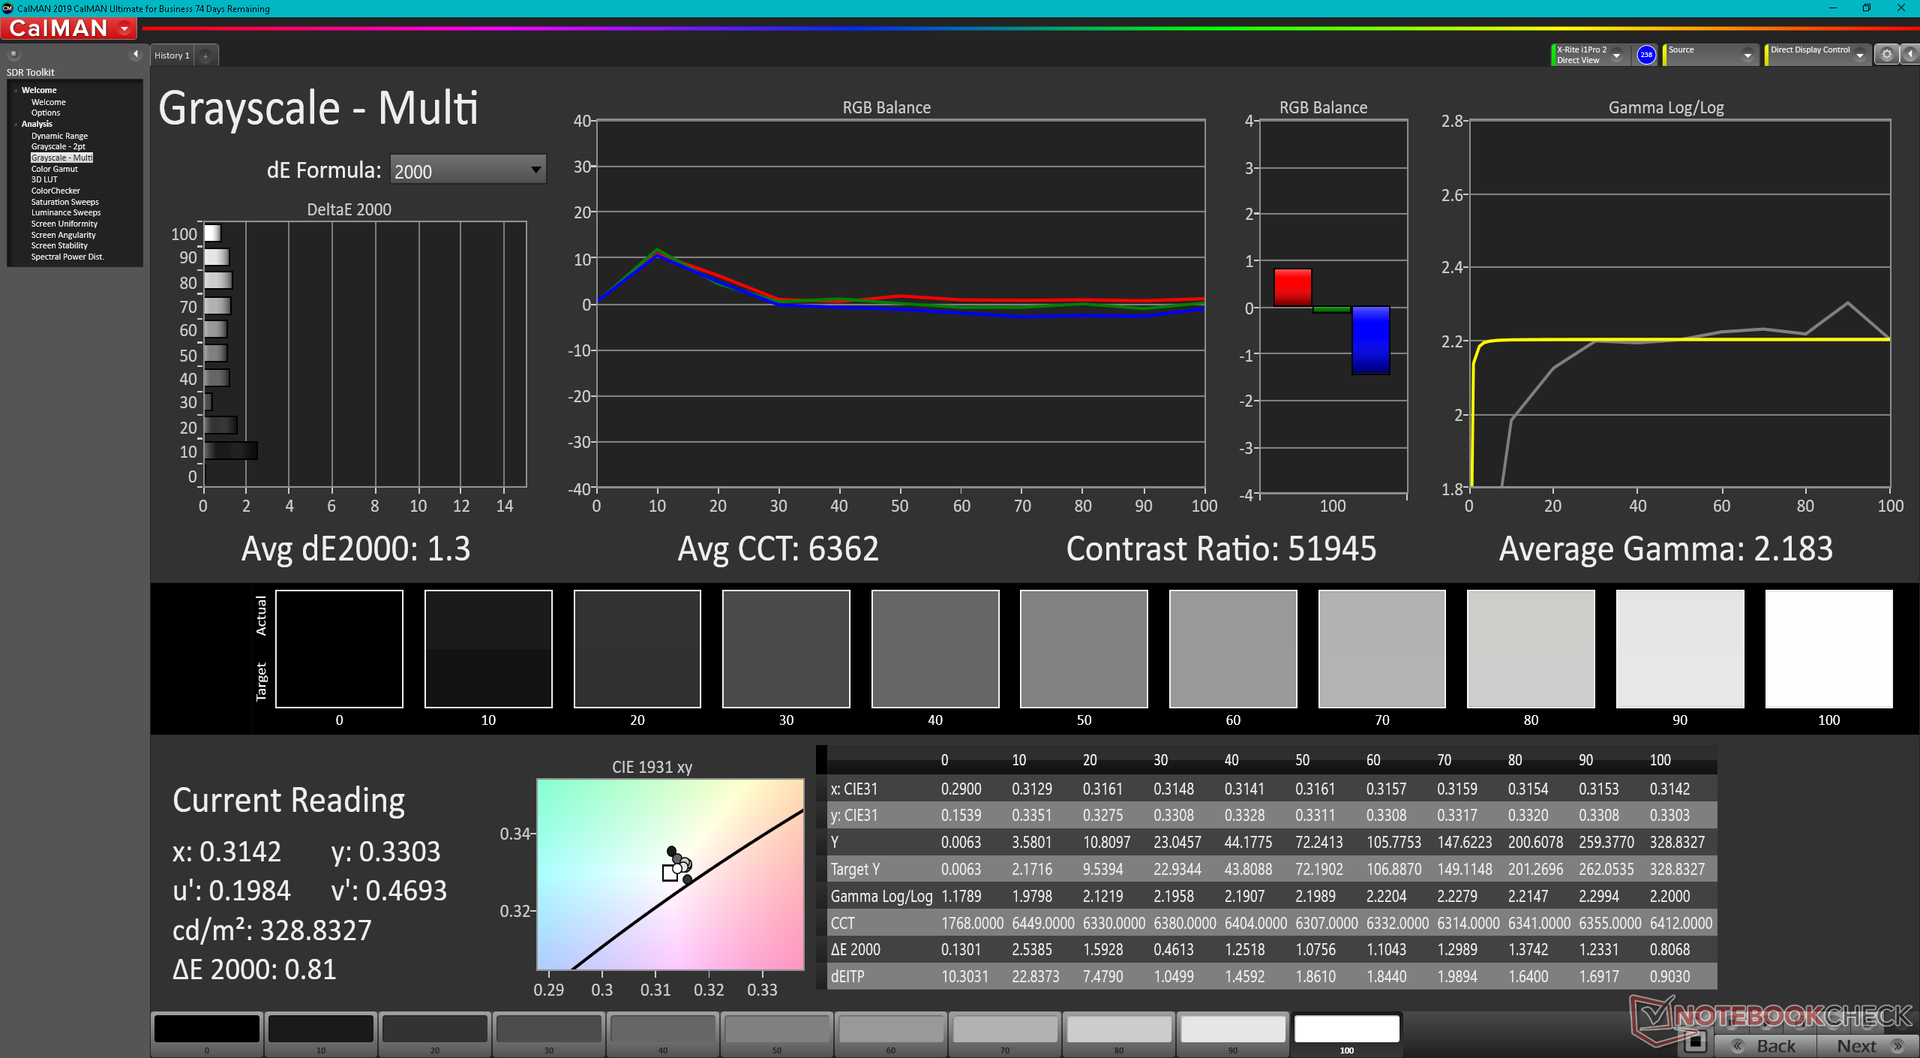
Våra mätningar nedan återspeglar endast OLED-alternativet. Dess främsta fördelar är de djupare färgerna, det becksvarta kontrastförhållandet och de betydligt snabbare svarstiderna för svartvitt och grått jämfört med IPS till priset av högre energiförbrukning och skärmens flimmer som kan påverka en liten delmängd användare.
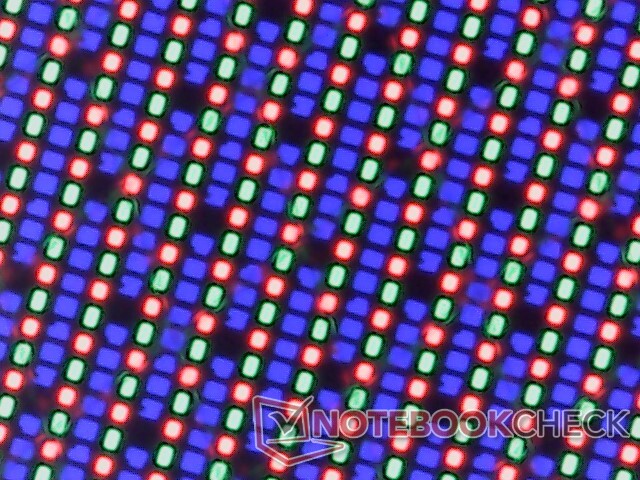
Bildkvaliteten är skarp men med märkbara färgkorn som blir tydligare vid visning av vita färger vid höga ljusstyrkor. IPS-alternativet kan vara att föredra för dem som inte behöver P3-färger eftersom uppdateringsfrekvensen på 120 Hz ger en mycket jämnare upplevelse.
| |||||||||||||||||||||||||
Distribution av ljusstyrkan: 97 %
Mitt på batteriet: 328.8 cd/m²
Kontrast: ∞:1 (Svärta: 0 cd/m²)
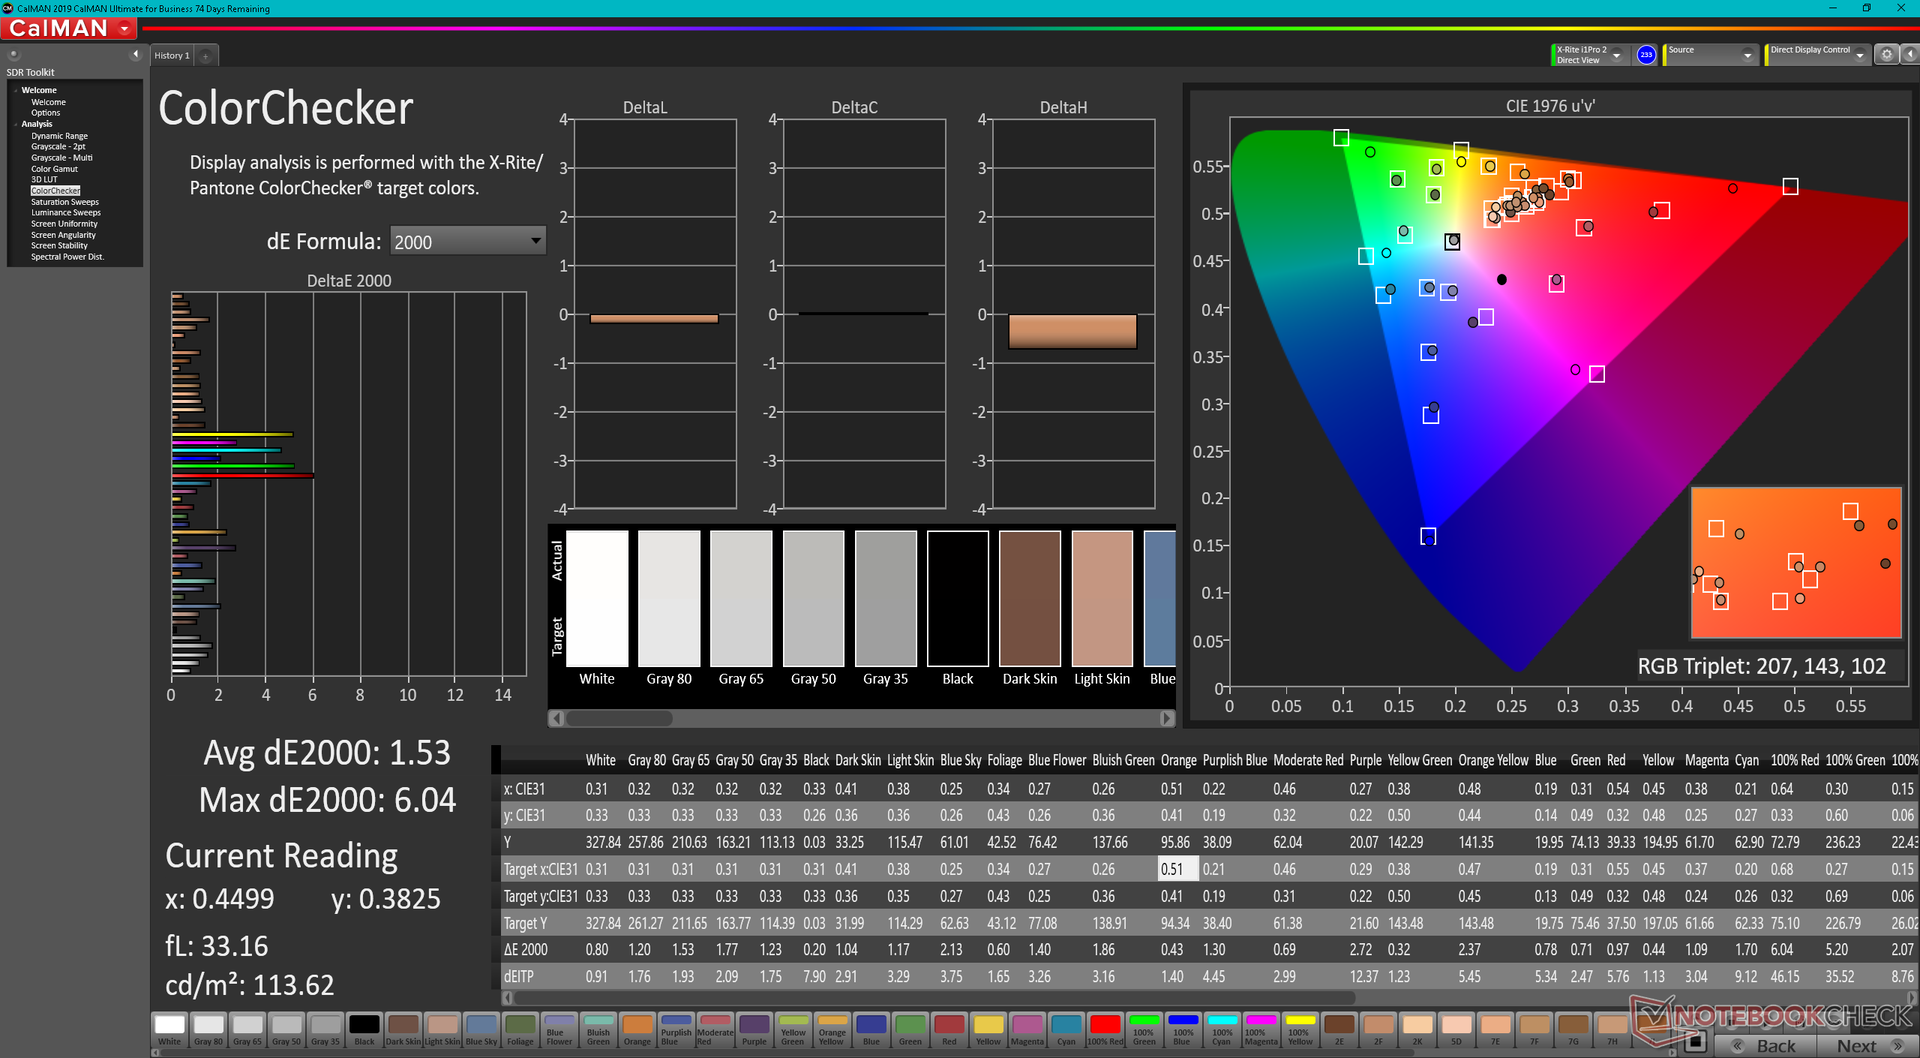
ΔE ColorChecker Calman: 1.53 | ∀{0.5-29.43 Ø4.72}
ΔE Greyscale Calman: 1.3 | ∀{0.09-98 Ø4.97}
88% AdobeRGB 1998 (Argyll 3D)
100% sRGB (Argyll 3D)
99.3% Display P3 (Argyll 3D)
Gamma: 2.18
CCT: 6362 K
| HP Envy 16 h0112nr Samsung SDC4174, OLED, 3840x2400, 16" | Lenovo ThinkBook 16 G4+ IAP LEN160WQXGA, IPS, 2560x1600, 16" | MSI Creator Z16P B12UHST AUOD298, IPS True Pixel (~100% DCI-P3), 2560x1600, 16" | Dell Inspiron 16 Plus 7610-MHJ8F AU Optronics B160QAN, AUO9F91, IPS, 3072x1920, 16" | Apple MacBook Pro 16 2021 M1 Pro Liquid Retina XDR, Mini-LED, 3456x2234, 16.2" | Huawei MateBook 16s i7 BOE XS TV160DKT-NH0, IPS, 2520x1680, 16" | |
|---|---|---|---|---|---|---|
| Display | -17% | -1% | -13% | 0% | -21% | |
| Display P3 Coverage (%) | 99.3 | 69.6 -30% | 97.6 -2% | 75 -24% | 99.1 0% | 64.5 -35% |
| sRGB Coverage (%) | 100 | 97.5 -2% | 99.9 0% | 100 0% | 100 0% | 96.7 -3% |
| AdobeRGB 1998 Coverage (%) | 88 | 71.7 -19% | 86.8 -1% | 76 -14% | 88 0% | 66.6 -24% |
| Response Times | -1160% | -391% | -2092% | -3381% | -1403% | |
| Response Time Grey 50% / Grey 80% * (ms) | 2 ? | 32.7 ? -1535% | 12.9 ? -545% | 54 ? -2600% | 42.8 ? -2040% | 35.7 ? -1685% |
| Response Time Black / White * (ms) | 1.9 ? | 16.8 ? -784% | 6.4 ? -237% | 32 ? -1584% | 91.6 ? -4721% | 23.2 ? -1121% |
| PWM Frequency (Hz) | 240.4 ? | 14880 | ||||
| Screen | -36% | -17% | -37% | 15% | 13% | |
| Brightness middle (cd/m²) | 328.8 | 371 13% | 428 30% | 290 -12% | 514 56% | 311 -5% |
| Brightness (cd/m²) | 332 | 357 8% | 394 19% | 285 -14% | 497 50% | 319 -4% |
| Brightness Distribution (%) | 97 | 91 -6% | 86 -11% | 88 -9% | 95 -2% | 91 -6% |
| Black Level * (cd/m²) | 0.23 | 0.42 | 0.21 | 0.02 | 0.17 | |
| Colorchecker dE 2000 * | 1.53 | 2.6 -70% | 1.67 -9% | 2.57 -68% | 1.4 8% | 1 35% |
| Colorchecker dE 2000 max. * | 6.04 | 4.4 27% | 5.71 5% | 4.78 21% | 2.8 54% | 1.7 72% |
| Greyscale dE 2000 * | 1.3 | 3.7 -185% | 3.1 -138% | 3.14 -142% | 2.3 -77% | 1.5 -15% |
| Gamma | 2.18 101% | 2.32 95% | 2.195 100% | 2.34 94% | 2.27 97% | 2.15 102% |
| CCT | 6362 102% | 7271 89% | 6498 100% | 6408 101% | 6792 96% | 6432 101% |
| Contrast (:1) | 1613 | 1019 | 1381 | 25700 | 1829 | |
| Colorchecker dE 2000 calibrated * | 1.3 | 0.71 | 1.89 | 0.8 | ||
| Totalt genomsnitt (program/inställningar) | -404% /
-235% | -136% /
-81% | -714% /
-404% | -1122% /
-607% | -470% /
-254% |
* ... mindre är bättre
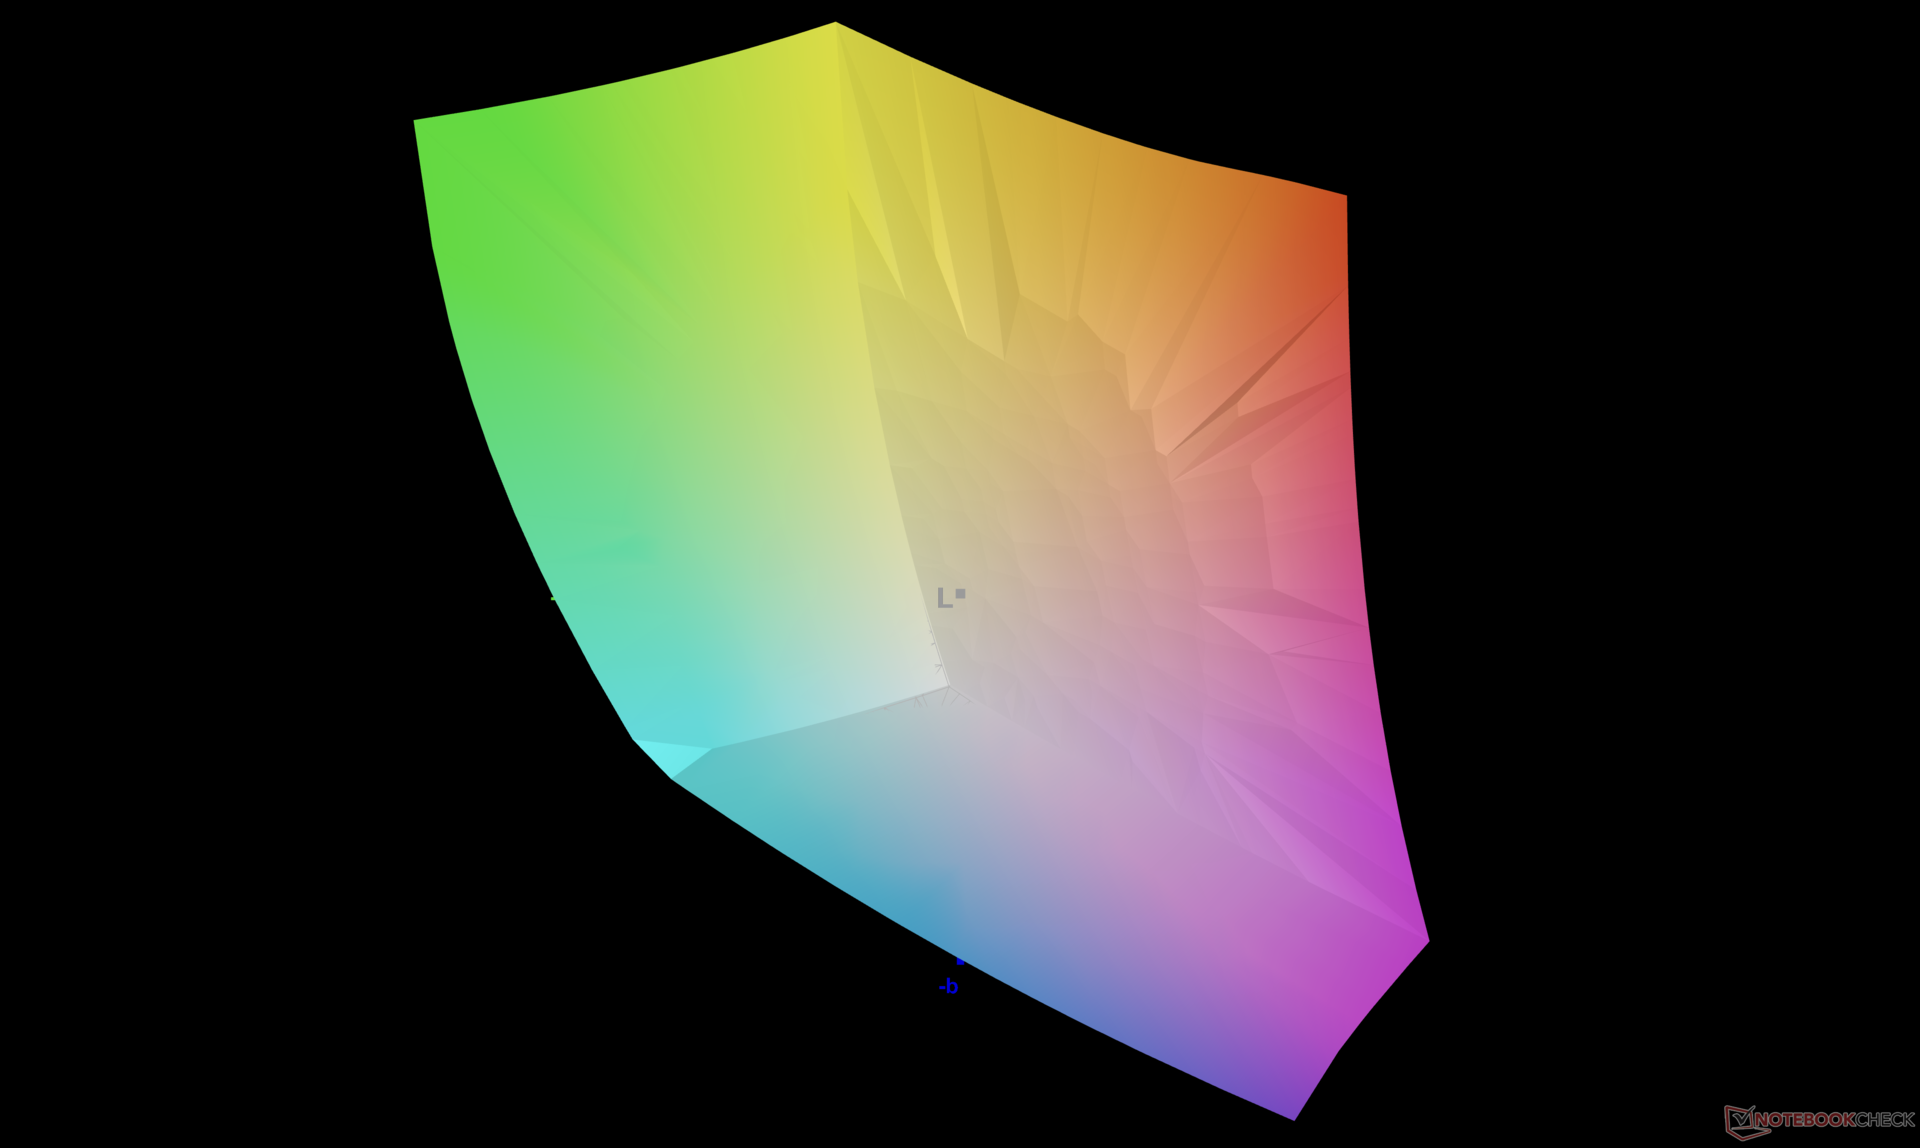
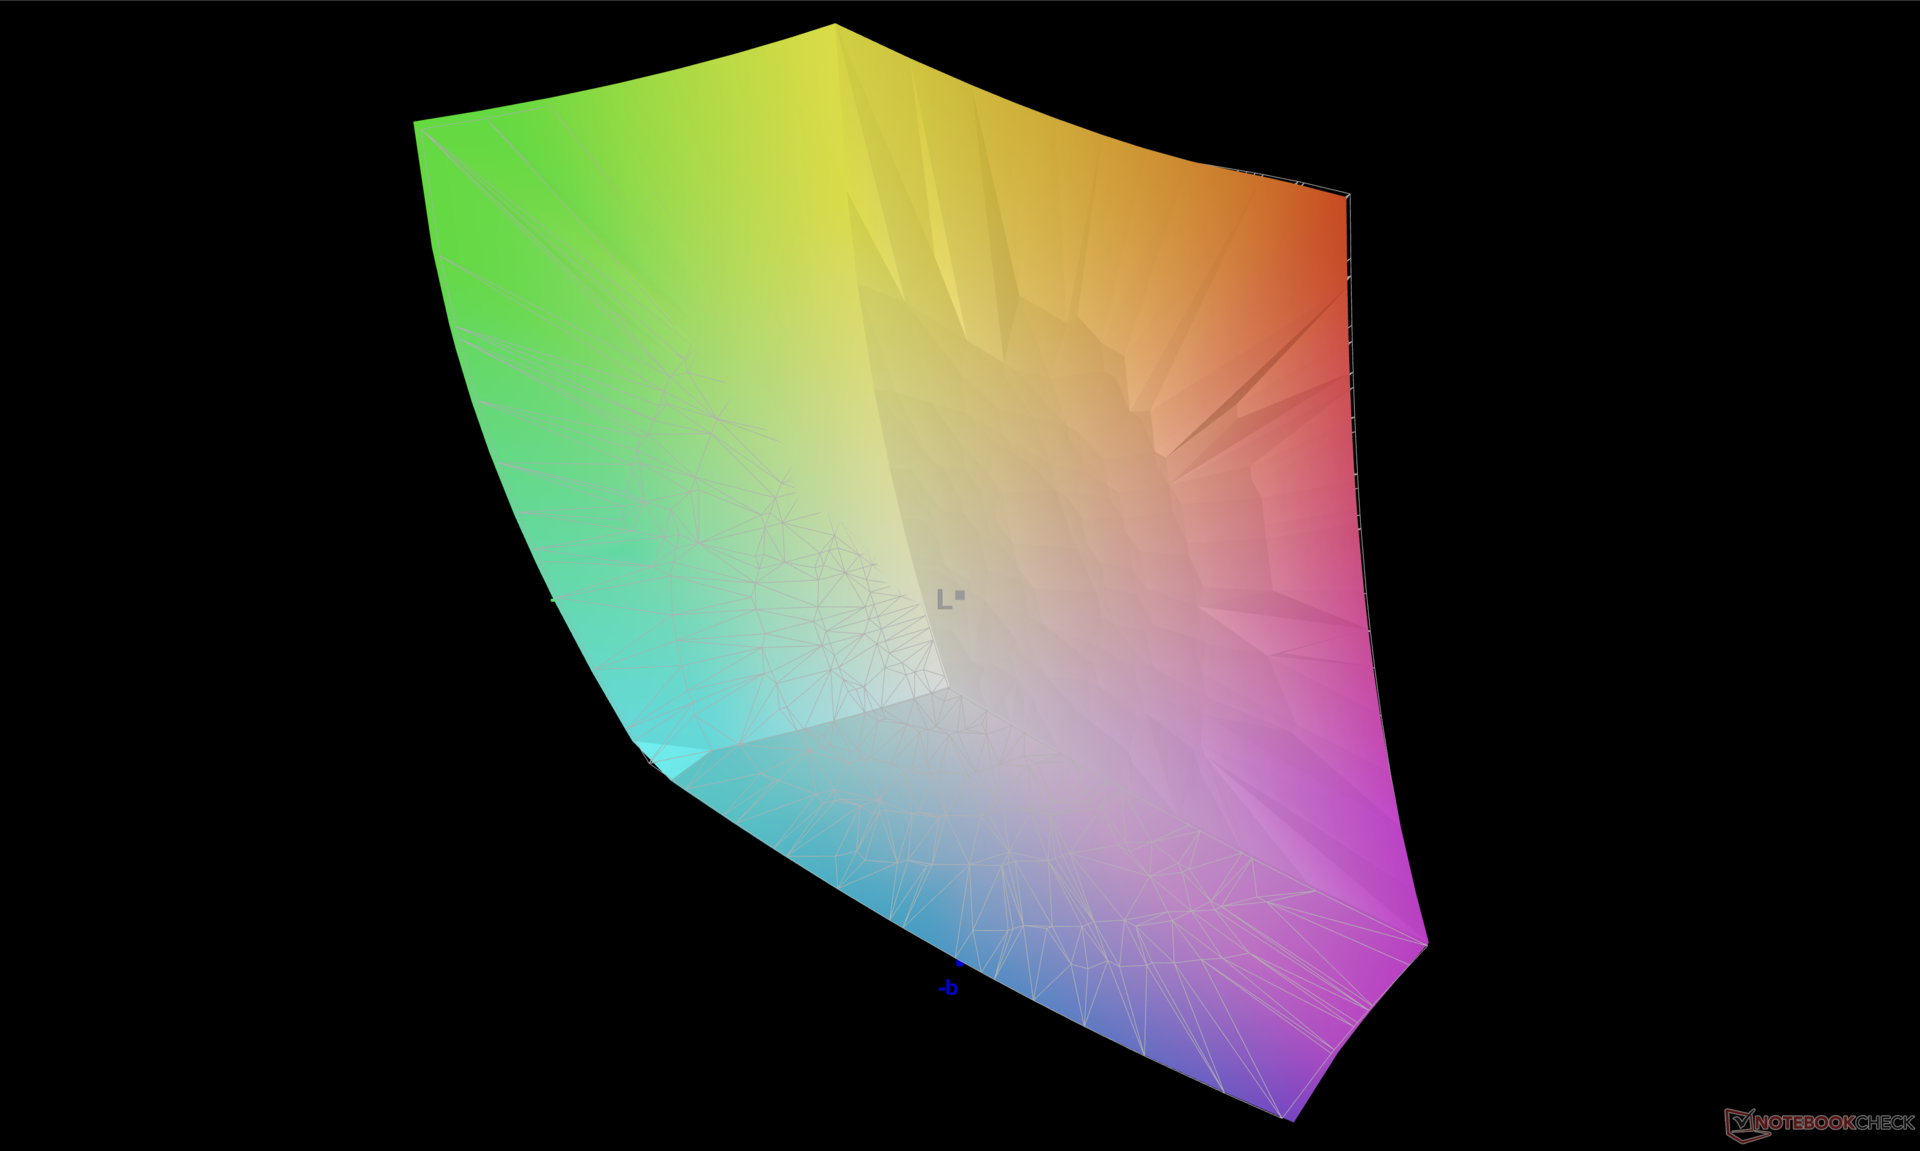
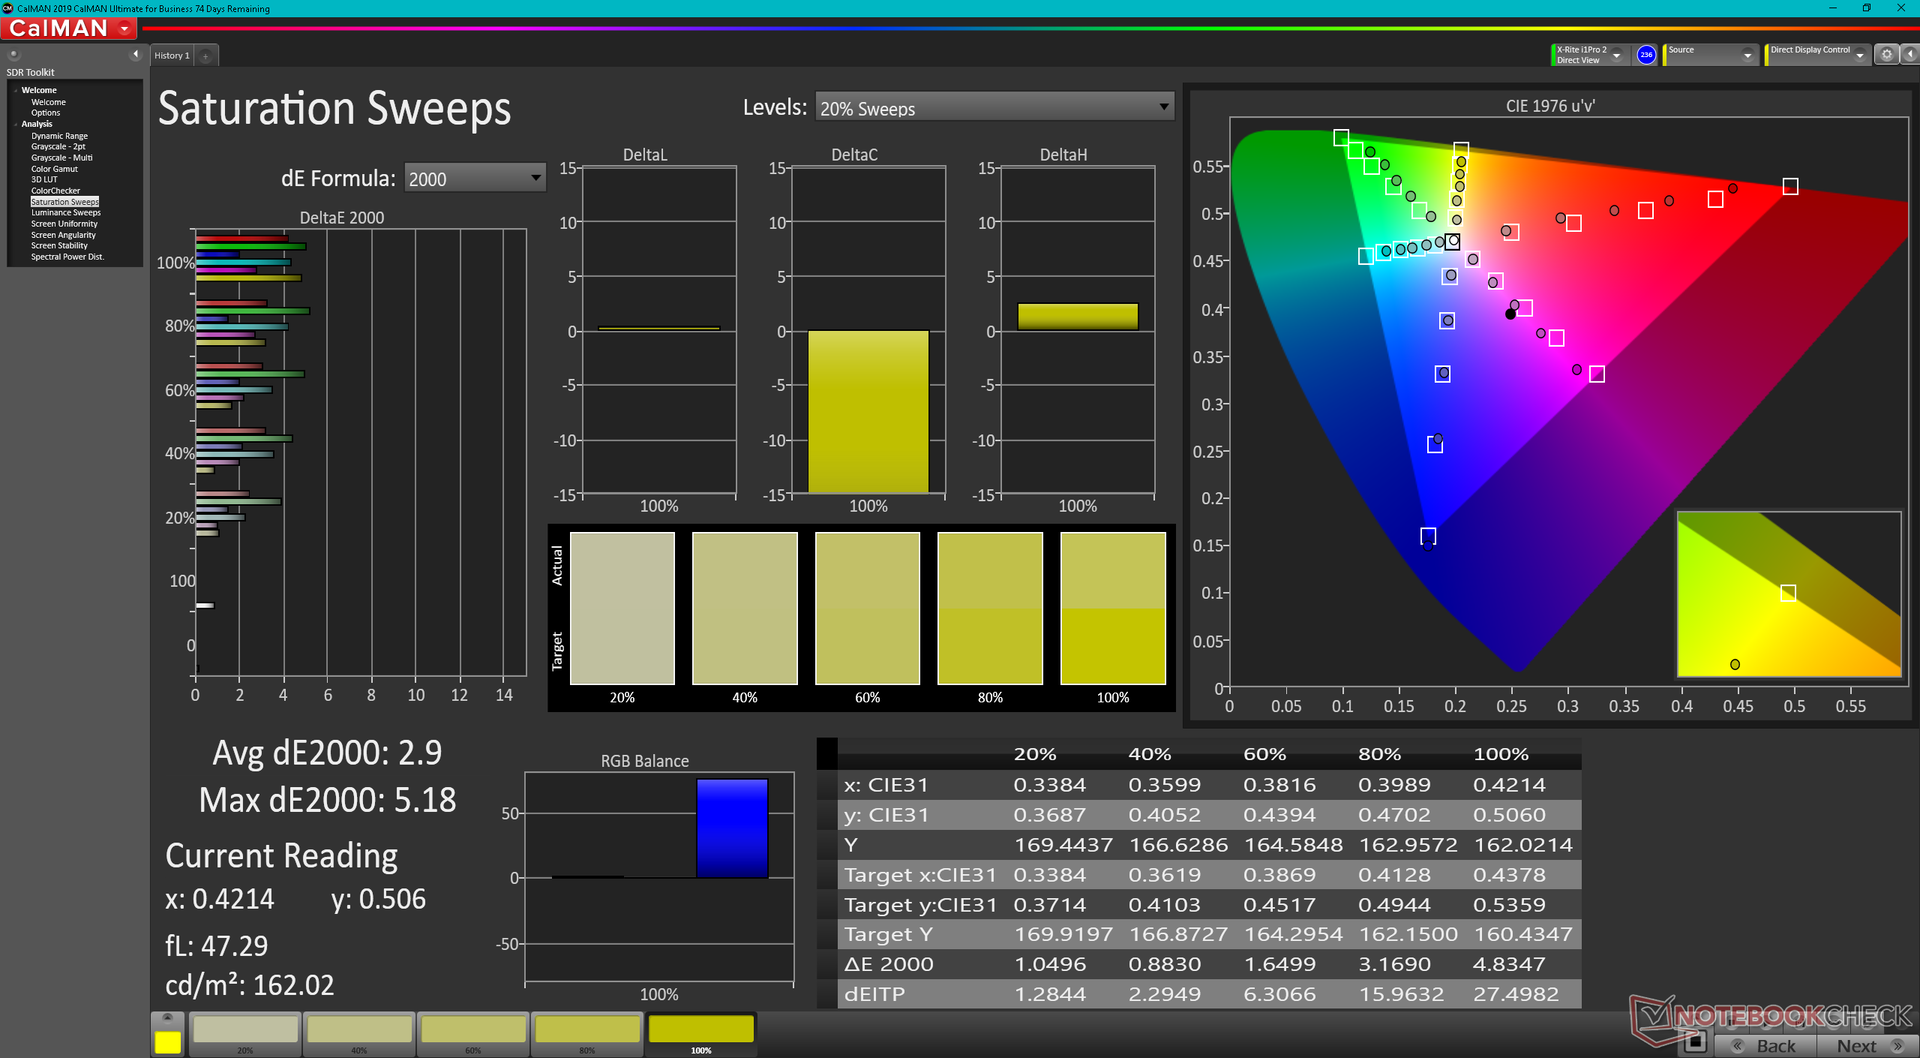
Panelen är kalibrerad direkt mot P3-standarden med genomsnittliga DeltaE-värden för gråskala och färg på endast 1,3 respektive 1,53. Färgerna verkar vara mer felaktiga vid högre mättnadsnivåer än vid lägre mättnadsnivåer.
Visa svarstider
| ↔ Svarstid svart till vitt | ||
|---|---|---|
| 1.9 ms ... stiga ↗ och falla ↘ kombinerat | ↗ 0.8 ms stiga | 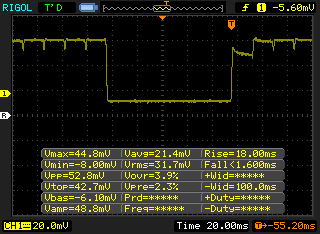 |
| ↘ 1.1 ms hösten | ||
| Skärmen visar väldigt snabba svarsfrekvenser i våra tester och borde vara mycket väl lämpad för fartfyllt spel. I jämförelse sträcker sig alla testade enheter från 0.1 (minst) till 240 (maximalt) ms. » 11 % av alla enheter är bättre. Det betyder att den uppmätta svarstiden är bättre än genomsnittet av alla testade enheter (19.9 ms). | ||
| ↔ Svarstid 50 % grått till 80 % grått | ||
| 2 ms ... stiga ↗ och falla ↘ kombinerat | ↗ 1 ms stiga | 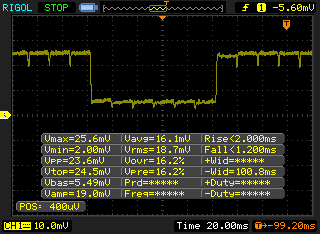 |
| ↘ 1 ms hösten | ||
| Skärmen visar väldigt snabba svarsfrekvenser i våra tester och borde vara mycket väl lämpad för fartfyllt spel. I jämförelse sträcker sig alla testade enheter från 0.165 (minst) till 636 (maximalt) ms. » 10 % av alla enheter är bättre. Det betyder att den uppmätta svarstiden är bättre än genomsnittet av alla testade enheter (31.1 ms). | ||
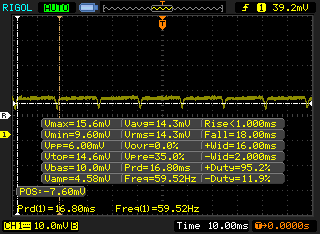
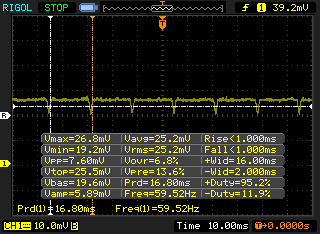
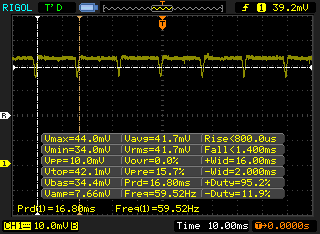
Skärmflimmer / PWM (Puls-Width Modulation)
| Skärmflimmer / PWM upptäckt | 240.4 Hz | ≤ 100 % ljusstyrka inställning | 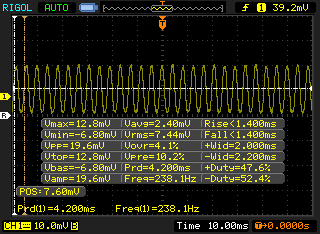 |
Displayens bakgrundsbelysning flimrar vid 240.4 Hz (i värsta fall, t.ex. med PWM) Flimrande upptäckt vid en ljusstyrkeinställning på 100 % och lägre. Det ska inte finnas något flimmer eller PWM över denna ljusstyrkeinställning. Frekvensen för 240.4 Hz är relativt låg, så känsliga användare kommer sannolikt att märka flimmer och uppleva ansträngda ögon vid den angivna ljusstyrkeinställningen och nedan. Som jämförelse: 52 % av alla testade enheter använder inte PWM för att dämpa skärmen. Om PWM upptäcktes mättes ett medelvärde av 7784 (minst: 5 - maximum: 343500) Hz. | |||
Flimmer eller pulsbreddsmodulering förekommer på alla ljusstyrkor, precis som på OLED-panelerna i de senaste Asus VivoBook eller ZenBook bärbara datorer. Frekvensen är 240,4 Hz från 0 till 40 procent ljusstyrka och 60 Hz från 41 till 100 procent ljusstyrka.


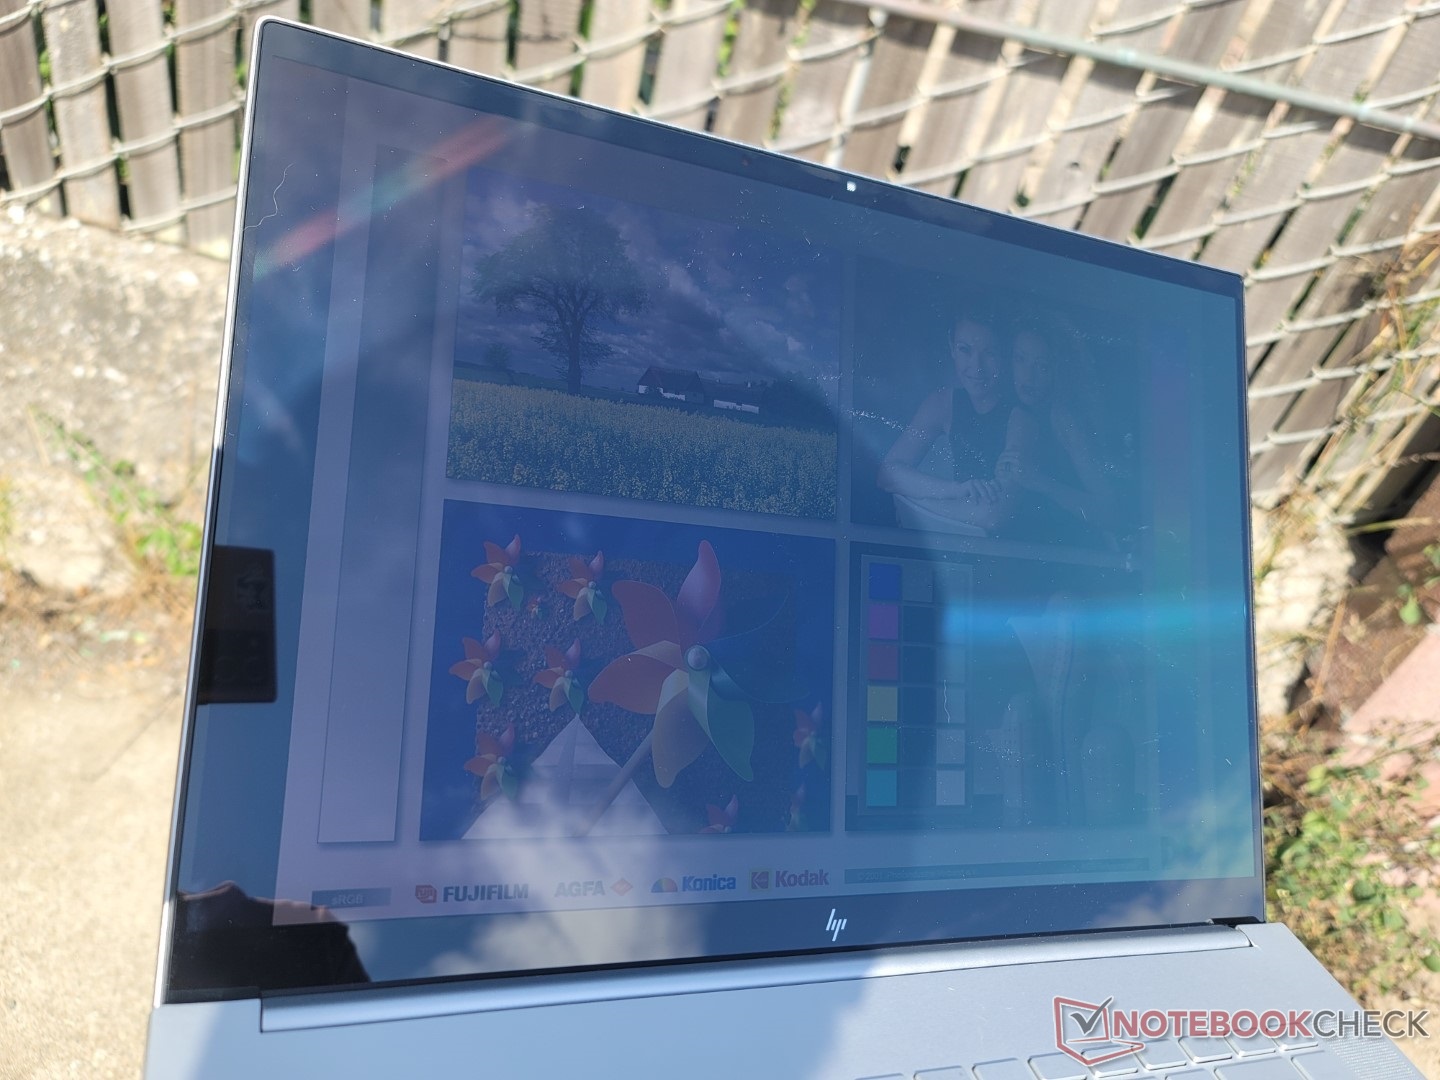
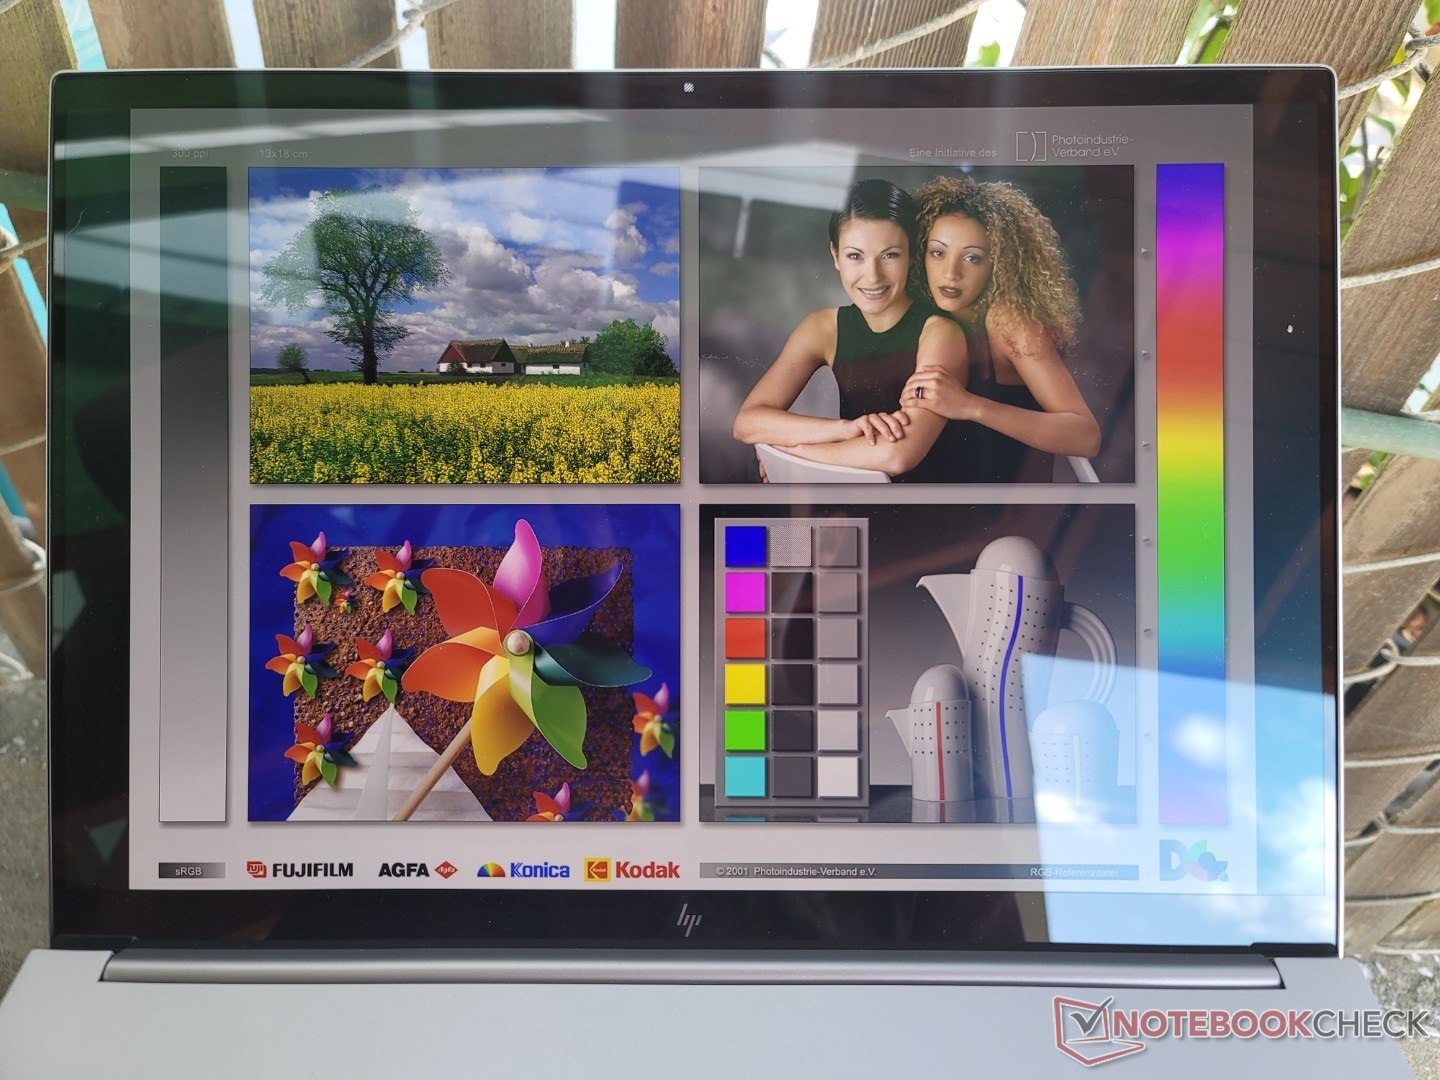
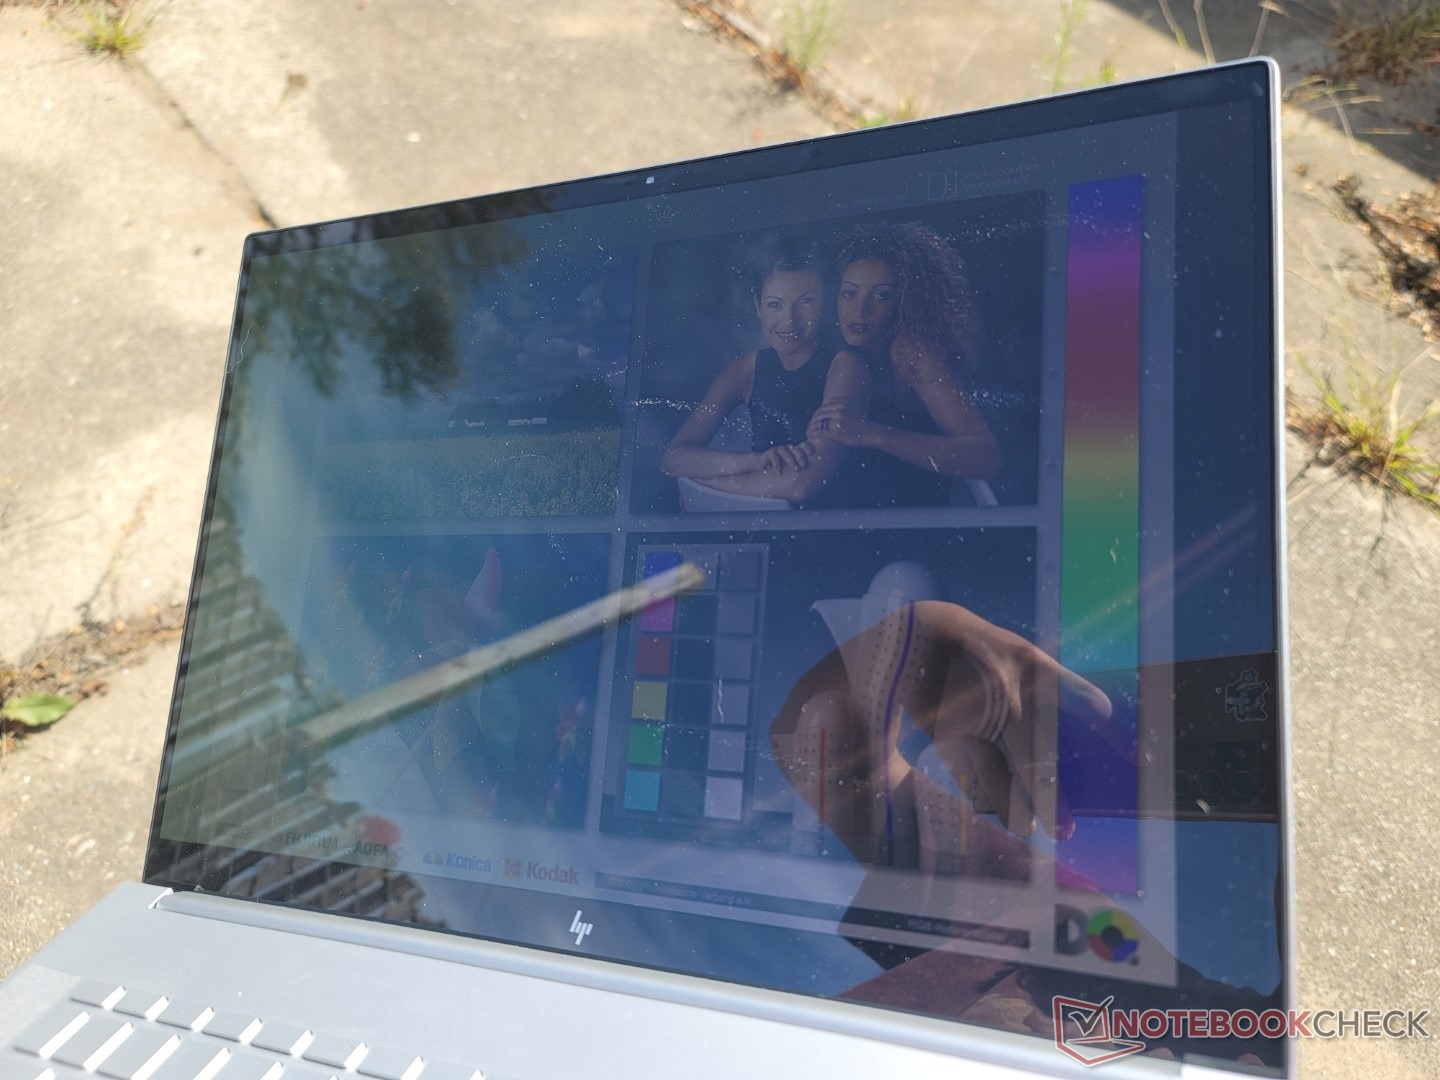
Bländning är oundviklig under de flesta utomhusförhållanden. Den blanka skärmen är inte alls lika ljusstark som skärmen på MacBook Pro 16. Med strax över 320 nits maximalt är detta en av de svagare OLED-panelerna på marknaden.
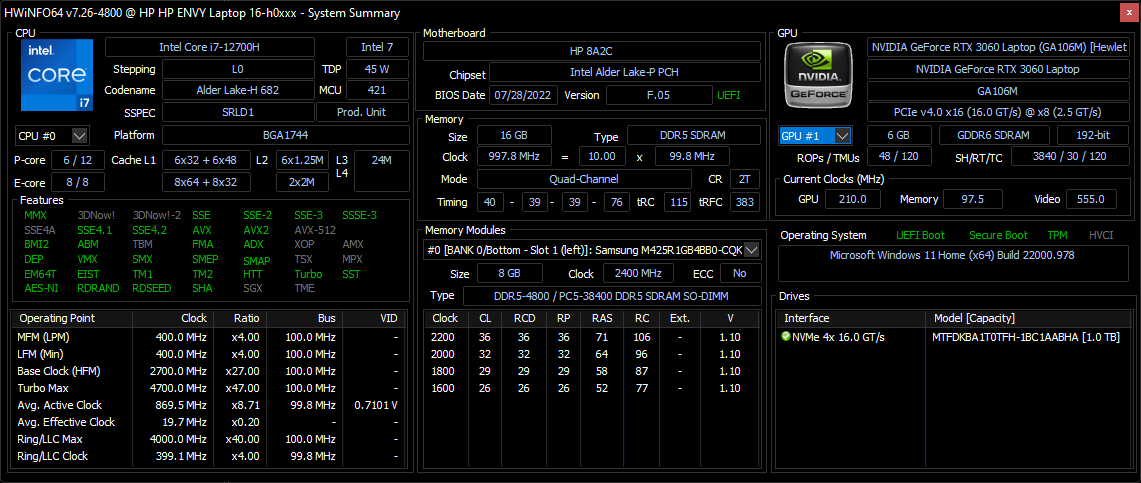
Prestanda - Intel 12th Gen Core H
Provningsförhållanden
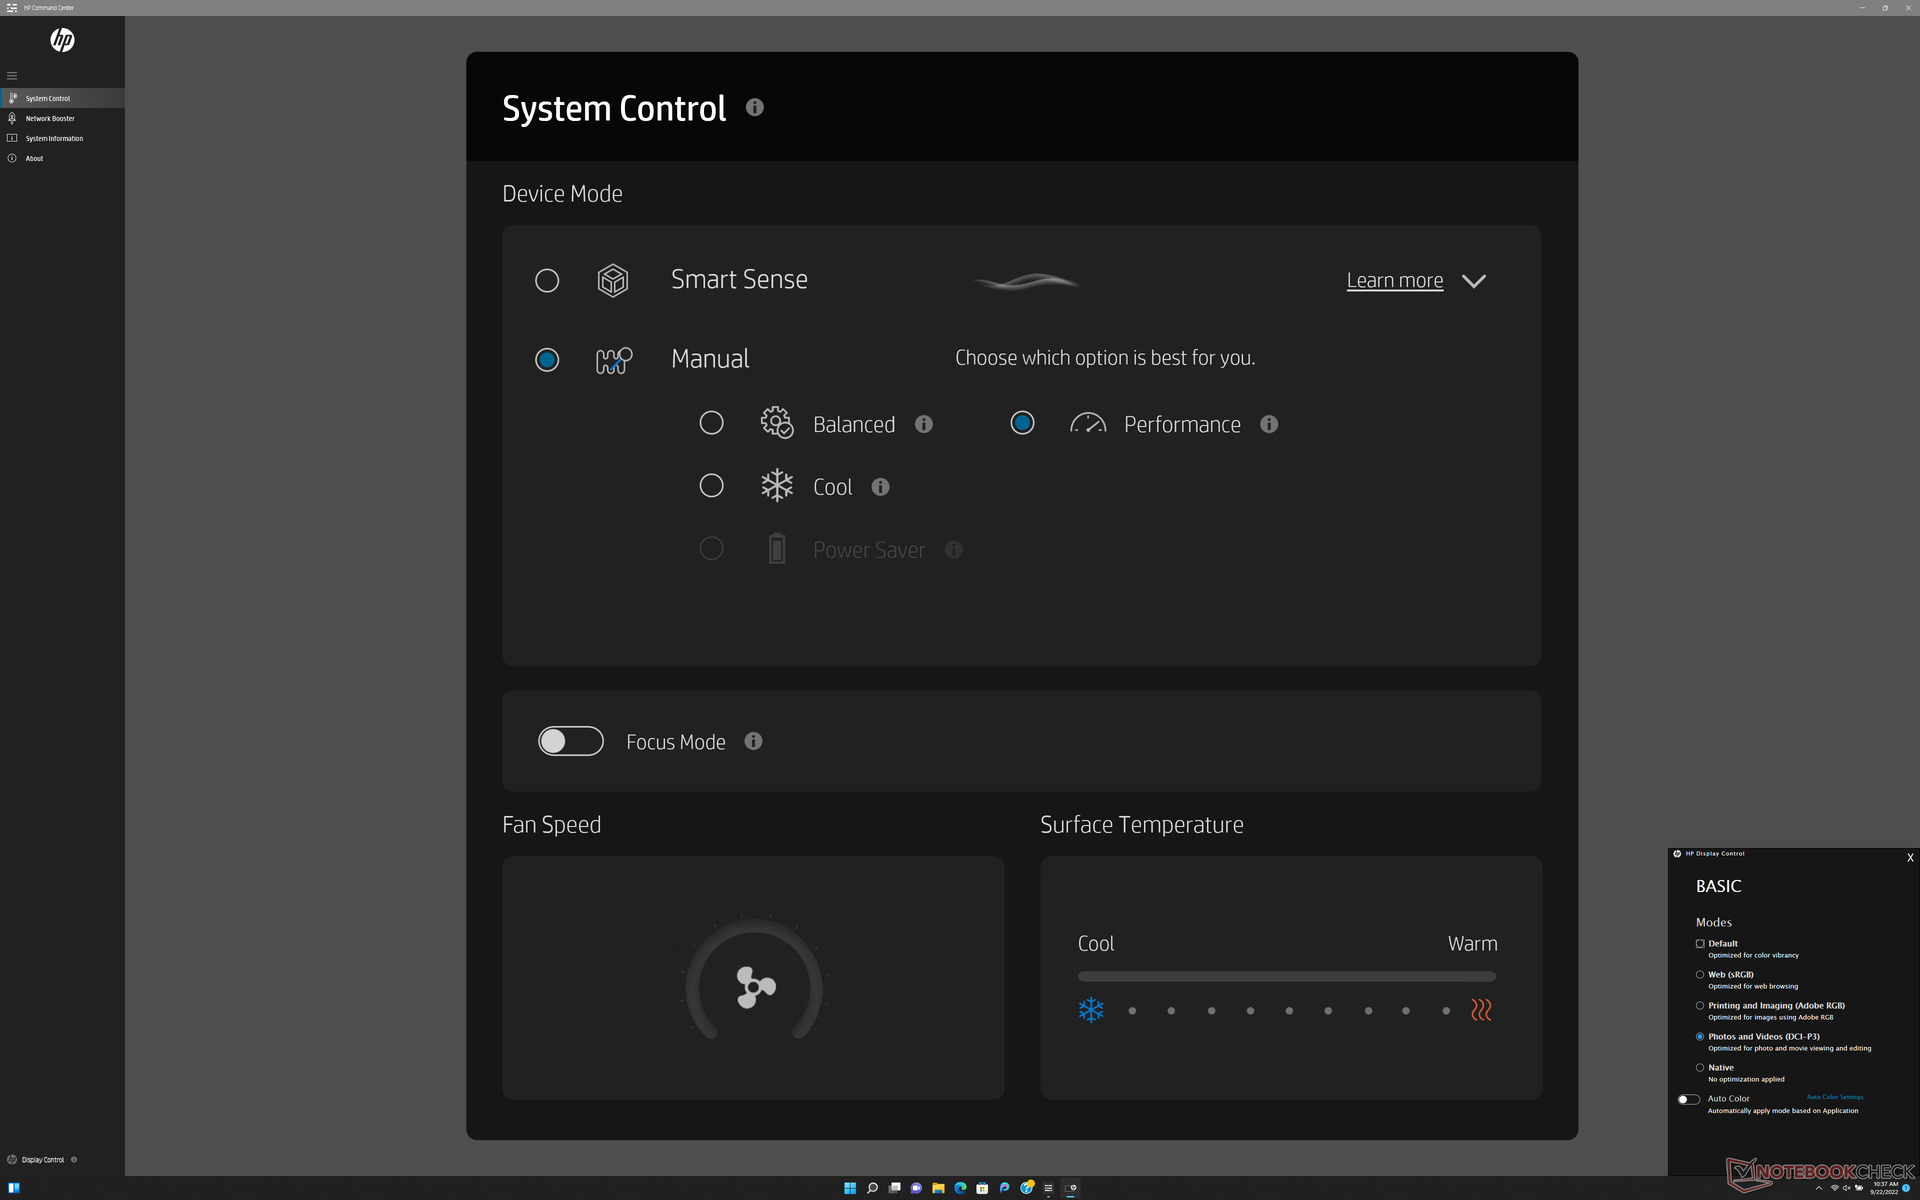
Vi ställde in vår enhet till prestandaläge via både Windows och HP Command Center-programvaran innan vi körde alla benchmarks nedan. HP Command Center är navet för att styra strömprofiler och displayfärger, vilket framgår av skärmdumpen nedan.
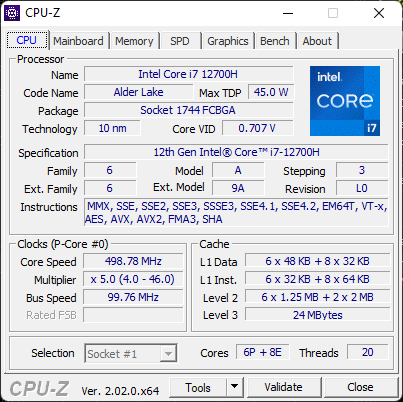
Processor
Prestandan för flera trådar är cirka 15 procent långsammare än den genomsnittliga bärbara datorn i vår databas som är utrustad med samma Core i7-12700H PROCESSOR. Lenovo Legion Slim 7 16, till exempel, kan köra samma processor snabbare även efter att ha tagit hänsyn till eventuell strypning. Trots detta är prestandan fortfarande betydligt bättre än den 10:e gen.Core i7-10750H i Envy 15 från 2020 med cirka 60 procent
Uppgradering till Core i9-12900H SKU förväntas öka prestandan för flera trådar med så mycket som 30-40 procent jämfört med vår Core i7-12700H SKU.
Cinebench R15 Multi Loop
Cinebench R23: Multi Core | Single Core
Cinebench R15: CPU Multi 64Bit | CPU Single 64Bit
Blender: v2.79 BMW27 CPU
7-Zip 18.03: 7z b 4 | 7z b 4 -mmt1
Geekbench 5.5: Multi-Core | Single-Core
HWBOT x265 Benchmark v2.2: 4k Preset
LibreOffice : 20 Documents To PDF
R Benchmark 2.5: Overall mean
| Cinebench R20 / CPU (Multi Core) | |
| MSI GE67 HX 12UGS | |
| MSI Creator Z16P B12UHST | |
| Genomsnitt Intel Core i7-12700H (1576 - 7407, n=64) | |
| Lenovo Legion 7 16ARHA7 | |
| Asus ROG Flow X16 GV601RW-M5082W | |
| HP Envy 16 h0112nr | |
| HP Omen 16-c0077ng | |
| Schenker XMG Apex 15 Max | |
| Dell Inspiron 16 Plus 7610-MHJ8F | |
| Lenovo Legion C7 15IMH05 82EH0030GE | |
| Lenovo ThinkPad X1 Nano Gen 2 Core i7-1280P | |
| Asus ProArt StudioBook Pro 15 W500G5T | |
| HP Envy 15-ep0098nr | |
| Apple MacBook Pro 16 2021 M1 Pro | |
| Cinebench R20 / CPU (Single Core) | |
| MSI Creator Z16P B12UHST | |
| HP Envy 16 h0112nr | |
| Genomsnitt Intel Core i7-12700H (300 - 704, n=64) | |
| MSI GE67 HX 12UGS | |
| Lenovo ThinkPad X1 Nano Gen 2 Core i7-1280P | |
| Lenovo Legion 7 16ARHA7 | |
| Asus ROG Flow X16 GV601RW-M5082W | |
| Dell Inspiron 16 Plus 7610-MHJ8F | |
| Schenker XMG Apex 15 Max | |
| HP Omen 16-c0077ng | |
| Lenovo Legion C7 15IMH05 82EH0030GE | |
| Asus ProArt StudioBook Pro 15 W500G5T | |
| HP Envy 15-ep0098nr | |
| Apple MacBook Pro 16 2021 M1 Pro | |
| Cinebench R15 / CPU Multi 64Bit | |
| MSI GE67 HX 12UGS | |
| MSI Creator Z16P B12UHST | |
| HP Envy 16 h0112nr | |
| Genomsnitt Intel Core i7-12700H (1379 - 2916, n=70) | |
| Lenovo Legion 7 16ARHA7 | |
| Asus ROG Flow X16 GV601RW-M5082W | |
| Lenovo ThinkPad X1 Nano Gen 2 Core i7-1280P | |
| HP Omen 16-c0077ng | |
| Dell Inspiron 16 Plus 7610-MHJ8F | |
| Schenker XMG Apex 15 Max | |
| Apple MacBook Pro 16 2021 M1 Pro | |
| Lenovo Legion C7 15IMH05 82EH0030GE | |
| HP Envy 15-ep0098nr | |
| Asus ProArt StudioBook Pro 15 W500G5T | |
| Cinebench R15 / CPU Single 64Bit | |
| MSI Creator Z16P B12UHST | |
| MSI GE67 HX 12UGS | |
| HP Envy 16 h0112nr | |
| Genomsnitt Intel Core i7-12700H (113 - 263, n=65) | |
| Lenovo Legion 7 16ARHA7 | |
| Schenker XMG Apex 15 Max | |
| Asus ROG Flow X16 GV601RW-M5082W | |
| Lenovo ThinkPad X1 Nano Gen 2 Core i7-1280P | |
| HP Omen 16-c0077ng | |
| Dell Inspiron 16 Plus 7610-MHJ8F | |
| Apple MacBook Pro 16 2021 M1 Pro | |
| Lenovo Legion C7 15IMH05 82EH0030GE | |
| HP Envy 15-ep0098nr | |
| Asus ProArt StudioBook Pro 15 W500G5T | |
| Blender / v2.79 BMW27 CPU | |
| Asus ProArt StudioBook Pro 15 W500G5T | |
| HP Envy 15-ep0098nr | |
| Lenovo Legion C7 15IMH05 82EH0030GE | |
| Dell Inspiron 16 Plus 7610-MHJ8F | |
| Lenovo ThinkPad X1 Nano Gen 2 Core i7-1280P | |
| Schenker XMG Apex 15 Max | |
| HP Omen 16-c0077ng | |
| HP Envy 16 h0112nr | |
| Genomsnitt Intel Core i7-12700H (168 - 732, n=63) | |
| Asus ROG Flow X16 GV601RW-M5082W | |
| Lenovo Legion 7 16ARHA7 | |
| MSI Creator Z16P B12UHST | |
| Apple MacBook Pro 16 2021 M1 Pro | |
| MSI GE67 HX 12UGS | |
| 7-Zip 18.03 / 7z b 4 | |
| MSI GE67 HX 12UGS | |
| MSI Creator Z16P B12UHST | |
| Schenker XMG Apex 15 Max | |
| Lenovo Legion 7 16ARHA7 | |
| Asus ROG Flow X16 GV601RW-M5082W | |
| Genomsnitt Intel Core i7-12700H (22844 - 73067, n=63) | |
| HP Envy 16 h0112nr | |
| Lenovo ThinkPad X1 Nano Gen 2 Core i7-1280P | |
| Lenovo Legion C7 15IMH05 82EH0030GE | |
| Dell Inspiron 16 Plus 7610-MHJ8F | |
| Asus ProArt StudioBook Pro 15 W500G5T | |
| HP Envy 15-ep0098nr | |
| 7-Zip 18.03 / 7z b 4 -mmt1 | |
| Schenker XMG Apex 15 Max | |
| MSI Creator Z16P B12UHST | |
| HP Envy 16 h0112nr | |
| Asus ROG Flow X16 GV601RW-M5082W | |
| Lenovo Legion 7 16ARHA7 | |
| Genomsnitt Intel Core i7-12700H (2743 - 5972, n=63) | |
| MSI GE67 HX 12UGS | |
| Lenovo ThinkPad X1 Nano Gen 2 Core i7-1280P | |
| HP Omen 16-c0077ng | |
| Lenovo Legion C7 15IMH05 82EH0030GE | |
| Dell Inspiron 16 Plus 7610-MHJ8F | |
| Asus ProArt StudioBook Pro 15 W500G5T | |
| HP Envy 15-ep0098nr | |
| HWBOT x265 Benchmark v2.2 / 4k Preset | |
| MSI GE67 HX 12UGS | |
| MSI Creator Z16P B12UHST | |
| Lenovo Legion 7 16ARHA7 | |
| Genomsnitt Intel Core i7-12700H (4.67 - 21.8, n=64) | |
| Asus ROG Flow X16 GV601RW-M5082W | |
| HP Omen 16-c0077ng | |
| HP Envy 16 h0112nr | |
| Schenker XMG Apex 15 Max | |
| Dell Inspiron 16 Plus 7610-MHJ8F | |
| Lenovo Legion C7 15IMH05 82EH0030GE | |
| HP Envy 15-ep0098nr | |
| Lenovo ThinkPad X1 Nano Gen 2 Core i7-1280P | |
| Asus ProArt StudioBook Pro 15 W500G5T | |
| LibreOffice / 20 Documents To PDF | |
| HP Omen 16-c0077ng | |
| Asus ProArt StudioBook Pro 15 W500G5T | |
| Asus ROG Flow X16 GV601RW-M5082W | |
| Lenovo Legion C7 15IMH05 82EH0030GE | |
| Lenovo Legion 7 16ARHA7 | |
| Schenker XMG Apex 15 Max | |
| HP Envy 15-ep0098nr | |
| Genomsnitt Intel Core i7-12700H (34.2 - 95.3, n=63) | |
| Dell Inspiron 16 Plus 7610-MHJ8F | |
| Lenovo ThinkPad X1 Nano Gen 2 Core i7-1280P | |
| HP Envy 16 h0112nr | |
| MSI GE67 HX 12UGS | |
| MSI Creator Z16P B12UHST | |
| R Benchmark 2.5 / Overall mean | |
| Asus ProArt StudioBook Pro 15 W500G5T | |
| HP Envy 15-ep0098nr | |
| Lenovo Legion C7 15IMH05 82EH0030GE | |
| Dell Inspiron 16 Plus 7610-MHJ8F | |
| HP Omen 16-c0077ng | |
| Schenker XMG Apex 15 Max | |
| Asus ROG Flow X16 GV601RW-M5082W | |
| Lenovo Legion 7 16ARHA7 | |
| Lenovo ThinkPad X1 Nano Gen 2 Core i7-1280P | |
| Genomsnitt Intel Core i7-12700H (0.4441 - 1.052, n=63) | |
| MSI GE67 HX 12UGS | |
| HP Envy 16 h0112nr | |
| MSI Creator Z16P B12UHST | |
Cinebench R23: Multi Core | Single Core
Cinebench R15: CPU Multi 64Bit | CPU Single 64Bit
Blender: v2.79 BMW27 CPU
7-Zip 18.03: 7z b 4 | 7z b 4 -mmt1
Geekbench 5.5: Multi-Core | Single-Core
HWBOT x265 Benchmark v2.2: 4k Preset
LibreOffice : 20 Documents To PDF
R Benchmark 2.5: Overall mean
* ... mindre är bättre
AIDA64: FP32 Ray-Trace | FPU Julia | CPU SHA3 | CPU Queen | FPU SinJulia | FPU Mandel | CPU AES | CPU ZLib | FP64 Ray-Trace | CPU PhotoWorxx
| Performance rating | |
| Lenovo ThinkBook 16 G4+ IAP | |
| HP Envy 16 h0112nr | |
| MSI Creator Z16P B12UHST | |
| Genomsnitt Intel Core i7-12700H | |
| Dell Inspiron 16 Plus 7610-MHJ8F | |
| Huawei MateBook 16s i7 | |
| AIDA64 / FP32 Ray-Trace | |
| Lenovo ThinkBook 16 G4+ IAP | |
| HP Envy 16 h0112nr | |
| Genomsnitt Intel Core i7-12700H (2585 - 17957, n=64) | |
| Dell Inspiron 16 Plus 7610-MHJ8F | |
| MSI Creator Z16P B12UHST | |
| Huawei MateBook 16s i7 | |
| AIDA64 / FPU Julia | |
| Lenovo ThinkBook 16 G4+ IAP | |
| HP Envy 16 h0112nr | |
| Dell Inspiron 16 Plus 7610-MHJ8F | |
| Genomsnitt Intel Core i7-12700H (12439 - 90760, n=64) | |
| MSI Creator Z16P B12UHST | |
| Huawei MateBook 16s i7 | |
| AIDA64 / CPU SHA3 | |
| Dell Inspiron 16 Plus 7610-MHJ8F | |
| Lenovo ThinkBook 16 G4+ IAP | |
| Genomsnitt Intel Core i7-12700H (833 - 4242, n=64) | |
| MSI Creator Z16P B12UHST | |
| HP Envy 16 h0112nr | |
| Huawei MateBook 16s i7 | |
| AIDA64 / CPU Queen | |
| MSI Creator Z16P B12UHST | |
| Lenovo ThinkBook 16 G4+ IAP | |
| HP Envy 16 h0112nr | |
| Genomsnitt Intel Core i7-12700H (57923 - 103202, n=63) | |
| Huawei MateBook 16s i7 | |
| Dell Inspiron 16 Plus 7610-MHJ8F | |
| AIDA64 / FPU SinJulia | |
| MSI Creator Z16P B12UHST | |
| Lenovo ThinkBook 16 G4+ IAP | |
| Genomsnitt Intel Core i7-12700H (3249 - 9939, n=64) | |
| Dell Inspiron 16 Plus 7610-MHJ8F | |
| HP Envy 16 h0112nr | |
| Huawei MateBook 16s i7 | |
| AIDA64 / FPU Mandel | |
| Lenovo ThinkBook 16 G4+ IAP | |
| Dell Inspiron 16 Plus 7610-MHJ8F | |
| HP Envy 16 h0112nr | |
| Genomsnitt Intel Core i7-12700H (7135 - 44760, n=64) | |
| MSI Creator Z16P B12UHST | |
| Huawei MateBook 16s i7 | |
| AIDA64 / CPU AES | |
| Dell Inspiron 16 Plus 7610-MHJ8F | |
| HP Envy 16 h0112nr | |
| MSI Creator Z16P B12UHST | |
| Genomsnitt Intel Core i7-12700H (31839 - 144360, n=64) | |
| Lenovo ThinkBook 16 G4+ IAP | |
| Huawei MateBook 16s i7 | |
| AIDA64 / CPU ZLib | |
| MSI Creator Z16P B12UHST | |
| Lenovo ThinkBook 16 G4+ IAP | |
| Genomsnitt Intel Core i7-12700H (305 - 1171, n=64) | |
| HP Envy 16 h0112nr | |
| Dell Inspiron 16 Plus 7610-MHJ8F | |
| Huawei MateBook 16s i7 | |
| AIDA64 / FP64 Ray-Trace | |
| Lenovo ThinkBook 16 G4+ IAP | |
| HP Envy 16 h0112nr | |
| Genomsnitt Intel Core i7-12700H (1437 - 9692, n=64) | |
| Dell Inspiron 16 Plus 7610-MHJ8F | |
| MSI Creator Z16P B12UHST | |
| Huawei MateBook 16s i7 | |
| AIDA64 / CPU PhotoWorxx | |
| Huawei MateBook 16s i7 | |
| MSI Creator Z16P B12UHST | |
| Lenovo ThinkBook 16 G4+ IAP | |
| HP Envy 16 h0112nr | |
| Genomsnitt Intel Core i7-12700H (12863 - 52207, n=64) | |
| Dell Inspiron 16 Plus 7610-MHJ8F | |
Systemets prestanda
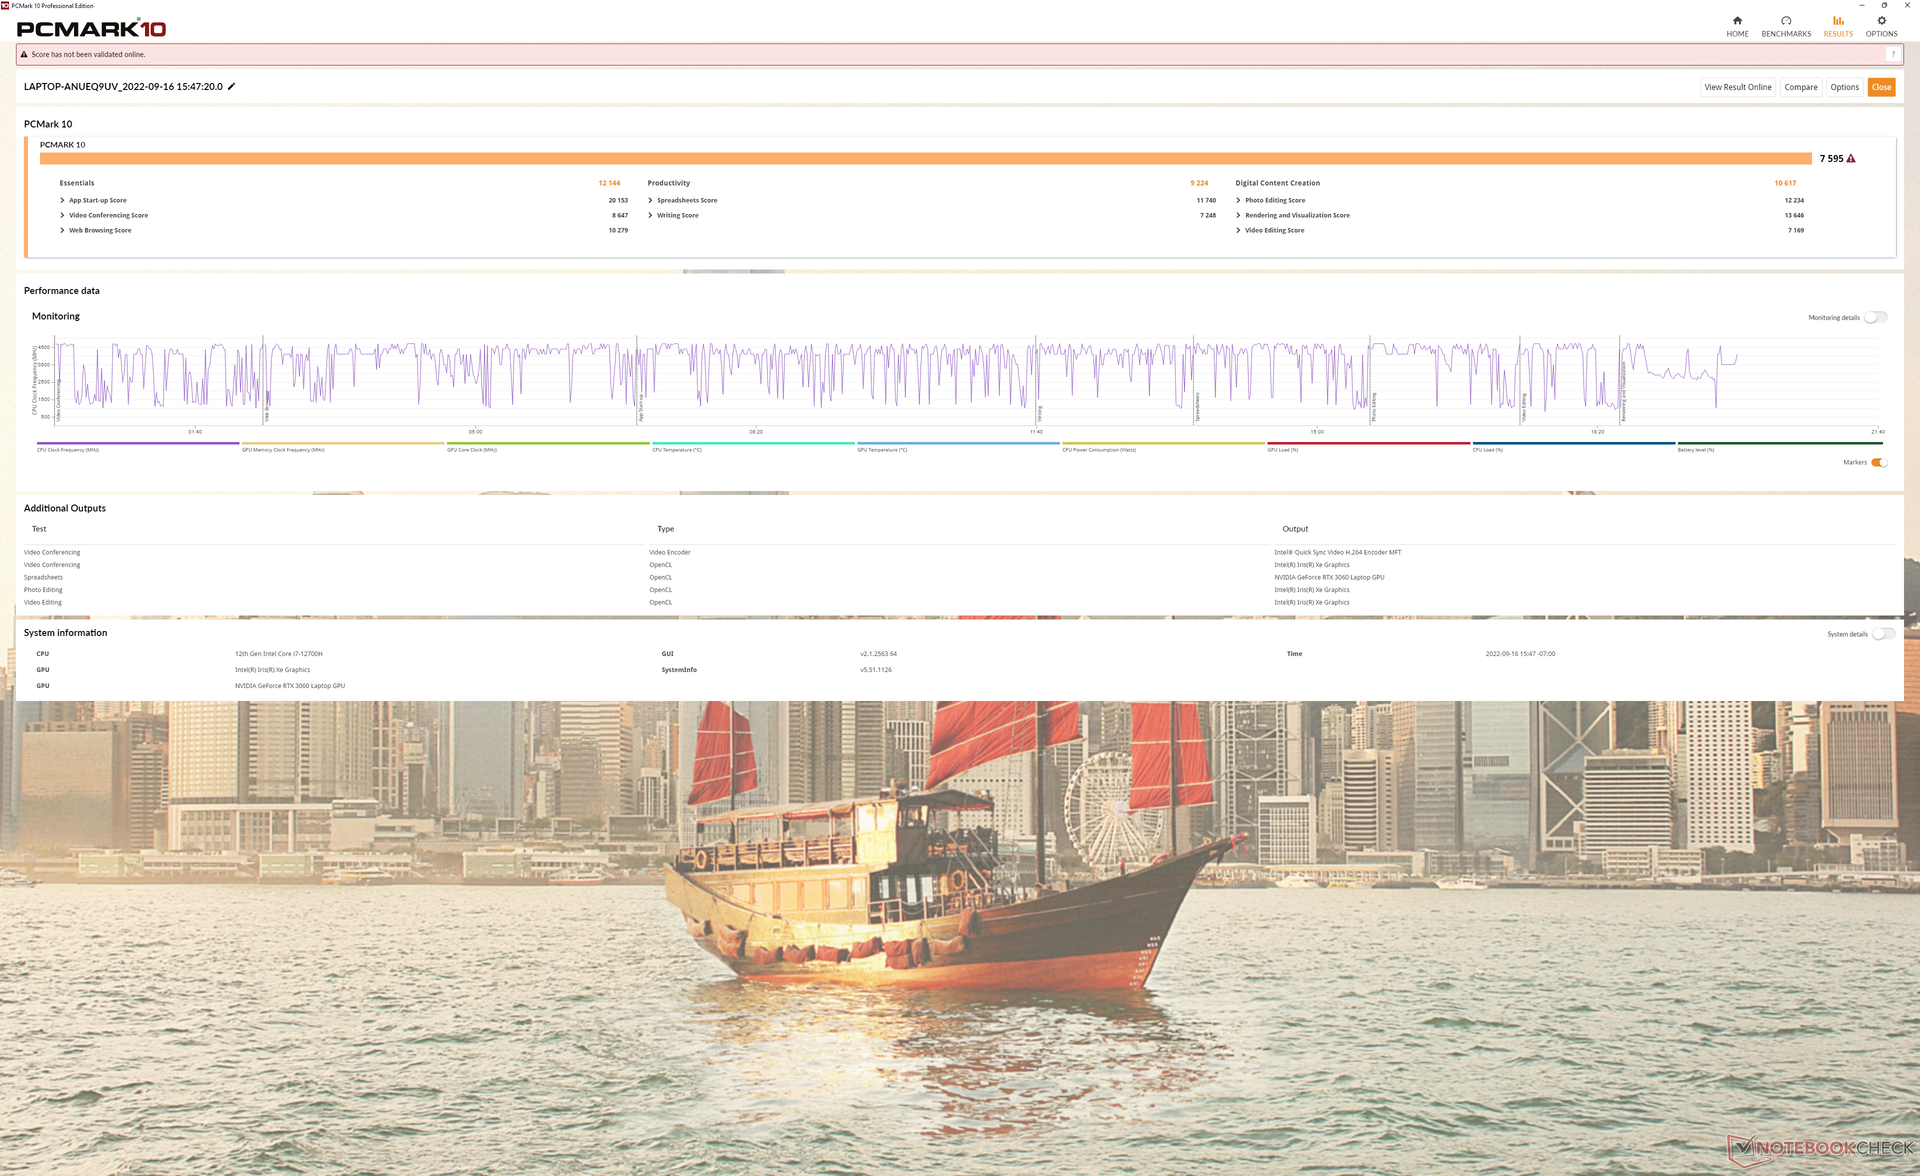
PCMark-resultaten är konsekvent överlägsna 2020 Envy 15 med stora marginaler. Vi misstänker att övergången från Intel Optane spelade en stor roll i ökningen av resultaten.
CrossMark: Overall | Productivity | Creativity | Responsiveness
| PCMark 10 / Score | |
| MSI Creator Z16P B12UHST | |
| HP Envy 16 h0112nr | |
| Genomsnitt Intel Core i7-12700H, NVIDIA GeForce RTX 3060 Laptop GPU (5986 - 8156, n=12) | |
| Huawei MateBook 16s i7 | |
| HP Envy 15-ep0098nr | |
| Dell Inspiron 16 Plus 7610-MHJ8F | |
| PCMark 10 / Essentials | |
| HP Envy 16 h0112nr | |
| Huawei MateBook 16s i7 | |
| MSI Creator Z16P B12UHST | |
| Genomsnitt Intel Core i7-12700H, NVIDIA GeForce RTX 3060 Laptop GPU (9289 - 12144, n=12) | |
| Dell Inspiron 16 Plus 7610-MHJ8F | |
| HP Envy 15-ep0098nr | |
| PCMark 10 / Productivity | |
| MSI Creator Z16P B12UHST | |
| HP Envy 16 h0112nr | |
| Genomsnitt Intel Core i7-12700H, NVIDIA GeForce RTX 3060 Laptop GPU (6161 - 10362, n=12) | |
| Huawei MateBook 16s i7 | |
| HP Envy 15-ep0098nr | |
| Dell Inspiron 16 Plus 7610-MHJ8F | |
| PCMark 10 / Digital Content Creation | |
| MSI Creator Z16P B12UHST | |
| Genomsnitt Intel Core i7-12700H, NVIDIA GeForce RTX 3060 Laptop GPU (8950 - 12554, n=12) | |
| HP Envy 16 h0112nr | |
| Huawei MateBook 16s i7 | |
| HP Envy 15-ep0098nr | |
| Dell Inspiron 16 Plus 7610-MHJ8F | |
| CrossMark / Overall | |
| Huawei MateBook 16s i7 | |
| HP Envy 16 h0112nr | |
| Genomsnitt Intel Core i7-12700H, NVIDIA GeForce RTX 3060 Laptop GPU (1649 - 2017, n=11) | |
| Lenovo ThinkBook 16 G4+ IAP | |
| Apple MacBook Pro 16 2021 M1 Pro | |
| CrossMark / Productivity | |
| Huawei MateBook 16s i7 | |
| HP Envy 16 h0112nr | |
| Genomsnitt Intel Core i7-12700H, NVIDIA GeForce RTX 3060 Laptop GPU (1536 - 1958, n=11) | |
| Lenovo ThinkBook 16 G4+ IAP | |
| Apple MacBook Pro 16 2021 M1 Pro | |
| CrossMark / Creativity | |
| Apple MacBook Pro 16 2021 M1 Pro | |
| HP Envy 16 h0112nr | |
| Huawei MateBook 16s i7 | |
| Lenovo ThinkBook 16 G4+ IAP | |
| Genomsnitt Intel Core i7-12700H, NVIDIA GeForce RTX 3060 Laptop GPU (1816 - 2084, n=11) | |
| CrossMark / Responsiveness | |
| Huawei MateBook 16s i7 | |
| Genomsnitt Intel Core i7-12700H, NVIDIA GeForce RTX 3060 Laptop GPU (1210 - 2207, n=11) | |
| HP Envy 16 h0112nr | |
| Lenovo ThinkBook 16 G4+ IAP | |
| Apple MacBook Pro 16 2021 M1 Pro | |
| PCMark 10 Score | 7595 poäng | |
Hjälp | ||
| AIDA64 / Memory Copy | |
| Huawei MateBook 16s i7 | |
| Lenovo ThinkBook 16 G4+ IAP | |
| MSI Creator Z16P B12UHST | |
| HP Envy 16 h0112nr | |
| Genomsnitt Intel Core i7-12700H (25615 - 80511, n=64) | |
| Dell Inspiron 16 Plus 7610-MHJ8F | |
| AIDA64 / Memory Read | |
| Lenovo ThinkBook 16 G4+ IAP | |
| Huawei MateBook 16s i7 | |
| MSI Creator Z16P B12UHST | |
| HP Envy 16 h0112nr | |
| Genomsnitt Intel Core i7-12700H (25586 - 79442, n=64) | |
| Dell Inspiron 16 Plus 7610-MHJ8F | |
| AIDA64 / Memory Write | |
| MSI Creator Z16P B12UHST | |
| Huawei MateBook 16s i7 | |
| HP Envy 16 h0112nr | |
| Lenovo ThinkBook 16 G4+ IAP | |
| Genomsnitt Intel Core i7-12700H (23679 - 88660, n=64) | |
| Dell Inspiron 16 Plus 7610-MHJ8F | |
| AIDA64 / Memory Latency | |
| Lenovo ThinkBook 16 G4+ IAP | |
| Huawei MateBook 16s i7 | |
| Dell Inspiron 16 Plus 7610-MHJ8F | |
| MSI Creator Z16P B12UHST | |
| HP Envy 16 h0112nr | |
| Genomsnitt Intel Core i7-12700H (76.2 - 133.9, n=62) | |
* ... mindre är bättre
DPC-latenstid
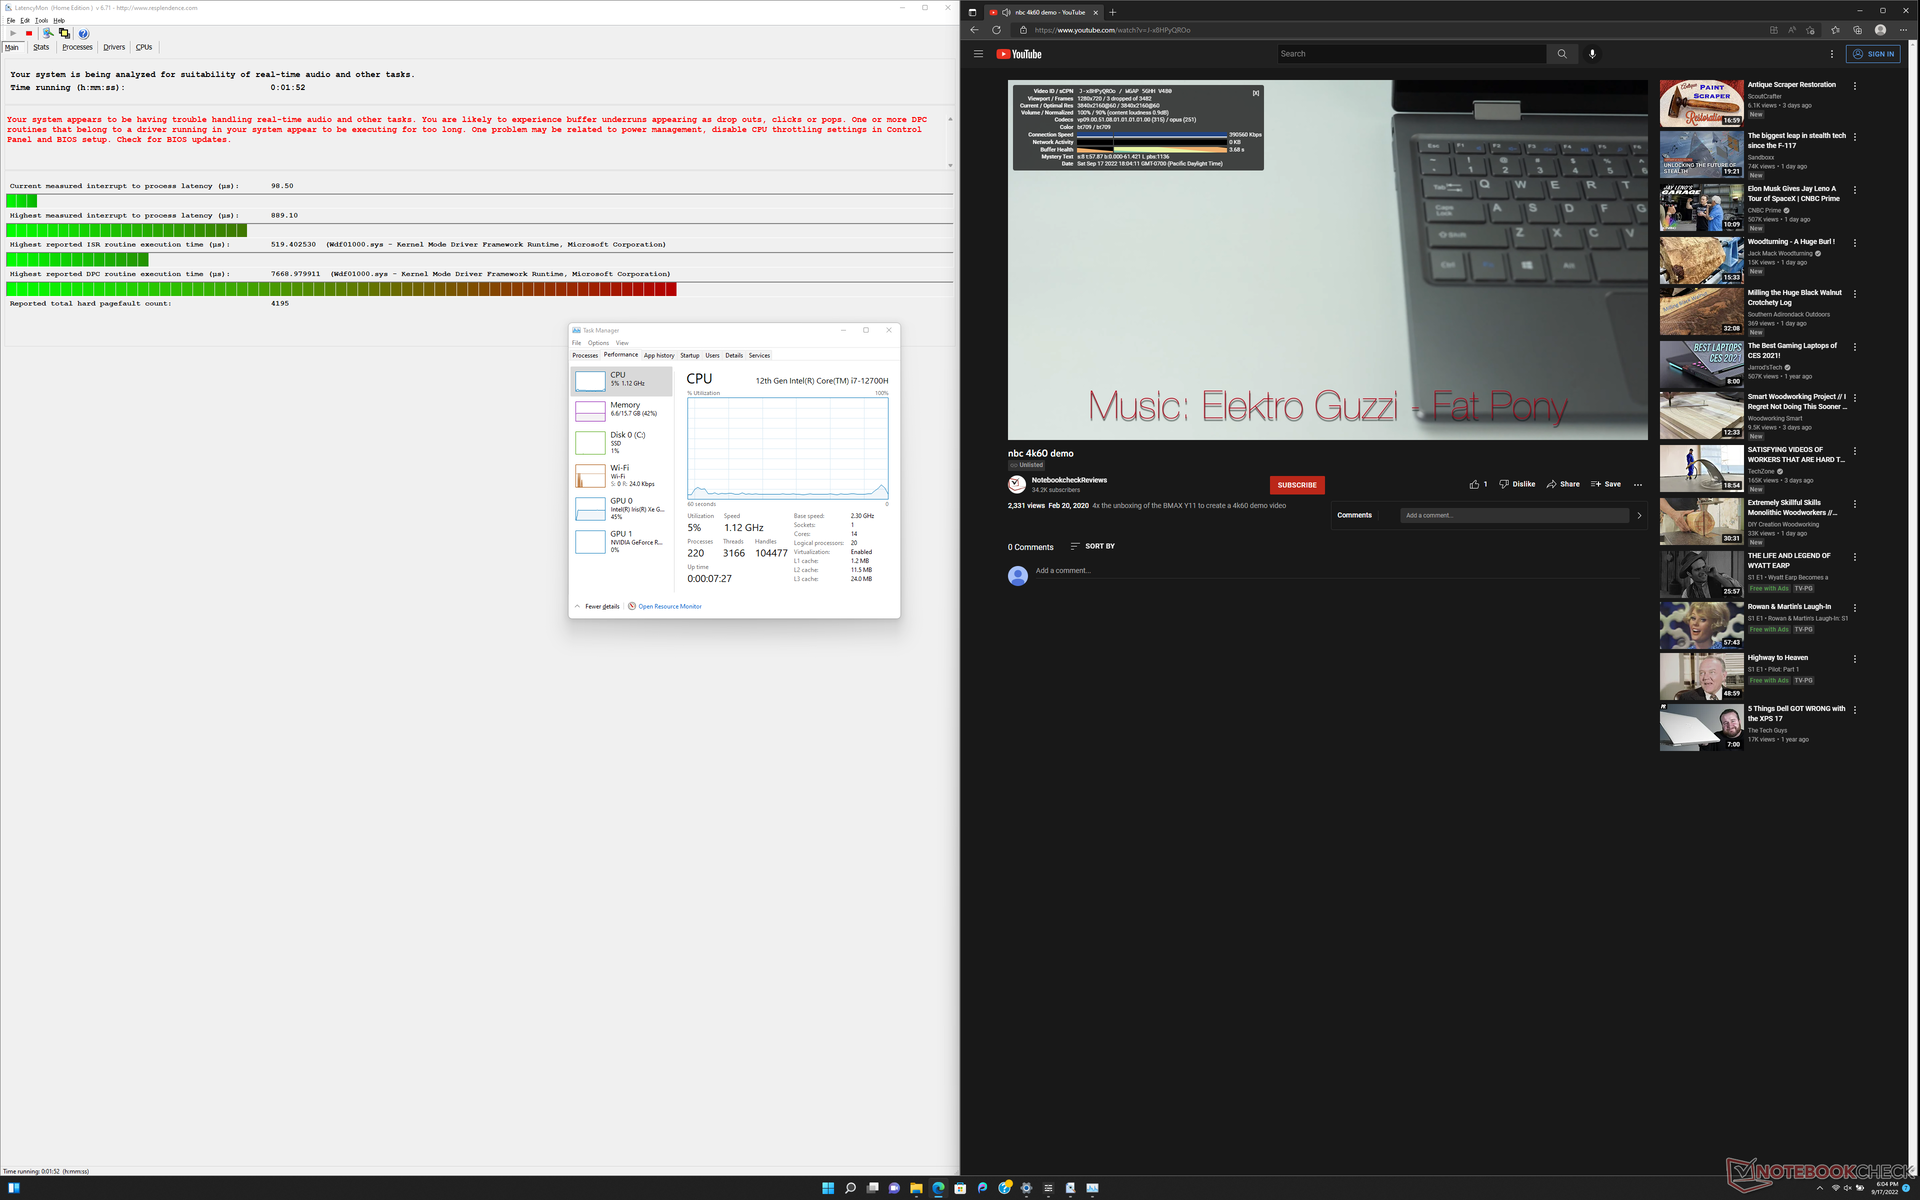
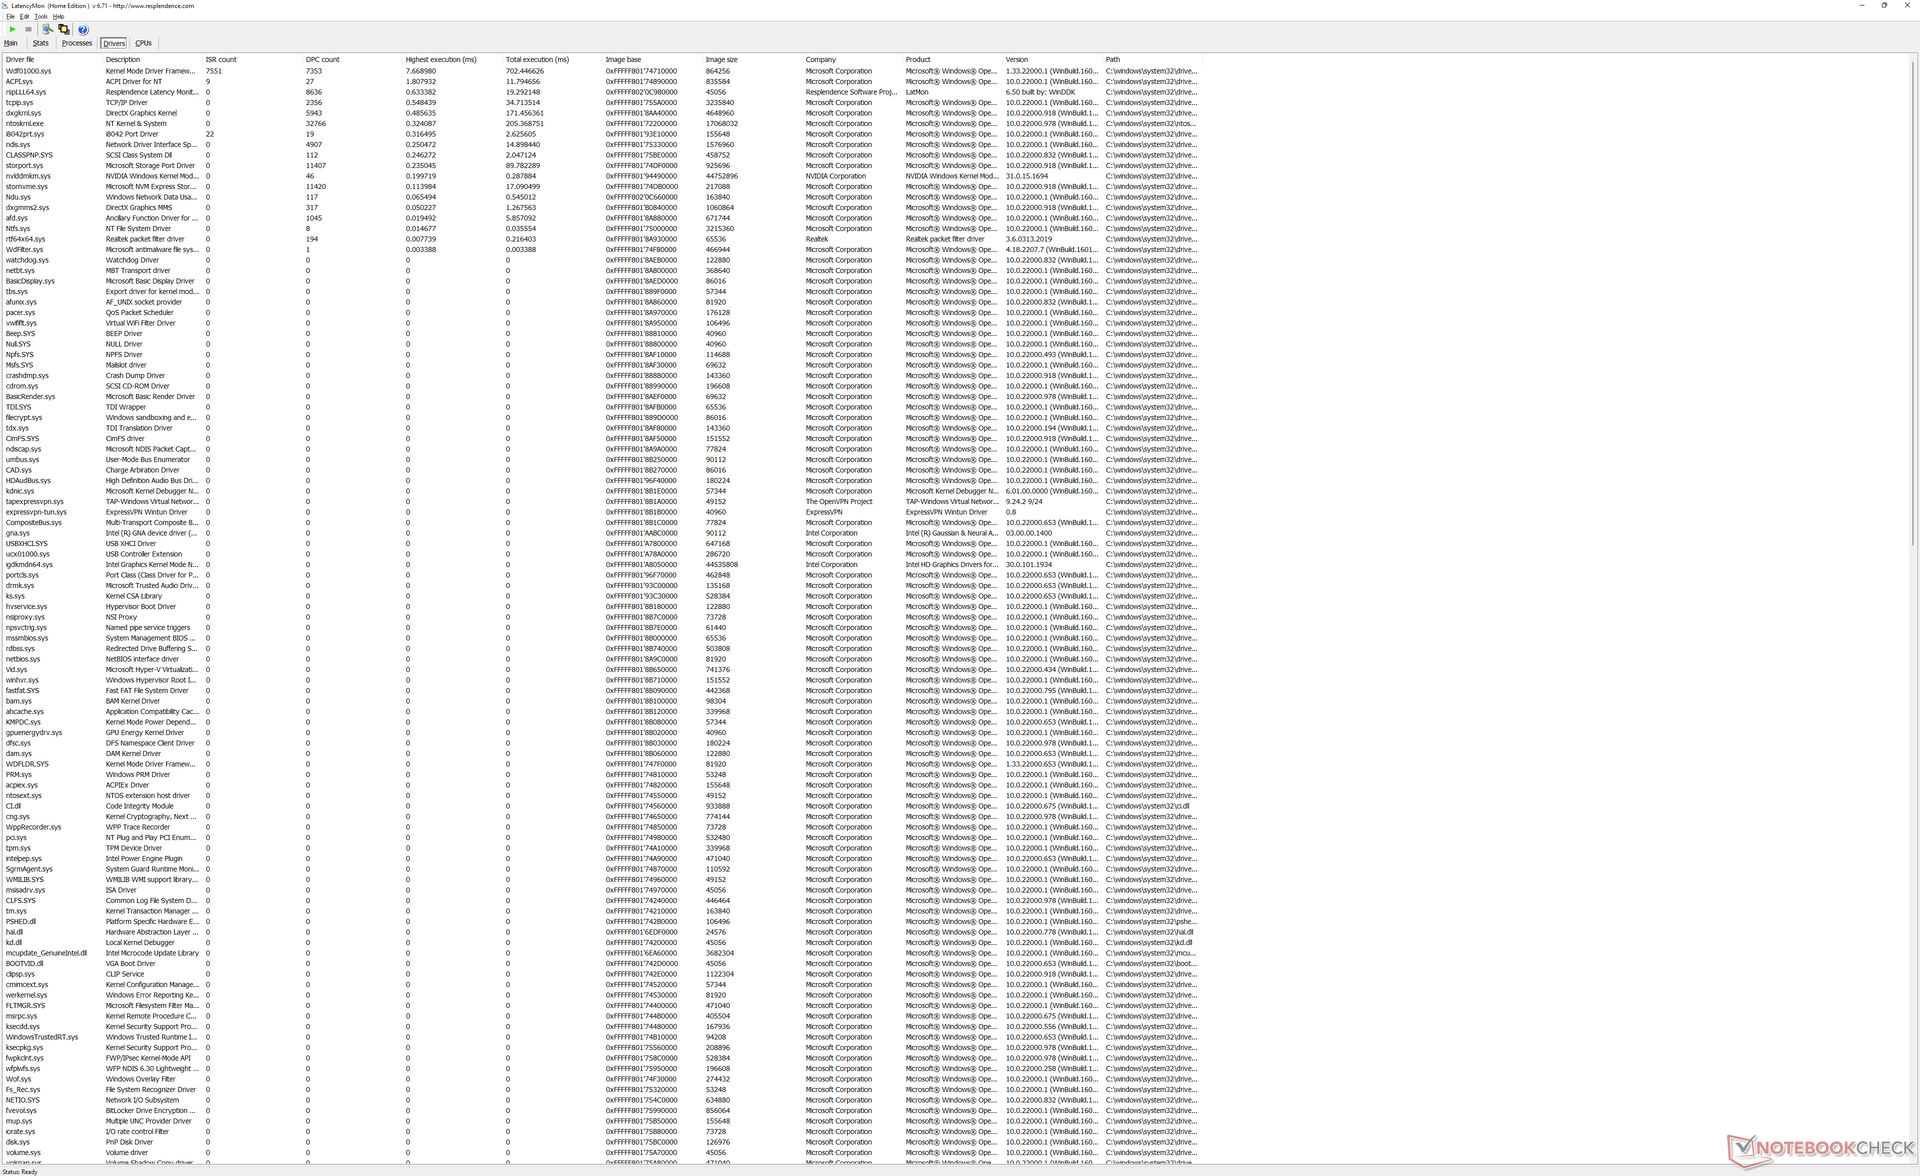
LatencyMon avslöjar DPC-problem när du öppnar flera webbläsarflikar på vår hemsida. uppspelning av 4K-video vid 60 FPS är också ofullständig med 3 tappade bilder under vår minutlånga testvideo.
| DPC Latencies / LatencyMon - interrupt to process latency (max), Web, Youtube, Prime95 | |
| Lenovo ThinkBook 16 G4+ IAP | |
| HP Envy 16 h0112nr | |
| MSI Creator Z16P B12UHST | |
* ... mindre är bättre
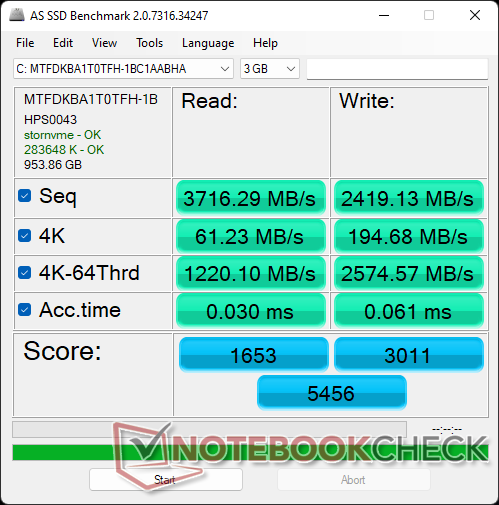
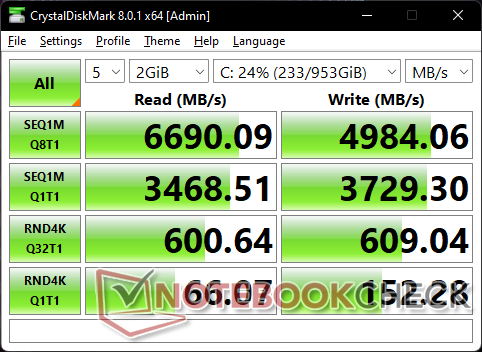
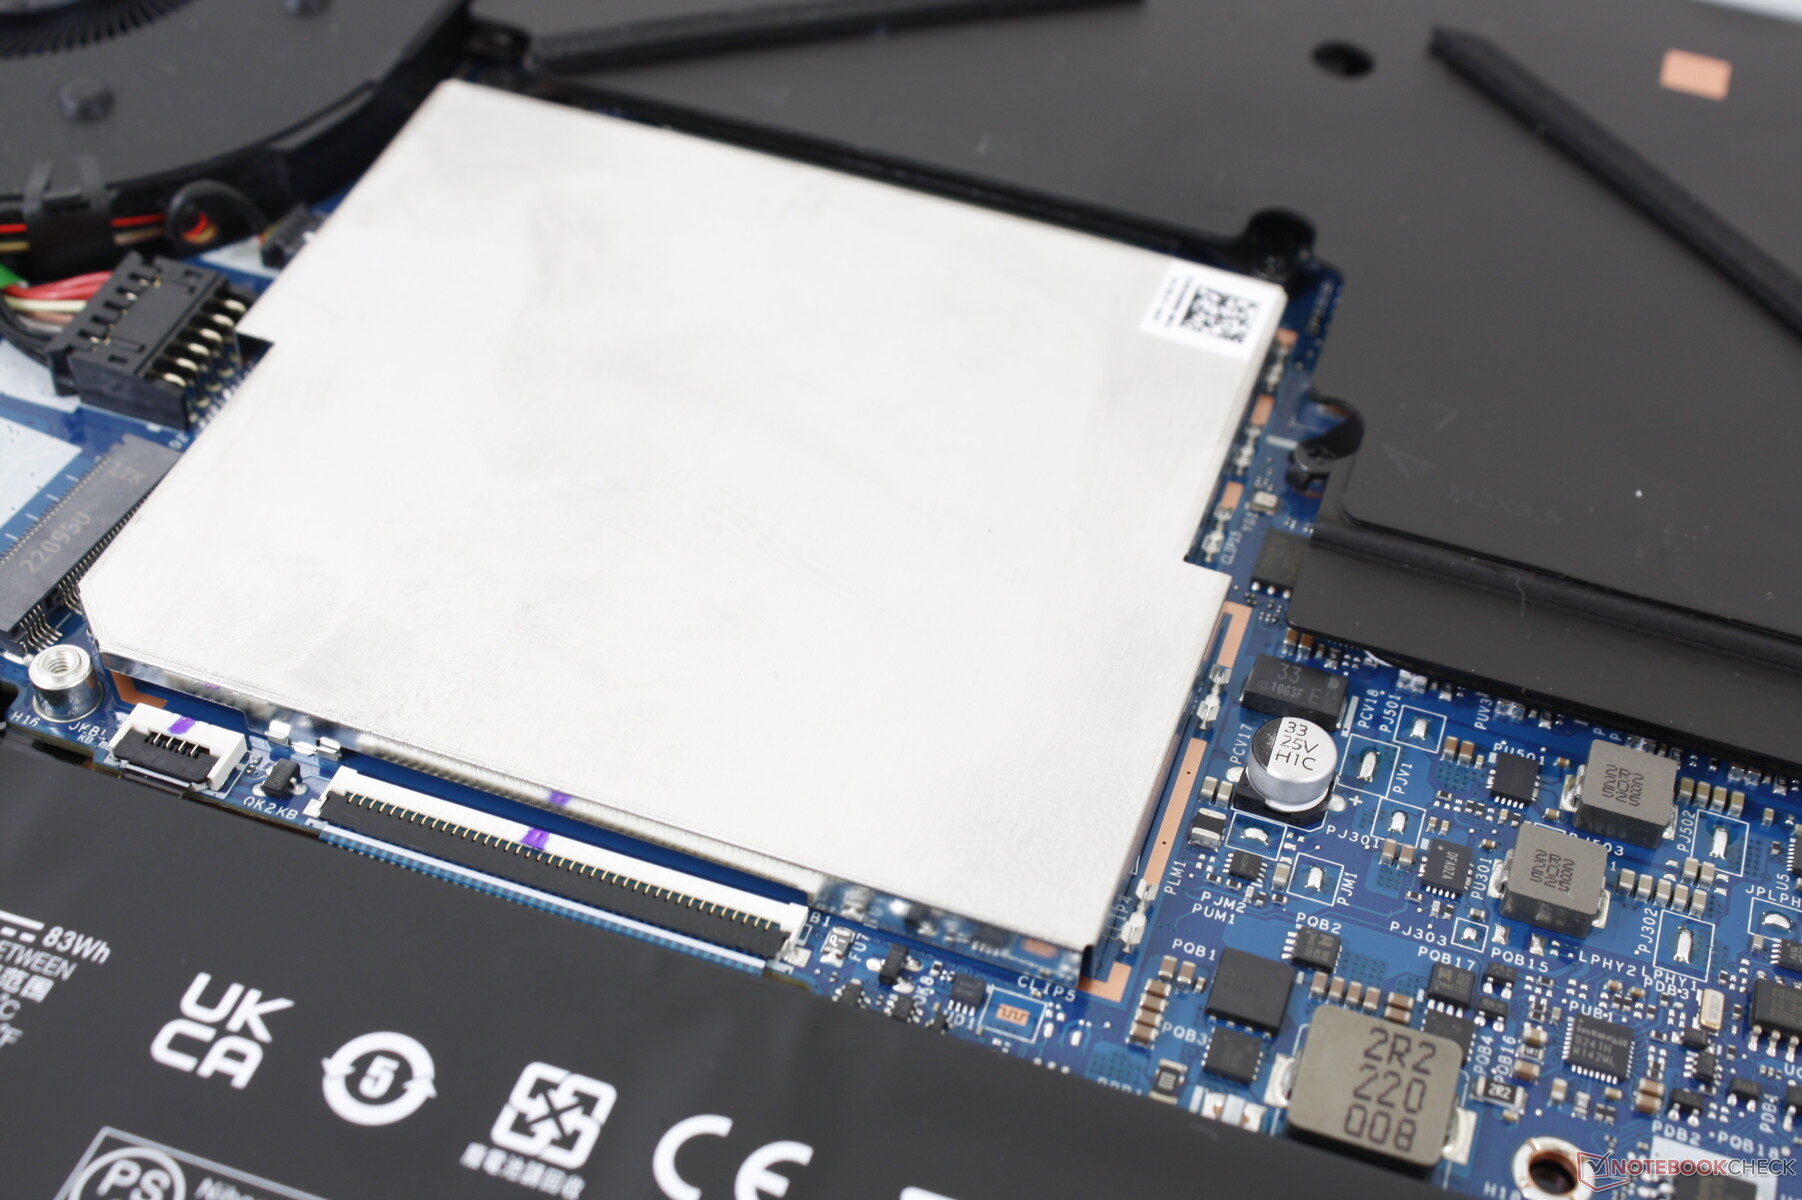
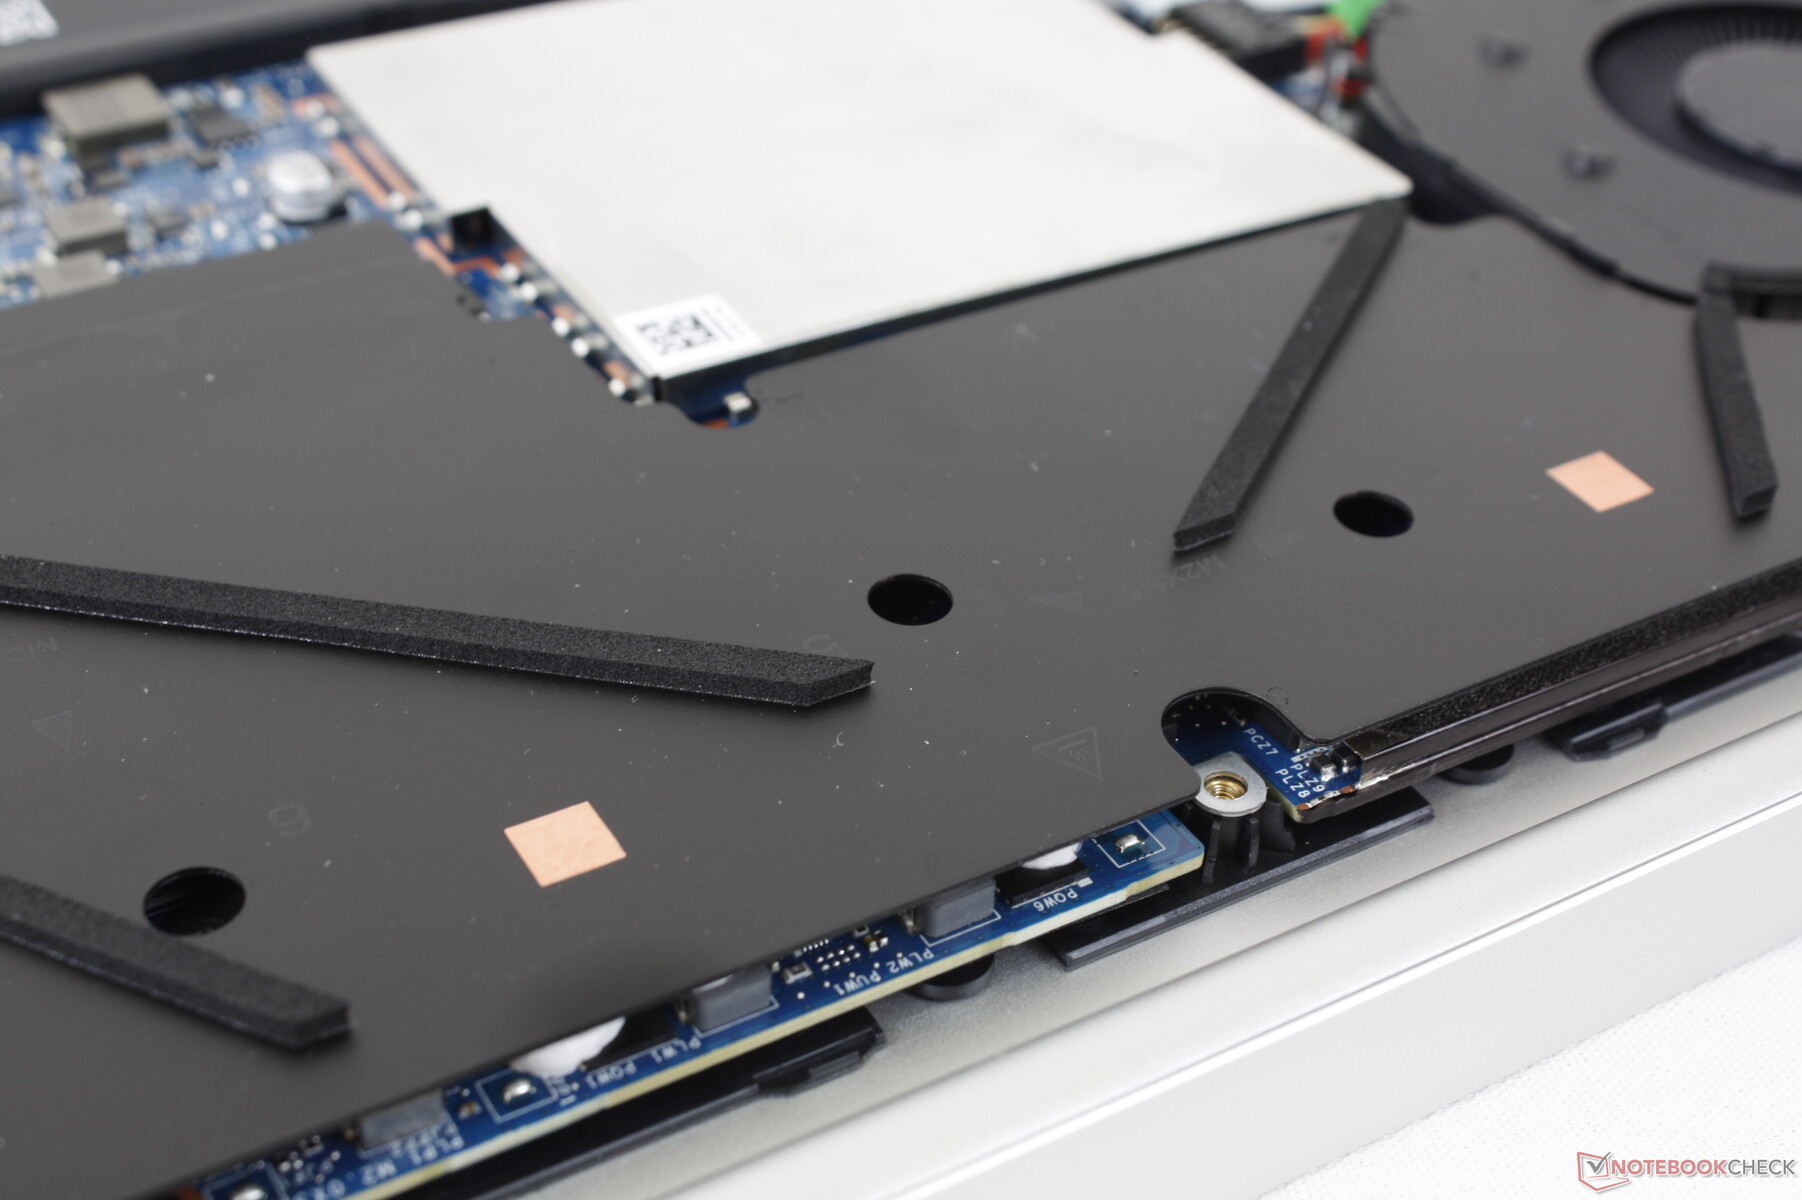
Lagringsenheter - Stöd för RAID 0
Vår testenhet levereras med sammaMicron 3400 PCIe4 x4 NVMe SSD som finns i många andra avancerade system, bland annat i MSI Stealth GS77 eller HP Spectre x360 13.5. Enheten uppvisar inga problem med strypning på vår testenhet, men skrivhastigheterna är inte alls lika snabba som på den konkurrerande Samsung PM9A1-serien.
HP inkluderar bara ett SSD-skydd trots att det finns två SSD-fack. Om du planerar att installera en andra enhet finns det en god chans att den kan köras vid varmare temperaturer.

| Drive Performance rating - Percent | |
| MSI Creator Z16P B12UHST | |
| HP Envy 16 h0112nr | |
| Huawei MateBook 16s i7 | |
| Lenovo ThinkBook 16 G4+ IAP | |
| Dell Inspiron 16 Plus 7610-MHJ8F -1! | |
* ... mindre är bättre
Disk Throttling: DiskSpd Read Loop, Queue Depth 8
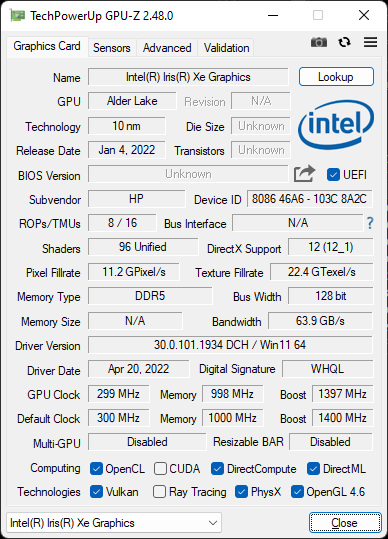
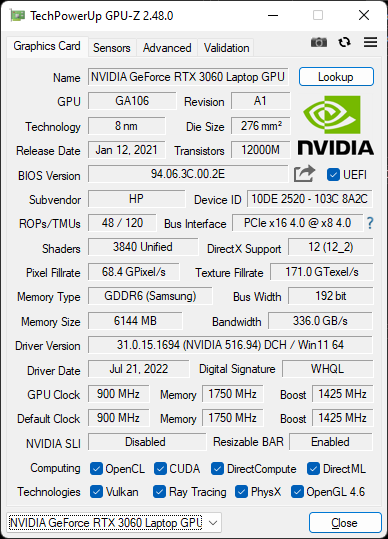
GPU-prestanda - 95 W TGP GeForce RTX 3060
Grafikprestandan är cirka 5 procent långsammare än den genomsnittliga bärbara datorn i vår databas som är utrustad med en samma GeForce RTX 3060. Underskottet är tillräckligt litet för att användarna troligen inte ska märka det.
Uppgradering från den sämre Arc A370M alternativet till GeForce RTX 3060 ger användarna mer än dubbelt så mycket rå grafikprestanda.
Om du kör i balanserat läge istället för prestandaläge minskar grafikprestandan med 6 procent för mycket tystare fläktar, vilket beskrivs i vårt avsnitt om systemljud.
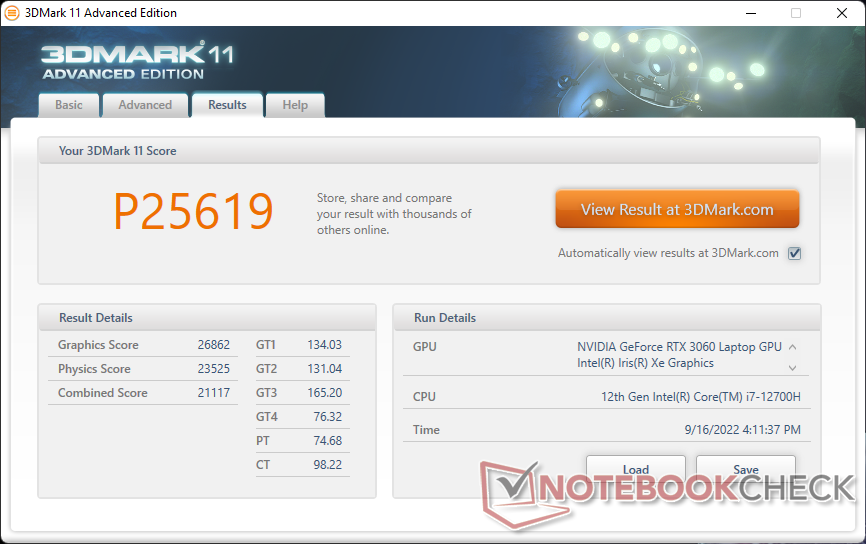
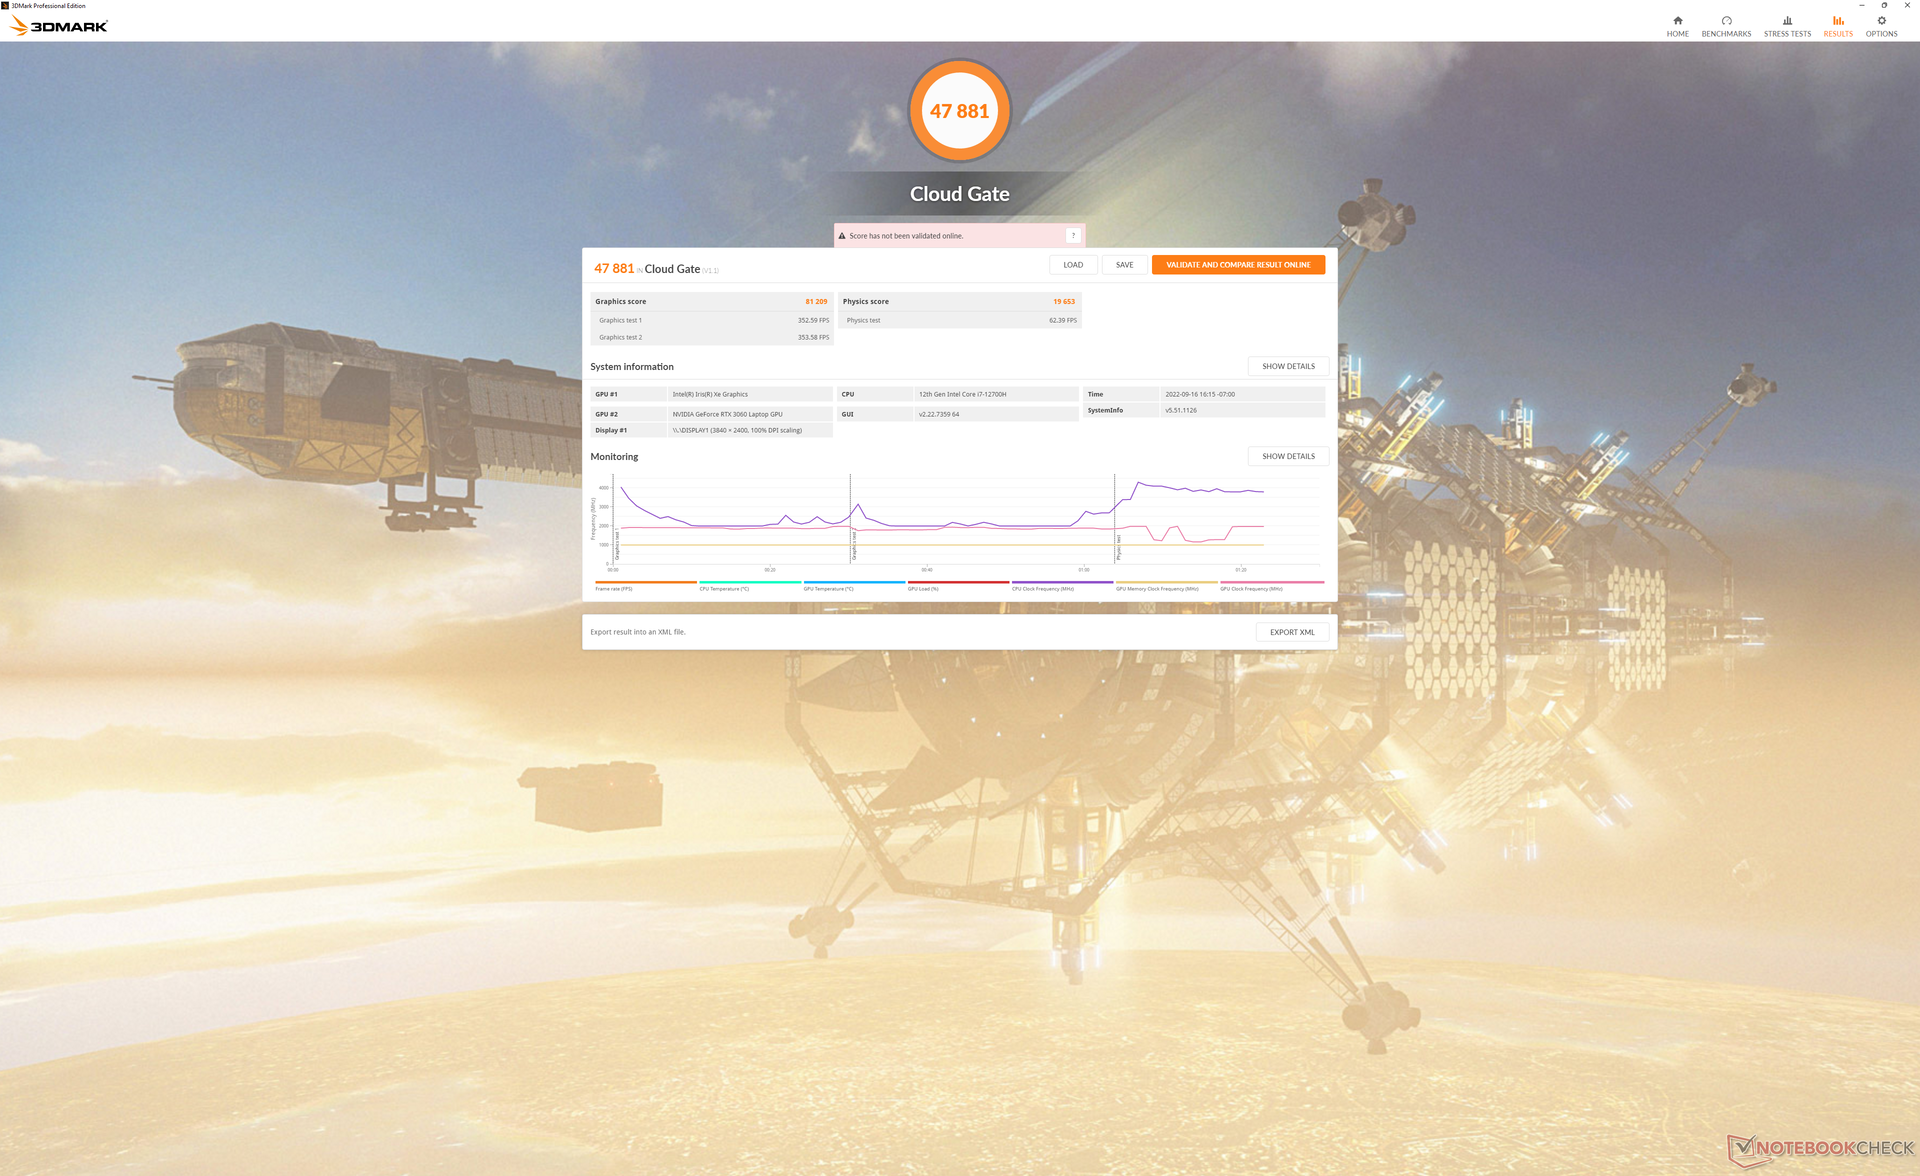

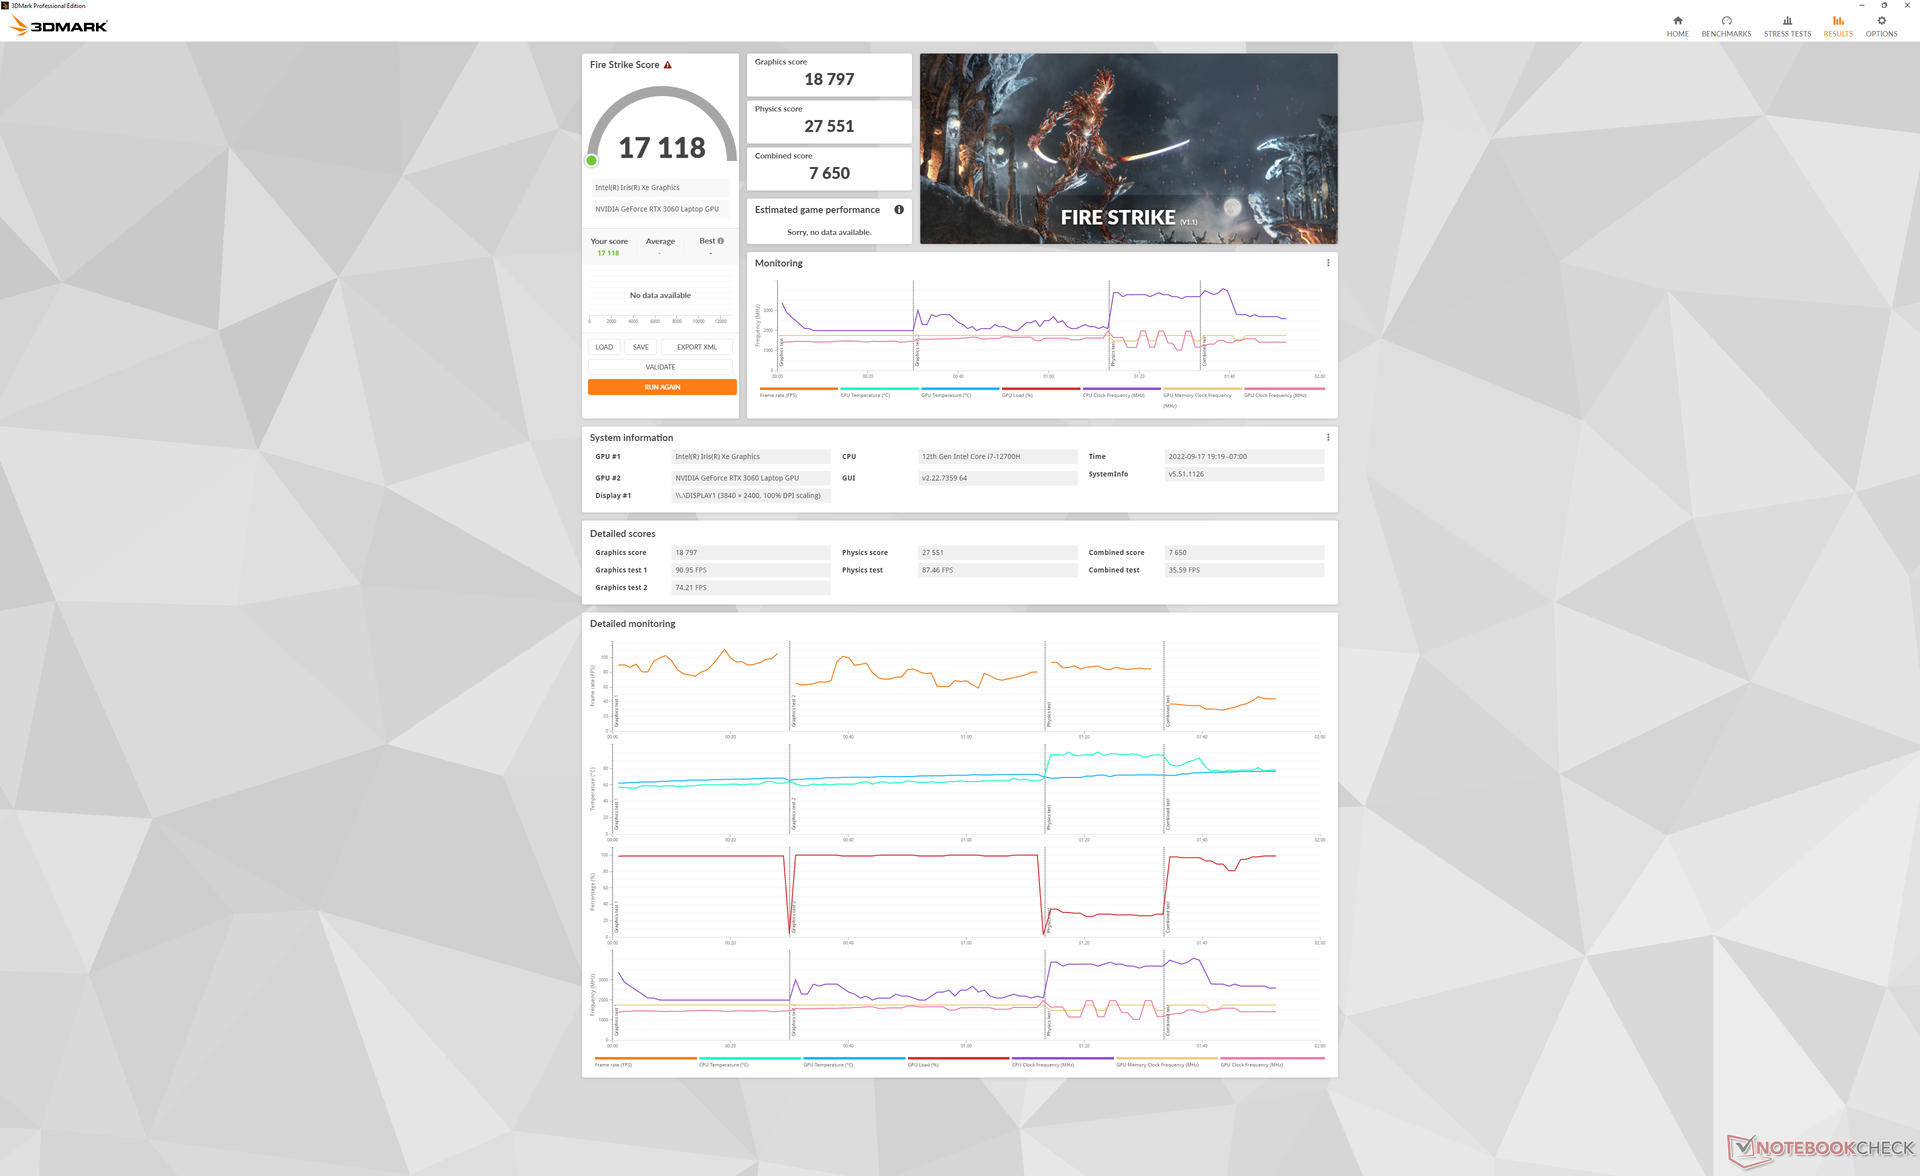

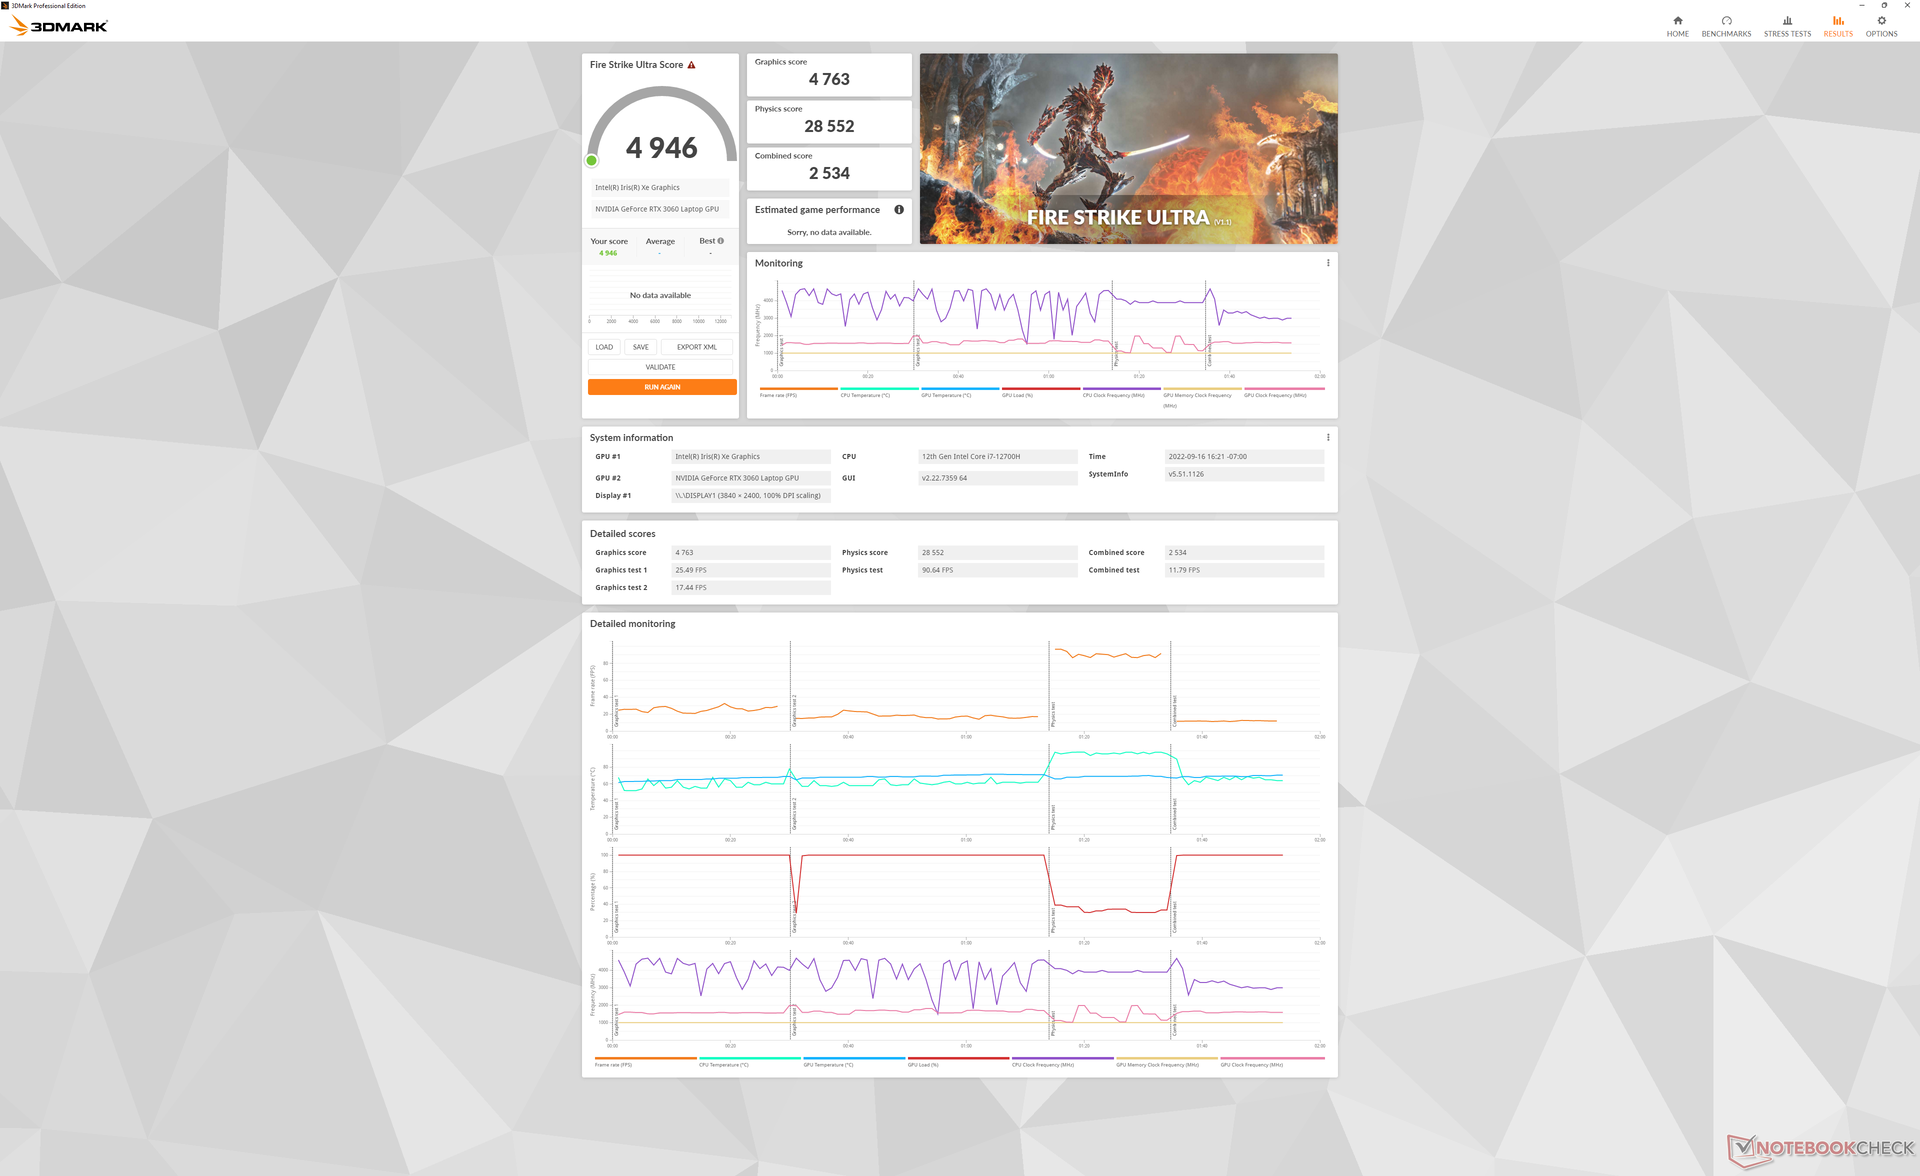
| 3DMark 11 Performance | 25619 poäng | |
| 3DMark Cloud Gate Standard Score | 47881 poäng | |
| 3DMark Fire Strike Score | 17118 poäng | |
| 3DMark Time Spy Score | 8190 poäng | |
Hjälp | ||
Witcher 3 FPS Chart
| låg | med. | hög | ultra | QHD | 4K | |
|---|---|---|---|---|---|---|
| GTA V (2015) | 185.6 | 181.2 | 174.1 | 103.3 | 76.7 | |
| The Witcher 3 (2015) | 402.3 | 264 | 161.2 | 82.8 | 55.1 | |
| Dota 2 Reborn (2015) | 180.6 | 164.8 | 149.1 | 139 | 46.9 | |
| Final Fantasy XV Benchmark (2018) | 177.2 | 111.7 | 83.9 | 62 | 34.6 | |
| X-Plane 11.11 (2018) | 140.3 | 127 | 103 | 60.5 | ||
| Strange Brigade (2018) | 418 | 202 | 162 | 140.4 | 103.5 | |
| Cyberpunk 2077 1.6 (2022) | 115.7 | 94.4 | 72.3 | 59.5 | 17.9 |
Utsläpp
Systemljud - lika högt som många bärbara datorer för spel
Fläktljudet tenderar att pulsera om det är inställt på Balanced power profile eller högre. Förvänta dig att fläktarna ligger mellan 30 och 34 dB(A) mot en tyst bakgrund på 22,8 dB(A) när du surfar på webben eller spelar upp video. Andra bärbara 16-tumsdatorer som t.ex.Huawei MateBook 16s eller MacBook Pro 16 kan alla vara tystare längre än Envy 16.
Fläktarna kan vara så högljudda som 41 dB(A) när man kör 3DMark 06 jämfört med endast 26 dB(A) och 34 dB(A) på de tidigare nämnda Apple respektive Huawei
Fläktljudet blir ännu högre med drygt 51 dB(A) när man kör Witcher 3 i prestandaläget. Detta skulle sjunka betydligt till 41,6 dB(A) om man körde i balanserat läge istället, men grafikprestandan skulle då bli cirka 5-10 procent långsammare som nämnts ovan. Sammantaget är detta en ganska högljudd bärbar dator om du vill utnyttja dess prestanda.
Ljudnivå
| Låg belastning |
| 22.9 / 22.9 / 30.5 dB(A) |
| Hög belastning |
| 41.4 / 51.4 dB(A) |
 | ||
30 dB tyst 40 dB(A) hörbar 50 dB(A) högt ljud |
||
min: | ||
| HP Envy 16 h0112nr GeForce RTX 3060 Laptop GPU, i7-12700H, Micron 3400 1TB MTFDKBA1T0TFH | Lenovo ThinkBook 16 G4+ IAP GeForce RTX 2050 Mobile, i7-12700H, Micron 2450 1TB MTFDKCD1T0TFK | MSI Creator Z16P B12UHST GeForce RTX 3080 Ti Laptop GPU, i9-12900H, Samsung PM9A1 MZVL22T0HBLB | Dell Inspiron 16 Plus 7610-MHJ8F UHD Graphics Xe 32EUs (Tiger Lake-H), i7-11800H, OM3PDP3-AD NVMe KDI 512GB | Apple MacBook Pro 16 2021 M1 Pro M1 Pro 16-Core GPU, M1 Pro, Apple SSD AP1024R | Huawei MateBook 16s i7 Iris Xe G7 96EUs, i7-12700H, Silicon Motion PCIe-8 SSD | |
|---|---|---|---|---|---|---|
| Noise | 1% | -5% | -1% | 10% | 9% | |
| av / miljö * (dB) | 22.8 | 24.2 -6% | 26 -14% | 26.3 -15% | 24.7 -8% | 24 -5% |
| Idle Minimum * (dB) | 22.9 | 24.2 -6% | 27 -18% | 26.3 -15% | 24.7 -8% | 24 -5% |
| Idle Average * (dB) | 22.9 | 24.2 -6% | 29 -27% | 26.3 -15% | 24.7 -8% | 25.2 -10% |
| Idle Maximum * (dB) | 30.5 | 24.2 21% | 31 -2% | 24.7 19% | 27.2 11% | |
| Load Average * (dB) | 41.4 | 47 -14% | 43 -4% | 33 20% | 26.1 37% | 34.8 16% |
| Witcher 3 ultra * (dB) | 51.1 | 47 8% | 43 16% | 44 14% | 34.8 32% | |
| Load Maximum * (dB) | 51.4 | 47 9% | 46 11% | 49.2 4% | 37.4 27% | 39 24% |
* ... mindre är bättre
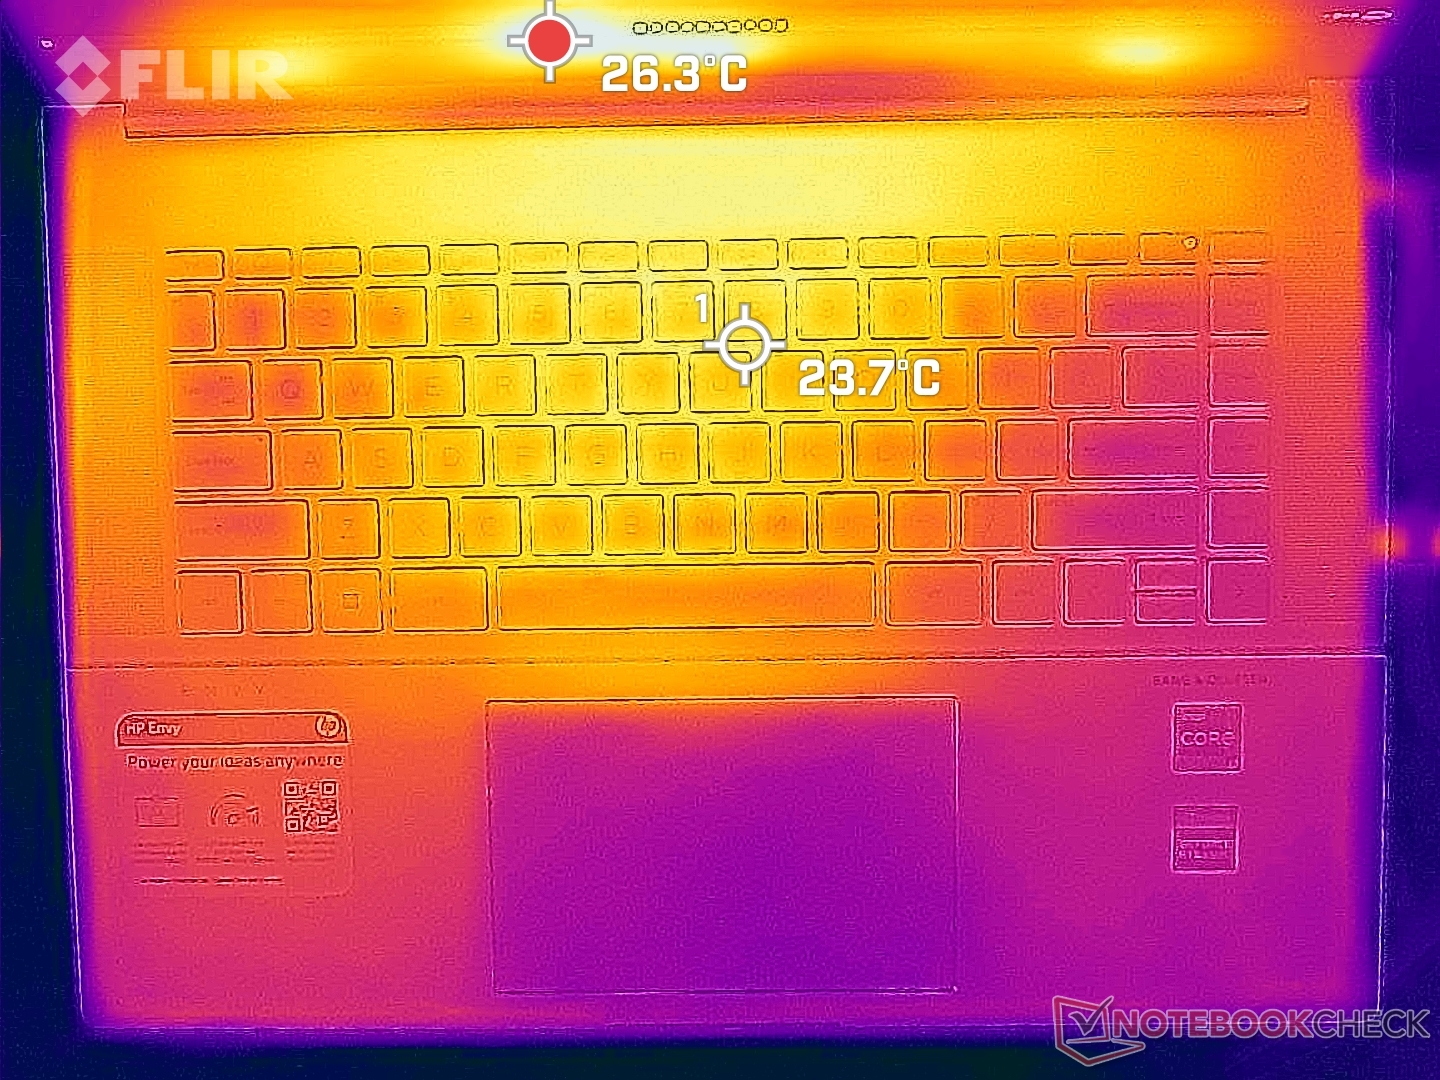
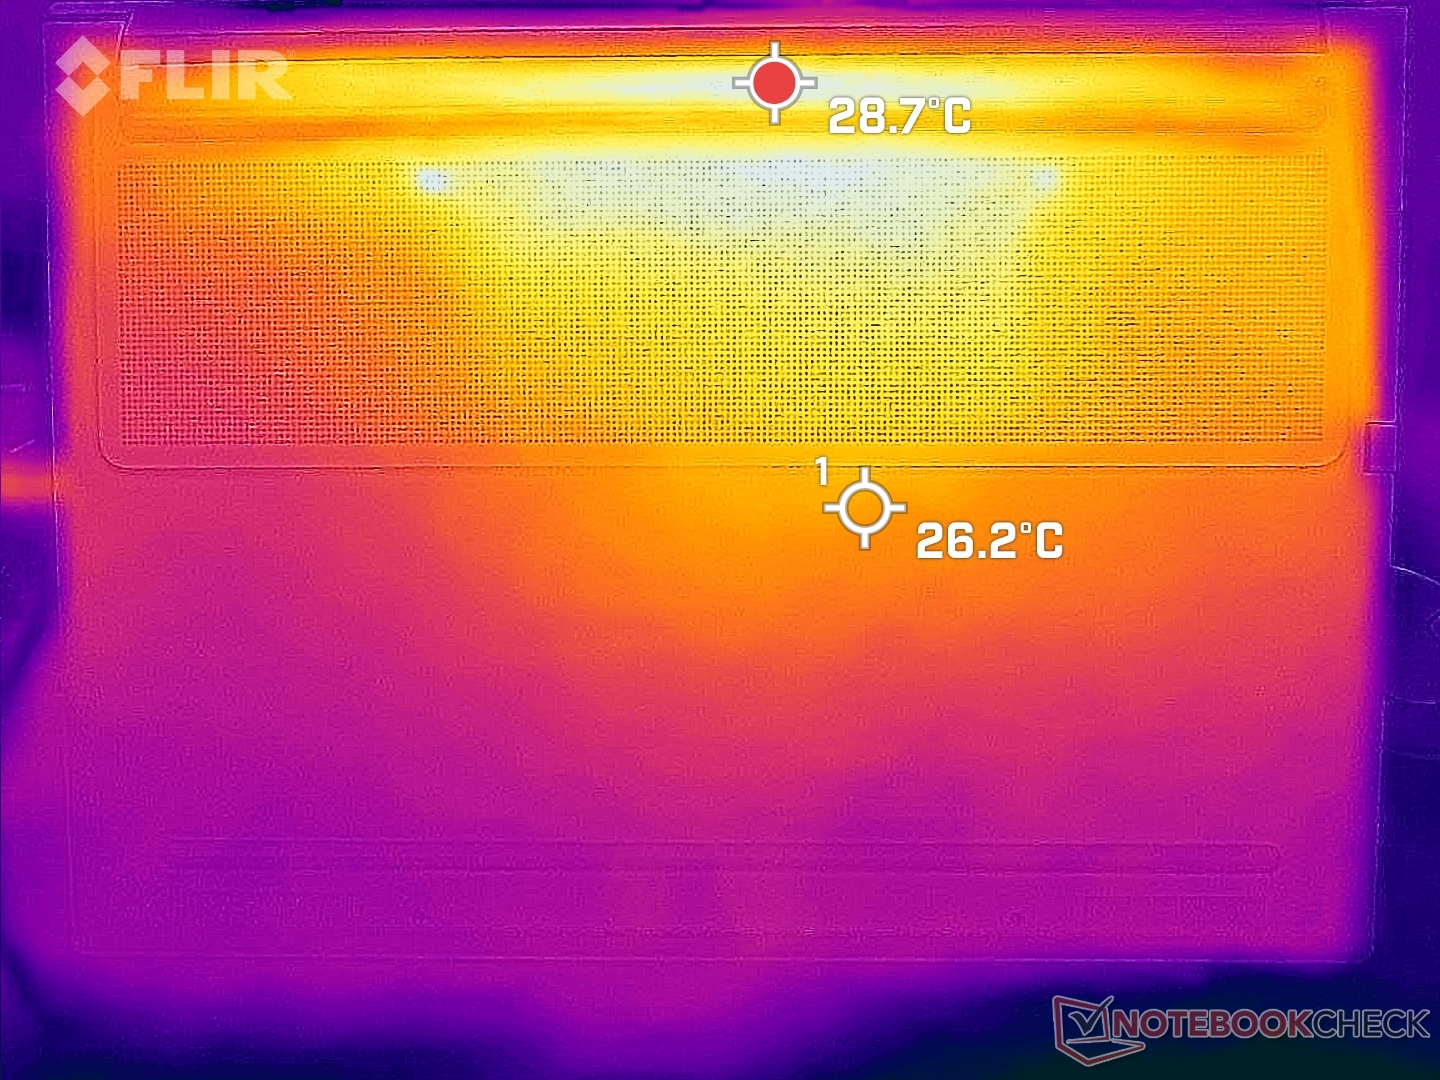
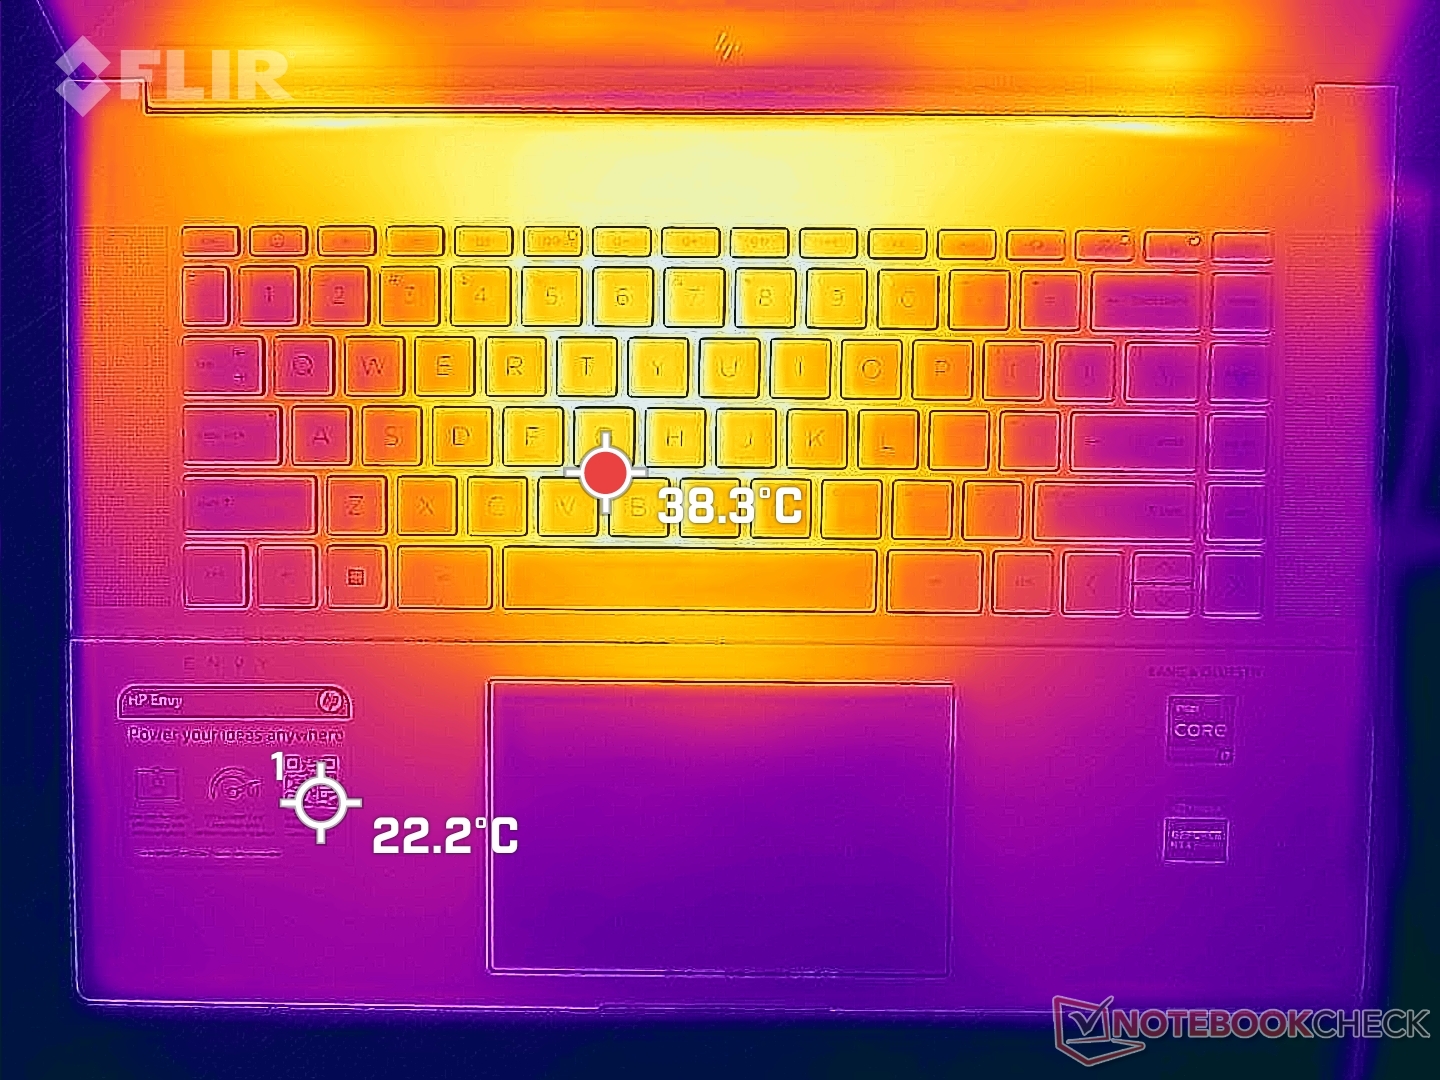
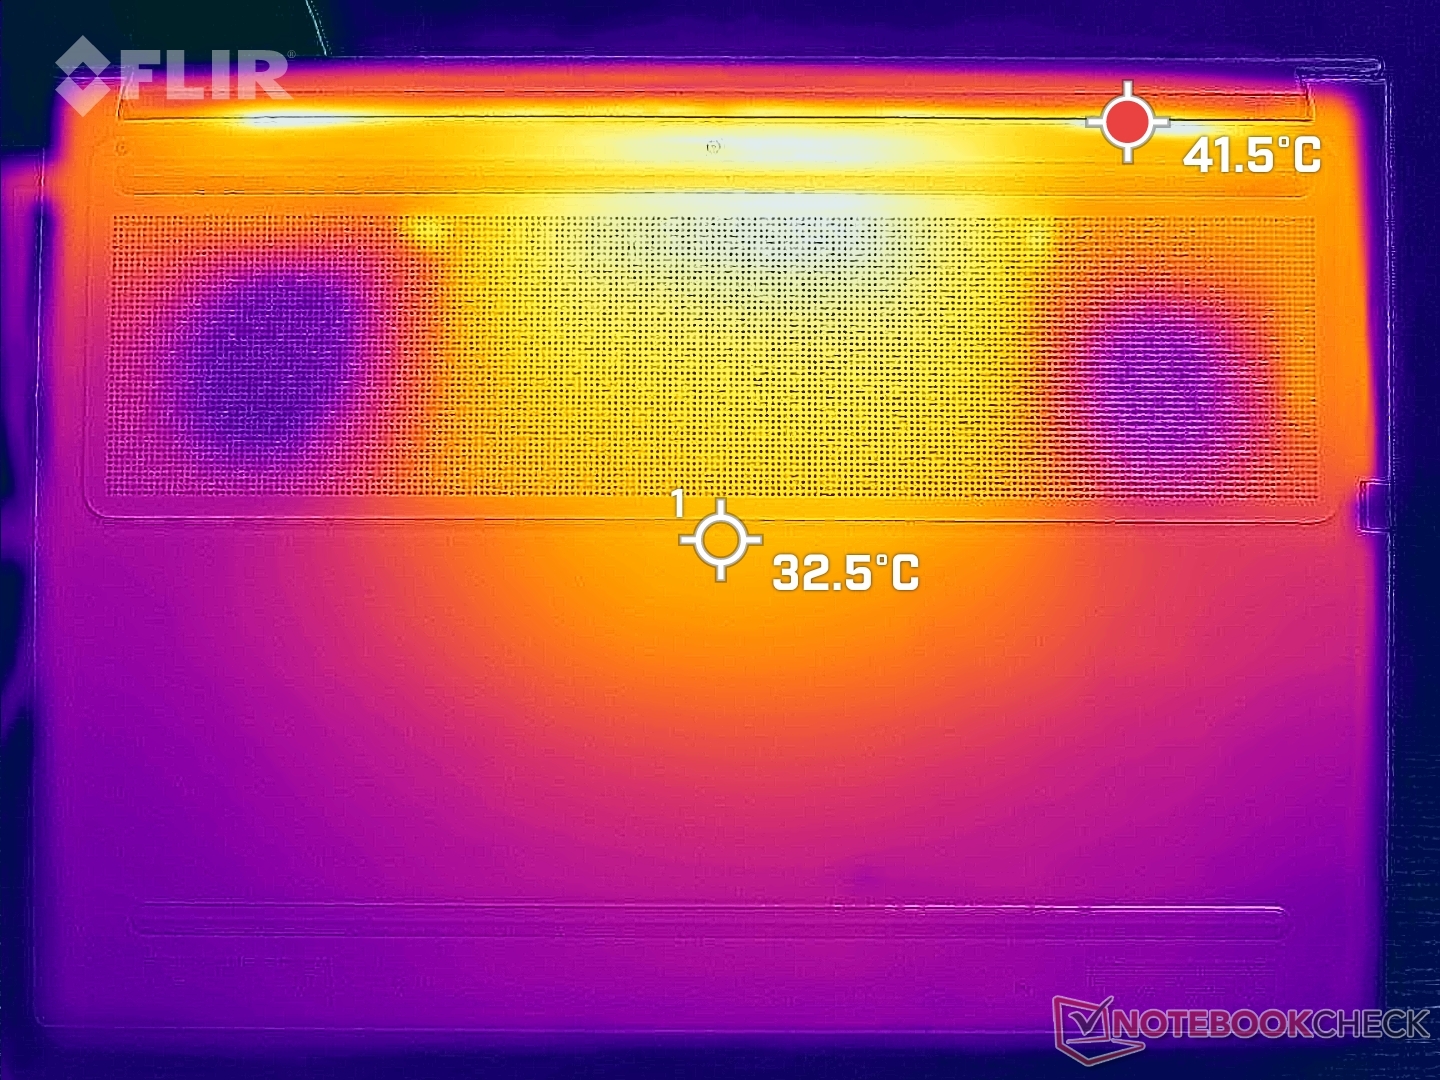
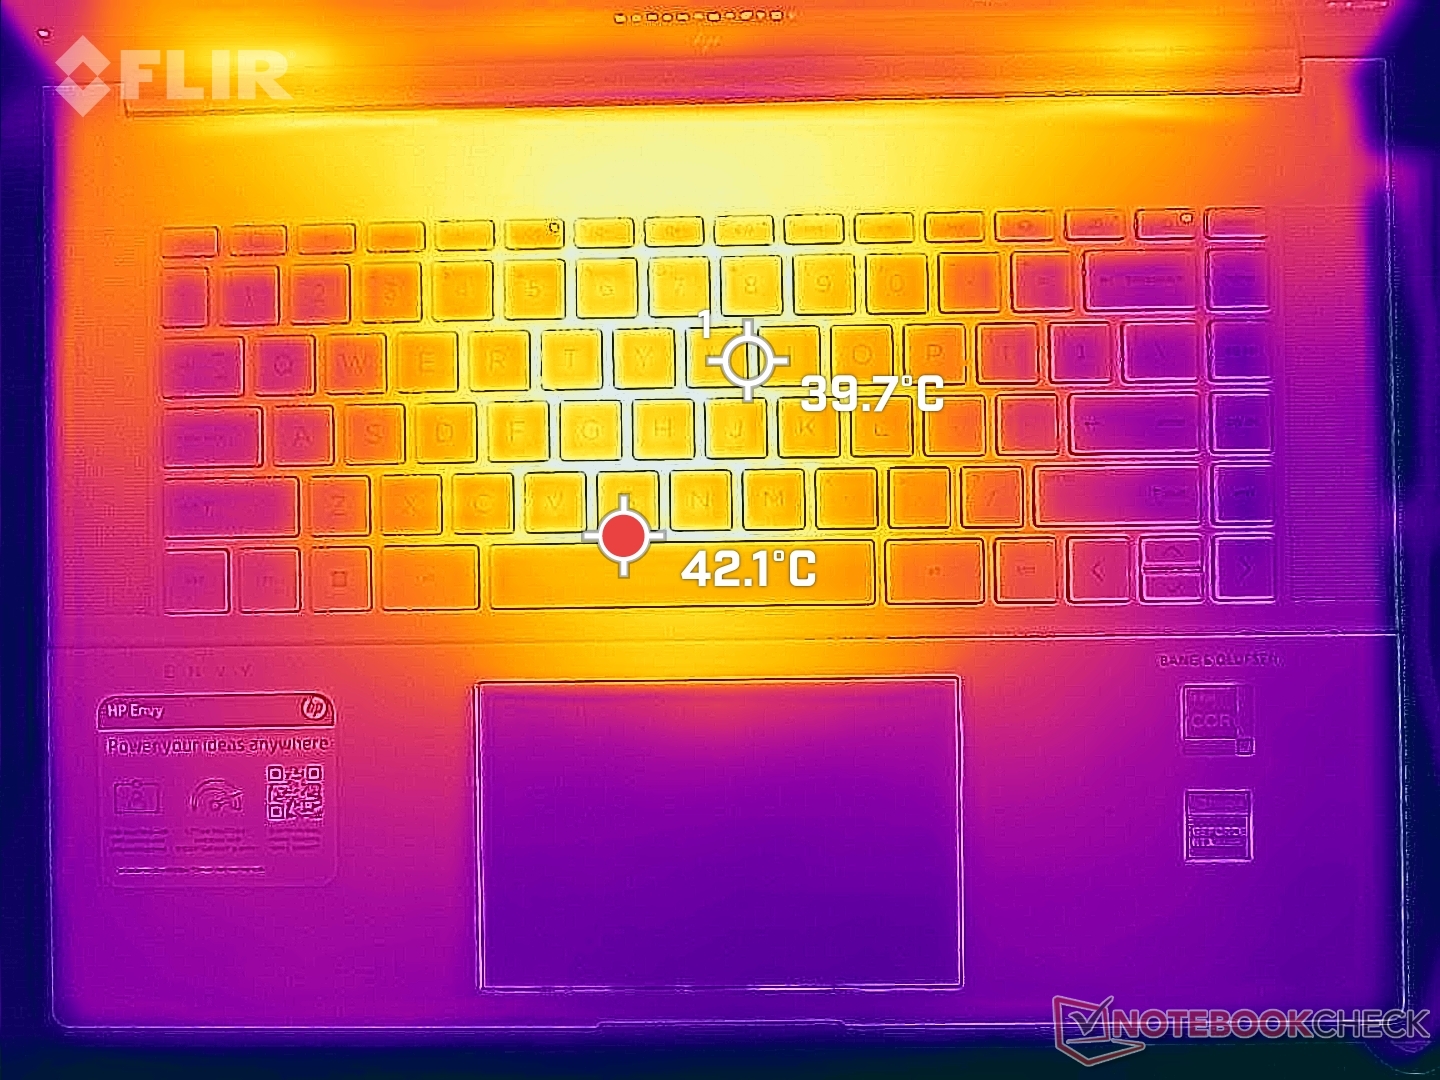
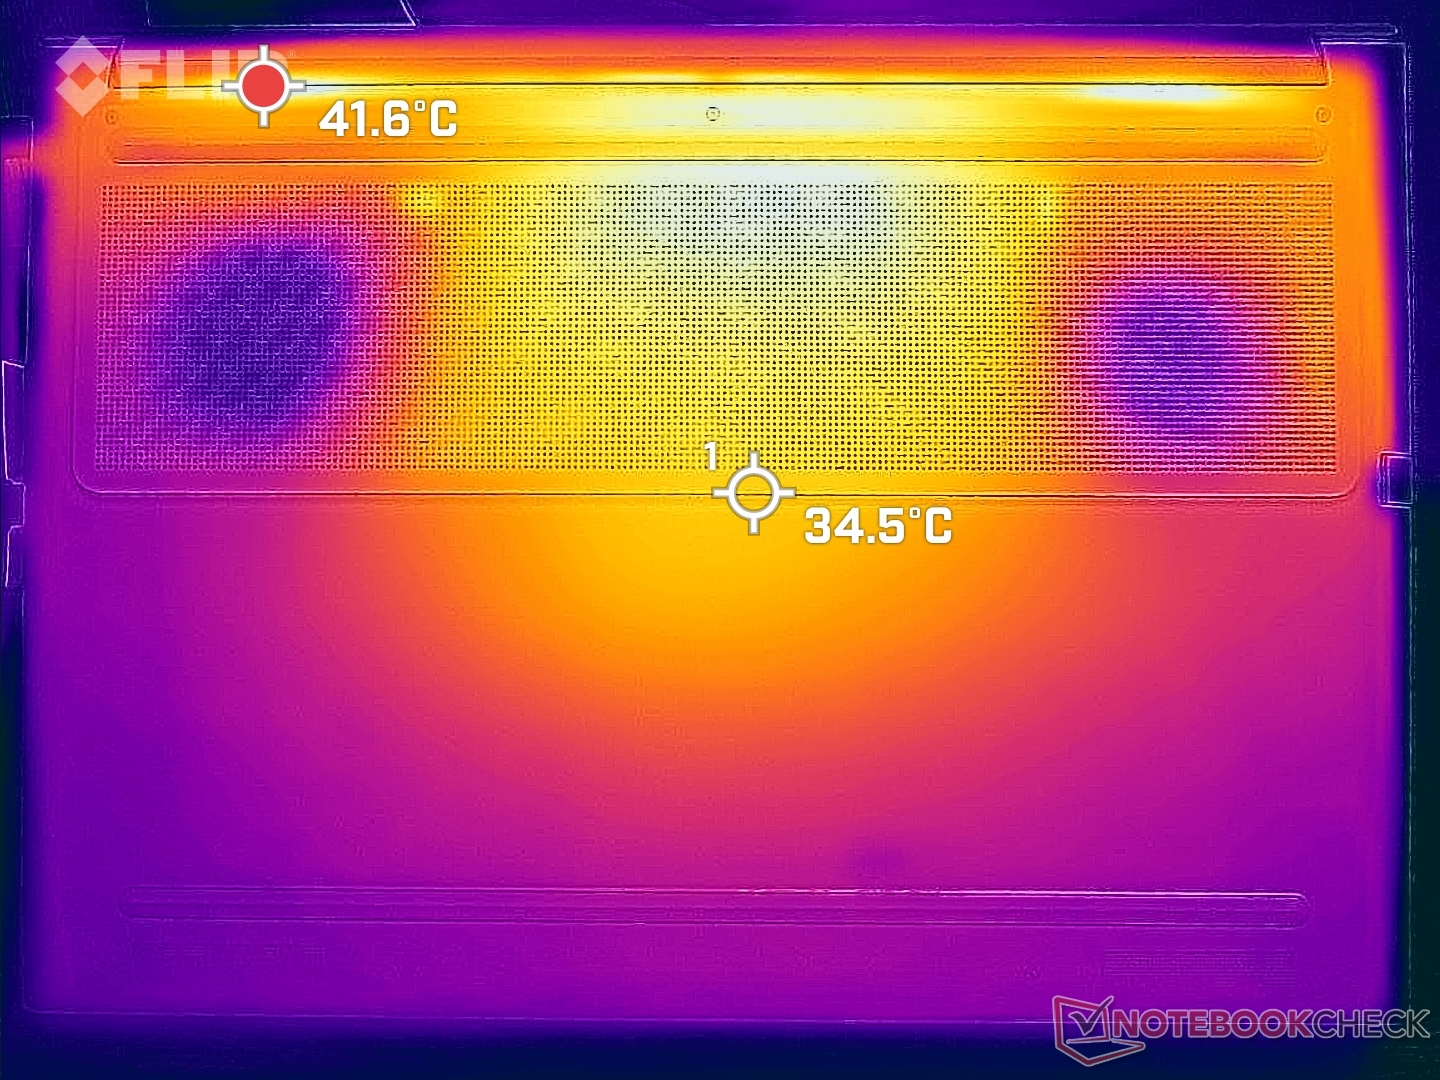
Temperatur
Yttemperaturen är ganska varm även när den går på tomgång på skrivbordet utan några pågående program. Under dessa förhållanden kan värmepunkterna nå 33 C på både ovansidan och undersidan jämfört med endast 26 C på ThinkBook 16 G4. Vid hög belastning kan samma områden nå över 45 C. Handflatorna förblir relativt svala, men undersidan kan vara obekväm mot huden.
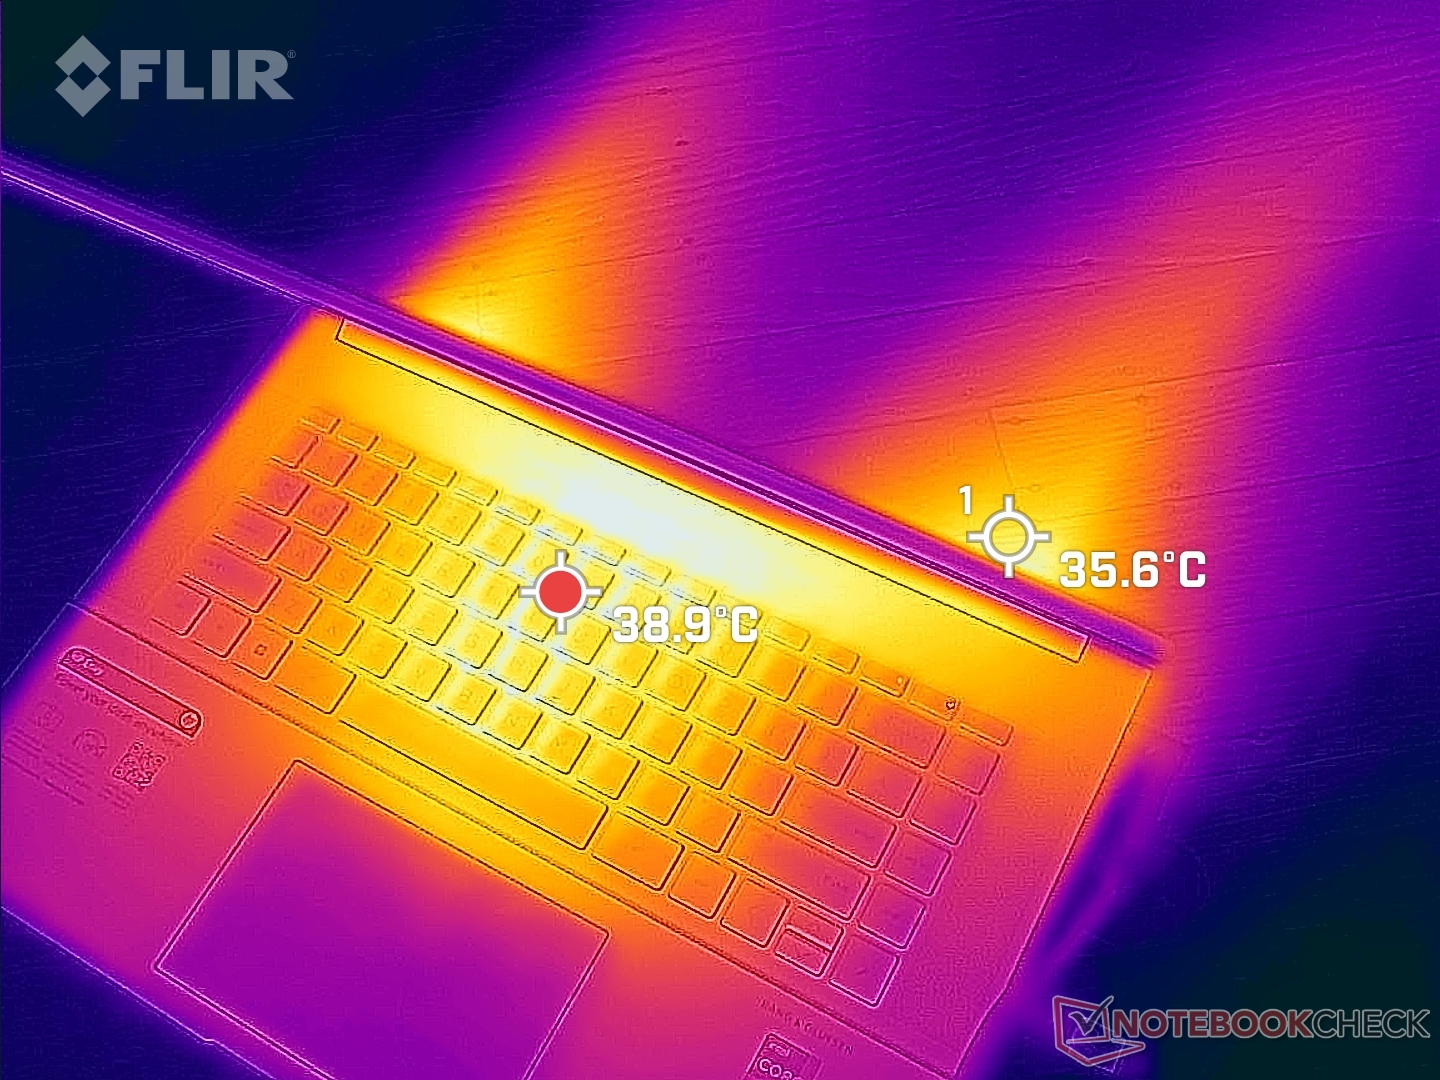
(-) Den maximala temperaturen på ovansidan är 45.2 °C / 113 F, jämfört med genomsnittet av 36.8 °C / 98 F , allt från 21 till 71 °C för klassen Multimedia.
(±) Botten värms upp till maximalt 44 °C / 111 F, jämfört med genomsnittet av 39.1 °C / 102 F
(+) Vid tomgångsbruk är medeltemperaturen för ovansidan 31 °C / 88 F, jämfört med enhetsgenomsnittet på 31.3 °C / ### class_avg_f### F.
(±) När du spelar The Witcher 3 är medeltemperaturen för ovansidan 33.6 °C / 92 F, jämfört med enhetsgenomsnittet på 31.3 °C / ## #class_avg_f### F.
(+) Handledsstöden och pekplattan är kallare än hudtemperaturen med maximalt 29.8 °C / 85.6 F och är därför svala att ta på.
(±) Medeltemperaturen för handledsstödsområdet på liknande enheter var 28.7 °C / 83.7 F (-1.1 °C / -1.9 F).
| HP Envy 16 h0112nr Intel Core i7-12700H, NVIDIA GeForce RTX 3060 Laptop GPU | Lenovo ThinkBook 16 G4+ IAP Intel Core i7-12700H, NVIDIA GeForce RTX 2050 Mobile | MSI Creator Z16P B12UHST Intel Core i9-12900H, NVIDIA GeForce RTX 3080 Ti Laptop GPU | Dell Inspiron 16 Plus 7610-MHJ8F Intel Core i7-11800H, Intel UHD Graphics Xe 32EUs (Tiger Lake-H) | Apple MacBook Pro 16 2021 M1 Pro Apple M1 Pro, Apple M1 Pro 16-Core GPU | Huawei MateBook 16s i7 Intel Core i7-12700H, Intel Iris Xe Graphics G7 96EUs | |
|---|---|---|---|---|---|---|
| Heat | 8% | -20% | 4% | 19% | 5% | |
| Maximum Upper Side * (°C) | 45.2 | 42.9 5% | 67 -48% | 43.4 4% | 41 9% | 40.9 10% |
| Maximum Bottom * (°C) | 44 | 50.6 -15% | 69 -57% | 45.1 -3% | 39 11% | 48.3 -10% |
| Idle Upper Side * (°C) | 33.6 | 26 23% | 29 14% | 30.6 9% | 24 29% | 29.2 13% |
| Idle Bottom * (°C) | 32.6 | 26.5 19% | 29 11% | 31.1 5% | 24 26% | 30.4 7% |
* ... mindre är bättre
Stresstest - Begränsad Turbo Boost
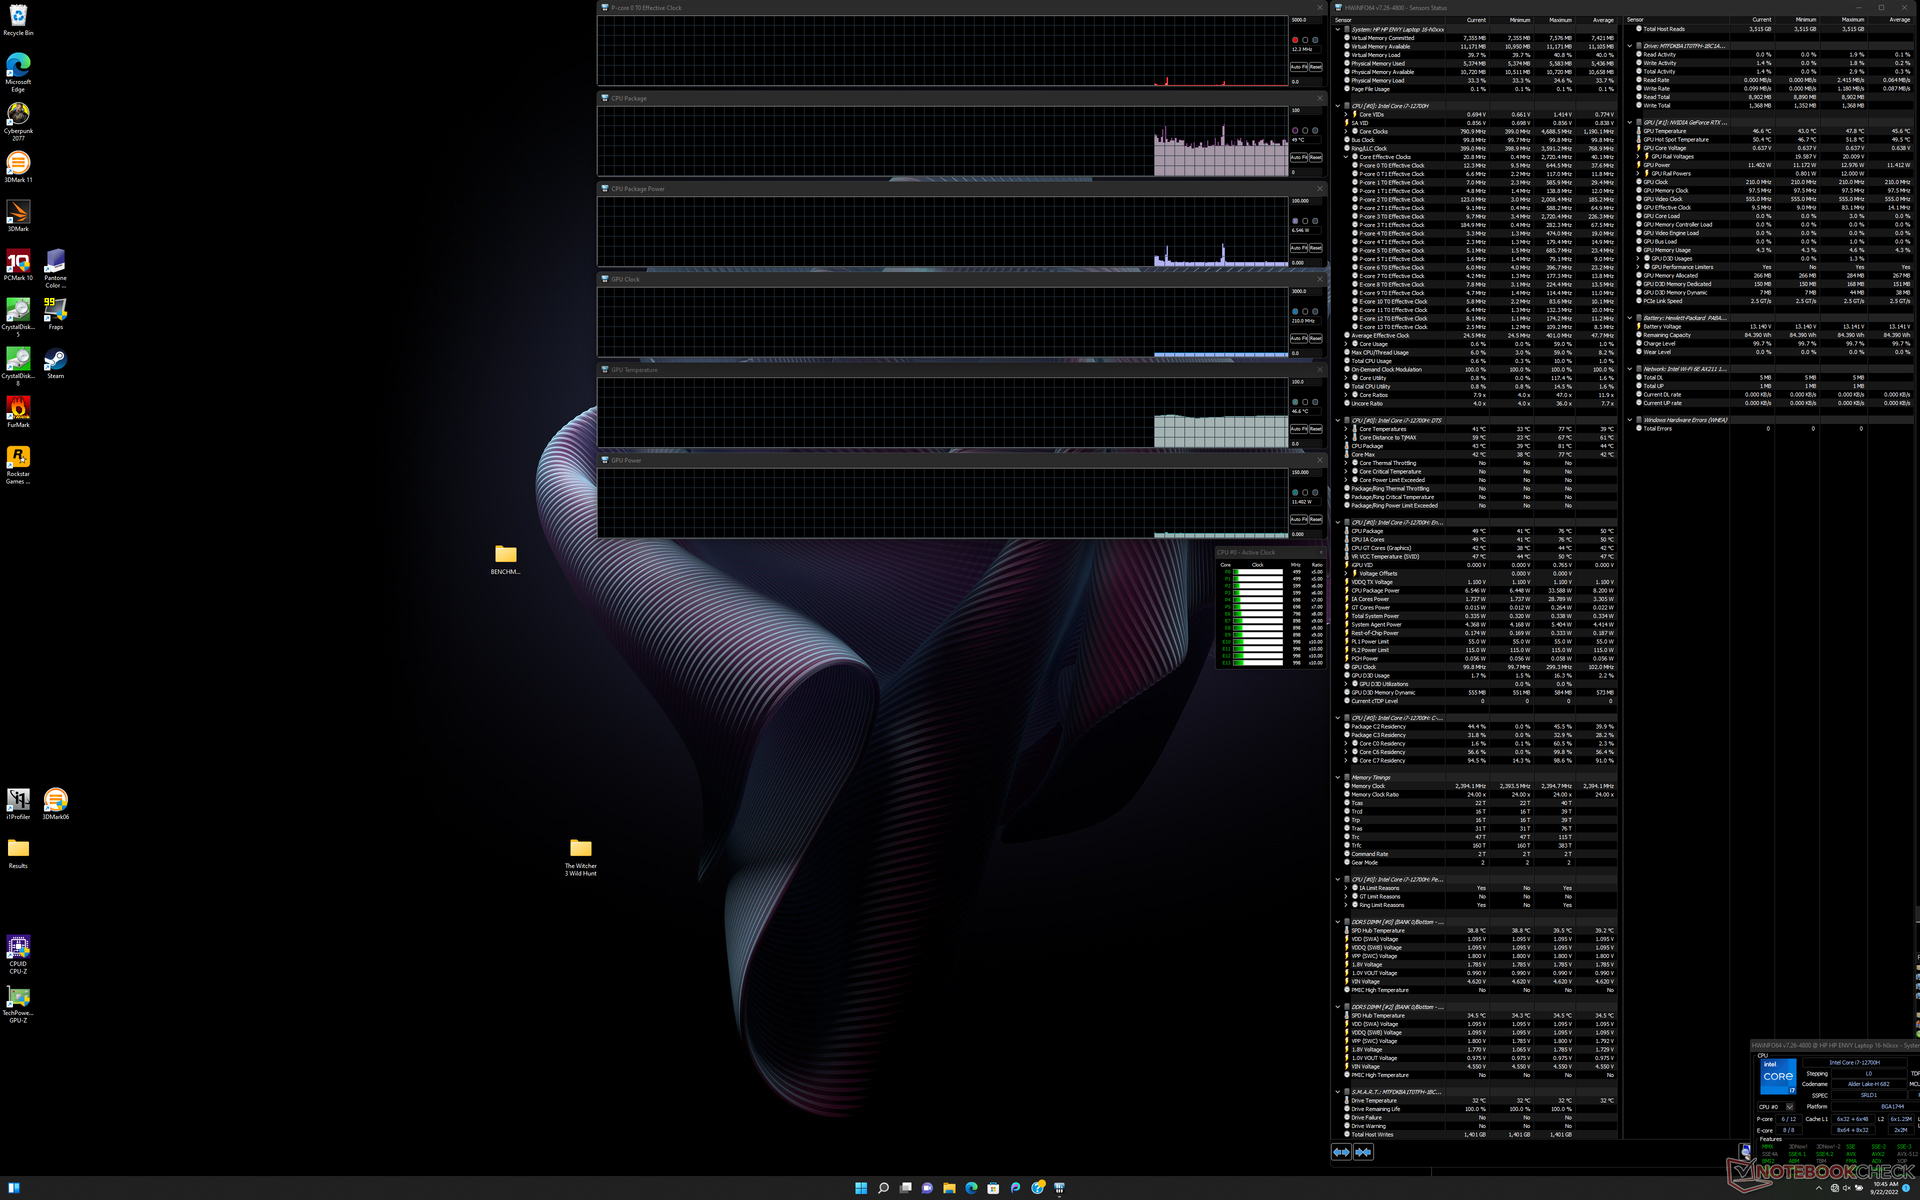
Om Prime95 körs får CPU-klockfrekvensen, temperaturen och strömförbrukningen på kortet att stiga till 3,7 GHz, 80 C respektive 115 W, vilket varar i cirka 15 sekunder. Därefter sjunker CPU:n och stabiliseras på 2,1 till 2,2 GHz, 66 C respektive 55 W. Som jämförelse kan nämnas att samma test på MSI GS77 med samma Core i7-12700H CPU skulle resultera i både högre stabila klockfrekvenser och kärntemperaturer på 2,7-3,0 GHz respektive 96 C. HP kanske väljer den säkrare vägen med sin Envy 16 genom att köra med lägre Turbo Boost-klockfrekvens för att hålla temperaturen lägre.
GPU-klockfrekvenser, temperatur och strömförbrukning på kortet skulle stabiliseras vid 1717 MHz, 74 C respektive 94 W när man kör Witcher 3 i prestandaläget. Detta sjunker till 1542 MHz, 72 C och 80 W om spelet körs i balanserat läge istället. Användarna måste uthärda systemets maximala fläktljud om de vill utnyttja GPU:n till fullo.
Att köra på batteri begränsar prestandan. Ett Fire Strike -test på batterier skulle ge fysik- och grafikpoäng på 17295 respektive 10572 poäng, jämfört med 28353 respektive 19890 poäng på nätströmmen.
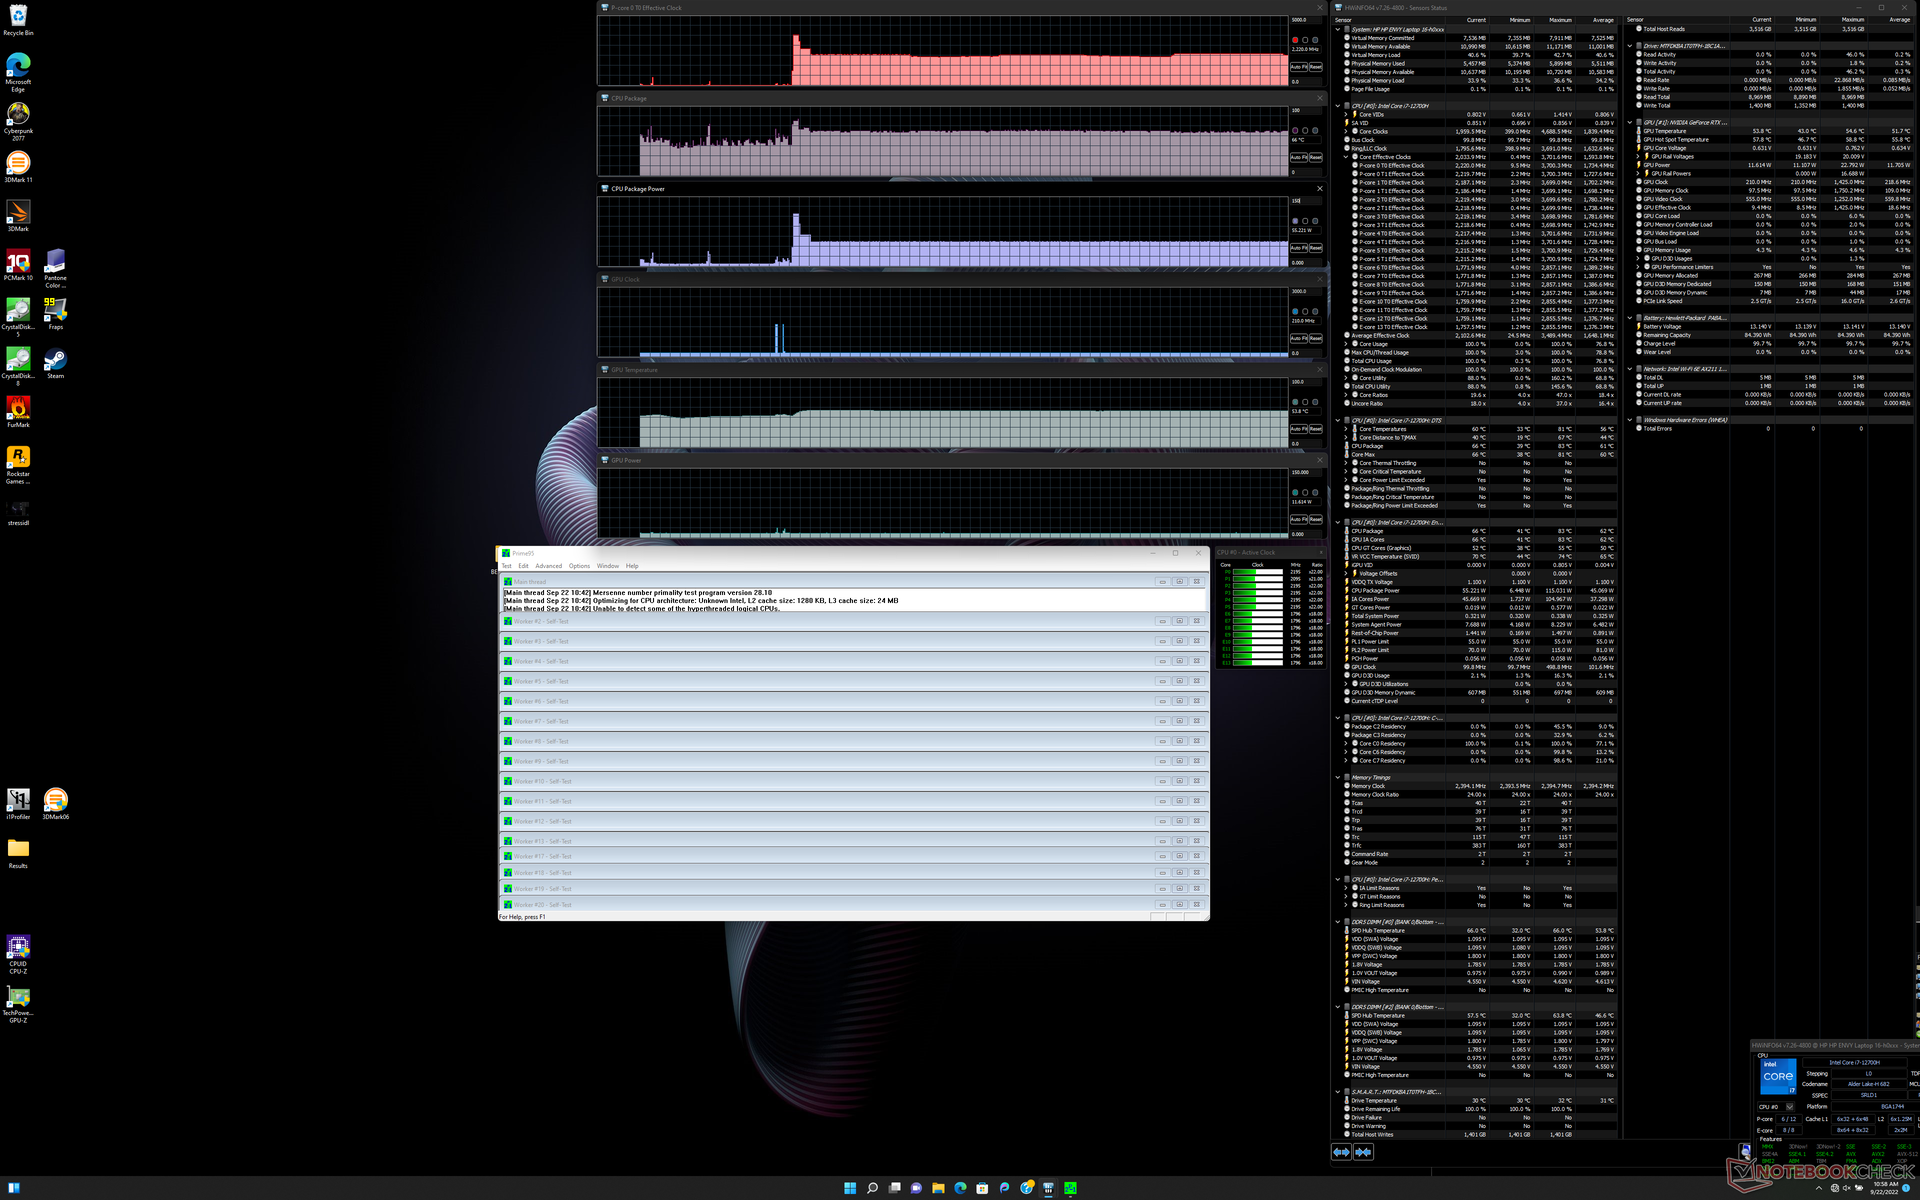
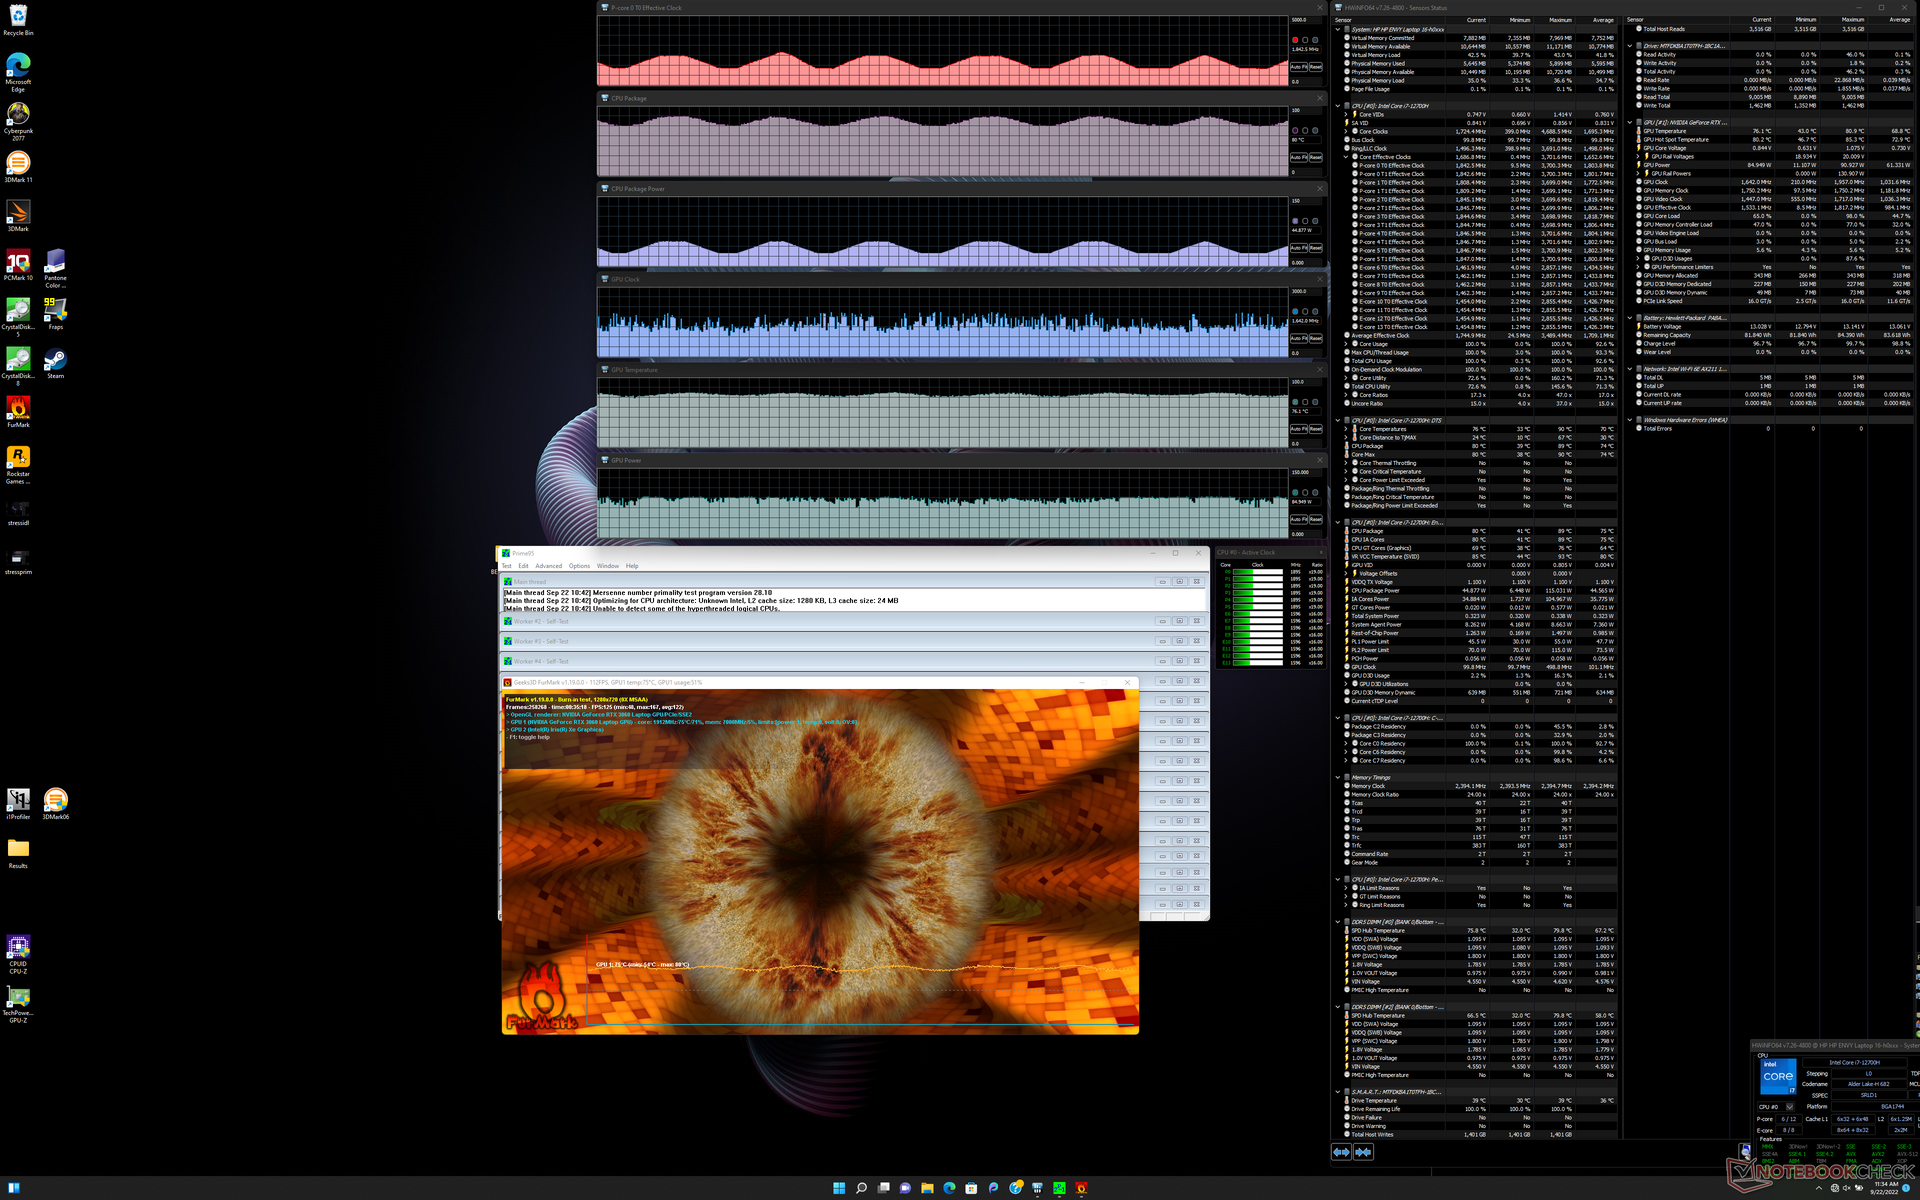
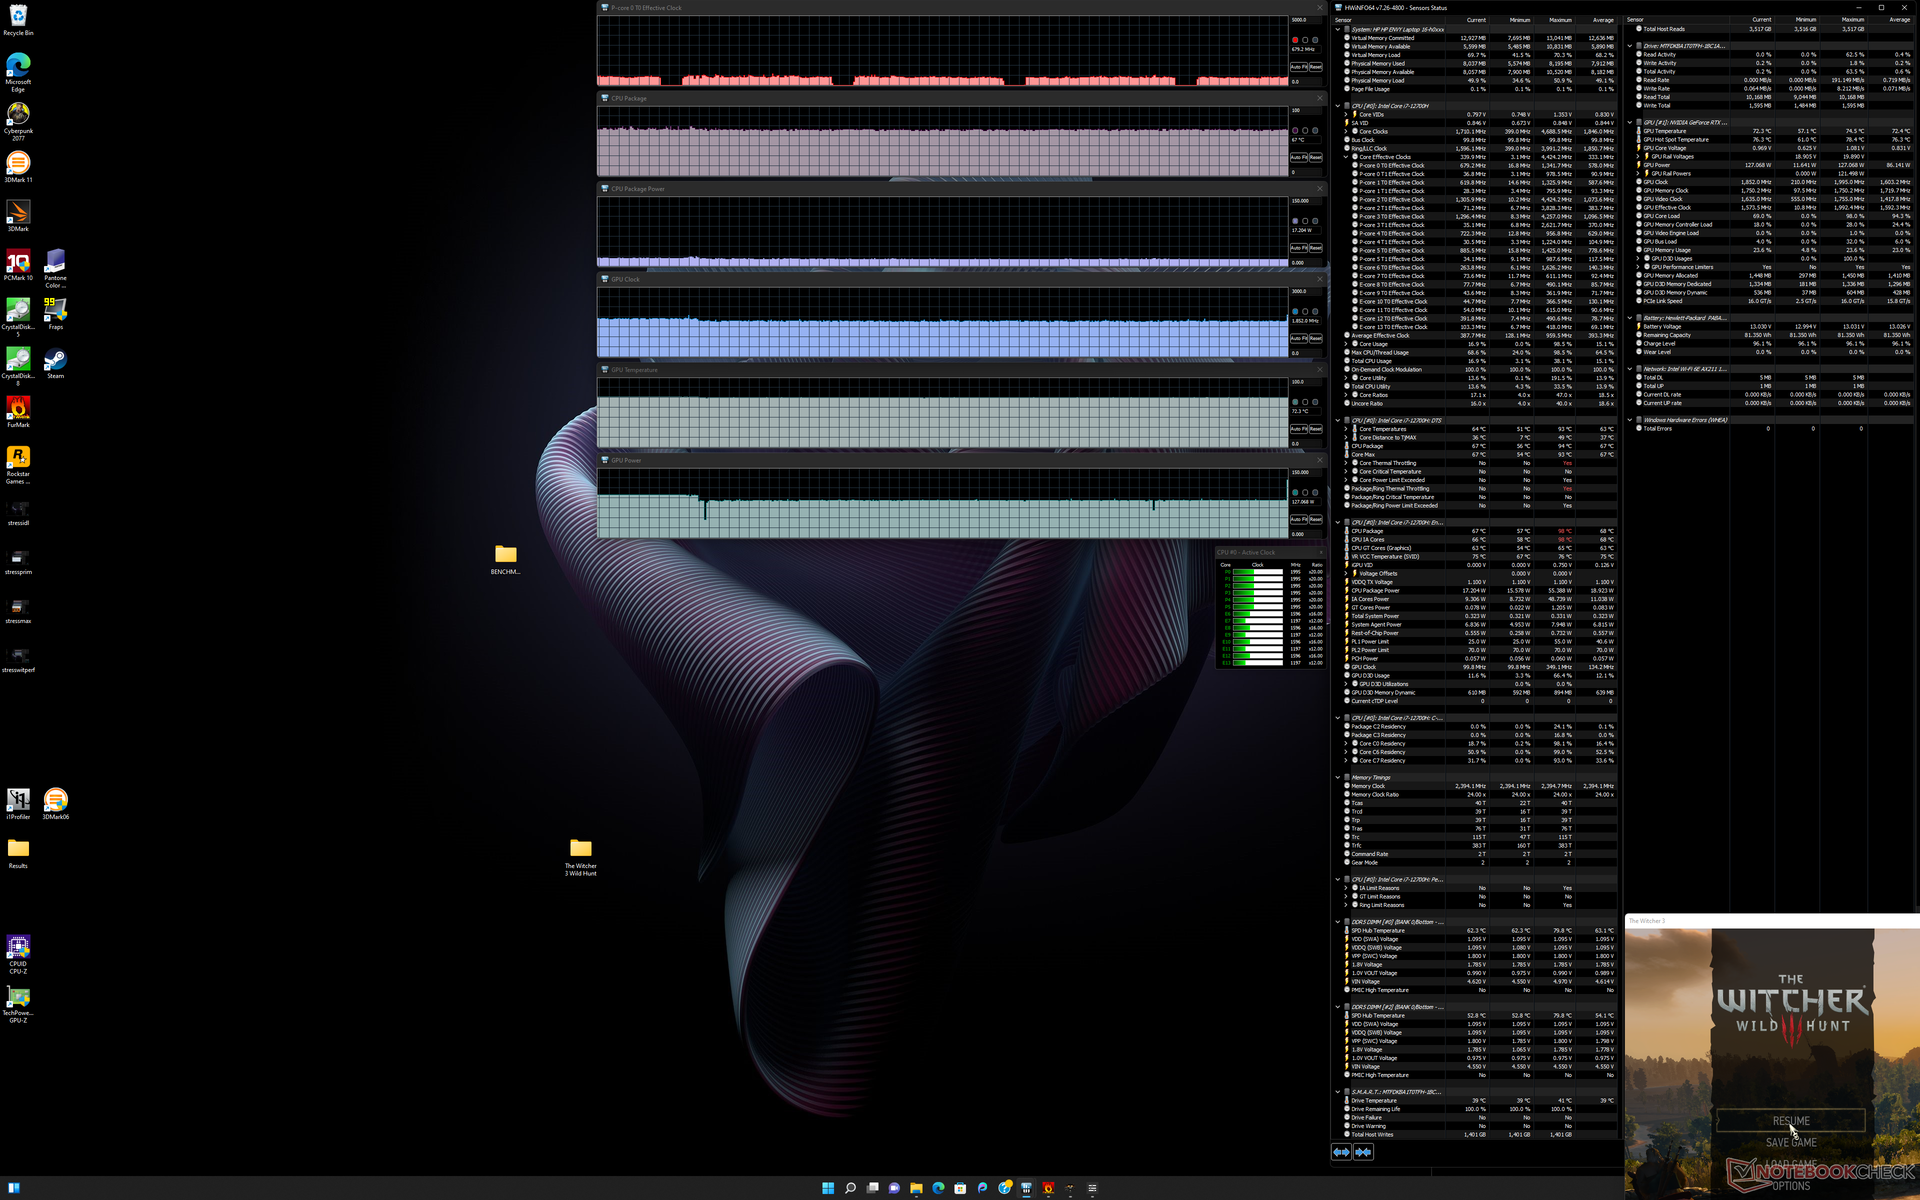
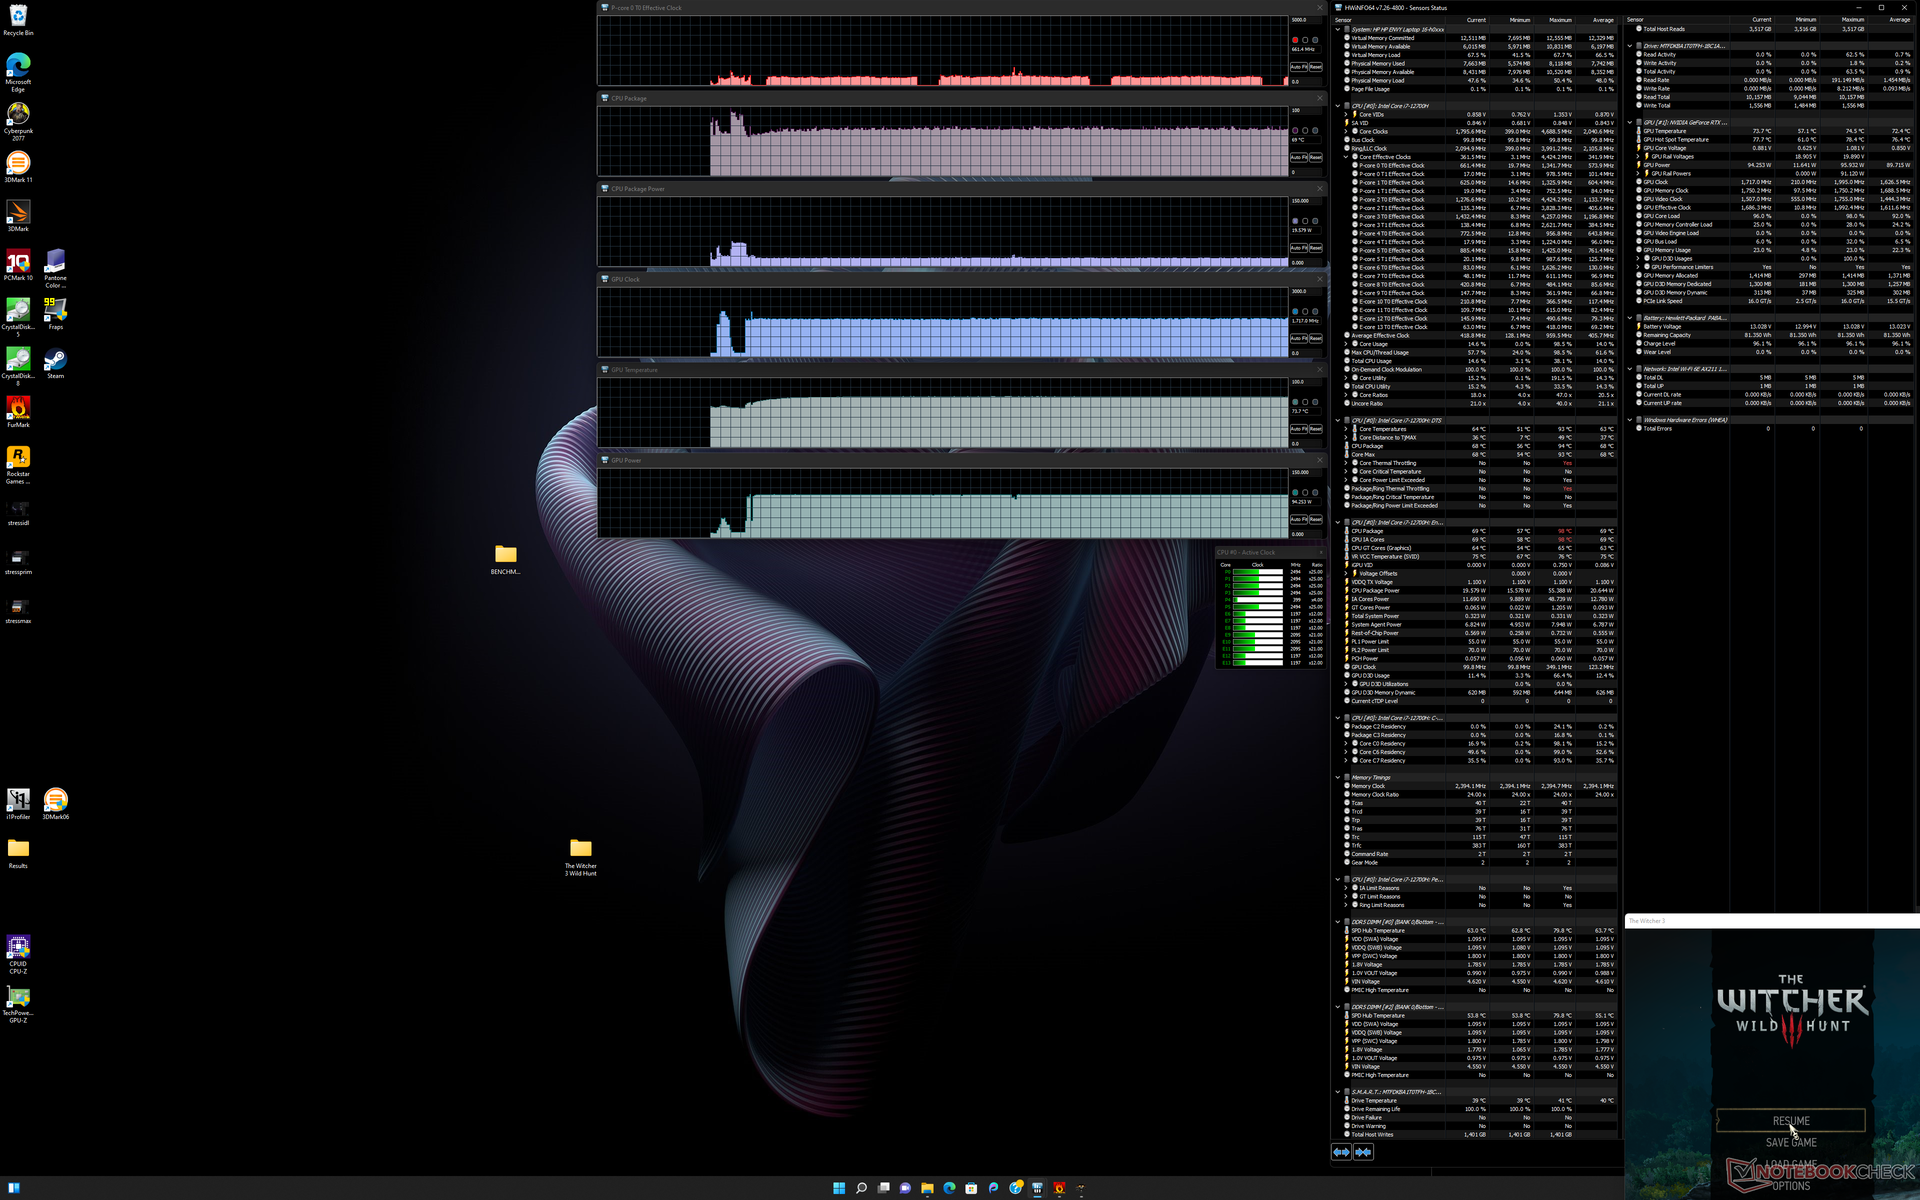
| CPU-klocka (GHz) | GPU-klocka (MHz) | Genomsnittlig CPU-temperatur (°C) | Genomsnittlig GPU-temperatur (°C) | |
| System Idle | -- | -- | 49 | 47 |
| Prime95 Stress | 2.1 - 2.2 | -- | 66 | 54 |
| Prime95 + FurMark Stress | 1.2 - 2.2 | ~1642 | 74 - 87 | 76 |
| Witcher 3 Stress (balanserat läge) | 0,67 | 1542 | 67 | 72 |
| Witcher 3 Stress (prestationsläge) | 0,67 | 1717 | 69 | 74 |
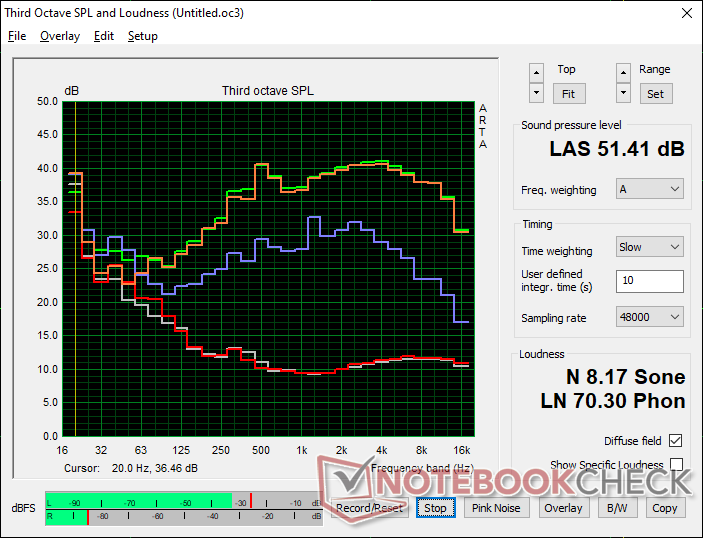
Högtalare
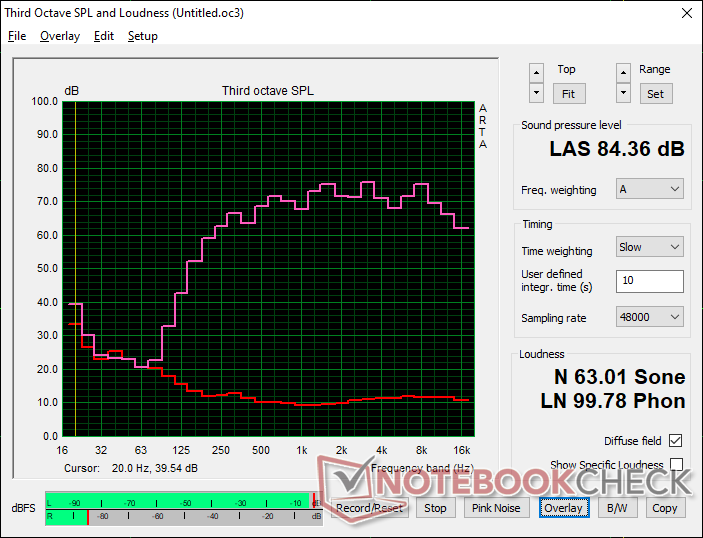
HP Envy 16 h0112nr ljudanalys
(+) | högtalare kan spela relativt högt (84.4 dB)
Bas 100 - 315 Hz
(-) | nästan ingen bas - i genomsnitt 15.9% lägre än medianen
(±) | linjäriteten för basen är genomsnittlig (12.8% delta till föregående frekvens)
Mellan 400 - 2000 Hz
(+) | balanserad mellan - endast 3.1% från medianen
(+) | mids är linjära (5.5% delta till föregående frekvens)
Högsta 2 - 16 kHz
(+) | balanserade toppar - endast 3.4% från medianen
(+) | toppar är linjära (6.3% delta till föregående frekvens)
Totalt 100 - 16 000 Hz
(+) | det totala ljudet är linjärt (12.1% skillnad mot median)
Jämfört med samma klass
» 22% av alla testade enheter i den här klassen var bättre, 3% liknande, 76% sämre
» Den bästa hade ett delta på 5%, genomsnittet var 17%, sämst var 45%
Jämfört med alla testade enheter
» 9% av alla testade enheter var bättre, 2% liknande, 88% sämre
» Den bästa hade ett delta på 4%, genomsnittet var 24%, sämst var 134%
Apple MacBook Pro 16 2021 M1 Pro ljudanalys
(+) | högtalare kan spela relativt högt (84.7 dB)
Bas 100 - 315 Hz
(+) | bra bas - bara 3.8% från medianen
(+) | basen är linjär (5.2% delta till föregående frekvens)
Mellan 400 - 2000 Hz
(+) | balanserad mellan - endast 1.3% från medianen
(+) | mids är linjära (2.1% delta till föregående frekvens)
Högsta 2 - 16 kHz
(+) | balanserade toppar - endast 1.9% från medianen
(+) | toppar är linjära (2.7% delta till föregående frekvens)
Totalt 100 - 16 000 Hz
(+) | det totala ljudet är linjärt (4.6% skillnad mot median)
Jämfört med samma klass
» 0% av alla testade enheter i den här klassen var bättre, 0% liknande, 100% sämre
» Den bästa hade ett delta på 5%, genomsnittet var 17%, sämst var 45%
Jämfört med alla testade enheter
» 0% av alla testade enheter var bättre, 0% liknande, 100% sämre
» Den bästa hade ett delta på 4%, genomsnittet var 24%, sämst var 134%
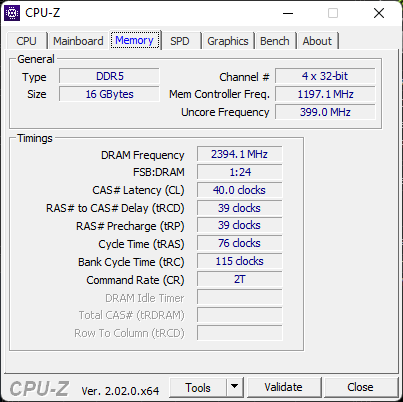
Energiförvaltning
Effektförbrukning
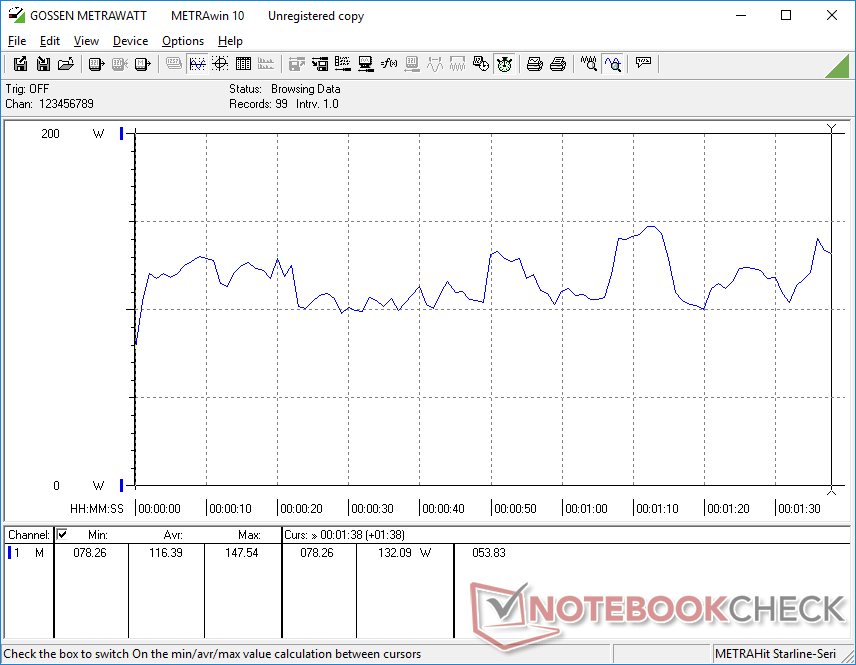
Vid tomgångskörning på skrivbordet drar den mellan 10 W och 28 W beroende på ljusstyrka, energiprofil och Optimus-inställning, jämfört med endast 9 W till 18 W på Envy 15 från 2020 på grund av den mer krävande OLED-panelen och 12:e generationens processor. Tänk på att vissa färger kräver mer ström än andra på en OLED-panel eftersom beskrivs i detalj här.
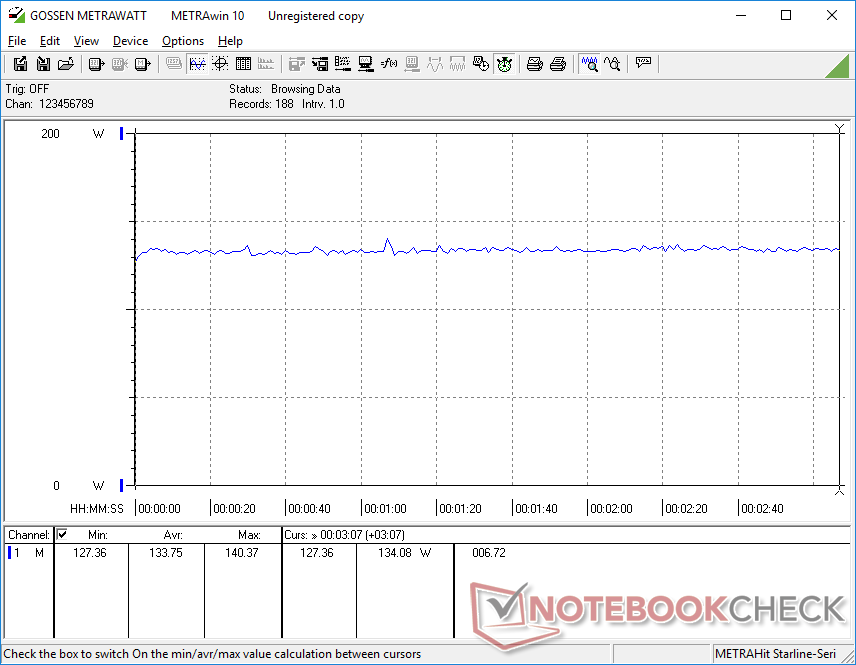
Strömförbrukningen vid spelande är hög med cirka 134 W för att vara jämförbar medMSI Creator Z16P med den snabbare Core i9-12900H CPU och RTX 3080 Ti GPU eller Lenovo Legion Slim 7 16 med samma Core i7 CPU och GPU. Jämfört med 2020 Envy 15 är förbrukningen dock bara cirka 7 procent högre vid spel trots den 20 till 30 procent snabbare grafikprestandan för högre prestanda per watt.
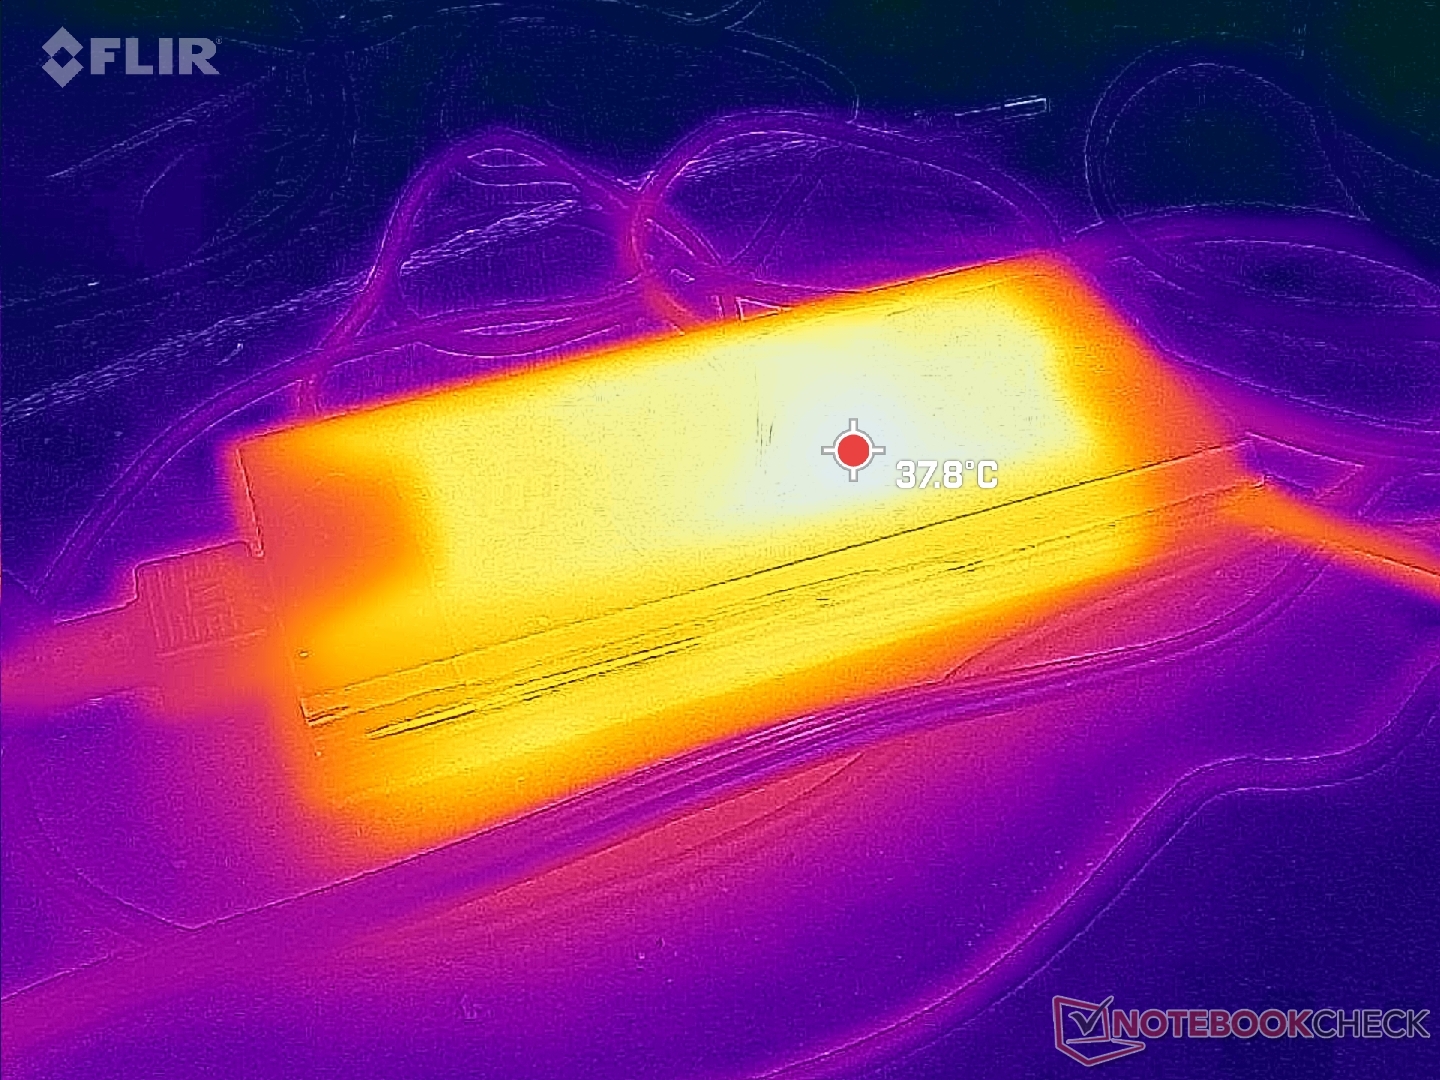
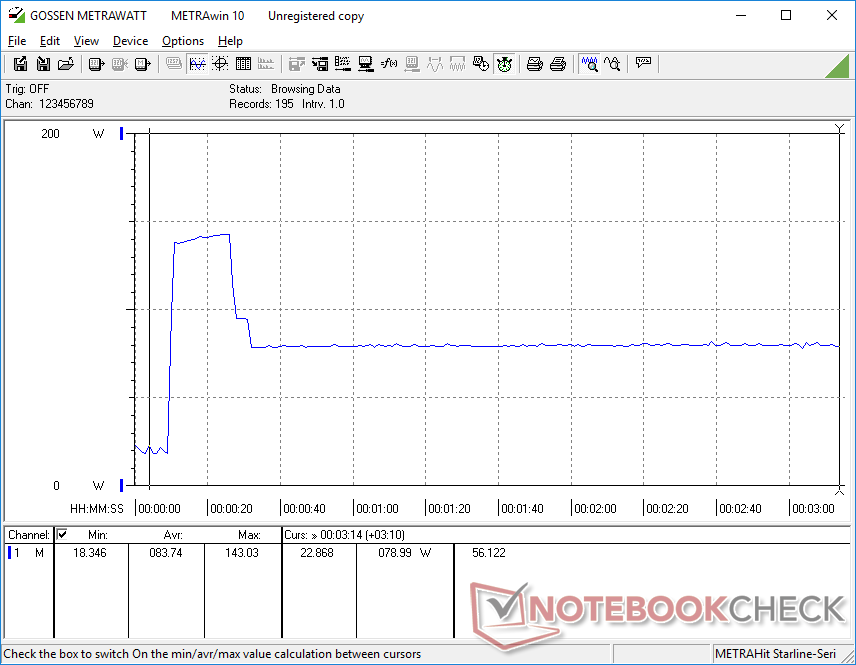
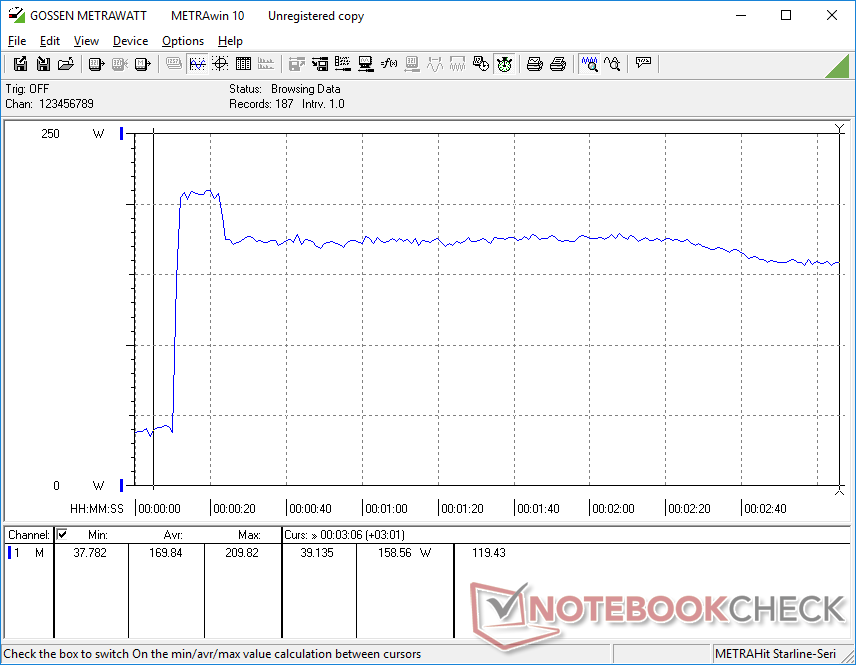
Vi kan mäta ett tillfälligt maximalt uttag på 209,8 W från den medelstora (~16,5 x 7,8 x 2,5 cm) 200 W AC-adaptern när CPU:n och GPU:n var och en är 100 procent utnyttjad. Förbrukningen stabiliseras vid cirka 160 W om man kör extrema belastningar.
| Av/Standby | |
| Låg belastning | |
| Hög belastning |
|
Förklaring:
min: | |
| HP Envy 16 h0112nr i7-12700H, GeForce RTX 3060 Laptop GPU, Micron 3400 1TB MTFDKBA1T0TFH, OLED, 3840x2400, 16" | Lenovo ThinkBook 16 G4+ IAP i7-12700H, GeForce RTX 2050 Mobile, Micron 2450 1TB MTFDKCD1T0TFK, IPS, 2560x1600, 16" | MSI Creator Z16P B12UHST i9-12900H, GeForce RTX 3080 Ti Laptop GPU, Samsung PM9A1 MZVL22T0HBLB, IPS True Pixel (~100% DCI-P3), 2560x1600, 16" | Dell Inspiron 16 Plus 7610-MHJ8F i7-11800H, UHD Graphics Xe 32EUs (Tiger Lake-H), OM3PDP3-AD NVMe KDI 512GB, IPS, 3072x1920, 16" | Apple MacBook Pro 16 2021 M1 Pro M1 Pro, M1 Pro 16-Core GPU, Apple SSD AP1024R, Mini-LED, 3456x2234, 16.2" | Huawei MateBook 16s i7 i7-12700H, Iris Xe G7 96EUs, Silicon Motion PCIe-8 SSD, IPS, 2520x1680, 16" | |
|---|---|---|---|---|---|---|
| Power Consumption | 36% | -11% | 50% | 33% | 35% | |
| Idle Minimum * (Watt) | 10 | 5 50% | 11 -10% | 5.4 46% | 5 50% | 6.8 32% |
| Idle Average * (Watt) | 10.9 | 11.2 -3% | 17 -56% | 9.8 10% | 15.1 -39% | 13.2 -21% |
| Idle Maximum * (Watt) | 27.8 | 11.6 58% | 26 6% | 14 50% | 15.5 44% | 13.8 50% |
| Load Average * (Watt) | 116.4 | 89.3 23% | 124 -7% | 44 62% | 54 54% | 75.2 35% |
| Witcher 3 ultra * (Watt) | 133.7 | 83 38% | 133.5 -0% | 44 67% | 56.1 58% | |
| Load Maximum * (Watt) | 209.8 | 102 51% | 212 -1% | 76.8 63% | 90 57% | 90.6 57% |
* ... mindre är bättre
Power Consumption Witcher 3 / Stresstest
Power Consumption external Monitor
Batteritid
WLAN-driftstiden är jämförbar med MateBook 16s i7 eller ThinkBook 16 G4+ IAP med cirka 8 timmar. Batterikapaciteten är identisk med 2020 års Envy 15 trots flytten till en större skärmstorlek.
Laddning från tomt till fullt med den medföljande fatadaptern tar cirka 1,5 timmar. Systemet kan inte laddas via USB-C trots vad de officiella specifikationerna kan påstå. När en USB-C-laddare på 100 W kopplas in skulle systemet helt enkelt ge en varning om att använda en laddare med högre kapacitet istället. Vi har kontaktat HP för att få ett förtydligande och kommer att uppdatera det här avsnittet i enlighet med detta.
| HP Envy 16 h0112nr i7-12700H, GeForce RTX 3060 Laptop GPU, 83 Wh | Lenovo ThinkBook 16 G4+ IAP i7-12700H, GeForce RTX 2050 Mobile, 71 Wh | MSI Creator Z16P B12UHST i9-12900H, GeForce RTX 3080 Ti Laptop GPU, 90 Wh | Dell Inspiron 16 Plus 7610-MHJ8F i7-11800H, UHD Graphics Xe 32EUs (Tiger Lake-H), 86 Wh | Apple MacBook Pro 16 2021 M1 Pro M1 Pro, M1 Pro 16-Core GPU, 99.6 Wh | Huawei MateBook 16s i7 i7-12700H, Iris Xe G7 96EUs, 84 Wh | |
|---|---|---|---|---|---|---|
| Batteridrifttid | -1% | -36% | 67% | 114% | 11% | |
| Reader / Idle (h) | 17.8 | 22.5 26% | ||||
| WiFi v1.3 (h) | 7.9 | 8.2 4% | 5.2 -34% | 9.5 20% | 16.9 114% | 8.1 3% |
| Load (h) | 1.6 | 1.5 -6% | 1 -37% | 4.1 156% | 1.9 19% | |
| H.264 (h) | 12.6 | 5.8 | 17.5 | 9.3 | ||
| WiFi (h) | 9.5 |
För
Emot
Slutsats - Som en billigare MacBook Pro 16
Envy 16 är naturligtvis snabbare än den äldre Envy 15, men några av de nackdelar som vi nämnde med Envy 15 har ännu inte åtgärdats. De högljudda fläktarna, inget Kensington-lås, den svampiga klickplattan och de relativt svaga gångjärnen är ett steg nedåt jämfört med alternativ som MacBook Pro 16 eller Dell Inspiron 16 Plus. Systemet är också en av de större och tyngre bärbara 16-tumsdatorerna på marknaden, vilket kan avskräcka resenärer och studenter.
HP Envy 16 är nästan 10 000 kronor billigare än MacBook Pro 16 och erbjuder samtidigt konkurrenskraftig prestanda, funktionalitet och färger. Det är dock ett ganska högljutt och tungt system.
Användare som inte avskräcks av vikten kommer att finna att Envy 16 är ett mångsidigt system med prestanda, skärmstorlek och färger som passar för spel och redigering. Vi uppskattar särskilt hur enkelt det är att lägga till mer lagringsutrymme eller RAM-minne vid behov. Om dina uppgifter inte kräver mycket hästkrafter bör du dock överväga betydligt lättare 16-tumsalternativ som t.ex LG Gram 16 eller Huawei MateBook 16s.
Pris och tillgänglighet
Envy 16 finns nu tillgänglig hos stora återförsäljare, bland annat Newegg, Best Buy, Costco, Micro Center och HP.com i olika konfigurationer. Vår specifika konfiguration finns på Micro Center för 1 700 USD medan Intel Arc A370M SKU:er kan hittas på andra ställen.
HP Envy 16 h0112nr
- 09/24/2022 v7 (old)
Allen Ngo
Price comparison

