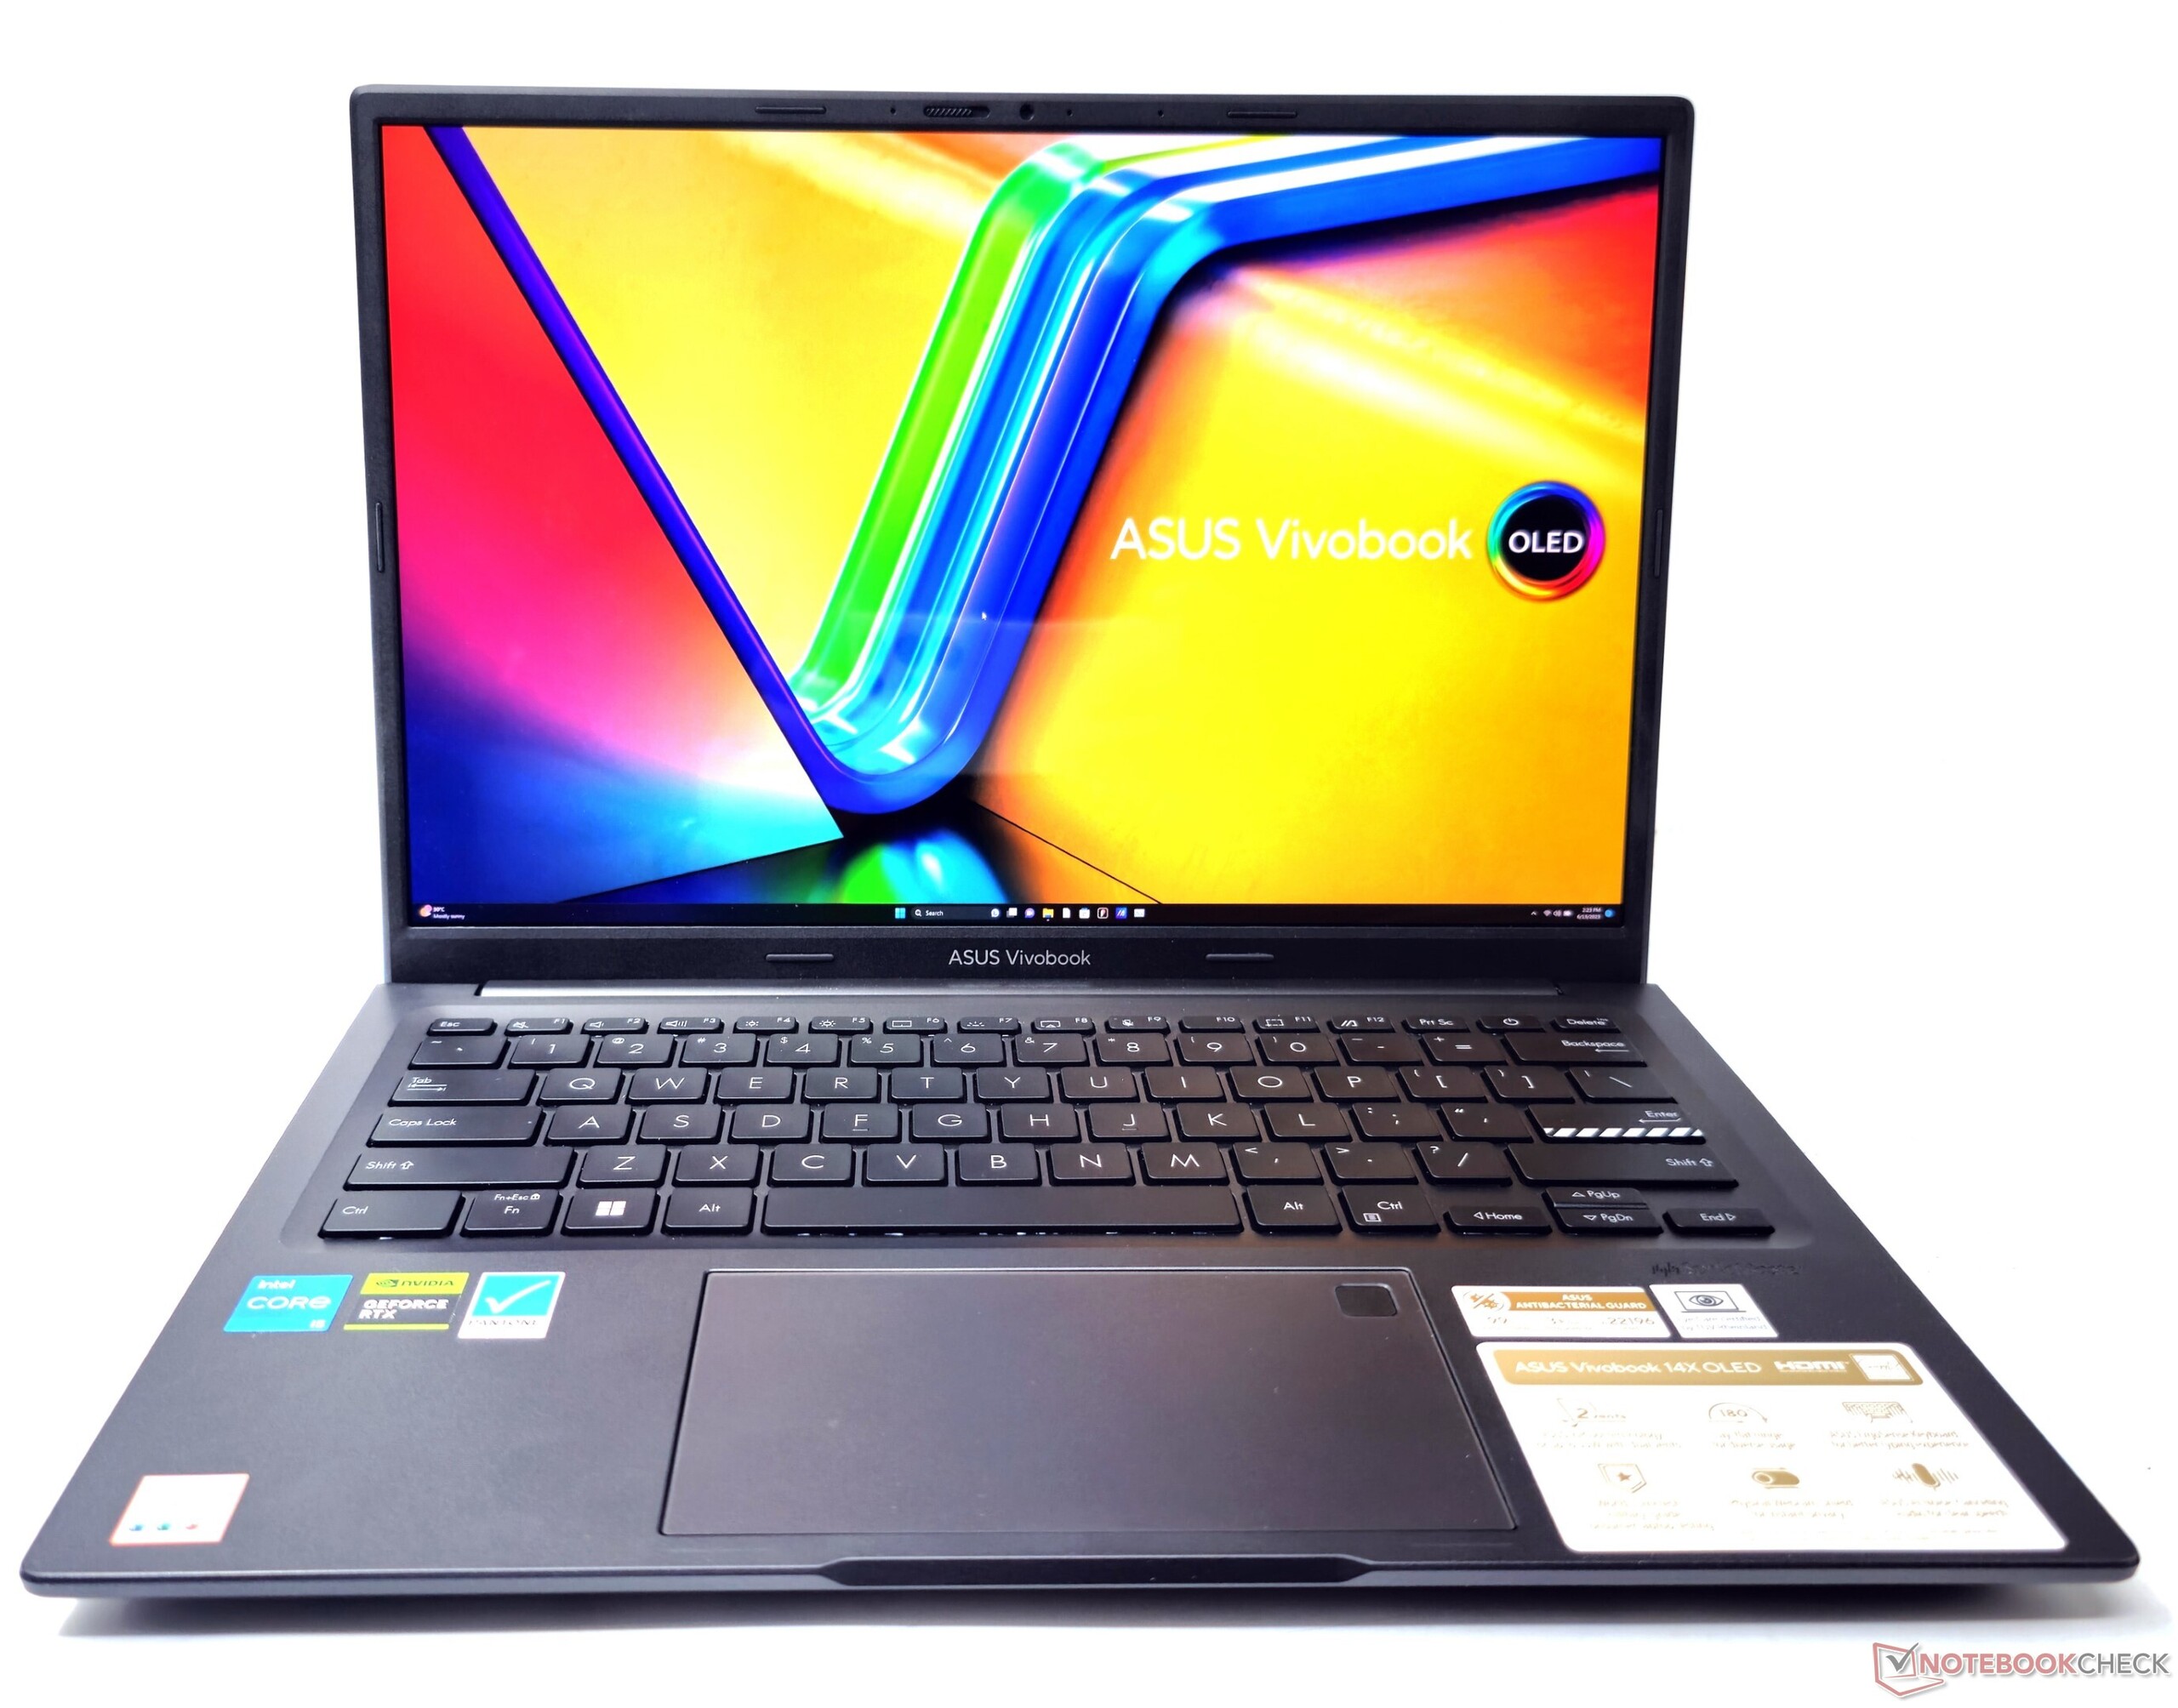
Asus VivoBook 14X OLED K3405 recension av bärbar dator: Enklare multimedia-laptop med Core i5-13500H och livfull 2,8K OLED-skärm

Asus har lanserat flera uppgraderade VivoBooks i år. Medan den nya VivoBook 15X erbjuder Intel Raptor Lake-P och AMD Ryzen 7030U Barcelo-R alternativ, är VivoBook Pro 16Xskruvar upp spakarna hela vägen till Core i9-13980HX. Vi vänder nu vårt fokus mot VivoBook 14X som levereras med en Raptor Lake-H45 CPU.
VivoBook 14X ger oss den första glimten avIntel Core i5-13500Hprestanda tillsammans med enNvidia GeForce RTX 3050 GPU för bärbar dator. OLED-skärmar har nu blivit mer eller mindre stommen i VivoBooks, med undantag för några få SKU:er i lågprissegmentet. I det här fallet har VivoBook 14X en 14-tums 2,8K OLED-skärm med en uppdateringsfrekvens på 90 Hz.
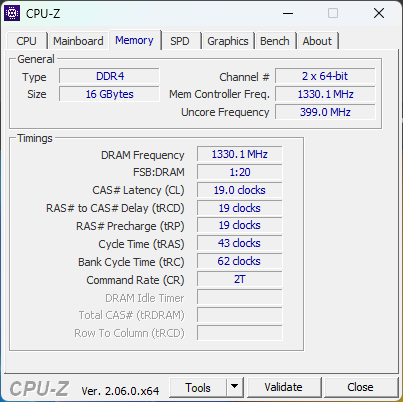
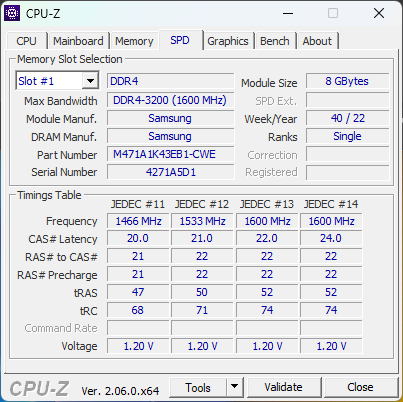
Asus utrustar också den bärbara datorn med 16 GB DDR4-3200 RAM, Wi-Fi 6E och en 512 GB NVMe SSD. Denna konfiguration kommer att kosta dig 96 990 kr (1 172 USD).
Potentiella konkurrenter i jämförelse
Gradering | Datum | Modell | Vikt | Höjd | Storlek | Upplösning | Pris |
|---|---|---|---|---|---|---|---|
| 85.6 % v7 (old) | 08/2023 | Asus VivoBook 14X K3405 i5-13500H, GeForce RTX 3050 4GB Laptop GPU | 1.4 kg | 18.9 mm | 14.00" | 2880x1800 | |
| 86.3 % v7 (old) | 07/2023 | Acer Swift X SFX14-71G i7-13700H, GeForce RTX 4050 Laptop GPU | 1.5 kg | 17.9 mm | 14.50" | 2880x1800 | |
| 85.4 % v7 (old) | 07/2023 | MSI Stealth 14 Studio A13V i7-13700H, GeForce RTX 4050 Laptop GPU | 1.7 kg | 19 mm | 14.00" | 2560x1600 | |
| 89.4 % v7 (old) | 05/2023 | Gigabyte Aero 14 OLED BMF i7-13700H, GeForce RTX 4050 Laptop GPU | 1.4 kg | 17 mm | 14.00" | 2880x1800 | |
| 89.2 % v7 (old) | 04/2023 | Lenovo Slim Pro 7 14ARP8 R7 7735HS, GeForce RTX 3050 6GB Laptop GPU | 1.6 kg | 15.6 mm | 14.50" | 2560x1600 | |
| 88.8 % v7 (old) | 10/2022 | Schenker Vision 14 2022 RTX 3050 Ti i7-12700H, GeForce RTX 3050 Ti Laptop GPU | 1.3 kg | 16.6 mm | 14.00" | 2880x1800 |
Chassi: Lätt men ändå utilitaristisk
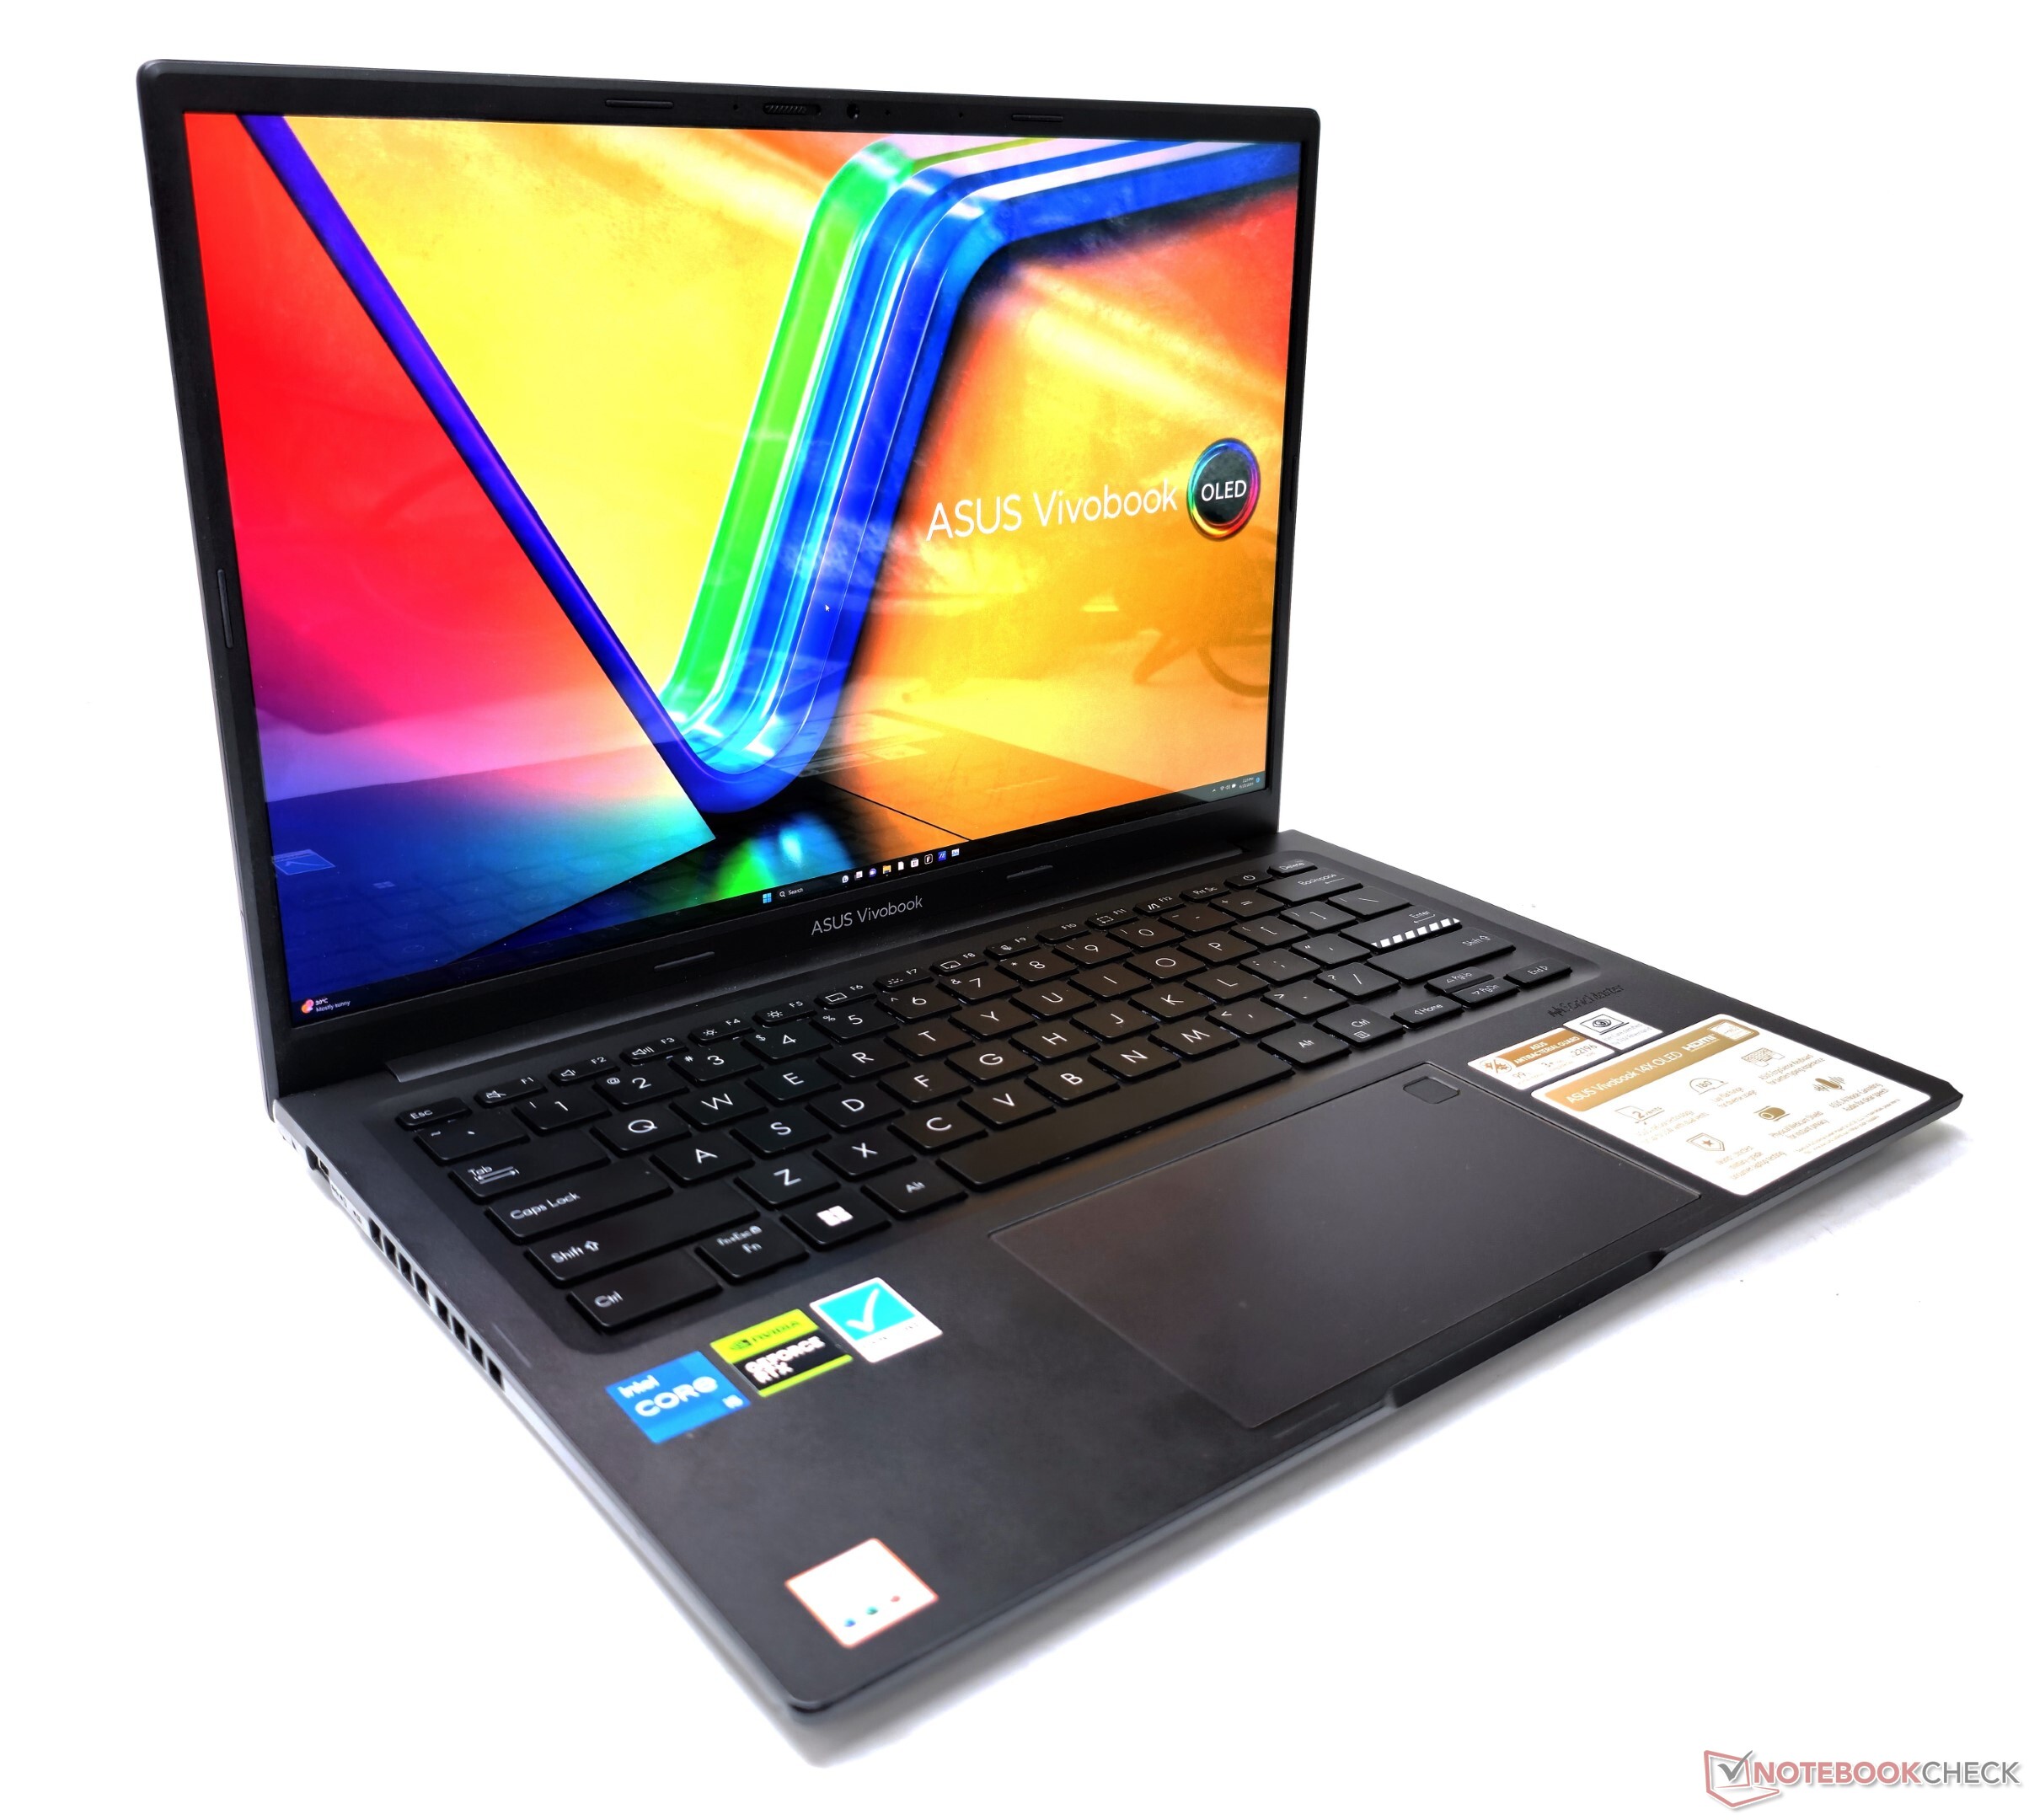
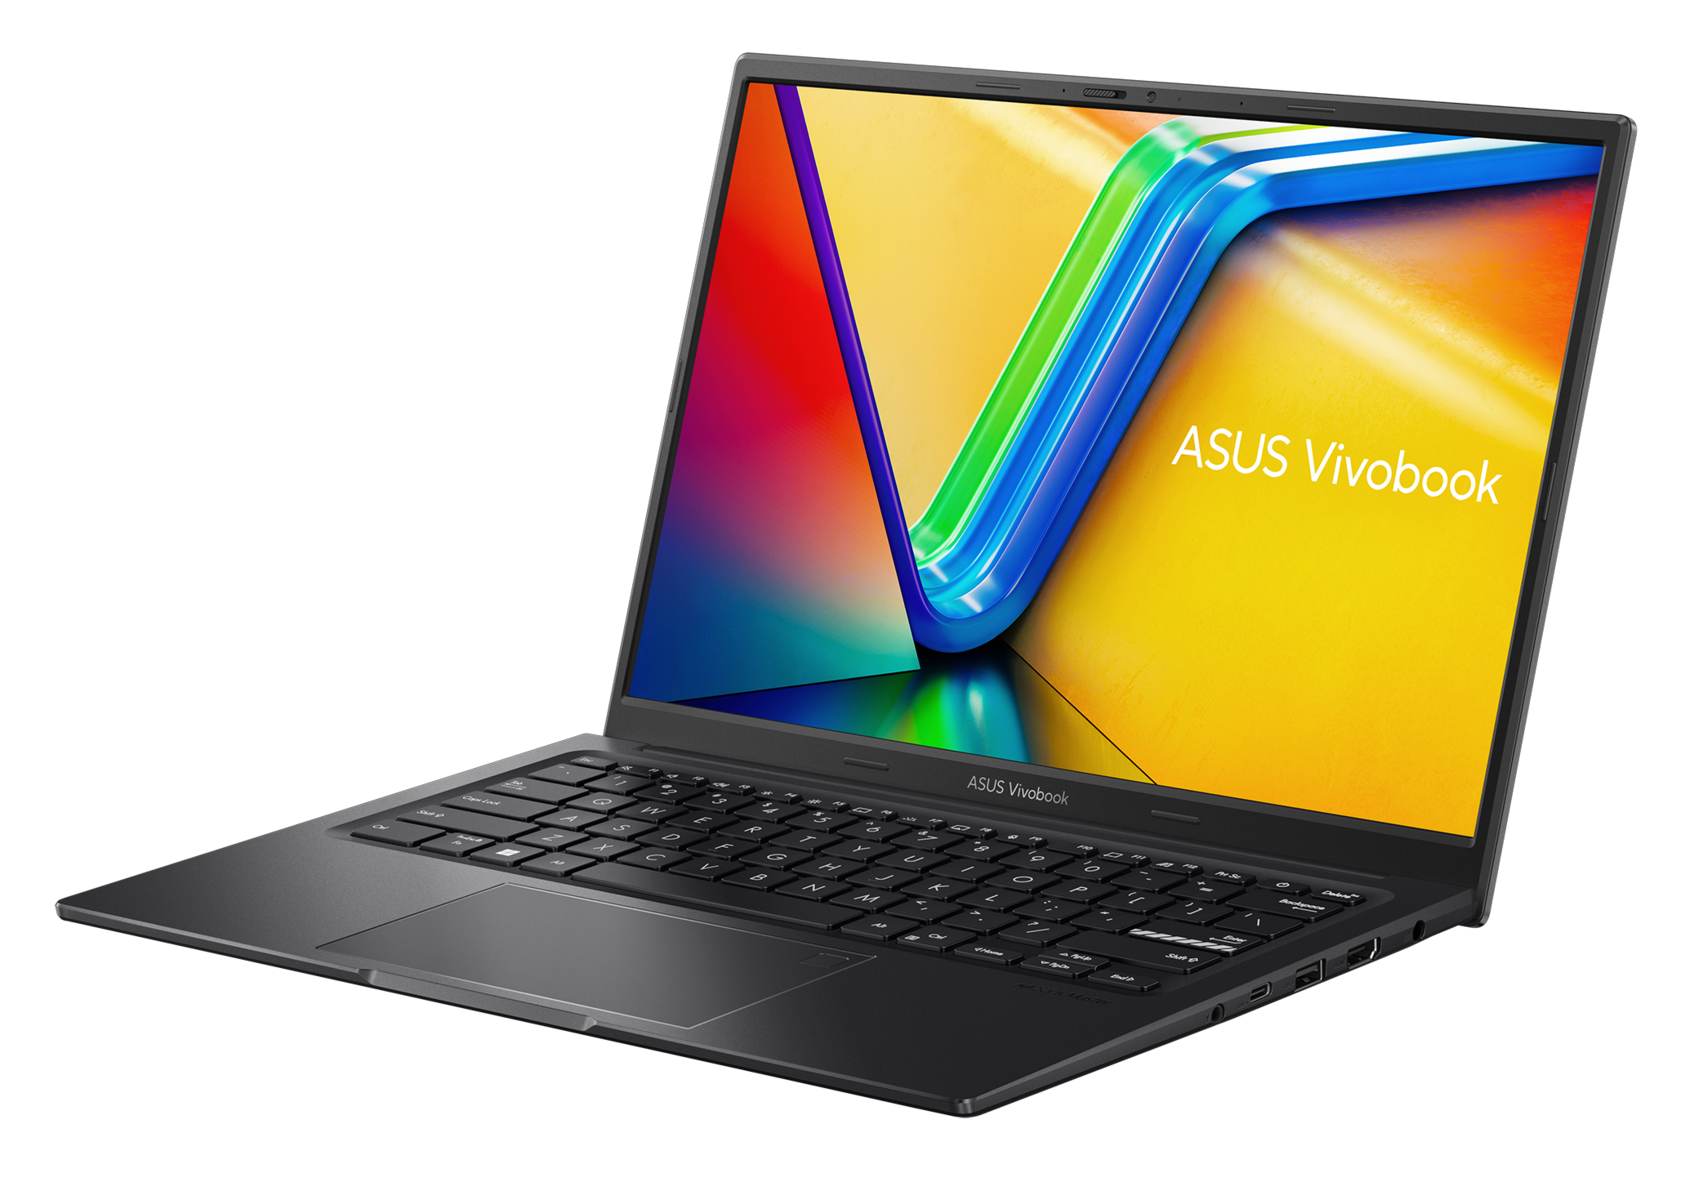
I likhet med VivoBook 15X erbjuder Asus VivoBook 14X i två färgalternativ: Cool Silver och Indie Black (vår variant). Som vanligt med VivoBooks har det 1,4 kg tunga chassit främst en plastkonstruktion medan det metalliska locket har den distinkta VivoBook-logotypen.
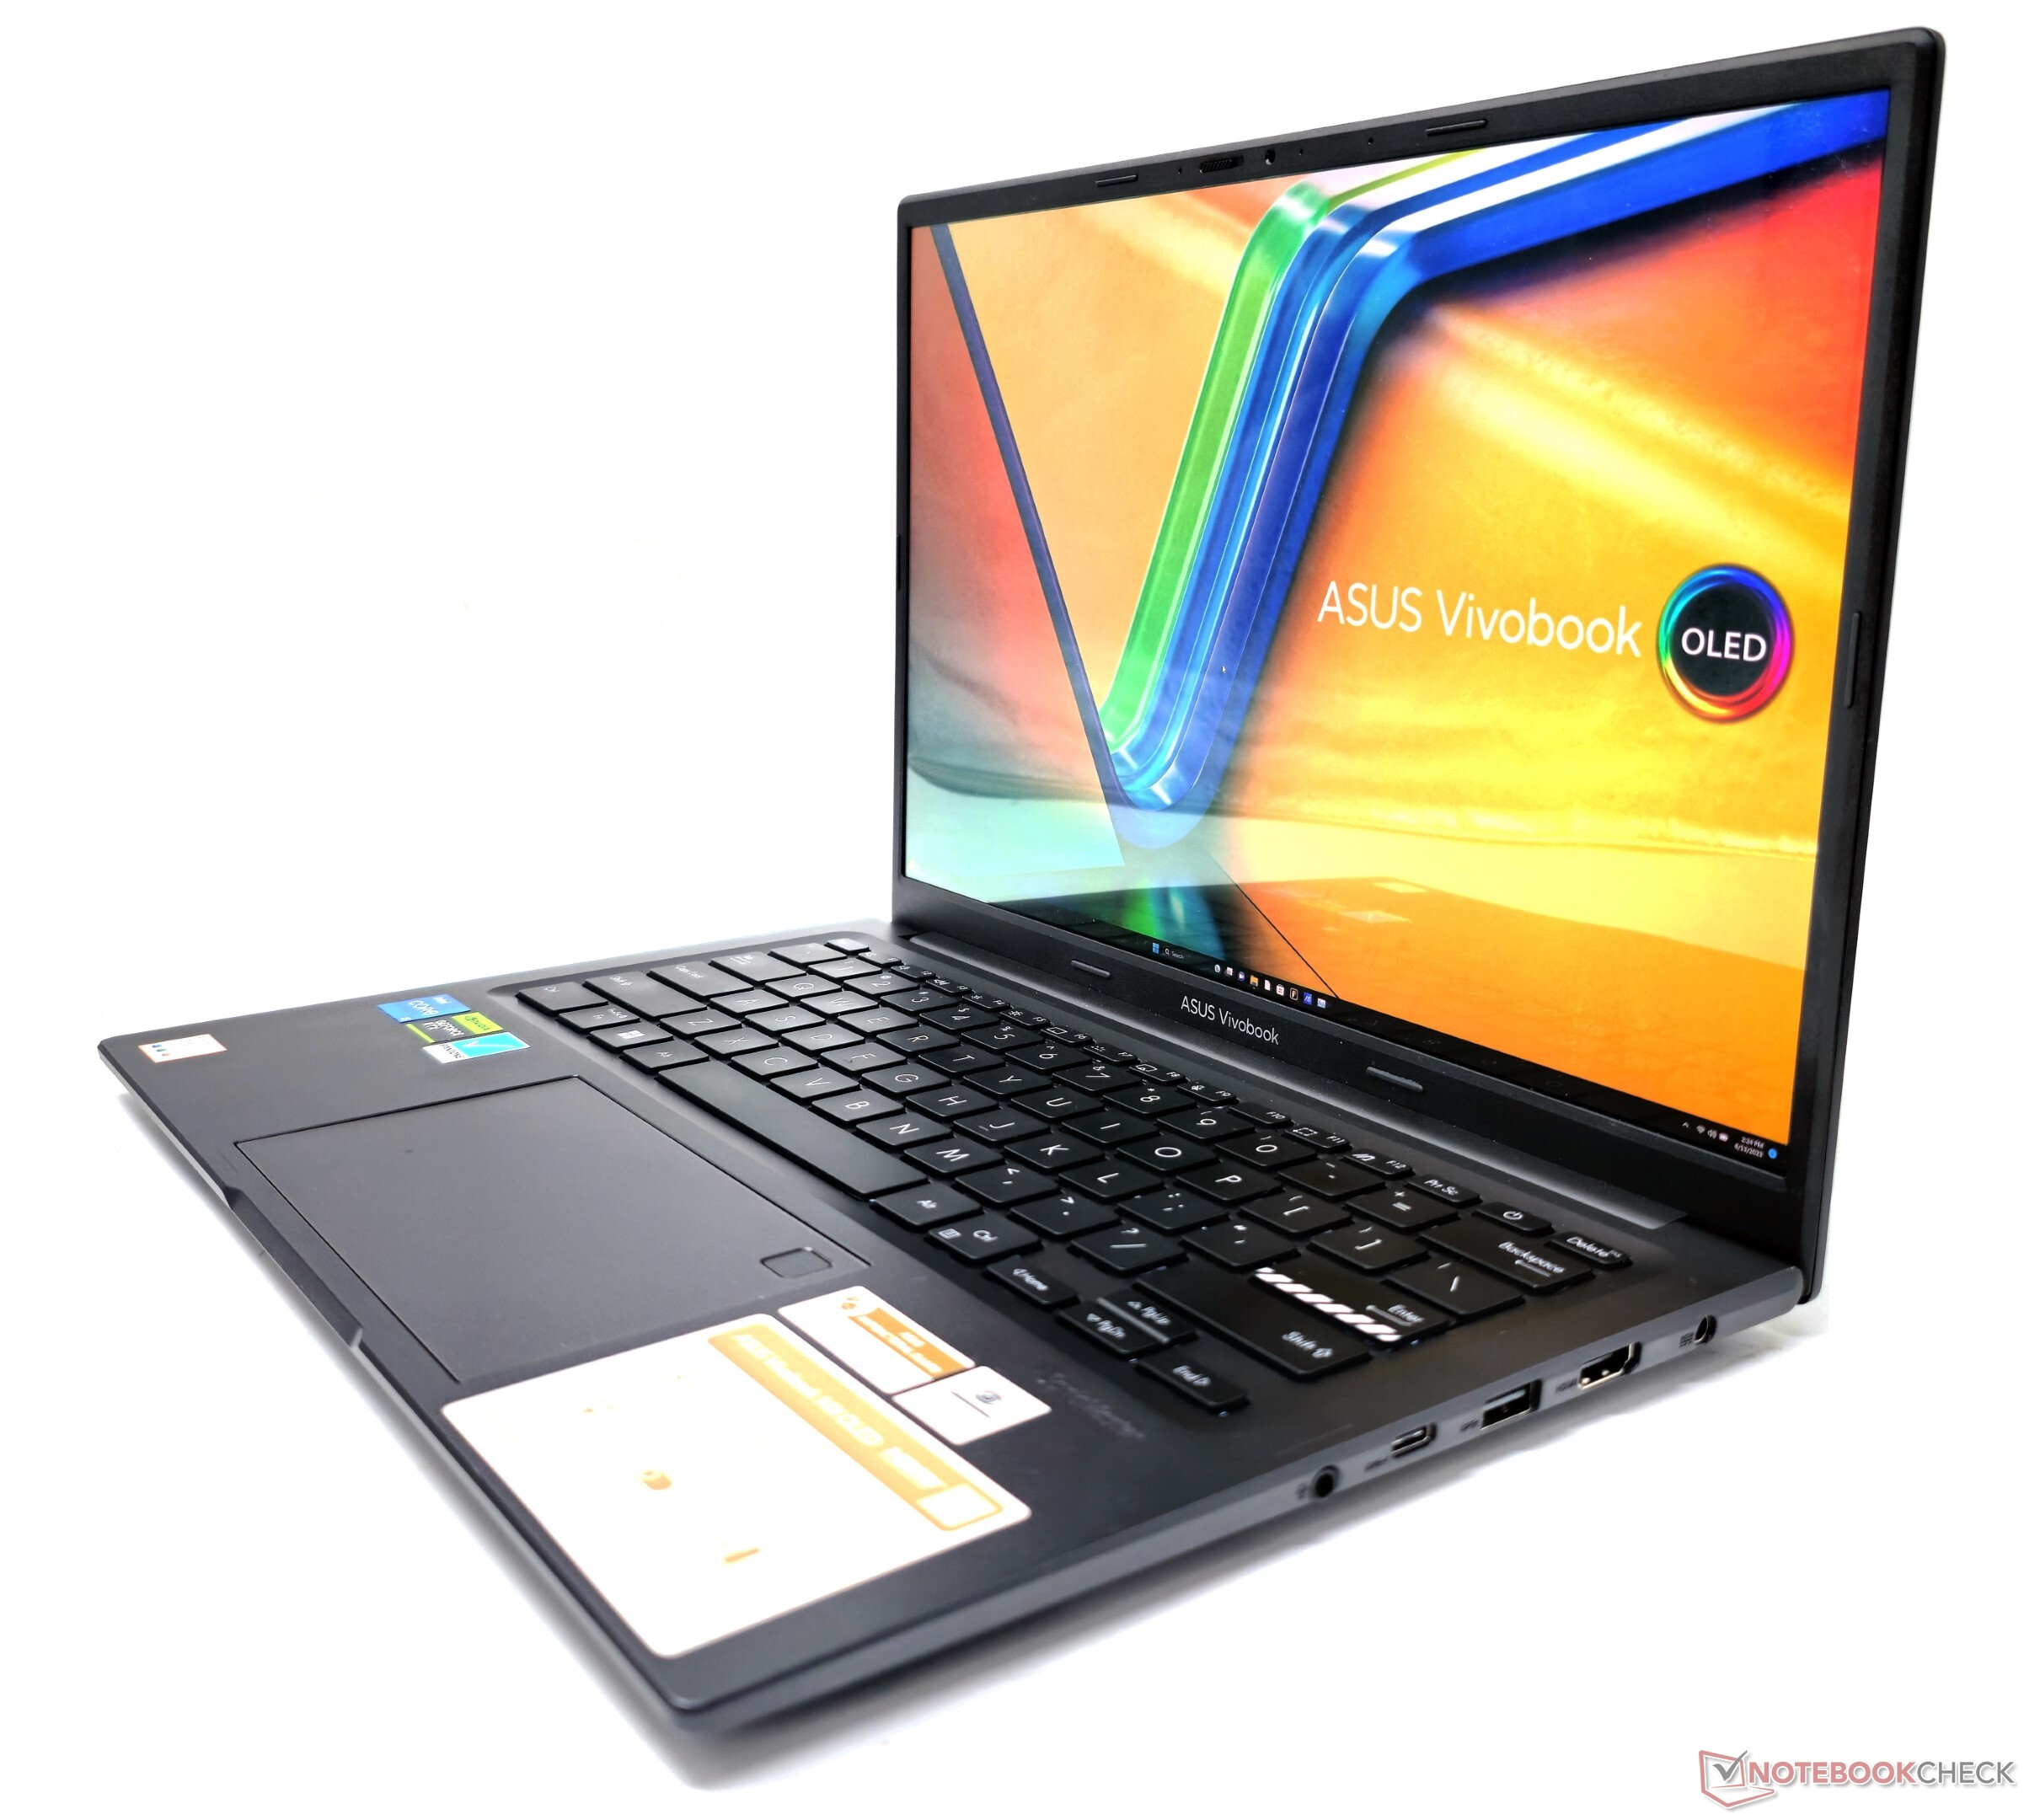
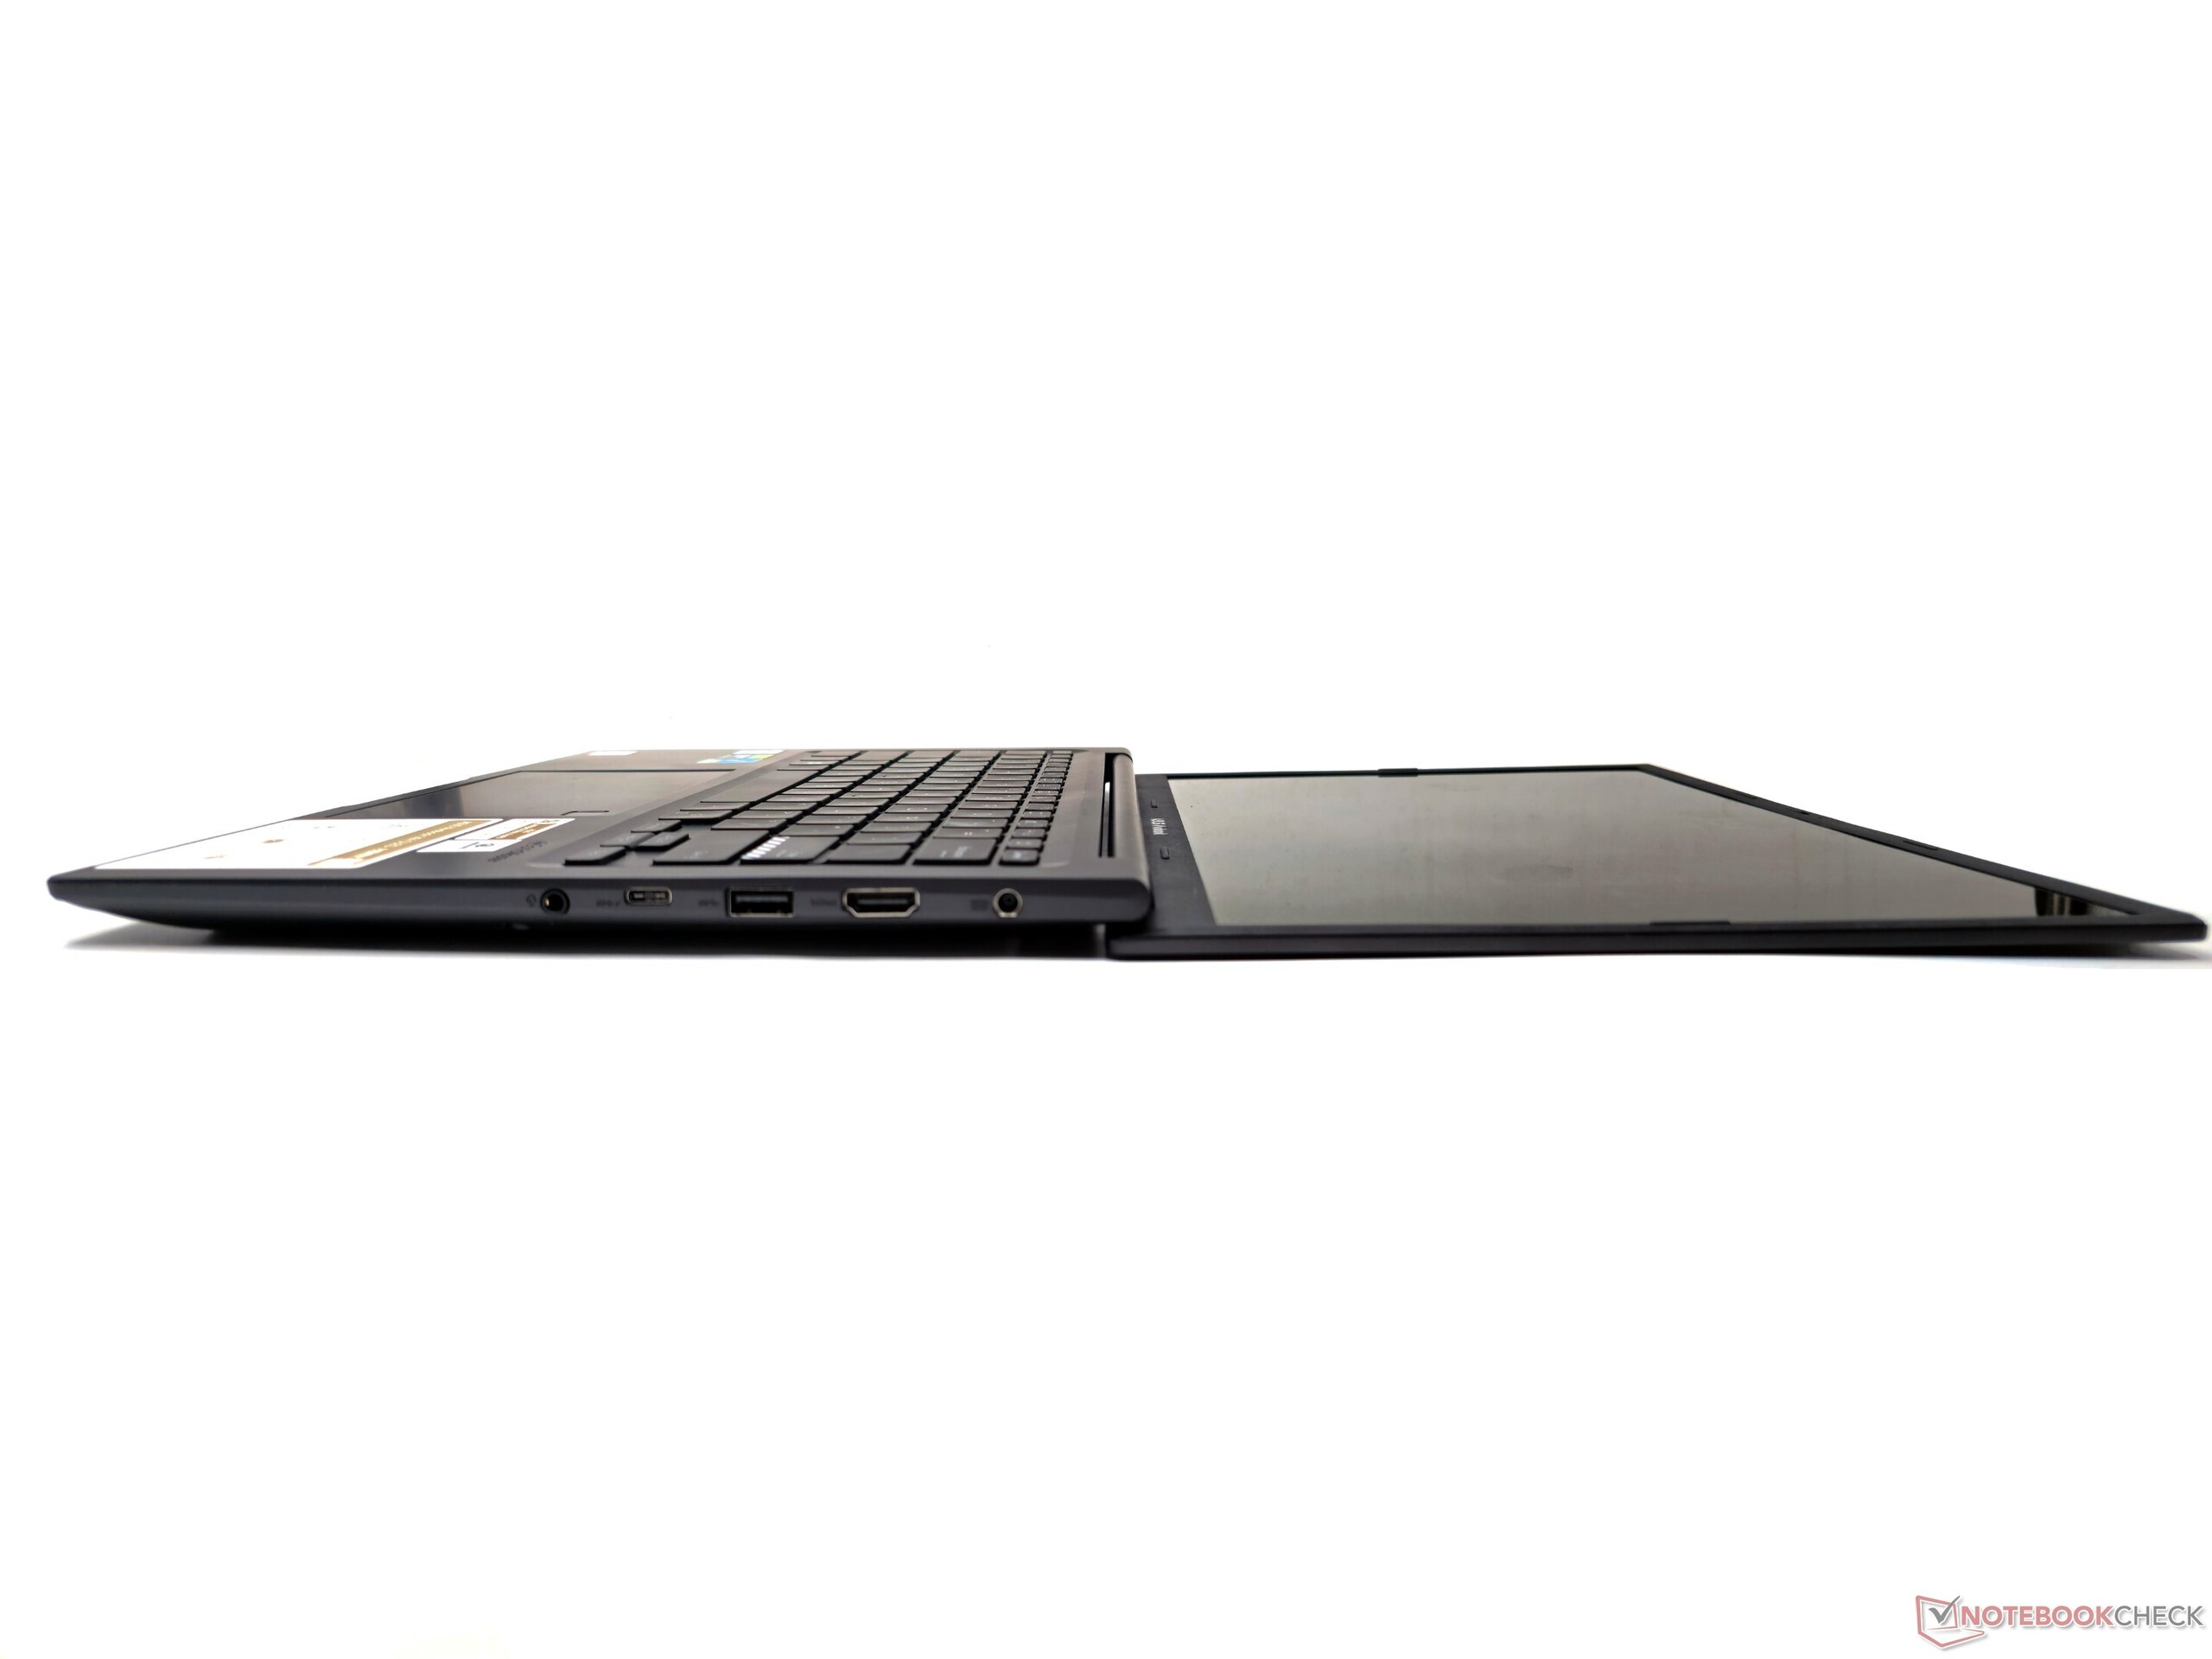
Att öppna locket är en barnlek och kräver bara ett finger, och den bärbara datorn förblir stabil utan att glida. Skärmen kan läggas platt i en 180° vinkel. Det finns viss flexibilitet i skärmen och tangentbordet, men detta bör inte vara ett problem vid normal användning.
Gångjärnen känns solida utan knarr eller överdrivet motstånd. Det finns också Asus antimikrobiella skydd som sägs hämma bakterietillväxt i minst tre år. Asus hävdar också att den bärbara datorn uppfyller MIL-STD-810H hållbarhetsstandarder.
Anslutningsmöjligheter: Wi-Fi 6E prestanda inte upp till märket
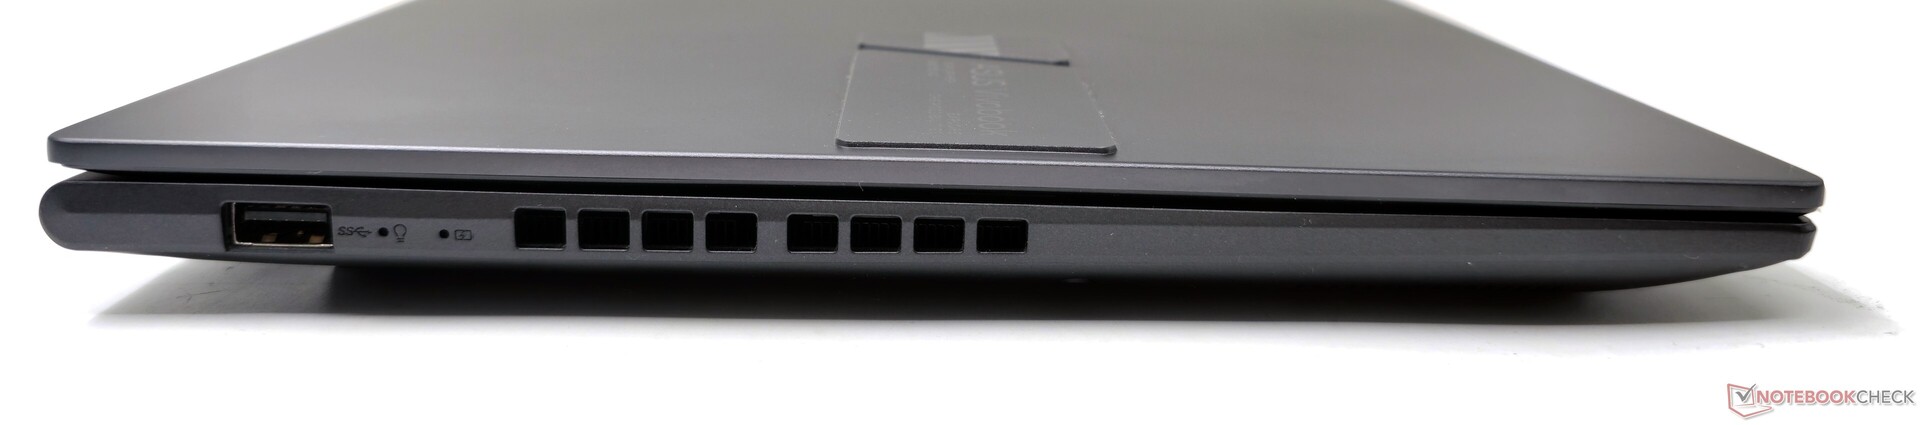
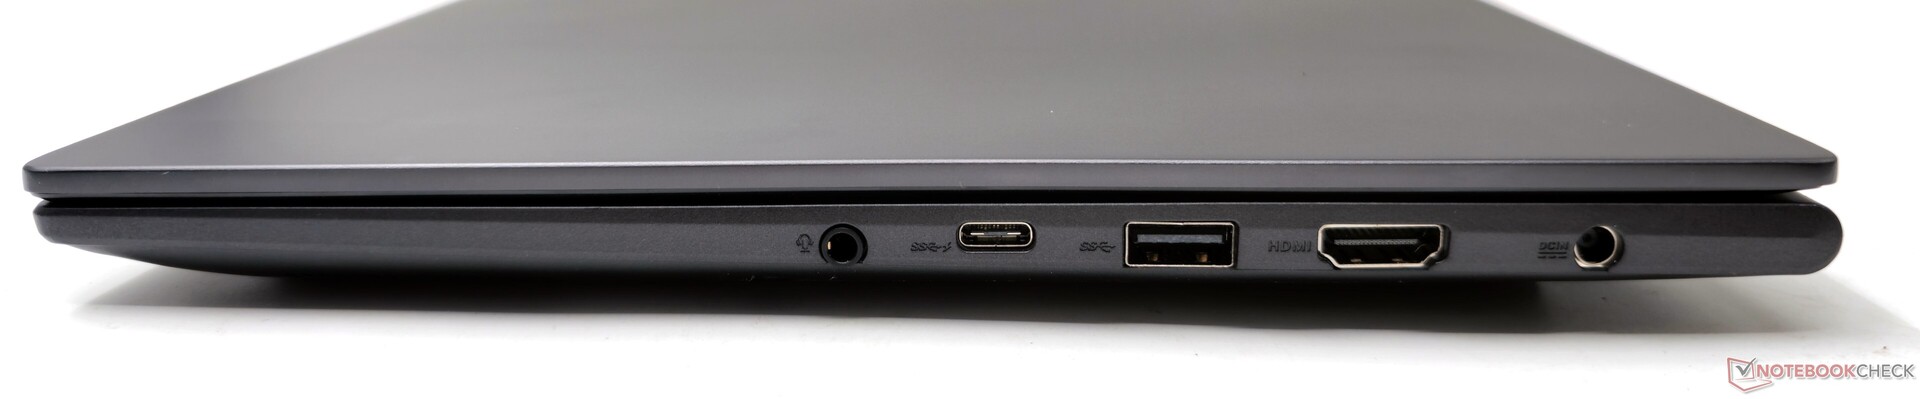
Portarrangemanget liknar det vi har sett på VivoBook 15X tidigare. På vänster sida finns en enda USB 3.2 Gen1 Type-A-port, medan resten är placerade på höger sida.
Denna ensidiga fördelning av portar kan vara besvärande, särskilt när du använder en extern mus och om du tänker ansluta flera kringutrustningsenheter. Avståndet mellan portarna är dock tillräckligt och kommer inte att orsaka några problem med anslutningen.
Kommunikation
Intel Wi-Fi 6E AX211-kortet visar utmärkt prestanda i 5 GHz-bandet utan några märkbara droppar när det testas med vår referens Asus ROG Rapture GT-AXE11000-router.
Detsamma kan dock inte sägas för 6 GHz-bandet, som visar inkonsekvent prestanda med regelbundna genomströmningsfall under testet.
I jämförelse med Gigabyte Aero 14 OLED med ett Intel Wi-Fi 6E AX210-kort bra prestanda i båda banden.
| Networking / iperf3 transmit AXE11000 | |
| Asus VivoBook 14X K3405 (iperf 3.1.3) | |
| Acer Swift X SFX14-71G | |
| Gigabyte Aero 14 OLED BMF (iperf 3.1.3) | |
| MSI Stealth 14 Studio A13V | |
| Schenker Vision 14 2022 RTX 3050 Ti (iperf 3.1.3) | |
| Genomsnitt av klass Multimedia (606 - 1978, n=61, senaste 2 åren) | |
| Lenovo Slim Pro 7 14ARP8 (iperf 3.1.3) | |
| Genomsnitt Intel Wi-Fi 6E AX211 (64 - 1921, n=276) | |
| Networking / iperf3 receive AXE11000 | |
| Asus VivoBook 14X K3405 (iperf 3.1.3) | |
| Gigabyte Aero 14 OLED BMF (iperf 3.1.3) | |
| Schenker Vision 14 2022 RTX 3050 Ti (iperf 3.1.3) | |
| MSI Stealth 14 Studio A13V | |
| Acer Swift X SFX14-71G | |
| Lenovo Slim Pro 7 14ARP8 (iperf 3.1.3) | |
| Genomsnitt Intel Wi-Fi 6E AX211 (582 - 1890, n=276) | |
| Genomsnitt av klass Multimedia (682 - 1818, n=61, senaste 2 åren) | |
| Networking / iperf3 transmit AXE11000 6GHz | |
| Gigabyte Aero 14 OLED BMF (iperf 3.1.3) | |
| Genomsnitt av klass Multimedia (869 - 2373, n=25, senaste 2 åren) | |
| Asus VivoBook 14X K3405 (iperf 3.1.3) | |
| Genomsnitt Intel Wi-Fi 6E AX211 (385 - 1851, n=226) | |
| Networking / iperf3 receive AXE11000 6GHz | |
| Gigabyte Aero 14 OLED BMF (iperf 3.1.3) | |
| Genomsnitt av klass Multimedia (1212 - 2361, n=25, senaste 2 åren) | |
| Asus VivoBook 14X K3405 (iperf 3.1.3) | |
| Genomsnitt Intel Wi-Fi 6E AX211 (700 - 1857, n=226) | |
Webbkamera
Den integrerade 720p-webbkameran på VivoBook 14X uppvisar dålig skärpa och betydande färgavvikelser. X-Rite ColorChecker Passport-testet avslöjar det högsta Delta E på 22,45 med färgen Purplish Blue.
Även om webbkameran kan räcka för enstaka videosamtal, borde Asus ha utrustat den bärbara datorn med en 1080p-modul för förbättrad kvalitet.
En fysisk slutare för webbkameran finns för ökad integritet.


Säkerhet
Biometriska inloggningar underlättas av en fingeravtrycksläsare som är inbäddad i pekplattan. Dessutom finns en TPM 2.0-modul.
Tillbehör och garanti
Det finns inga ytterligare tillbehör i lådan förutom 90 W nätadapter och det vanliga pappersarbetet.
I Indien erbjuder Asus VivoBook 14X med ett års standardgaranti. De som köper den bärbara datorn före den 31 augusti 2023 kan också dra nytta av Back to College-förmåner som inkluderar flera alternativ för garantiförlängning och lokalt skydd mot oavsiktliga skador från 99 kr till 2 999 kr.
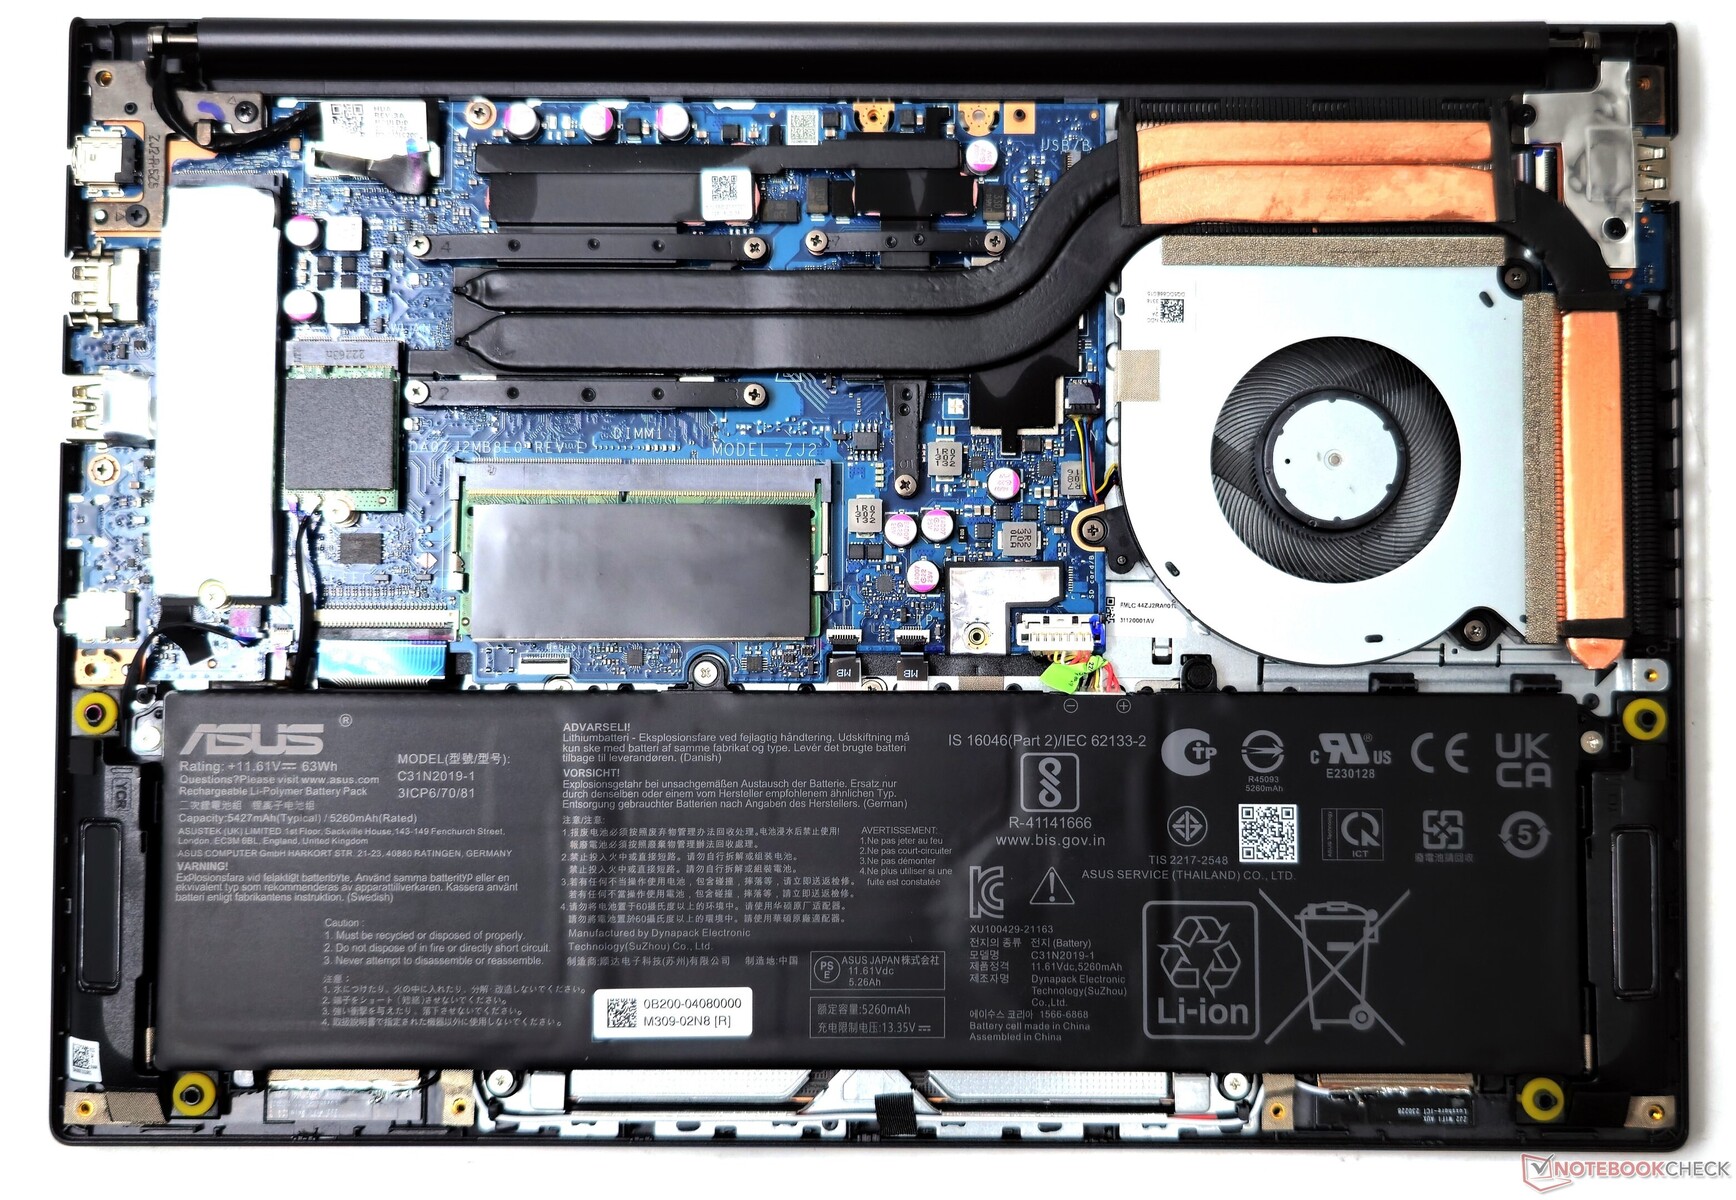
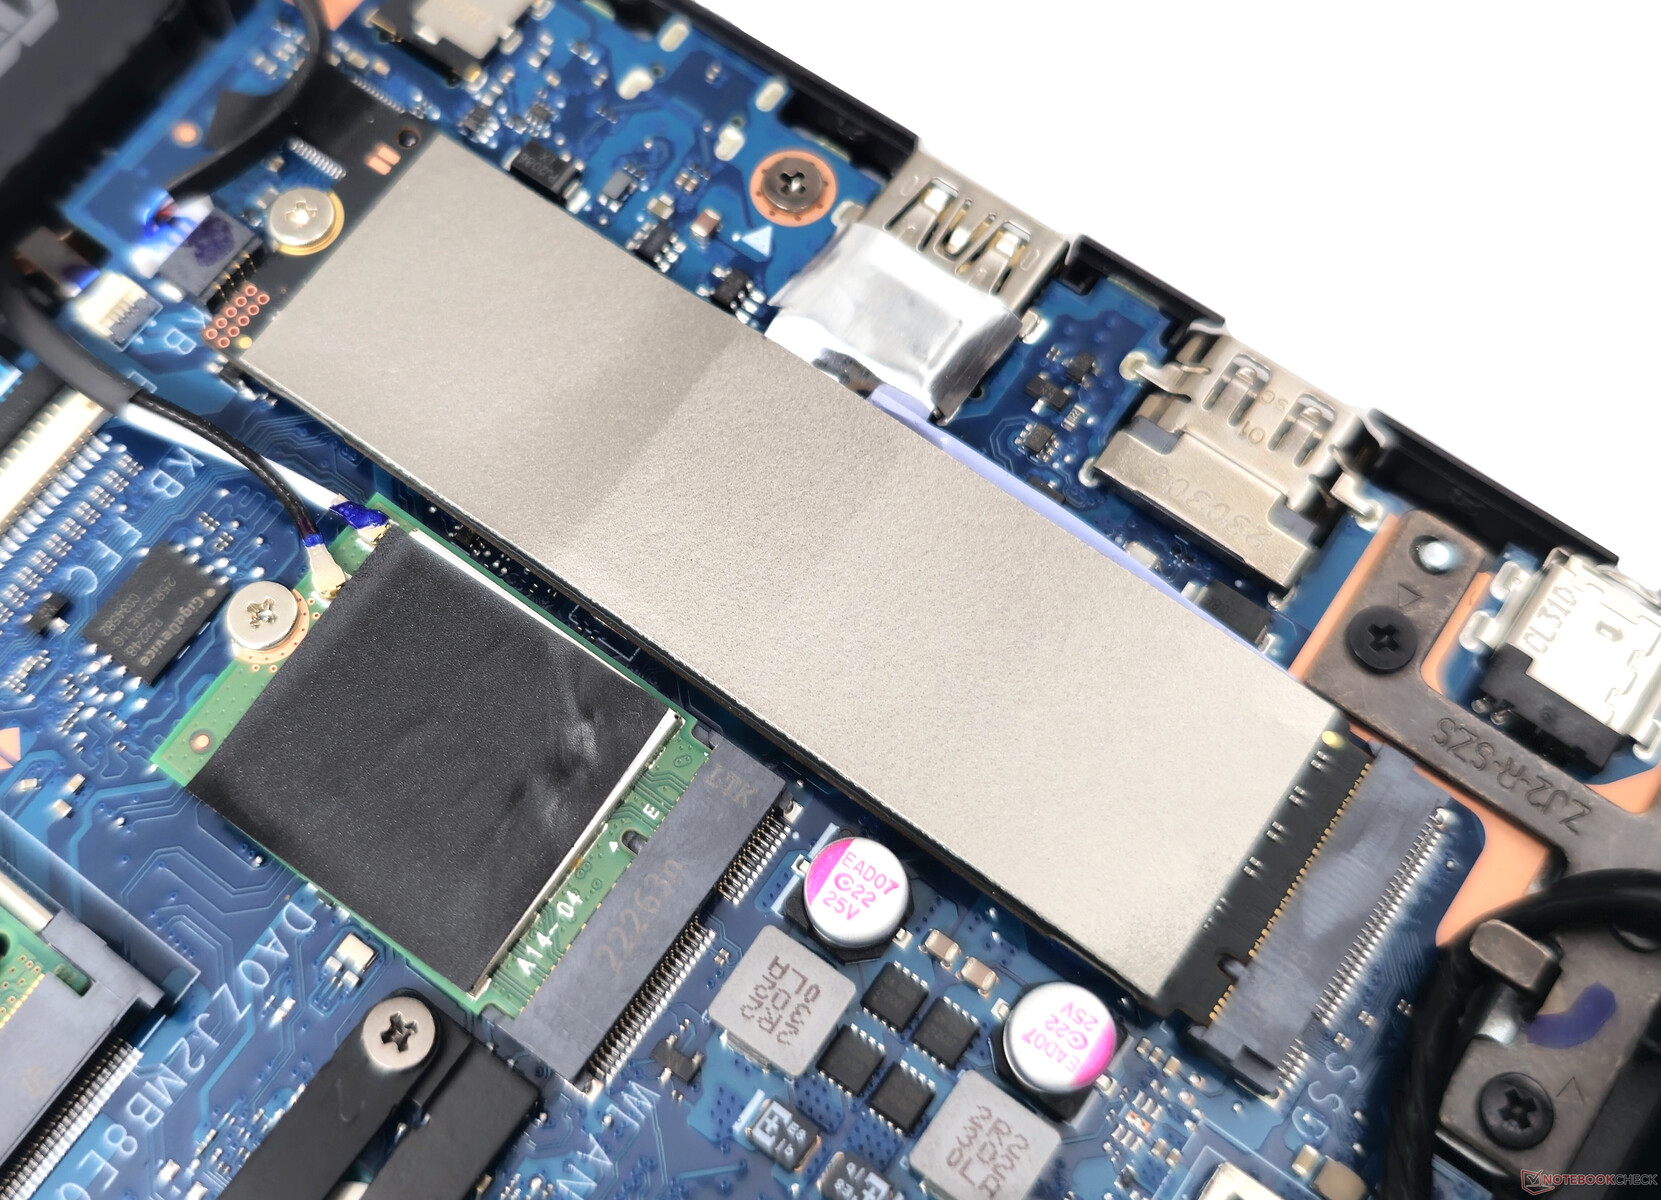
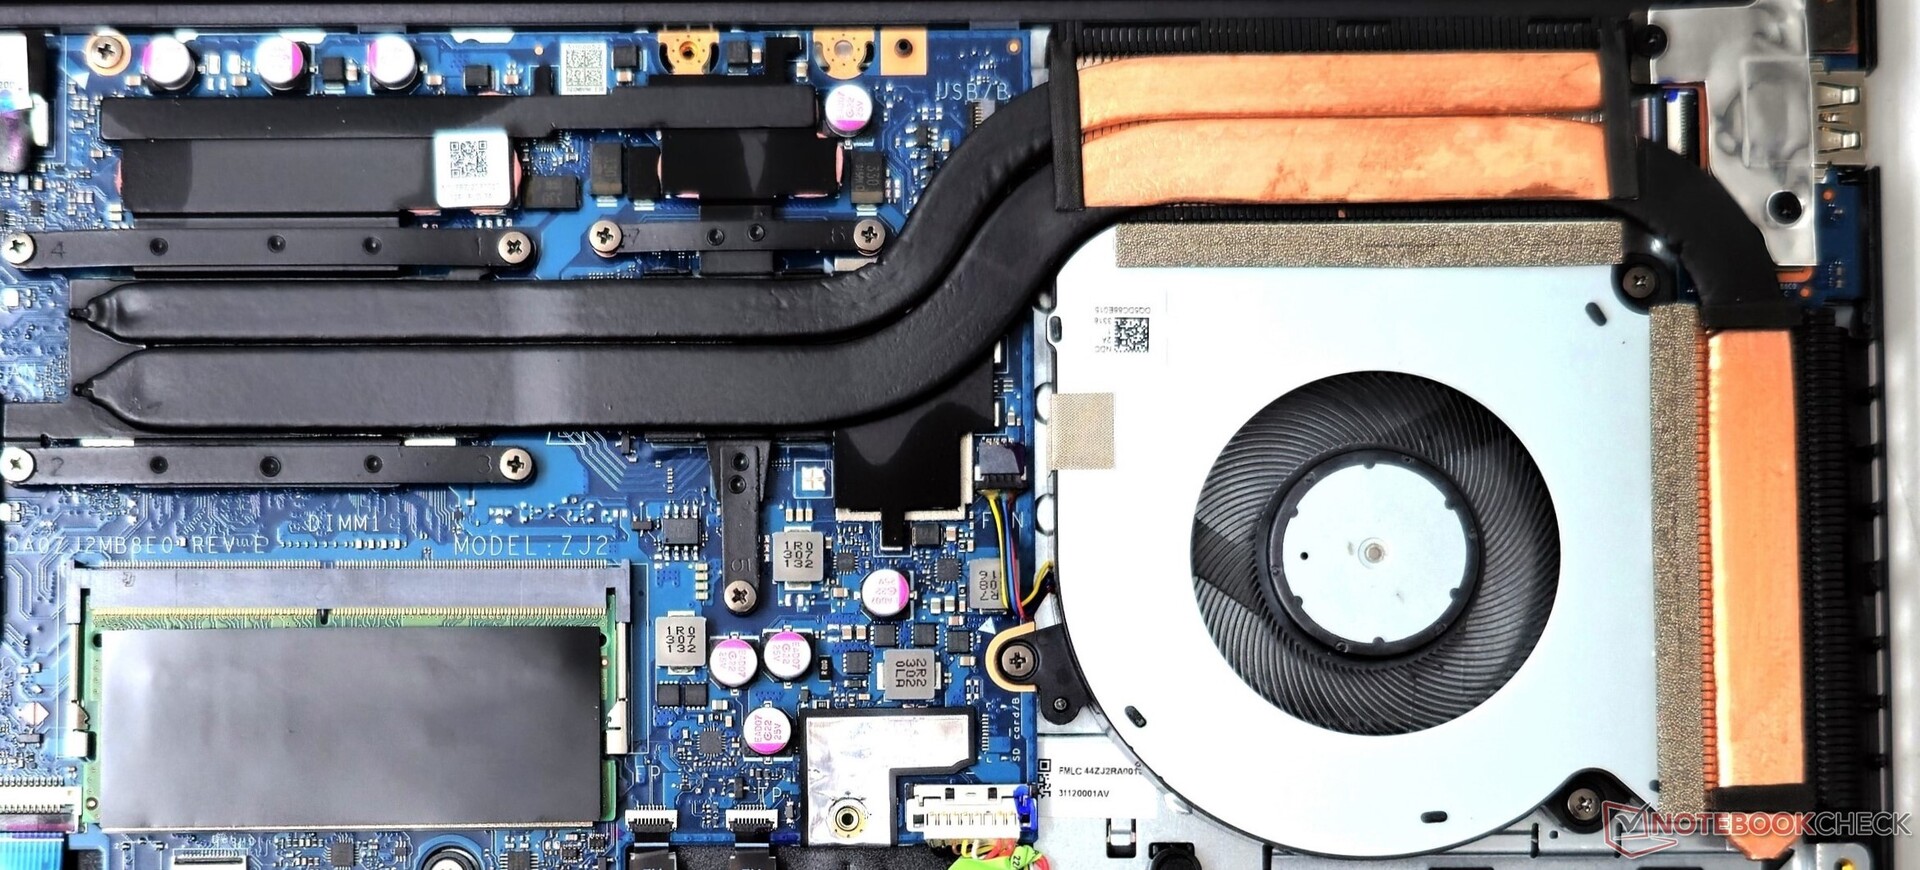
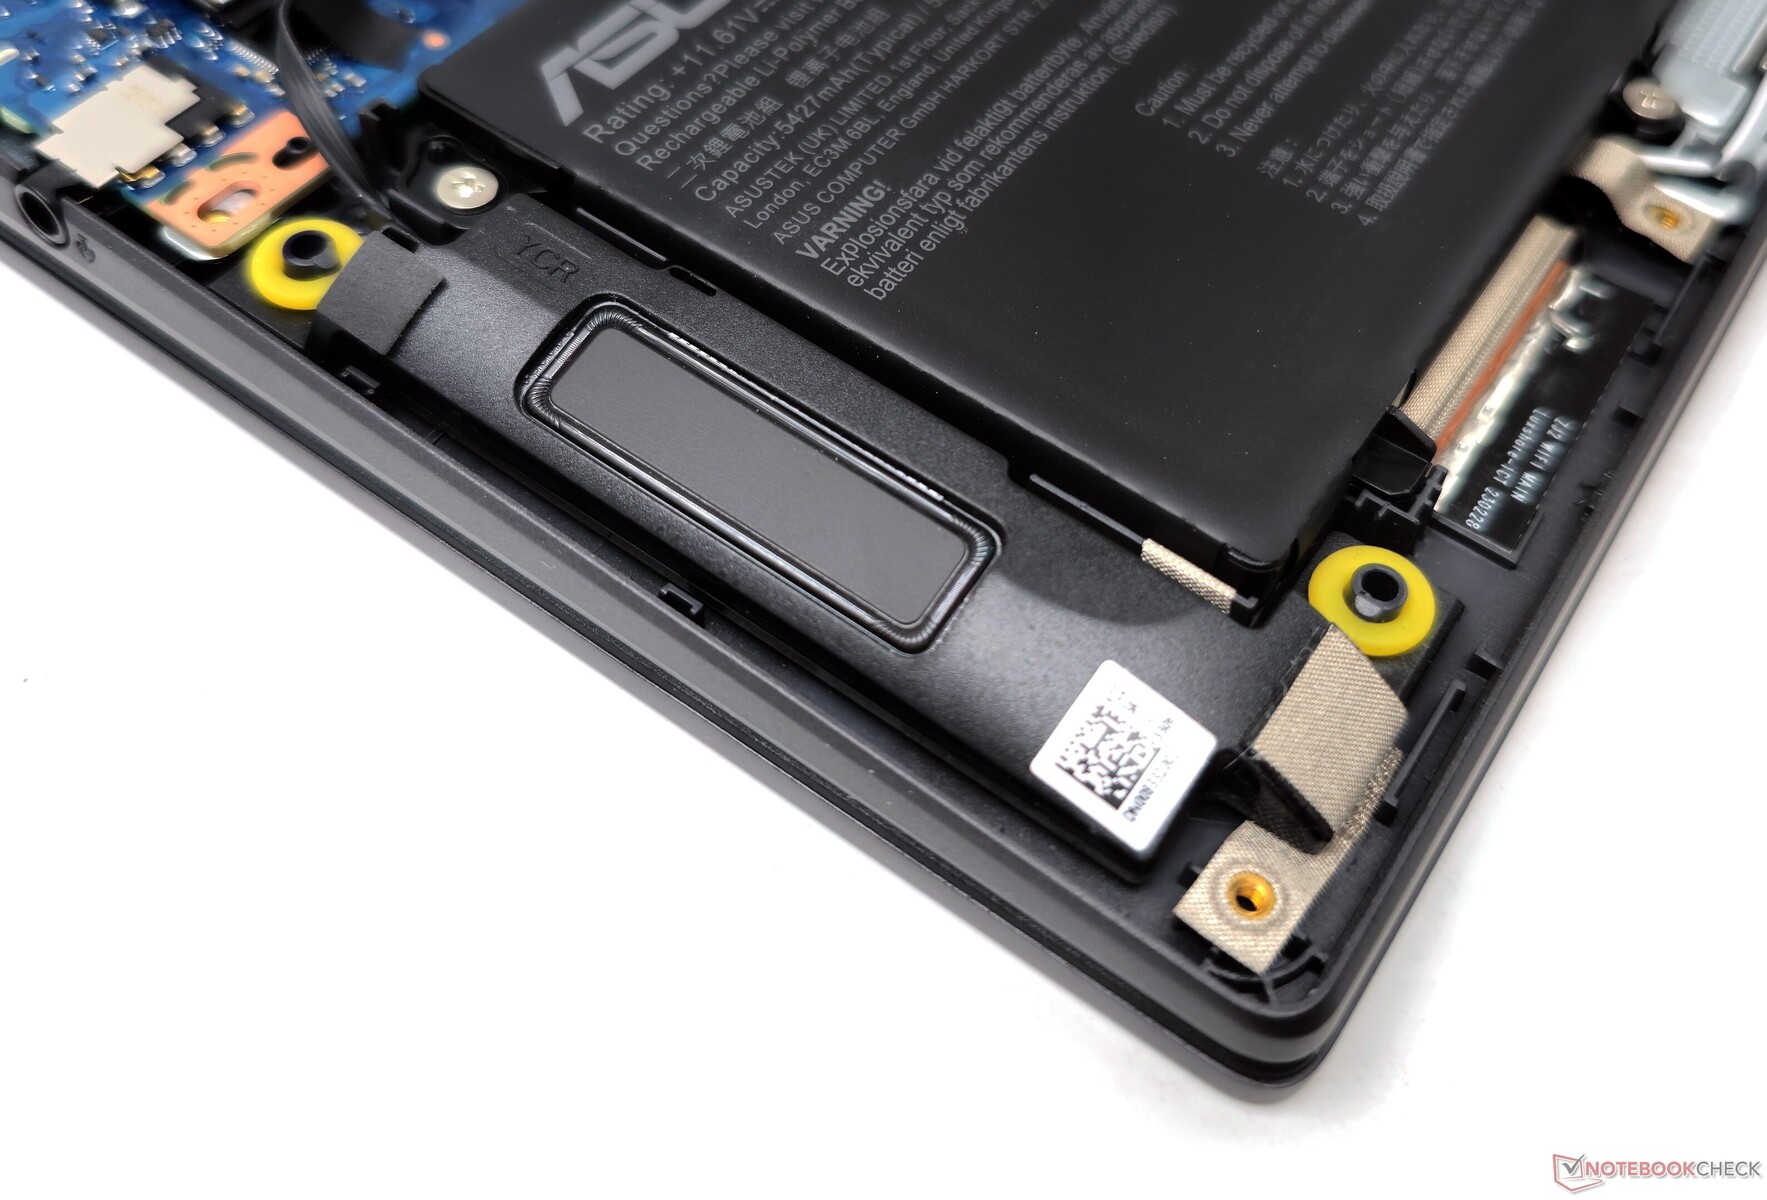
Underhåll
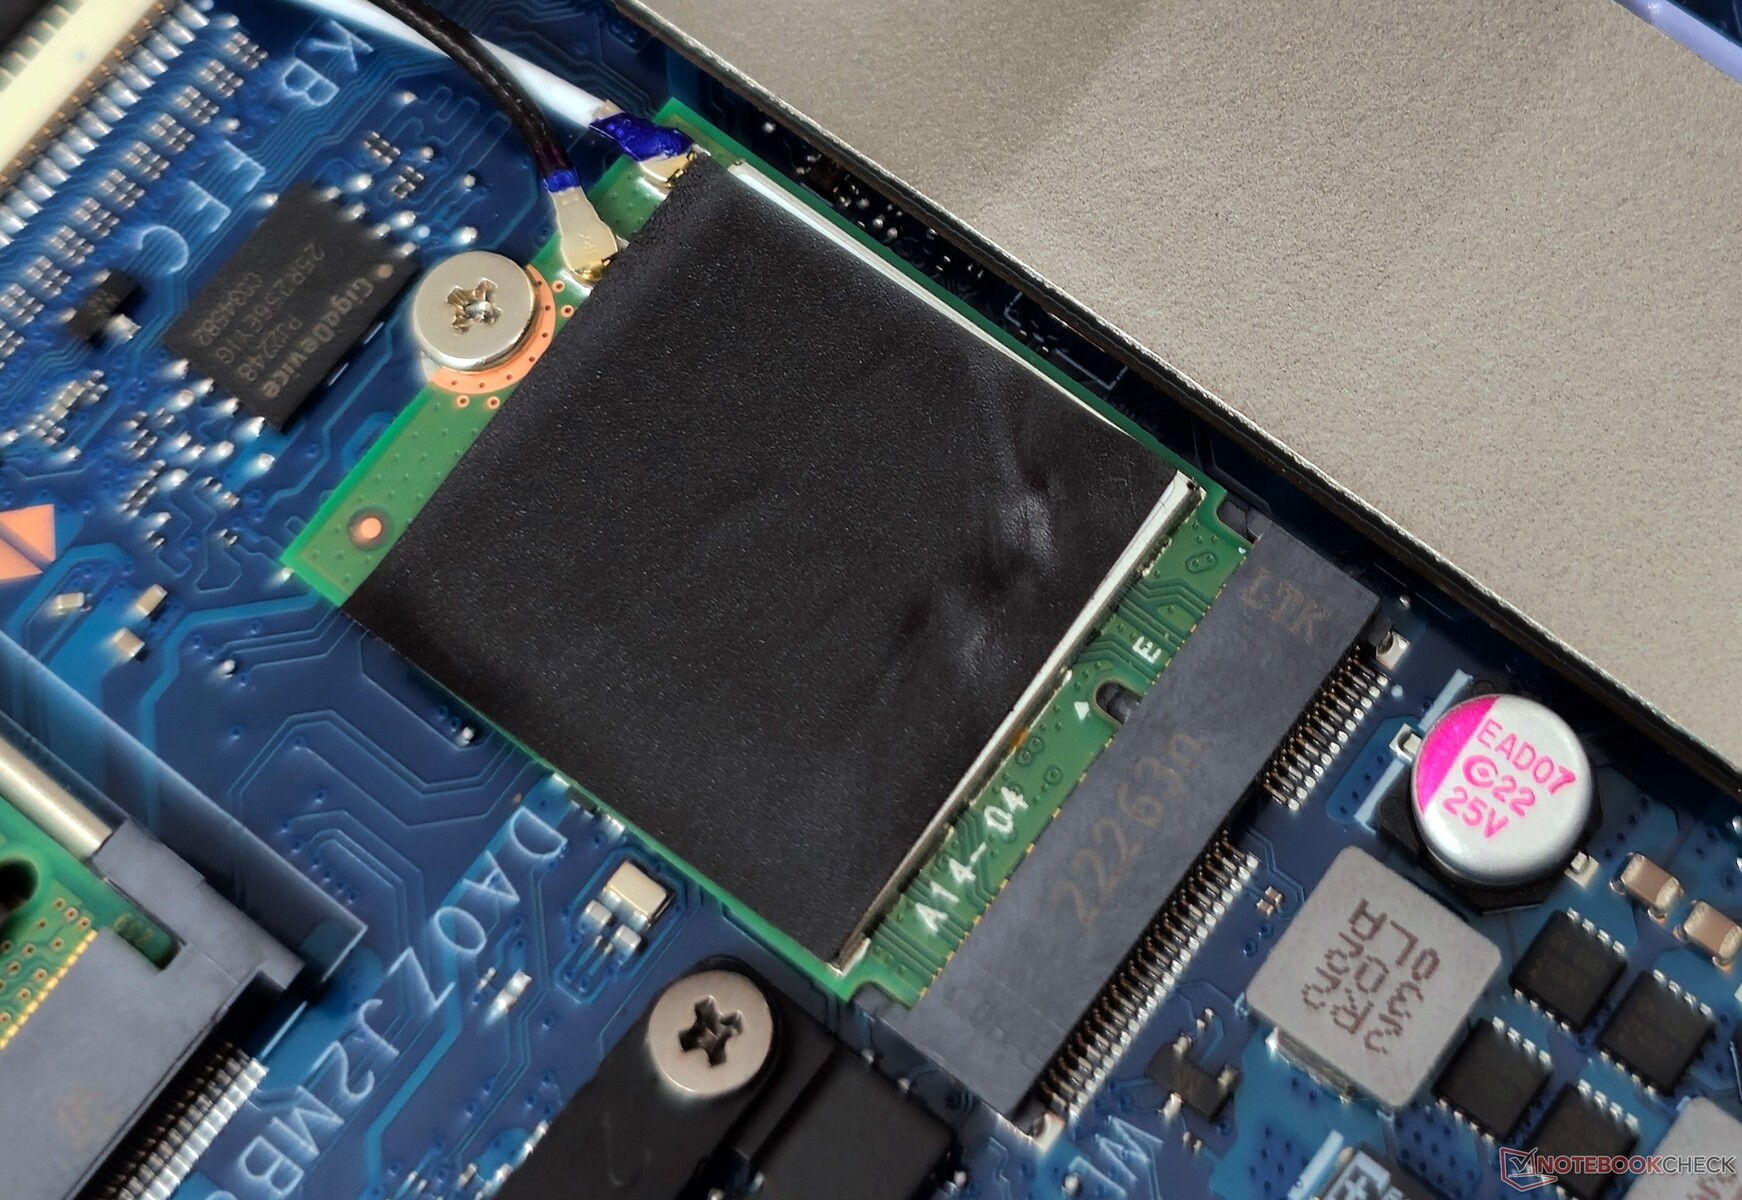
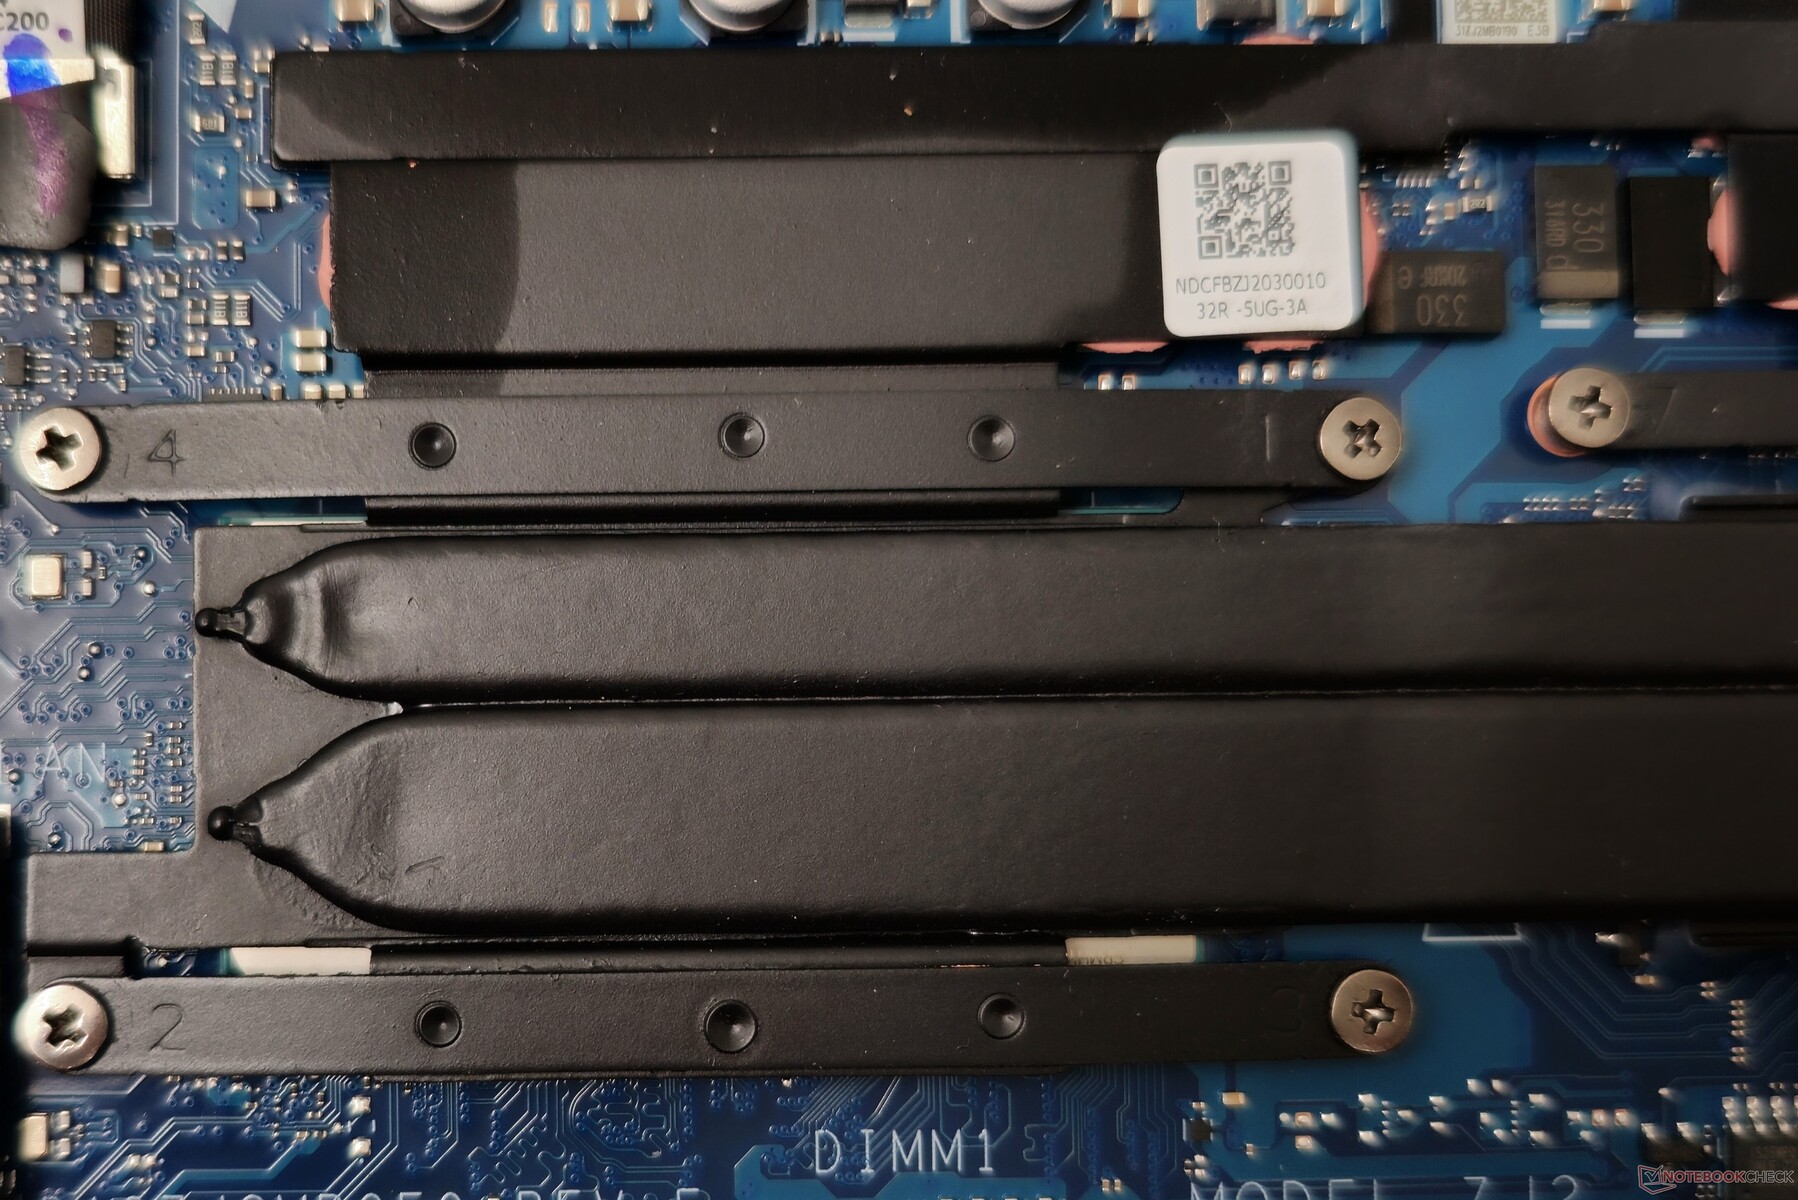
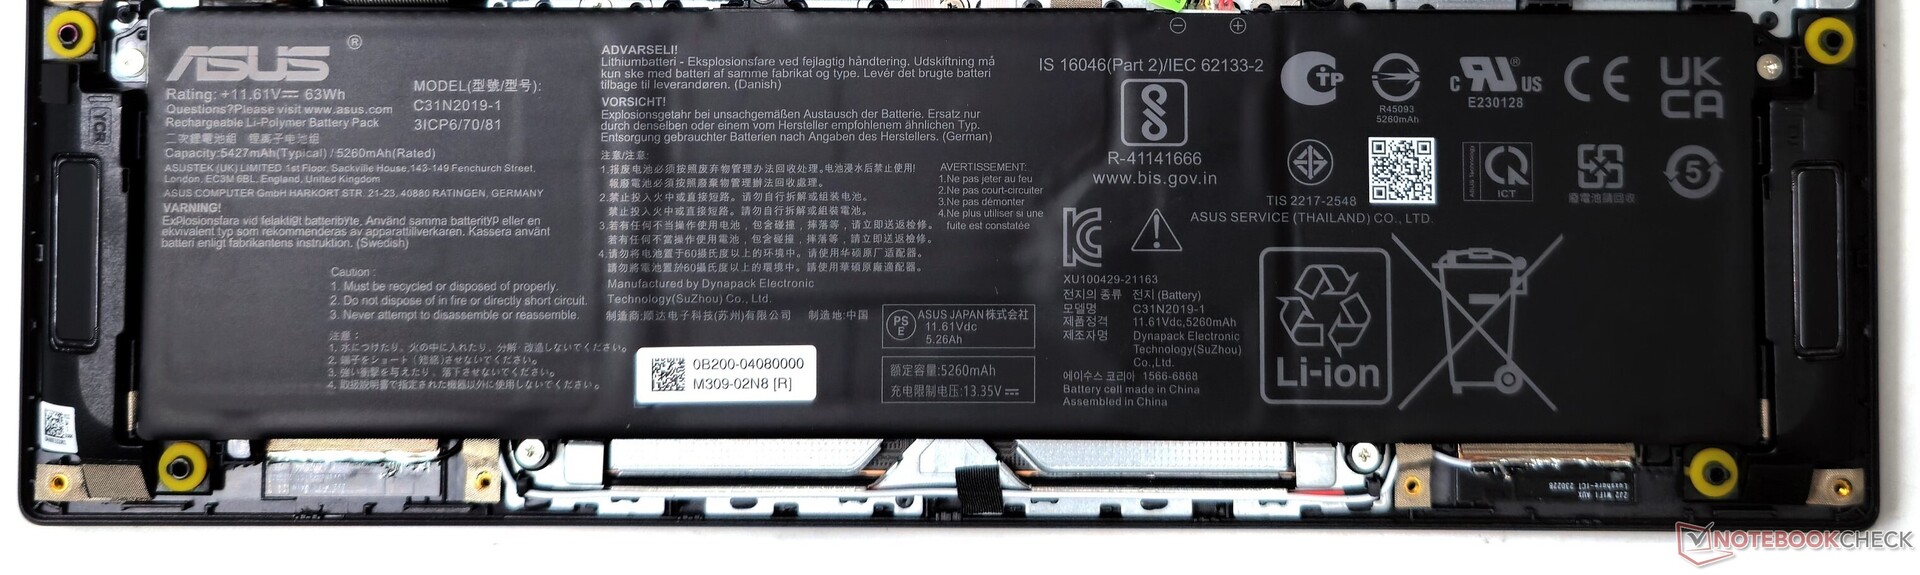
För att komma åt insidan måste du ta bort sju PH0-skruvar från bakpanelen. Väl på insidan kan du enkelt byta ut WLAN-kortet och NVMe SSD.
Det är värt att notera att 8 GB RAM-minne är fastlödd på moderkortet, vilket innebär att du bara kan uppgradera en SO-DIMM-kortplats. Batteriet kan skruvas loss och bytas ut vid behov.
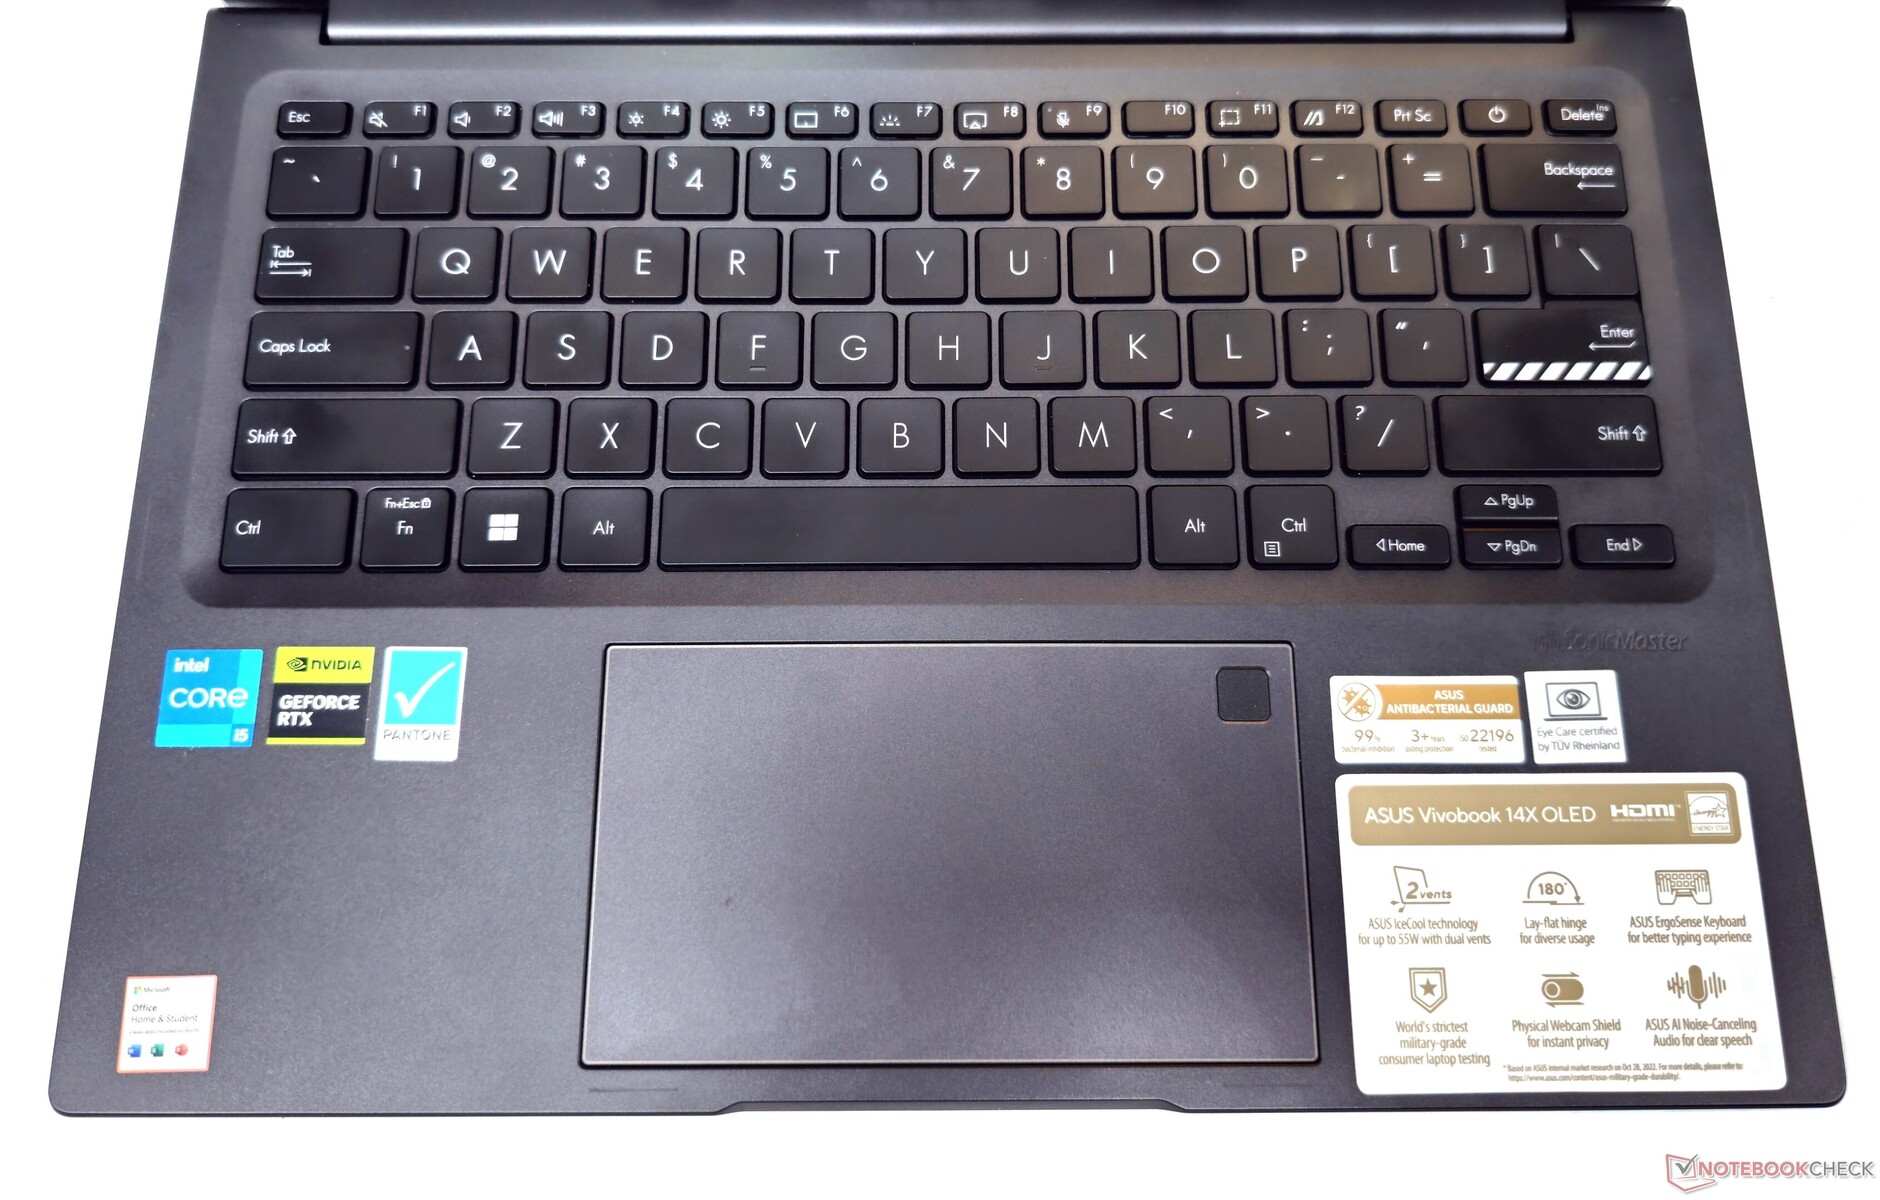
Inmatningsenheter: Bra tangentbord och pekplatta
Tangentbord
VivoBook 14X är utrustad med vad Asus kallar ett ErgoSense-tangentbord, som erbjuder en 1,4 mm tangentförflyttning. Att skriva på det här tangentbordet är en bekväm upplevelse tack vare de skålade tangentknapparna och de välplacerade tangenterna.
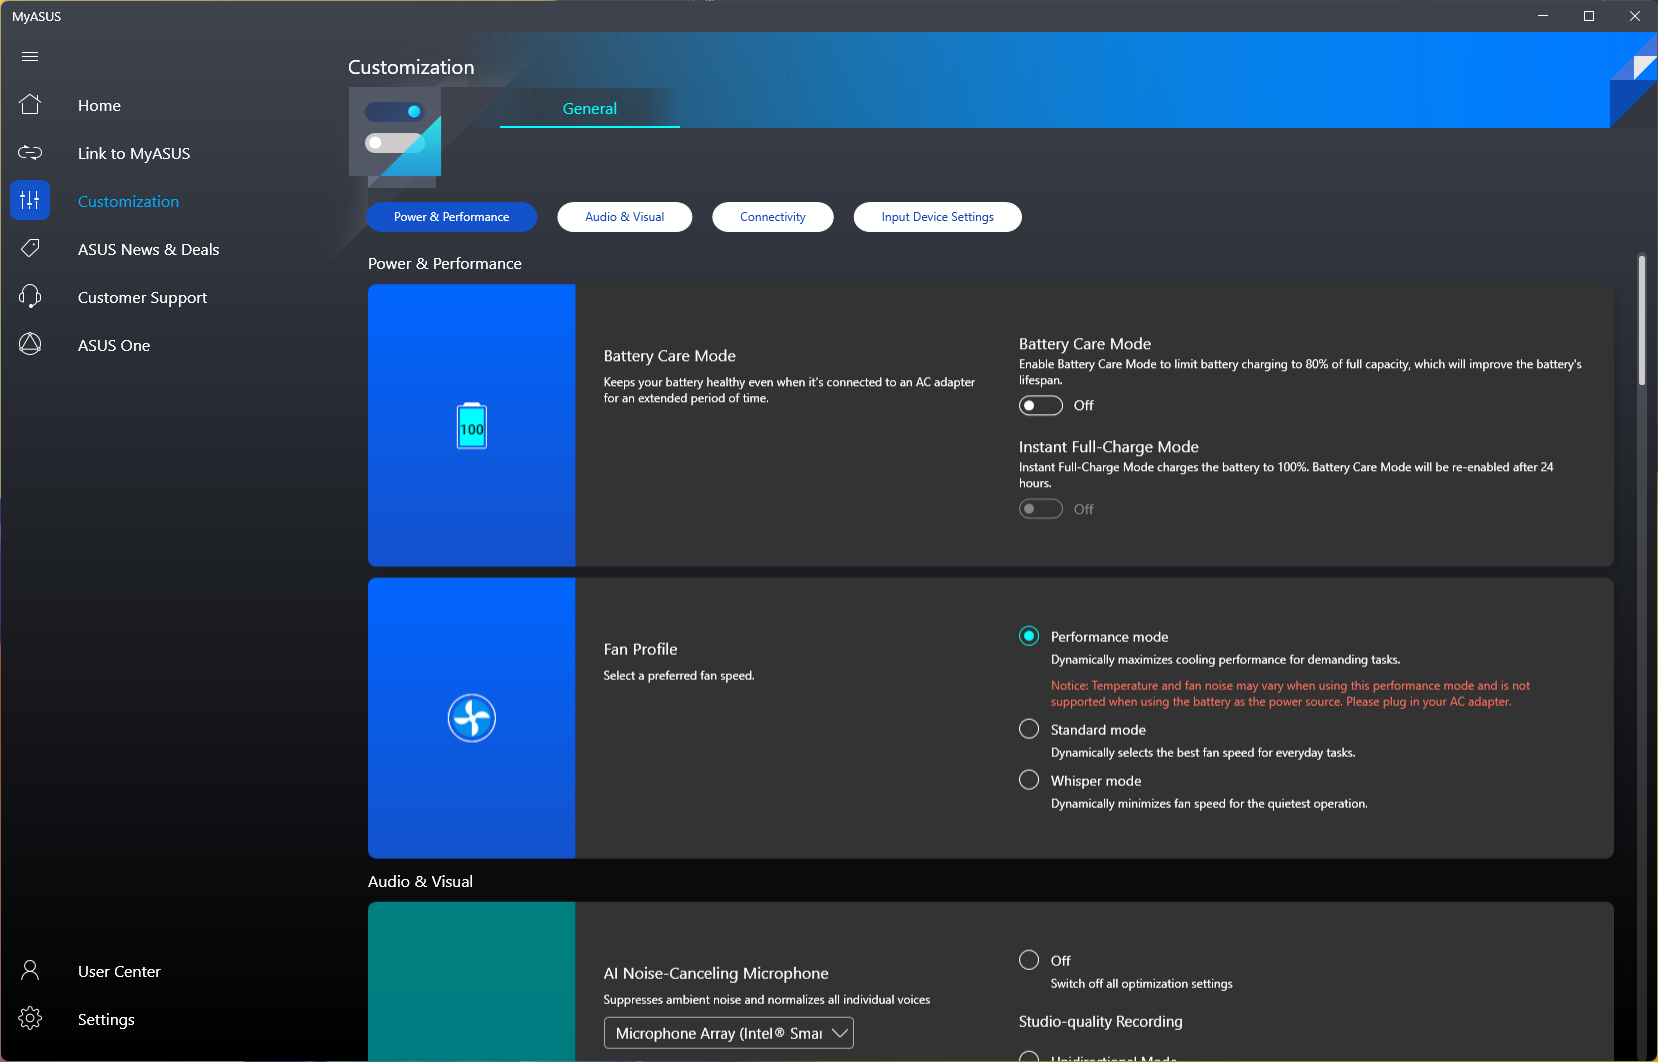
Den övre raden innehåller både F1-F12-tangenter och specialtangenter, vars primära funktioner kan konfigureras med MyAsus-appen. Piltangenterna kan kännas något trånga, men det är typiskt för en bärbar dator i den här formfaktorn. Bakgrundsbelysningen i tre steg ger hyfsad läsbarhet i mörka miljöer.
Pekplatta
VivoBook 14X:s pekplatta mäter 7,5 cm x 13 cm, vilket ger gott om utrymme för navigering, och den ger en smidig glidupplevelse.
Hela ytan fungerar som vänster musknapp, och klickningarna är responsiva och relativt tysta.
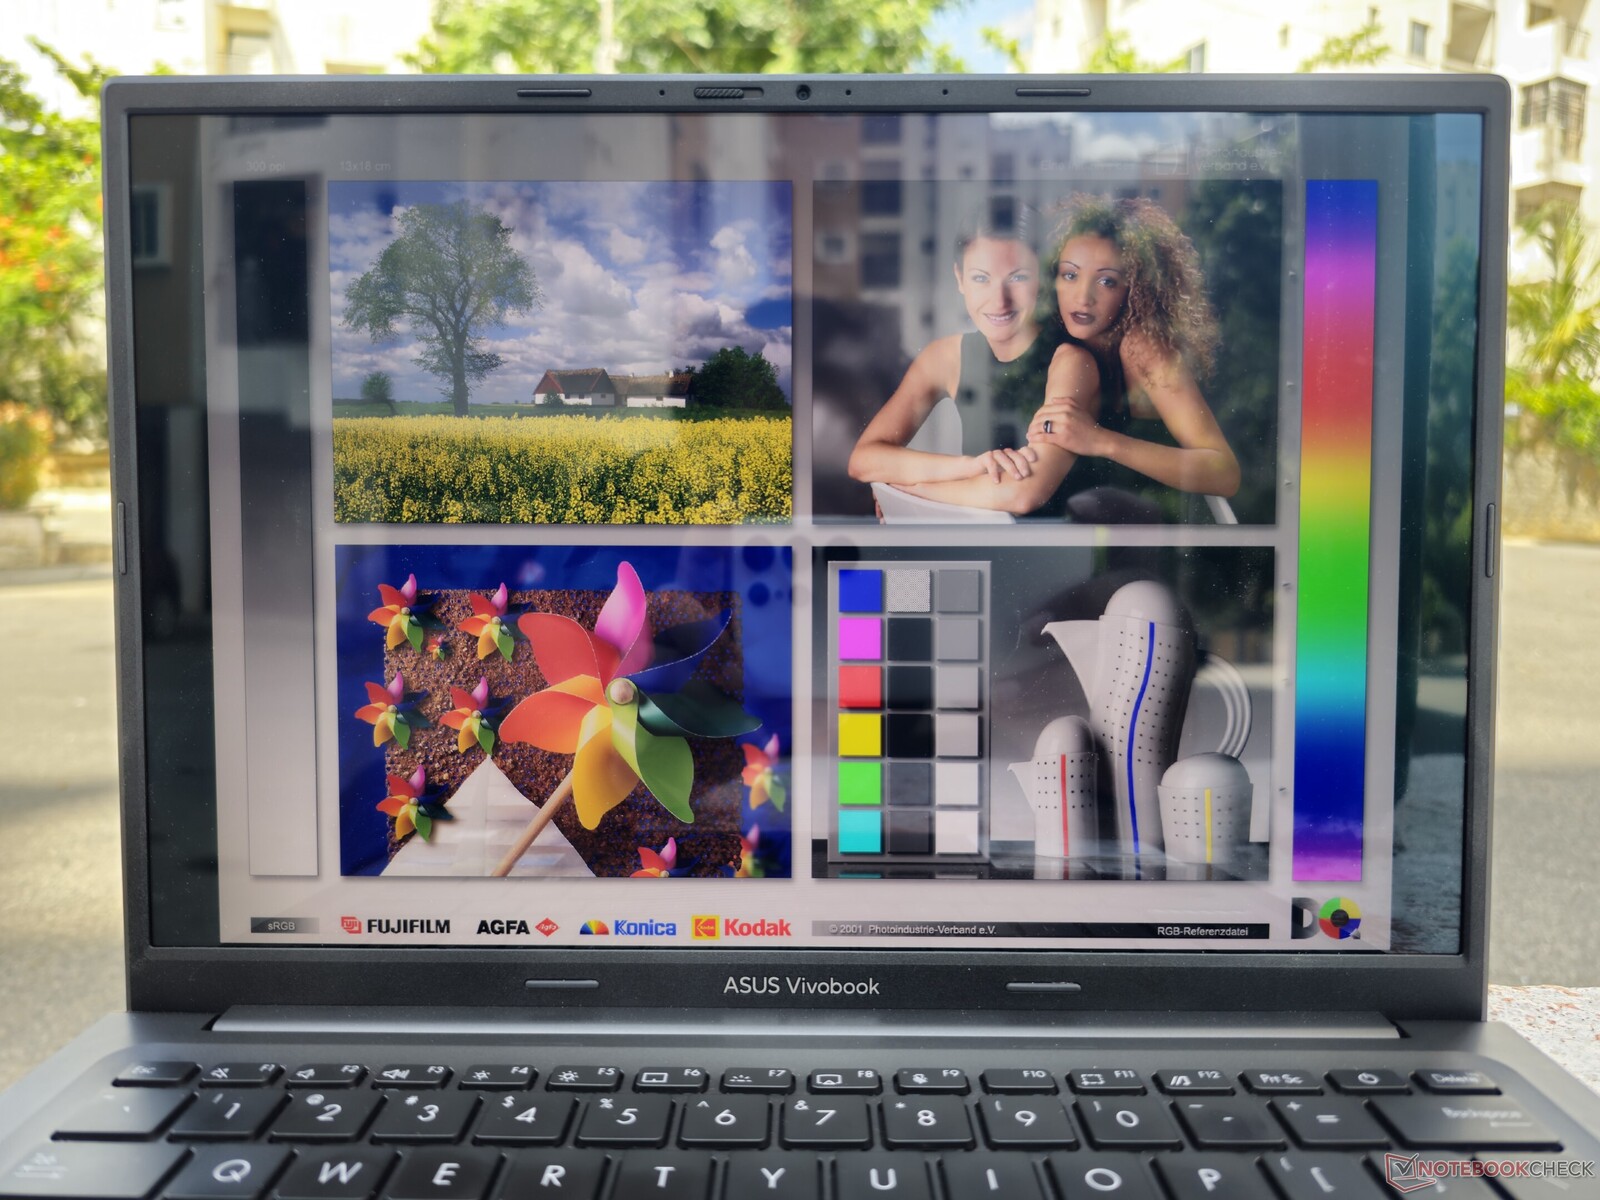
Display: 2,8K OLED med HDR och 90 Hz PWM
Den 2880 x 1800 16:10 90 Hz Samsung OLED-panelen i VivoBook 14X erbjuder en bra ljusfördelning och ett i princip oändligt kontrastförhållande.
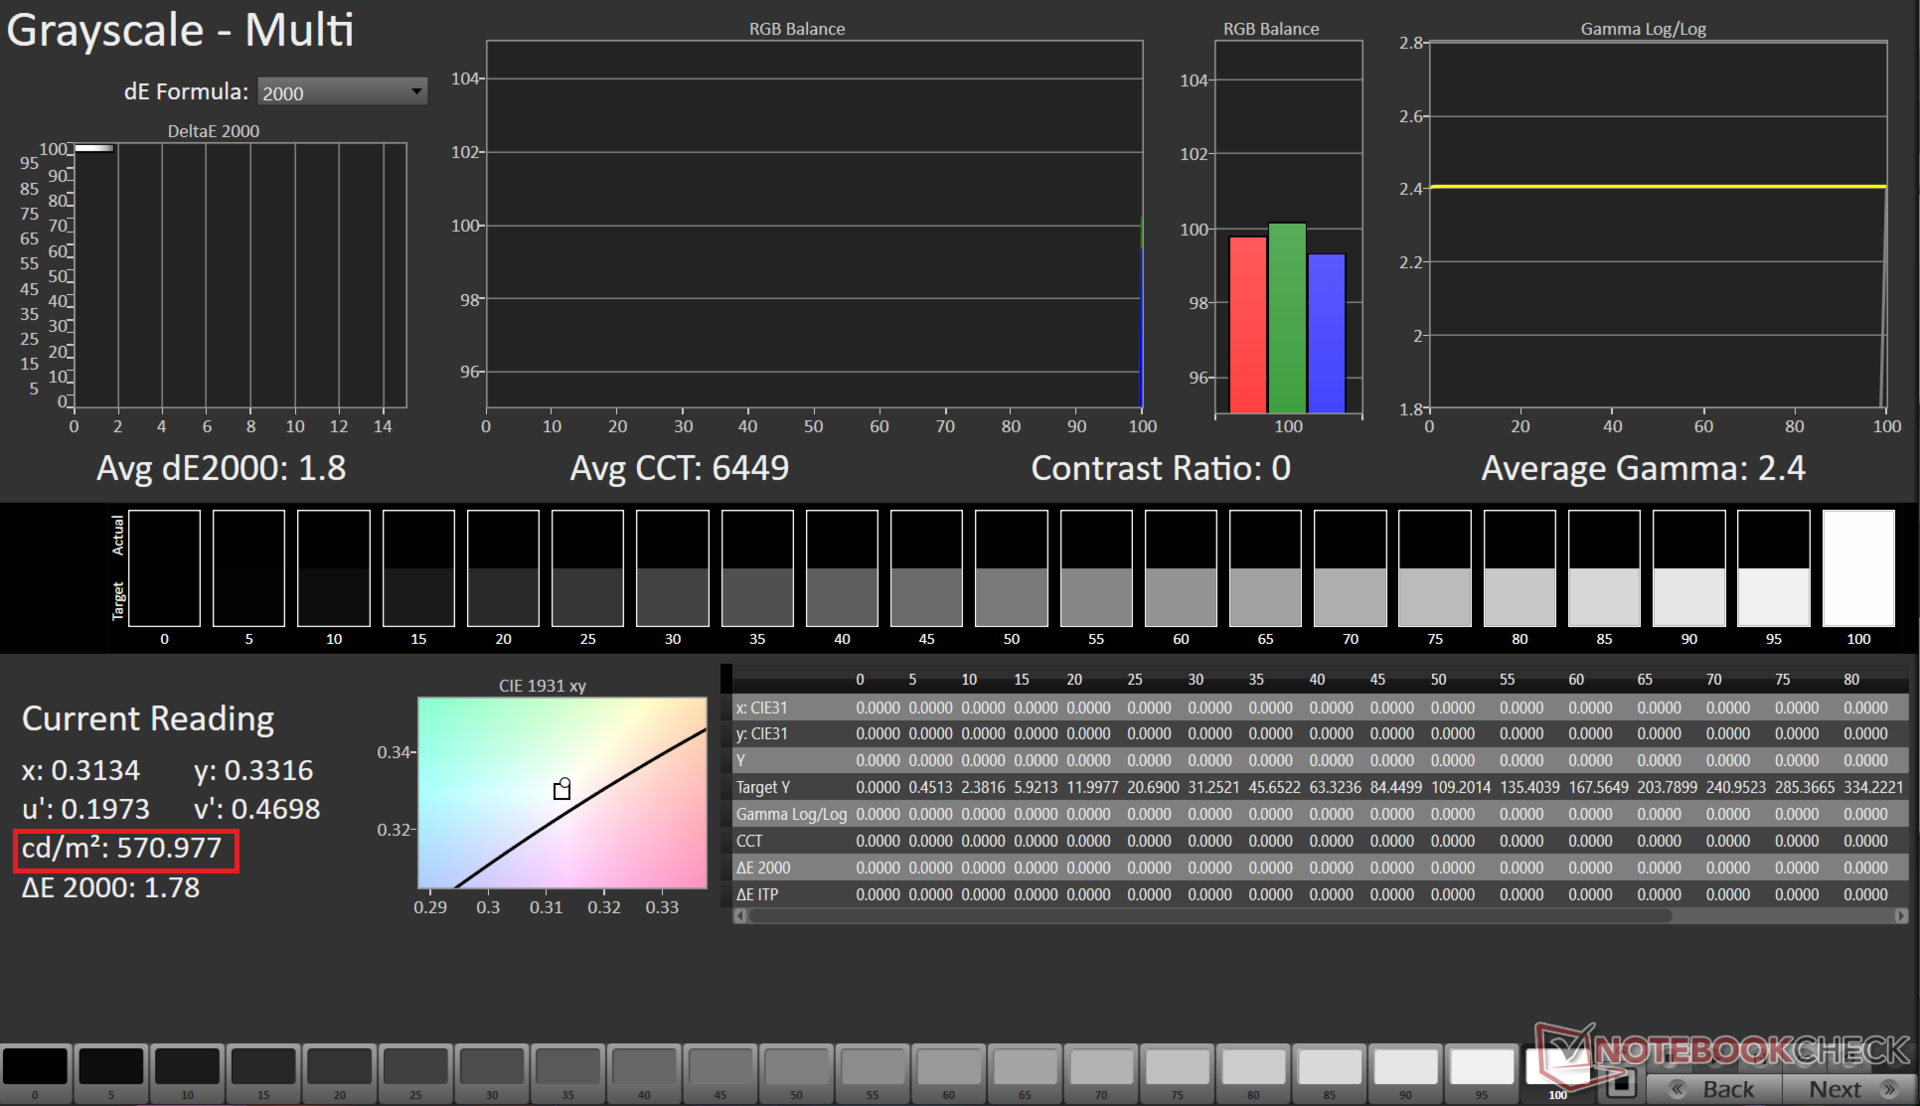
Vi uppmätte en maximal ljusstyrka på 373 nits i SDR-läge. Skärmen är certifierad för VESA DisplayHDR True Black 600, och vi kunde mäta upp till 571 nits när vi spelade upp HDR-innehåll. Det finns ingen bakgrundsbelysning som blöder med tanke på att detta är en OLED-skärm.
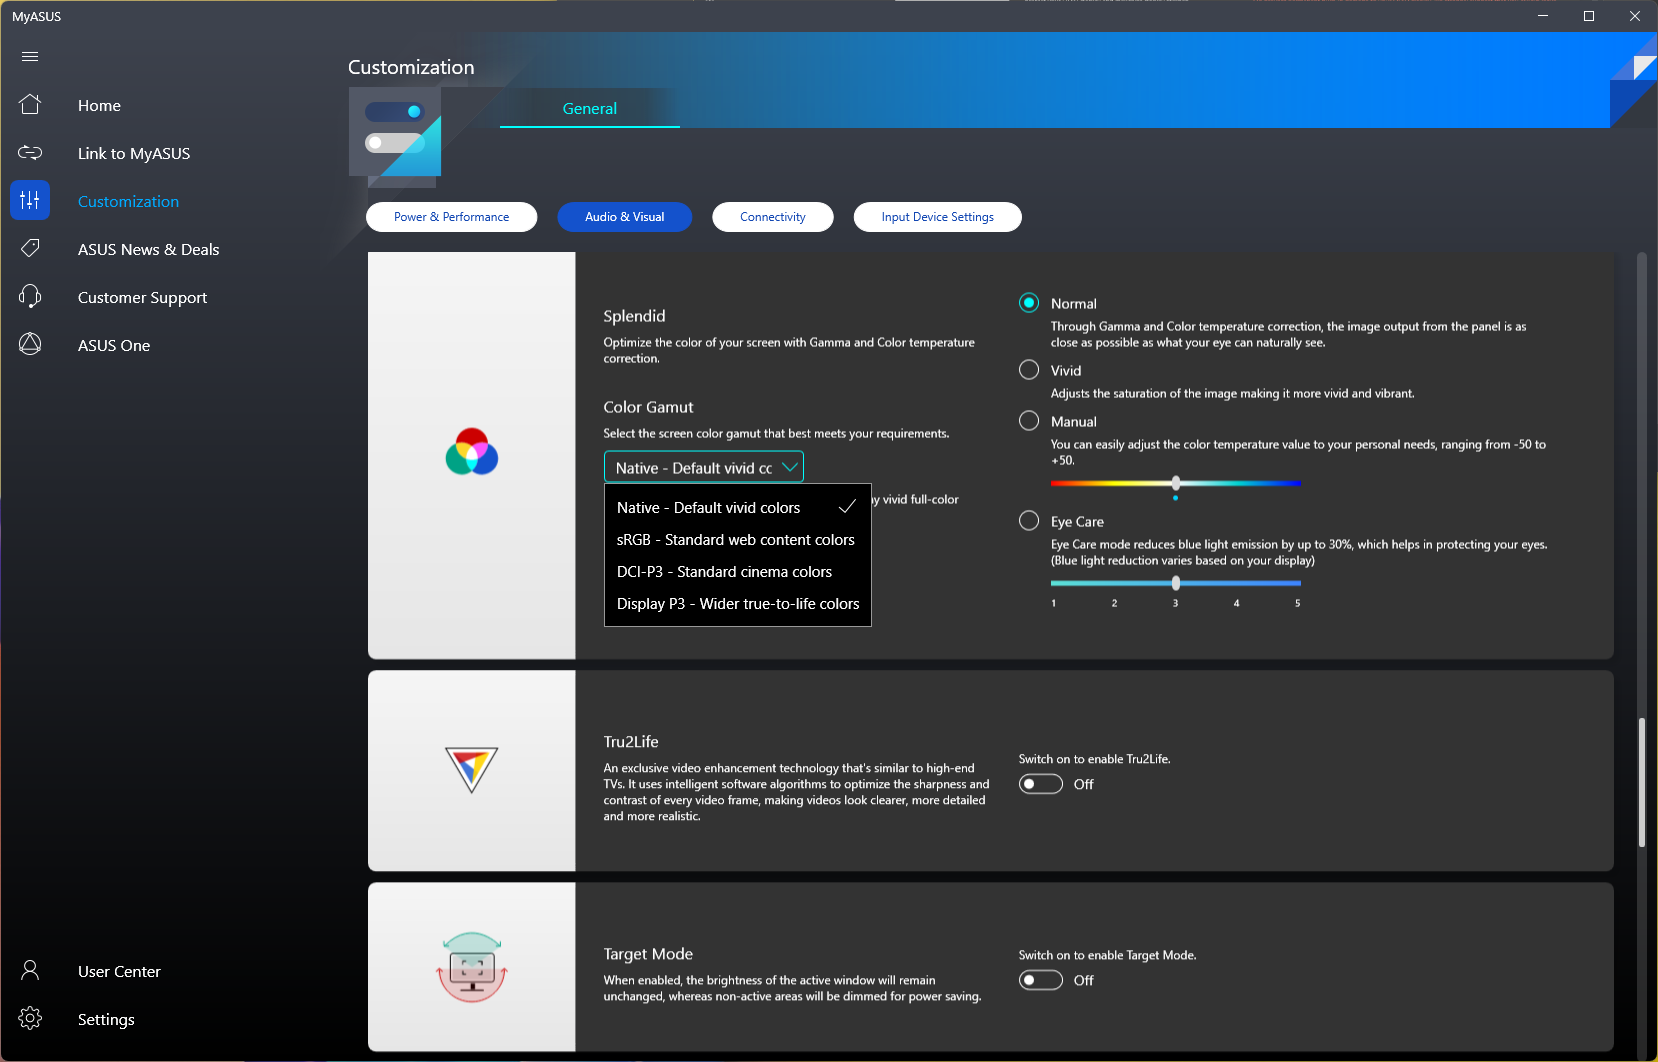
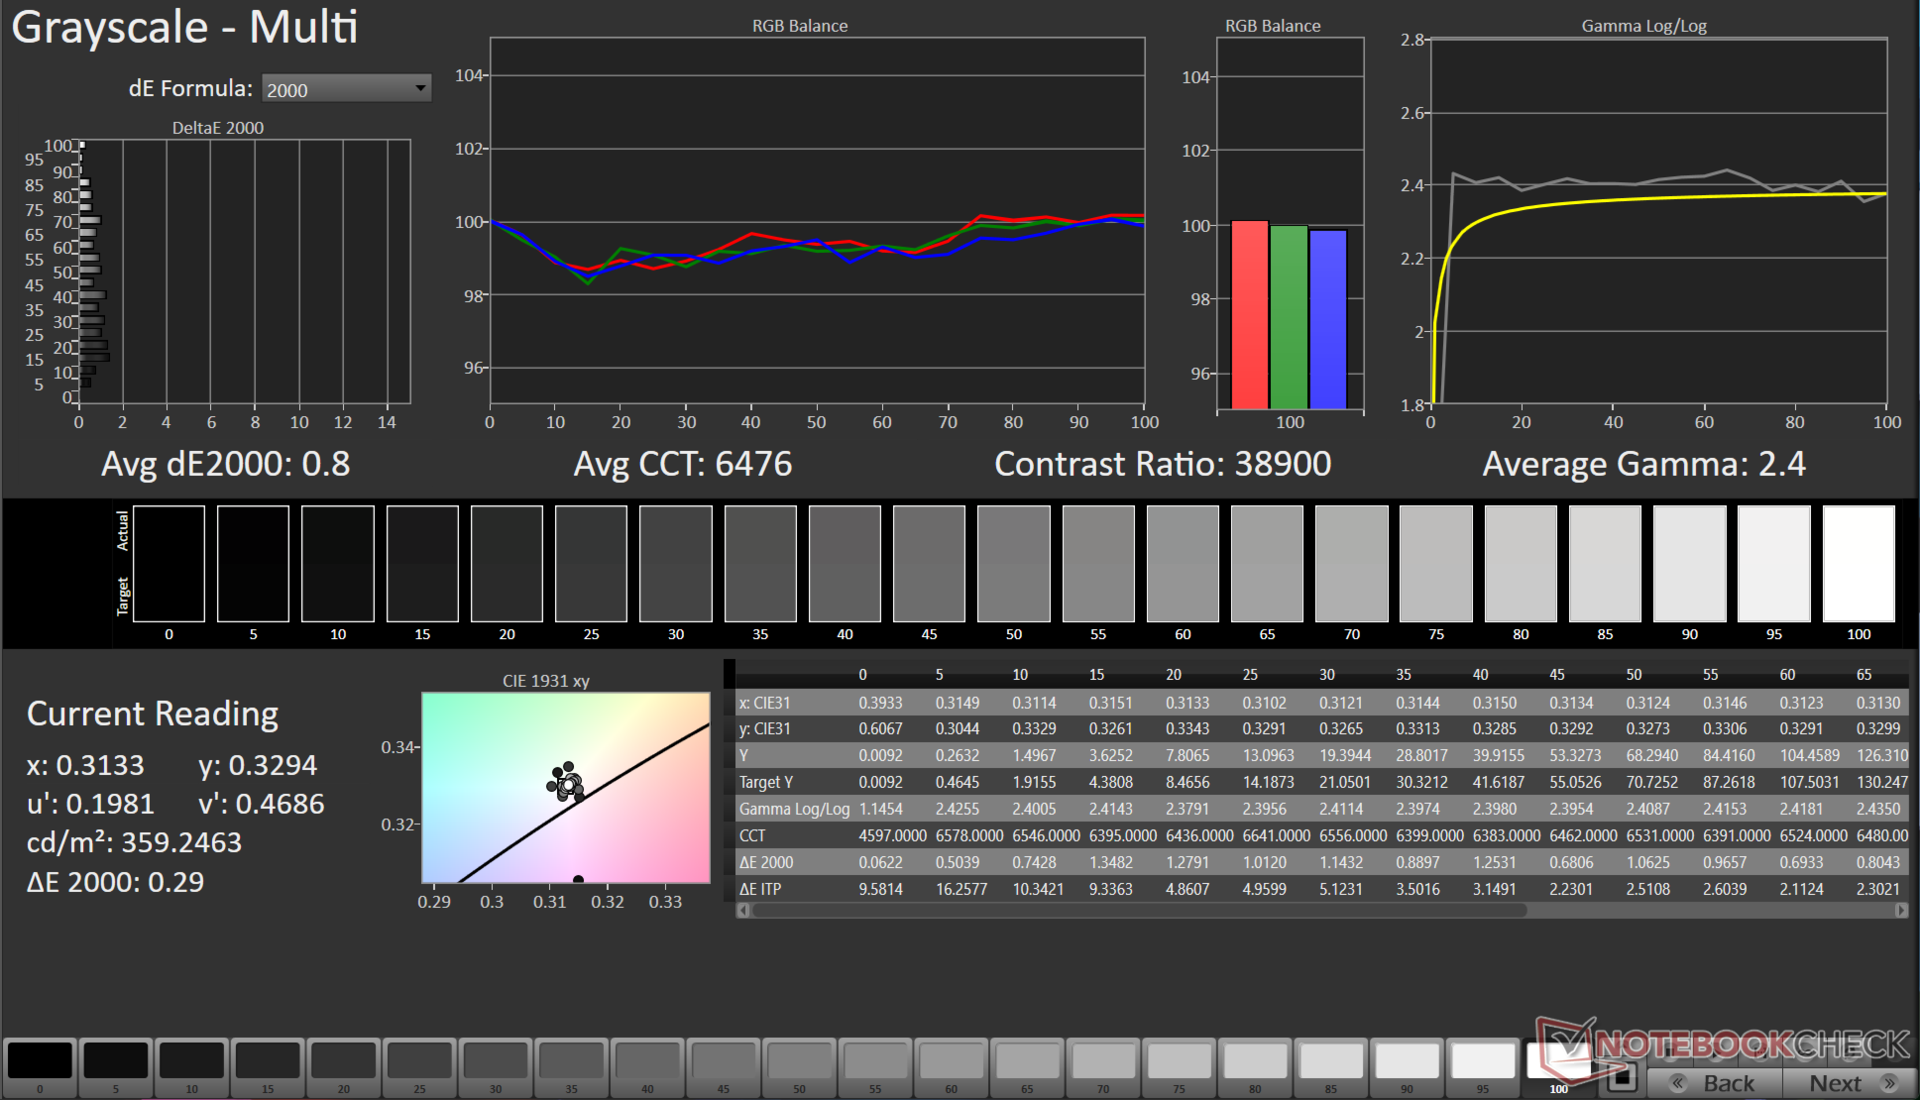
MyAsus-appen erbjuder flera skärmalternativ. Vi utförde alla tester med det fabriksinställda Normal-läget med en Native-färgskala.

| |||||||||||||||||||||||||
Distribution av ljusstyrkan: 85 %
Mitt på batteriet: 367 cd/m²
Kontrast: ∞:1 (Svärta: 0 cd/m²)
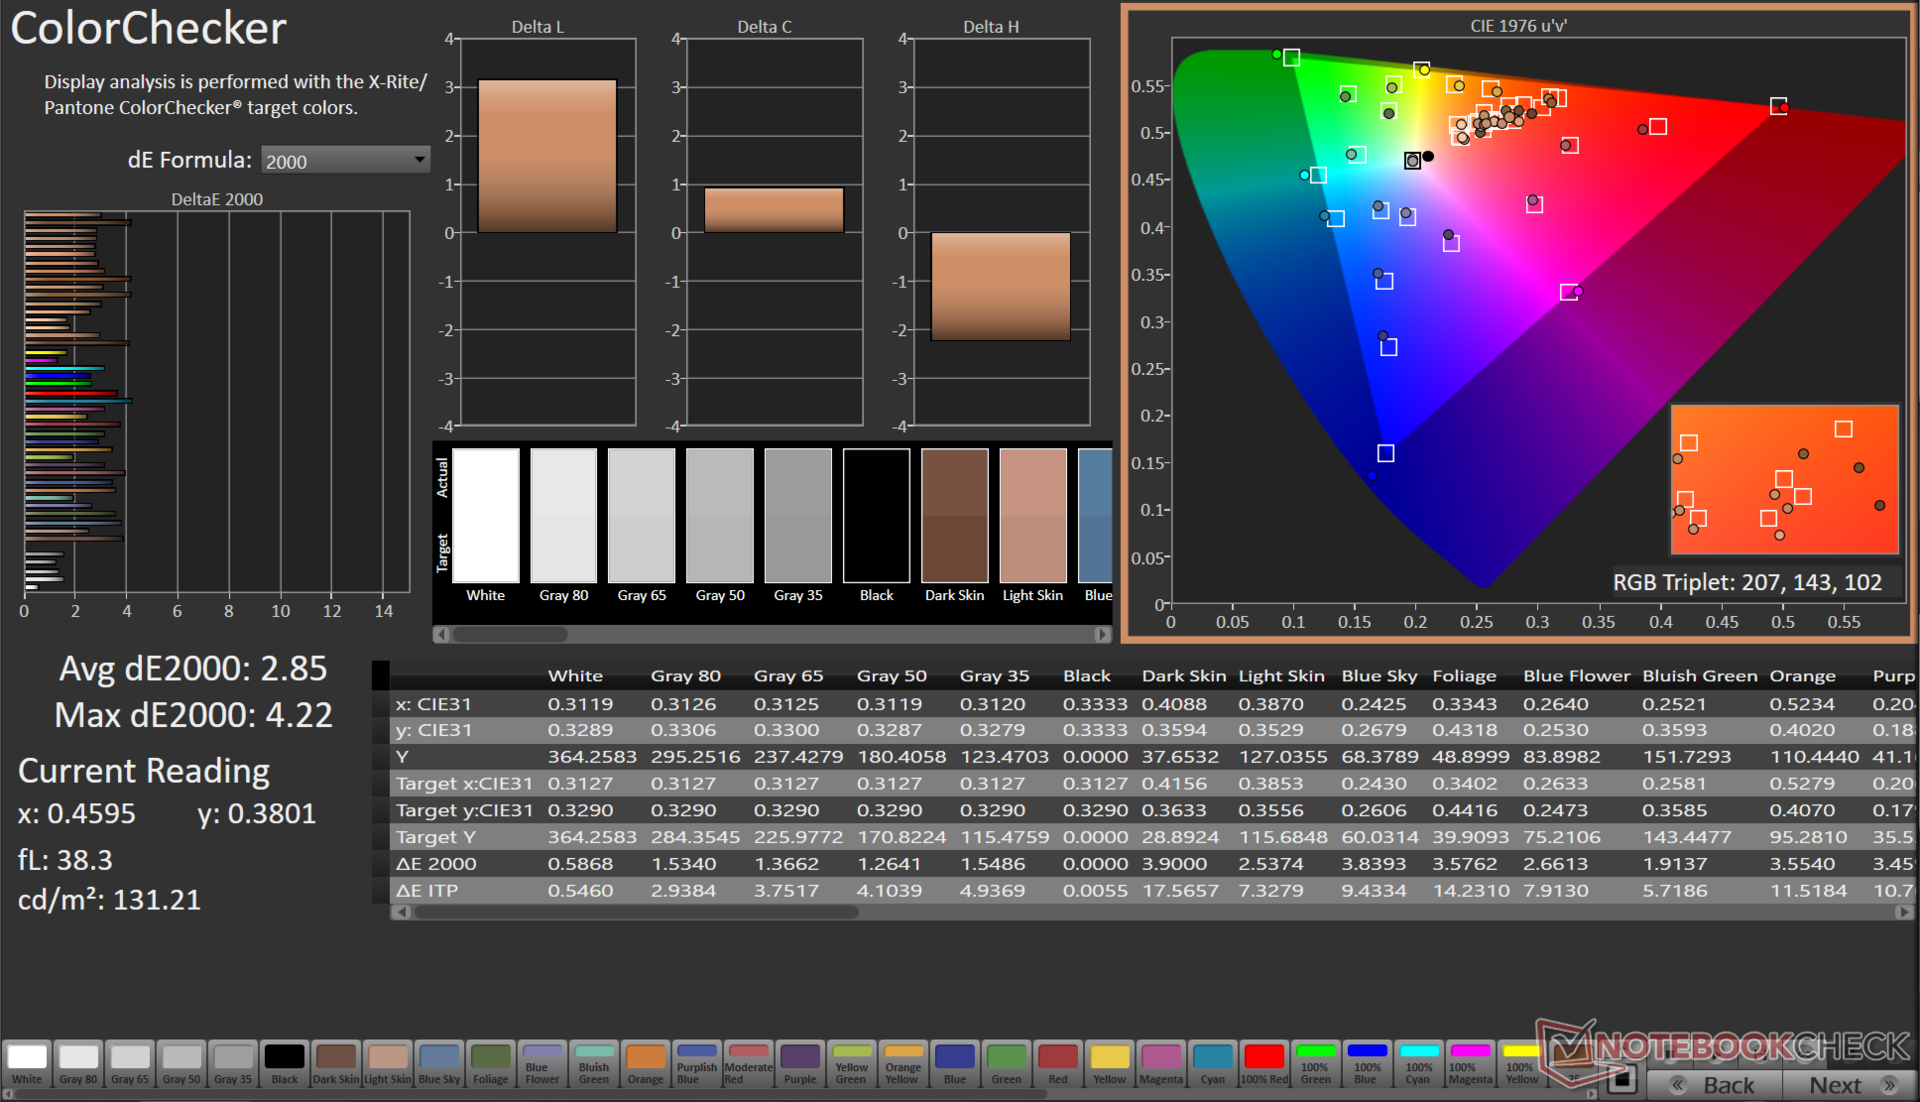
ΔE ColorChecker Calman: 2.85 | ∀{0.5-29.43 Ø4.73}
calibrated: 2.18
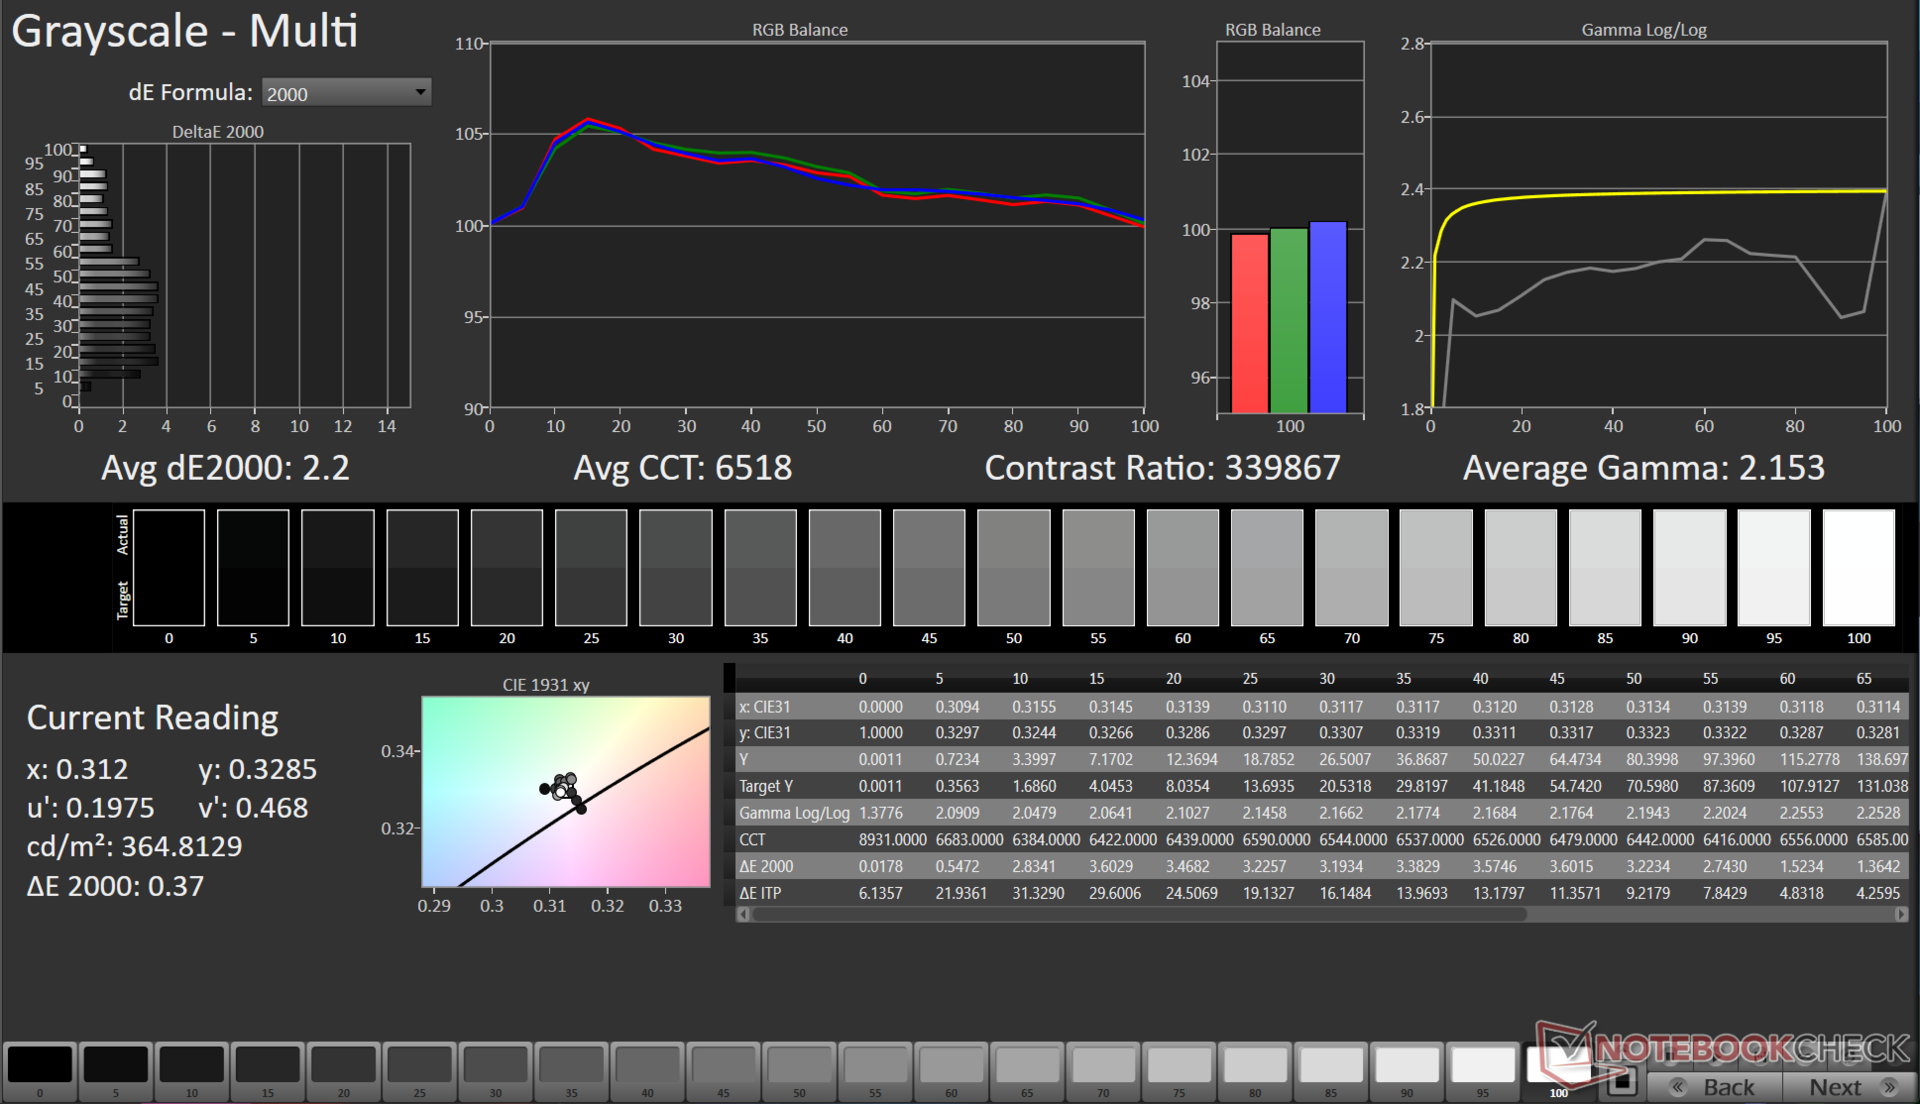
ΔE Greyscale Calman: 2.2 | ∀{0.09-98 Ø4.97}
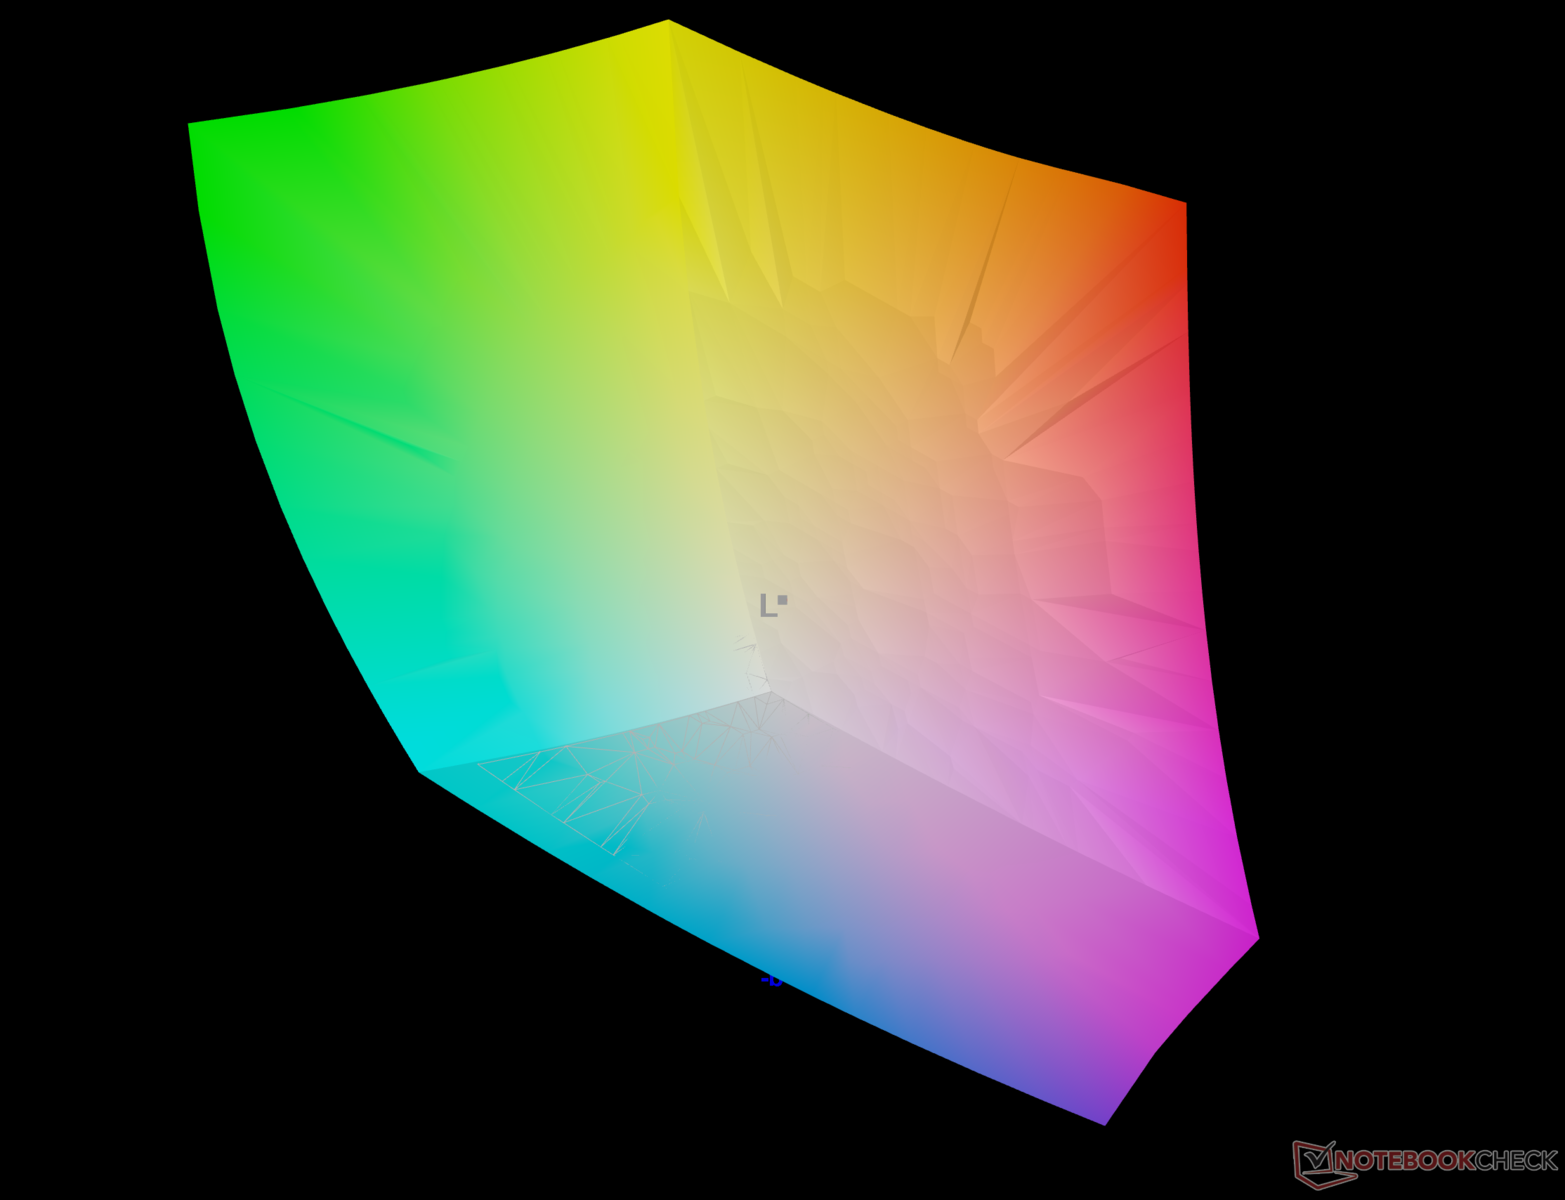
96.5% AdobeRGB 1998 (Argyll 3D)
100% sRGB (Argyll 3D)
99.9% Display P3 (Argyll 3D)
Gamma: 2.15
CCT: 6518 K
| Asus VivoBook 14X K3405 Samsung ATNA40YK07-1, , 2880x1800, 14" | Acer Swift X SFX14-71G ATNA45AF03-0, OLED, 2880x1800, 14.5" | MSI Stealth 14 Studio A13V B140QAN06.T, IPS, 2560x1600, 14" | Gigabyte Aero 14 OLED BMF Samsung SDC4192 (ATNA40YK14-0), OLED, 2880x1800, 14" | Lenovo Slim Pro 7 14ARP8 LEN89C1, IPS, 2560x1600, 14.5" | Schenker Vision 14 2022 RTX 3050 Ti MNE007ZA1-1, IPS, 2880x1800, 14" | |
|---|---|---|---|---|---|---|
| Display | 0% | -5% | -3% | -17% | -17% | |
| Display P3 Coverage (%) | 99.9 | 99.9 0% | 96.2 -4% | 99.8 0% | 72.9 -27% | 74.1 -26% |
| sRGB Coverage (%) | 100 | 99.9 0% | 99.6 0% | 100 0% | 98.2 -2% | 97.4 -3% |
| AdobeRGB 1998 Coverage (%) | 96.5 | 96.2 0% | 85.3 -12% | 88.7 -8% | 74.6 -23% | 75.3 -22% |
| Response Times | 81% | -159% | -13% | -1350% | -1320% | |
| Response Time Grey 50% / Grey 80% * (ms) | 1.15 ? | 0.4 ? 65% | 5.5 ? -378% | 2.4 ? -109% | 31.8 ? -2665% | 31.5 ? -2639% |
| Response Time Black / White * (ms) | 14.4 ? | 0.6 ? 96% | 5.8 ? 60% | 2.4 ? 83% | 19.3 ? -34% | 14.5 ? -1% |
| PWM Frequency (Hz) | 90.02 ? | 240 ? | 300 | |||
| Screen | 15% | 3% | 45% | -16% | -14% | |
| Brightness middle (cd/m²) | 369 | 388 5% | 419 14% | 423 15% | 344.7 -7% | 421 14% |
| Brightness (cd/m²) | 364 | 390 7% | 402 10% | 427 17% | 334 -8% | 416 14% |
| Brightness Distribution (%) | 85 | 98 15% | 89 5% | 98 15% | 92 8% | 89 5% |
| Black Level * (cd/m²) | 0.43 | 0.1 | 0.31 | 0.28 | ||
| Colorchecker dE 2000 * | 2.85 | 2.2 23% | 2.3 19% | 0.55 81% | 3.01 -6% | 3.2 -12% |
| Colorchecker dE 2000 max. * | 4.22 | 3.9 8% | 5.8 -37% | 1.15 73% | 6.3 -49% | 5.5 -30% |
| Colorchecker dE 2000 calibrated * | 2.18 | 1.9 13% | 0.9 59% | 1.15 47% | 0.83 62% | 2 8% |
| Greyscale dE 2000 * | 2.2 | 1.4 36% | 3.3 -50% | 0.69 69% | 4.6 -109% | 4.4 -100% |
| Gamma | 2.15 102% | 2.22 99% | 2.14 103% | 2.42 91% | 2.28 96% | 2.22 99% |
| CCT | 6518 100% | 6380 102% | 6550 99% | 6479 100% | 6420 101% | 6384 102% |
| Contrast (:1) | 974 | 4230 | 1112 | 1504 | ||
| Totalt genomsnitt (program/inställningar) | 32% /
22% | -54% /
-26% | 10% /
24% | -461% /
-238% | -450% /
-233% |
* ... mindre är bättre
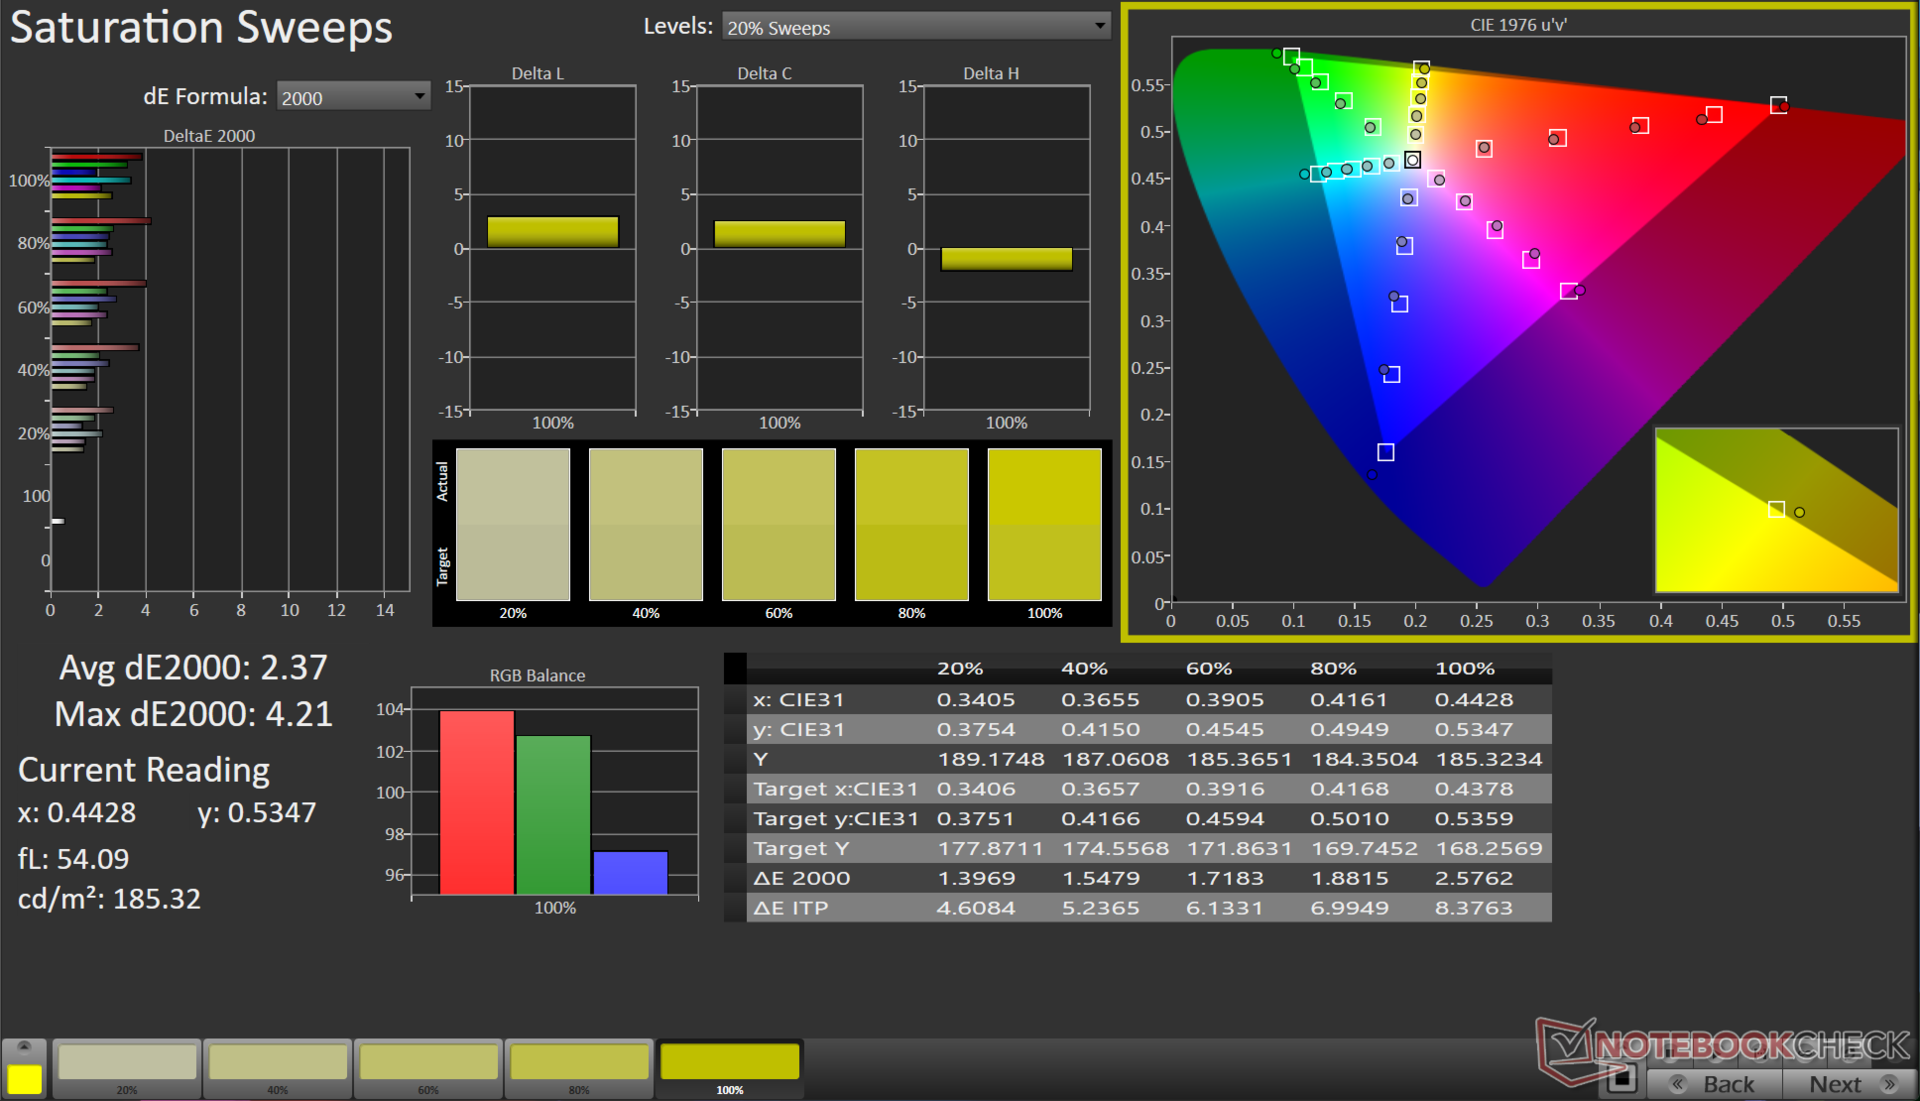
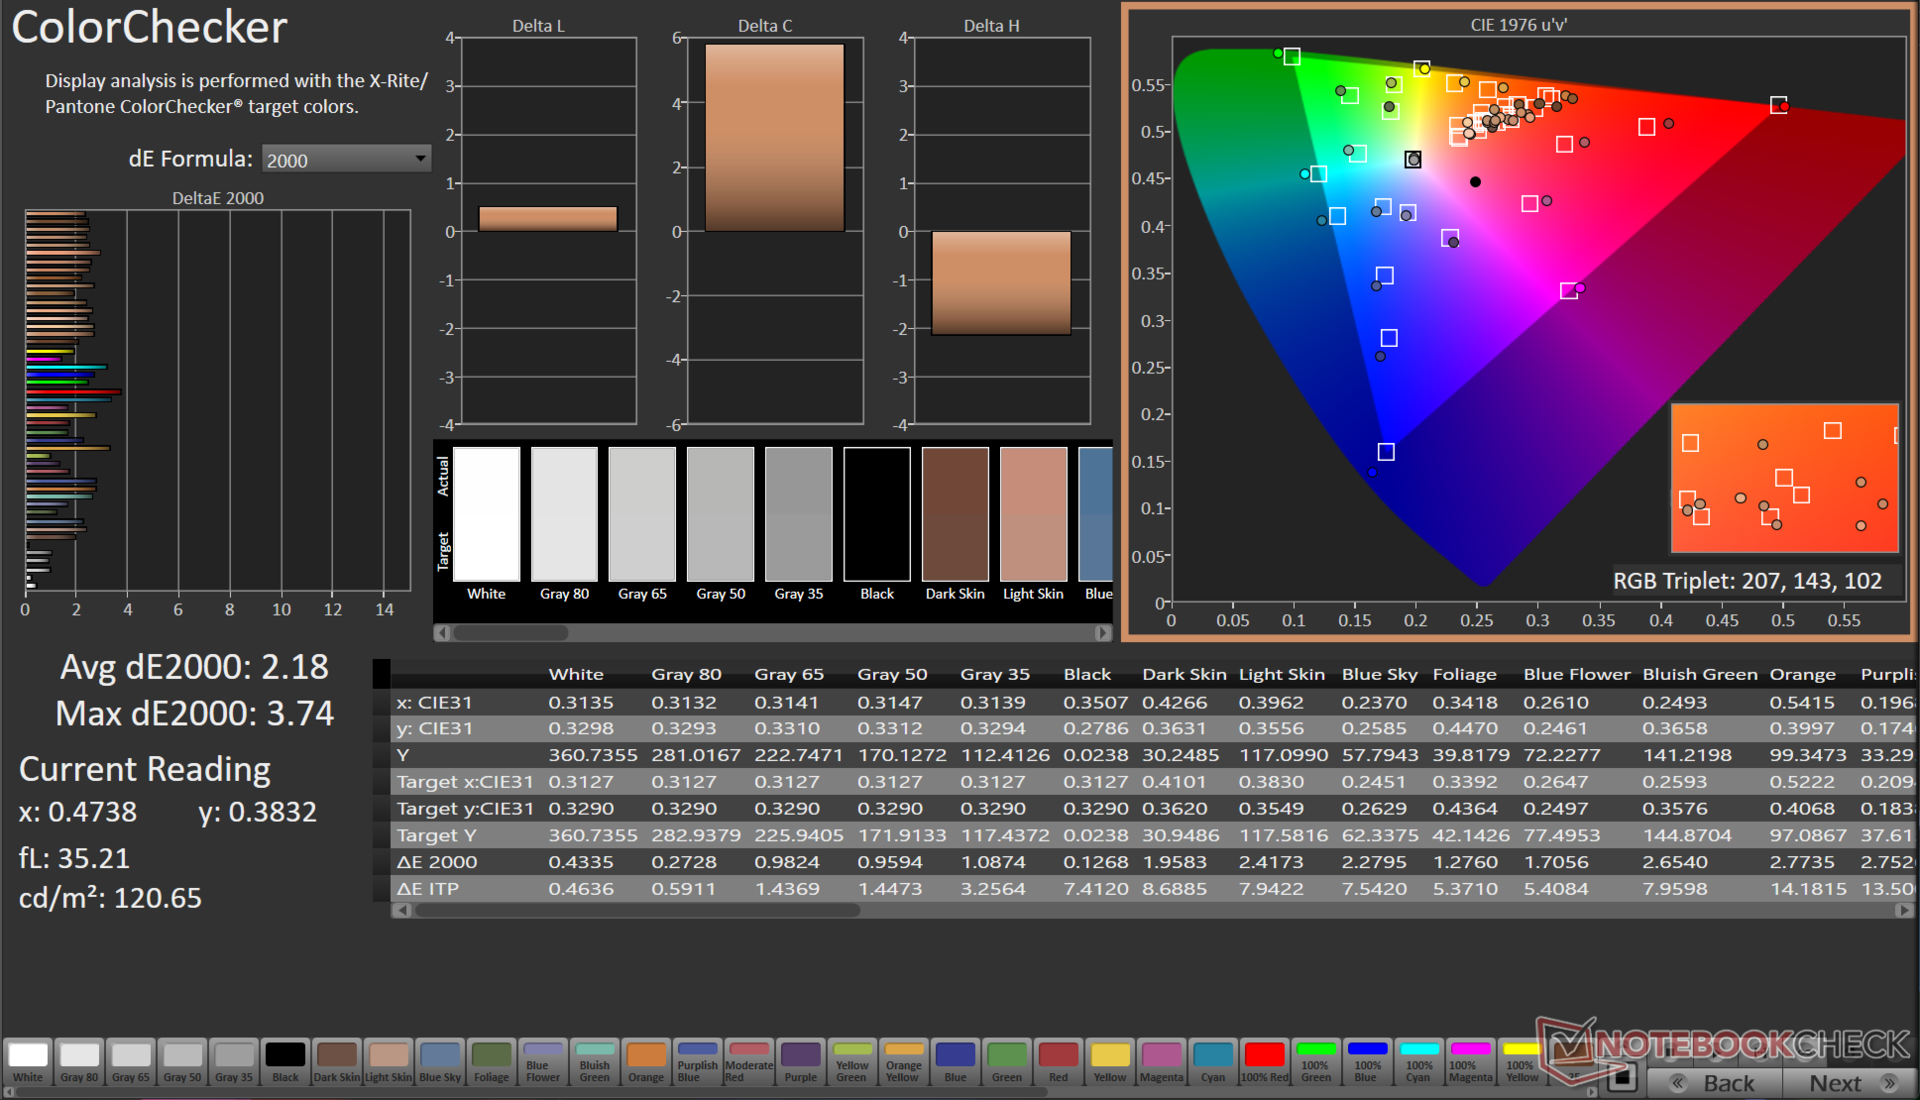
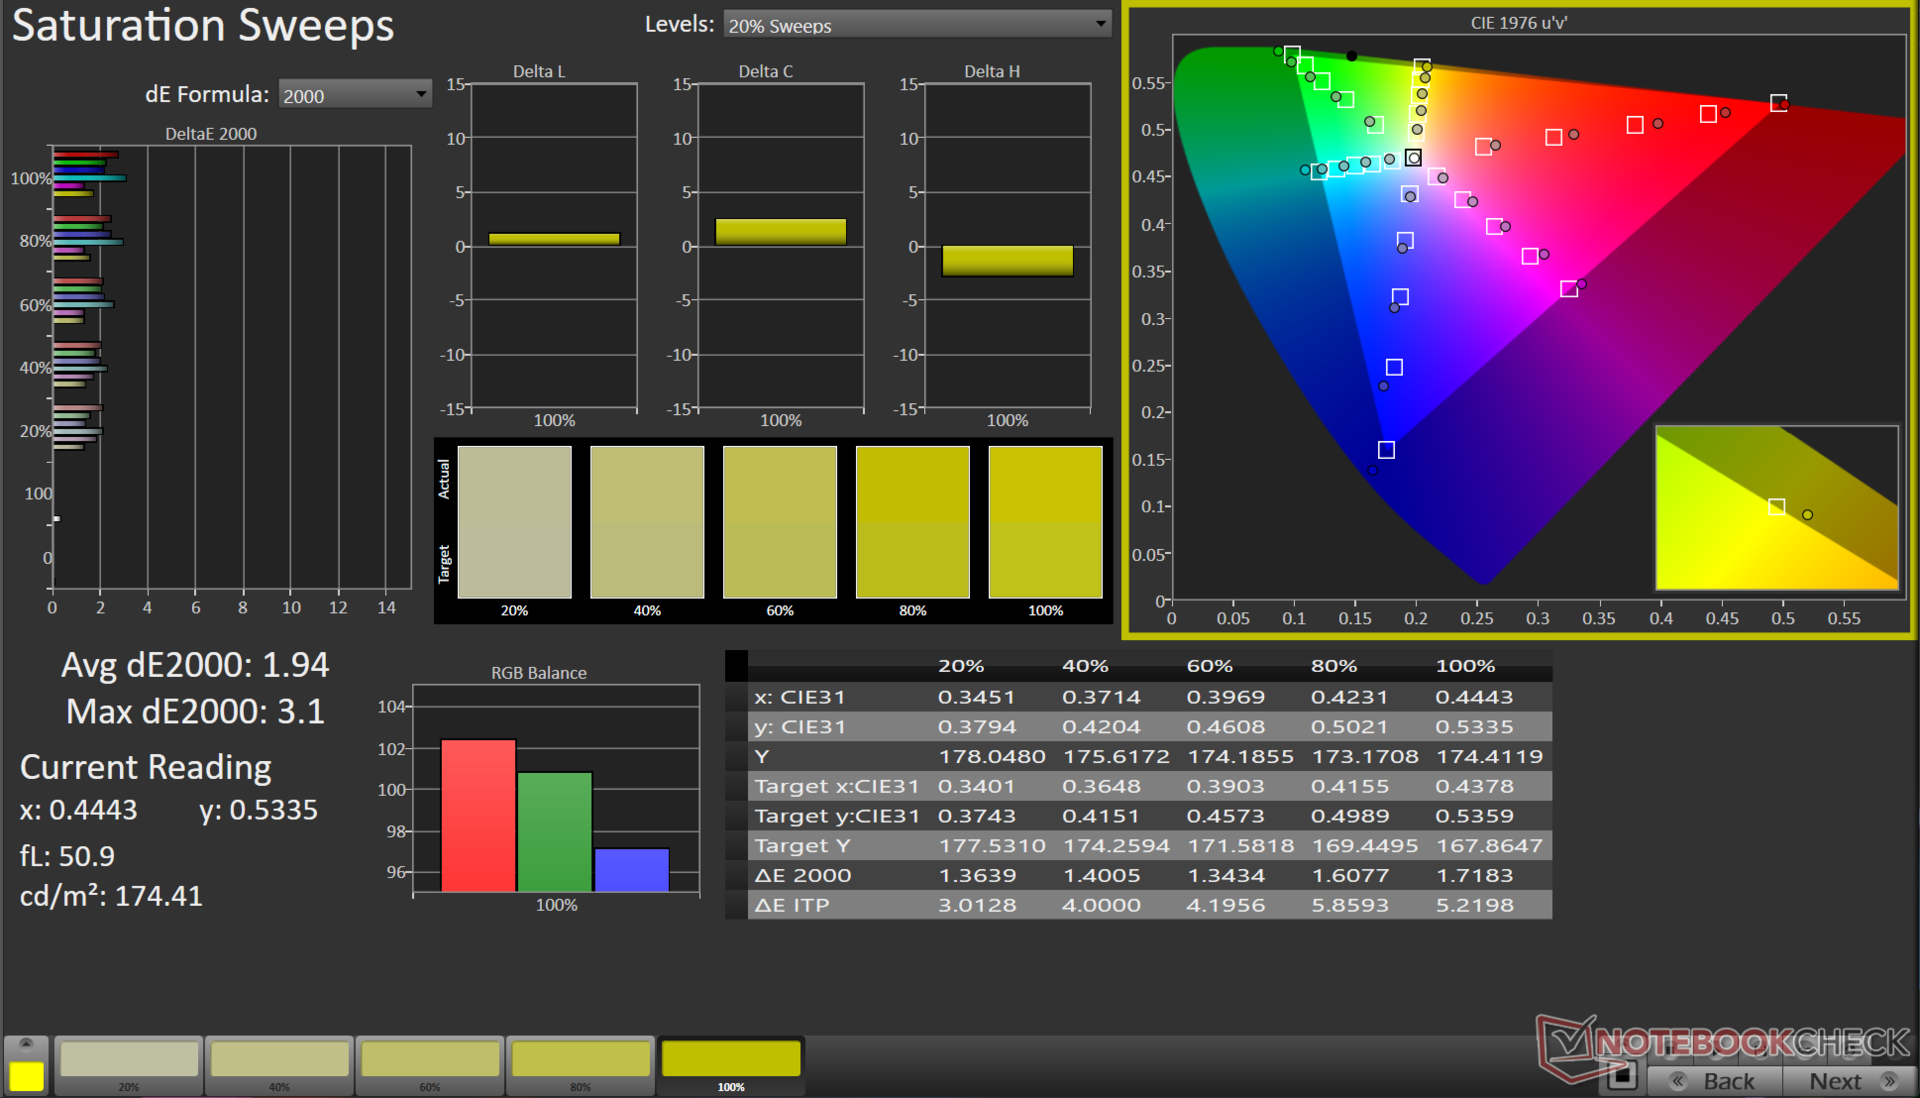
Innehållsskapare kommer att bli nöjda med VivoBook 14X:s imponerande täckning av hela sRGB-färgrymden (100 %), tillsammans med en nästan fullständig täckning av Adobe RGB (96,5 %) och Display P3 (99,9 %) färgrymder.


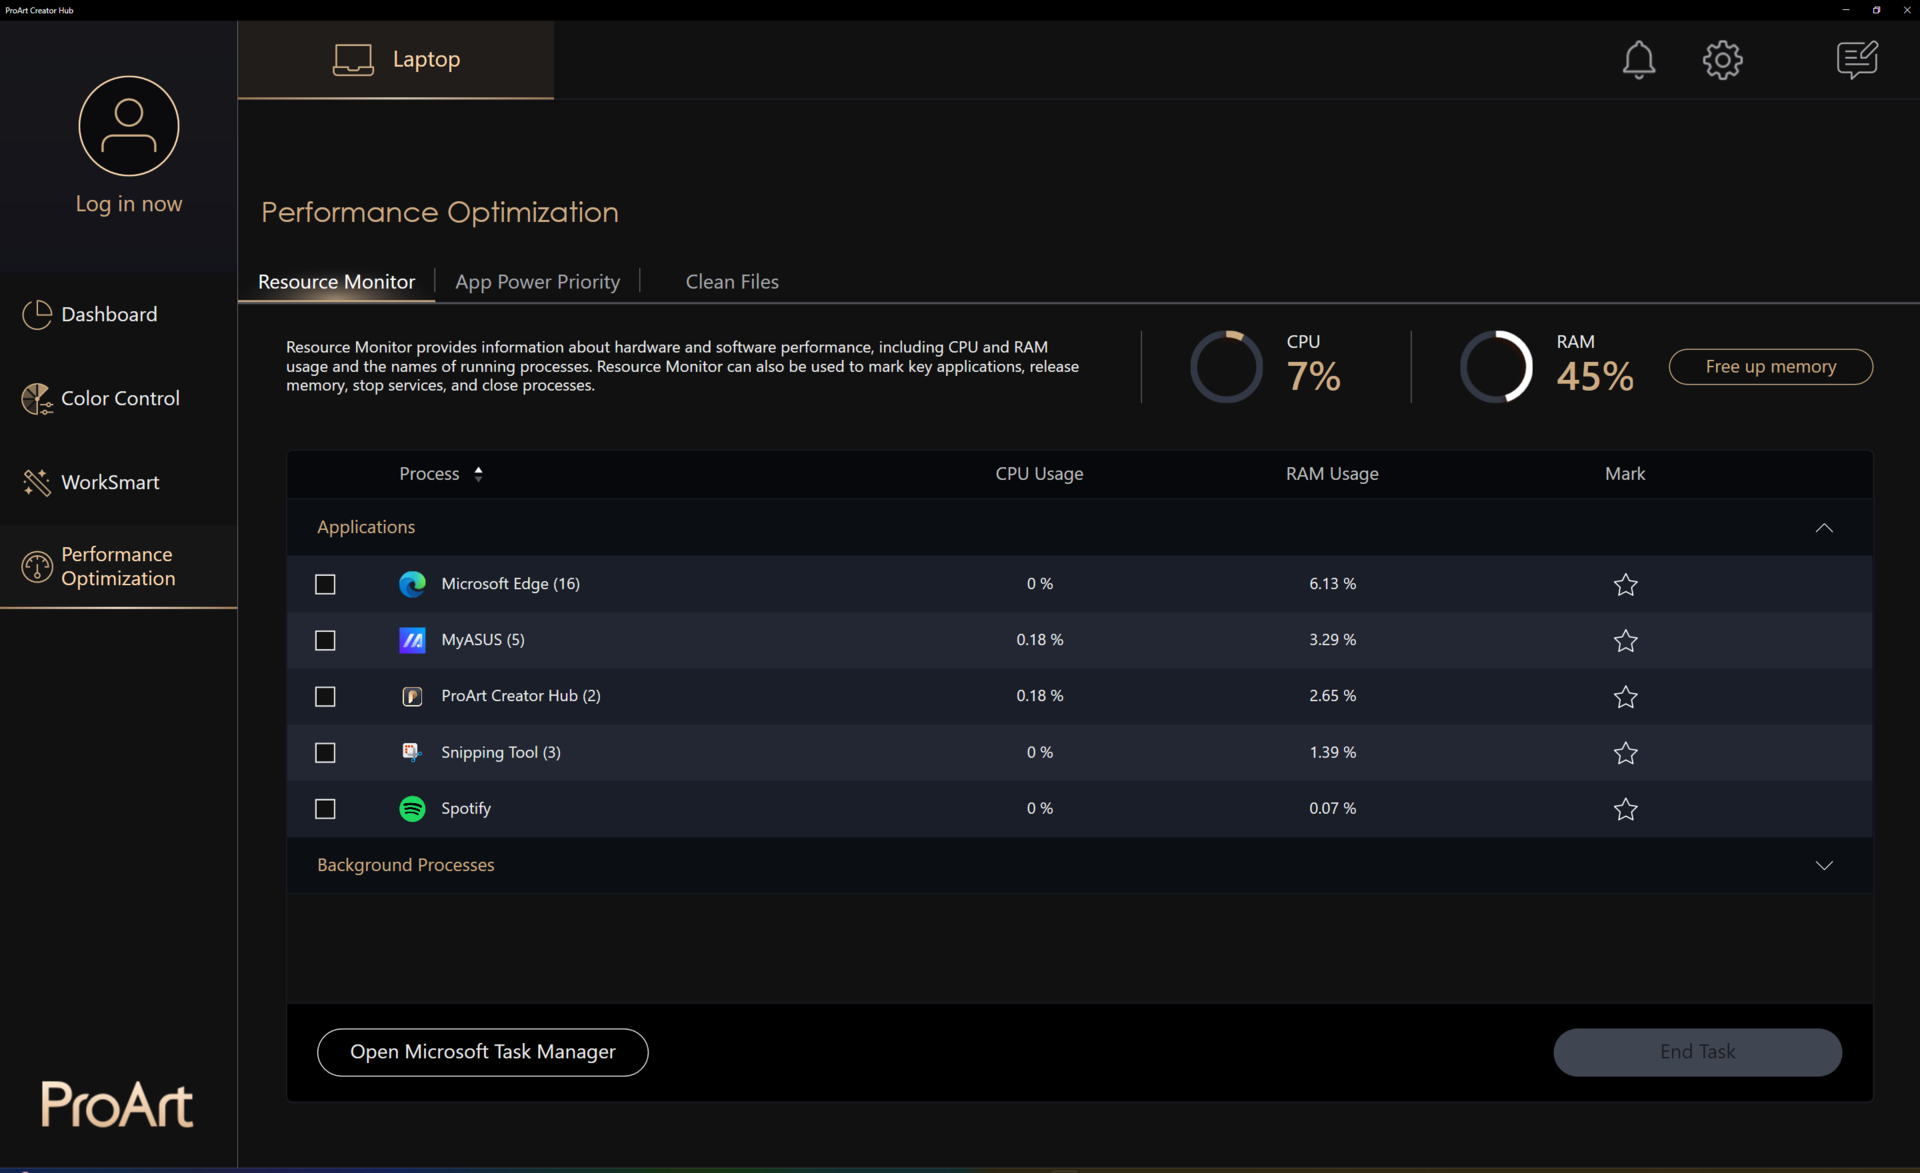
Vi utförde färgkalibrering i Display P3-färgrymden. VivoBook 14X visar redan låga Delta E-värden i gråskala och ColorChecker direkt från start. Du kan också använda ProArt Creator Hub och en kompatibel X-Rite i1Display-kalibrator för att utföra din egen kalibrering.
Med vår X-Rite i1Basic Pro 3 spektrofotometer och Calman Ultimate-programvaran från Portrait Displays kunde vi uppnå ett betydligt lägre Delta E på 0,8 i gråskala. Endast marginella förbättringar kunde dock ses i ColorChecker-värdena.
Den kalibrerade ICC-filen kan laddas ner från länken ovan.
Visa svarstider
| ↔ Svarstid svart till vitt | ||
|---|---|---|
| 14.4 ms ... stiga ↗ och falla ↘ kombinerat | ↗ 12.8 ms stiga | 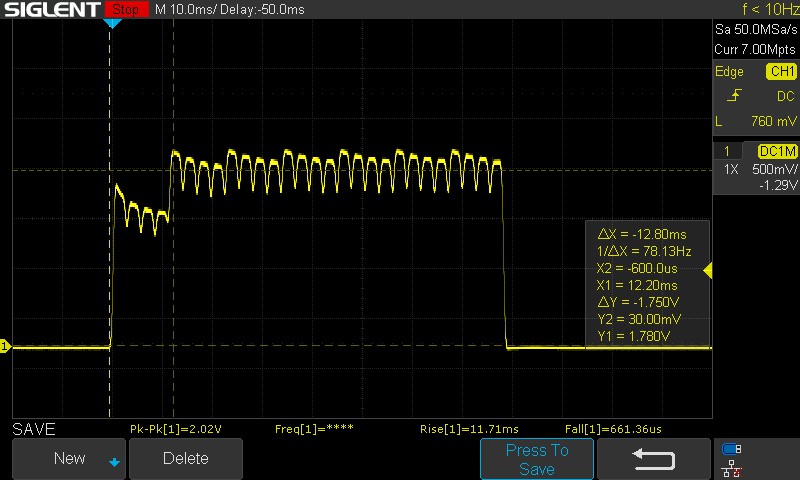 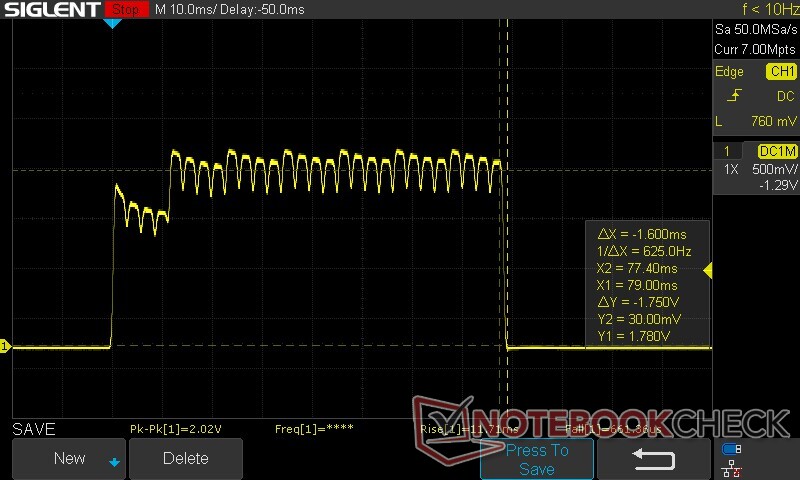 |
| ↘ 1.6 ms hösten | ||
| Skärmen visar bra svarsfrekvens i våra tester, men kan vara för långsam för konkurrenskraftiga spelare. I jämförelse sträcker sig alla testade enheter från 0.1 (minst) till 240 (maximalt) ms. » 35 % av alla enheter är bättre. Det betyder att den uppmätta svarstiden är bättre än genomsnittet av alla testade enheter (19.9 ms). | ||
| ↔ Svarstid 50 % grått till 80 % grått | ||
| 1.15 ms ... stiga ↗ och falla ↘ kombinerat | ↗ 0.57 ms stiga | 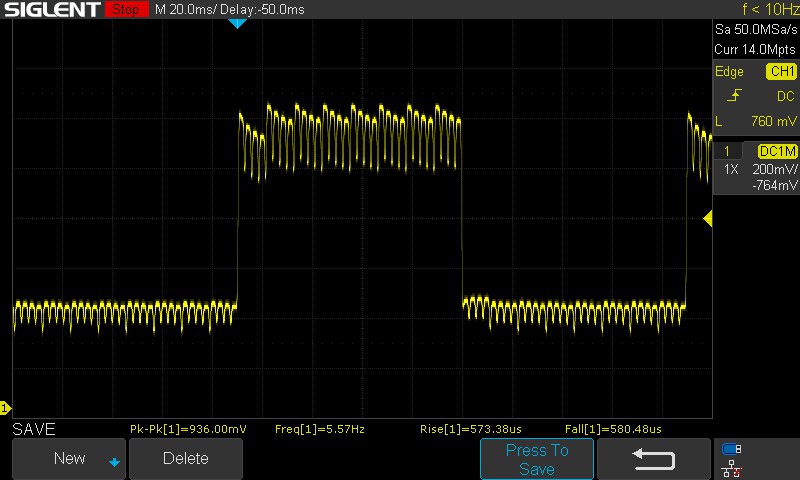 |
| ↘ 0.58 ms hösten | ||
| Skärmen visar väldigt snabba svarsfrekvenser i våra tester och borde vara mycket väl lämpad för fartfyllt spel. I jämförelse sträcker sig alla testade enheter från 0.165 (minst) till 636 (maximalt) ms. » 5 % av alla enheter är bättre. Det betyder att den uppmätta svarstiden är bättre än genomsnittet av alla testade enheter (31.1 ms). | ||
Manuell mätning var nödvändig för att uppskatta svarstider på grund av bakgrundsflimmer. En övergång från 100% svart till 100% vitt tar 14,4 ms, vilket är något i överkant för en OLED-panel. Övergångarna från 50% grått till 80% grått är dock mycket snabbare, 1,15 ms.
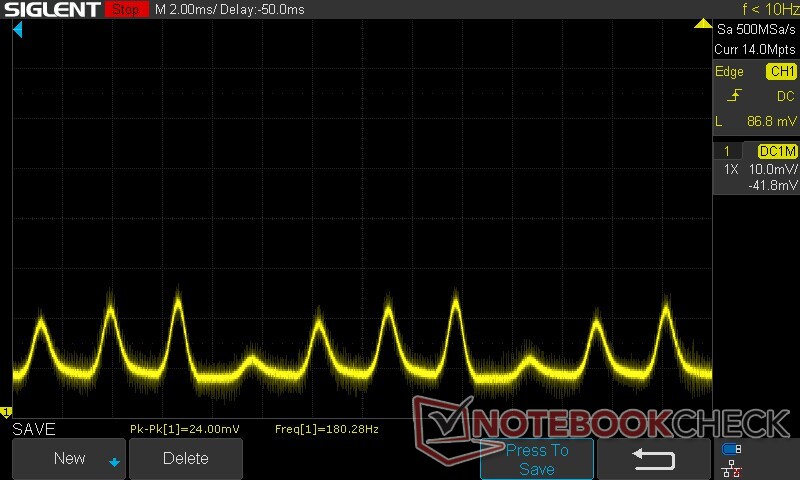
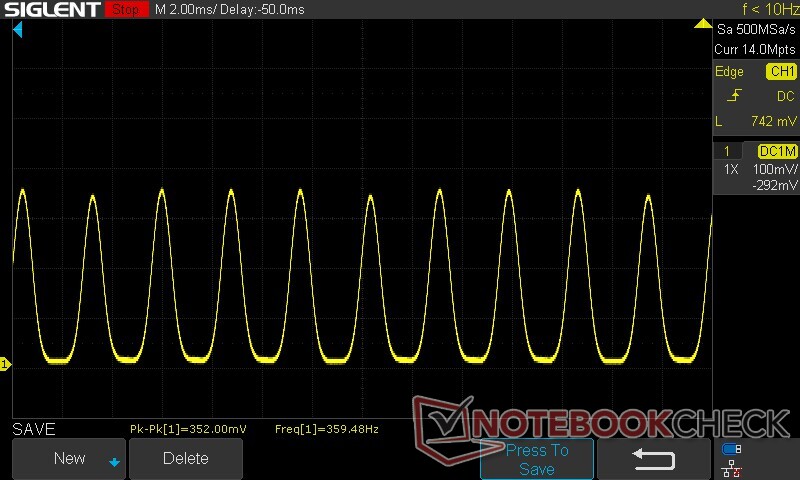
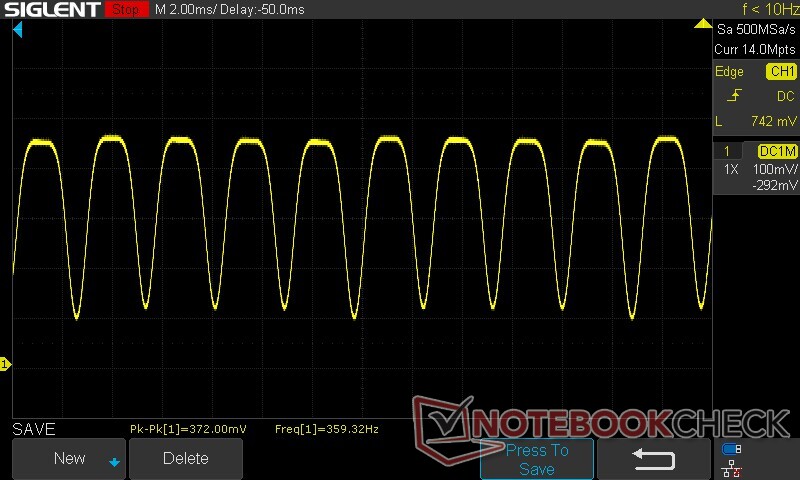
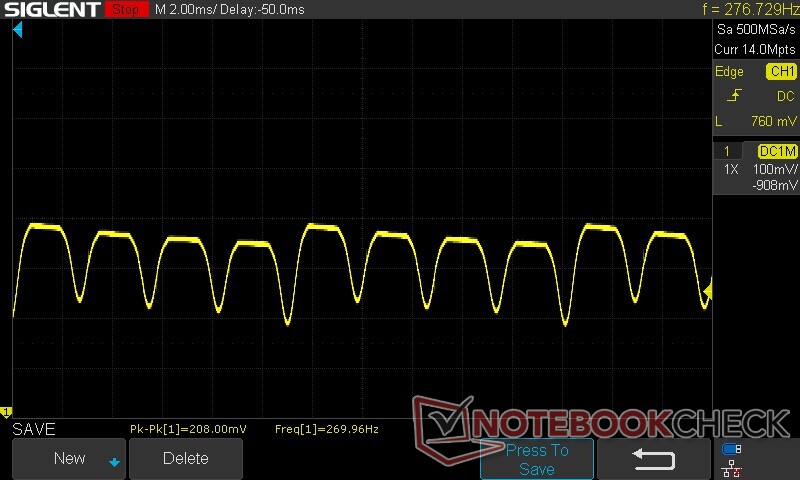
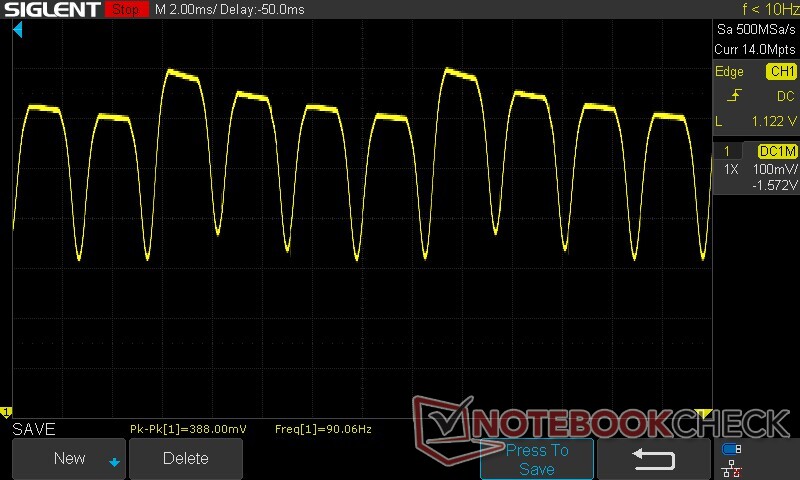
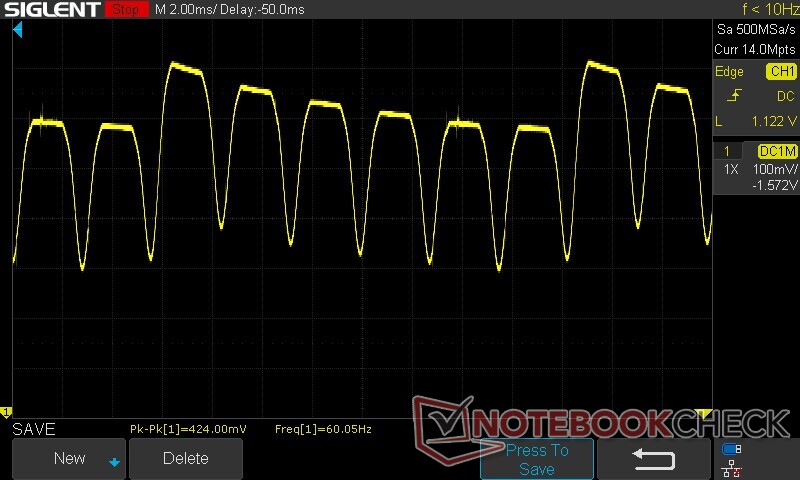
Skärmflimmer / PWM (Puls-Width Modulation)
| Skärmflimmer / PWM upptäckt | 90.02 Hz | 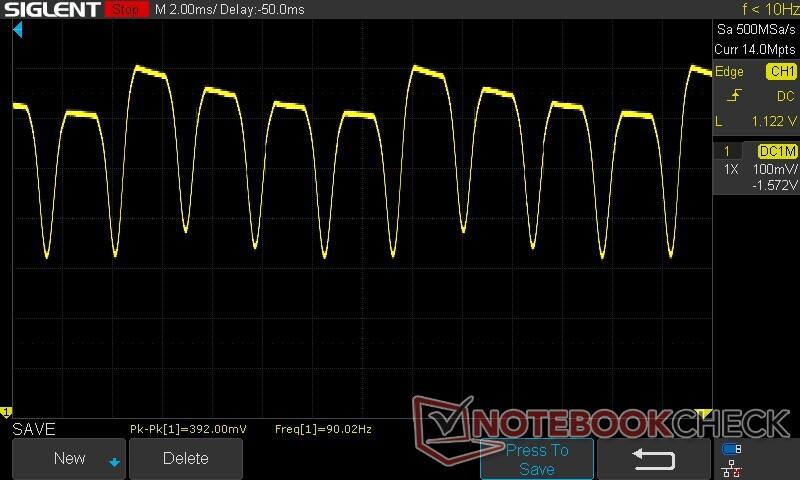 | |
| ≤ 100 cd/m² ljusstyrka | |||
Displayens bakgrundsbelysning flimrar vid 90.02 Hz (i värsta fall, t.ex. med PWM) Flimrande upptäckt vid en ljusstyrkeinställning på 100 cd/m² och lägre. Det ska inte finnas något flimmer eller PWM över denna ljusstyrkeinställning. Frekvensen för 90.02 Hz är mycket låg, så flimmer kan orsaka ögon- och huvudvärk efter långvarig användning. Flimrande förekommer vid relativt låga ljusstyrkeinställningar, så långvarig användning med denna ljusstyrkeinställning eller lägre kan orsaka ögonansträngning. Som jämförelse: 52 % av alla testade enheter använder inte PWM för att dämpa skärmen. Om PWM upptäcktes mättes ett medelvärde av 7794 (minst: 5 - maximum: 343500) Hz. | |||
Panelen använder 90 Hz DC Dimming mellan 75% och 100% ljusstyrka. Under 75% växlar panelen till en PWM-frekvens på ca 360 Hz.
90 Hz DC Dimming bör vara relativt mindre ansträngande för ögonen jämfört med PWM-flimmer. Denna frekvens går ner till 60 Hz vid motsvarande uppdateringsfrekvens.
Vi rekommenderar att ljusstyrkan är högre än 50% för att minimera visuell trötthet.
För mer information, kolla in "Varför PWM är en sådan huvudvärk" och "Analys: DC Dimming vs PWM - Kan du dimma AMOLED-skärmar utan flimmer". En översikt över uppmätt PWM i alla granskade enheter finns i vår Tabell över PWM-rankning.
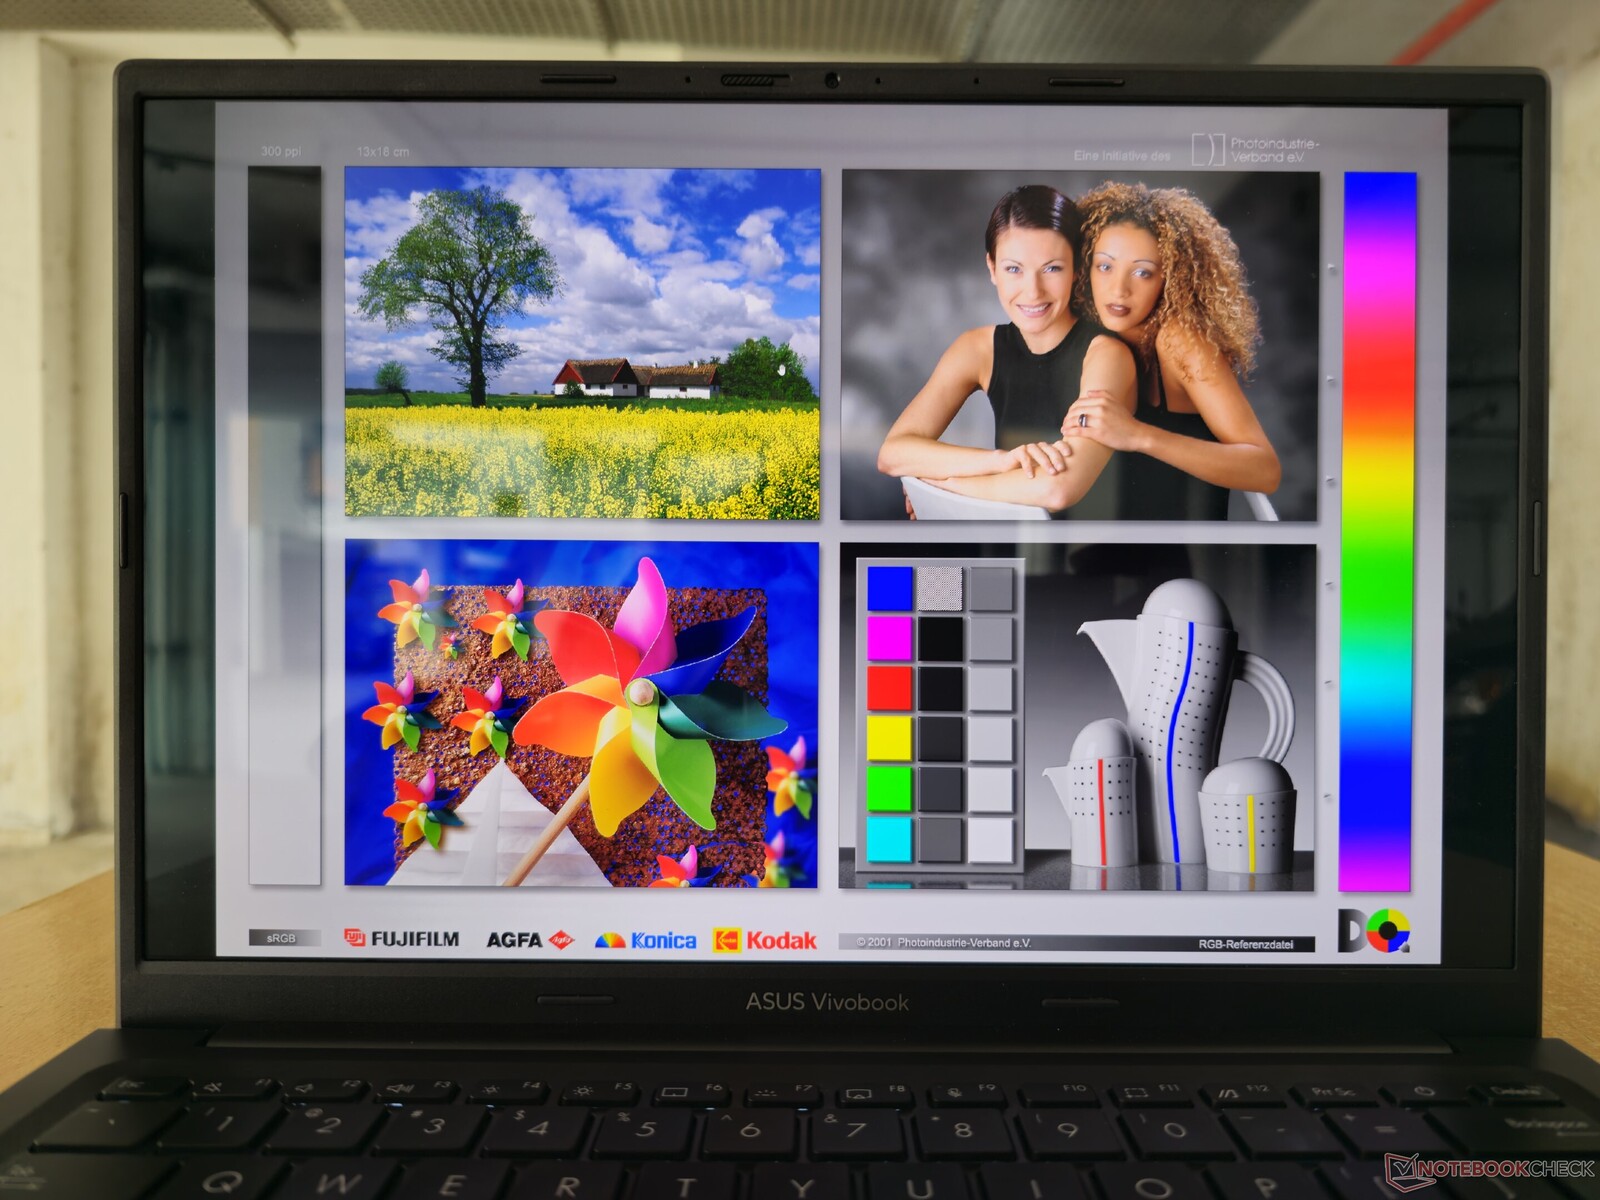
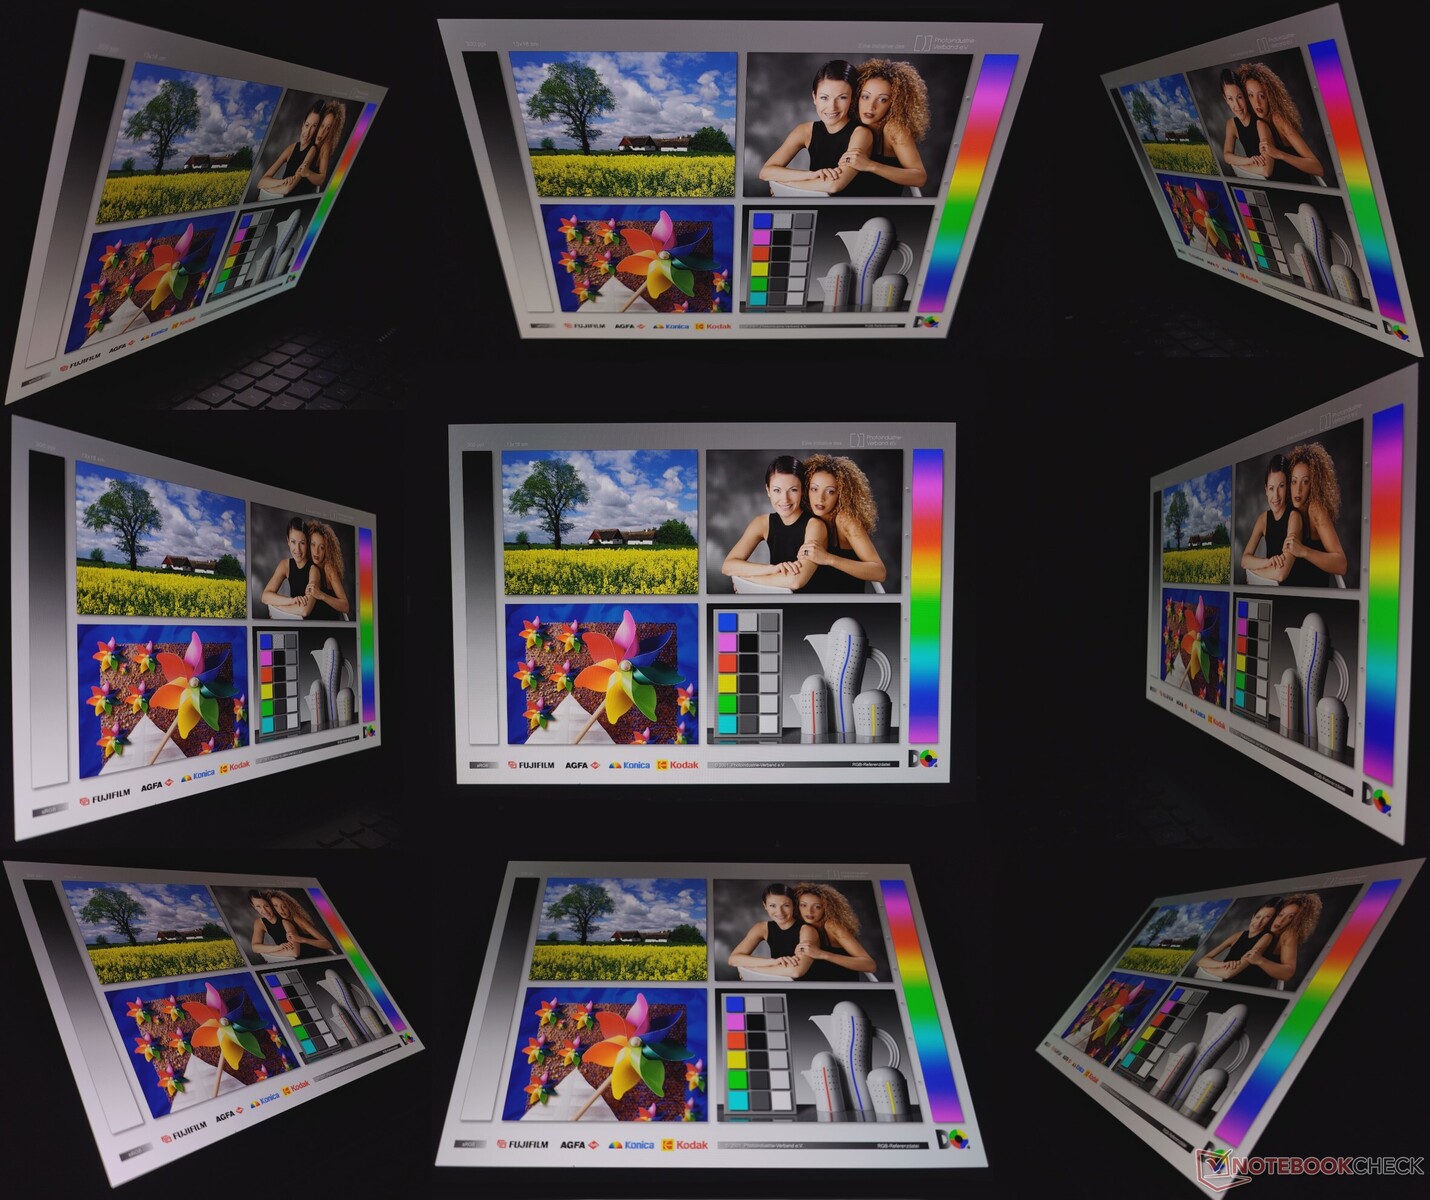
Utomhusvisning i solljus kan vara irriterande på grund av den glansiga skärmen. Betraktningsvinklarna är bra med minimal förlust av ljusstyrka i extrema vinklar och ingen synlig grön nyans.
Prestanda: Hamstrung Core i5-13500H med lite strypning
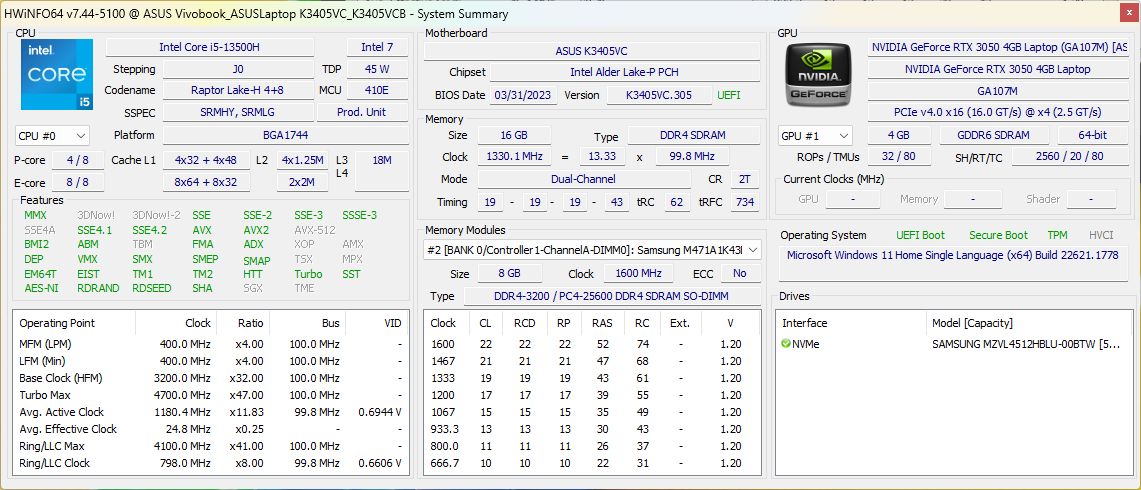
Vår Asus VivoBook 14X OLED drivs av Intel Core i5-13500H CPU och Nvidia GeForce RTX 3050 4 GB GPU för bärbar dator. RTX 3050 SKU:erna kan konfigureras antingen med en Core i5-13500H eller en Core i9-13900H.
En RTX 2050 Mobil är också tillgängligt men endast med en Core i5-13500H.
Villkor för testning
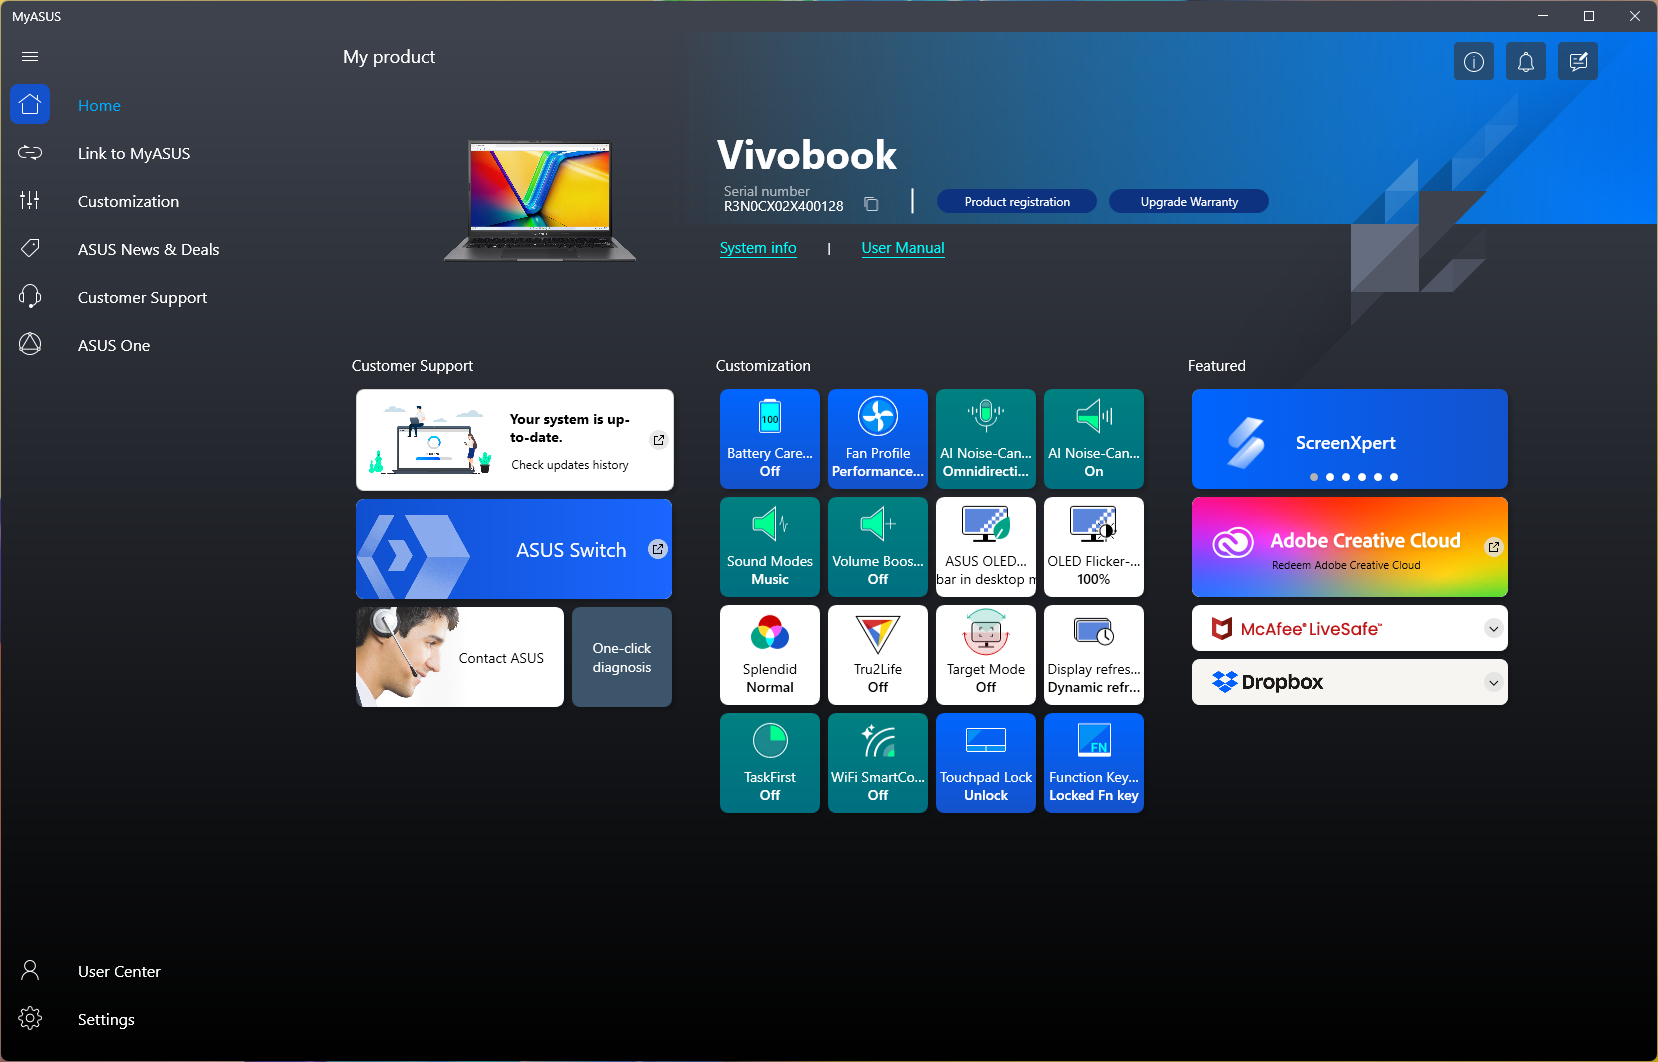
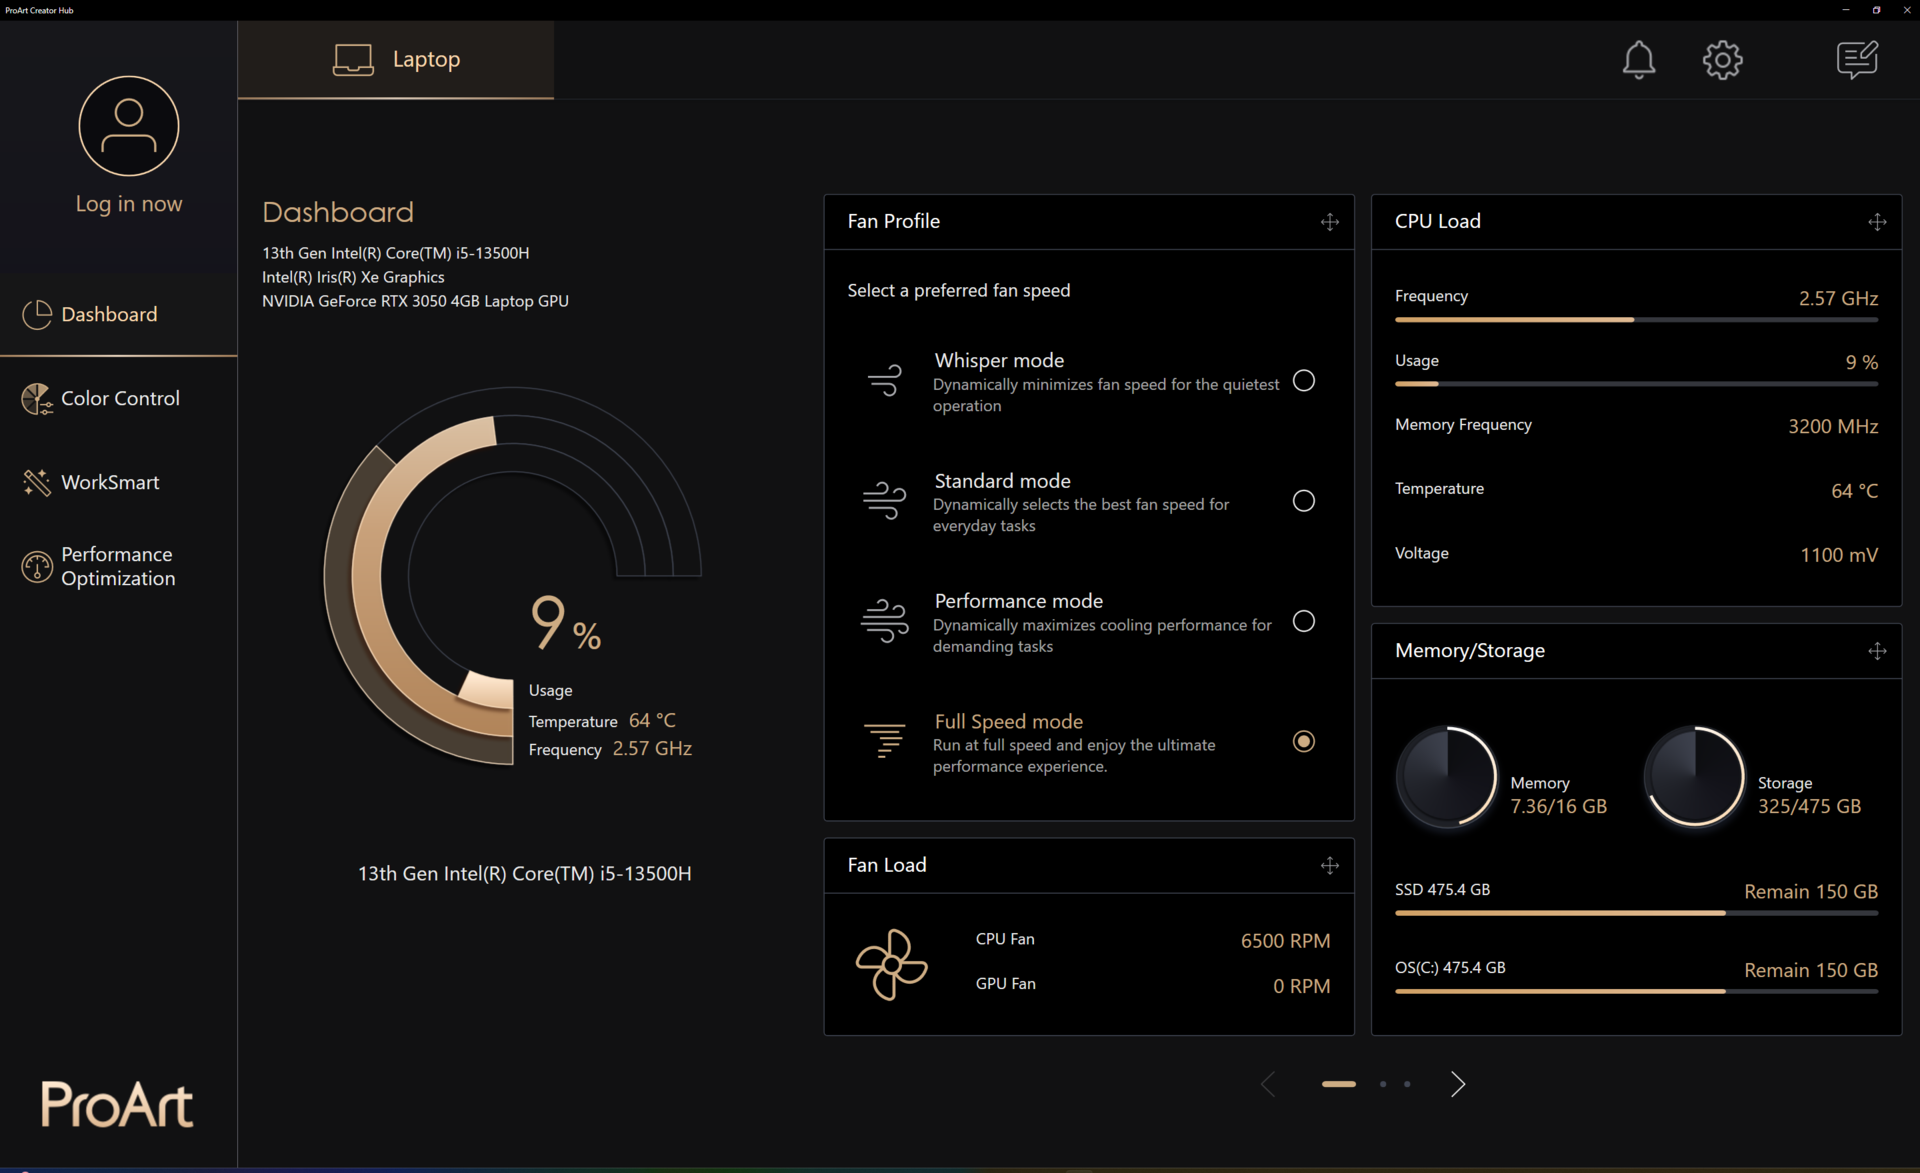
Asus delar redundant upp prestandainställningarna mellan MyAsus-appen och ProArt Creator Hub, även om MyAsus-appen bör vara tillräcklig i de flesta fall. Du måste dock använda ProArt Creator Hub för att komma åt Full Speed-läget.
Vi använde Full Speed-läget för alla prestandamätningar och Standard-läget för batteritester.
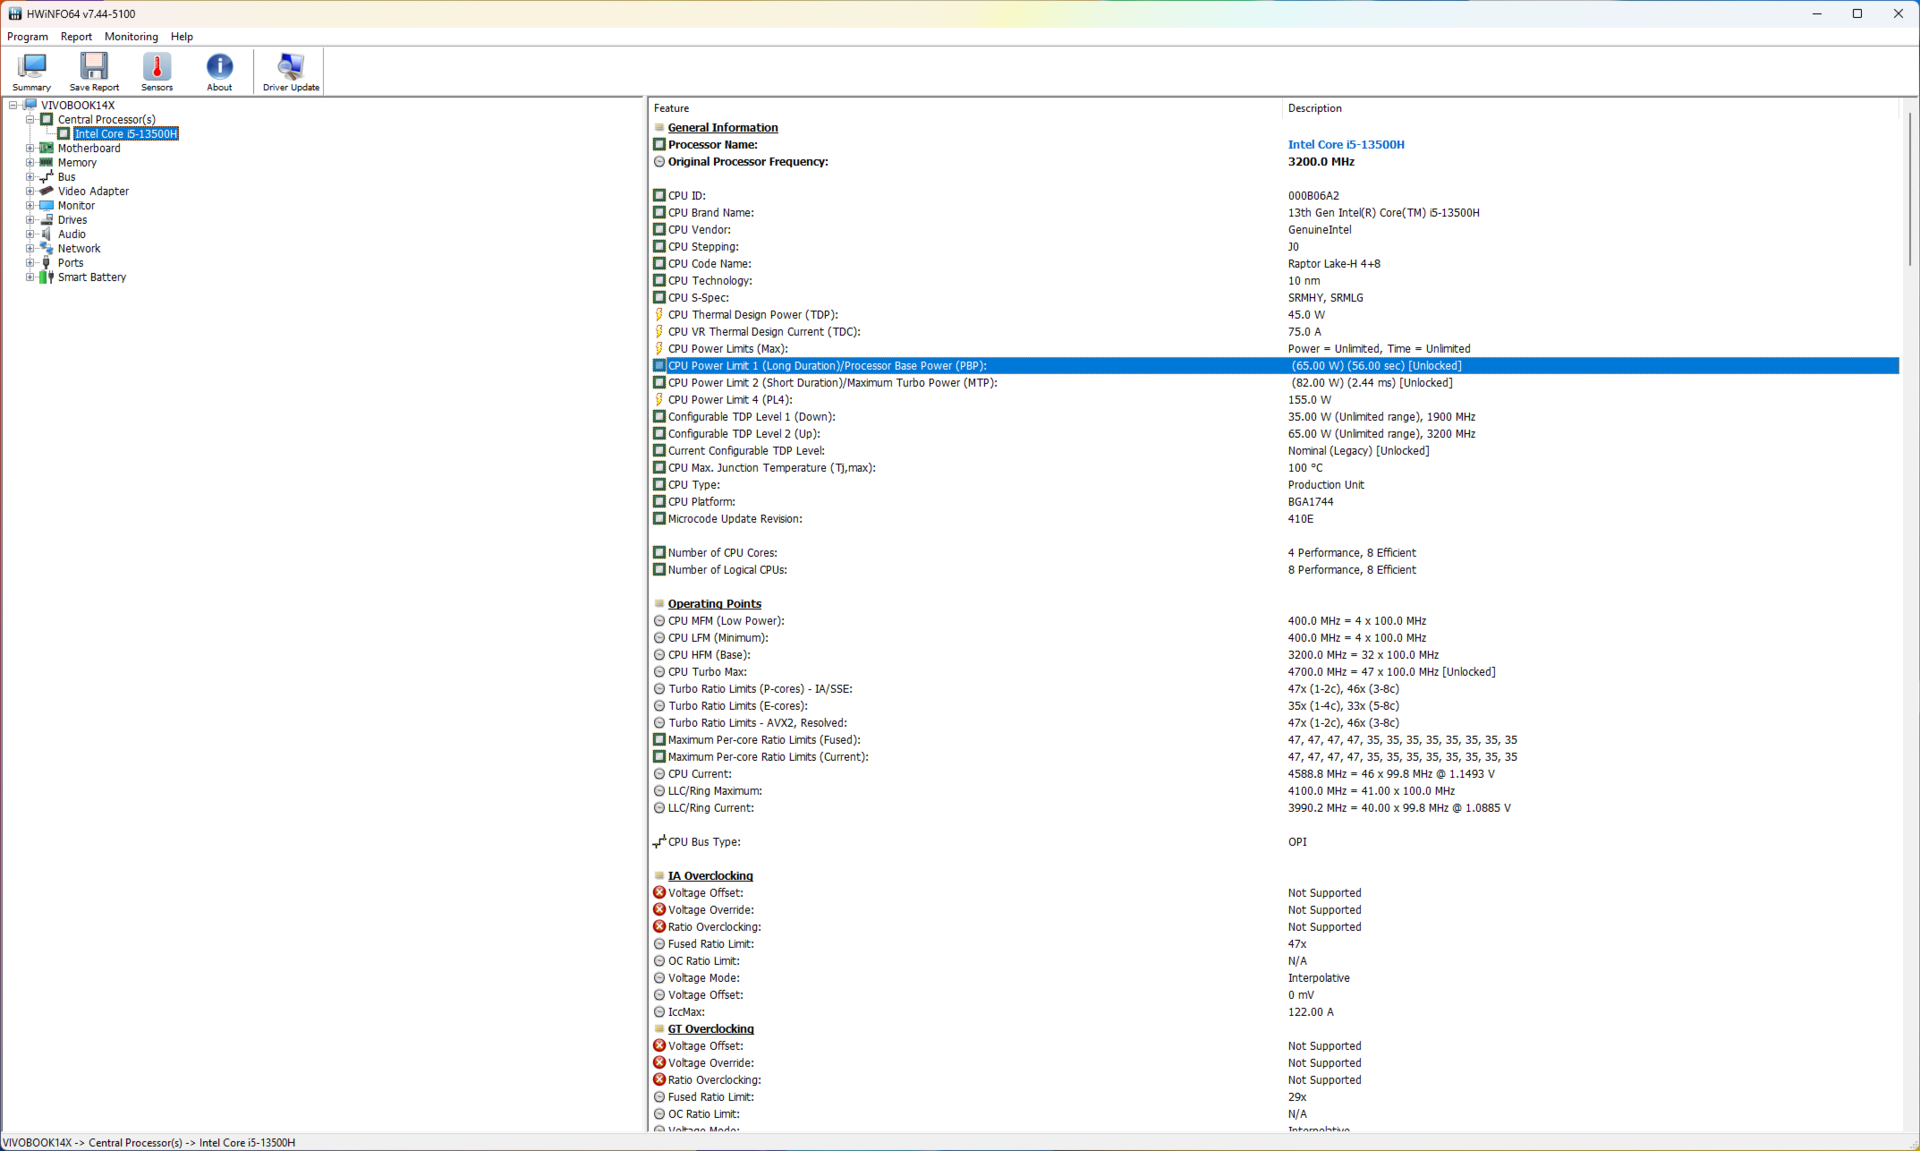
Tabellen nedan illustrerar hur Core i5-13500H:s PL1- och PL2-värden varierar beroende på den valda prestandainställningen.
| Prestandaläge | PL1 (PBP) / Tau | PL2 (MTP) / Tau |
|---|---|---|
| Viskning | 30 W / 56 s | 54 W / 2,44 ms |
| Standard | 50 W / 56 s | 82 W / 2,44 ms |
| Prestanda | 55 W / 56 s | 82 W / 2,44 ms |
| Full hastighet | 65 W / 56 s | 82 W / 2,44 ms |
Processor
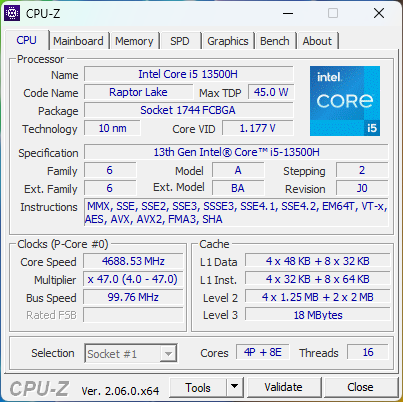
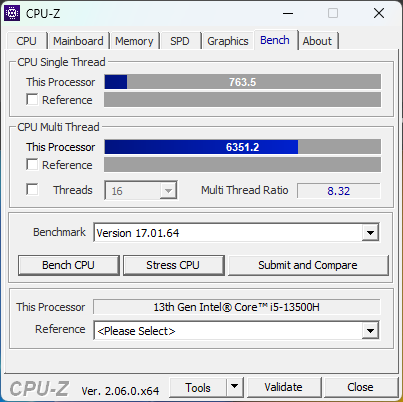
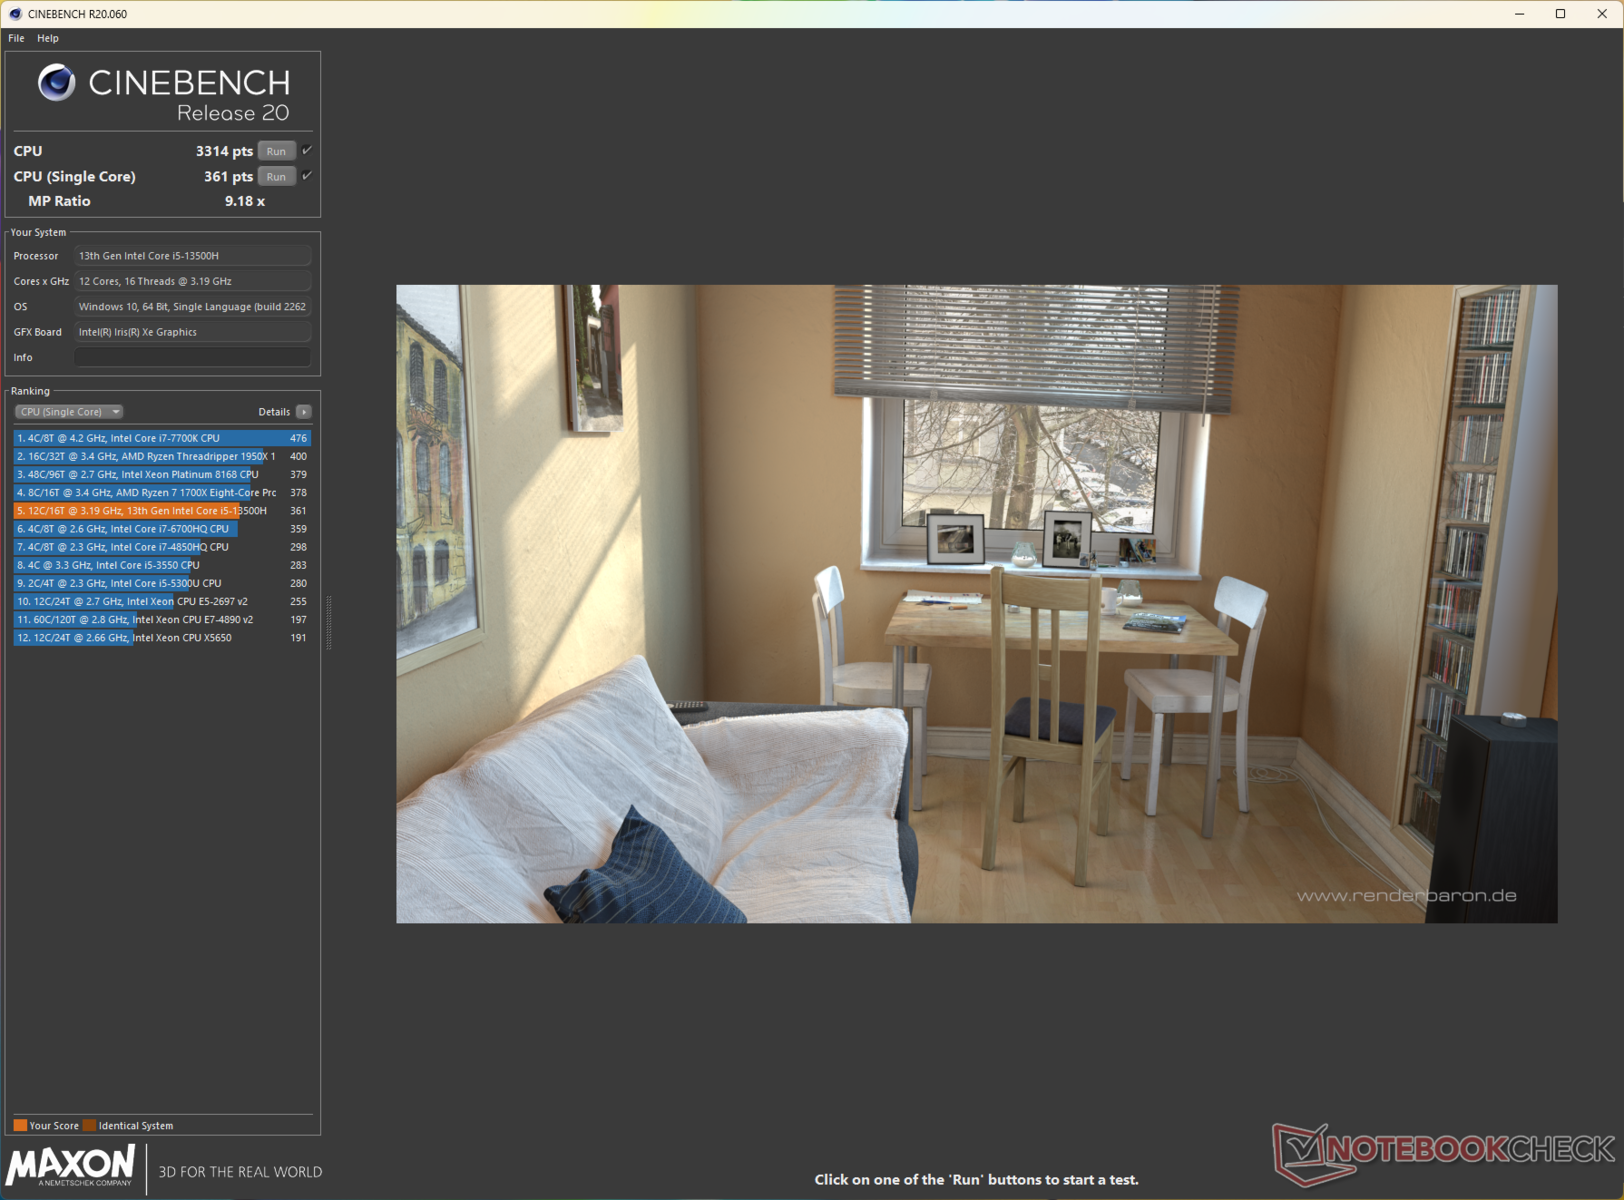
Core i5-13500H erbjuder 12 kärnor (4P + 8E) och 16 trådar med enkelkärniga boostar upp till 4,7 GHz och en TDP på 45 W. Den övergripande CPU-prestandan är i stort sett i linje med en Core i7-12700Hmen faller ca 10% bakomCore i7-13700H i MSI Stealth 14 Studio.
Med detta sagt sjunker CPU-prestandan med cirka 18% i slutet av Cinebench R15 multi-core loop-test. Denna strypning är dock inte lika drastisk jämfört med vad vi observerar med Core i7-13700H iAcer Swift X SFX14.
Cinebench R15 Multi Loop
Cinebench R23: Multi Core | Single Core
Cinebench R20: CPU (Multi Core) | CPU (Single Core)
Cinebench R15: CPU Multi 64Bit | CPU Single 64Bit
Blender: v2.79 BMW27 CPU
7-Zip 18.03: 7z b 4 | 7z b 4 -mmt1
Geekbench 5.5: Multi-Core | Single-Core
HWBOT x265 Benchmark v2.2: 4k Preset
LibreOffice : 20 Documents To PDF
R Benchmark 2.5: Overall mean
| CPU Performance rating | |
| Genomsnitt av klass Multimedia | |
| MSI Stealth 14 Studio A13V | |
| Gigabyte Aero 14 OLED BMF | |
| Acer Swift X SFX14-71G | |
| Schenker Vision 14 2022 RTX 3050 Ti | |
| Genomsnitt Intel Core i5-13500H | |
| Asus VivoBook 14X K3405 | |
| Lenovo Slim Pro 7 14ARP8 | |
| Cinebench R23 / Multi Core | |
| MSI Stealth 14 Studio A13V | |
| Genomsnitt av klass Multimedia (4861 - 33362, n=81, senaste 2 åren) | |
| Acer Swift X SFX14-71G | |
| Schenker Vision 14 2022 RTX 3050 Ti | |
| Genomsnitt Intel Core i5-13500H (13542 - 16335, n=5) | |
| Asus VivoBook 14X K3405 | |
| Gigabyte Aero 14 OLED BMF | |
| Lenovo Slim Pro 7 14ARP8 | |
| Cinebench R23 / Single Core | |
| Genomsnitt av klass Multimedia (1128 - 2459, n=73, senaste 2 åren) | |
| Acer Swift X SFX14-71G | |
| Gigabyte Aero 14 OLED BMF | |
| Genomsnitt Intel Core i5-13500H (1704 - 1799, n=5) | |
| Asus VivoBook 14X K3405 | |
| Schenker Vision 14 2022 RTX 3050 Ti | |
| MSI Stealth 14 Studio A13V | |
| Lenovo Slim Pro 7 14ARP8 | |
| Cinebench R20 / CPU (Multi Core) | |
| MSI Stealth 14 Studio A13V | |
| Genomsnitt av klass Multimedia (1887 - 12912, n=64, senaste 2 åren) | |
| Acer Swift X SFX14-71G | |
| Schenker Vision 14 2022 RTX 3050 Ti | |
| Asus VivoBook 14X K3405 | |
| Genomsnitt Intel Core i5-13500H (5108 - 6212, n=5) | |
| Gigabyte Aero 14 OLED BMF | |
| Lenovo Slim Pro 7 14ARP8 | |
| Cinebench R20 / CPU (Single Core) | |
| Acer Swift X SFX14-71G | |
| Genomsnitt av klass Multimedia (425 - 853, n=64, senaste 2 åren) | |
| Gigabyte Aero 14 OLED BMF | |
| Schenker Vision 14 2022 RTX 3050 Ti | |
| Genomsnitt Intel Core i5-13500H (655 - 687, n=5) | |
| Asus VivoBook 14X K3405 | |
| MSI Stealth 14 Studio A13V | |
| Lenovo Slim Pro 7 14ARP8 | |
| Cinebench R15 / CPU Multi 64Bit | |
| MSI Stealth 14 Studio A13V | |
| Genomsnitt av klass Multimedia (856 - 5224, n=68, senaste 2 åren) | |
| Gigabyte Aero 14 OLED BMF | |
| Acer Swift X SFX14-71G | |
| Genomsnitt Intel Core i5-13500H (2234 - 2475, n=5) | |
| Asus VivoBook 14X K3405 | |
| Schenker Vision 14 2022 RTX 3050 Ti | |
| Lenovo Slim Pro 7 14ARP8 | |
| Cinebench R15 / CPU Single 64Bit | |
| Genomsnitt av klass Multimedia (184.8 - 326, n=66, senaste 2 åren) | |
| Acer Swift X SFX14-71G | |
| Gigabyte Aero 14 OLED BMF | |
| Schenker Vision 14 2022 RTX 3050 Ti | |
| Genomsnitt Intel Core i5-13500H (243 - 261, n=5) | |
| Asus VivoBook 14X K3405 | |
| MSI Stealth 14 Studio A13V | |
| Lenovo Slim Pro 7 14ARP8 | |
| Blender / v2.79 BMW27 CPU | |
| Acer Swift X SFX14-71G | |
| Schenker Vision 14 2022 RTX 3050 Ti | |
| Genomsnitt av klass Multimedia (100 - 557, n=65, senaste 2 åren) | |
| Lenovo Slim Pro 7 14ARP8 | |
| Genomsnitt Intel Core i5-13500H (205 - 263, n=6) | |
| Asus VivoBook 14X K3405 | |
| Gigabyte Aero 14 OLED BMF | |
| MSI Stealth 14 Studio A13V | |
| 7-Zip 18.03 / 7z b 4 | |
| MSI Stealth 14 Studio A13V | |
| Genomsnitt av klass Multimedia (29095 - 130368, n=62, senaste 2 åren) | |
| Gigabyte Aero 14 OLED BMF | |
| Acer Swift X SFX14-71G | |
| Lenovo Slim Pro 7 14ARP8 | |
| Genomsnitt Intel Core i5-13500H (50846 - 58567, n=6) | |
| Asus VivoBook 14X K3405 | |
| Schenker Vision 14 2022 RTX 3050 Ti | |
| 7-Zip 18.03 / 7z b 4 -mmt1 | |
| Acer Swift X SFX14-71G | |
| Gigabyte Aero 14 OLED BMF | |
| Genomsnitt av klass Multimedia (3666 - 7545, n=63, senaste 2 åren) | |
| Schenker Vision 14 2022 RTX 3050 Ti | |
| Genomsnitt Intel Core i5-13500H (5500 - 5885, n=6) | |
| Asus VivoBook 14X K3405 | |
| MSI Stealth 14 Studio A13V | |
| Lenovo Slim Pro 7 14ARP8 | |
| Geekbench 5.5 / Multi-Core | |
| Genomsnitt av klass Multimedia (4652 - 20422, n=62, senaste 2 åren) | |
| MSI Stealth 14 Studio A13V | |
| Acer Swift X SFX14-71G | |
| Schenker Vision 14 2022 RTX 3050 Ti | |
| Gigabyte Aero 14 OLED BMF | |
| Genomsnitt Intel Core i5-13500H (9312 - 11465, n=5) | |
| Asus VivoBook 14X K3405 | |
| Lenovo Slim Pro 7 14ARP8 | |
| Geekbench 5.5 / Single-Core | |
| Genomsnitt av klass Multimedia (805 - 2974, n=62, senaste 2 åren) | |
| Gigabyte Aero 14 OLED BMF | |
| Acer Swift X SFX14-71G | |
| Schenker Vision 14 2022 RTX 3050 Ti | |
| Genomsnitt Intel Core i5-13500H (1674 - 1762, n=5) | |
| MSI Stealth 14 Studio A13V | |
| Asus VivoBook 14X K3405 | |
| Lenovo Slim Pro 7 14ARP8 | |
| HWBOT x265 Benchmark v2.2 / 4k Preset | |
| Genomsnitt av klass Multimedia (5.26 - 36.1, n=63, senaste 2 åren) | |
| MSI Stealth 14 Studio A13V | |
| Lenovo Slim Pro 7 14ARP8 | |
| Asus VivoBook 14X K3405 | |
| Genomsnitt Intel Core i5-13500H (14.4 - 17.9, n=6) | |
| Gigabyte Aero 14 OLED BMF | |
| Schenker Vision 14 2022 RTX 3050 Ti | |
| Acer Swift X SFX14-71G | |
| LibreOffice / 20 Documents To PDF | |
| Lenovo Slim Pro 7 14ARP8 | |
| MSI Stealth 14 Studio A13V | |
| Genomsnitt Intel Core i5-13500H (44 - 65.5, n=5) | |
| Genomsnitt av klass Multimedia (23.9 - 146.7, n=64, senaste 2 åren) | |
| Asus VivoBook 14X K3405 | |
| Schenker Vision 14 2022 RTX 3050 Ti | |
| Gigabyte Aero 14 OLED BMF | |
| Acer Swift X SFX14-71G | |
| R Benchmark 2.5 / Overall mean | |
| Lenovo Slim Pro 7 14ARP8 | |
| MSI Stealth 14 Studio A13V | |
| Asus VivoBook 14X K3405 | |
| Genomsnitt Intel Core i5-13500H (0.471 - 0.51, n=6) | |
| Genomsnitt av klass Multimedia (0.3604 - 0.947, n=63, senaste 2 åren) | |
| Schenker Vision 14 2022 RTX 3050 Ti | |
| Gigabyte Aero 14 OLED BMF | |
| Acer Swift X SFX14-71G | |
* ... mindre är bättre
Att köra Cinebench R15 multi-core loop i olika prestandalägen visar att VivoBook 14X:s Core i5-13500H-implementering inte fullt ut kan utnyttja sin tilldelade TDP-budget. I standard- och fullhastighetsprofilerna är den högsta observerade paketeffekten endast 70 W mot tillåtna 82 W.
Dessutom uppnås denna effektnivå endast under den inledande loopen, med den maximala klockfrekvensen runt 3,5 GHz. I Whisper-läget kan processorn använda upp till 54 W, men genomsnittet ligger på cirka 16 W under testet.
Cinebench R20 får sig en rejäl törn i batteriläget med 45% och 41% lägre single-core respektive multi-core prestanda.
AIDA64: FP32 Ray-Trace | FPU Julia | CPU SHA3 | CPU Queen | FPU SinJulia | FPU Mandel | CPU AES | CPU ZLib | FP64 Ray-Trace | CPU PhotoWorxx
| Performance rating | |
| MSI Stealth 14 Studio A13V | |
| Genomsnitt av klass Multimedia | |
| Gigabyte Aero 14 OLED BMF | |
| Lenovo Slim Pro 7 14ARP8 | |
| Asus VivoBook 14X K3405 | |
| Genomsnitt Intel Core i5-13500H | |
| Schenker Vision 14 2022 RTX 3050 Ti | |
| Acer Swift X SFX14-71G | |
| AIDA64 / FP32 Ray-Trace | |
| Genomsnitt av klass Multimedia (2214 - 50388, n=60, senaste 2 åren) | |
| MSI Stealth 14 Studio A13V | |
| Lenovo Slim Pro 7 14ARP8 | |
| Asus VivoBook 14X K3405 | |
| Genomsnitt Intel Core i5-13500H (11081 - 15390, n=6) | |
| Gigabyte Aero 14 OLED BMF | |
| Schenker Vision 14 2022 RTX 3050 Ti | |
| Acer Swift X SFX14-71G | |
| AIDA64 / FPU Julia | |
| Lenovo Slim Pro 7 14ARP8 | |
| MSI Stealth 14 Studio A13V | |
| Genomsnitt av klass Multimedia (12867 - 201874, n=61, senaste 2 åren) | |
| Asus VivoBook 14X K3405 | |
| Genomsnitt Intel Core i5-13500H (56813 - 74251, n=6) | |
| Gigabyte Aero 14 OLED BMF | |
| Schenker Vision 14 2022 RTX 3050 Ti | |
| Acer Swift X SFX14-71G | |
| AIDA64 / CPU SHA3 | |
| Genomsnitt av klass Multimedia (653 - 8623, n=61, senaste 2 åren) | |
| MSI Stealth 14 Studio A13V | |
| Asus VivoBook 14X K3405 | |
| Lenovo Slim Pro 7 14ARP8 | |
| Genomsnitt Intel Core i5-13500H (2621 - 3623, n=6) | |
| Gigabyte Aero 14 OLED BMF | |
| Schenker Vision 14 2022 RTX 3050 Ti | |
| Acer Swift X SFX14-71G | |
| AIDA64 / CPU Queen | |
| Gigabyte Aero 14 OLED BMF | |
| MSI Stealth 14 Studio A13V | |
| Acer Swift X SFX14-71G | |
| Schenker Vision 14 2022 RTX 3050 Ti | |
| Lenovo Slim Pro 7 14ARP8 | |
| Genomsnitt Intel Core i5-13500H (77835 - 85727, n=6) | |
| Asus VivoBook 14X K3405 | |
| Genomsnitt av klass Multimedia (13483 - 181505, n=49, senaste 2 åren) | |
| AIDA64 / FPU SinJulia | |
| Lenovo Slim Pro 7 14ARP8 | |
| MSI Stealth 14 Studio A13V | |
| Genomsnitt av klass Multimedia (1240 - 28794, n=61, senaste 2 åren) | |
| Gigabyte Aero 14 OLED BMF | |
| Schenker Vision 14 2022 RTX 3050 Ti | |
| Genomsnitt Intel Core i5-13500H (7249 - 8086, n=6) | |
| Asus VivoBook 14X K3405 | |
| Acer Swift X SFX14-71G | |
| AIDA64 / FPU Mandel | |
| Lenovo Slim Pro 7 14ARP8 | |
| Genomsnitt av klass Multimedia (6395 - 105740, n=60, senaste 2 åren) | |
| MSI Stealth 14 Studio A13V | |
| Asus VivoBook 14X K3405 | |
| Genomsnitt Intel Core i5-13500H (27820 - 38336, n=6) | |
| Gigabyte Aero 14 OLED BMF | |
| Schenker Vision 14 2022 RTX 3050 Ti | |
| Acer Swift X SFX14-71G | |
| AIDA64 / CPU AES | |
| Gigabyte Aero 14 OLED BMF | |
| Asus VivoBook 14X K3405 | |
| Genomsnitt Intel Core i5-13500H (62657 - 120493, n=6) | |
| Acer Swift X SFX14-71G | |
| MSI Stealth 14 Studio A13V | |
| Schenker Vision 14 2022 RTX 3050 Ti | |
| Genomsnitt av klass Multimedia (13243 - 126790, n=61, senaste 2 åren) | |
| Lenovo Slim Pro 7 14ARP8 | |
| AIDA64 / CPU ZLib | |
| MSI Stealth 14 Studio A13V | |
| Genomsnitt av klass Multimedia (167.2 - 2022, n=61, senaste 2 åren) | |
| Schenker Vision 14 2022 RTX 3050 Ti | |
| Asus VivoBook 14X K3405 | |
| Genomsnitt Intel Core i5-13500H (782 - 992, n=6) | |
| Gigabyte Aero 14 OLED BMF | |
| Lenovo Slim Pro 7 14ARP8 | |
| Acer Swift X SFX14-71G | |
| AIDA64 / FP64 Ray-Trace | |
| Genomsnitt av klass Multimedia (1014 - 26875, n=61, senaste 2 åren) | |
| MSI Stealth 14 Studio A13V | |
| Lenovo Slim Pro 7 14ARP8 | |
| Asus VivoBook 14X K3405 | |
| Genomsnitt Intel Core i5-13500H (5955 - 8495, n=6) | |
| Gigabyte Aero 14 OLED BMF | |
| Schenker Vision 14 2022 RTX 3050 Ti | |
| Acer Swift X SFX14-71G | |
| AIDA64 / CPU PhotoWorxx | |
| Gigabyte Aero 14 OLED BMF | |
| Genomsnitt av klass Multimedia (12860 - 88154, n=61, senaste 2 åren) | |
| Acer Swift X SFX14-71G | |
| MSI Stealth 14 Studio A13V | |
| Genomsnitt Intel Core i5-13500H (20212 - 37618, n=6) | |
| Schenker Vision 14 2022 RTX 3050 Ti | |
| Lenovo Slim Pro 7 14ARP8 | |
| Asus VivoBook 14X K3405 | |
Systemets prestanda
VivoBook 14X ligger efter MSI Stealth 14 i PCMark 10- och CrossMark-testerna, men inte mycket. Den övergripande systemprestandan vid typisk daglig användning är smidig och responsiv.
CrossMark: Overall | Productivity | Creativity | Responsiveness
AIDA64: Memory Copy | Memory Read | Memory Write | Memory Latency
| PCMark 10 / Score | |
| Genomsnitt av klass Multimedia (4325 - 10386, n=58, senaste 2 åren) | |
| Gigabyte Aero 14 OLED BMF | |
| Acer Swift X SFX14-71G | |
| MSI Stealth 14 Studio A13V | |
| Asus VivoBook 14X K3405 | |
| Genomsnitt Intel Core i5-13500H, NVIDIA GeForce RTX 3050 4GB Laptop GPU (n=1) | |
| Schenker Vision 14 2022 RTX 3050 Ti | |
| Lenovo Slim Pro 7 14ARP8 | |
| PCMark 10 / Essentials | |
| Gigabyte Aero 14 OLED BMF | |
| Acer Swift X SFX14-71G | |
| Genomsnitt av klass Multimedia (8025 - 11664, n=57, senaste 2 åren) | |
| Schenker Vision 14 2022 RTX 3050 Ti | |
| MSI Stealth 14 Studio A13V | |
| Asus VivoBook 14X K3405 | |
| Genomsnitt Intel Core i5-13500H, NVIDIA GeForce RTX 3050 4GB Laptop GPU (n=1) | |
| Lenovo Slim Pro 7 14ARP8 | |
| PCMark 10 / Productivity | |
| Genomsnitt av klass Multimedia (7323 - 18233, n=57, senaste 2 åren) | |
| Acer Swift X SFX14-71G | |
| Gigabyte Aero 14 OLED BMF | |
| Asus VivoBook 14X K3405 | |
| Genomsnitt Intel Core i5-13500H, NVIDIA GeForce RTX 3050 4GB Laptop GPU (n=1) | |
| Schenker Vision 14 2022 RTX 3050 Ti | |
| MSI Stealth 14 Studio A13V | |
| Lenovo Slim Pro 7 14ARP8 | |
| PCMark 10 / Digital Content Creation | |
| MSI Stealth 14 Studio A13V | |
| Genomsnitt av klass Multimedia (3651 - 16240, n=57, senaste 2 åren) | |
| Acer Swift X SFX14-71G | |
| Gigabyte Aero 14 OLED BMF | |
| Lenovo Slim Pro 7 14ARP8 | |
| Schenker Vision 14 2022 RTX 3050 Ti | |
| Asus VivoBook 14X K3405 | |
| Genomsnitt Intel Core i5-13500H, NVIDIA GeForce RTX 3050 4GB Laptop GPU (n=1) | |
| CrossMark / Overall | |
| Acer Swift X SFX14-71G | |
| Genomsnitt av klass Multimedia (866 - 2728, n=67, senaste 2 åren) | |
| Gigabyte Aero 14 OLED BMF | |
| MSI Stealth 14 Studio A13V | |
| Schenker Vision 14 2022 RTX 3050 Ti | |
| Asus VivoBook 14X K3405 | |
| Genomsnitt Intel Core i5-13500H, NVIDIA GeForce RTX 3050 4GB Laptop GPU (n=1) | |
| Lenovo Slim Pro 7 14ARP8 | |
| CrossMark / Productivity | |
| Acer Swift X SFX14-71G | |
| Gigabyte Aero 14 OLED BMF | |
| Genomsnitt av klass Multimedia (931 - 2489, n=67, senaste 2 åren) | |
| MSI Stealth 14 Studio A13V | |
| Schenker Vision 14 2022 RTX 3050 Ti | |
| Asus VivoBook 14X K3405 | |
| Genomsnitt Intel Core i5-13500H, NVIDIA GeForce RTX 3050 4GB Laptop GPU (n=1) | |
| Lenovo Slim Pro 7 14ARP8 | |
| CrossMark / Creativity | |
| Genomsnitt av klass Multimedia (907 - 3465, n=67, senaste 2 åren) | |
| Acer Swift X SFX14-71G | |
| Gigabyte Aero 14 OLED BMF | |
| MSI Stealth 14 Studio A13V | |
| Schenker Vision 14 2022 RTX 3050 Ti | |
| Asus VivoBook 14X K3405 | |
| Genomsnitt Intel Core i5-13500H, NVIDIA GeForce RTX 3050 4GB Laptop GPU (n=1) | |
| Lenovo Slim Pro 7 14ARP8 | |
| CrossMark / Responsiveness | |
| Acer Swift X SFX14-71G | |
| Gigabyte Aero 14 OLED BMF | |
| MSI Stealth 14 Studio A13V | |
| Schenker Vision 14 2022 RTX 3050 Ti | |
| Genomsnitt av klass Multimedia (605 - 2024, n=67, senaste 2 åren) | |
| Asus VivoBook 14X K3405 | |
| Genomsnitt Intel Core i5-13500H, NVIDIA GeForce RTX 3050 4GB Laptop GPU (n=1) | |
| Lenovo Slim Pro 7 14ARP8 | |
| AIDA64 / Memory Copy | |
| Genomsnitt av klass Multimedia (21158 - 132135, n=61, senaste 2 åren) | |
| Gigabyte Aero 14 OLED BMF | |
| Acer Swift X SFX14-71G | |
| MSI Stealth 14 Studio A13V | |
| Lenovo Slim Pro 7 14ARP8 | |
| Schenker Vision 14 2022 RTX 3050 Ti | |
| Asus VivoBook 14X K3405 | |
| Genomsnitt Intel Core i5-13500H, NVIDIA GeForce RTX 3050 4GB Laptop GPU (n=1) | |
| AIDA64 / Memory Read | |
| Genomsnitt av klass Multimedia (19699 - 174586, n=61, senaste 2 åren) | |
| Gigabyte Aero 14 OLED BMF | |
| MSI Stealth 14 Studio A13V | |
| Acer Swift X SFX14-71G | |
| Lenovo Slim Pro 7 14ARP8 | |
| Asus VivoBook 14X K3405 | |
| Genomsnitt Intel Core i5-13500H, NVIDIA GeForce RTX 3050 4GB Laptop GPU (n=1) | |
| Schenker Vision 14 2022 RTX 3050 Ti | |
| AIDA64 / Memory Write | |
| Gigabyte Aero 14 OLED BMF | |
| Genomsnitt av klass Multimedia (17733 - 134998, n=61, senaste 2 åren) | |
| Acer Swift X SFX14-71G | |
| Lenovo Slim Pro 7 14ARP8 | |
| MSI Stealth 14 Studio A13V | |
| Schenker Vision 14 2022 RTX 3050 Ti | |
| Asus VivoBook 14X K3405 | |
| Genomsnitt Intel Core i5-13500H, NVIDIA GeForce RTX 3050 4GB Laptop GPU (n=1) | |
| AIDA64 / Memory Latency | |
| Genomsnitt av klass Multimedia (7 - 535, n=60, senaste 2 åren) | |
| Lenovo Slim Pro 7 14ARP8 | |
| Acer Swift X SFX14-71G | |
| Gigabyte Aero 14 OLED BMF | |
| Schenker Vision 14 2022 RTX 3050 Ti | |
| Asus VivoBook 14X K3405 | |
| Genomsnitt Intel Core i5-13500H, NVIDIA GeForce RTX 3050 4GB Laptop GPU (n=1) | |
| MSI Stealth 14 Studio A13V | |
* ... mindre är bättre
| PCMark 8 Home Score Accelerated v2 | 5514 poäng | |
| PCMark 8 Work Score Accelerated v2 | 6078 poäng | |
| PCMark 10 Score | 6645 poäng | |
Hjälp | ||
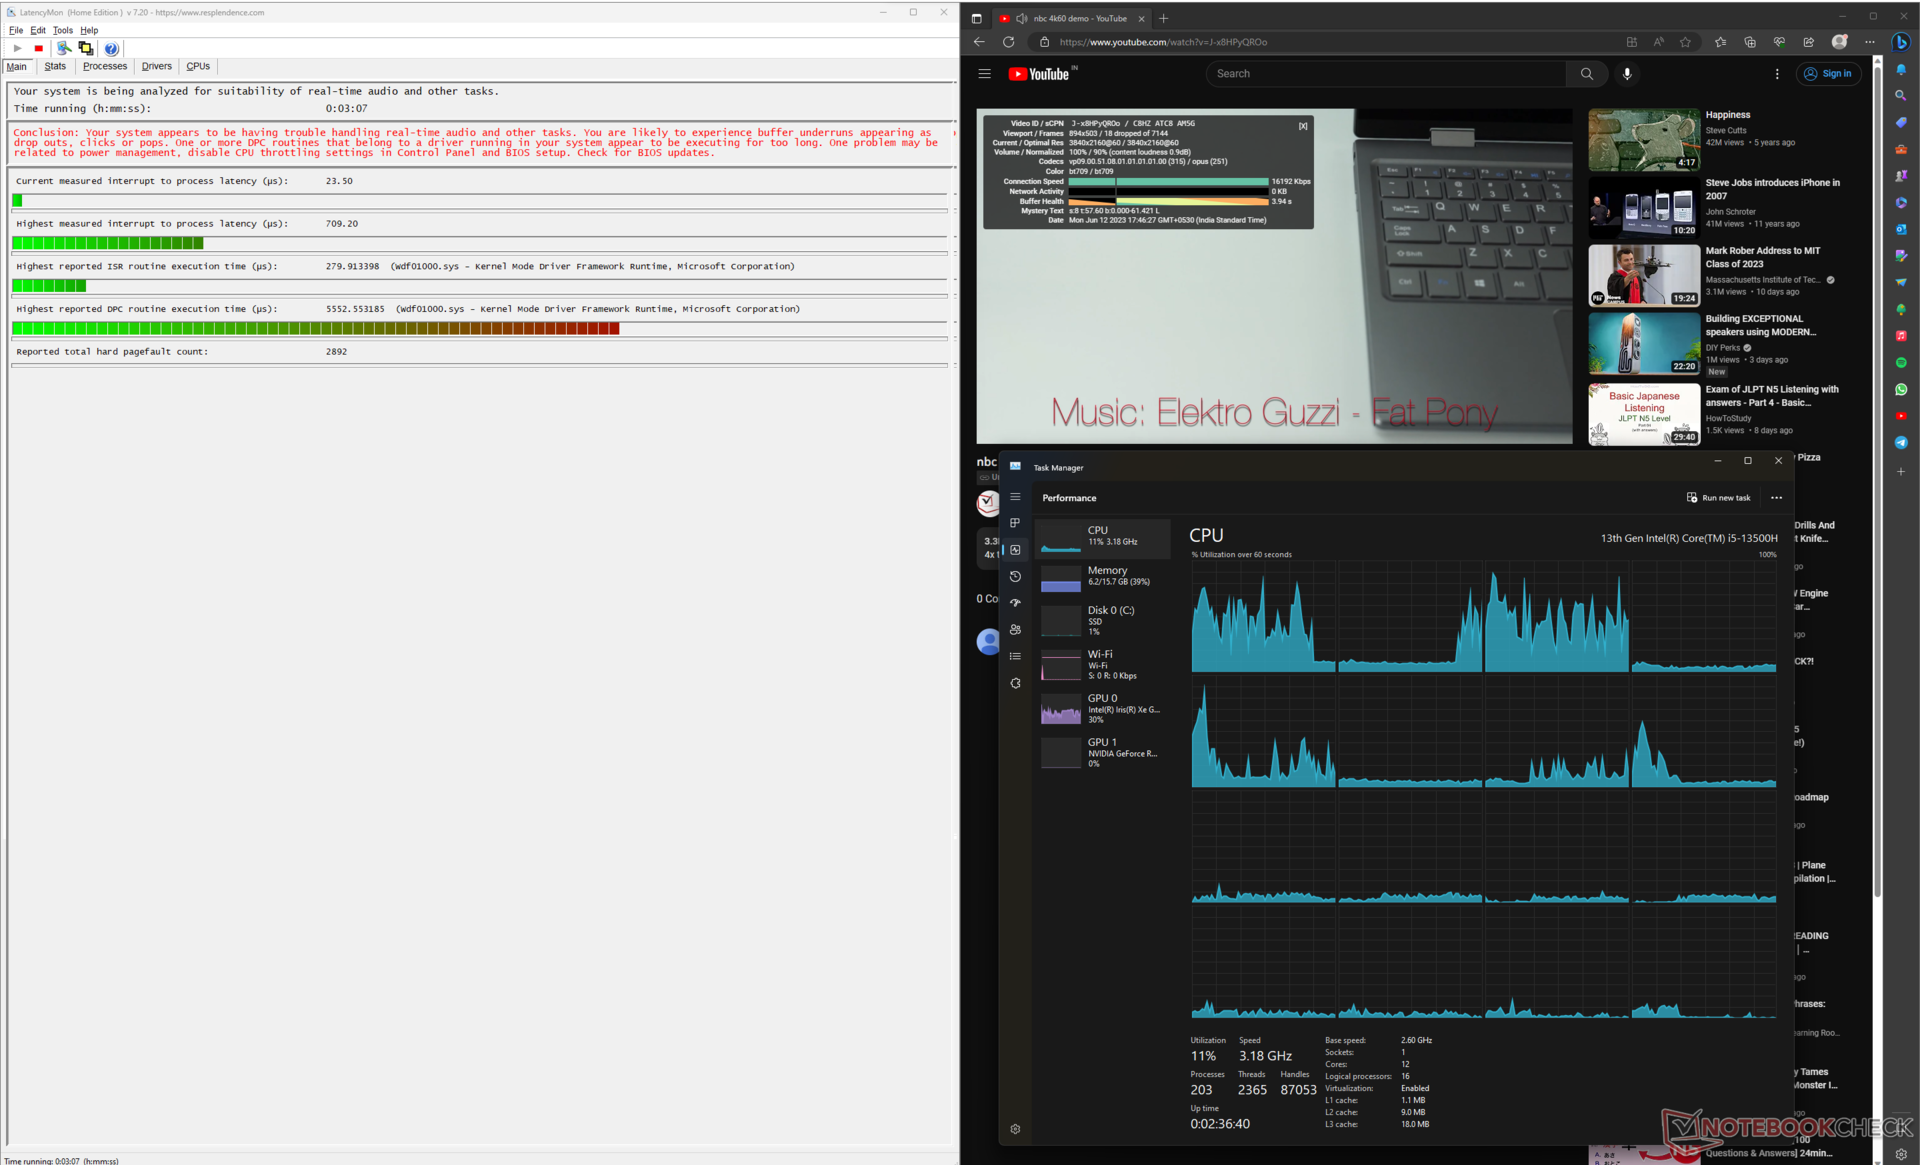
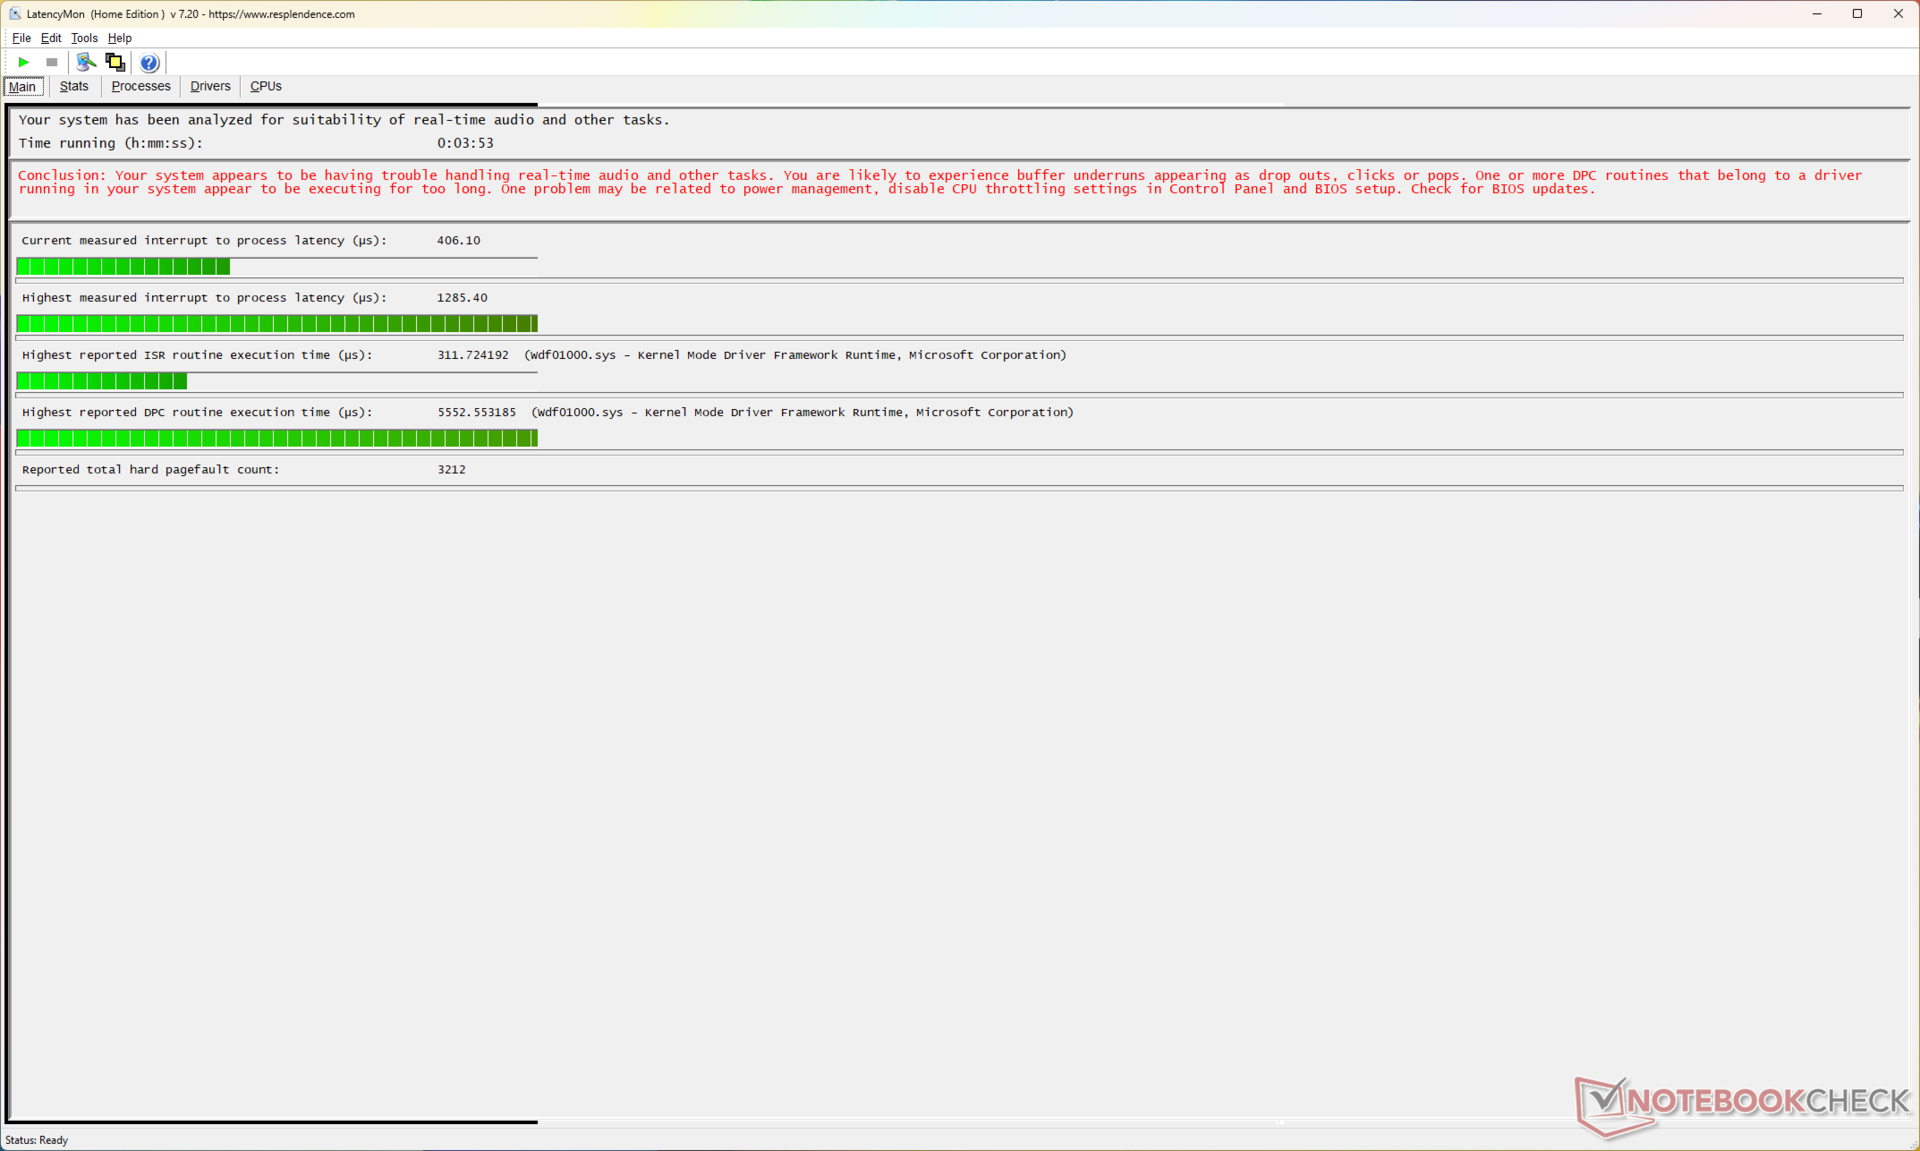
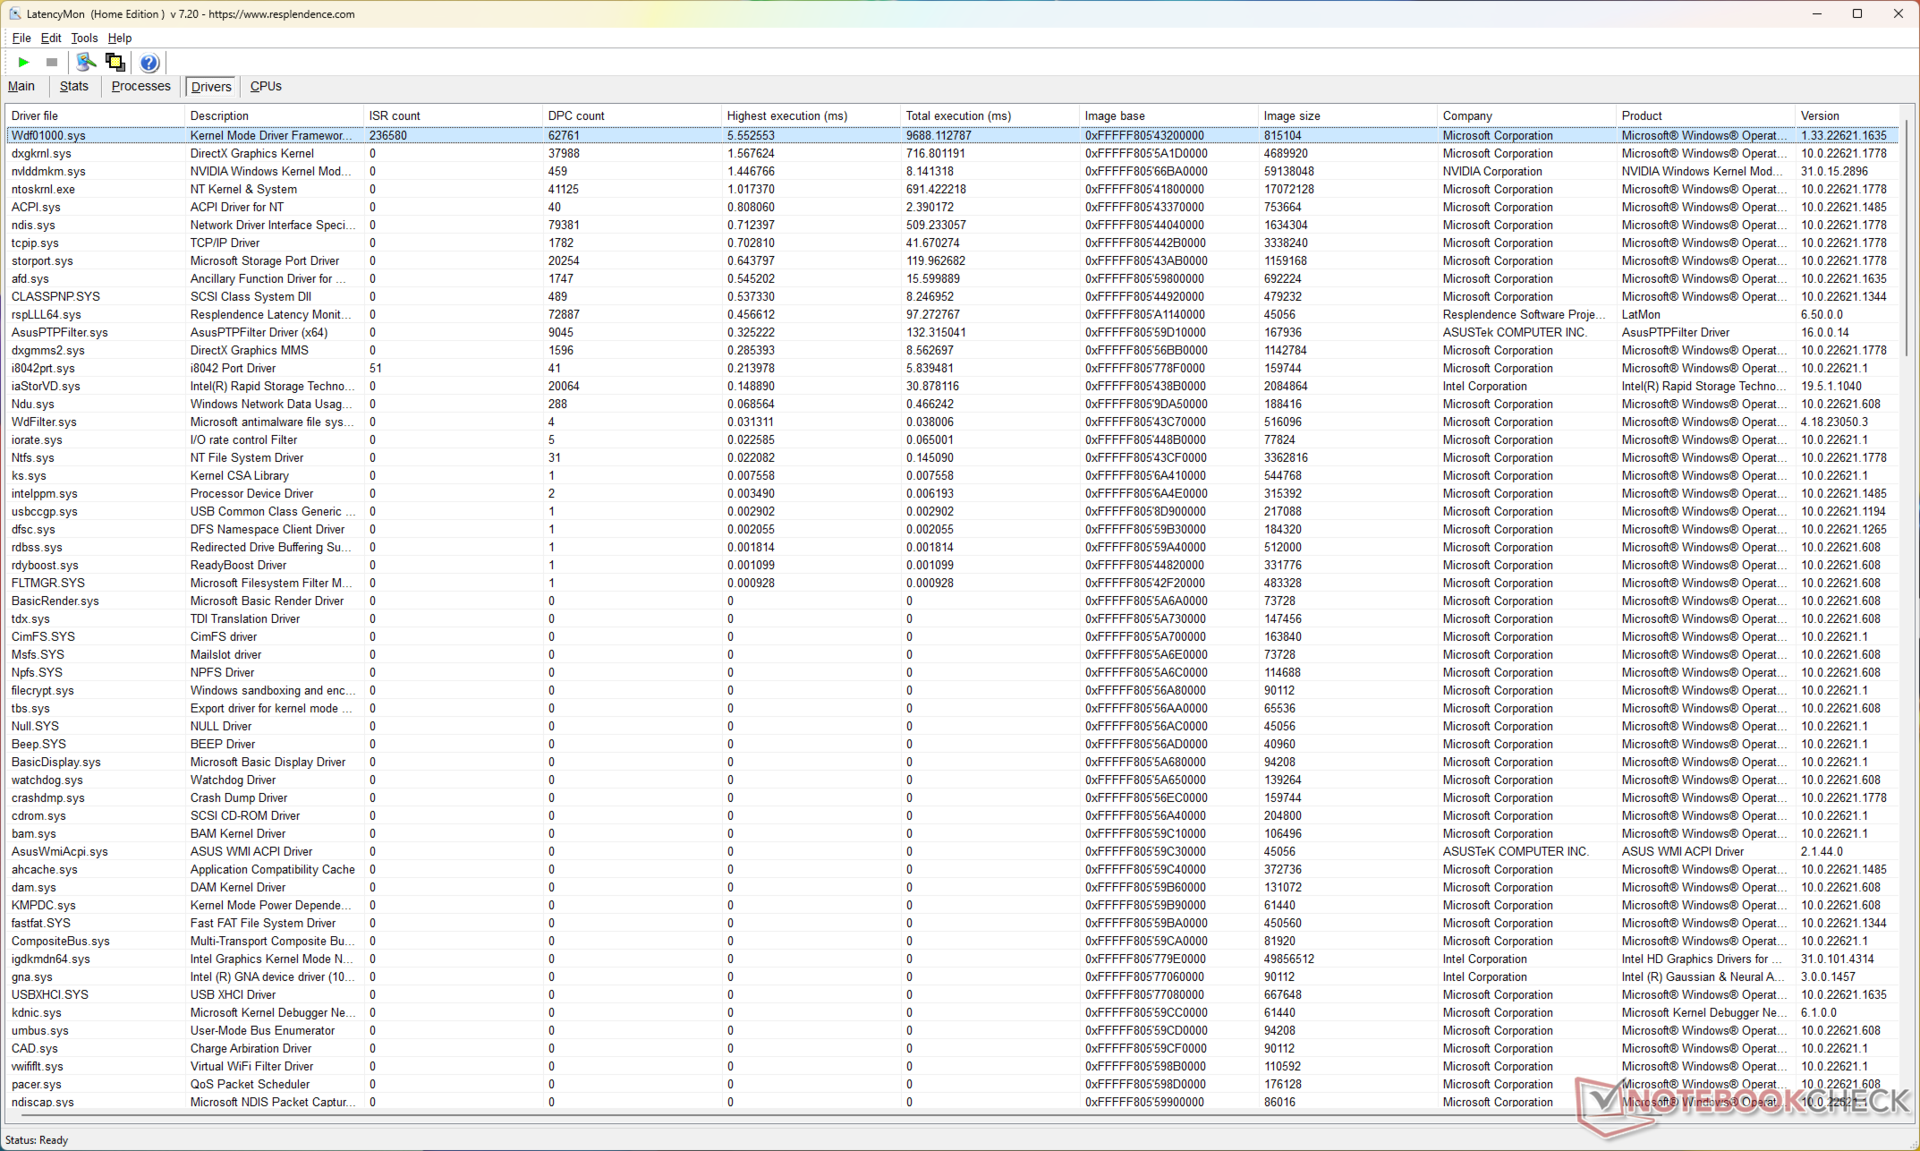
DPC-fördröjning
DPC-latens verkar vara på den högre sidan. Den uppmätta interrupt-till-process-latenstiden var ursprungligen 709,20 µs under uppspelning av en 4K YouTube-video.
Detta värde ökade till 1285,40 µs efter en 10-sekunders Prime95-stress, vilket tyder på att arbetsflöden i realtid kan påverkas under tung belastning.
| DPC Latencies / LatencyMon - interrupt to process latency (max), Web, Youtube, Prime95 | |
| Acer Swift X SFX14-71G | |
| Gigabyte Aero 14 OLED BMF | |
| MSI Stealth 14 Studio A13V | |
| Lenovo Slim Pro 7 14ARP8 | |
| Asus VivoBook 14X K3405 | |
| Schenker Vision 14 2022 RTX 3050 Ti | |
* ... mindre är bättre
VårDPC-rankning av latenssida innehåller fler latensjämförelser mellan granskade enheter.
Lagringsenheter
Den installerade Samsung PM9B1 NVMe SSD-enheten erbjuder tillfredsställande prestanda för de flesta applikationer. Asus har tillhandahållit en termisk pad under enheten, vilket hjälper till att upprätthålla relativt stabil prestanda under DiskSpd read loop-testet.
Med detta sagt faller PM9B1 SSD betydligt bakom konkurrenterna i nästan alla aspekter utom för 4K-skrivningar. Det finns inget utrymme för lagringsexpansion.

* ... mindre är bättre
Disk Throttling: DiskSpd Read Loop, Queue Depth 8
Fler jämförelser av lagringsprestanda finns i våra HDD- och SSD-riktmärken sida.
GPU-prestanda
Asus implementerar en 40 W Nvidia GeForce RTX 3050 4 GB GPU för bärbar dator i VivoBook 14X. RTX 3050 4 GB är föråldrad för en 2023-enhet med en 13:e generationens Intel-processor, och vi ser detta återspeglas i syntetiska och spelbenchmarks.
Kumulativ 3DMark-prestanda minskar med 23% jämfört med RTX 3050 Ti i Schenker Vision 14och med 26 % jämfört med RTX 3050 6 GB i Lenovo Slim Pro 7.
VivoBook 14X faller också efter med 38% mot den nyare 35 W RTX 4050 i Gigabyte Aero 14 OLED.
| 3DMark 11 Performance | 13942 poäng | |
| 3DMark Ice Storm Standard Score | 70334 poäng | |
| 3DMark Cloud Gate Standard Score | 36793 poäng | |
| 3DMark Fire Strike Score | 8504 poäng | |
| 3DMark Fire Strike Extreme Score | 4371 poäng | |
| 3DMark Time Spy Score | 3832 poäng | |
Hjälp | ||
| Blender / v3.3 Classroom OPTIX/RTX | |
| Asus VivoBook 14X K3405 | |
| Genomsnitt NVIDIA GeForce RTX 3050 4GB Laptop GPU (53 - 99, n=12) | |
| Lenovo Slim Pro 7 14ARP8 | |
| Schenker Vision 14 2022 RTX 3050 Ti | |
| Genomsnitt av klass Multimedia (12 - 105, n=24, senaste 2 åren) | |
| Gigabyte Aero 14 OLED BMF | |
| Acer Swift X SFX14-71G | |
| MSI Stealth 14 Studio A13V | |
| Blender / v3.3 Classroom CUDA | |
| Asus VivoBook 14X K3405 | |
| Asus VivoBook 14X K3405 | |
| Genomsnitt NVIDIA GeForce RTX 3050 4GB Laptop GPU (97 - 152, n=13) | |
| Lenovo Slim Pro 7 14ARP8 | |
| Schenker Vision 14 2022 RTX 3050 Ti | |
| Gigabyte Aero 14 OLED BMF | |
| Genomsnitt av klass Multimedia (20 - 186, n=24, senaste 2 åren) | |
| Acer Swift X SFX14-71G | |
| Blender / v3.3 Classroom CPU | |
| Genomsnitt NVIDIA GeForce RTX 3050 4GB Laptop GPU (388 - 937, n=11) | |
| Acer Swift X SFX14-71G | |
| Schenker Vision 14 2022 RTX 3050 Ti | |
| Gigabyte Aero 14 OLED BMF | |
| Asus VivoBook 14X K3405 | |
| Lenovo Slim Pro 7 14ARP8 | |
| Genomsnitt av klass Multimedia (134.5 - 1042, n=68, senaste 2 åren) | |
| MSI Stealth 14 Studio A13V | |
* ... mindre är bättre
Spelprestanda
VivoBook 14X riktar sig inte till en spelpublik men klarar ändå av hyfsade 1080p Ultra-spel, särskilt med mindre krävande eSport-titlar.
Märkbara ökningar av bildfrekvensen kan uppnås genom att utnyttja uppskalningsalgoritmer i spel som stöds.
| The Witcher 3 - 1920x1080 Ultra Graphics & Postprocessing (HBAO+) | |
| MSI Stealth 14 Studio A13V | |
| Gigabyte Aero 14 OLED BMF | |
| Gigabyte Aero 14 OLED BMF | |
| Acer Swift X SFX14-71G | |
| Lenovo Slim Pro 7 14ARP8 | |
| Genomsnitt av klass Multimedia (11 - 121, n=13, senaste 2 åren) | |
| Schenker Vision 14 2022 RTX 3050 Ti | |
| Asus VivoBook 14X K3405 | |
| Final Fantasy XV Benchmark - 1920x1080 High Quality | |
| MSI Stealth 14 Studio A13V | |
| Acer Swift X SFX14-71G | |
| Gigabyte Aero 14 OLED BMF | |
| Genomsnitt av klass Multimedia (7.61 - 144.4, n=66, senaste 2 åren) | |
| Lenovo Slim Pro 7 14ARP8 | |
| Schenker Vision 14 2022 RTX 3050 Ti | |
| Asus VivoBook 14X K3405 | |
| Strange Brigade - 1920x1080 ultra AA:ultra AF:16 | |
| MSI Stealth 14 Studio A13V | |
| Acer Swift X SFX14-71G | |
| Gigabyte Aero 14 OLED BMF | |
| Genomsnitt av klass Multimedia (13.3 - 303, n=66, senaste 2 åren) | |
| Schenker Vision 14 2022 RTX 3050 Ti | |
| Asus VivoBook 14X K3405 | |
Witcher 3 FPS-diagram
Det finns inga större problem med GPU-kylningen eftersom vi ser relativt stabila bildfrekvenser när vi kör The Witcher 3 på 1080p Ultra.
Witcher 3 FPS Chart
| låg | med. | hög | ultra | QHD | 4K | |
|---|---|---|---|---|---|---|
| GTA V (2015) | 175 | 167.8 | 100.4 | 48.4 | 33.7 | 32 |
| The Witcher 3 (2015) | 150.4 | 68.8 | 70.6 | 40 | 24.4 | |
| Dota 2 Reborn (2015) | 163.4 | 141 | 135.3 | 115.3 | 57.1 | |
| Final Fantasy XV Benchmark (2018) | 99.4 | 52.5 | 37.7 | 27.3 | 15 | |
| X-Plane 11.11 (2018) | 111 | 95.2 | 78.9 | 66.1 | ||
| Far Cry 5 (2018) | 127 | 68 | 61 | 57 | 39 | 19 |
| Strange Brigade (2018) | 179.7 | 78.6 | 65.2 | 57.9 | 41.1 | 23.4 |
| F1 2021 (2021) | 232 | 123.6 | 96 | 44.1 | 32.1 | 12.7 |
| Cyberpunk 2077 1.6 (2022) | 51.7 | 38.2 | 28.4 | 25.3 | 15.6 | 5.57 |
| F1 22 (2022) | 119.4 | 108.5 | 75.2 | 21.3 | 13.2 | 5.9 |
Kolla in vår dedikerade Nvidia GeForce RTX 3050 GPU för bärbar dator för mer information och prestandajämförelser.
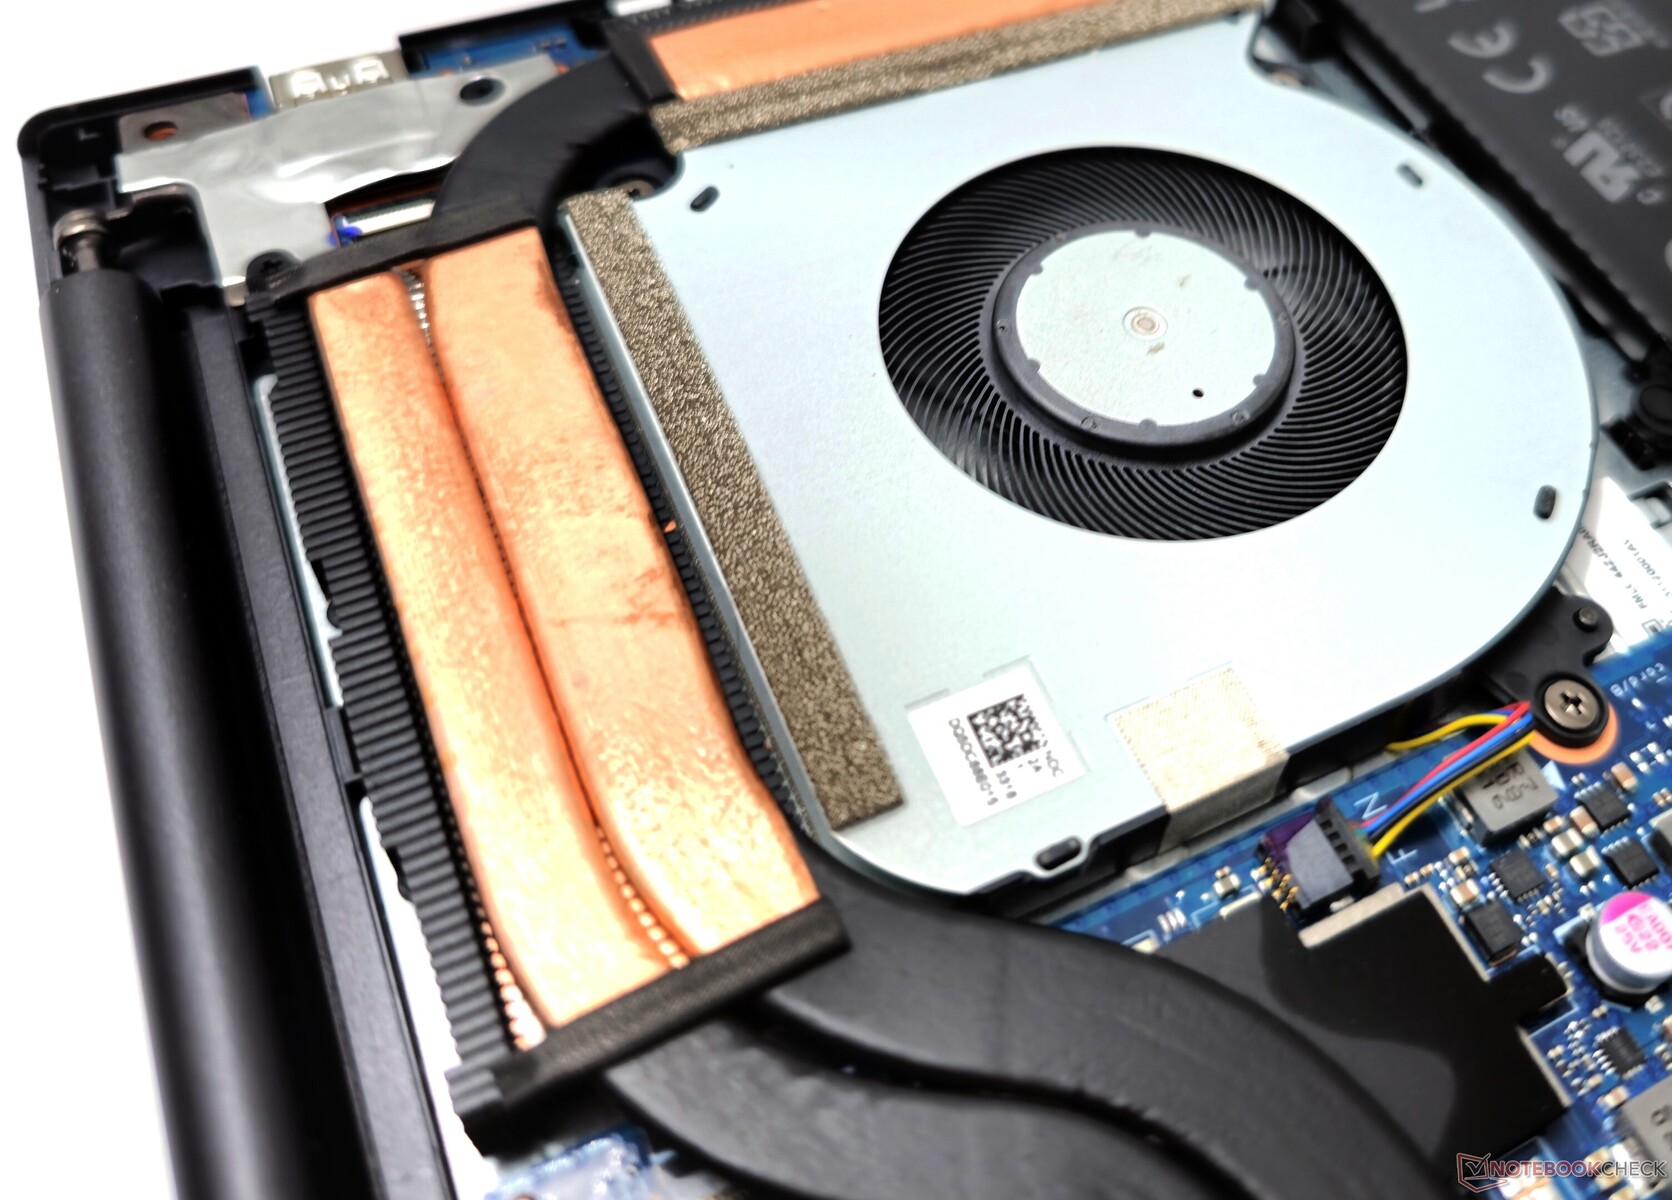
Utsläpp: Kombination med en fläkt och dubbla värmerör som drivs till max
Buller från systemet
Asus utrustar VivoBook 14X med en enda fläkt för att kyla både CPU och GPU. I likhet med våra resultat med andra VivoBook-modeller, verkar Asus ha satt en gräns för det maximala fläktljudet för varje prestandaprofil.
Företaget hävdar att fläktljudet är mindre än 40 dB(A) i standardprofilen. Vi registrerade ljudtrycksnivåer på 31 dB(A) i Whisper-läget, 42 dB(A) i Standard och nästan 53 dB(A) i Performance-läget.
Profilen för Full Speed-läget bibehåller en konsekvent SPL på nästan 53 dB(A) oavsett belastning.
Ljudnivå
| Låg belastning |
| 22.08 / 22.08 / 22.08 dB(A) |
| Hög belastning |
| 52.98 / 52.67 dB(A) |
 | ||
30 dB tyst 40 dB(A) hörbar 50 dB(A) högt ljud |
||
min: | ||
| Prestandaläge | Tomgång dB(A) | Genomsnittlig belastning dB(A) | Maximal belastning dB(A) | Witcher 3 1080p Ultra dB(A) |
|---|---|---|---|---|
| Viskning | 21,73 | 30,61 | 31,13 | 30,67 / 34 fps |
| Standard | 21,62 | 42,33 | 42,12 | 42,23 / 38 fps |
| Prestanda | 22.08 | 52.98 | 52.67 | 52.65 / 40 fps |
| Asus VivoBook 14X K3405 i5-13500H, GeForce RTX 3050 4GB Laptop GPU | Acer Swift X SFX14-71G i7-13700H, GeForce RTX 4050 Laptop GPU | MSI Stealth 14 Studio A13V i7-13700H, GeForce RTX 4050 Laptop GPU | Gigabyte Aero 14 OLED BMF i7-13700H, GeForce RTX 4050 Laptop GPU | Lenovo Slim Pro 7 14ARP8 R7 7735HS, GeForce RTX 3050 6GB Laptop GPU | Schenker Vision 14 2022 RTX 3050 Ti i7-12700H, GeForce RTX 3050 Ti Laptop GPU | |
|---|---|---|---|---|---|---|
| Noise | -14% | -10% | -11% | 4% | -4% | |
| av / miljö * (dB) | 21.46 | 24.8 -16% | 25.3 -18% | 24 -12% | 22.7 -6% | 24.4 -14% |
| Idle Minimum * (dB) | 22.08 | 28.2 -28% | 25.3 -15% | 24 -9% | 22.8 -3% | 24.4 -11% |
| Idle Average * (dB) | 22.08 | 31.8 -44% | 25 -13% | 24 -9% | 22.8 -3% | 24.4 -11% |
| Idle Maximum * (dB) | 22.08 | 31.8 -44% | 33.7 -53% | 35.71 -62% | 22.8 -3% | 27.8 -26% |
| Load Average * (dB) | 52.98 | 38.2 28% | 42.2 20% | 43.8 17% | 43.3 18% | |
| Witcher 3 ultra * (dB) | 52.7 | 50 5% | 51 3% | 40.22 24% | 43.8 17% | 48.2 9% |
| Load Maximum * (dB) | 52.67 | 52.2 1% | 51 3% | 51.93 1% | 47.1 11% | 48.8 7% |
* ... mindre är bättre
Temperatur
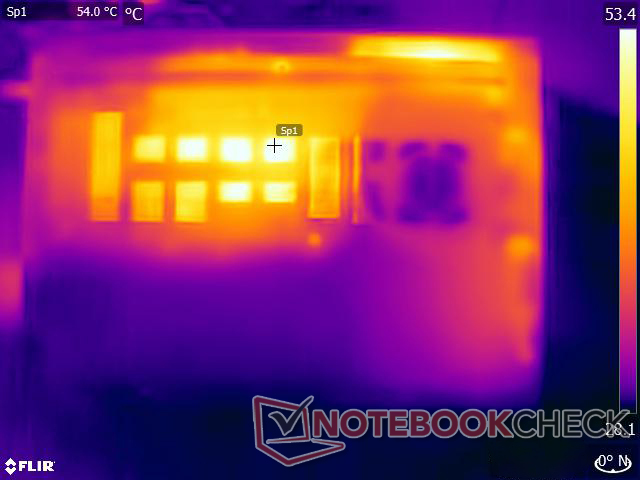
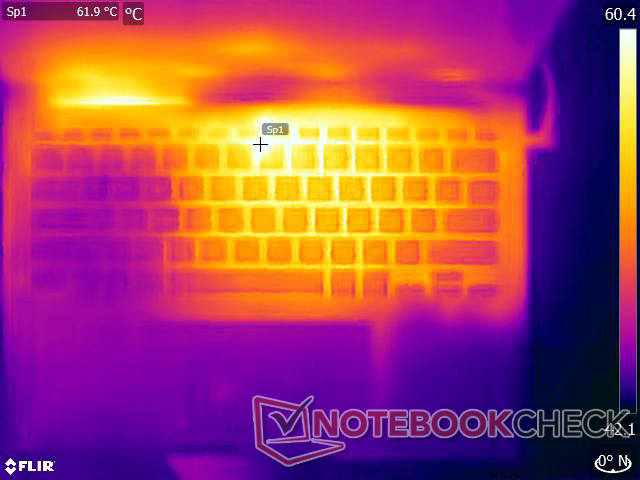
Asus hävdar förbättrad termisk prestanda med den nya fläktdesignen, men kombinationen med en fläkt och dubbla heatpipes har sina begränsningar när det gäller att hålla yttemperaturerna under kontroll under stress.
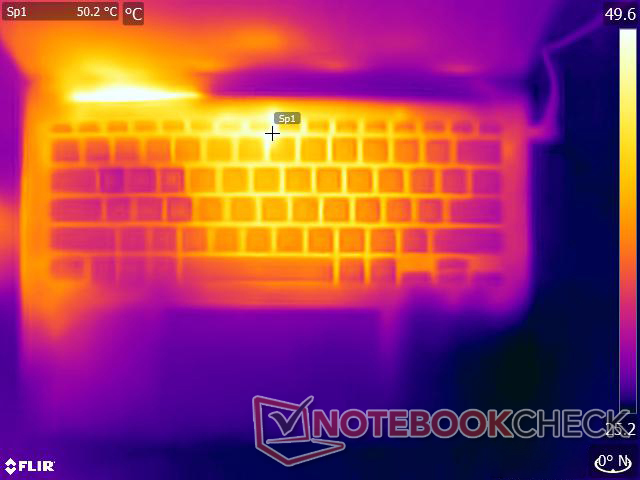
Vi registrerade temperaturer på upp till 49 °C på ovansidan och upp till 54 °C på undersidan under maximal belastning. Pekplattan och området där höger handflata vilar förblir dock relativt svala.
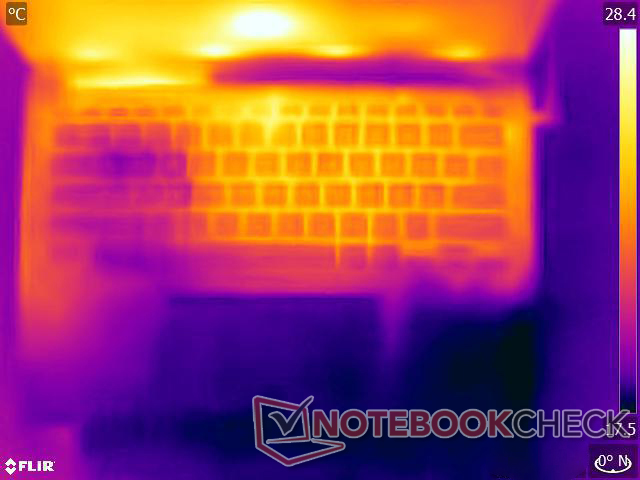
(-) Den maximala temperaturen på ovansidan är 49.2 °C / 121 F, jämfört med genomsnittet av 36.8 °C / 98 F , allt från 21 till 71 °C för klassen Multimedia.
(-) Botten värms upp till maximalt 54 °C / 129 F, jämfört med genomsnittet av 39.1 °C / 102 F
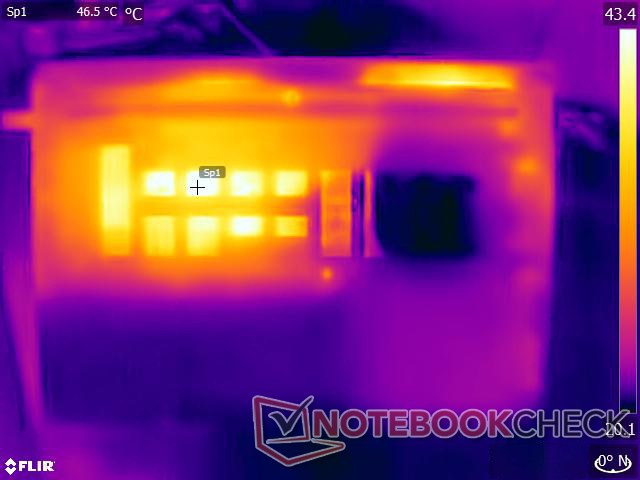
(+) Vid tomgångsbruk är medeltemperaturen för ovansidan 30.6 °C / 87 F, jämfört med enhetsgenomsnittet på 31.3 °C / ### class_avg_f### F.
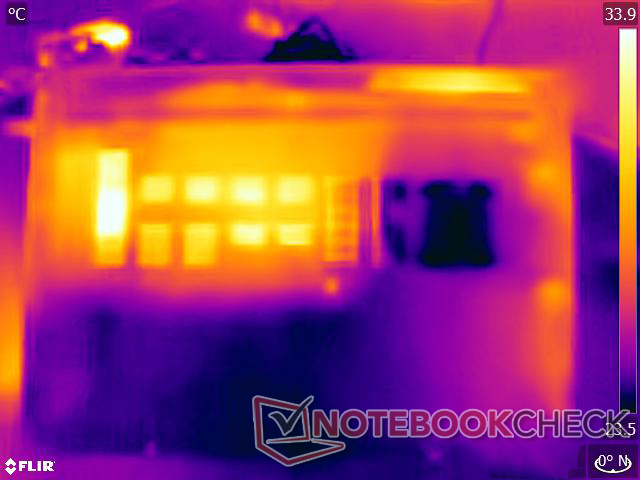
(±) När du spelar The Witcher 3 är medeltemperaturen för ovansidan 37.8 °C / 100 F, jämfört med enhetsgenomsnittet på 31.3 °C / ## #class_avg_f### F.
(+) Handledsstöden och pekplattan når maximal hudtemperatur (35.4 °C / 95.7 F) och är därför inte varma.
(-) Medeltemperaturen för handledsstödsområdet på liknande enheter var 28.7 °C / 83.7 F (-6.7 °C / -12 F).
| Asus VivoBook 14X K3405 Intel Core i5-13500H, NVIDIA GeForce RTX 3050 4GB Laptop GPU | Acer Swift X SFX14-71G Intel Core i7-13700H, NVIDIA GeForce RTX 4050 Laptop GPU | MSI Stealth 14 Studio A13V Intel Core i7-13700H, NVIDIA GeForce RTX 4050 Laptop GPU | Gigabyte Aero 14 OLED BMF Intel Core i7-13700H, NVIDIA GeForce RTX 4050 Laptop GPU | Lenovo Slim Pro 7 14ARP8 AMD Ryzen 7 7735HS, NVIDIA GeForce RTX 3050 6GB Laptop GPU | Schenker Vision 14 2022 RTX 3050 Ti Intel Core i7-12700H, NVIDIA GeForce RTX 3050 Ti Laptop GPU | |
|---|---|---|---|---|---|---|
| Heat | 16% | -0% | 18% | 21% | 9% | |
| Maximum Upper Side * (°C) | 49.2 | 46.4 6% | 46.9 5% | 42 15% | 42.2 14% | 48.4 2% |
| Maximum Bottom * (°C) | 54 | 49 9% | 56.1 -4% | 52 4% | 49 9% | 57.1 -6% |
| Idle Upper Side * (°C) | 33.6 | 26.5 21% | 33.8 -1% | 26 23% | 24.4 27% | 28.1 16% |
| Idle Bottom * (°C) | 37.6 | 26.6 29% | 37.9 -1% | 27 28% | 25.2 33% | 29 23% |
* ... mindre är bättre
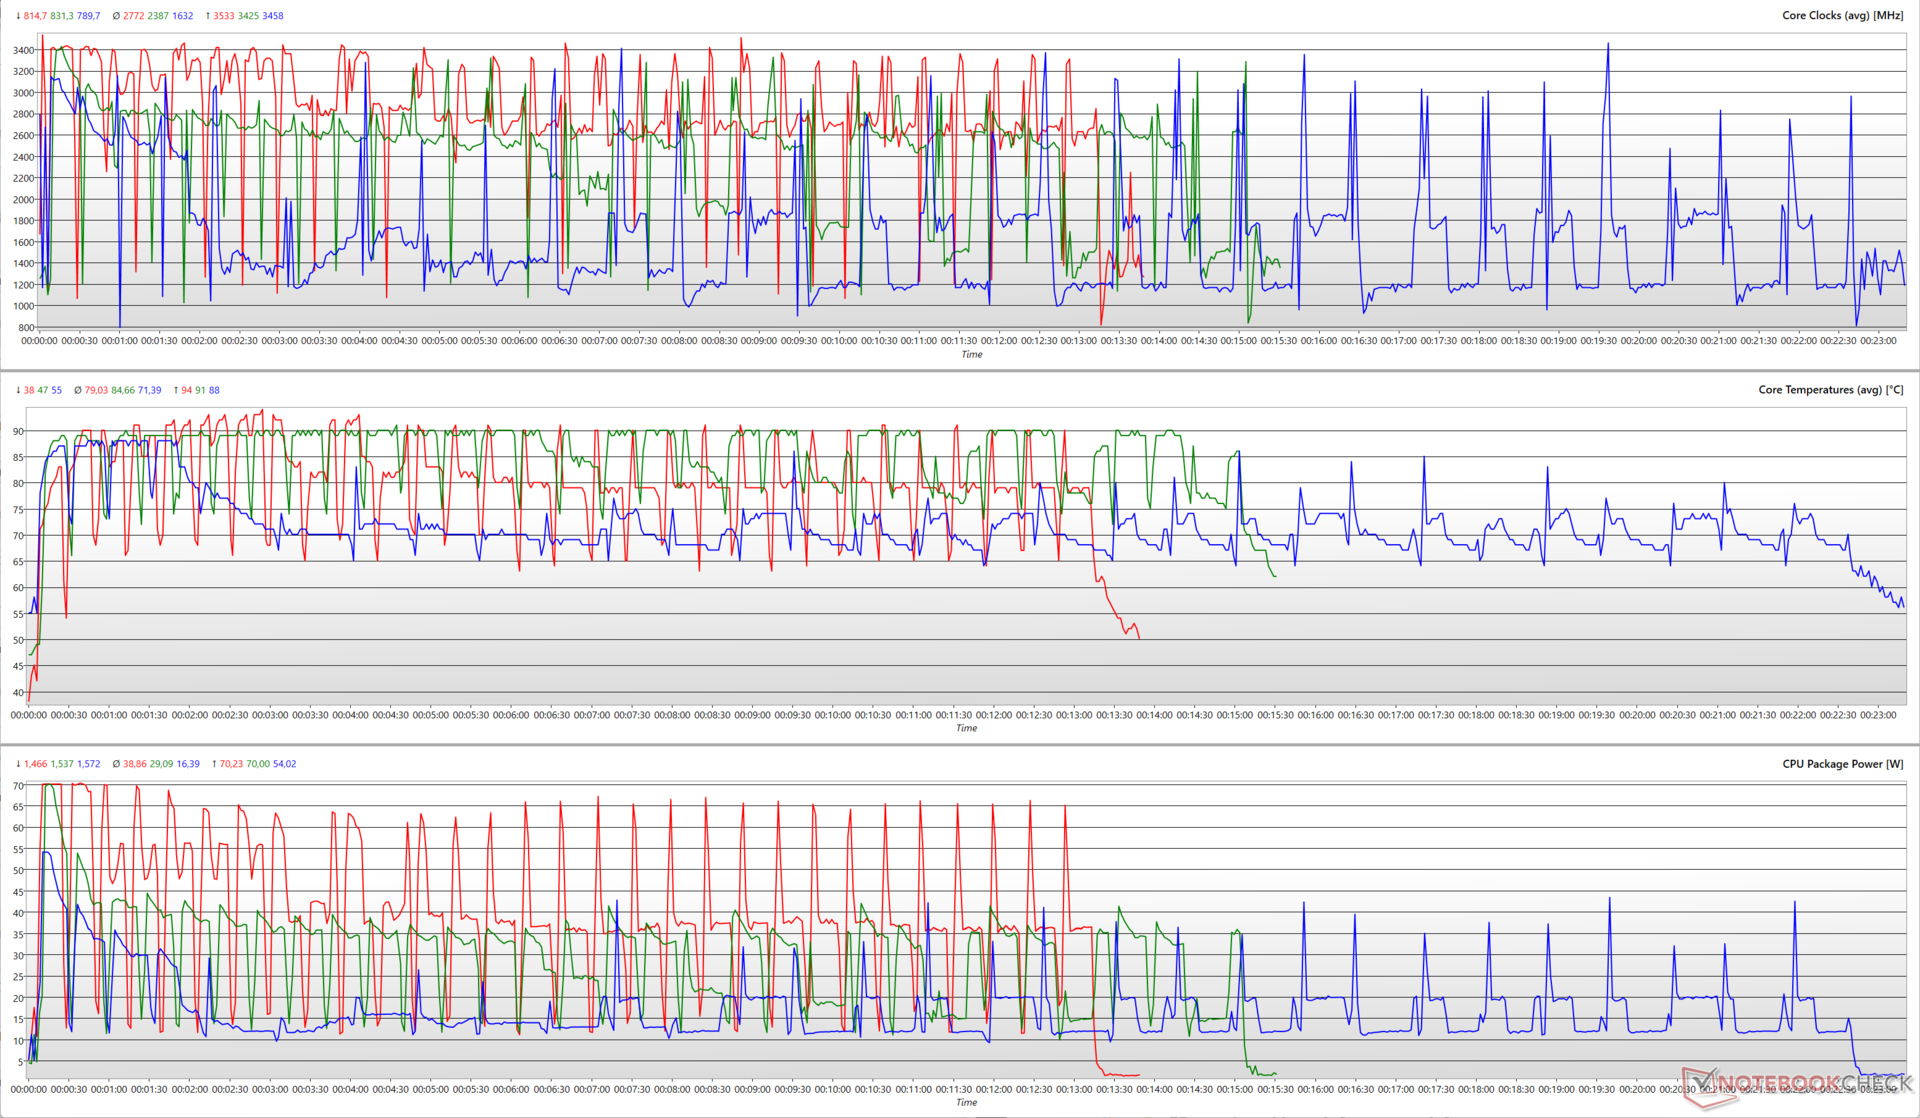
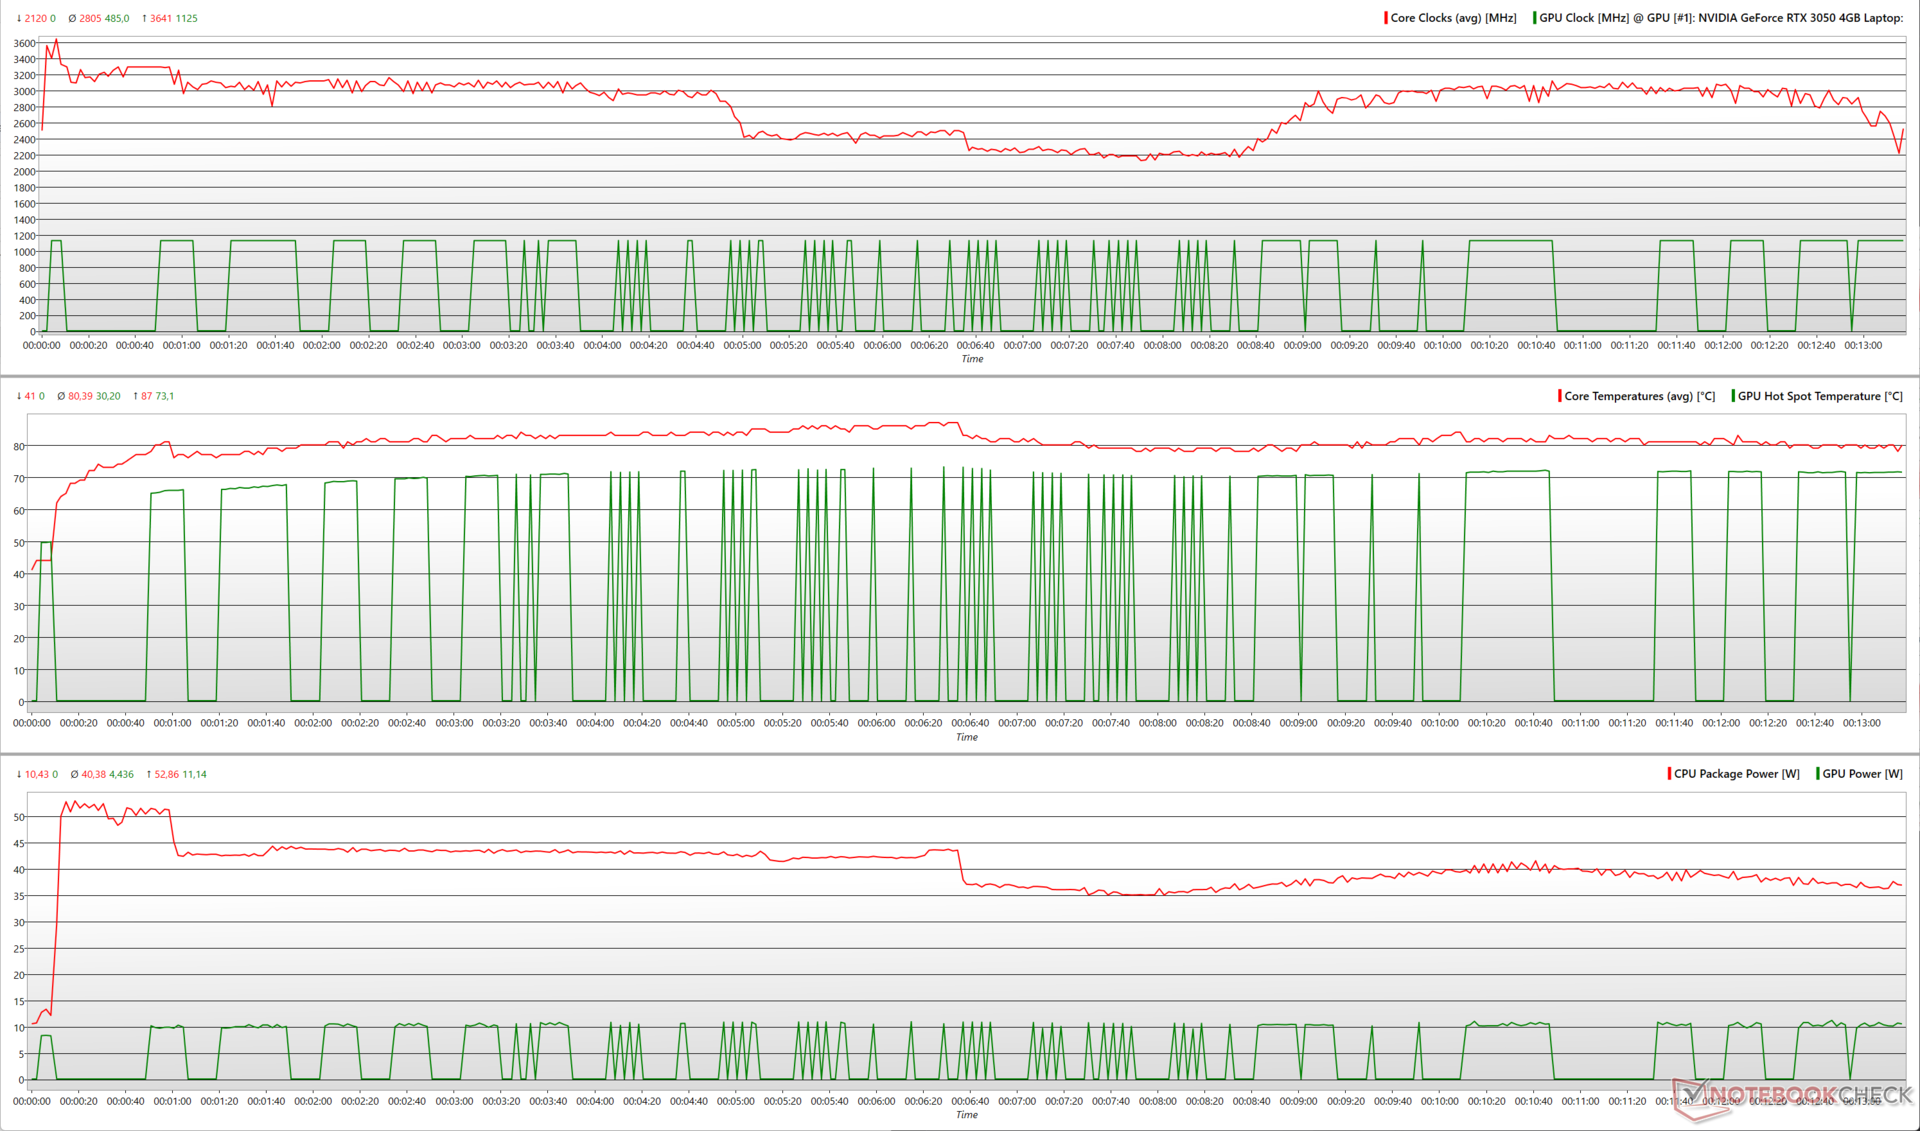
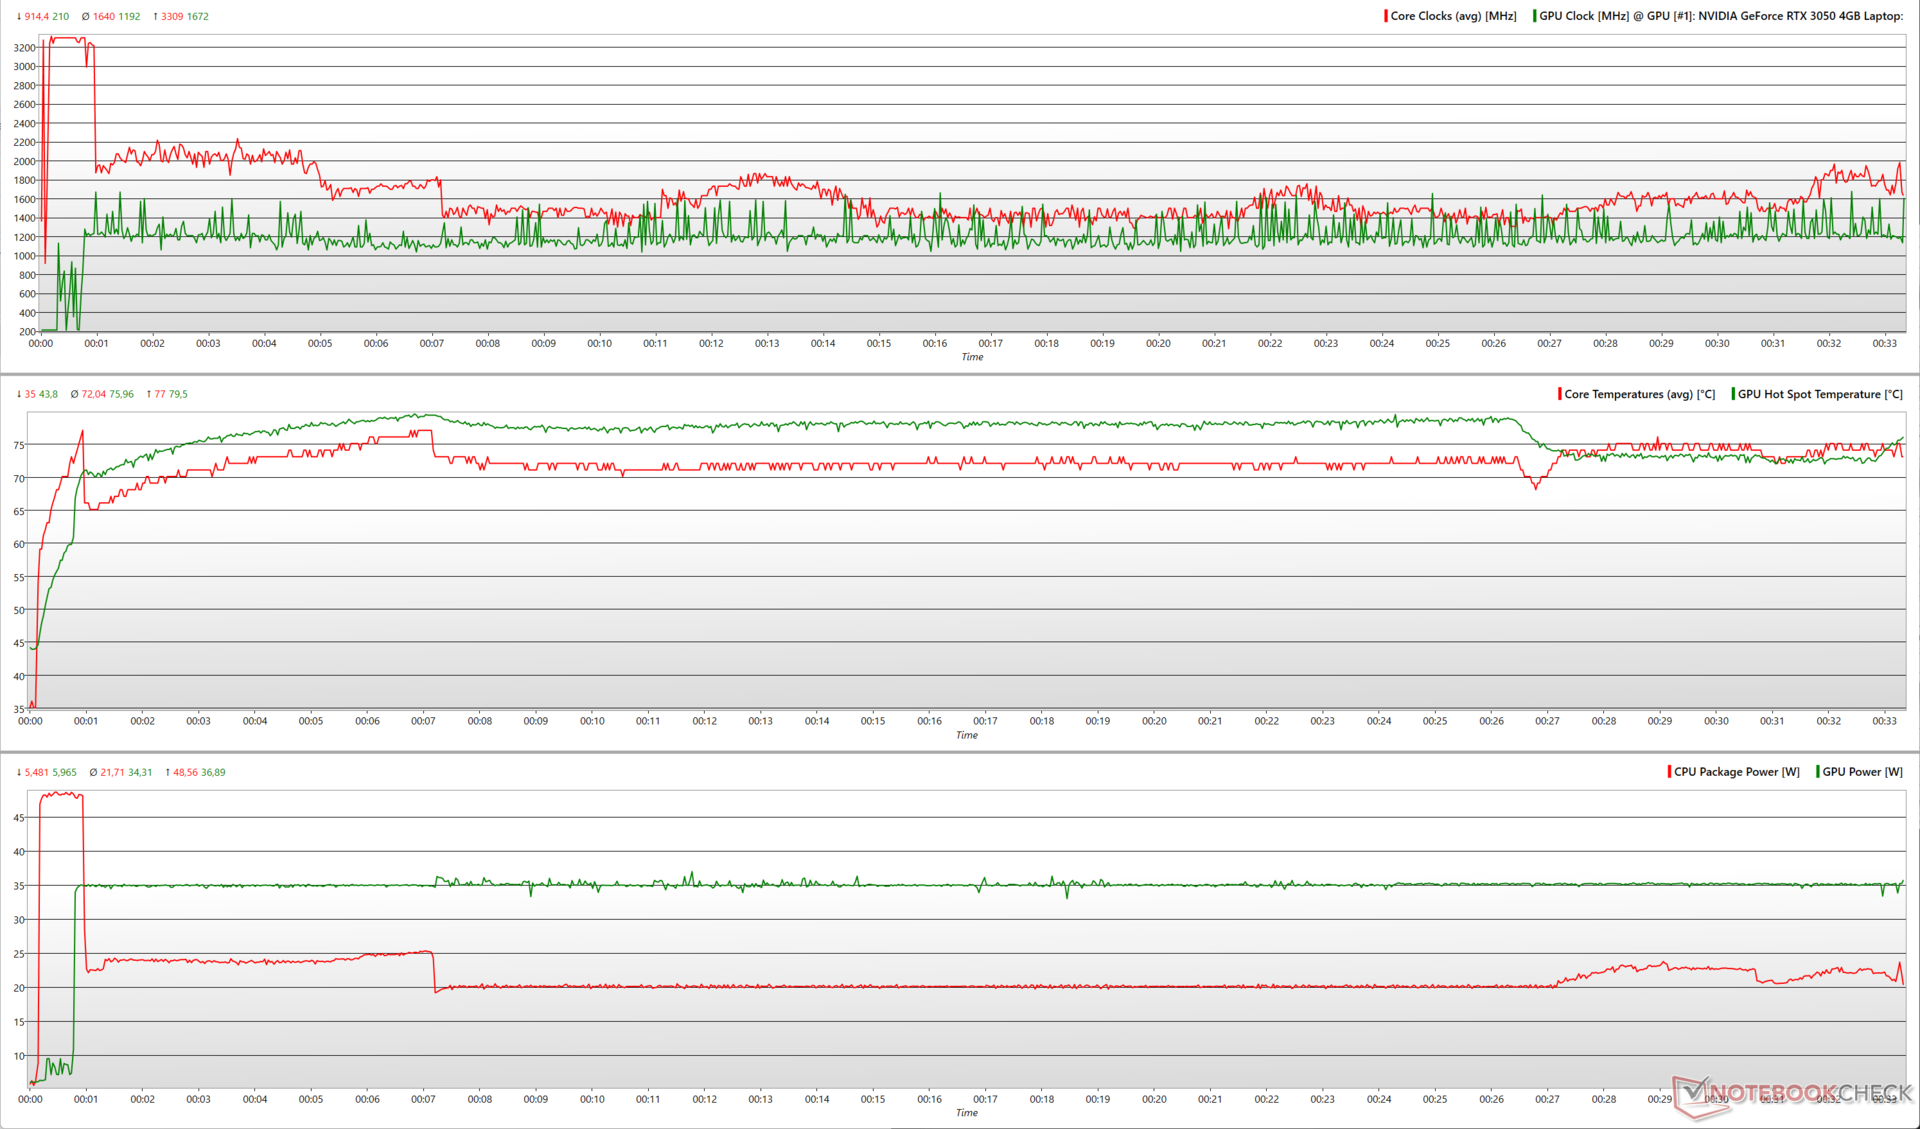
Stresstest
När VivoBook 14X belastas med Prime95 in-place stora FFT:er når Core i5-13500H en topp på 3,6 GHz och förbrukar nästan 53 W.
När FurMark läggs till mixen sjunker CPU:ns maximala paketförbrukning till 48,6 W och ligger kvar på 22 W. RTX 3050 visar genomsnittliga klockfrekvenser på 1 192 MHz med en energiförbrukning som ligger kvar på 34 W.
| Stresstest | CPU-klocka (GHz) | GPU-klocka (MHz) | Genomsnittlig CPU-temperatur (°C) | Genomsnittlig GPU-temperatur (°C) |
| System i viloläge | 3,8 | 0 | 40 | 25,1 |
| Prime95 | 2,95 | 0 | 80 | 25,3 |
| Prime95 + FurMark | 1,75 | 1 177 | 72 | 68,3 |
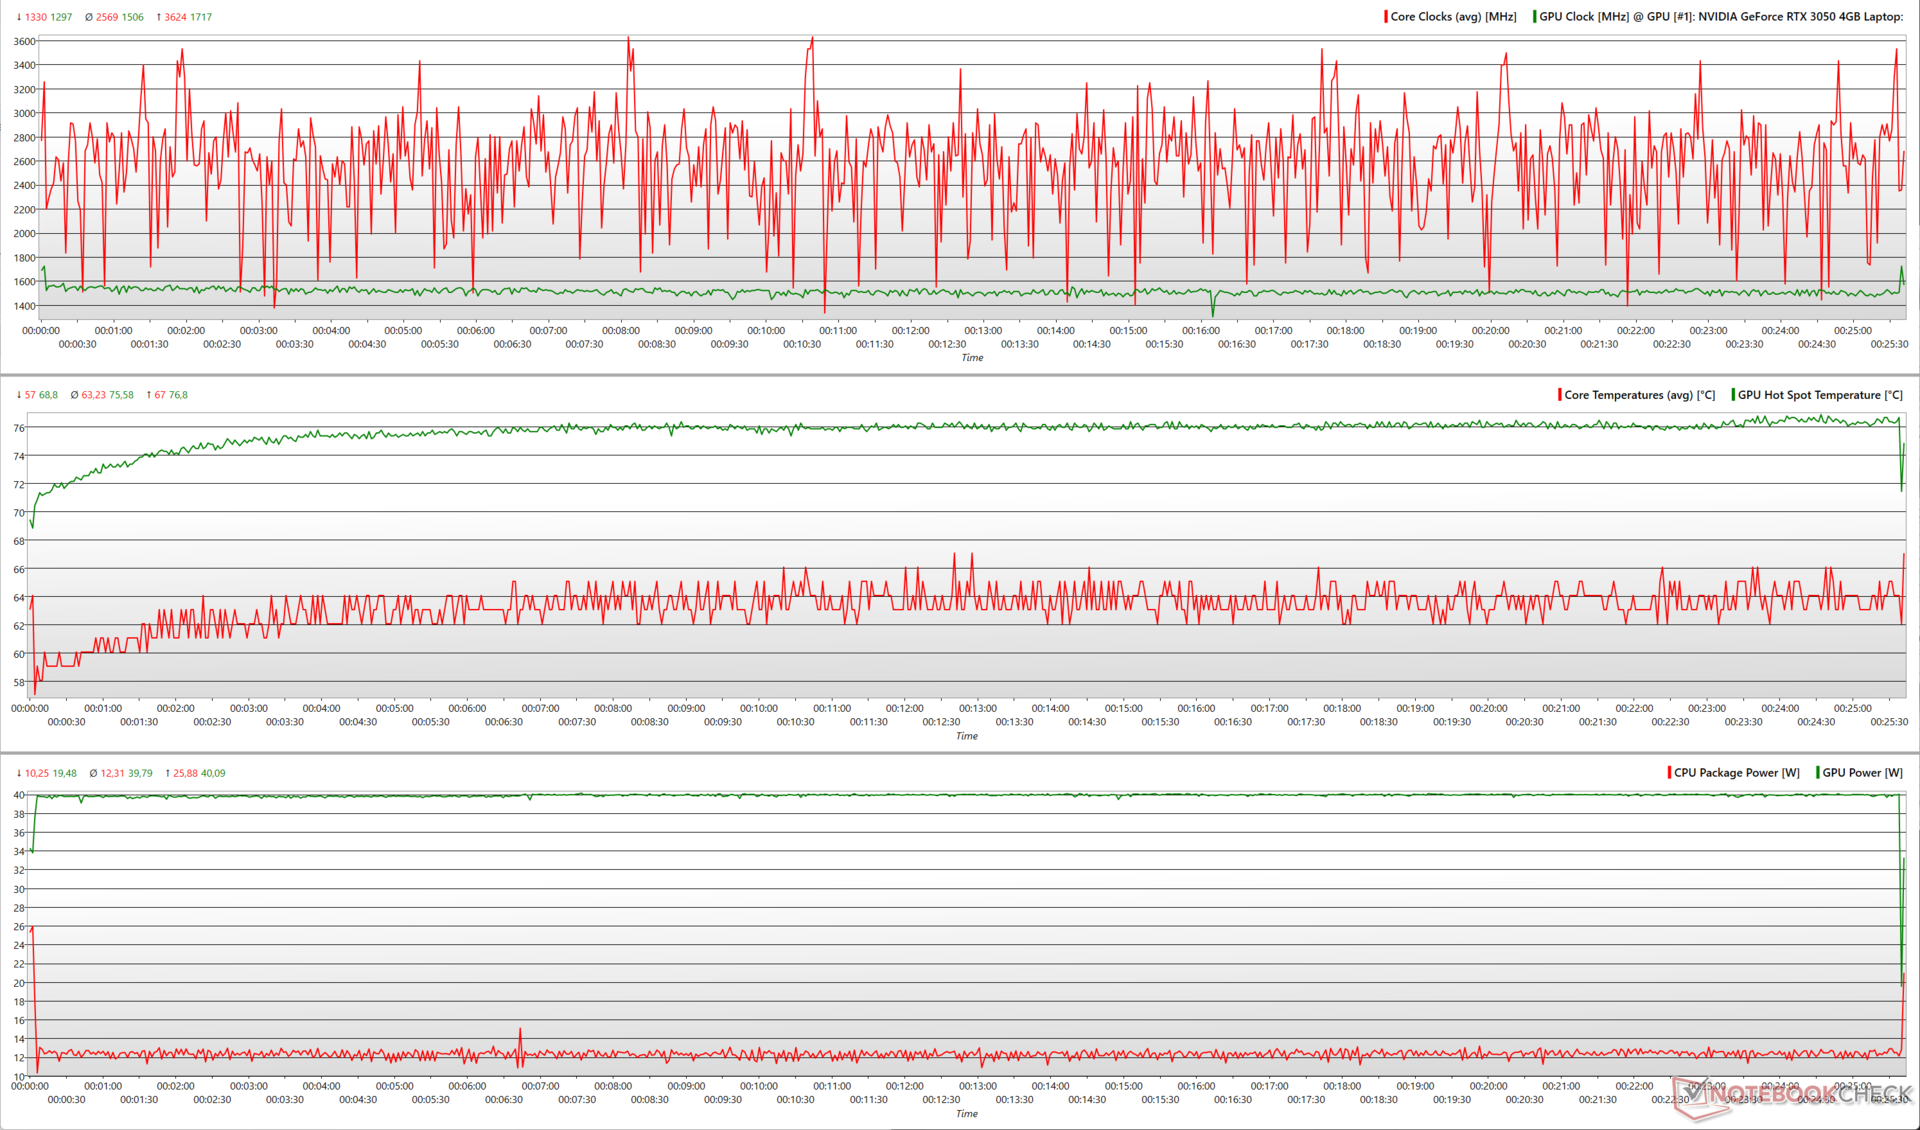
| The Witcher 3 1080p Ultra | 2,56 | 1 506 | 63,2 | 75,6 |
Med Witcher 3 på 1080p Ultra kan RTX 3050 toppa på 1 717 MHz och förbruka 40 W. Core i5-13500H ligger i genomsnitt på 12 W och ger en genomsnittlig klockfrekvens på cirka 2,6 GHz.
Enligt Asus har VivoBook 14X:s kylsystem råd med en kombinerad TDP på 55 W från CPU och GPU. Våra stresstester bekräftar detta påstående, eftersom vi observerar en genomsnittlig strömförbrukning på 56 W när vi kör Prime95 + FurMark och 52 W under stresstestet The Witcher 3.
Högtalare
Med en högsta ljudstyrka på 70,7 db(A) är VivoBook 14X:s stereohögtalare inte tillräckligt högljudda. Med det sagt kan Dirac-tuningen ge en viss mängd bas samtidigt som balanserade mellanregister och höga toner bibehålls.
Användare kan få en mycket bättre ljudupplevelse genom att ansluta externa ljudenheter via 3,5 mm ljuduttaget eller via Bluetooth 5.3.
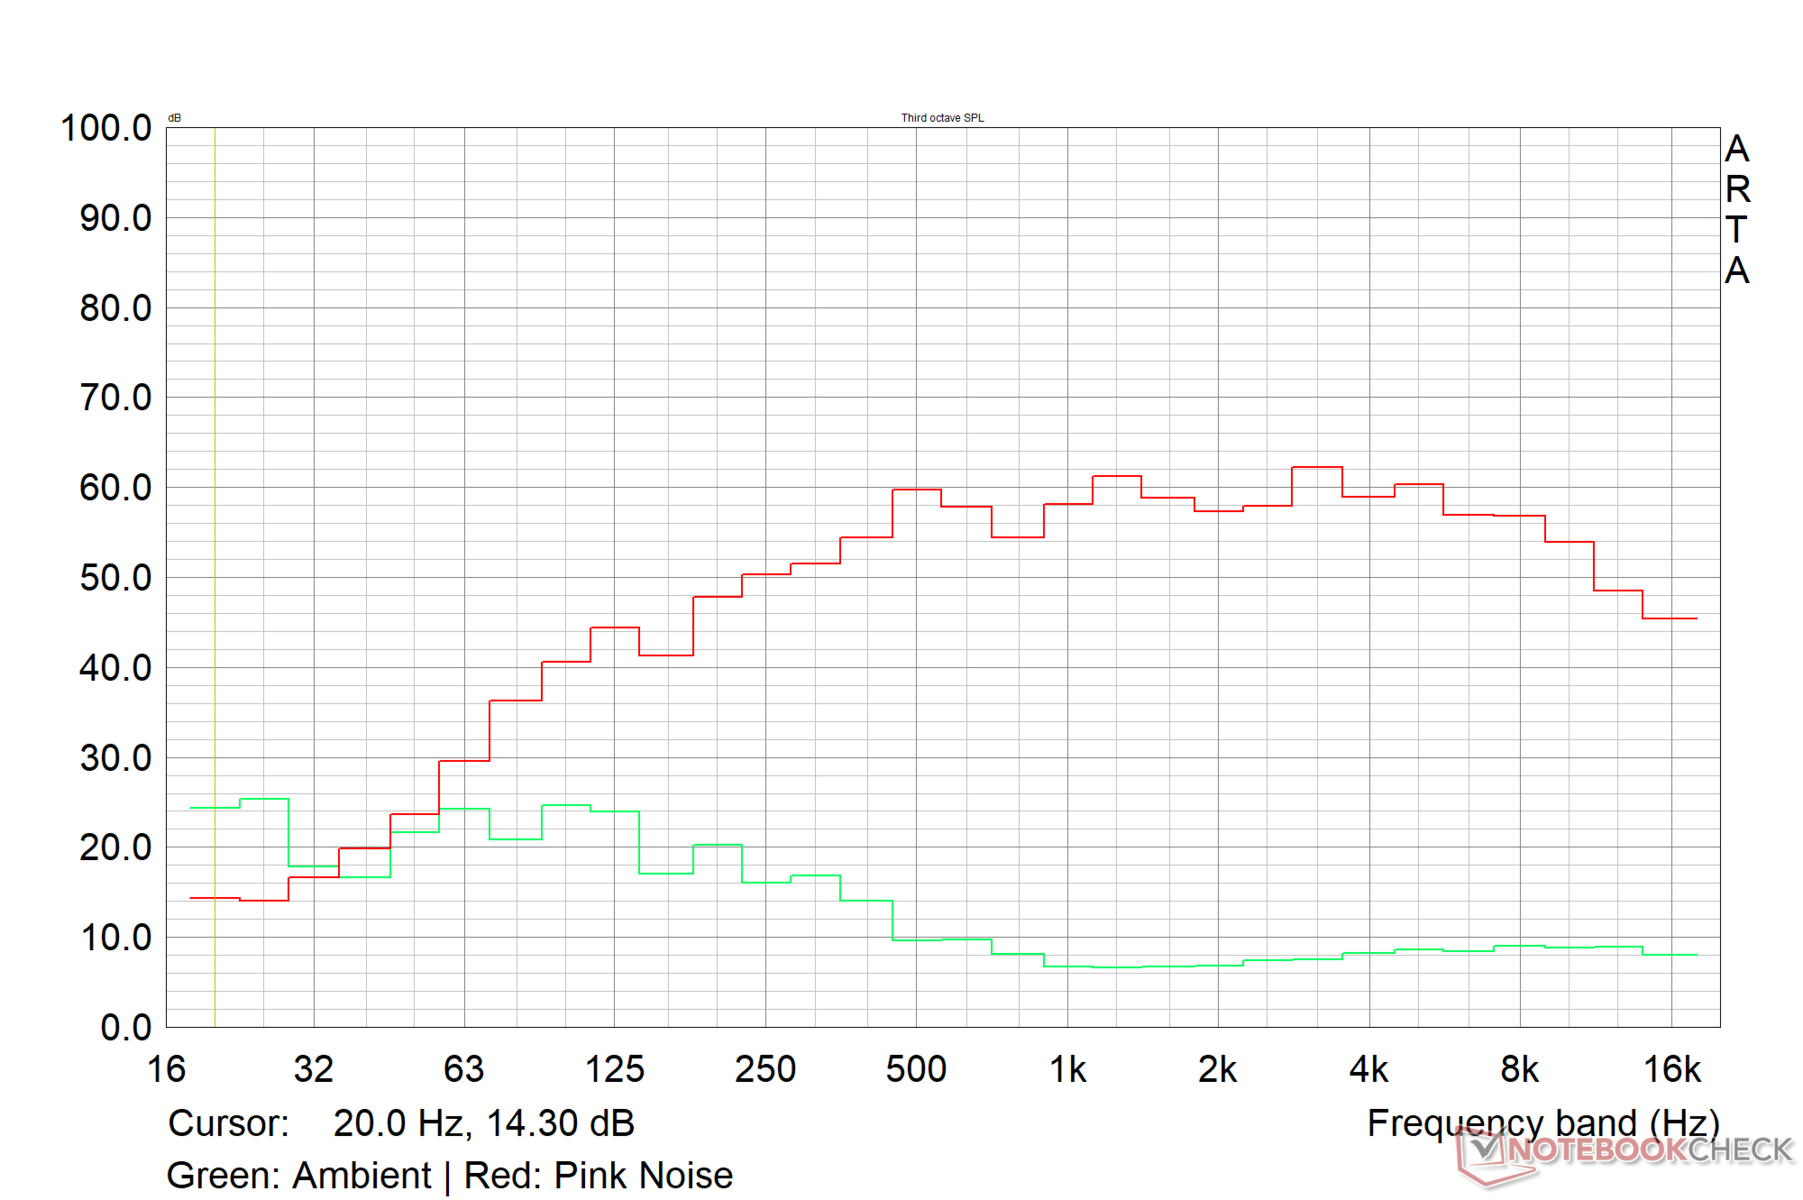
Asus VivoBook 14X K3405 ljudanalys
(-) | inte särskilt höga högtalare (70.7 dB)
Bas 100 - 315 Hz
(±) | reducerad bas - i genomsnitt 10.8% lägre än medianen
(±) | linjäriteten för basen är genomsnittlig (7.4% delta till föregående frekvens)
Mellan 400 - 2000 Hz
(+) | balanserad mellan - endast 2.1% från medianen
(+) | mids är linjära (6.3% delta till föregående frekvens)
Högsta 2 - 16 kHz
(+) | balanserade toppar - endast 2.2% från medianen
(+) | toppar är linjära (4.8% delta till föregående frekvens)
Totalt 100 - 16 000 Hz
(+) | det totala ljudet är linjärt (13.2% skillnad mot median)
Jämfört med samma klass
» 27% av alla testade enheter i den här klassen var bättre, 5% liknande, 68% sämre
» Den bästa hade ett delta på 5%, genomsnittet var 17%, sämst var 45%
Jämfört med alla testade enheter
» 13% av alla testade enheter var bättre, 3% liknande, 84% sämre
» Den bästa hade ett delta på 4%, genomsnittet var 24%, sämst var 134%
Apple MacBook Pro 16 2021 M1 Pro ljudanalys
(+) | högtalare kan spela relativt högt (84.7 dB)
Bas 100 - 315 Hz
(+) | bra bas - bara 3.8% från medianen
(+) | basen är linjär (5.2% delta till föregående frekvens)
Mellan 400 - 2000 Hz
(+) | balanserad mellan - endast 1.3% från medianen
(+) | mids är linjära (2.1% delta till föregående frekvens)
Högsta 2 - 16 kHz
(+) | balanserade toppar - endast 1.9% från medianen
(+) | toppar är linjära (2.7% delta till föregående frekvens)
Totalt 100 - 16 000 Hz
(+) | det totala ljudet är linjärt (4.6% skillnad mot median)
Jämfört med samma klass
» 0% av alla testade enheter i den här klassen var bättre, 0% liknande, 100% sämre
» Den bästa hade ett delta på 5%, genomsnittet var 17%, sämst var 45%
Jämfört med alla testade enheter
» 0% av alla testade enheter var bättre, 0% liknande, 100% sämre
» Den bästa hade ett delta på 4%, genomsnittet var 24%, sämst var 134%
Energiförvaltning: Sparsam sippring vid tomgång och belastning
Strömförbrukning
Kombinationen Core i5-13500H och RTX 3050 är ganska ekonomisk när det gäller strömförbrukning jämfört med konkurrenterna. VivoBook 14X OLED kan utnyttja den medföljande 90 W nätadaptern fullt ut under maximal belastning.
Medan Lenovo Slim Pro 7 med enRyzen 7 7735HSoch en RTX 3050 6 GB har en 8 % lägre strömförbrukning vid genomsnittlig belastning, har den högre strömförbrukning vid viloläge, spel och maximal belastning.
| Av/Standby | |
| Låg belastning | |
| Hög belastning |
|
Förklaring:
min: | |
| Asus VivoBook 14X K3405 i5-13500H, GeForce RTX 3050 4GB Laptop GPU, , 2880x1800, 14" | Acer Swift X SFX14-71G i7-13700H, GeForce RTX 4050 Laptop GPU, OLED, 2880x1800, 14.5" | MSI Stealth 14 Studio A13V i7-13700H, GeForce RTX 4050 Laptop GPU, IPS, 2560x1600, 14" | Gigabyte Aero 14 OLED BMF i7-13700H, GeForce RTX 4050 Laptop GPU, OLED, 2880x1800, 14" | Lenovo Slim Pro 7 14ARP8 R7 7735HS, GeForce RTX 3050 6GB Laptop GPU, IPS, 2560x1600, 14.5" | Schenker Vision 14 2022 RTX 3050 Ti i7-12700H, GeForce RTX 3050 Ti Laptop GPU, IPS, 2880x1800, 14" | Genomsnitt NVIDIA GeForce RTX 3050 4GB Laptop GPU | Genomsnitt av klass Multimedia | |
|---|---|---|---|---|---|---|---|---|
| Power Consumption | -30% | -100% | -14% | -36% | -26% | -37% | -16% | |
| Idle Minimum * (Watt) | 4.96 | 8.4 -69% | 10.4 -110% | 7.4 -49% | 7.6 -53% | 7.5 -51% | 7.17 ? -45% | 5.71 ? -15% |
| Idle Average * (Watt) | 7.54 | 11.5 -53% | 19.1 -153% | 8.3 -10% | 12.2 -62% | 10.4 -38% | 10.4 ? -38% | 10.1 ? -34% |
| Idle Maximum * (Watt) | 9.31 | 11.9 -28% | 19.4 -108% | 8.7 7% | 12.8 -37% | 11.4 -22% | 14.8 ? -59% | 12.4 ? -33% |
| Load Average * (Watt) | 83.4 | 84.9 -2% | 95.9 -15% | 76 9% | 76.5 8% | 83.3 -0% | 89.7 ? -8% | 65 ? 22% |
| Witcher 3 ultra * (Watt) | 73.3 | 83.6 -14% | 141.6 -93% | 70 5% | 89.5 -22% | 92.7 -26% | ||
| Load Maximum * (Watt) | 91.74 | 104.2 -14% | 203 -121% | 132 -44% | 135.7 -48% | 110.3 -20% | 124.8 ? -36% | 112.2 ? -22% |
* ... mindre är bättre
Power Consumption: The Witcher 3 / Stress test
Power Consumption: External monitor
Batteritid
VivoBook 14X har ett 63 WHr-batteri som inte erbjuder någon extraordinär livslängd, men det bör klara av att användas under större delen av en vanlig arbetsdag innan det behöver laddas.
Batteriet räcker i nästan 10,5 timmar när man loopar en 1080p H.264-video med 150 nits ljusstyrka, vilket är imponerande. Den bärbara datorns speluthållighet är dock betydligt kortare och klockar in på drygt en timme.
Den medföljande nätadaptern kan fylla på den bärbara datorns batteri från 0% till 60% på cirka 50 minuter.
| Asus VivoBook 14X K3405 i5-13500H, GeForce RTX 3050 4GB Laptop GPU, 63 Wh | Acer Swift X SFX14-71G i7-13700H, GeForce RTX 4050 Laptop GPU, 76 Wh | MSI Stealth 14 Studio A13V i7-13700H, GeForce RTX 4050 Laptop GPU, 72 Wh | Gigabyte Aero 14 OLED BMF i7-13700H, GeForce RTX 4050 Laptop GPU, 63 Wh | Lenovo Slim Pro 7 14ARP8 R7 7735HS, GeForce RTX 3050 6GB Laptop GPU, 73 Wh | Schenker Vision 14 2022 RTX 3050 Ti i7-12700H, GeForce RTX 3050 Ti Laptop GPU, 99.8 Wh | Genomsnitt av klass Multimedia | |
|---|---|---|---|---|---|---|---|
| Batteridrifttid | -17% | -17% | 15% | 30% | 41% | 53% | |
| H.264 (h) | 10.4 | 9.5 -9% | 6.6 -37% | 11.1 7% | 16.4 ? 58% | ||
| WiFi v1.3 (h) | 8.1 | 7.7 -5% | 6.3 -22% | 7.6 -6% | 10.5 30% | 10.1 25% | 12 ? 48% |
| Witcher 3 ultra (h) | 1.3 | ||||||
| Load (h) | 1.1 | 0.7 -36% | 1.2 9% | 1.5 36% | 2.1 91% | 1.675 ? 52% | |
| Reader / Idle (h) | 11.3 | 25.2 ? |
För
Emot
Bedömning: Mångsidig multimedia-laptop med mycket utrymme för förbättringar
Asus VivoBook 14X K3405 tar fram prestanda- och effektivitetsfördelarna med Intel Core i5-13500Hi ett elegant och lätt chassi.
Den bärbara datorn erbjuder hyfsade anslutningsmöjligheter, men Wi-Fi 6E-prestandan behöver förbättras ytterligare. Thunderbolt 4 saknas också.
Asus använder en 2.8K 90 Hz Samsung OLED-panel i VivoBook 14X som visar utmärkta färgegenskaper för blivande redaktörer. Panelen lider av PWM vid lägre ljusstyrka men använder DC Dimming för att kompensera något för flimret vid högre belysning.
Asus VivoBook 14X skriker inte direkt efter kraft och kan säkert dra nytta av GPU- och kylningsuppgraderingar, men det är en välutrustad multimedia-laptop som också tillåter lite lätt spelande på sidan om."
Core i5-13500H har vissa fördelar i våra tester, men VivoBook 14X:s chassi och kylningsbegränsningar gör att processorn inte kan visa sina muskler fullt ut. En 35 W RTX 4050 skulle ha varit pricken över i:et, men det är troligt att Asus valde den åldrande RTX 3050 för att hålla nere kostnaderna
.Vi skulle också vilja se Asus övergå till ett kylsystem med dubbla fläktar i kommande iterationer eftersom lösningen med en fläkt i VivoBook 14X snabbt kan nå sina gränser.
Trots dessa begränsningar är Asus VivoBook 14X fortfarande en attraktiv multimedia-bärbar dator i övre mellanklassen nära 1 100 € (under 1 00 000 kr). Ett bra alternativ är Lenovo Slim Pro 7 som har en 2,5K IPS-pekskärm och Ryzen 7 7735HS.
Gigabyte Aero 14 OLED med en 35 W RTX 4050 och Core i7-13700H erbjuder en mer uppdaterad konfiguration, förutsatt att du är villig att betala det högr
e priset.Pris och tillgänglighet
Den testade kombinationen av Core i5-13500 och RTX 3050 i VivoBook 14X OLED kostar 96 990 kr, och det enda sättet att köpa den är via Asus India onlinebutik https://in.store.asus.com/asus-vivobook-14x.html.
Amazon Indien och Flipkart har endast Core i5-13500H och RTX 2050 SKU som kostar cirka 82 000 kr. Amazon US och Best Buy US verkar också bara ha RTX 2050 SKU med FHD + OLED-paneler för cirka 850 US-dollar.
Asus VivoBook 14X K3405
- 08/07/2023 v7 (old)
Vaidyanathan Subramaniam
Genomskinlighet
Valet av enheter som ska granskas görs av vår redaktion. Testprovet gavs till författaren som ett lån av tillverkaren eller återförsäljaren för denna recension. Långivaren hade inget inflytande på denna recension och inte heller fick tillverkaren en kopia av denna recension innan publiceringen. Det fanns ingen skyldighet att publicera denna recension. Som ett oberoende medieföretag är Notebookcheck inte föremål för auktoritet från tillverkare, återförsäljare eller förlag.
This is how Notebookcheck is testingEvery year, Notebookcheck independently reviews hundreds of laptops and smartphones using standardized procedures to ensure that all results are comparable. We have continuously developed our test methods for around 20 years and set industry standards in the process. In our test labs, high-quality measuring equipment is utilized by experienced technicians and editors. These tests involve a multi-stage validation process. Our complex rating system is based on hundreds of well-founded measurements and benchmarks, which maintains objectivity.
Price comparison

