Recension av Dell Inspiron 16 Plus 7620 - En multimedia-laptop som gör allt
Dell Inspiron 16 Plus 7620 från 2022 är en direkt efterföljare till Inspiron 16 Plus 7610 från 2021 ( ) och ersätter förra årets modell med 12:e generationens CPU:er och snabbare GeForce RTX GPU:er som ersätter 11:e generationens CPU:er. Tillverkaren har även reviderat chassit för ett annat utseende efter bara ett år på marknaden för serien.
Bland konkurrenterna i detta område finns andra bärbara 16-tums multimedie- eller kreatörsdatorer i mellanklass till högklassig storlek som Lenovo Yoga 7 16IAP7, Huawei MateBook D 16, Acer Swift X, Asus Vivobook Pro 16X, eller till och med MSI Creator Z16.
Fler recensioner av Dell:
Potentiella konkurrenter i jämförelse
Gradering | Datum | Modell | Vikt | Höjd | Storlek | Upplösning | Pris |
|---|---|---|---|---|---|---|---|
| 87.4 % v7 (old) | 08/2022 | Dell Inspiron 16 Plus 7620 i7-12700H, GeForce RTX 3050 Ti Laptop GPU | 2.1 kg | 18.99 mm | 16.00" | 3072x1920 | |
| 86.7 % v7 (old) | 10/2021 | Dell Inspiron 16 Plus 7610 i7-11800H, GeForce RTX 3050 4GB Laptop GPU | 2 kg | 18.99 mm | 16.00" | 3072x1920 | |
| 88.7 % v7 (old) | 08/2022 | Lenovo Yoga 7 16IAP7 i7-1260P, Iris Xe G7 96EUs | 2 kg | 19.2 mm | 16.00" | 2560x1600 | |
| 83.6 % v7 (old) | 07/2022 | Huawei MateBook D 16 2022 i7-12700H, Iris Xe G7 96EUs | 1.7 kg | 18.4 mm | 16.00" | 1920x1200 | |
| 86.2 % v7 (old) | 07/2022 | Acer Swift X SFX16-51G-5388 i5-11320H, GeForce RTX 3050 4GB Laptop GPU | 1.8 kg | 18.9 mm | 16.10" | 1920x1080 | |
v (old) | 12/2021 | Asus Vivobook Pro 16X-M7600QE R9 5900HX, GeForce RTX 3050 Ti Laptop GPU | 1.9 kg | 19 mm | 16.10" | 3840x2400 |
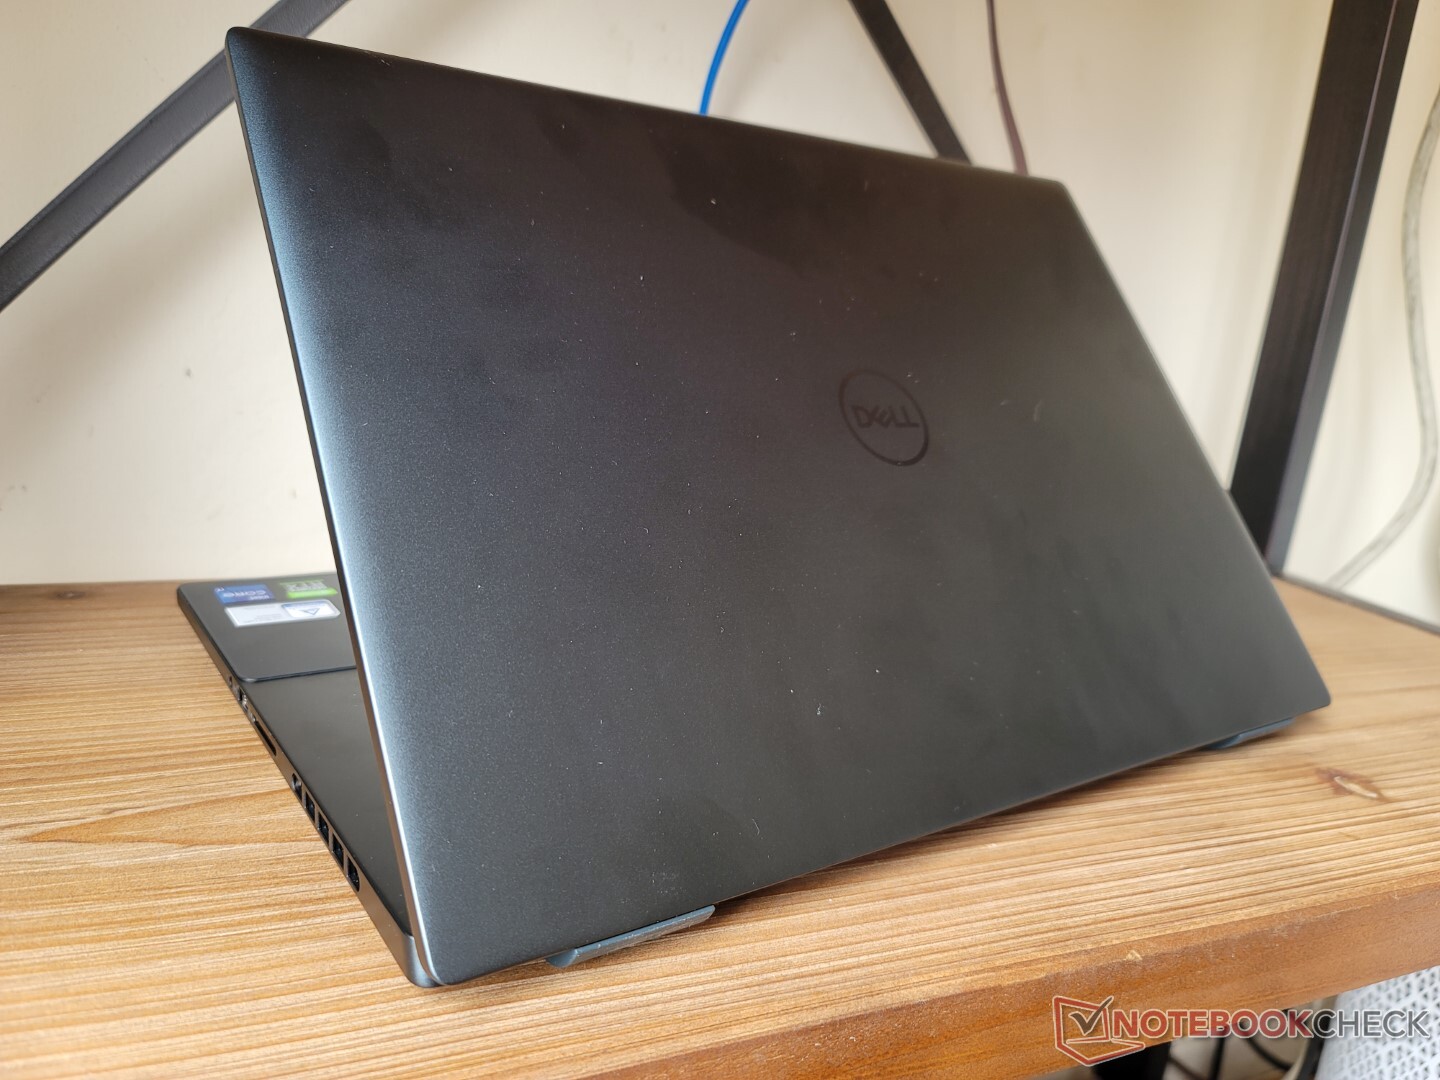
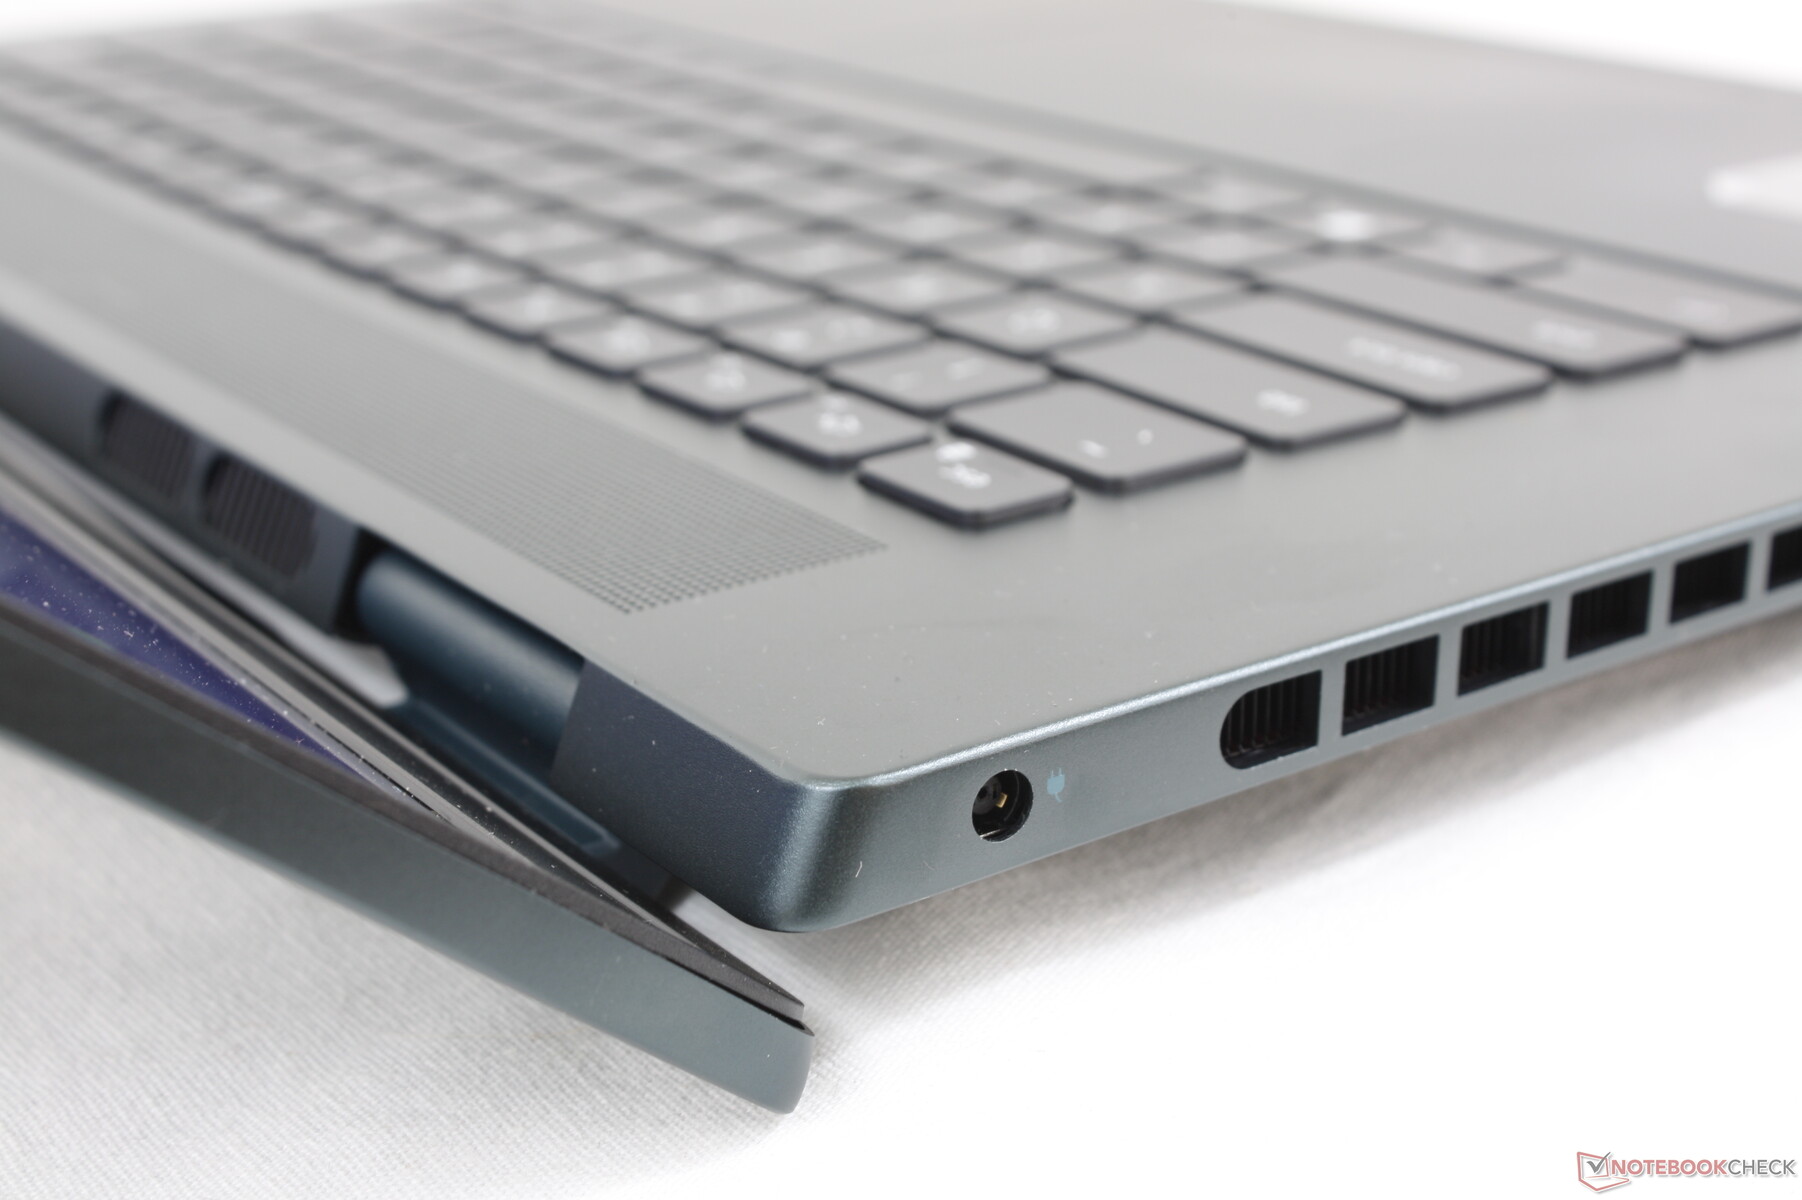
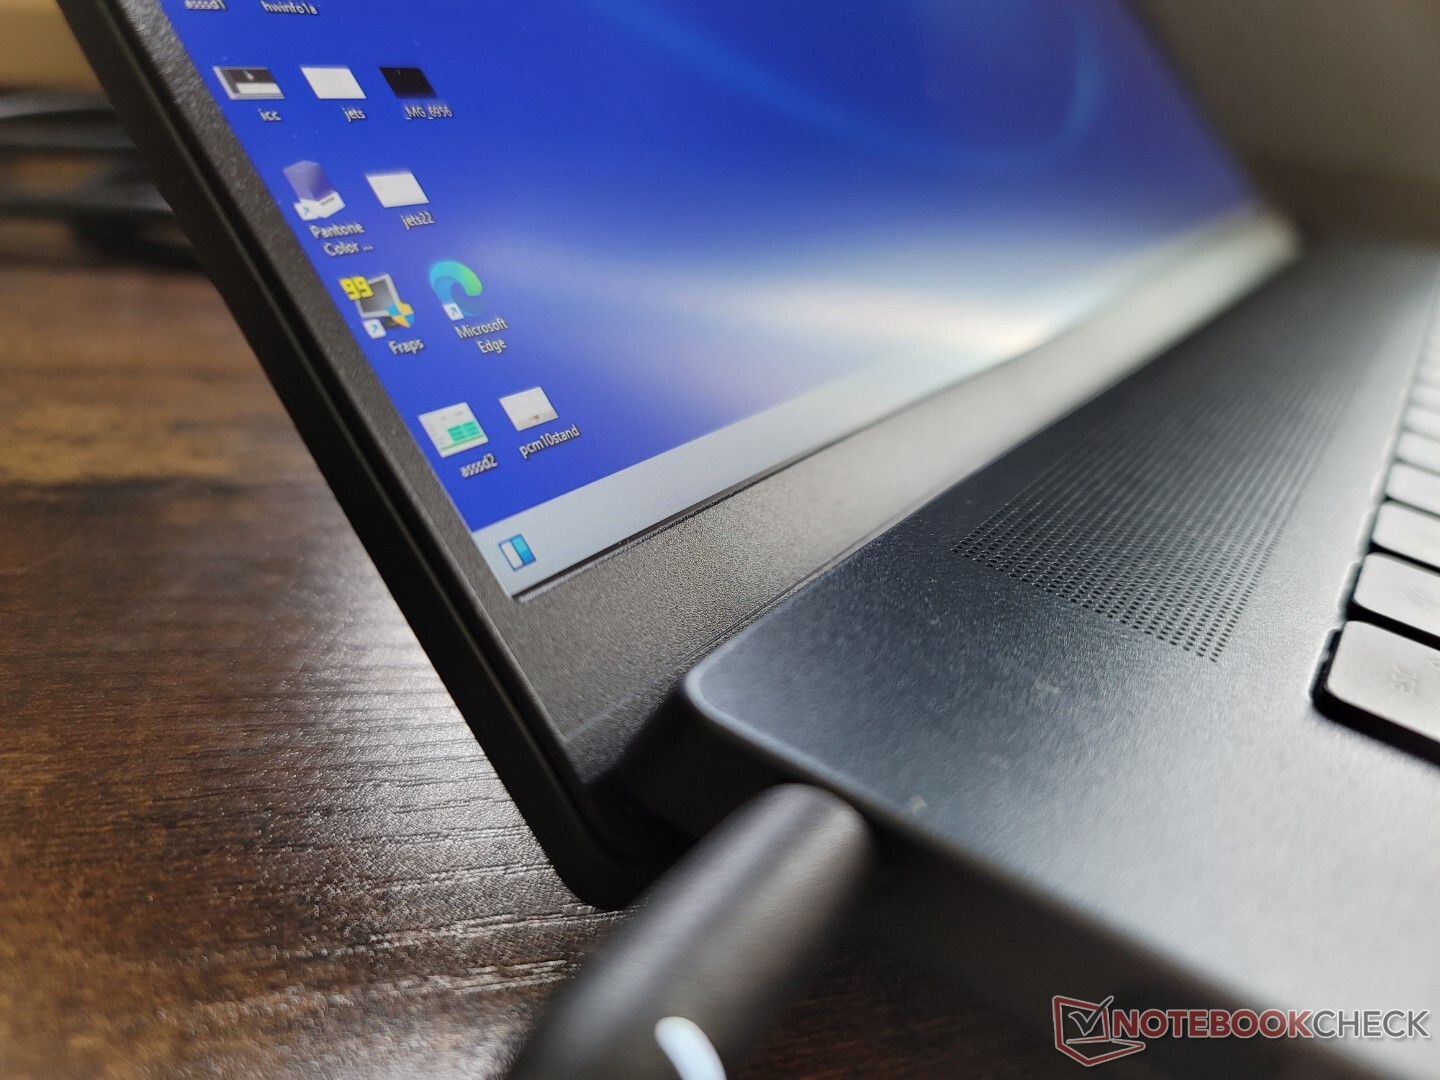
Hölje - Mörkare toner
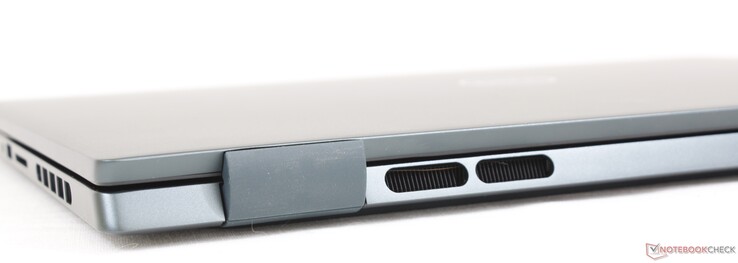
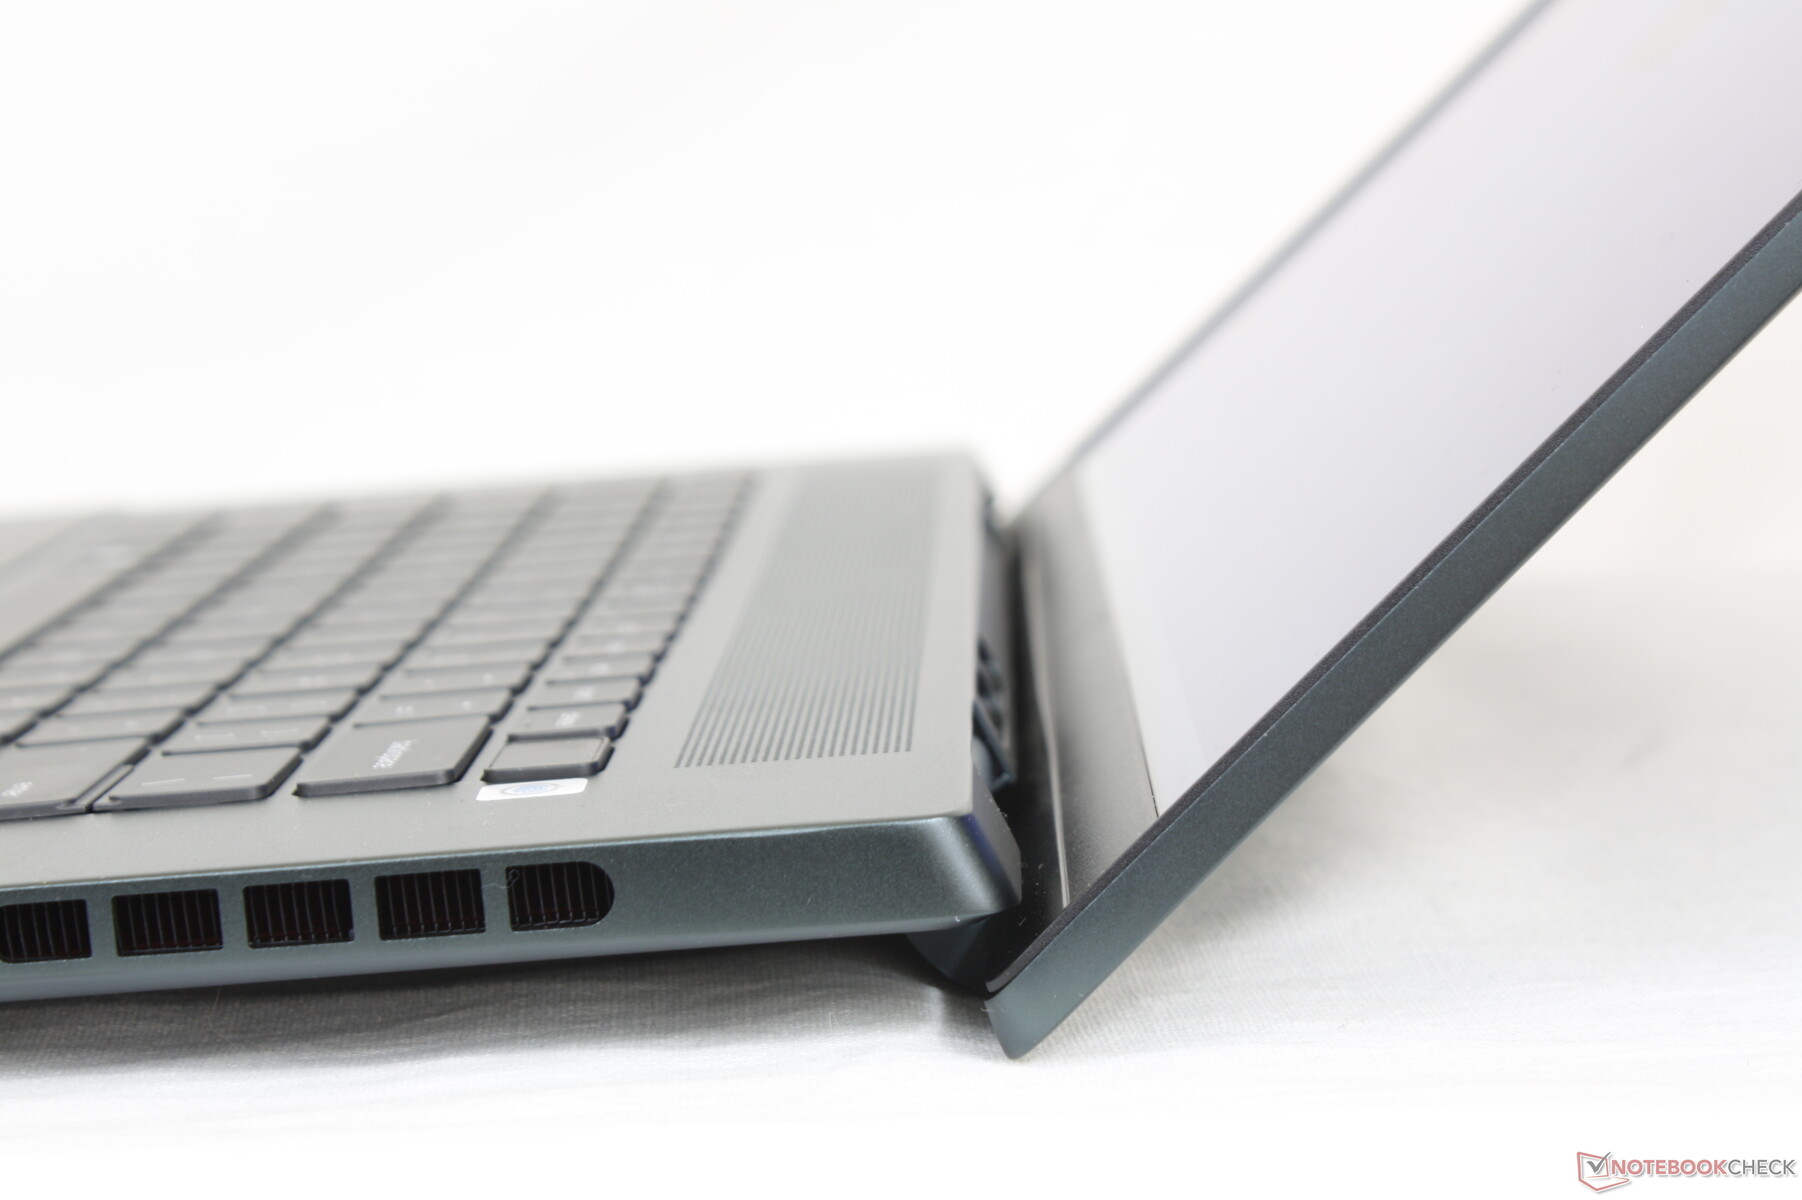
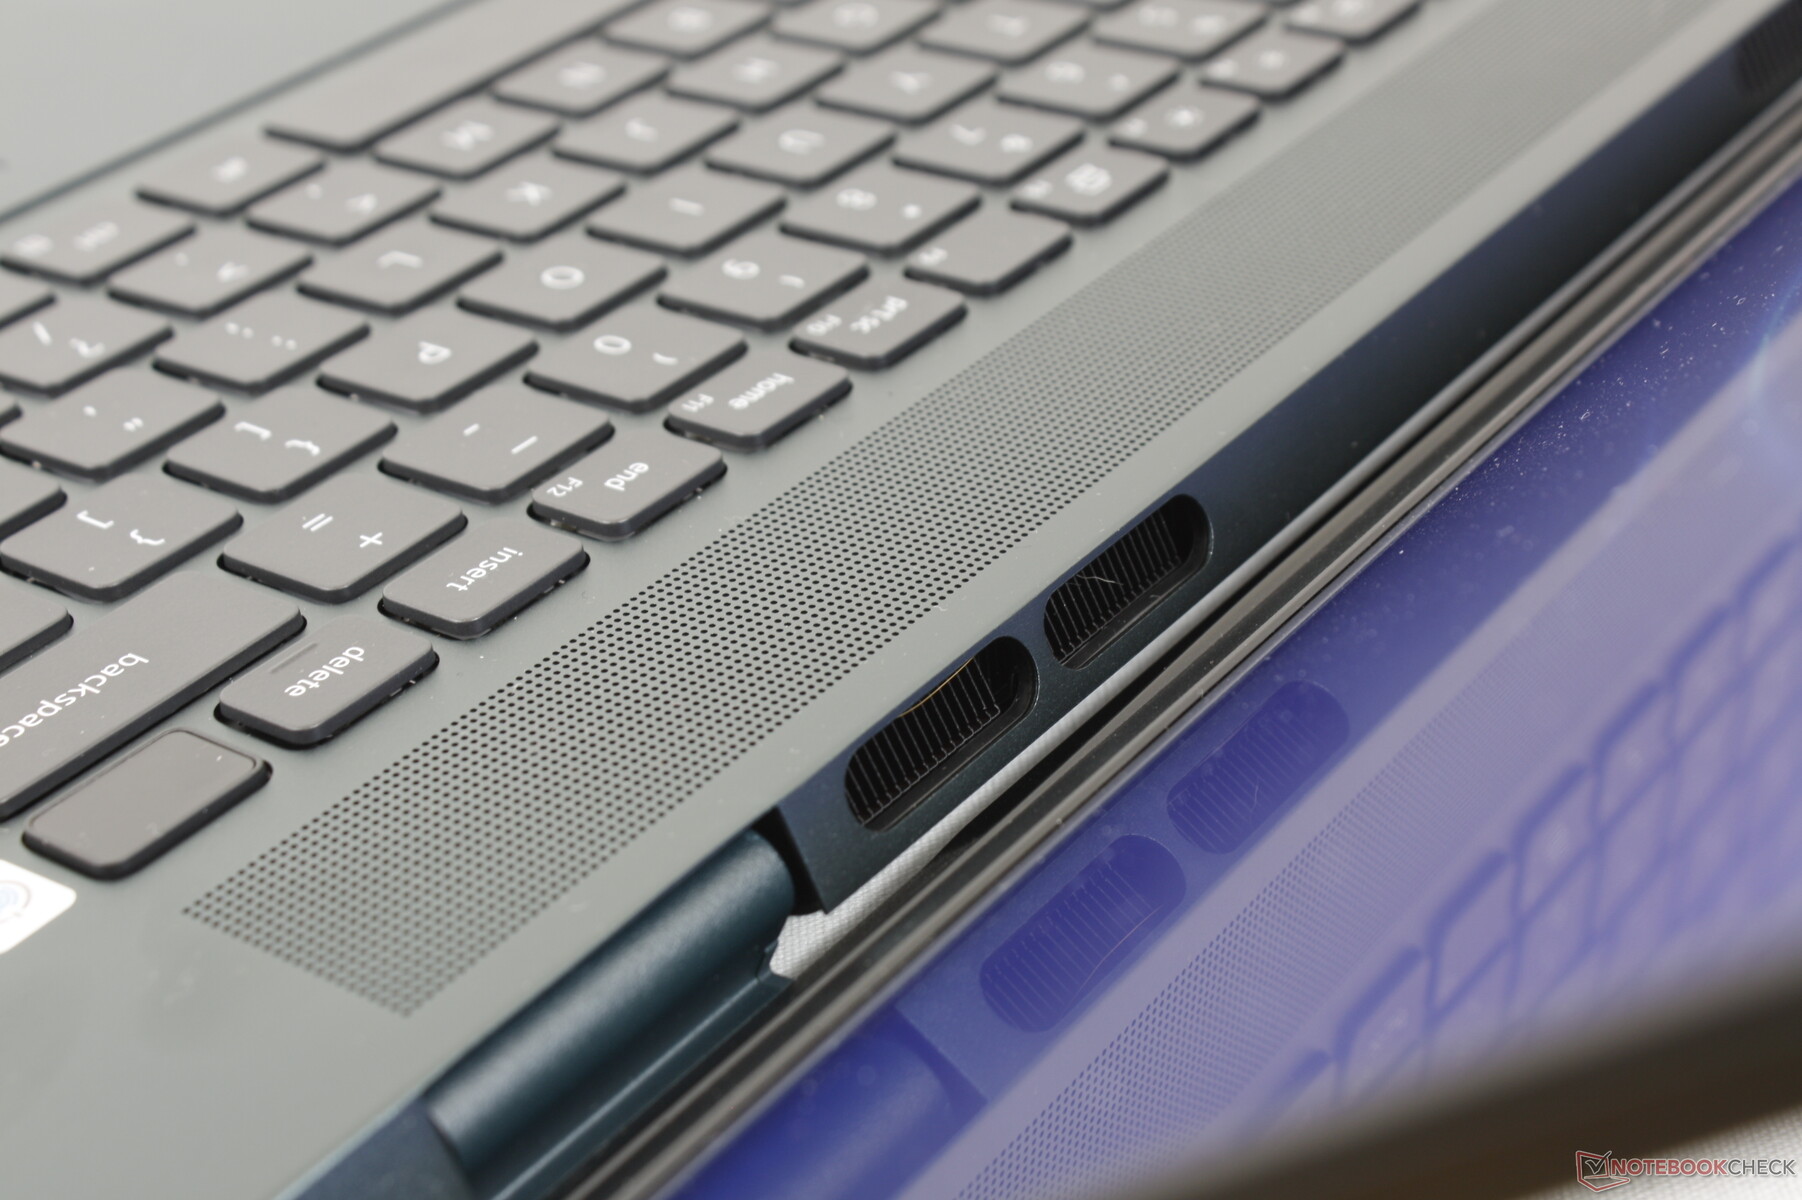
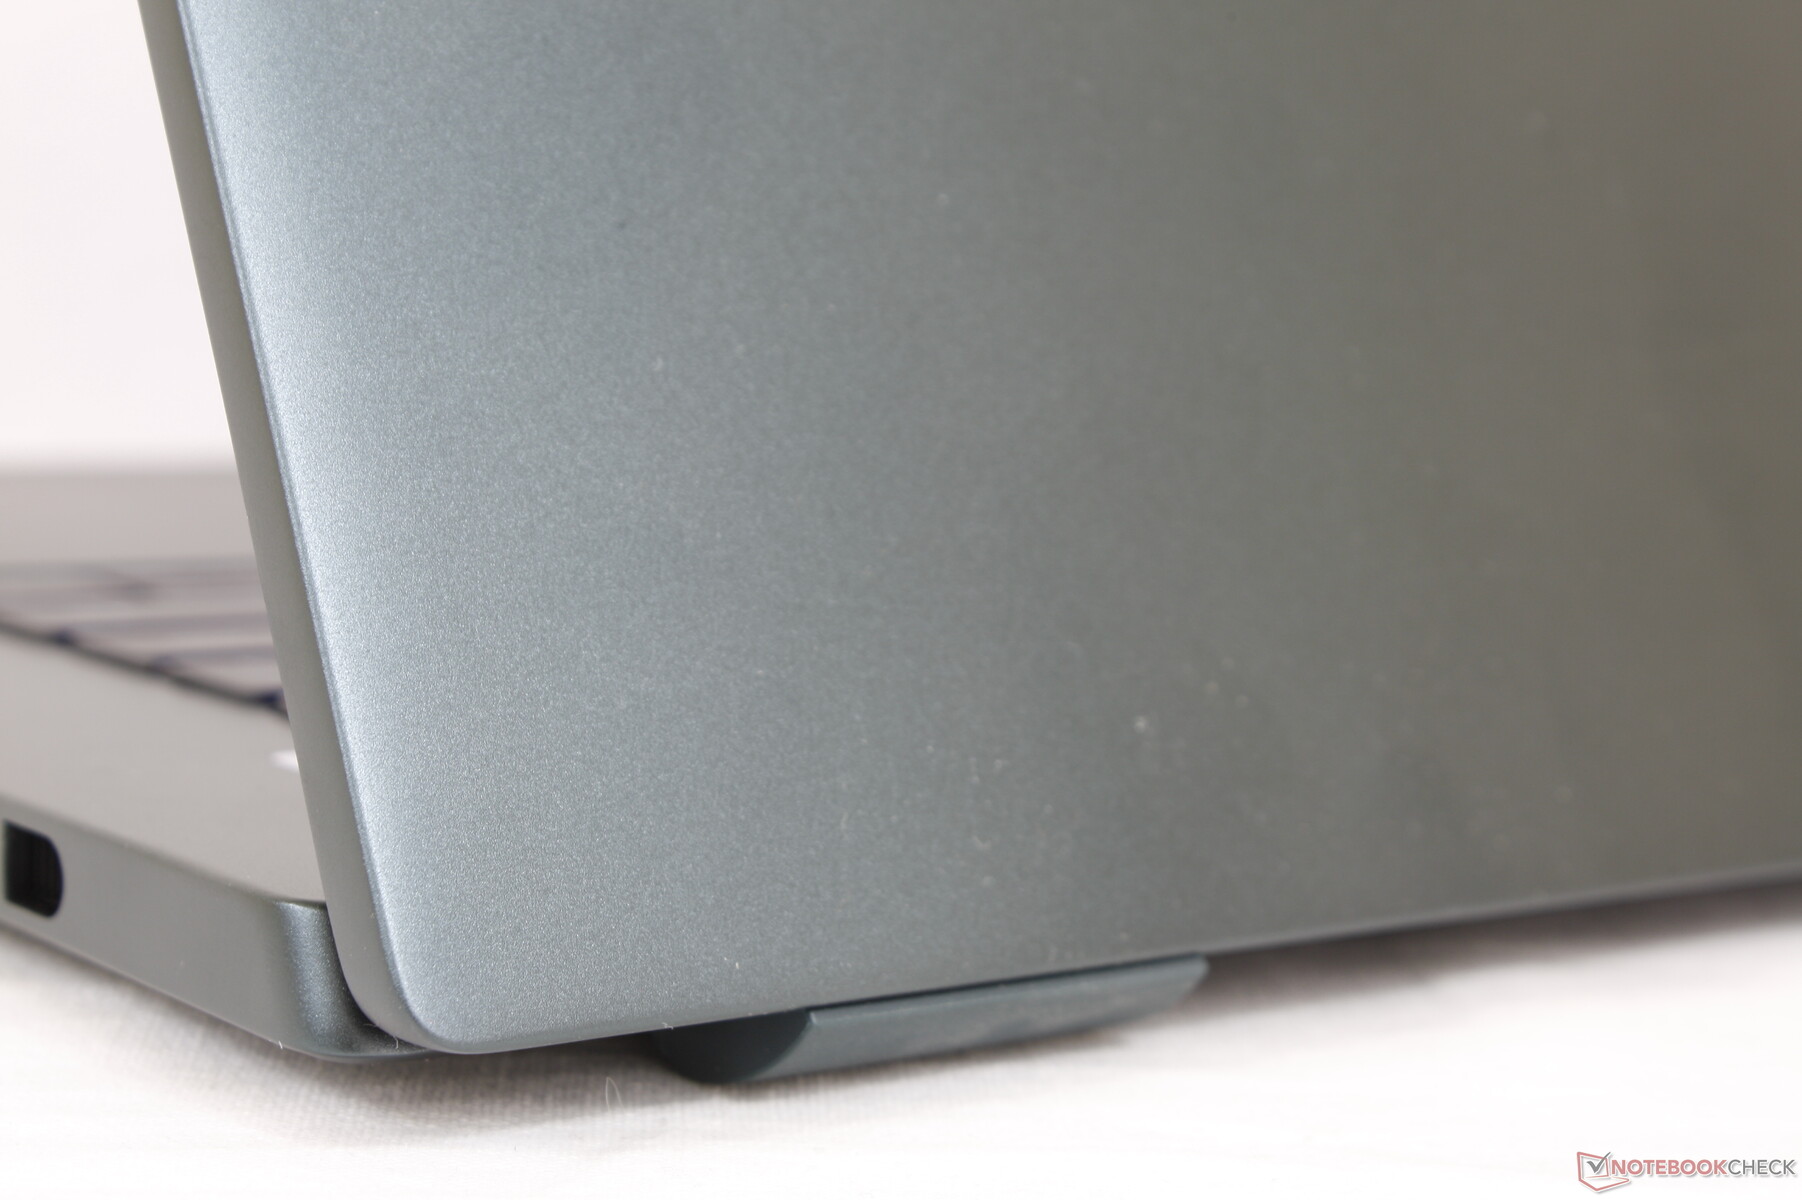
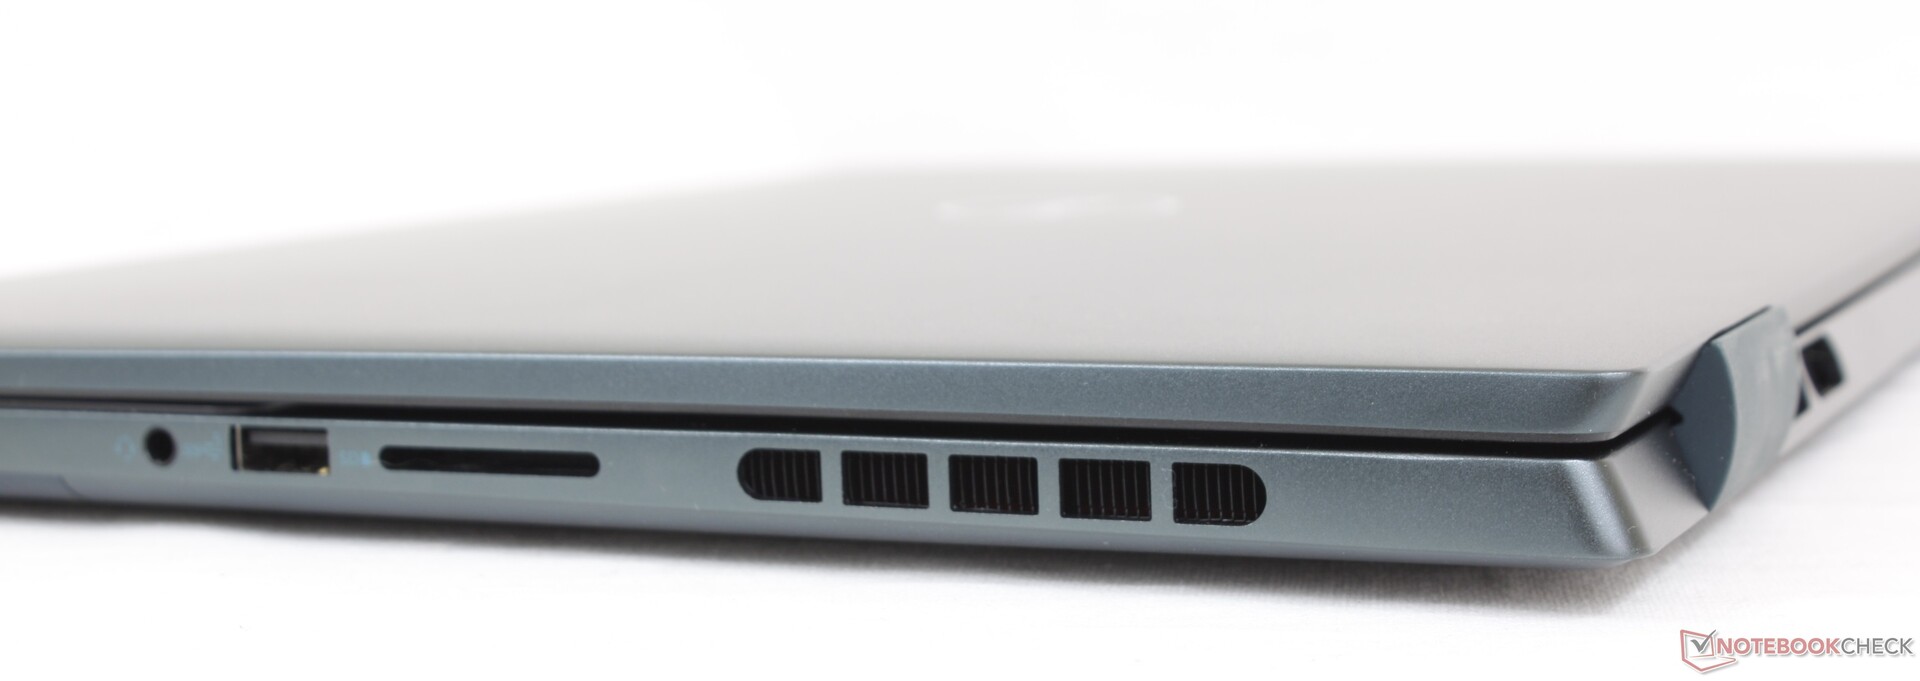
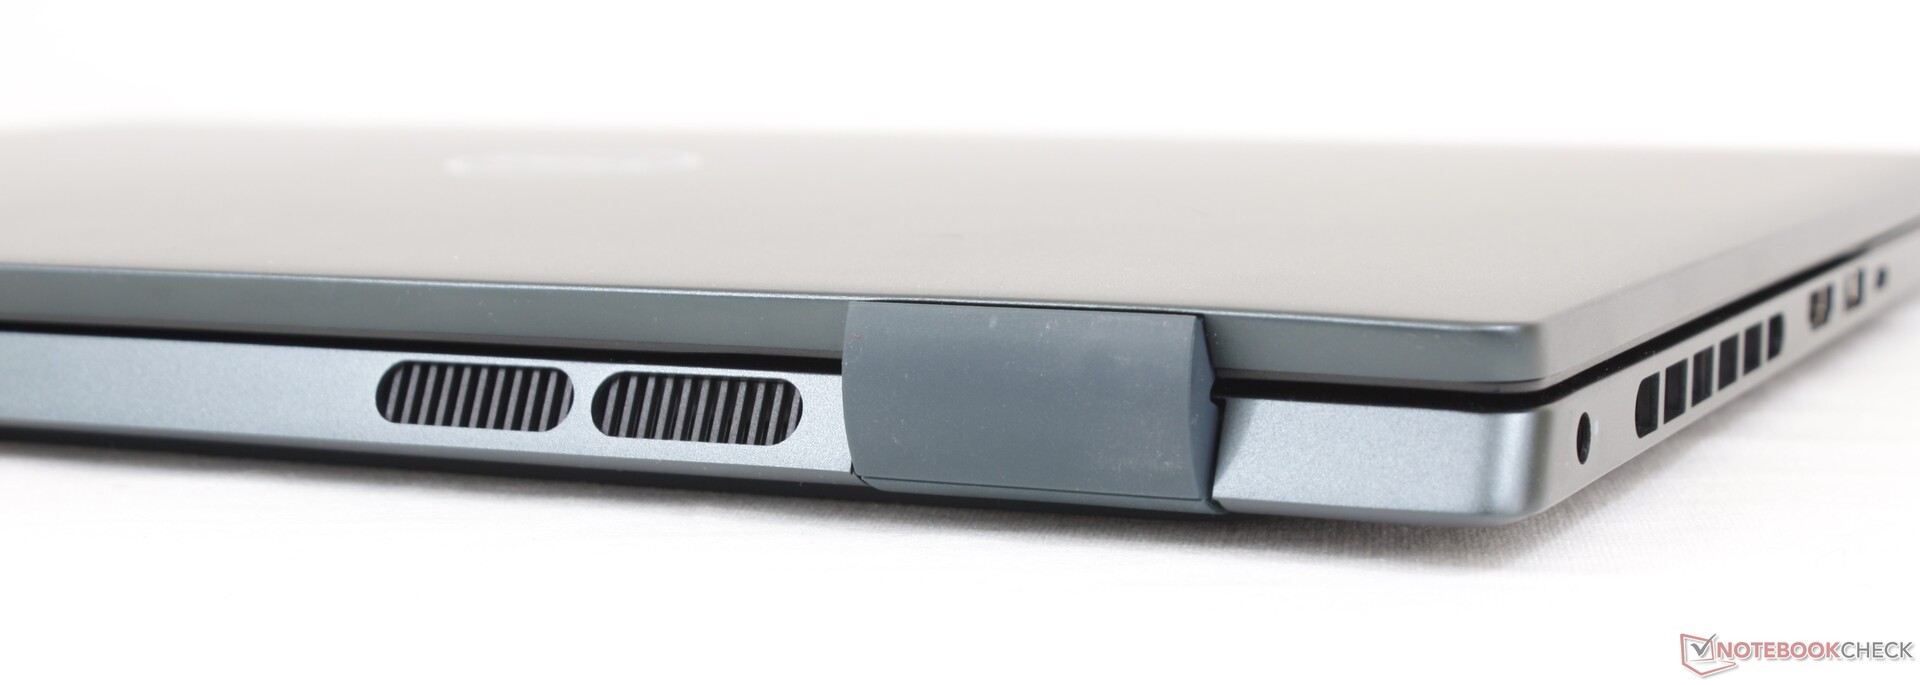
Skillnaderna mellan 2021- och 2022-modellerna är omedelbart märkbara. Ventilationsgallren längs sidorna och baksidan är till exempel nu rektangulära respektive ovala i stället för cirklar. De kromskurna kanterna och hörnen är nu borta för ett mer monokromt och mindre utsmyckat utseende
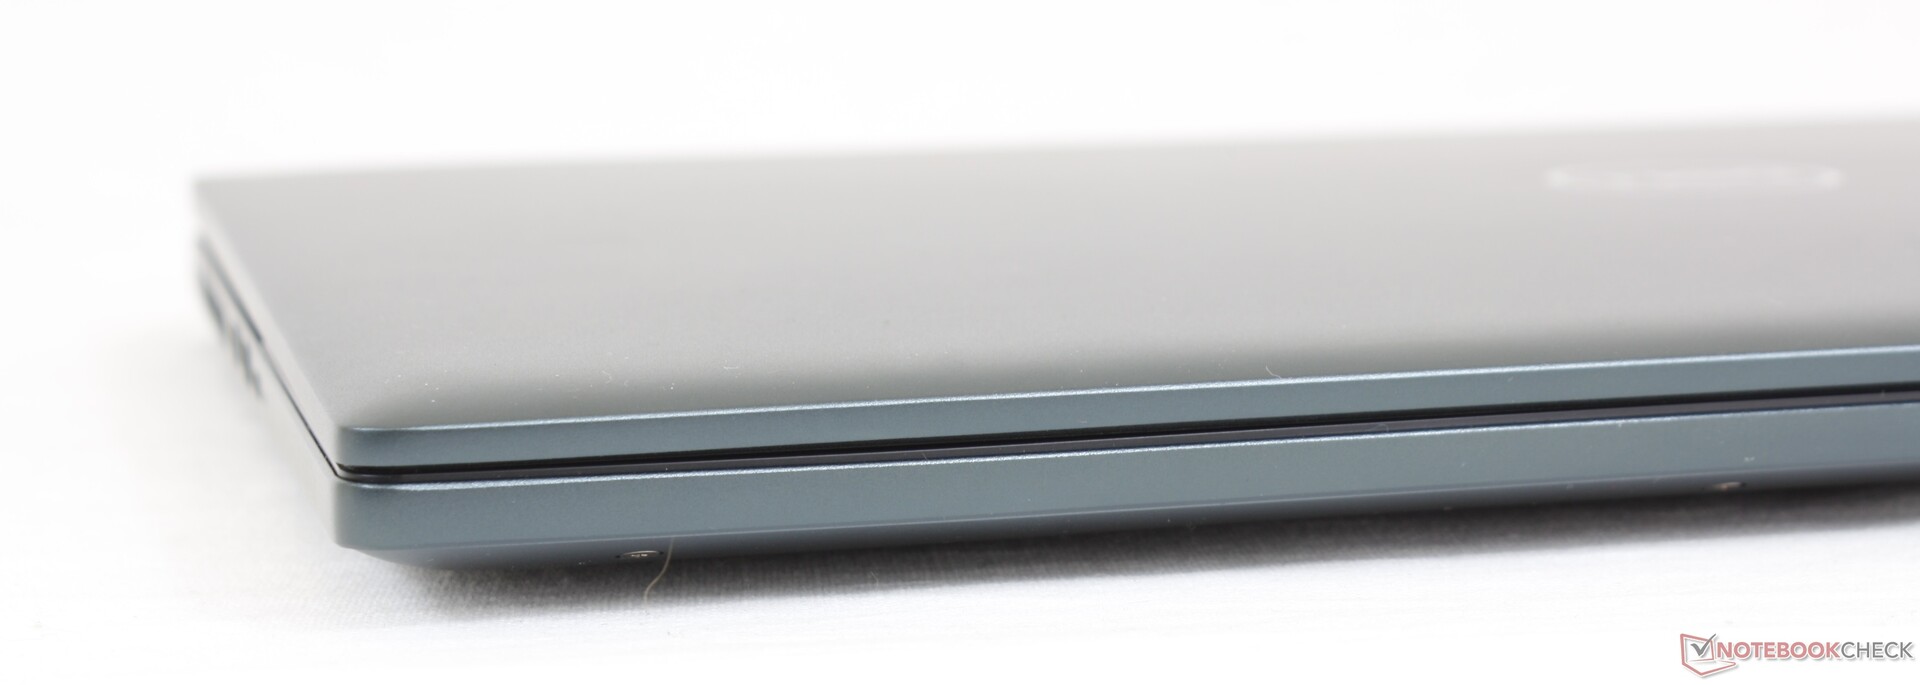
Byggkvaliteten är fortfarande ungefär densamma. Metallbasen vrider och knarrar lite mer än på en dyrare XPS eller Spectre och detta gäller särskilt locket. Vi hoppades att alla visuella förändringar skulle leda till ett starkare chassi, men det verkar inte vara fallet. Om du fortfarande har 2021-modellen i rockar så missar du inte särskilt mycket ur designsynpunkt med 2022-modellen.
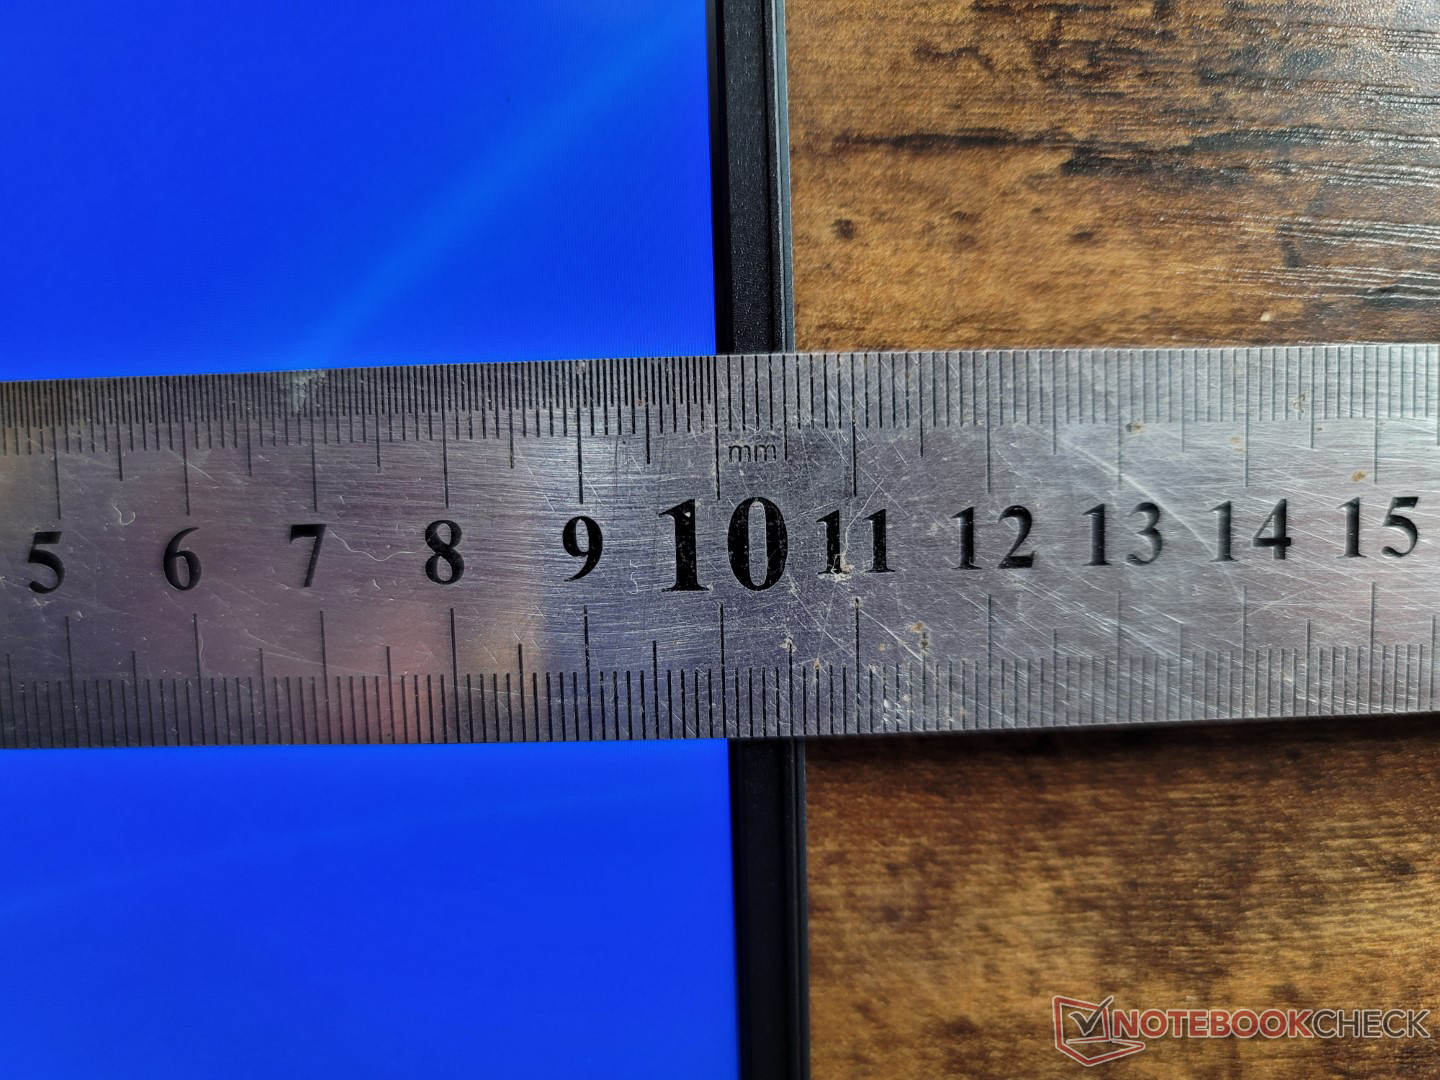
Ett av våra klagomål på Inspiron 16 Plus 7610 var dess vikt, och det gäller fortfarande för 7620 trots att chassit har ändrats. Med en vikt på 2-2,1 kg är systemet några hundra gram tyngre än 16-tums Acer Swift X eller Huawei MateBook D 16. Den nya designen är inte heller mindre eftersom dimensionerna faktiskt är något större i fotavtryck jämfört med 7610.
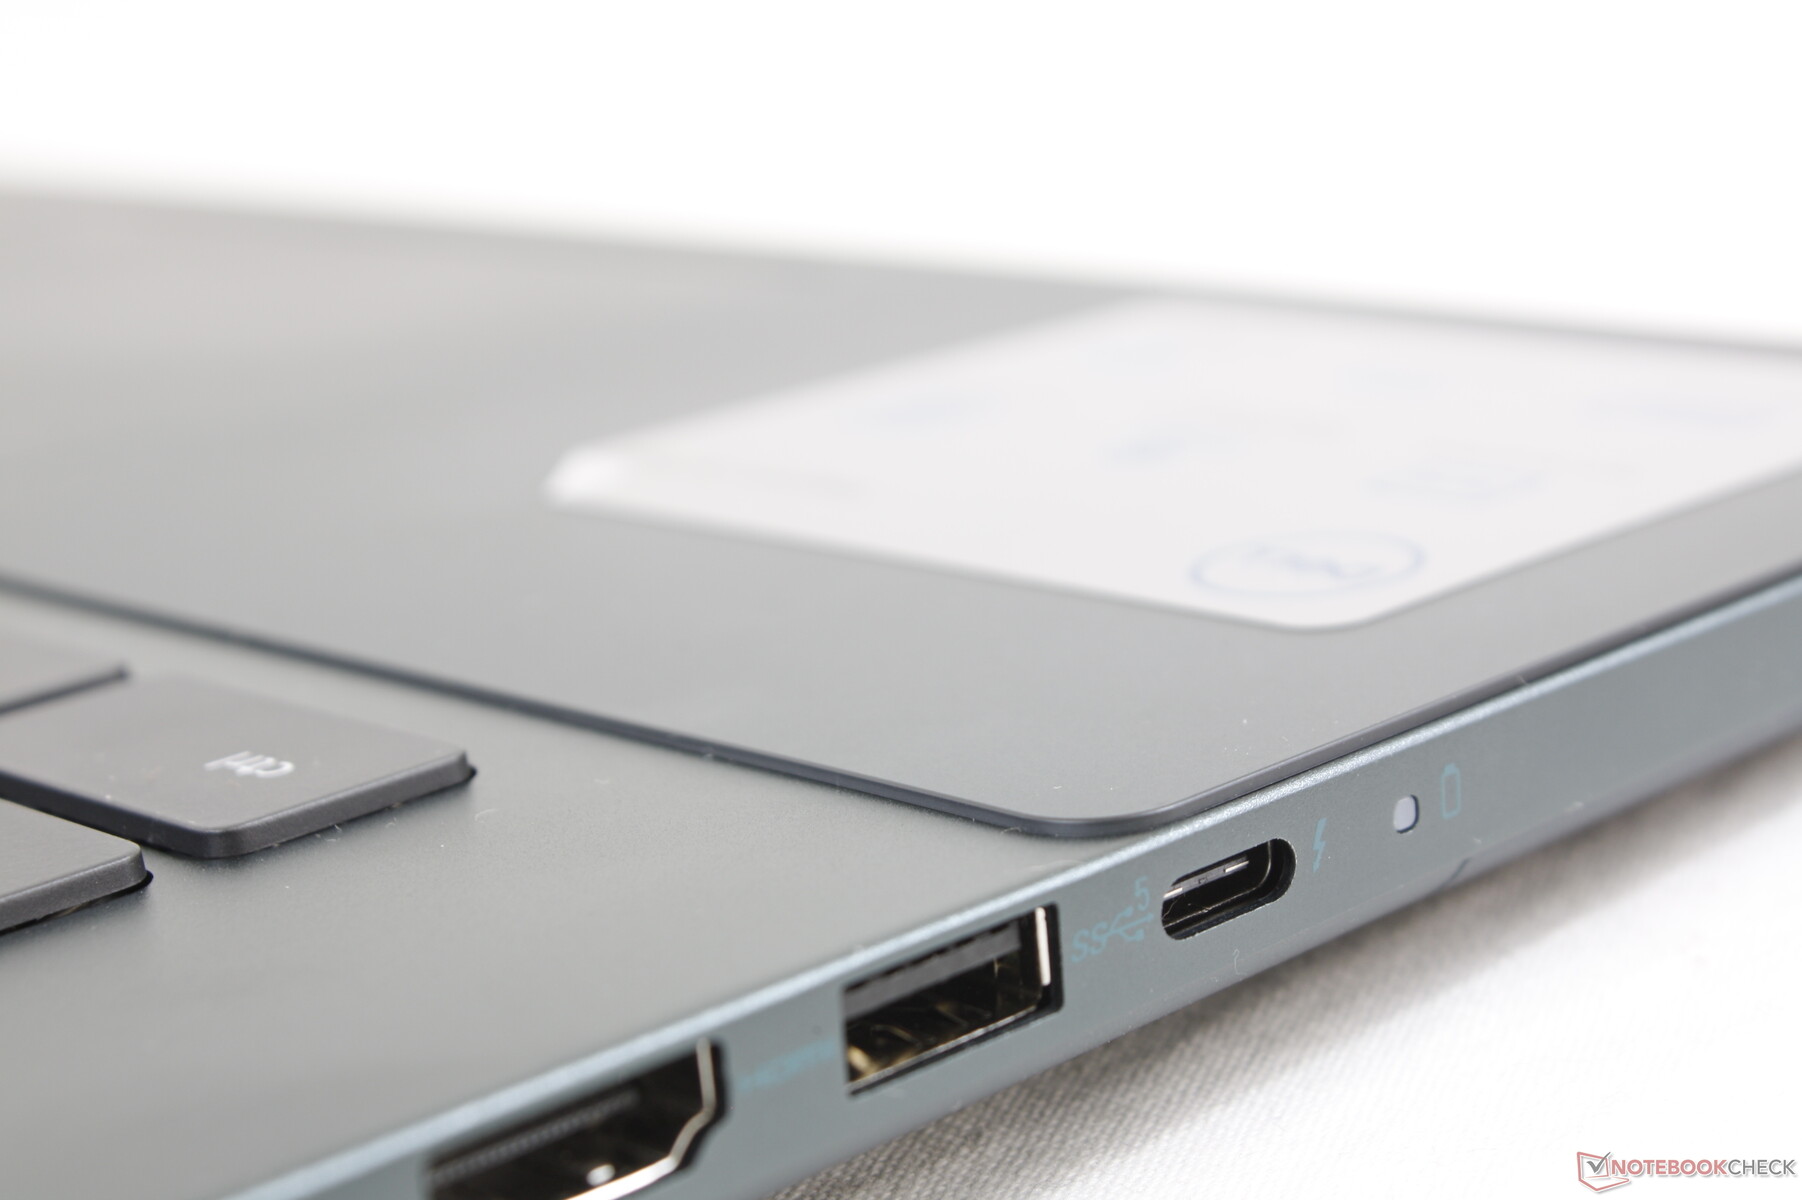
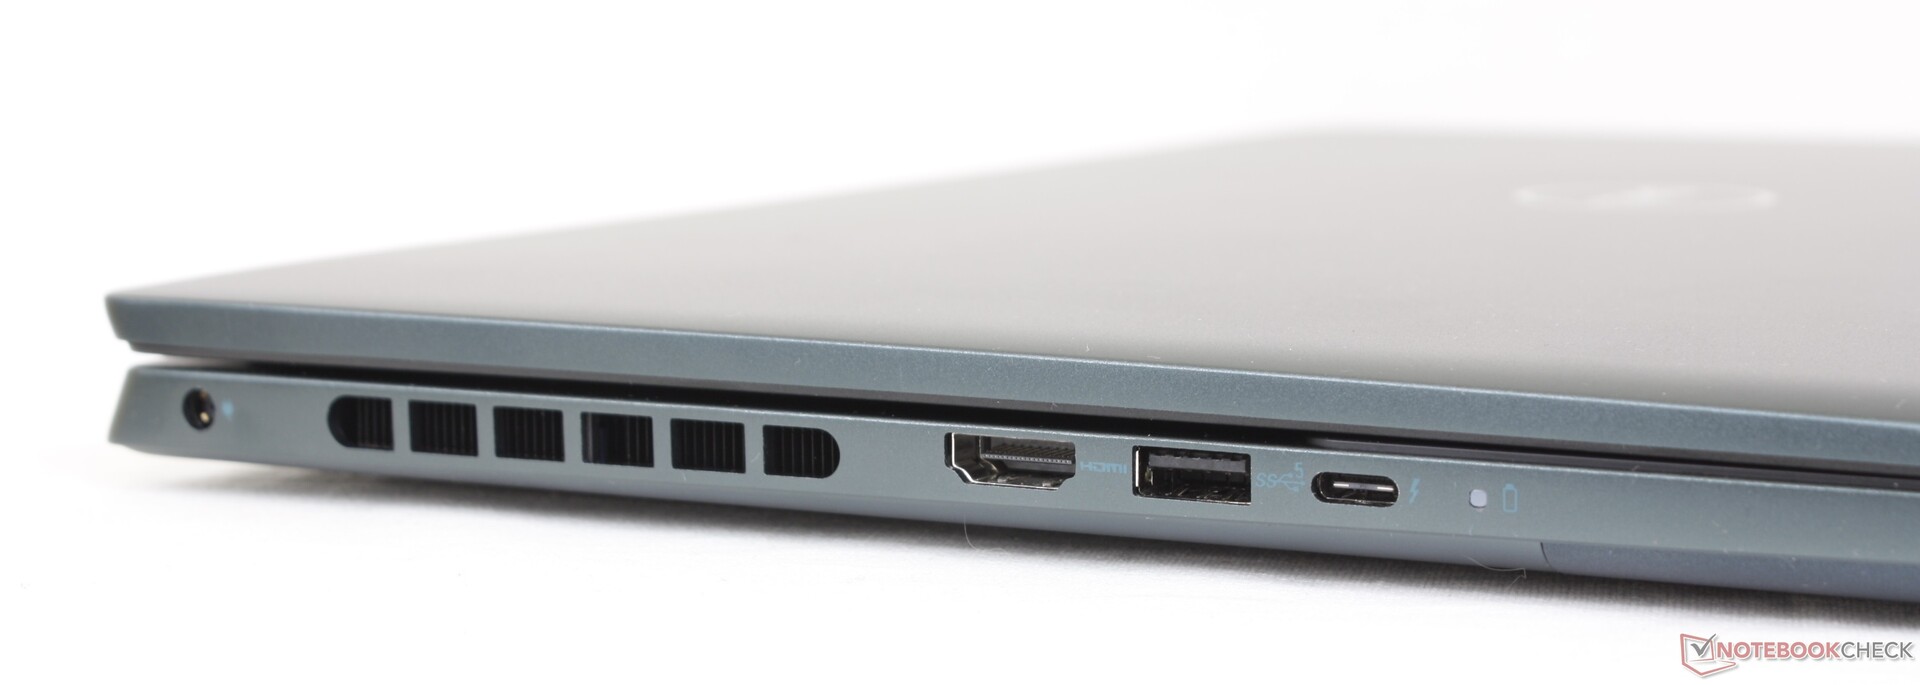
Anslutningar - Stöd för Thunderbolt 4
7620 har samma portar som 7610 trots de yttre förändringarna. En andra USB-C-port som på Lenovo Yoga 7 16 Gen 7 skulle ha varit trevlig att ha med tanke på hur stor och tung enheten är.
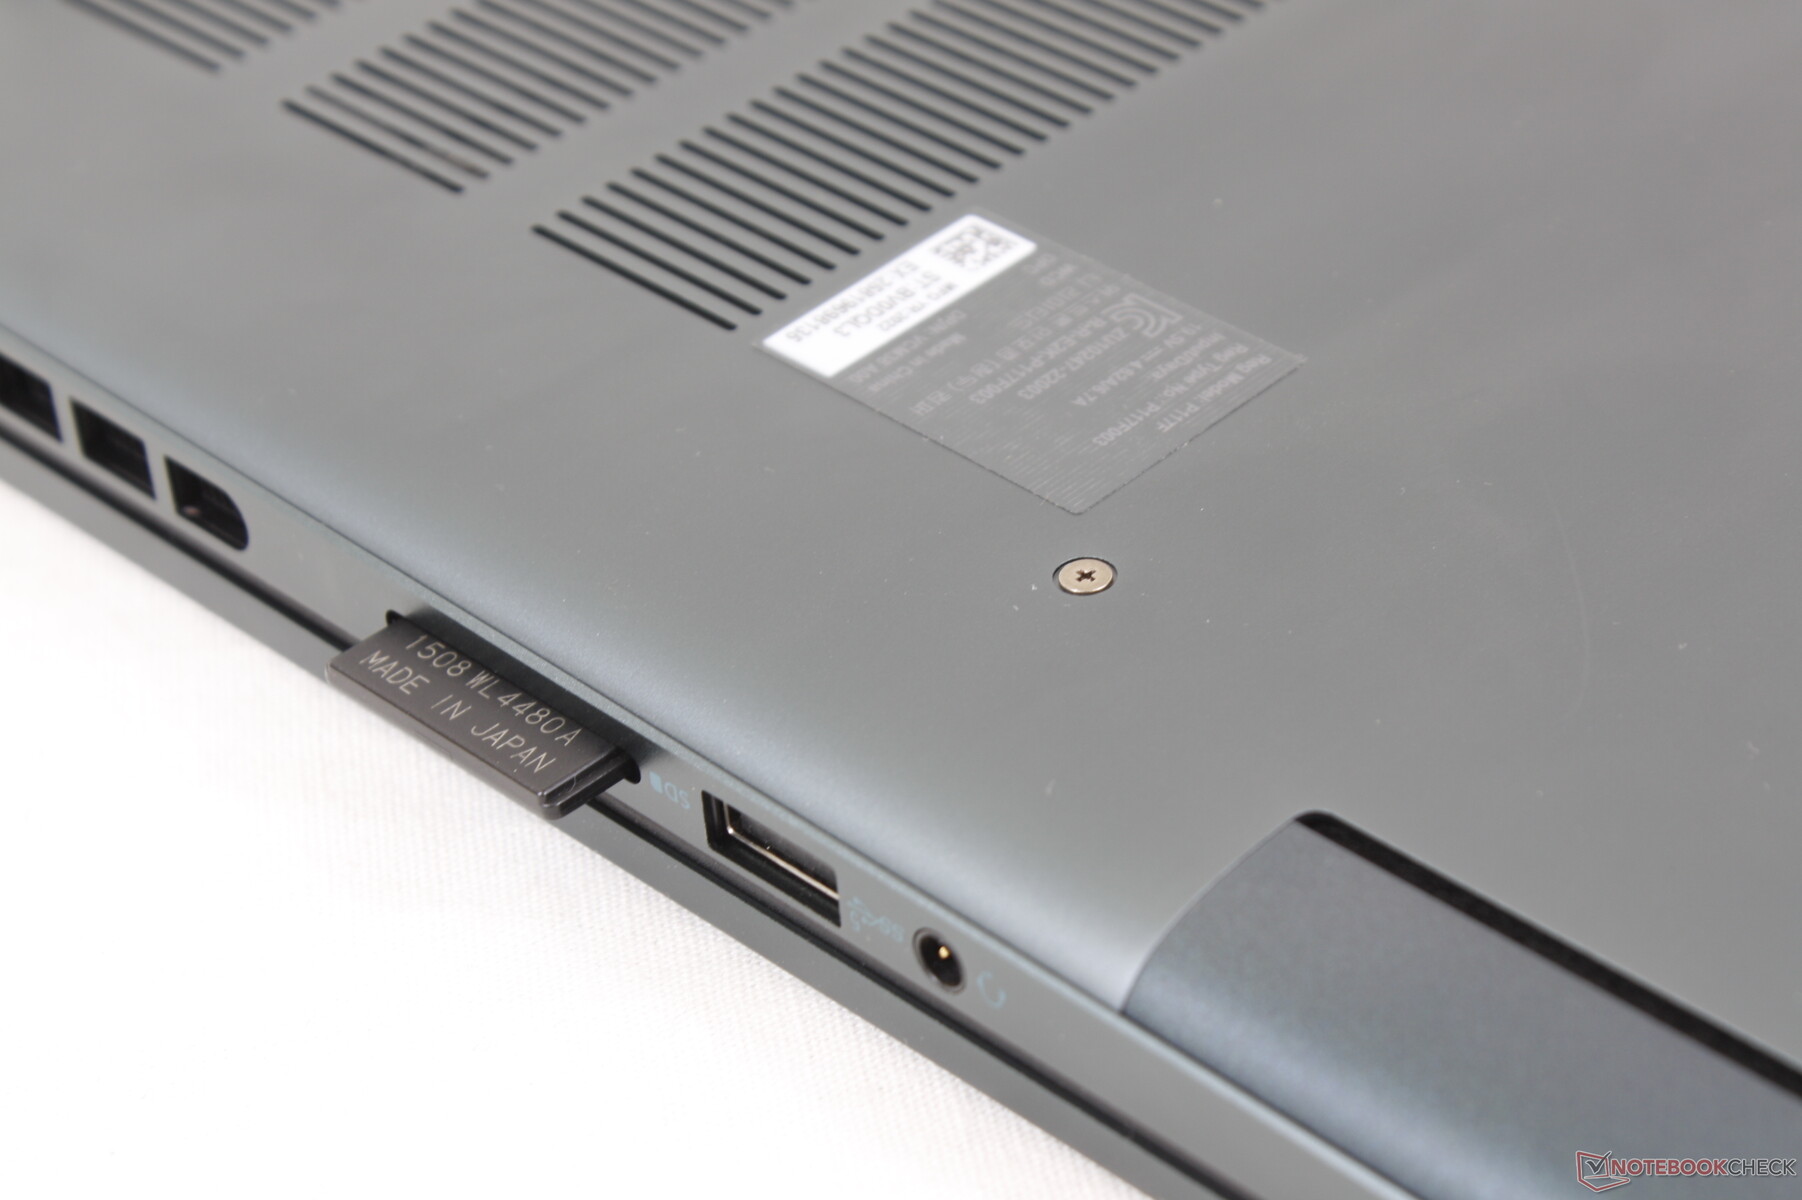
SD-kortläsare
Överföringshastigheten med SD-kortet är fortfarande mycket långsam. Det är nu tydligt att Dell vill att användarna ska uppgradera till dyrare XPS-serien om de vill ha snabbare prestanda för SD-kort.
Observera att RTX 3060 SKU levereras med en MicroSD-läsare istället för en fullstor.
| SD Card Reader | |
| average JPG Copy Test (av. of 3 runs) | |
| Dell XPS 15 9520 RTX 3050 Ti (Toshiba Exceria Pro SDXC 64 GB UHS-II) | |
| Lenovo Yoga 7 16IAP7 (Toshiba Exceria Pro SDXC 64 GB UHS-II) | |
| Asus Vivobook Pro 16X-M7600QE (AV Pro SD microSD 128 GB V60) | |
| Dell Inspiron 16 Plus 7620 (Toshiba Exceria Pro SDXC 64 GB UHS-II) | |
| Dell Inspiron 16 Plus 7610 (AV PRO microSD 128 GB V60) | |
| maximum AS SSD Seq Read Test (1GB) | |
| Dell XPS 15 9520 RTX 3050 Ti (Toshiba Exceria Pro SDXC 64 GB UHS-II) | |
| Lenovo Yoga 7 16IAP7 (Toshiba Exceria Pro SDXC 64 GB UHS-II) | |
| Asus Vivobook Pro 16X-M7600QE (AV Pro SD microSD 128 GB V60) | |
| Dell Inspiron 16 Plus 7620 (Toshiba Exceria Pro SDXC 64 GB UHS-II) | |
| Dell Inspiron 16 Plus 7610 (AV PRO microSD 128 GB V60) | |
Kommunikation
SKU:erna kan konfigureras med antingen Intel AX201 eller AX211 för Wi-Fi 6 respektive Wi-Fi 6E-anslutning. AX211 i vår enhet uppvisar utmärkta mottagningshastigheter när den är kopplad till vår 6 GHz-router, men överföringshastigheterna är inte så stabila som förväntat även efter flera försök.
| Networking | |
| iperf3 transmit AX12 | |
| Acer Swift X SFX16-51G-5388 | |
| Dell Inspiron 16 Plus 7610 | |
| Asus Vivobook Pro 16X-M7600QE | |
| iperf3 receive AX12 | |
| Acer Swift X SFX16-51G-5388 | |
| Dell Inspiron 16 Plus 7610 | |
| Asus Vivobook Pro 16X-M7600QE | |
| iperf3 receive AXE11000 6GHz | |
| Lenovo Yoga 7 16IAP7 | |
| Dell Inspiron 16 Plus 7620 | |
| iperf3 transmit AXE11000 6GHz | |
| Lenovo Yoga 7 16IAP7 | |
| Dell Inspiron 16 Plus 7620 | |
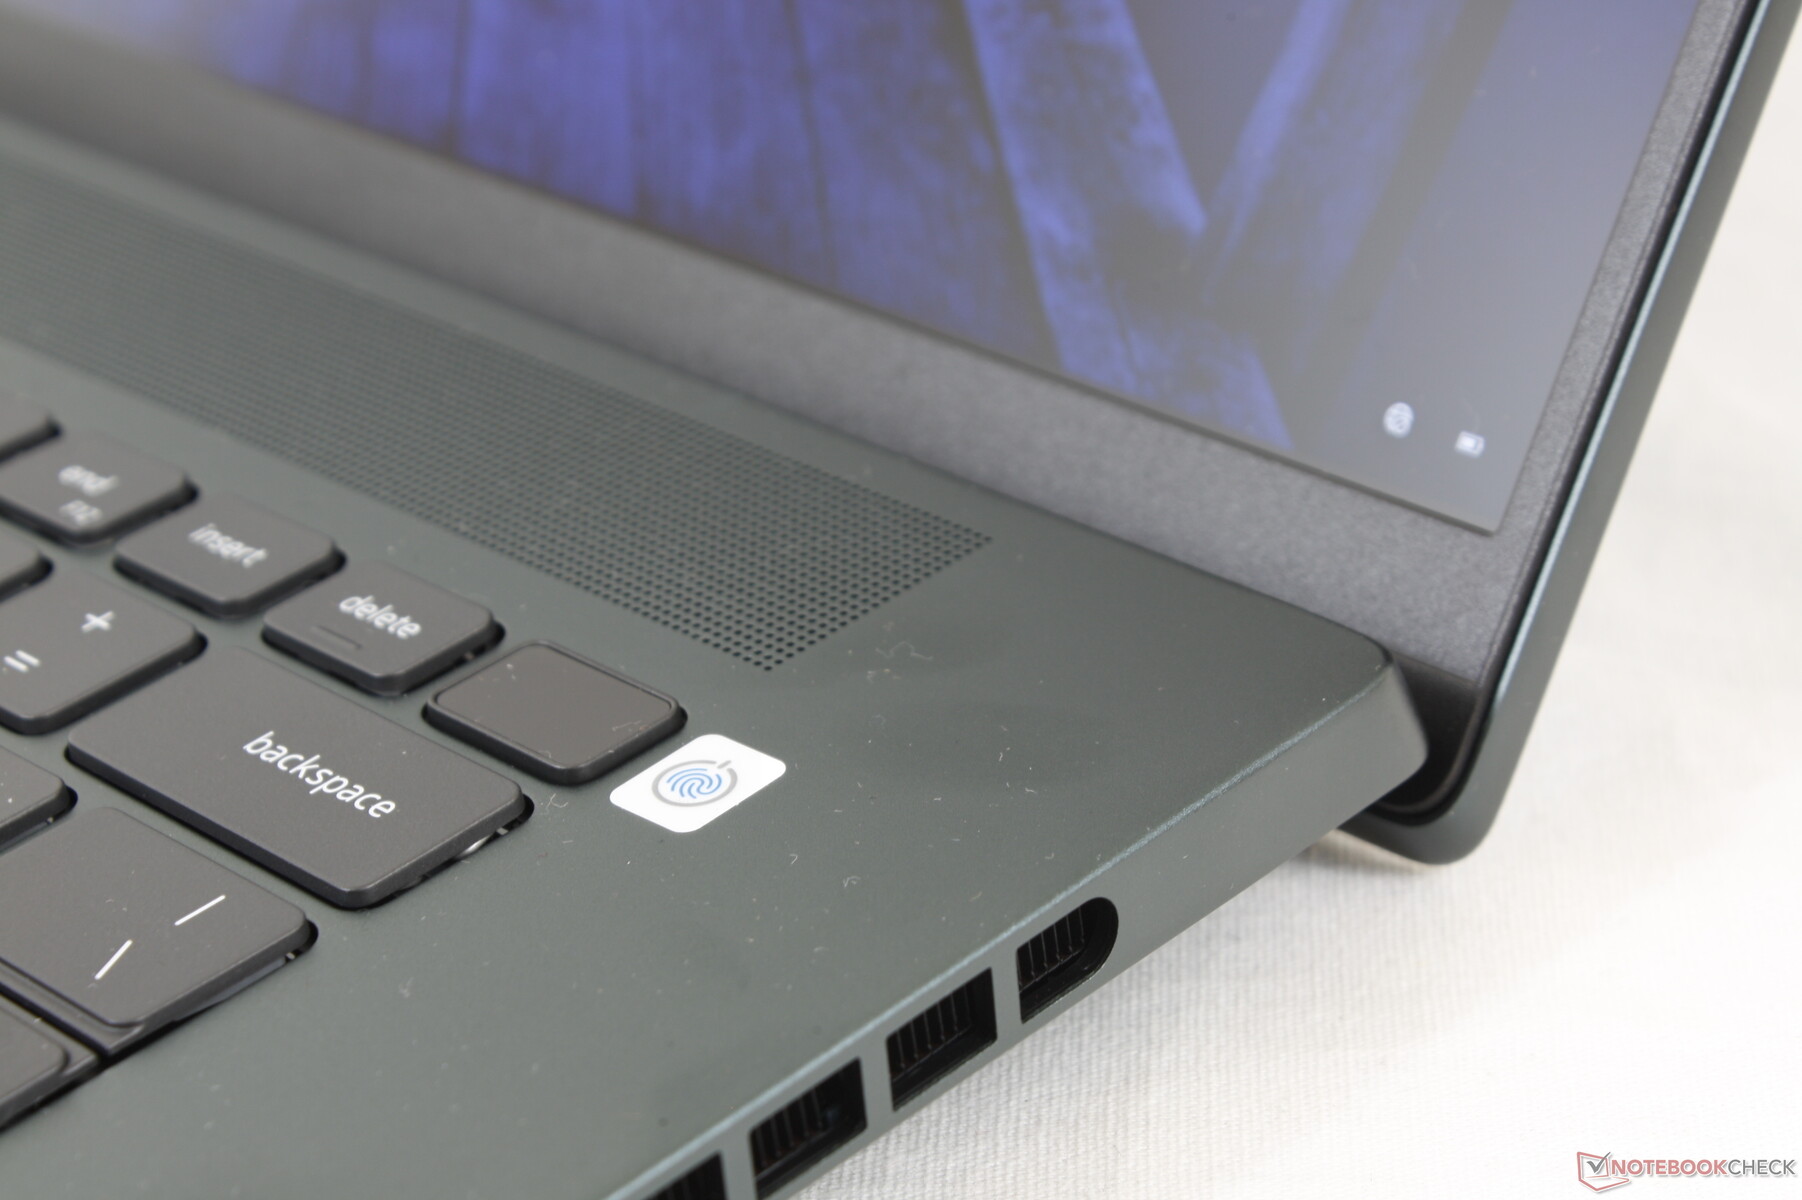
Webbkamera - nu 2 MP i stället för 1 MP
Dell har uppgraderat webbkameran från 720p eller 1 MP på Inspiron 16 Plus 7610 till 1080p eller 2 MP på 7620-modellen för renare bilder. Det finns stöd för Windows Hello och en fysisk stängare för webbkameran för att skydda privatlivet.


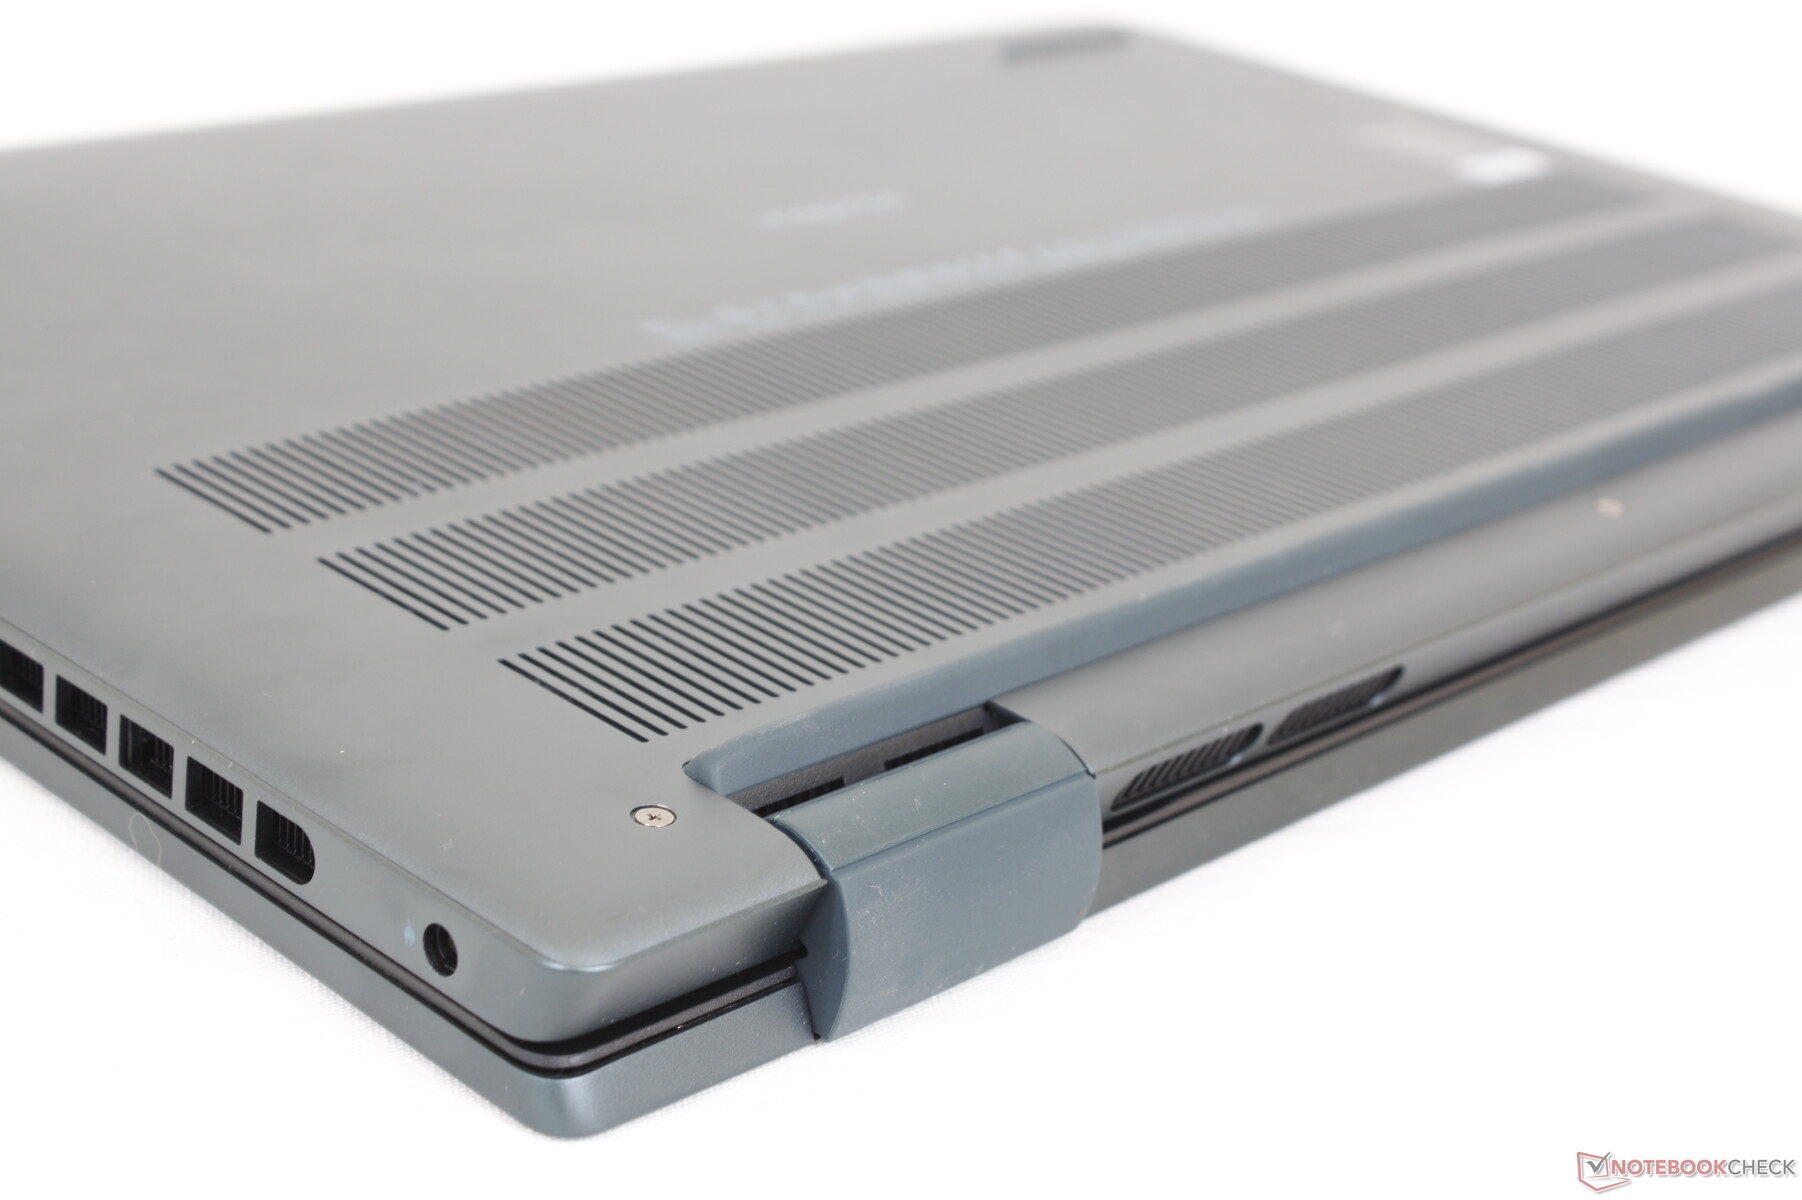
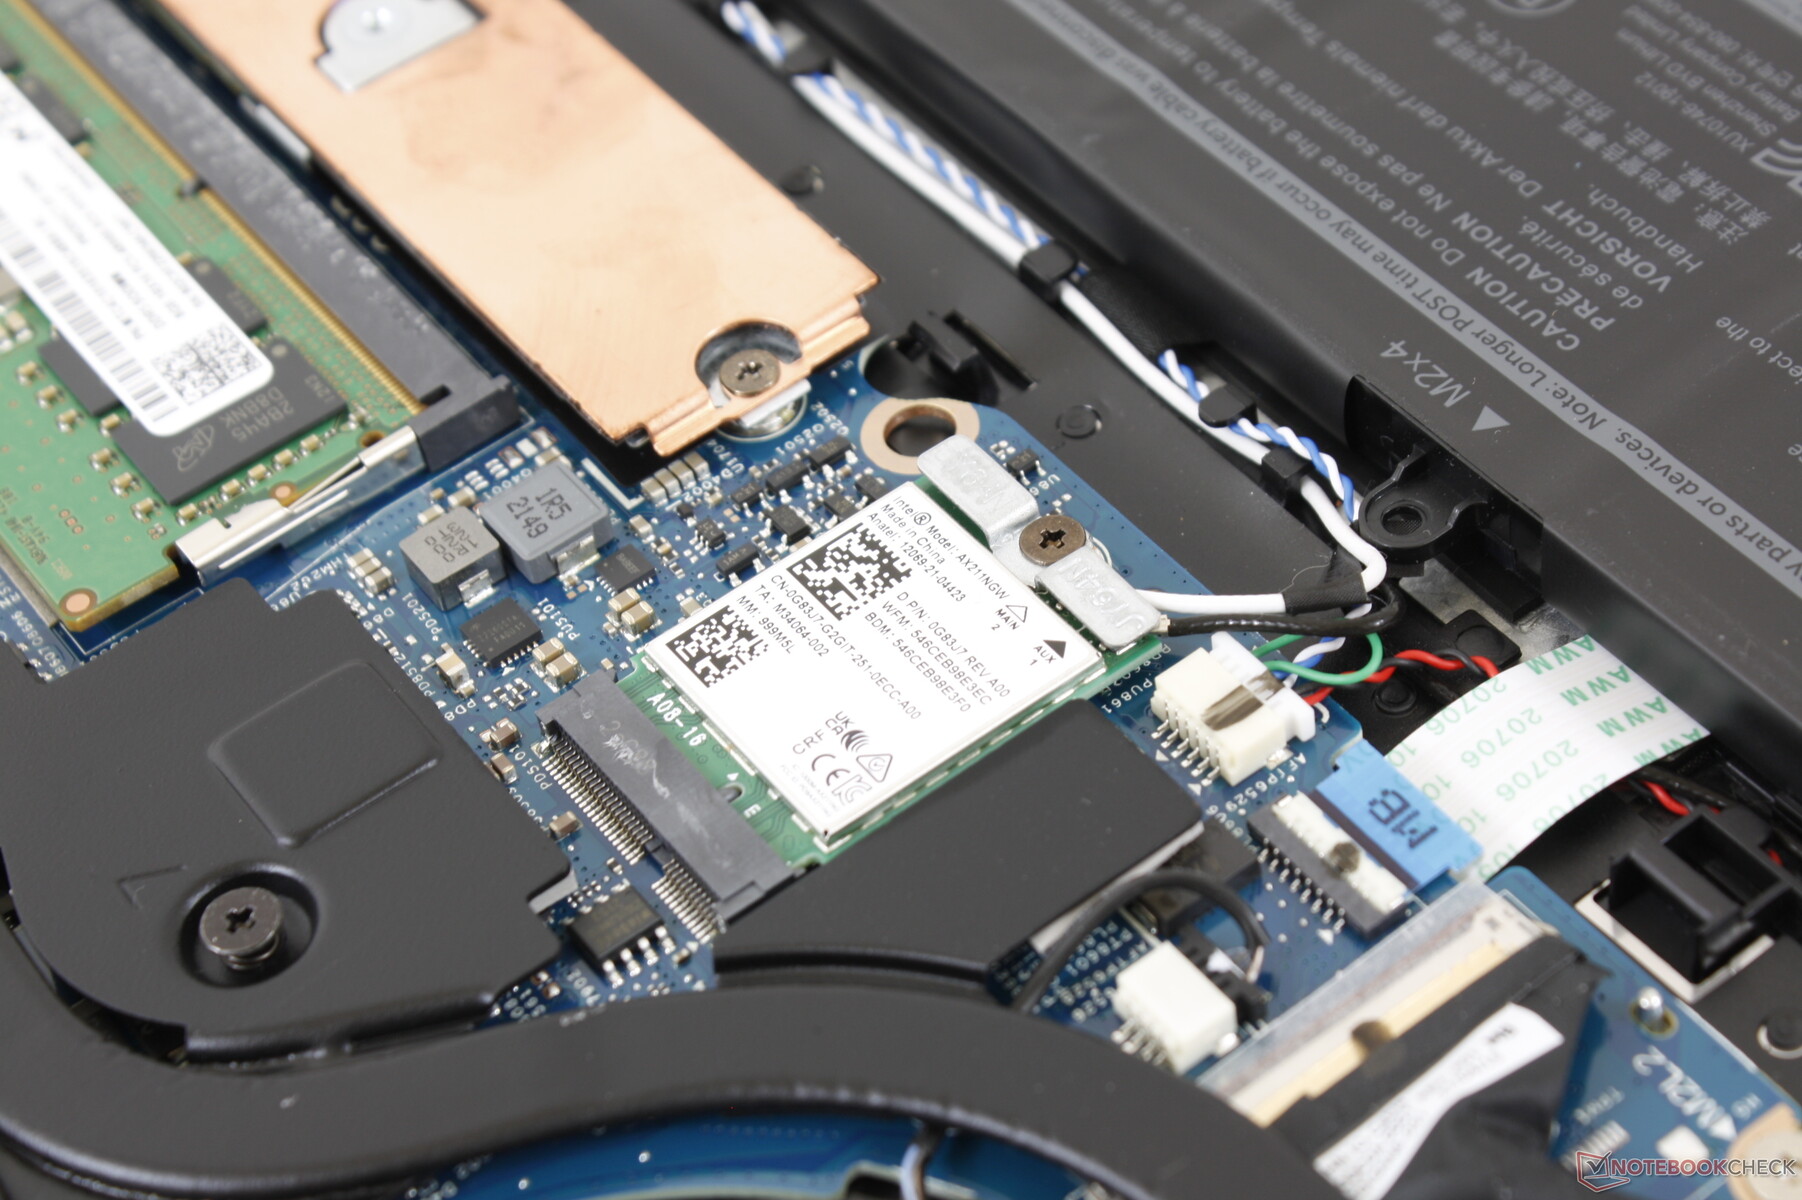
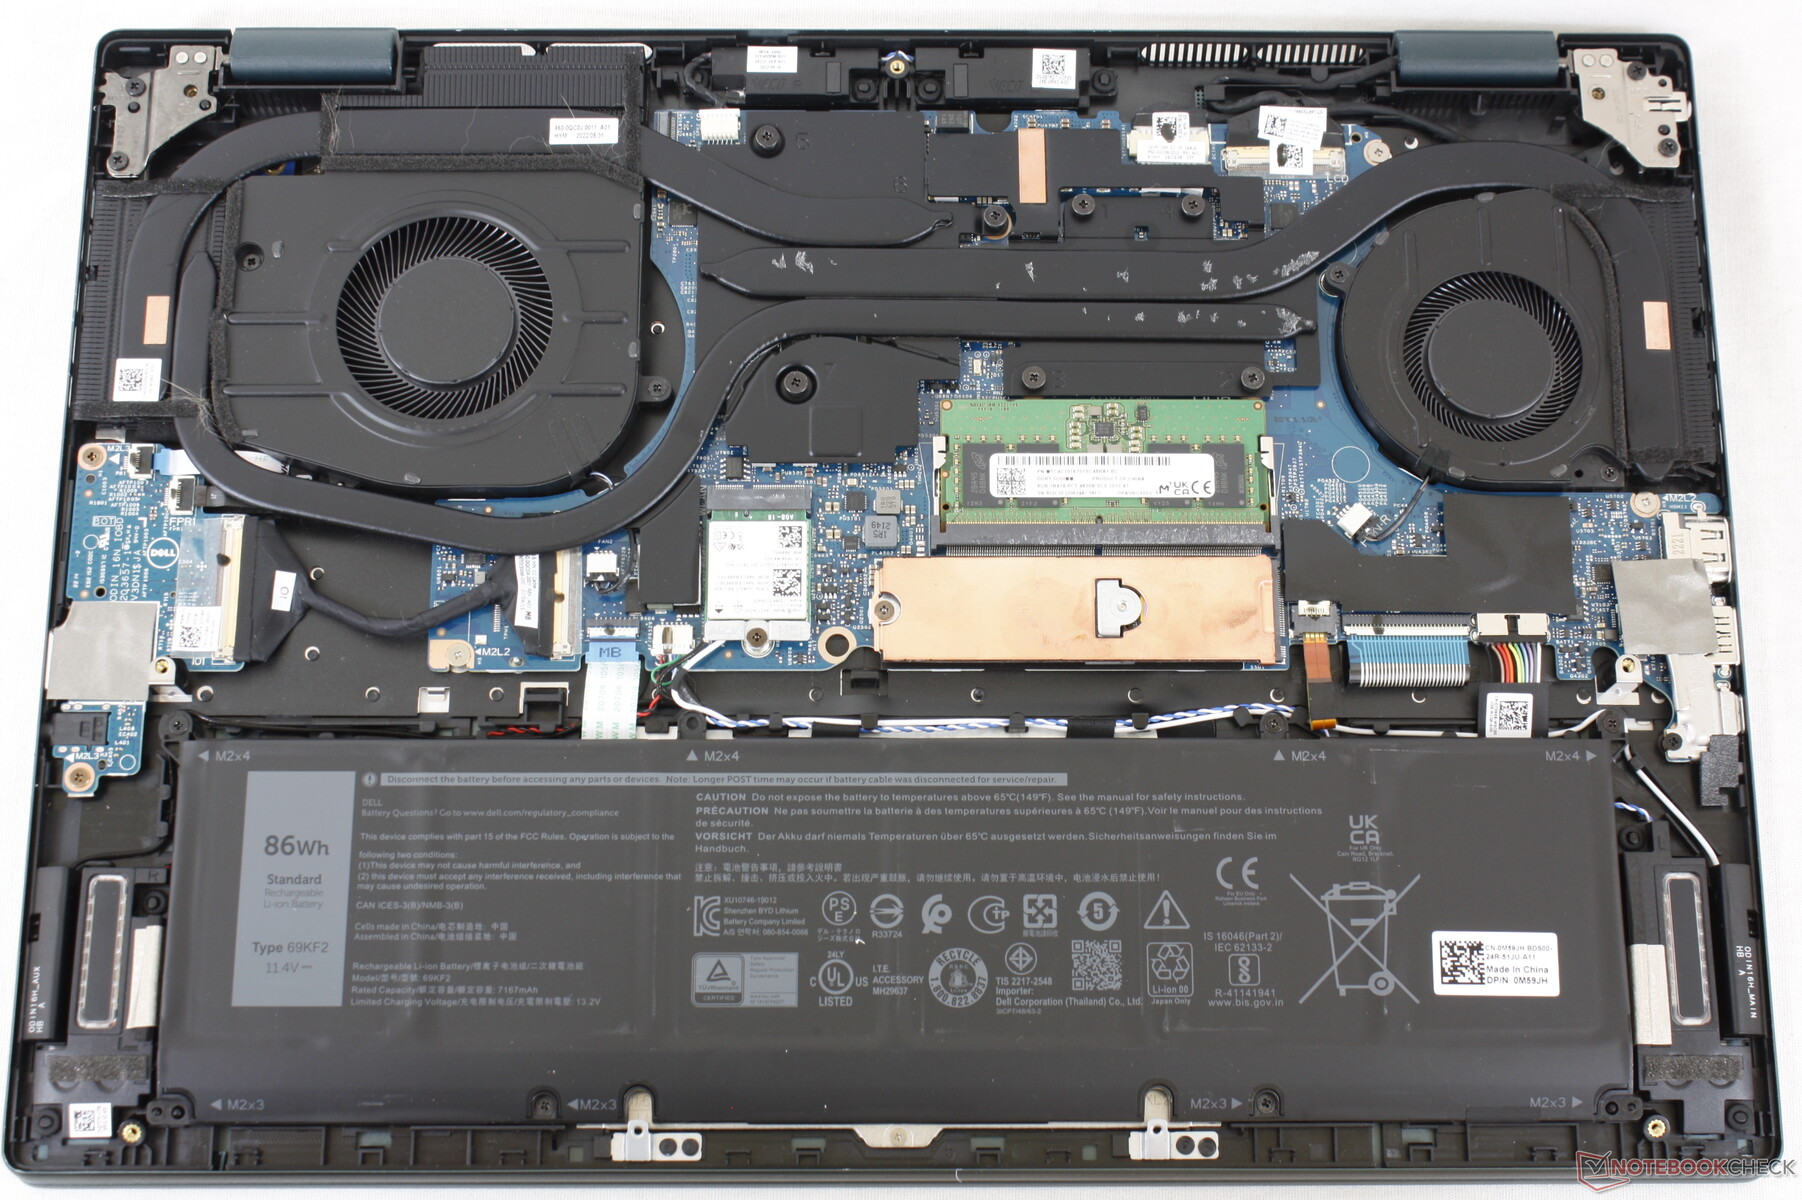
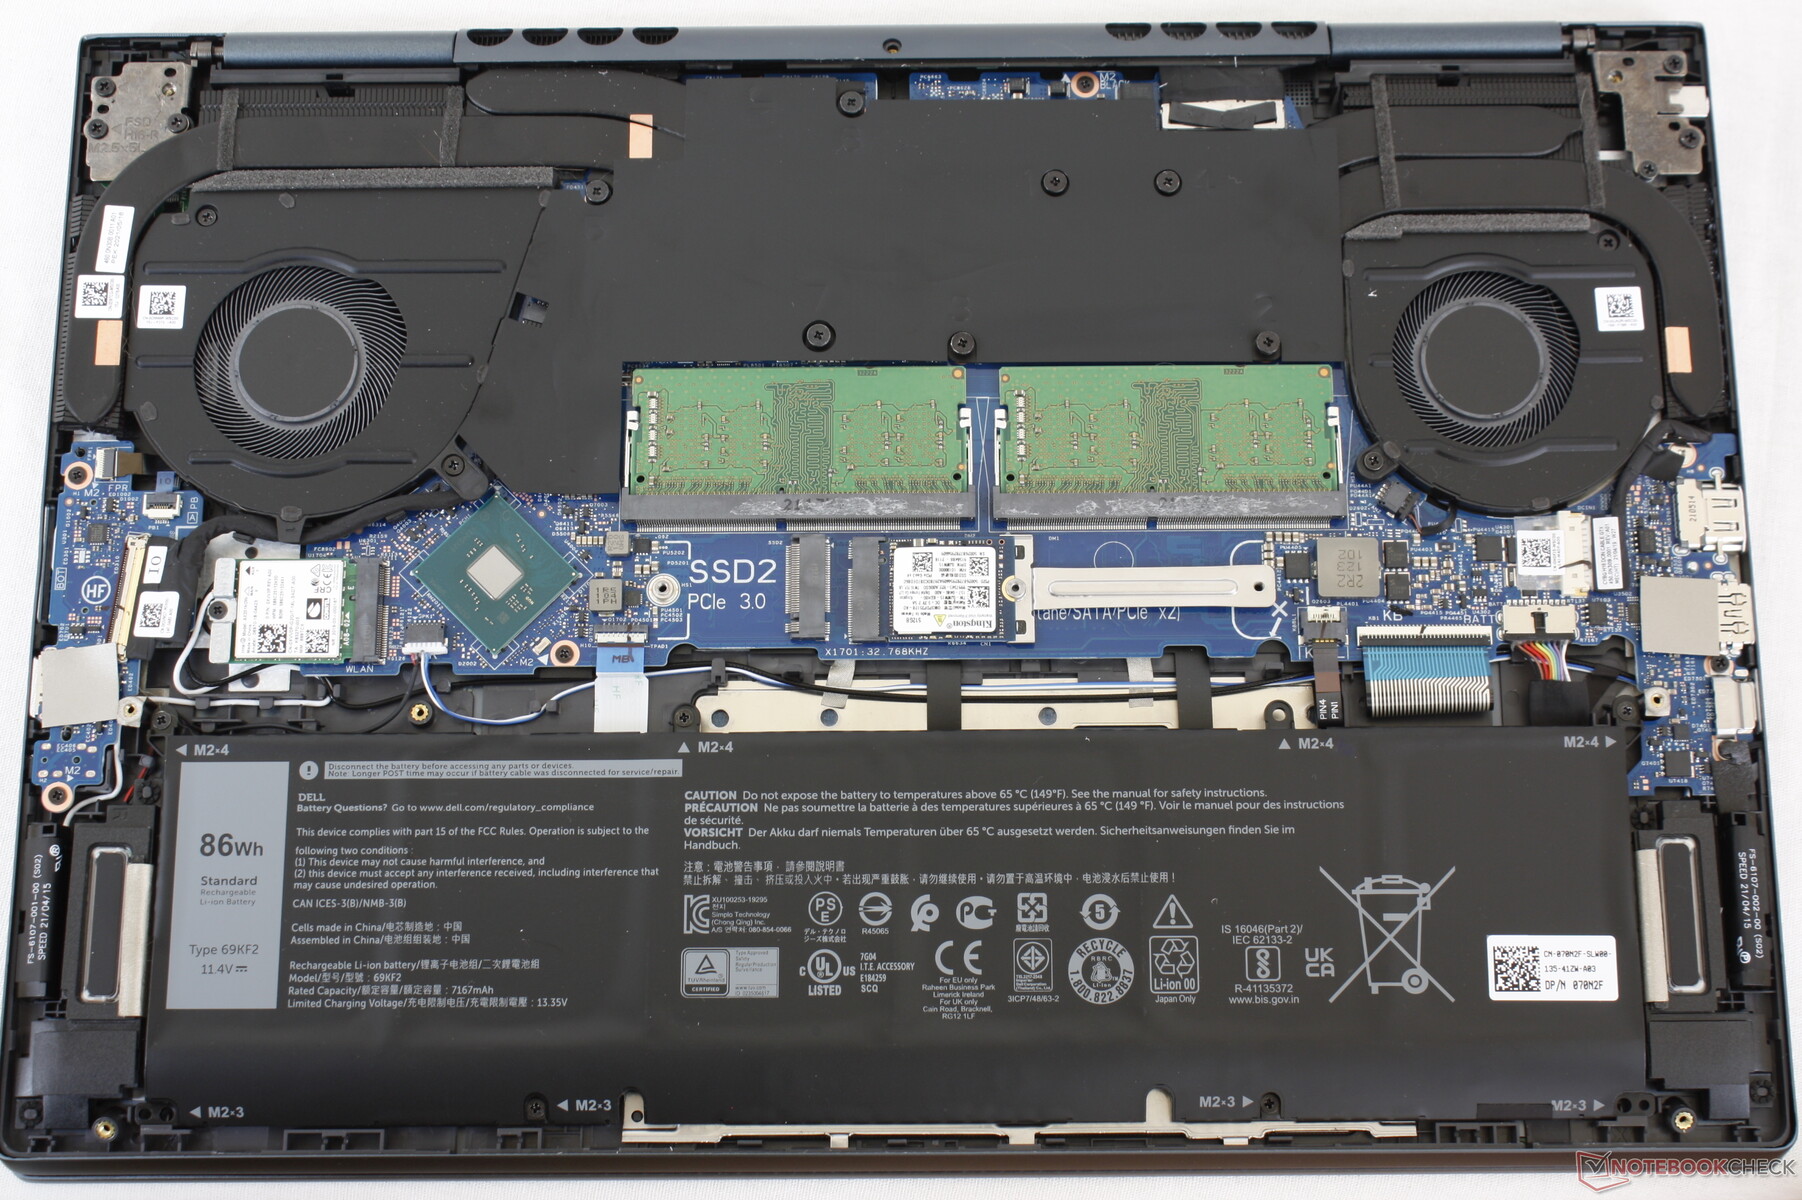
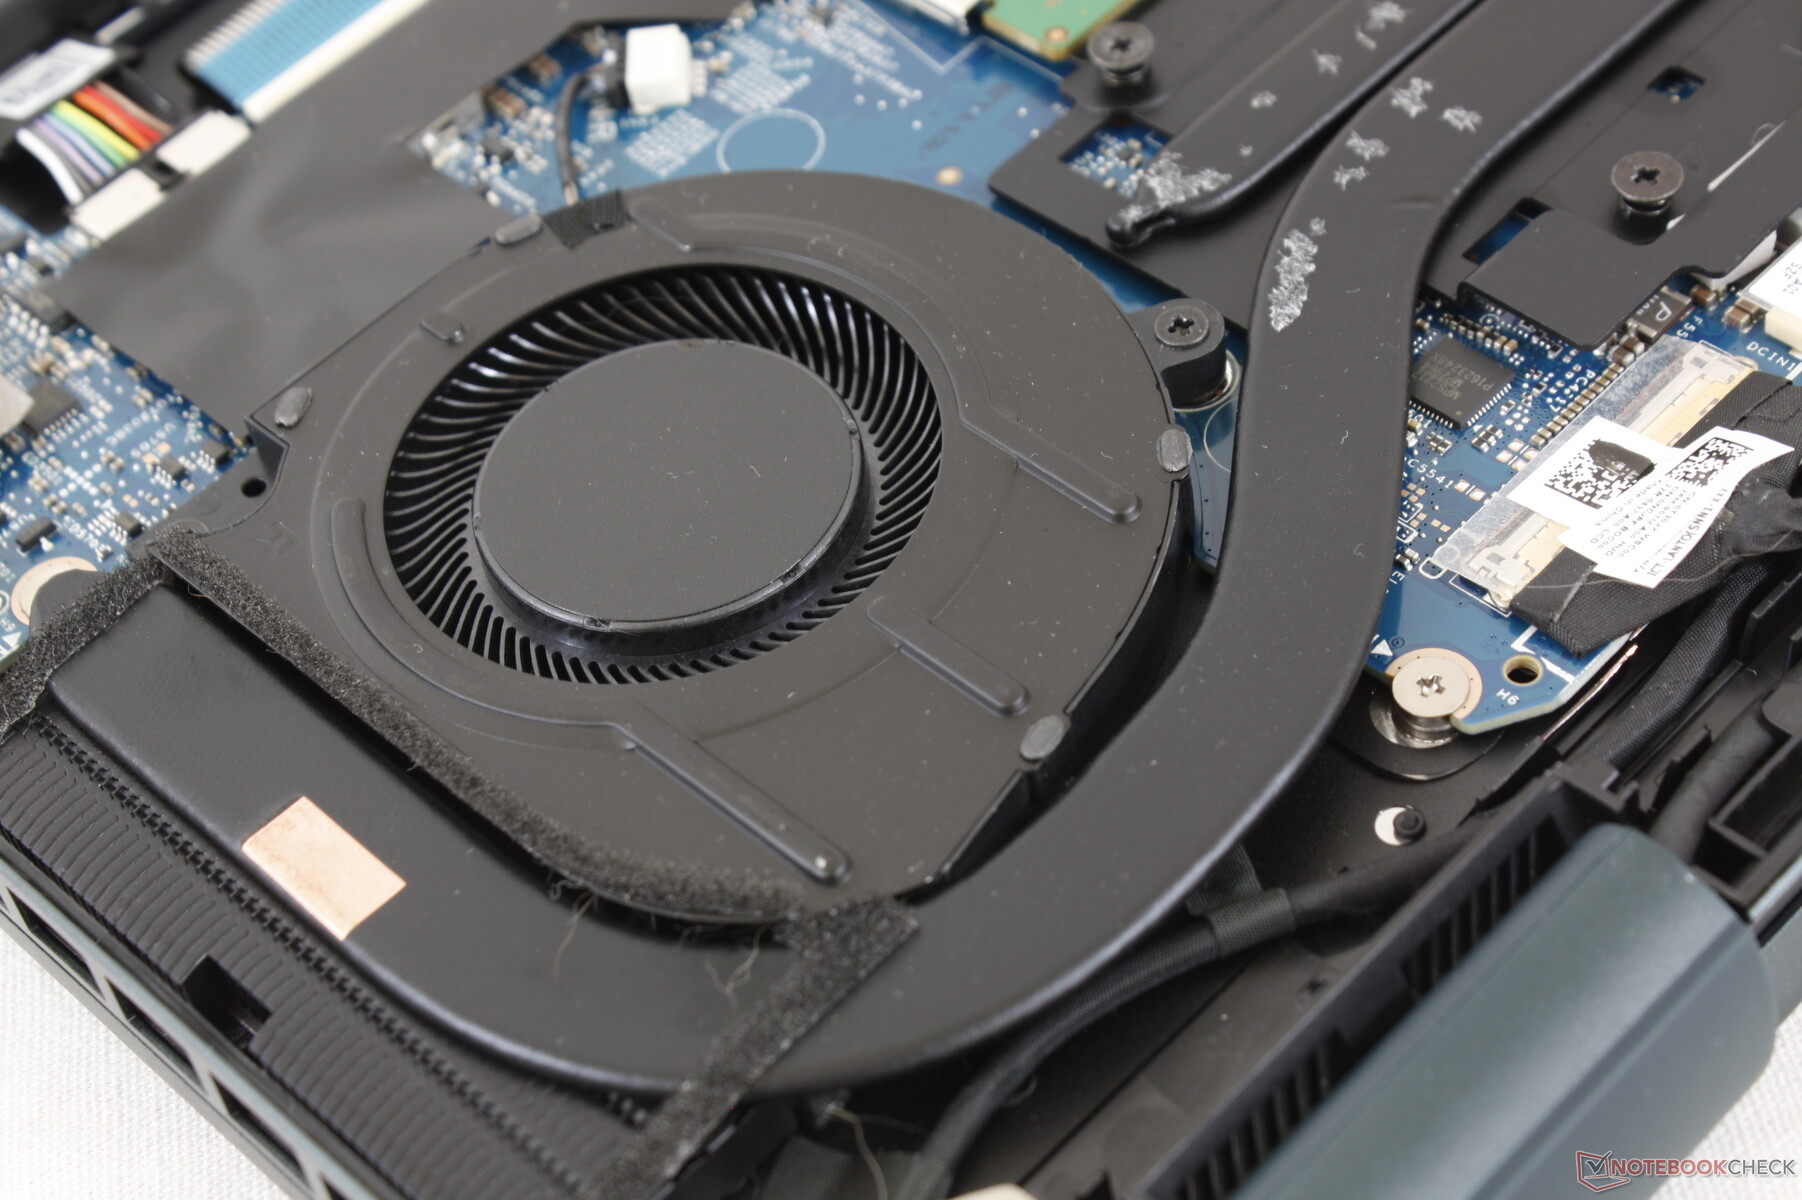
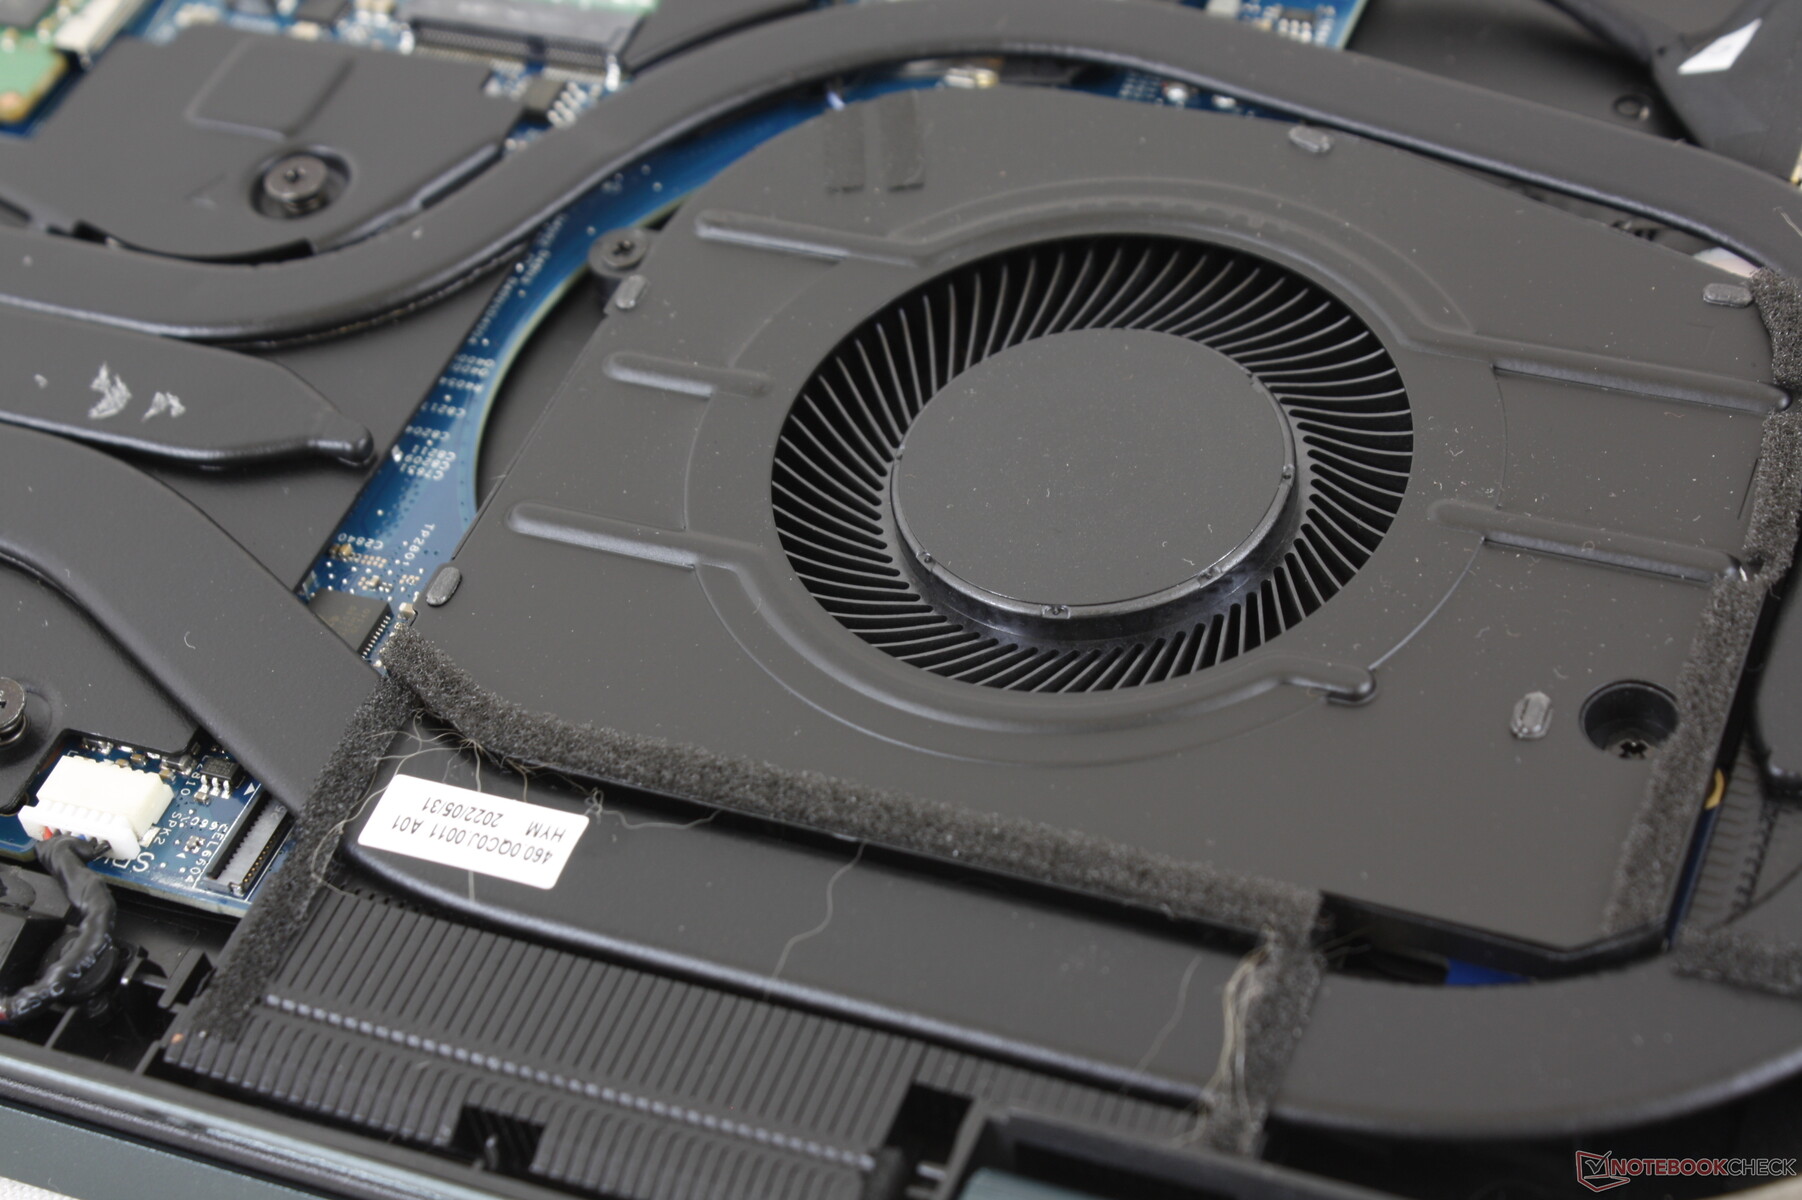
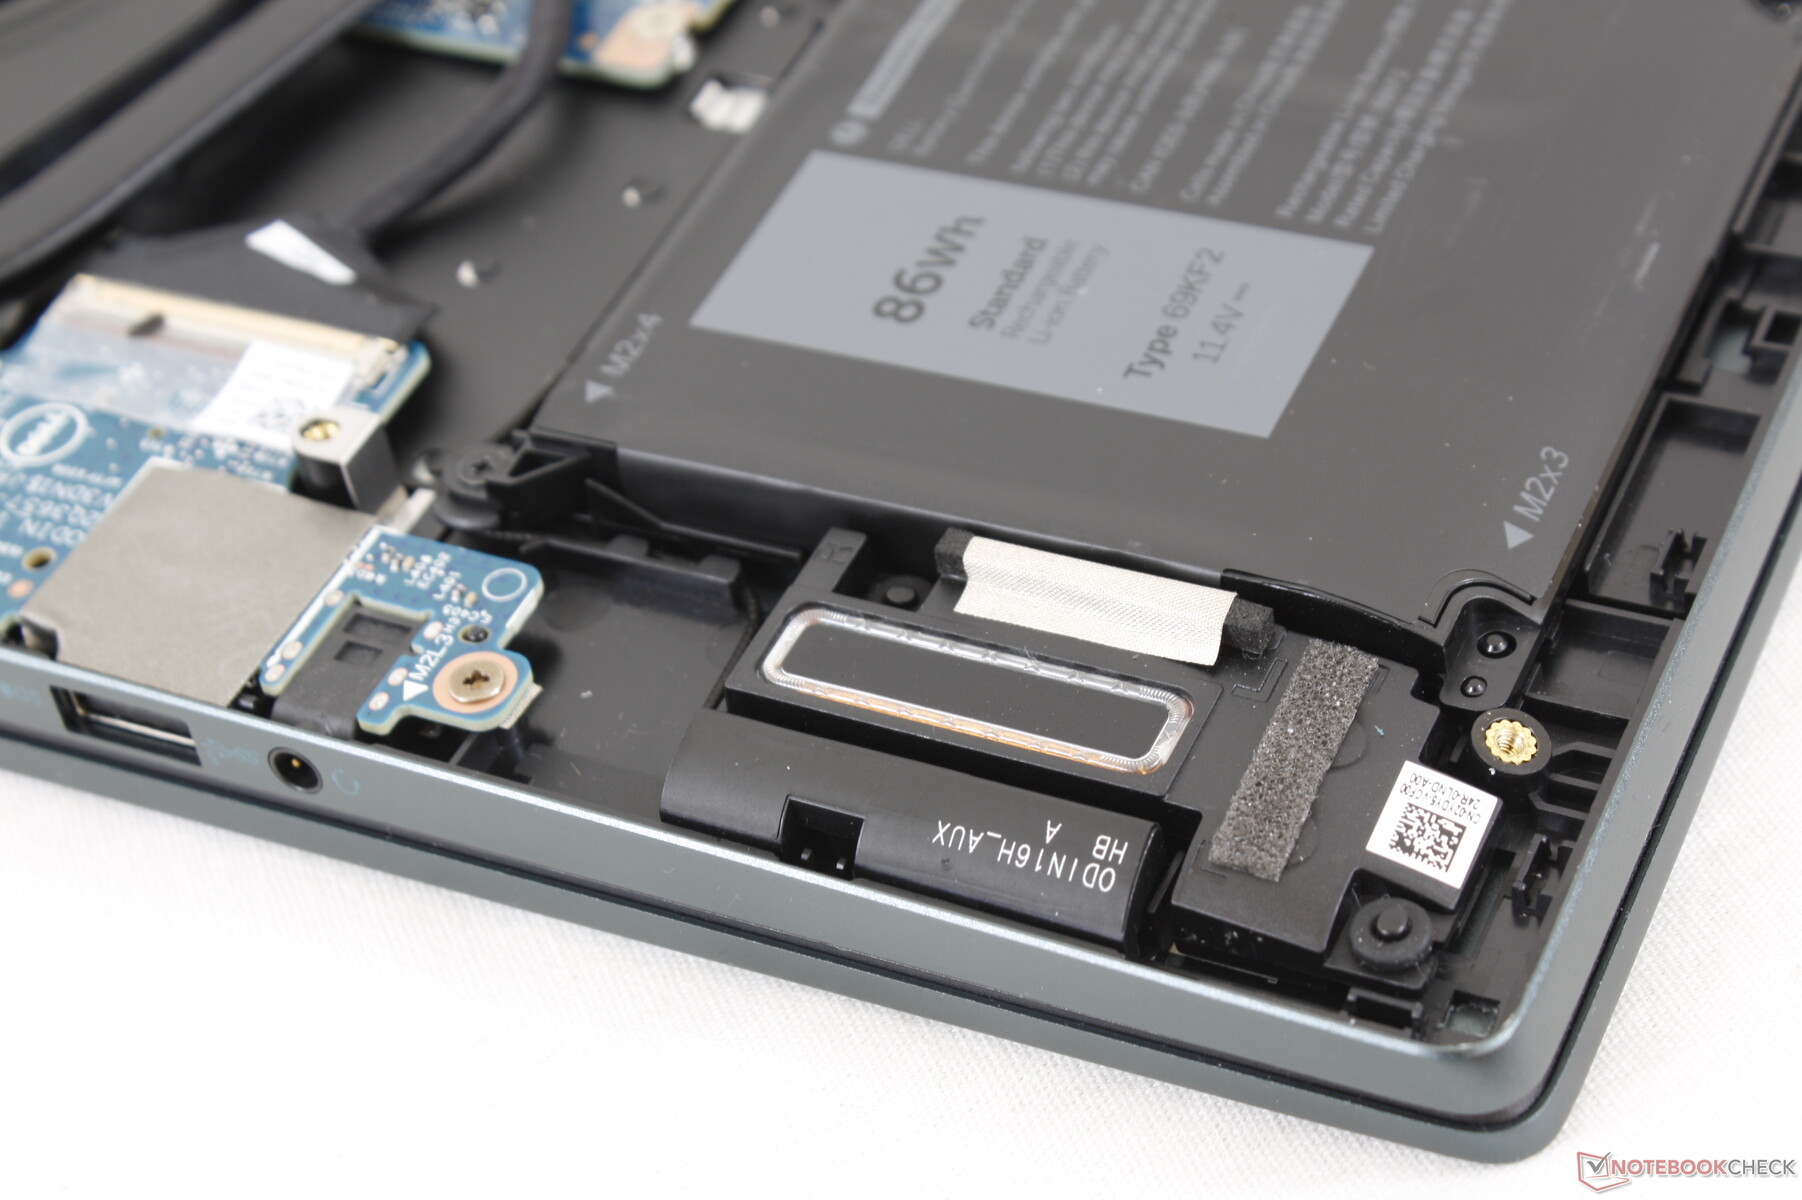
Underhåll
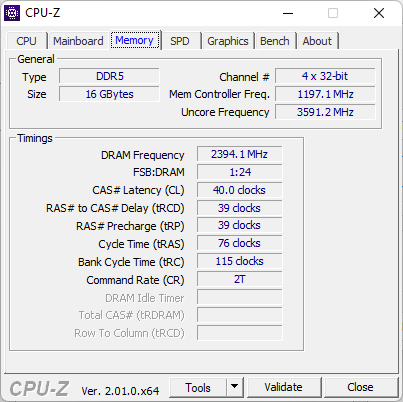
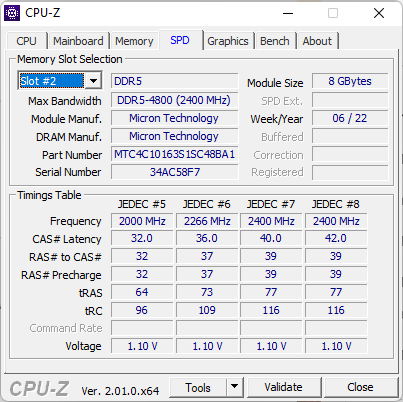
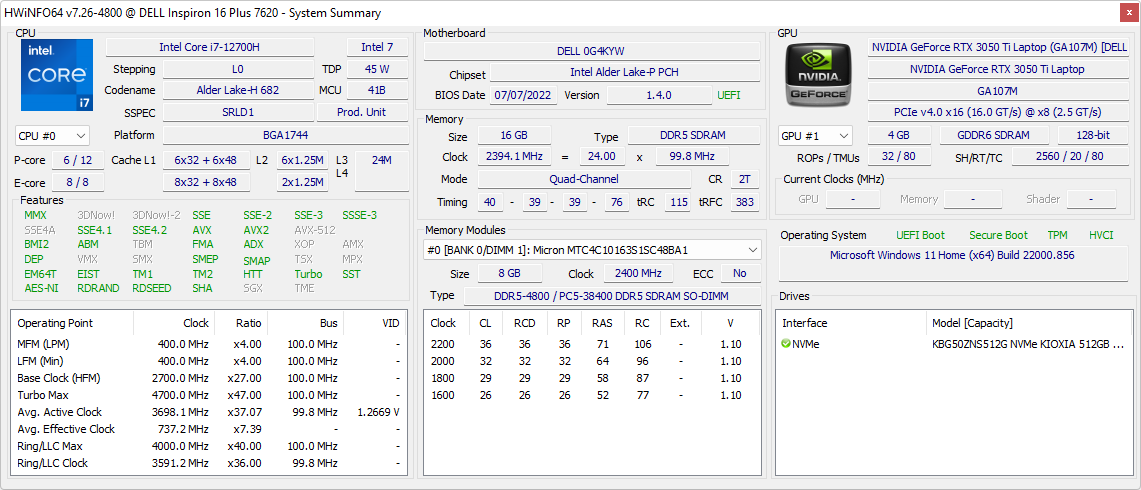
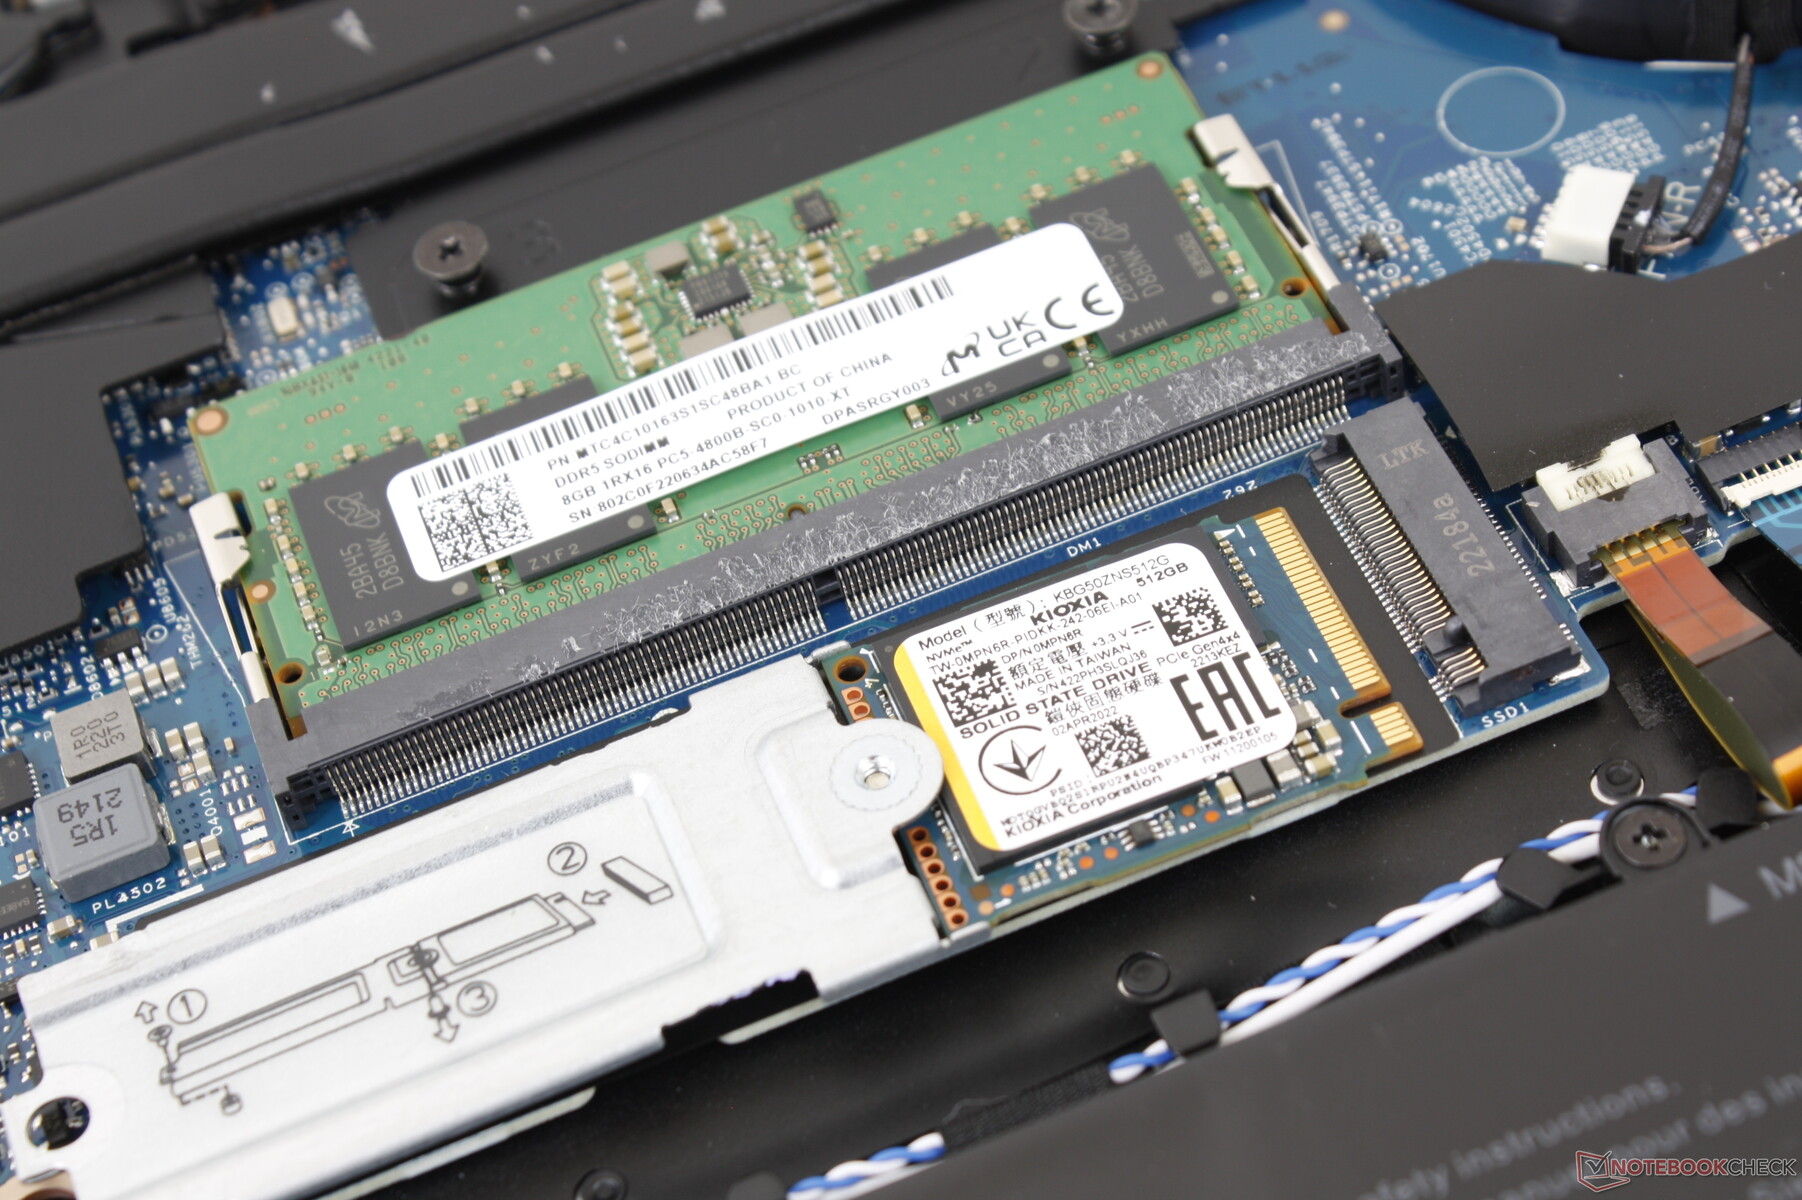
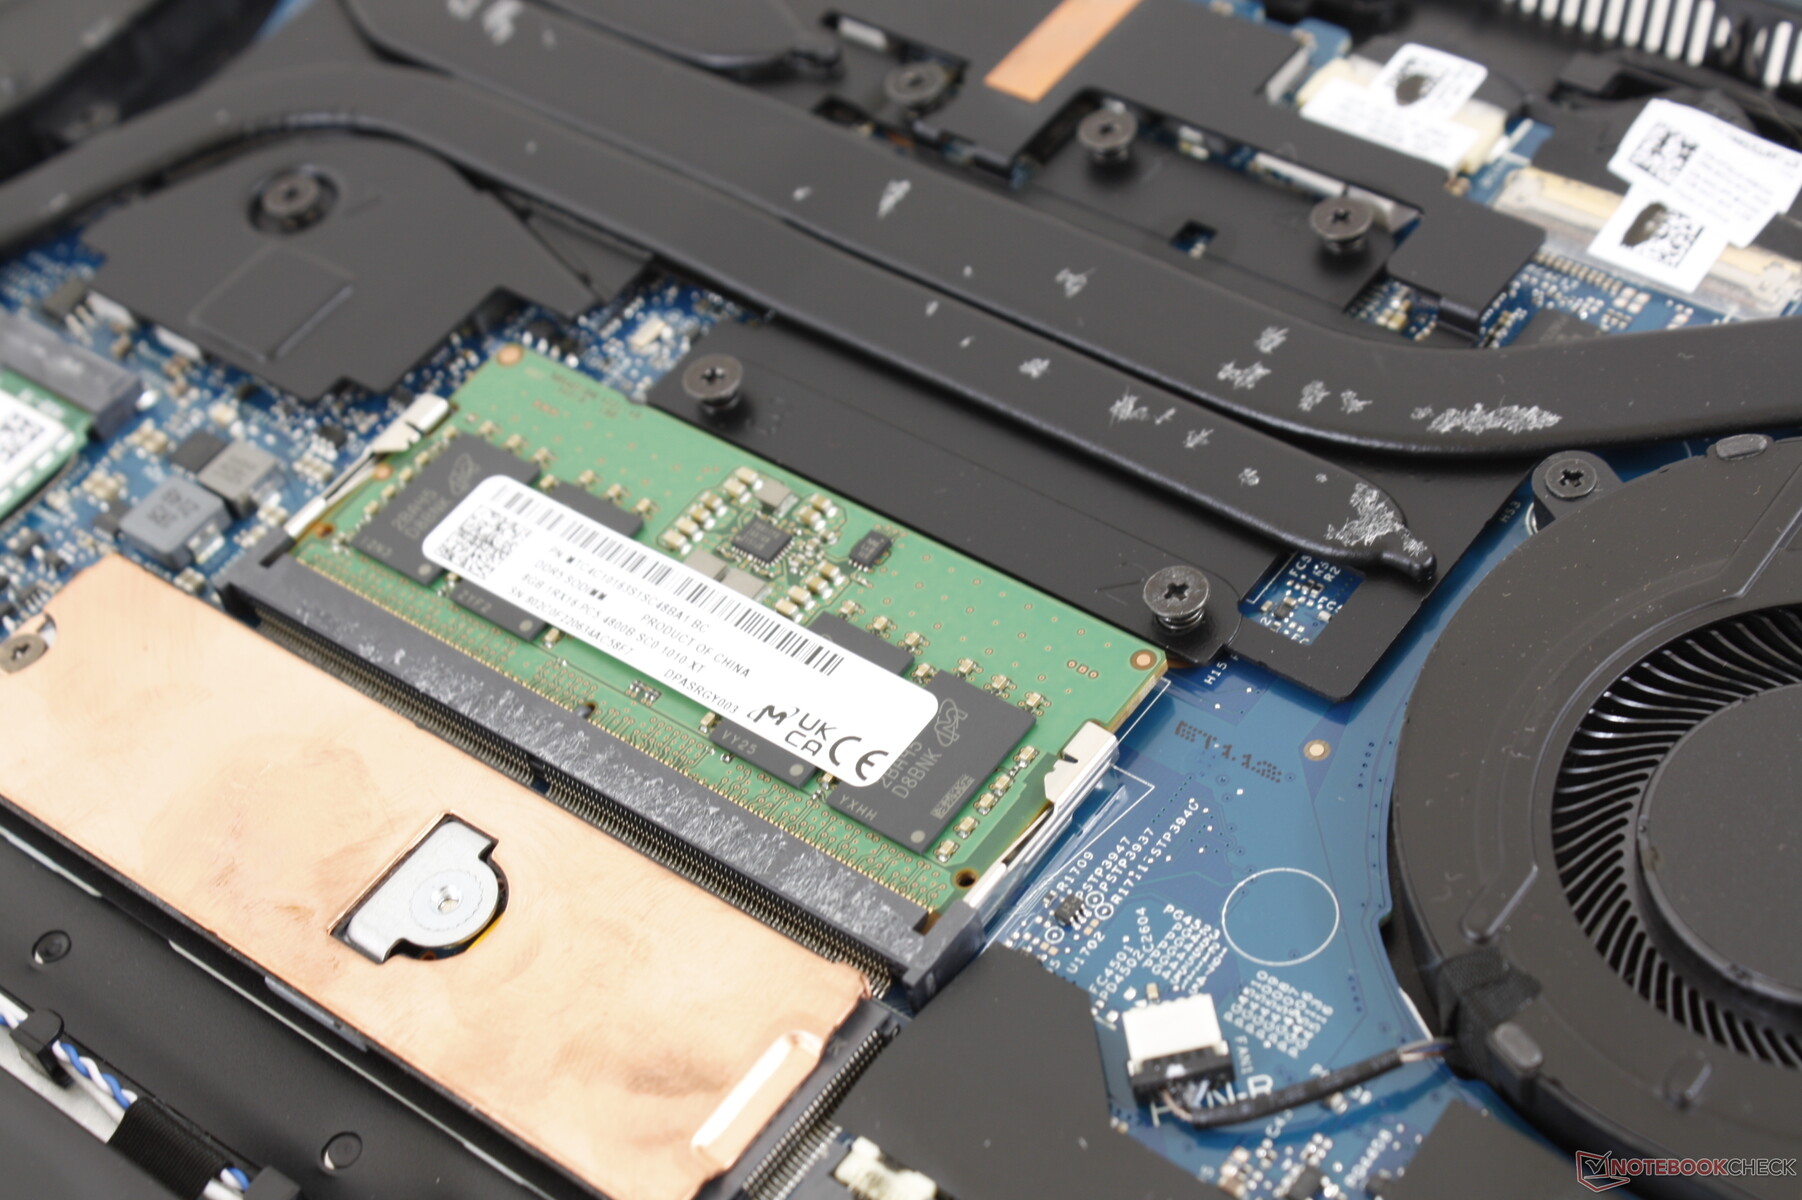
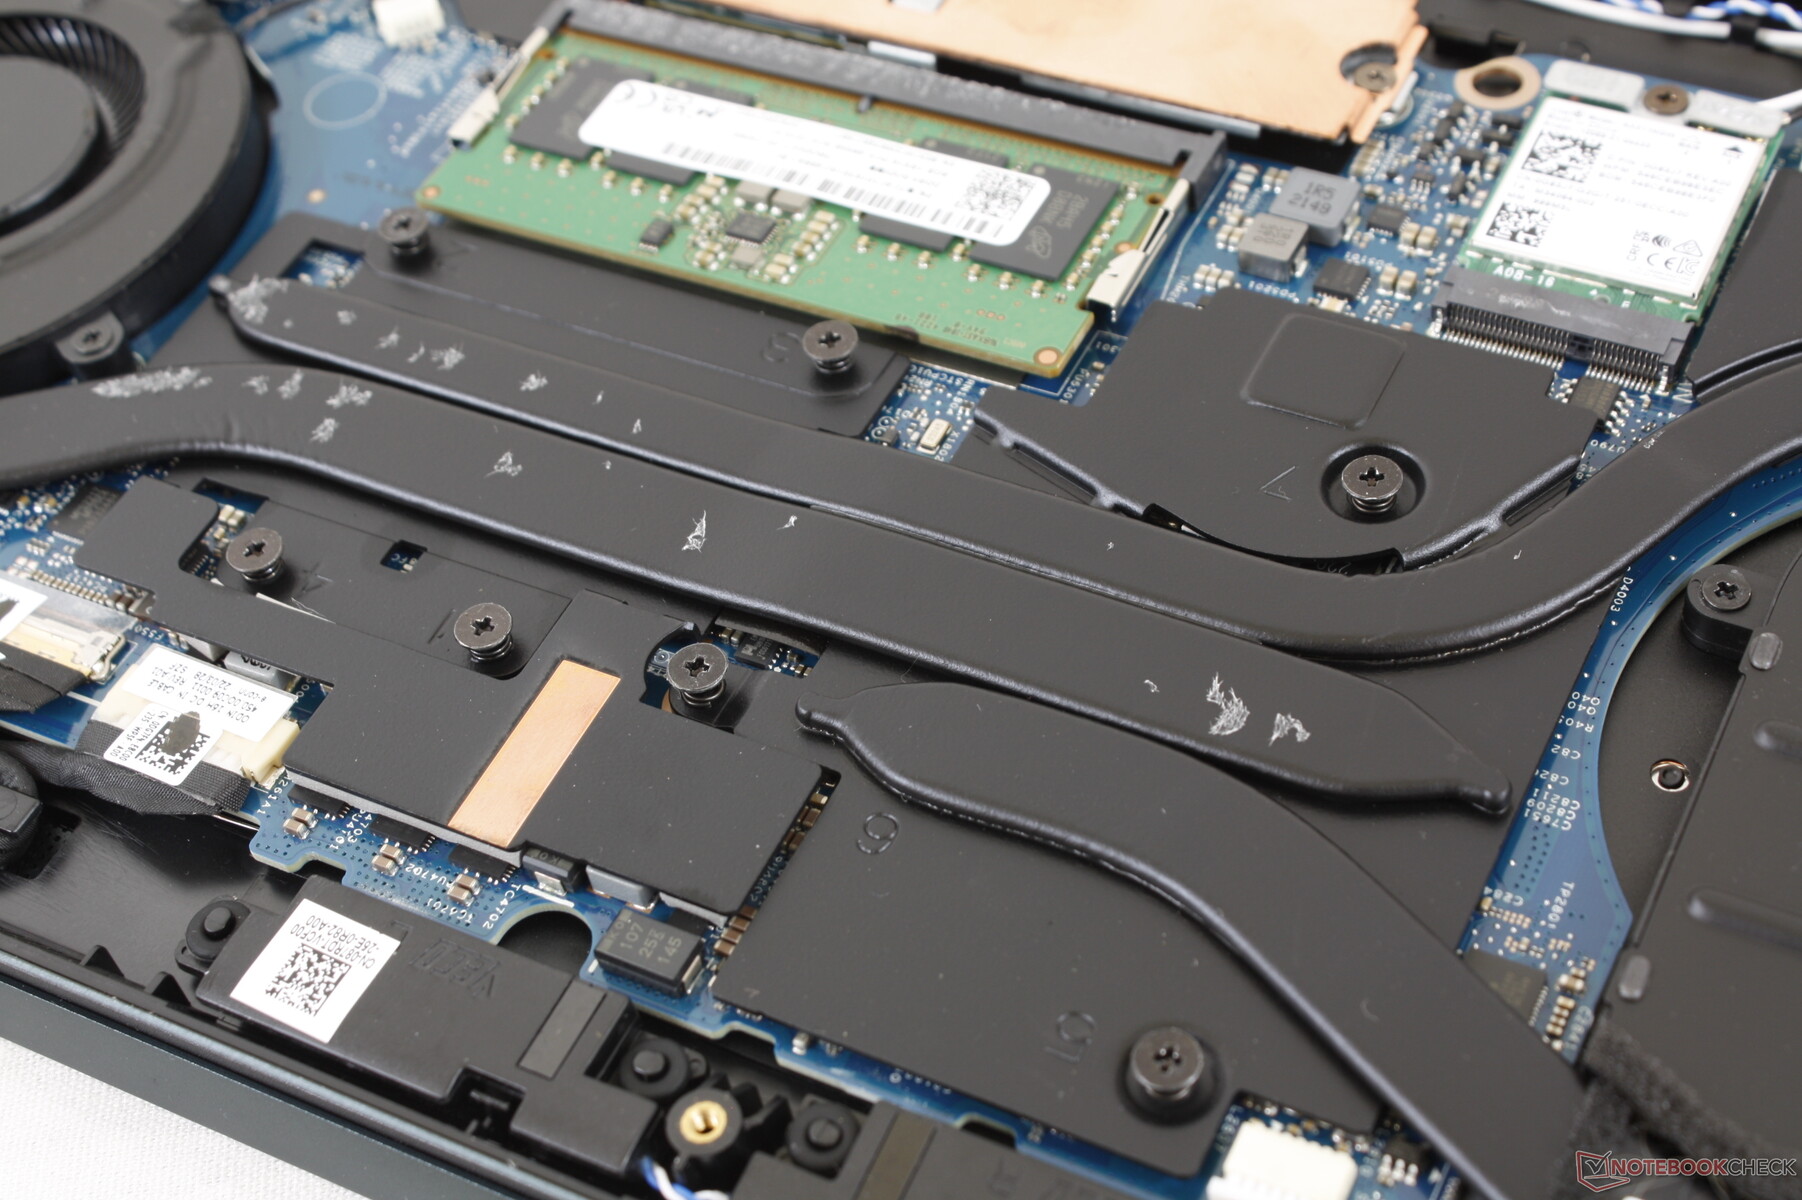
Bottenpanelen kan lätt tas bort med en Philips-skruvmejsel. När man väl är inne kommer användarna att märka den reviderade kylningslösningen jämfört med den äldre 7610. Förändringarna har faktiskt tagit bort en SODIMM-plats och en M.2 SSD-plats från 7620, vilket gör att det bara finns en SSD-plats och en SODIMM-plats att arbeta med, vilket visas på våra bilder nedan. Mer förvirrande är att användare som väljer RTX 3060 SKU kommer att ha 2x SODIMM-platser.
8 GB RAM kommer lödda på vårt kort för maximalt 40 GB om de konfigureras med en flyttbar 32 GB DDR5 RAM-modul. RTX 3060 SKU:er kan konfigureras med upp till 64 GB eftersom de har 2x SODIMM-fack och inga lödda RAM-minnen.
Tillbehör och garanti
Det finns inget extra i lådan förutom nätadapter och papper. Den vanliga ettåriga begränsade garantin gäller om den köps i USA.
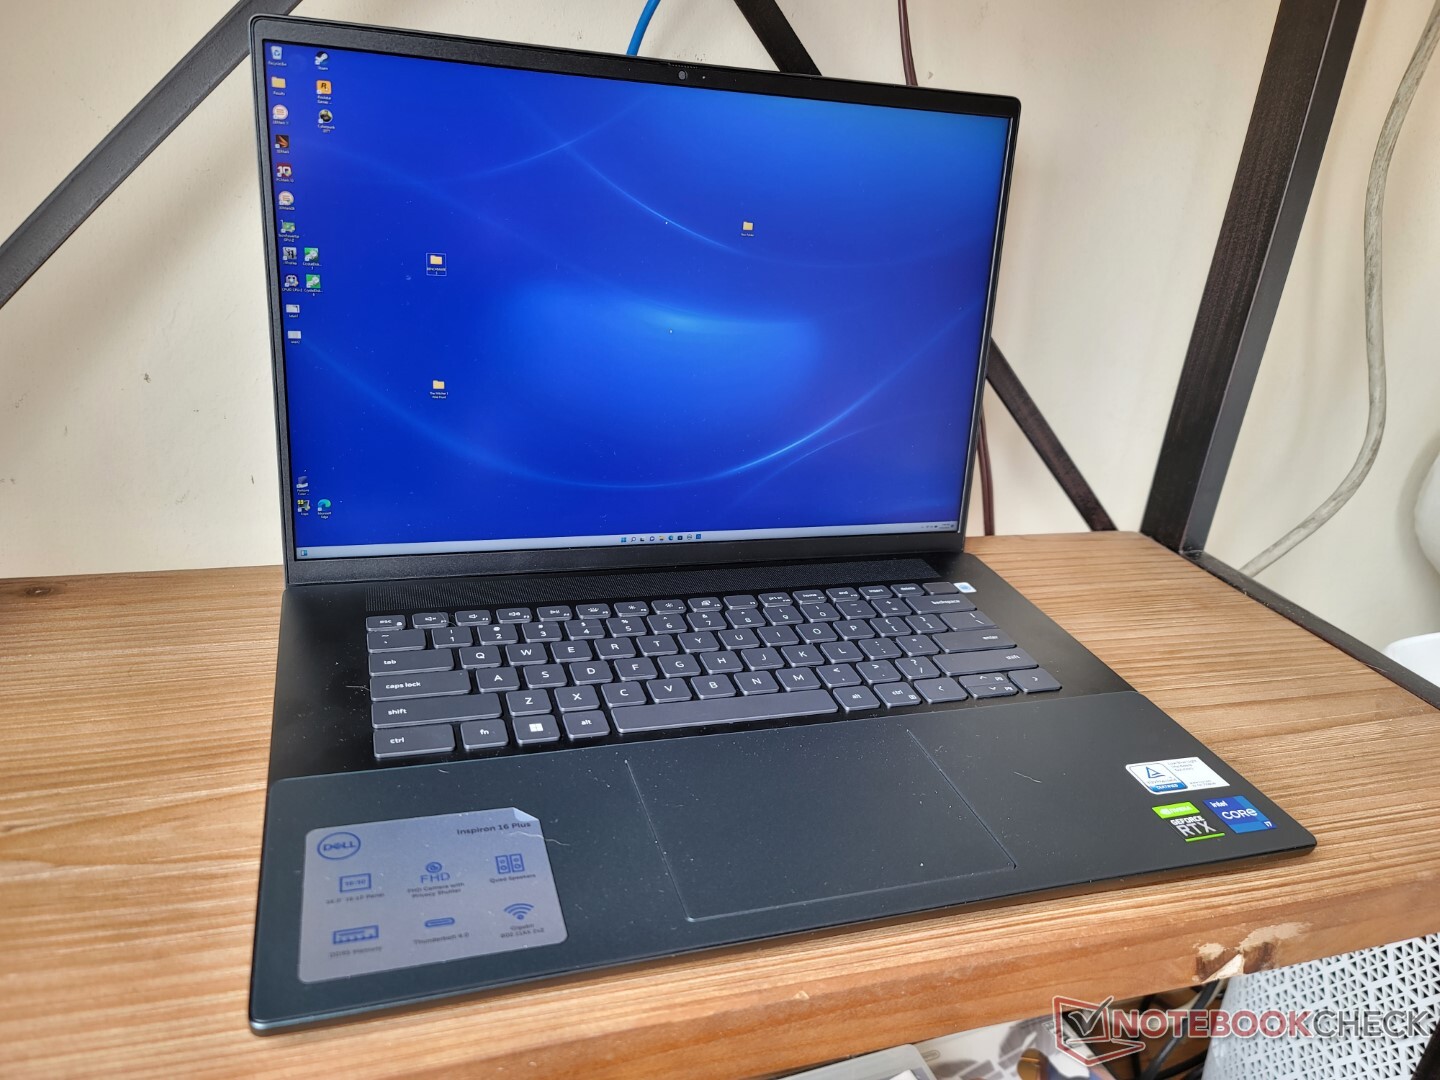
Inmatningsenheter - Samma som Inspiron 16 Plus 7620 2-in-1
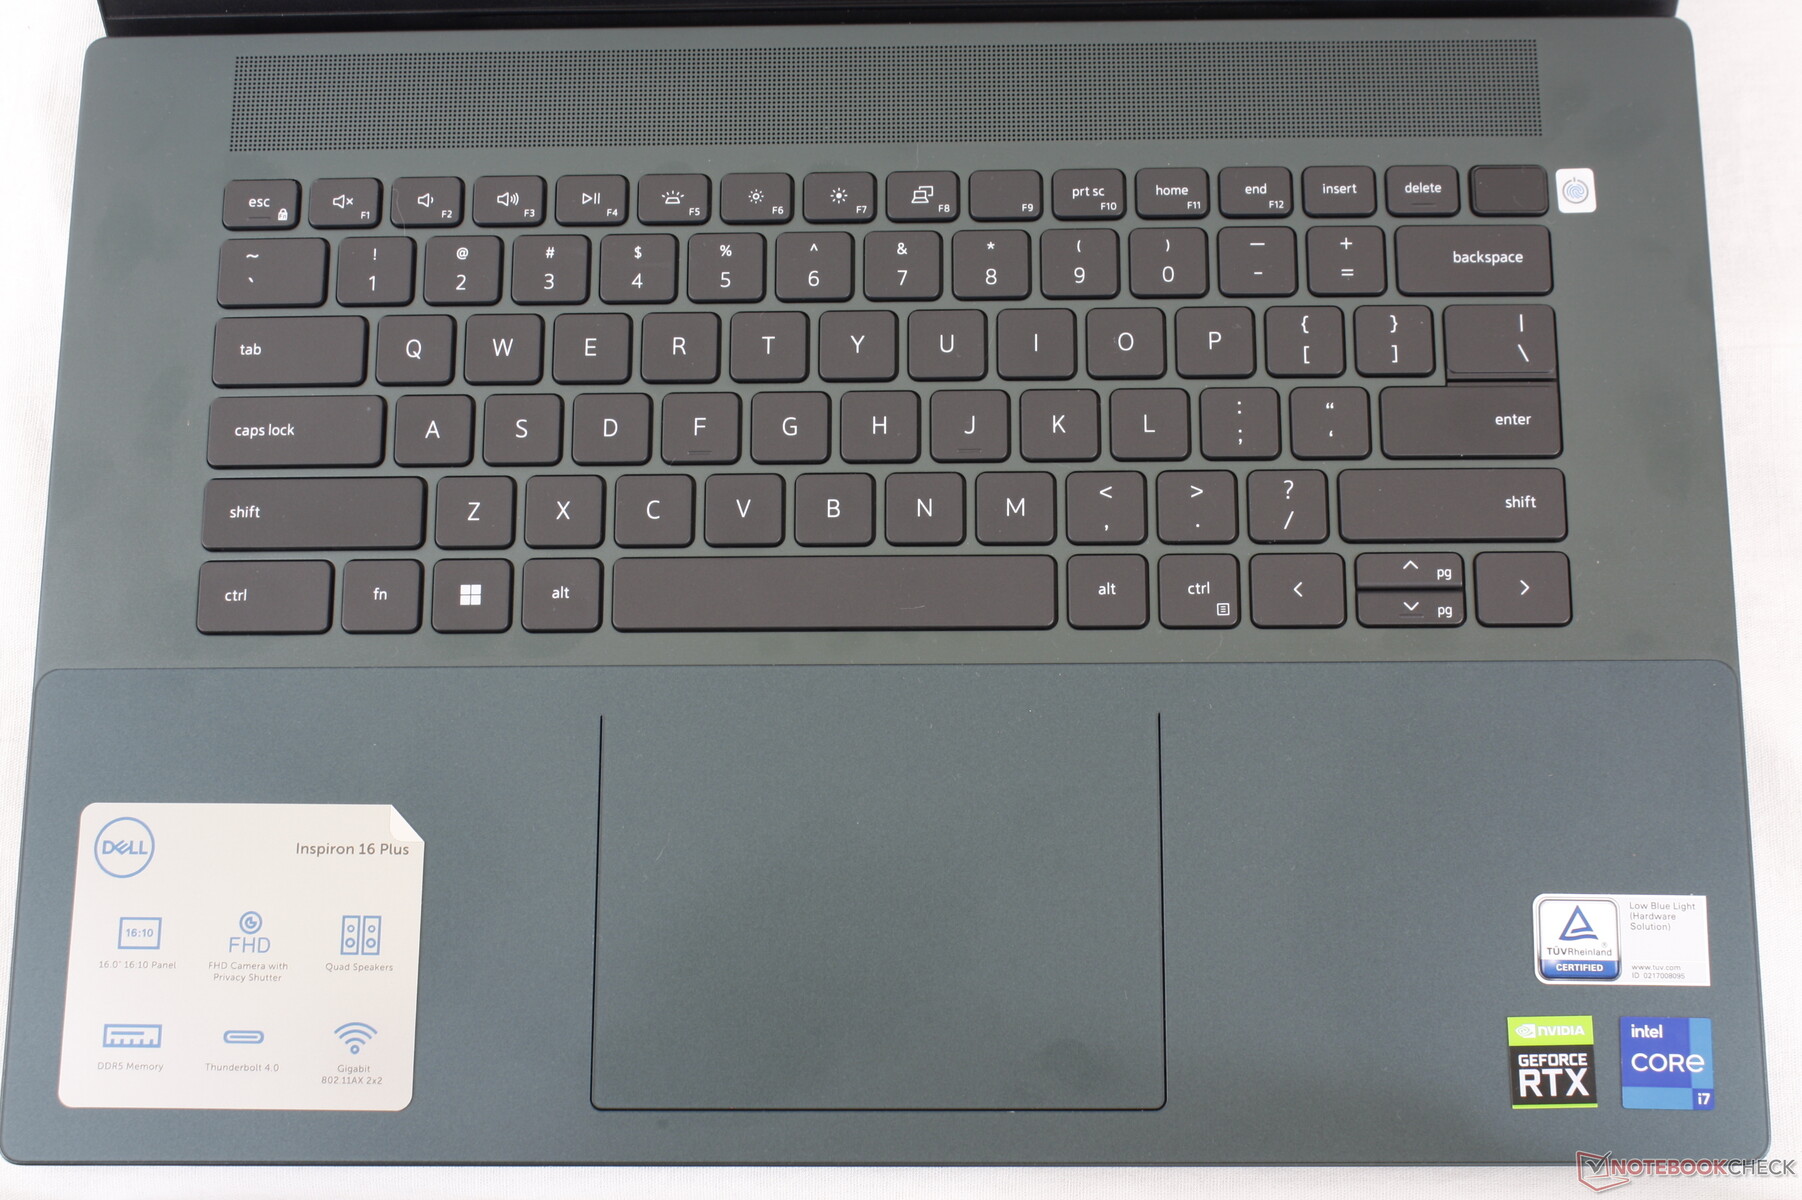
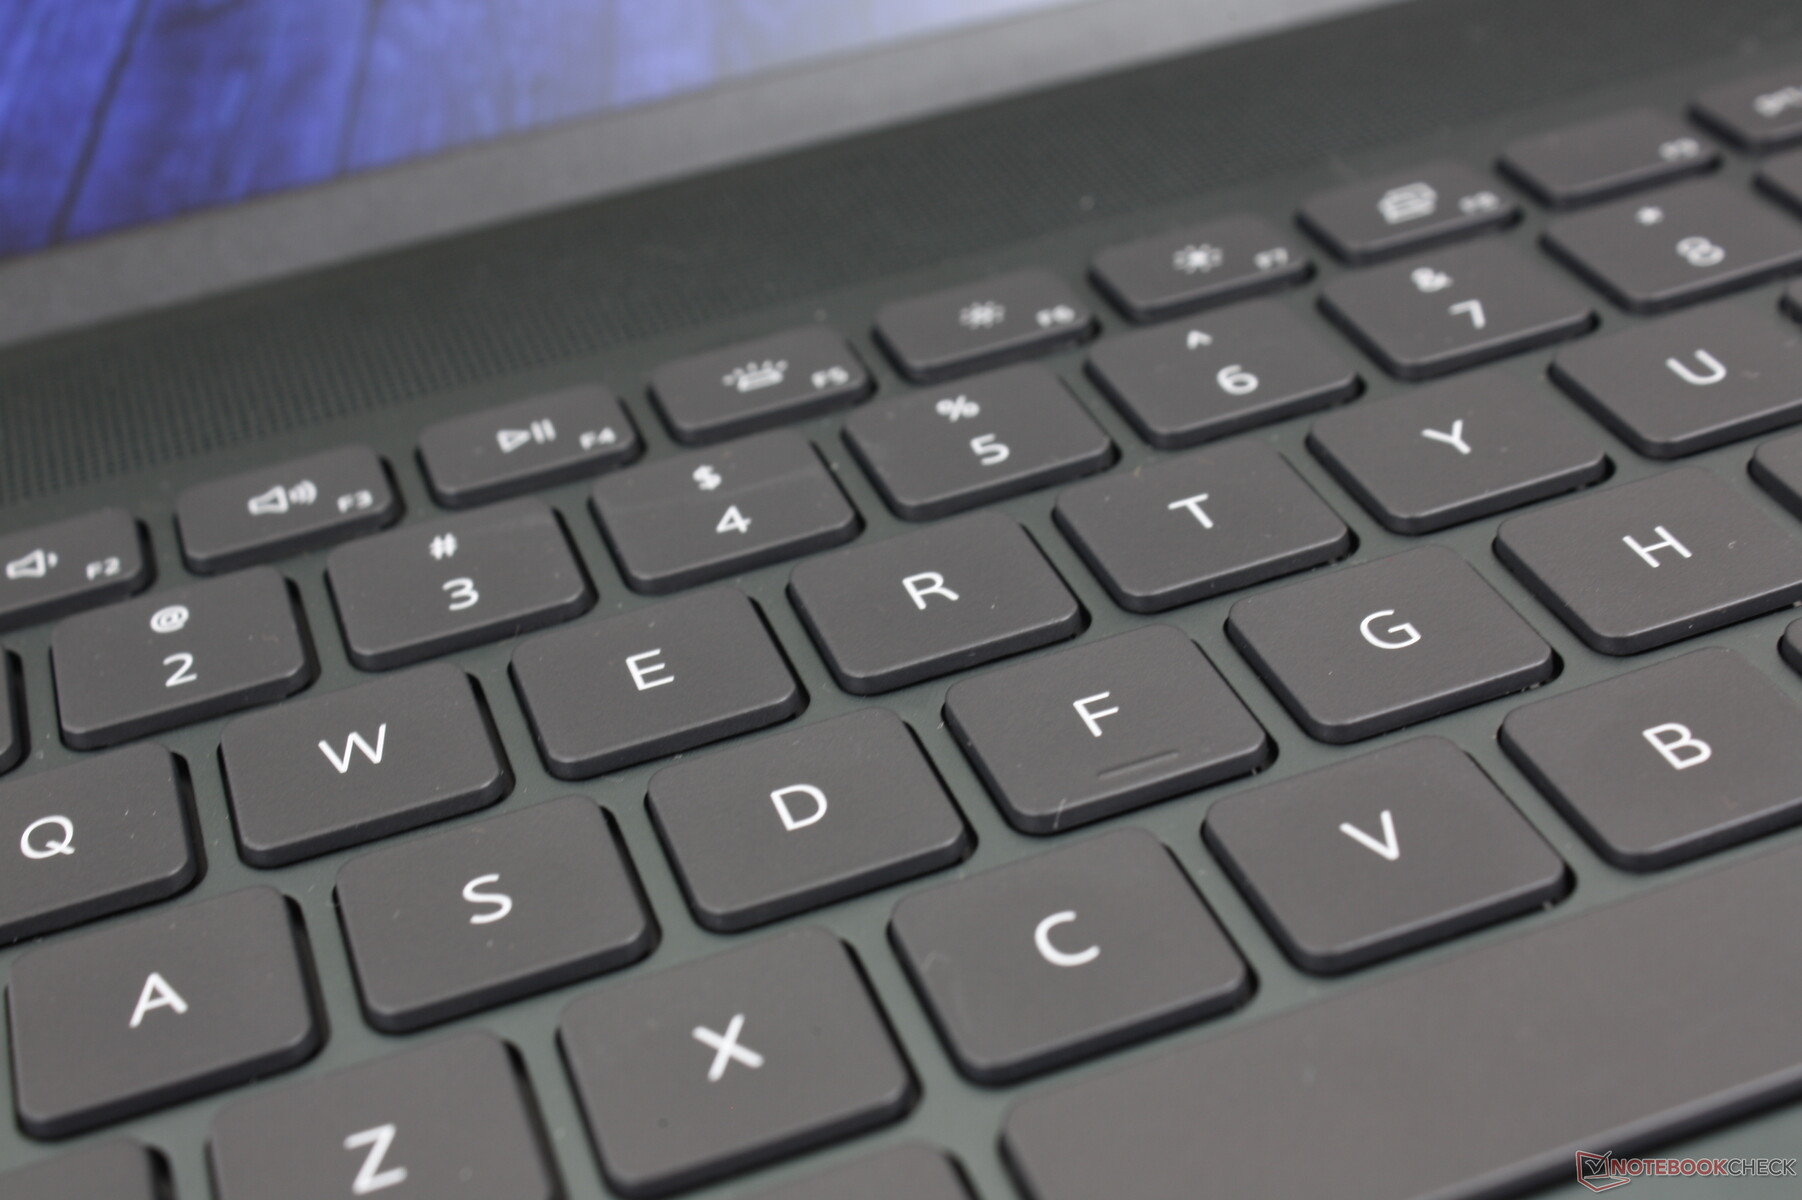
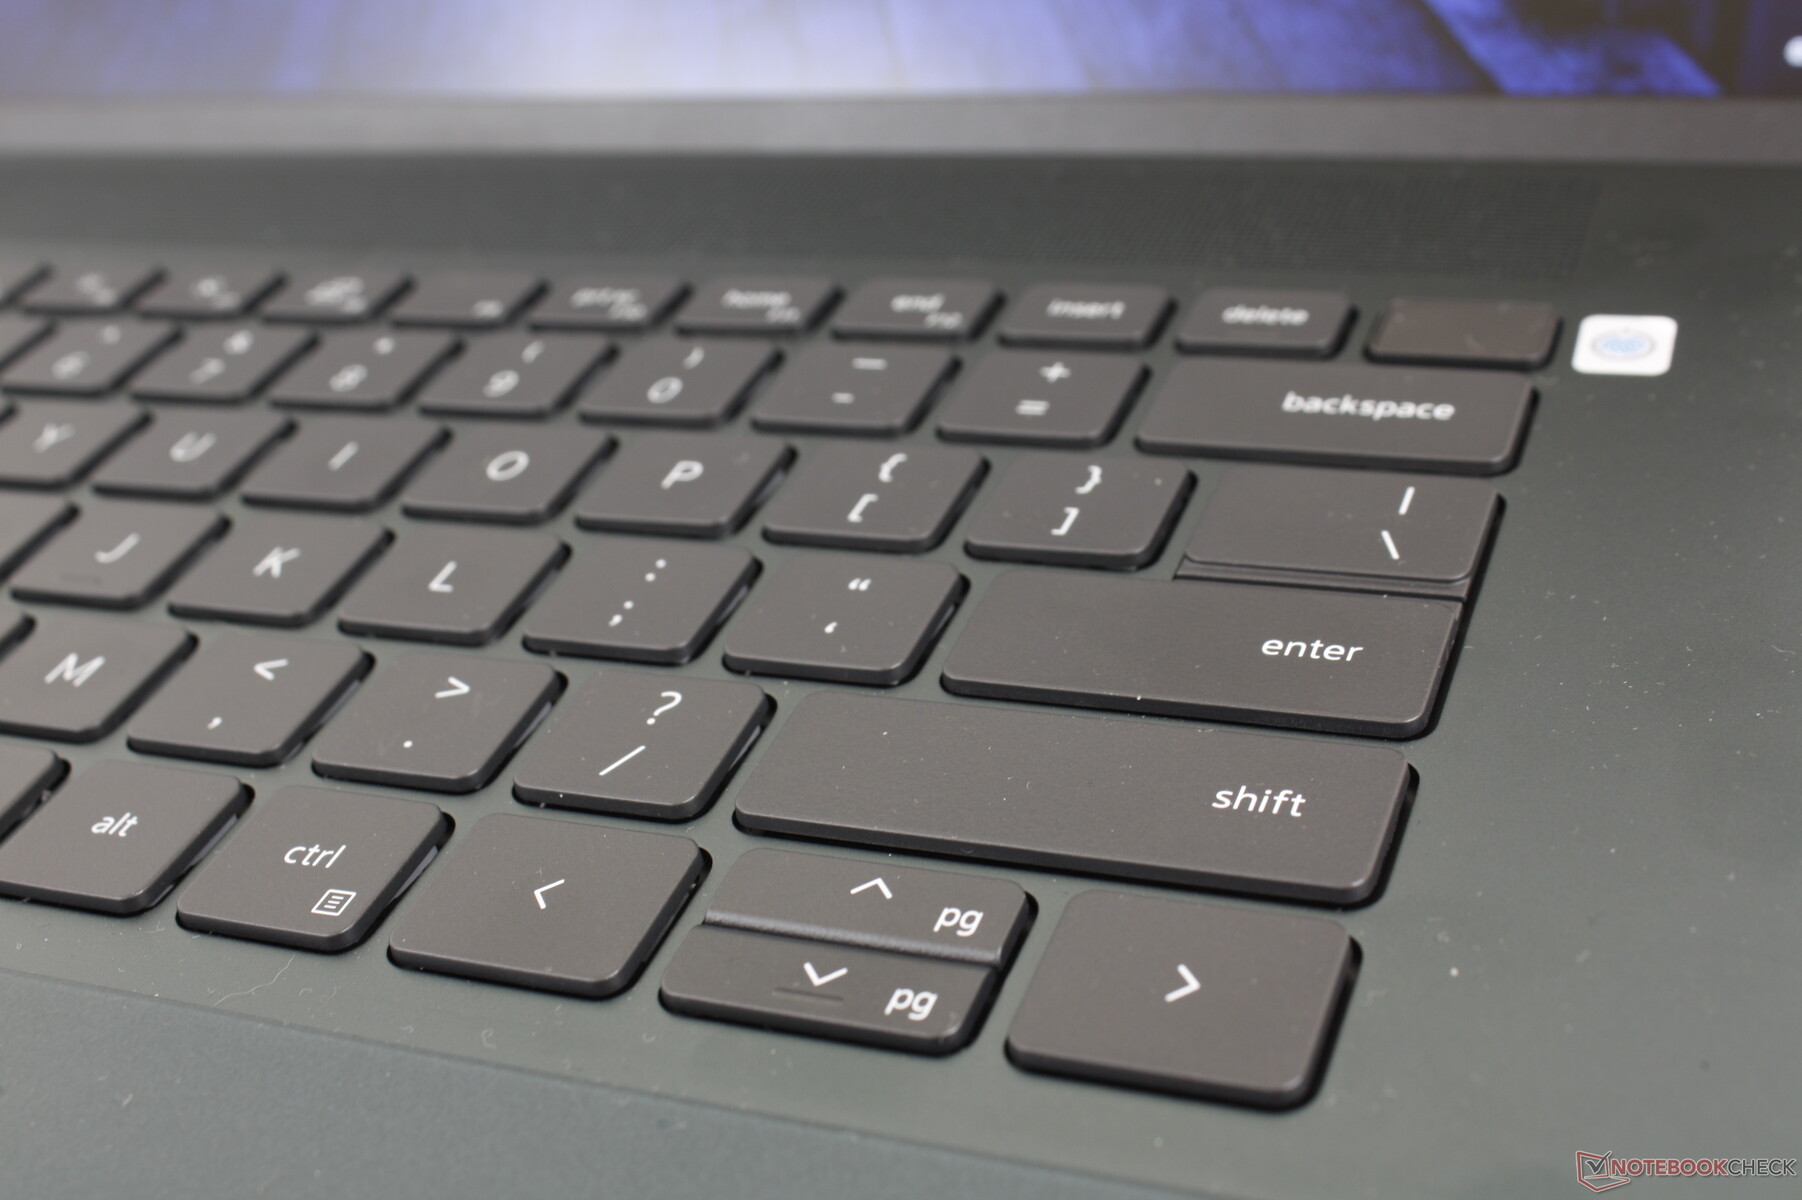
Tangentbord
Dell har förnyat tangentbordet i år så att numblocket inte längre finns med. I övrigt är skrivupplevelsen likadan som påInspiron 16 Plus 7620 2-i-1 eftersom tangenterna fortfarande är något mjukare än tangenterna på LG Gram 16 eller HP Spectre-serien.
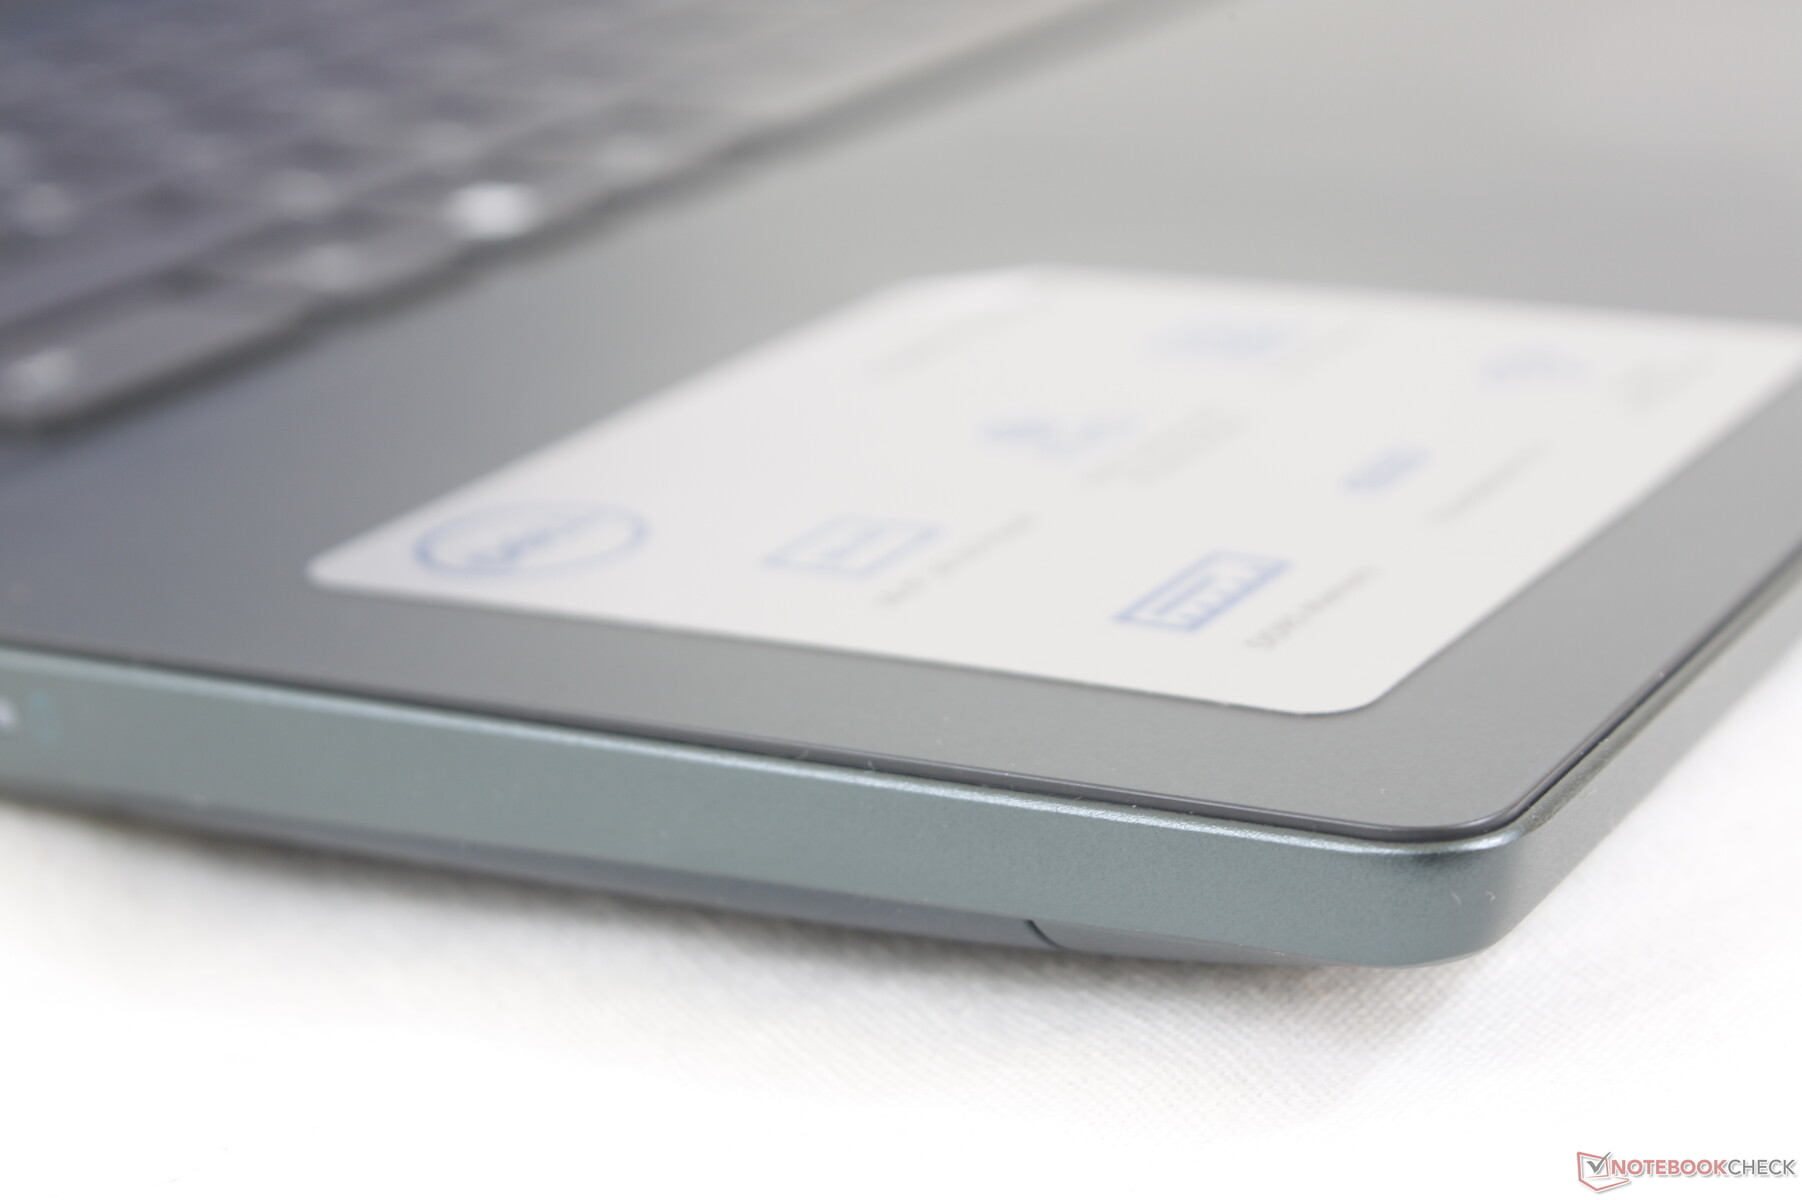
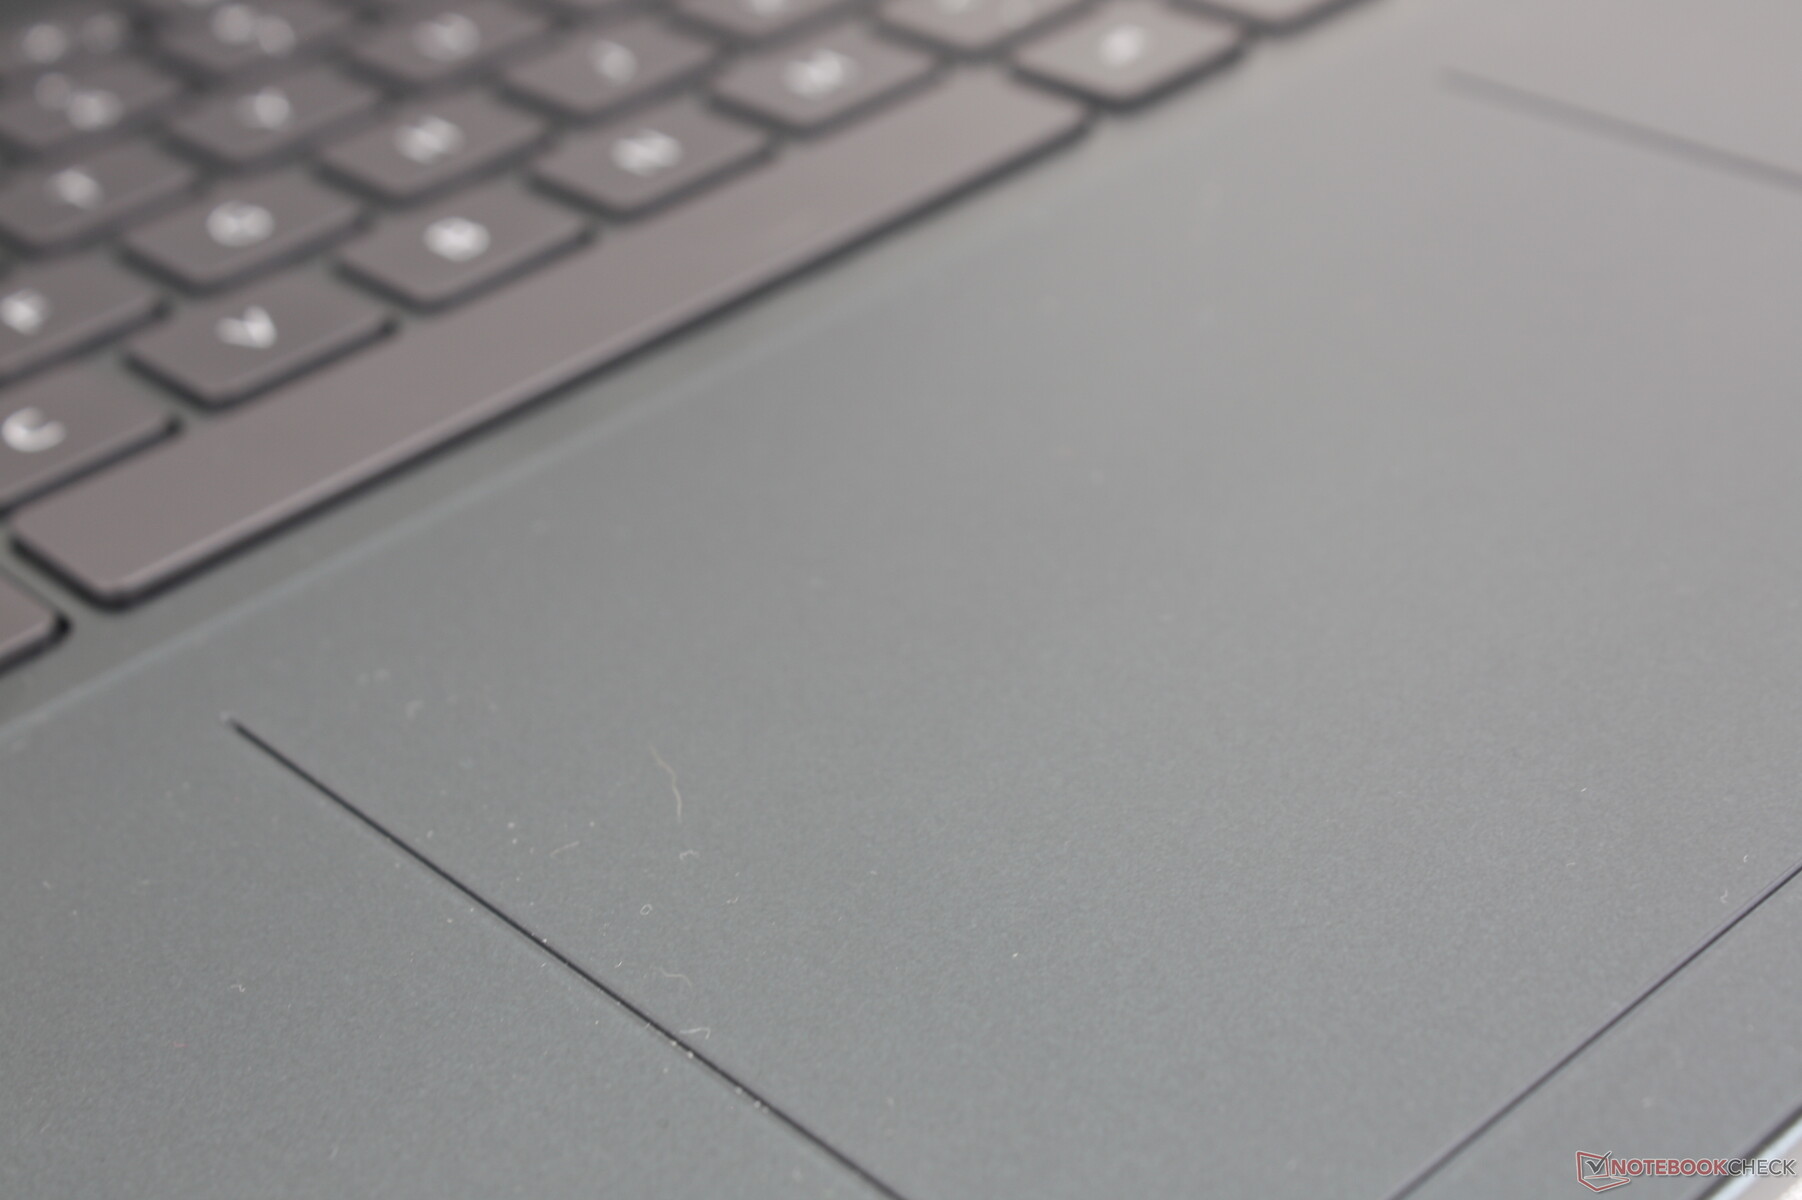
Pekplatta
Klickplattan på vår 2022-modell är mindre än klickplattan på 2021-modellen (11,5 x 8 cm jämfört med 13,5 x 9 cm) för att vara likvärdig med klickplattan på Inspiron 16 7620 2-i-1. Den nya Mylarytan fungerar utmärkt för styrning av markören eftersom den är slät när den glider snabbt men lite klibbig när den glider långsamt för mer exakta klick. Klickandet på klickplattan är dock fortfarande mjukare och svampigare än vad vi skulle vilja ha.
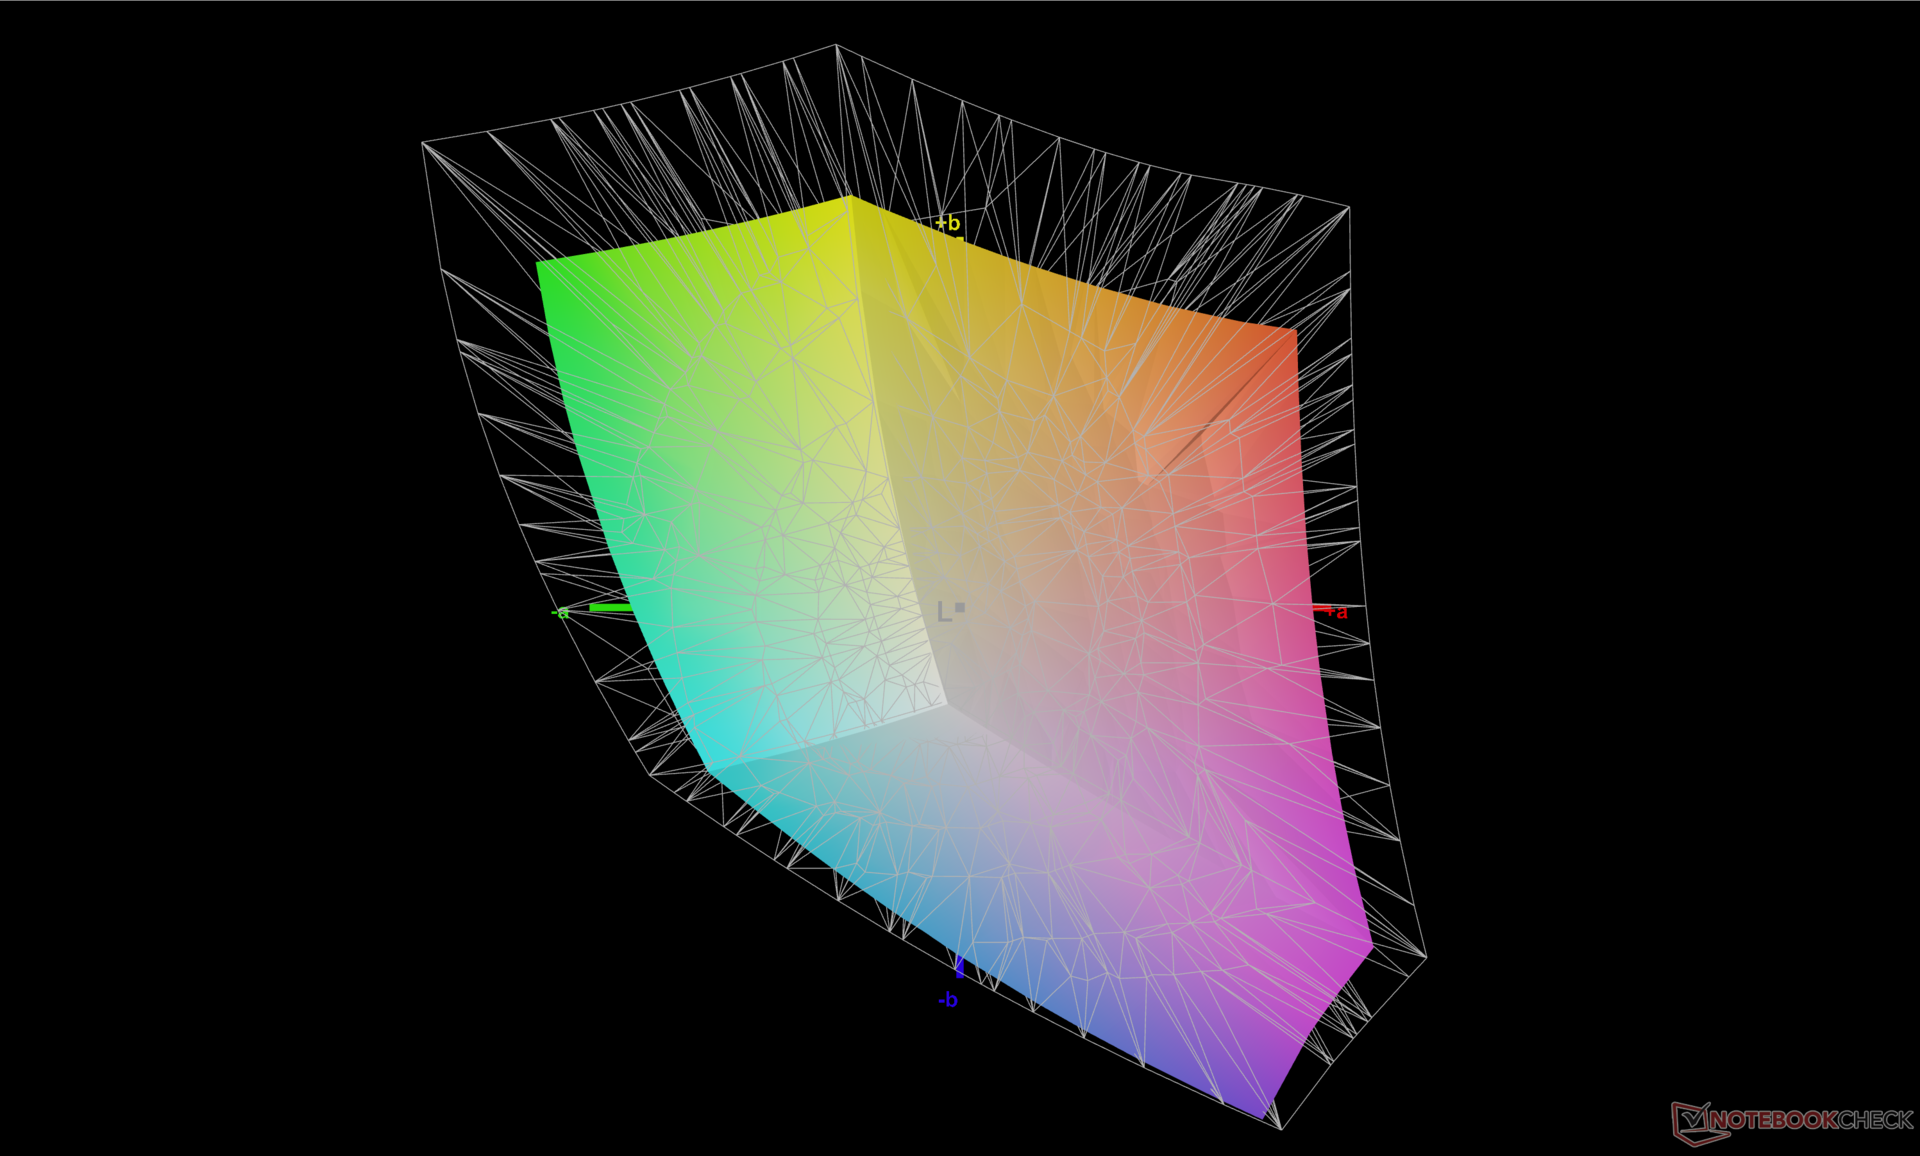
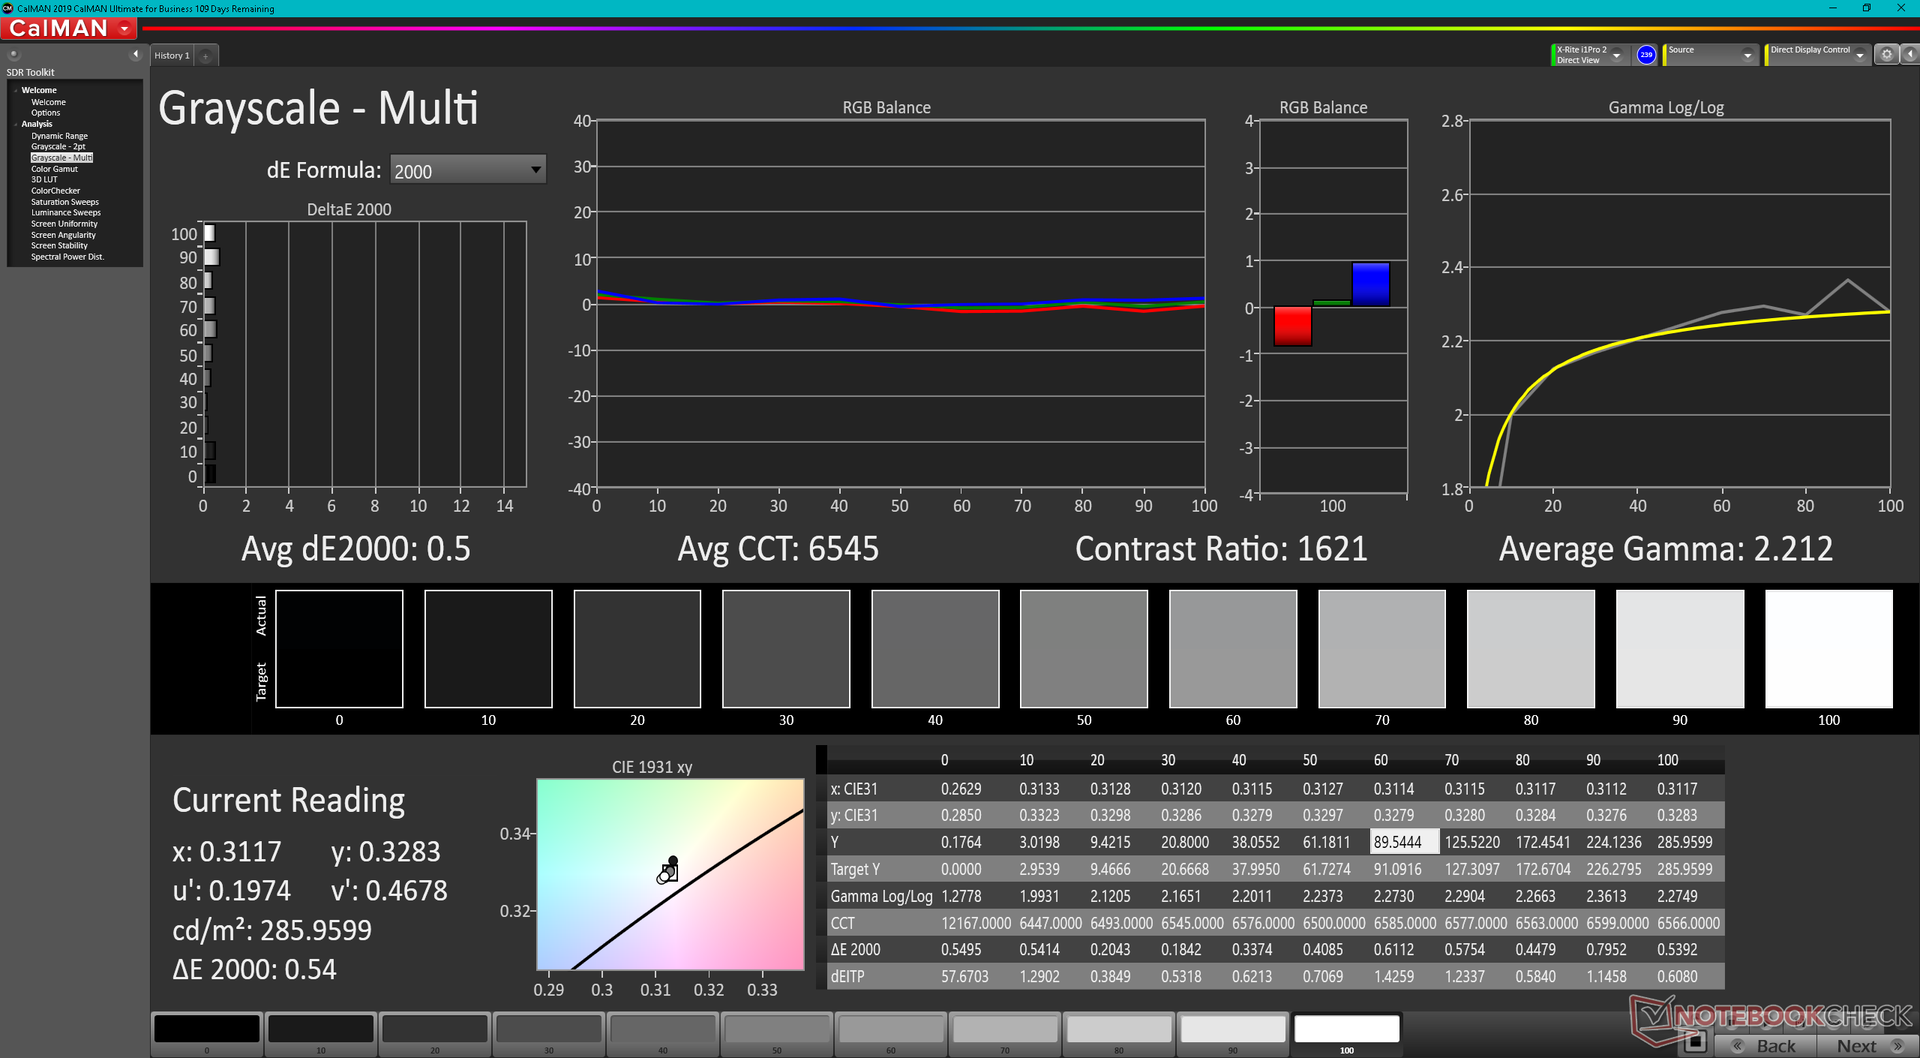
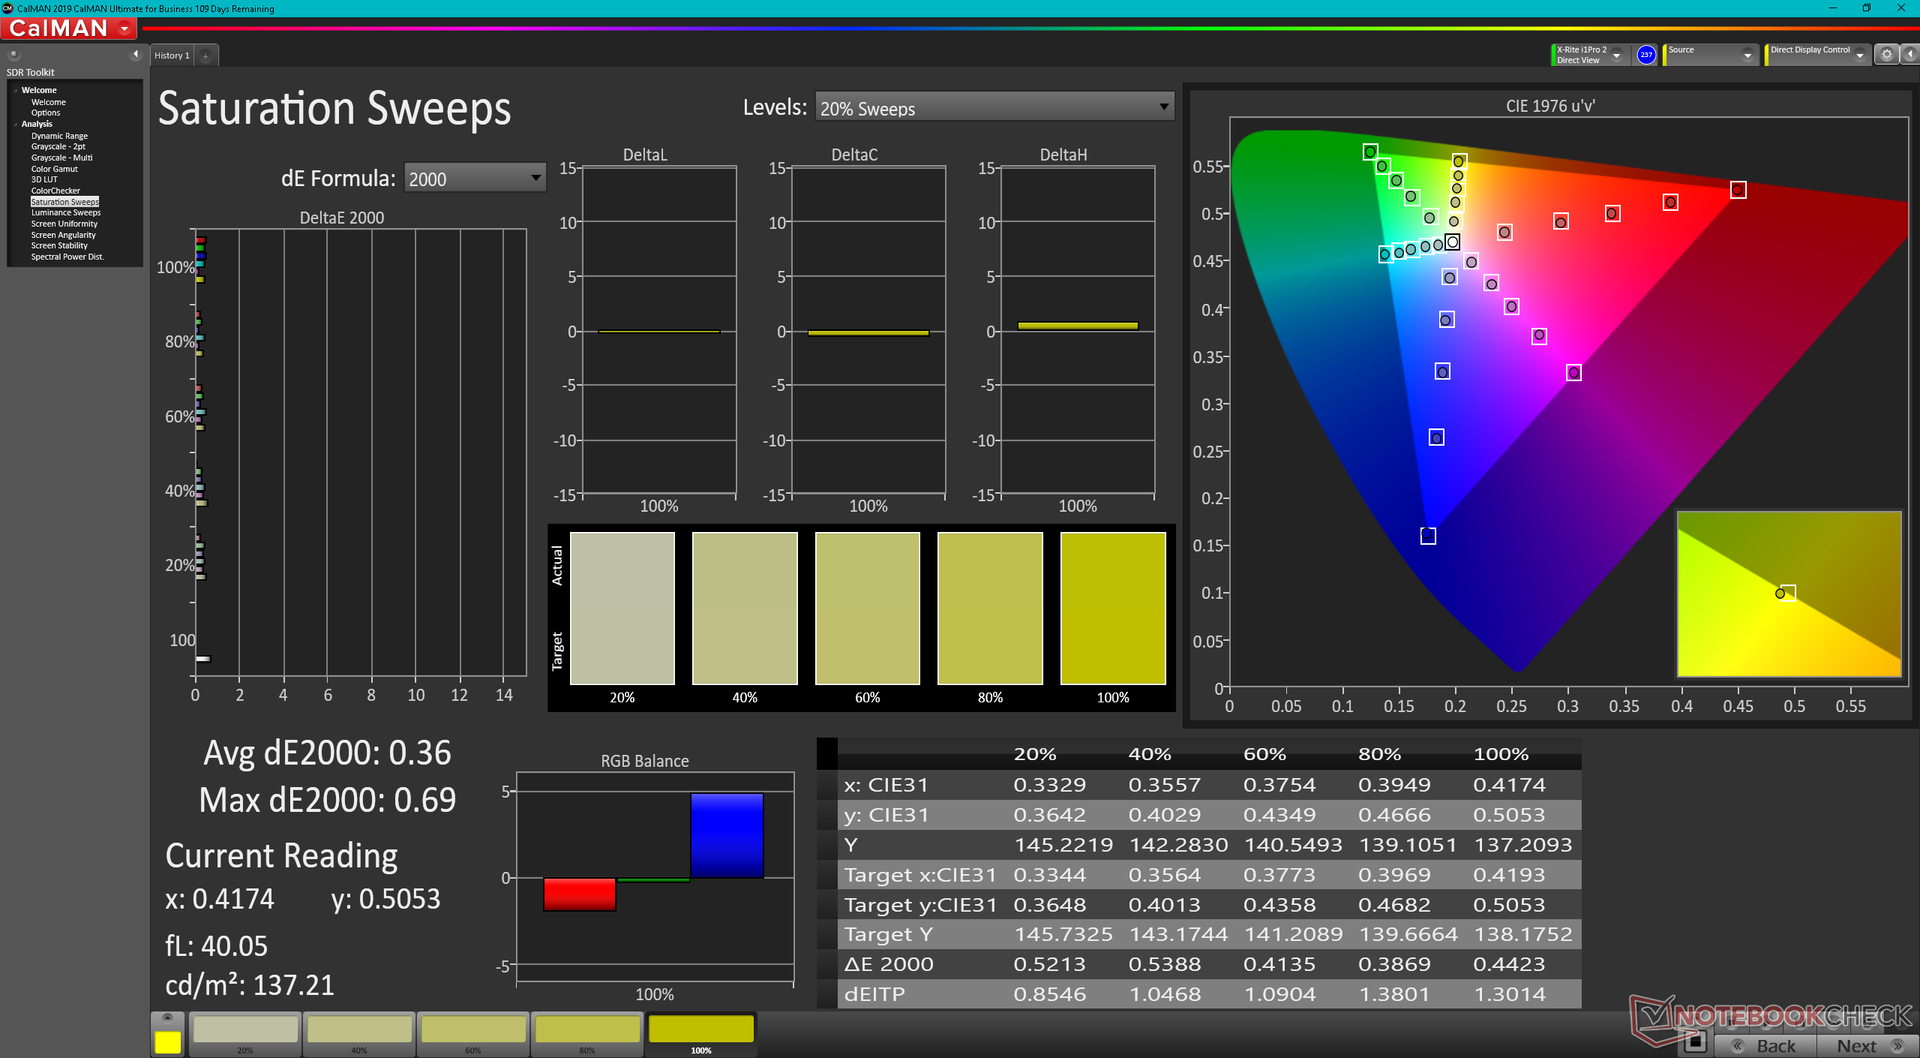
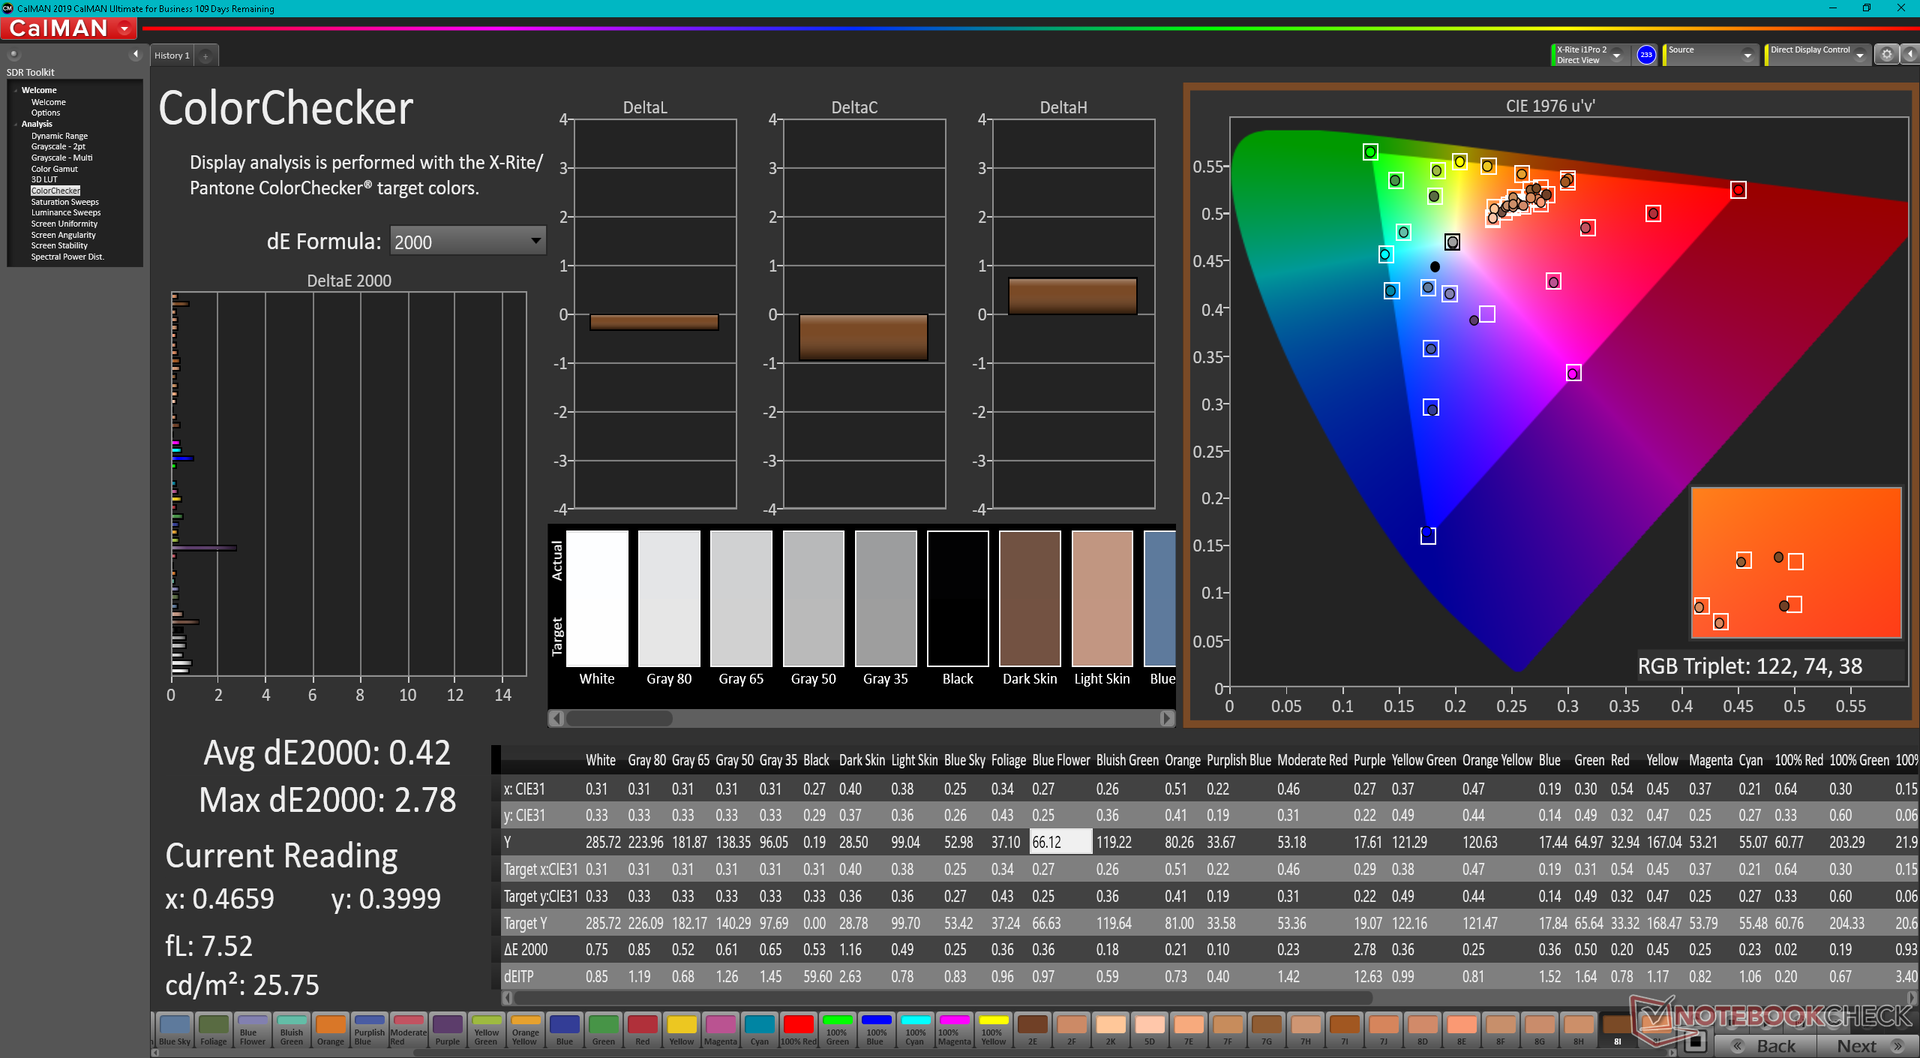
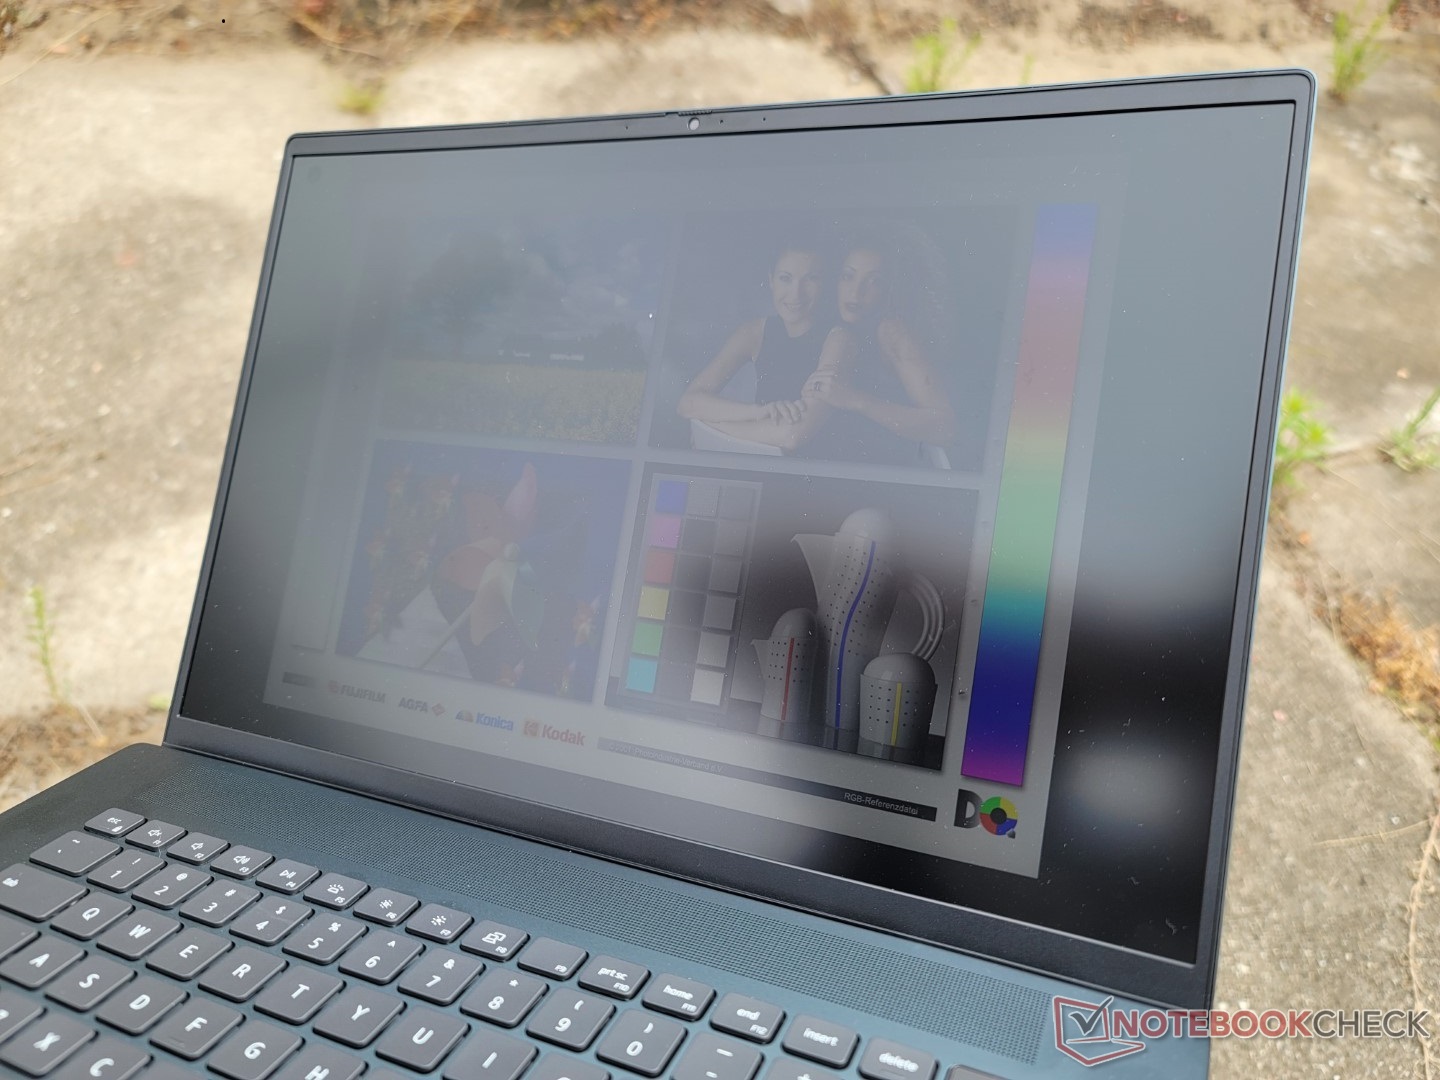
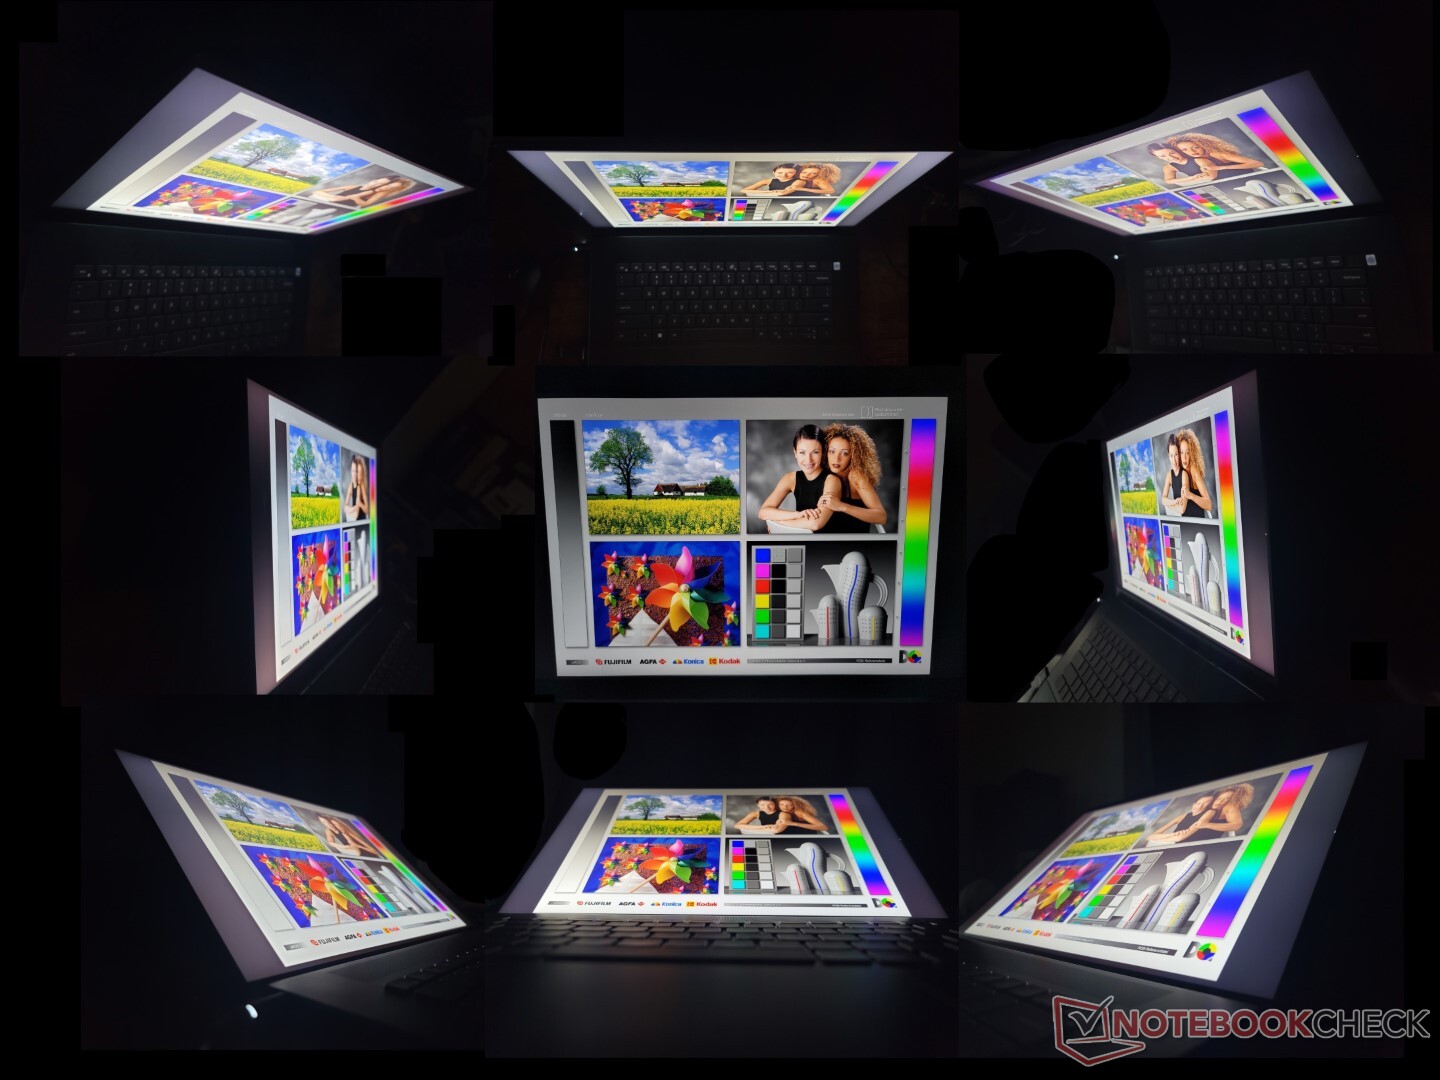
Skärm - Inga större förändringar
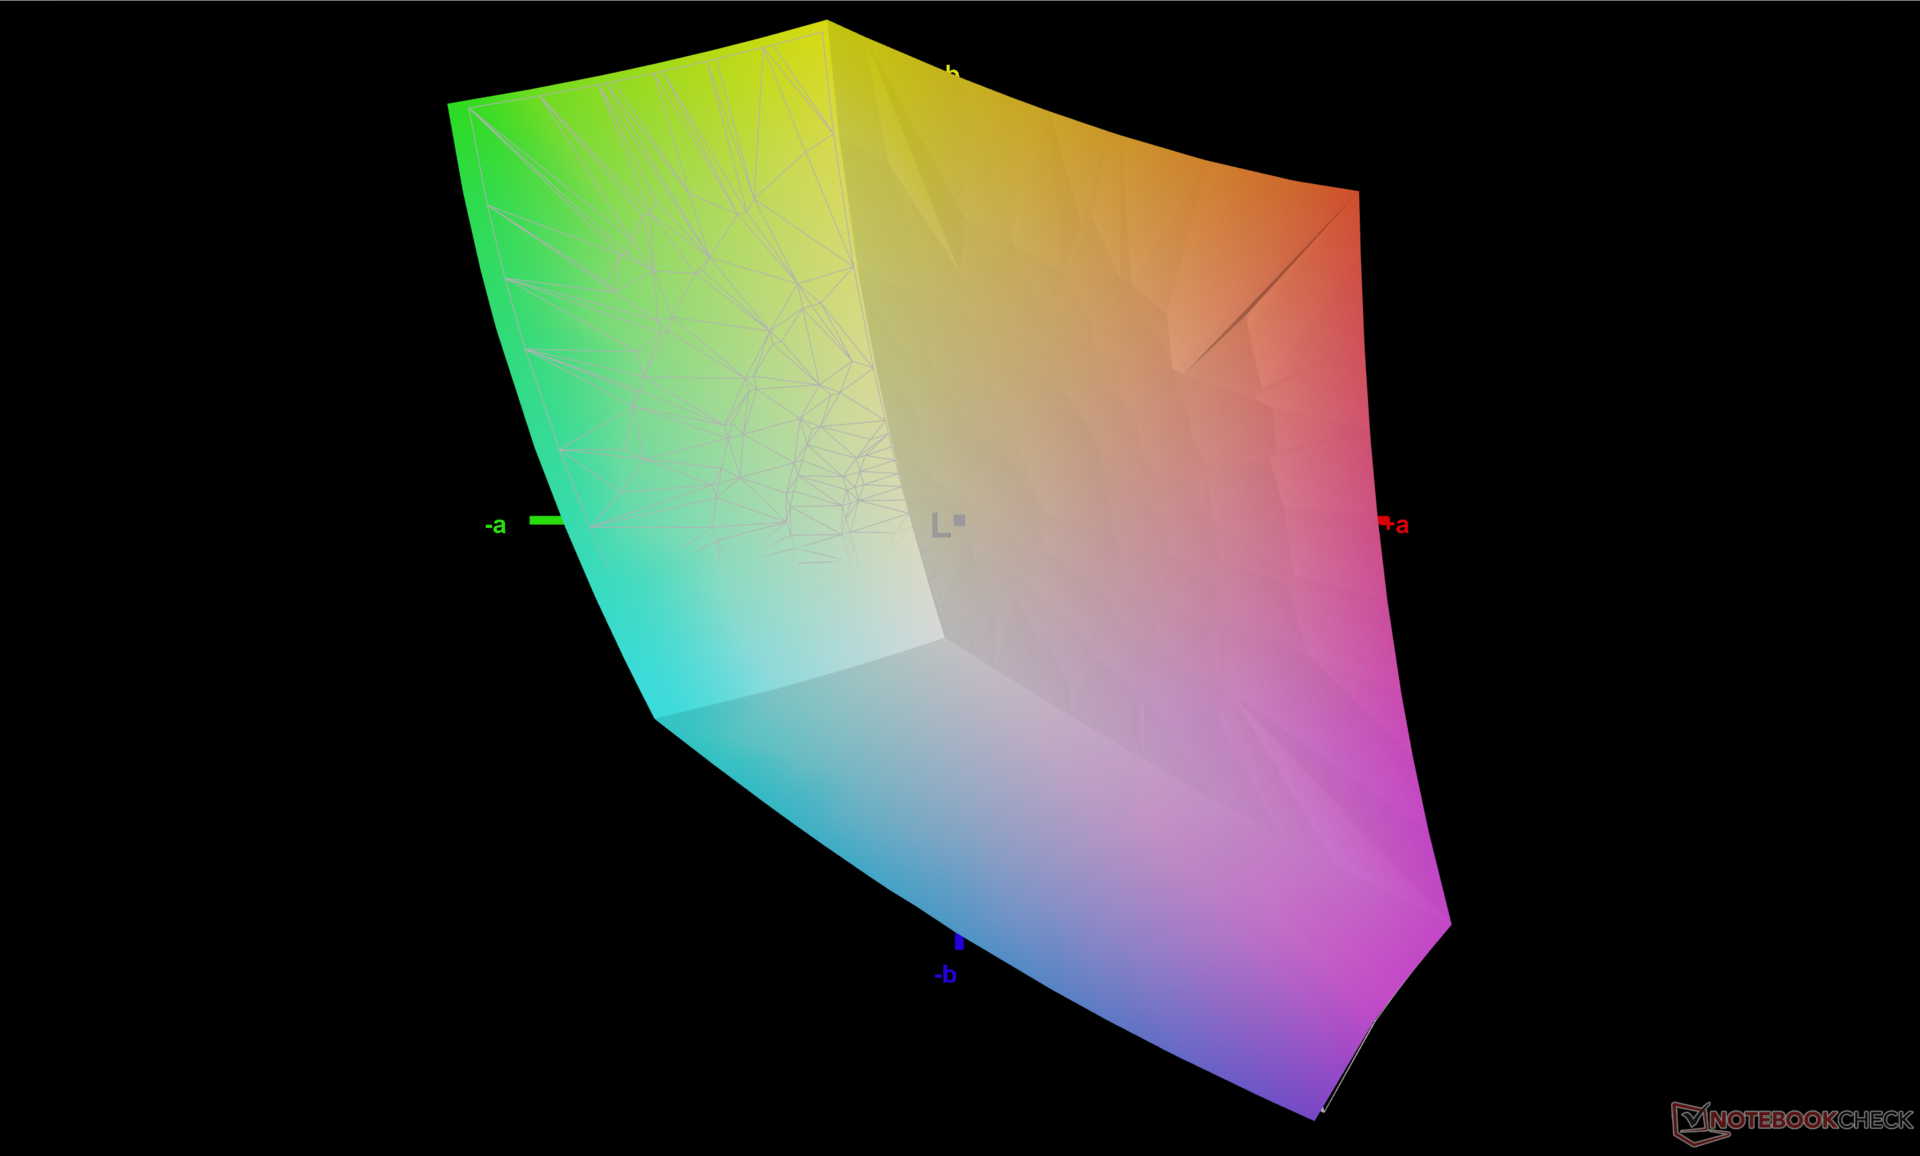
Intressant nog har Dell bytt panelleverantör från AU Optronics för förra årets Inspiron 16 Plus 7610 till BOE för den senaste modellen. Svarstiderna är något snabbare för mindre allvarlig ghosting, men allt annat är i stort sett detsamma, inklusive full sRGB-täckning, ~1000:1 kontrastförhållande och ~290 nit maximal ljusstyrka
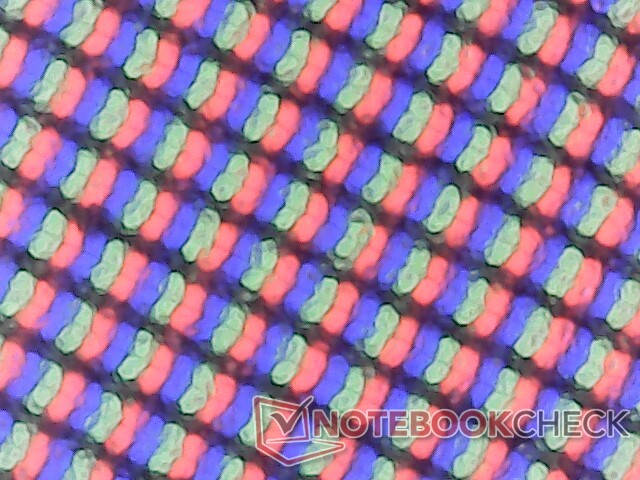
Visningsupplevelsen är bra, men fortfarande några steg lägre än XPS-serien eller OLED-panelen på Asus VivoBook Pro 16X. Bildkvaliteten är märkbart kornigare på grund av det aggressiva matta överlagret medan färgerna inte är alls lika livliga som på OLED. Vi förstår att Inspiron-serien inte är tänkt att vara toppmodell, men det är en besvikelse att Dell inte gjorde några större förändringar av skärmen i år
Det finns tre 300-nit-panelalternativ att välja mellan: 3072 x 1920 matt non-touch, 1920 x 1200 matt non-touch och 1920 x 1200 glossy touch. Våra mätningar nedan återspeglar endast panelen med högre upplösning.
| |||||||||||||||||||||||||
Distribution av ljusstyrkan: 92 %
Mitt på batteriet: 288.9 cd/m²
Kontrast: 1111:1 (Svärta: 0.26 cd/m²)
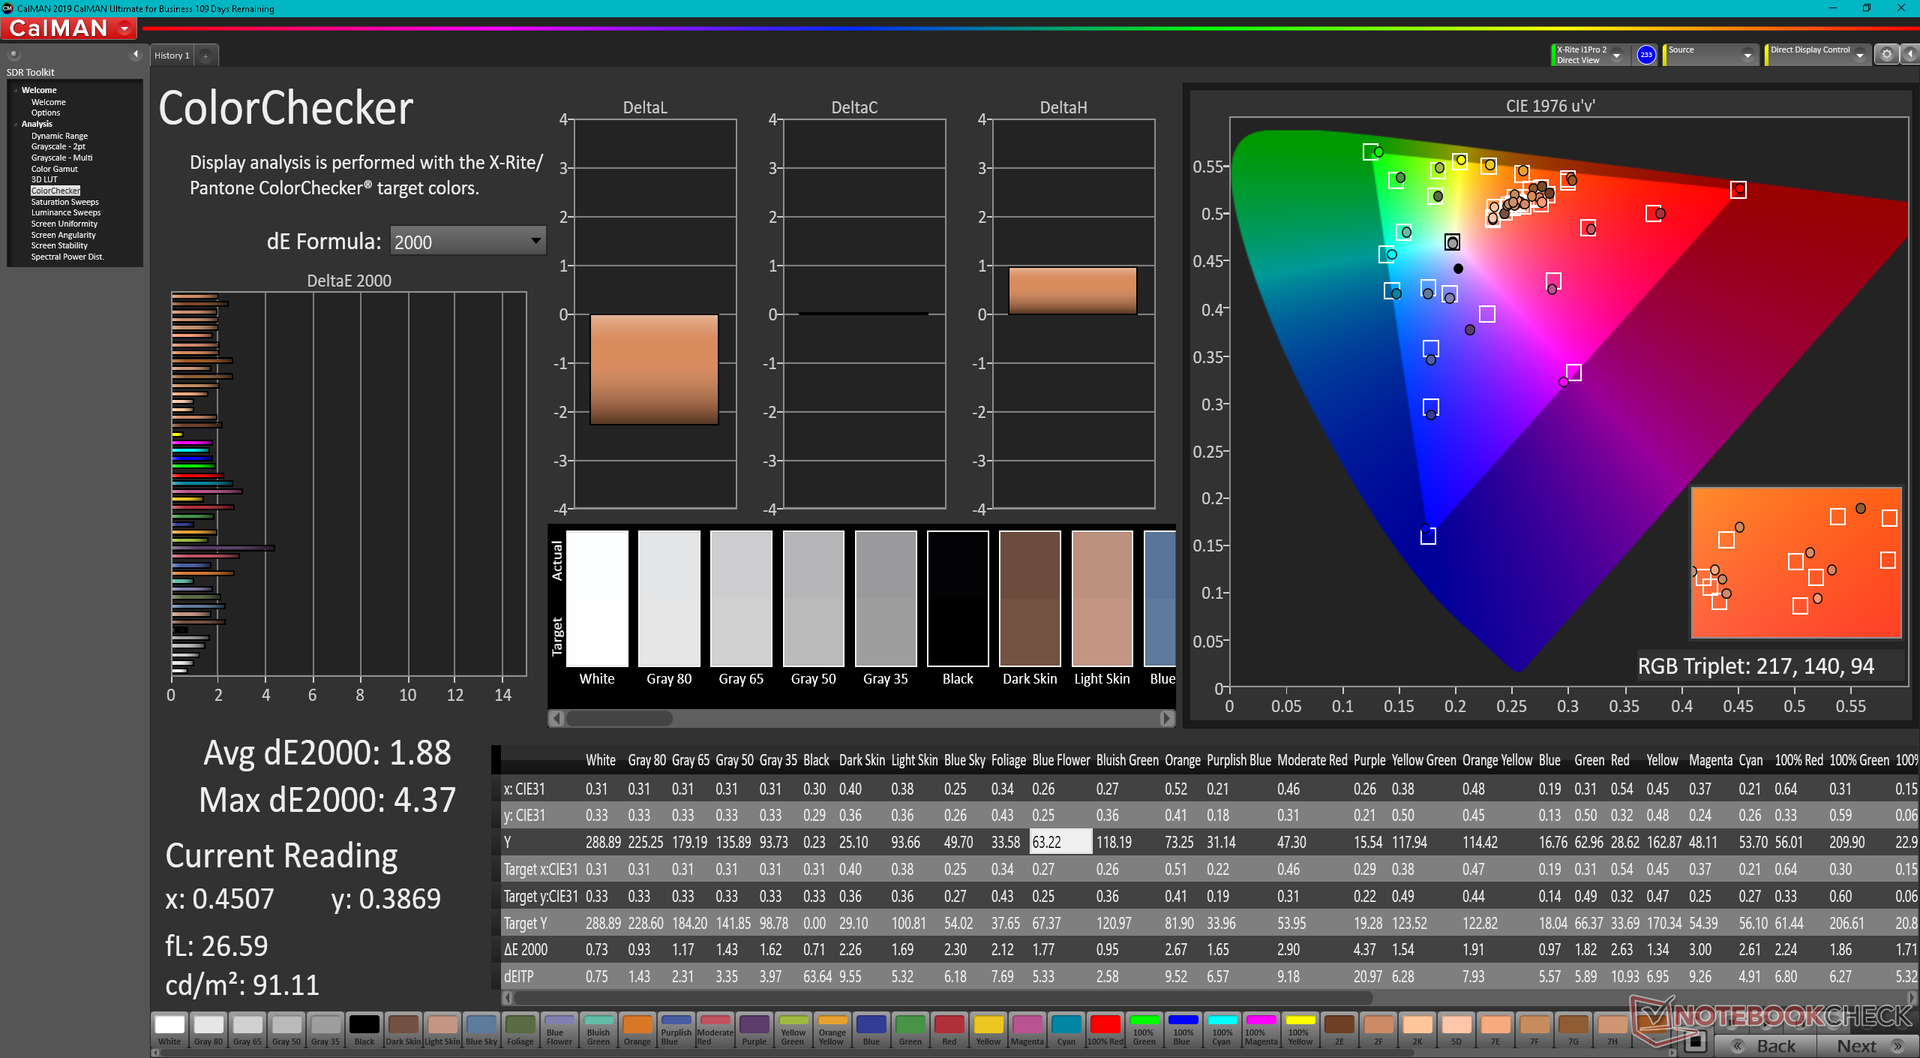
ΔE ColorChecker Calman: 1.88 | ∀{0.5-29.43 Ø4.71}
calibrated: 0.42
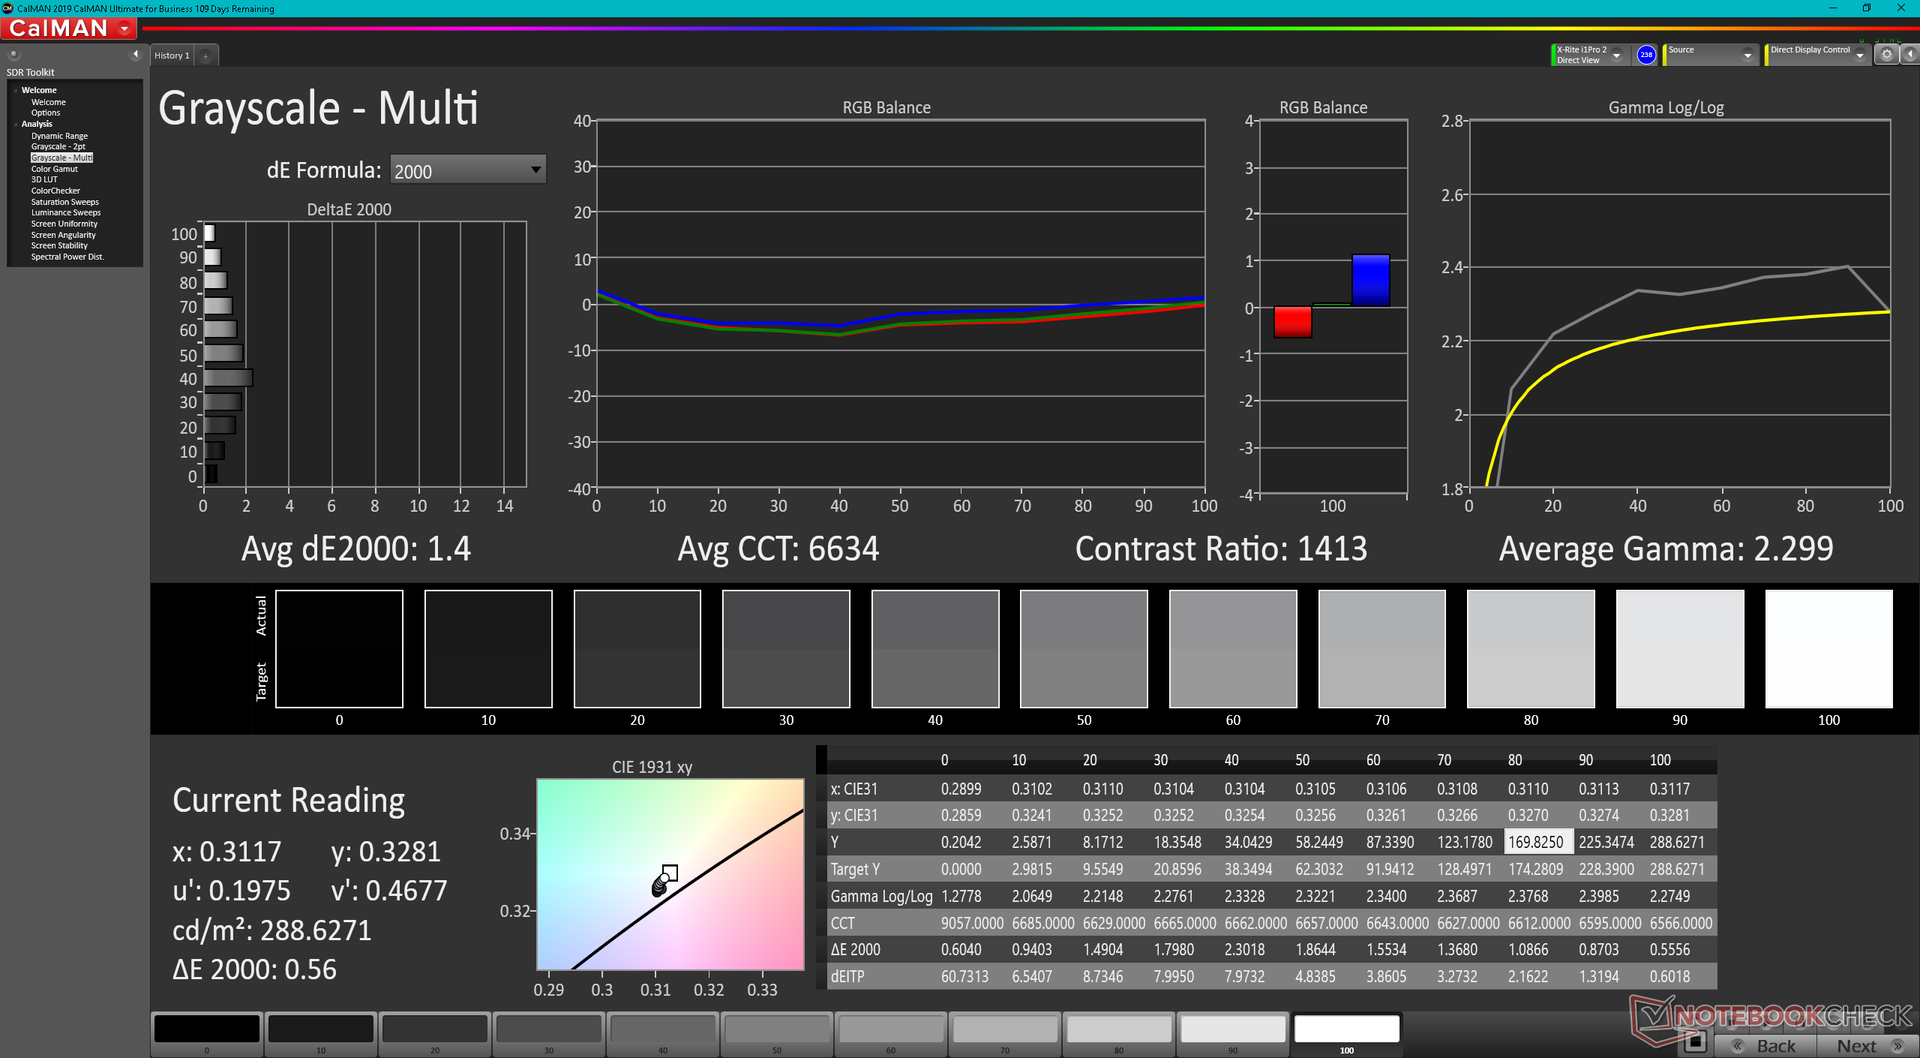
ΔE Greyscale Calman: 1.4 | ∀{0.09-98 Ø4.96}
73.2% AdobeRGB 1998 (Argyll 3D)
99.5% sRGB (Argyll 3D)
70.8% Display P3 (Argyll 3D)
Gamma: 2.3
CCT: 6634 K
| Dell Inspiron 16 Plus 7620 BOE NE16N41, IPS, 3072x1920, 16" | Dell Inspiron 16 Plus 7610 AU Optronics B160QAN, IPS, 3072x1920, 16" | Lenovo Yoga 7 16IAP7 Lenovo LEN160WQXGA, IPS, 2560x1600, 16" | Huawei MateBook D 16 2022 BOE NV160WUM-NH0, IPS, 1920x1200, 16" | Acer Swift X SFX16-51G-5388 Chi Mei N161HCA-EA3, , 1920x1080, 16.1" | Asus Vivobook Pro 16X-M7600QE Samsung ATNA60YV02-0, OLED, 3840x2400, 16.1" | |
|---|---|---|---|---|---|---|
| Display | 3% | -5% | -5% | -7% | 25% | |
| Display P3 Coverage (%) | 70.8 | 74.1 5% | 67 -5% | 66.2 -6% | 65.1 -8% | 99.8 41% |
| sRGB Coverage (%) | 99.5 | 99.4 0% | 95.7 -4% | 96.4 -3% | 95.65 -4% | 100 1% |
| AdobeRGB 1998 Coverage (%) | 73.2 | 75.8 4% | 69.3 -5% | 68.3 -7% | 66.75 -9% | 96.9 32% |
| Response Times | -30% | 8% | 27% | 25% | 94% | |
| Response Time Grey 50% / Grey 80% * (ms) | 38 ? | 49.2 ? -29% | 36 ? 5% | 30.5 ? 20% | 30 ? 21% | 2 ? 95% |
| Response Time Black / White * (ms) | 28 ? | 36.8 ? -31% | 24.8 ? 11% | 18.7 ? 33% | 20 ? 29% | 2 ? 93% |
| PWM Frequency (Hz) | 60 ? | |||||
| Screen | -47% | -13% | -56% | -6% | -35% | |
| Brightness middle (cd/m²) | 288.9 | 296.8 3% | 393.7 36% | 319 10% | 276 -4% | 392 36% |
| Brightness (cd/m²) | 276 | 292 6% | 367 33% | 317 15% | 264 -4% | 396 43% |
| Brightness Distribution (%) | 92 | 87 -5% | 84 -9% | 90 -2% | 85 -8% | 98 7% |
| Black Level * (cd/m²) | 0.26 | 0.21 19% | 0.38 -46% | 0.23 12% | 0.16 38% | |
| Contrast (:1) | 1111 | 1413 27% | 1036 -7% | 1387 25% | 1725 55% | |
| Colorchecker dE 2000 * | 1.88 | 2.56 -36% | 1.97 -5% | 3.4 -81% | 1.8 4% | 1.74 7% |
| Colorchecker dE 2000 max. * | 4.37 | 4.76 -9% | 5.46 -25% | 8.1 -85% | 3.77 14% | 3.18 27% |
| Colorchecker dE 2000 calibrated * | 0.42 | 1.86 -343% | 0.62 -48% | 0.8 -90% | 0.63 -50% | 1.85 -340% |
| Greyscale dE 2000 * | 1.4 | 2.6 -86% | 2.1 -50% | 5.7 -307% | 2.76 -97% | 1.77 -26% |
| Gamma | 2.3 96% | 2.07 106% | 2.1 105% | 2.1 105% | 2.37 93% | 2.22 99% |
| CCT | 6634 98% | 6628 98% | 6461 101% | 7433 87% | 6564 99% | 6483 100% |
| Totalt genomsnitt (program/inställningar) | -25% /
-34% | -3% /
-9% | -11% /
-33% | 4% /
-2% | 28% /
1% |
* ... mindre är bättre
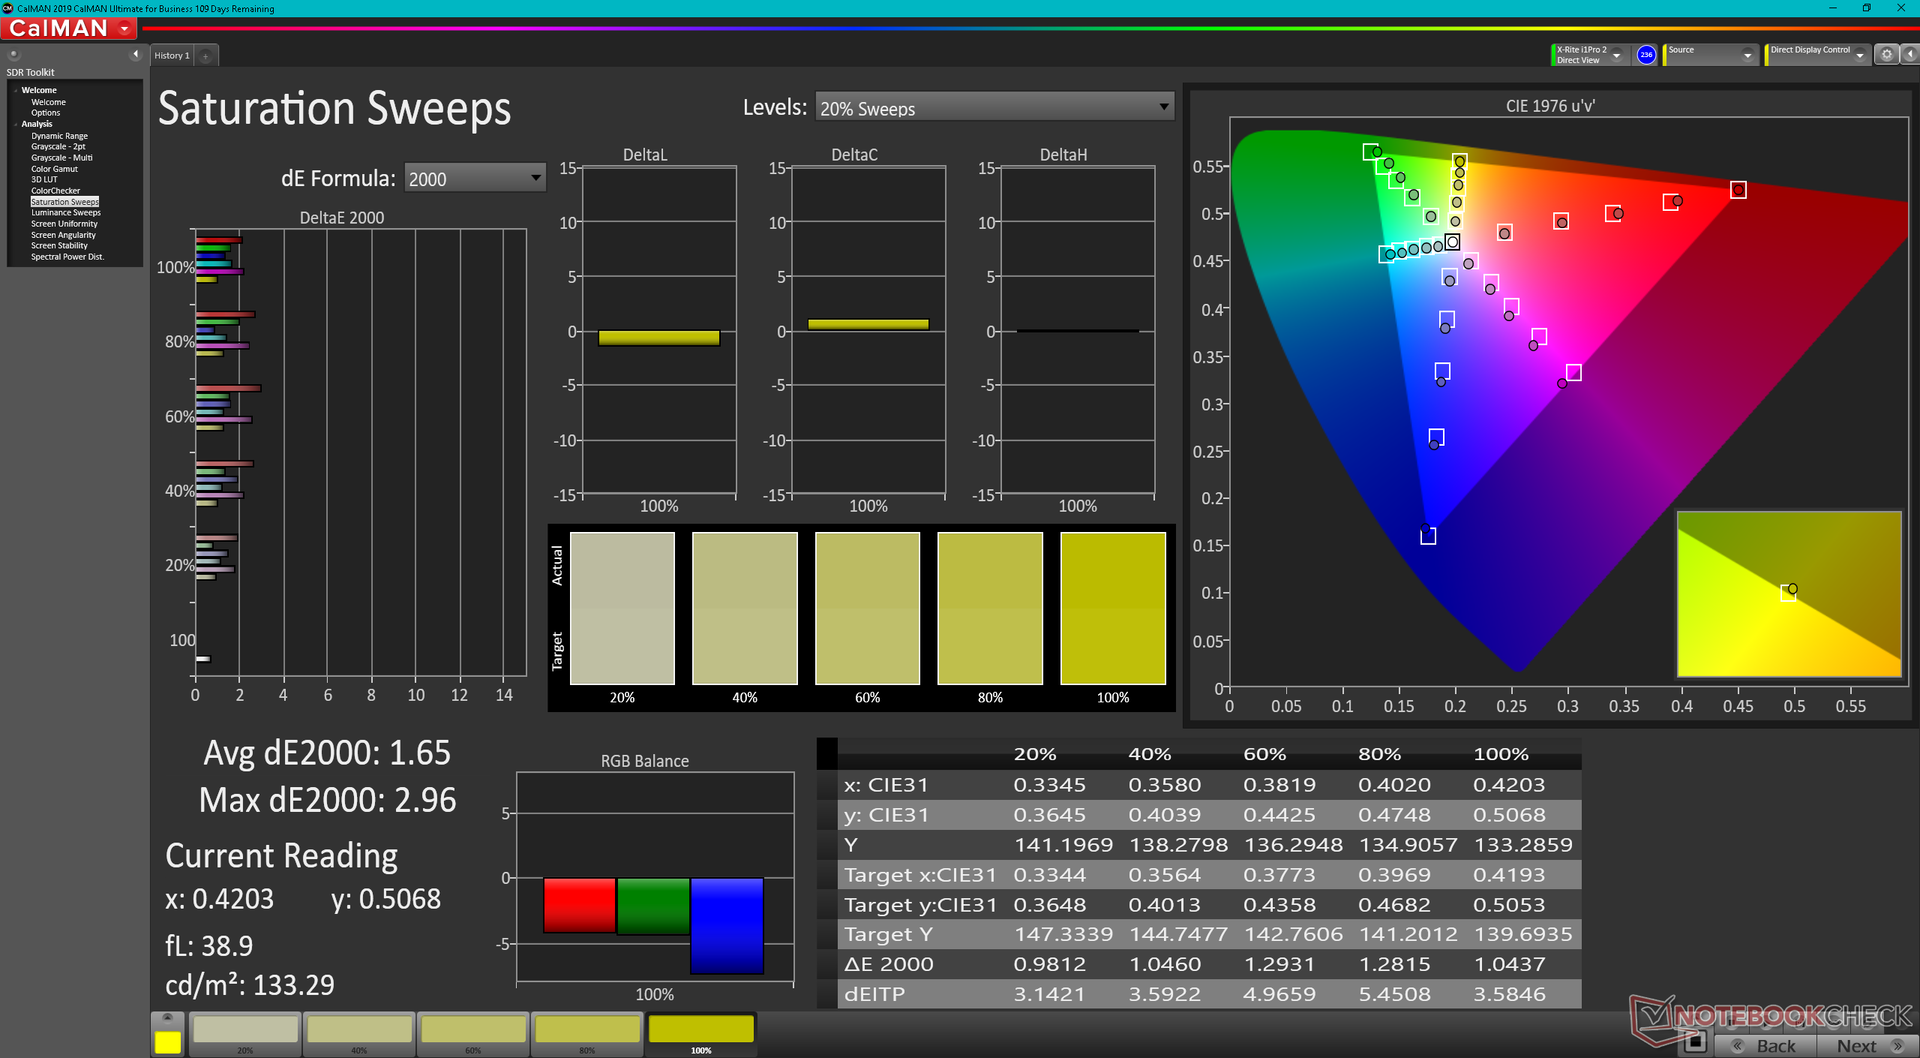
Skärmen är välkalibrerad från början, precis som vi upptäckte på 7610. Genomsnittliga DeltaE-värden för gråskala och färg ligger på 1,4 respektive 1,88, medan våra egna kalibreringsförsök förbättrar genomsnittet ytterligare till bara 0,5 och 0,42. Om du värdesätter sRGB-precisa skärmar kommer du att gilla vad du ser här.
Visa svarstider
| ↔ Svarstid svart till vitt | ||
|---|---|---|
| 28 ms ... stiga ↗ och falla ↘ kombinerat | ↗ 13.2 ms stiga | 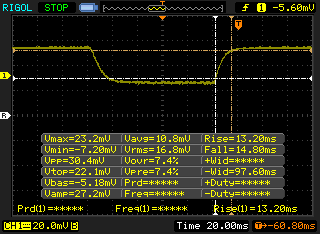 |
| ↘ 14.8 ms hösten | ||
| Skärmen visar relativt långsamma svarsfrekvenser i våra tester och kan vara för långsam för spelare. I jämförelse sträcker sig alla testade enheter från 0.1 (minst) till 240 (maximalt) ms. » 71 % av alla enheter är bättre. Detta innebär att den uppmätta svarstiden är sämre än genomsnittet av alla testade enheter (19.8 ms). | ||
| ↔ Svarstid 50 % grått till 80 % grått | ||
| 38 ms ... stiga ↗ och falla ↘ kombinerat | ↗ 21.2 ms stiga | 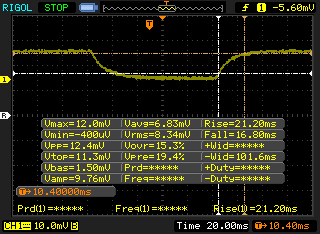 |
| ↘ 16.8 ms hösten | ||
| Skärmen visar långsamma svarsfrekvenser i våra tester och kommer att vara otillfredsställande för spelare. I jämförelse sträcker sig alla testade enheter från 0.165 (minst) till 636 (maximalt) ms. » 55 % av alla enheter är bättre. Detta innebär att den uppmätta svarstiden är sämre än genomsnittet av alla testade enheter (31 ms). | ||
Skärmflimmer / PWM (Puls-Width Modulation)
| Skärmflimmer / PWM upptäcktes inte | 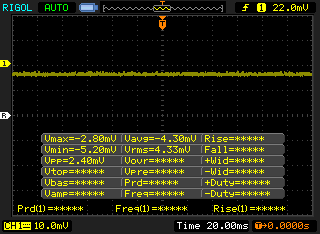 | ||
Som jämförelse: 52 % av alla testade enheter använder inte PWM för att dämpa skärmen. Om PWM upptäcktes mättes ett medelvärde av 7754 (minst: 5 - maximum: 343500) Hz. | |||
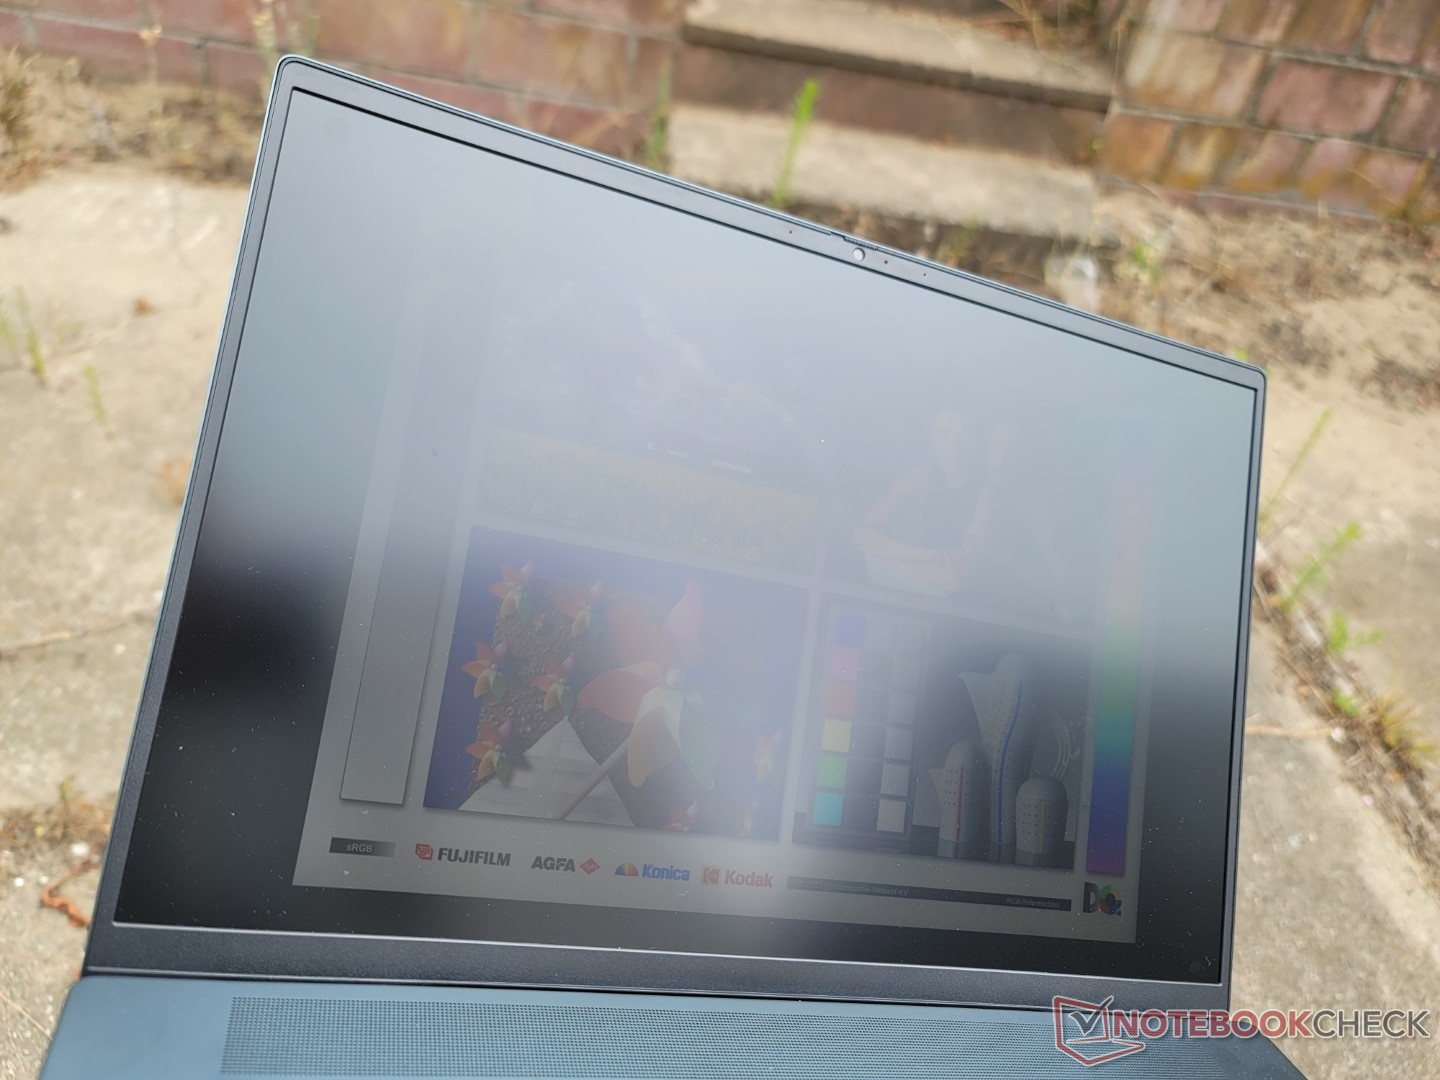
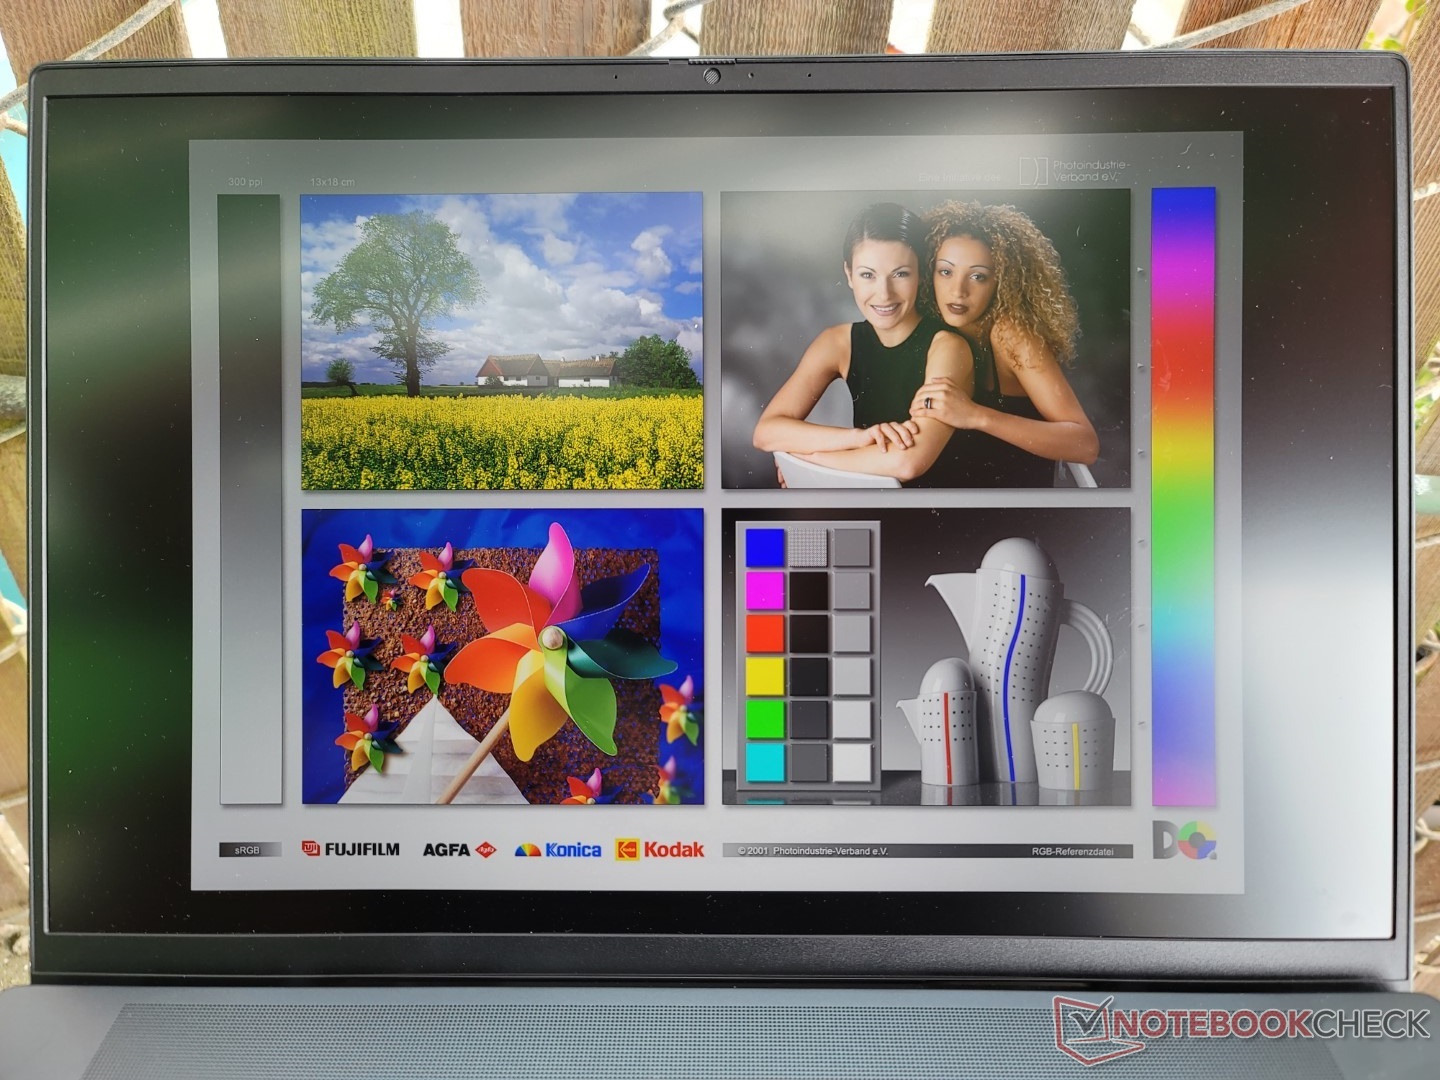
Synligheten utomhus är jämförbar med förra årets modell eftersom den maximala ljusstyrkan inte har ändrats. Lenovo Yoga 7 eller Asus VivoBook Pro 16X har ljusare skärmar, men det är svårare att undvika bländning från deras blanka overlays.
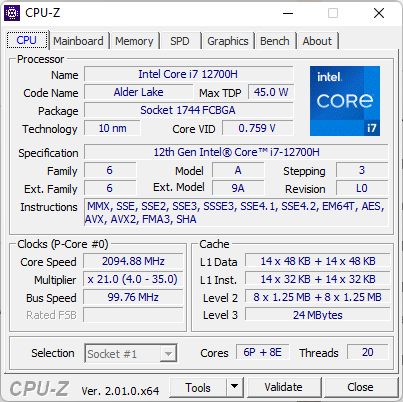
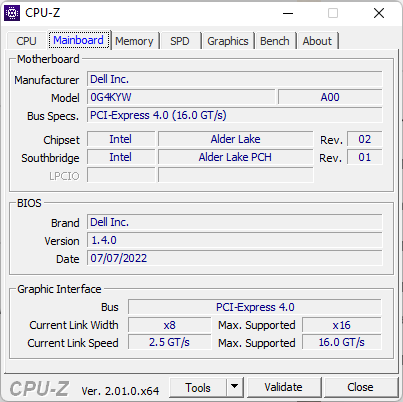
Prestanda - 12th Gen ger högre prestanda och strömförbrukning
Provningsförhållanden
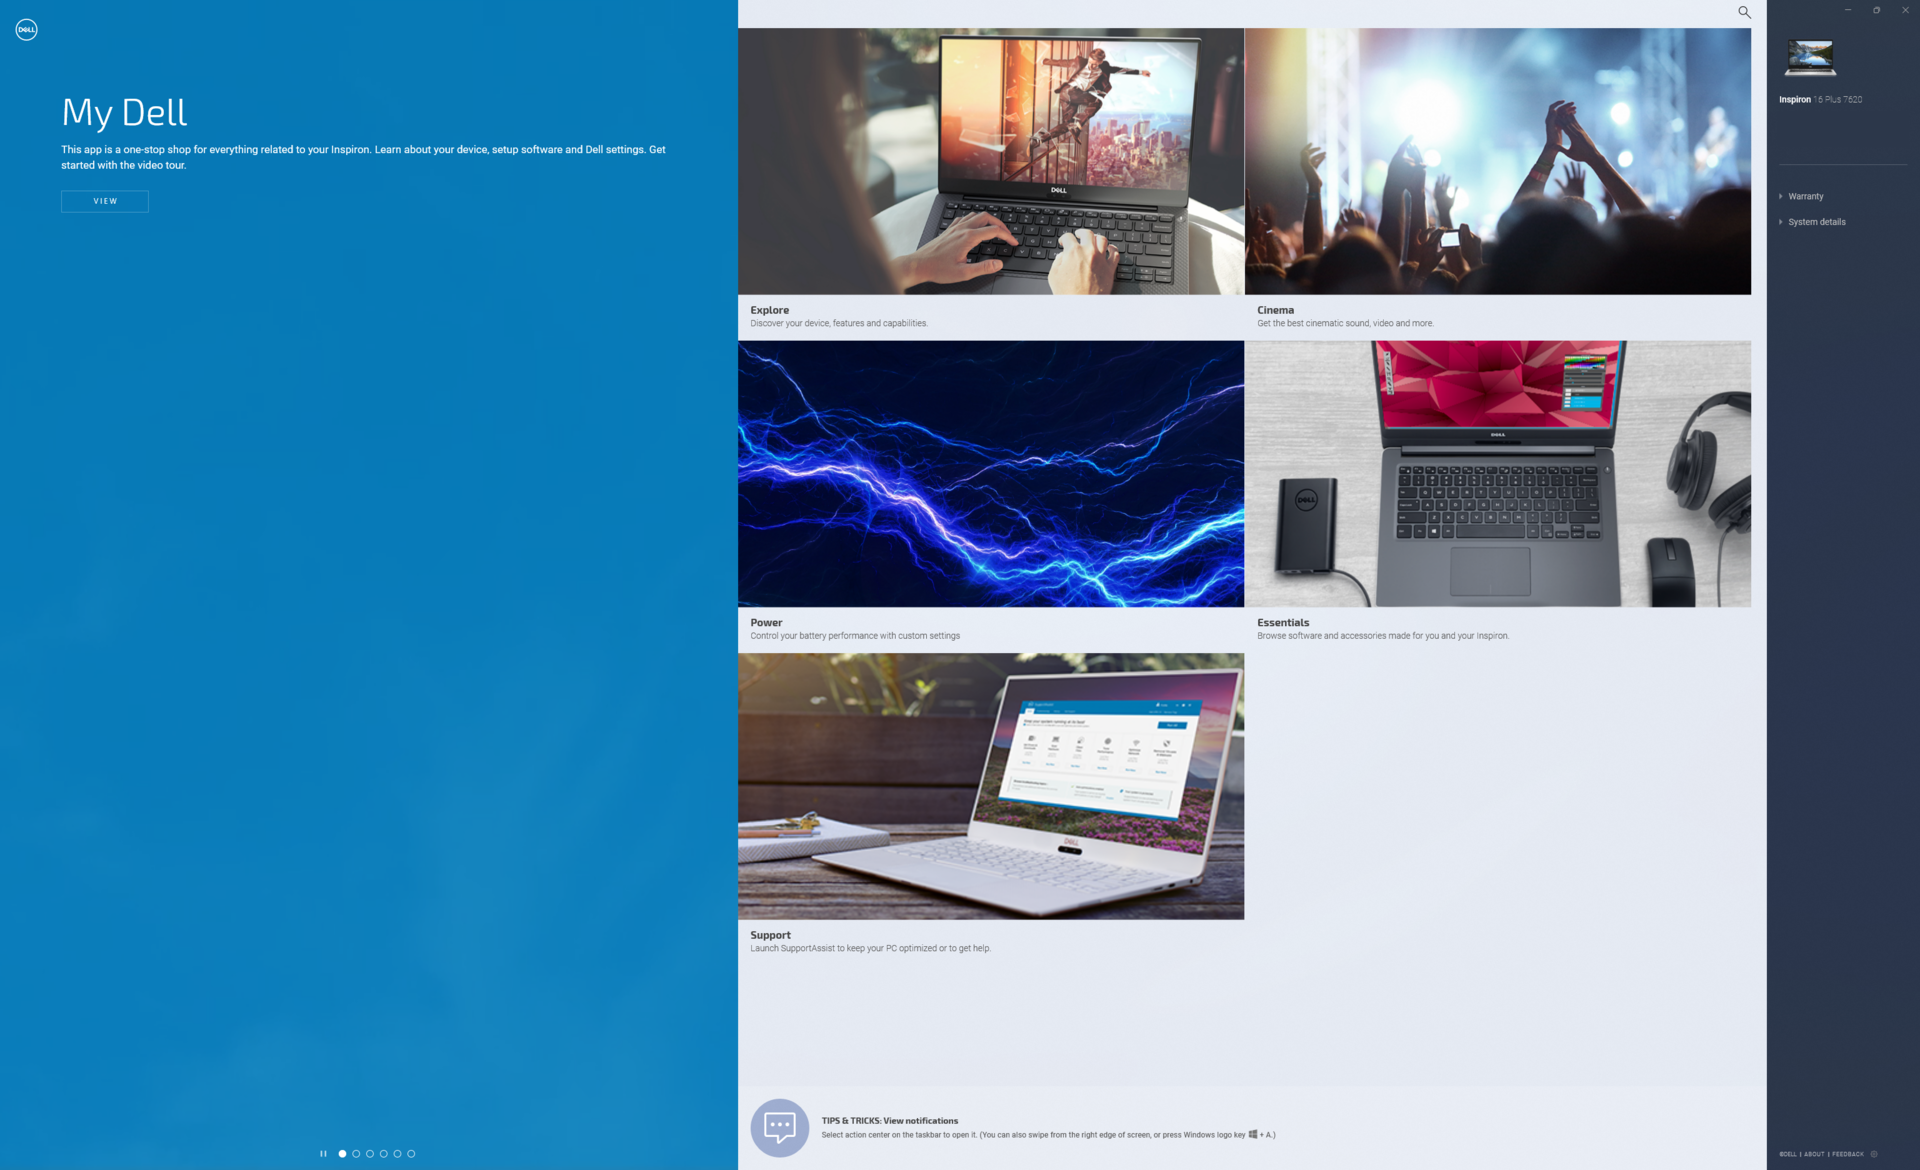
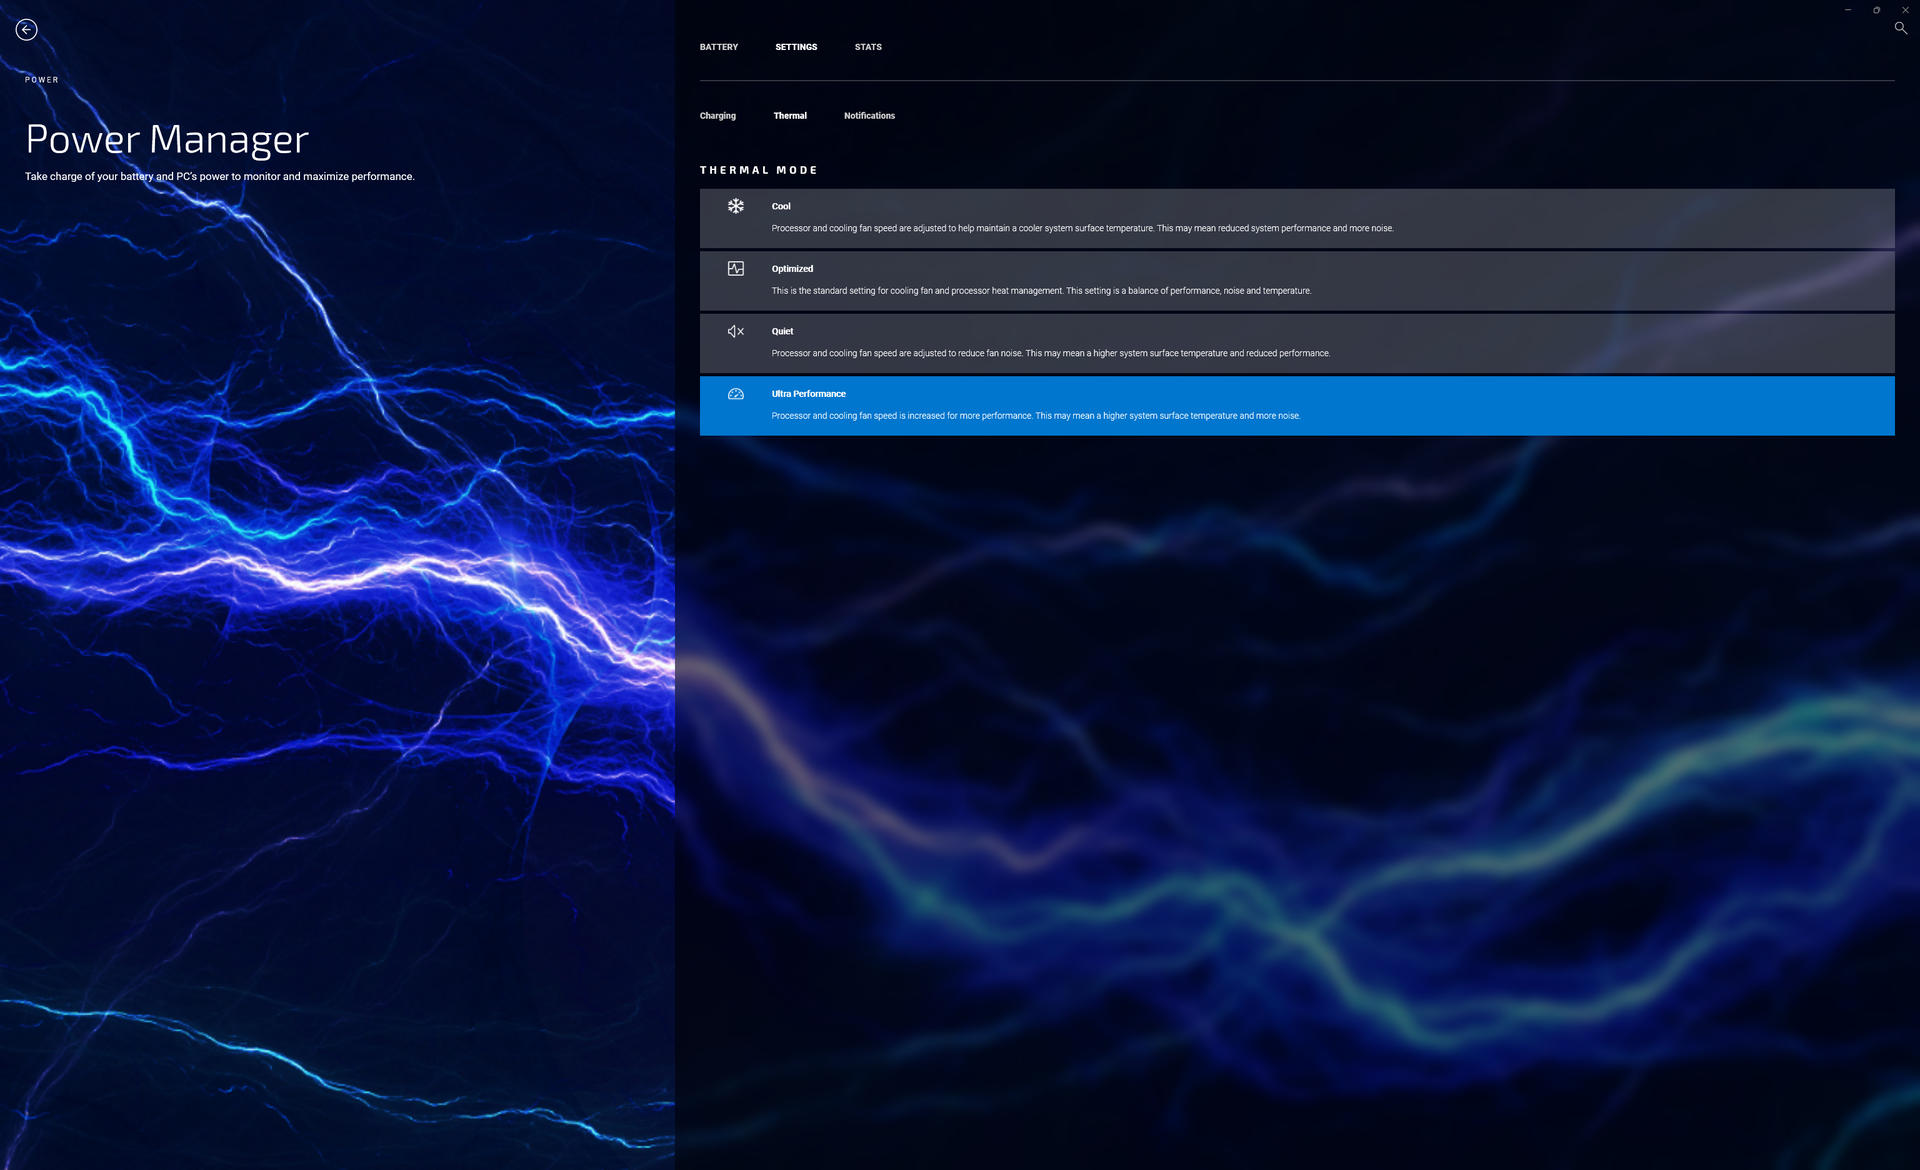
Vi ställde in vår enhet i prestandaläge via Windows och Ultra Performance-läge via den förinstallerade MyDell-programvaran innan vi körde några av de följande riktmärkena. Användarna bör bekanta sig med MyDell eftersom det är navet för garantifrågor, produktregistrering, inställningar för batteriladdning och prestandalägen
Nvidia Optimus levereras som standard utan MUX-alternativ.
Processor
Rå prestanda för flera trådar är cirka 30-50 procent snabbare än den senaste generationen Core i7-11800H vilket innebär en ganska betydande ökning från år till år. Hållbarheten i prestandan kunde dock vara lite bättre, eftersom CineBench R15 xT-poängen skulle sjunka med cirka 18 procent när man körde riktmärket i en slinga. Vi är inte säkra på hur mycket av en prestandadämpning användarna kan förvänta sig om de nedgraderar till Core i5-12500H eftersom vi ännu inte har testat någon bärbar dator med en sådan CPU i skrivande stund.
Cinebench R15 Multi Loop
Cinebench R23: Multi Core | Single Core
Cinebench R15: CPU Multi 64Bit | CPU Single 64Bit
Blender: v2.79 BMW27 CPU
7-Zip 18.03: 7z b 4 | 7z b 4 -mmt1
Geekbench 5.5: Multi-Core | Single-Core
HWBOT x265 Benchmark v2.2: 4k Preset
LibreOffice : 20 Documents To PDF
R Benchmark 2.5: Overall mean
| Cinebench R20 / CPU (Multi Core) | |
| MSI Creator Z16P B12UHST | |
| Gigabyte Aero 16 YE5 | |
| Genomsnitt Intel Core i7-12700H (1576 - 7407, n=64) | |
| Razer Blade 15 2022 | |
| Dell Inspiron 16 Plus 7620 | |
| Lenovo Yoga 7 16IAP7 | |
| Dell Inspiron 16 Plus 7610-MHJ8F | |
| HP Victus 16-e0145ng | |
| Dell Inspiron 14 7420 2-in-1 | |
| Acer Swift X SFX16-51G-5388 | |
| HP Pavilion Gaming 16-a0242ng | |
| Cinebench R20 / CPU (Single Core) | |
| MSI Creator Z16P B12UHST | |
| Razer Blade 15 2022 | |
| Gigabyte Aero 16 YE5 | |
| Dell Inspiron 14 7420 2-in-1 | |
| Dell Inspiron 16 Plus 7620 | |
| Genomsnitt Intel Core i7-12700H (300 - 704, n=64) | |
| Lenovo Yoga 7 16IAP7 | |
| Dell Inspiron 16 Plus 7610-MHJ8F | |
| Acer Swift X SFX16-51G-5388 | |
| HP Victus 16-e0145ng | |
| HP Pavilion Gaming 16-a0242ng | |
| Cinebench R23 / Multi Core | |
| MSI Creator Z16P B12UHST | |
| Gigabyte Aero 16 YE5 | |
| Genomsnitt Intel Core i7-12700H (4032 - 19330, n=64) | |
| Razer Blade 15 2022 | |
| Dell Inspiron 16 Plus 7620 | |
| Dell Inspiron 16 Plus 7610-MHJ8F | |
| Lenovo Yoga 7 16IAP7 | |
| HP Victus 16-e0145ng | |
| Dell Inspiron 14 7420 2-in-1 | |
| Acer Swift X SFX16-51G-5388 | |
| Cinebench R23 / Single Core | |
| Gigabyte Aero 16 YE5 | |
| MSI Creator Z16P B12UHST | |
| Razer Blade 15 2022 | |
| Dell Inspiron 14 7420 2-in-1 | |
| Dell Inspiron 16 Plus 7620 | |
| Genomsnitt Intel Core i7-12700H (778 - 1826, n=63) | |
| Lenovo Yoga 7 16IAP7 | |
| Dell Inspiron 16 Plus 7610-MHJ8F | |
| HP Victus 16-e0145ng | |
| Acer Swift X SFX16-51G-5388 | |
| Cinebench R15 / CPU Multi 64Bit | |
| MSI Creator Z16P B12UHST | |
| Gigabyte Aero 16 YE5 | |
| Genomsnitt Intel Core i7-12700H (1379 - 2916, n=70) | |
| Dell Inspiron 16 Plus 7620 | |
| Razer Blade 15 2022 | |
| Dell Inspiron 16 Plus 7610-MHJ8F | |
| Lenovo Yoga 7 16IAP7 | |
| HP Victus 16-e0145ng | |
| Dell Inspiron 14 7420 2-in-1 | |
| Acer Swift X SFX16-51G-5388 | |
| HP Pavilion Gaming 16-a0242ng | |
| Cinebench R15 / CPU Single 64Bit | |
| Gigabyte Aero 16 YE5 | |
| MSI Creator Z16P B12UHST | |
| Razer Blade 15 2022 | |
| Dell Inspiron 16 Plus 7620 | |
| Genomsnitt Intel Core i7-12700H (113 - 263, n=65) | |
| Dell Inspiron 14 7420 2-in-1 | |
| Lenovo Yoga 7 16IAP7 | |
| Dell Inspiron 16 Plus 7610-MHJ8F | |
| HP Victus 16-e0145ng | |
| Acer Swift X SFX16-51G-5388 | |
| HP Pavilion Gaming 16-a0242ng | |
| Blender / v2.79 BMW27 CPU | |
| HP Pavilion Gaming 16-a0242ng | |
| Acer Swift X SFX16-51G-5388 | |
| Dell Inspiron 14 7420 2-in-1 | |
| Lenovo Yoga 7 16IAP7 | |
| HP Victus 16-e0145ng | |
| Dell Inspiron 16 Plus 7610-MHJ8F | |
| Dell Inspiron 16 Plus 7620 | |
| Razer Blade 15 2022 | |
| Genomsnitt Intel Core i7-12700H (168 - 732, n=63) | |
| Gigabyte Aero 16 YE5 | |
| MSI Creator Z16P B12UHST | |
| 7-Zip 18.03 / 7z b 4 | |
| MSI Creator Z16P B12UHST | |
| Gigabyte Aero 16 YE5 | |
| Razer Blade 15 2022 | |
| Genomsnitt Intel Core i7-12700H (22844 - 73067, n=63) | |
| Dell Inspiron 16 Plus 7620 | |
| HP Victus 16-e0145ng | |
| Dell Inspiron 16 Plus 7610-MHJ8F | |
| Lenovo Yoga 7 16IAP7 | |
| Dell Inspiron 14 7420 2-in-1 | |
| HP Pavilion Gaming 16-a0242ng | |
| Acer Swift X SFX16-51G-5388 | |
| 7-Zip 18.03 / 7z b 4 -mmt1 | |
| Gigabyte Aero 16 YE5 | |
| MSI Creator Z16P B12UHST | |
| Razer Blade 15 2022 | |
| Genomsnitt Intel Core i7-12700H (2743 - 5972, n=63) | |
| Dell Inspiron 16 Plus 7620 | |
| Dell Inspiron 14 7420 2-in-1 | |
| Lenovo Yoga 7 16IAP7 | |
| HP Victus 16-e0145ng | |
| Dell Inspiron 16 Plus 7610-MHJ8F | |
| HP Pavilion Gaming 16-a0242ng | |
| Acer Swift X SFX16-51G-5388 | |
| Geekbench 5.5 / Multi-Core | |
| MSI Creator Z16P B12UHST | |
| Gigabyte Aero 16 YE5 | |
| Razer Blade 15 2022 | |
| Dell Inspiron 16 Plus 7620 | |
| Genomsnitt Intel Core i7-12700H (5144 - 13745, n=64) | |
| Lenovo Yoga 7 16IAP7 | |
| Dell Inspiron 16 Plus 7610-MHJ8F | |
| Dell Inspiron 16 Plus 7610-MHJ8F | |
| Dell Inspiron 16 Plus 7610-MHJ8F | |
| HP Victus 16-e0145ng | |
| Dell Inspiron 14 7420 2-in-1 | |
| Acer Swift X SFX16-51G-5388 | |
| HP Pavilion Gaming 16-a0242ng | |
| HP Pavilion Gaming 16-a0242ng | |
| Geekbench 5.5 / Single-Core | |
| MSI Creator Z16P B12UHST | |
| Gigabyte Aero 16 YE5 | |
| Razer Blade 15 2022 | |
| Lenovo Yoga 7 16IAP7 | |
| Dell Inspiron 16 Plus 7620 | |
| Genomsnitt Intel Core i7-12700H (803 - 1851, n=64) | |
| Dell Inspiron 14 7420 2-in-1 | |
| Dell Inspiron 16 Plus 7610-MHJ8F | |
| Dell Inspiron 16 Plus 7610-MHJ8F | |
| Dell Inspiron 16 Plus 7610-MHJ8F | |
| Acer Swift X SFX16-51G-5388 | |
| HP Victus 16-e0145ng | |
| HP Pavilion Gaming 16-a0242ng | |
| HP Pavilion Gaming 16-a0242ng | |
| HWBOT x265 Benchmark v2.2 / 4k Preset | |
| MSI Creator Z16P B12UHST | |
| Gigabyte Aero 16 YE5 | |
| Razer Blade 15 2022 | |
| Genomsnitt Intel Core i7-12700H (4.67 - 21.8, n=64) | |
| Dell Inspiron 16 Plus 7620 | |
| HP Victus 16-e0145ng | |
| Lenovo Yoga 7 16IAP7 | |
| Dell Inspiron 16 Plus 7610-MHJ8F | |
| Dell Inspiron 14 7420 2-in-1 | |
| Acer Swift X SFX16-51G-5388 | |
| HP Pavilion Gaming 16-a0242ng | |
| LibreOffice / 20 Documents To PDF | |
| HP Victus 16-e0145ng | |
| HP Pavilion Gaming 16-a0242ng | |
| Razer Blade 15 2022 | |
| Acer Swift X SFX16-51G-5388 | |
| Dell Inspiron 14 7420 2-in-1 | |
| Lenovo Yoga 7 16IAP7 | |
| Dell Inspiron 16 Plus 7620 | |
| Genomsnitt Intel Core i7-12700H (34.2 - 95.3, n=63) | |
| Dell Inspiron 16 Plus 7610-MHJ8F | |
| Gigabyte Aero 16 YE5 | |
| MSI Creator Z16P B12UHST | |
| R Benchmark 2.5 / Overall mean | |
| HP Pavilion Gaming 16-a0242ng | |
| Acer Swift X SFX16-51G-5388 | |
| Dell Inspiron 16 Plus 7610-MHJ8F | |
| HP Victus 16-e0145ng | |
| Dell Inspiron 16 Plus 7620 | |
| Genomsnitt Intel Core i7-12700H (0.4441 - 1.052, n=63) | |
| Razer Blade 15 2022 | |
| Dell Inspiron 14 7420 2-in-1 | |
| Lenovo Yoga 7 16IAP7 | |
| MSI Creator Z16P B12UHST | |
| Gigabyte Aero 16 YE5 | |
* ... mindre är bättre
AIDA64: FP32 Ray-Trace | FPU Julia | CPU SHA3 | CPU Queen | FPU SinJulia | FPU Mandel | CPU AES | CPU ZLib | FP64 Ray-Trace | CPU PhotoWorxx
| Performance rating | |
| Asus Vivobook Pro 16X-M7600QE | |
| Dell Inspiron 16 Plus 7620 | |
| Genomsnitt Intel Core i7-12700H | |
| Huawei MateBook D 16 2022 | |
| Lenovo Yoga 7 16IAP7 | |
| Acer Swift X SFX16-51G-5388 | |
| Dell Inspiron 16 Plus 7610 -9! | |
| AIDA64 / FP32 Ray-Trace | |
| Asus Vivobook Pro 16X-M7600QE | |
| Asus Vivobook Pro 16X-M7600QE | |
| Dell Inspiron 16 Plus 7620 | |
| Huawei MateBook D 16 2022 | |
| Genomsnitt Intel Core i7-12700H (2585 - 17957, n=64) | |
| Lenovo Yoga 7 16IAP7 | |
| Acer Swift X SFX16-51G-5388 | |
| AIDA64 / FPU Julia | |
| Asus Vivobook Pro 16X-M7600QE | |
| Asus Vivobook Pro 16X-M7600QE | |
| Dell Inspiron 16 Plus 7620 | |
| Huawei MateBook D 16 2022 | |
| Genomsnitt Intel Core i7-12700H (12439 - 90760, n=64) | |
| Lenovo Yoga 7 16IAP7 | |
| Acer Swift X SFX16-51G-5388 | |
| AIDA64 / CPU SHA3 | |
| Asus Vivobook Pro 16X-M7600QE | |
| Asus Vivobook Pro 16X-M7600QE | |
| Genomsnitt Intel Core i7-12700H (833 - 4242, n=64) | |
| Dell Inspiron 16 Plus 7620 | |
| Huawei MateBook D 16 2022 | |
| Lenovo Yoga 7 16IAP7 | |
| Acer Swift X SFX16-51G-5388 | |
| AIDA64 / CPU Queen | |
| Asus Vivobook Pro 16X-M7600QE | |
| Asus Vivobook Pro 16X-M7600QE | |
| Genomsnitt Intel Core i7-12700H (57923 - 103202, n=63) | |
| Huawei MateBook D 16 2022 | |
| Dell Inspiron 16 Plus 7620 | |
| Lenovo Yoga 7 16IAP7 | |
| Acer Swift X SFX16-51G-5388 | |
| AIDA64 / FPU SinJulia | |
| Asus Vivobook Pro 16X-M7600QE | |
| Asus Vivobook Pro 16X-M7600QE | |
| Genomsnitt Intel Core i7-12700H (3249 - 9939, n=64) | |
| Dell Inspiron 16 Plus 7620 | |
| Huawei MateBook D 16 2022 | |
| Lenovo Yoga 7 16IAP7 | |
| Acer Swift X SFX16-51G-5388 | |
| AIDA64 / FPU Mandel | |
| Asus Vivobook Pro 16X-M7600QE | |
| Asus Vivobook Pro 16X-M7600QE | |
| Dell Inspiron 16 Plus 7620 | |
| Genomsnitt Intel Core i7-12700H (7135 - 44760, n=64) | |
| Huawei MateBook D 16 2022 | |
| Lenovo Yoga 7 16IAP7 | |
| Acer Swift X SFX16-51G-5388 | |
| AIDA64 / CPU AES | |
| Asus Vivobook Pro 16X-M7600QE | |
| Asus Vivobook Pro 16X-M7600QE | |
| Huawei MateBook D 16 2022 | |
| Genomsnitt Intel Core i7-12700H (31839 - 144360, n=64) | |
| Dell Inspiron 16 Plus 7620 | |
| Acer Swift X SFX16-51G-5388 | |
| Lenovo Yoga 7 16IAP7 | |
| AIDA64 / CPU ZLib | |
| Dell Inspiron 16 Plus 7620 | |
| Genomsnitt Intel Core i7-12700H (305 - 1171, n=64) | |
| Asus Vivobook Pro 16X-M7600QE | |
| Asus Vivobook Pro 16X-M7600QE | |
| Huawei MateBook D 16 2022 | |
| Lenovo Yoga 7 16IAP7 | |
| Acer Swift X SFX16-51G-5388 | |
| Dell Inspiron 16 Plus 7610 | |
| AIDA64 / FP64 Ray-Trace | |
| Asus Vivobook Pro 16X-M7600QE | |
| Asus Vivobook Pro 16X-M7600QE | |
| Dell Inspiron 16 Plus 7620 | |
| Genomsnitt Intel Core i7-12700H (1437 - 9692, n=64) | |
| Huawei MateBook D 16 2022 | |
| Lenovo Yoga 7 16IAP7 | |
| Acer Swift X SFX16-51G-5388 | |
| AIDA64 / CPU PhotoWorxx | |
| Lenovo Yoga 7 16IAP7 | |
| Huawei MateBook D 16 2022 | |
| Acer Swift X SFX16-51G-5388 | |
| Dell Inspiron 16 Plus 7620 | |
| Genomsnitt Intel Core i7-12700H (12863 - 52207, n=64) | |
| Asus Vivobook Pro 16X-M7600QE | |
| Asus Vivobook Pro 16X-M7600QE | |
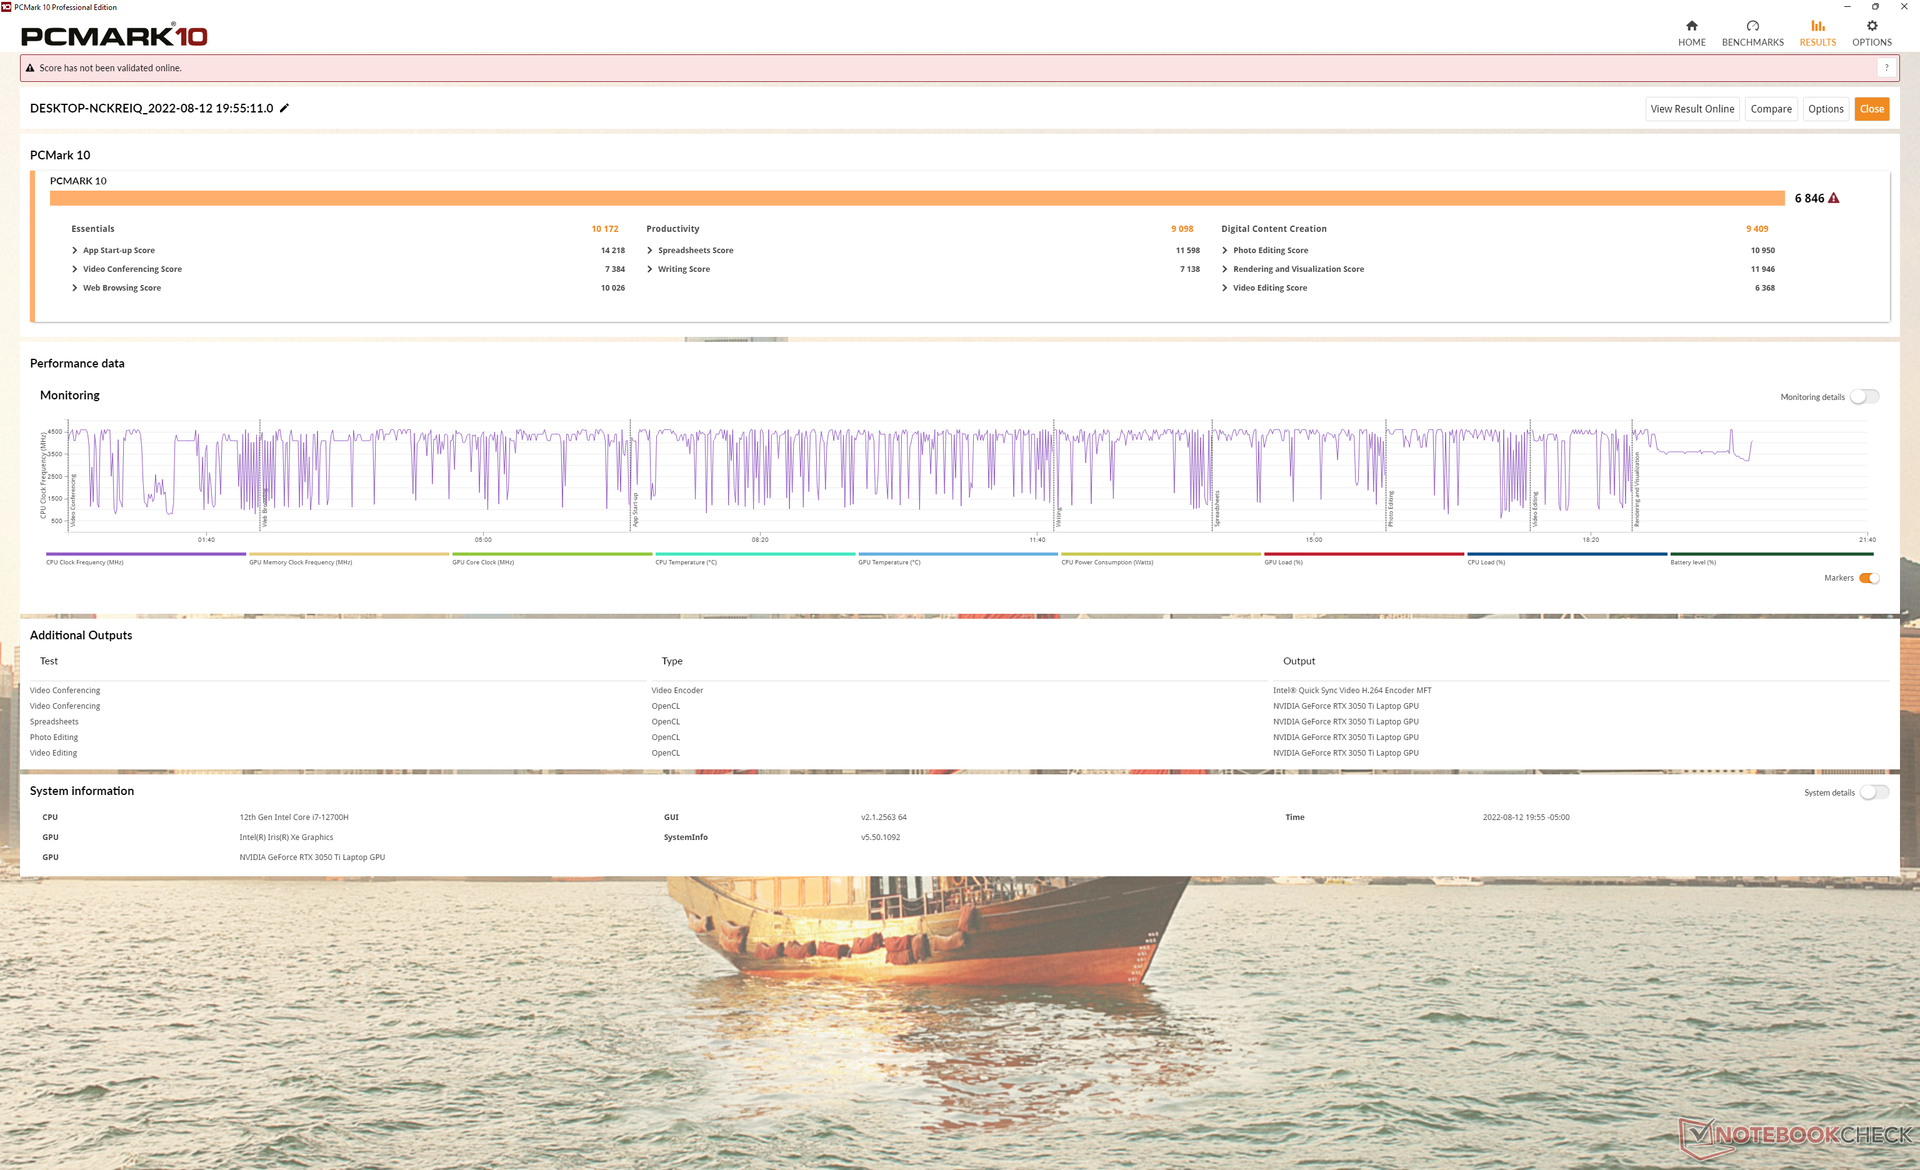
Systemets prestanda
PCMark 10-resultaten är genomgående högre än för den tidigare generationen Inspiron 16 Plus 7610 och för de flesta andra 16-tums bärbara multimediebärbara datorer.
CrossMark: Overall | Productivity | Creativity | Responsiveness
| PCMark 10 / Score | |
| Dell Inspiron 16 Plus 7620 | |
| Genomsnitt Intel Core i7-12700H, NVIDIA GeForce RTX 3050 Ti Laptop GPU (6623 - 7075, n=5) | |
| Asus Vivobook Pro 16X-M7600QE | |
| Dell Inspiron 16 Plus 7610 | |
| Huawei MateBook D 16 2022 | |
| Lenovo Yoga 7 16IAP7 | |
| Acer Swift X SFX16-51G-5388 | |
| PCMark 10 / Essentials | |
| Huawei MateBook D 16 2022 | |
| Lenovo Yoga 7 16IAP7 | |
| Asus Vivobook Pro 16X-M7600QE | |
| Genomsnitt Intel Core i7-12700H, NVIDIA GeForce RTX 3050 Ti Laptop GPU (9540 - 10970, n=5) | |
| Dell Inspiron 16 Plus 7620 | |
| Dell Inspiron 16 Plus 7610 | |
| Acer Swift X SFX16-51G-5388 | |
| PCMark 10 / Productivity | |
| Asus Vivobook Pro 16X-M7600QE | |
| Dell Inspiron 16 Plus 7620 | |
| Genomsnitt Intel Core i7-12700H, NVIDIA GeForce RTX 3050 Ti Laptop GPU (8530 - 9555, n=5) | |
| Acer Swift X SFX16-51G-5388 | |
| Dell Inspiron 16 Plus 7610 | |
| Huawei MateBook D 16 2022 | |
| Lenovo Yoga 7 16IAP7 | |
| PCMark 10 / Digital Content Creation | |
| Dell Inspiron 16 Plus 7620 | |
| Genomsnitt Intel Core i7-12700H, NVIDIA GeForce RTX 3050 Ti Laptop GPU (8855 - 9542, n=5) | |
| Dell Inspiron 16 Plus 7610 | |
| Asus Vivobook Pro 16X-M7600QE | |
| Lenovo Yoga 7 16IAP7 | |
| Huawei MateBook D 16 2022 | |
| Acer Swift X SFX16-51G-5388 | |
| CrossMark / Overall | |
| Huawei MateBook D 16 2022 | |
| Dell Inspiron 16 Plus 7620 | |
| Genomsnitt Intel Core i7-12700H, NVIDIA GeForce RTX 3050 Ti Laptop GPU (1654 - 1872, n=5) | |
| Lenovo Yoga 7 16IAP7 | |
| Acer Swift X SFX16-51G-5388 | |
| CrossMark / Productivity | |
| Huawei MateBook D 16 2022 | |
| Genomsnitt Intel Core i7-12700H, NVIDIA GeForce RTX 3050 Ti Laptop GPU (1595 - 1792, n=5) | |
| Dell Inspiron 16 Plus 7620 | |
| Lenovo Yoga 7 16IAP7 | |
| Acer Swift X SFX16-51G-5388 | |
| CrossMark / Creativity | |
| Huawei MateBook D 16 2022 | |
| Dell Inspiron 16 Plus 7620 | |
| Lenovo Yoga 7 16IAP7 | |
| Genomsnitt Intel Core i7-12700H, NVIDIA GeForce RTX 3050 Ti Laptop GPU (1699 - 1993, n=5) | |
| Acer Swift X SFX16-51G-5388 | |
| CrossMark / Responsiveness | |
| Huawei MateBook D 16 2022 | |
| Genomsnitt Intel Core i7-12700H, NVIDIA GeForce RTX 3050 Ti Laptop GPU (1383 - 1768, n=5) | |
| Dell Inspiron 16 Plus 7620 | |
| Lenovo Yoga 7 16IAP7 | |
| Acer Swift X SFX16-51G-5388 | |
| PCMark 10 Score | 6846 poäng | |
Hjälp | ||
| AIDA64 / Memory Copy | |
| Lenovo Yoga 7 16IAP7 | |
| Huawei MateBook D 16 2022 | |
| Acer Swift X SFX16-51G-5388 | |
| Dell Inspiron 16 Plus 7620 | |
| Genomsnitt Intel Core i7-12700H (25615 - 80511, n=64) | |
| Asus Vivobook Pro 16X-M7600QE | |
| Asus Vivobook Pro 16X-M7600QE | |
| AIDA64 / Memory Read | |
| Lenovo Yoga 7 16IAP7 | |
| Dell Inspiron 16 Plus 7620 | |
| Genomsnitt Intel Core i7-12700H (25586 - 79442, n=64) | |
| Huawei MateBook D 16 2022 | |
| Acer Swift X SFX16-51G-5388 | |
| Asus Vivobook Pro 16X-M7600QE | |
| Asus Vivobook Pro 16X-M7600QE | |
| AIDA64 / Memory Write | |
| Acer Swift X SFX16-51G-5388 | |
| Lenovo Yoga 7 16IAP7 | |
| Huawei MateBook D 16 2022 | |
| Dell Inspiron 16 Plus 7620 | |
| Genomsnitt Intel Core i7-12700H (23679 - 88660, n=64) | |
| Asus Vivobook Pro 16X-M7600QE | |
| Asus Vivobook Pro 16X-M7600QE | |
| AIDA64 / Memory Latency | |
| Acer Swift X SFX16-51G-5388 | |
| Huawei MateBook D 16 2022 | |
| Lenovo Yoga 7 16IAP7 | |
| Dell Inspiron 16 Plus 7620 | |
| Genomsnitt Intel Core i7-12700H (76.2 - 133.9, n=62) | |
| Asus Vivobook Pro 16X-M7600QE | |
| Asus Vivobook Pro 16X-M7600QE | |
| Dell Inspiron 16 Plus 7610 | |
* ... mindre är bättre
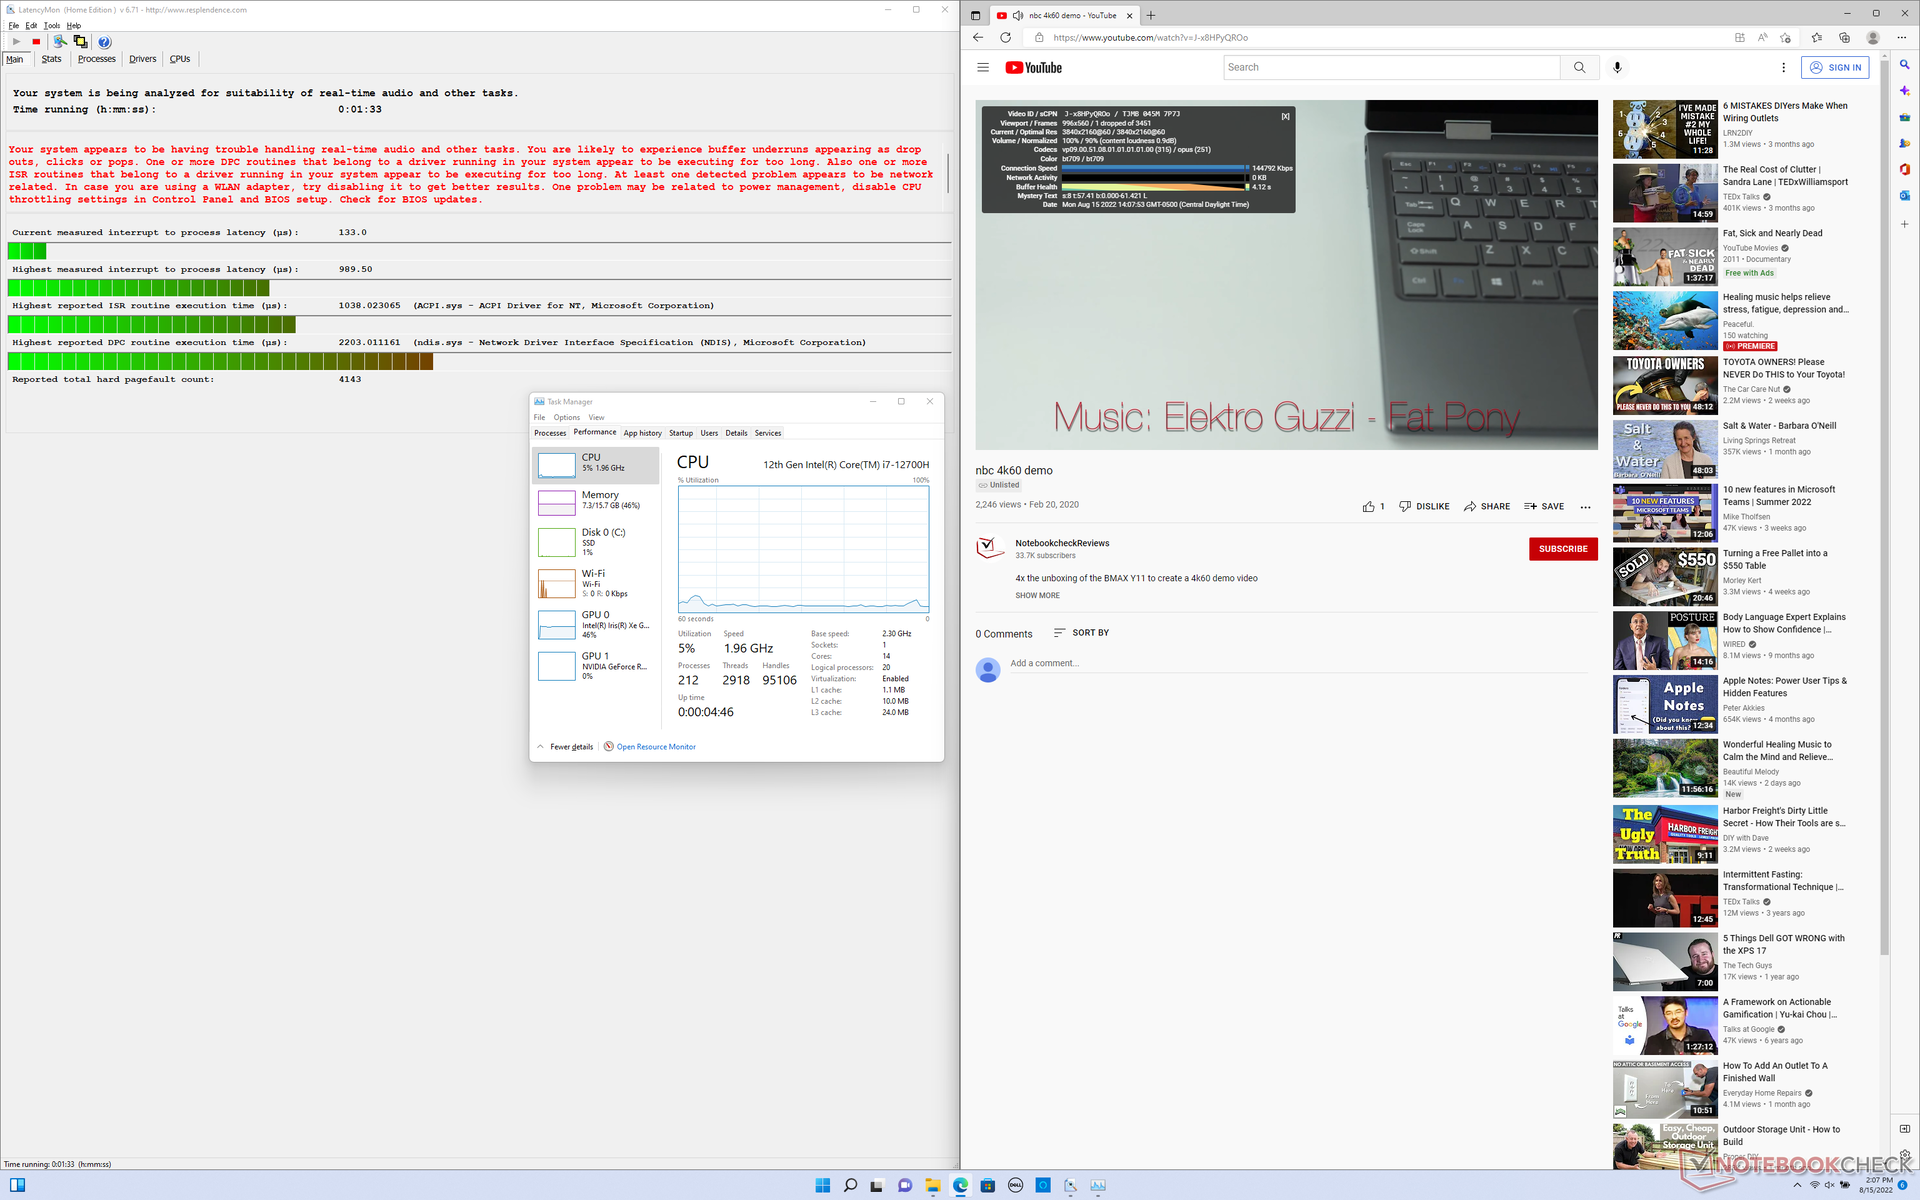
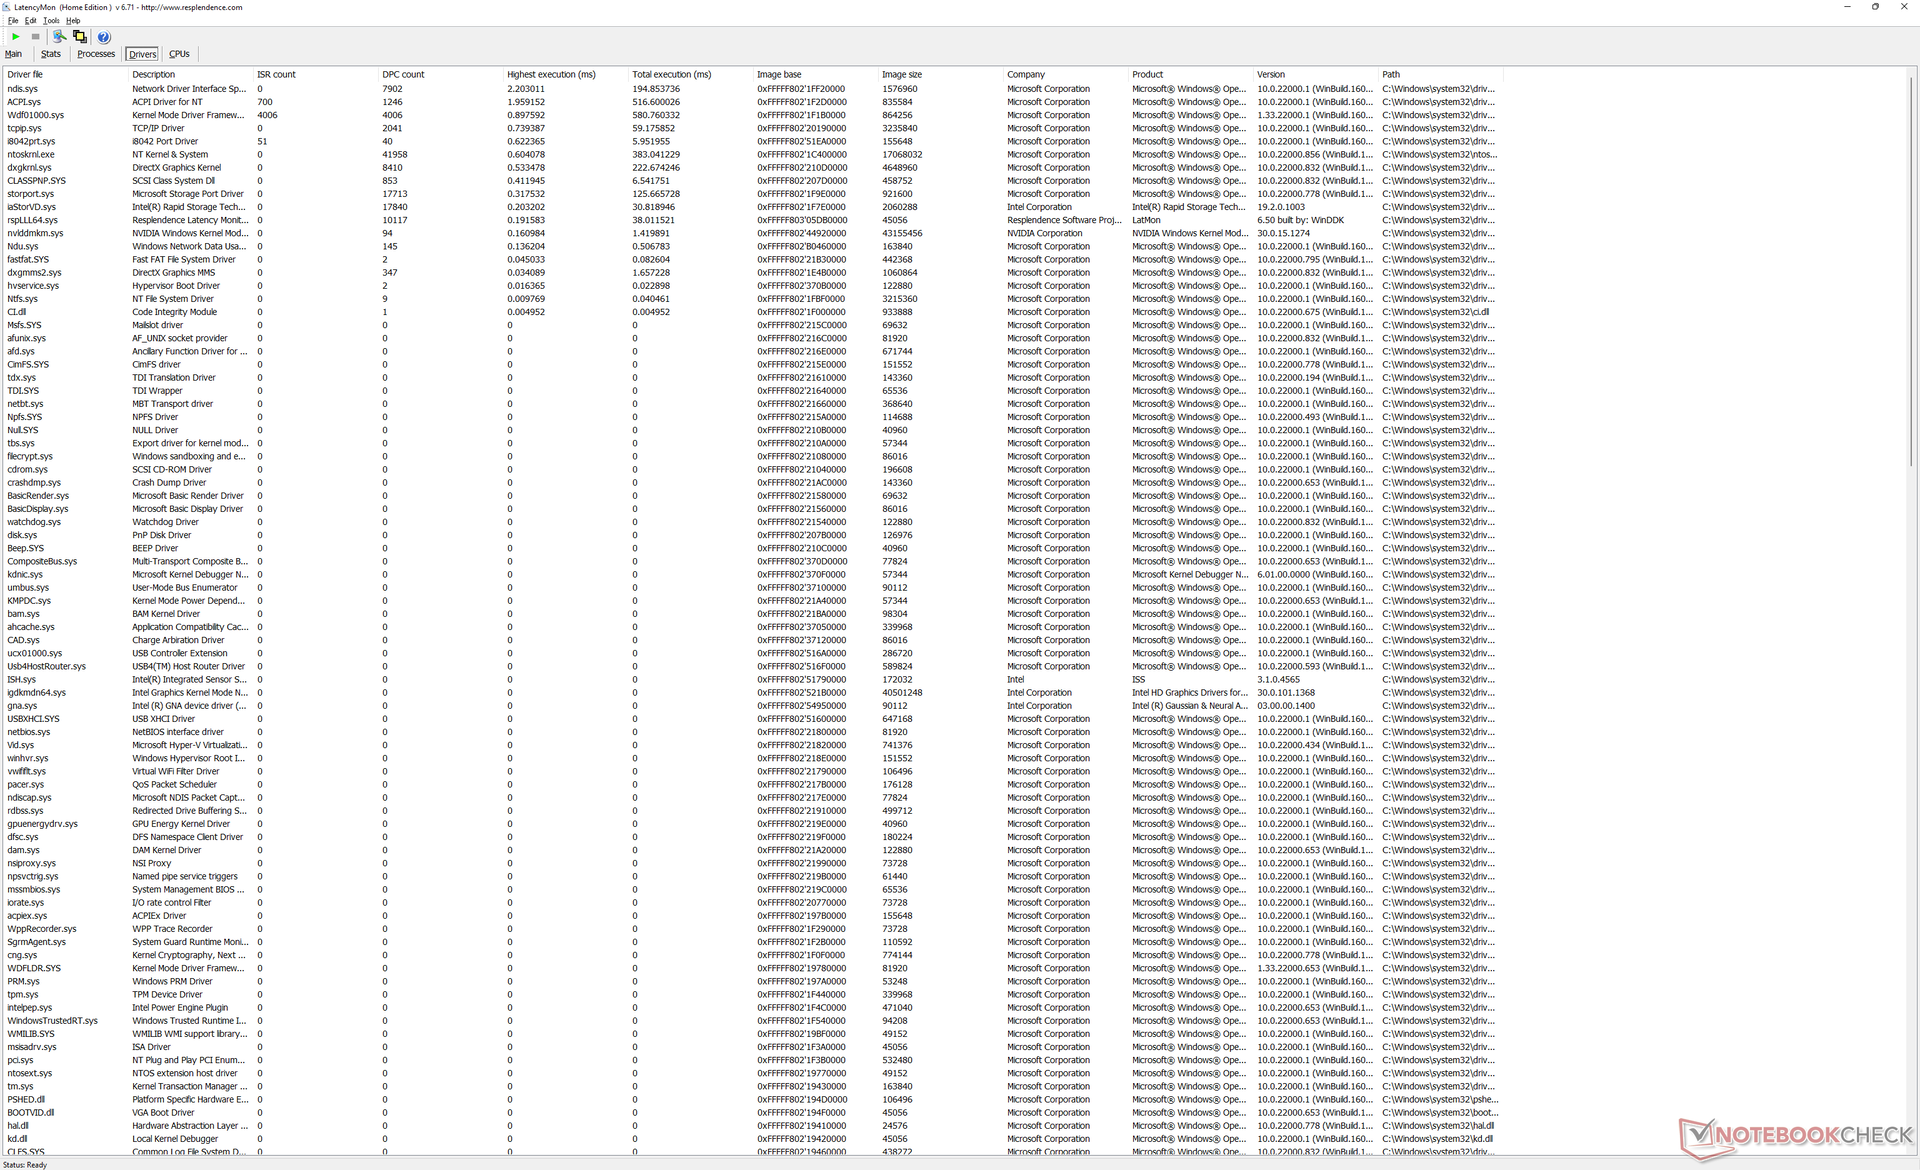
DPC-latenstid
LatencyMon avslöjar mindre DPC-problem när man öppnar flera webbläsarflikar på vår hemsida. uppspelning av 4K-video vid 60 FPS är annars smidig med bara en enda tappad bild under vår minutlånga testvideo.
| DPC Latencies / LatencyMon - interrupt to process latency (max), Web, Youtube, Prime95 | |
| Acer Swift X SFX16-51G-5388 | |
| Asus Vivobook Pro 16X-M7600QE | |
| Dell Inspiron 16 Plus 7610 | |
| Dell Inspiron 16 Plus 7620 | |
| Huawei MateBook D 16 2022 | |
| Lenovo Yoga 7 16IAP7 | |
* ... mindre är bättre
Lagringsenheter
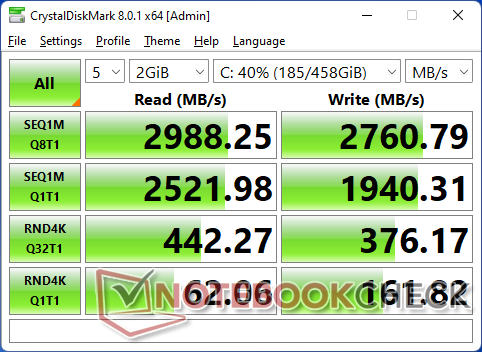
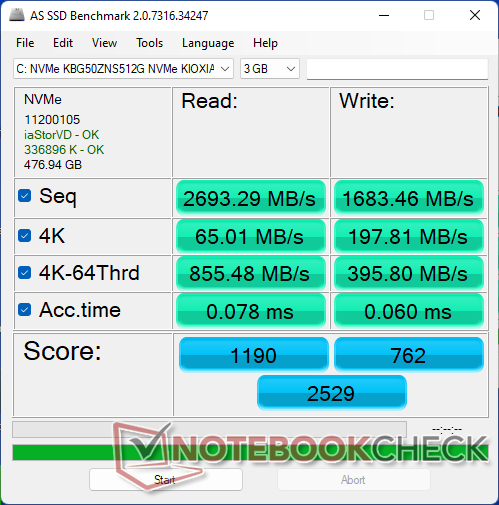
Vår testenhet levereras med en budget 512 GB PCIe4 x4 M.2Kioxia SSD för sekventiell läs- och skrivhastighet på upp till 2 700 MB/s vardera. En värmespridare i koppar ligger ovanpå för att hjälpa till med kylningen. Enheten i vår enhet uppvisar inga problem med prestandakraftsbegränsning när DiskSpd körs i en loop.

| Drive Performance rating - Percent | |
| Huawei MateBook D 16 2022 | |
| Asus Vivobook Pro 16X-M7600QE | |
| Lenovo Yoga 7 16IAP7 | |
| Dell Inspiron 16 Plus 7620 | |
| Acer Swift X SFX16-51G-5388 | |
| Dell Inspiron 16 Plus 7610 | |
* ... mindre är bättre
Disk Throttling: DiskSpd Read Loop, Queue Depth 8
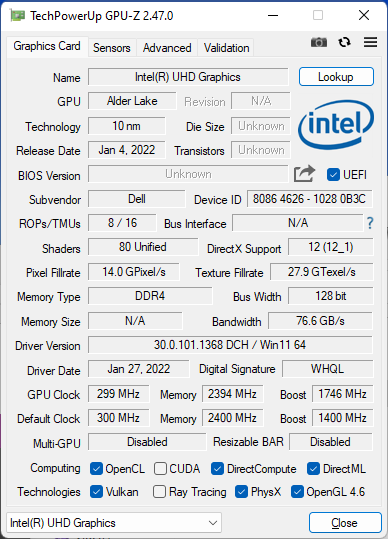
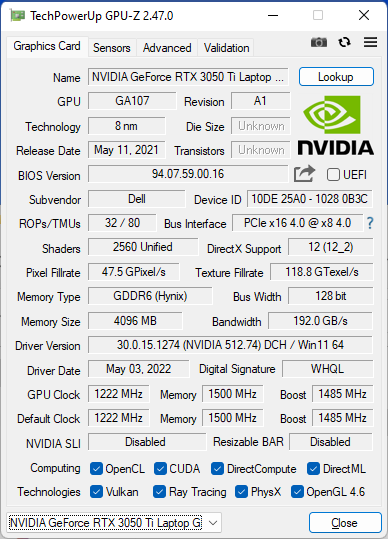
GPU-prestanda - något snabbare än tidigare
Grafikprestanda från vår GeForce RTX 3050 Ti är endast cirka 10 procent snabbare än RTX 3050 i förra årets modell. Även om RTX 3050-serien generellt sett är en besvikelse eftersom den äldre och billigare GTX 1660 Ti är överlägsen, är åtminstone Dells implementering här snabbare än de flesta andra bärbara datorer med samma GPU
Uppgradering till konfigurationen RTX 3060 förväntas öka grafikprestandan med upp till 20 procent. GPU:n skulle dock vara begränsad till en TGP på 60 W, vilket är i den nedre delen av spektrumet för mobila RTX 3060-alternativ.
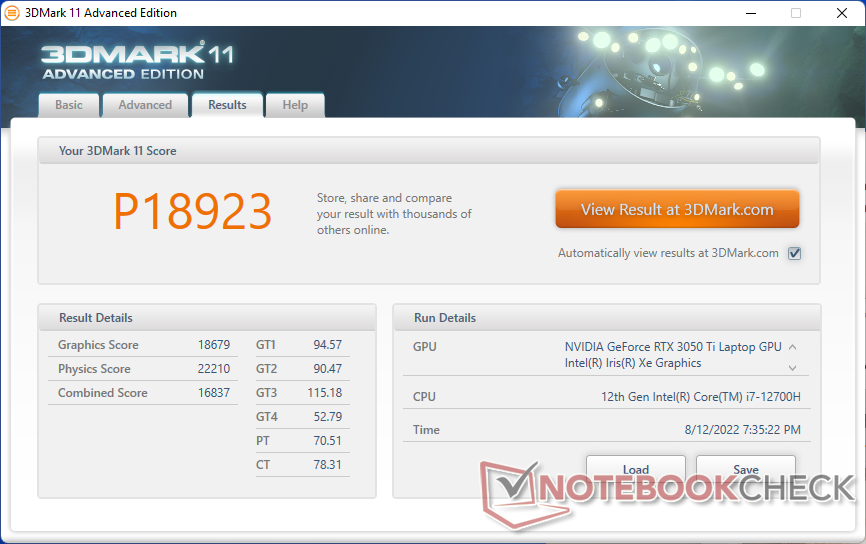
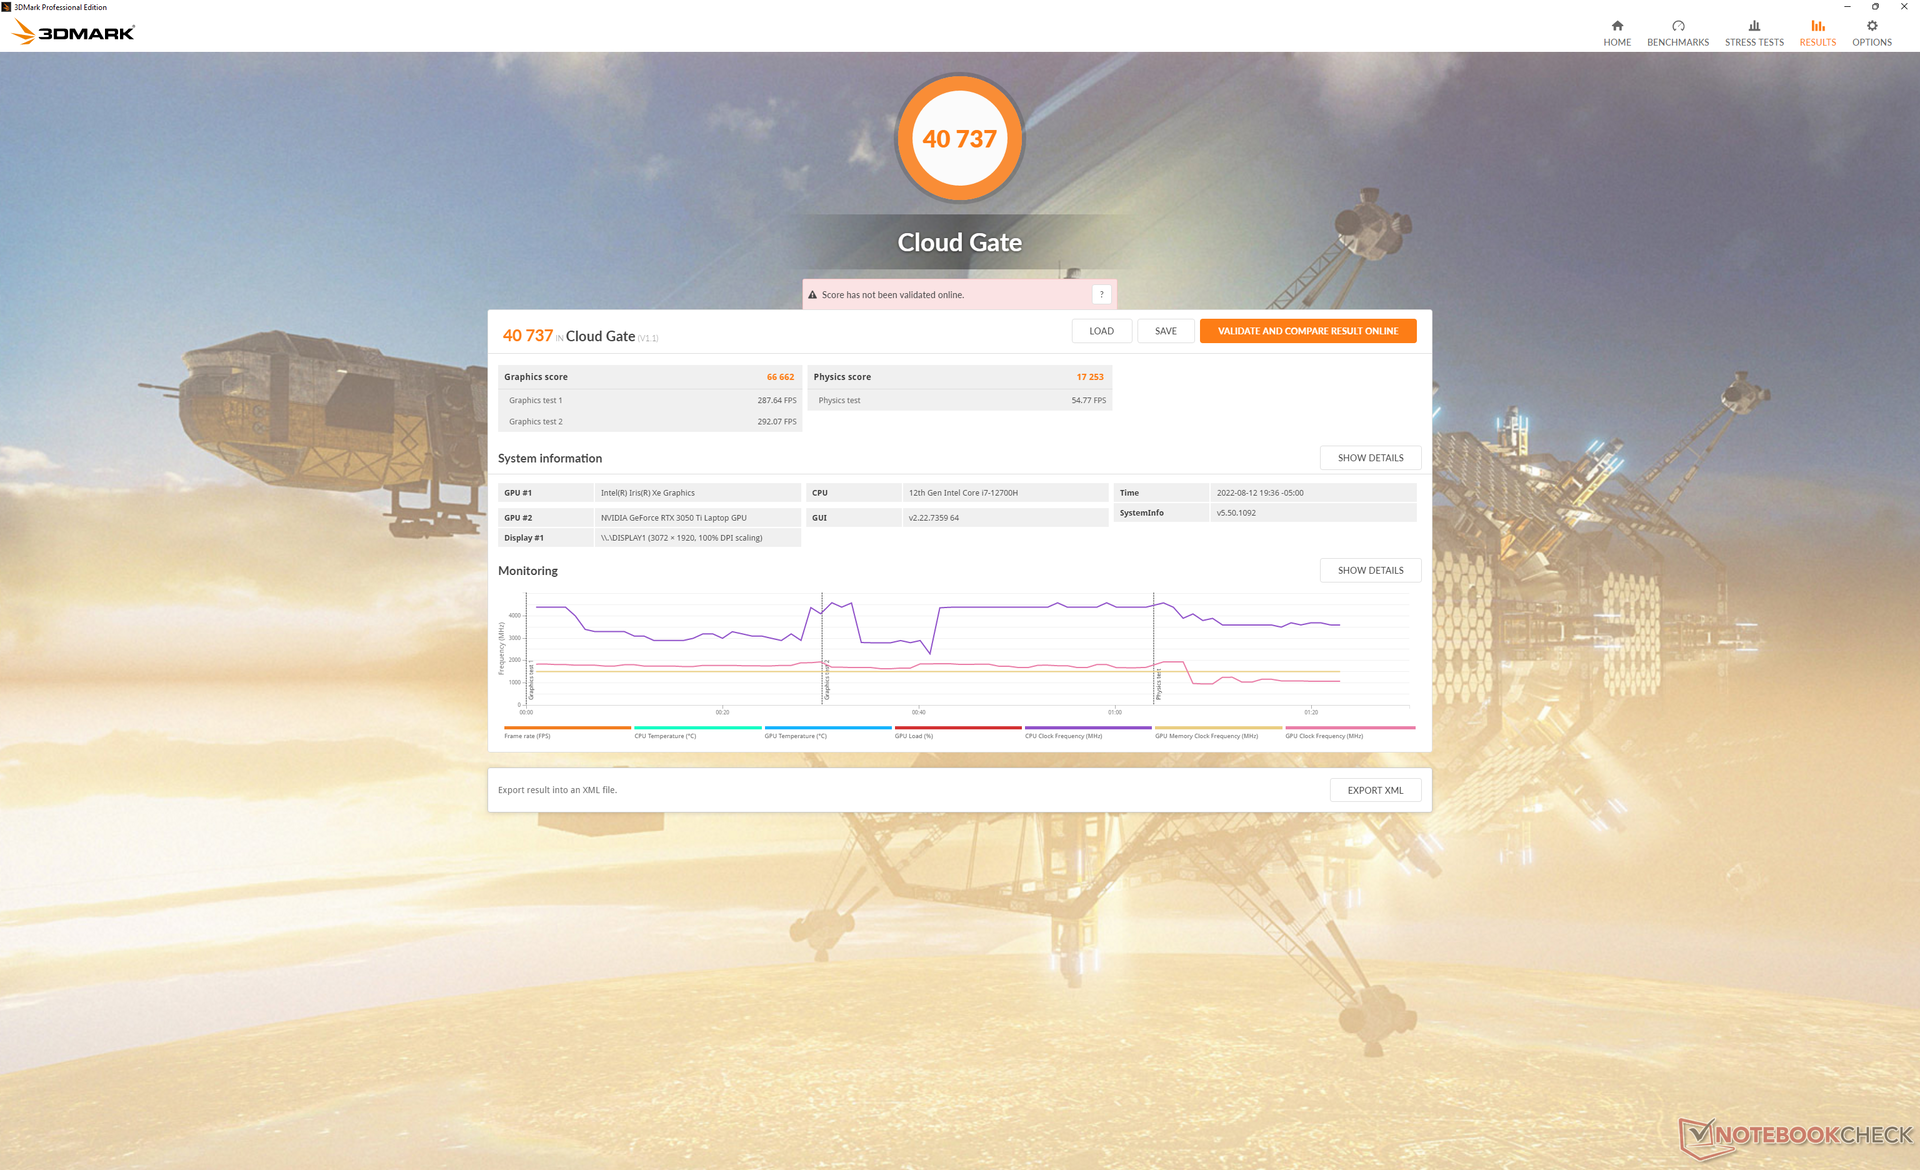
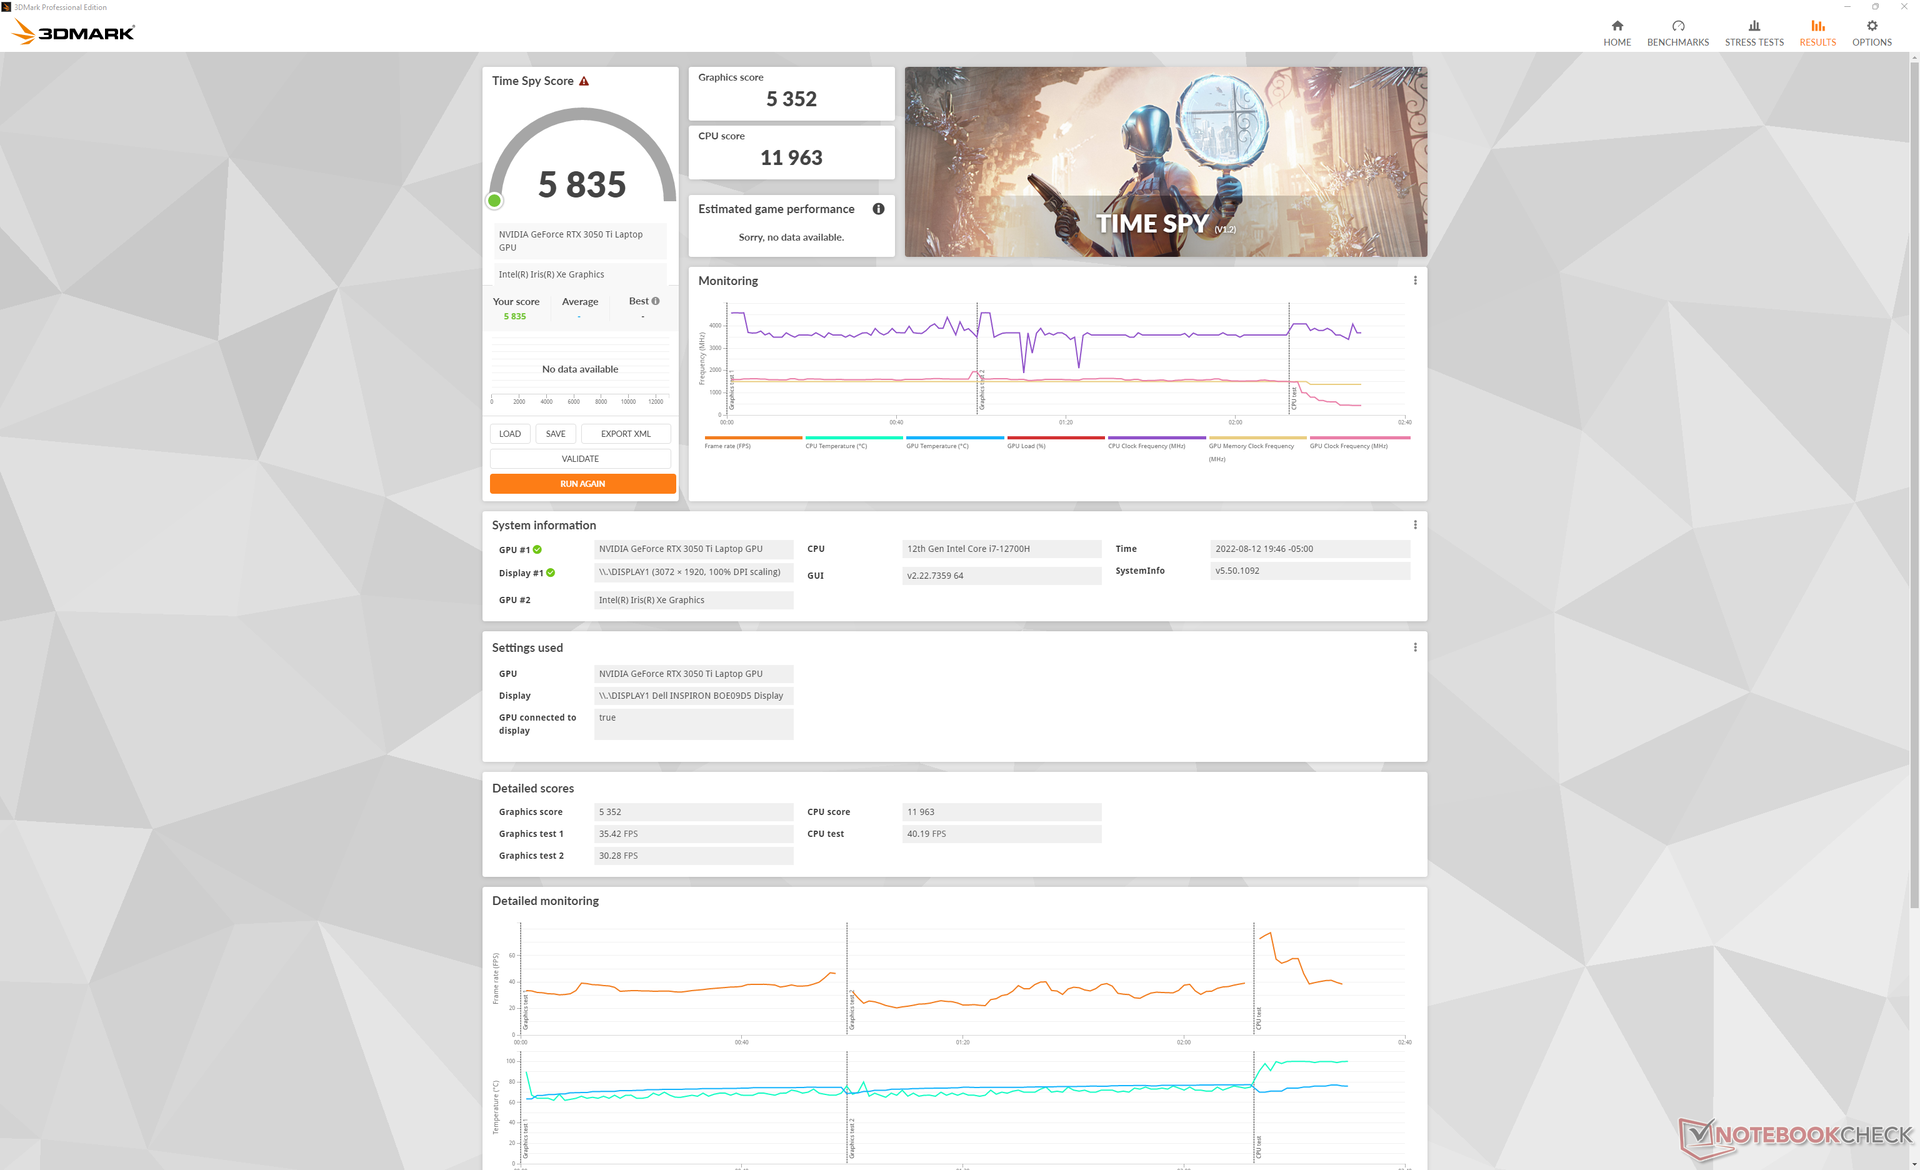
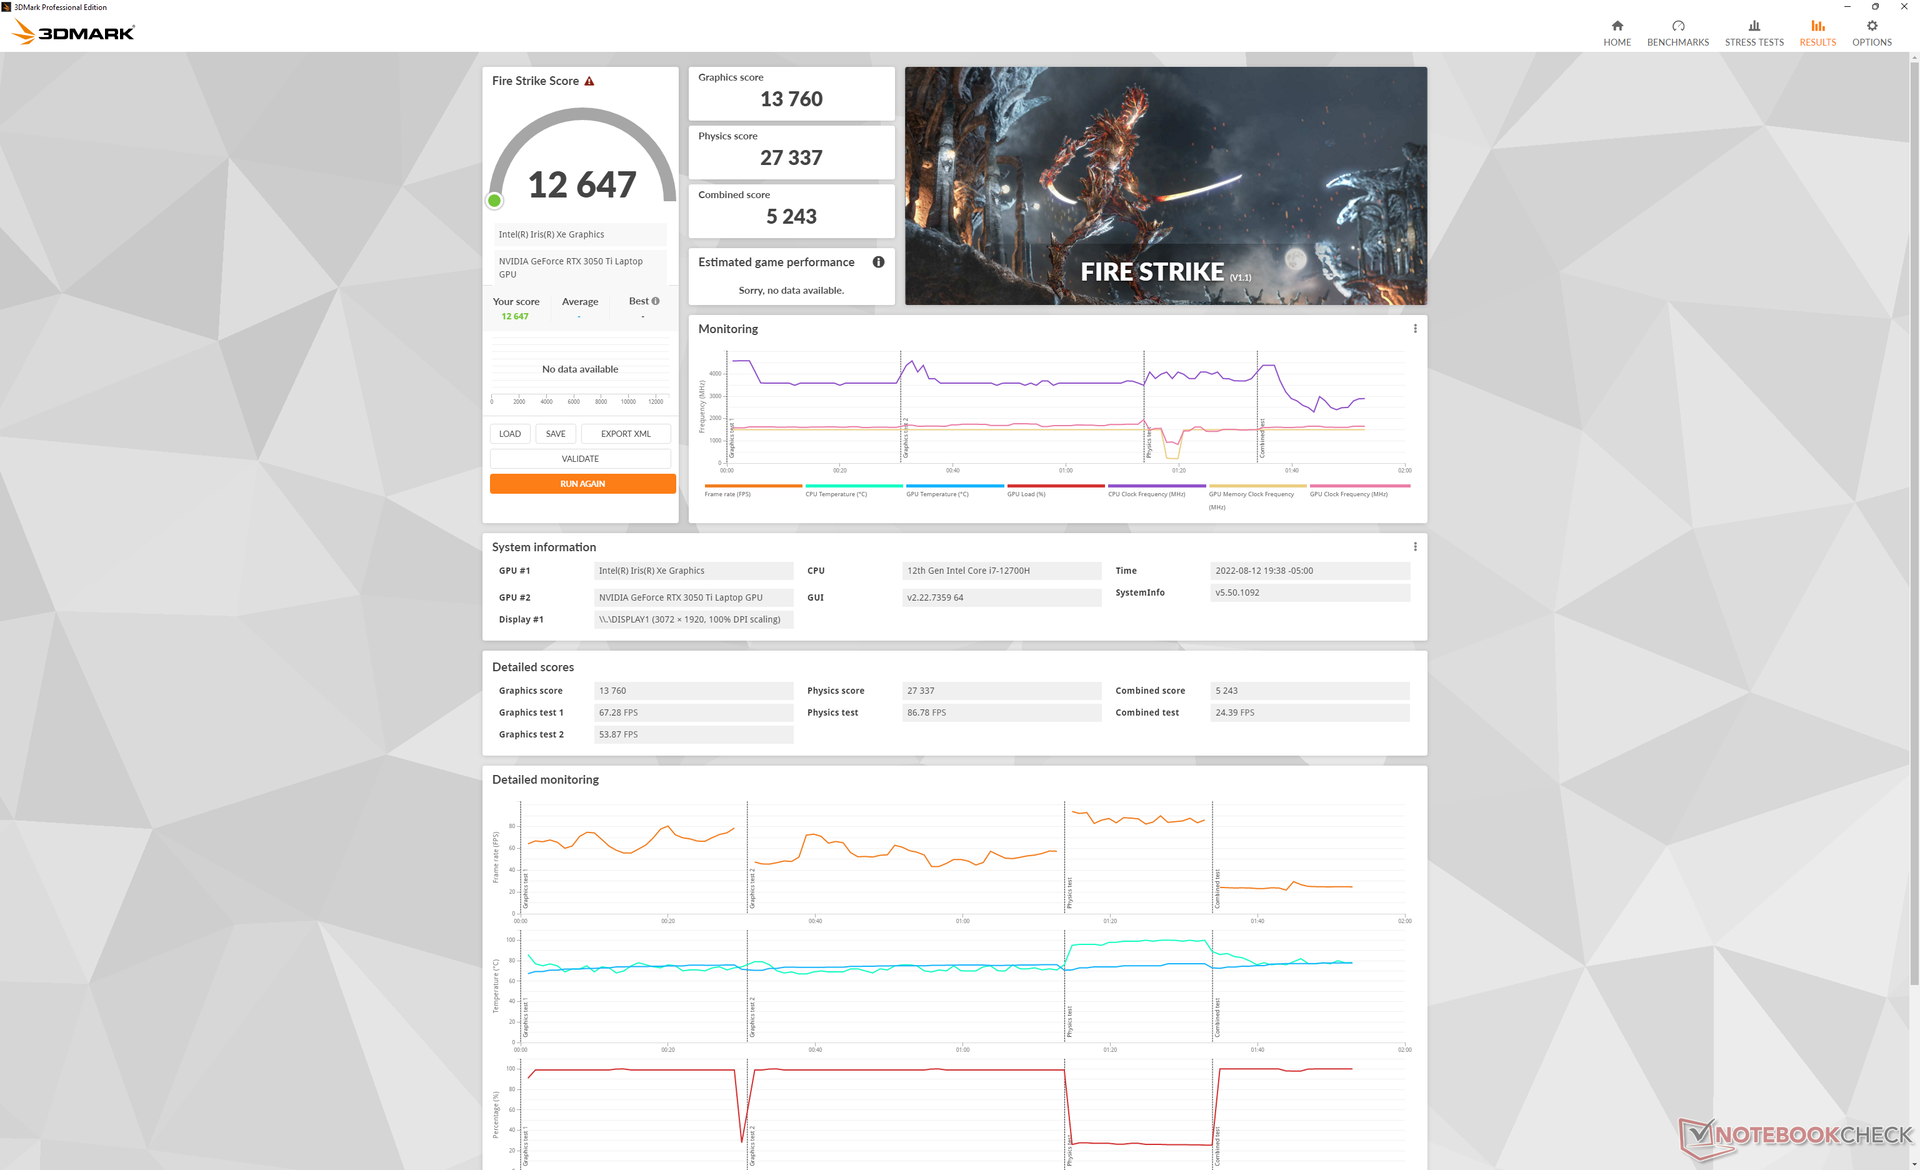
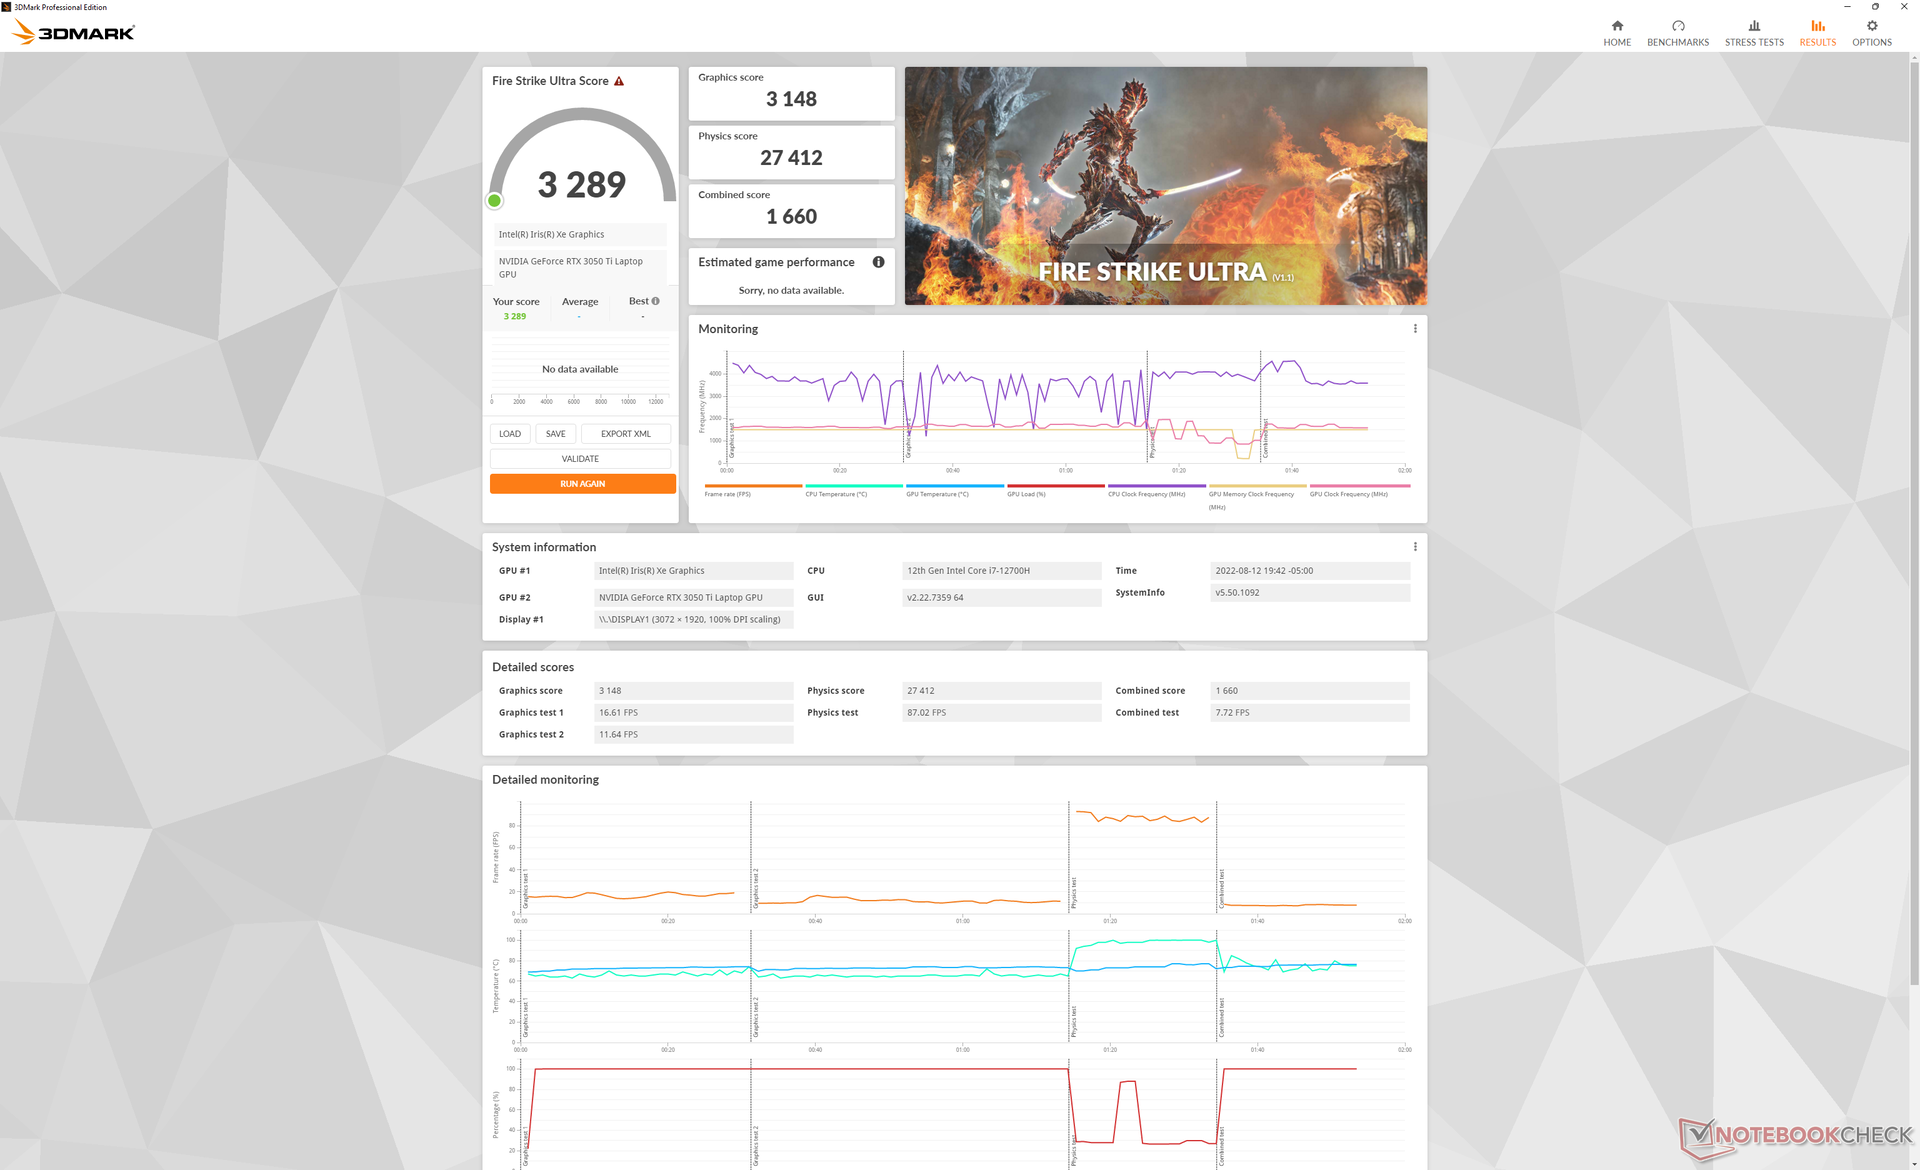
| 3DMark 11 Performance | 18923 poäng | |
| 3DMark Cloud Gate Standard Score | 40737 poäng | |
| 3DMark Fire Strike Score | 12647 poäng | |
| 3DMark Time Spy Score | 5835 poäng | |
Hjälp | ||
| Cyberpunk 2077 1.6 | |
| 1920x1080 Low Preset | |
| Dell Inspiron 16 Plus 7620 | |
| Genomsnitt NVIDIA GeForce RTX 3050 Ti Laptop GPU (48.2 - 81.9, n=9) | |
| Lenovo Yoga 7 16IAP7 | |
| 1920x1080 Medium Preset | |
| Dell Inspiron 16 Plus 7620 | |
| Genomsnitt NVIDIA GeForce RTX 3050 Ti Laptop GPU (47.4 - 67.4, n=9) | |
| Lenovo Yoga 7 16IAP7 | |
| 1920x1080 High Preset | |
| Dell Inspiron 16 Plus 7620 | |
| Genomsnitt NVIDIA GeForce RTX 3050 Ti Laptop GPU (39 - 51.5, n=9) | |
| Lenovo Yoga 7 16IAP7 | |
| 1920x1080 Ultra Preset | |
| Genomsnitt NVIDIA GeForce RTX 3050 Ti Laptop GPU (31 - 50.5, n=9) | |
| Dell Inspiron 16 Plus 7620 | |
| Lenovo Yoga 7 16IAP7 | |
| 2560x1440 Ultra Preset | |
| Dell Inspiron 16 Plus 7620 | |
| Genomsnitt NVIDIA GeForce RTX 3050 Ti Laptop GPU (20 - 25, n=4) | |
Witcher 3 FPS Chart
| låg | med. | hög | ultra | QHD | |
|---|---|---|---|---|---|
| GTA V (2015) | 181.7 | 176.1 | 148.7 | 75.4 | 53.4 |
| The Witcher 3 (2015) | 297.3 | 183 | 108.4 | 57 | |
| Dota 2 Reborn (2015) | 171.8 | 157.5 | 148 | 140.7 | |
| Final Fantasy XV Benchmark (2018) | 138.9 | 77.7 | 54.1 | 38.1 | |
| X-Plane 11.11 (2018) | 132.5 | 115.6 | 92.8 | ||
| Strange Brigade (2018) | 307 | 138.3 | 110.2 | 95.2 | 69.1 |
| Cyberpunk 2077 1.6 (2022) | 79.5 | 66.2 | 47.9 | 39.5 | 23.4 |
Utsläpp - skulle kunna vara tystare
Systembrus
Ljudet från fläktarna är ständigt närvarande eftersom båda fläktarna aldrig riktigt är på tomgång, även när de sitter på skrivbordet utan pågående program. När den är som tystast kan vi registrera ett ljud på 25,7 dB(A) mot en tyst bakgrund på 23,3 dB(A) även när den är inställd på strömprofilen "Quiet". Dessutom tar det ett tag innan fläktljudet lugnar ner sig igen efter att ha kört hög belastning som spel. Efter att ha stängt Witcher 3, till exempel, förblev fläktarna högljudda i flera minuter efteråt.
Fläktljudet stabiliserades vid 49,2 dB(A) när följande körs Witcher 3 i läget Ultra Performance eller 46,1 dB(A) i läget Balanced, vilket är högre än Vivobook Pro 16X med samma RTX 3050 Ti GPU. Det höga 40 dB(A)-intervallet har mer gemensamt med bärbara speldatorer med hög effekt än andra bärbara multimediadatorer.
Ljudnivå
| Låg belastning |
| 25.7 / 26.1 / 30.6 dB(A) |
| Hög belastning |
| 46.2 / 49.4 dB(A) |
 | ||
30 dB tyst 40 dB(A) hörbar 50 dB(A) högt ljud |
||
min: | ||
| Dell Inspiron 16 Plus 7620 GeForce RTX 3050 Ti Laptop GPU, i7-12700H, Kioxia BG5 KBG50ZNS512G | Dell Inspiron 16 Plus 7610 GeForce RTX 3050 4GB Laptop GPU, i7-11800H, Kingston OM3PDP3512B | Lenovo Yoga 7 16IAP7 Iris Xe G7 96EUs, i7-1260P, Micron 2450 512GB MTFDKCD512TFK | Huawei MateBook D 16 2022 Iris Xe G7 96EUs, i7-12700H, Silicon Motion PCIe-8 SSD | Acer Swift X SFX16-51G-5388 GeForce RTX 3050 4GB Laptop GPU, i5-11320H, Samsung PM991 MZVLQ512HBLU | Asus Vivobook Pro 16X-M7600QE GeForce RTX 3050 Ti Laptop GPU, R9 5900HX, SK Hynix HFM001TD3JX013N | |
|---|---|---|---|---|---|---|
| Noise | 3% | 14% | 8% | 3% | 1% | |
| av / miljö * (dB) | 23.3 | 24.4 -5% | 23.6 -1% | 24.2 -4% | 25.4 -9% | 26 -12% |
| Idle Minimum * (dB) | 25.7 | 24.4 5% | 23.6 8% | 24.2 6% | 25.4 1% | 27 -5% |
| Idle Average * (dB) | 26.1 | 24.4 7% | 23.6 10% | 25.8 1% | 25.4 3% | 27 -3% |
| Idle Maximum * (dB) | 30.6 | 24.4 20% | 23.6 23% | 30.5 -0% | 27.8 9% | 27.5 10% |
| Load Average * (dB) | 46.2 | 48.3 -5% | 37.7 18% | 39.8 14% | 41 11% | 41.7 10% |
| Witcher 3 ultra * (dB) | 49.2 | 48.9 1% | 40 19% | 39.8 19% | ||
| Load Maximum * (dB) | 49.4 | 48.9 1% | 40.2 19% | 39.8 19% | 47 5% | 45.3 8% |
* ... mindre är bättre
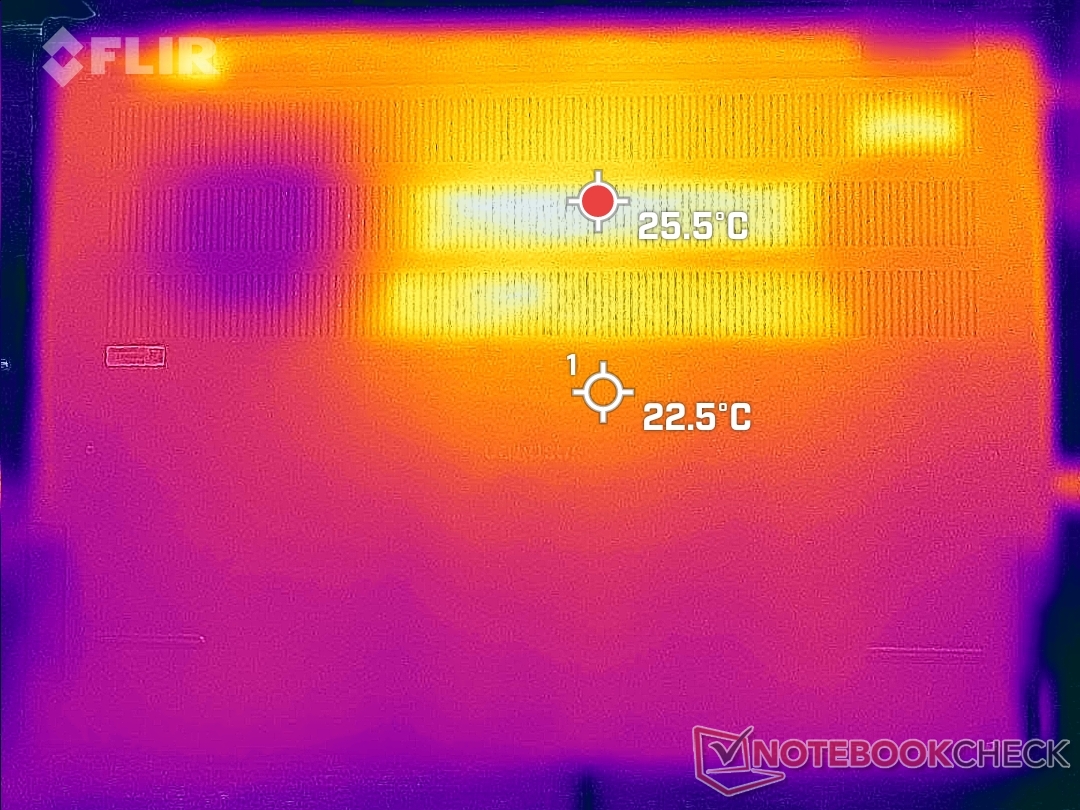
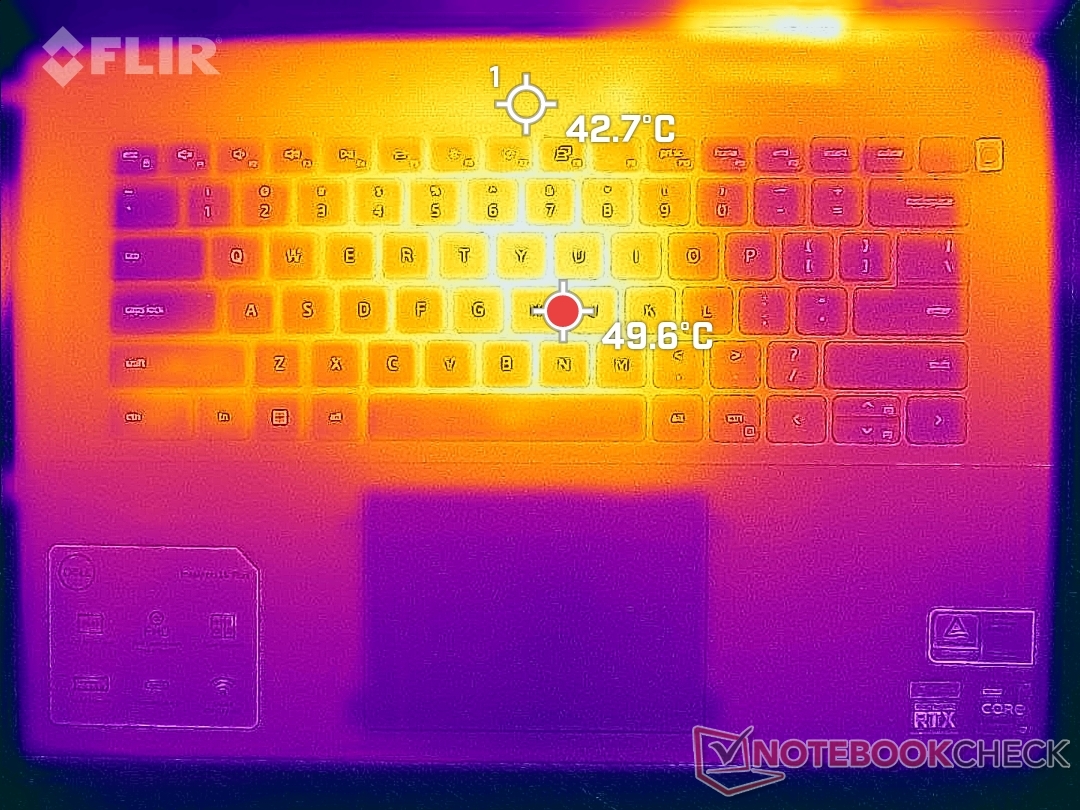
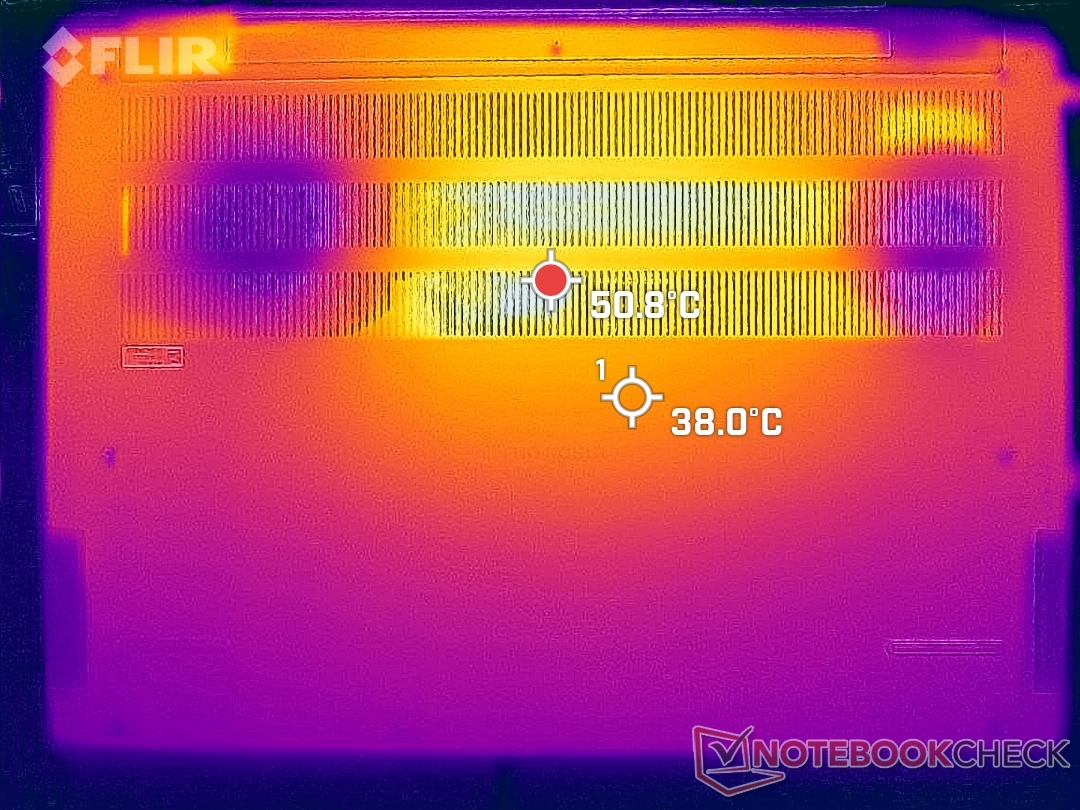
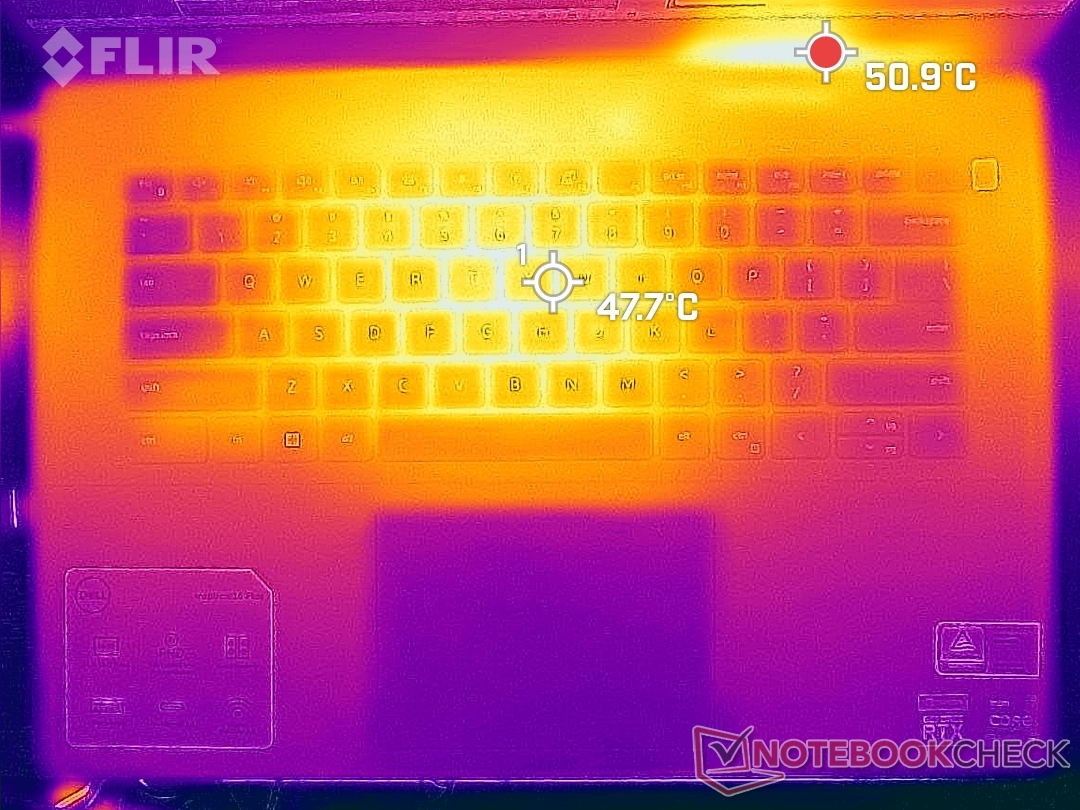
Temperatur
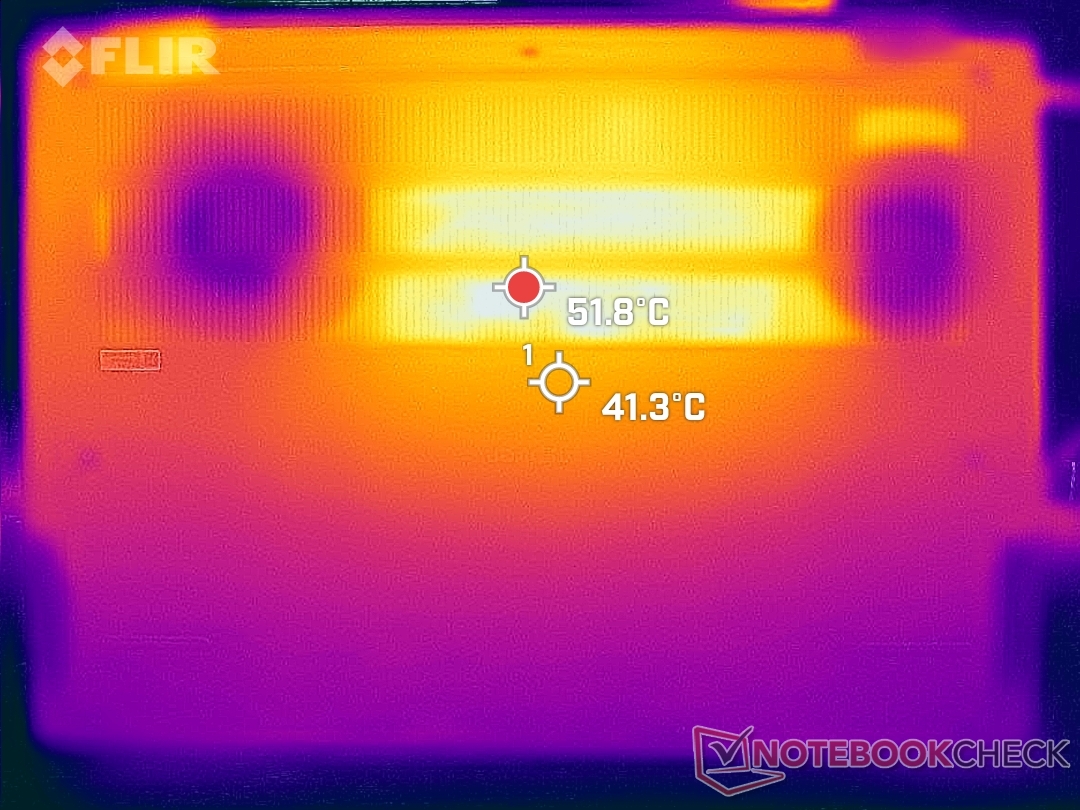
De heta punkterna finns i mitten av tangentbordet där temperaturen kan nå 50 C när du kör höga belastningar som spel. Andra bärbara 16-tumsdatorer som t.ex Asus Vivobook Pro 16X, Lenovo Yoga 7 och till och med den äldre Inspiron 16 7610 är svalare med mer än några grader vid liknande belastning. Handflatorna kan också vara varmare än väntat med 30 C jämfört med det vanligare mitten av 20 C. Inspiron 16 Plus 7620 är definitivt mer av en bärbar dator för skrivbord än en bärbar dator för knäbäddning.
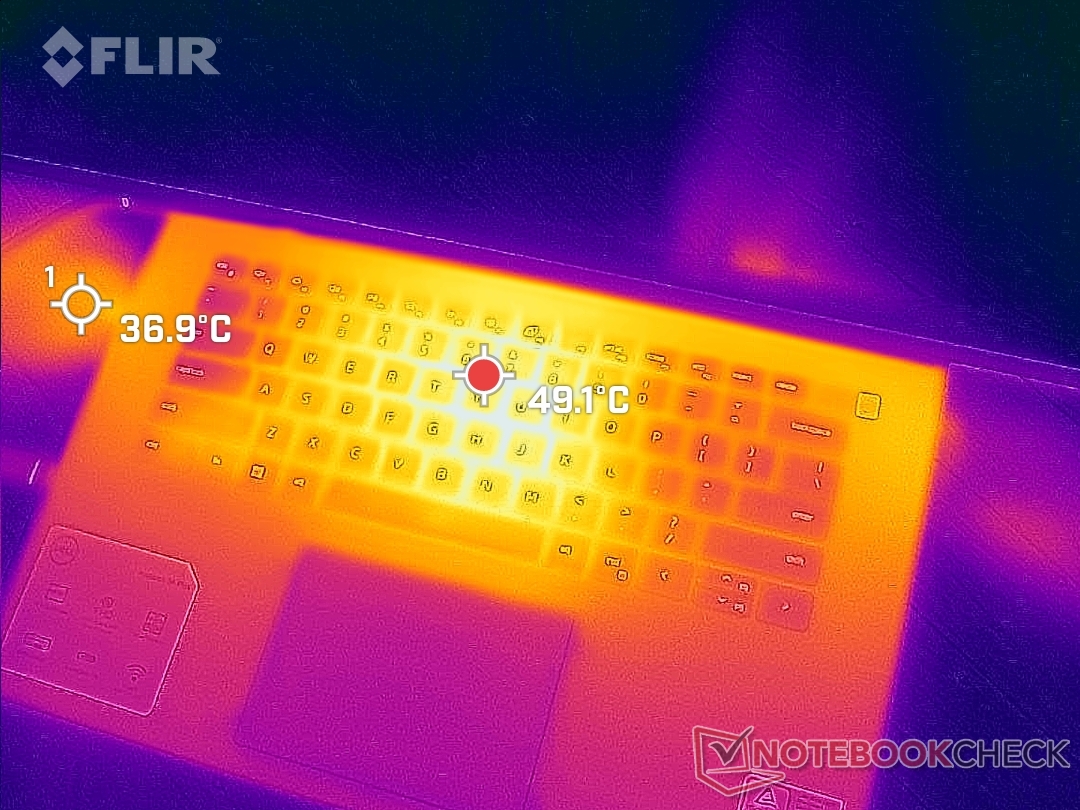
(-) Den maximala temperaturen på ovansidan är 46 °C / 115 F, jämfört med genomsnittet av 36.8 °C / 98 F , allt från 21 till 71 °C för klassen Multimedia.
(-) Botten värms upp till maximalt 45.8 °C / 114 F, jämfört med genomsnittet av 39.1 °C / 102 F
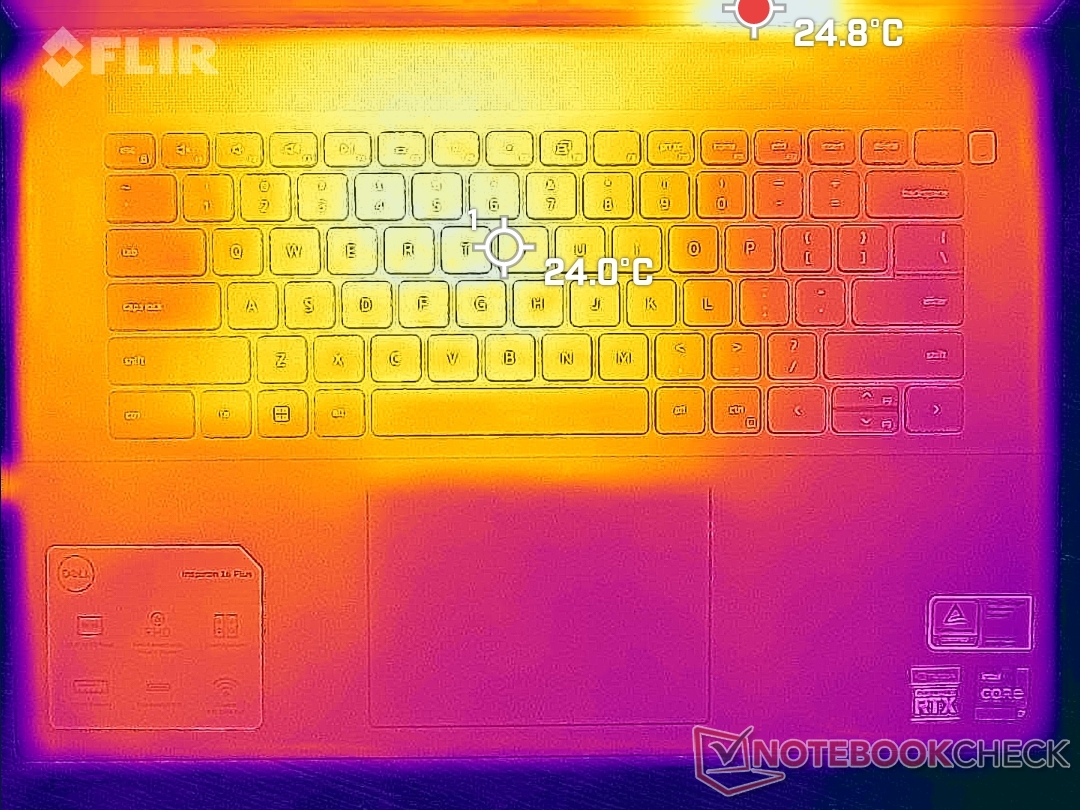
(+) Vid tomgångsbruk är medeltemperaturen för ovansidan 26.8 °C / 80 F, jämfört med enhetsgenomsnittet på 31.3 °C / ### class_avg_f### F.
(±) När du spelar The Witcher 3 är medeltemperaturen för ovansidan 36.8 °C / 98 F, jämfört med enhetsgenomsnittet på 31.3 °C / ## #class_avg_f### F.
(+) Handledsstöden och pekplattan är kallare än hudtemperaturen med maximalt 30.6 °C / 87.1 F och är därför svala att ta på.
(±) Medeltemperaturen för handledsstödsområdet på liknande enheter var 28.7 °C / 83.7 F (-1.9 °C / -3.4 F).
| Dell Inspiron 16 Plus 7620 Intel Core i7-12700H, NVIDIA GeForce RTX 3050 Ti Laptop GPU | Dell Inspiron 16 Plus 7610 Intel Core i7-11800H, NVIDIA GeForce RTX 3050 4GB Laptop GPU | Lenovo Yoga 7 16IAP7 Intel Core i7-1260P, Intel Iris Xe Graphics G7 96EUs | Huawei MateBook D 16 2022 Intel Core i7-12700H, Intel Iris Xe Graphics G7 96EUs | Acer Swift X SFX16-51G-5388 Intel Core i5-11320H, NVIDIA GeForce RTX 3050 4GB Laptop GPU | Asus Vivobook Pro 16X-M7600QE AMD Ryzen 9 5900HX, NVIDIA GeForce RTX 3050 Ti Laptop GPU | |
|---|---|---|---|---|---|---|
| Heat | -12% | 24% | 3% | -6% | 9% | |
| Maximum Upper Side * (°C) | 46 | 46.4 -1% | 39 15% | 41.8 9% | 52.4 -14% | 39.4 14% |
| Maximum Bottom * (°C) | 45.8 | 54.8 -20% | 34.2 25% | 47.3 -3% | 50 -9% | 43.6 5% |
| Idle Upper Side * (°C) | 29.2 | 31.4 -8% | 21.2 27% | 28.3 3% | 30.3 -4% | 27.6 5% |
| Idle Bottom * (°C) | 31 | 36.6 -18% | 21.6 30% | 30.2 3% | 30.4 2% | 27.5 11% |
* ... mindre är bättre
Stresstest
När Prime95 stress körs når processorn 3,5 GHz och 80 W under de första 15 sekunderna tills kärntemperaturen når 90 C. Därefter sjunker klockfrekvensen och strömförbrukningen på kortet gradvis innan den stabiliseras på 2,3 GHz respektive 50 W för att upprätthålla en kärntemperatur på 86 C. Om samma test utförs på 2021-modellen får man något lägre kärntemperaturer och en strömförbrukning på 83 C respektive 45 W på kortet.
GPU:s klockfrekvens, temperatur och strömförbrukning på kortet stabiliseras vid 1627 MHz, 85 C respektive 64 W vid körning Witcher 3 jämfört med 1837 MHz, 69 C och 63 W på Inspiron 16 Plus 7610. Det råder ingen tvekan om att processorerna i 2022-modellen körs varmare för att ge högre prestandanivåer.
Att köra på batteri begränsar prestandan även om den är inställd på Ultra Performance-läget. Ett 3DMark 11-test på batterier skulle ge fysik- och grafikresultat på 10252 respektive 8609 poäng, jämfört med 22210 respektive 18923 poäng när det är på strömförsörjning.
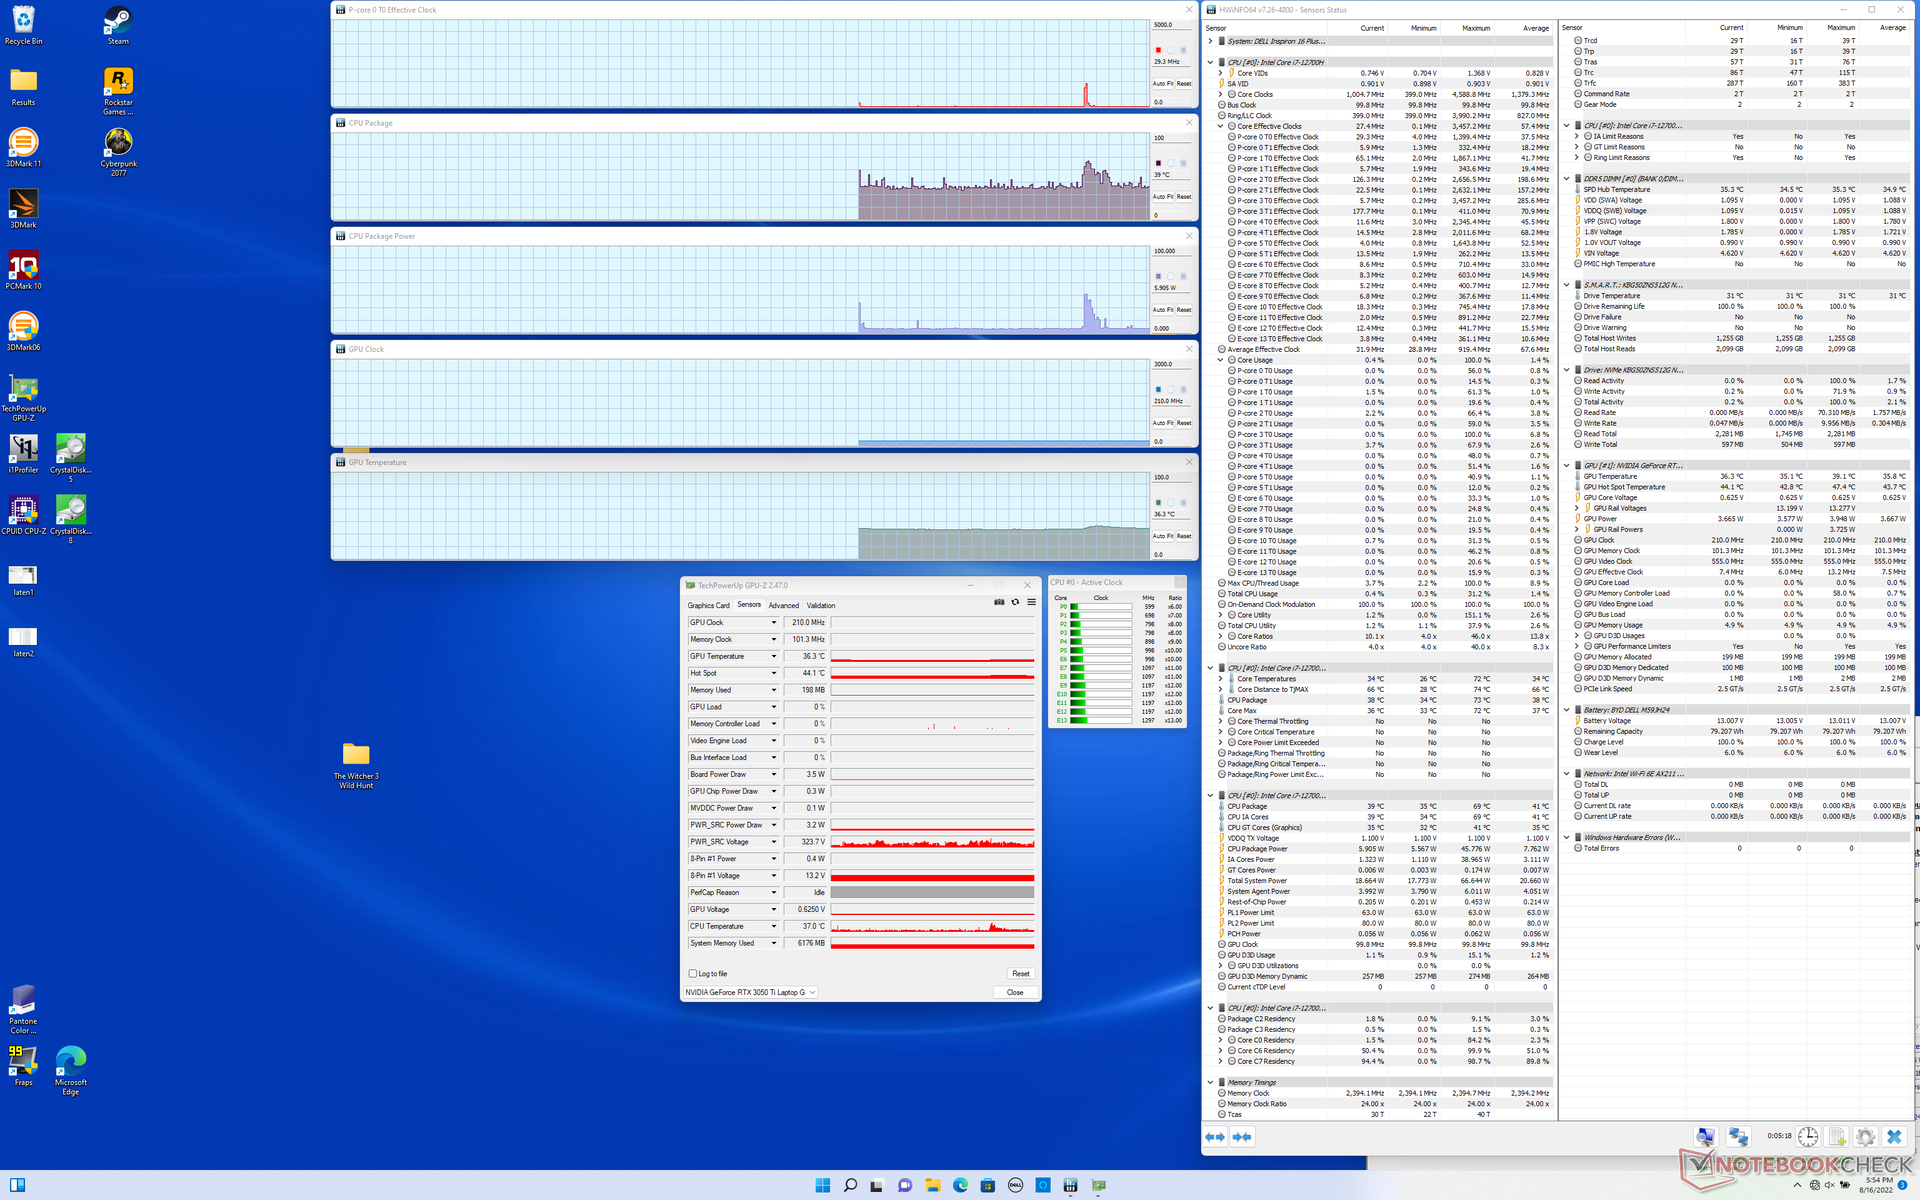
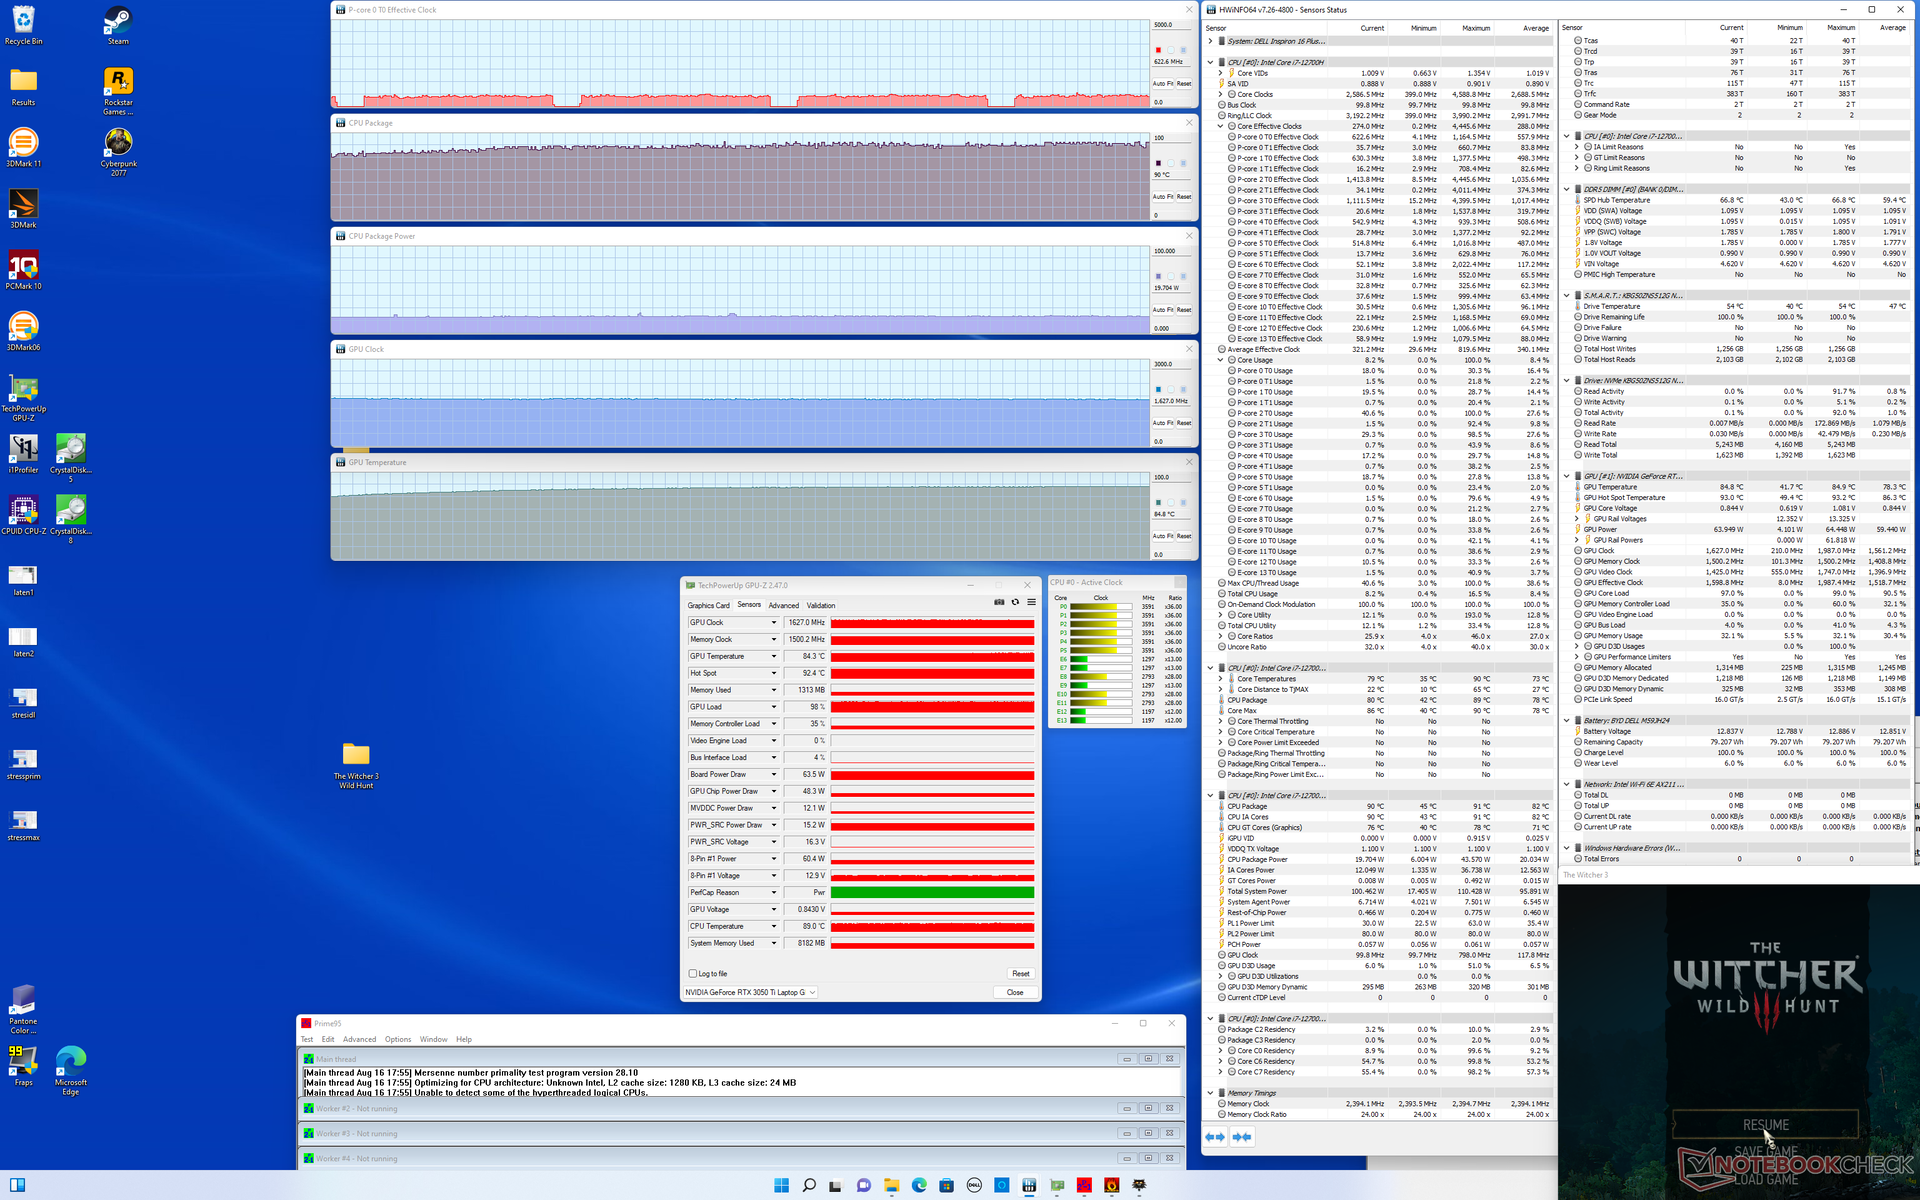
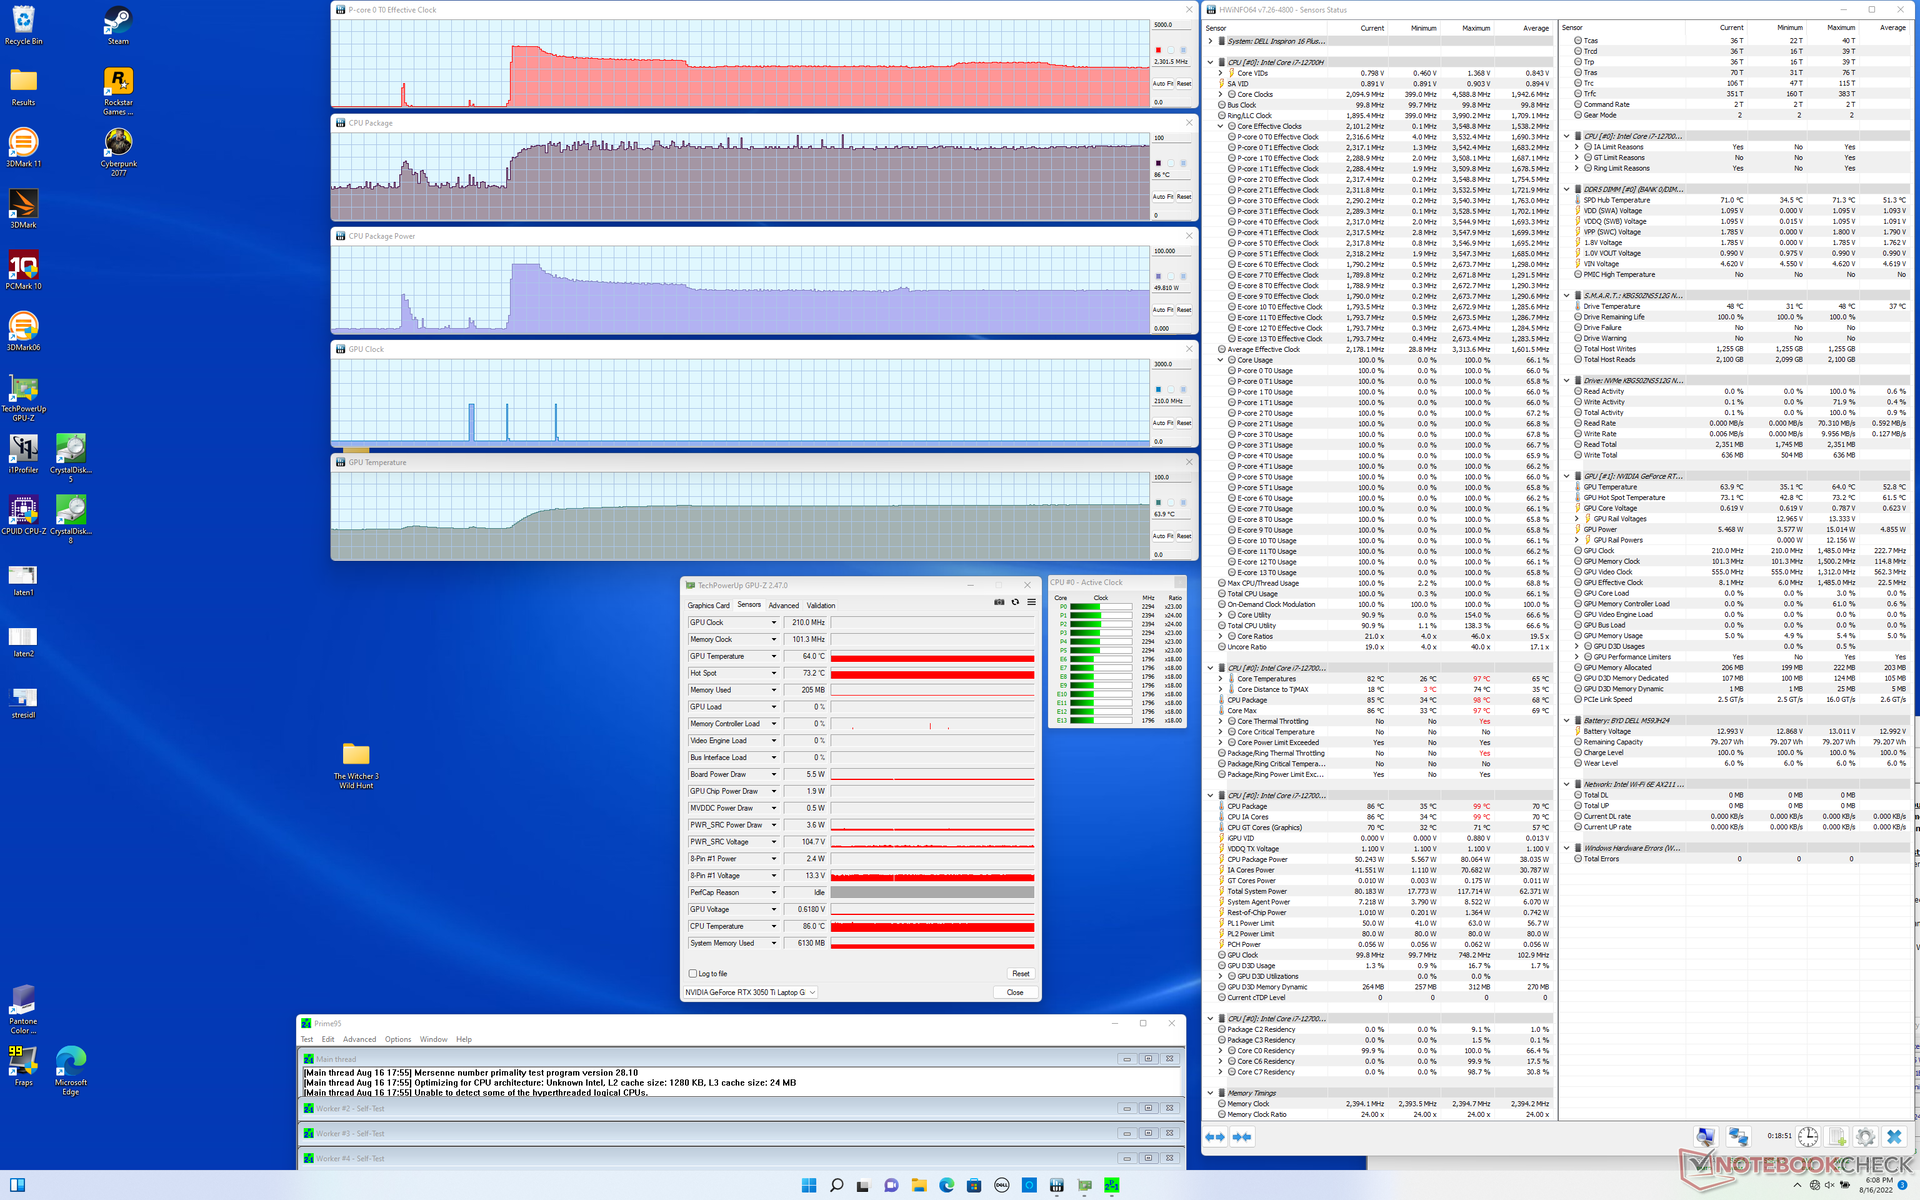
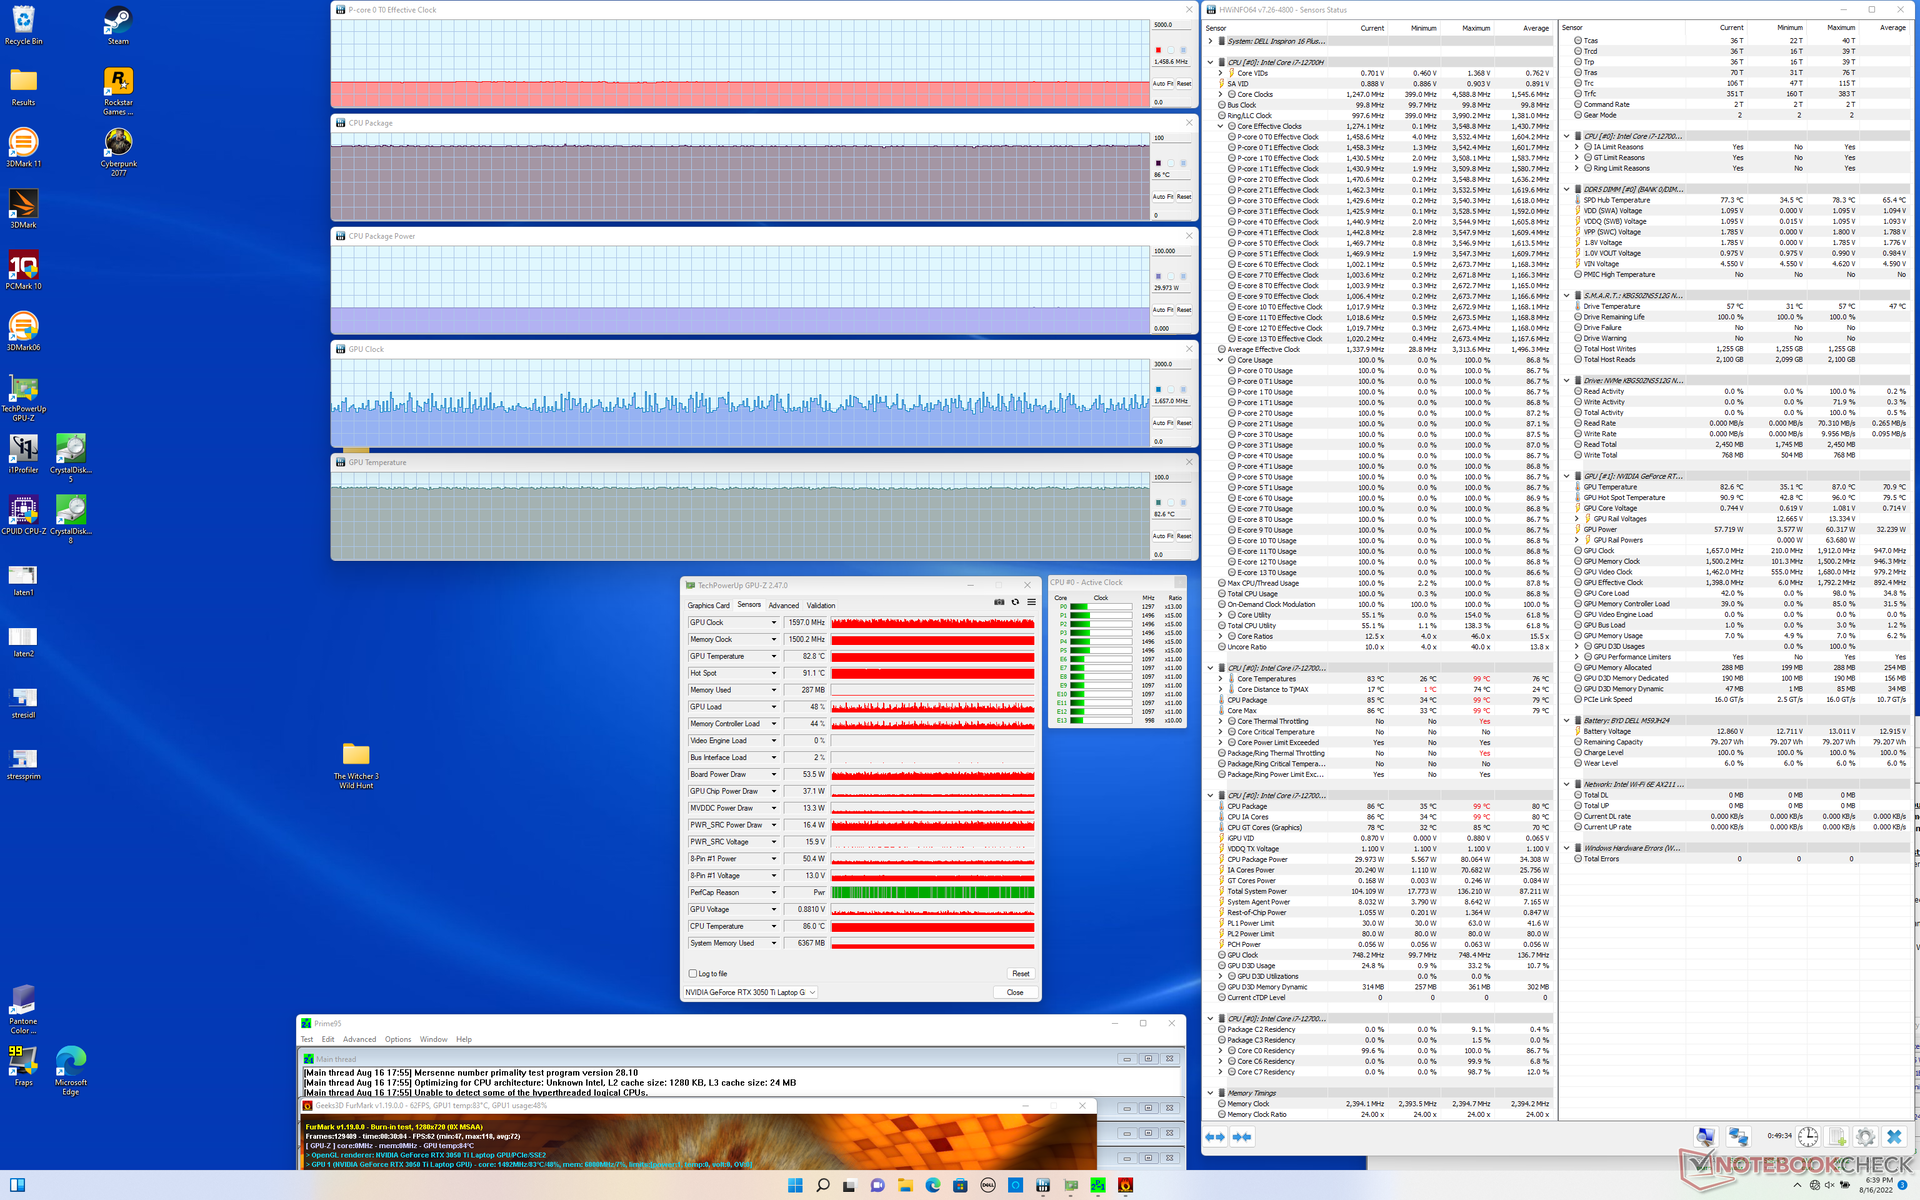
| CPU-klocka (GHz) | GPU-klocka (MHz) | Genomsnittlig CPU-temperatur (°C) | Genomsnittlig GPU-temperatur (°C) | |
| Systemets tomgång | -- | -- | 39 | 36 |
| Prime95 Stress | 2.3 | -- | 86 | 64 |
| Prime95 + FurMark Stress | 1,5 | ~1597 | 86 | 83 |
| Witcher 3 Stress | ~0,6 | 1627 | 90 | 85 |
Högtalare
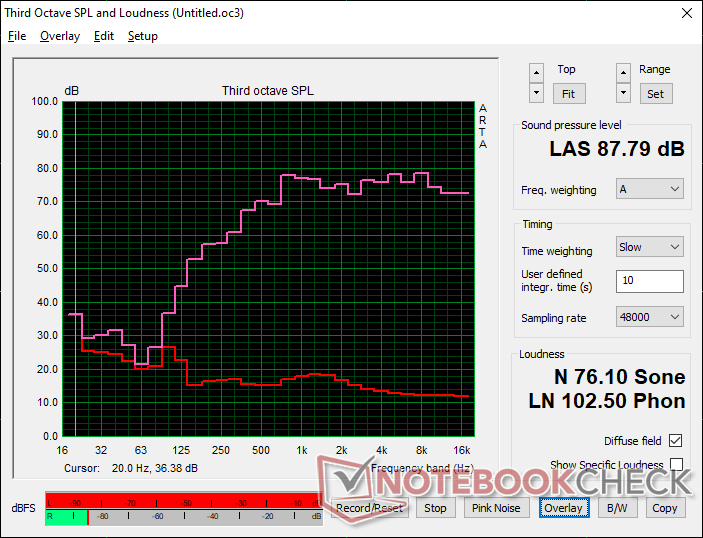
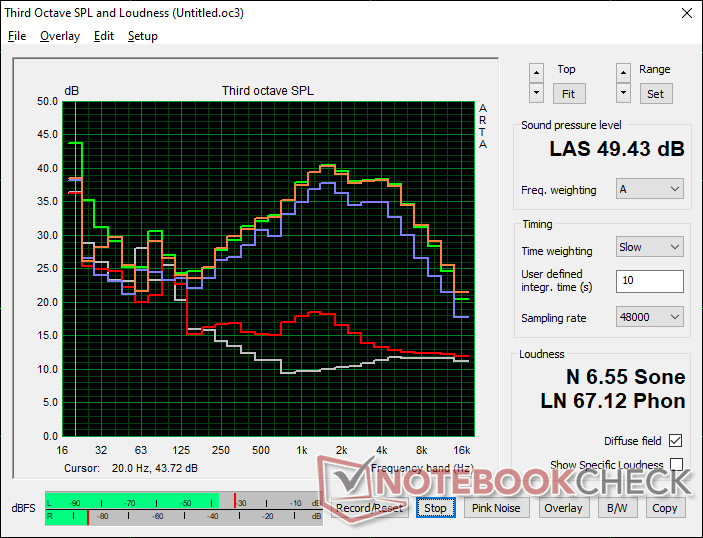
Dell Inspiron 16 Plus 7620 ljudanalys
(+) | högtalare kan spela relativt högt (87.8 dB)
Bas 100 - 315 Hz
(-) | nästan ingen bas - i genomsnitt 22.2% lägre än medianen
(±) | linjäriteten för basen är genomsnittlig (9.7% delta till föregående frekvens)
Mellan 400 - 2000 Hz
(+) | balanserad mellan - endast 3.3% från medianen
(+) | mids är linjära (5.3% delta till föregående frekvens)
Högsta 2 - 16 kHz
(+) | balanserade toppar - endast 2.5% från medianen
(+) | toppar är linjära (4.7% delta till föregående frekvens)
Totalt 100 - 16 000 Hz
(+) | det totala ljudet är linjärt (13.4% skillnad mot median)
Jämfört med samma klass
» 28% av alla testade enheter i den här klassen var bättre, 5% liknande, 68% sämre
» Den bästa hade ett delta på 5%, genomsnittet var 17%, sämst var 45%
Jämfört med alla testade enheter
» 14% av alla testade enheter var bättre, 4% liknande, 82% sämre
» Den bästa hade ett delta på 4%, genomsnittet var 23%, sämst var 134%
Apple MacBook Pro 16 2021 M1 Pro ljudanalys
(+) | högtalare kan spela relativt högt (84.7 dB)
Bas 100 - 315 Hz
(+) | bra bas - bara 3.8% från medianen
(+) | basen är linjär (5.2% delta till föregående frekvens)
Mellan 400 - 2000 Hz
(+) | balanserad mellan - endast 1.3% från medianen
(+) | mids är linjära (2.1% delta till föregående frekvens)
Högsta 2 - 16 kHz
(+) | balanserade toppar - endast 1.9% från medianen
(+) | toppar är linjära (2.7% delta till föregående frekvens)
Totalt 100 - 16 000 Hz
(+) | det totala ljudet är linjärt (4.6% skillnad mot median)
Jämfört med samma klass
» 0% av alla testade enheter i den här klassen var bättre, 0% liknande, 100% sämre
» Den bästa hade ett delta på 5%, genomsnittet var 17%, sämst var 45%
Jämfört med alla testade enheter
» 0% av alla testade enheter var bättre, 0% liknande, 100% sämre
» Den bästa hade ett delta på 4%, genomsnittet var 23%, sämst var 134%
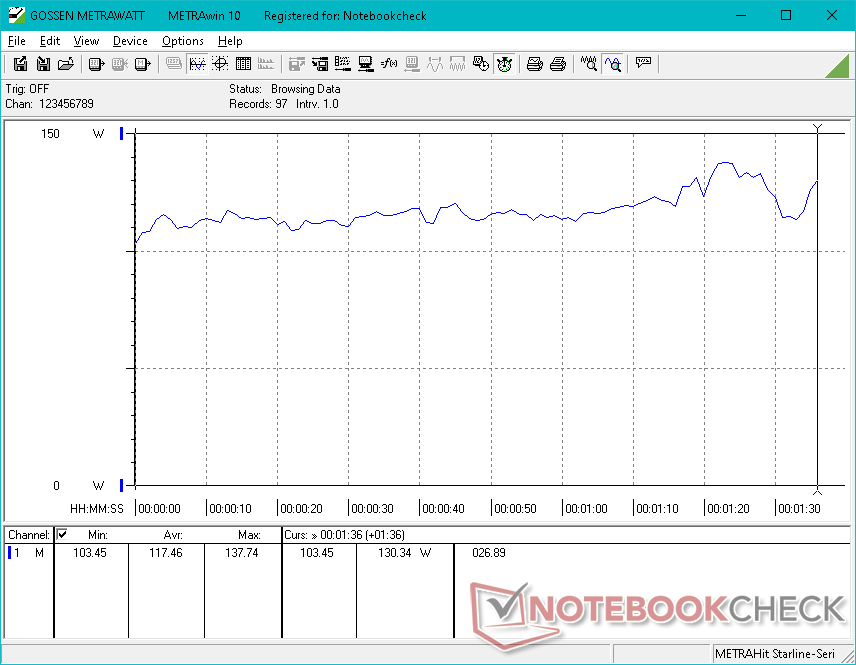
Energihantering - strömkrävande CPU
Effektförbrukning
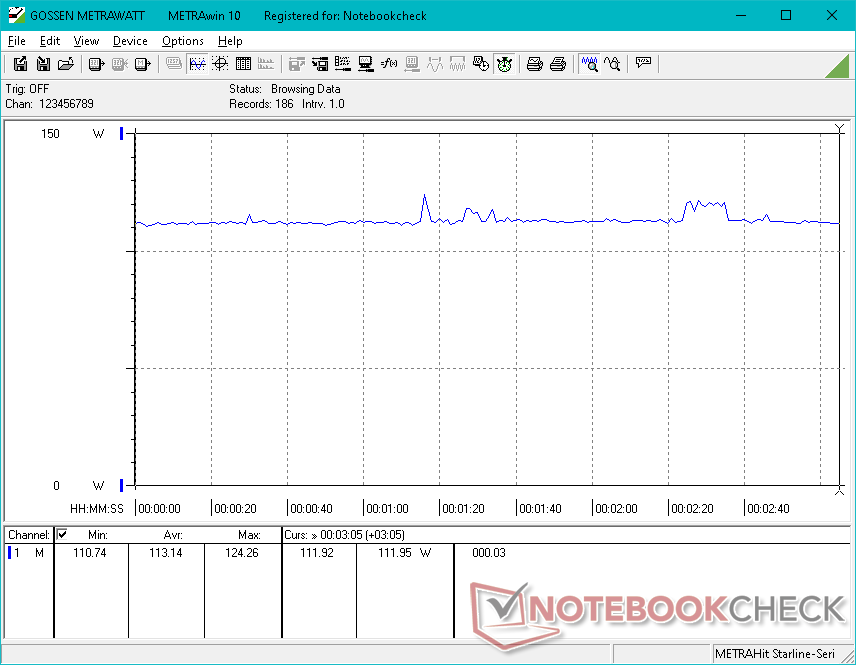
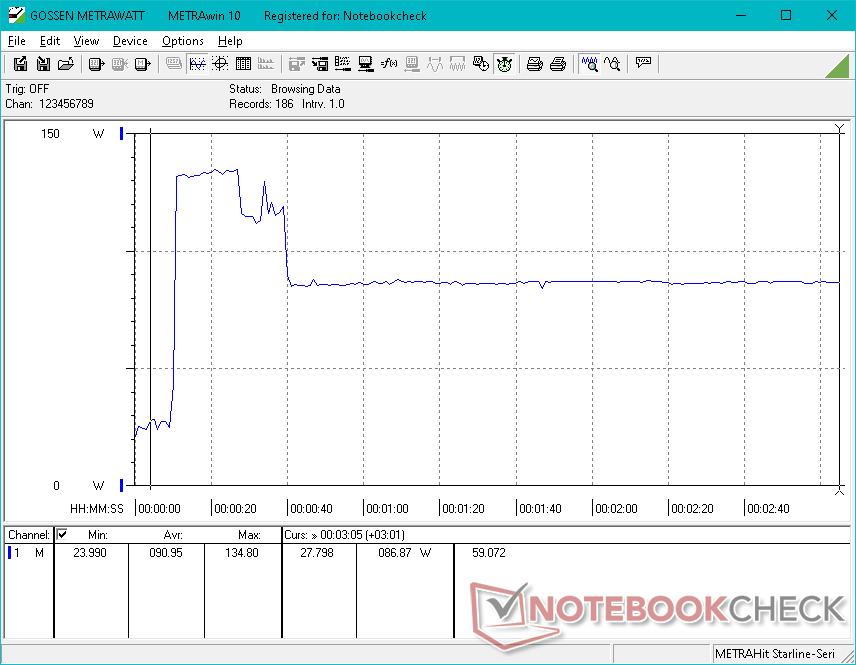
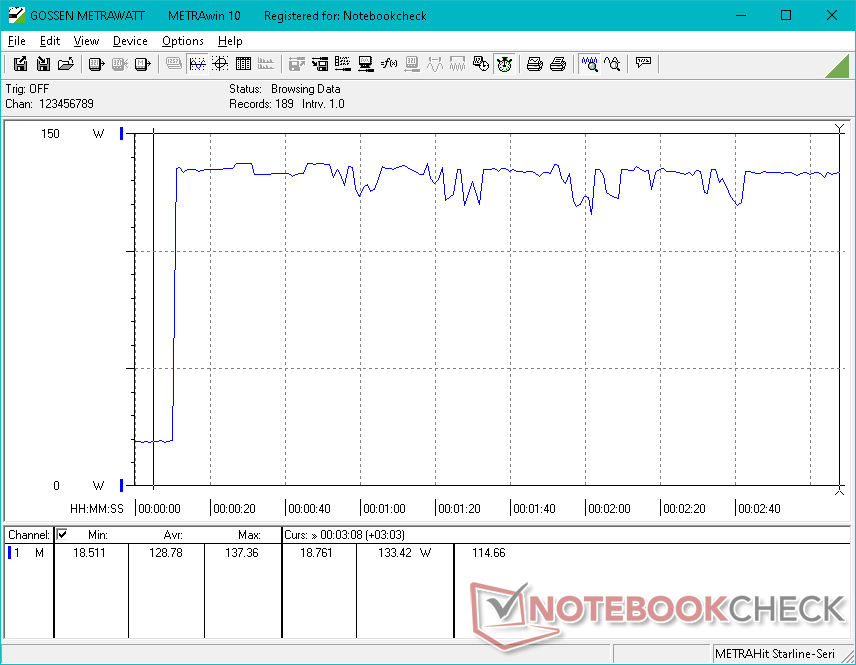
Strömförbrukningen liknar den för 2021-modellen när den är på tomgång på skrivbordet eller när den körs med mycket låg belastning. Vid högre belastning blir 2022-modellen dock mer krävande, särskilt om belastningen är processorintensiv. Körning Witcher 3drar till exempel bara 5 procent mer ström medan Prime95 skulle dra hela 72 procent mer. Den betydligt högre förbrukningen är i linje med de flesta andra bärbara datorer vi hittills har testat som drivs av Alder Lake CPU:er av 12:e generationen
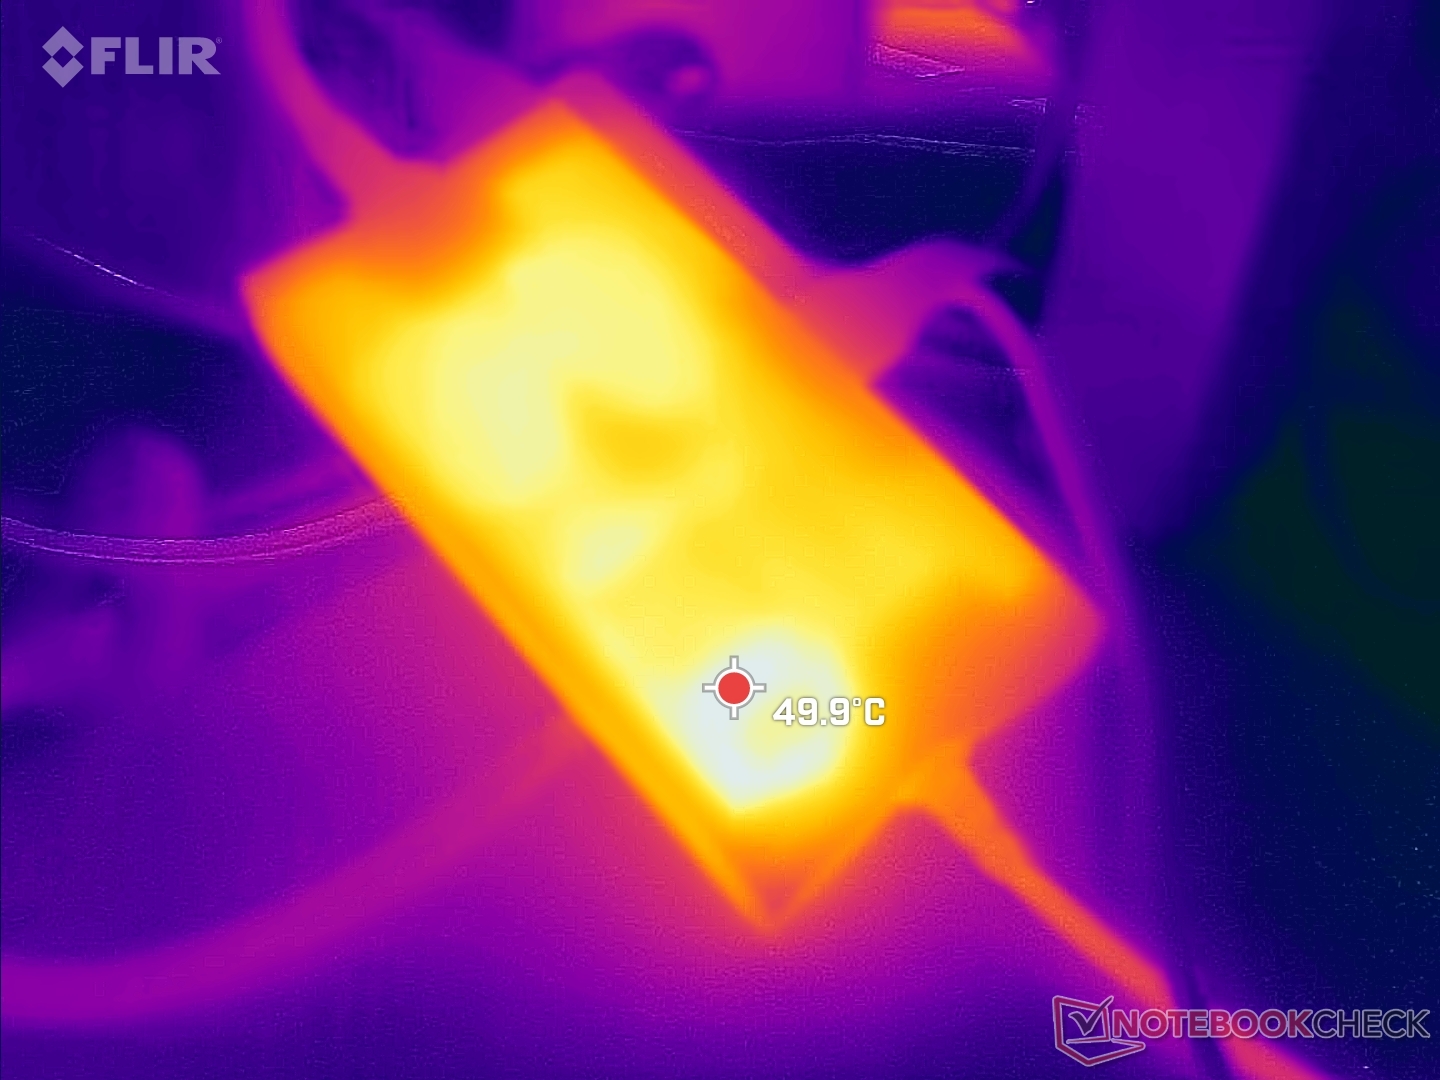
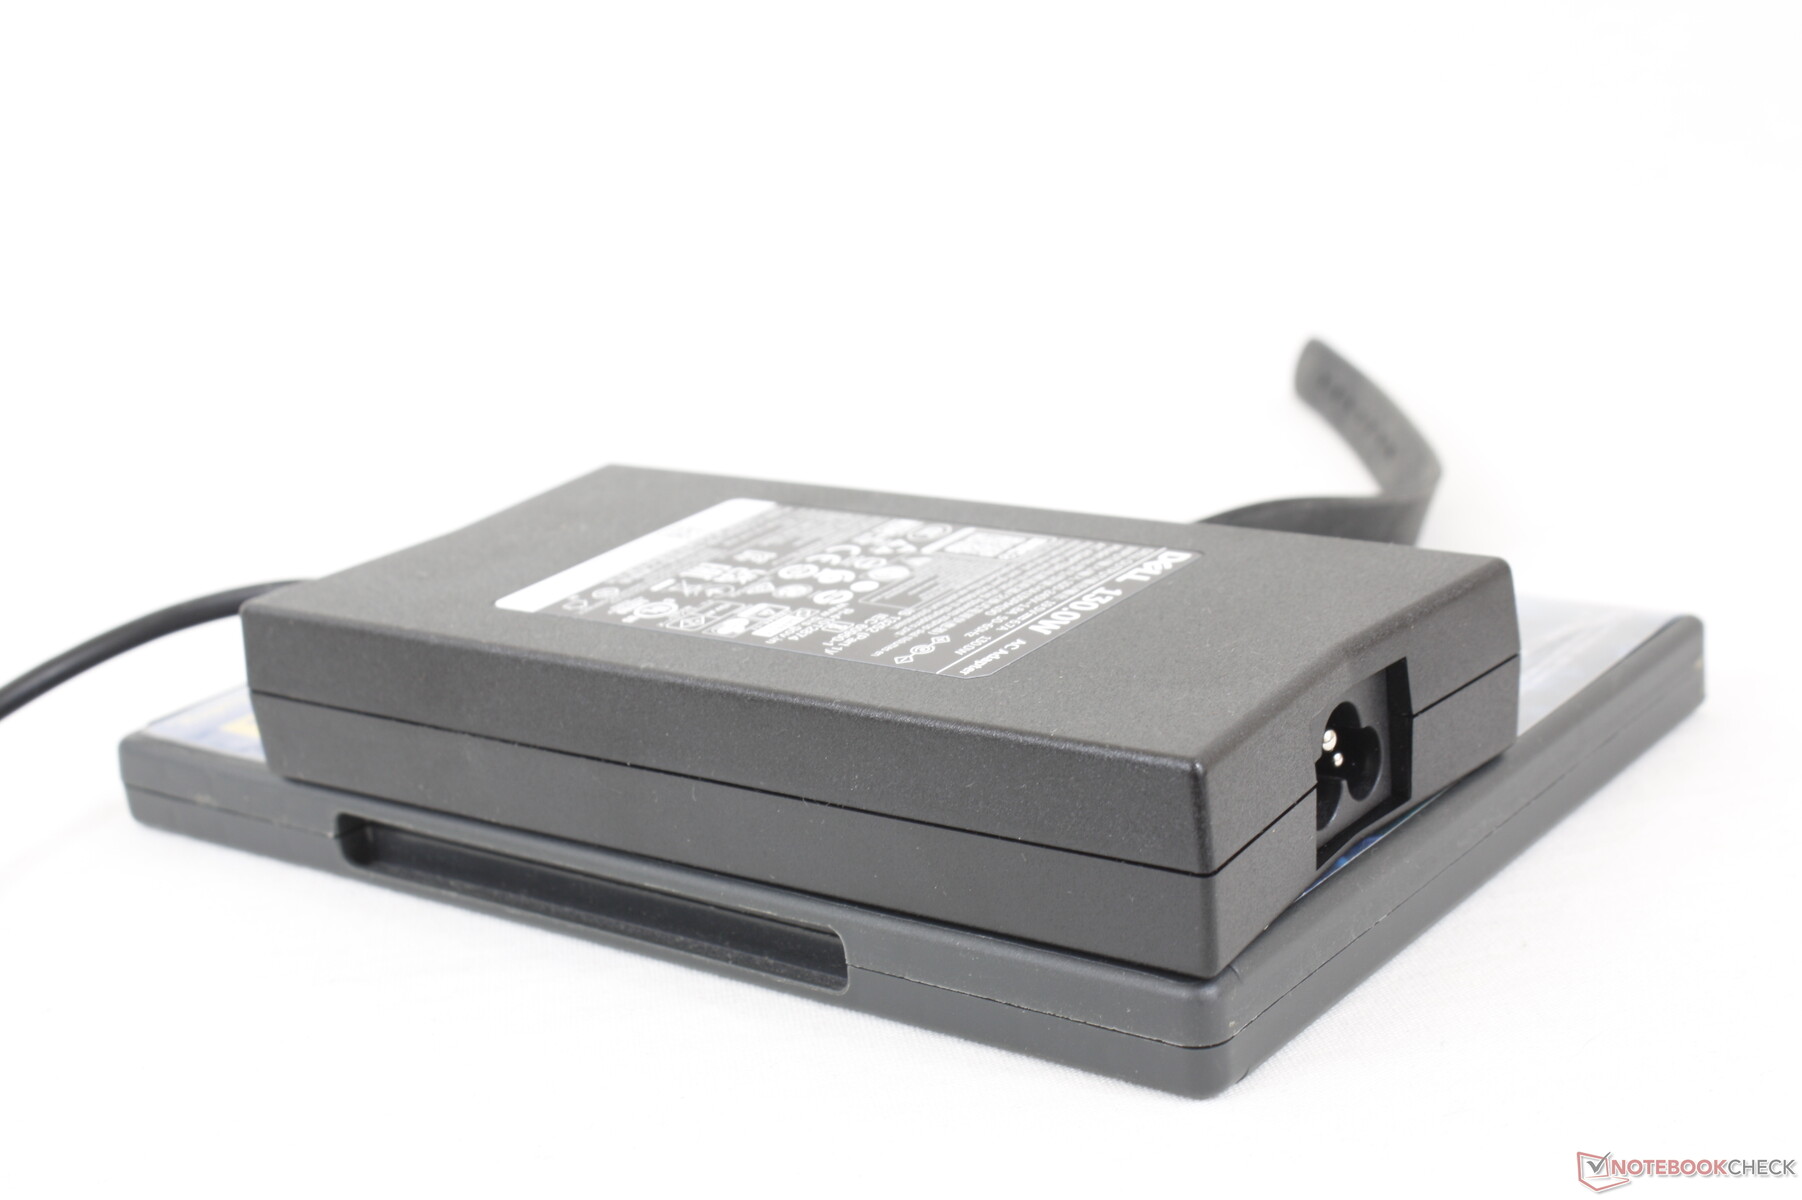
Vi kan registrera ett maximalt uttag på 137 W från den medelstora (~15,3 x 7,5 x 2,6 cm) 130 W AC-adaptern. Dell har inte gjort några ändringar i växelströmsadaptern eller dess nominella kapacitet trots den mer strömkrävande CPU:n.
| Av/Standby | |
| Låg belastning | |
| Hög belastning |
|
Förklaring:
min: | |
| Dell Inspiron 16 Plus 7620 i7-12700H, GeForce RTX 3050 Ti Laptop GPU, Kioxia BG5 KBG50ZNS512G, IPS, 3072x1920, 16" | Dell Inspiron 16 Plus 7610 i7-11800H, GeForce RTX 3050 4GB Laptop GPU, Kingston OM3PDP3512B, IPS, 3072x1920, 16" | Lenovo Yoga 7 16IAP7 i7-1260P, Iris Xe G7 96EUs, Micron 2450 512GB MTFDKCD512TFK, IPS, 2560x1600, 16" | Huawei MateBook D 16 2022 i7-12700H, Iris Xe G7 96EUs, Silicon Motion PCIe-8 SSD, IPS, 1920x1200, 16" | Acer Swift X SFX16-51G-5388 i5-11320H, GeForce RTX 3050 4GB Laptop GPU, Samsung PM991 MZVLQ512HBLU, , 1920x1080, 16.1" | Asus Vivobook Pro 16X-M7600QE R9 5900HX, GeForce RTX 3050 Ti Laptop GPU, SK Hynix HFM001TD3JX013N, OLED, 3840x2400, 16.1" | |
|---|---|---|---|---|---|---|
| Power Consumption | 1% | 35% | 29% | 21% | 1% | |
| Idle Minimum * (Watt) | 6.8 | 7.7 -13% | 6.6 3% | 6.1 10% | 7 -3% | 8.2 -21% |
| Idle Average * (Watt) | 9.6 | 10.7 -11% | 8.3 14% | 10.6 -10% | 10.1 -5% | 16.2 -69% |
| Idle Maximum * (Watt) | 17 | 16.8 1% | 9.8 42% | 11.5 32% | 15 12% | 19.7 -16% |
| Load Average * (Watt) | 117.5 | 100.39 15% | 66 44% | 65.5 44% | 63.3 46% | 65.8 44% |
| Witcher 3 ultra * (Watt) | 113.1 | 108 5% | 52 54% | 61.2 46% | 63.3 44% | 65.6 42% |
| Load Maximum * (Watt) | 137.4 | 129 6% | 67.1 51% | 68.4 50% | 94 32% | 104 24% |
* ... mindre är bättre
Power Consumption Witcher 3 / Stresstest
Power Consumption external Monitor
Batteritid
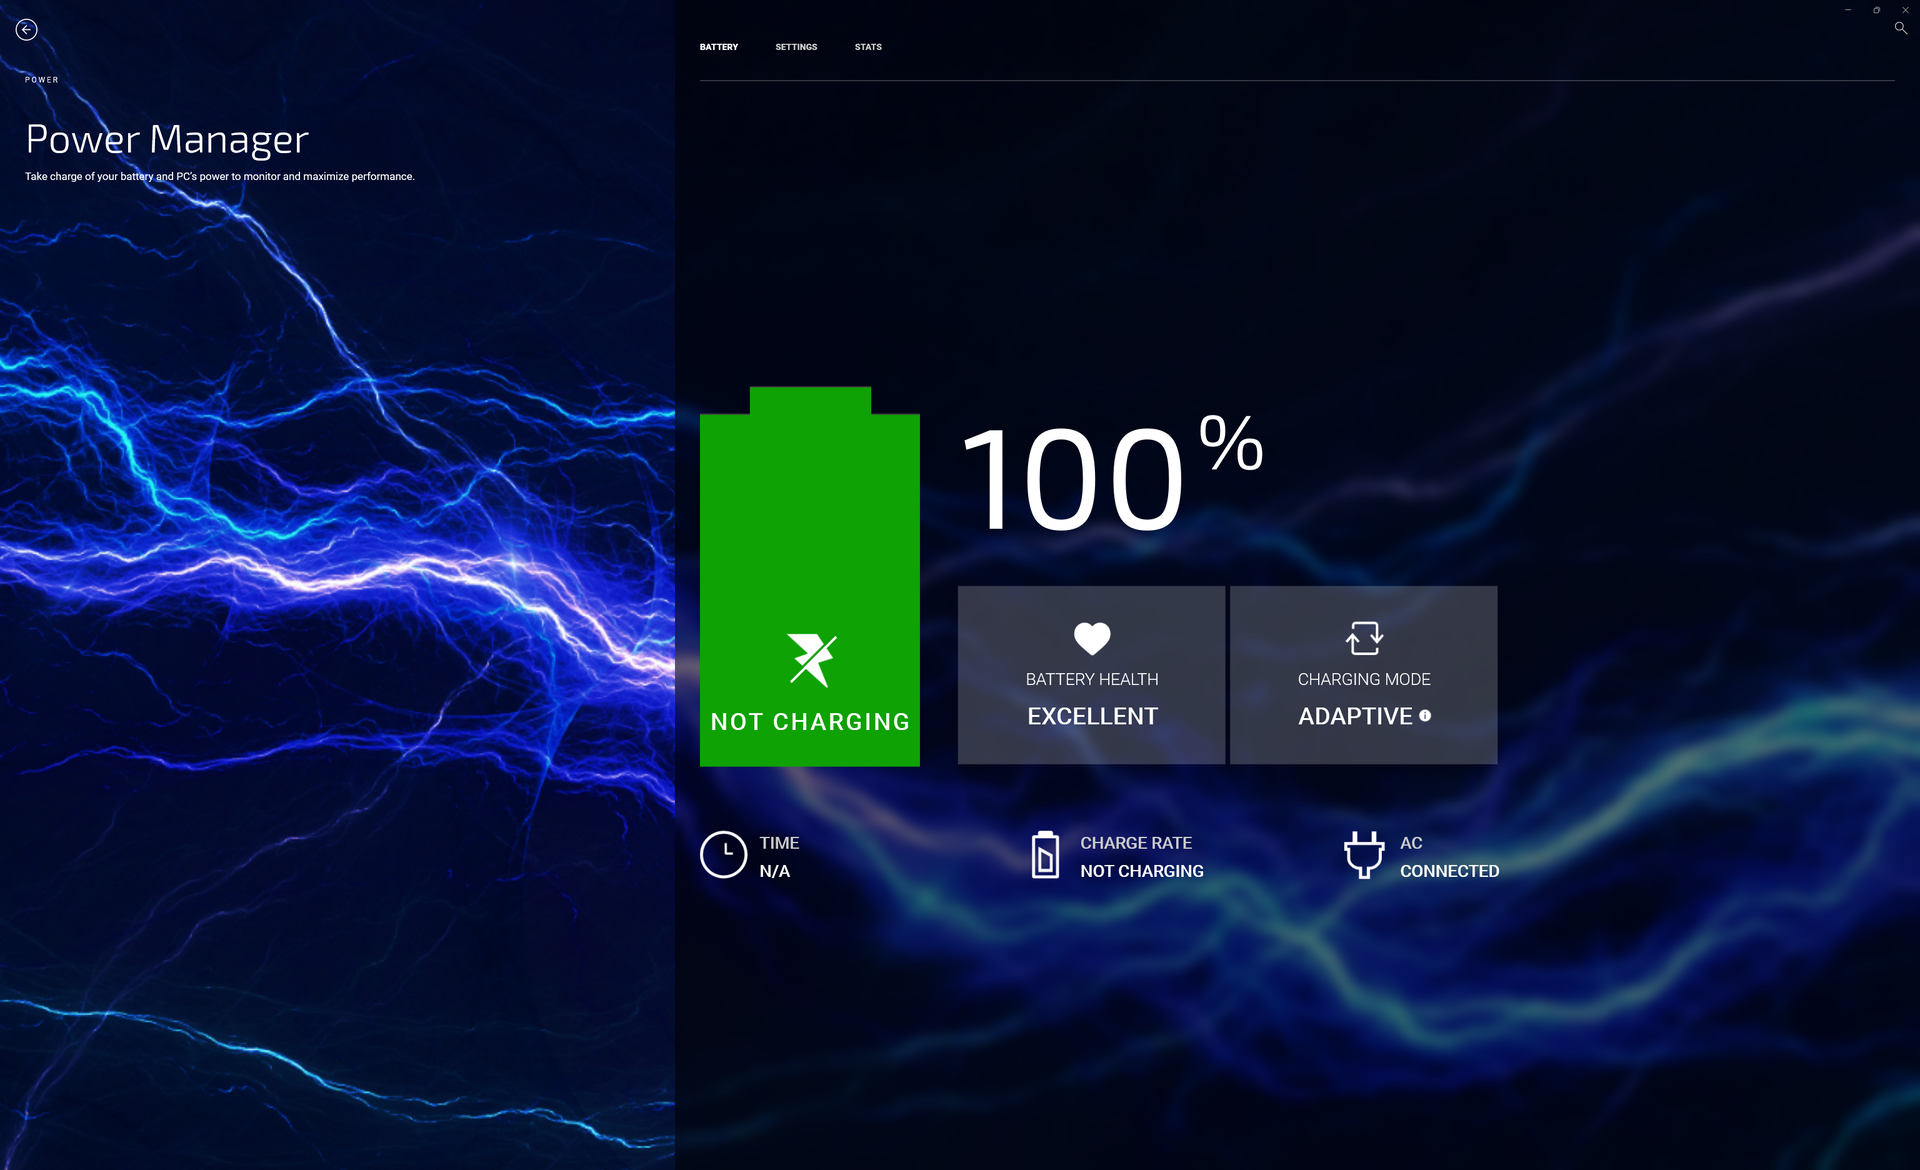
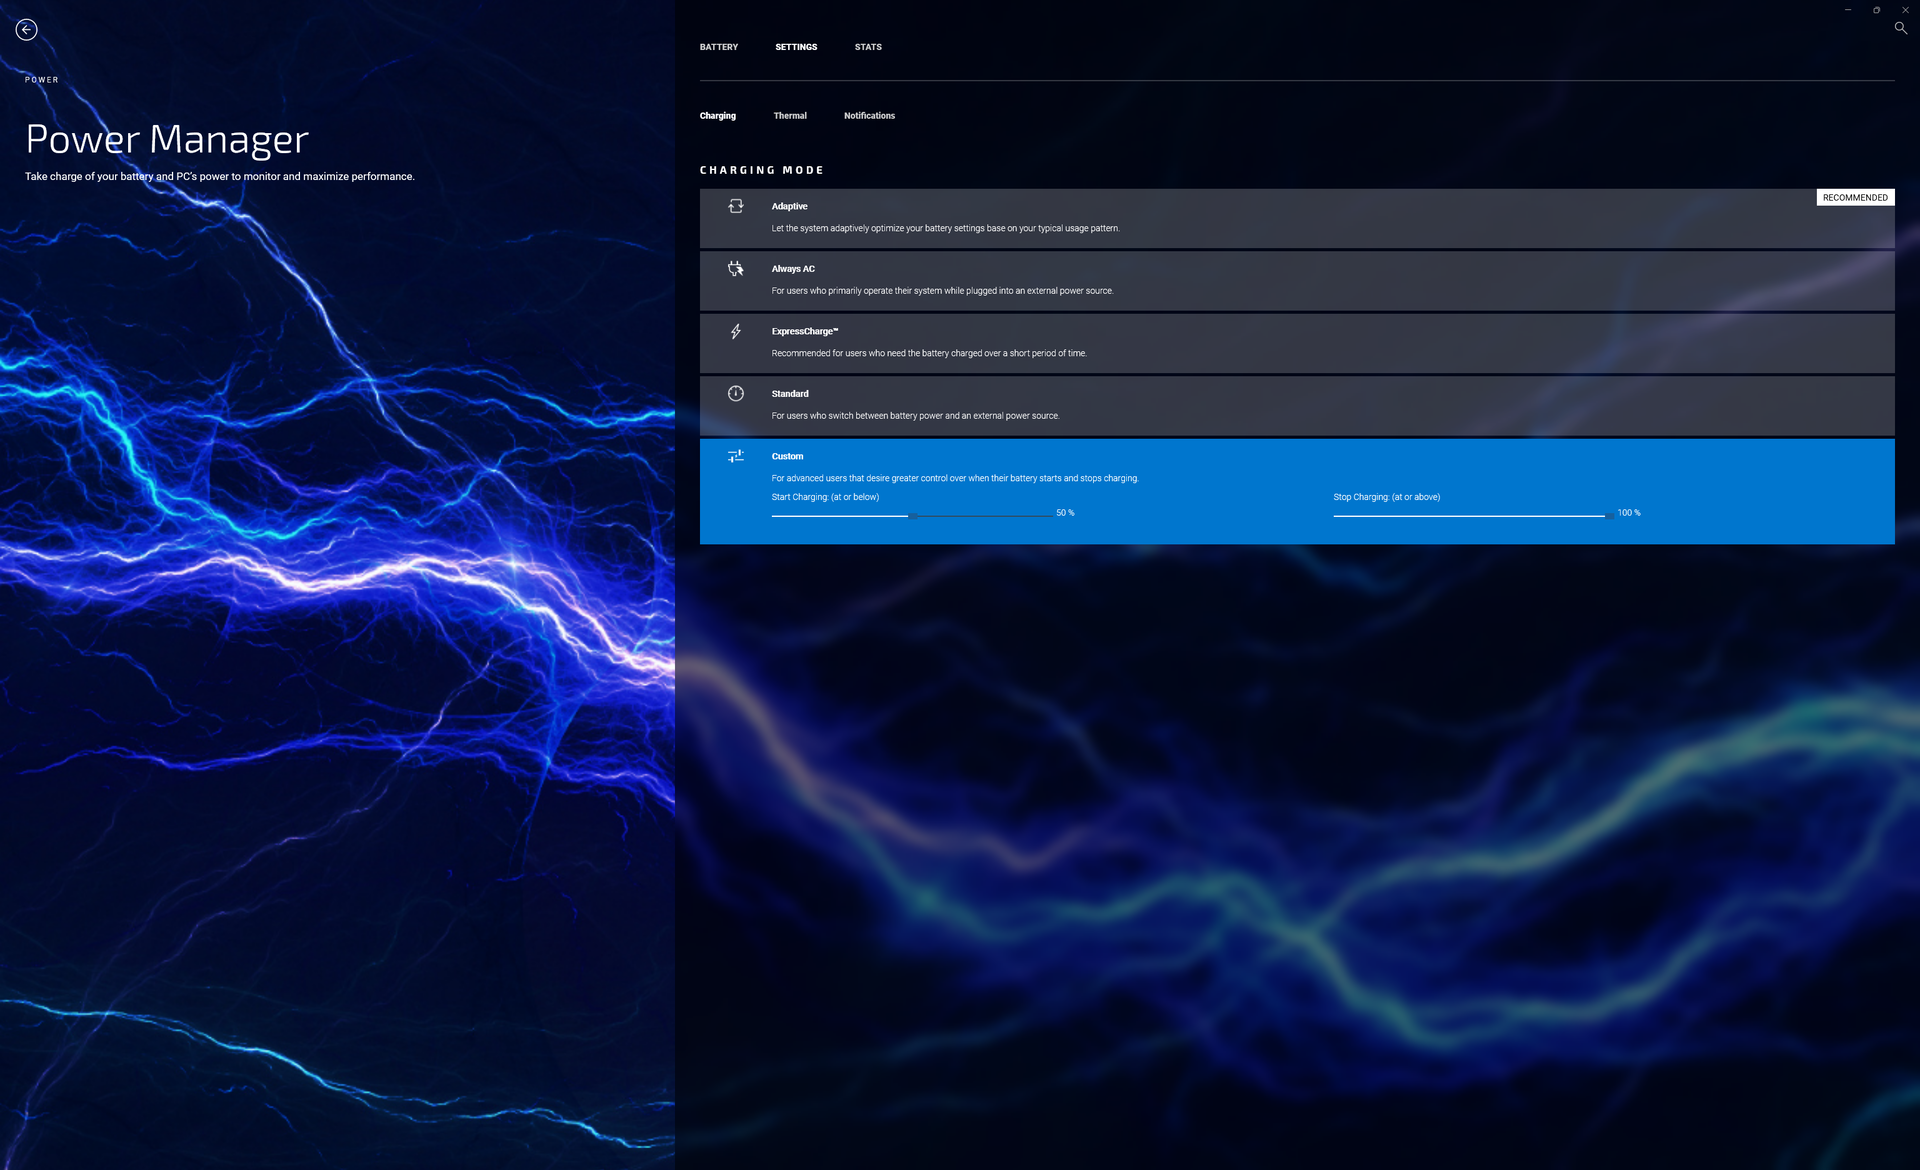
Batterikapaciteten har inte ändrats jämfört med förra årets modell, vilket ger liknande körtider. Användare kan förvänta sig 9,5 timmars verklig WLAN-användning med den balanserade strömprofilen. Ett mindre batterialternativ på 56 Wh finns tillgängligt på vissa SKU:er för en lägre totalvikt.
Laddning från tomt till fullt batteri tar cirka 2 timmar med den medföljande fålliga nätadaptern. Systemet kan också laddas via USB-C-laddare från tredje part.
| Dell Inspiron 16 Plus 7620 i7-12700H, GeForce RTX 3050 Ti Laptop GPU, 86 Wh | Dell Inspiron 16 Plus 7610 i7-11800H, GeForce RTX 3050 4GB Laptop GPU, 86 Wh | Lenovo Yoga 7 16IAP7 i7-1260P, Iris Xe G7 96EUs, 71 Wh | Huawei MateBook D 16 2022 i7-12700H, Iris Xe G7 96EUs, 60 Wh | Acer Swift X SFX16-51G-5388 i5-11320H, GeForce RTX 3050 4GB Laptop GPU, 58.7 Wh | Asus Vivobook Pro 16X-M7600QE R9 5900HX, GeForce RTX 3050 Ti Laptop GPU, 96 Wh | |
|---|---|---|---|---|---|---|
| Batteridrifttid | 63% | 2% | -26% | 5% | 6% | |
| Reader / Idle (h) | 18.6 | 20.5 10% | 12.2 -34% | 20.3 9% | ||
| WiFi v1.3 (h) | 9.6 | 9.9 3% | 7.9 -18% | 7.1 -26% | 8.1 -16% | 11.3 18% |
| Load (h) | 1.2 | 3.3 175% | 1.9 58% | 1.5 25% | 1.1 -8% | |
| H.264 (h) | 8.4 | |||||
| Gaming (h) | 1.1 |
För
Emot
Omdöme - Delvis multimedia, delvis kreatör, delvis gamer
Den mest anmärkningsvärda fördelen med Inspiron 16 Plus 7620 jämfört med Inspiron 16 Plus 7620 7610 är den 12:e generationens Intel Core-H CPU som ger upp till 50 procent snabbare prestanda för flera trådar. Om dina arbetsuppgifter kan utnyttja den snabbare processorn kan 7620 vara en värdefull investering jämfört med sin föregångare.
De flesta av de andra förändringarna är ett sidospår för serien eller bara relativt små uppgraderingar i bästa fall. Till exempel är den högre upplösningen med en webbkamera på 2 MP trevlig, men den är inte alls i närheten av webbkamerorna på 5 MP i HP Spectre eller Envy 16. Den reviderade chassidesignen är också trevlig, men den gör egentligen inte systemet lättare, mindre eller starkare än den äldre 7610-designen. Alternativ som den lättare Asus VivoBook Pro 16X kommer med RTX 3050 Ti och en OLED-panel det sistnämnda erbjuder vår Dell fortfarande inte. En panel med snabbare uppdatering, till exempel panelen med 120 Hz på HP Envy 16, skulle vara ett bra alternativ att ha.
Inspiron 16 Plus 7620 är mycket snabbare än 7610 när det gäller CPU-prestanda. I övrigt är det mesta i stort sett lika eller till och med sämre, till exempel har den varmare temperaturer och färre expansionsplatser.
Samtidigt kan flera andra förändringar ses som nedgraderingar, till exempel den utelämnade numreringsblocket, den mindre klickplattan, högre strömförbrukning vid belastning, varmare temperaturer och färre antal SODIMM- och M.2-SSD-fack. Det är fortfarande ett kraftfullt system med både färger och prestanda som passar för casual gaming och innehållsskapande, men det är inte direkt en homerun när vissa funktioner saknas.
Pris och tillgänglighet
Amazon har för närvarande en konfiguration tillgänglig med Core i7-12700H, 16 GB RAM, 512 GB SSD, 3K-skärm och RTX 3050-grafik för 1450 USD. Vi rekommenderar att du beställer direkt från Dell för fler alternativ.
Dell Inspiron 16 Plus 7620
- 08/18/2022 v7 (old)
Allen Ngo
Price comparison

