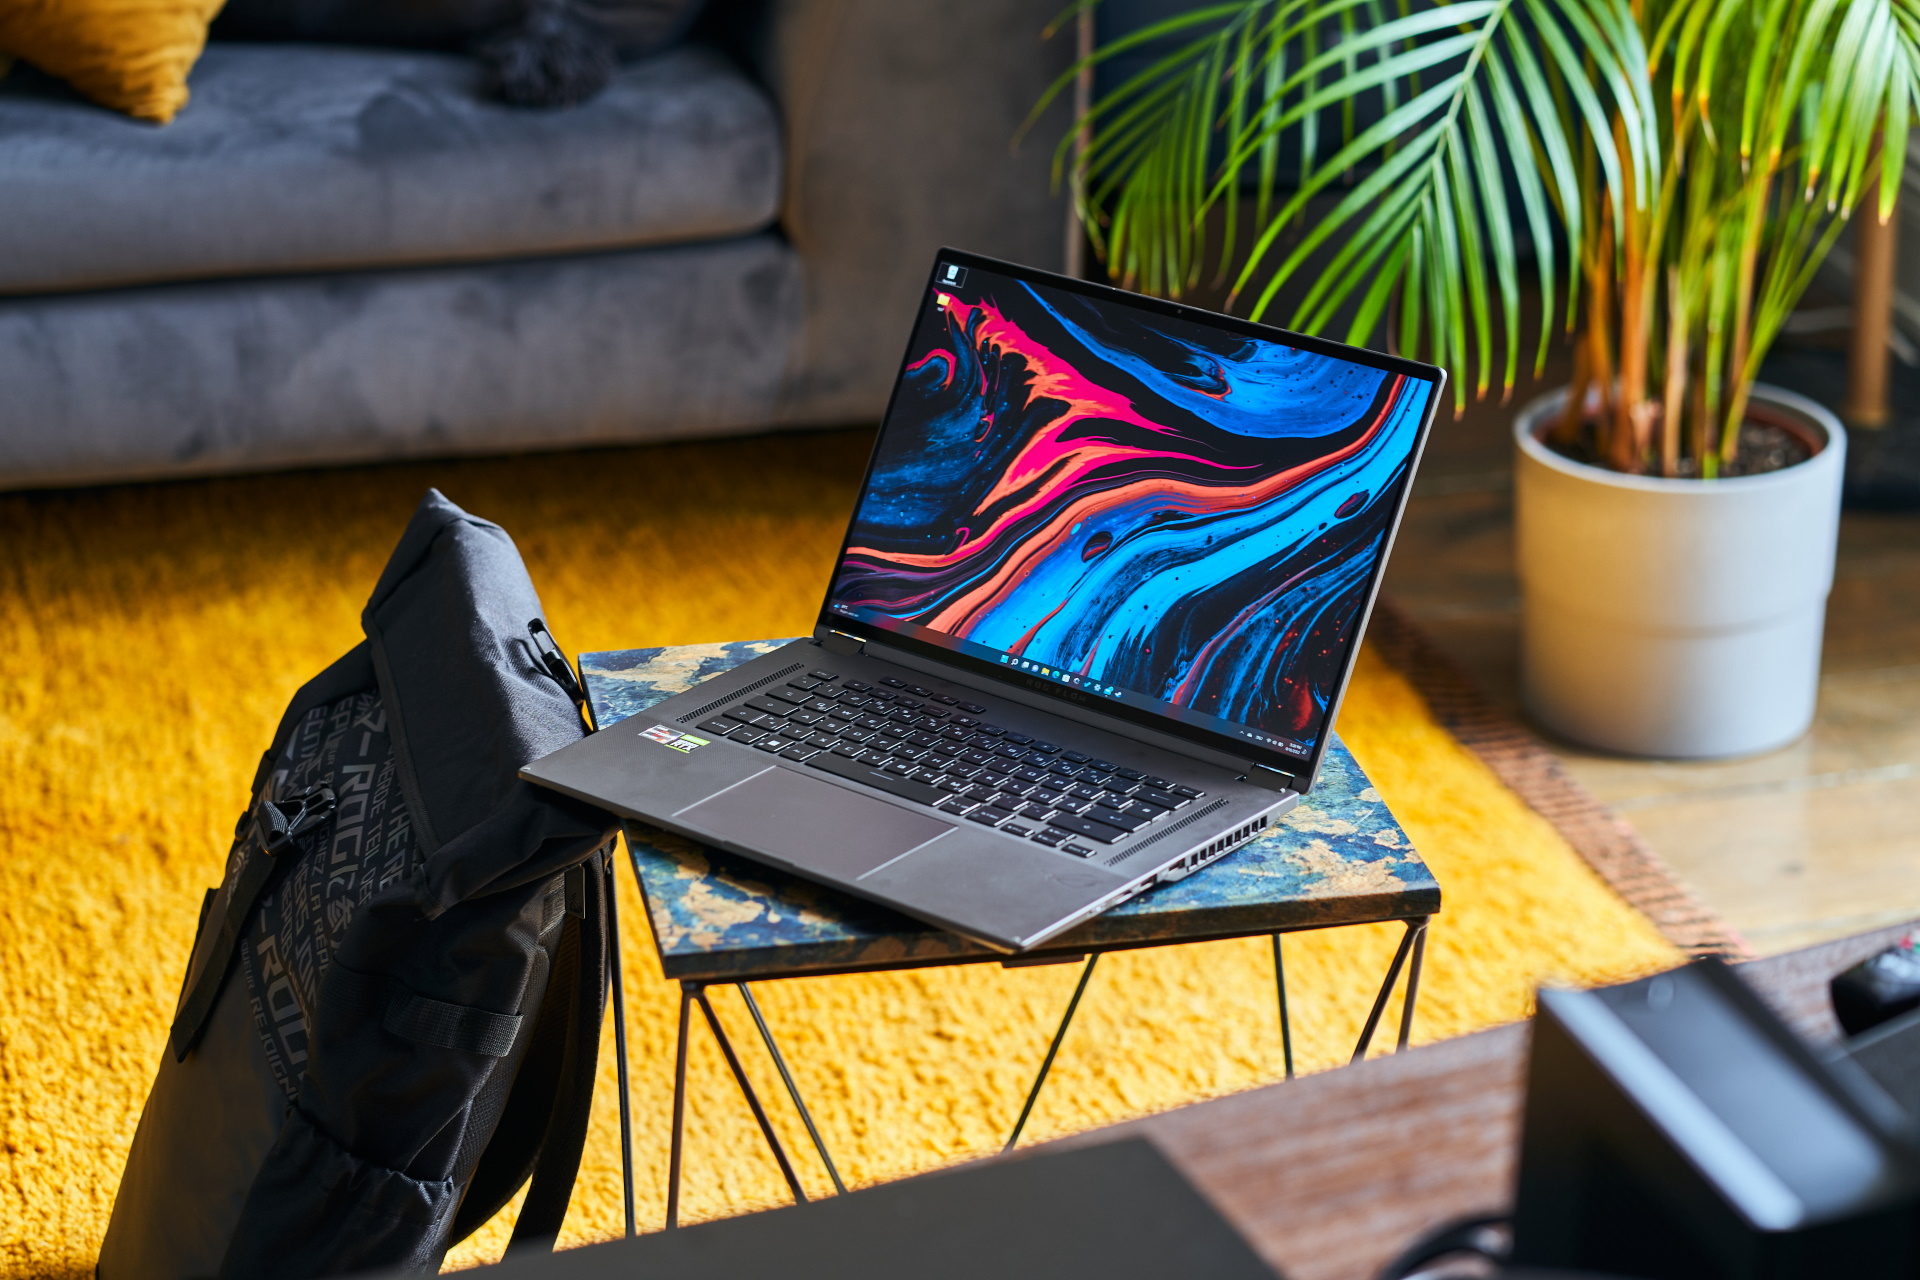
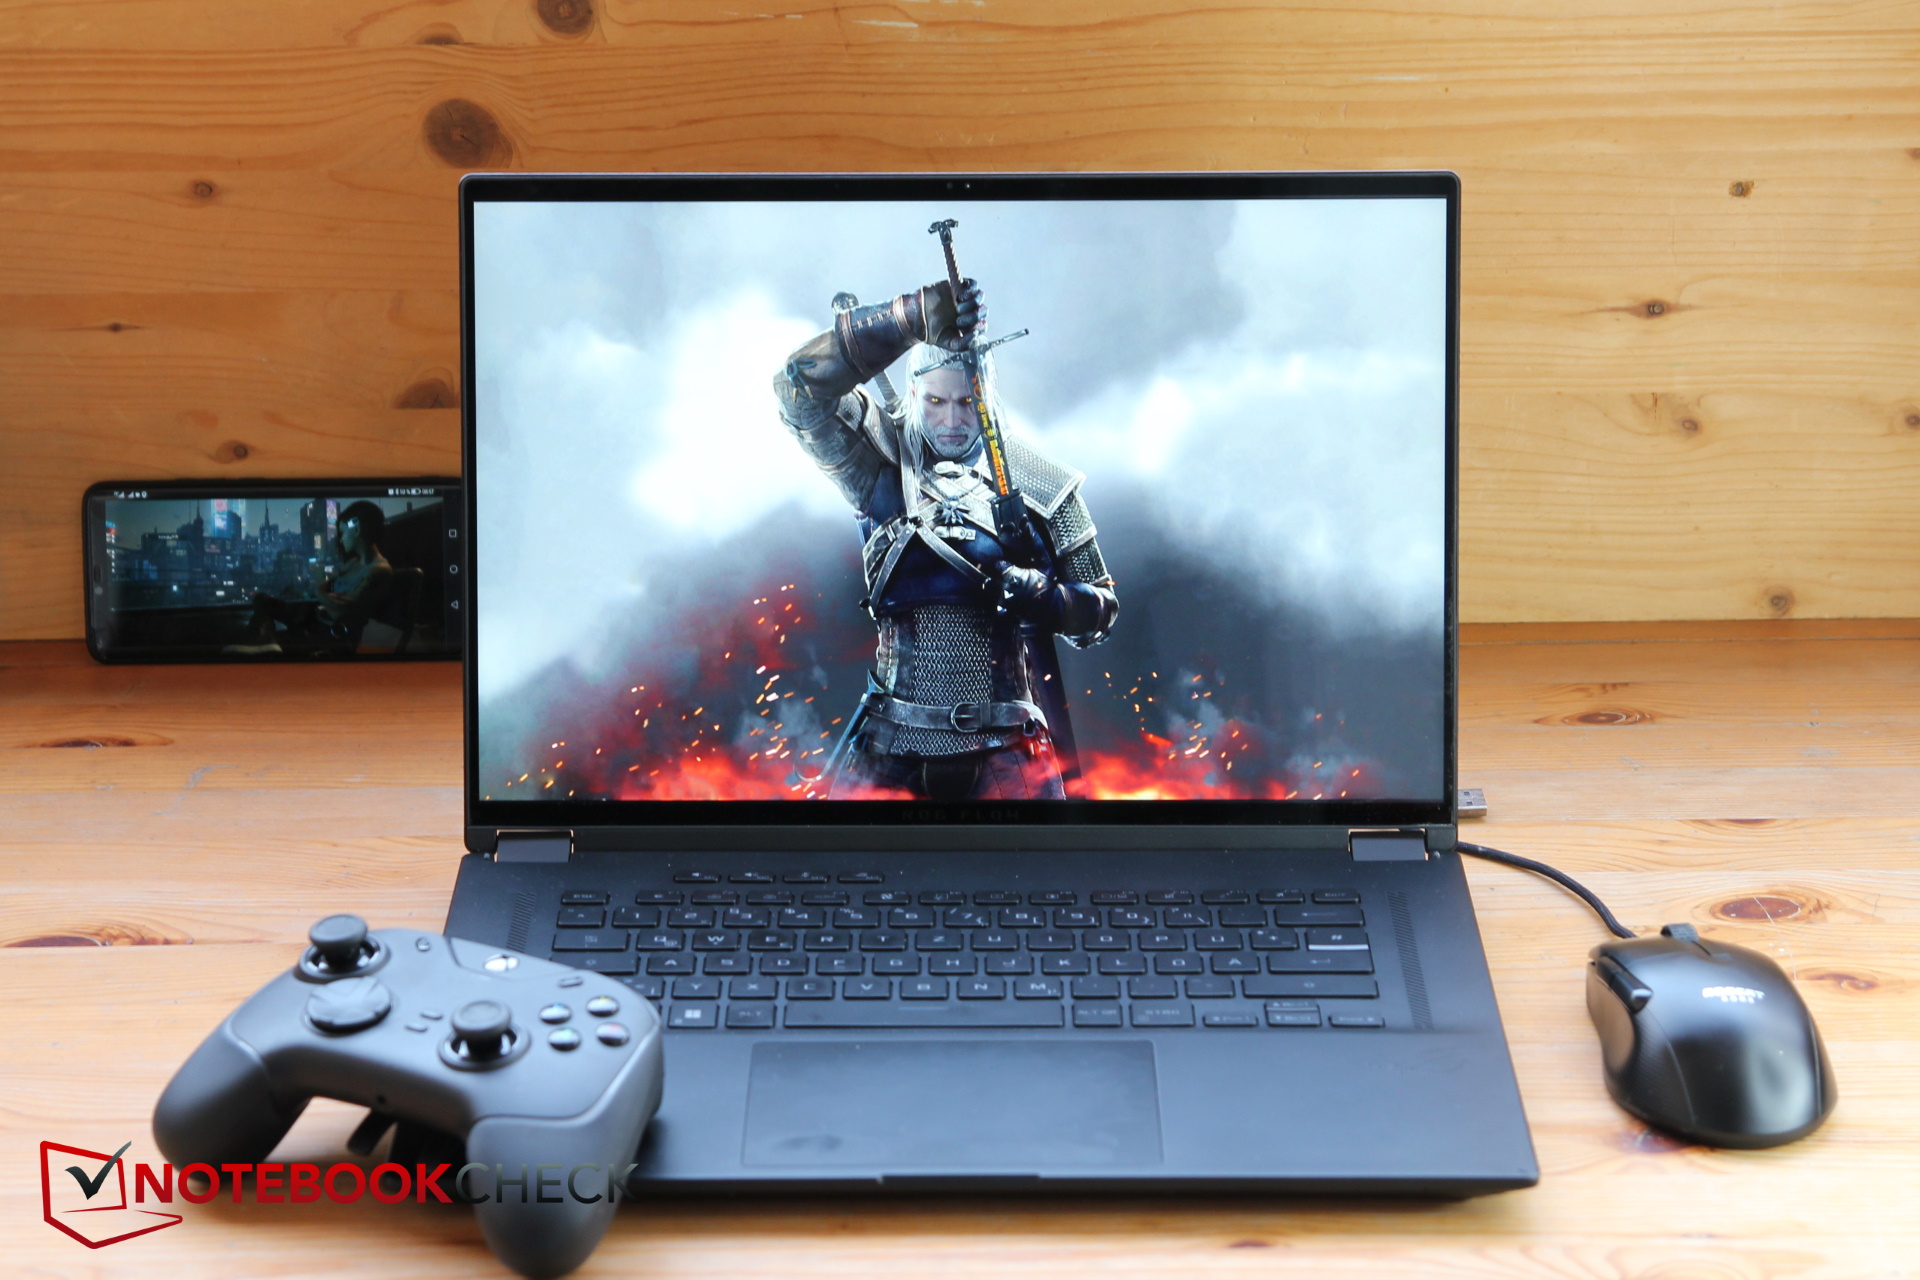
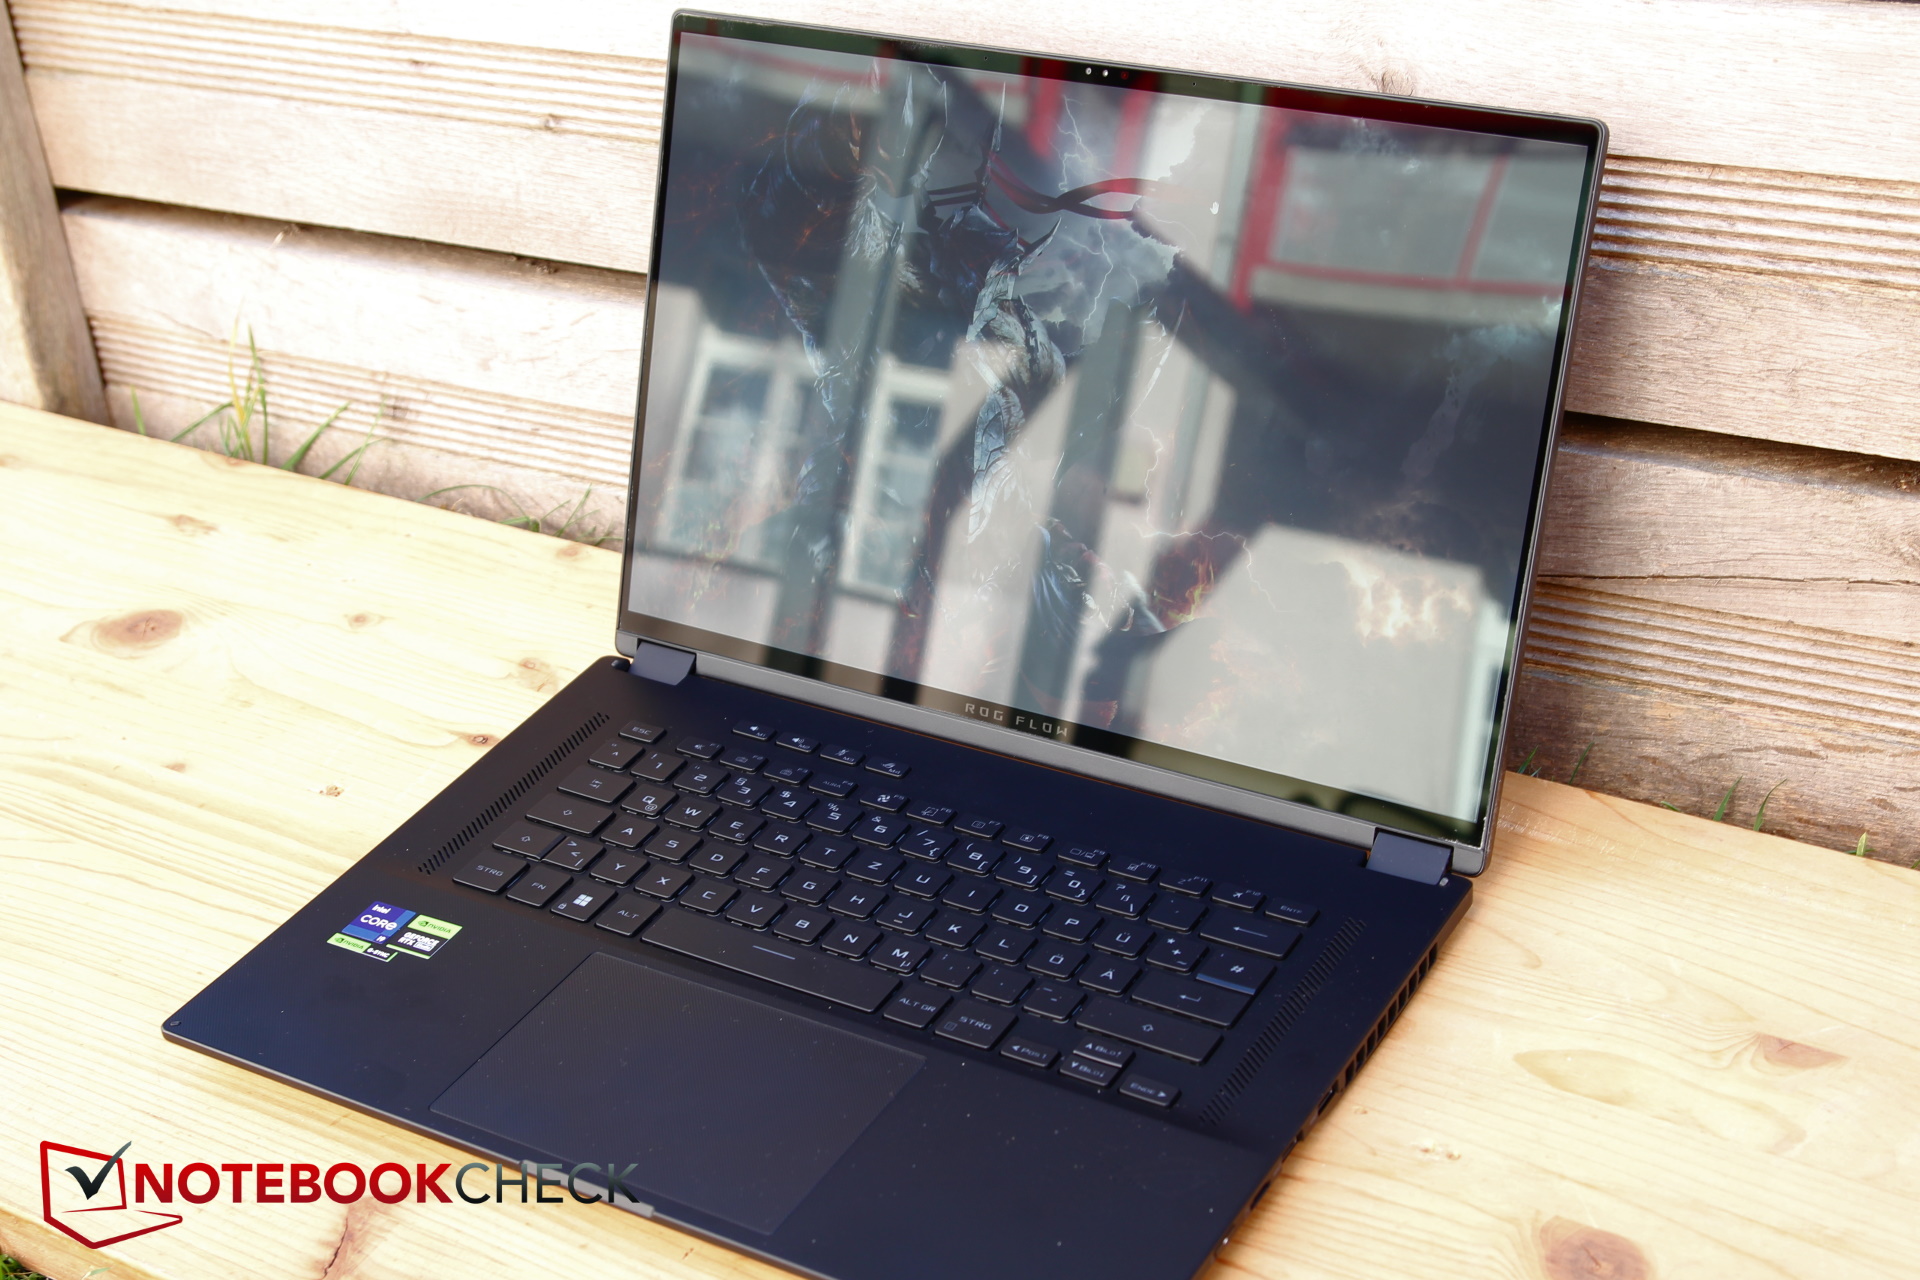
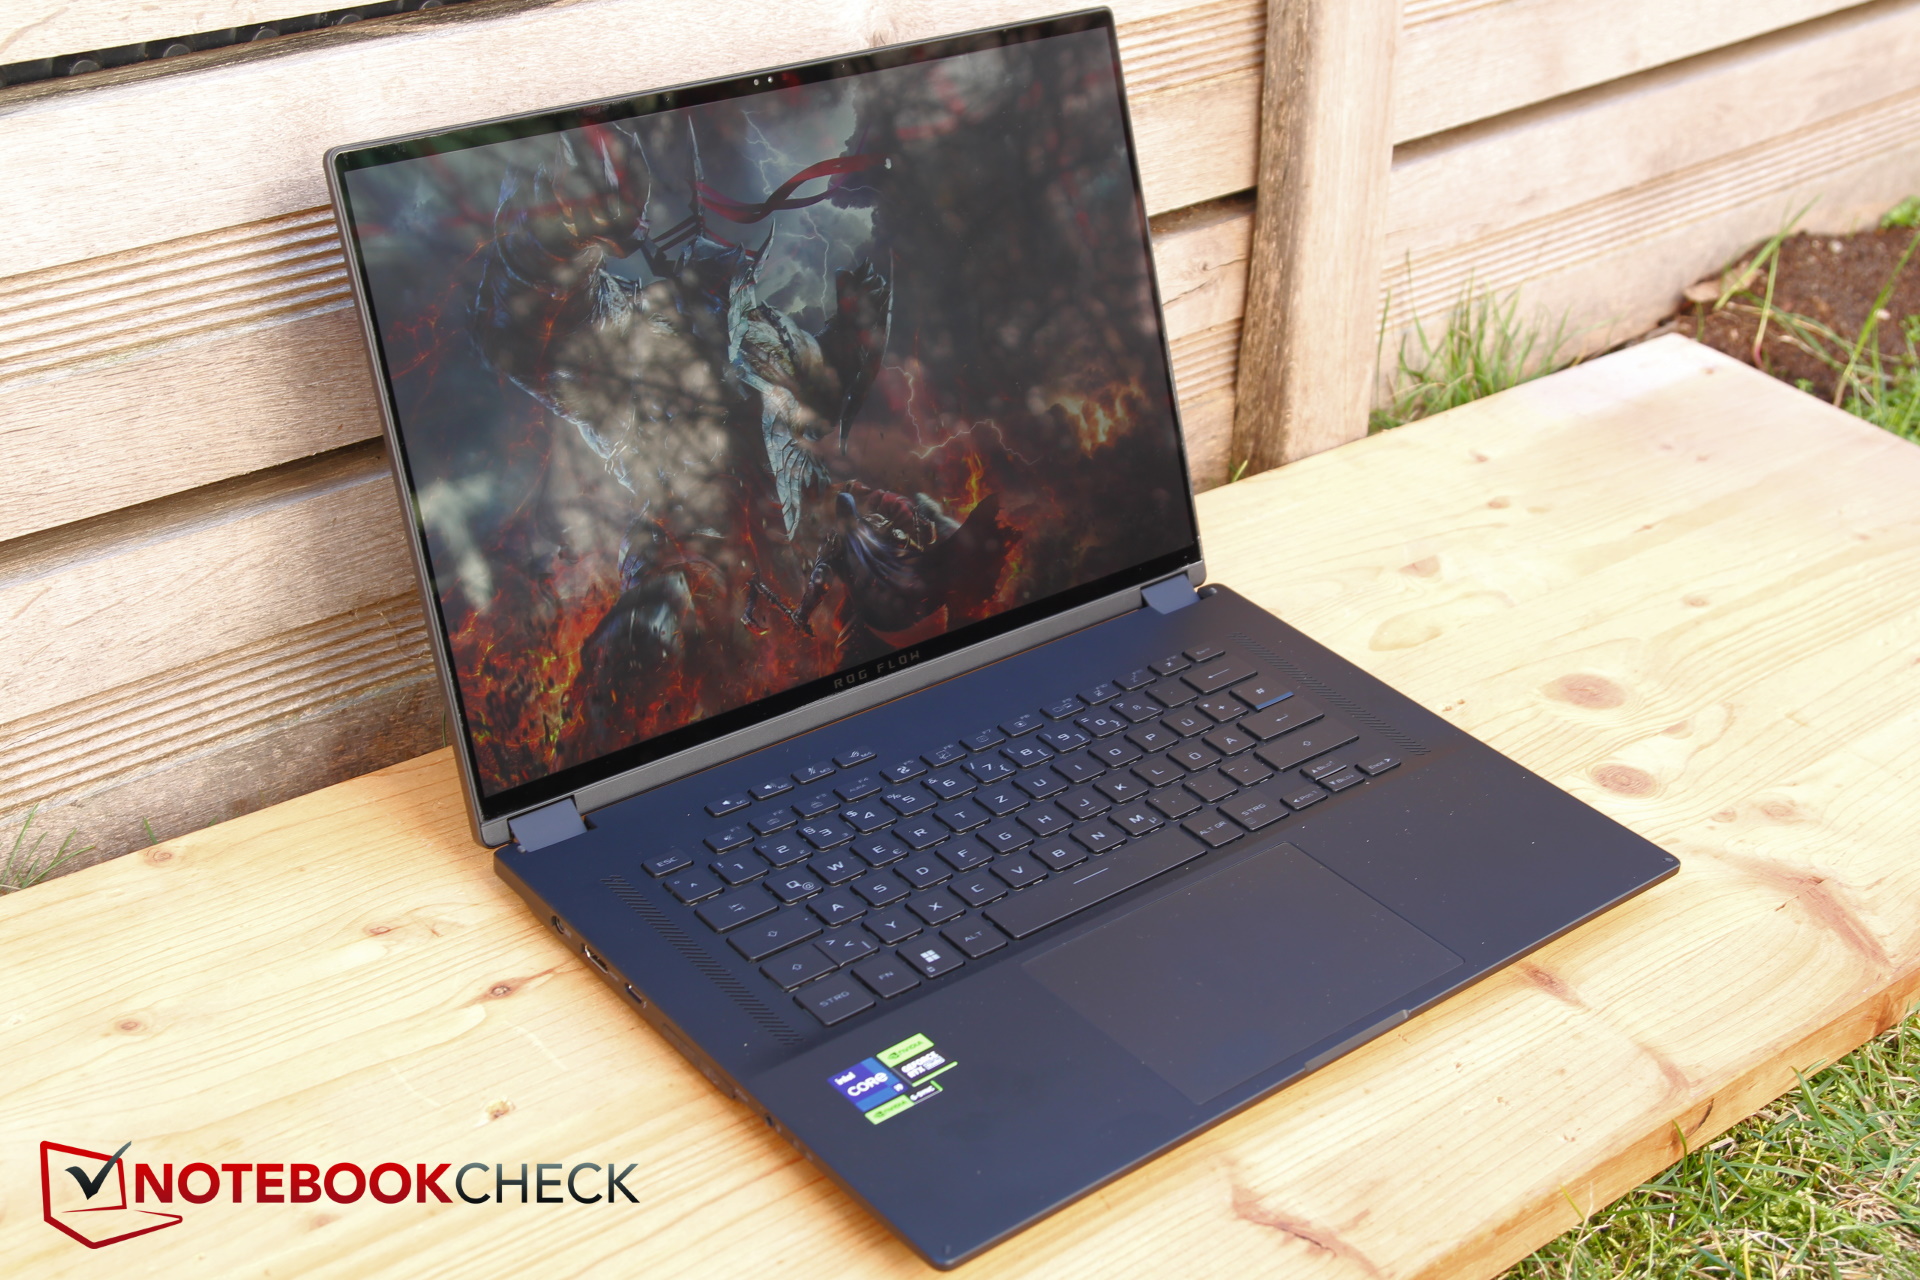
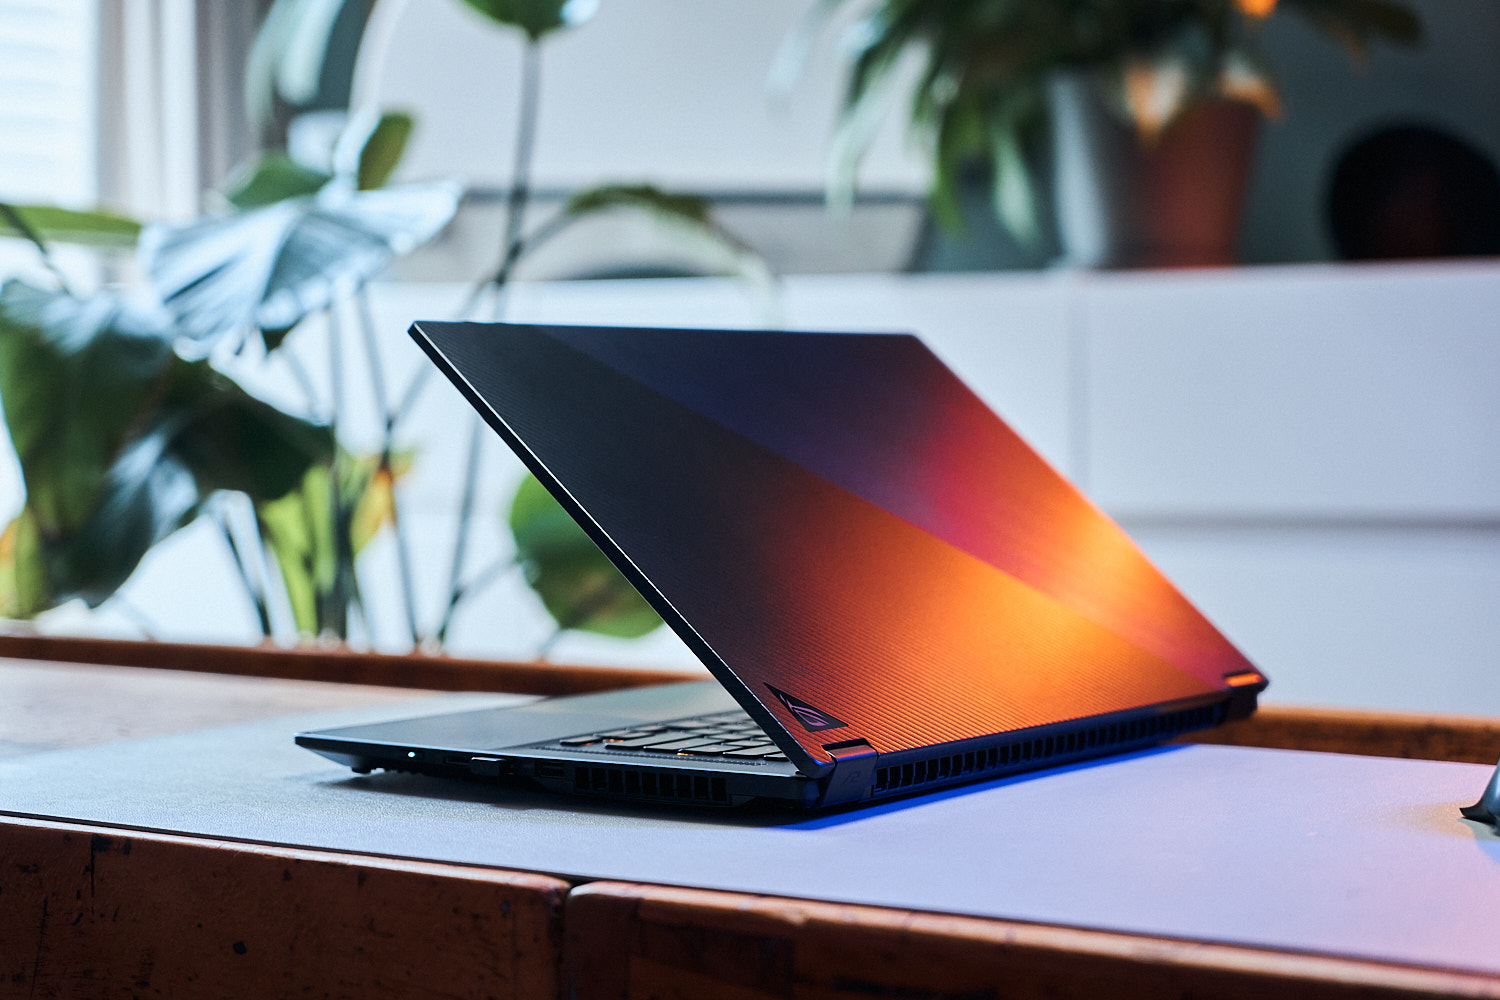
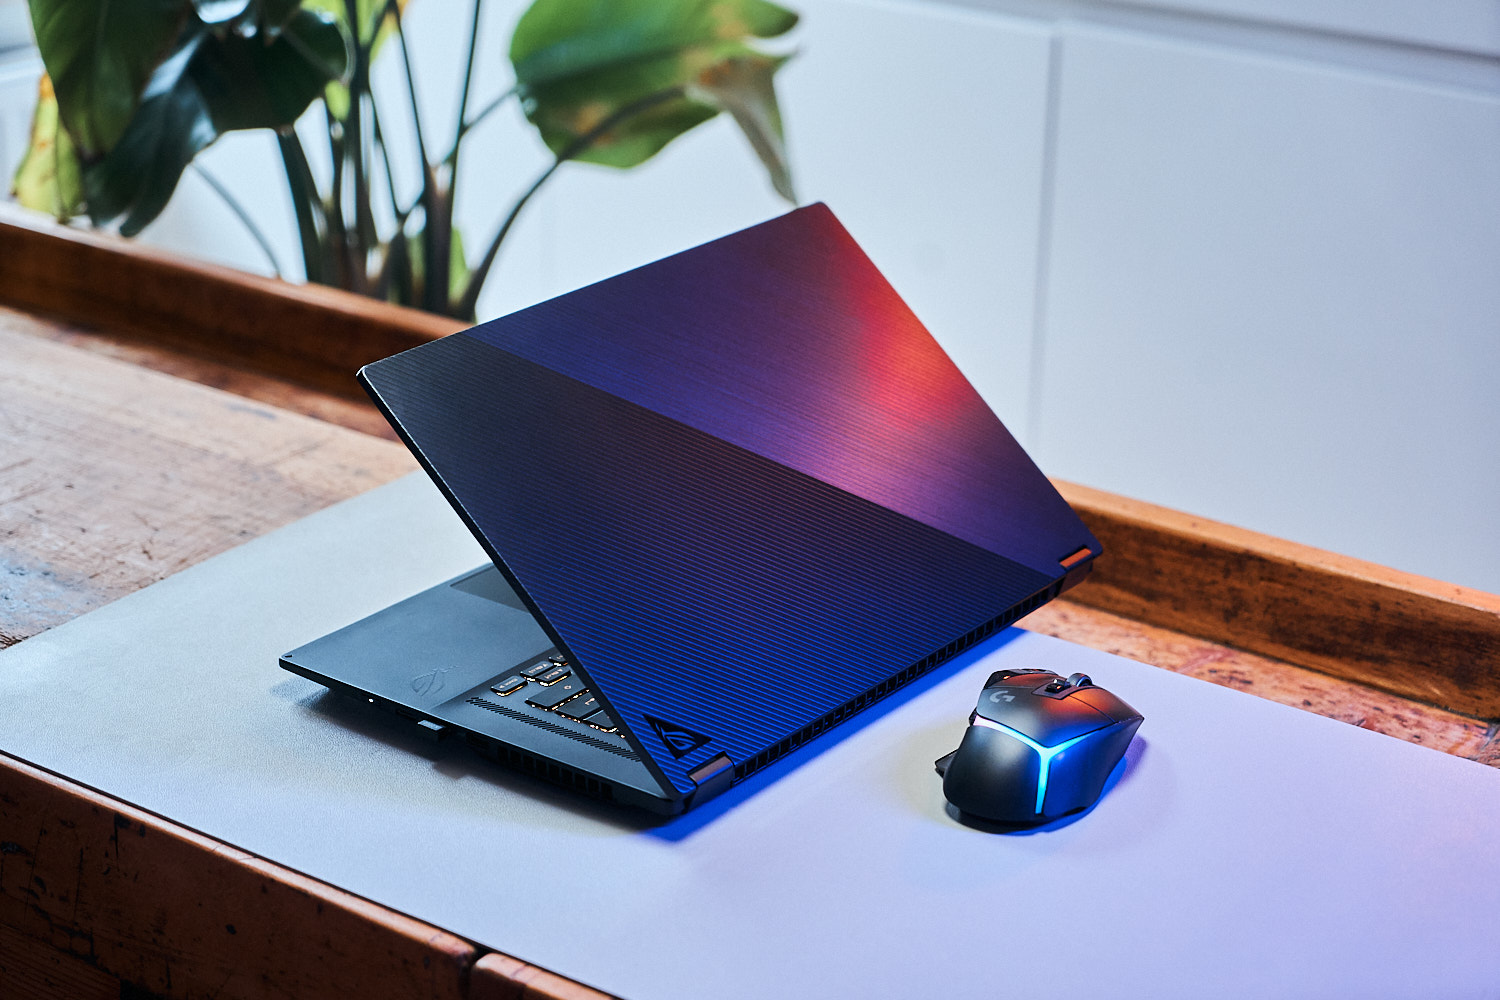
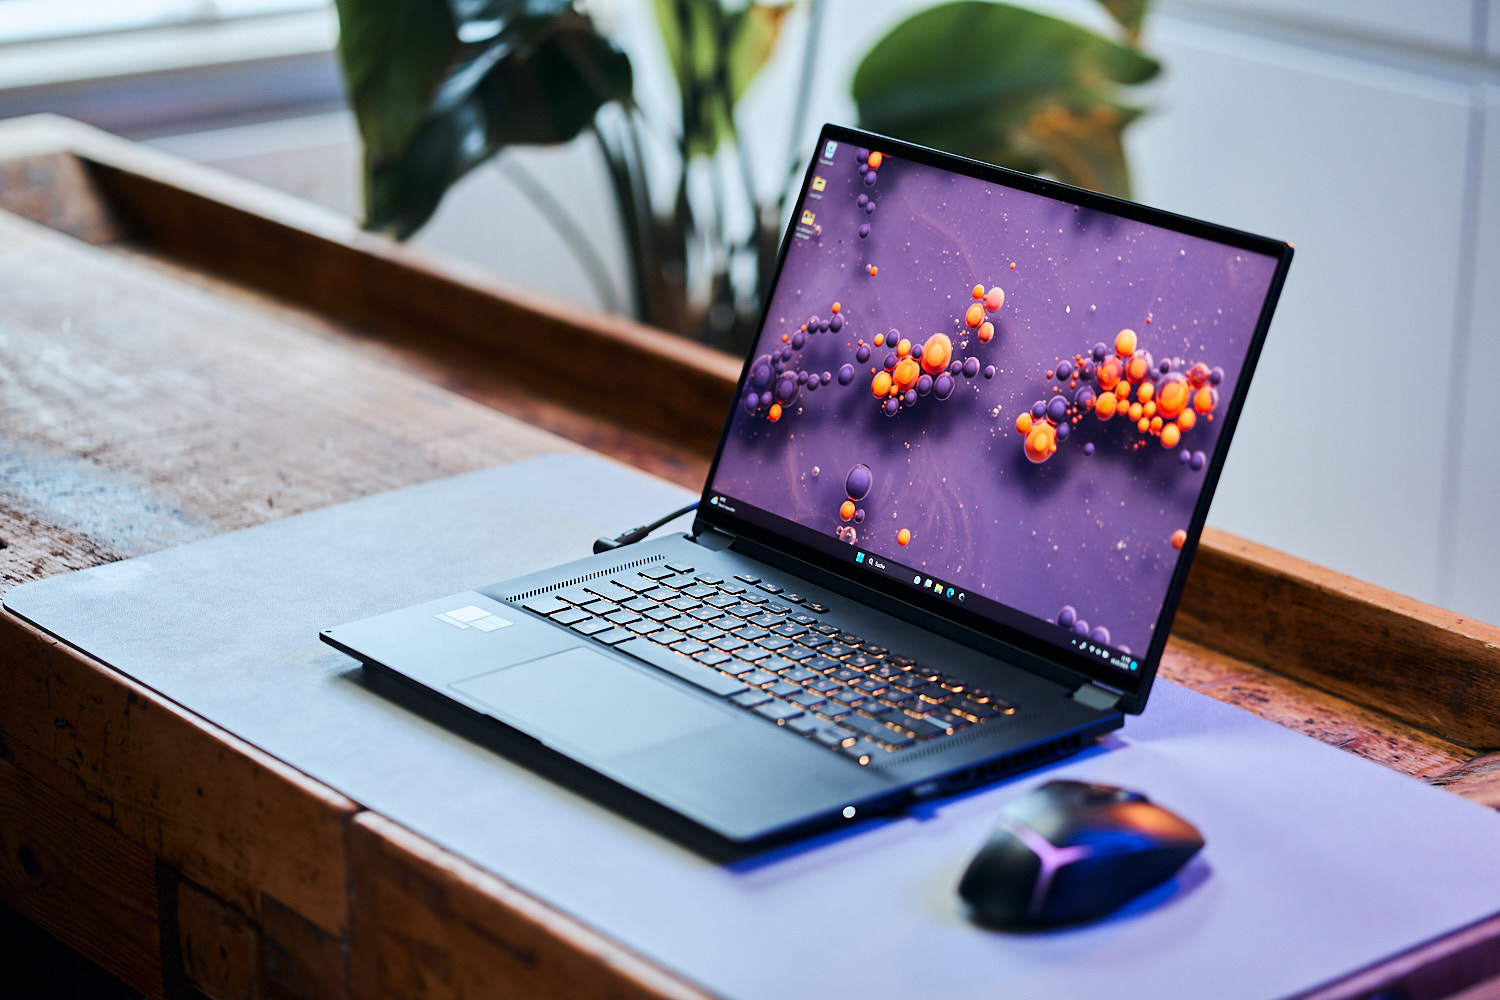
Recension av den slimmade bärbara datorn Asus ROG Flow X16: En kraftfull 16-tums gaming workstation 2-i-1 med pekskärm

Förra året var ROG Flow X16vår första bärbara speldator utrustad med en mini-LED-skärm. Vid den tidpunkten var datorn före sin tid och av den anledningen verkar Asus inte ha haft någon anledning att ge den här modellen en fullständig översyn. Den version vi granskar här kommer dock utan en mini-LED-skärm. Många funktioner förblir dock desamma såsom chassit och portar där Asus endast byter CPU/GPU-generation.
På samma sätt är Asus för närvarande också före spelet i sin förverkligande av nya koncept, vilket bevisas av den nya Asus ROG Ally såväl somAsus ROG Flow Z13spelplatta. X16 är inte precis din vardagsenhet: Vad vi har här är en ultratunn bärbar speldator som samtidigt är en 2-i-1-enhet. Skärmen kan roteras 360 grader så att den bärbara datorn kan användas som en surfplatta via pekskärmen. Eftersom direkt konkurrens är svår att hitta är det därför vi jämför den med vanliga spelmaskiner. Förutom sin föregångare använder vi ocksåSamsung Galaxy Book3 Ultra 16, denLenovo Legion Pro 5, denLenovo Yoga Pro 7 14 G8ochMSI Katana 17 B13V för jämförelse.
Eftersom olika funktioner som finns i förra årets modell förblir desamma, ägnar vi inte särskild uppmärksamhet åt fodral, tillbehör, service och inmatningsenheter utan föredrar att peka dig i riktning mot vår recension av förra årets Asus ROG Flow X16 GV601RWför ytterligare information.
Potentiella konkurrenter i jämförelse
Gradering | Datum | Modell | Vikt | Höjd | Storlek | Upplösning | Pris |
|---|---|---|---|---|---|---|---|
| 89.7 % v7 (old) | 06/2023 | Asus ROG Flow X16 GV601V i9-13900H, GeForce RTX 4060 Laptop GPU | 2.1 kg | 19.4 mm | 16.00" | 2560x1600 | |
| 89.5 % v7 (old) | 08/2022 | Asus ROG Flow X16 GV601RW-M5082W R9 6900HS, GeForce RTX 3070 Ti Laptop GPU | 2.1 kg | 19.4 mm | 16.10" | 2560x1600 | |
| 88.8 % v7 (old) | 05/2023 | Samsung Galaxy Book3 Ultra 16, i9-13900H RTX 4070 i9-13900H, GeForce RTX 4070 Laptop GPU | 1.8 kg | 16.8 mm | 16.00" | 2880x1800 | |
| 87.9 % v7 (old) | 05/2023 | Lenovo Legion Pro 5 16IRX8 i7-13700HX, GeForce RTX 4060 Laptop GPU | 2.5 kg | 26.8 mm | 16.00" | 2560x1600 | |
| 90.2 % v7 (old) | 05/2023 | Lenovo Yoga Pro 7 14IRH G8 i7-13700H, GeForce RTX 4050 Laptop GPU | 1.5 kg | 15.6 mm | 14.50" | 3072x1920 | |
| 82.1 % v7 (old) | 02/2023 | MSI Katana 17 B13VFK i7-13620H, GeForce RTX 4060 Laptop GPU | 2.8 kg | 25.2 mm | 17.30" | 1920x1080 |
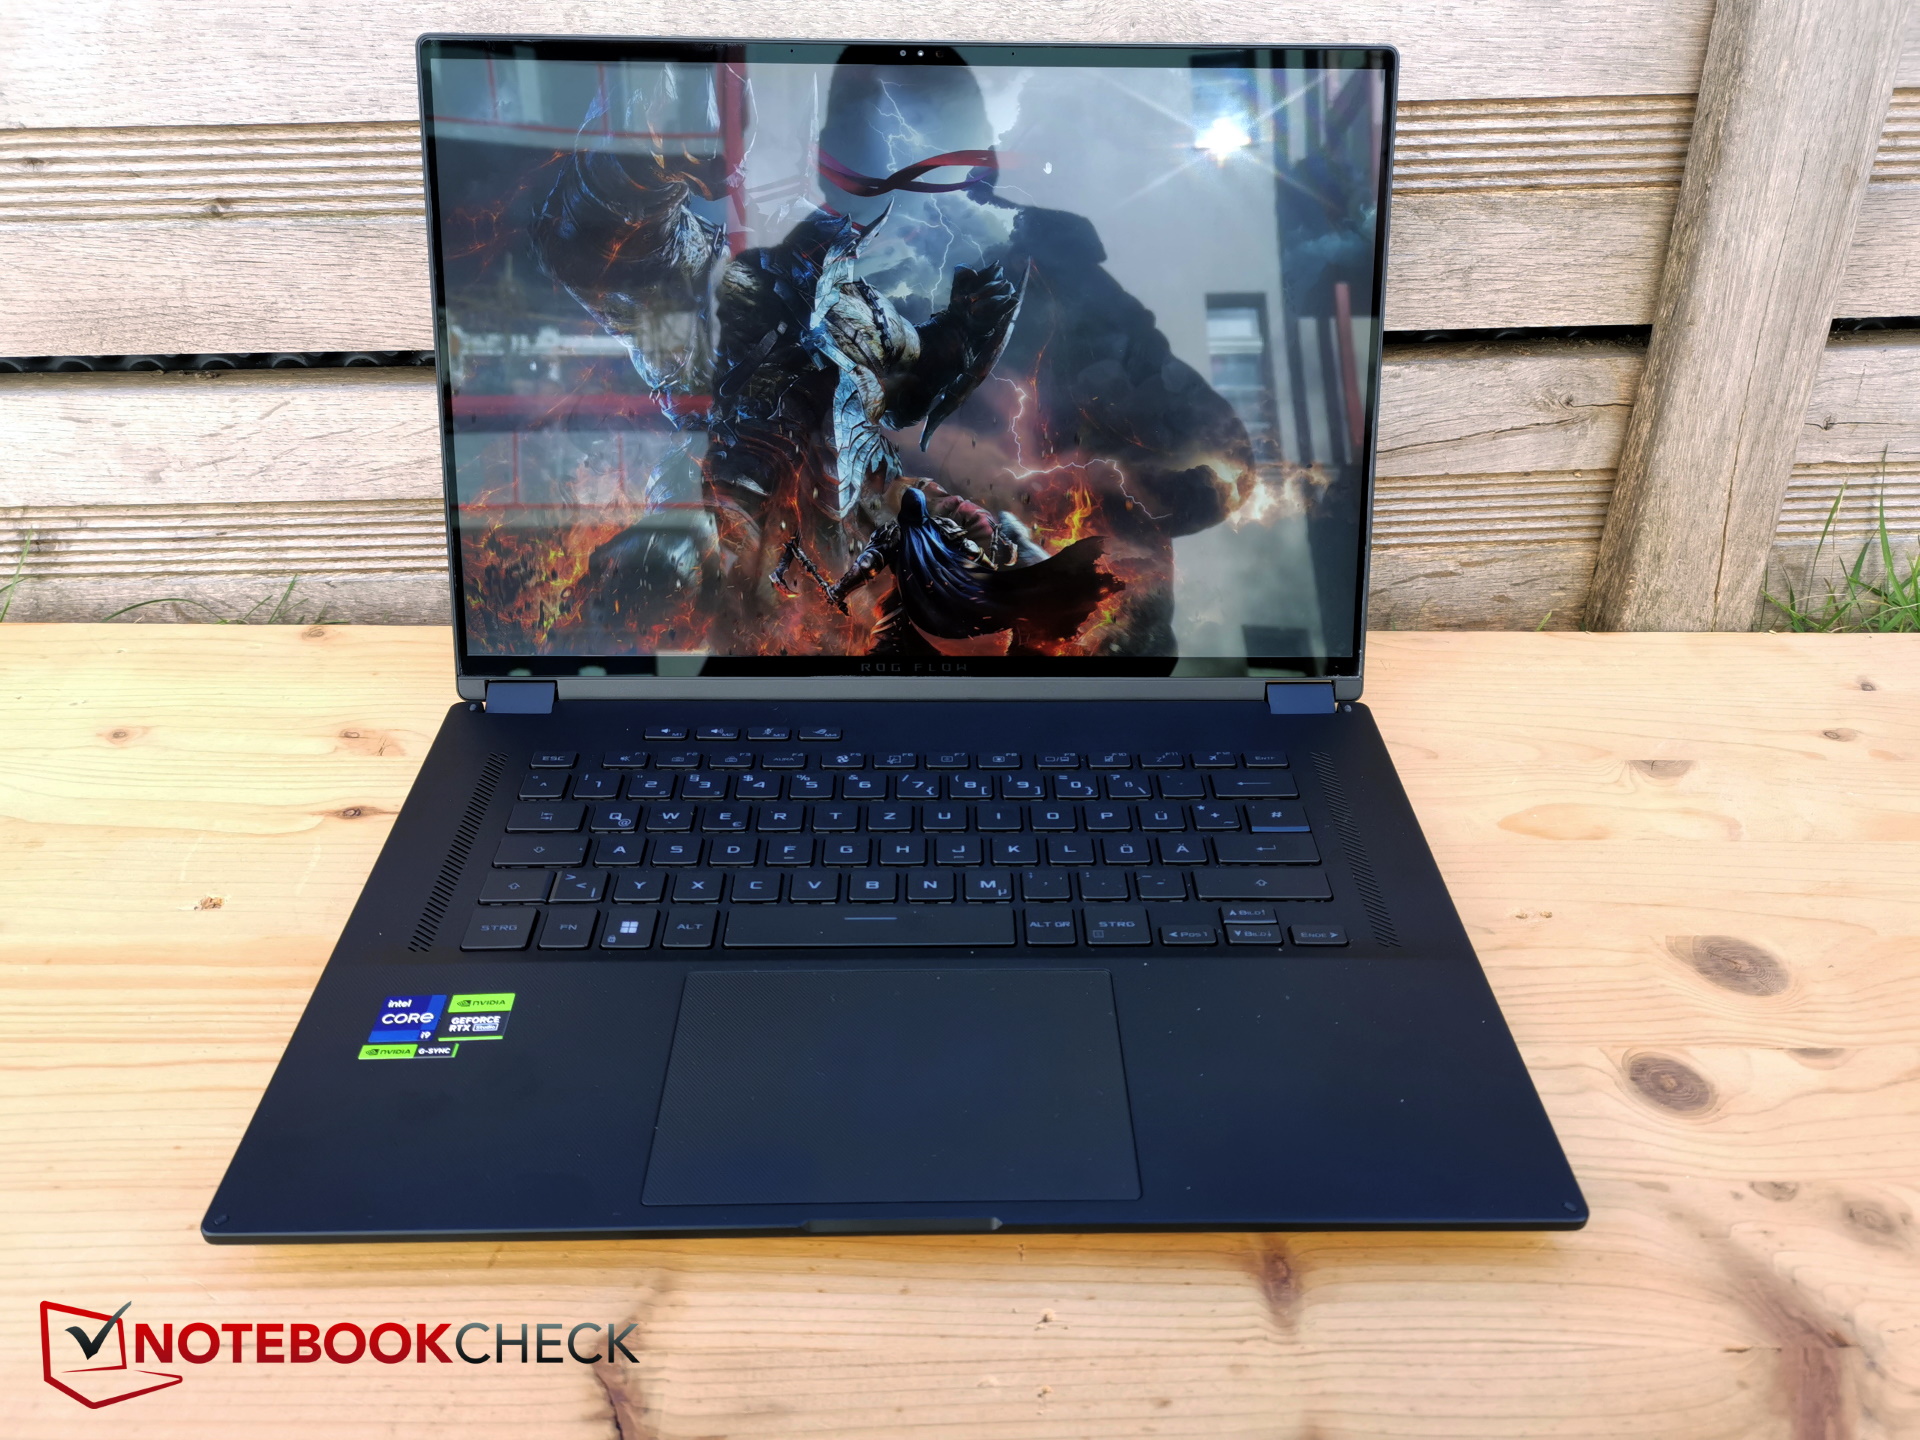
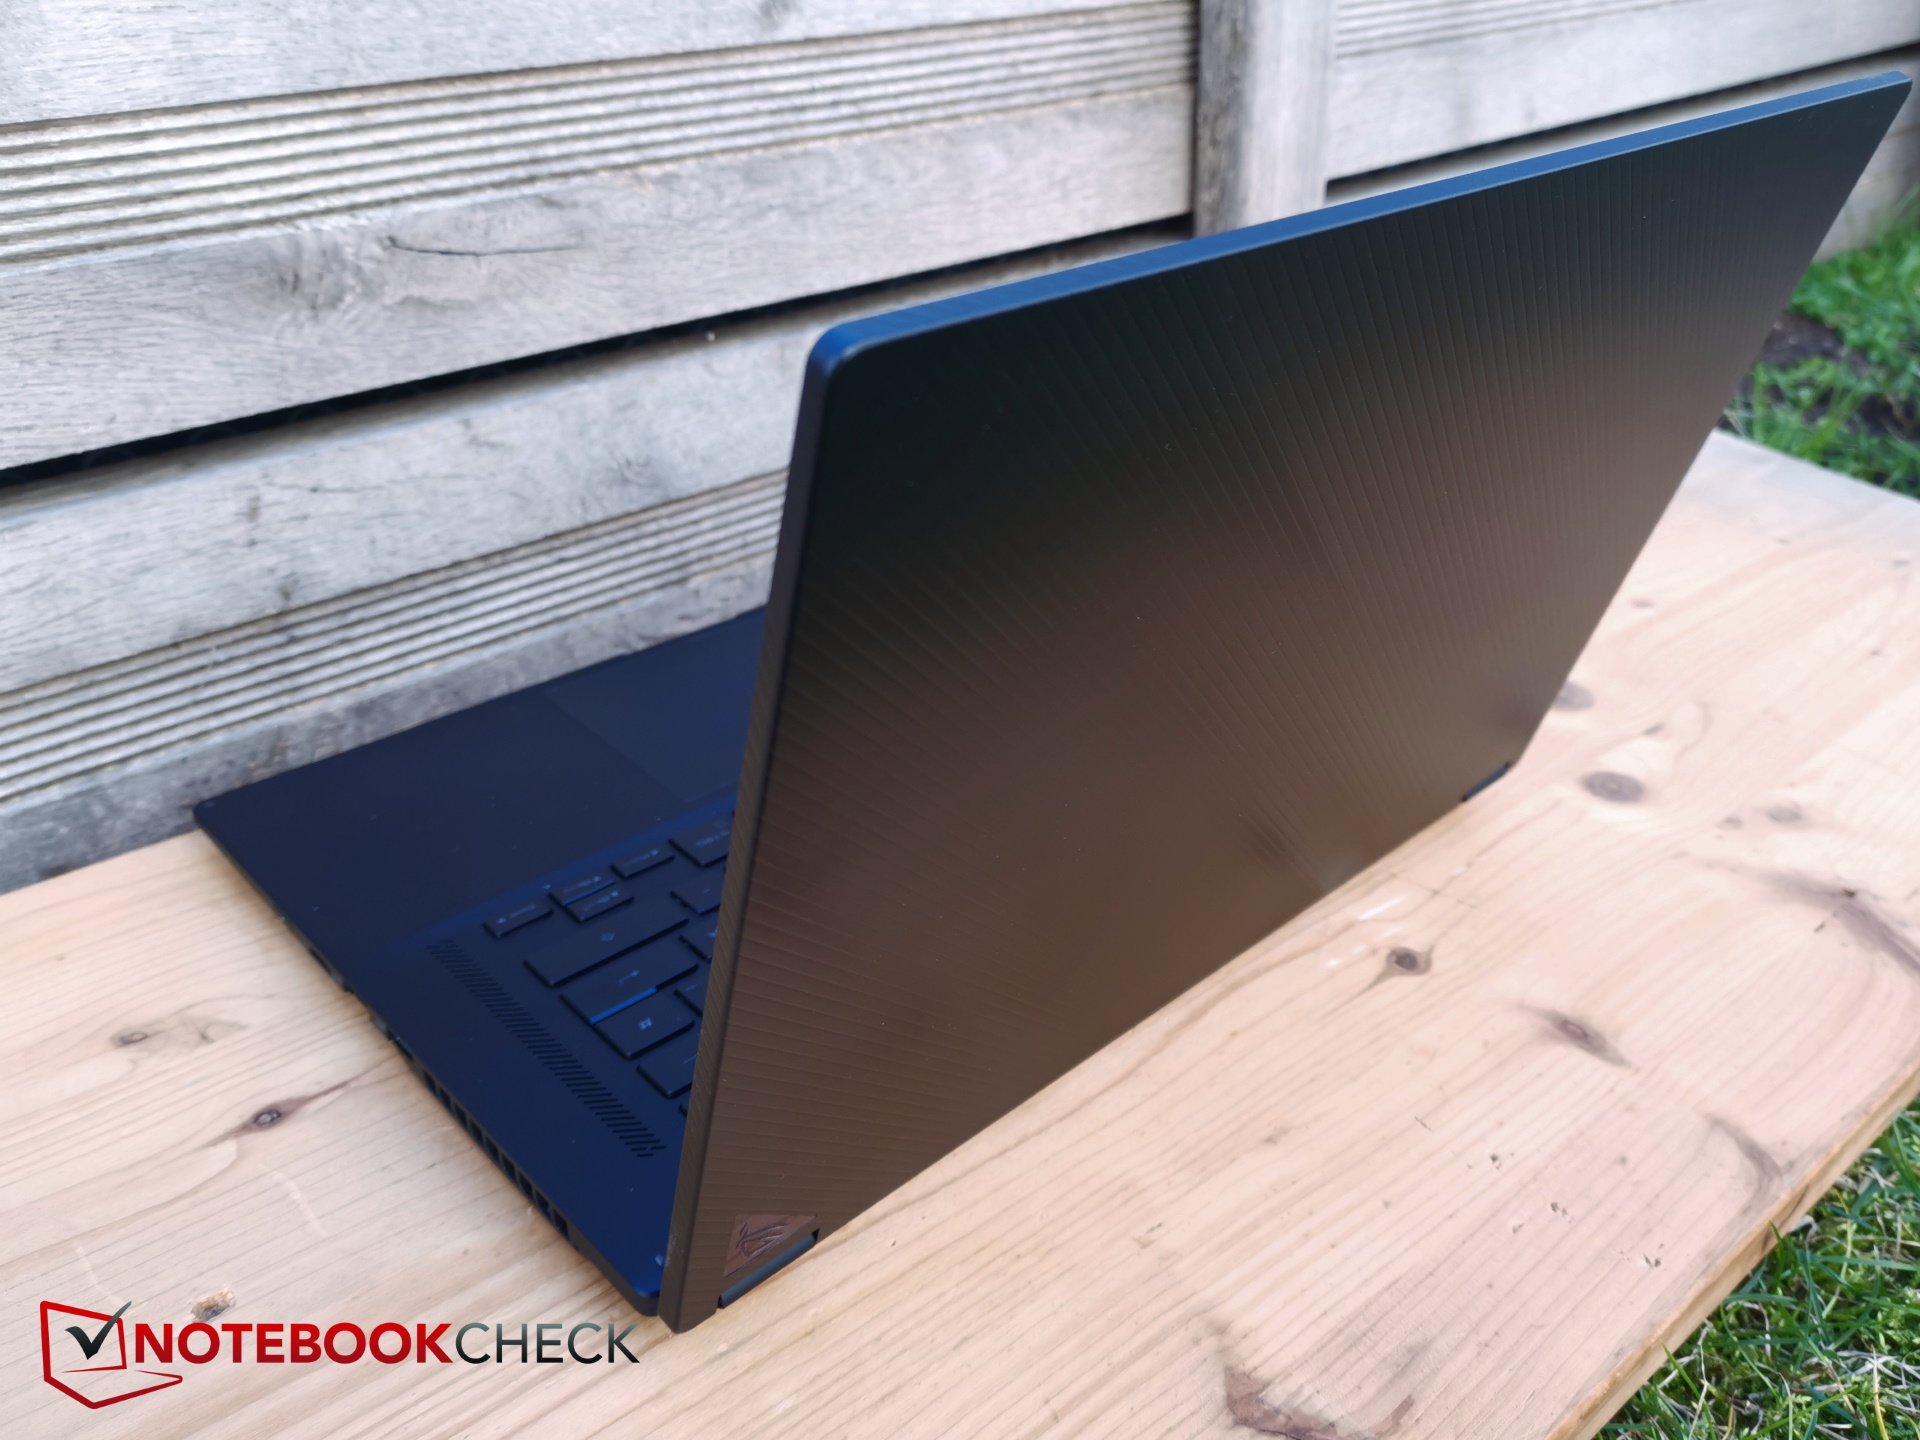
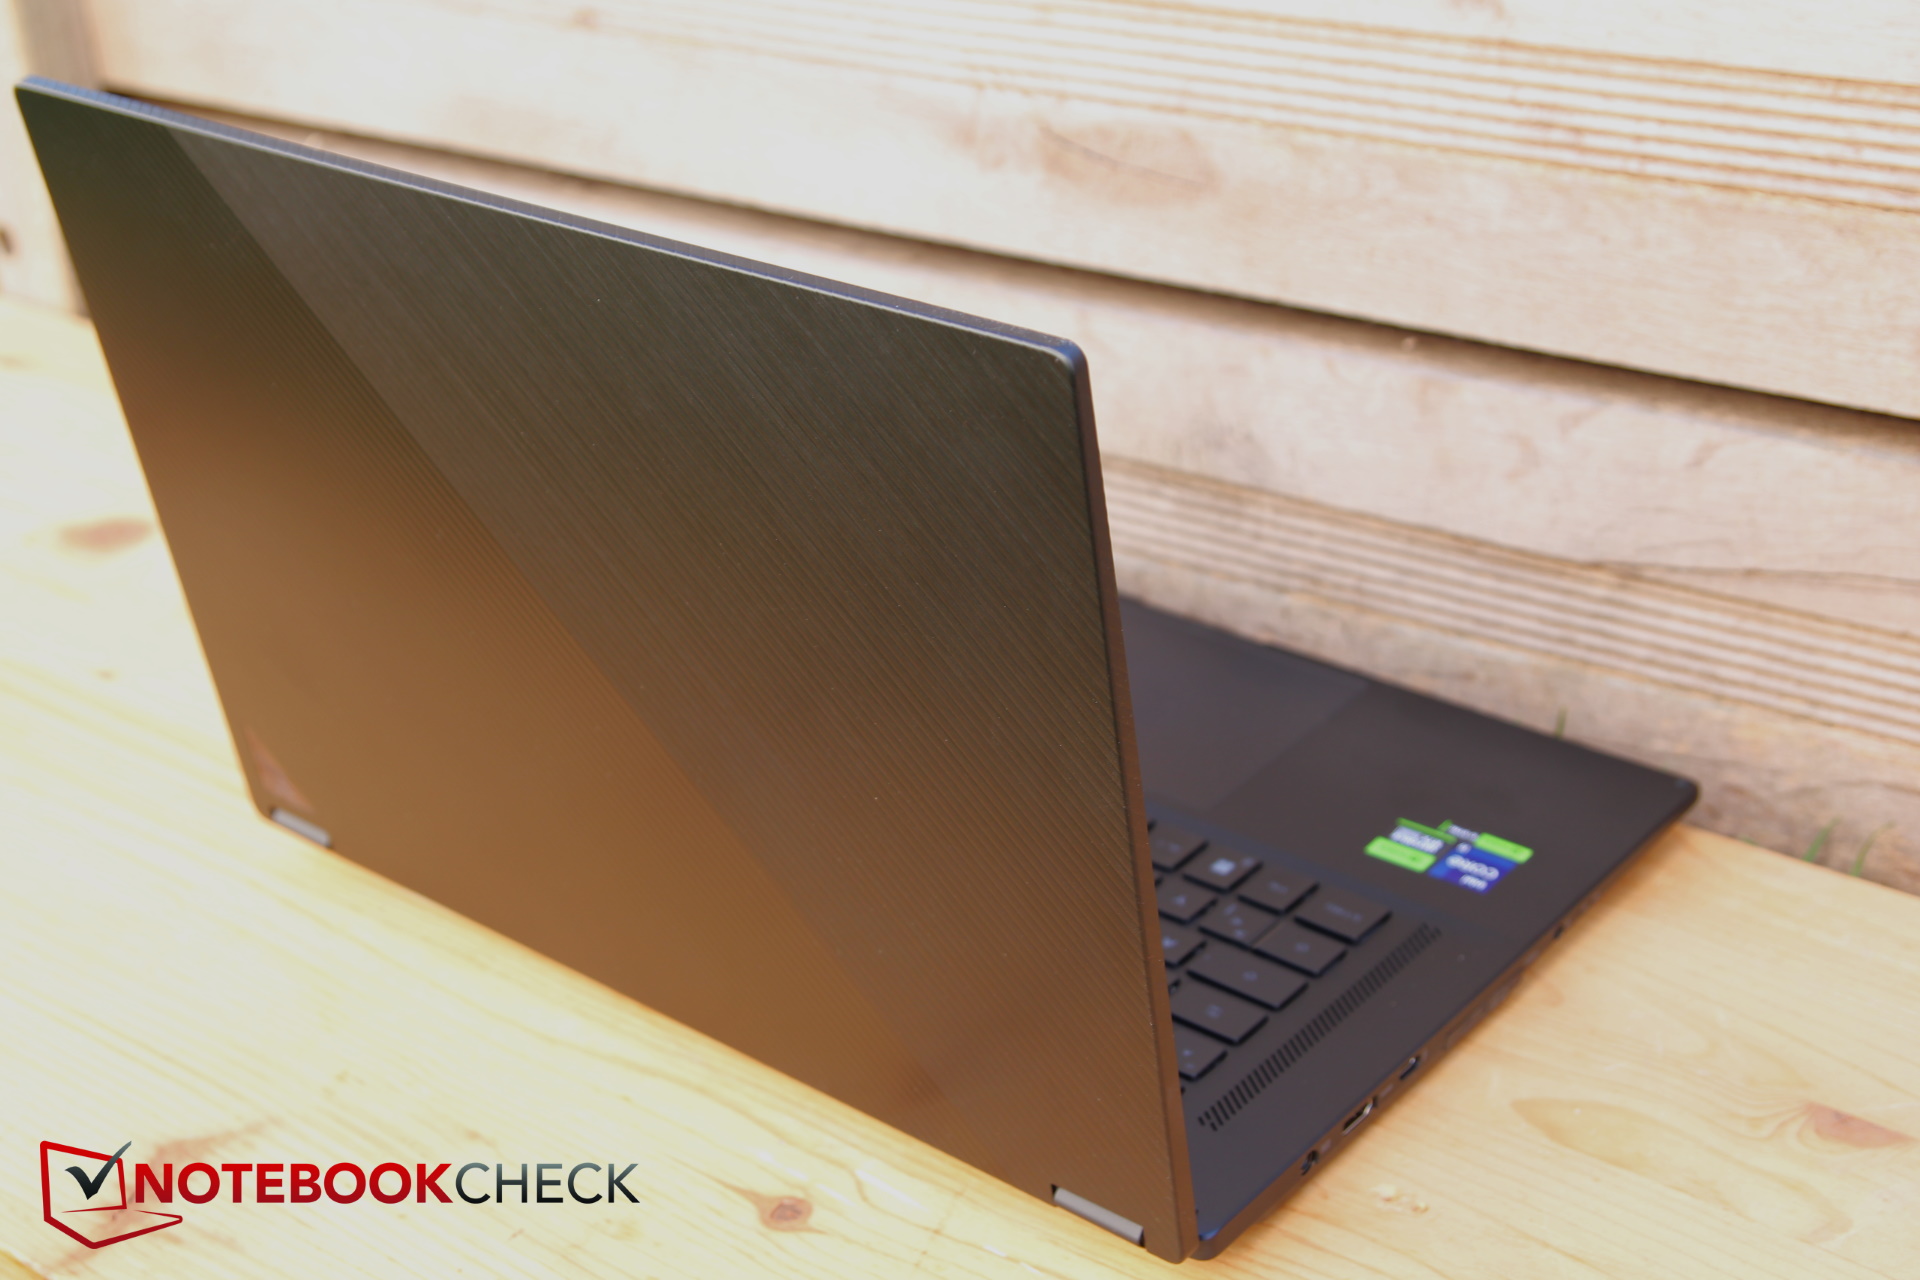
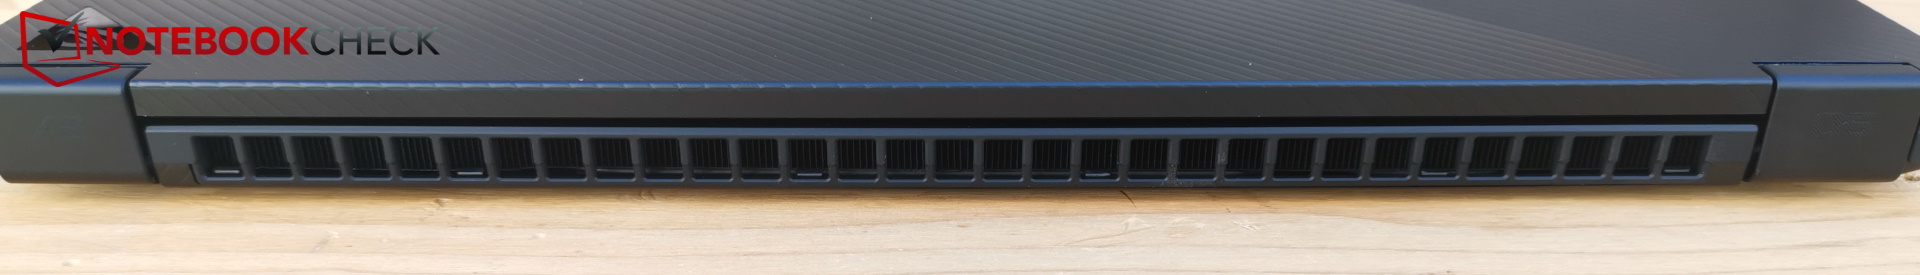
Case - Precis lika slimmad och bra som förra året
Logotypen på locket är något annorlunda, men bortsett från det är allt i stort sett oförändrat.

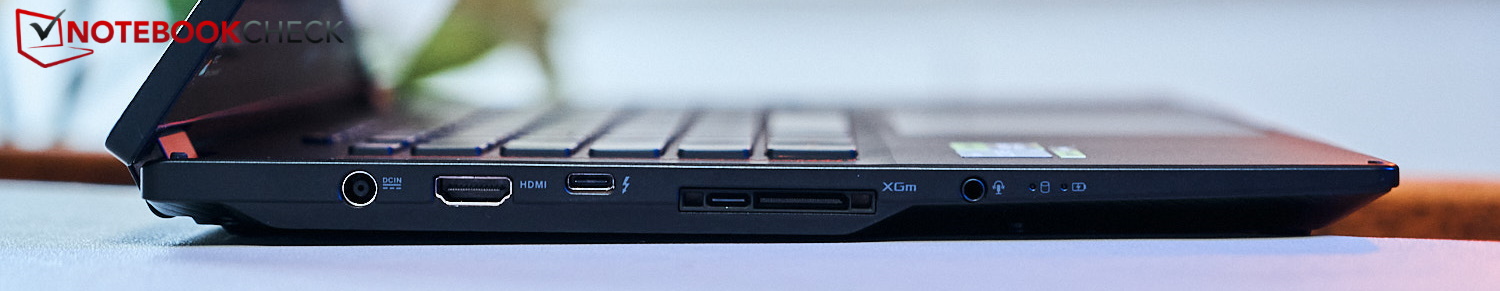
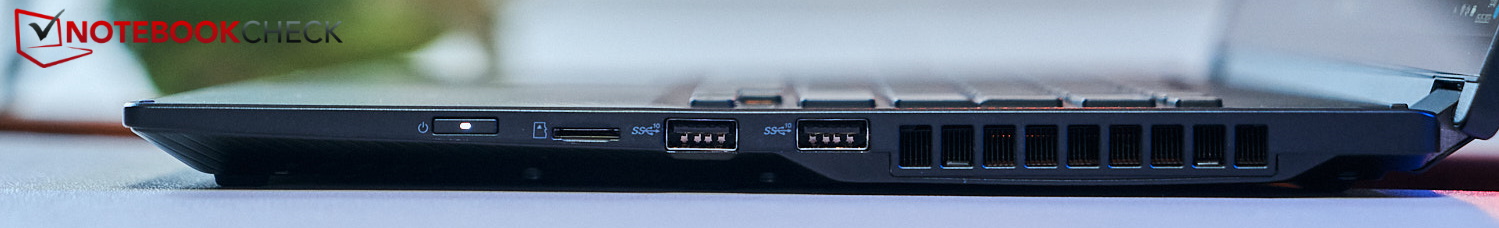
Funktioner - TB4 och XG mobilt gränssnitt
SD-kortläsare
| SD Card Reader | |
| average JPG Copy Test (av. of 3 runs) | |
| Asus ROG Flow X16 GV601RW-M5082W (AV Pro SD microSD 128 GB V60) | |
| Genomsnitt av klass Gaming (20.9 - 210, n=54, senaste 2 åren) | |
| Asus ROG Flow X16 GV601V | |
| Samsung Galaxy Book3 Ultra 16, i9-13900H RTX 4070 (AV Pro SD microSD 128 GB V60) | |
| maximum AS SSD Seq Read Test (1GB) | |
| Asus ROG Flow X16 GV601V | |
| Asus ROG Flow X16 GV601RW-M5082W (AV Pro SD microSD 128 GB V60) | |
| Genomsnitt av klass Gaming (25.5 - 261, n=51, senaste 2 åren) | |
| Samsung Galaxy Book3 Ultra 16, i9-13900H RTX 4070 (AV Pro SD microSD 128 GB V60) | |
Kommunikation
Överföringshastigheterna med Intels AX211 i ett 6 GHz-nät är mycket höga och stabila (ca 1,6 MBit/s) och i ett 5 GHz-nät är låga överföringshastigheter på endast ca 1 MBit/s möjliga.
Webbkamera
På det här området har Asus uppgraderat 720p-kameran som fanns i förra årets modell till en Full HD-kamera. Bilderna är hyfsade men färgavvikelsen är något på den höga sidan.


Säkerhet
TPM är tillgängligt tack vare Intel-chipet, men en fingeravtryckssensor och till och med ett Kensington-lås saknas. Kameran är kompatibel med Windows Hello.
Tillbehör
Tyvärr ingår inte pennan i år och teoretiskt sett får du en bärbar dator utan några ytterligare tillbehör. Beroende på paketet ingår dock en ROG-märkt laptopryggsäck, ROG Fusion II 300-headsetet samt ROG Gladius III-musen.
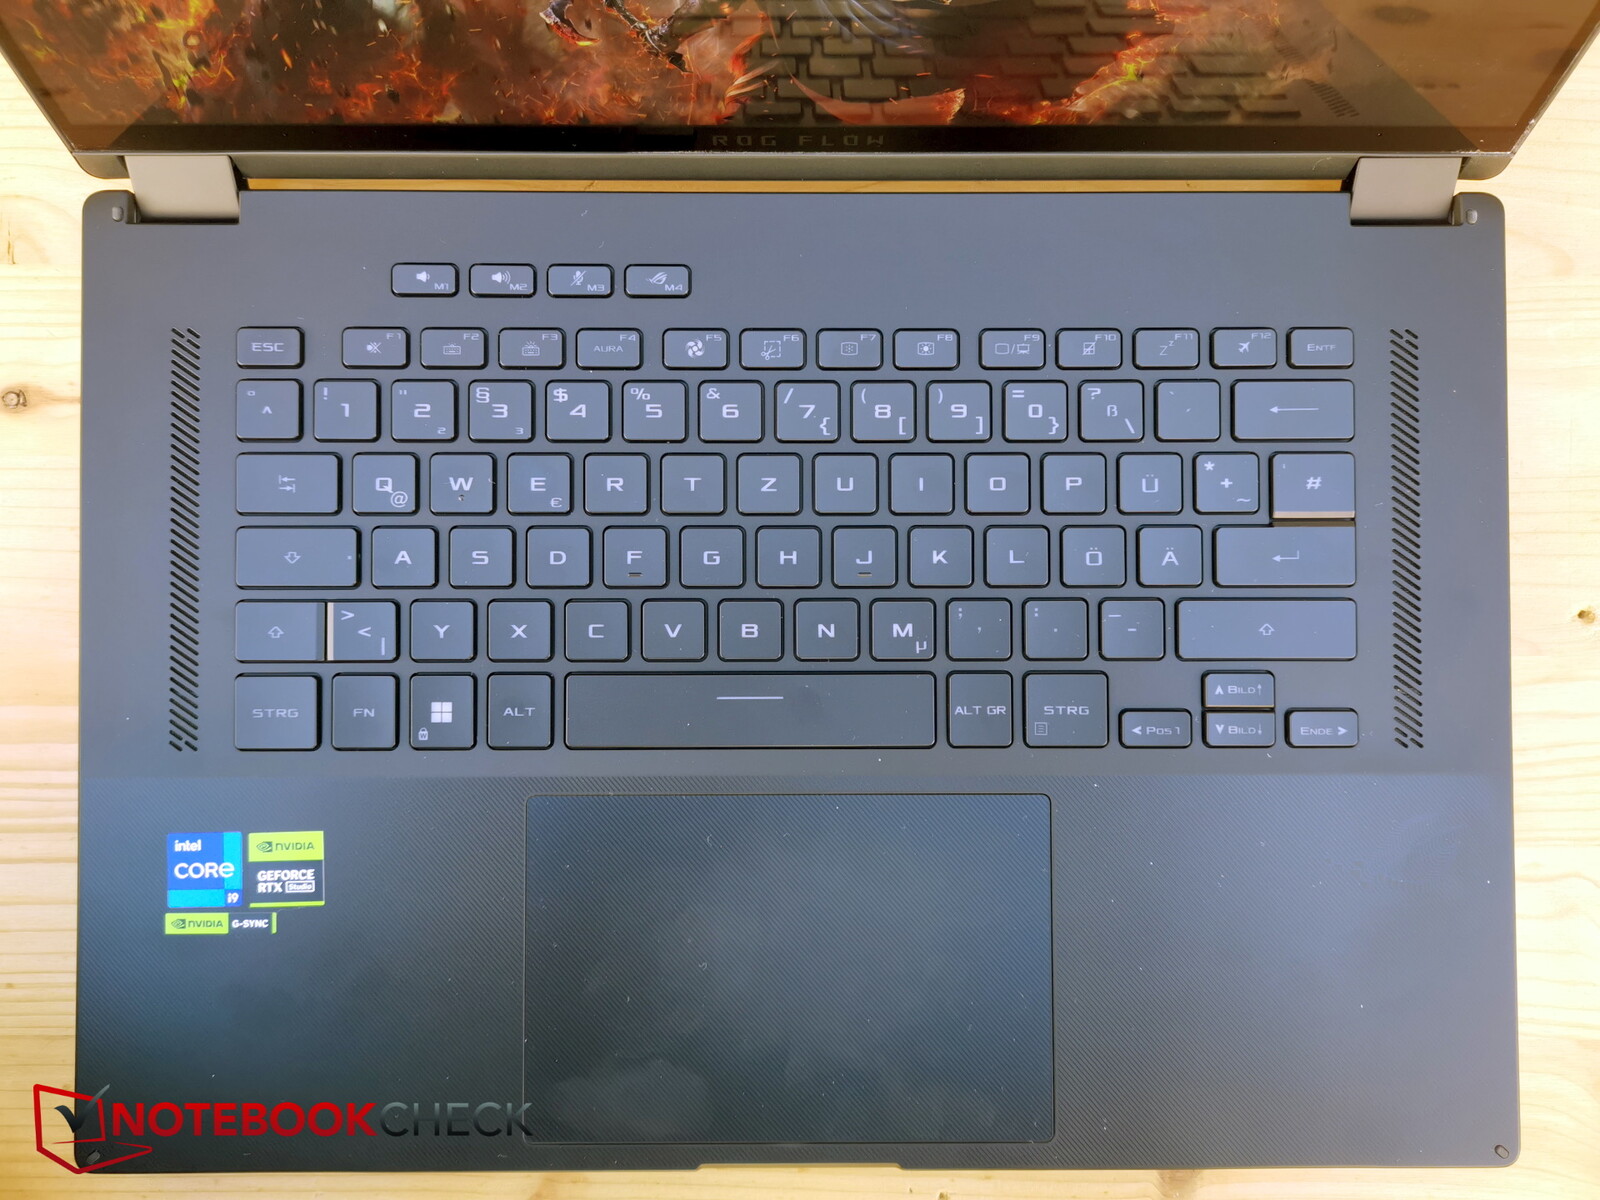
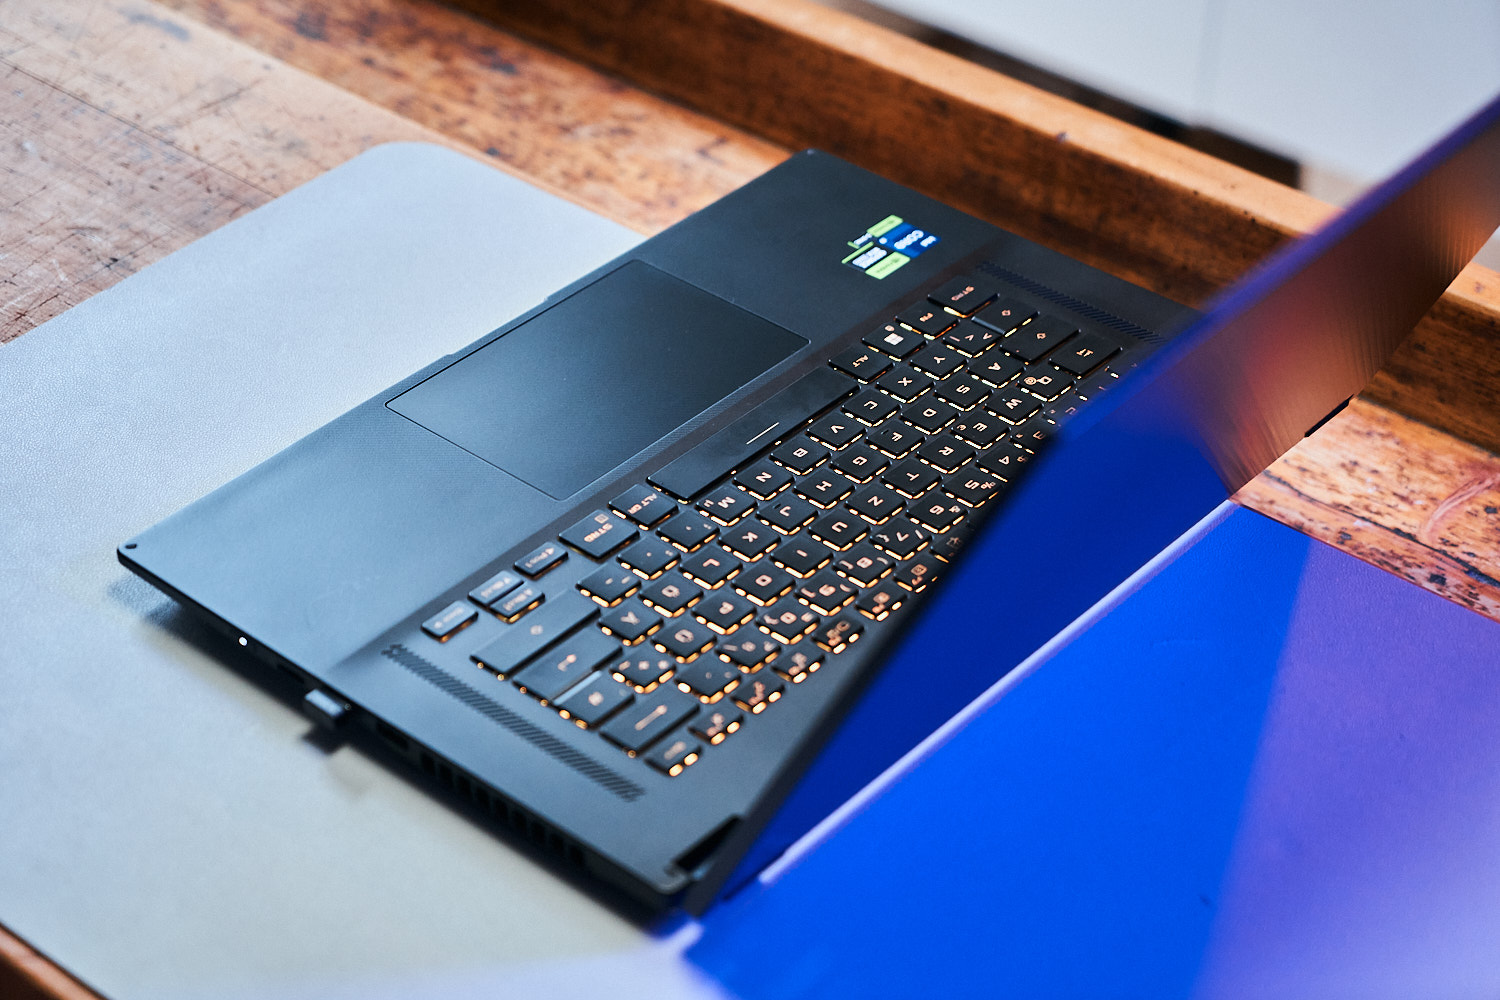
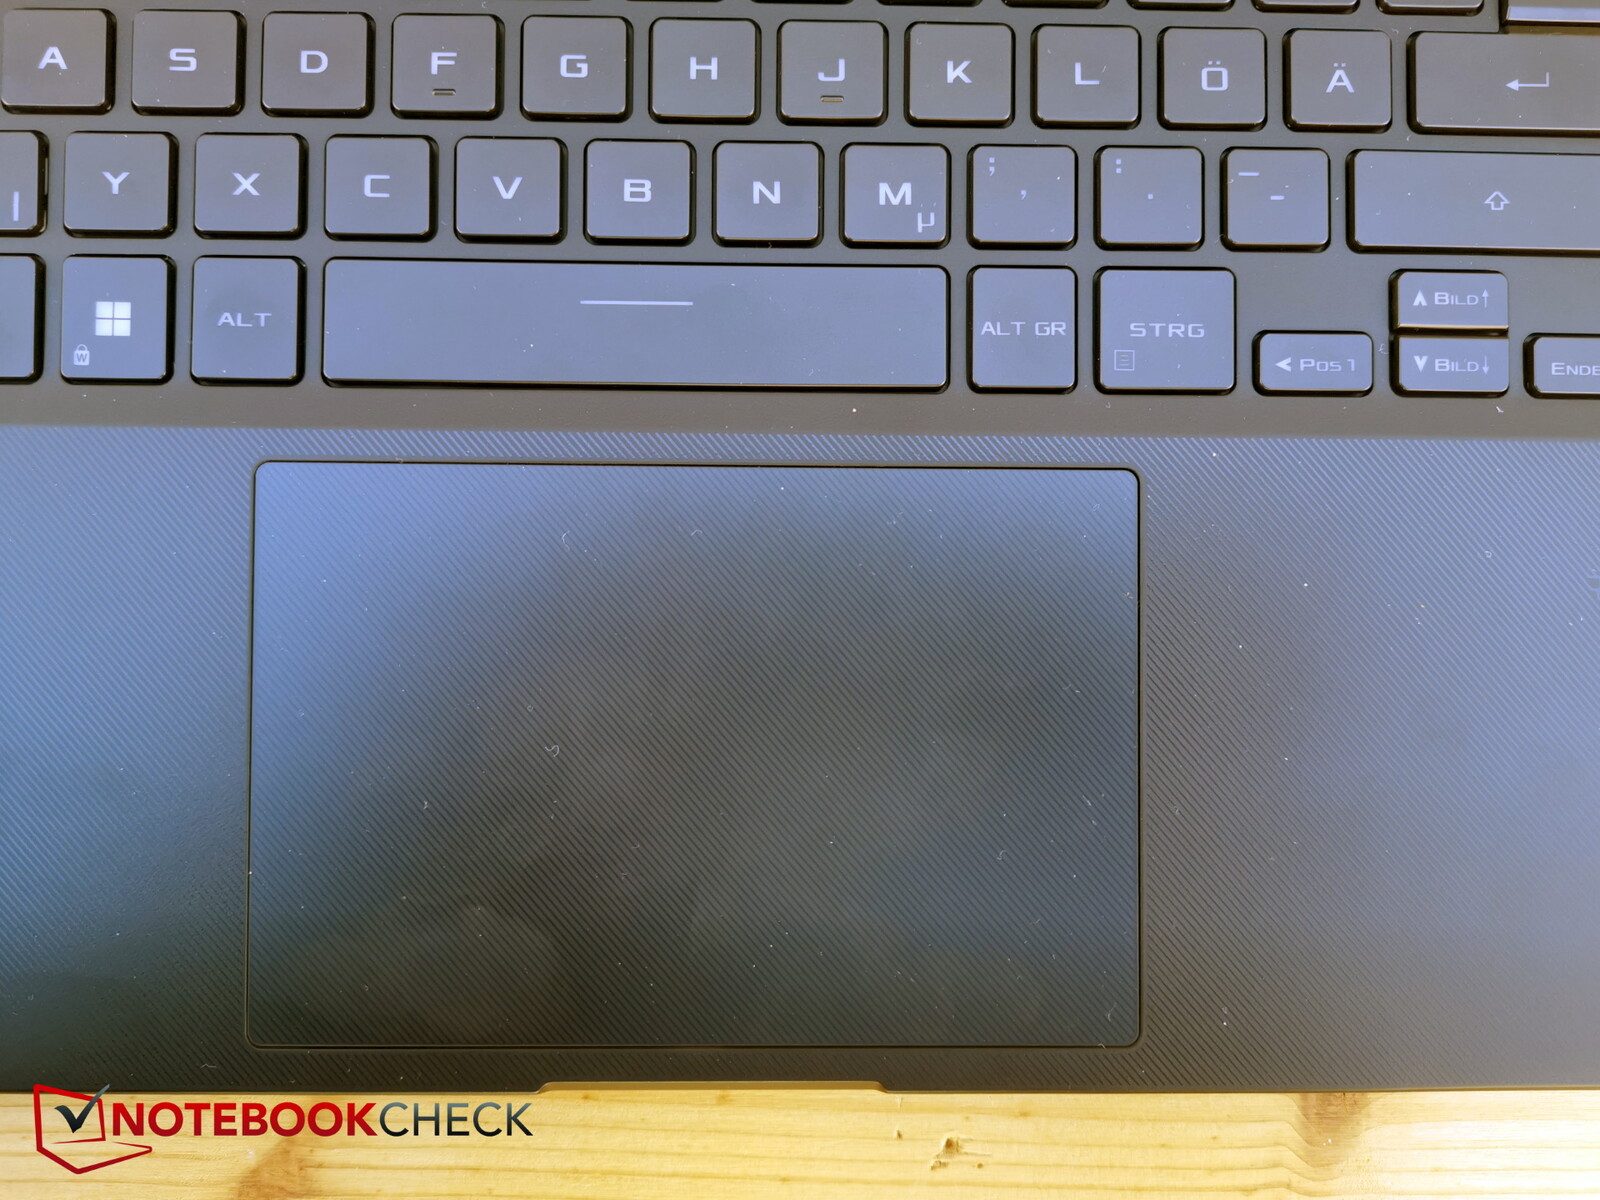
Inmatningsenheter - X16 har en stor pekplatta

Display - med eller utan mini-LED?
X16 har en 16-tums Asus TMX1603 eller TL160ADMP03-0 IPS-panel med pekskärmsfunktionalitet men utan mini-LED. Samma panel, om än i en variant utan pekfunktion, finns även i Asus ROG Strix G16. Det är en skärm i 16:10-format med 2560 x 1600 pixlar som stöder inmatning med pekpenna. Tyvärr, till skillnad från förra året då pennan ingick, måste den i år köpas separat.
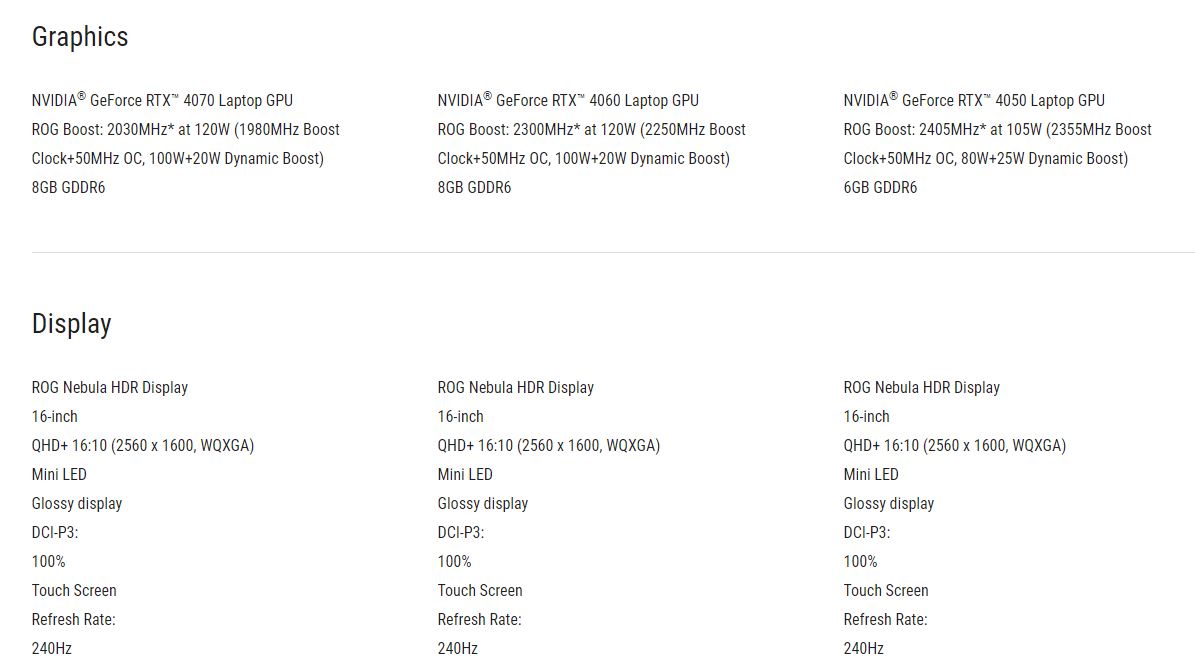
På samma sätt som förra året finns det också möjlighet att välja en panel med mini-LED-bakgrundsbelysning som har förbättrats ytterligare en gång: Antalet dimningszoner har fördubblats till 1 024, uppdateringsfrekvensen har ökat från 165 till 240 Hz och den maximala ljusstyrkan har ökat något till 1100 nits (HDR). Tyvärr har mini-LED-panelen (recenserad här) endast tillgänglig från RTX 4070eller modeller med högre specifikationer och finns därför inte i vår granskningsmodell.
Asus webbplats ger dock intrycket att alla modeller levereras med en mini-LED-skärm - även de med en RTX 4050 och RTX 4060. Så var uppmärksam när du köper!
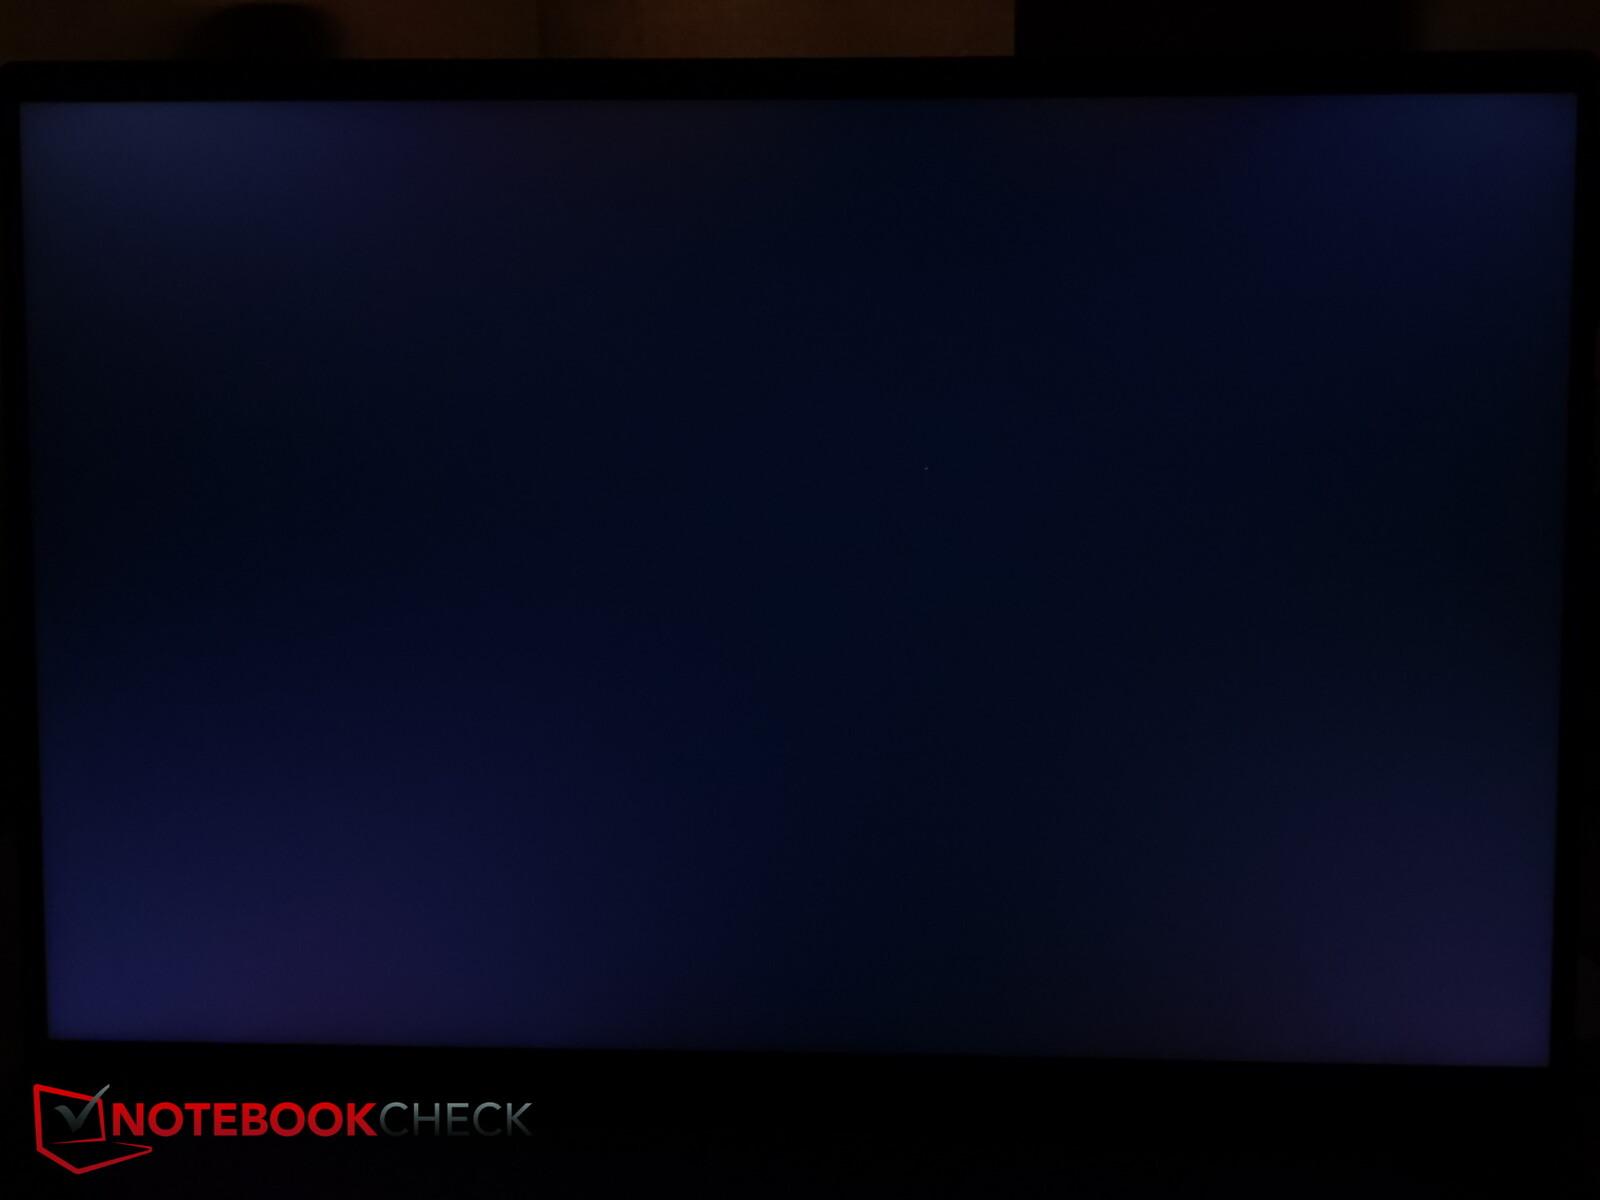
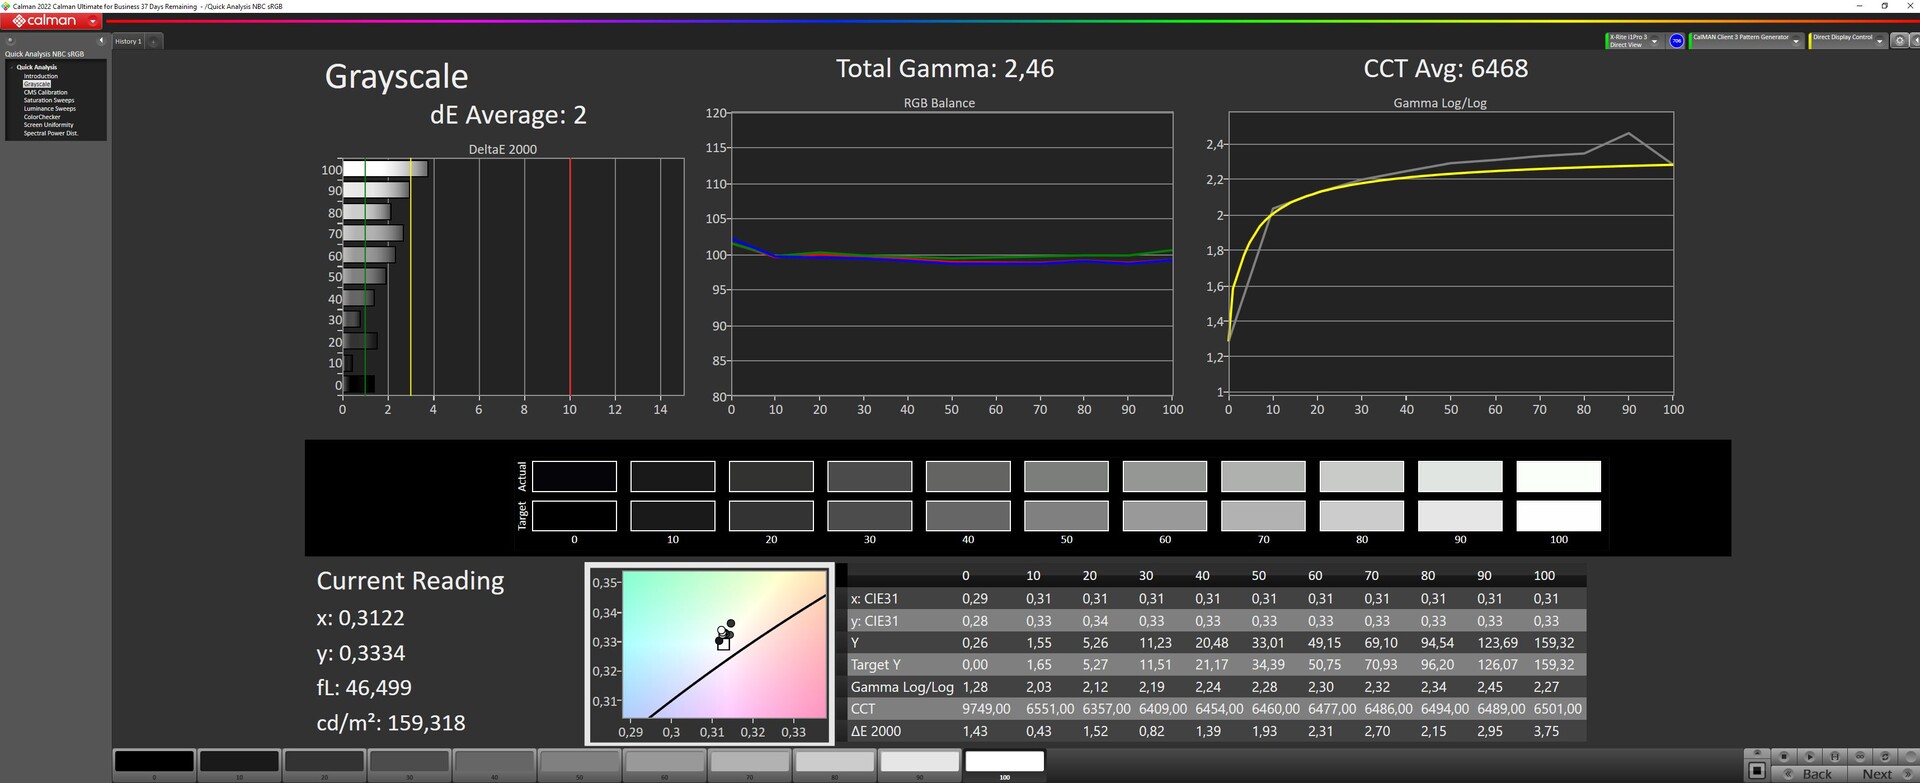
Men även utan mini-LED uppmätte vår standardmodell en genomsnittlig ljusstyrka på cirka 469 nits med en belysningsgrad på mycket goda 91 procent. Svartnivåerna är acceptabla 0,39 vilket ger ett kontrastförhållande på 1 246:1.
Svarstiderna är mycket snabba, det finns ingen anledning att oroa sig för PWM och backlight bleeding är endast mycket minimal med den är endast synlig längs den övre kanten.
| |||||||||||||||||||||||||
Distribution av ljusstyrkan: 91 %
Mitt på batteriet: 487 cd/m²
Kontrast: 1246:1 (Svärta: 0.39 cd/m²)
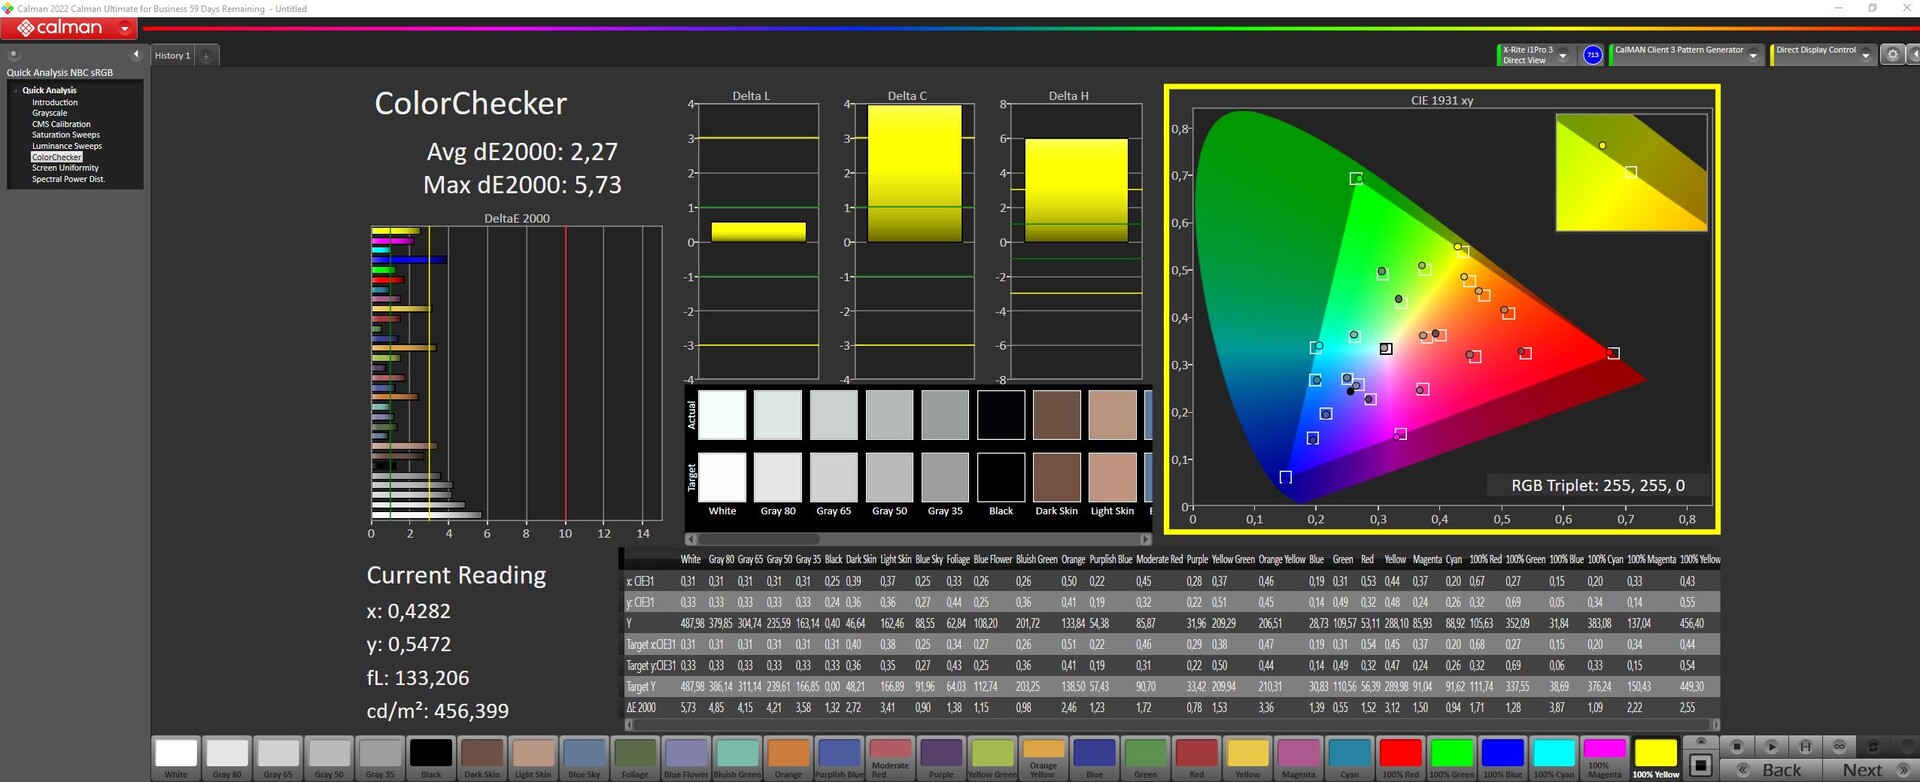
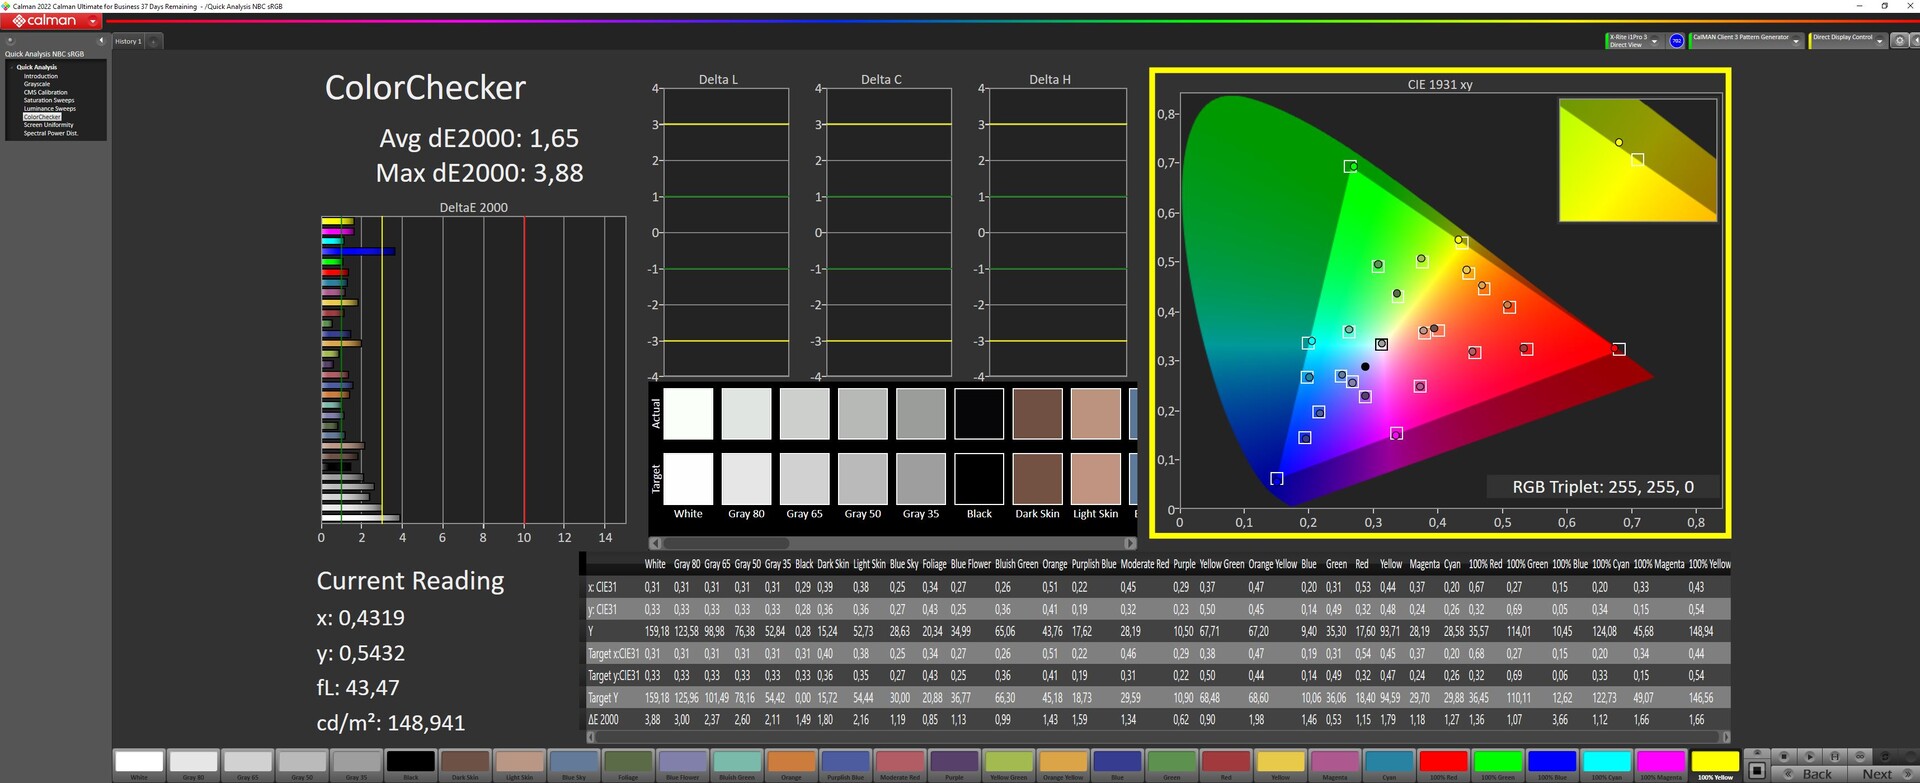
ΔE ColorChecker Calman: 2.27 | ∀{0.5-29.43 Ø4.71}
calibrated: 0.6
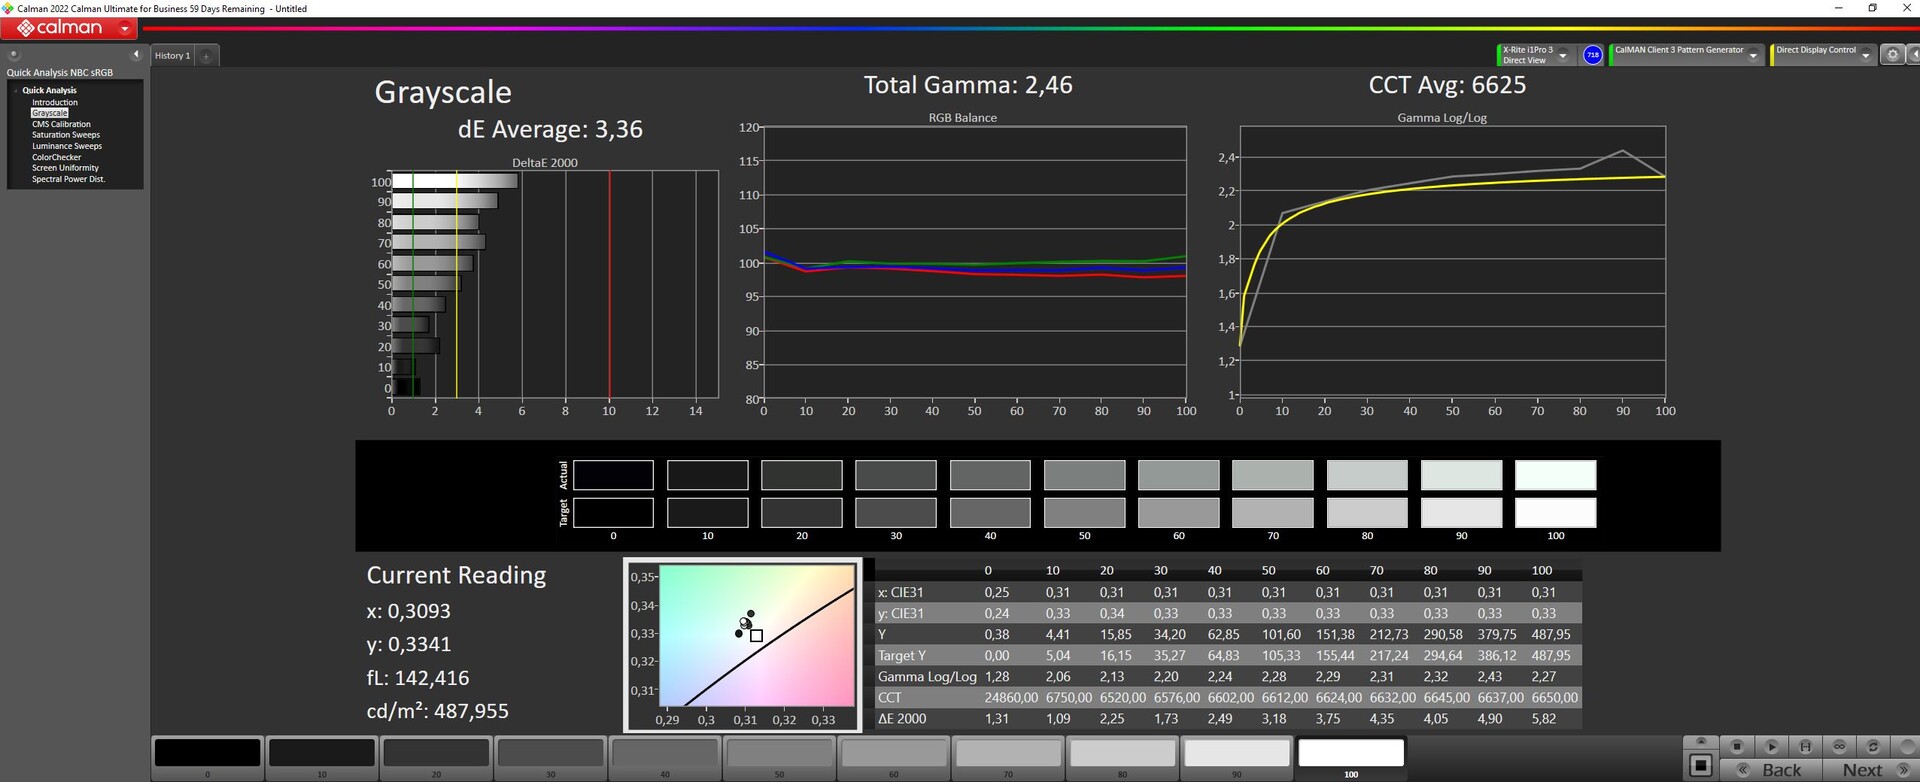
ΔE Greyscale Calman: 3.36 | ∀{0.09-98 Ø4.96}
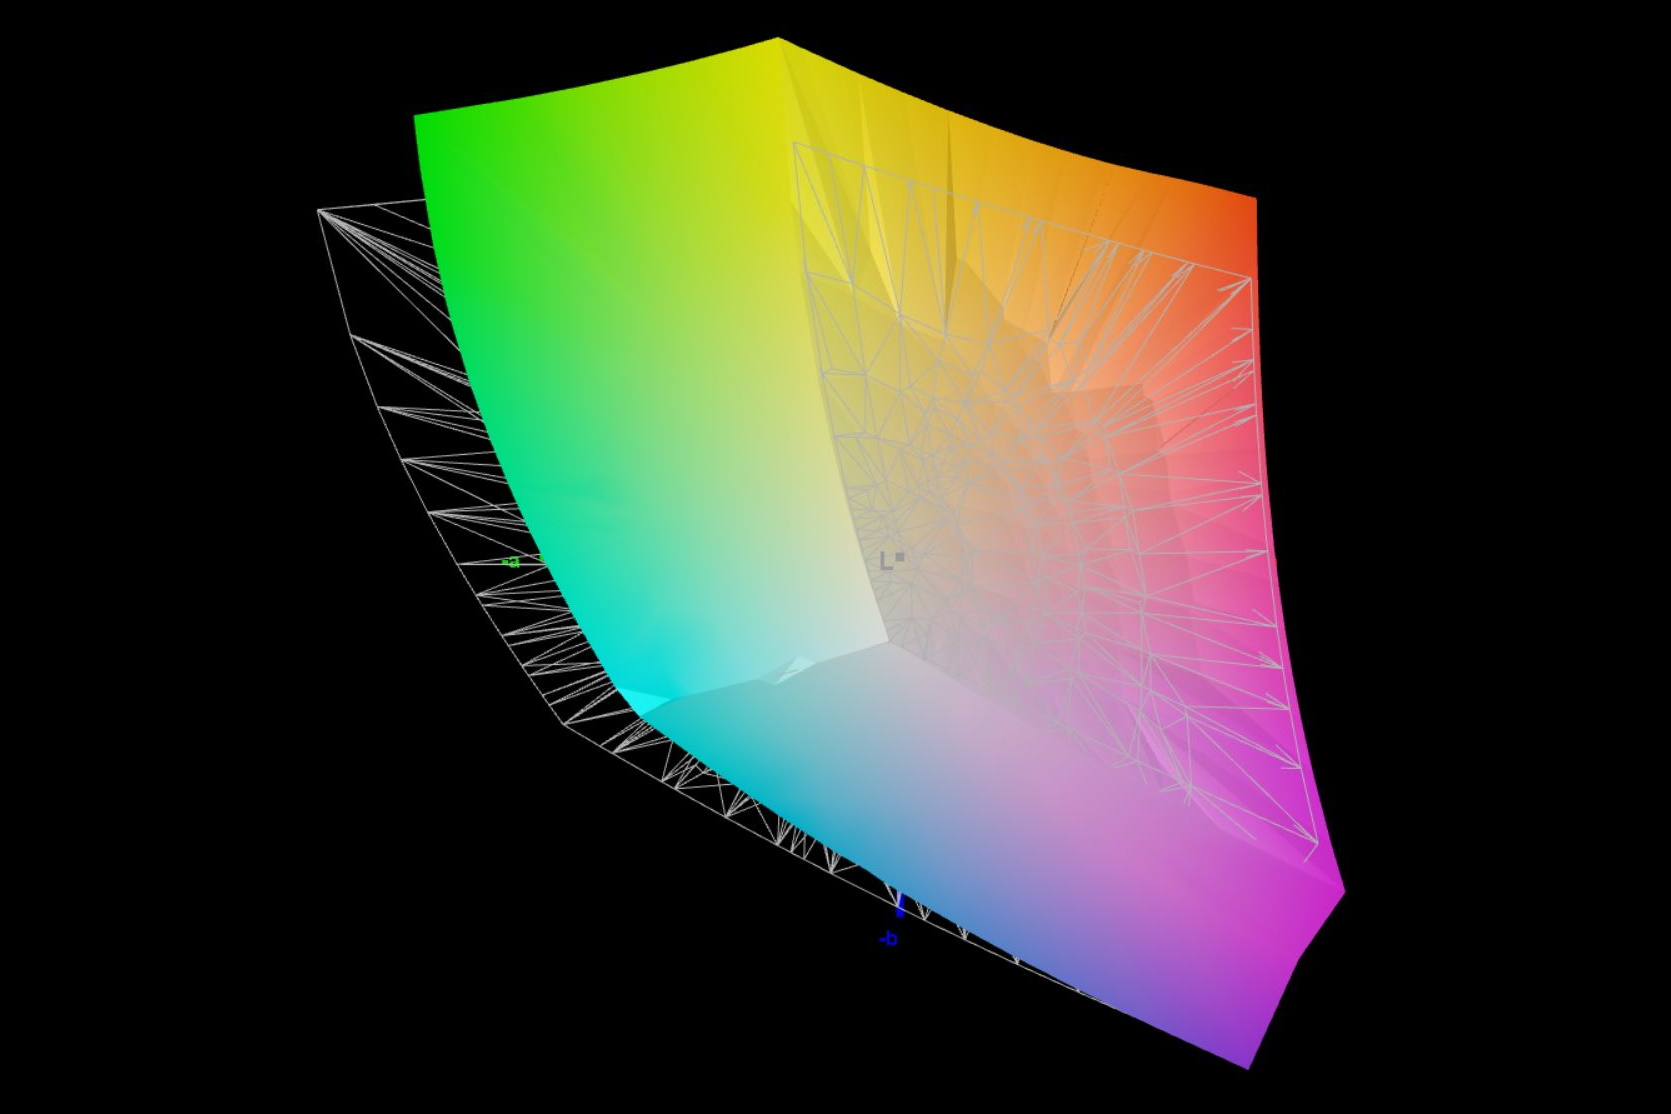
84.63% AdobeRGB 1998 (Argyll 3D)
99.92% sRGB (Argyll 3D)
96.61% Display P3 (Argyll 3D)
Gamma: 2.46
CCT: 6625 K
| Asus ROG Flow X16 GV601V TMX1603 (TL160ADMP03-0), IPS, 2560x1600, 16" | Asus ROG Flow X16 GV601RW-M5082W AUO B160QAN02.S, Mini LED, 2560x1600, 16.1" | Samsung Galaxy Book3 Ultra 16, i9-13900H RTX 4070 Samsung SDC4185 ATNA60CL03-0, OLED / AMOLED, 2880x1800, 16" | Lenovo Legion Pro 5 16IRX8 AU Optronics B160QAN03.1, IPS, 2560x1600, 16" | Lenovo Yoga Pro 7 14IRH G8 LEN145-3K, IPS, 3072x1920, 14.5" | MSI Katana 17 B13VFK B173HAN04.9, IPS LED, 1920x1080, 17.3" | |
|---|---|---|---|---|---|---|
| Display | 3% | 4% | -13% | 2% | -49% | |
| Display P3 Coverage (%) | 96.61 | 99.82 3% | 95.3 -1% | 71.2 -26% | 98.7 2% | 40.8 -58% |
| sRGB Coverage (%) | 99.92 | 99.99 0% | 99.1 -1% | 98.8 -1% | 100 0% | 61 -39% |
| AdobeRGB 1998 Coverage (%) | 84.63 | 90.21 7% | 97.4 15% | 73.3 -13% | 87.6 4% | 42.2 -50% |
| Response Times | -117% | 61% | -160% | -419% | -505% | |
| Response Time Grey 50% / Grey 80% * (ms) | 3.8 ? | 11 ? -189% | 2 ? 47% | 14.5 ? -282% | 31.5 ? -729% | 33 ? -768% |
| Response Time Black / White * (ms) | 7.6 ? | 11 ? -45% | 2 ? 74% | 10.4 ? -37% | 15.8 ? -108% | 26 ? -242% |
| PWM Frequency (Hz) | 7400 ? | 250 ? | ||||
| Screen | 16% | 2% | 8% | 26% | -111% | |
| Brightness middle (cd/m²) | 486 | 498 2% | 403 -17% | 405.7 -17% | 441 -9% | 267 -45% |
| Brightness (cd/m²) | 469 | 502 7% | 408 -13% | 368 -22% | 453 -3% | 256 -45% |
| Brightness Distribution (%) | 91 | 94 3% | 98 8% | 87 -4% | 92 1% | 93 2% |
| Black Level * (cd/m²) | 0.39 | 0.11 72% | 0.38 3% | 0.34 13% | 0.21 46% | |
| Contrast (:1) | 1246 | 4527 263% | 1068 -14% | 1297 4% | 1271 2% | |
| Colorchecker dE 2000 * | 2.27 | 1.87 18% | 2.63 -16% | 1.65 27% | 0.6 74% | 4.7 -107% |
| Colorchecker dE 2000 max. * | 5.73 | 6.15 -7% | 4.07 29% | 4.2 27% | 1.3 77% | 20.4 -256% |
| Colorchecker dE 2000 calibrated * | 0.6 | 1.94 -223% | 0.53 12% | 0.6 -0% | 4.5 -650% | |
| Greyscale dE 2000 * | 3.36 | 3.15 6% | 2.69 20% | 1.2 64% | 0.8 76% | 1.5 55% |
| Gamma | 2.46 89% | 330.95 1% | 2.48 89% | 2.3 96% | 2.2 100% | 2.12 104% |
| CCT | 6625 98% | 7294 89% | 6907 94% | 6453 101% | 6597 99% | 6552 99% |
| Totalt genomsnitt (program/inställningar) | -33% /
-6% | 22% /
13% | -55% /
-20% | -130% /
-43% | -222% /
-154% |
* ... mindre är bättre
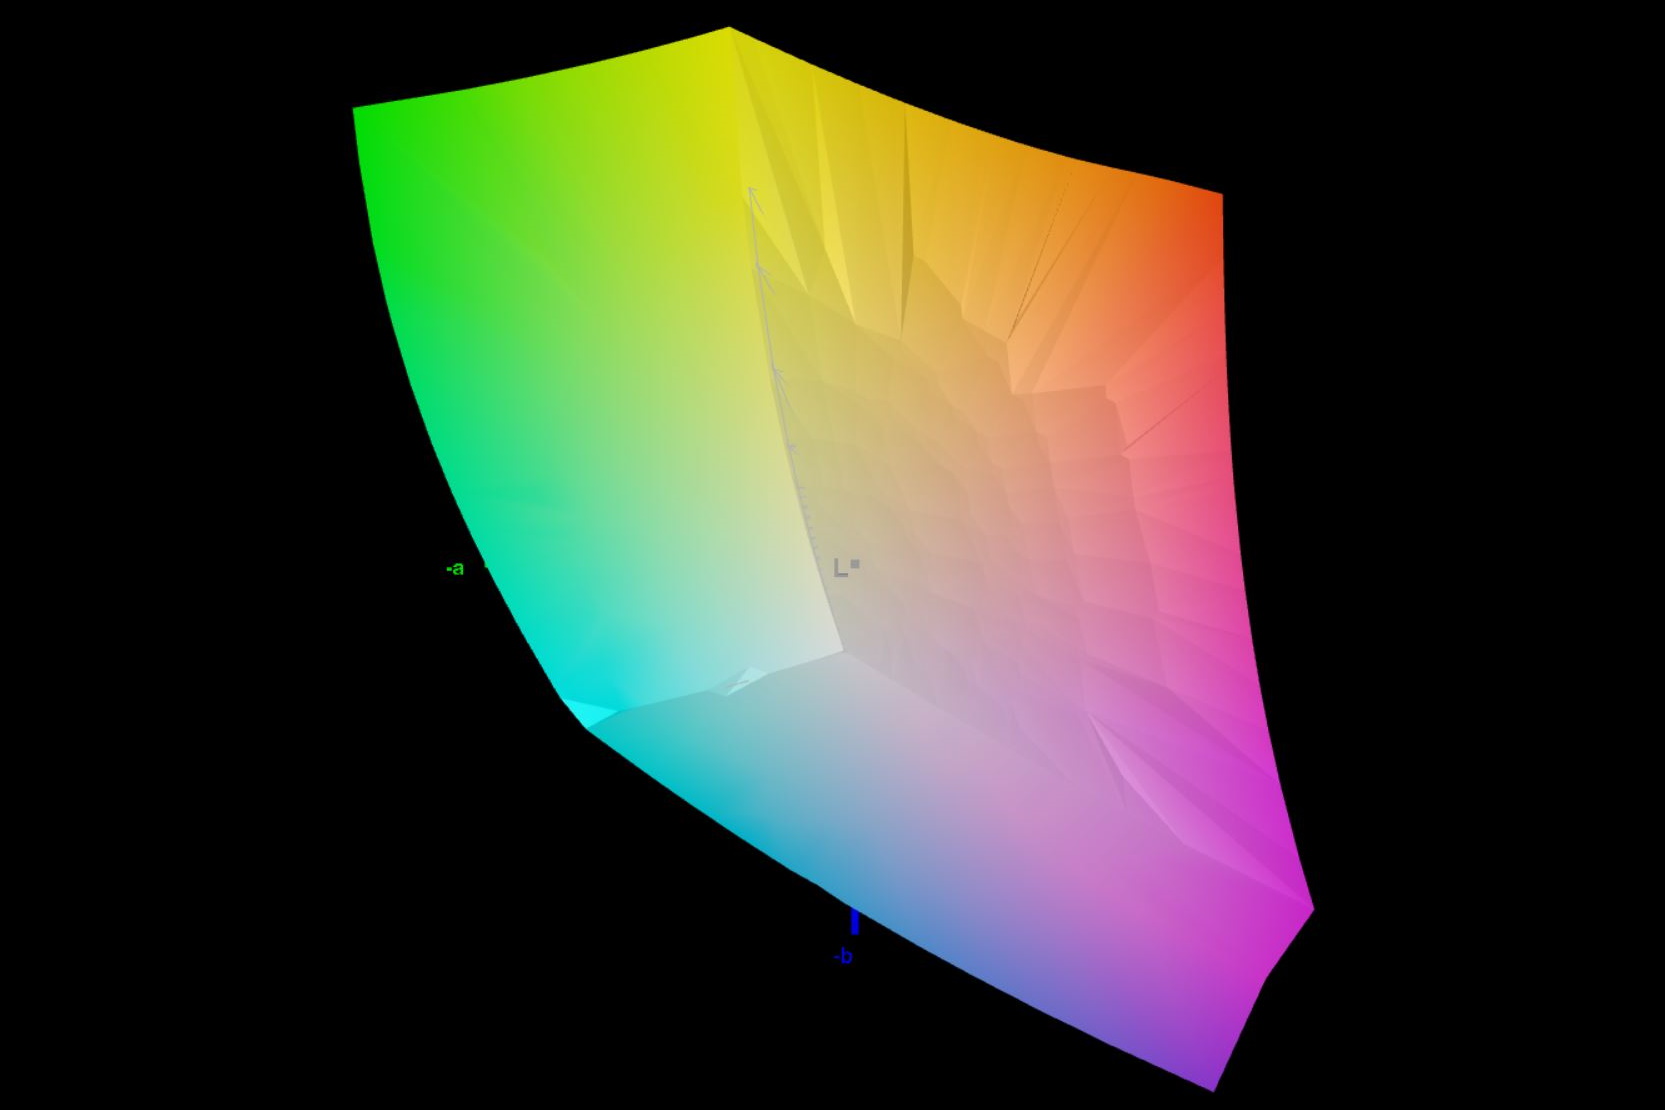
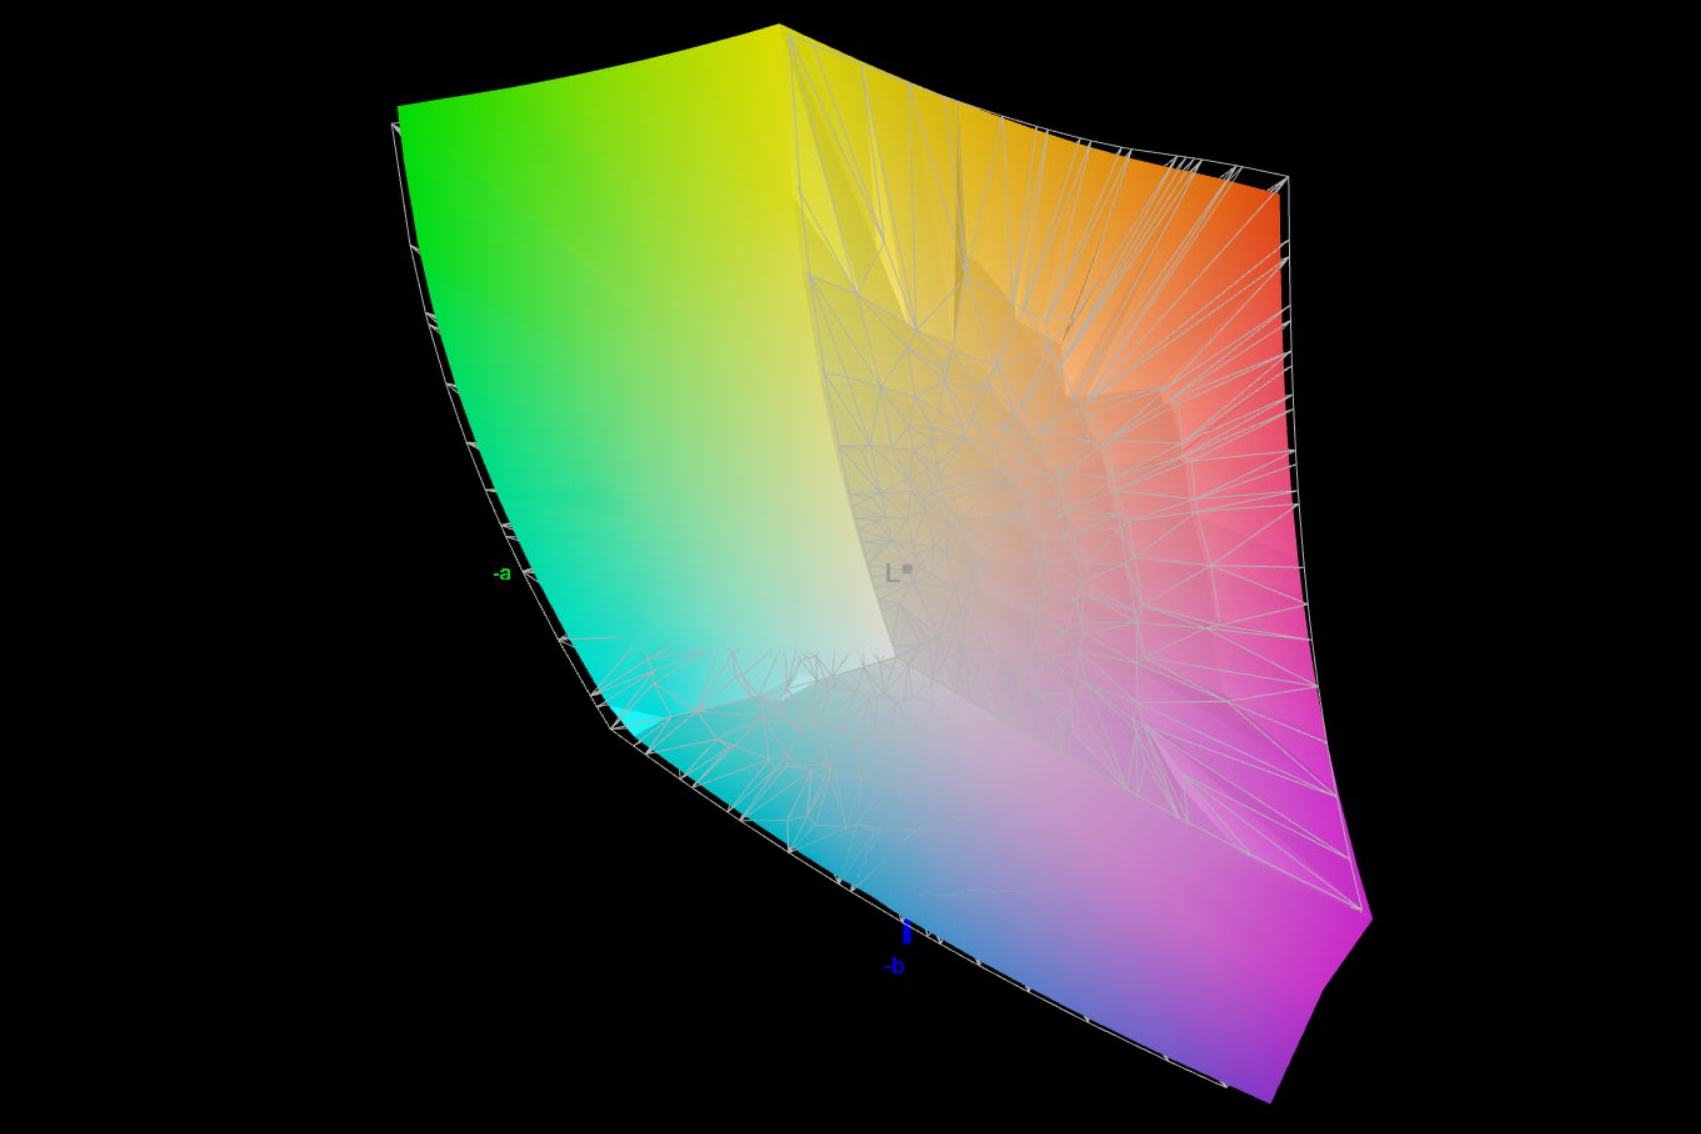
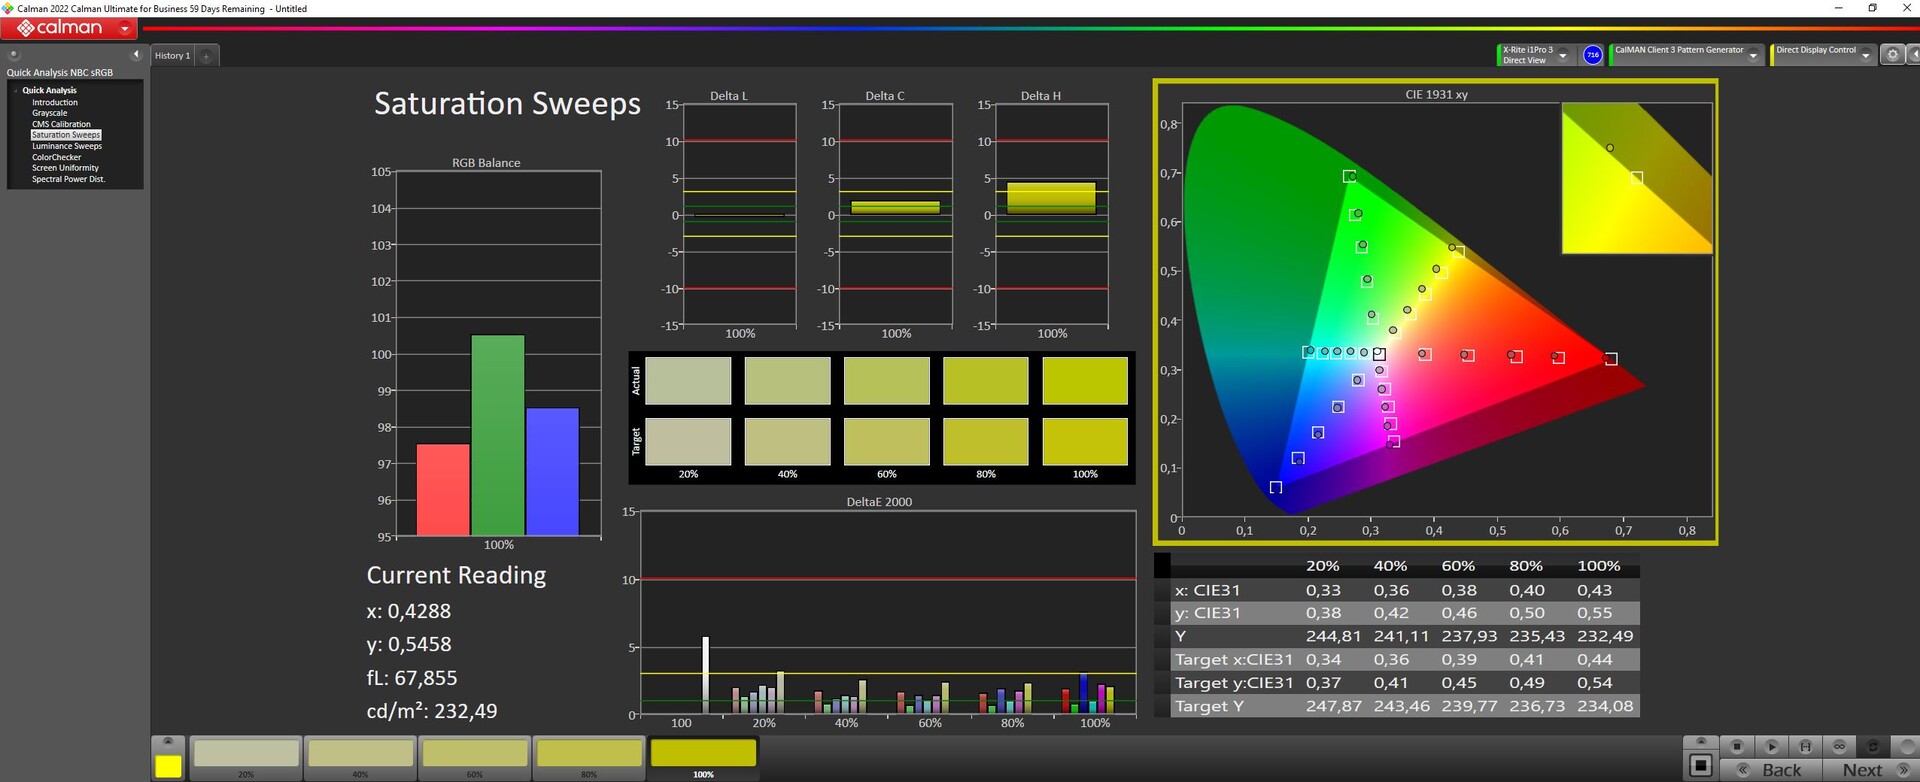
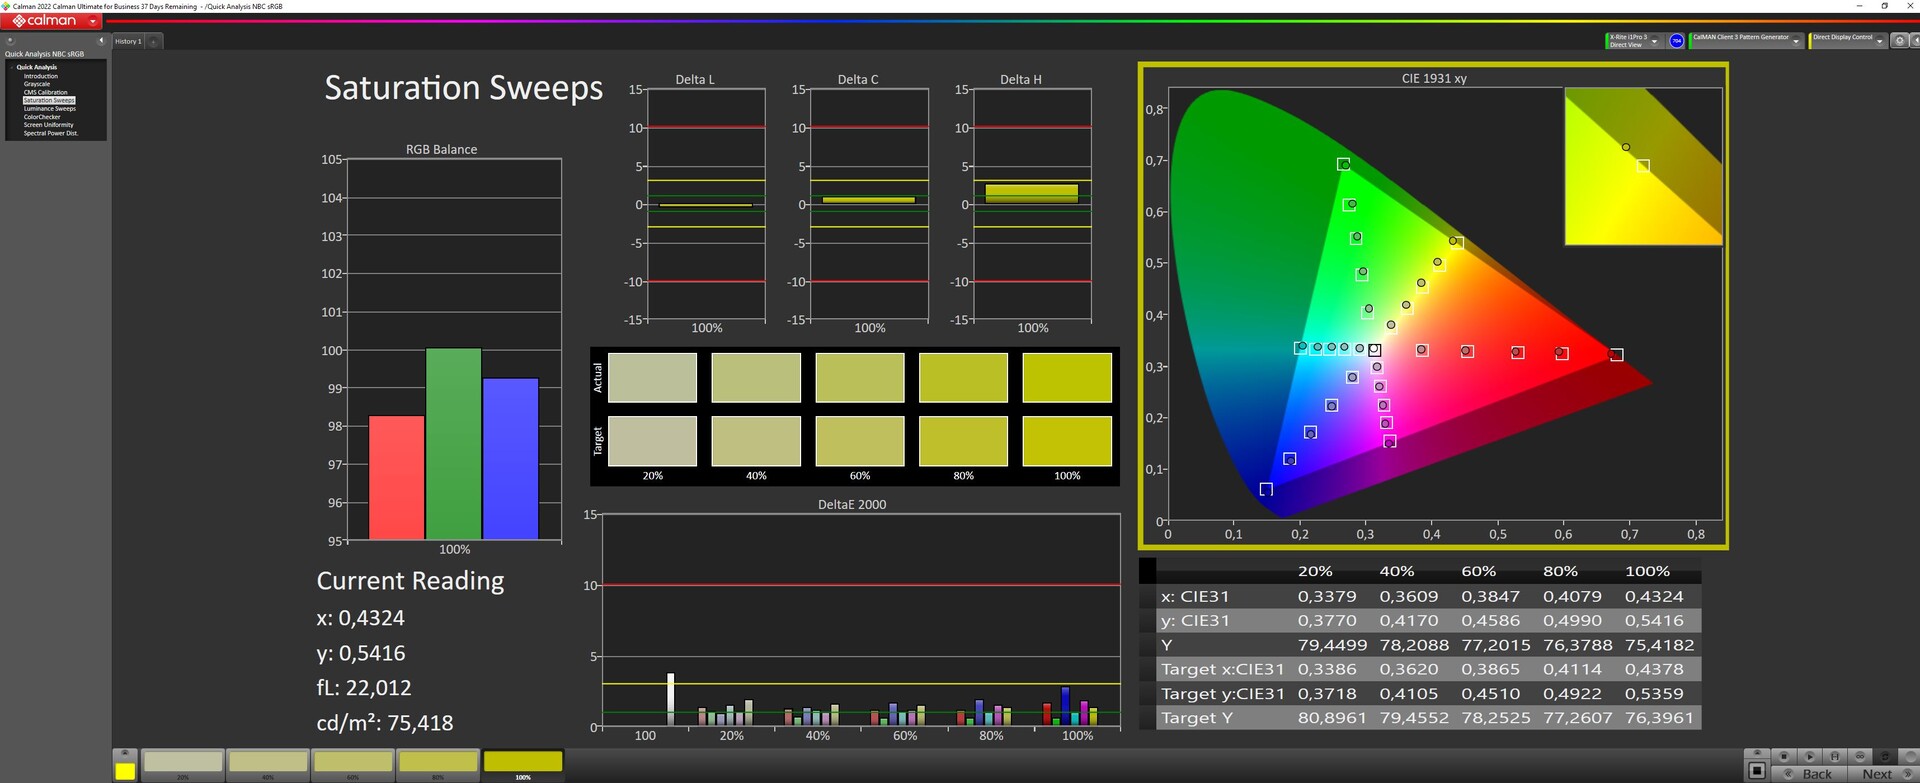
Asus marknadsför enheten med 100 procent DCI P3 och vi uppmätte cirka 97 procent. AdobeRGB täcks till cirka 85 procent och sRGB helt.
För bättre färgåtergivning är det bra att minska X16:s ljusstyrka till ca 50 procent. Därefter förbättras gråskalans DeltaE från 3,36 till endast 2. Dessutom sjunker ColorCheckers DeltaE ytterligare. En ny kalibrering med i1Profiler är egentligen inte meningsfull.
Visa svarstider
| ↔ Svarstid svart till vitt | ||
|---|---|---|
| 7.6 ms ... stiga ↗ och falla ↘ kombinerat | ↗ 4 ms stiga | 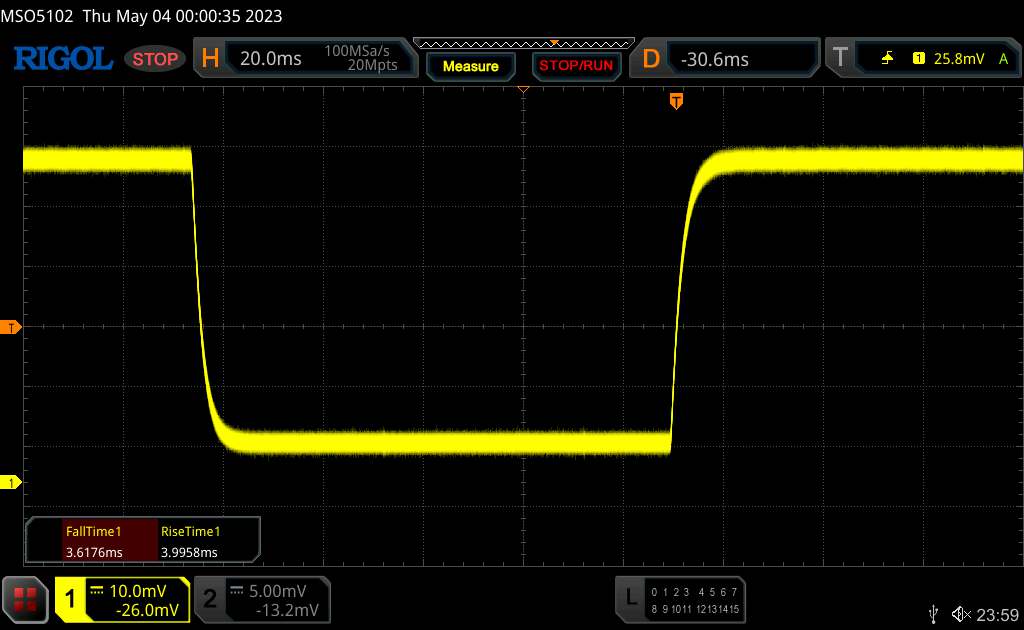 |
| ↘ 3.6 ms hösten | ||
| Skärmen visar väldigt snabba svarsfrekvenser i våra tester och borde vara mycket väl lämpad för fartfyllt spel. I jämförelse sträcker sig alla testade enheter från 0.1 (minst) till 240 (maximalt) ms. » 22 % av alla enheter är bättre. Det betyder att den uppmätta svarstiden är bättre än genomsnittet av alla testade enheter (19.8 ms). | ||
| ↔ Svarstid 50 % grått till 80 % grått | ||
| 3.8 ms ... stiga ↗ och falla ↘ kombinerat | ↗ 1.8 ms stiga | 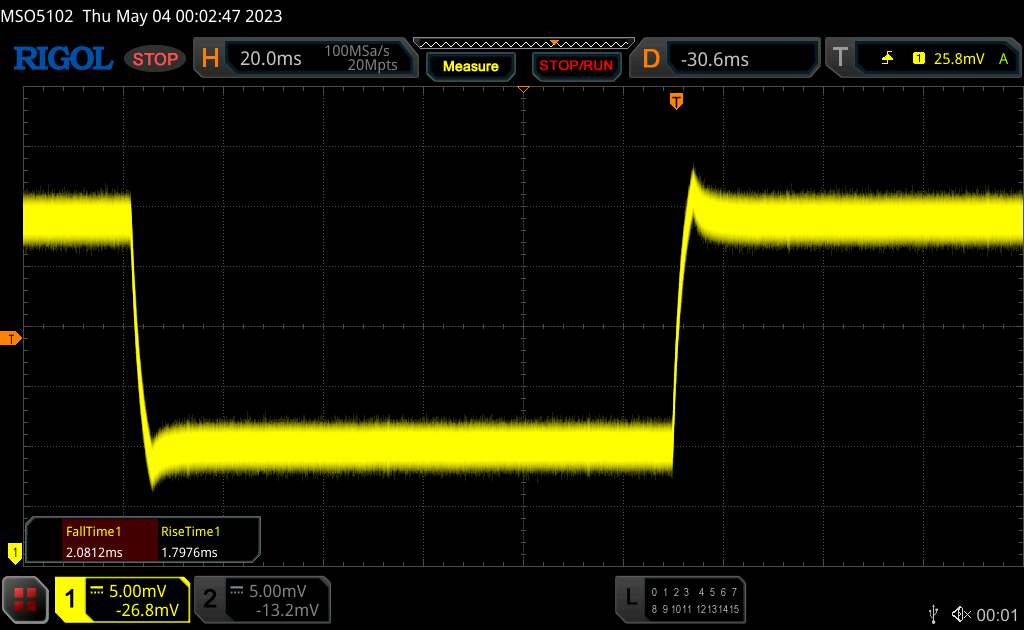 |
| ↘ 2 ms hösten | ||
| Skärmen visar väldigt snabba svarsfrekvenser i våra tester och borde vara mycket väl lämpad för fartfyllt spel. I jämförelse sträcker sig alla testade enheter från 0.165 (minst) till 636 (maximalt) ms. » 15 % av alla enheter är bättre. Det betyder att den uppmätta svarstiden är bättre än genomsnittet av alla testade enheter (31 ms). | ||
Skärmflimmer / PWM (Puls-Width Modulation)
| Skärmflimmer / PWM upptäcktes inte | 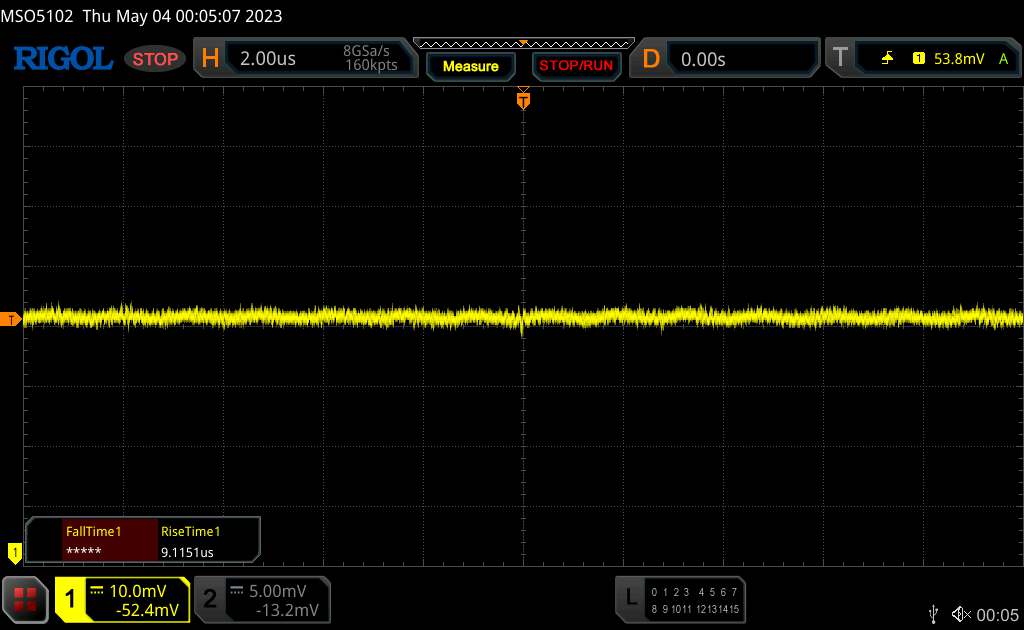 | ||
Som jämförelse: 52 % av alla testade enheter använder inte PWM för att dämpa skärmen. Om PWM upptäcktes mättes ett medelvärde av 7754 (minst: 5 - maximum: 343500) Hz. | |||
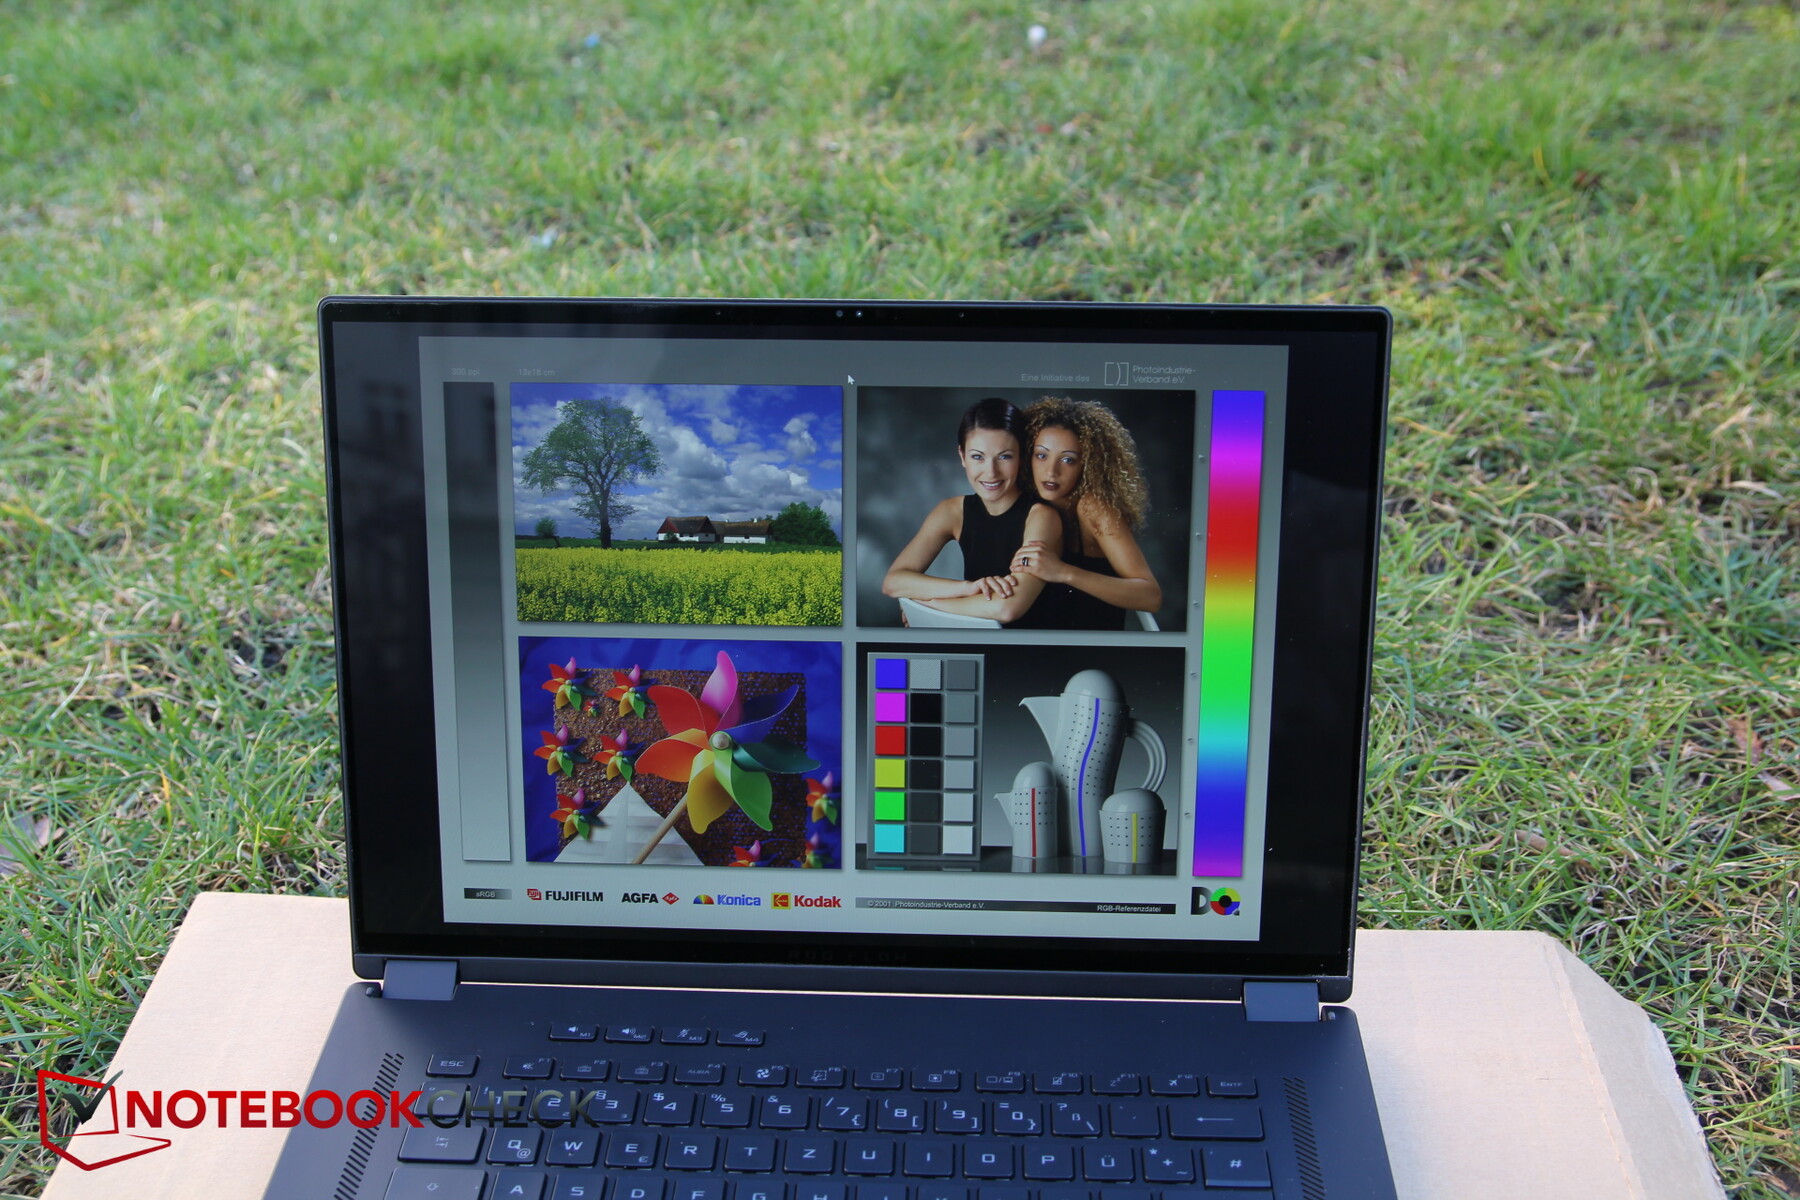
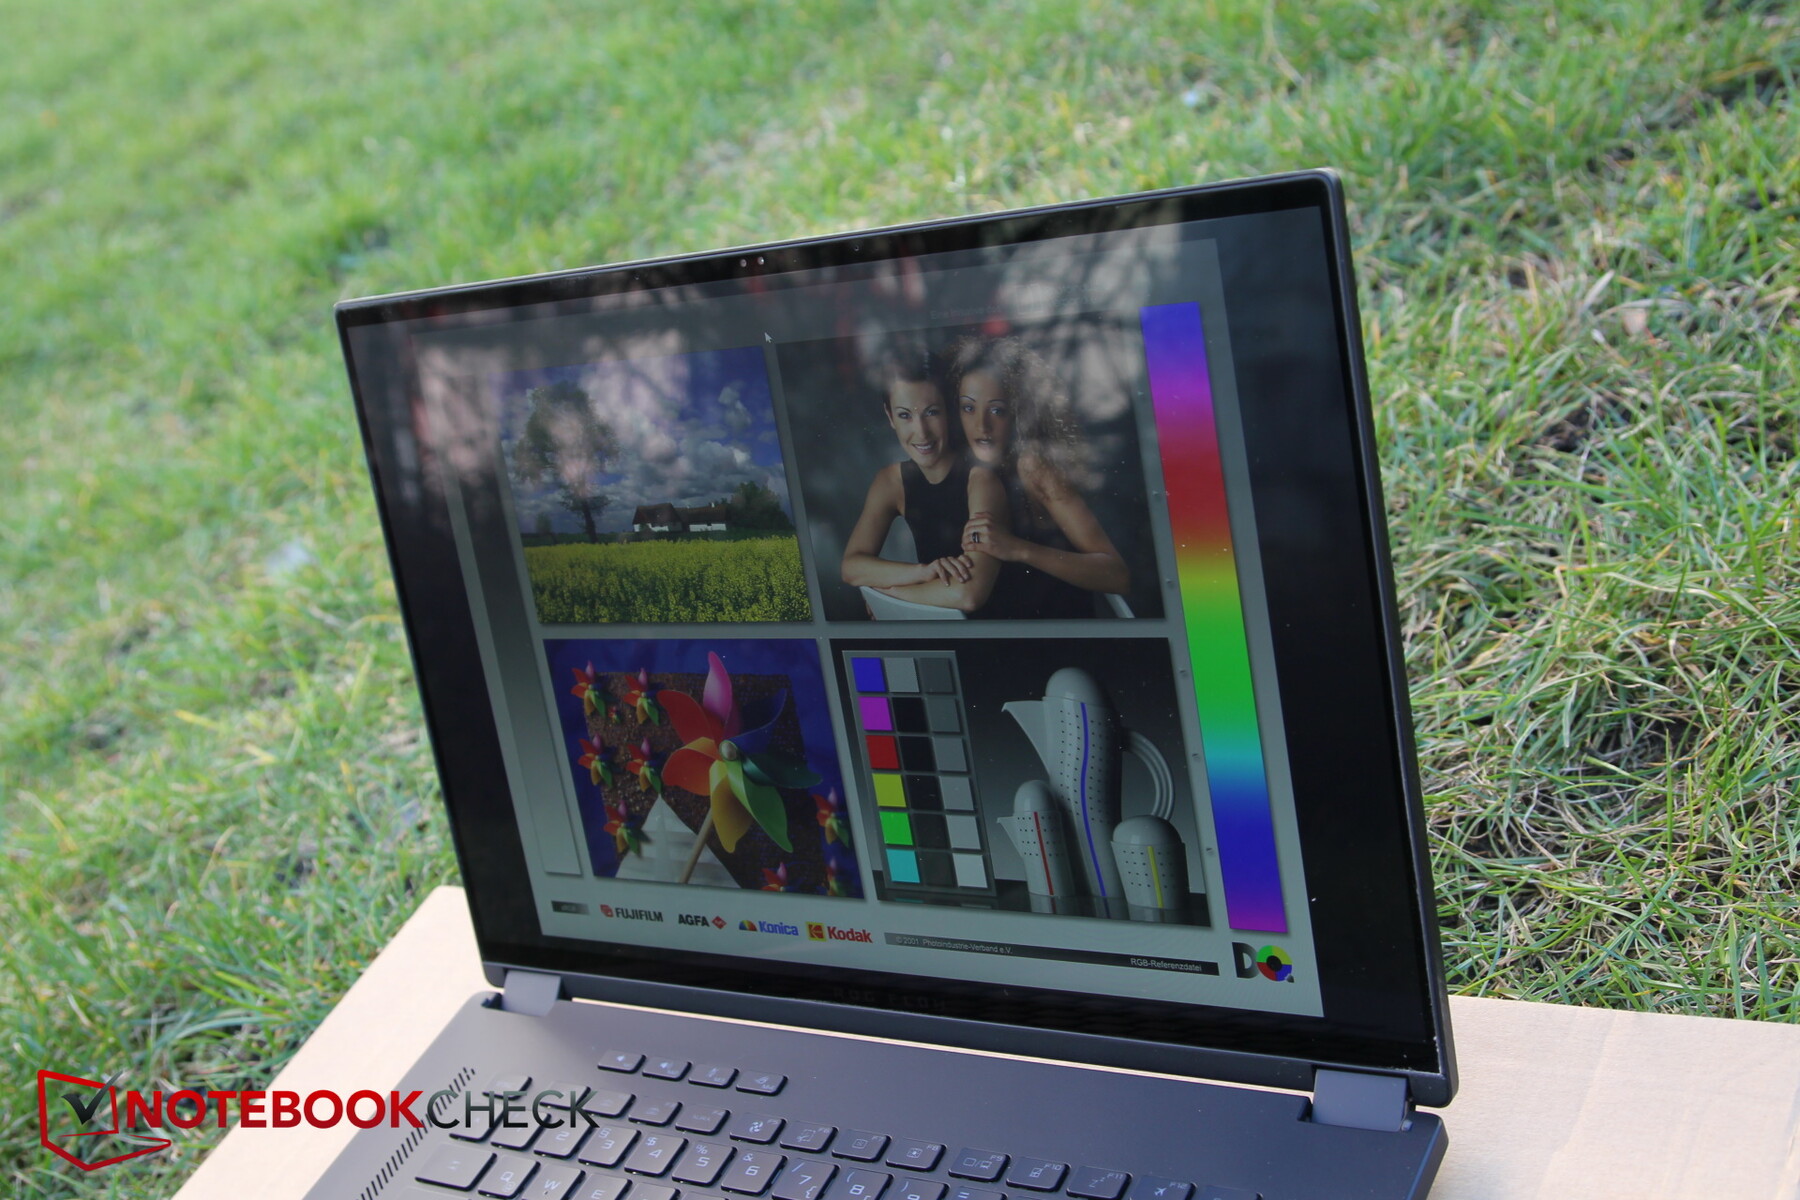
Utomhus är den mycket höga ljusstyrkan till hjälp i både direkt solljus och skugga. Vid betraktning från vida vinklar försämrar den blanka pekskärmen visningsupplevelsen.

Prestanda - En kraftfull Asus-platta
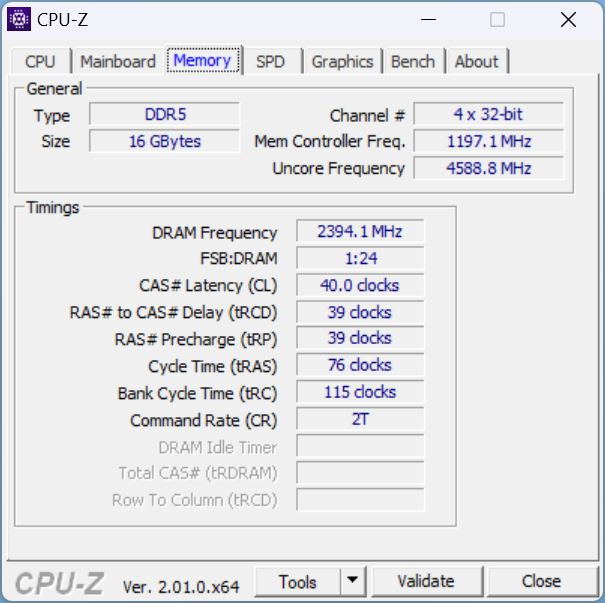
Alla konfigurationer har Core i9-13900H gemensamt. Detta kombineras valfritt med enRTX 4050, RTX 4060 eller RTX 4070. Enligt webbplatsen är SKU:erna med de två svagare grafikkorten endast utrustade med 8 GB RAM-minne, medan RTX 4070-konfigurationen kommer med 16 GB. Vår granskningsenhet är dock utrustad med en RTX 4060 och 16 GB RAM. Det ser ut som Asus kan ha uppgraderat vår granskningsmodell här. Bortsett från det kan enheten utrustas med upp till 64 GB RAM.

Testförhållanden
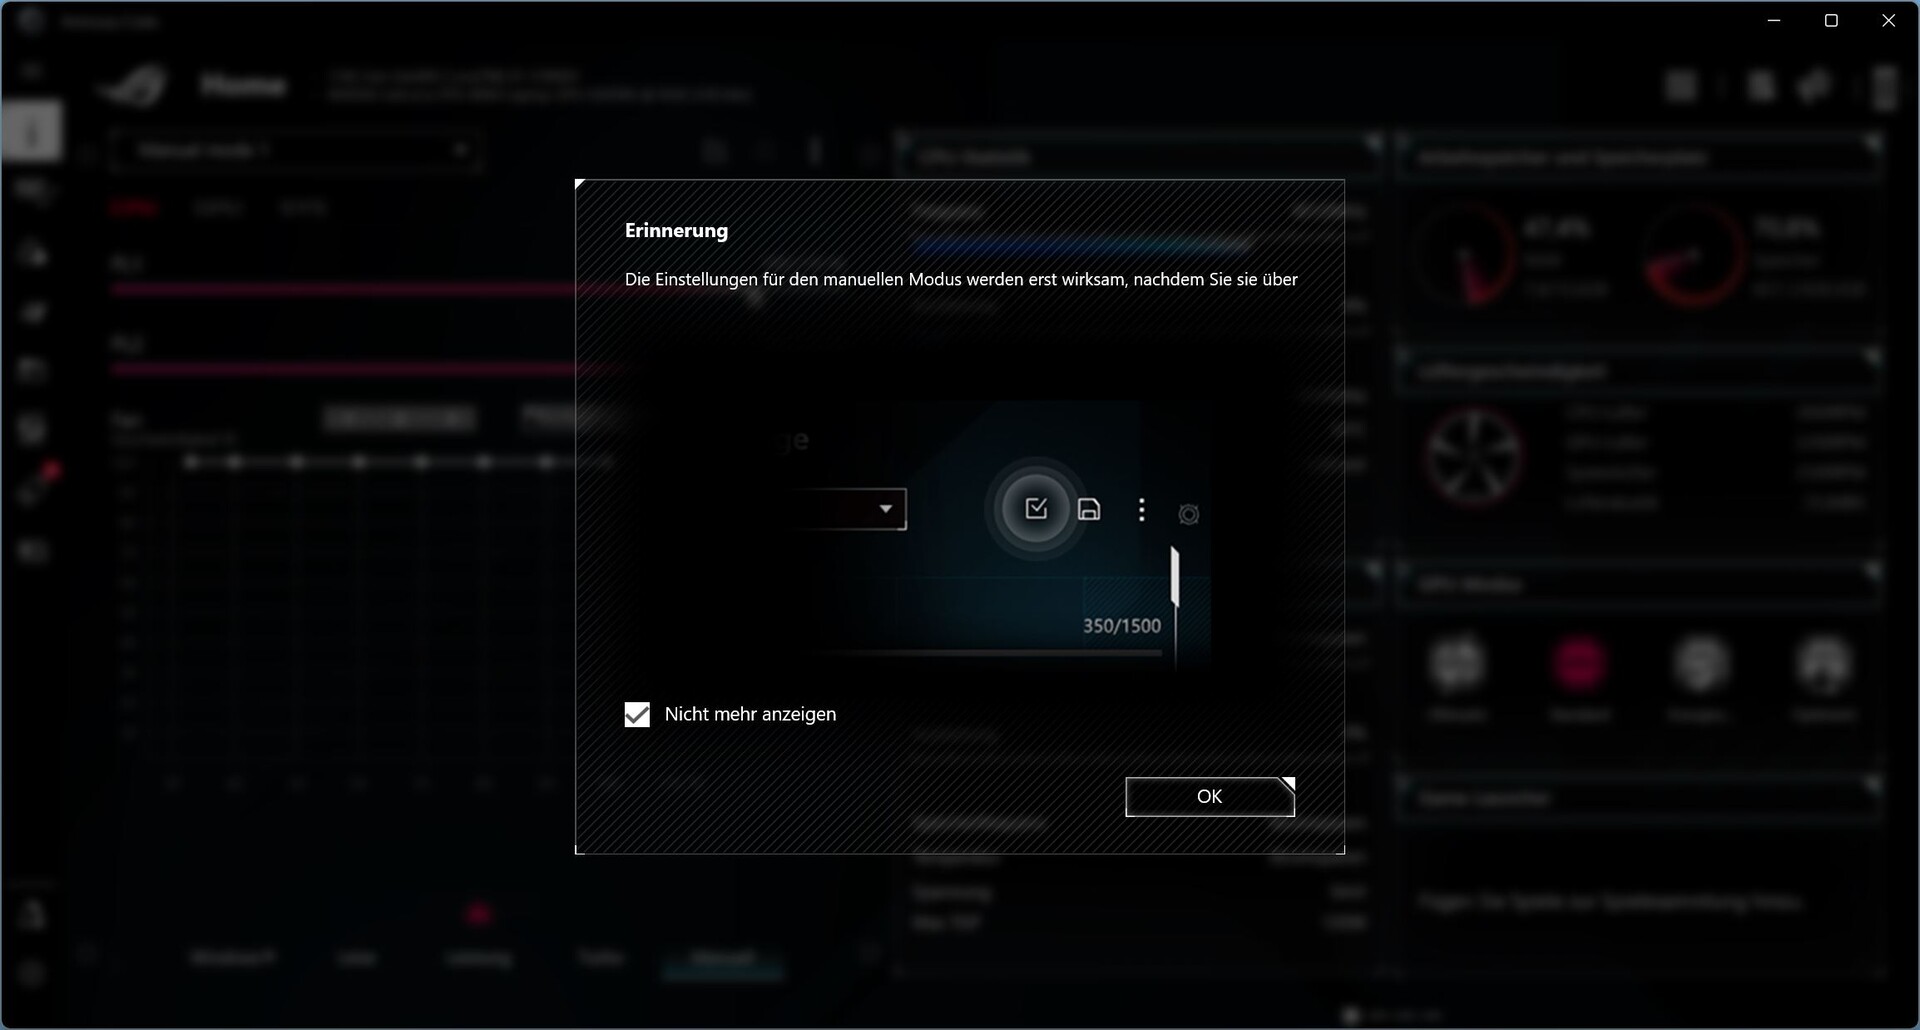
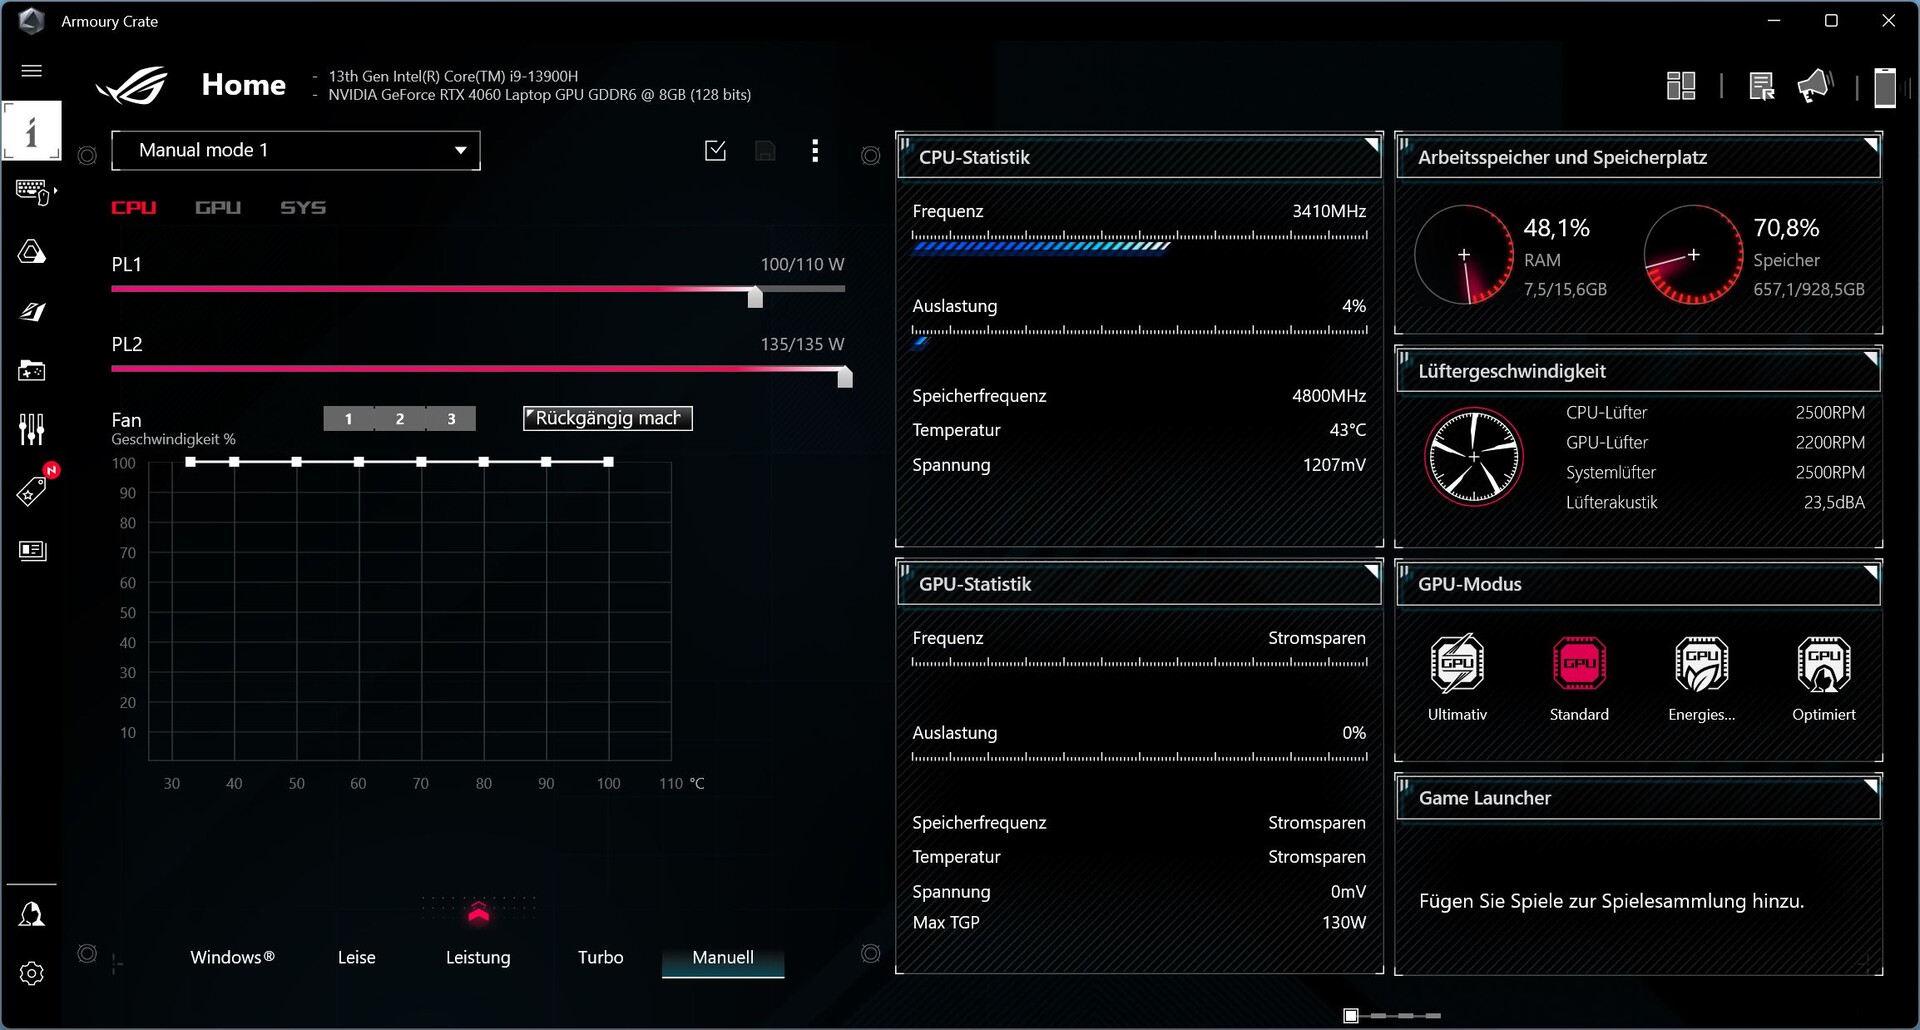
Asus bärbara speldatorer har alltid två förinstallerade appar från tillverkaren som nästan påminner lite om bloatware. MyAsus ansvarar för supportfrågor medan Armory Crate agerar kontrollcenter och, som tyvärr är vanligt nuförtiden, datainsamling. Appen är inte särskilt mogen ännu, särskilt inte när det gäller översättning. Det finns ständigt saknade eller avskurna delar. Dessutom uppdaterar appen ibland sig själv frivilligt när den startas, vilket innebär att användaren måste vänta länge innan han får tillgång till saker som prestandalägen - irriterande!
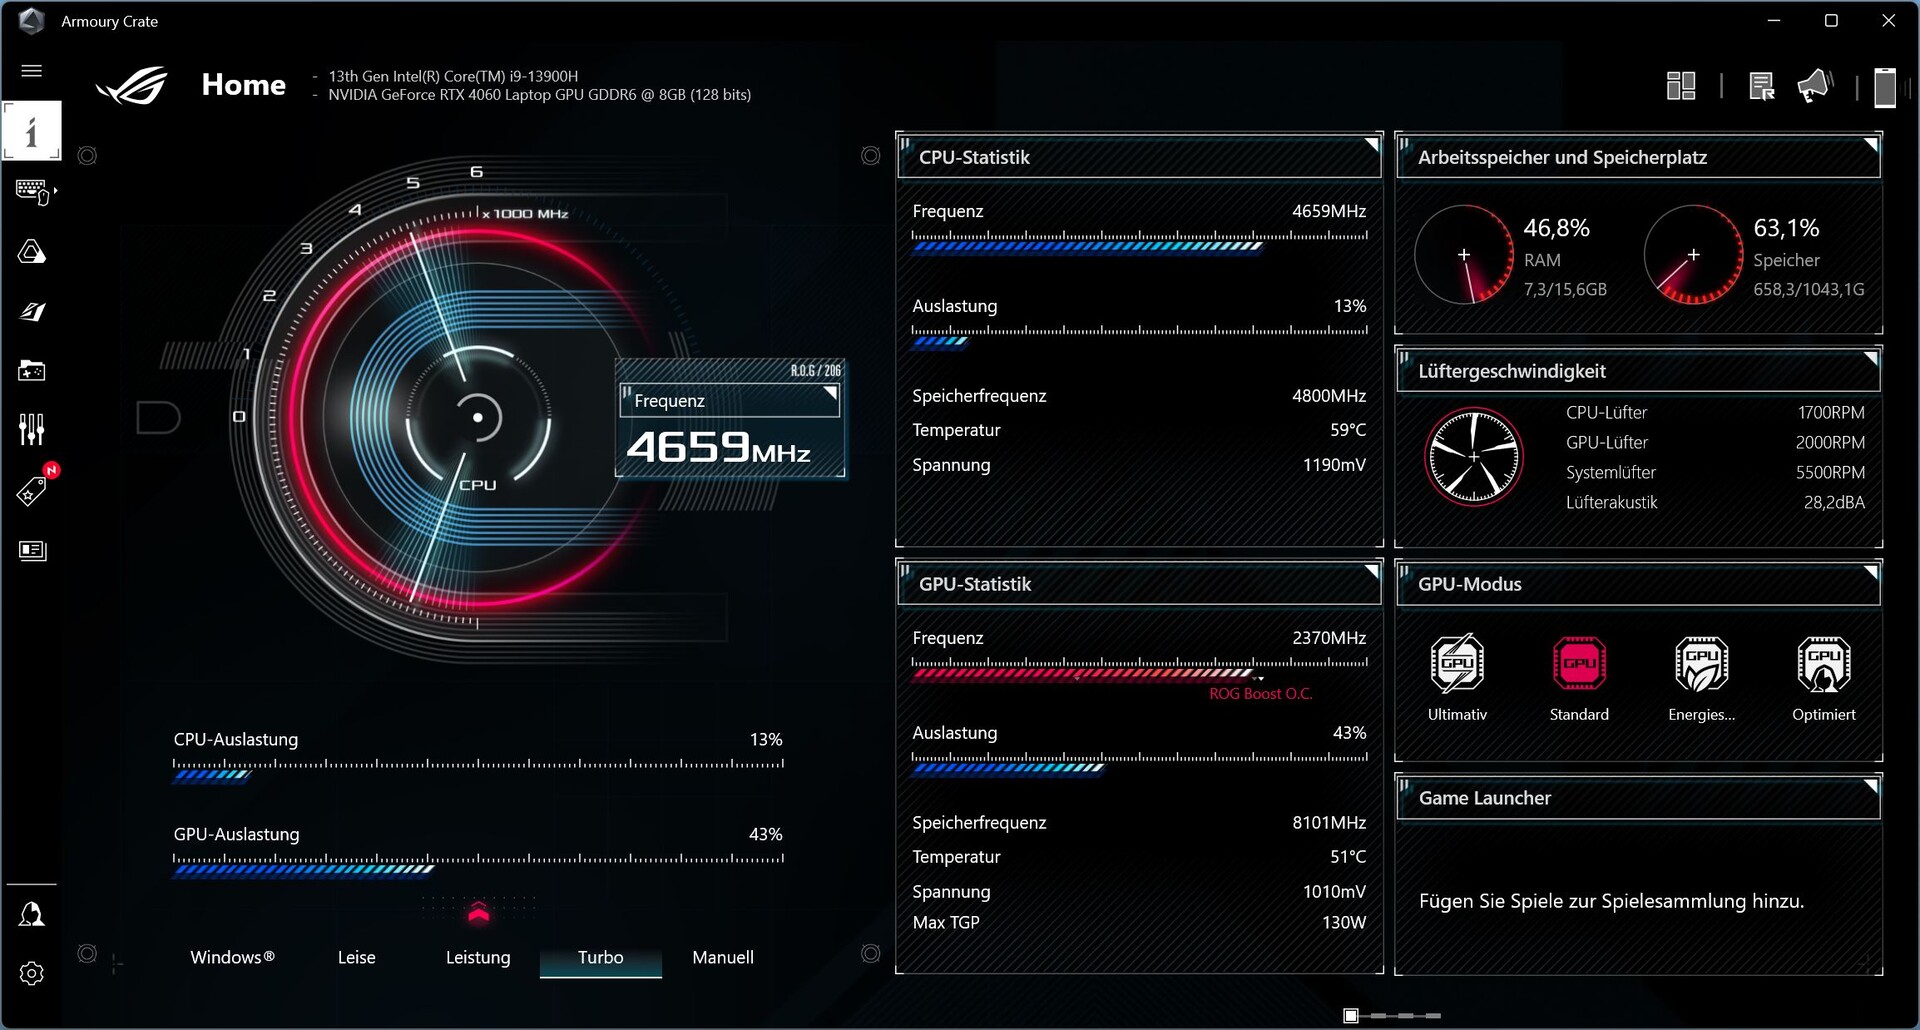
Det finns totalt fyra prestandalägen (Windows, Tyst, Prestanda, Turbo, Manuell). För att uppnå de bästa resultaten valde vi turbo. Vi presenterar dock fortfarande alla resultat som erhållits genom att använda de andra lägena. Du kan också hitta MUX-omkopplaren, med andra ord omkopplingen mellan iGPU och dGPU här.
Processor
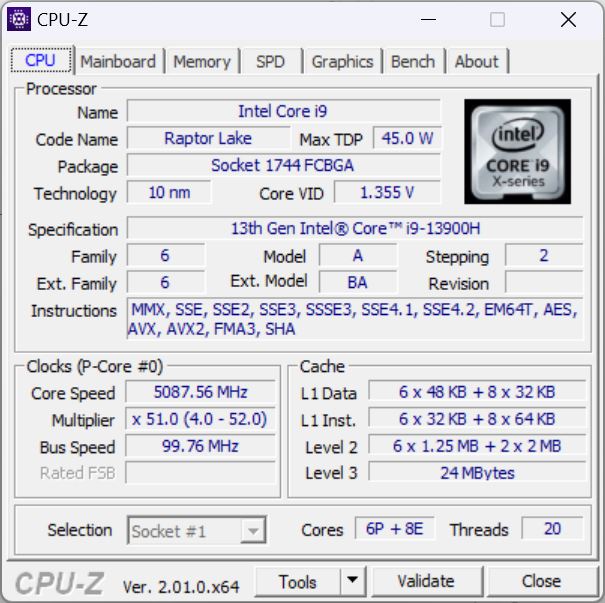
Trots det tunna höljet innehåller X16 en Intel Core i9-13900Hen avancerad Raptor Lake-processor med 6 P- och 8 E-kärnor som kan köras från 1,9 GHz (E-kärnans basklockhastighet) upp till 5,4 GHz (enkelkärnig turbo).
Eftersom den nyare H-serien knappt har några förändringar jämfört med Alder Lake-serien, är det inte förvånande att X16 inte kan dra ifrån förra årets konkurrens. Lenovo Legion Pro 7med sin HX-CPU, är i en annan liga här. Det är dock imponerande att resultatet ligger hela 10 procent över genomsnittet för i9-13900H i vår databas, trots den tunna formfaktorn.
Efter de första två till tre körningarna sjönk värdet något. Nedan kan du hitta CPU: s TDP beroende på det valda prestandaläget, även om dessa värden är mer teoretiska (HWinfo). Som ett resultat drar processorn knappast mer än 100 watt, även när man använder turboläge i CinebenchR15 och under en körning i tyst läge sjönk TDP till under 60 watt.
I batteriläge väljs det tysta läget automatiskt. Turbo är blockerat men du kan teoretiskt sett fortfarande slå på strömmen.
| Leistungsmodus/TDP der CPU | PL1 | PL2 | Poäng |
|---|---|---|---|
| Turbo | 110 | 135 | 3.100 |
| Leistung | 100 | 120 | 2.882 |
| Leise | 80 | 100 | 2.342 |
| Akku Leistung | 38 | 60 | 2,199 |
| Akku Leise | 30 | 30 | 1.604 |
Cinebench R15 Multi Continuous Test
Cinebench R23: Multi Core | Single Core
Cinebench R20: CPU (Multi Core) | CPU (Single Core)
Cinebench R15: CPU Multi 64Bit | CPU Single 64Bit
Blender: v2.79 BMW27 CPU
7-Zip 18.03: 7z b 4 | 7z b 4 -mmt1
Geekbench 5.5: Multi-Core | Single-Core
HWBOT x265 Benchmark v2.2: 4k Preset
LibreOffice : 20 Documents To PDF
R Benchmark 2.5: Overall mean
| CPU Performance rating | |
| Lenovo Legion Pro 7 16IRX8H | |
| Genomsnitt av klass Gaming | |
| Asus ROG Flow X16 GV601V | |
| Asus ROG Zephyrus M16 GU604VY-NM042X | |
| Apple MacBook Pro 16 2023 M2 Max -6! | |
| MSI Creator Z16P B12UHST | |
| Genomsnitt Intel Core i9-13900H | |
| Lenovo Legion Slim 7-16IAH 82TF004YGE | |
| MSI Katana 17 B13VFK | |
| Razer Blade 15 OLED (Early 2022) | |
| Lenovo Legion S7 16ARHA7 | |
| Asus ROG Flow X16 GV601RW-M5082W | |
| Corsair Voyager a1600 | |
| Cinebench R23 / Single Core | |
| Lenovo Legion Pro 7 16IRX8H | |
| Asus ROG Flow X16 GV601V | |
| Genomsnitt av klass Gaming (1166 - 2415, n=107, senaste 2 åren) | |
| Asus ROG Zephyrus M16 GU604VY-NM042X | |
| MSI Creator Z16P B12UHST | |
| Genomsnitt Intel Core i9-13900H (1297 - 2054, n=26) | |
| MSI Katana 17 B13VFK | |
| Lenovo Legion Slim 7-16IAH 82TF004YGE | |
| Razer Blade 15 OLED (Early 2022) | |
| Apple MacBook Pro 16 2023 M2 Max | |
| Lenovo Legion S7 16ARHA7 | |
| Corsair Voyager a1600 | |
| Asus ROG Flow X16 GV601RW-M5082W | |
| Cinebench R20 / CPU (Multi Core) | |
| Lenovo Legion Pro 7 16IRX8H | |
| Genomsnitt av klass Gaming (4029 - 16433, n=106, senaste 2 åren) | |
| Asus ROG Flow X16 GV601V | |
| Asus ROG Zephyrus M16 GU604VY-NM042X | |
| MSI Creator Z16P B12UHST | |
| Lenovo Legion Slim 7-16IAH 82TF004YGE | |
| Genomsnitt Intel Core i9-13900H (4935 - 7716, n=25) | |
| Razer Blade 15 OLED (Early 2022) | |
| MSI Katana 17 B13VFK | |
| Lenovo Legion S7 16ARHA7 | |
| Asus ROG Flow X16 GV601RW-M5082W | |
| Corsair Voyager a1600 | |
| Apple MacBook Pro 16 2023 M2 Max | |
| Cinebench R20 / CPU (Single Core) | |
| Lenovo Legion Pro 7 16IRX8H | |
| Genomsnitt av klass Gaming (442 - 913, n=106, senaste 2 åren) | |
| Asus ROG Flow X16 GV601V | |
| Asus ROG Zephyrus M16 GU604VY-NM042X | |
| MSI Creator Z16P B12UHST | |
| Genomsnitt Intel Core i9-13900H (428 - 792, n=25) | |
| MSI Katana 17 B13VFK | |
| Lenovo Legion Slim 7-16IAH 82TF004YGE | |
| Razer Blade 15 OLED (Early 2022) | |
| Lenovo Legion S7 16ARHA7 | |
| Asus ROG Flow X16 GV601RW-M5082W | |
| Corsair Voyager a1600 | |
| Apple MacBook Pro 16 2023 M2 Max | |
| Cinebench R15 / CPU Multi 64Bit | |
| Lenovo Legion Pro 7 16IRX8H | |
| Genomsnitt av klass Gaming (1578 - 6330, n=105, senaste 2 åren) | |
| Asus ROG Flow X16 GV601V | |
| Asus ROG Zephyrus M16 GU604VY-NM042X | |
| MSI Creator Z16P B12UHST | |
| Lenovo Legion Slim 7-16IAH 82TF004YGE | |
| Genomsnitt Intel Core i9-13900H (2061 - 3100, n=26) | |
| Razer Blade 15 OLED (Early 2022) | |
| Lenovo Legion S7 16ARHA7 | |
| MSI Katana 17 B13VFK | |
| Asus ROG Flow X16 GV601RW-M5082W | |
| Corsair Voyager a1600 | |
| Apple MacBook Pro 16 2023 M2 Max | |
| Cinebench R15 / CPU Single 64Bit | |
| Lenovo Legion Pro 7 16IRX8H | |
| Genomsnitt av klass Gaming (188.8 - 350, n=106, senaste 2 åren) | |
| Asus ROG Zephyrus M16 GU604VY-NM042X | |
| Asus ROG Flow X16 GV601V | |
| MSI Creator Z16P B12UHST | |
| Genomsnitt Intel Core i9-13900H (211 - 297, n=26) | |
| MSI Katana 17 B13VFK | |
| Lenovo Legion S7 16ARHA7 | |
| Lenovo Legion Slim 7-16IAH 82TF004YGE | |
| Razer Blade 15 OLED (Early 2022) | |
| Corsair Voyager a1600 | |
| Asus ROG Flow X16 GV601RW-M5082W | |
| Apple MacBook Pro 16 2023 M2 Max | |
| Blender / v2.79 BMW27 CPU | |
| Corsair Voyager a1600 | |
| Asus ROG Flow X16 GV601RW-M5082W | |
| Razer Blade 15 OLED (Early 2022) | |
| MSI Katana 17 B13VFK | |
| Lenovo Legion S7 16ARHA7 | |
| Genomsnitt Intel Core i9-13900H (166 - 268, n=24) | |
| MSI Creator Z16P B12UHST | |
| Lenovo Legion Slim 7-16IAH 82TF004YGE | |
| Asus ROG Flow X16 GV601V | |
| Asus ROG Zephyrus M16 GU604VY-NM042X | |
| Genomsnitt av klass Gaming (79 - 330, n=104, senaste 2 åren) | |
| Lenovo Legion Pro 7 16IRX8H | |
| 7-Zip 18.03 / 7z b 4 | |
| Lenovo Legion Pro 7 16IRX8H | |
| Genomsnitt av klass Gaming (33491 - 148086, n=105, senaste 2 åren) | |
| Asus ROG Zephyrus M16 GU604VY-NM042X | |
| Asus ROG Flow X16 GV601V | |
| MSI Creator Z16P B12UHST | |
| Genomsnitt Intel Core i9-13900H (45045 - 79032, n=25) | |
| Lenovo Legion Slim 7-16IAH 82TF004YGE | |
| Razer Blade 15 OLED (Early 2022) | |
| Lenovo Legion S7 16ARHA7 | |
| MSI Katana 17 B13VFK | |
| Corsair Voyager a1600 | |
| Asus ROG Flow X16 GV601RW-M5082W | |
| 7-Zip 18.03 / 7z b 4 -mmt1 | |
| Lenovo Legion Pro 7 16IRX8H | |
| Genomsnitt av klass Gaming (4199 - 7436, n=105, senaste 2 åren) | |
| Asus ROG Flow X16 GV601V | |
| Asus ROG Zephyrus M16 GU604VY-NM042X | |
| MSI Creator Z16P B12UHST | |
| Lenovo Legion S7 16ARHA7 | |
| Genomsnitt Intel Core i9-13900H (3665 - 6600, n=25) | |
| Corsair Voyager a1600 | |
| MSI Katana 17 B13VFK | |
| Asus ROG Flow X16 GV601RW-M5082W | |
| Lenovo Legion Slim 7-16IAH 82TF004YGE | |
| Razer Blade 15 OLED (Early 2022) | |
| Geekbench 5.5 / Single-Core | |
| Genomsnitt av klass Gaming (986 - 2474, n=105, senaste 2 åren) | |
| Lenovo Legion Pro 7 16IRX8H | |
| Asus ROG Flow X16 GV601V | |
| Apple MacBook Pro 16 2023 M2 Max | |
| Asus ROG Zephyrus M16 GU604VY-NM042X | |
| Genomsnitt Intel Core i9-13900H (1140 - 2043, n=26) | |
| MSI Creator Z16P B12UHST | |
| MSI Katana 17 B13VFK | |
| Lenovo Legion Slim 7-16IAH 82TF004YGE | |
| Razer Blade 15 OLED (Early 2022) | |
| Lenovo Legion S7 16ARHA7 | |
| Asus ROG Flow X16 GV601RW-M5082W | |
| Corsair Voyager a1600 | |
| HWBOT x265 Benchmark v2.2 / 4k Preset | |
| Lenovo Legion Pro 7 16IRX8H | |
| Genomsnitt av klass Gaming (11.5 - 44.4, n=105, senaste 2 åren) | |
| Asus ROG Zephyrus M16 GU604VY-NM042X | |
| Asus ROG Flow X16 GV601V | |
| MSI Creator Z16P B12UHST | |
| Lenovo Legion Slim 7-16IAH 82TF004YGE | |
| Genomsnitt Intel Core i9-13900H (14.1 - 22.3, n=25) | |
| Lenovo Legion S7 16ARHA7 | |
| Razer Blade 15 OLED (Early 2022) | |
| MSI Katana 17 B13VFK | |
| Corsair Voyager a1600 | |
| Asus ROG Flow X16 GV601RW-M5082W | |
| LibreOffice / 20 Documents To PDF | |
| Corsair Voyager a1600 | |
| MSI Katana 17 B13VFK | |
| Asus ROG Flow X16 GV601RW-M5082W | |
| Razer Blade 15 OLED (Early 2022) | |
| Asus ROG Zephyrus M16 GU604VY-NM042X | |
| Genomsnitt av klass Gaming (33.2 - 88.8, n=105, senaste 2 åren) | |
| Lenovo Legion S7 16ARHA7 | |
| Genomsnitt Intel Core i9-13900H (34.4 - 82.8, n=25) | |
| Lenovo Legion Pro 7 16IRX8H | |
| Lenovo Legion Slim 7-16IAH 82TF004YGE | |
| MSI Creator Z16P B12UHST | |
| Asus ROG Flow X16 GV601V | |
| R Benchmark 2.5 / Overall mean | |
| Razer Blade 15 OLED (Early 2022) | |
| Asus ROG Flow X16 GV601RW-M5082W | |
| Corsair Voyager a1600 | |
| Lenovo Legion Slim 7-16IAH 82TF004YGE | |
| Lenovo Legion S7 16ARHA7 | |
| Genomsnitt Intel Core i9-13900H (0.4052 - 0.723, n=25) | |
| MSI Katana 17 B13VFK | |
| MSI Creator Z16P B12UHST | |
| Genomsnitt av klass Gaming (0.3439 - 0.759, n=106, senaste 2 åren) | |
| Asus ROG Flow X16 GV601V | |
| Asus ROG Zephyrus M16 GU604VY-NM042X | |
| Lenovo Legion Pro 7 16IRX8H | |
* ... mindre är bättre
AIDA64: FP32 Ray-Trace | FPU Julia | CPU SHA3 | CPU Queen | FPU SinJulia | FPU Mandel | CPU AES | CPU ZLib | FP64 Ray-Trace | CPU PhotoWorxx
| Performance rating | |
| Genomsnitt av klass Gaming | |
| Asus ROG Flow X16 GV601RW-M5082W | |
| Lenovo Legion S7 16ARHA7 | |
| Corsair Voyager a1600 | |
| Asus ROG Flow X16 GV601V | |
| Lenovo Legion Slim 7-16IAH 82TF004YGE | |
| Genomsnitt Intel Core i9-13900H | |
| Razer Blade 15 OLED (Early 2022) | |
| MSI Creator Z16P B12UHST | |
| MSI Katana 17 B13VFK | |
| AIDA64 / FP32 Ray-Trace | |
| Genomsnitt av klass Gaming (10227 - 85542, n=105, senaste 2 åren) | |
| Lenovo Legion Slim 7-16IAH 82TF004YGE | |
| Asus ROG Flow X16 GV601RW-M5082W | |
| Lenovo Legion S7 16ARHA7 | |
| Corsair Voyager a1600 | |
| Genomsnitt Intel Core i9-13900H (6788 - 19557, n=25) | |
| MSI Katana 17 B13VFK | |
| Razer Blade 15 OLED (Early 2022) | |
| Asus ROG Flow X16 GV601V | |
| MSI Creator Z16P B12UHST | |
| AIDA64 / FPU Julia | |
| Genomsnitt av klass Gaming (51376 - 238426, n=105, senaste 2 åren) | |
| Lenovo Legion S7 16ARHA7 | |
| Asus ROG Flow X16 GV601RW-M5082W | |
| Corsair Voyager a1600 | |
| Asus ROG Flow X16 GV601V | |
| Lenovo Legion Slim 7-16IAH 82TF004YGE | |
| Genomsnitt Intel Core i9-13900H (22551 - 95579, n=25) | |
| Razer Blade 15 OLED (Early 2022) | |
| MSI Katana 17 B13VFK | |
| MSI Creator Z16P B12UHST | |
| AIDA64 / CPU SHA3 | |
| Genomsnitt av klass Gaming (2180 - 10115, n=105, senaste 2 åren) | |
| Asus ROG Flow X16 GV601V | |
| Lenovo Legion Slim 7-16IAH 82TF004YGE | |
| Asus ROG Flow X16 GV601RW-M5082W | |
| Lenovo Legion S7 16ARHA7 | |
| Genomsnitt Intel Core i9-13900H (2491 - 4270, n=25) | |
| Corsair Voyager a1600 | |
| Razer Blade 15 OLED (Early 2022) | |
| MSI Creator Z16P B12UHST | |
| MSI Katana 17 B13VFK | |
| AIDA64 / CPU Queen | |
| Genomsnitt av klass Gaming (49785 - 173351, n=90, senaste 2 åren) | |
| Asus ROG Flow X16 GV601V | |
| Lenovo Legion S7 16ARHA7 | |
| MSI Creator Z16P B12UHST | |
| Razer Blade 15 OLED (Early 2022) | |
| Corsair Voyager a1600 | |
| Genomsnitt Intel Core i9-13900H (65121 - 120936, n=25) | |
| Asus ROG Flow X16 GV601RW-M5082W | |
| Lenovo Legion Slim 7-16IAH 82TF004YGE | |
| MSI Katana 17 B13VFK | |
| AIDA64 / FPU SinJulia | |
| Genomsnitt av klass Gaming (4424 - 33636, n=105, senaste 2 åren) | |
| Corsair Voyager a1600 | |
| Lenovo Legion S7 16ARHA7 | |
| Asus ROG Flow X16 GV601RW-M5082W | |
| Asus ROG Flow X16 GV601V | |
| MSI Creator Z16P B12UHST | |
| Lenovo Legion Slim 7-16IAH 82TF004YGE | |
| Razer Blade 15 OLED (Early 2022) | |
| Genomsnitt Intel Core i9-13900H (6108 - 11631, n=25) | |
| MSI Katana 17 B13VFK | |
| AIDA64 / FPU Mandel | |
| Genomsnitt av klass Gaming (25115 - 128721, n=105, senaste 2 åren) | |
| Lenovo Legion S7 16ARHA7 | |
| Asus ROG Flow X16 GV601RW-M5082W | |
| Corsair Voyager a1600 | |
| Asus ROG Flow X16 GV601V | |
| Lenovo Legion Slim 7-16IAH 82TF004YGE | |
| Genomsnitt Intel Core i9-13900H (11283 - 48474, n=25) | |
| Razer Blade 15 OLED (Early 2022) | |
| MSI Katana 17 B13VFK | |
| MSI Creator Z16P B12UHST | |
| AIDA64 / CPU AES | |
| Asus ROG Flow X16 GV601RW-M5082W | |
| Lenovo Legion Slim 7-16IAH 82TF004YGE | |
| Lenovo Legion S7 16ARHA7 | |
| Corsair Voyager a1600 | |
| Genomsnitt av klass Gaming (39258 - 247074, n=105, senaste 2 åren) | |
| MSI Creator Z16P B12UHST | |
| Razer Blade 15 OLED (Early 2022) | |
| Genomsnitt Intel Core i9-13900H (3691 - 149377, n=25) | |
| Asus ROG Flow X16 GV601V | |
| MSI Katana 17 B13VFK | |
| AIDA64 / CPU ZLib | |
| Genomsnitt av klass Gaming (574 - 2531, n=105, senaste 2 åren) | |
| Asus ROG Flow X16 GV601V | |
| MSI Creator Z16P B12UHST | |
| Razer Blade 15 OLED (Early 2022) | |
| Genomsnitt Intel Core i9-13900H (789 - 1254, n=25) | |
| Lenovo Legion Slim 7-16IAH 82TF004YGE | |
| Asus ROG Flow X16 GV601RW-M5082W | |
| Lenovo Legion S7 16ARHA7 | |
| Corsair Voyager a1600 | |
| MSI Katana 17 B13VFK | |
| AIDA64 / FP64 Ray-Trace | |
| Genomsnitt av klass Gaming (5509 - 45446, n=105, senaste 2 åren) | |
| Asus ROG Flow X16 GV601V | |
| Asus ROG Flow X16 GV601RW-M5082W | |
| Lenovo Legion S7 16ARHA7 | |
| Lenovo Legion Slim 7-16IAH 82TF004YGE | |
| Corsair Voyager a1600 | |
| Genomsnitt Intel Core i9-13900H (3655 - 10716, n=25) | |
| MSI Katana 17 B13VFK | |
| Razer Blade 15 OLED (Early 2022) | |
| MSI Creator Z16P B12UHST | |
| AIDA64 / CPU PhotoWorxx | |
| Genomsnitt av klass Gaming (12271 - 89891, n=105, senaste 2 åren) | |
| MSI Creator Z16P B12UHST | |
| Genomsnitt Intel Core i9-13900H (10871 - 50488, n=25) | |
| Asus ROG Flow X16 GV601V | |
| Lenovo Legion Slim 7-16IAH 82TF004YGE | |
| Razer Blade 15 OLED (Early 2022) | |
| Razer Blade 15 OLED (Early 2022) | |
| MSI Katana 17 B13VFK | |
| Corsair Voyager a1600 | |
| Asus ROG Flow X16 GV601RW-M5082W | |
| Lenovo Legion S7 16ARHA7 | |
Systemets prestanda
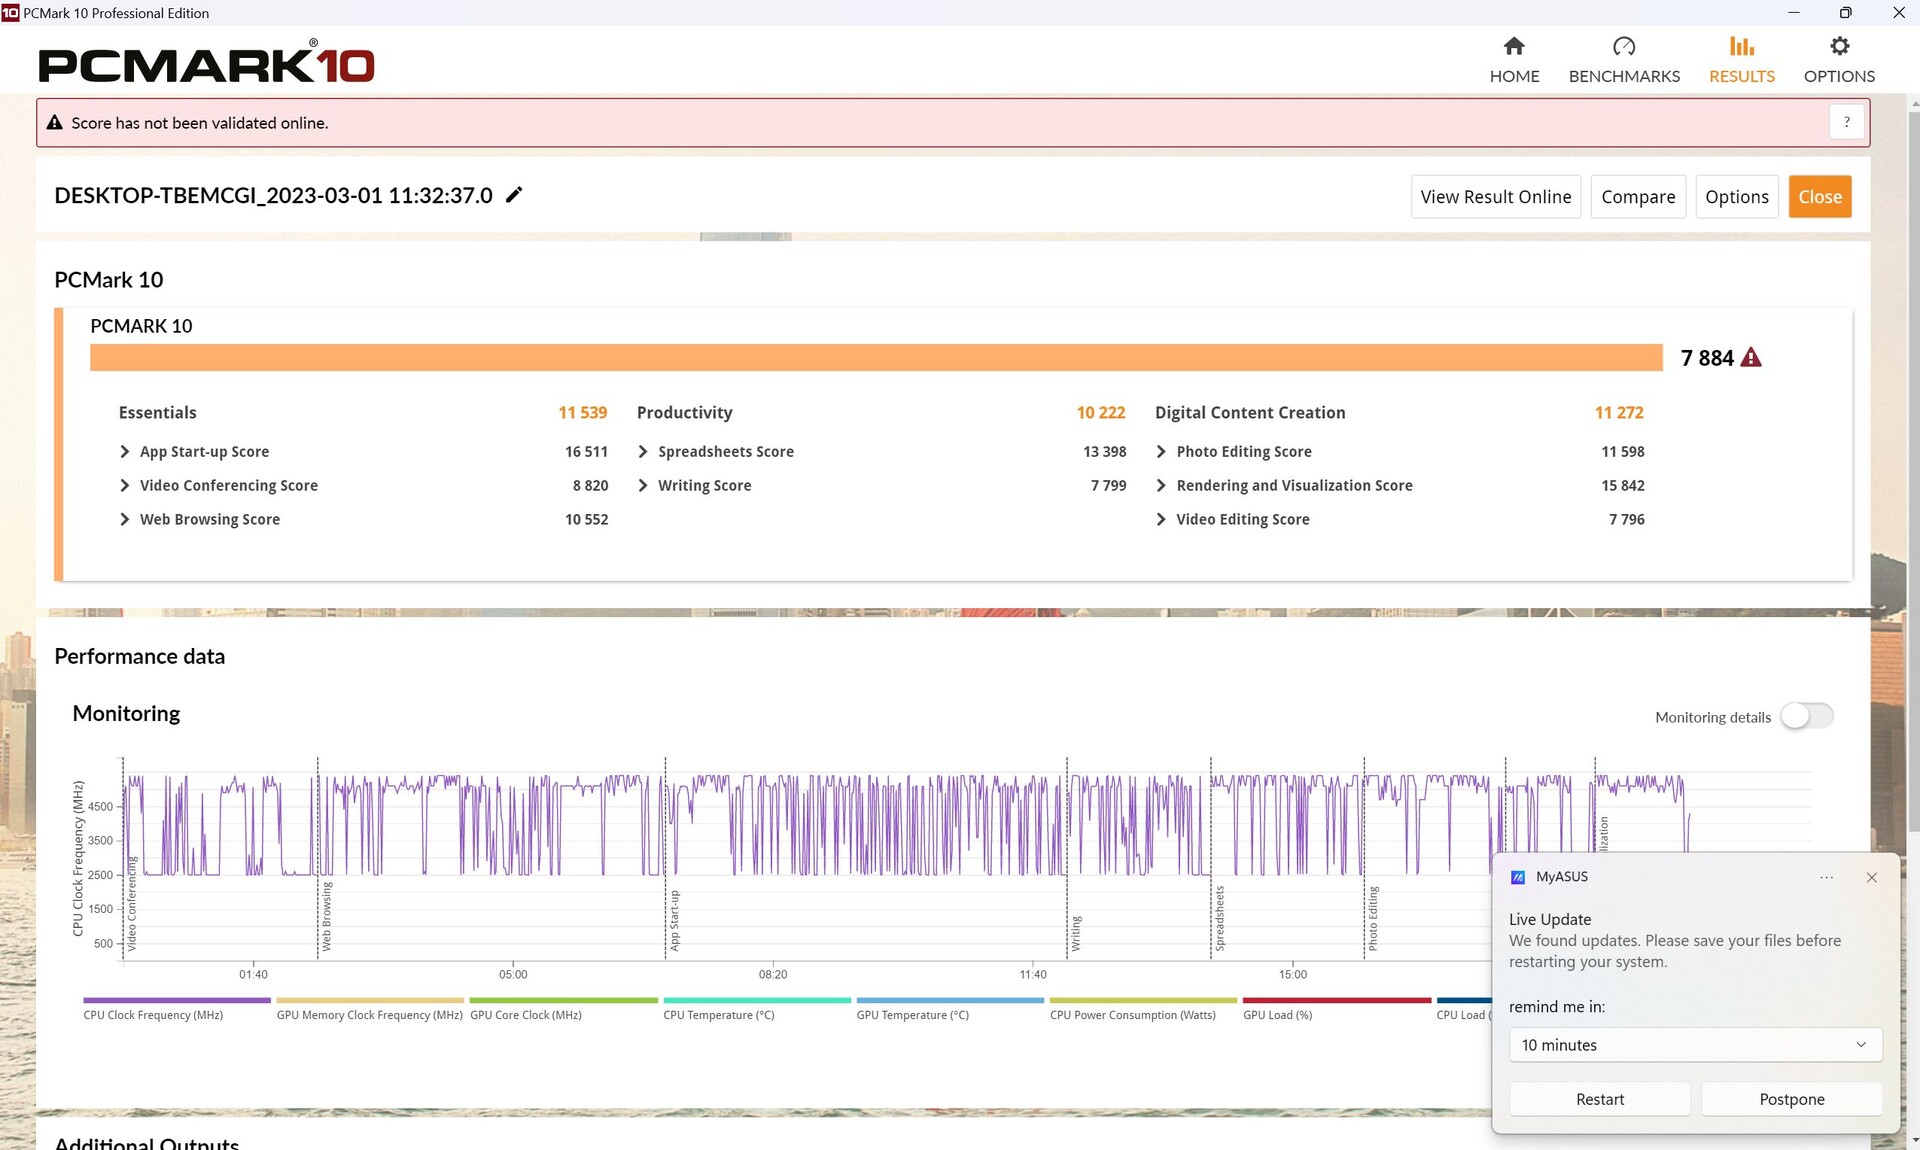
I PCMark10-testerna presterade X16 som förväntat, om inte till och med lite bättre än förväntat. Det fanns inga avvikelser eller nedgångar i något av våra deltest.
CrossMark: Overall | Productivity | Creativity | Responsiveness
| PCMark 10 / Score | |
| Genomsnitt av klass Gaming (5828 - 12414, n=93, senaste 2 åren) | |
| Asus ROG Zephyrus M16 GU604VY-NM042X | |
| MSI Creator Z16P B12UHST | |
| Asus ROG Flow X16 GV601V | |
| Lenovo Legion Pro 7 16IRX8H | |
| Genomsnitt Intel Core i9-13900H, NVIDIA GeForce RTX 4060 Laptop GPU (7578 - 7884, n=3) | |
| Lenovo Legion S7 16ARHA7 | |
| Lenovo Legion Slim 7-16IAH 82TF004YGE | |
| Razer Blade 15 OLED (Early 2022) | |
| Corsair Voyager a1600 | |
| MSI Katana 17 B13VFK | |
| Asus ROG Flow X16 GV601RW-M5082W | |
| PCMark 10 / Essentials | |
| Lenovo Legion Pro 7 16IRX8H | |
| Asus ROG Zephyrus M16 GU604VY-NM042X | |
| Asus ROG Flow X16 GV601V | |
| Genomsnitt Intel Core i9-13900H, NVIDIA GeForce RTX 4060 Laptop GPU (11235 - 11539, n=3) | |
| MSI Creator Z16P B12UHST | |
| Lenovo Legion Slim 7-16IAH 82TF004YGE | |
| MSI Katana 17 B13VFK | |
| Lenovo Legion S7 16ARHA7 | |
| Genomsnitt av klass Gaming (8810 - 11935, n=97, senaste 2 åren) | |
| Razer Blade 15 OLED (Early 2022) | |
| Corsair Voyager a1600 | |
| Asus ROG Flow X16 GV601RW-M5082W | |
| PCMark 10 / Productivity | |
| Genomsnitt av klass Gaming (6845 - 25323, n=95, senaste 2 åren) | |
| MSI Creator Z16P B12UHST | |
| Asus ROG Zephyrus M16 GU604VY-NM042X | |
| Lenovo Legion Pro 7 16IRX8H | |
| Asus ROG Flow X16 GV601V | |
| Genomsnitt Intel Core i9-13900H, NVIDIA GeForce RTX 4060 Laptop GPU (9888 - 10222, n=3) | |
| Razer Blade 15 OLED (Early 2022) | |
| Lenovo Legion S7 16ARHA7 | |
| Asus ROG Flow X16 GV601RW-M5082W | |
| Lenovo Legion Slim 7-16IAH 82TF004YGE | |
| MSI Katana 17 B13VFK | |
| Corsair Voyager a1600 | |
| PCMark 10 / Digital Content Creation | |
| Genomsnitt av klass Gaming (7602 - 19954, n=95, senaste 2 åren) | |
| Asus ROG Zephyrus M16 GU604VY-NM042X | |
| MSI Creator Z16P B12UHST | |
| Lenovo Legion S7 16ARHA7 | |
| Corsair Voyager a1600 | |
| Asus ROG Flow X16 GV601V | |
| Genomsnitt Intel Core i9-13900H, NVIDIA GeForce RTX 4060 Laptop GPU (10418 - 11272, n=3) | |
| Lenovo Legion Slim 7-16IAH 82TF004YGE | |
| Razer Blade 15 OLED (Early 2022) | |
| Lenovo Legion Pro 7 16IRX8H | |
| MSI Katana 17 B13VFK | |
| Asus ROG Flow X16 GV601RW-M5082W | |
| CrossMark / Overall | |
| Genomsnitt av klass Gaming (1366 - 2409, n=94, senaste 2 åren) | |
| Asus ROG Zephyrus M16 GU604VY-NM042X | |
| Asus ROG Flow X16 GV601V | |
| Genomsnitt Intel Core i9-13900H, NVIDIA GeForce RTX 4060 Laptop GPU (1874 - 1983, n=3) | |
| Apple MacBook Pro 16 2023 M2 Max | |
| Lenovo Legion Slim 7-16IAH 82TF004YGE | |
| MSI Katana 17 B13VFK | |
| Razer Blade 15 OLED (Early 2022) | |
| Lenovo Legion S7 16ARHA7 | |
| Asus ROG Flow X16 GV601RW-M5082W | |
| Corsair Voyager a1600 | |
| CrossMark / Productivity | |
| Asus ROG Flow X16 GV601V | |
| Genomsnitt av klass Gaming (1386 - 2254, n=94, senaste 2 åren) | |
| Asus ROG Zephyrus M16 GU604VY-NM042X | |
| Genomsnitt Intel Core i9-13900H, NVIDIA GeForce RTX 4060 Laptop GPU (1779 - 1889, n=3) | |
| Lenovo Legion Slim 7-16IAH 82TF004YGE | |
| MSI Katana 17 B13VFK | |
| Lenovo Legion S7 16ARHA7 | |
| Razer Blade 15 OLED (Early 2022) | |
| Apple MacBook Pro 16 2023 M2 Max | |
| Asus ROG Flow X16 GV601RW-M5082W | |
| Corsair Voyager a1600 | |
| CrossMark / Creativity | |
| Apple MacBook Pro 16 2023 M2 Max | |
| Genomsnitt av klass Gaming (1343 - 2786, n=94, senaste 2 åren) | |
| Asus ROG Zephyrus M16 GU604VY-NM042X | |
| Asus ROG Flow X16 GV601V | |
| Genomsnitt Intel Core i9-13900H, NVIDIA GeForce RTX 4060 Laptop GPU (2104 - 2195, n=3) | |
| MSI Katana 17 B13VFK | |
| Lenovo Legion Slim 7-16IAH 82TF004YGE | |
| Razer Blade 15 OLED (Early 2022) | |
| Lenovo Legion S7 16ARHA7 | |
| Asus ROG Flow X16 GV601RW-M5082W | |
| Corsair Voyager a1600 | |
| CrossMark / Responsiveness | |
| Lenovo Legion Slim 7-16IAH 82TF004YGE | |
| MSI Katana 17 B13VFK | |
| Genomsnitt av klass Gaming (1226 - 2334, n=94, senaste 2 åren) | |
| Asus ROG Flow X16 GV601V | |
| Asus ROG Zephyrus M16 GU604VY-NM042X | |
| Genomsnitt Intel Core i9-13900H, NVIDIA GeForce RTX 4060 Laptop GPU (1548 - 1698, n=3) | |
| Razer Blade 15 OLED (Early 2022) | |
| Lenovo Legion S7 16ARHA7 | |
| Asus ROG Flow X16 GV601RW-M5082W | |
| Apple MacBook Pro 16 2023 M2 Max | |
| Corsair Voyager a1600 | |
| PCMark 10 Score | 7884 poäng | |
Hjälp | ||
| AIDA64 / Memory Copy | |
| Genomsnitt av klass Gaming (21750 - 129946, n=105, senaste 2 åren) | |
| Samsung Galaxy Book3 Ultra 16, i9-13900H RTX 4070 | |
| Lenovo Yoga Pro 7 14IRH G8 | |
| Genomsnitt Intel Core i9-13900H (37448 - 74486, n=25) | |
| Asus ROG Flow X16 GV601V | |
| Lenovo Legion Pro 5 16IRX8 | |
| MSI Katana 17 B13VFK | |
| Asus ROG Flow X16 GV601RW-M5082W | |
| AIDA64 / Memory Read | |
| Genomsnitt av klass Gaming (22956 - 118858, n=105, senaste 2 åren) | |
| Samsung Galaxy Book3 Ultra 16, i9-13900H RTX 4070 | |
| Lenovo Yoga Pro 7 14IRH G8 | |
| Asus ROG Flow X16 GV601V | |
| Lenovo Legion Pro 5 16IRX8 | |
| Genomsnitt Intel Core i9-13900H (41599 - 75433, n=25) | |
| MSI Katana 17 B13VFK | |
| Asus ROG Flow X16 GV601RW-M5082W | |
| AIDA64 / Memory Write | |
| Samsung Galaxy Book3 Ultra 16, i9-13900H RTX 4070 | |
| Genomsnitt av klass Gaming (22297 - 135096, n=105, senaste 2 åren) | |
| Lenovo Yoga Pro 7 14IRH G8 | |
| Lenovo Legion Pro 5 16IRX8 | |
| Genomsnitt Intel Core i9-13900H (36152 - 88505, n=25) | |
| Asus ROG Flow X16 GV601V | |
| Asus ROG Flow X16 GV601RW-M5082W | |
| MSI Katana 17 B13VFK | |
| AIDA64 / Memory Latency | |
| Genomsnitt av klass Gaming (75.3 - 259, n=105, senaste 2 åren) | |
| Lenovo Yoga Pro 7 14IRH G8 | |
| Samsung Galaxy Book3 Ultra 16, i9-13900H RTX 4070 | |
| MSI Katana 17 B13VFK | |
| Asus ROG Flow X16 GV601RW-M5082W | |
| Asus ROG Flow X16 GV601V | |
| Genomsnitt Intel Core i9-13900H (75.8 - 102.3, n=25) | |
| Lenovo Legion Pro 5 16IRX8 | |
* ... mindre är bättre
DPC-fördröjningar
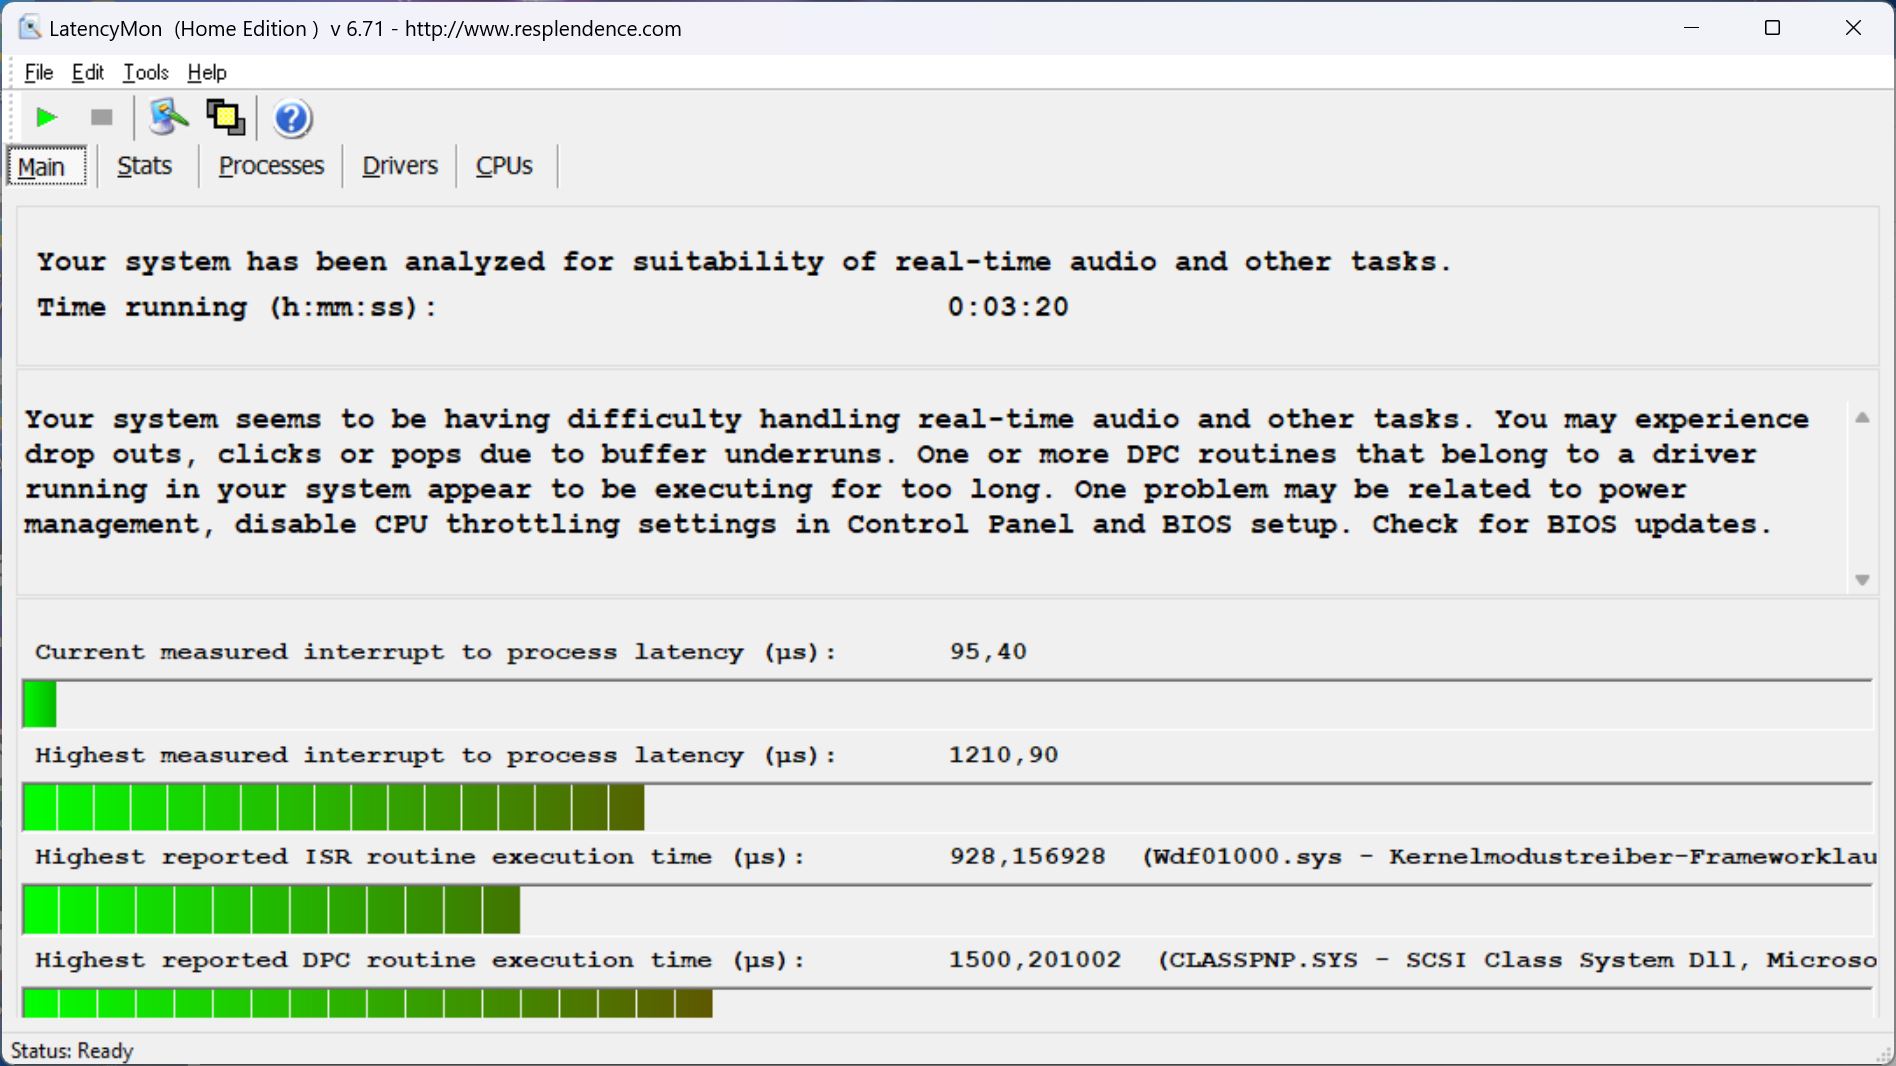
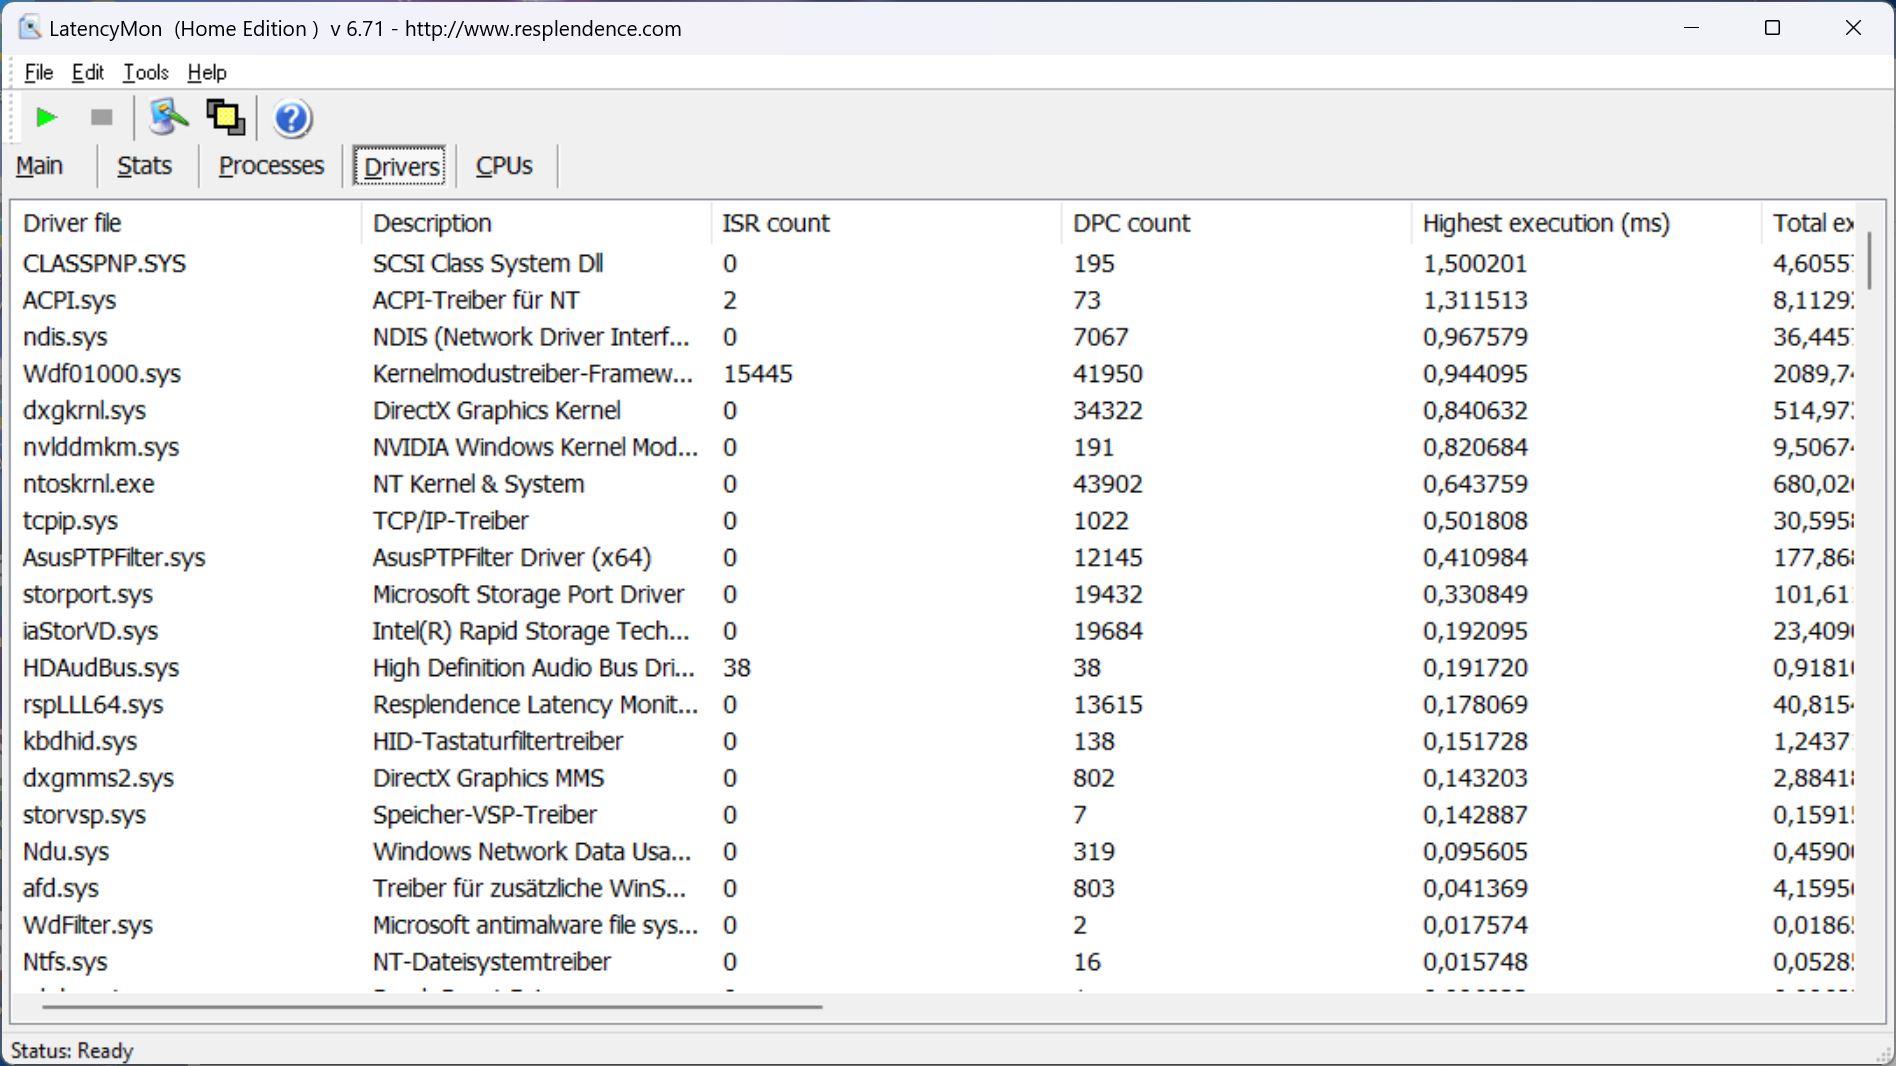
När flera webbläsarflikar öppnades visade programvaran LatencyMon-fördröjningar. Vår 4K/60fps YouTube-video kördes dock smidigt och utan några tappade bildrutor. Trots detta skulle poängen kunna vara lite lägre, särskilt för den riktade gruppen av innehållsskapare.

| DPC Latencies / LatencyMon - interrupt to process latency (max), Web, Youtube, Prime95 | |
| Samsung Galaxy Book3 Ultra 16, i9-13900H RTX 4070 | |
| MSI Katana 17 B13VFK | |
| Asus ROG Flow X16 GV601V | |
| Asus ROG Flow X16 GV601RW-M5082W | |
| Lenovo Yoga Pro 7 14IRH G8 | |
| Lenovo Legion Pro 5 16IRX8 | |
* ... mindre är bättre
Masslagring
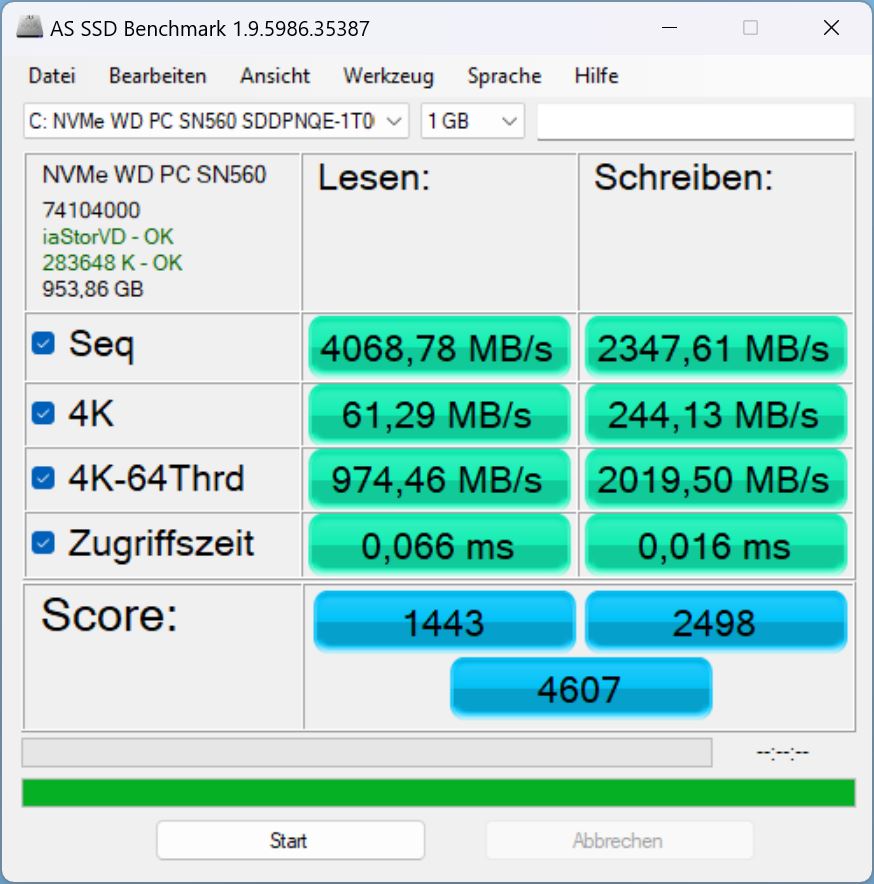
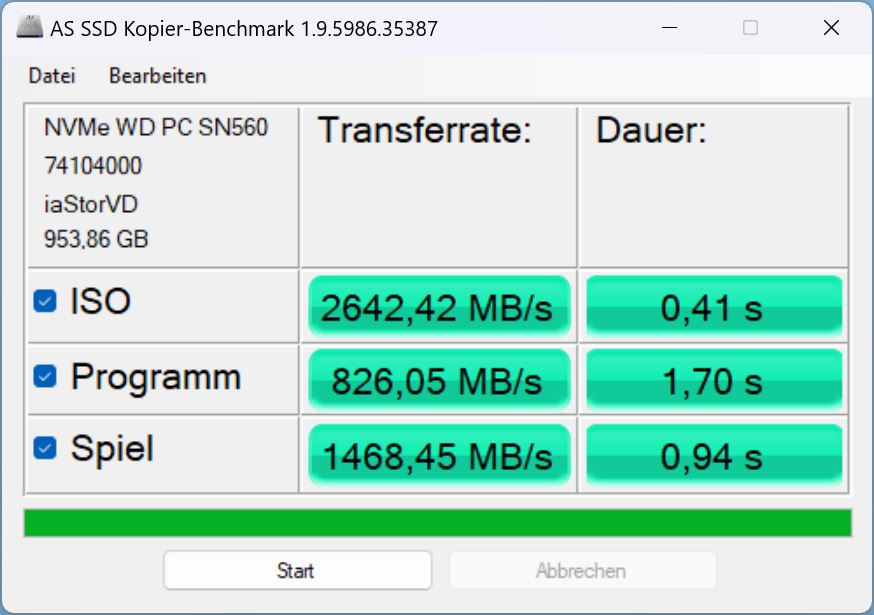
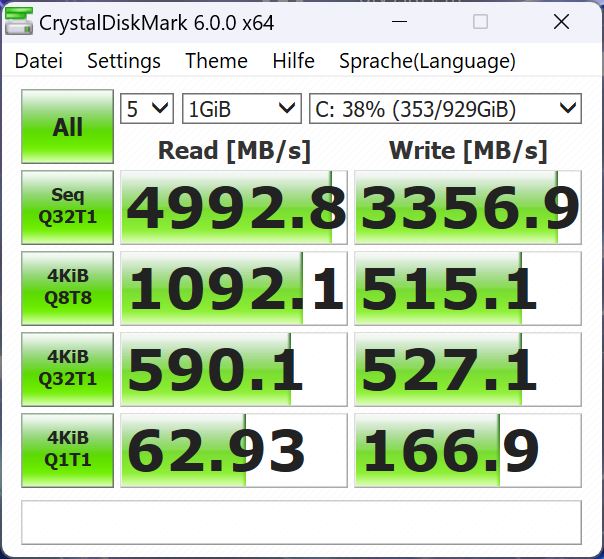
Asus har monterat en 1TB PCIe-4.0-x4-NVMe SSD från Western Digital. Än en gång befinner sig lagringsenheten nära botten av baksidan i vårSSD best-of-lista. Den tidigare modellens Micron SSD var betydligt snabbare med cirka 42 procent i genomsnitt!
För hemmabaserad användning är SSD naturligtvis tillräckligt snabb, men för professionella användare - den kategori som X16 riktar sig till - är detta bakåtsteg i prestanda något beklagligt.

* ... mindre är bättre
Continuous performance Read: DiskSpd Read Loop, Queue Depth 8
Grafikkort
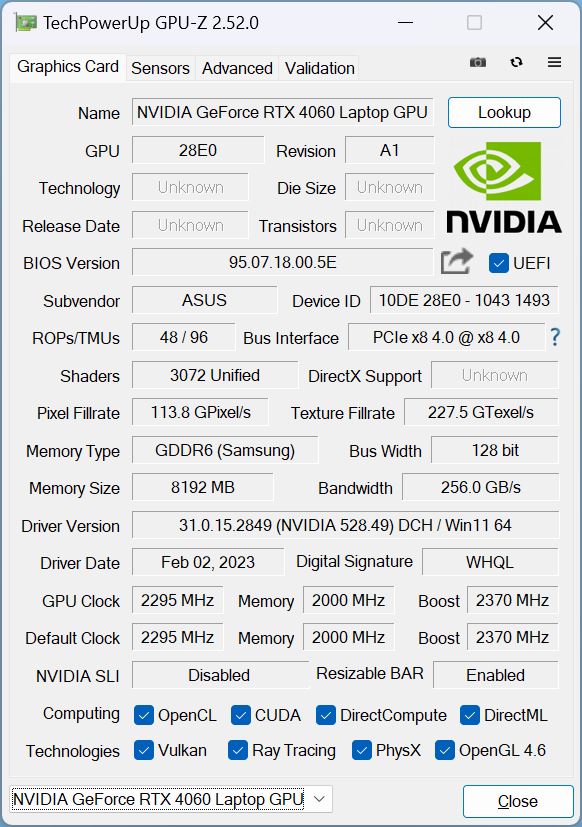
Vår testmodell är hem till enNvidia Geforce RTX 4060. EnRTX 4050eller enRTX 4070är också tillgängliga. Kortet kan dra maximalt 120 watt inklusive en dynamisk boost på 20 watt.
I 3DMark-benchmarks presterade det ungefär 10 procent bättre (turbo) än den genomsnittliga RTX 4060-bärbara datorn i vår databas.
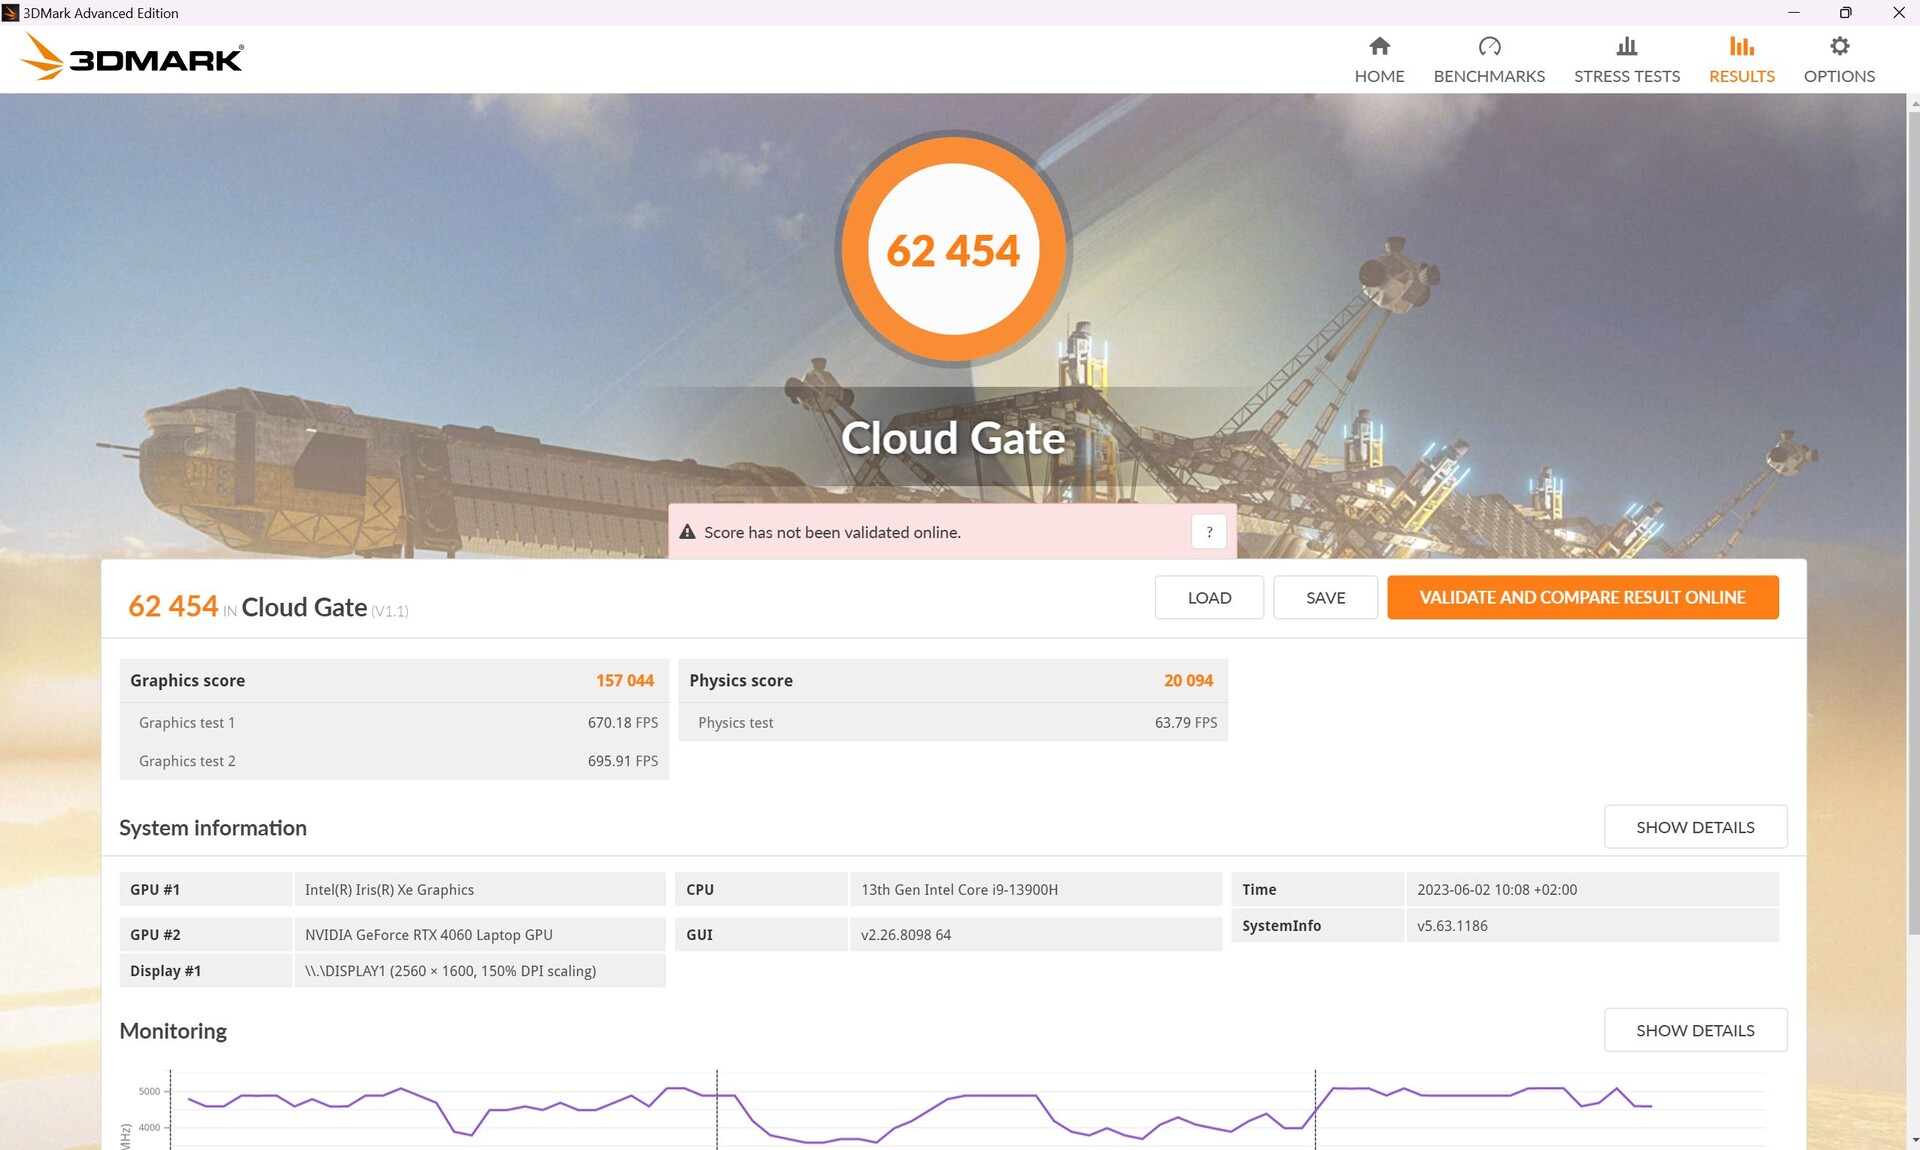
När vi jämför resultaten mellan turbo- och prestandalägena är det särskilt tydligt att grafikprestandan ökar, medan CPU- och fysikprestanda tenderar att sjunka (se Cloud Gate eller Fire Strike).
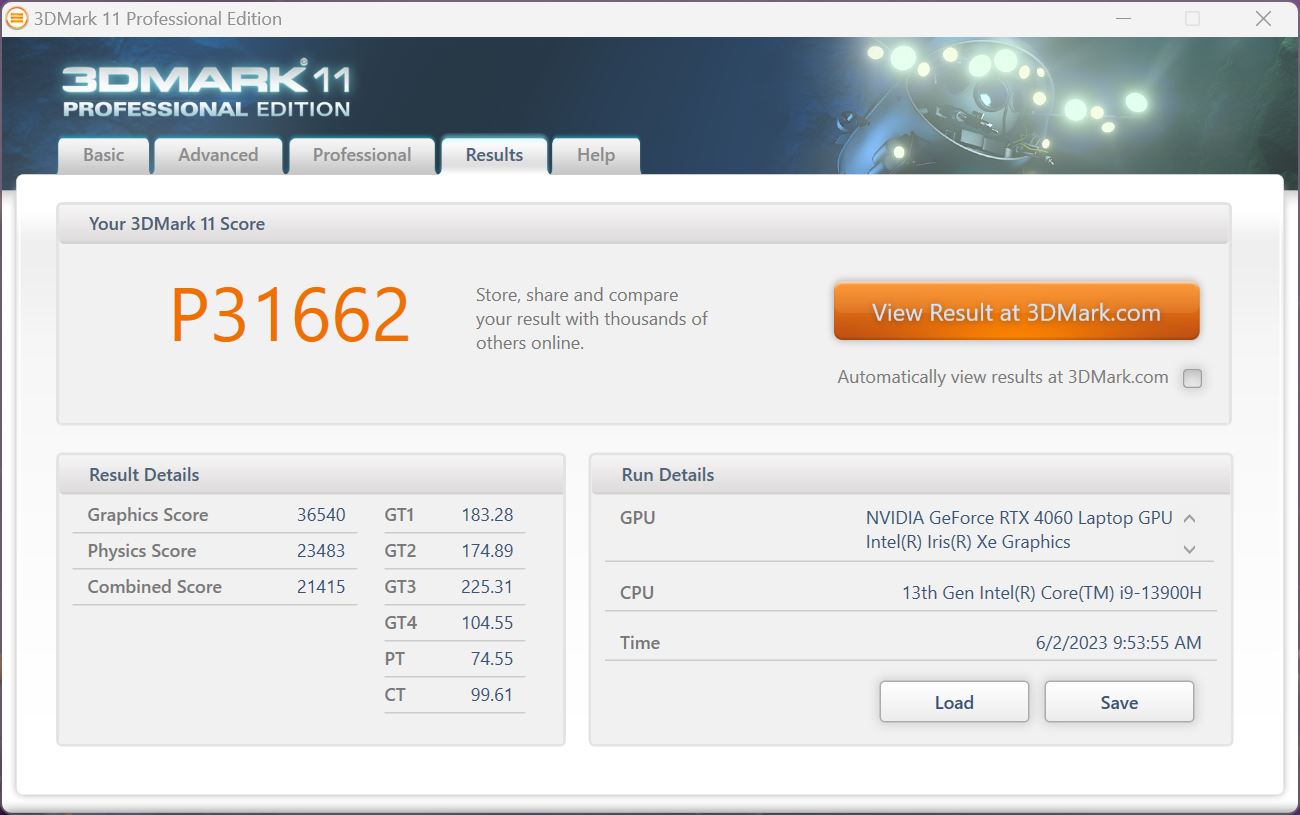
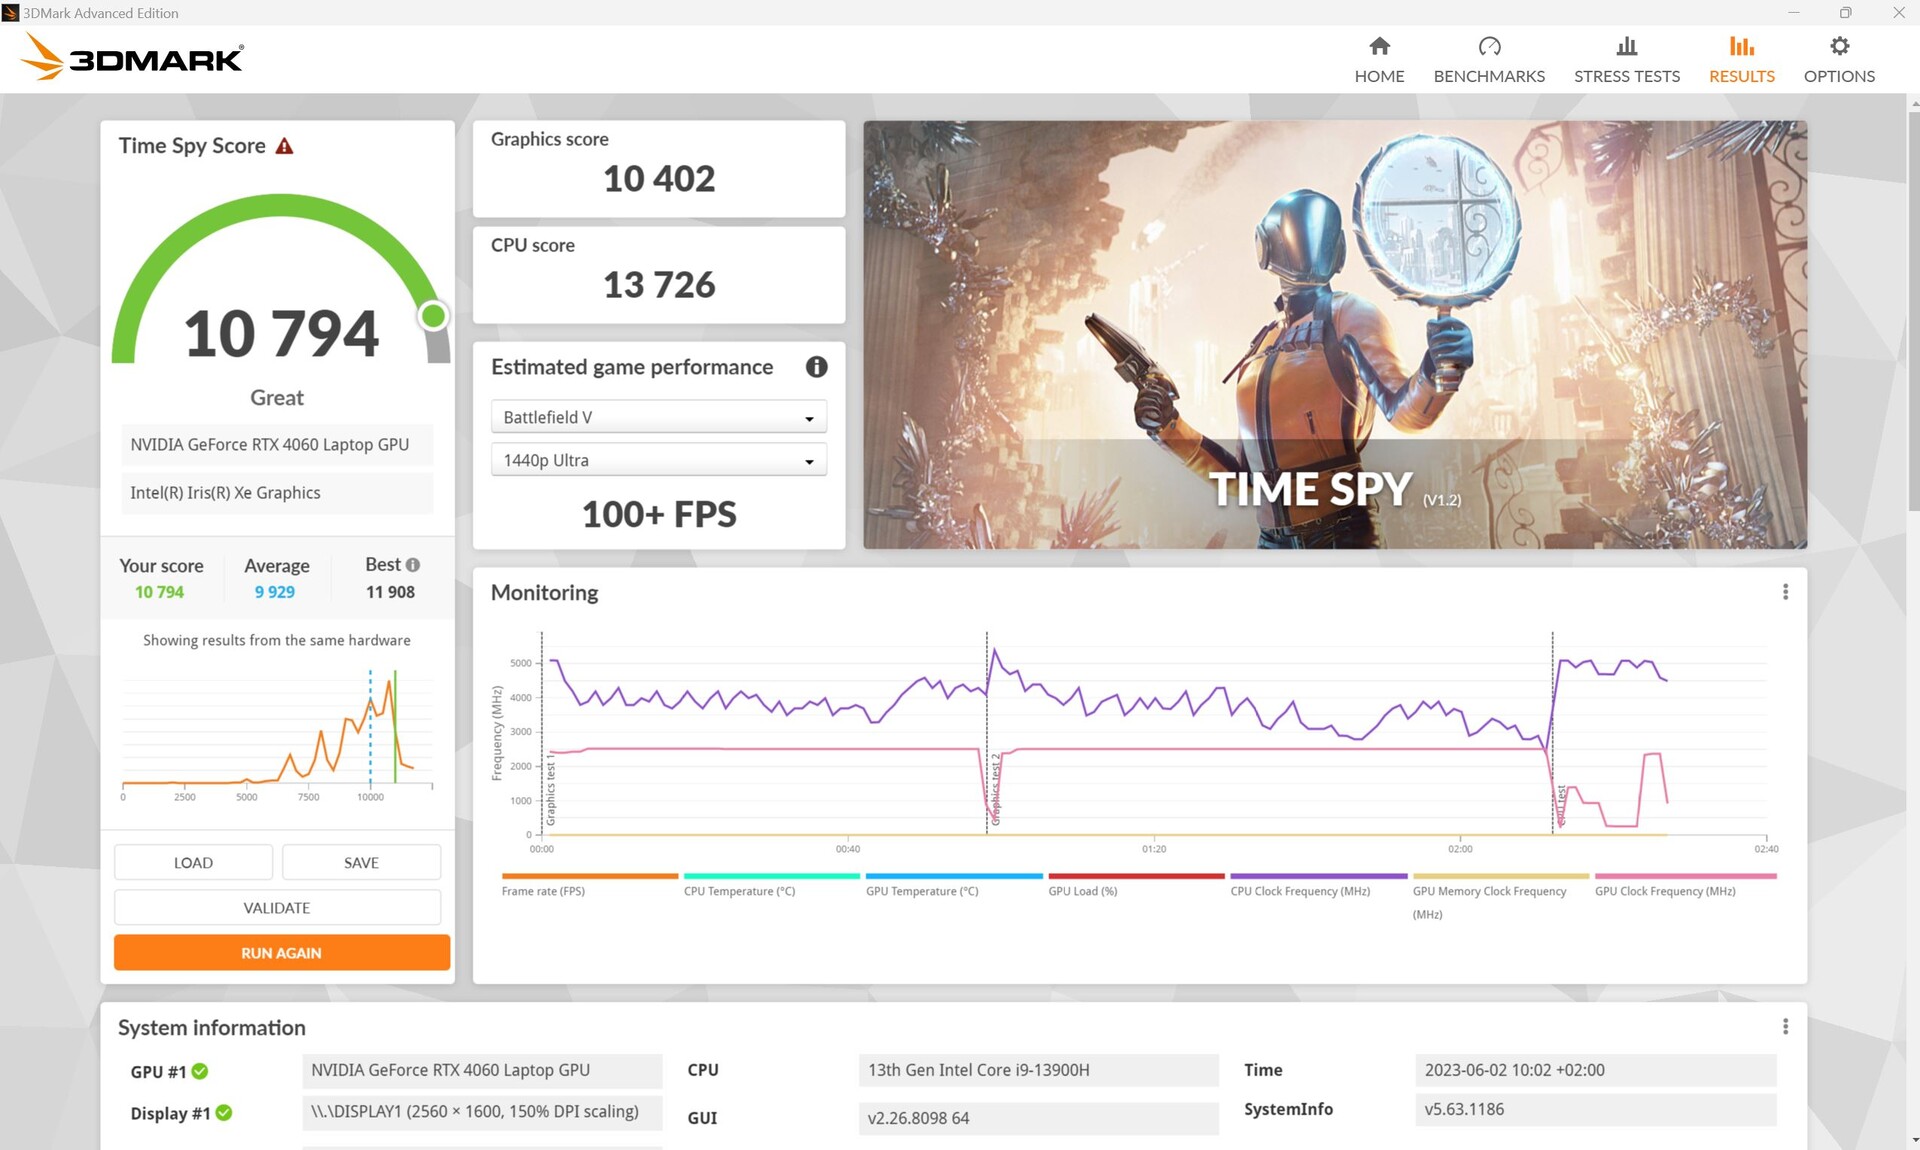
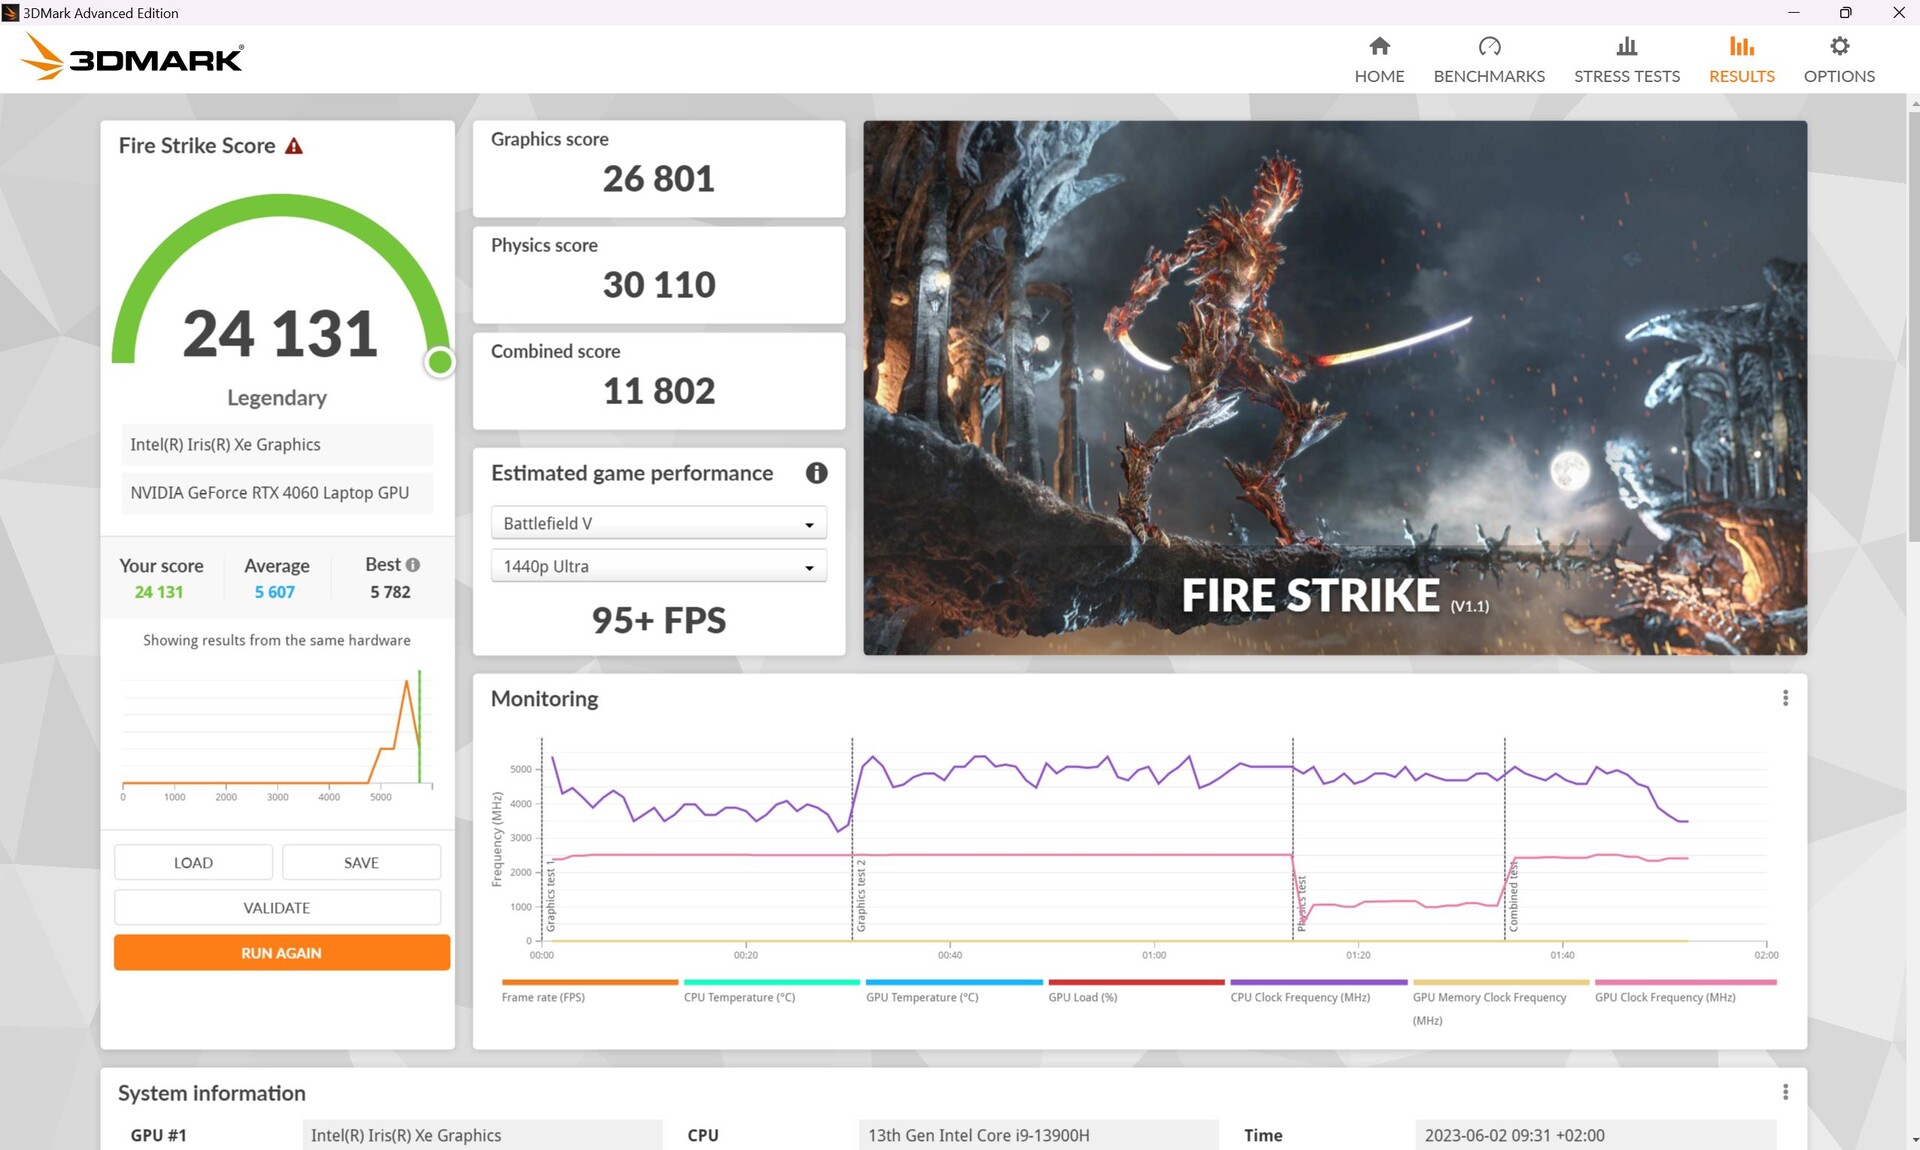
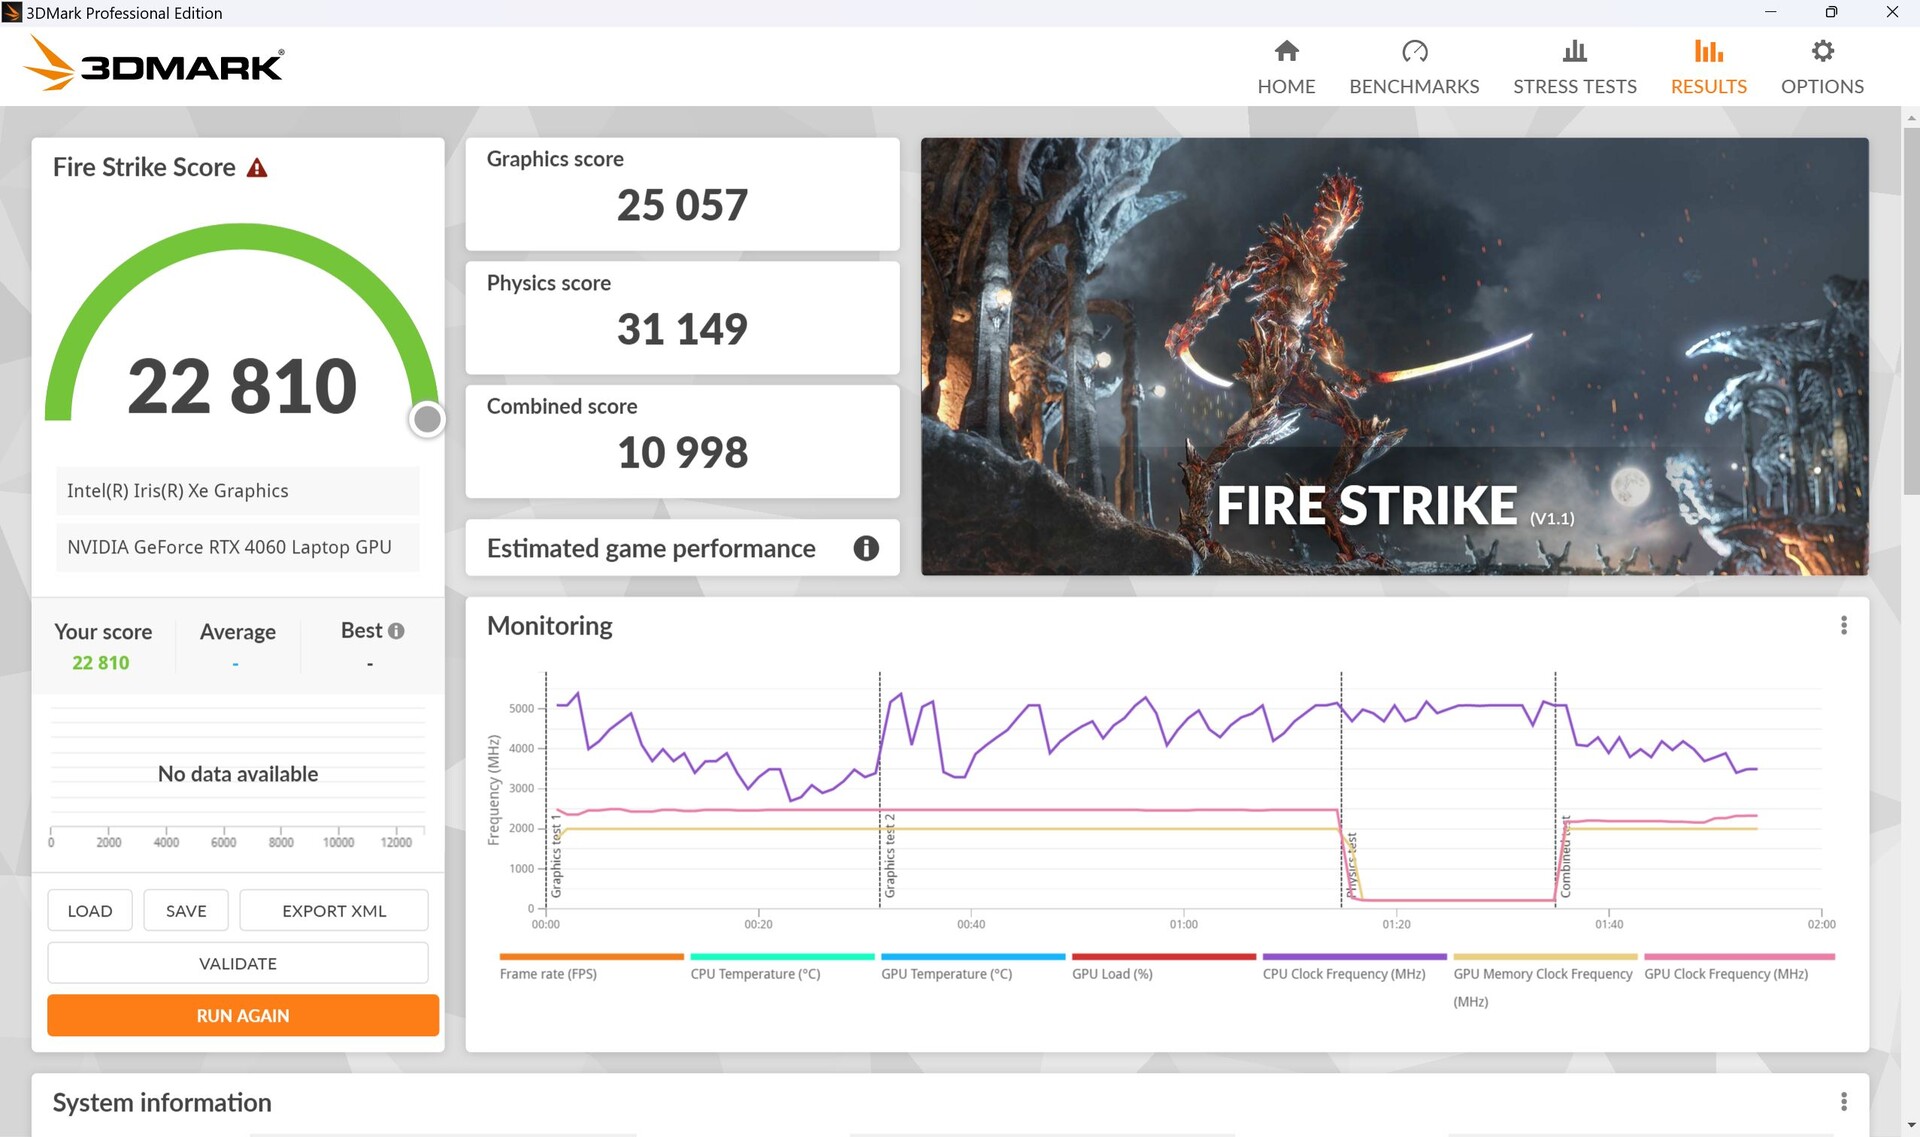
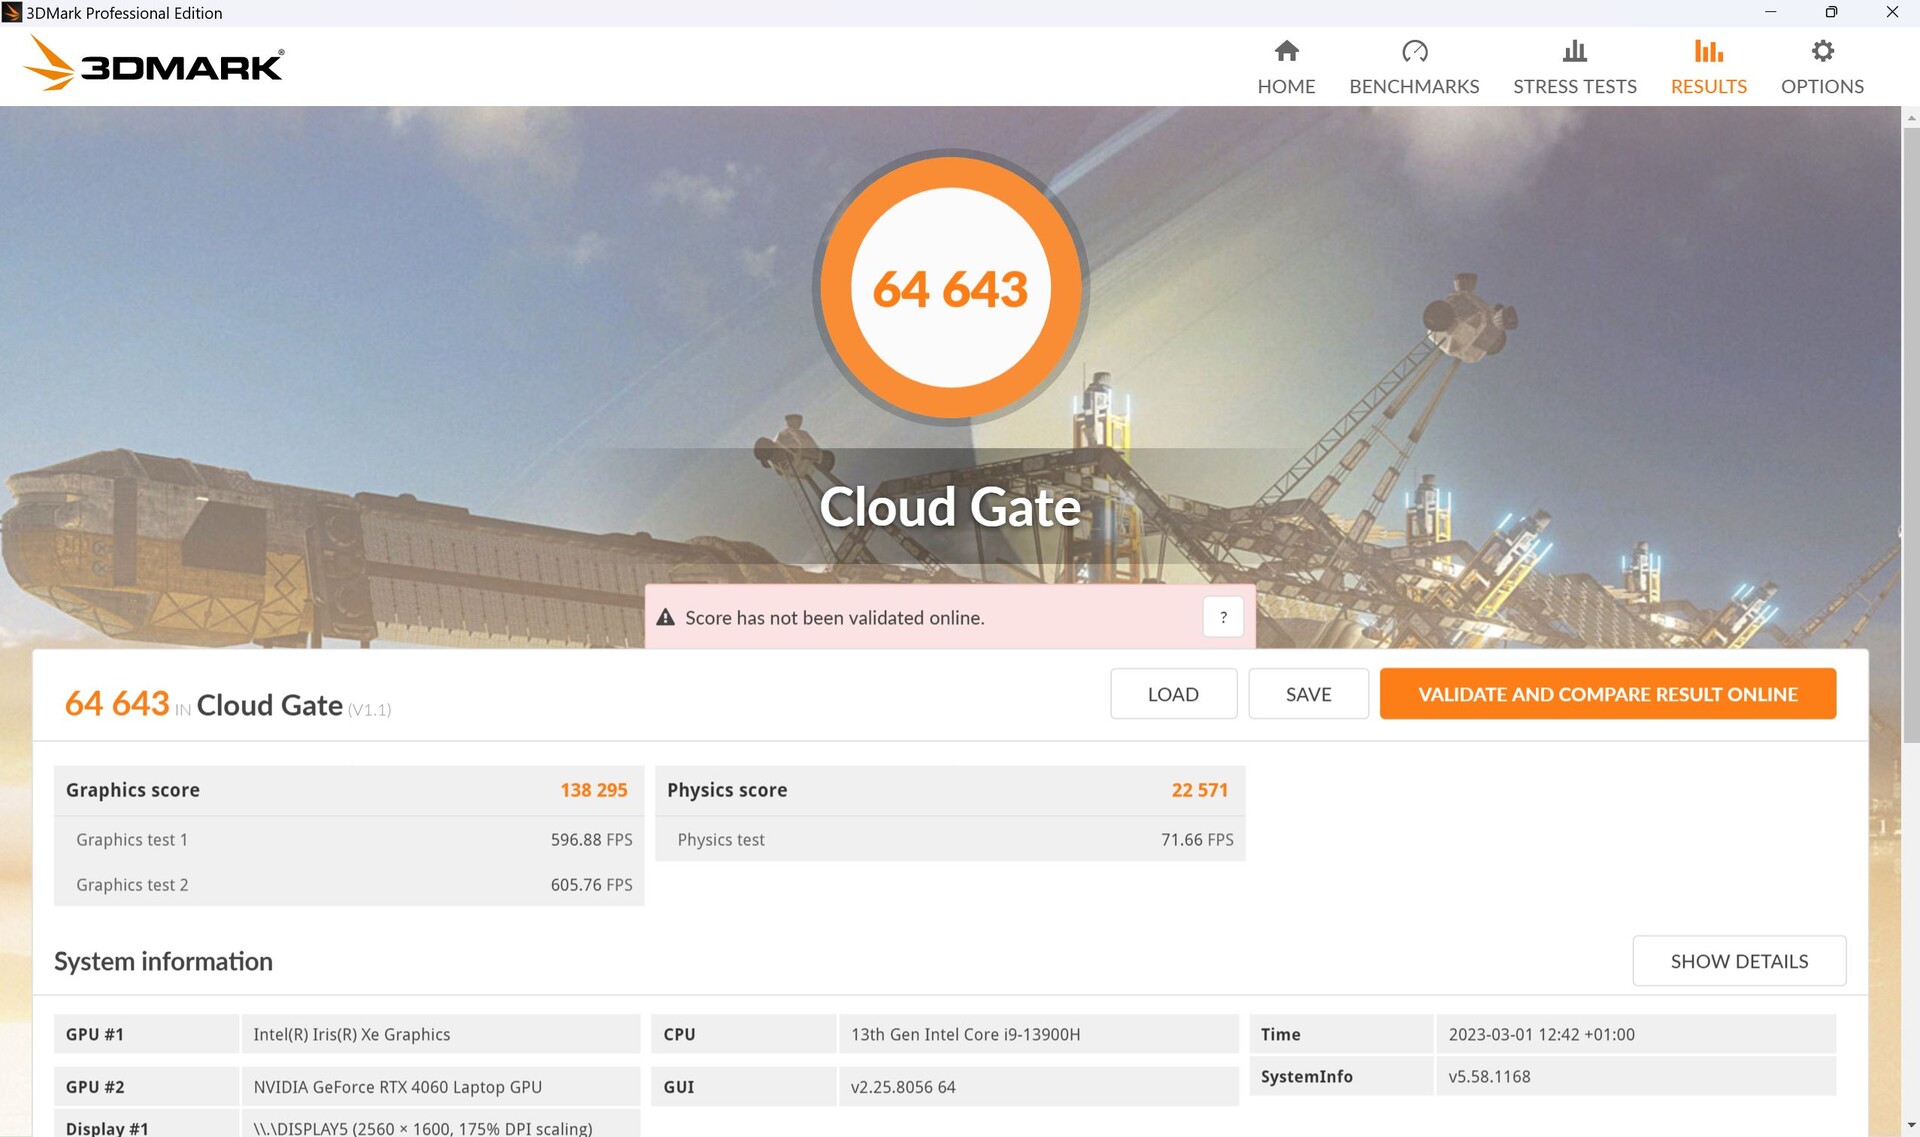
På avstånd från väggen sjunker grafikprestandan. I prestandaläget sjönk Fire Strike grafikpoäng med cirka 17 procent och i tyst läge med hela 42 procent.


| 3DMark 11 Performance | 31662 poäng | |
| 3DMark Cloud Gate Standard Score | 62454 poäng | |
| 3DMark Fire Strike Score | 24131 poäng | |
| 3DMark Time Spy Score | 10794 poäng | |
Hjälp | ||
* ... mindre är bättre
| Premiere Pro PugetBench - Overall Score 0.9 | |
| MSI Stealth 17 Studio A13VH-014 | |
| Asus ROG Flow X16 GV601V | |
| Asus Zephyrus Duo 16 GX650PY-NM006W | |
| MSI Titan GT77 HX 13VI | |
| Apple MacBook Pro 14 2023 M2 Pro | |
| Asus ROG Zephyrus G14 GA402XY | |
Spelprestanda
I Full HD kördes nästan alla spel vi testade smidigt med maximala detaljer. Det finns till och med tillräckliga resurser för QHD med endast mycket krävande titlar som The Last of Us som går på tomgång.
I vår jämförelse ligger Flow X16 på samma nivå som Katana 17 vars RTX 4060 endast har ett TGP-maximum på 105 watt. Å andra sidan är det bara 5 procent som skiljer den från Legion 5 vars RTX 4060 har en TGP på 140 watt. Detta visar återigen att GPU: n knappast lyckas dra nytta av högre TGP, vilket vår kollega betonade i sin analys av de nya Nvidia Geforce RTX 4000-korten. Föregångaren, med sin RTX 3070 Ti, slår den med hela 21 procent.
| The Witcher 3 - 1920x1080 Ultra Graphics & Postprocessing (HBAO+) | |
| Genomsnitt av klass Gaming (104.7 - 240, n=7, senaste 2 åren) | |
| Lenovo Legion Pro 5 16IRX8 | |
| Asus ROG Flow X16 GV601V | |
| MSI Katana 17 B13VFK | |
| Asus ROG Flow X16 GV601RW-M5082W | |
| Samsung Galaxy Book3 Ultra 16, i9-13900H RTX 4070 | |
| Lenovo Yoga Pro 7 14IRH G8 | |
| Strange Brigade - 1920x1080 ultra AA:ultra AF:16 | |
| Genomsnitt av klass Gaming (76.3 - 458, n=87, senaste 2 åren) | |
| Asus ROG Flow X16 GV601V | |
| MSI Katana 17 B13VFK | |
| Asus ROG Flow X16 GV601RW-M5082W | |
| Samsung Galaxy Book3 Ultra 16, i9-13900H RTX 4070 | |
Frameraten på Witcher 3 visar den vanliga dag/natt-kurvan men är i övrigt mycket stabil. Enligt GPU-Z-loggen ligger kärnklockhastigheten på nästan konstanta 2 460 MHz och minnesklockhastigheten är också stabil (2 GHz).
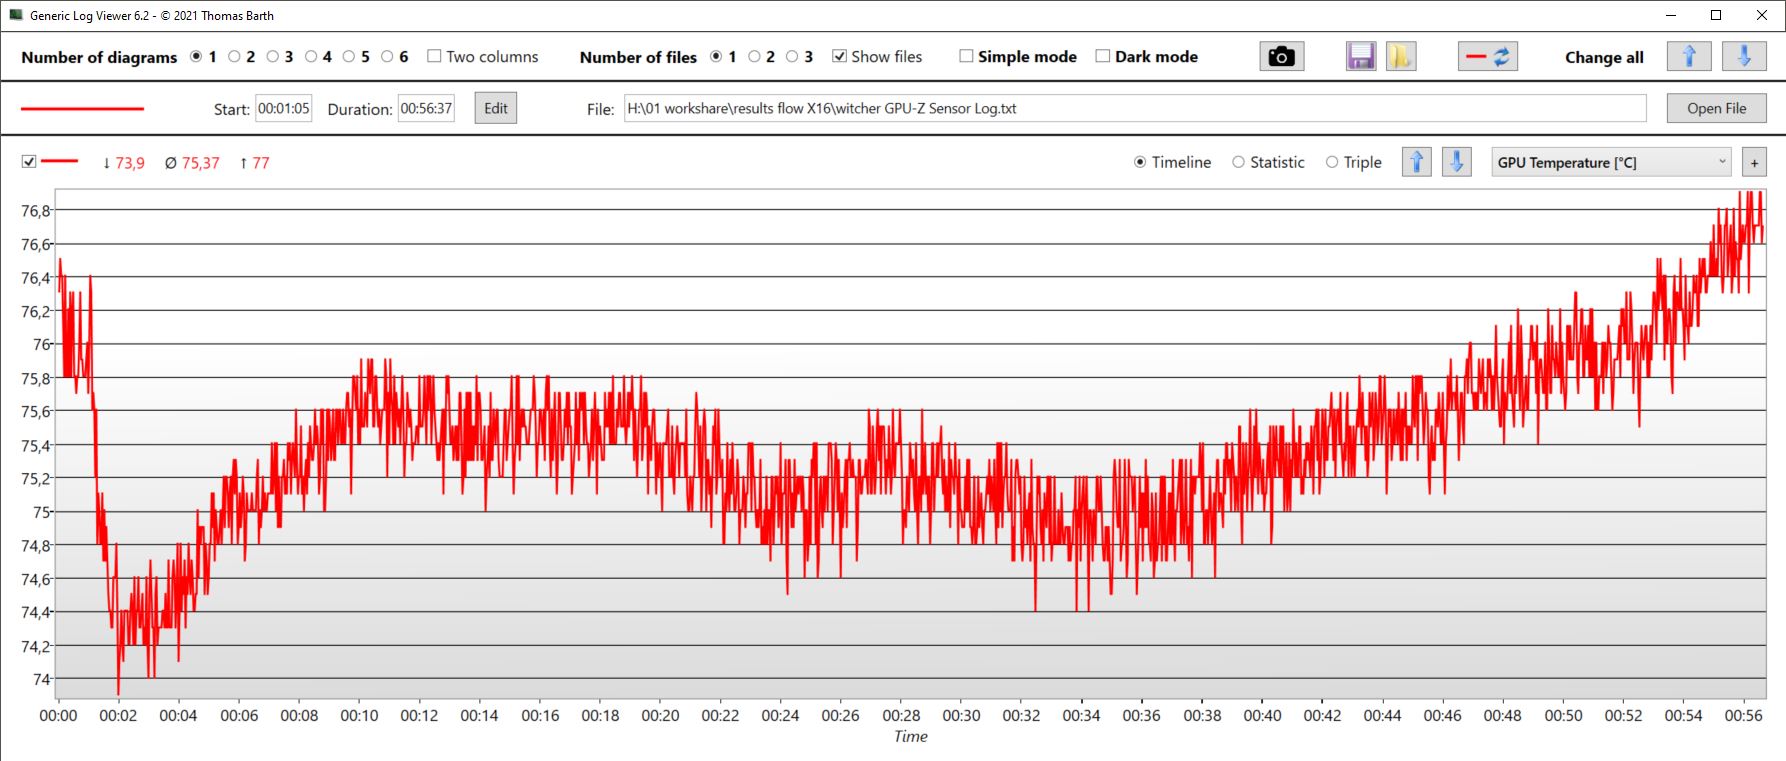
GPU-temperaturen fluktuerade något med ett genomsnitt på cirka 75 °C men ökade kontinuerligt mot slutet av timmen, vilket innebär att klockhastigheten kan strypas under längre perioder av drift.
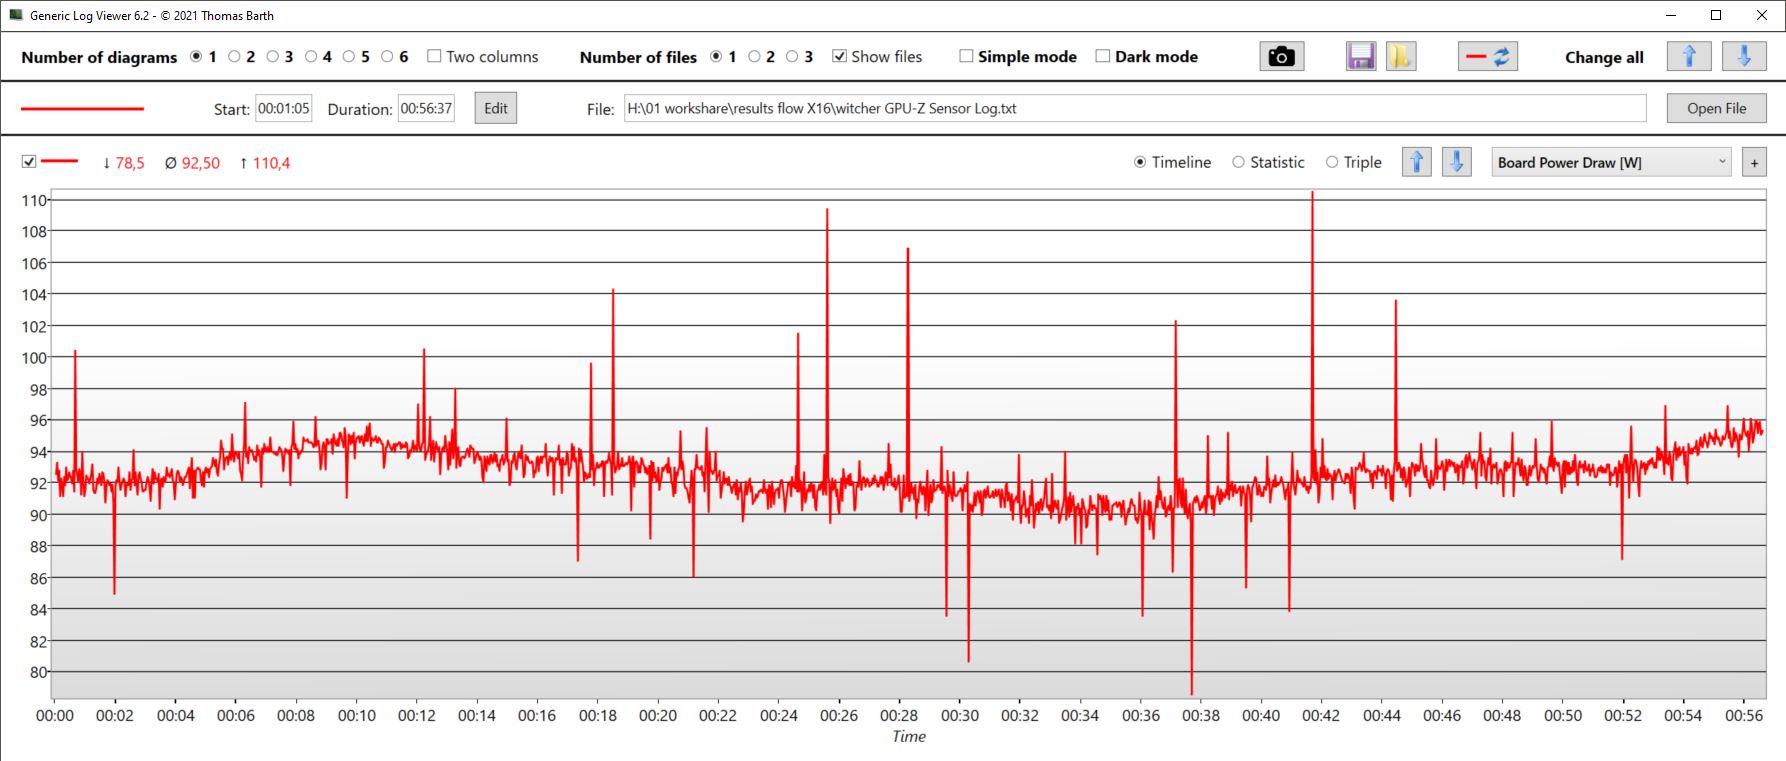
Kortet drog endast 92,5 watt i genomsnitt och vi såg extremt korta toppar på 110 watt men de möjliga 120 watt nåddes aldrig.
Med sittRTX 4070ärGalaxy Book3 ingen chans mot vår X16 som, från en teknisk synvinkel, till och med lyckas komma i närheten av Legion 5.
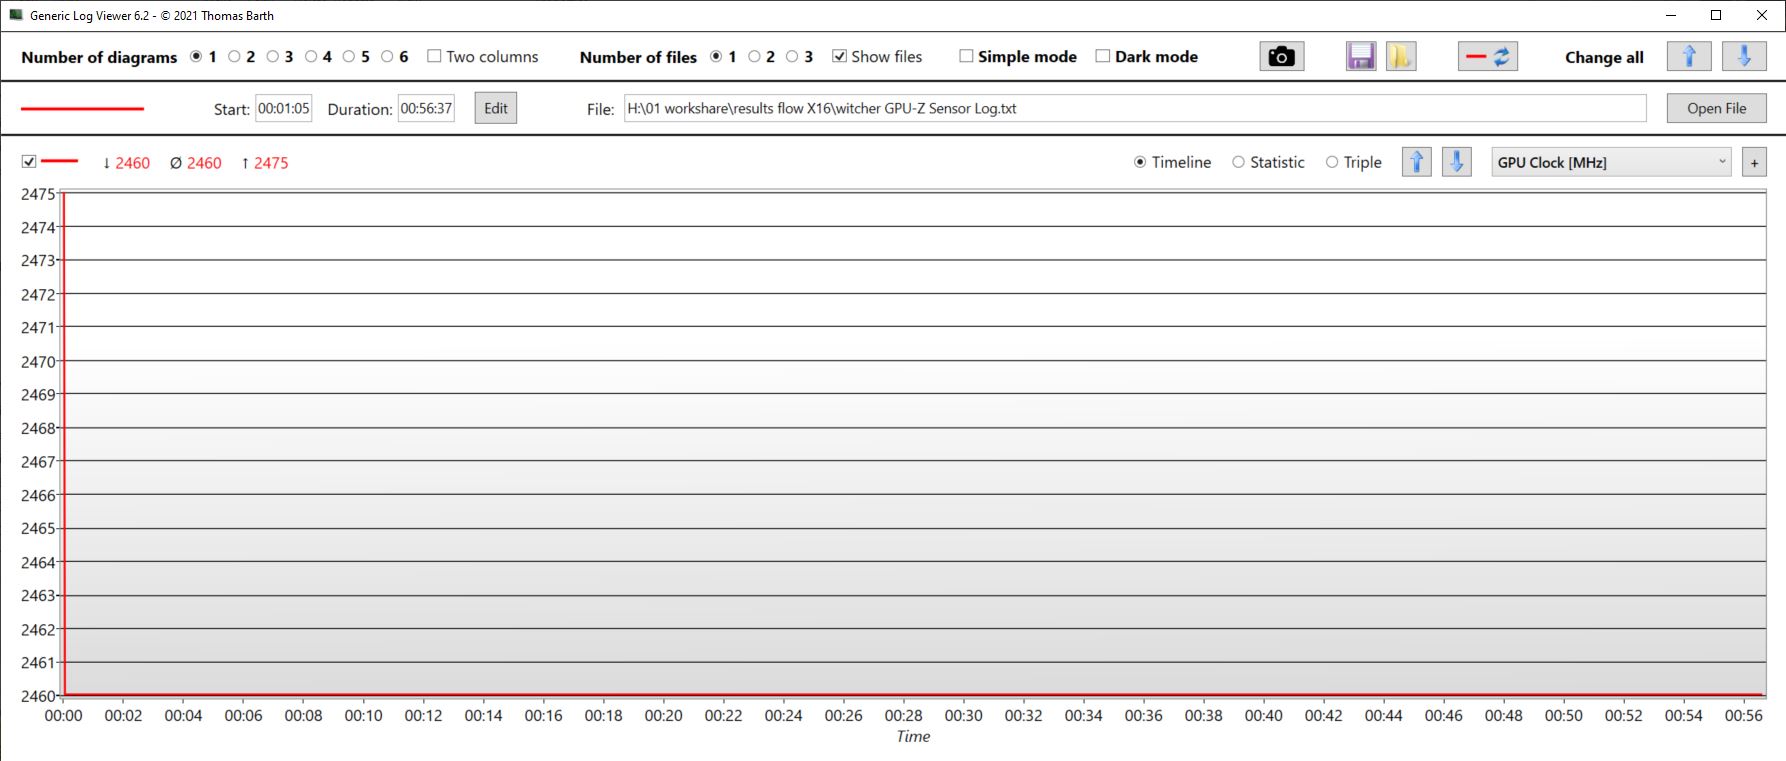
Witcher 3 FPS diagram
| låg | med. | hög | ultra | QHD | 4K | |
|---|---|---|---|---|---|---|
| GTA V (2015) | 184.4 | 179.8 | 173.9 | 110.3 | 79.4 | |
| The Witcher 3 (2015) | 214.8 | 106.5 | ||||
| Dota 2 Reborn (2015) | 188.3 | 166 | 162.8 | 149.2 | 115.5 | |
| Final Fantasy XV Benchmark (2018) | 100.8 | |||||
| X-Plane 11.11 (2018) | 174 | 145.4 | 116.4 | 105.6 | ||
| Far Cry 5 (2018) | 140 | 130 | 99 | |||
| Strange Brigade (2018) | 419 | 266 | 225 | 192.5 | 129.2 | |
| Shadow of the Tomb Raider (2018) | 150 | 137 | 93 | |||
| Assassin´s Creed Valhalla (2020) | 114 | 98 | 71 | |||
| Far Cry 6 (2021) | 120 | 108 | 79 | |||
| Cyberpunk 2077 1.6 (2022) | 84.25 | 76.64 | 48.71 | |||
| F1 22 (2022) | 257 | 218 | 183.9 | 64.8 | 42.3 | |
| Call of Duty Modern Warfare 2 2022 (2022) | 91 | 86 | 61 | |||
| Hogwarts Legacy (2023) | 106.9 | 91.9 | 42.8 | |||
| The Last of Us (2023) | 71.2 | 53.1 | 32.7 |
Utsläpp - Tyst är också möjligt med Flow X16
Utsläpp av buller
Vid tomgångskörning står fläktarna mestadels stilla. Under belastning beror bullret tydligt på det valda prestandaläget. När vi till exempel spelade i turboläget gick fläktarna på över 50 dB, medan de i prestandaläget gick på mycket mer acceptabla 44 dB. Enbart denna relativt stora skillnad bör göra den lilla prestandaförlusten i prestandaläget mer uthärdlig. I tyst läge sjönk decibelnivån till endast 37 dB.
I turboläget var fläktarna igång ganska länge efter att ha kört krävande uppgifter som spel, om än inte på full hastighet. Men även när X16 kördes på tomgång förblev den högljudd i ganska många minuter, om en spelsession precis tidigare hade ägt rum.
För innehållsskapare skulle vi därför rekommendera att använda prestandaläget (eller till och med tyst) eftersom de är mycket tystare med en tolerabel minskning av tillgänglig effekt.
När du kör på tomgång fortsätter Windows eller Asus bakgrundsprocesser att störa de tysta fläktarna. Dessa fläktar sparkar in, särskilt i turboläge.
| Modus/Witcher 3 Ultra | FPS | Lautstärke in dB | Durchschnittsverbrauch in W |
|---|---|---|---|
| Turbo | 102 | 50,92 | 142 |
| Leistung | 92 | 44 | |
| Leise | 80 | 37,53 | 106 |
Ljudnivå
| Låg belastning |
| 24 / 24 / 24 dB(A) |
| Hög belastning |
| 36.71 / 50.92 dB(A) |
 | ||
30 dB tyst 40 dB(A) hörbar 50 dB(A) högt ljud |
||
min: | ||
| Asus ROG Flow X16 GV601V GeForce RTX 4060 Laptop GPU, i9-13900H, WD PC SN560 SDDPNQE-1T00 | Asus ROG Flow X16 GV601RW-M5082W GeForce RTX 3070 Ti Laptop GPU, R9 6900HS, Micron 3400 1TB MTFDKBA1T0TFH | Samsung Galaxy Book3 Ultra 16, i9-13900H RTX 4070 GeForce RTX 4070 Laptop GPU, i9-13900H, Samsung PM9A1 MZVL21T0HCLR | Lenovo Legion Pro 5 16IRX8 GeForce RTX 4060 Laptop GPU, i7-13700HX, SK hynix PC801 HFS512GEJ9X115N | Lenovo Yoga Pro 7 14IRH G8 GeForce RTX 4050 Laptop GPU, i7-13700H, Samsung PM9A1 MZVL21T0HCLR | MSI Katana 17 B13VFK GeForce RTX 4060 Laptop GPU, i7-13620H, Micron 2400 MTFDKBA1T0QFM | |
|---|---|---|---|---|---|---|
| Noise | -13% | -9% | 1% | -6% | -19% | |
| av / miljö * (dB) | 24 | 25.5 -6% | 25.2 -5% | 23 4% | 22.9 5% | 24.5 -2% |
| Idle Minimum * (dB) | 24 | 25.5 -6% | 25.2 -5% | 23.1 4% | 22.9 5% | 24.5 -2% |
| Idle Average * (dB) | 24 | 25.5 -6% | 25.2 -5% | 23.1 4% | 22.9 5% | 24.5 -2% |
| Idle Maximum * (dB) | 24 | 27.4 -14% | 31.3 -30% | 26.6 -11% | 36.8 -53% | 40 -67% |
| Load Average * (dB) | 36.71 | 49.9 -36% | 38.8 -6% | 34.7 5% | 43.7 -19% | 48.3 -32% |
| Witcher 3 ultra * (dB) | 50.92 | 47.6 7% | 46.2 9% | 56 -10% | ||
| Load Maximum * (dB) | 50.92 | 55 -8% | 51.2 -1% | 54.8 -8% | 46.2 9% | 59.1 -16% |
* ... mindre är bättre
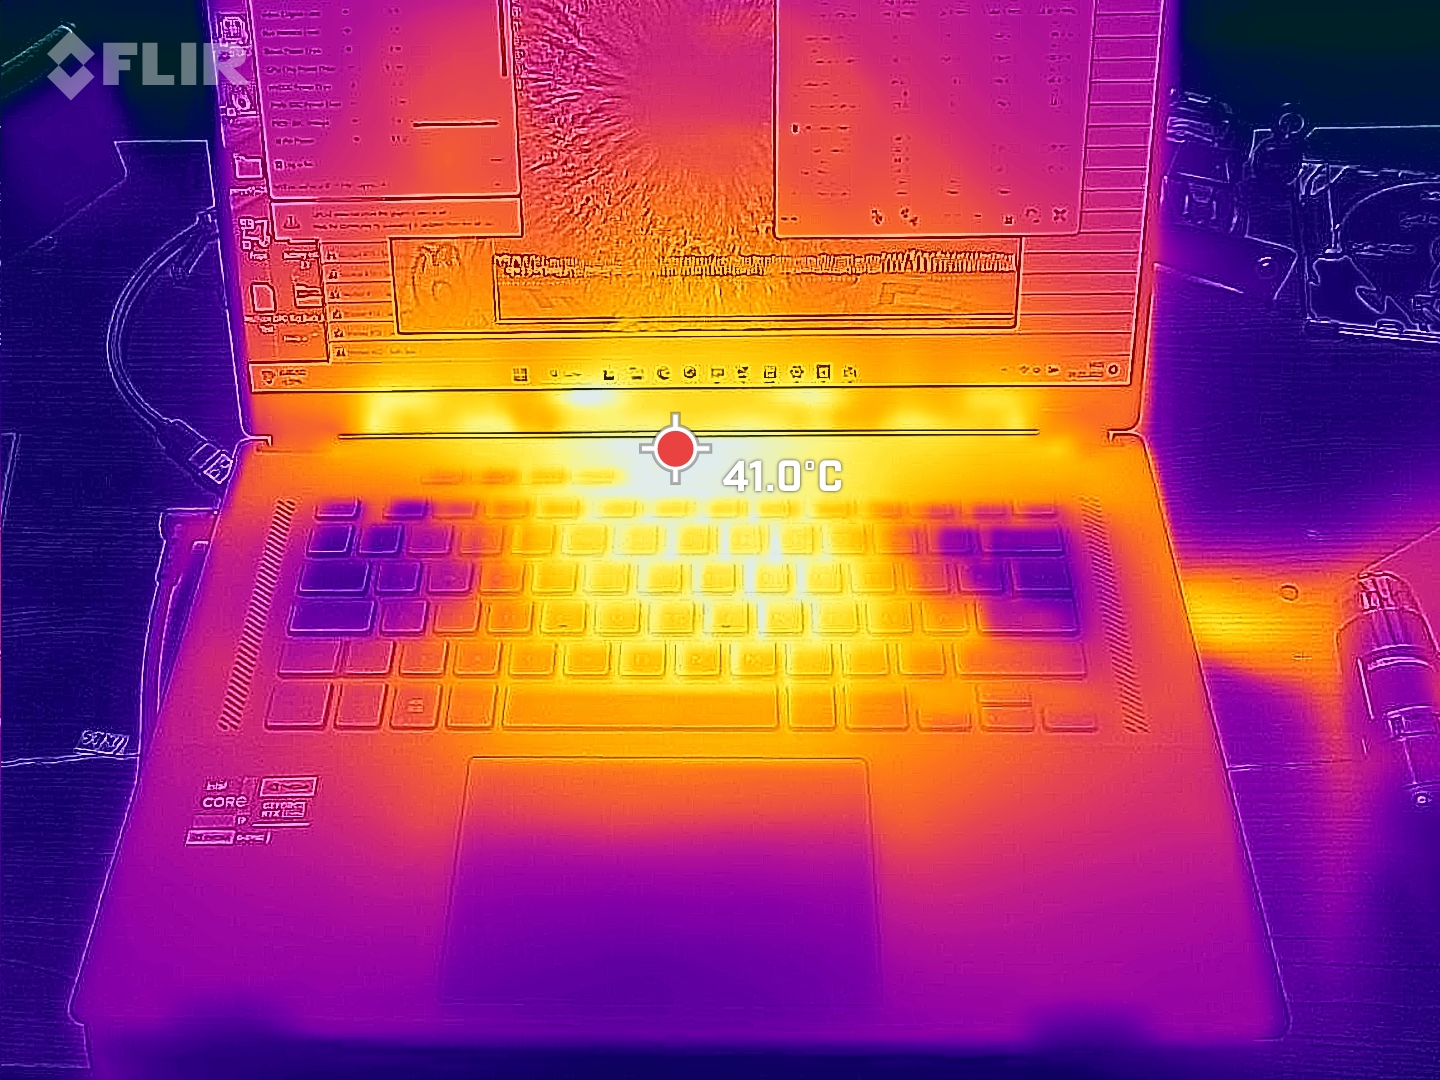
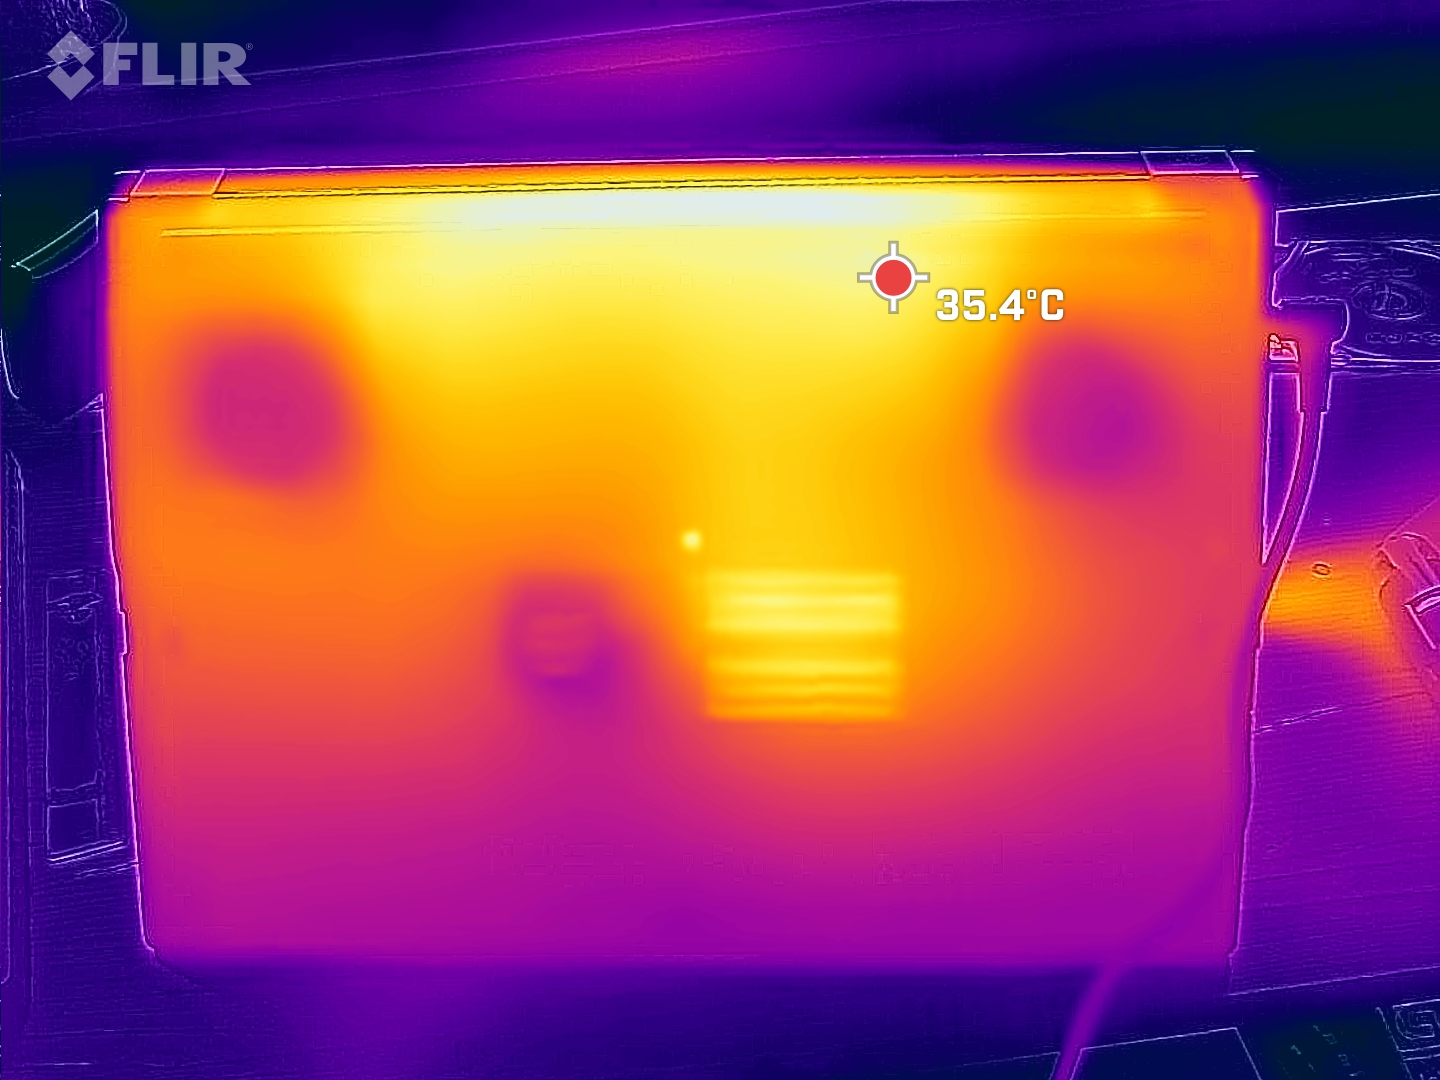
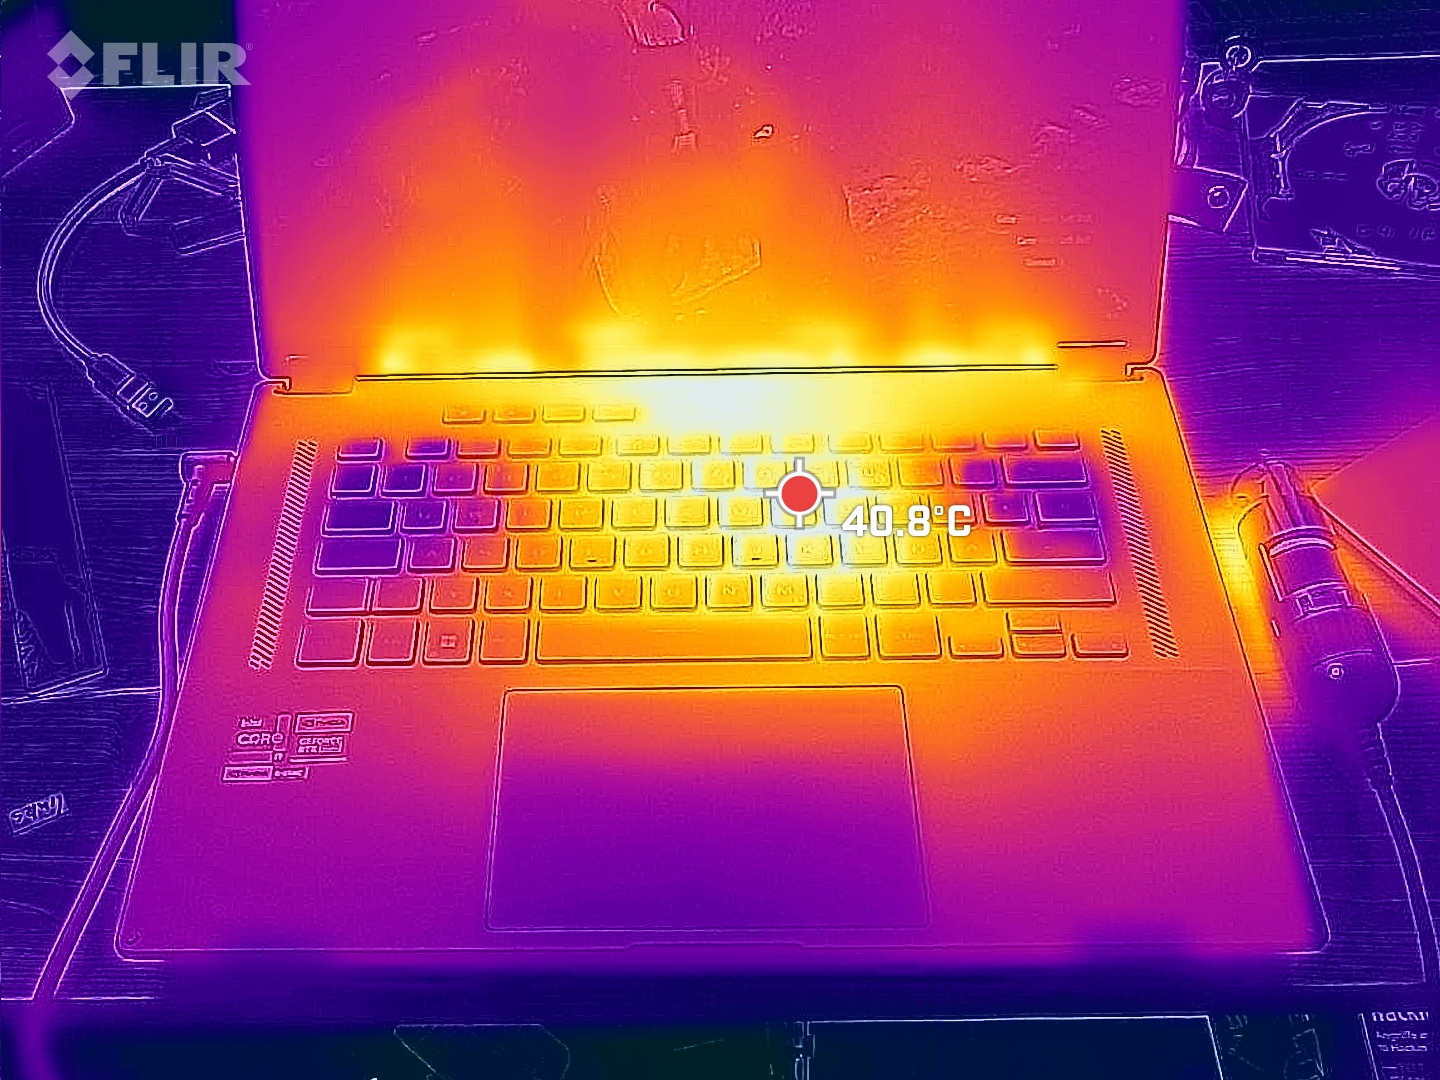
Temperatur
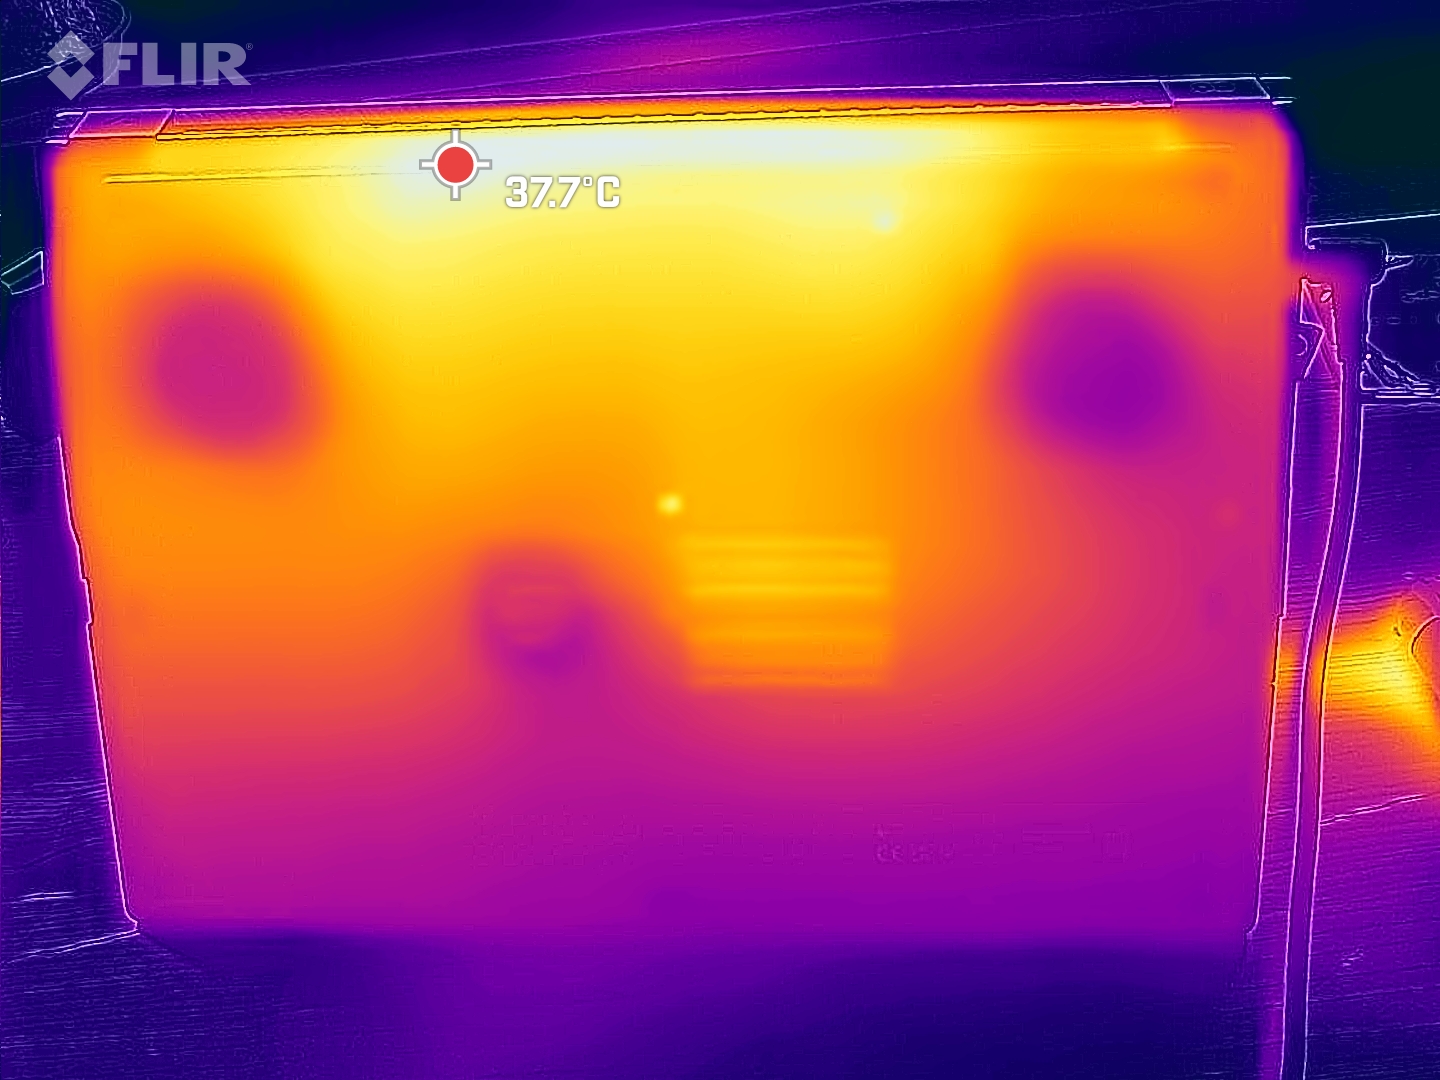
Under spelandet finns det heta punkter på cirka 50 °C som kan hittas på mitten, den övre delen av enheten och mot baksidan där handledsstödet och WASD-tangenterna förblir jämförelsevis svala. På undersidan av den bärbara datorn blir det inte överdrivet varmt.
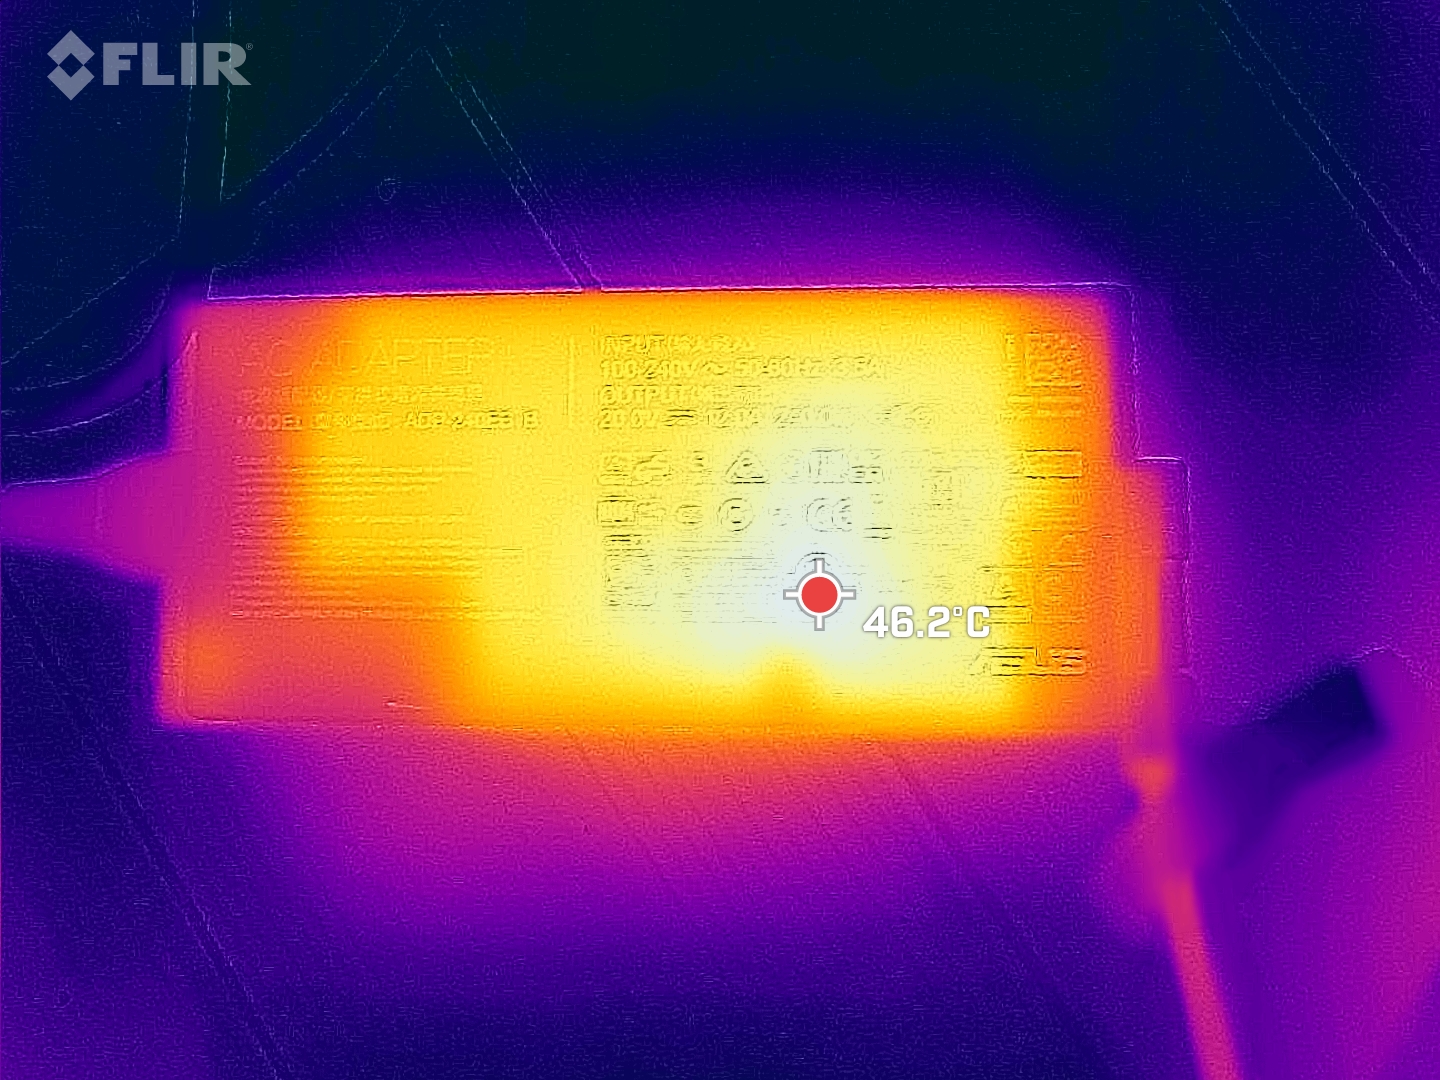
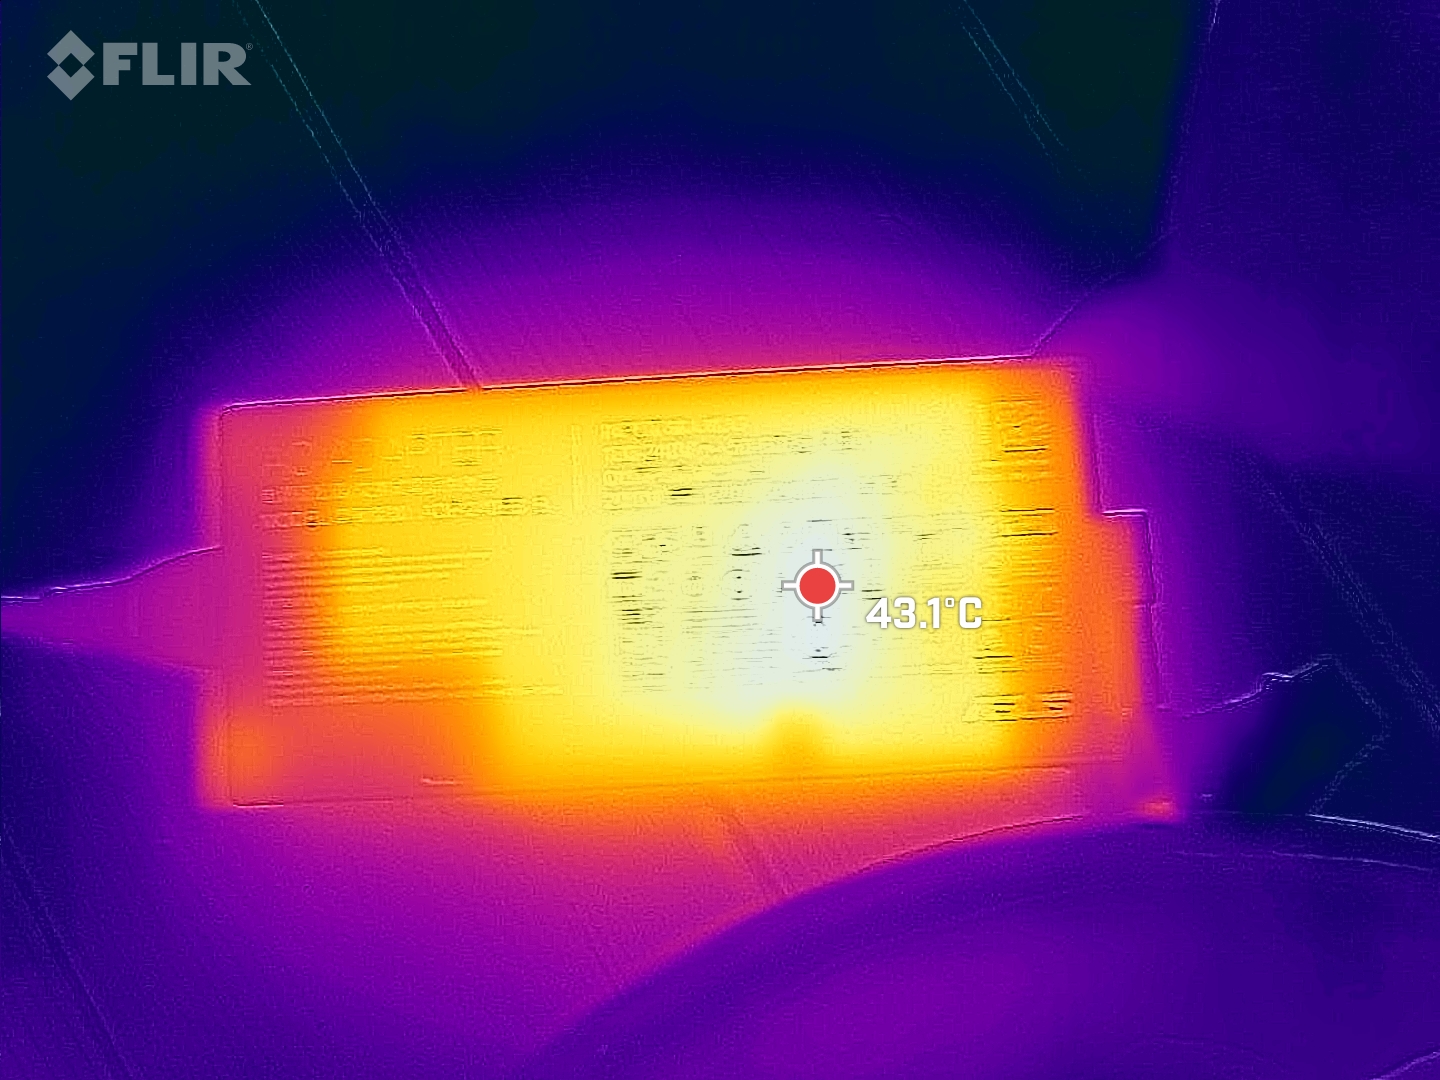
Men även i viloläge kan nätadaptern bli mycket varm. Det krävs bara ett fåtal bakgrundsprocesser för att värma upp det tunna nätaggregatet till en temperatur på 45 °C!
(-) Den maximala temperaturen på ovansidan är 46 °C / 115 F, jämfört med genomsnittet av 40.4 °C / 105 F , allt från 21.2 till 68.8 °C för klassen Gaming.
(±) Botten värms upp till maximalt 41 °C / 106 F, jämfört med genomsnittet av 43.2 °C / 110 F
(+) Vid tomgångsbruk är medeltemperaturen för ovansidan 31.9 °C / 89 F, jämfört med enhetsgenomsnittet på 33.9 °C / ### class_avg_f### F.
(±) När du spelar The Witcher 3 är medeltemperaturen för ovansidan 37.4 °C / 99 F, jämfört med enhetsgenomsnittet på 33.9 °C / ## #class_avg_f### F.
(+) Handledsstöden och pekplattan är kallare än hudtemperaturen med maximalt 31 °C / 87.8 F och är därför svala att ta på.
(-) Medeltemperaturen för handledsstödsområdet på liknande enheter var 28.8 °C / 83.8 F (-2.2 °C / -4 F).
| Asus ROG Flow X16 GV601V Intel Core i9-13900H, NVIDIA GeForce RTX 4060 Laptop GPU | Asus ROG Flow X16 GV601RW-M5082W AMD Ryzen 9 6900HS, NVIDIA GeForce RTX 3070 Ti Laptop GPU | Samsung Galaxy Book3 Ultra 16, i9-13900H RTX 4070 Intel Core i9-13900H, NVIDIA GeForce RTX 4070 Laptop GPU | Lenovo Legion Pro 5 16IRX8 Intel Core i7-13700HX, NVIDIA GeForce RTX 4060 Laptop GPU | Lenovo Yoga Pro 7 14IRH G8 Intel Core i7-13700H, NVIDIA GeForce RTX 4050 Laptop GPU | MSI Katana 17 B13VFK Intel Core i7-13620H, NVIDIA GeForce RTX 4060 Laptop GPU | |
|---|---|---|---|---|---|---|
| Heat | -13% | -4% | 0% | 4% | 2% | |
| Maximum Upper Side * (°C) | 46 | 55.1 -20% | 45.9 -0% | 42.8 7% | 41.6 10% | 41.6 10% |
| Maximum Bottom * (°C) | 41 | 50.3 -23% | 50.9 -24% | 50 -22% | 55.7 -36% | 43.1 -5% |
| Idle Upper Side * (°C) | 36 | 35.5 1% | 31.6 12% | 29.6 18% | 25.9 28% | 32 11% |
| Idle Bottom * (°C) | 33 | 36.1 -9% | 34.2 -4% | 34 -3% | 28 15% | 35.8 -8% |
* ... mindre är bättre
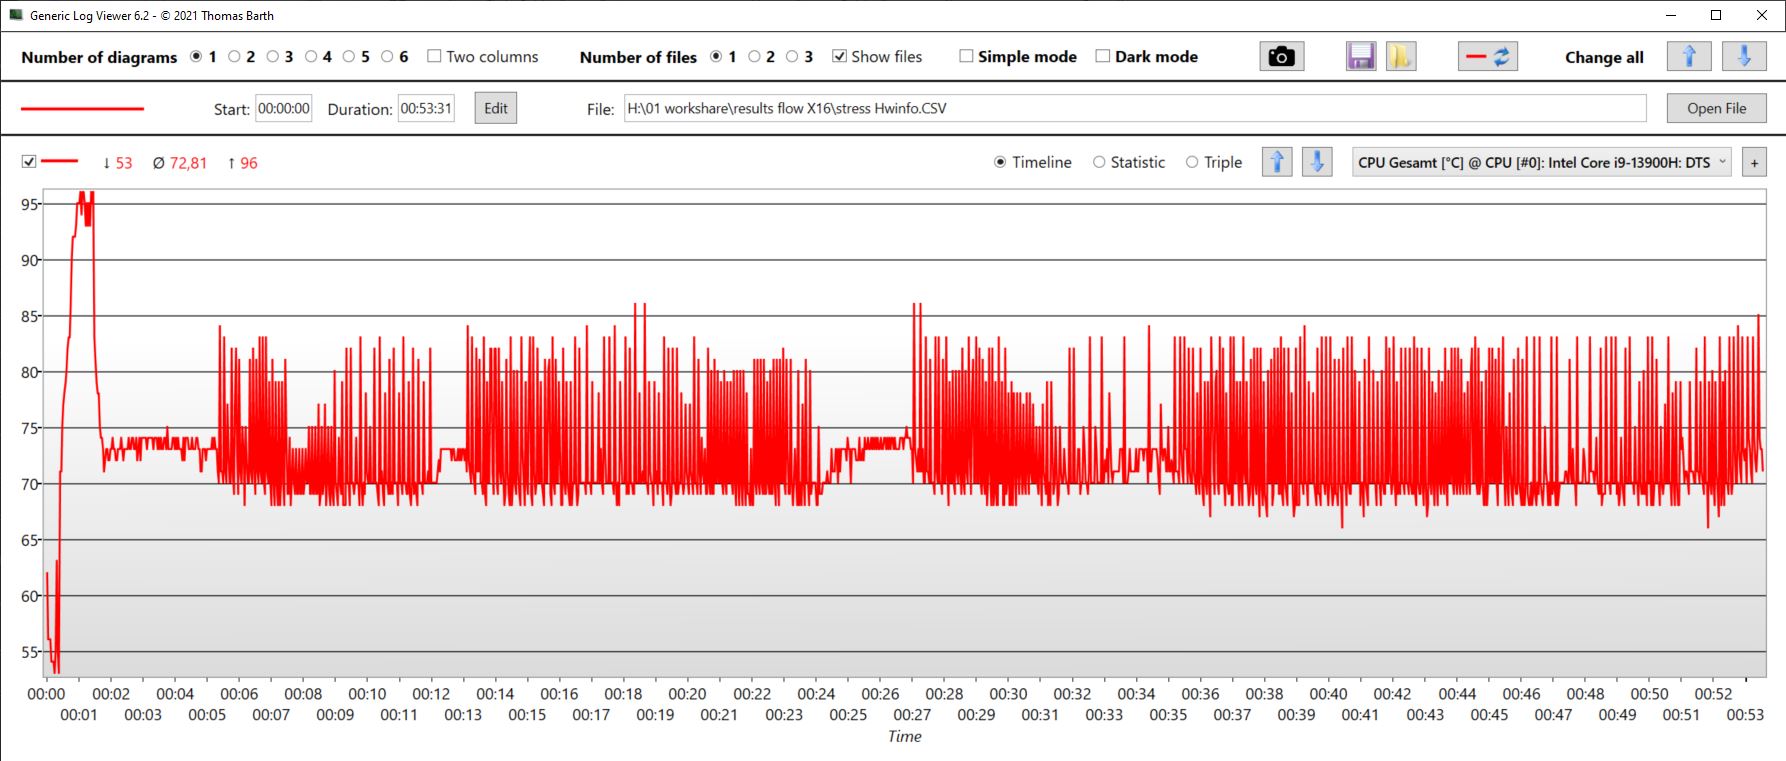
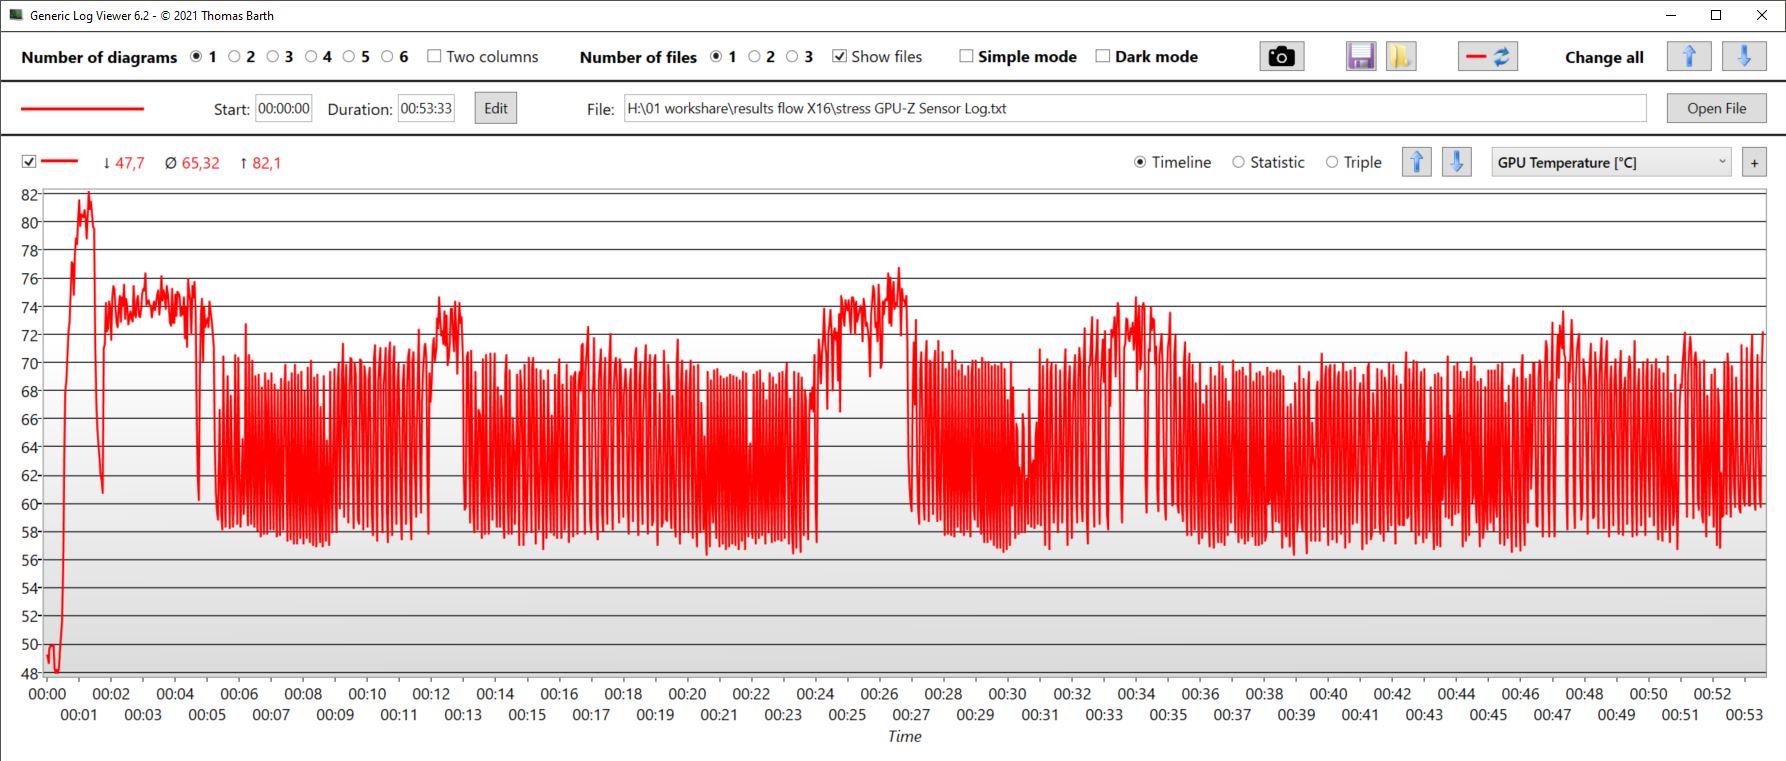
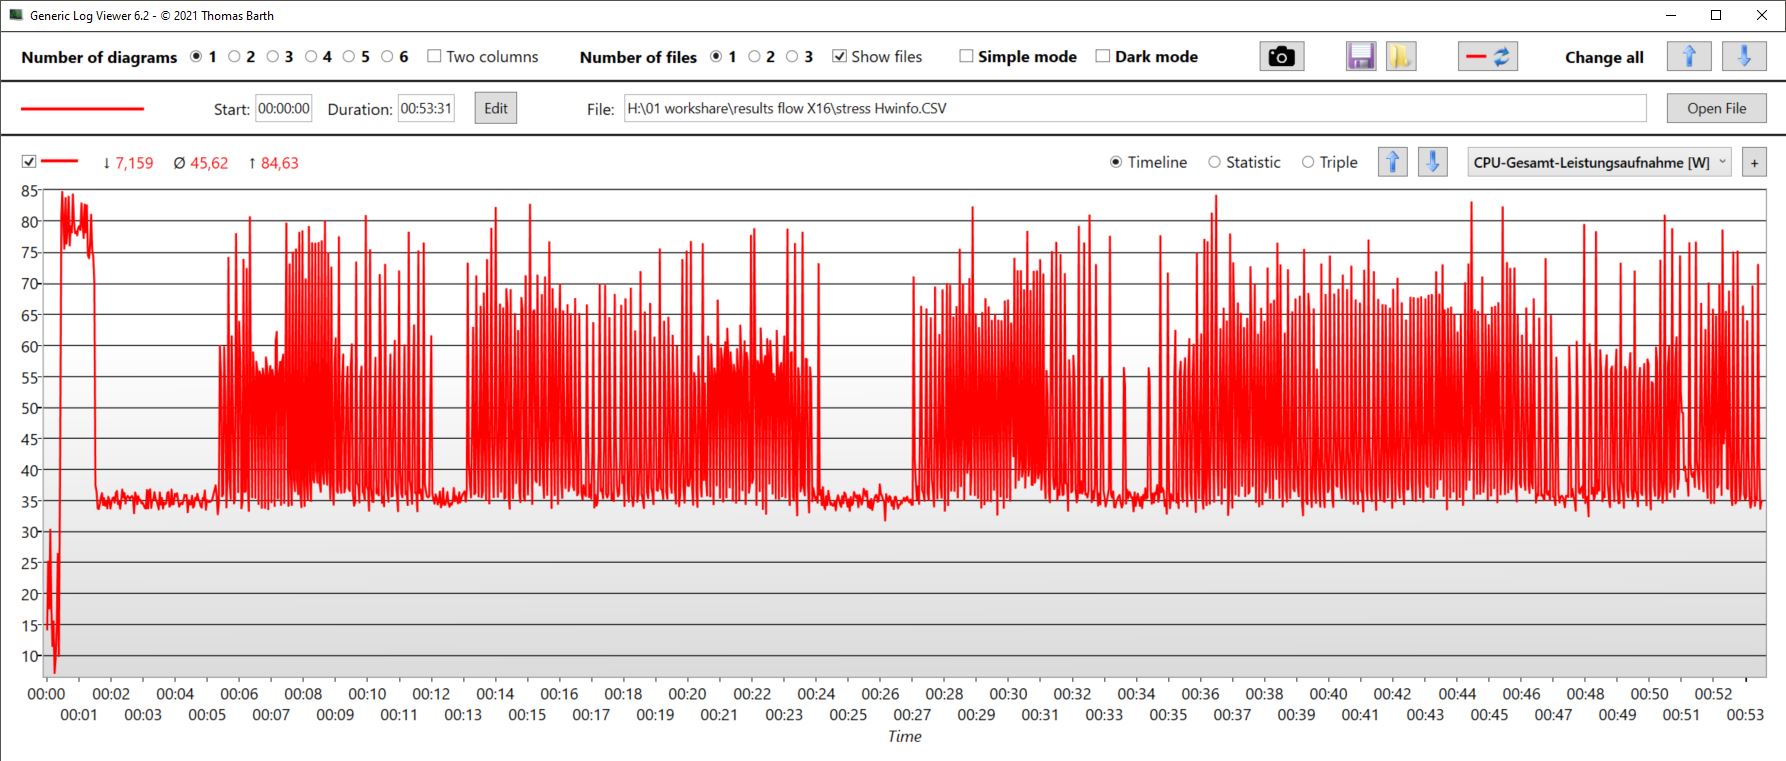
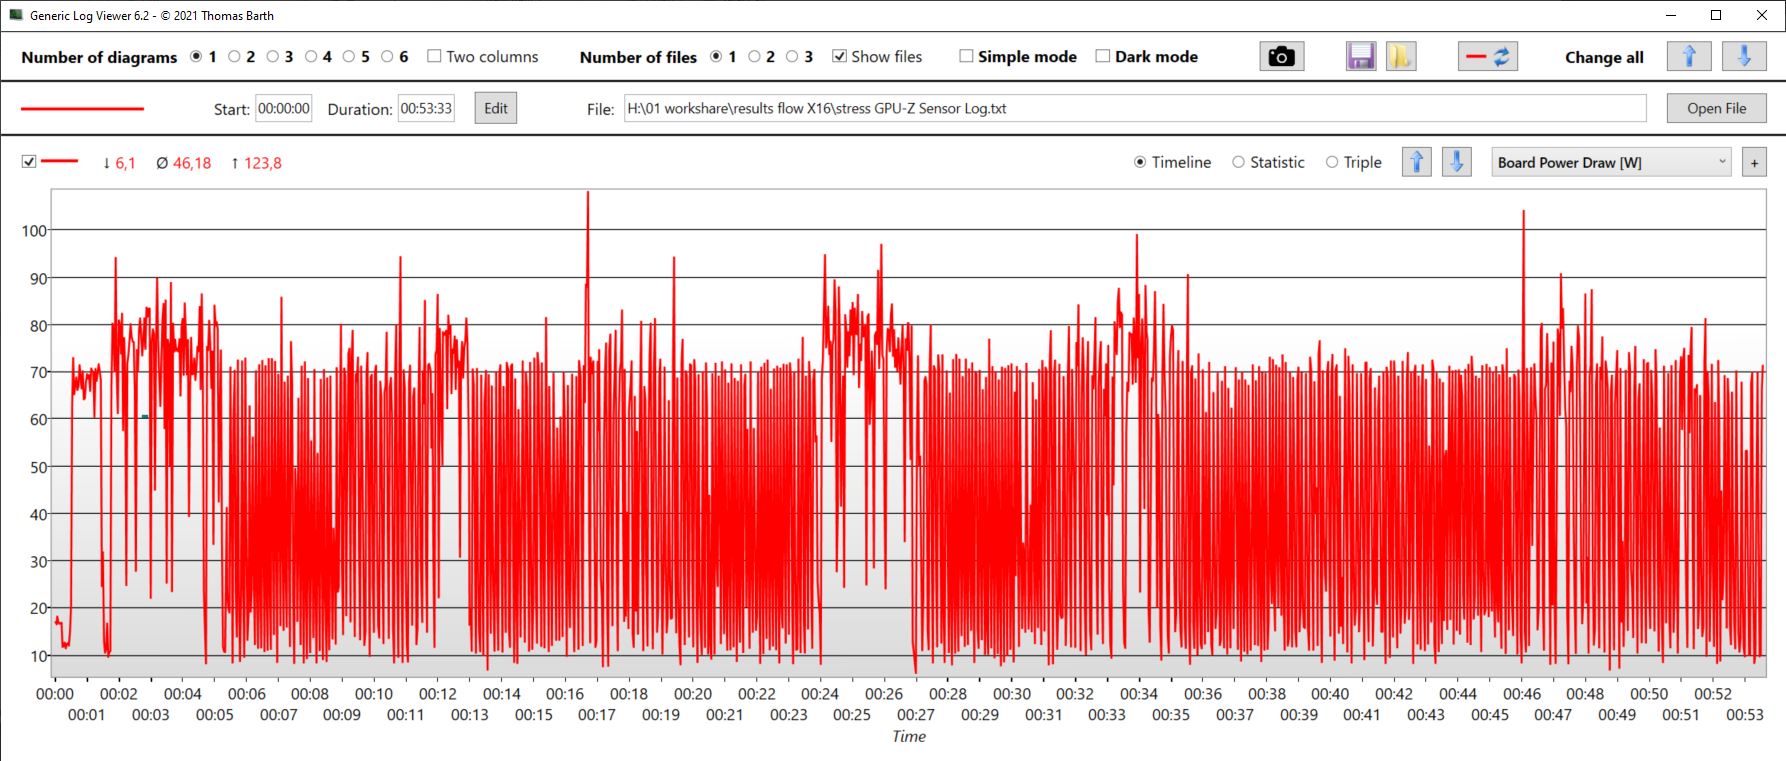
Stresstest
I början ökade kärnorna till nästan 4 GHz och CPU:n drog 85 watt. Men efter cirka en minut nådde kärntemperaturen 96 °C och prestandan minskade avsevärt. Kärnornas klockfrekvens sjönk till 2,4 GHz under några minuter och TDP var bara 35 watt. Detta resulterade i en ytterligare temperaturminskning. Efter några minuter ökade hastigheten och fluktuerade ganska avsevärt och lade sig på ett genomsnitt på cirka 2,6 GHz. Minskningen av TDP till 35 watt under några minuter i taget var ett regelbundet förekommande fenomen, varefter den periodvis fluktuerade igen. Eftersom temperaturen sjönk lika snabbt var detta inte den enda anledningen till detta beteende.
I mindre utsträckning var GPU liknande. De relativt stabila faserna var betydligt kortare och de totala värdena fluktuerade mer. Klockfrekvensen pendlade upprepade gånger från 2,4 GHz till 2,4 GHz till endast 500 MHz och lägre, och minnesklockfrekvensen uppvisade liknande extrema fluktuationer. Medeltemperaturen var 65 °C och steg till maximalt 82 °C. Strömförbrukningen låg på i genomsnitt 46 watt, men hoppade upprepade gånger till 90 watt eller över 100 watt.
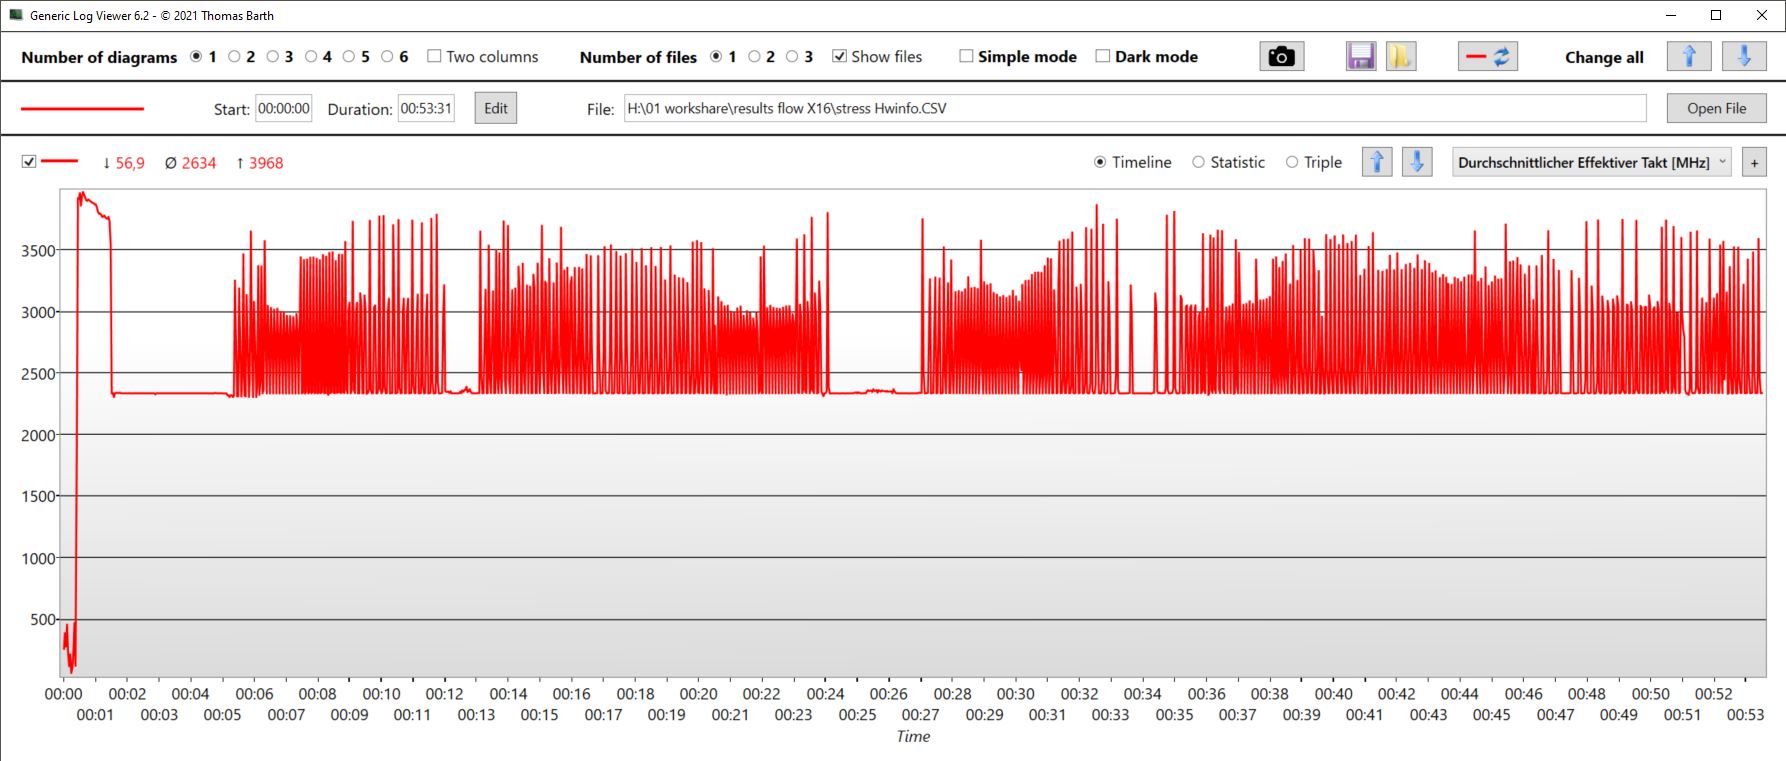
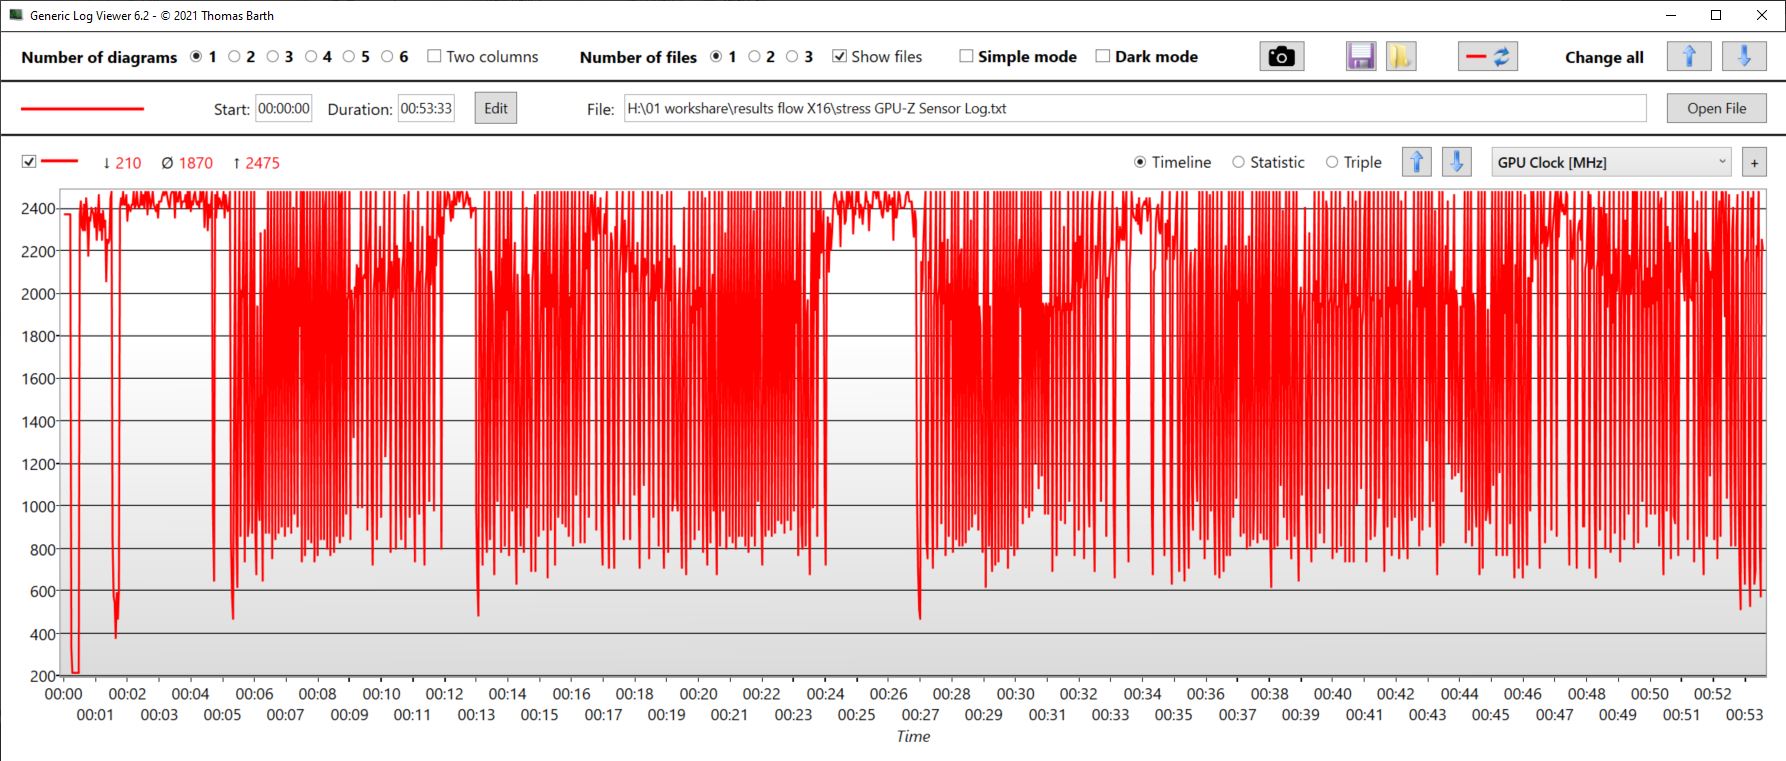
| CPU-klocka (GHz) | GPU-klocka (MHz) | Genomsnittlig CPU-temperatur (°C) | Genomsnittlig GPU-temperatur (°C) | |
| Prime95 + FurMark Stress | 2,6 | 1.870 | 73 | 65 |
| Witcher 3 StressAllerdings könnten die Boxen etwas lauter | 505 | 2.460 | 67,6 | 75 |
Högtalare
Högtalarna erbjuder balanserade mellan- och högregister och basen är naturligtvis lägre, om än mindre än i vissa andra modeller. Högtalarna skulle dock kunna låta lite högre, allt som allt.
Det finns ett 3,5 mm headsetuttag för att möjliggöra anslutning av analoga slutenheter.
Asus ROG Flow X16 GV601V ljudanalys
(±) | högtalarljudstyrkan är genomsnittlig men bra (77.38 dB)
Bas 100 - 315 Hz
(±) | reducerad bas - i genomsnitt 9.6% lägre än medianen
(±) | linjäriteten för basen är genomsnittlig (9.2% delta till föregående frekvens)
Mellan 400 - 2000 Hz
(+) | balanserad mellan - endast 4.7% från medianen
(±) | linjäriteten för mids är genomsnittlig (7.5% delta till föregående frekvens)
Högsta 2 - 16 kHz
(+) | balanserade toppar - endast 2.2% från medianen
(+) | toppar är linjära (6.1% delta till föregående frekvens)
Totalt 100 - 16 000 Hz
(+) | det totala ljudet är linjärt (12% skillnad mot median)
Jämfört med samma klass
» 12% av alla testade enheter i den här klassen var bättre, 4% liknande, 84% sämre
» Den bästa hade ett delta på 6%, genomsnittet var 18%, sämst var 132%
Jämfört med alla testade enheter
» 9% av alla testade enheter var bättre, 2% liknande, 88% sämre
» Den bästa hade ett delta på 4%, genomsnittet var 23%, sämst var 134%
Lenovo Legion Pro 5 16IRX8 ljudanalys
(±) | högtalarljudstyrkan är genomsnittlig men bra (72.7 dB)
Bas 100 - 315 Hz
(-) | nästan ingen bas - i genomsnitt 23.7% lägre än medianen
(±) | linjäriteten för basen är genomsnittlig (10.7% delta till föregående frekvens)
Mellan 400 - 2000 Hz
(+) | balanserad mellan - endast 3.8% från medianen
(±) | linjäriteten för mids är genomsnittlig (7.1% delta till föregående frekvens)
Högsta 2 - 16 kHz
(+) | balanserade toppar - endast 3.7% från medianen
(+) | toppar är linjära (6.7% delta till föregående frekvens)
Totalt 100 - 16 000 Hz
(±) | linjäriteten för det totala ljudet är genomsnittlig (21.9% skillnad mot median)
Jämfört med samma klass
» 79% av alla testade enheter i den här klassen var bättre, 6% liknande, 16% sämre
» Den bästa hade ett delta på 6%, genomsnittet var 18%, sämst var 132%
Jämfört med alla testade enheter
» 63% av alla testade enheter var bättre, 7% liknande, 30% sämre
» Den bästa hade ett delta på 4%, genomsnittet var 23%, sämst var 134%
Energiförvaltning - Bra men inte fantastiskt
Energiförvaltning
Vid tomgångskörning är vår X16 inte lika ekonomisk som Galaxy Book3, vilket också beror på den ljusstarka pekskärmen. Trots detta är enheten vid inaktiv användning en värld för sig jämfört med Legion 5. Men när man tittar på 17-tums Katana är det tydligt att Flow X16 skulle kunna vara lite mer energieffektiv när den är på tomgång.
När du spelar är förbrukningen jämförbar medKatana 17med något bättre prestanda. Samtidigt ärLegion 5betydligt mer ström från väggen. Det senare gäller även för föregångarer, där den nya Asus har blivit märkbart mer effektiv.
| Av/Standby | |
| Låg belastning | |
| Hög belastning |
|
Förklaring:
min: | |
| Asus ROG Flow X16 GV601V i9-13900H, GeForce RTX 4060 Laptop GPU, WD PC SN560 SDDPNQE-1T00, IPS, 2560x1600, 16" | Asus ROG Flow X16 GV601RW-M5082W R9 6900HS, GeForce RTX 3070 Ti Laptop GPU, Micron 3400 1TB MTFDKBA1T0TFH, Mini LED, 2560x1600, 16.1" | Samsung Galaxy Book3 Ultra 16, i9-13900H RTX 4070 i9-13900H, GeForce RTX 4070 Laptop GPU, Samsung PM9A1 MZVL21T0HCLR, OLED / AMOLED, 2880x1800, 16" | Lenovo Legion Pro 5 16IRX8 i7-13700HX, GeForce RTX 4060 Laptop GPU, SK hynix PC801 HFS512GEJ9X115N, IPS, 2560x1600, 16" | Lenovo Yoga Pro 7 14IRH G8 i7-13700H, GeForce RTX 4050 Laptop GPU, Samsung PM9A1 MZVL21T0HCLR, IPS, 3072x1920, 14.5" | MSI Katana 17 B13VFK i7-13620H, GeForce RTX 4060 Laptop GPU, Micron 2400 MTFDKBA1T0QFM, IPS LED, 1920x1080, 17.3" | Genomsnitt NVIDIA GeForce RTX 4060 Laptop GPU | Genomsnitt av klass Gaming | |
|---|---|---|---|---|---|---|---|---|
| Power Consumption | -48% | 41% | -63% | 23% | 0% | -5% | -25% | |
| Idle Minimum * (Watt) | 9.6 | 12.2 -27% | 4.3 55% | 24.5 -155% | 7.6 21% | 12.2 -27% | 11.5 ? -20% | 13 ? -35% |
| Idle Average * (Watt) | 16 | 25.5 -59% | 4.6 71% | 29.2 -83% | 13.3 17% | 14.9 7% | 16 ? -0% | 19 ? -19% |
| Idle Maximum * (Watt) | 16.9 | 29.8 -76% | 11.4 33% | 34.3 -103% | 13.7 19% | 15.8 7% | 20.3 ? -20% | 24.6 ? -46% |
| Load Average * (Watt) | 104 | 183 -76% | 97 7% | 98.7 5% | 88.2 15% | 85.22 18% | 92.9 ? 11% | 110.7 ? -6% |
| Witcher 3 ultra * (Watt) | 142 | 183.6 -29% | 100.9 29% | 178.6 -26% | 94.2 34% | 151.1 -6% | ||
| Load Maximum * (Watt) | 214 | 253 -18% | 107 50% | 249.6 -17% | 143 33% | 212.8 1% | 210 ? 2% | 259 ? -21% |
* ... mindre är bättre
Power consumption Witcher 3 / Stress test
Power consumption with an external monitor
Batteriets livslängd
Vår testmodell har behållit samma batteristorlek (90 Wh) som sin föregångare. Därmed är batteriet i Slim X16 större än den typ som finns i normalstora spelmaskiner i mellanklassen, t.ex Legion 5.
Därför kan man förvänta sig lång batteritid. Detta gjorde vårt Wi-Fi-test ännu mer överraskande. Konkurrenter med mindre batterier som Galaxy Book3 (76 Wh) eller även Yoga Pro 7 (73 Wh) har lika bra uthållighet. Detta är ett område där X16 skulle kunna förbättra sin strömförbrukning i viloläge.
Batteritiden är ändå bra, men med tanke på det stora batteriet kunde man ha förväntat sig bättre drifttider - åtminstone när det gäller enkla uppgifter som att surfa på internet. När du surfar på webben i batteriläge bör du dessutom se till att tyst läge är valt och inte prestanda.
| Asus ROG Flow X16 GV601V i9-13900H, GeForce RTX 4060 Laptop GPU, 90 Wh | Asus ROG Flow X16 GV601RW-M5082W R9 6900HS, GeForce RTX 3070 Ti Laptop GPU, 90 Wh | Samsung Galaxy Book3 Ultra 16, i9-13900H RTX 4070 i9-13900H, GeForce RTX 4070 Laptop GPU, 76 Wh | Lenovo Legion Pro 5 16IRX8 i7-13700HX, GeForce RTX 4060 Laptop GPU, 80 Wh | Lenovo Yoga Pro 7 14IRH G8 i7-13700H, GeForce RTX 4050 Laptop GPU, 73 Wh | MSI Katana 17 B13VFK i7-13620H, GeForce RTX 4060 Laptop GPU, 53.5 Wh | Genomsnitt av klass Gaming | |
|---|---|---|---|---|---|---|---|
| Batteridrifttid | -34% | -13% | -55% | 6% | -48% | -6% | |
| H.264 (h) | 8.9 | 9 1% | 12.4 39% | 8.32 ? -7% | |||
| WiFi v1.3 (h) | 7.9 | 5.7 -28% | 8 1% | 3.4 -57% | 9.9 25% | 2.9 -63% | 7.11 ? -10% |
| Load (h) | 1.5 | 0.9 -40% | 0.9 -40% | 0.7 -53% | 0.8 -47% | 1 -33% | 1.502 ? 0% |
| Witcher 3 ultra (h) | 0.9 | ||||||
| Reader / Idle (h) | 6.7 | 8.27 ? |
För
Emot
Omdöme - En underbar, mycket mångsidig enhet
Framför allt är Asus ROG Flow X16 en sak - mångsidig! Det är en tunn, mobil arbetsenhet, det är en 2-i-1, surfplatta, en kraftfull arbetsstation och till och med en speldator. Men något är ännu mer överraskande: Den gör alla dessa saker riktigt bra utan att göra några stora misstag. Det är allt annat än en lat kompromiss.
För trots sina kompakta mått och 2-i-1-funktionalitet är hårdvaran inte strypt och har, åtminstone i turboläge, prestanda över genomsnittet. Även om det är här det blir lite högljutt, är det inte högre än den rent spelfokuserade konkurrensen. Men även efter att ha avslutat en period med tung belastning fortsätter fläktarna att gå under ganska lång tid.
Vi ändrar produktkategorin till "Gaming" eftersom poängen här är ungefär 2,4 procentenheter högre än kategorin "Convertible".
Asus ROG Flow X16 är en extremt mångsidig och kraftfull gaming workstation 2-i-1 med en bra pekskärm.
Än så länge är alternativ av detta slag få och långt mellan. För närvarande verkar Asus själva vara mycket angelägna om att experimentera. Potentiella köpare kan ta en titt på en enhet som vi nämnde i början av artikeln, Asus ROG Flow Z13-spelplattan. DenSamsung Galaxy Book3 Ultra 16(89%) är lika bra, men något trög trots den kraftfullare GPU:n. Den svagare specadeLenovo Yoga Pro 7 14 G8(90%) är också värd att överväga.
Pris och tillgänglighet
För närvarande är vår konfiguration av Flow X16 med en RTX 4060 inte tillgänglig på Amazon eller BestBuy. I den senare butiken kan dock RTX 4070-modellen köpas för 2699,99 USD.
Asus ROG Flow X16 GV601V
- 06/08/2023 v7 (old)
Christian Hintze
Genomskinlighet
Valet av enheter som ska granskas görs av vår redaktion. Testprovet gavs till författaren som ett lån av tillverkaren eller återförsäljaren för denna recension. Långivaren hade inget inflytande på denna recension och inte heller fick tillverkaren en kopia av denna recension innan publiceringen. Det fanns ingen skyldighet att publicera denna recension. Som ett oberoende medieföretag är Notebookcheck inte föremål för auktoritet från tillverkare, återförsäljare eller förlag.
This is how Notebookcheck is testingEvery year, Notebookcheck independently reviews hundreds of laptops and smartphones using standardized procedures to ensure that all results are comparable. We have continuously developed our test methods for around 20 years and set industry standards in the process. In our test labs, high-quality measuring equipment is utilized by experienced technicians and editors. These tests involve a multi-stage validation process. Our complex rating system is based on hundreds of well-founded measurements and benchmarks, which maintains objectivity.
Price comparison

