Test: Dell Alienware m15 R3 - Räddad av ångkammaren (Sammanfattning)
Gradering | Datum | Modell | Vikt | Höjd | Storlek | Upplösning | Pris |
|---|---|---|---|---|---|---|---|
| 84.8 % v7 (old) | 08/2020 | Alienware m15 R3 P87F i7-10750H, GeForce RTX 2070 Mobile | 2.3 kg | 19.9 mm | 15.60" | 1920x1080 | |
| 82.6 % v7 (old) | Eluktronics RP-15 R7 4800H, GeForce RTX 2060 Mobile | 1.9 kg | 20 mm | 15.60" | 1920x1080 | ||
| 86 % v7 (old) | 05/2020 | Razer Blade 15 RZ09-0328 i7-10750H, GeForce RTX 2070 Max-Q | 2.1 kg | 19.9 mm | 15.60" | 3840x2160 | |
| 81.3 % v7 (old) | 05/2019 | Asus Zephyrus S GX502GW i7-9750H, GeForce RTX 2070 Mobile | 2.1 kg | 19 mm | 15.60" | 1920x1080 | |
| 82.8 % v7 (old) | 05/2020 | MSI GS66 Stealth 10SFS i9-10980HK, GeForce RTX 2070 Super Max-Q | 2.2 kg | 20 mm | 15.60" | 1920x1080 |
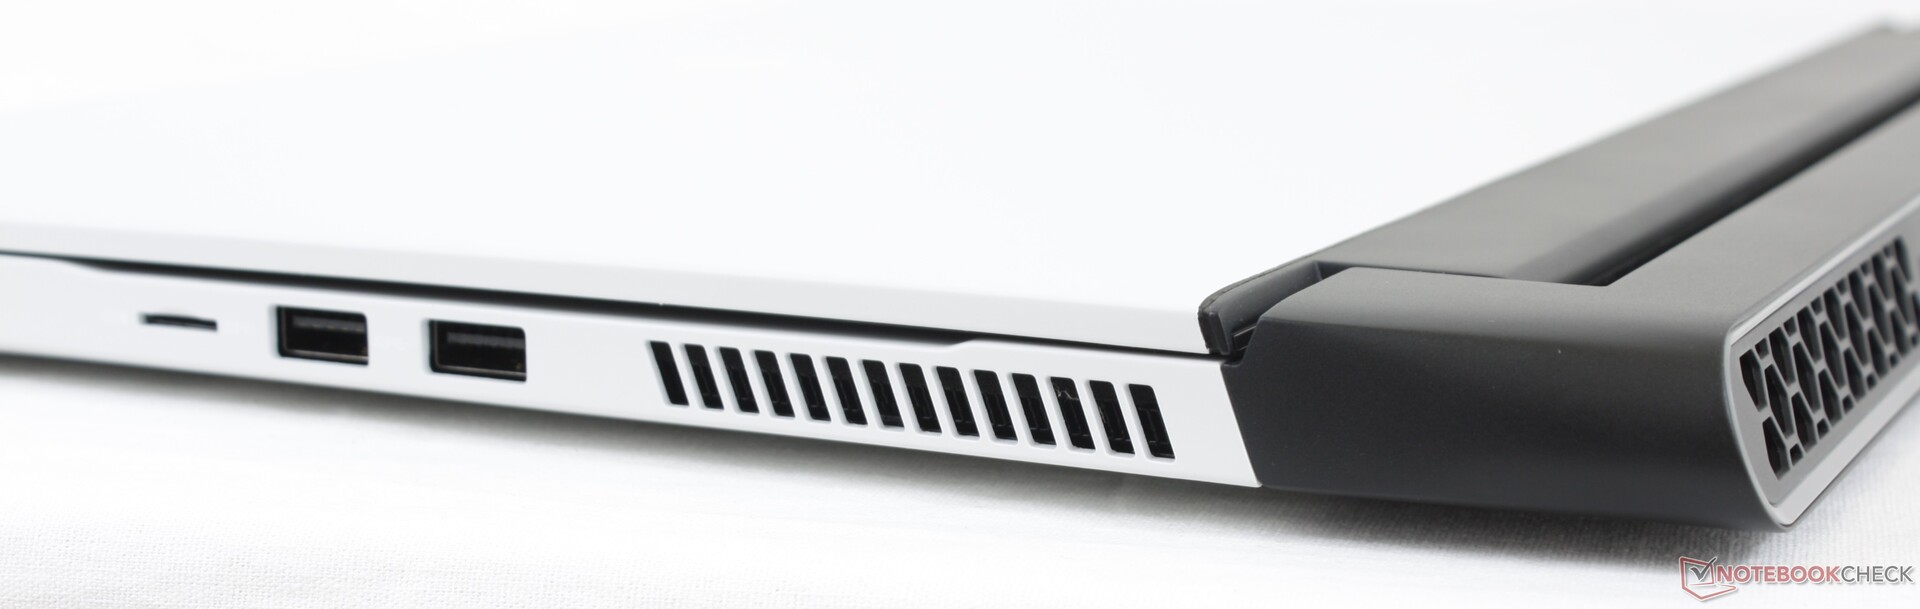

| SD Card Reader | |
| average JPG Copy Test (av. of 3 runs) | |
| MSI GS75 10SF-609US (Toshiba Exceria Pro M501 UHS-II) | |
| Dell XPS 15 9500 Core i7 4K UHD (Toshiba Exceria Pro SDXC 64 GB UHS-II) | |
| Gigabyte Aero 15 OLED XA (Toshiba Exceria Pro SDXC 64 GB UHS-II) | |
| Alienware m15 R3 P87F (Toshiba Exceria Pro M501 UHS-II) | |
| Eluktronics RP-15 (Toshiba Exceria Pro SDXC 64 GB UHS-II) | |
| maximum AS SSD Seq Read Test (1GB) | |
| Gigabyte Aero 15 OLED XA (Toshiba Exceria Pro SDXC 64 GB UHS-II) | |
| Alienware m15 R3 P87F (Toshiba Exceria Pro M501 UHS-II) | |
| MSI GS75 10SF-609US (Toshiba Exceria Pro M501 UHS-II) | |
| Dell XPS 15 9500 Core i7 4K UHD (Toshiba Exceria Pro SDXC 64 GB UHS-II) | |
| Eluktronics RP-15 (Toshiba Exceria Pro SDXC 64 GB UHS-II) | |
| Networking | |
| iperf3 transmit AX12 | |
| Eluktronics RP-15 | |
| MSI GS75 10SF-609US | |
| Alienware m15 R3 P87F | |
| Dell XPS 15 9500 Core i7 4K UHD | |
| Gigabyte Aero 15 OLED XA | |
| iperf3 receive AX12 | |
| Eluktronics RP-15 | |
| Dell XPS 15 9500 Core i7 4K UHD | |
| Alienware m15 R3 P87F | |
| MSI GS75 10SF-609US | |
| Gigabyte Aero 15 OLED XA | |

")
")
| |||||||||||||||||||||||||
Distribution av ljusstyrkan: 87 %
Mitt på batteriet: 326.7 cd/m²
Kontrast: 990:1 (Svärta: 0.33 cd/m²)
ΔE ColorChecker Calman: 2.4 | ∀{0.5-29.43 Ø4.72}
calibrated: 1.51
ΔE Greyscale Calman: 3.2 | ∀{0.09-98 Ø4.97}
99.2% sRGB (Argyll 1.6.3 3D)
63.7% AdobeRGB 1998 (Argyll 1.6.3 3D)
69.8% AdobeRGB 1998 (Argyll 3D)
98.9% sRGB (Argyll 3D)
68.6% Display P3 (Argyll 3D)
Gamma: 2.13
CCT: 7129 K
| Alienware m15 R3 P87F AU Optronics B156HAN, IPS, 15.6", 1920x1080 | Alienware m15 P79F Samsung SDCA029, 156WR04, OLED, 15.6", 3840x2160 | Eluktronics RP-15 BOE NV156FHM-N4G, IPS, 15.6", 1920x1080 | Razer Blade 15 RZ09-0328 Samsung SDCA029, AMOLED, 15.6", 3840x2160 | Asus Zephyrus S GX502GW AU Optronics B156HAN08.2 (AUO82ED), IPS, 15.6", 1920x1080 | MSI GS66 Stealth 10SFS AUO B156HAN12.0 (AUO328E), IPS, 15.6", 1920x1080 | |
|---|---|---|---|---|---|---|
| Display | 30% | -7% | 29% | -6% | 1% | |
| Display P3 Coverage (%) | 68.6 | 99.9 46% | 63.7 -7% | 99.9 46% | 64.9 -5% | 69.5 1% |
| sRGB Coverage (%) | 98.9 | 100 1% | 92 -7% | 100 1% | 91 -8% | 99.6 1% |
| AdobeRGB 1998 Coverage (%) | 69.8 | 100 43% | 65.2 -7% | 97.4 40% | 65.9 -6% | 70.8 1% |
| Response Times | 57% | -163% | 54% | -31% | -120% | |
| Response Time Grey 50% / Grey 80% * (ms) | 4 ? | 2.6 ? 35% | 17.2 ? -330% | 2.7 ? 32% | 7.2 ? -80% | 14 ? -250% |
| Response Time Black / White * (ms) | 10.8 ? | 2.3 ? 79% | 10.4 ? 4% | 2.6 ? 76% | 8.8 ? 19% | 9.6 ? 11% |
| PWM Frequency (Hz) | 60.2 ? | 59.5 ? | ||||
| Screen | -17% | -28% | -5% | -5% | 5% | |
| Brightness middle (cd/m²) | 326.7 | 452.1 38% | 298.6 -9% | 366.7 12% | 286 -12% | 316 -3% |
| Brightness (cd/m²) | 316 | 452 43% | 289 -9% | 371 17% | 275 -13% | 311 -2% |
| Brightness Distribution (%) | 87 | 90 3% | 90 3% | 91 5% | 90 3% | 92 6% |
| Black Level * (cd/m²) | 0.33 | 0.35 -6% | 0.37 -12% | 0.21 36% | ||
| Contrast (:1) | 990 | 853 -14% | 773 -22% | 1505 52% | ||
| Colorchecker dE 2000 * | 2.4 | 6.34 -164% | 5.01 -109% | 5.21 -117% | 2.19 9% | 3.03 -26% |
| Colorchecker dE 2000 max. * | 6.06 | 12.97 -114% | 7.06 -17% | 7.92 -31% | 4.4 27% | 7.32 -21% |
| Colorchecker dE 2000 calibrated * | 1.51 | 2.52 -67% | 2.27 -50% | 1.1 27% | ||
| Greyscale dE 2000 * | 3.2 | 2.8 13% | 5.4 -69% | 2 37% | 2.2 31% | 3.9 -22% |
| Gamma | 2.13 103% | 2.21 100% | 2.54 87% | 2.17 101% | 2.41 91% | 2.42 91% |
| CCT | 7129 91% | 6114 106% | 7461 87% | 6514 100% | 6405 101% | 7439 87% |
| Color Space (Percent of AdobeRGB 1998) (%) | 63.7 | 91 43% | 59.1 -7% | 86.6 36% | 59 -7% | 65 2% |
| Color Space (Percent of sRGB) (%) | 99.2 | 100 1% | 91.6 -8% | 100 1% | 91 -8% | 100 1% |
| Totalt genomsnitt (program/inställningar) | 23% /
5% | -66% /
-41% | 26% /
12% | -14% /
-8% | -38% /
-12% |
* ... mindre är bättre
Visa svarstider
| ↔ Svarstid svart till vitt | ||
|---|---|---|
| 10.8 ms ... stiga ↗ och falla ↘ kombinerat | ↗ 5.2 ms stiga | 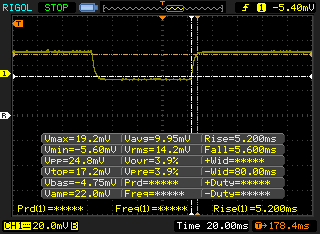 |
| ↘ 5.6 ms hösten | ||
| Skärmen visar bra svarsfrekvens i våra tester, men kan vara för långsam för konkurrenskraftiga spelare. I jämförelse sträcker sig alla testade enheter från 0.1 (minst) till 240 (maximalt) ms. » 29 % av alla enheter är bättre. Det betyder att den uppmätta svarstiden är bättre än genomsnittet av alla testade enheter (19.8 ms). | ||
| ↔ Svarstid 50 % grått till 80 % grått | ||
| 4 ms ... stiga ↗ och falla ↘ kombinerat | ↗ 1.6 ms stiga | 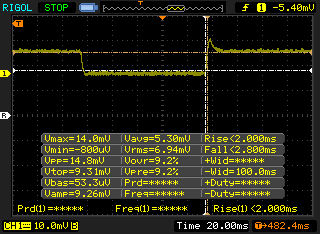 |
| ↘ 2.4 ms hösten | ||
| Skärmen visar väldigt snabba svarsfrekvenser i våra tester och borde vara mycket väl lämpad för fartfyllt spel. I jämförelse sträcker sig alla testade enheter från 0.165 (minst) till 636 (maximalt) ms. » 15 % av alla enheter är bättre. Det betyder att den uppmätta svarstiden är bättre än genomsnittet av alla testade enheter (31 ms). | ||
Skärmflimmer / PWM (Puls-Width Modulation)
| Skärmflimmer / PWM upptäcktes inte |  | ||
Som jämförelse: 52 % av alla testade enheter använder inte PWM för att dämpa skärmen. Om PWM upptäcktes mättes ett medelvärde av 7781 (minst: 5 - maximum: 343500) Hz. | |||
Cinebench R15: CPU Multi 64Bit | CPU Single 64Bit
Blender: v2.79 BMW27 CPU
7-Zip 18.03: 7z b 4 -mmt1 | 7z b 4
Geekbench 5.5: Single-Core | Multi-Core
HWBOT x265 Benchmark v2.2: 4k Preset
LibreOffice : 20 Documents To PDF
R Benchmark 2.5: Overall mean
| Cinebench R20 / CPU (Multi Core) | |
| Intel Core i9-10900K | |
| Dell G5 15 SE 5505 P89F | |
| Asus ROG Strix Scar 15 G532LWS | |
| Gigabyte Aero 15 OLED XB-8DE51B0SP | |
| MSI GE65 Raider 9SF-049US | |
| Alienware m15 R3 P87F | |
| Acer Nitro 5 AN515-44-R5FT | |
| Genomsnitt Intel Core i7-10750H (1749 - 3325, n=43) | |
| Maingear Vector 15 | |
| MSI GE63 Raider 8SG | |
| Asus Zephyrus GX501 | |
| Cinebench R20 / CPU (Single Core) | |
| Intel Core i9-10900K | |
| Gigabyte Aero 15 OLED XB-8DE51B0SP | |
| Asus ROG Strix Scar 15 G532LWS | |
| Dell G5 15 SE 5505 P89F | |
| Alienware m15 R3 P87F | |
| MSI GE65 Raider 9SF-049US | |
| Genomsnitt Intel Core i7-10750H (431 - 504, n=43) | |
| Maingear Vector 15 | |
| Acer Nitro 5 AN515-44-R5FT | |
| MSI GE63 Raider 8SG | |
| Asus Zephyrus GX501 | |
| Cinebench R15 / CPU Multi 64Bit | |
| Intel Core i9-10900K | |
| Dell G5 15 SE 5505 P89F | |
| Gigabyte Aero 15 OLED XB-8DE51B0SP | |
| Asus ROG Strix Scar 15 G532LWS | |
| MSI GE65 Raider 9SF-049US | |
| Acer Nitro 5 AN515-44-R5FT | |
| Alienware m15 R3 P87F | |
| Maingear Vector 15 | |
| Genomsnitt Intel Core i7-10750H (804 - 1418, n=50) | |
| MSI GE63 Raider 8SG | |
| Asus Zephyrus GX501 | |
| Cinebench R15 / CPU Single 64Bit | |
| Intel Core i9-10900K | |
| Gigabyte Aero 15 OLED XB-8DE51B0SP | |
| Asus ROG Strix Scar 15 G532LWS | |
| Alienware m15 R3 P87F | |
| MSI GE65 Raider 9SF-049US | |
| Genomsnitt Intel Core i7-10750H (184 - 213, n=45) | |
| Dell G5 15 SE 5505 P89F | |
| Maingear Vector 15 | |
| Acer Nitro 5 AN515-44-R5FT | |
| MSI GE63 Raider 8SG | |
| Asus Zephyrus GX501 | |
| Blender / v2.79 BMW27 CPU | |
| Genomsnitt Intel Core i7-10750H (322 - 587, n=43) | |
| Acer Nitro 5 AN515-44-R5FT | |
| Alienware m15 R3 P87F | |
| Gigabyte Aero 15 OLED XB-8DE51B0SP | |
| Asus ROG Strix Scar 15 G532LWS | |
| Dell G5 15 SE 5505 P89F | |
| Intel Core i9-10900K | |
| 7-Zip 18.03 / 7z b 4 -mmt1 | |
| Intel Core i9-10900K | |
| Asus ROG Strix Scar 15 G532LWS | |
| Gigabyte Aero 15 OLED XB-8DE51B0SP | |
| Genomsnitt Intel Core i7-10750H (4504 - 5470, n=43) | |
| Dell G5 15 SE 5505 P89F | |
| Alienware m15 R3 P87F | |
| Acer Nitro 5 AN515-44-R5FT | |
| 7-Zip 18.03 / 7z b 4 | |
| Intel Core i9-10900K | |
| Dell G5 15 SE 5505 P89F | |
| Asus ROG Strix Scar 15 G532LWS | |
| Gigabyte Aero 15 OLED XB-8DE51B0SP | |
| Acer Nitro 5 AN515-44-R5FT | |
| Alienware m15 R3 P87F | |
| Genomsnitt Intel Core i7-10750H (26040 - 37345, n=43) | |
| Geekbench 5.5 / Single-Core | |
| Intel Core i9-10900K | |
| Asus ROG Strix Scar 15 G532LWS | |
| Gigabyte Aero 15 OLED XB-8DE51B0SP | |
| Alienware m15 R3 P87F | |
| Genomsnitt Intel Core i7-10750H (1114 - 1333, n=43) | |
| Dell G5 15 SE 5505 P89F | |
| Acer Nitro 5 AN515-44-R5FT | |
| Geekbench 5.5 / Multi-Core | |
| Intel Core i9-10900K | |
| Asus ROG Strix Scar 15 G532LWS | |
| Gigabyte Aero 15 OLED XB-8DE51B0SP | |
| Dell G5 15 SE 5505 P89F | |
| Alienware m15 R3 P87F | |
| Genomsnitt Intel Core i7-10750H (4443 - 6674, n=43) | |
| Acer Nitro 5 AN515-44-R5FT | |
| HWBOT x265 Benchmark v2.2 / 4k Preset | |
| Intel Core i9-10900K | |
| Gigabyte Aero 15 OLED XB-8DE51B0SP | |
| Asus ROG Strix Scar 15 G532LWS | |
| Dell G5 15 SE 5505 P89F | |
| Alienware m15 R3 P87F | |
| Genomsnitt Intel Core i7-10750H (5.54 - 11.6, n=43) | |
| Acer Nitro 5 AN515-44-R5FT | |
| LibreOffice / 20 Documents To PDF | |
| Intel Core i9-10900K | |
| Dell G5 15 SE 5505 P89F | |
| Acer Nitro 5 AN515-44-R5FT | |
| Alienware m15 R3 P87F | |
| Genomsnitt Intel Core i7-10750H (43.1 - 99.2, n=43) | |
| Gigabyte Aero 15 OLED XB-8DE51B0SP | |
| Asus ROG Strix Scar 15 G532LWS | |
| R Benchmark 2.5 / Overall mean | |
| Alienware m15 R3 P87F | |
| Acer Nitro 5 AN515-44-R5FT | |
| Genomsnitt Intel Core i7-10750H (0.578 - 0.708, n=42) | |
| Dell G5 15 SE 5505 P89F | |
| Asus ROG Strix Scar 15 G532LWS | |
| Gigabyte Aero 15 OLED XB-8DE51B0SP | |
| Intel Core i9-10900K | |
* ... mindre är bättre
| PCMark 8 | |
| Home Score Accelerated v2 | |
| Alienware m15 R3 P87F | |
| Eluktronics RP-15 | |
| Genomsnitt Intel Core i7-10750H, NVIDIA GeForce RTX 2070 Mobile (3372 - 5702, n=4) | |
| Razer Blade 15 RZ09-0328 | |
| Alienware m15 P79F | |
| Work Score Accelerated v2 | |
| Alienware m15 R3 P87F | |
| Eluktronics RP-15 | |
| Genomsnitt Intel Core i7-10750H, NVIDIA GeForce RTX 2070 Mobile (5678 - 6224, n=4) | |
| Razer Blade 15 RZ09-0328 | |
| Alienware m15 P79F | |
| PCMark 8 Home Score Accelerated v2 | 5702 poäng | |
| PCMark 8 Work Score Accelerated v2 | 6224 poäng | |
| PCMark 10 Score | 6255 poäng | |
Hjälp | ||
| DPC Latencies / LatencyMon - interrupt to process latency (max), Web, Youtube, Prime95 | |
| Dell G5 15 SE 5505 P89F | |
| MSI GS66 Stealth 10SFS | |
| Gigabyte Aero 15 OLED XB-8DE51B0SP | |
| Asus ROG Strix Scar 15 G532LWS | |
| Alienware m15 R3 P87F | |
| MSI GS66 Stealth 10SE-045 | |
| Acer Nitro 5 AN515-44-R5FT | |
| Razer Blade 15 RZ09-0328 | |
| Eluktronics RP-15 | |
| MSI GS75 10SF-609US | |
* ... mindre är bättre
| Alienware m15 R3 P87F 2x Micron 2200S 512 GB (RAID 0) | Alienware m15 P79F Toshiba XG5 KXG50ZNV512G | Razer Blade 15 RZ09-0328 Lite-On CA5-8D512 | Asus Zephyrus S GX502GW 2x Intel SSD 660p SSDPEKNW512G8 (RAID 0) | MSI GS66 Stealth 10SFS Samsung SSD PM981 MZVLB1T0HALR | |
|---|---|---|---|---|---|
| AS SSD | -9% | 4% | 2% | 25% | |
| Seq Read (MB/s) | 2058 | 1937 -6% | 2021 -2% | 2506 22% | 1065 -48% |
| Seq Write (MB/s) | 2316 | 1066 -54% | 2090 -10% | 1712 -26% | 2360 2% |
| 4K Read (MB/s) | 39.72 | 31.76 -20% | 47.71 20% | 48.32 22% | 48.09 21% |
| 4K Write (MB/s) | 62.9 | 102.6 63% | 101.1 61% | 103.6 65% | 110.7 76% |
| 4K-64 Read (MB/s) | 1334 | 1140 -15% | 856 -36% | 624 -53% | 1635 23% |
| 4K-64 Write (MB/s) | 1271 | 938 -26% | 1041 -18% | 1253 -1% | 1829 44% |
| Access Time Read * (ms) | 0.062 | 0.058 6% | 0.052 16% | 0.08 -29% | 0.071 -15% |
| Access Time Write * (ms) | 0.388 | 0.04 90% | 0.111 71% | 0.04 90% | 0.034 91% |
| Score Read (Points) | 1580 | 1366 -14% | 1105 -30% | 923 -42% | 1790 13% |
| Score Write (Points) | 1565 | 1147 -27% | 1351 -14% | 1528 -2% | 2176 39% |
| Score Total (Points) | 3968 | 3168 -20% | 3037 -23% | 2896 -27% | 4950 25% |
| Copy ISO MB/s (MB/s) | 1685 | 946 -44% | 2474 47% | ||
| Copy Program MB/s (MB/s) | 669 | 452.8 -32% | 679 1% | ||
| Copy Game MB/s (MB/s) | 1493 | 1013 -32% | 1037 -31% | ||
| CrystalDiskMark 5.2 / 6 | 5% | 13% | -6% | 9% | |
| Write 4K (MB/s) | 67.3 | 148.4 121% | 118.7 76% | 97 44% | 131.3 95% |
| Read 4K (MB/s) | 41.47 | 49.65 20% | 52.4 26% | 49.58 20% | 45.84 11% |
| Write Seq (MB/s) | 2239 | 1139 -49% | 2247 0% | 1838 -18% | 2370 6% |
| Read Seq (MB/s) | 2112 | 2353 11% | 2234 6% | 2421 15% | 1509 -29% |
| Write 4K Q32T1 (MB/s) | 488.9 | 484.7 -1% | 515 5% | 326.9 -33% | 481.5 -2% |
| Read 4K Q32T1 (MB/s) | 557 | 542 -3% | 584 5% | 372.9 -33% | 560 1% |
| Write Seq Q32T1 (MB/s) | 2654 | 1139 -57% | 2235 -16% | 1894 -29% | 2392 -10% |
| Read Seq Q32T1 (MB/s) | 3137 | 3108 -1% | 3171 1% | 2828 -10% | 3232 3% |
| Totalt genomsnitt (program/inställningar) | -2% /
-4% | 9% /
7% | -2% /
-1% | 17% /
18% |
* ... mindre är bättre

Kontinuerlig inläsning: DiskSpd Read Loop, Queue Depth 8
| 3DMark 11 | |
| 1280x720 Performance GPU | |
| Intel Core i9-10900K | |
| MSI GE63 Raider 8SG | |
| Asus Strix Scar 17 G732LXS | |
| Asus ROG Strix Scar 15 G532LWS | |
| Gigabyte Aero 15 OLED XB-8DE51B0SP | |
| Asus ROG Zephyrus Duo 15 GX550LXS | |
| Alienware m15 R3 P87F | |
| MSI GE65 Raider 9SF-049US | |
| Genomsnitt NVIDIA GeForce RTX 2070 Mobile (23335 - 27298, n=21) | |
| Dell G5 15 SE 5505 P89F | |
| Asus Zephyrus GX501 | |
| Razer Blade 15 RZ09-0328 | |
| Eluktronics RP-15 | |
| Maingear Vector 15 | |
| Acer Nitro 5 AN515-44-R5FT | |
| 1280x720 Performance Combined | |
| Intel Core i9-10900K | |
| Asus Strix Scar 17 G732LXS | |
| MSI GE65 Raider 9SF-049US | |
| Gigabyte Aero 15 OLED XB-8DE51B0SP | |
| Asus ROG Zephyrus Duo 15 GX550LXS | |
| Asus ROG Strix Scar 15 G532LWS | |
| Eluktronics RP-15 | |
| Alienware m15 R3 P87F | |
| Dell G5 15 SE 5505 P89F | |
| Genomsnitt NVIDIA GeForce RTX 2070 Mobile (8716 - 16364, n=21) | |
| Maingear Vector 15 | |
| Razer Blade 15 RZ09-0328 | |
| Acer Nitro 5 AN515-44-R5FT | |
| MSI GE63 Raider 8SG | |
| Asus Zephyrus GX501 | |
| 3DMark 11 Performance | 21233 poäng | |
| 3DMark Cloud Gate Standard Score | 41006 poäng | |
| 3DMark Fire Strike Score | 18127 poäng | |
| 3DMark Time Spy Score | 7818 poäng | |
Hjälp | ||
| Shadow of the Tomb Raider - 1920x1080 Highest Preset AA:T | |
| Intel Core i9-10900K | |
| Asus ROG Strix Scar 15 G532LWS | |
| MSI GE65 Raider 9SF-049US | |
| Alienware m15 R3 P87F | |
| MSI GS66 Stealth 10SFS | |
| MSI GS75 10SF-609US | |
| Genomsnitt NVIDIA GeForce RTX 2070 Mobile (74.2 - 97, n=11) | |
| Razer Blade 15 RZ09-0328 | |
| Alienware m15 P79F | |
| Gigabyte Aero 15 OLED XA | |
| MSI GS66 Stealth 10SE-045 | |
| Eluktronics RP-15 | |
| Asus Zephyrus S GX502GW | |
| Dell G5 15 SE 5505 P89F | |
| Acer Nitro 5 AN515-44-R5FT | |
| The Witcher 3 - 1920x1080 Ultra Graphics & Postprocessing (HBAO+) | |
| Intel Core i9-10900K | |
| Asus ROG Strix Scar 15 G532LWS | |
| Alienware m15 R3 P87F | |
| MSI GE65 Raider 9SF-049US | |
| Genomsnitt NVIDIA GeForce RTX 2070 Mobile (64 - 82.1, n=21) | |
| MSI GS66 Stealth 10SFS | |
| Asus Zephyrus S GX502GW | |
| MSI GS75 10SF-609US | |
| Dell G5 15 SE 5505 P89F | |
| Alienware m15 P79F | |
| Gigabyte Aero 15 OLED XA | |
| MSI GS66 Stealth 10SE-045 | |
| Eluktronics RP-15 | |
| Asus Zephyrus GX501 | |
| Razer Blade 15 RZ09-0328 | |
| Maingear Vector 15 | |
| Asus ROG Strix G15 G512LI | |
| Acer Nitro 5 AN515-44-R5FT | |
| låg | med. | hög | ultra | |
|---|---|---|---|---|
| The Witcher 3 (2015) | 356.7 | 249.9 | 149.8 | 81 |
| Dota 2 Reborn (2015) | 142 | 133 | 125 | 120 |
| X-Plane 11.11 (2018) | 96.1 | 87.3 | 71.9 | |
| Shadow of the Tomb Raider (2018) | 138 | 111 | 103 | 93 |
| Alienware m15 R3 P87F GeForce RTX 2070 Mobile, i7-10750H, 2x Micron 2200S 512 GB (RAID 0) | Alienware m15 R2 P87F GeForce RTX 2080 Max-Q, i7-9750H, 2x Toshiba XG6 KXG60ZNV512G (RAID 0) | Razer Blade 15 RZ09-0328 GeForce RTX 2070 Max-Q, i7-10750H, Lite-On CA5-8D512 | Asus Zephyrus S GX502GW GeForce RTX 2070 Mobile, i7-9750H, 2x Intel SSD 660p SSDPEKNW512G8 (RAID 0) | MSI GS66 Stealth 10SFS GeForce RTX 2070 Super Max-Q, i9-10980HK, Samsung SSD PM981 MZVLB1T0HALR | Asus ROG Strix Scar 15 G532LWS GeForce RTX 2070 Super Mobile, i9-10980HK, 2x Intel SSD 660p 1TB SSDPEKNW010T8 (RAID 0) | |
|---|---|---|---|---|---|---|
| Noise | -13% | -3% | -14% | -15% | -10% | |
| av / miljö * (dB) | 26.3 | 28.3 -8% | 28.4 -8% | 30 -14% | 30 -14% | 26.5 -1% |
| Idle Minimum * (dB) | 26.7 | 28.5 -7% | 28.4 -6% | 31 -16% | 32 -20% | 27.1 -1% |
| Idle Average * (dB) | 26.7 | 28.5 -7% | 28.4 -6% | 33 -24% | 34 -27% | 32.2 -21% |
| Idle Maximum * (dB) | 30.7 | 49 -60% | 31.7 -3% | 38 -24% | 39 -27% | 34 -11% |
| Load Average * (dB) | 40.2 | 49 -22% | 47.7 -19% | 50 -24% | 53 -32% | 52.4 -30% |
| Witcher 3 ultra * (dB) | 51 | 49 4% | 47.5 7% | 53 -4% | 48 6% | 57.5 -13% |
| Load Maximum * (dB) | 59.7 | 55 8% | 49.5 17% | 56 6% | 53 11% | 57.5 4% |
* ... mindre är bättre
Ljudnivå
| Låg belastning |
| 26.7 / 26.7 / 30.7 dB(A) |
| Hög belastning |
| 40.2 / 59.7 dB(A) |
 | ||
30 dB tyst 40 dB(A) hörbar 50 dB(A) högt ljud |
||
min: | ||
(-) Den maximala temperaturen på ovansidan är 55.8 °C / 132 F, jämfört med genomsnittet av 40.4 °C / 105 F , allt från 21.2 till 68.8 °C för klassen Gaming.
(-) Botten värms upp till maximalt 62 °C / 144 F, jämfört med genomsnittet av 43.2 °C / 110 F
(±) Vid tomgångsbruk är medeltemperaturen för ovansidan 35.4 °C / 96 F, jämfört med enhetsgenomsnittet på 33.9 °C / ### class_avg_f### F.
(±) När du spelar The Witcher 3 är medeltemperaturen för ovansidan 35.8 °C / 96 F, jämfört med enhetsgenomsnittet på 33.9 °C / ## #class_avg_f### F.
(+) Handledsstöden och pekplattan är kallare än hudtemperaturen med maximalt 29.4 °C / 84.9 F och är därför svala att ta på.
(±) Medeltemperaturen för handledsstödsområdet på liknande enheter var 28.8 °C / 83.8 F (-0.6 °C / -1.1 F).
Alienware m15 R3 P87F ljudanalys
(+) | högtalare kan spela relativt högt (89.5 dB)
Bas 100 - 315 Hz
(-) | nästan ingen bas - i genomsnitt 20.6% lägre än medianen
(±) | linjäriteten för basen är genomsnittlig (8.1% delta till föregående frekvens)
Mellan 400 - 2000 Hz
(±) | reducerade mids - i genomsnitt 6.6% lägre än median
(+) | mids är linjära (6.7% delta till föregående frekvens)
Högsta 2 - 16 kHz
(±) | högre toppar - i genomsnitt 5% högre än medianen
(±) | linjäriteten för toppar är genomsnittlig (7.5% delta till föregående frekvens)
Totalt 100 - 16 000 Hz
(±) | linjäriteten för det totala ljudet är genomsnittlig (16.5% skillnad mot median)
Jämfört med samma klass
» 42% av alla testade enheter i den här klassen var bättre, 7% liknande, 51% sämre
» Den bästa hade ett delta på 6%, genomsnittet var 18%, sämst var 132%
Jämfört med alla testade enheter
» 28% av alla testade enheter var bättre, 6% liknande, 66% sämre
» Den bästa hade ett delta på 4%, genomsnittet var 24%, sämst var 134%
Apple MacBook 12 (Early 2016) 1.1 GHz ljudanalys
(+) | högtalare kan spela relativt högt (83.6 dB)
Bas 100 - 315 Hz
(±) | reducerad bas - i genomsnitt 11.3% lägre än medianen
(±) | linjäriteten för basen är genomsnittlig (14.2% delta till föregående frekvens)
Mellan 400 - 2000 Hz
(+) | balanserad mellan - endast 2.4% från medianen
(+) | mids är linjära (5.5% delta till föregående frekvens)
Högsta 2 - 16 kHz
(+) | balanserade toppar - endast 2% från medianen
(+) | toppar är linjära (4.5% delta till föregående frekvens)
Totalt 100 - 16 000 Hz
(+) | det totala ljudet är linjärt (10.2% skillnad mot median)
Jämfört med samma klass
» 7% av alla testade enheter i den här klassen var bättre, 2% liknande, 91% sämre
» Den bästa hade ett delta på 5%, genomsnittet var 18%, sämst var 53%
Jämfört med alla testade enheter
» 5% av alla testade enheter var bättre, 1% liknande, 94% sämre
» Den bästa hade ett delta på 4%, genomsnittet var 24%, sämst var 134%
| Av/Standby | |
| Låg belastning | |
| Hög belastning |
|
Förklaring:
min: | |
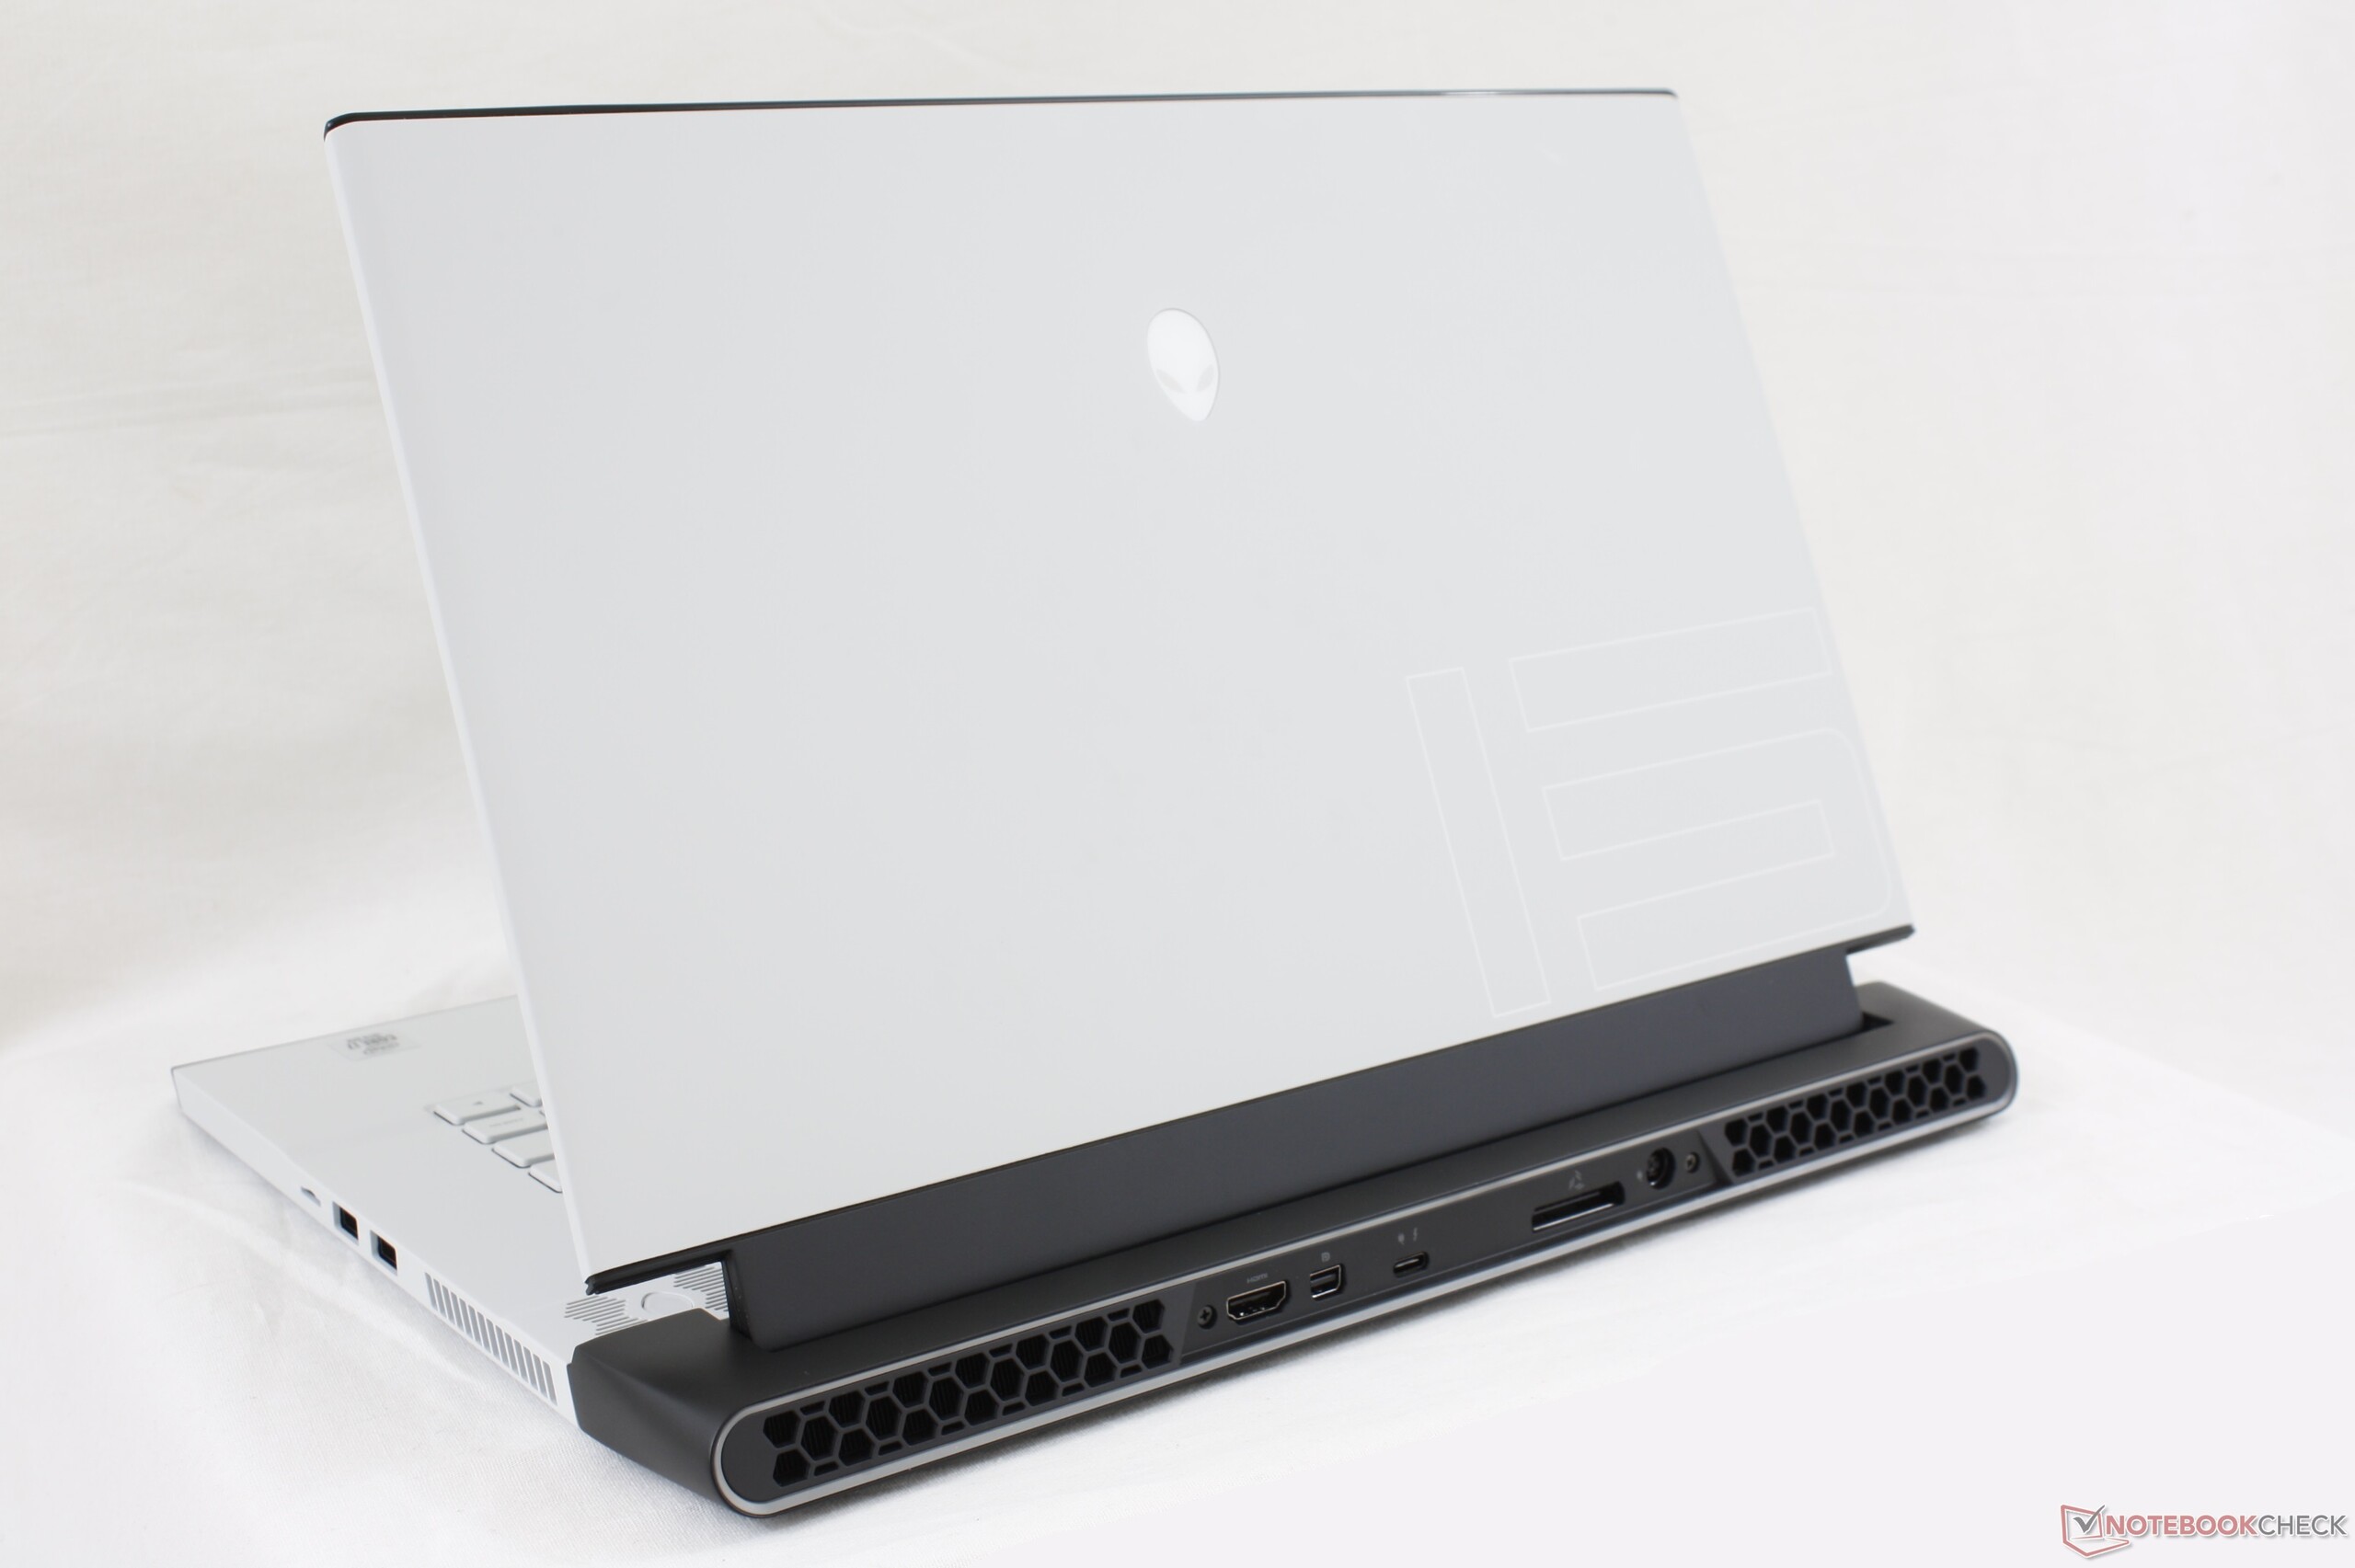
| Alienware m15 R3 P87F i7-10750H, GeForce RTX 2070 Mobile, IPS, 1920x1080, 15.6" | Alienware m15 P79F i7-8750H, GeForce RTX 2070 Max-Q, OLED, 3840x2160, 15.6" | Eluktronics RP-15 R7 4800H, GeForce RTX 2060 Mobile, IPS, 1920x1080, 15.6" | Razer Blade 15 RZ09-0328 i7-10750H, GeForce RTX 2070 Max-Q, AMOLED, 3840x2160, 15.6" | Asus Zephyrus S GX502GW i7-9750H, GeForce RTX 2070 Mobile, IPS, 1920x1080, 15.6" | MSI GS66 Stealth 10SFS i9-10980HK, GeForce RTX 2070 Super Max-Q, IPS, 1920x1080, 15.6" | MSI GP65 10SFK-047US i7-10750H, GeForce RTX 2070 Mobile, IPS, 1920x1080, 15.6" | |
|---|---|---|---|---|---|---|---|
| Power Consumption | 45% | 31% | 41% | 25% | 39% | 38% | |
| Idle Minimum * (Watt) | 34 | 10.9 68% | 21.7 36% | 11.1 67% | 24 29% | 13 62% | 14.2 58% |
| Idle Average * (Watt) | 48.6 | 12.3 75% | 30.1 38% | 13.7 72% | 27 44% | 16 67% | 18.8 61% |
| Idle Maximum * (Watt) | 58.2 | 19 67% | 35 40% | 33.4 43% | 33 43% | 27 54% | 23.9 59% |
| Load Average * (Watt) | 129.4 | 96 26% | 112.6 13% | 104.4 19% | 129 -0% | 109 16% | 96.9 25% |
| Witcher 3 ultra * (Watt) | 214.5 | 161.7 25% | 134.4 37% | 159.9 25% | 176 18% | 155 28% | 185 14% |
| Load Maximum * (Watt) | 257.3 | 229.1 11% | 201.5 22% | 203.8 21% | 216 16% | 236 8% | 233.4 9% |
* ... mindre är bättre
| Alienware m15 R3 P87F i7-10750H, GeForce RTX 2070 Mobile, 86 Wh | Alienware m15 P79F i7-8750H, GeForce RTX 2070 Max-Q, 90 Wh | Eluktronics RP-15 R7 4800H, GeForce RTX 2060 Mobile, 46.7 Wh | Razer Blade 15 RZ09-0328 i7-10750H, GeForce RTX 2070 Max-Q, 65 Wh | Asus Zephyrus S GX502GW i7-9750H, GeForce RTX 2070 Mobile, 76 Wh | MSI GS66 Stealth 10SFS i9-10980HK, GeForce RTX 2070 Super Max-Q, 99.99 Wh | |
|---|---|---|---|---|---|---|
| Batteridrifttid | 86% | 29% | 43% | 31% | 110% | |
| Reader / Idle (h) | 5 | 5.9 18% | 8.4 68% | |||
| WiFi v1.3 (h) | 2.8 | 5.2 86% | 3.6 29% | 4 43% | 3.7 32% | 6.1 118% |
| Load (h) | 0.7 | 1 43% | 1.7 143% |
För
Emot
Läs den fullständiga versionen av den här recensionen på engelska här.
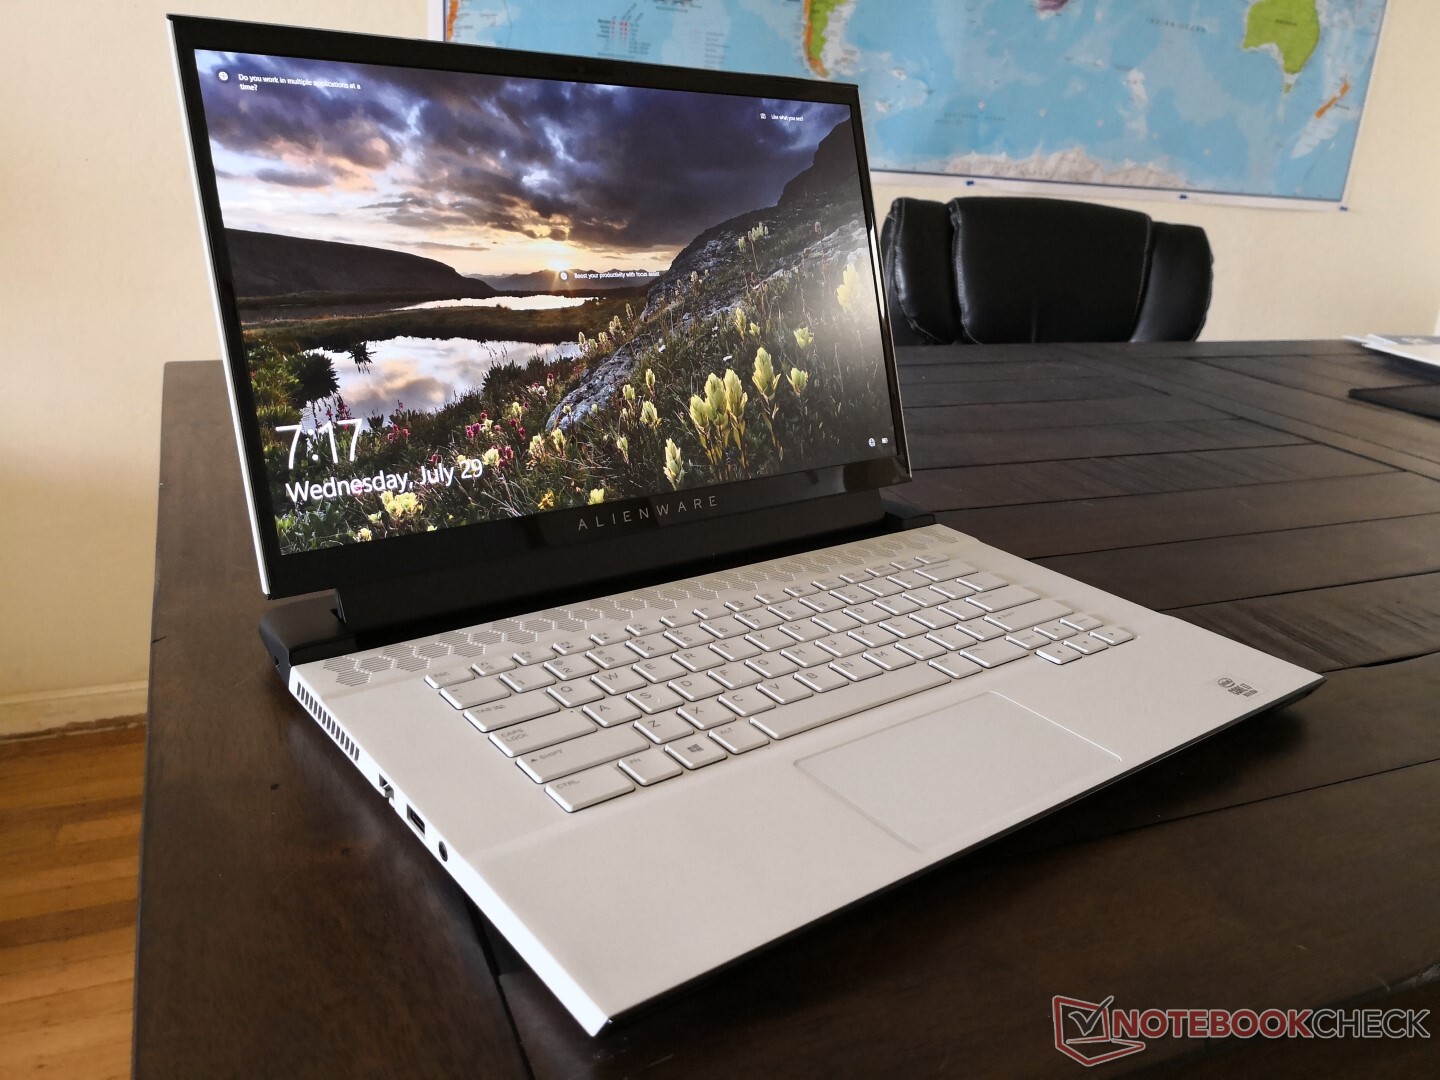
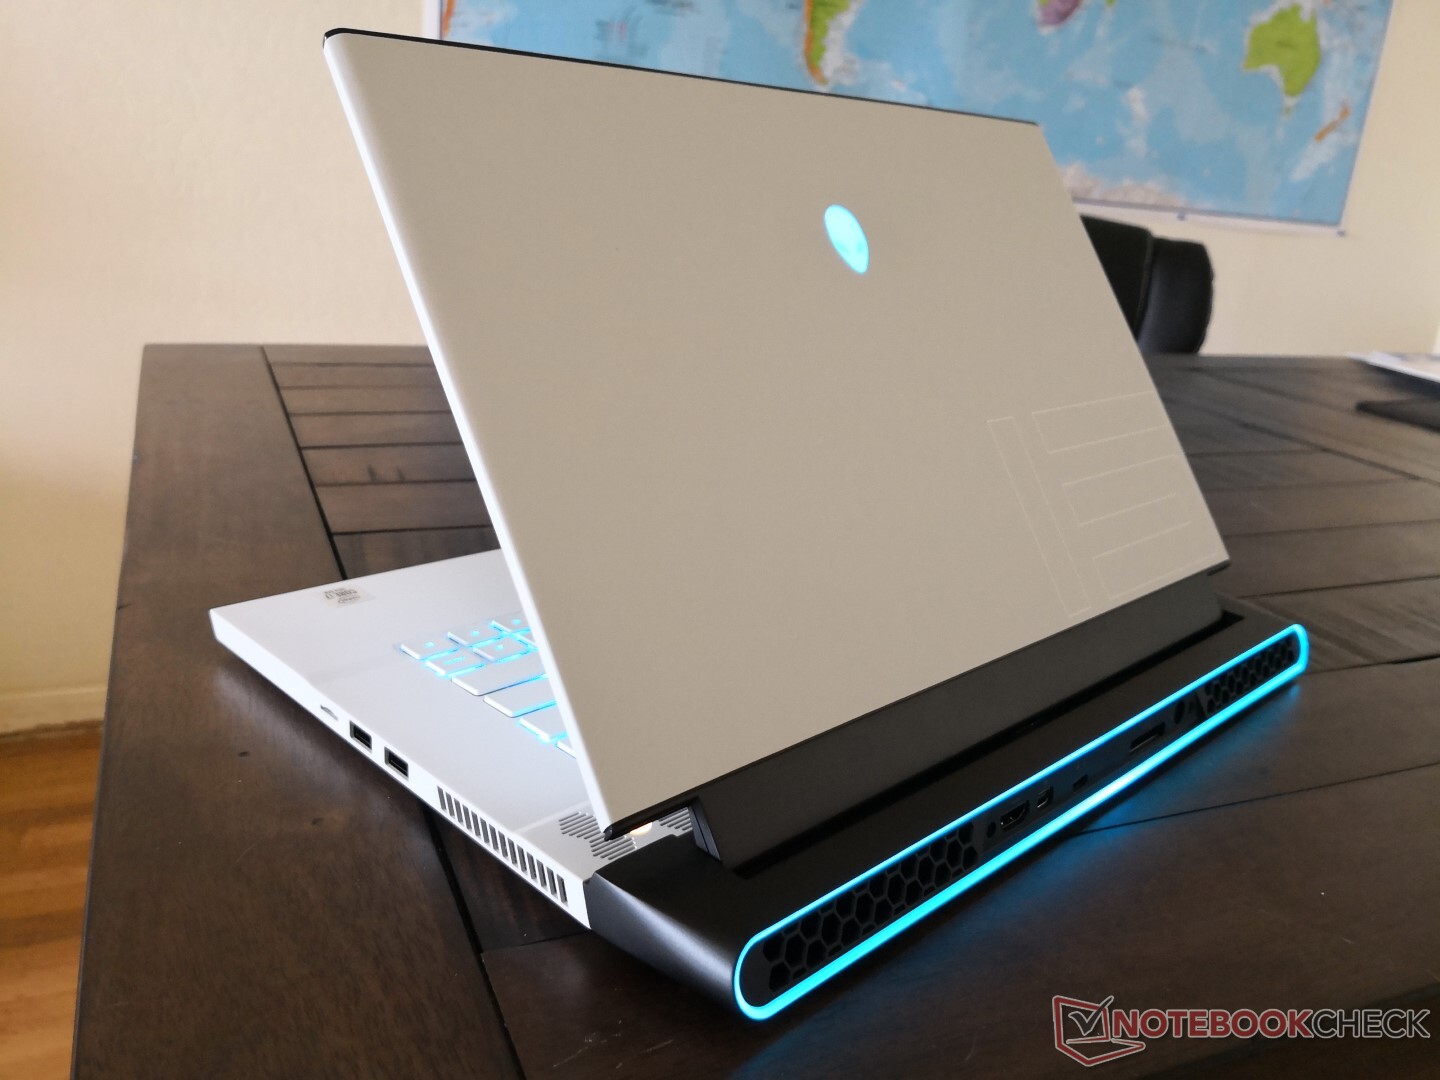
På utsidan verkar Alienware m15 R3 inte vara något annat än en mindre uppdatering från förra årets m15 R2. Istället sitter alla större förändringar på insidan, vilket är lite synd för det finns en risk att många inte märker dem. Dell har åtgärdat ett av de största problemen med m15 R2 genom att ge m15 R3 ett mycket starkare kylsystem, vilket sänker kärntemperaturerna till runt 20 C när man spelar. Kombinera detta med nya CPU- och GPU-alternativ och du har ett system som kan bli både snabbare och svalare än sin föregångare trots att den ser likadan ut på utsidan. Alienware m15 R3 är vad m15 R2 borde varit.
Nu när ett av de största problemen med förra årets modell har tagits hand om är det istället dags att förbättra systemets övriga delar. I synnerhet har fläktljudet inte förändrats, så du kommer fortfarande vilja ha ett par bra hörlurar på dig när du spelar. Det tunna och lätta chassit är inte så lätt och tunt som på andra modeller från samma kategori och ångkammaren har gjort systemet en aning tyngre än tidigare. Väldigt hög energiförbrukning och kort batteritid gör den till en dålig lösning för den som reser ofta, särskilt i jämförelse med MSI GS66 eller Razer Blade 15, som har nästan samma CPU- och GPU-alternativ som vår Dell-maskin.
Totalt sett är Alienware m15 R3 en tydlig förbättring jämfört med m15 R2, särskilt när det kommer till kärntemperaturerna. De nya processoralternativen är också välkomna, men i övrigt är i princip allt annat likadant som på förra årets m15 R2, vilket inkluderar många av den sistnämndas brister.
Alienware m15 R3 P87F
- 07/31/2020 v7 (old)
Allen Ngo
Price comparison
