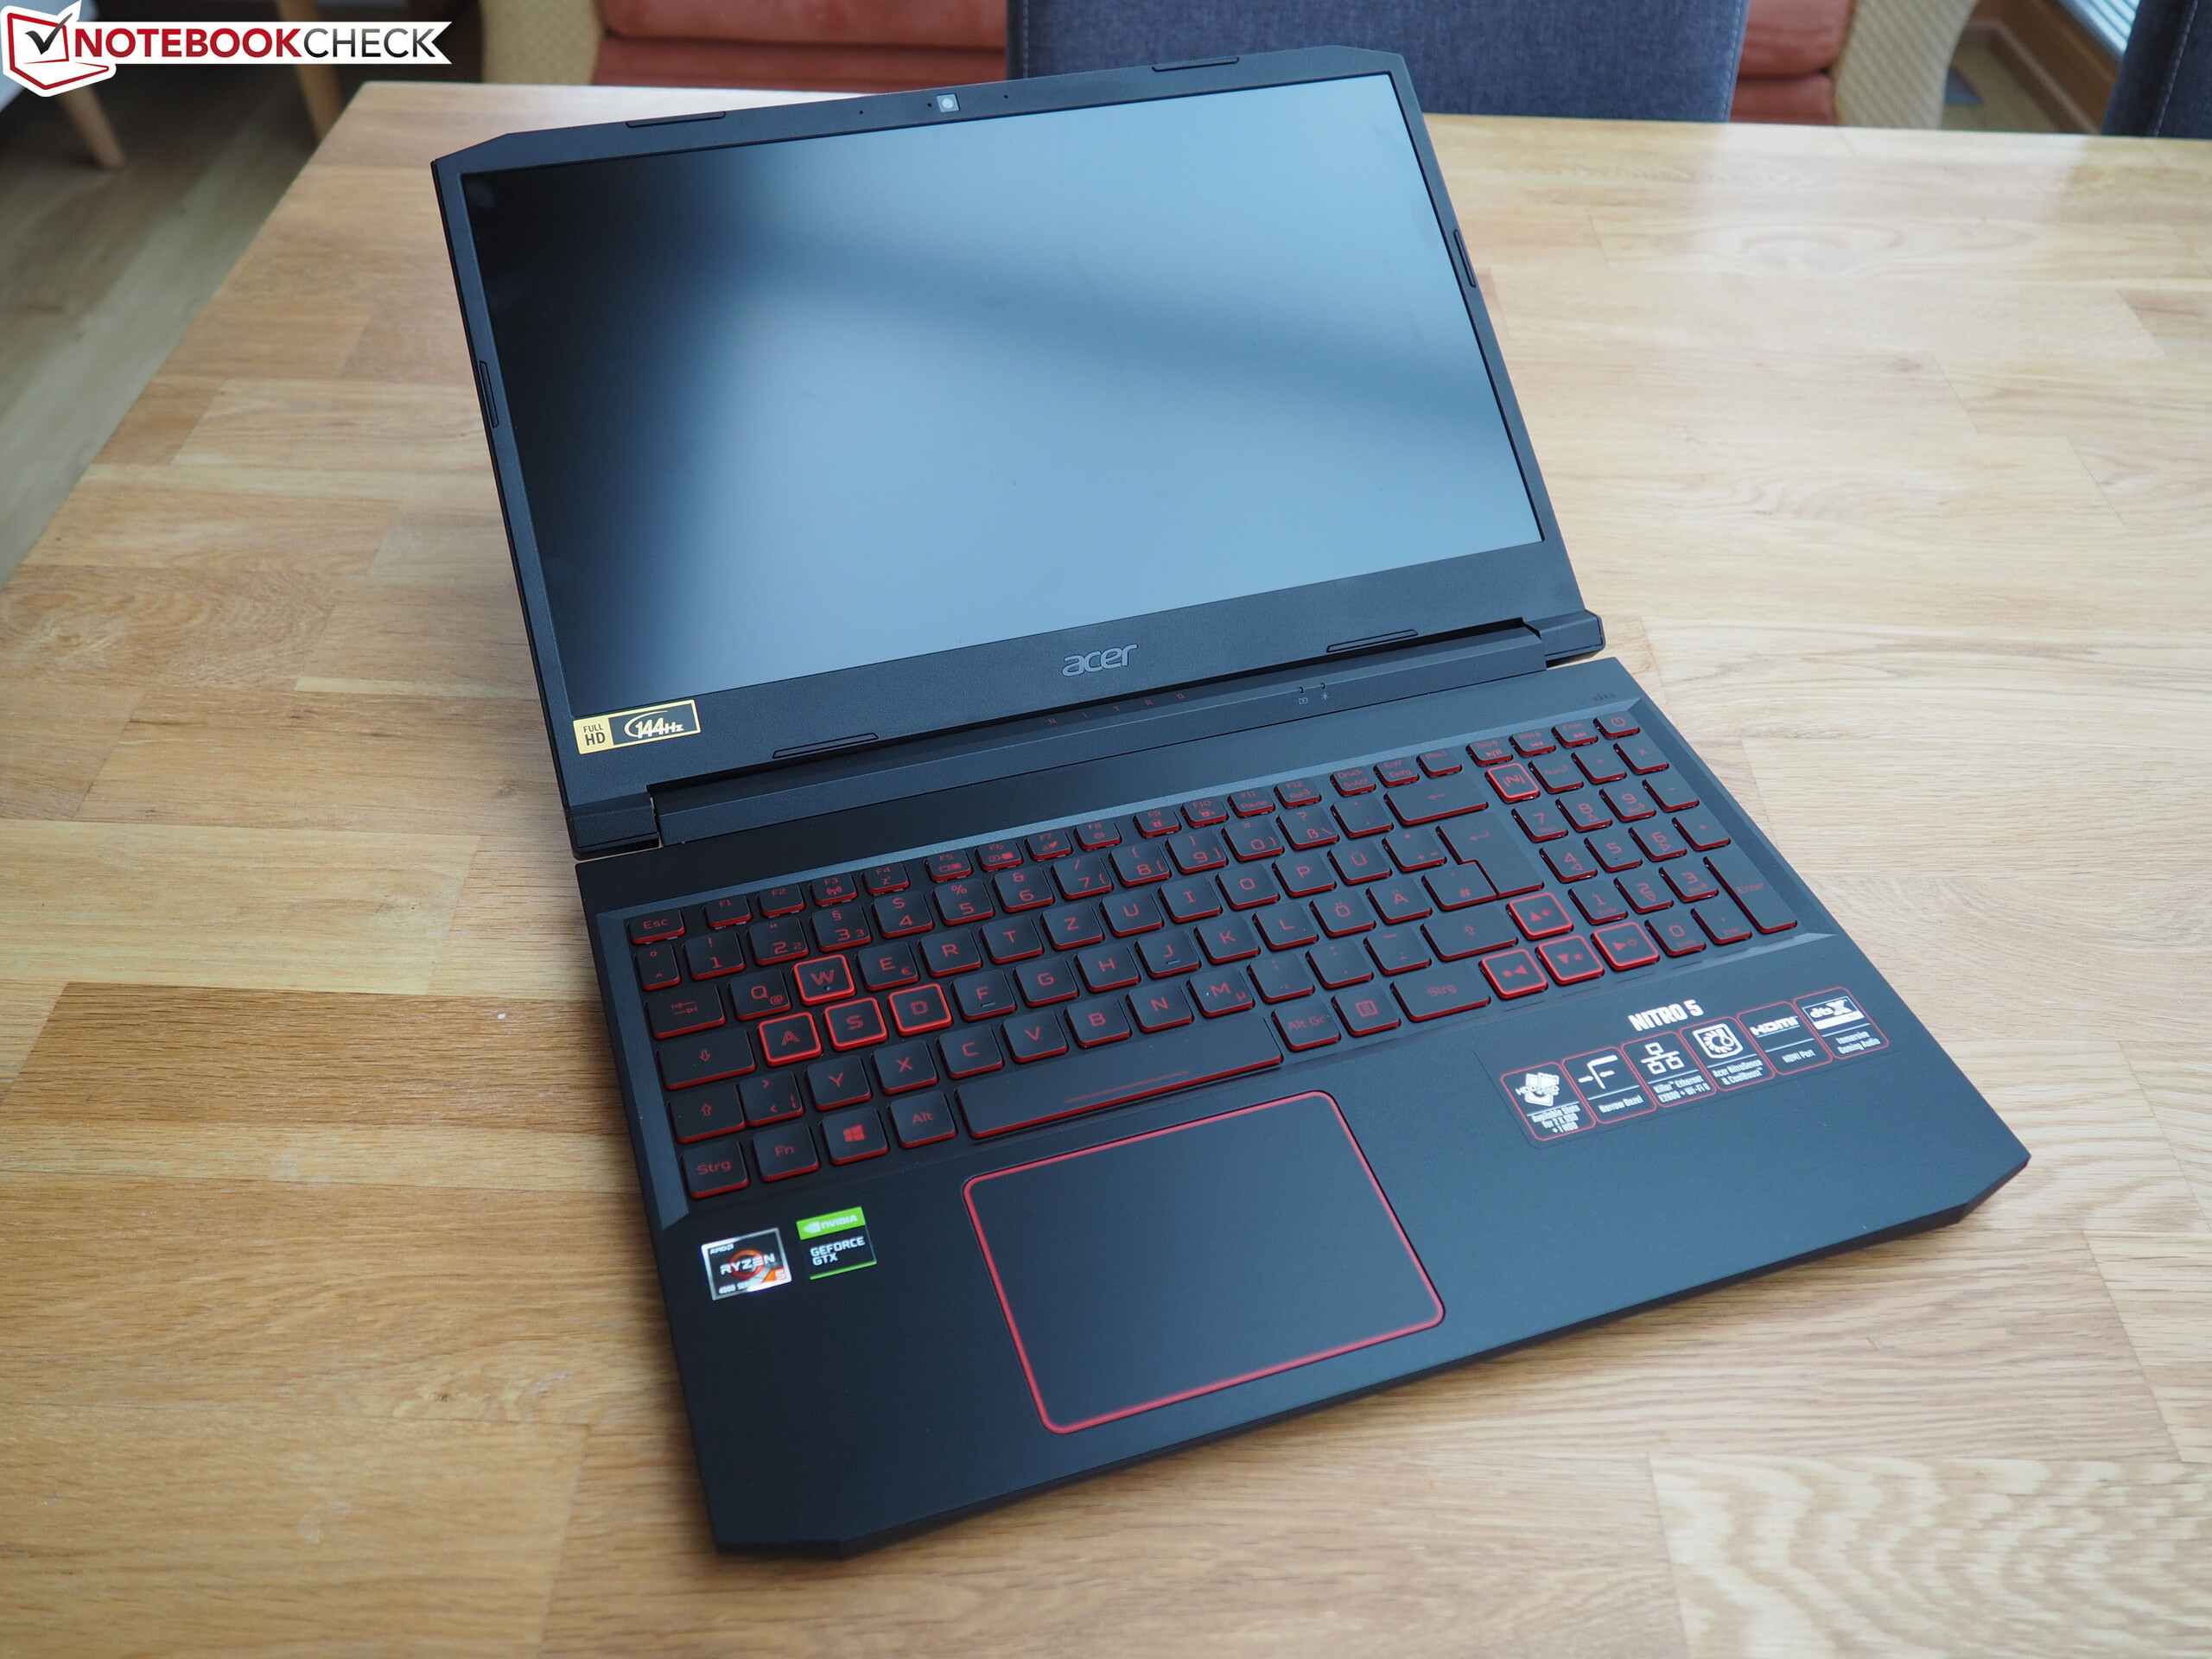
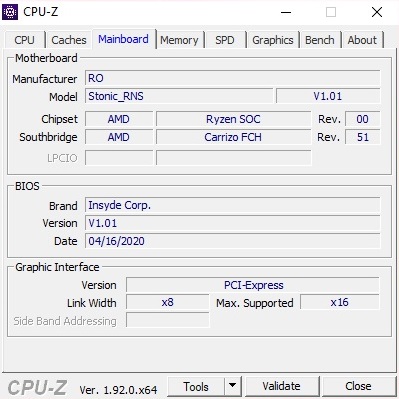
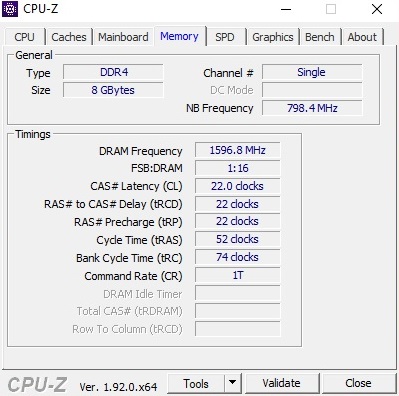
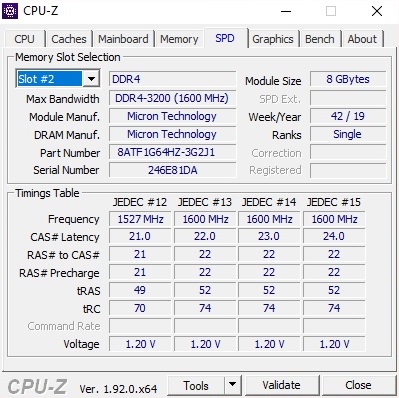
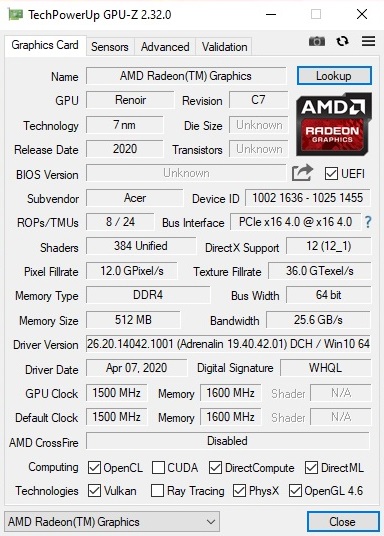
Test: Acer Nitro 5 AN515-44 - AMD dejtar Nvidia (Sammanfattning)
Gradering | Datum | Modell | Vikt | Höjd | Storlek | Upplösning | Pris |
|---|---|---|---|---|---|---|---|
| 79.8 % v7 (old) | 07/2020 | Acer Nitro 5 AN515-44-R5FT R5 4600H, GeForce GTX 1650 Ti Mobile | 2.2 kg | 24 mm | 15.60" | 1920x1080 | |
| 79.6 % v7 (old) | 11/2019 | Dell G5 15 5590-PCNJJ i5-9300H, GeForce GTX 1650 Mobile | 2.7 kg | 23.7 mm | 15.60" | 1920x1080 | |
| 81.5 % v7 (old) | HP Omen 15-dc1020ng i5-9300H, GeForce GTX 1650 Mobile | 2.3 kg | 25 mm | 15.60" | 1920x1080 | ||
| 82.3 % v7 (old) | 08/2019 | Lenovo Legion Y540-15IRH-81SX00B2GE i7-9750H, GeForce GTX 1660 Ti Mobile | 2.2 kg | 26 mm | 15.60" | 1920x1080 | |
| 82.1 % v7 (old) | 11/2019 | Acer Predator Helios 300 PH315-52-79TY i7-9750H, GeForce GTX 1660 Ti Mobile | 2.3 kg | 23.2 mm | 15.60" | 1920x1080 |
| Networking | |
| iperf3 transmit AX12 | |
| Acer Nitro 5 AN515-44-R5FT | |
| HP Omen 15-dc1020ng | |
| Dell G5 15 5590-PCNJJ | |
| Acer Predator Helios 300 PH315-52-79TY | |
| Lenovo Legion Y540-15IRH-81SX00B2GE | |
| iperf3 receive AX12 | |
| Acer Nitro 5 AN515-44-R5FT | |
| Dell G5 15 5590-PCNJJ | |
| Acer Predator Helios 300 PH315-52-79TY | |
| HP Omen 15-dc1020ng | |
| Lenovo Legion Y540-15IRH-81SX00B2GE | |


| |||||||||||||||||||||||||
Distribution av ljusstyrkan: 88 %
Mitt på batteriet: 287 cd/m²
Kontrast: 1148:1 (Svärta: 0.25 cd/m²)
ΔE ColorChecker Calman: 4.77 | ∀{0.5-29.43 Ø4.72}
calibrated: 3.73
ΔE Greyscale Calman: 2.7 | ∀{0.09-98 Ø4.97}
61% sRGB (Argyll 1.6.3 3D)
43% AdobeRGB 1998 (Argyll 1.6.3 3D)
42.56% AdobeRGB 1998 (Argyll 3D)
61.8% sRGB (Argyll 3D)
41.16% Display P3 (Argyll 3D)
Gamma: 2.115
CCT: 7187 K
| Acer Nitro 5 AN515-44-R5FT Panda LM156LF-2F01 (NCP004D), IPS, 1920x1080 | Dell G5 15 5590-PCNJJ AU Optronics B156HAN (AUO23ED), IPS, 1920x1080 | HP Omen 15-dc1020ng LGD05CE, IPS, 1920x1080 | Lenovo Legion Y540-15IRH-81SX00B2GE BOE 084D, IPS, 1920x1080 | Acer Predator Helios 300 PH315-52-79TY AUO, B156HAN08.2, IPS, 1920x1080 | |
|---|---|---|---|---|---|
| Display | 97% | -7% | 52% | 53% | |
| Display P3 Coverage (%) | 41.16 | 83.1 102% | 38.37 -7% | 63.6 55% | 64.1 56% |
| sRGB Coverage (%) | 61.8 | 99.9 62% | 57.6 -7% | 91.7 48% | 93 50% |
| AdobeRGB 1998 Coverage (%) | 42.56 | 96.8 127% | 39.69 -7% | 65.2 53% | 65.7 54% |
| Response Times | -9% | 2% | 69% | 67% | |
| Response Time Grey 50% / Grey 80% * (ms) | 40.8 ? | 48 ? -18% | 40 ? 2% | 8.8 ? 78% | 15 ? 63% |
| Response Time Black / White * (ms) | 30 ? | 30 ? -0% | 29.6 ? 1% | 12 ? 60% | 9 ? 70% |
| PWM Frequency (Hz) | |||||
| Screen | -13% | -11% | 14% | 14% | |
| Brightness middle (cd/m²) | 287 | 234 -18% | 251 -13% | 299 4% | 325 13% |
| Brightness (cd/m²) | 271 | 216 -20% | 232 -14% | 290 7% | 310 14% |
| Brightness Distribution (%) | 88 | 87 -1% | 76 -14% | 89 1% | 82 -7% |
| Black Level * (cd/m²) | 0.25 | 0.22 12% | 0.17 32% | 0.29 -16% | 0.255 -2% |
| Contrast (:1) | 1148 | 1064 -7% | 1476 29% | 1031 -10% | 1275 11% |
| Colorchecker dE 2000 * | 4.77 | 6.52 -37% | 6.2 -30% | 3.7 22% | 4.28 10% |
| Colorchecker dE 2000 max. * | 17.15 | 10.58 38% | 18.6 -8% | 7 59% | 8.42 51% |
| Colorchecker dE 2000 calibrated * | 3.73 | 3.56 5% | 4.8 -29% | 2 46% | 1.45 61% |
| Greyscale dE 2000 * | 2.7 | 5.33 -97% | 4.2 -56% | 4.1 -52% | 5.01 -86% |
| Gamma | 2.115 104% | 2.86 77% | 2.32 95% | 2.19 100% | 2.6 85% |
| CCT | 7187 90% | 5983 109% | 7454 87% | 7166 91% | 7678 85% |
| Color Space (Percent of AdobeRGB 1998) (%) | 43 | 36 -16% | 36.5 -15% | 59.3 38% | 60 40% |
| Color Space (Percent of sRGB) (%) | 61 | 57 -7% | 57.4 -6% | 91.5 50% | 93 52% |
| Totalt genomsnitt (program/inställningar) | 25% /
8% | -5% /
-9% | 45% /
28% | 45% /
28% |
* ... mindre är bättre
Visa svarstider
| ↔ Svarstid svart till vitt | ||
|---|---|---|
| 30 ms ... stiga ↗ och falla ↘ kombinerat | ↗ 16.8 ms stiga | 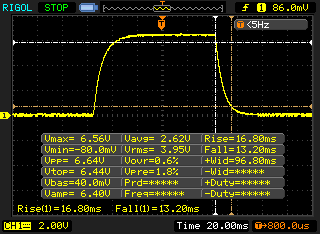 |
| ↘ 13.2 ms hösten | ||
| Skärmen visar långsamma svarsfrekvenser i våra tester och kommer att vara otillfredsställande för spelare. I jämförelse sträcker sig alla testade enheter från 0.1 (minst) till 240 (maximalt) ms. » 80 % av alla enheter är bättre. Detta innebär att den uppmätta svarstiden är sämre än genomsnittet av alla testade enheter (19.9 ms). | ||
| ↔ Svarstid 50 % grått till 80 % grått | ||
| 40.8 ms ... stiga ↗ och falla ↘ kombinerat | ↗ 19.2 ms stiga | 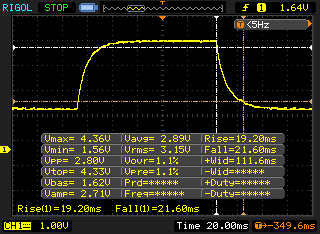 |
| ↘ 21.6 ms hösten | ||
| Skärmen visar långsamma svarsfrekvenser i våra tester och kommer att vara otillfredsställande för spelare. I jämförelse sträcker sig alla testade enheter från 0.165 (minst) till 636 (maximalt) ms. » 64 % av alla enheter är bättre. Detta innebär att den uppmätta svarstiden är sämre än genomsnittet av alla testade enheter (31.1 ms). | ||
Skärmflimmer / PWM (Puls-Width Modulation)
| Skärmflimmer / PWM upptäcktes inte | 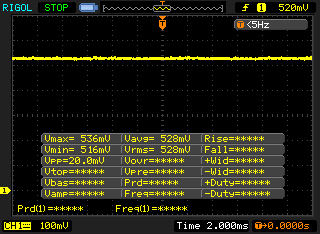 | ||
Som jämförelse: 52 % av alla testade enheter använder inte PWM för att dämpa skärmen. Om PWM upptäcktes mättes ett medelvärde av 7784 (minst: 5 - maximum: 343500) Hz. | |||
| Cinebench R15 | |
| CPU Single 64Bit | |
| Genomsnitt av klass Gaming (188.8 - 343, n=109, senaste 2 åren) | |
| Acer Predator Helios 300 PH315-52-79TY | |
| Lenovo Legion Y540-15IRH-81SX00B2GE | |
| Acer Nitro 5 AN515-44-R5FT | |
| HP Omen 15-dc1020ng | |
| Dell G5 15 5590-PCNJJ | |
| CPU Multi 64Bit | |
| Genomsnitt av klass Gaming (1578 - 6271, n=109, senaste 2 åren) | |
| Acer Nitro 5 AN515-44-R5FT | |
| Acer Predator Helios 300 PH315-52-79TY | |
| Lenovo Legion Y540-15IRH-81SX00B2GE | |
| Dell G5 15 5590-PCNJJ | |
| HP Omen 15-dc1020ng | |
| Blender - v2.79 BMW27 CPU | |
| HP Omen 15-dc1020ng | |
| Acer Predator Helios 300 PH315-52-79TY | |
| Lenovo Legion Y540-15IRH-81SX00B2GE | |
| Acer Nitro 5 AN515-44-R5FT | |
| Genomsnitt av klass Gaming (80 - 330, n=107, senaste 2 åren) | |
| Cinebench R20 | |
| CPU (Single Core) | |
| Genomsnitt av klass Gaming (442 - 895, n=109, senaste 2 åren) | |
| Acer Predator Helios 300 PH315-52-79TY | |
| Lenovo Legion Y540-15IRH-81SX00B2GE | |
| Acer Nitro 5 AN515-44-R5FT | |
| HP Omen 15-dc1020ng | |
| Dell G5 15 5590-PCNJJ | |
| CPU (Multi Core) | |
| Genomsnitt av klass Gaming (4029 - 16108, n=109, senaste 2 åren) | |
| Acer Nitro 5 AN515-44-R5FT | |
| Acer Predator Helios 300 PH315-52-79TY | |
| Lenovo Legion Y540-15IRH-81SX00B2GE | |
| Dell G5 15 5590-PCNJJ | |
| HP Omen 15-dc1020ng | |
| HWBOT x265 Benchmark v2.2 - 4k Preset | |
| Genomsnitt av klass Gaming (11.5 - 44.3, n=108, senaste 2 åren) | |
| Acer Nitro 5 AN515-44-R5FT | |
| Lenovo Legion Y540-15IRH-81SX00B2GE | |
| Acer Predator Helios 300 PH315-52-79TY | |
| HP Omen 15-dc1020ng | |
| LibreOffice - 20 Documents To PDF | |
| Acer Nitro 5 AN515-44-R5FT | |
| Genomsnitt av klass Gaming (19 - 88.8, n=108, senaste 2 åren) | |
| R Benchmark 2.5 - Overall mean | |
| Acer Nitro 5 AN515-44-R5FT | |
| Genomsnitt av klass Gaming (0.3439 - 0.759, n=109, senaste 2 åren) | |
* ... mindre är bättre
| DPC Latencies / LatencyMon - interrupt to process latency (max), Web, Youtube, Prime95 | |
| Acer Nitro 5 AN515-44-R5FT | |
* ... mindre är bättre
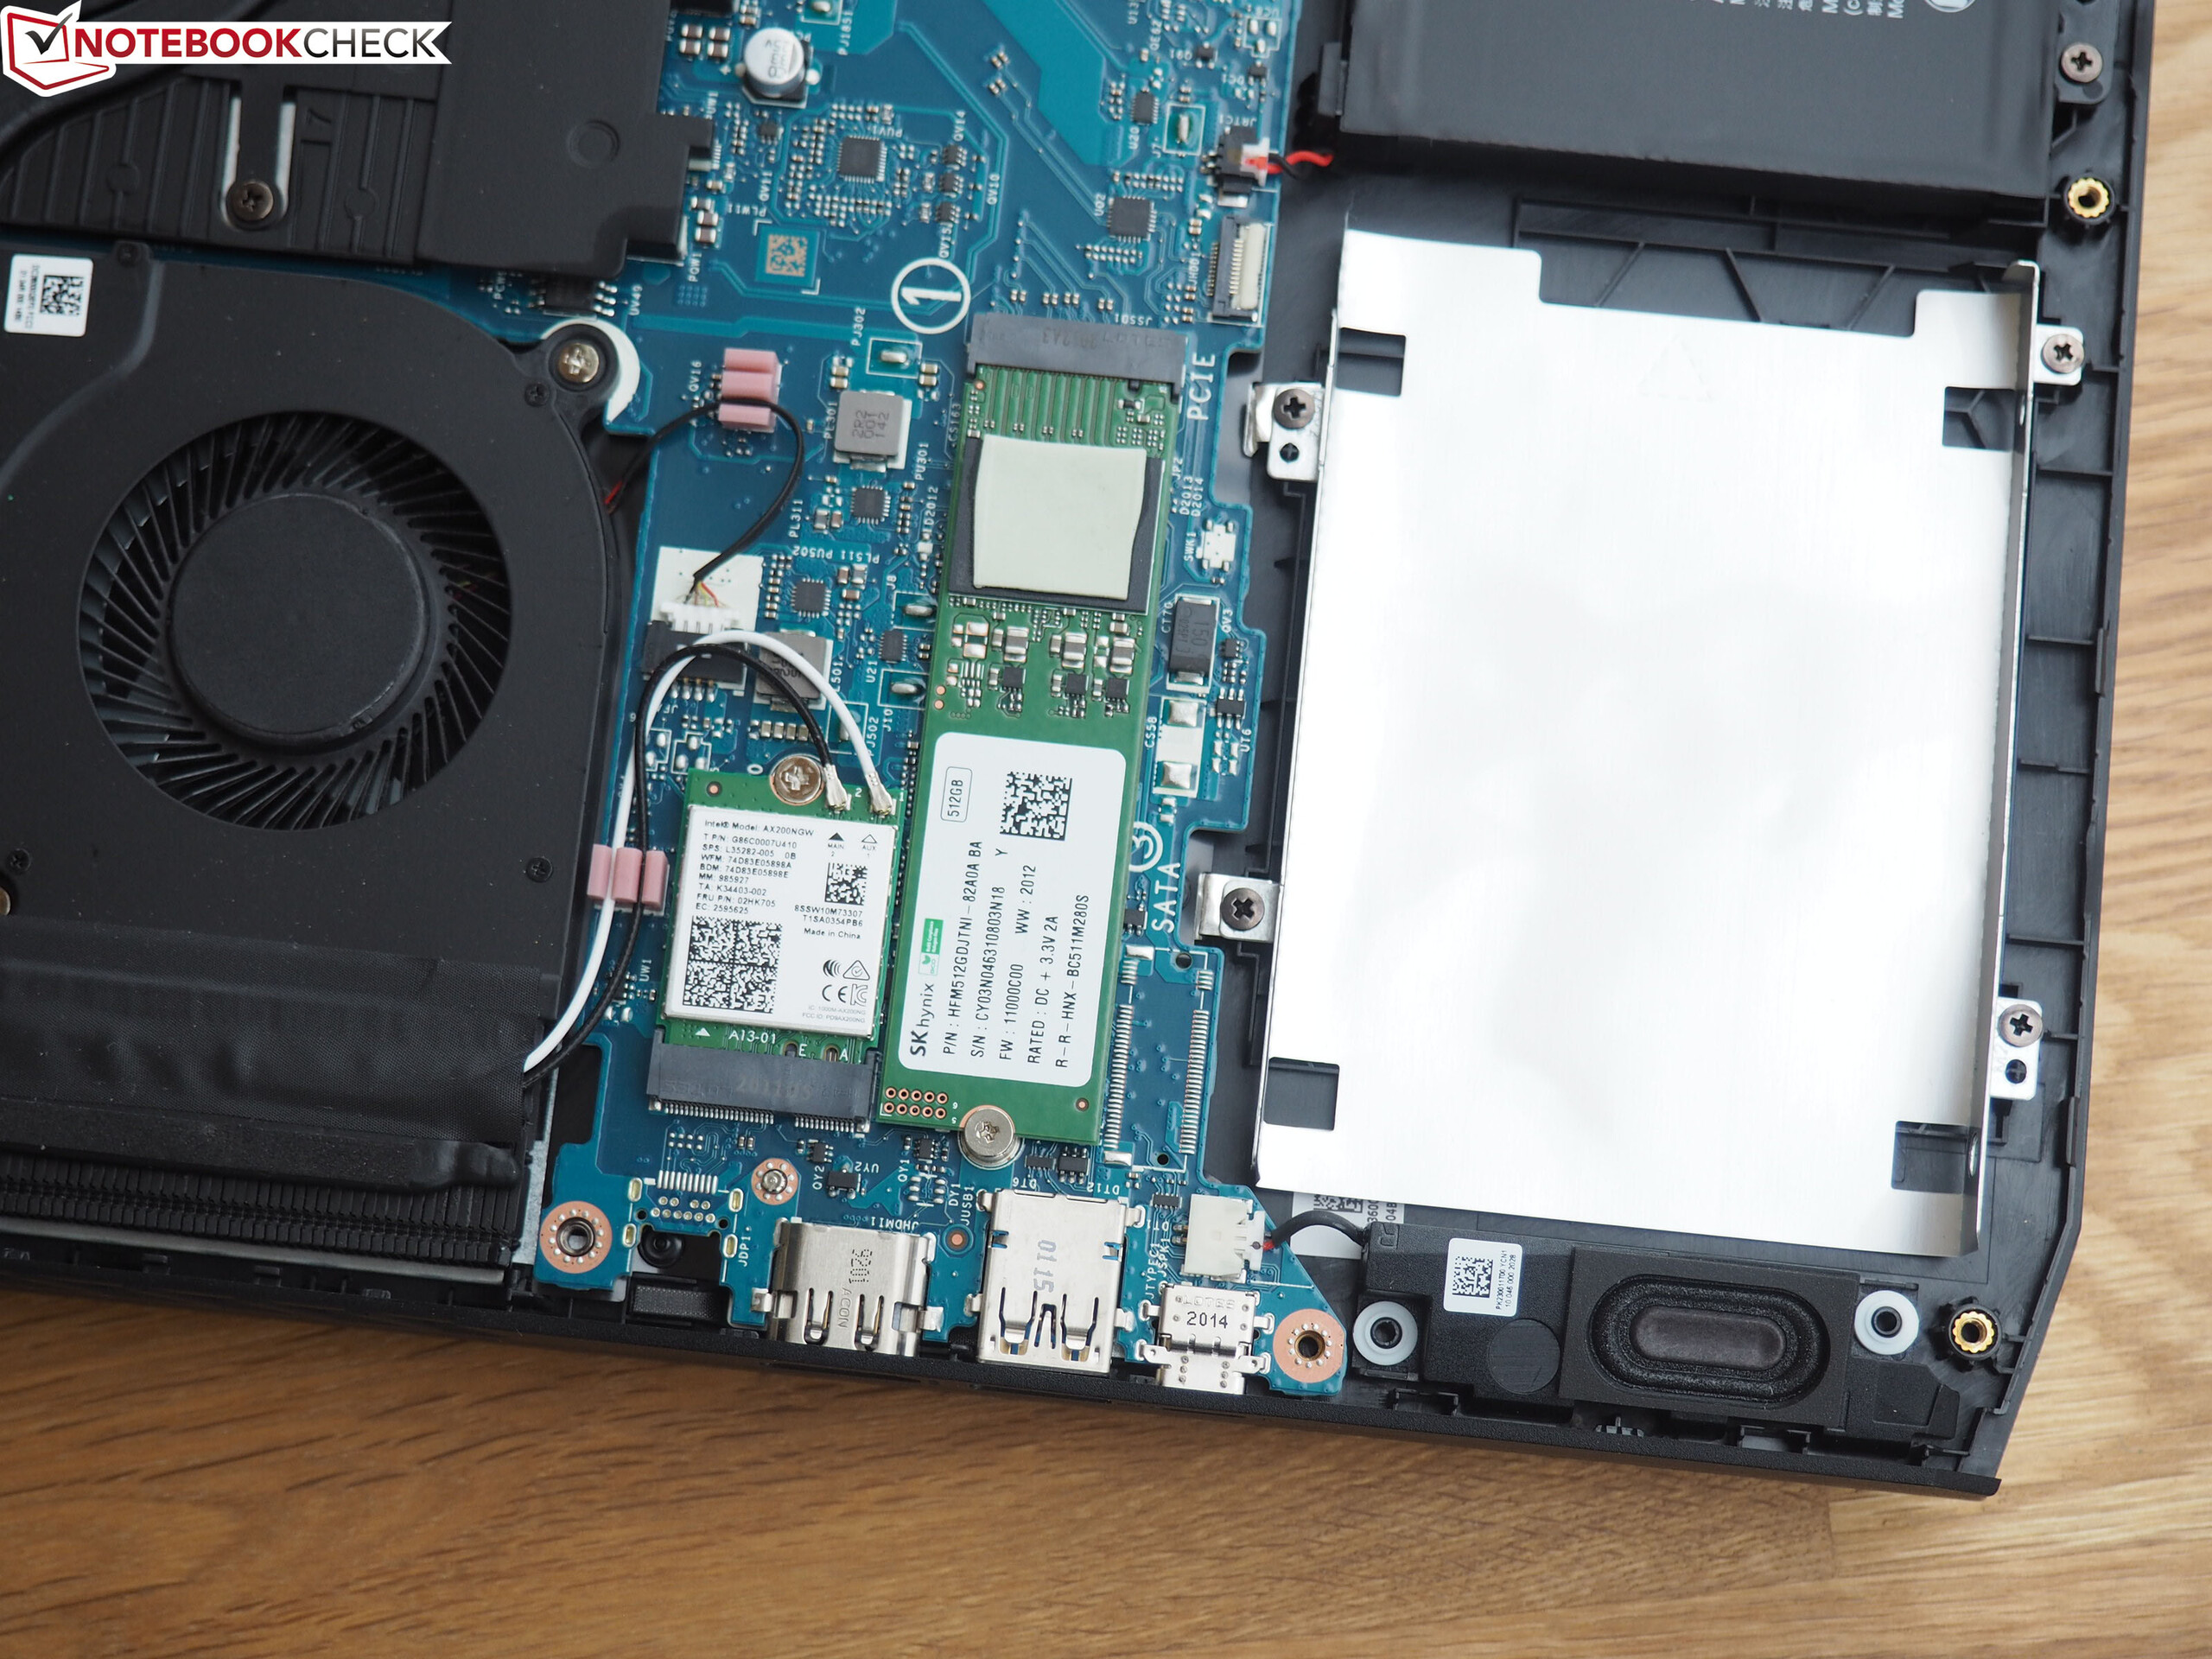
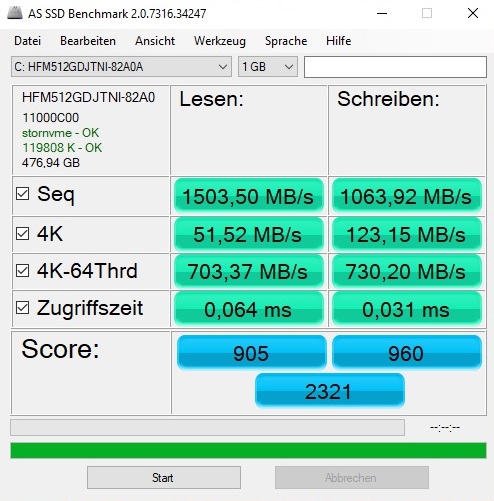
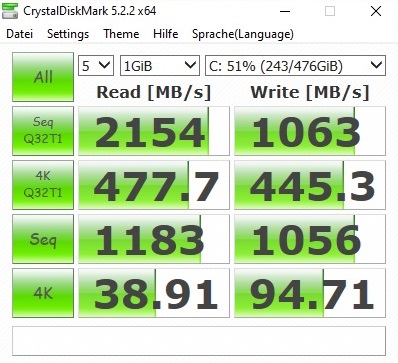
| Acer Nitro 5 AN515-44-R5FT SK Hynix BC511 HFM512GDJTNI | Dell G5 15 5590-PCNJJ KBG30ZMS128G | HP Omen 15-dc1020ng WDC PC SN720 SDAQNTW-512G | Lenovo Legion Y540-15IRH-81SX00B2GE WDC PC SN720 SDAPNTW-512G | Acer Predator Helios 300 PH315-52-79TY WDC PC SN720 SDAPNTW-512G | |
|---|---|---|---|---|---|
| CrystalDiskMark 5.2 / 6 | -55% | 43% | 42% | 48% | |
| Write 4K (MB/s) | 94.7 | 65.3 -31% | 112.1 18% | 158.8 68% | 108.7 15% |
| Read 4K (MB/s) | 38.91 | 29.71 -24% | 42.01 8% | 29.11 -25% | 44.91 15% |
| Write Seq (MB/s) | 1056 | 128.8 -88% | 1964 86% | 1584 50% | 2424 130% |
| Read Seq (MB/s) | 1183 | 859 -27% | 2065 75% | 1694 43% | 1617 37% |
| Write 4K Q32T1 (MB/s) | 445.3 | 95.8 -78% | 318.2 -29% | 536 20% | 356.9 -20% |
| Read 4K Q32T1 (MB/s) | 477.7 | 197.6 -59% | 406.7 -15% | 363.9 -24% | 557 17% |
| Write Seq Q32T1 (MB/s) | 1063 | 132.5 -88% | 2534 138% | 2536 139% | 2542 139% |
| Read Seq Q32T1 (MB/s) | 2154 | 1208 -44% | 3438 60% | 3458 61% | 3218 49% |

| 3DMark | |
| 1920x1080 Fire Strike Graphics | |
| Genomsnitt av klass Gaming (12242 - 62849, n=118, senaste 2 åren) | |
| Acer Predator Helios 300 PH315-52-79TY | |
| Lenovo Legion Y540-15IRH-81SX00B2GE | |
| Acer Nitro 5 AN515-44-R5FT | |
| HP Omen 15-dc1020ng | |
| Dell G5 15 5590-PCNJJ | |
| 2560x1440 Time Spy Graphics | |
| Genomsnitt av klass Gaming (5012 - 26212, n=117, senaste 2 åren) | |
| Acer Predator Helios 300 PH315-52-79TY | |
| Acer Nitro 5 AN515-44-R5FT | |
| HP Omen 15-dc1020ng | |
| Dell G5 15 5590-PCNJJ | |
| 3DMark 11 - 1280x720 Performance GPU | |
| Genomsnitt av klass Gaming (21841 - 80022, n=106, senaste 2 åren) | |
| Lenovo Legion Y540-15IRH-81SX00B2GE | |
| Acer Predator Helios 300 PH315-52-79TY | |
| Acer Nitro 5 AN515-44-R5FT | |
| HP Omen 15-dc1020ng | |
| Dell G5 15 5590-PCNJJ | |
| 3DMark 11 Performance | 12865 poäng | |
| 3DMark Cloud Gate Standard Score | 28177 poäng | |
| 3DMark Fire Strike Score | 9374 poäng | |
| 3DMark Time Spy Score | 4011 poäng | |
Hjälp | ||
| The Witcher 3 | |
| 1920x1080 High Graphics & Postprocessing (Nvidia HairWorks Off) | |
| Genomsnitt av klass Gaming (181 - 341, n=3, senaste 2 åren) | |
| Acer Predator Helios 300 PH315-52-79TY | |
| Acer Nitro 5 AN515-44-R5FT | |
| HP Omen 15-dc1020ng | |
| Dell G5 15 5590-PCNJJ | |
| 1920x1080 Ultra Graphics & Postprocessing (HBAO+) | |
| Genomsnitt av klass Gaming (95 - 240, n=8, senaste 2 åren) | |
| Acer Predator Helios 300 PH315-52-79TY | |
| Lenovo Legion Y540-15IRH-81SX00B2GE | |
| Acer Nitro 5 AN515-44-R5FT | |
| HP Omen 15-dc1020ng | |
| Dell G5 15 5590-PCNJJ | |
| låg | med. | hög | ultra | QHD | 4K | |
|---|---|---|---|---|---|---|
| GTA V (2015) | 144 | 93.1 | 51.5 | |||
| The Witcher 3 (2015) | 126 | 67.7 | 38.3 | 24.8 | ||
| Dota 2 Reborn (2015) | 107 | 104 | 91 | 87.1 | ||
| Fortnite (2018) | 121 | 89.9 | 68.6 | 41.1 | 13.1 | |
| Final Fantasy XV Benchmark (2018) | 56.5 | 42 | 14.6 | |||
| Kingdom Come: Deliverance (2018) | 69.3 | 57.7 | 38.7 | 25.9 | 11.7 | |
| X-Plane 11.11 (2018) | 80.2 | 67.6 | 59.1 | |||
| Monster Hunter World (2018) | 63.7 | 55.5 | 45.3 | |||
| Shadow of the Tomb Raider (2018) | 69 | 58 | 51 | 32 | 18 | |
| Hitman 2 (2018) | 59.2 | 53.7 | 51.5 | 40.5 | 21.6 | |
| Battlefield V (2018) | 84.3 | 73.2 | 67.3 | 51.2 | 27.6 | |
| Darksiders III (2018) | 85.9 | 68.6 | 60.8 | 37.9 | 12.7 | |
| Just Cause 4 (2018) | 84.4 | 60.9 | 56.2 | 37.5 | 19.6 | |
| Rage 2 (2019) | 66.9 | 55.5 | 54.7 | 33.7 | 14.9 | |
| Control (2019) | 48.6 | 35.5 | 21.9 | 10.5 | ||
| Borderlands 3 (2019) | 65.9 | 43.2 | 32.3 | 20.1 | 7.1 | |
| FIFA 20 (2019) | 155 | 153 | 148 | 144 | ||
| Call of Duty Modern Warfare 2019 (2019) | 71.1 | 63.5 | 51.7 | 36.6 | 18.9 | |
| Red Dead Redemption 2 (2019) | 53.8 | 35.4 | 21.8 | 17.1 | ||
| Gears Tactics (2020) | 100 | 67.3 | 49.8 | 29.3 | 16.9 |
Ljudnivå
| Låg belastning |
| 30 / 32 / 34 dB(A) |
| Hög belastning |
| 46 / 49 dB(A) |
 | ||
30 dB tyst 40 dB(A) hörbar 50 dB(A) högt ljud |
||
min: | ||
| Acer Nitro 5 AN515-44-R5FT R5 4600H, GeForce GTX 1650 Ti Mobile | Dell G5 15 5590-PCNJJ i5-9300H, GeForce GTX 1650 Mobile | HP Omen 15-dc1020ng i5-9300H, GeForce GTX 1650 Mobile | Lenovo Legion Y540-15IRH-81SX00B2GE i7-9750H, GeForce GTX 1660 Ti Mobile | Acer Predator Helios 300 PH315-52-79TY i7-9750H, GeForce GTX 1660 Ti Mobile | Genomsnitt av klass Gaming | |
|---|---|---|---|---|---|---|
| Noise | -3% | 13% | 9% | 3% | 10% | |
| av / miljö * (dB) | 30 | 30 -0% | 28.8 4% | 29.3 2% | 30.2 -1% | 24.1 ? 20% |
| Idle Minimum * (dB) | 30 | 31 -3% | 28.8 4% | 29.3 2% | 31 -3% | 25.8 ? 14% |
| Idle Average * (dB) | 32 | 32 -0% | 29.5 8% | 29.3 8% | 31 3% | 27.4 ? 14% |
| Idle Maximum * (dB) | 34 | 35 -3% | 31.1 9% | 29.3 14% | 31 9% | 29.9 ? 12% |
| Load Average * (dB) | 46 | 49 -7% | 35.2 23% | 35.7 22% | 41.5 10% | 43 ? 7% |
| Witcher 3 ultra * (dB) | 47 | 47 -0% | 35.2 25% | 44.2 6% | 46.7 1% | |
| Load Maximum * (dB) | 49 | 53 -8% | 41 16% | 45.6 7% | 46.9 4% | 54 ? -10% |
* ... mindre är bättre
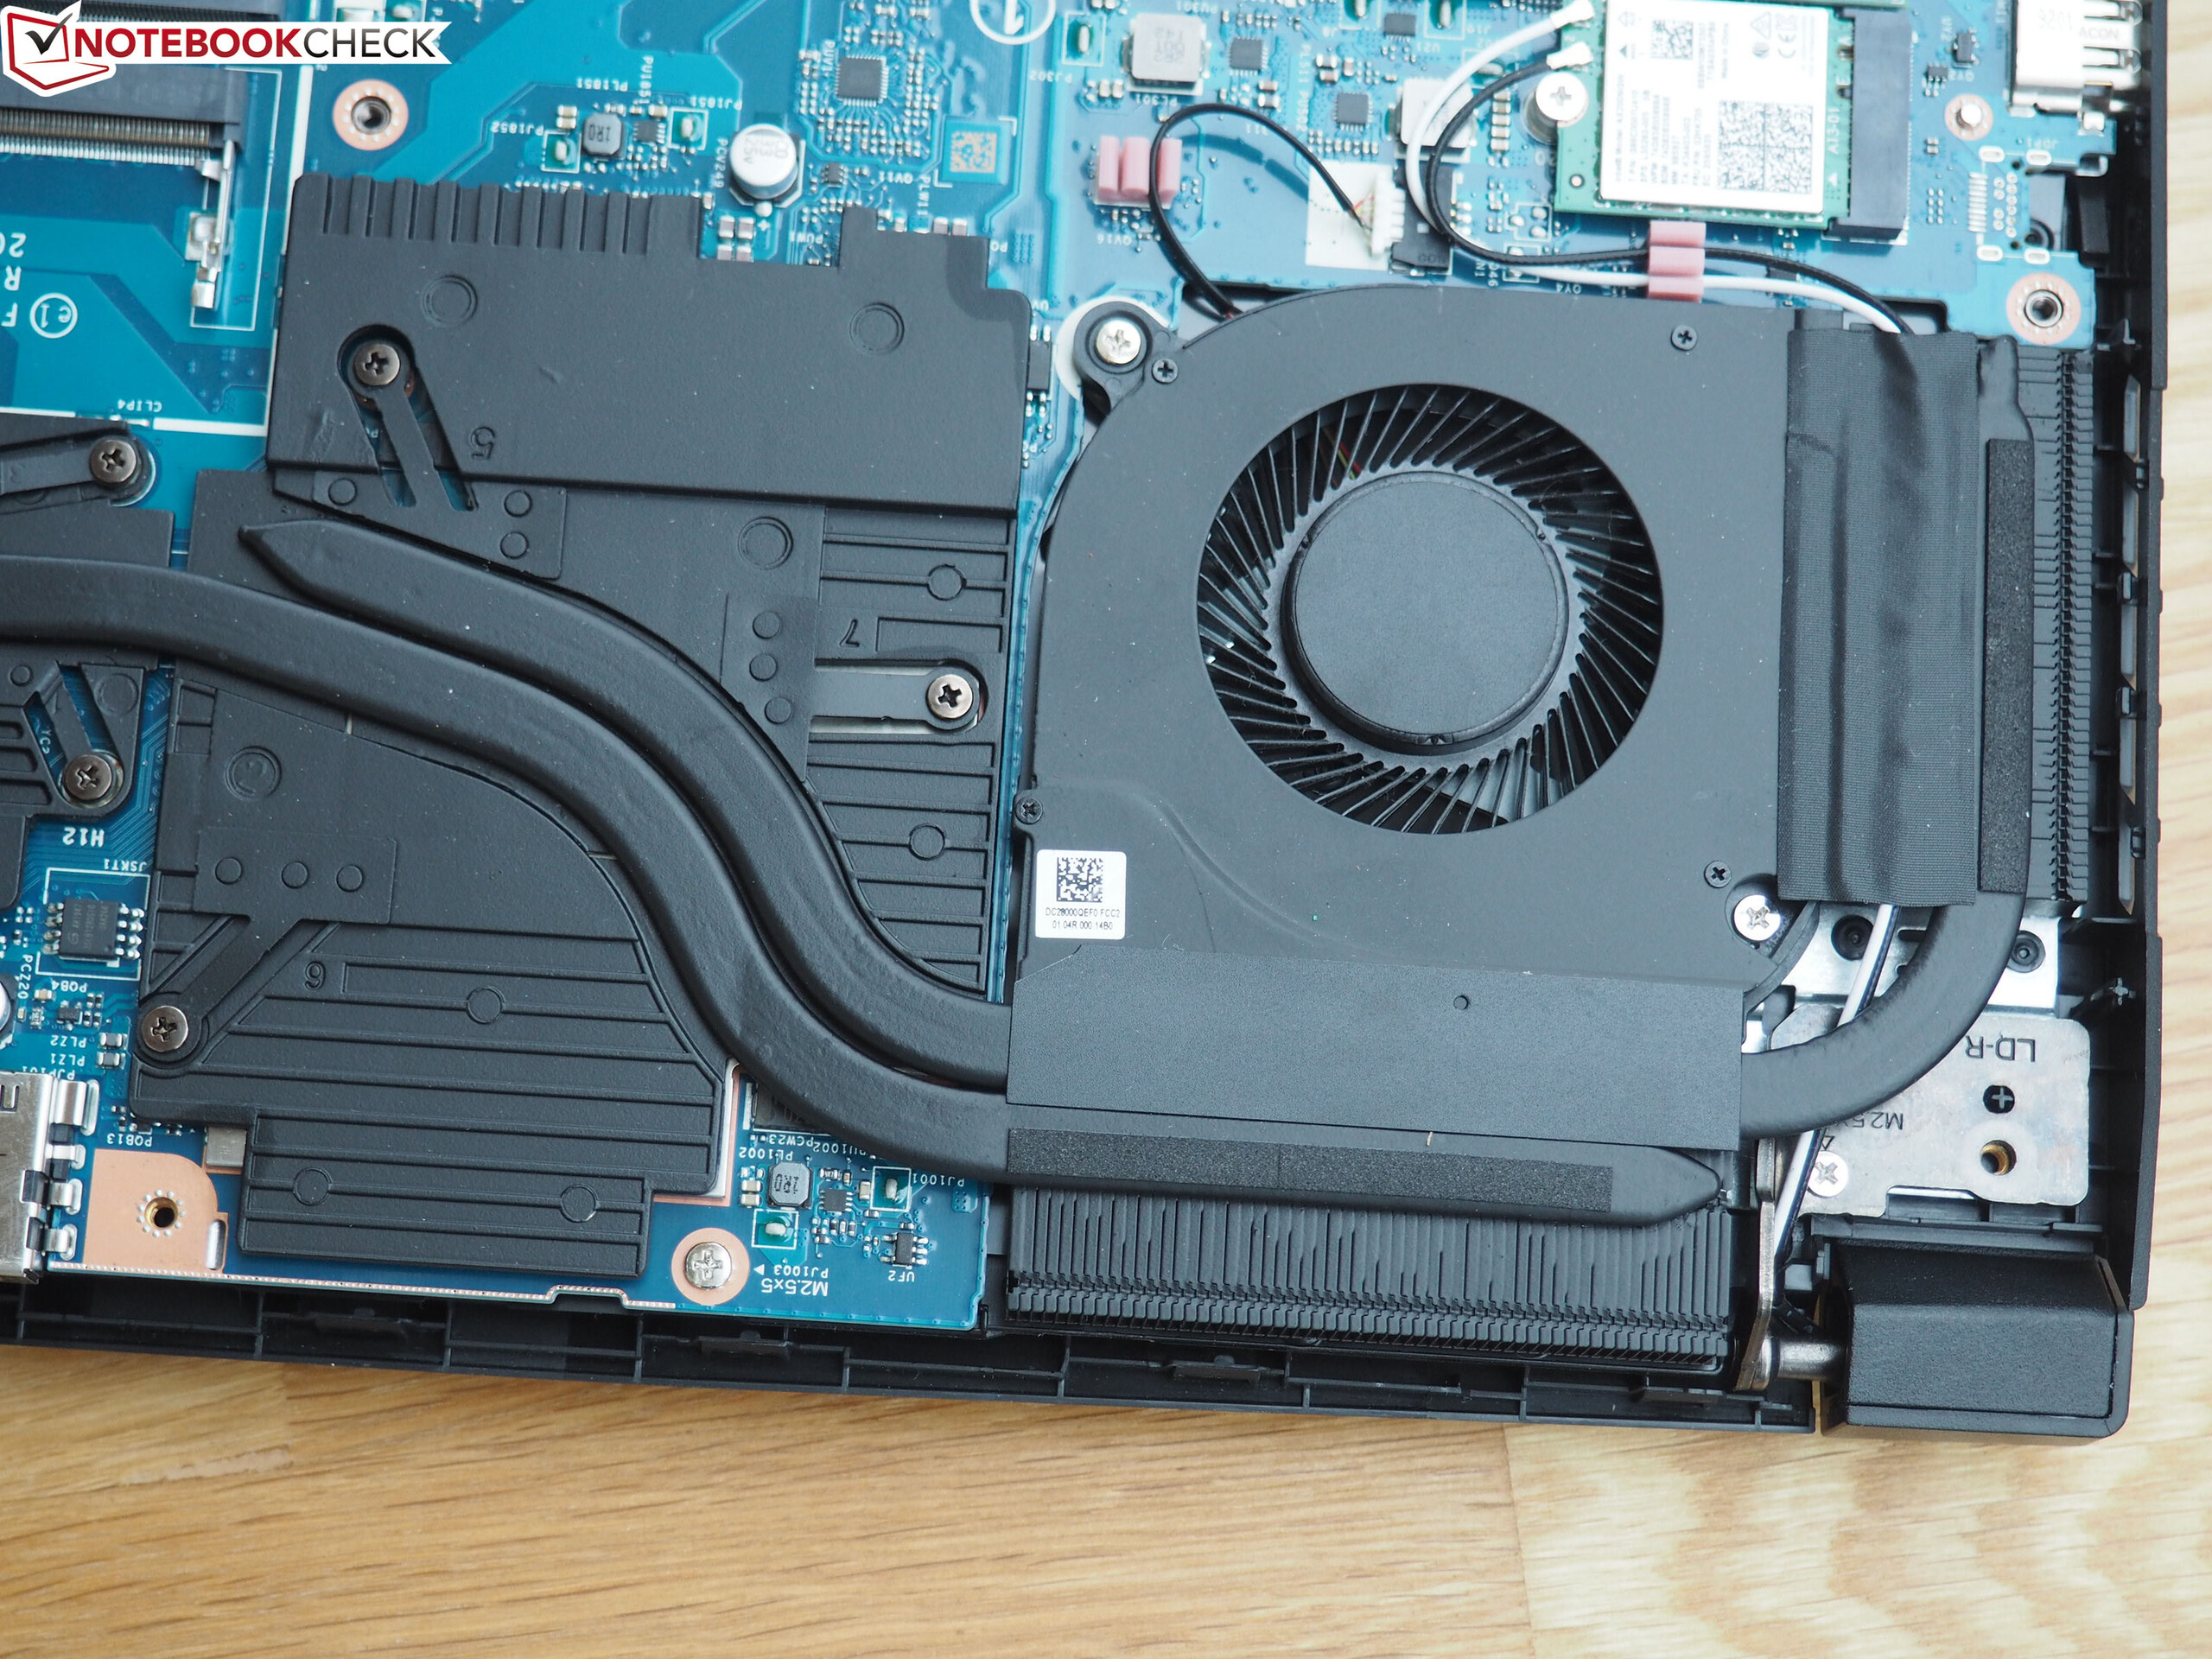
(-) Den maximala temperaturen på ovansidan är 49 °C / 120 F, jämfört med genomsnittet av 40.4 °C / 105 F , allt från 21.2 till 68.8 °C för klassen Gaming.
(-) Botten värms upp till maximalt 50 °C / 122 F, jämfört med genomsnittet av 43.2 °C / 110 F
(+) Vid tomgångsbruk är medeltemperaturen för ovansidan 25.9 °C / 79 F, jämfört med enhetsgenomsnittet på 33.9 °C / ### class_avg_f### F.
(±) När du spelar The Witcher 3 är medeltemperaturen för ovansidan 37.4 °C / 99 F, jämfört med enhetsgenomsnittet på 33.9 °C / ## #class_avg_f### F.
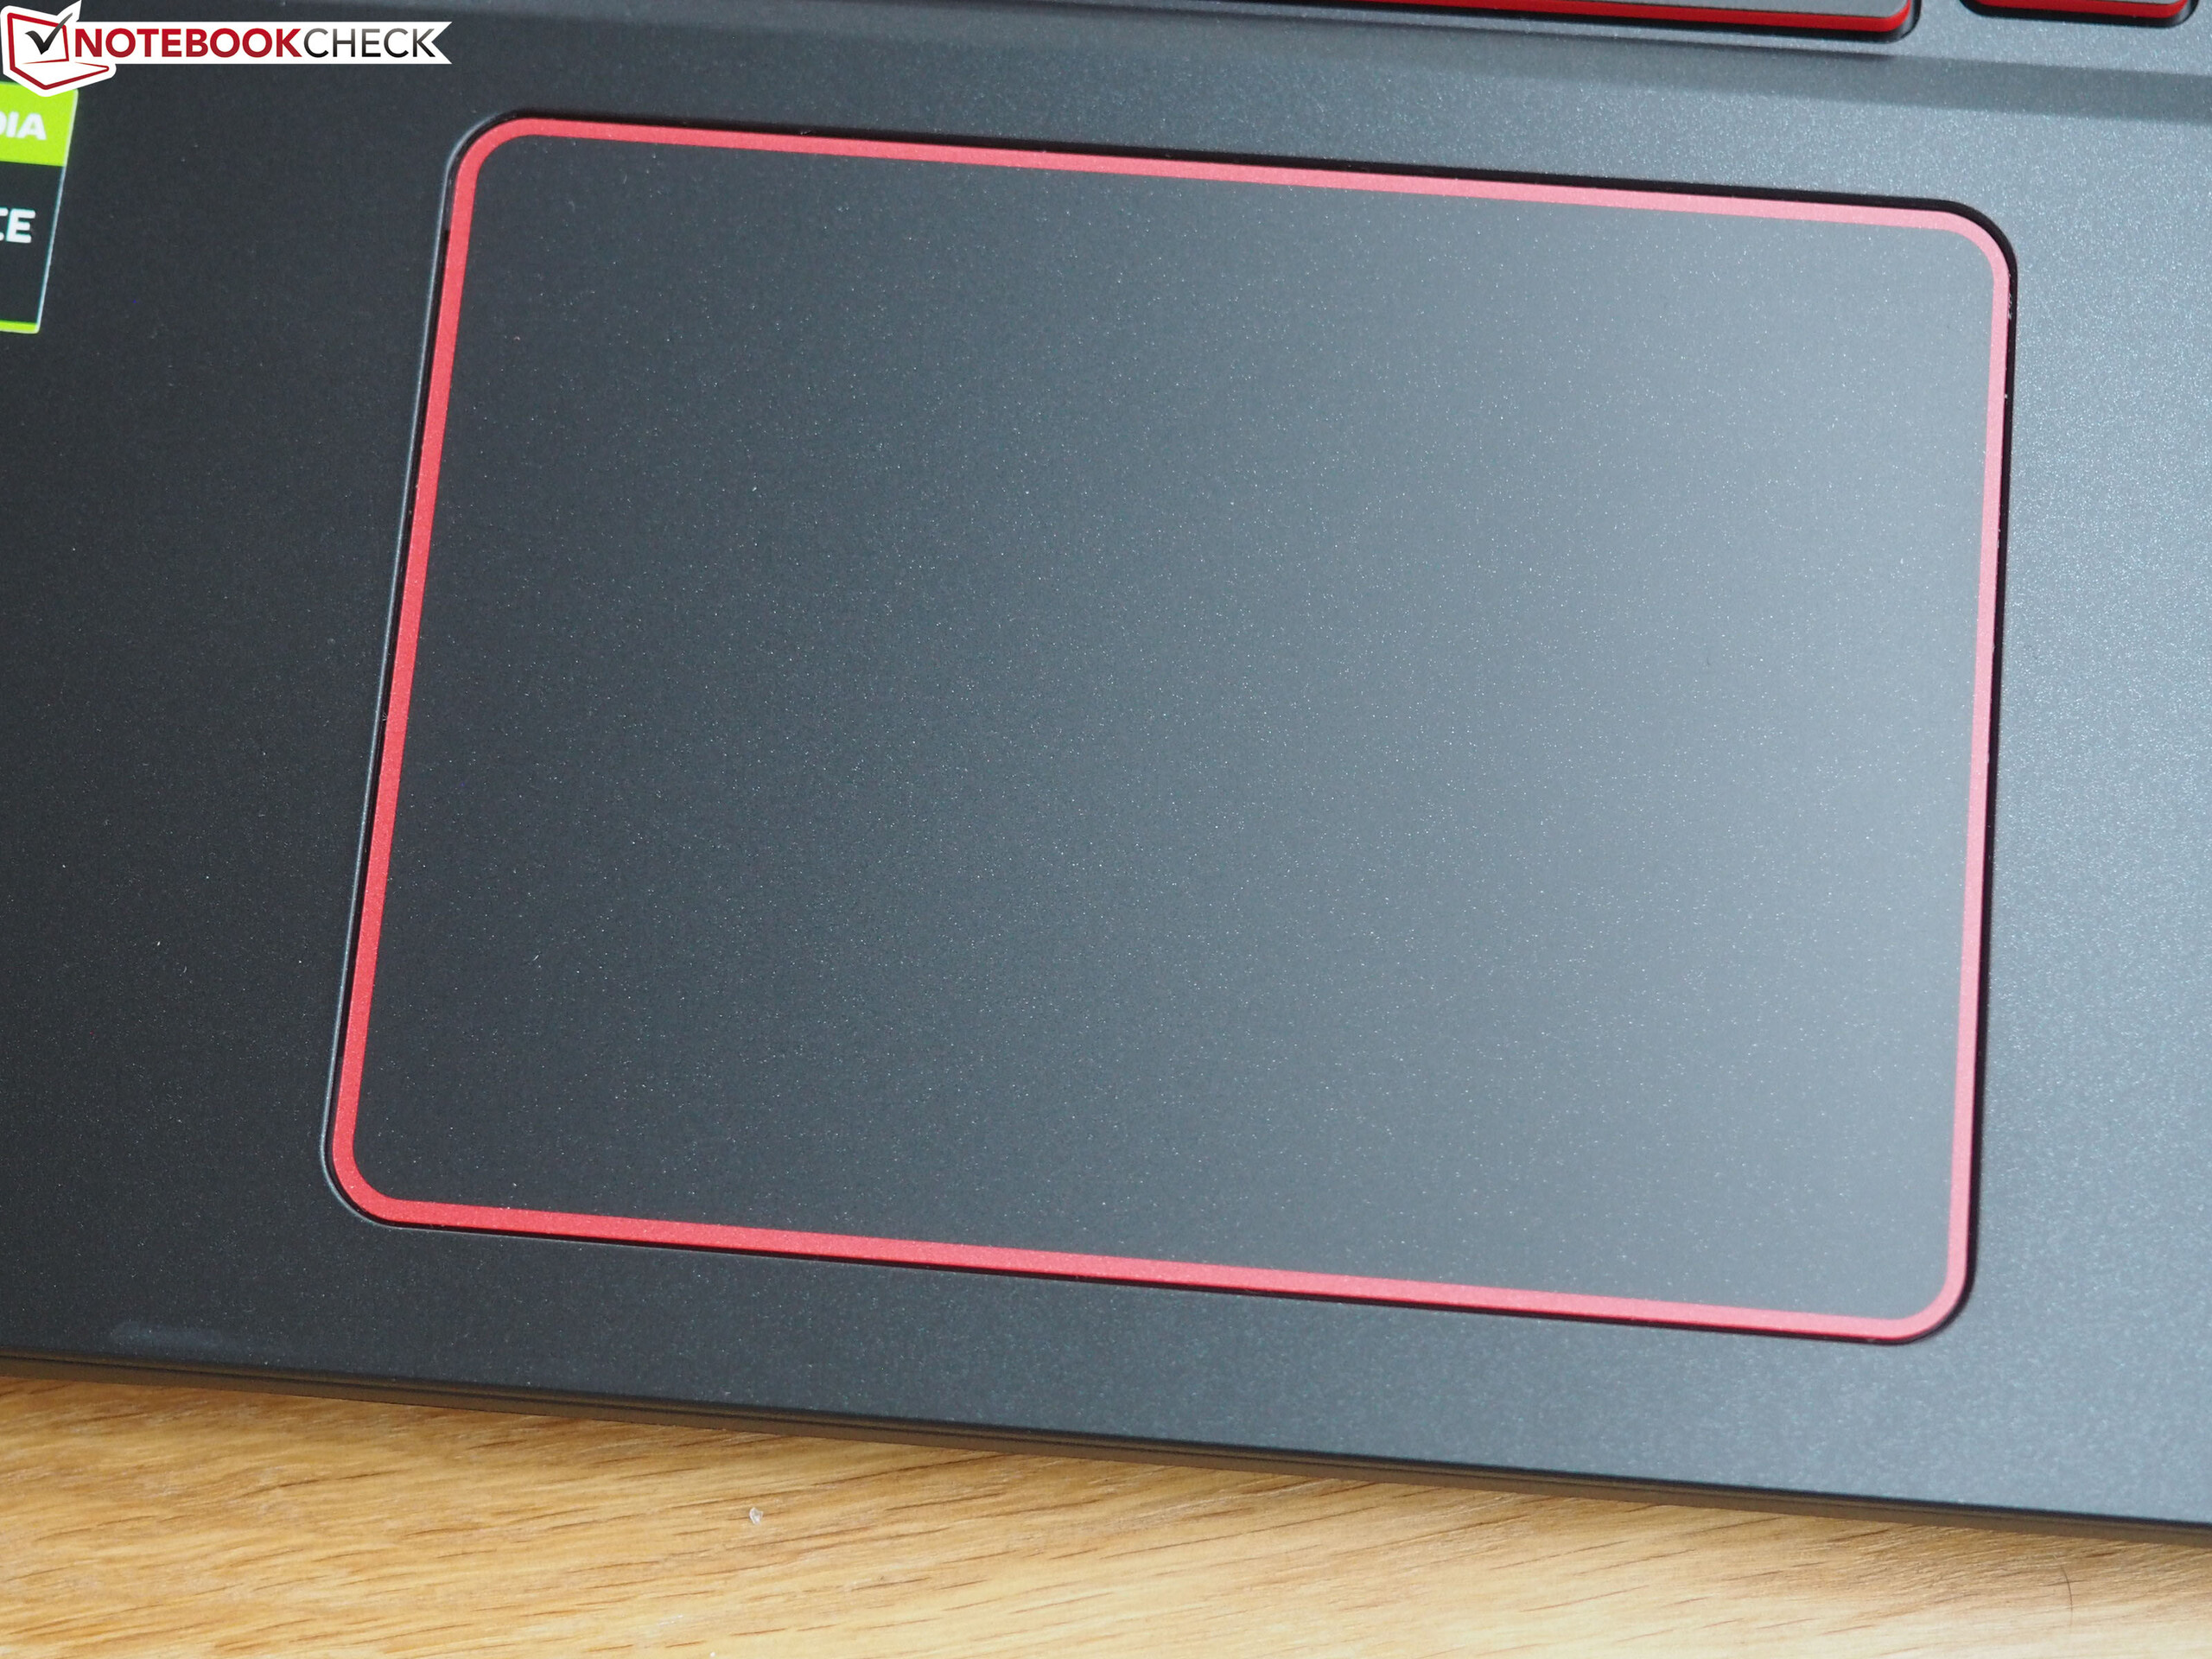
(+) Handledsstöden och pekplattan når maximal hudtemperatur (35 °C / 95 F) och är därför inte varma.
(-) Medeltemperaturen för handledsstödsområdet på liknande enheter var 28.8 °C / 83.8 F (-6.2 °C / -11.2 F).
| Acer Nitro 5 AN515-44-R5FT R5 4600H, GeForce GTX 1650 Ti Mobile | Dell G5 15 5590-PCNJJ i5-9300H, GeForce GTX 1650 Mobile | HP Omen 15-dc1020ng i5-9300H, GeForce GTX 1650 Mobile | Lenovo Legion Y540-15IRH-81SX00B2GE i7-9750H, GeForce GTX 1660 Ti Mobile | Acer Predator Helios 300 PH315-52-79TY i7-9750H, GeForce GTX 1660 Ti Mobile | Genomsnitt av klass Gaming | |
|---|---|---|---|---|---|---|
| Heat | 2% | 12% | -14% | 5% | -5% | |
| Maximum Upper Side * (°C) | 49 | 49 -0% | 40.3 18% | 42.7 13% | 52 -6% | 45.2 ? 8% |
| Maximum Bottom * (°C) | 50 | 55 -10% | 48.5 3% | 52.7 -5% | 46.3 7% | 47.9 ? 4% |
| Idle Upper Side * (°C) | 28 | 25 11% | 23.9 15% | 33.1 -18% | 24.8 11% | 31.1 ? -11% |
| Idle Bottom * (°C) | 28 | 26 7% | 24.6 12% | 41 -46% | 25.4 9% | 34.2 ? -22% |
* ... mindre är bättre
Acer Nitro 5 AN515-44-R5FT ljudanalys
(±) | högtalarljudstyrkan är genomsnittlig men bra (79 dB)
Bas 100 - 315 Hz
(-) | nästan ingen bas - i genomsnitt 24% lägre än medianen
(±) | linjäriteten för basen är genomsnittlig (11% delta till föregående frekvens)
Mellan 400 - 2000 Hz
(±) | högre mellan - i genomsnitt 5% högre än median
(+) | mids är linjära (6.9% delta till föregående frekvens)
Högsta 2 - 16 kHz
(+) | balanserade toppar - endast 2.3% från medianen
(+) | toppar är linjära (3.7% delta till föregående frekvens)
Totalt 100 - 16 000 Hz
(±) | linjäriteten för det totala ljudet är genomsnittlig (21.5% skillnad mot median)
Jämfört med samma klass
» 77% av alla testade enheter i den här klassen var bättre, 5% liknande, 18% sämre
» Den bästa hade ett delta på 6%, genomsnittet var 18%, sämst var 132%
Jämfört med alla testade enheter
» 61% av alla testade enheter var bättre, 7% liknande, 33% sämre
» Den bästa hade ett delta på 4%, genomsnittet var 24%, sämst var 134%
Acer Predator Helios 300 PH315-52-79TY ljudanalys
(-) | inte särskilt höga högtalare (69.2 dB)
Bas 100 - 315 Hz
(-) | nästan ingen bas - i genomsnitt 22.4% lägre än medianen
(±) | linjäriteten för basen är genomsnittlig (12.4% delta till föregående frekvens)
Mellan 400 - 2000 Hz
(+) | balanserad mellan - endast 3.8% från medianen
(±) | linjäriteten för mids är genomsnittlig (9.8% delta till föregående frekvens)
Högsta 2 - 16 kHz
(+) | balanserade toppar - endast 2% från medianen
(+) | toppar är linjära (6.9% delta till föregående frekvens)
Totalt 100 - 16 000 Hz
(±) | linjäriteten för det totala ljudet är genomsnittlig (21.4% skillnad mot median)
Jämfört med samma klass
» 77% av alla testade enheter i den här klassen var bättre, 5% liknande, 18% sämre
» Den bästa hade ett delta på 6%, genomsnittet var 18%, sämst var 132%
Jämfört med alla testade enheter
» 60% av alla testade enheter var bättre, 7% liknande, 33% sämre
» Den bästa hade ett delta på 4%, genomsnittet var 24%, sämst var 134%
| Av/Standby | |
| Låg belastning | |
| Hög belastning |
|
Förklaring:
min: | |
| Acer Nitro 5 AN515-44-R5FT R5 4600H, GeForce GTX 1650 Ti Mobile | Dell G5 15 5590-PCNJJ i5-9300H, GeForce GTX 1650 Mobile | HP Omen 15-dc1020ng i5-9300H, GeForce GTX 1650 Mobile | Lenovo Legion Y540-15IRH-81SX00B2GE i7-9750H, GeForce GTX 1660 Ti Mobile | Acer Predator Helios 300 PH315-52-79TY i7-9750H, GeForce GTX 1660 Ti Mobile | Genomsnitt av klass Gaming | |
|---|---|---|---|---|---|---|
| Power Consumption | -3% | -2% | -88% | -119% | -110% | |
| Idle Minimum * (Watt) | 5 | 4 20% | 4.04 19% | 14.5 -190% | 17.2 -244% | 13.2 ? -164% |
| Idle Average * (Watt) | 8 | 7 12% | 7.2 10% | 18.5 -131% | 22.6 -183% | 18.9 ? -136% |
| Idle Maximum * (Watt) | 13 | 12 8% | 11.4 12% | 20 -54% | 25.5 -96% | 24.3 ? -87% |
| Load Average * (Watt) | 69 | 95 -38% | 80.8 -17% | 81.6 -18% | 88 -28% | 108.3 ? -57% |
| Witcher 3 ultra * (Watt) | 78 | 86 -10% | 93.6 -20% | 132 -69% | ||
| Load Maximum * (Watt) | 124 | 135 -9% | 144.5 -17% | 208.1 -68% | 177 -43% | 254 ? -105% |
* ... mindre är bättre
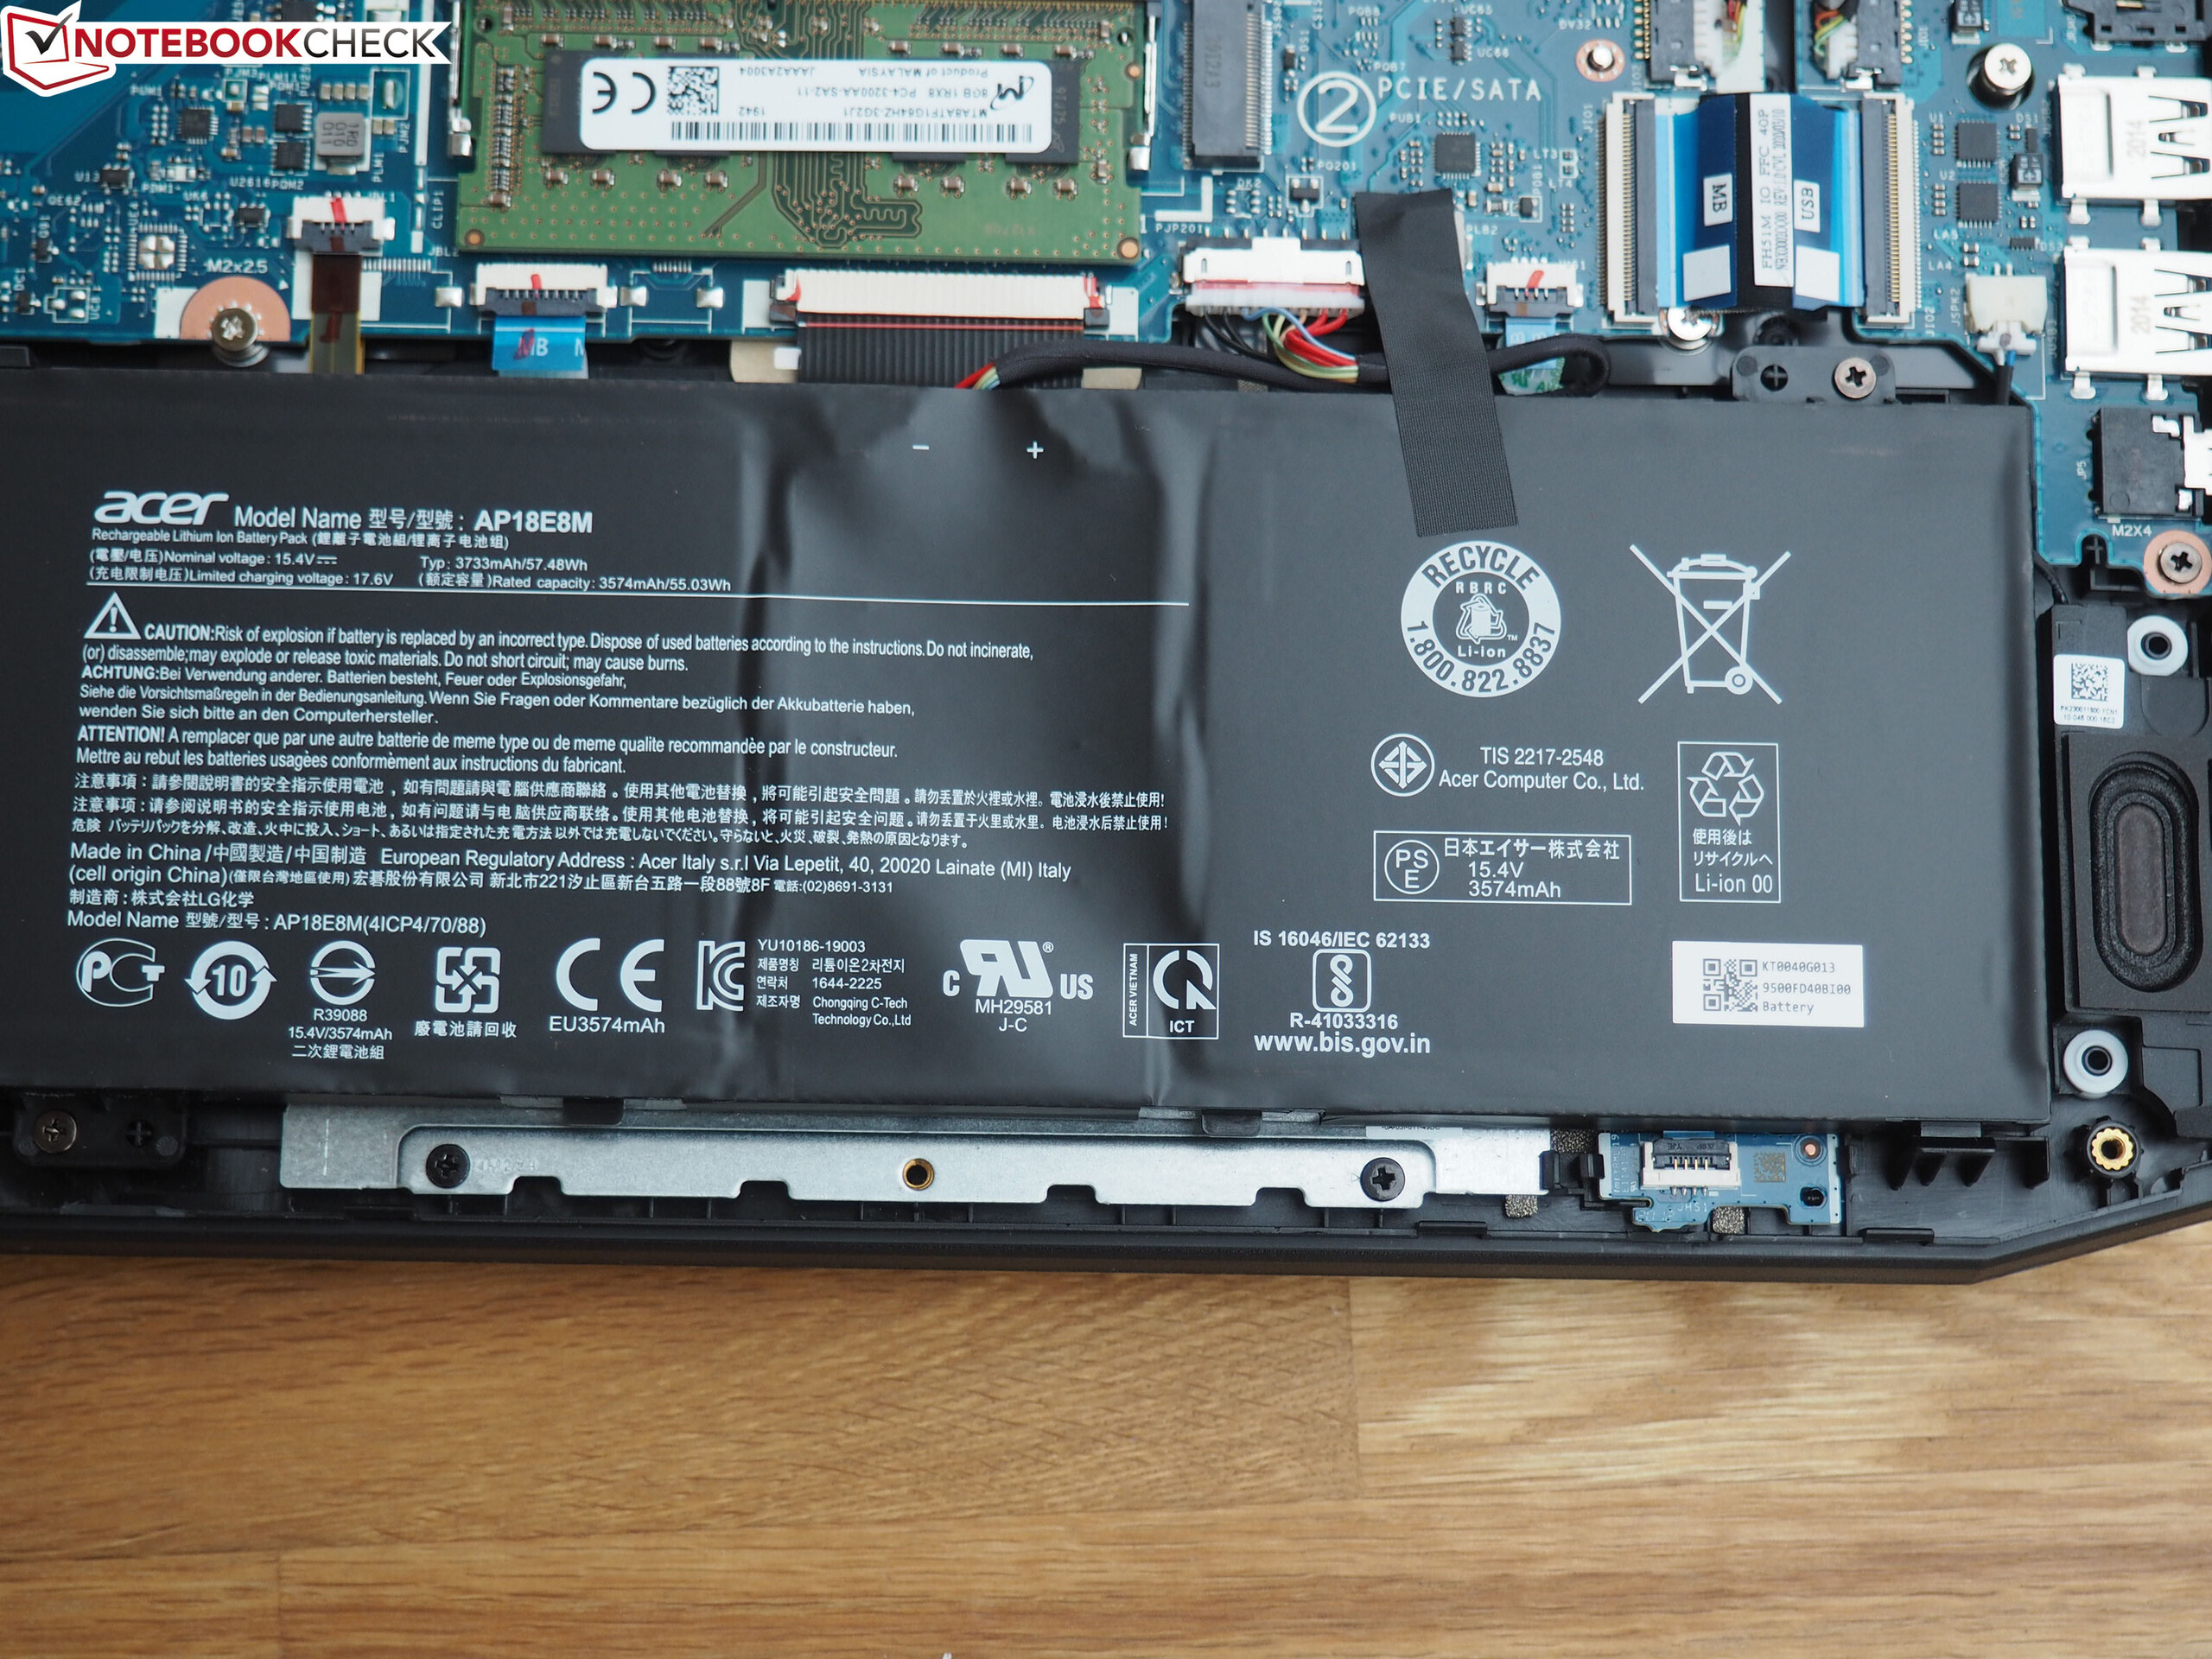
| Acer Nitro 5 AN515-44-R5FT R5 4600H, GeForce GTX 1650 Ti Mobile, 57.48 Wh | Dell G5 15 5590-PCNJJ i5-9300H, GeForce GTX 1650 Mobile, 60 Wh | HP Omen 15-dc1020ng i5-9300H, GeForce GTX 1650 Mobile, 52.5 Wh | Lenovo Legion Y540-15IRH-81SX00B2GE i7-9750H, GeForce GTX 1660 Ti Mobile, 57 Wh | Acer Predator Helios 300 PH315-52-79TY i7-9750H, GeForce GTX 1660 Ti Mobile, 58.75 Wh | Genomsnitt av klass Gaming | |
|---|---|---|---|---|---|---|
| Batteridrifttid | 18% | -8% | -50% | -46% | -17% | |
| Reader / Idle (h) | 13.8 | 14.5 5% | 15.9 15% | 4 -71% | 5 -64% | 8.71 ? -37% |
| WiFi v1.3 (h) | 8.7 | 8 -8% | 6.4 -26% | 2.4 -72% | 3.5 -60% | 7.04 ? -19% |
| Load (h) | 1.4 | 2.2 57% | 1.2 -14% | 1.3 -7% | 1.2 -14% | 1.47 ? 5% |
| H.264 (h) | 8 | 3.4 | 8.26 ? | |||
| Witcher 3 ultra (h) | 1 |
För
Emot
Läs den fullständiga versionen av den här recensionen på engelska här.
Prismedvetna köpare, notera detta: Vi kan verkligen rekommendera AMD-utgåvan av Acer Nitro 5 med Ryzen 5 4600H och GeForce GTX 1650 Ti ur ett pris/prestanda-perspektiv.
Även om de första bärbara speldatorerna med RX 5500M och GTX 1660 Ti börjar hamna i segmentet för under 10.000-kronor och potentiellt sett kan ge högre spelprestanda skulle motsvarande prestanda kosta mycket mer på en Intel-utrustad enhet.
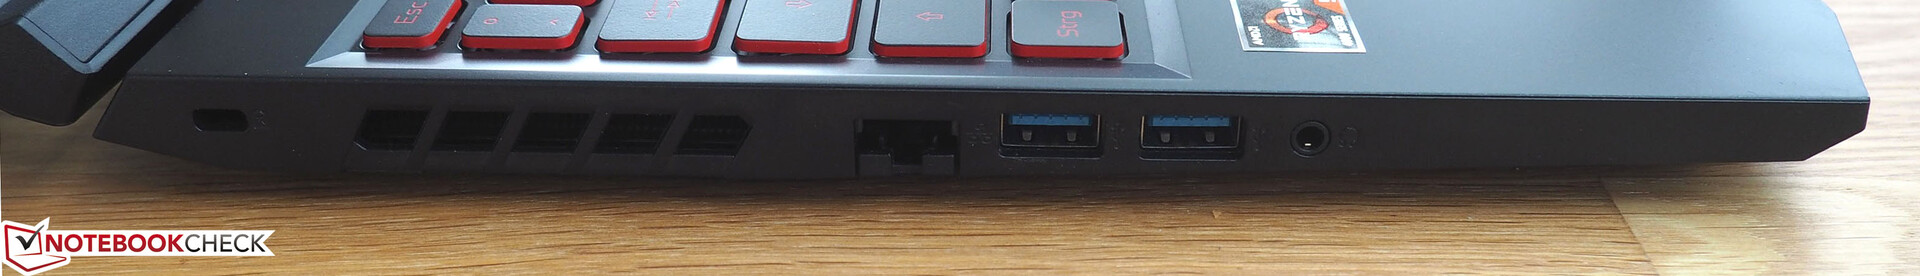
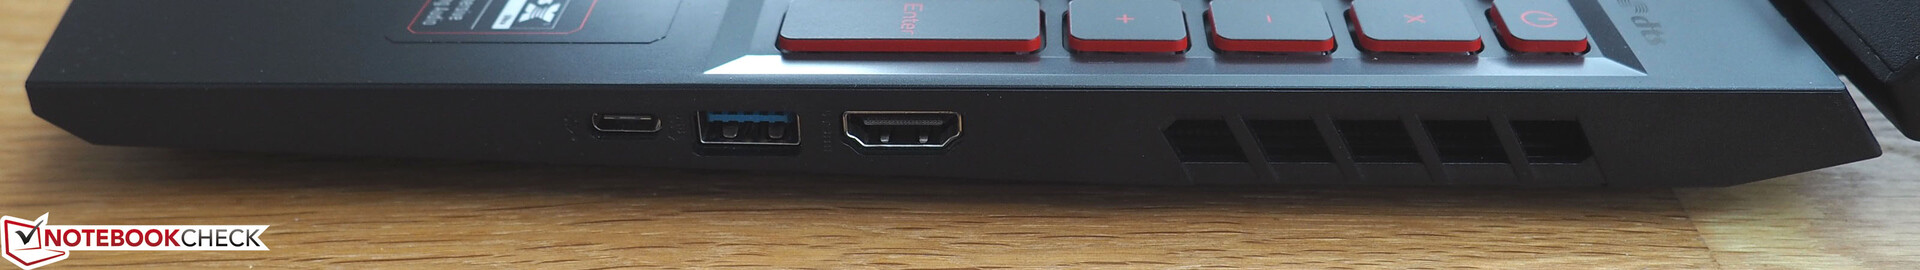
Om vi bortser från de nedskärningar Acer har behövt göra, som den mörka skärmen med lågt färgomfång eller den dåliga anslutbarheten är Nitro 5 AN515-44 en väldigt tilltalande och mångsidig budgetenhet. Tack vare lång batteritid, jämförelsevis låg vikt och ett kompakt hölje kan den till och med betraktas som en aning portabel.
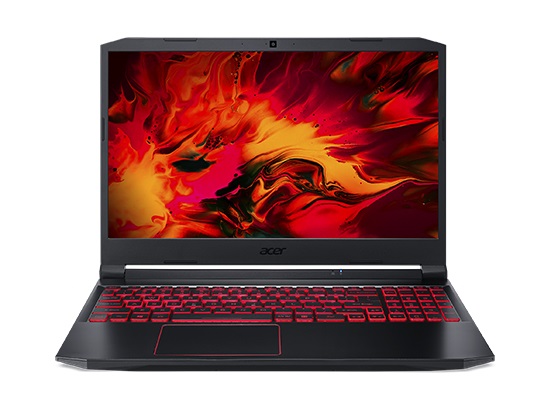
Acer Nitro 5 AN515-44-R5FT
- 06/27/2020 v7 (old)
Florian Glaser
Price comparison