Test: Dell Alienware m15 R2 - Mini me-versionen av Area-51m (Sammanfattning)
| |||||||||||||||||||||||||
Distribution av ljusstyrkan: 90 %
Mitt på batteriet: 324.2 cd/m²
Kontrast: 853:1 (Svärta: 0.38 cd/m²)
ΔE ColorChecker Calman: 5.01 | ∀{0.5-29.43 Ø4.73}
calibrated: 1.64
ΔE Greyscale Calman: 7.9 | ∀{0.09-98 Ø4.97}
95.5% sRGB (Argyll 1.6.3 3D)
60.8% AdobeRGB 1998 (Argyll 1.6.3 3D)
65.9% AdobeRGB 1998 (Argyll 3D)
95.1% sRGB (Argyll 3D)
65.3% Display P3 (Argyll 3D)
Gamma: 2.35
CCT: 8455 K
| Alienware m15 R2 P87F Sharp LQ156M1, IPS, 15.6", 1920x1080 | Razer Blade 15 RTX 2080 Max-Q Sharp LQ156M1JW03 (SHP14C5), IPS, 15.6", 1920x1080 | Asus Zephyrus S GX531GX AU Optronics B156HAN08.2, IPS, 15.6", 1920x1080 | MSI GS65 Stealth 9SG Sharp LQ156M1JW03 (SHP14C5), IPS, 15.6", 1920x1080 | Lenovo Legion Y740-15ICHg LP156WFG-SPB2, IPS, 15.6", 1920x1080 | Alienware m15 GTX 1070 Max-Q AU Optronics B156HAN, IPS, 15.6", 1920x1080 | |
|---|---|---|---|---|---|---|
| Display | 3% | -0% | 4% | -3% | -4% | |
| Display P3 Coverage (%) | 65.3 | 66.9 2% | 65.6 0% | 67.6 4% | 63.5 -3% | 63.5 -3% |
| sRGB Coverage (%) | 95.1 | 98.1 3% | 92.2 -3% | 97.5 3% | 92.4 -3% | 89.4 -6% |
| AdobeRGB 1998 Coverage (%) | 65.9 | 68.5 4% | 66.9 2% | 68.9 5% | 64.7 -2% | 64.5 -2% |
| Response Times | 2% | 24% | -10% | -33% | -23% | |
| Response Time Grey 50% / Grey 80% * (ms) | 16.4 ? | 12.8 ? 22% | 7 ? 57% | 13.6 ? 17% | 18.8 ? -15% | 18 ? -10% |
| Response Time Black / White * (ms) | 8.8 ? | 10.4 ? -18% | 9.6 ? -9% | 12 ? -36% | 13.2 ? -50% | 12 ? -36% |
| PWM Frequency (Hz) | 23810 ? | 23810 ? | 23260 ? | |||
| Screen | 24% | 13% | 25% | 6% | 5% | |
| Brightness middle (cd/m²) | 324.2 | 293 -10% | 323.6 0% | 282.3 -13% | 320.4 -1% | 353.6 9% |
| Brightness (cd/m²) | 304 | 270 -11% | 315 4% | 269 -12% | 298 -2% | 346 14% |
| Brightness Distribution (%) | 90 | 87 -3% | 91 1% | 90 0% | 85 -6% | 86 -4% |
| Black Level * (cd/m²) | 0.38 | 0.29 24% | 0.29 24% | 0.32 16% | 0.42 -11% | 0.3 21% |
| Contrast (:1) | 853 | 1010 18% | 1116 31% | 882 3% | 763 -11% | 1179 38% |
| Colorchecker dE 2000 * | 5.01 | 1.69 66% | 3.31 34% | 1.17 77% | 3.21 36% | 4.55 9% |
| Colorchecker dE 2000 max. * | 12.7 | 3.37 73% | 5.74 55% | 3.29 74% | 5.54 56% | 7.91 38% |
| Colorchecker dE 2000 calibrated * | 1.64 | 1.24 24% | 2.73 -66% | 1.06 35% | 2.36 -44% | 3.37 -105% |
| Greyscale dE 2000 * | 7.9 | 2.3 71% | 2.9 63% | 1.3 84% | 3.6 54% | 4.1 48% |
| Gamma | 2.35 94% | 2.3 96% | 2.29 96% | 2.2 100% | 2.27 97% | 2.27 97% |
| CCT | 8455 77% | 6758 96% | 6765 96% | 6643 98% | 6503 100% | 7434 87% |
| Color Space (Percent of AdobeRGB 1998) (%) | 60.8 | 63 4% | 59.7 -2% | 63.8 5% | 59 -3% | 57.9 -5% |
| Color Space (Percent of sRGB) (%) | 95.5 | 98.5 3% | 91.8 -4% | 97.5 2% | 92 -4% | 88.9 -7% |
| Totalt genomsnitt (program/inställningar) | 10% /
17% | 12% /
12% | 6% /
17% | -10% /
-1% | -7% /
-0% |
* ... mindre är bättre
Visa svarstider
| ↔ Svarstid svart till vitt | ||
|---|---|---|
| 8.8 ms ... stiga ↗ och falla ↘ kombinerat | ↗ 4.4 ms stiga | 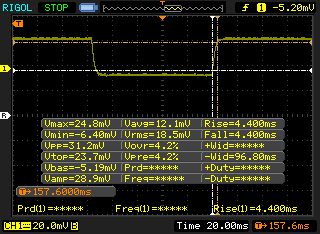 |
| ↘ 4.4 ms hösten | ||
| Skärmen visar snabba svarsfrekvenser i våra tester och bör passa för spel. I jämförelse sträcker sig alla testade enheter från 0.1 (minst) till 240 (maximalt) ms. » 24 % av alla enheter är bättre. Det betyder att den uppmätta svarstiden är bättre än genomsnittet av alla testade enheter (19.9 ms). | ||
| ↔ Svarstid 50 % grått till 80 % grått | ||
| 16.4 ms ... stiga ↗ och falla ↘ kombinerat | ↗ 7.6 ms stiga | 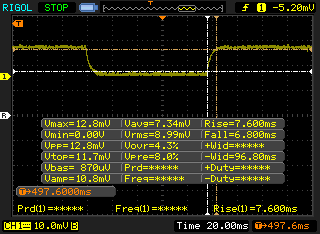 |
| ↘ 6.8 ms hösten | ||
| Skärmen visar bra svarsfrekvens i våra tester, men kan vara för långsam för konkurrenskraftiga spelare. I jämförelse sträcker sig alla testade enheter från 0.165 (minst) till 636 (maximalt) ms. » 30 % av alla enheter är bättre. Det betyder att den uppmätta svarstiden är bättre än genomsnittet av alla testade enheter (31.1 ms). | ||
Skärmflimmer / PWM (Puls-Width Modulation)
| Skärmflimmer / PWM upptäckt | 23810 Hz | ≤ 24 % ljusstyrka inställning | 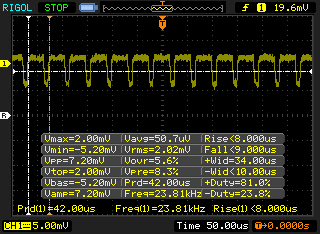 |
Displayens bakgrundsbelysning flimrar vid 23810 Hz (i värsta fall, t.ex. med PWM) Flimrande upptäckt vid en ljusstyrkeinställning på 24 % och lägre. Det ska inte finnas något flimmer eller PWM över denna ljusstyrkeinställning. Frekvensen för 23810 Hz är ganska hög, så de flesta användare som är känsliga för PWM bör inte märka något flimmer. Som jämförelse: 52 % av alla testade enheter använder inte PWM för att dämpa skärmen. Om PWM upptäcktes mättes ett medelvärde av 7784 (minst: 5 - maximum: 343500) Hz. | |||
| Cinebench R15 | |
| CPU Single 64Bit | |
| Alienware Area-51m i9-9900K RTX 2080 | |
| Eurocom Nightsky RX15 | |
| Alienware m17 P37E | |
| MSI GE75 9SG | |
| Genomsnitt Intel Core i7-9750H (170 - 194, n=82) | |
| Alienware m15 R2 P87F | |
| MSI GF63 8RC-040XPL | |
| Lenovo Legion Y540-17IRH | |
| Alienware m15 P79F | |
| Asus VivoBook S15 S532F | |
| Asus FX503VM-EH73 | |
| Asus ROG Zephyrus G15 GA502DU | |
| CPU Multi 64Bit | |
| Alienware Area-51m i9-9900K RTX 2080 | |
| Eurocom Nightsky RX15 | |
| MSI GE75 9SG | |
| Alienware m17 P37E | |
| Alienware m15 P79F | |
| Genomsnitt Intel Core i7-9750H (952 - 1306, n=85) | |
| Alienware m15 R2 P87F | |
| Lenovo Legion Y540-17IRH | |
| MSI GF63 8RC-040XPL | |
| Asus ROG Zephyrus G15 GA502DU | |
| Asus FX503VM-EH73 | |
| Asus VivoBook S15 S532F | |
| PCMark 8 Home Score Accelerated v2 | 4207 poäng | |
| PCMark 8 Work Score Accelerated v2 | 5706 poäng | |
| PCMark 10 Score | 5374 poäng | |
Hjälp | ||
| Alienware m15 R2 P87F 2x Toshiba XG6 KXG60ZNV512G (RAID 0) | Alienware m15 P79F Toshiba XG5 KXG50ZNV512G | Razer Blade 15 RTX 2080 Max-Q Samsung SSD PM981 MZVLB512HAJQ | Asus Zephyrus S GX531GX Intel SSD 660p SSDPEKNW512G8 | MSI GS65 Stealth 9SG Samsung SSD PM981 MZVLB512HAJQ | Dell Latitude 7400 2-in-1 Toshiba XG6 KXG60ZNV512G | |
|---|---|---|---|---|---|---|
| AS SSD | -12% | 12% | -26% | 20% | -49% | |
| Seq Read (MB/s) | 1925 | 1937 1% | 1832 -5% | 1239 -36% | 2005 4% | 2289 19% |
| Seq Write (MB/s) | 2371 | 1066 -55% | 1864 -21% | 920 -61% | 1580 -33% | 1163 -51% |
| 4K Read (MB/s) | 37.2 | 31.76 -15% | 52.1 40% | 45.74 23% | 49.33 33% | 22.29 -40% |
| 4K Write (MB/s) | 108.9 | 102.6 -6% | 108.3 -1% | 95.7 -12% | 103.8 -5% | 28.92 -73% |
| 4K-64 Read (MB/s) | 1177 | 1140 -3% | 1159 -2% | 322 -73% | 1241 5% | 415.6 -65% |
| 4K-64 Write (MB/s) | 1135 | 938 -17% | 1807 59% | 722 -36% | 1730 52% | 199.5 -82% |
| Access Time Read * (ms) | 0.065 | 0.058 11% | 0.05 23% | 0.073 -12% | 0.054 17% | 0.122 -88% |
| Access Time Write * (ms) | 0.108 | 0.04 63% | 0.034 69% | 0.047 56% | 0.036 67% | 0.143 -32% |
| Score Read (Points) | 1407 | 1366 -3% | 1394 -1% | 492 -65% | 1490 6% | 667 -53% |
| Score Write (Points) | 1481 | 1147 -23% | 2102 42% | 910 -39% | 1991 34% | 345 -77% |
| Score Total (Points) | 3633 | 3168 -13% | 4221 16% | 1654 -54% | 4230 16% | 1300 -64% |
| Copy ISO MB/s (MB/s) | 2073 | 946 -54% | 2083 0% | 1236 -40% | 3025 46% | 1767 -15% |
| Copy Program MB/s (MB/s) | 576 | 452.8 -21% | 496.5 -14% | 703 22% | 713 24% | 379.4 -34% |
| Copy Game MB/s (MB/s) | 1426 | 1013 -29% | 977 -31% | 812 -43% | 1554 9% | 1055 -26% |
* ... mindre är bättre

| 3DMark 11 Performance | 19885 poäng | |
| 3DMark Cloud Gate Standard Score | 33900 poäng | |
| 3DMark Fire Strike Score | 17504 poäng | |
| 3DMark Time Spy Score | 7785 poäng | |
Hjälp | ||
| låg | med. | hög | ultra | |
|---|---|---|---|---|
| BioShock Infinite (2013) | 314.6 | 273.1 | 251.7 | 166.5 |
| The Witcher 3 (2015) | 274.5 | 215.4 | 144.5 | 81.3 |
| Rocket League (2017) | 248.7 | 239.3 | 218.5 | |
| Shadow of the Tomb Raider (2018) | 114 | 91 | 89 | 87 |
| Alienware m15 R2 P87F GeForce RTX 2080 Max-Q, i7-9750H, 2x Toshiba XG6 KXG60ZNV512G (RAID 0) | Alienware m15 P79F GeForce RTX 2070 Max-Q, i7-8750H, Toshiba XG5 KXG50ZNV512G | Razer Blade 15 RTX 2080 Max-Q GeForce RTX 2080 Max-Q, i7-9750H, Samsung SSD PM981 MZVLB512HAJQ | Asus Zephyrus S GX531GX GeForce RTX 2080 Max-Q, i7-8750H, Intel SSD 660p SSDPEKNW512G8 | MSI GS65 Stealth 9SG GeForce RTX 2080 Max-Q, i7-9750H, Samsung SSD PM981 MZVLB512HAJQ | Lenovo Legion Y740-15ICHg GeForce RTX 2070 Max-Q, i7-8750H, Samsung SSD PM981 MZVLB256HAHQ | |
|---|---|---|---|---|---|---|
| Noise | -4% | 14% | 1% | 8% | 10% | |
| av / miljö * (dB) | 28.3 | 28.2 -0% | 28.3 -0% | 28.7 -1% | 28.3 -0% | 28 1% |
| Idle Minimum * (dB) | 28.5 | 30.3 -6% | 28.8 -1% | 29.8 -5% | 30.4 -7% | 32.6 -14% |
| Idle Average * (dB) | 28.5 | 35.4 -24% | 28.8 -1% | 32.4 -14% | 30.5 -7% | 32.7 -15% |
| Idle Maximum * (dB) | 49 | 50.3 -3% | 29 41% | 38 22% | 30.6 38% | 32.7 33% |
| Load Average * (dB) | 49 | 50.3 -3% | 33.5 32% | 38.2 22% | 37.6 23% | 33.3 32% |
| Witcher 3 ultra * (dB) | 49 | 50.2 -2% | 45 8% | 56.6 -16% | 46 6% | 41.6 15% |
| Load Maximum * (dB) | 55 | 50.2 9% | 45.2 18% | 56.6 -3% | 55.1 -0% | 45.2 18% |
* ... mindre är bättre
Ljudnivå
| Låg belastning |
| 28.5 / 28.5 / 49 dB(A) |
| Hög belastning |
| 49 / 55 dB(A) |
 | ||
30 dB tyst 40 dB(A) hörbar 50 dB(A) högt ljud |
||
min: | ||
(-) Den maximala temperaturen på ovansidan är 53.8 °C / 129 F, jämfört med genomsnittet av 40.4 °C / 105 F , allt från 21.2 till 68.8 °C för klassen Gaming.
(-) Botten värms upp till maximalt 58 °C / 136 F, jämfört med genomsnittet av 43.2 °C / 110 F
(+) Vid tomgångsbruk är medeltemperaturen för ovansidan 28 °C / 82 F, jämfört med enhetsgenomsnittet på 33.9 °C / ### class_avg_f### F.
(±) När du spelar The Witcher 3 är medeltemperaturen för ovansidan 36.3 °C / 97 F, jämfört med enhetsgenomsnittet på 33.9 °C / ## #class_avg_f### F.
(+) Handledsstöden och pekplattan når maximal hudtemperatur (32.2 °C / 90 F) och är därför inte varma.
(-) Medeltemperaturen för handledsstödsområdet på liknande enheter var 28.8 °C / 83.8 F (-3.4 °C / -6.2 F).
Alienware m15 R2 P87F ljudanalys
(+) | högtalare kan spela relativt högt (84 dB)
Bas 100 - 315 Hz
(-) | nästan ingen bas - i genomsnitt 18.8% lägre än medianen
(±) | linjäriteten för basen är genomsnittlig (11.9% delta till föregående frekvens)
Mellan 400 - 2000 Hz
(+) | balanserad mellan - endast 4.8% från medianen
(+) | mids är linjära (6.6% delta till föregående frekvens)
Högsta 2 - 16 kHz
(+) | balanserade toppar - endast 1.3% från medianen
(±) | linjäriteten för toppar är genomsnittlig (7.4% delta till föregående frekvens)
Totalt 100 - 16 000 Hz
(±) | linjäriteten för det totala ljudet är genomsnittlig (19.8% skillnad mot median)
Jämfört med samma klass
» 69% av alla testade enheter i den här klassen var bättre, 6% liknande, 24% sämre
» Den bästa hade ett delta på 6%, genomsnittet var 18%, sämst var 132%
Jämfört med alla testade enheter
» 50% av alla testade enheter var bättre, 7% liknande, 43% sämre
» Den bästa hade ett delta på 4%, genomsnittet var 24%, sämst var 134%
Apple MacBook 12 (Early 2016) 1.1 GHz ljudanalys
(+) | högtalare kan spela relativt högt (83.6 dB)
Bas 100 - 315 Hz
(±) | reducerad bas - i genomsnitt 11.3% lägre än medianen
(±) | linjäriteten för basen är genomsnittlig (14.2% delta till föregående frekvens)
Mellan 400 - 2000 Hz
(+) | balanserad mellan - endast 2.4% från medianen
(+) | mids är linjära (5.5% delta till föregående frekvens)
Högsta 2 - 16 kHz
(+) | balanserade toppar - endast 2% från medianen
(+) | toppar är linjära (4.5% delta till föregående frekvens)
Totalt 100 - 16 000 Hz
(+) | det totala ljudet är linjärt (10.2% skillnad mot median)
Jämfört med samma klass
» 7% av alla testade enheter i den här klassen var bättre, 2% liknande, 91% sämre
» Den bästa hade ett delta på 5%, genomsnittet var 18%, sämst var 53%
Jämfört med alla testade enheter
» 5% av alla testade enheter var bättre, 1% liknande, 94% sämre
» Den bästa hade ett delta på 4%, genomsnittet var 24%, sämst var 134%
| Av/Standby | |
| Låg belastning | |
| Hög belastning |
|
Förklaring:
min: | |
| Alienware m15 R2 P87F i7-9750H, GeForce RTX 2080 Max-Q, 2x Toshiba XG6 KXG60ZNV512G (RAID 0), IPS, 1920x1080, 15.6" | Alienware m15 P79F i7-8750H, GeForce RTX 2070 Max-Q, Toshiba XG5 KXG50ZNV512G, OLED, 3840x2160, 15.6" | Razer Blade 15 RTX 2080 Max-Q i7-9750H, GeForce RTX 2080 Max-Q, Samsung SSD PM981 MZVLB512HAJQ, IPS, 1920x1080, 15.6" | Lenovo Legion Y740-15ICHg i7-8750H, GeForce RTX 2070 Max-Q, Samsung SSD PM981 MZVLB256HAHQ, IPS, 1920x1080, 15.6" | MSI GP65 Leopard 9SE-225US i7-9750H, GeForce RTX 2060 Mobile, Toshiba KBG30ZMT512G, IPS, 1920x1080, 15.6" | Alienware 15 R3 Max-Q i7-7820HK, GeForce GTX 1080 Max-Q, LiteOn CX2-8B256, IPS, 1920x1080, 15.6" | |
|---|---|---|---|---|---|---|
| Power Consumption | 35% | 34% | 24% | 31% | 18% | |
| Idle Minimum * (Watt) | 19 | 10.9 43% | 12.5 34% | 22.9 -21% | 13.6 28% | 22 -16% |
| Idle Average * (Watt) | 40.5 | 12.3 70% | 15.3 62% | 27.2 33% | 17.9 56% | 26 36% |
| Idle Maximum * (Watt) | 52 | 19 63% | 20.7 60% | 27.5 47% | 20.6 60% | 33 37% |
| Load Average * (Watt) | 132.3 | 96 27% | 90.2 32% | 83.4 37% | 96 27% | 86 35% |
| Witcher 3 ultra * (Watt) | 183.3 | 161.7 12% | 162 12% | 143.6 22% | 154.6 16% | 159 13% |
| Load Maximum * (Watt) | 217.2 | 229.1 -5% | 209.3 4% | 160.5 26% | 218.6 -1% | 215 1% |
* ... mindre är bättre
| Alienware m15 R2 P87F i7-9750H, GeForce RTX 2080 Max-Q, 76 Wh | Alienware m15 P79F i7-8750H, GeForce RTX 2070 Max-Q, 90 Wh | Razer Blade 15 RTX 2080 Max-Q i7-9750H, GeForce RTX 2080 Max-Q, 80 Wh | Asus Zephyrus S GX531GX i7-8750H, GeForce RTX 2080 Max-Q, 50 Wh | MSI GS65 Stealth 9SG i7-9750H, GeForce RTX 2080 Max-Q, 82 Wh | Lenovo Legion Y740-15ICHg i7-8750H, GeForce RTX 2070 Max-Q, 57 Wh | |
|---|---|---|---|---|---|---|
| Batteridrifttid | -5% | 79% | -45% | 9% | -31% | |
| Reader / Idle (h) | 9.2 | 15.9 73% | 3.9 -58% | |||
| WiFi v1.3 (h) | 5.5 | 5.2 -5% | 6.6 20% | 3 -45% | 6 9% | 2.8 -49% |
| Load (h) | 0.7 | 1.7 143% | 0.8 14% |
För
Emot
Läs den fullständiga versionen av den här recensionen på engelska här.
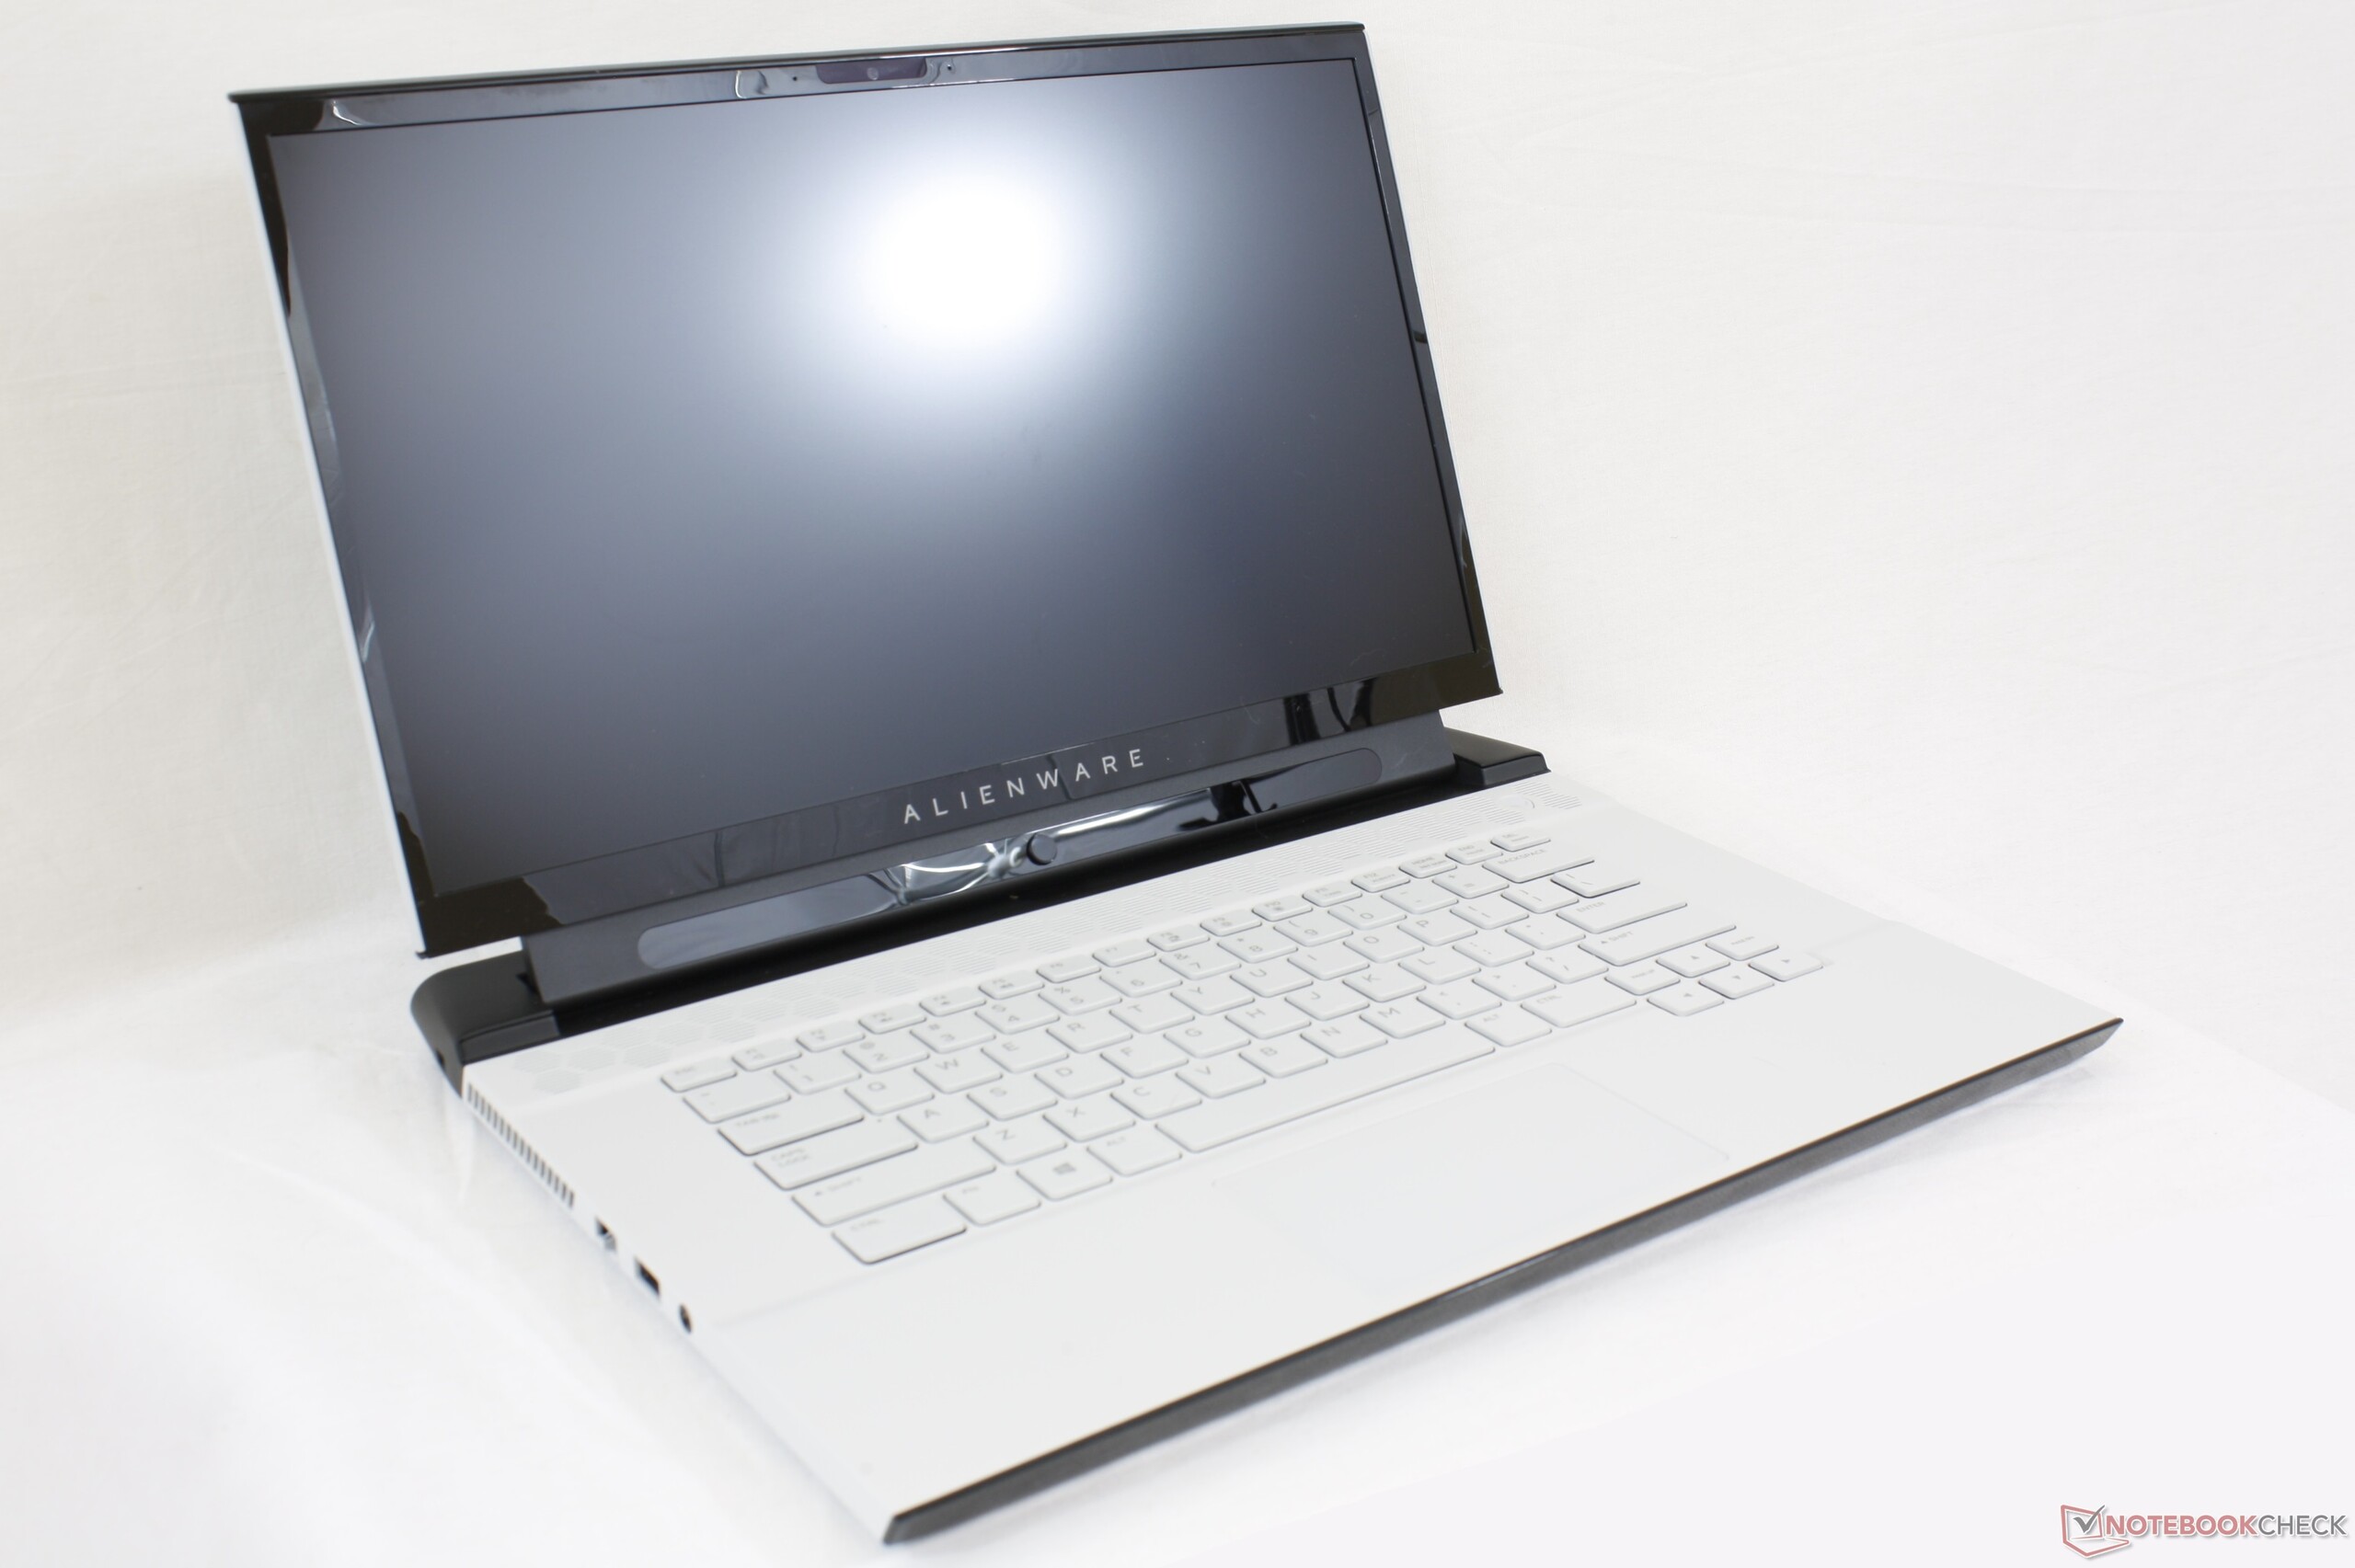
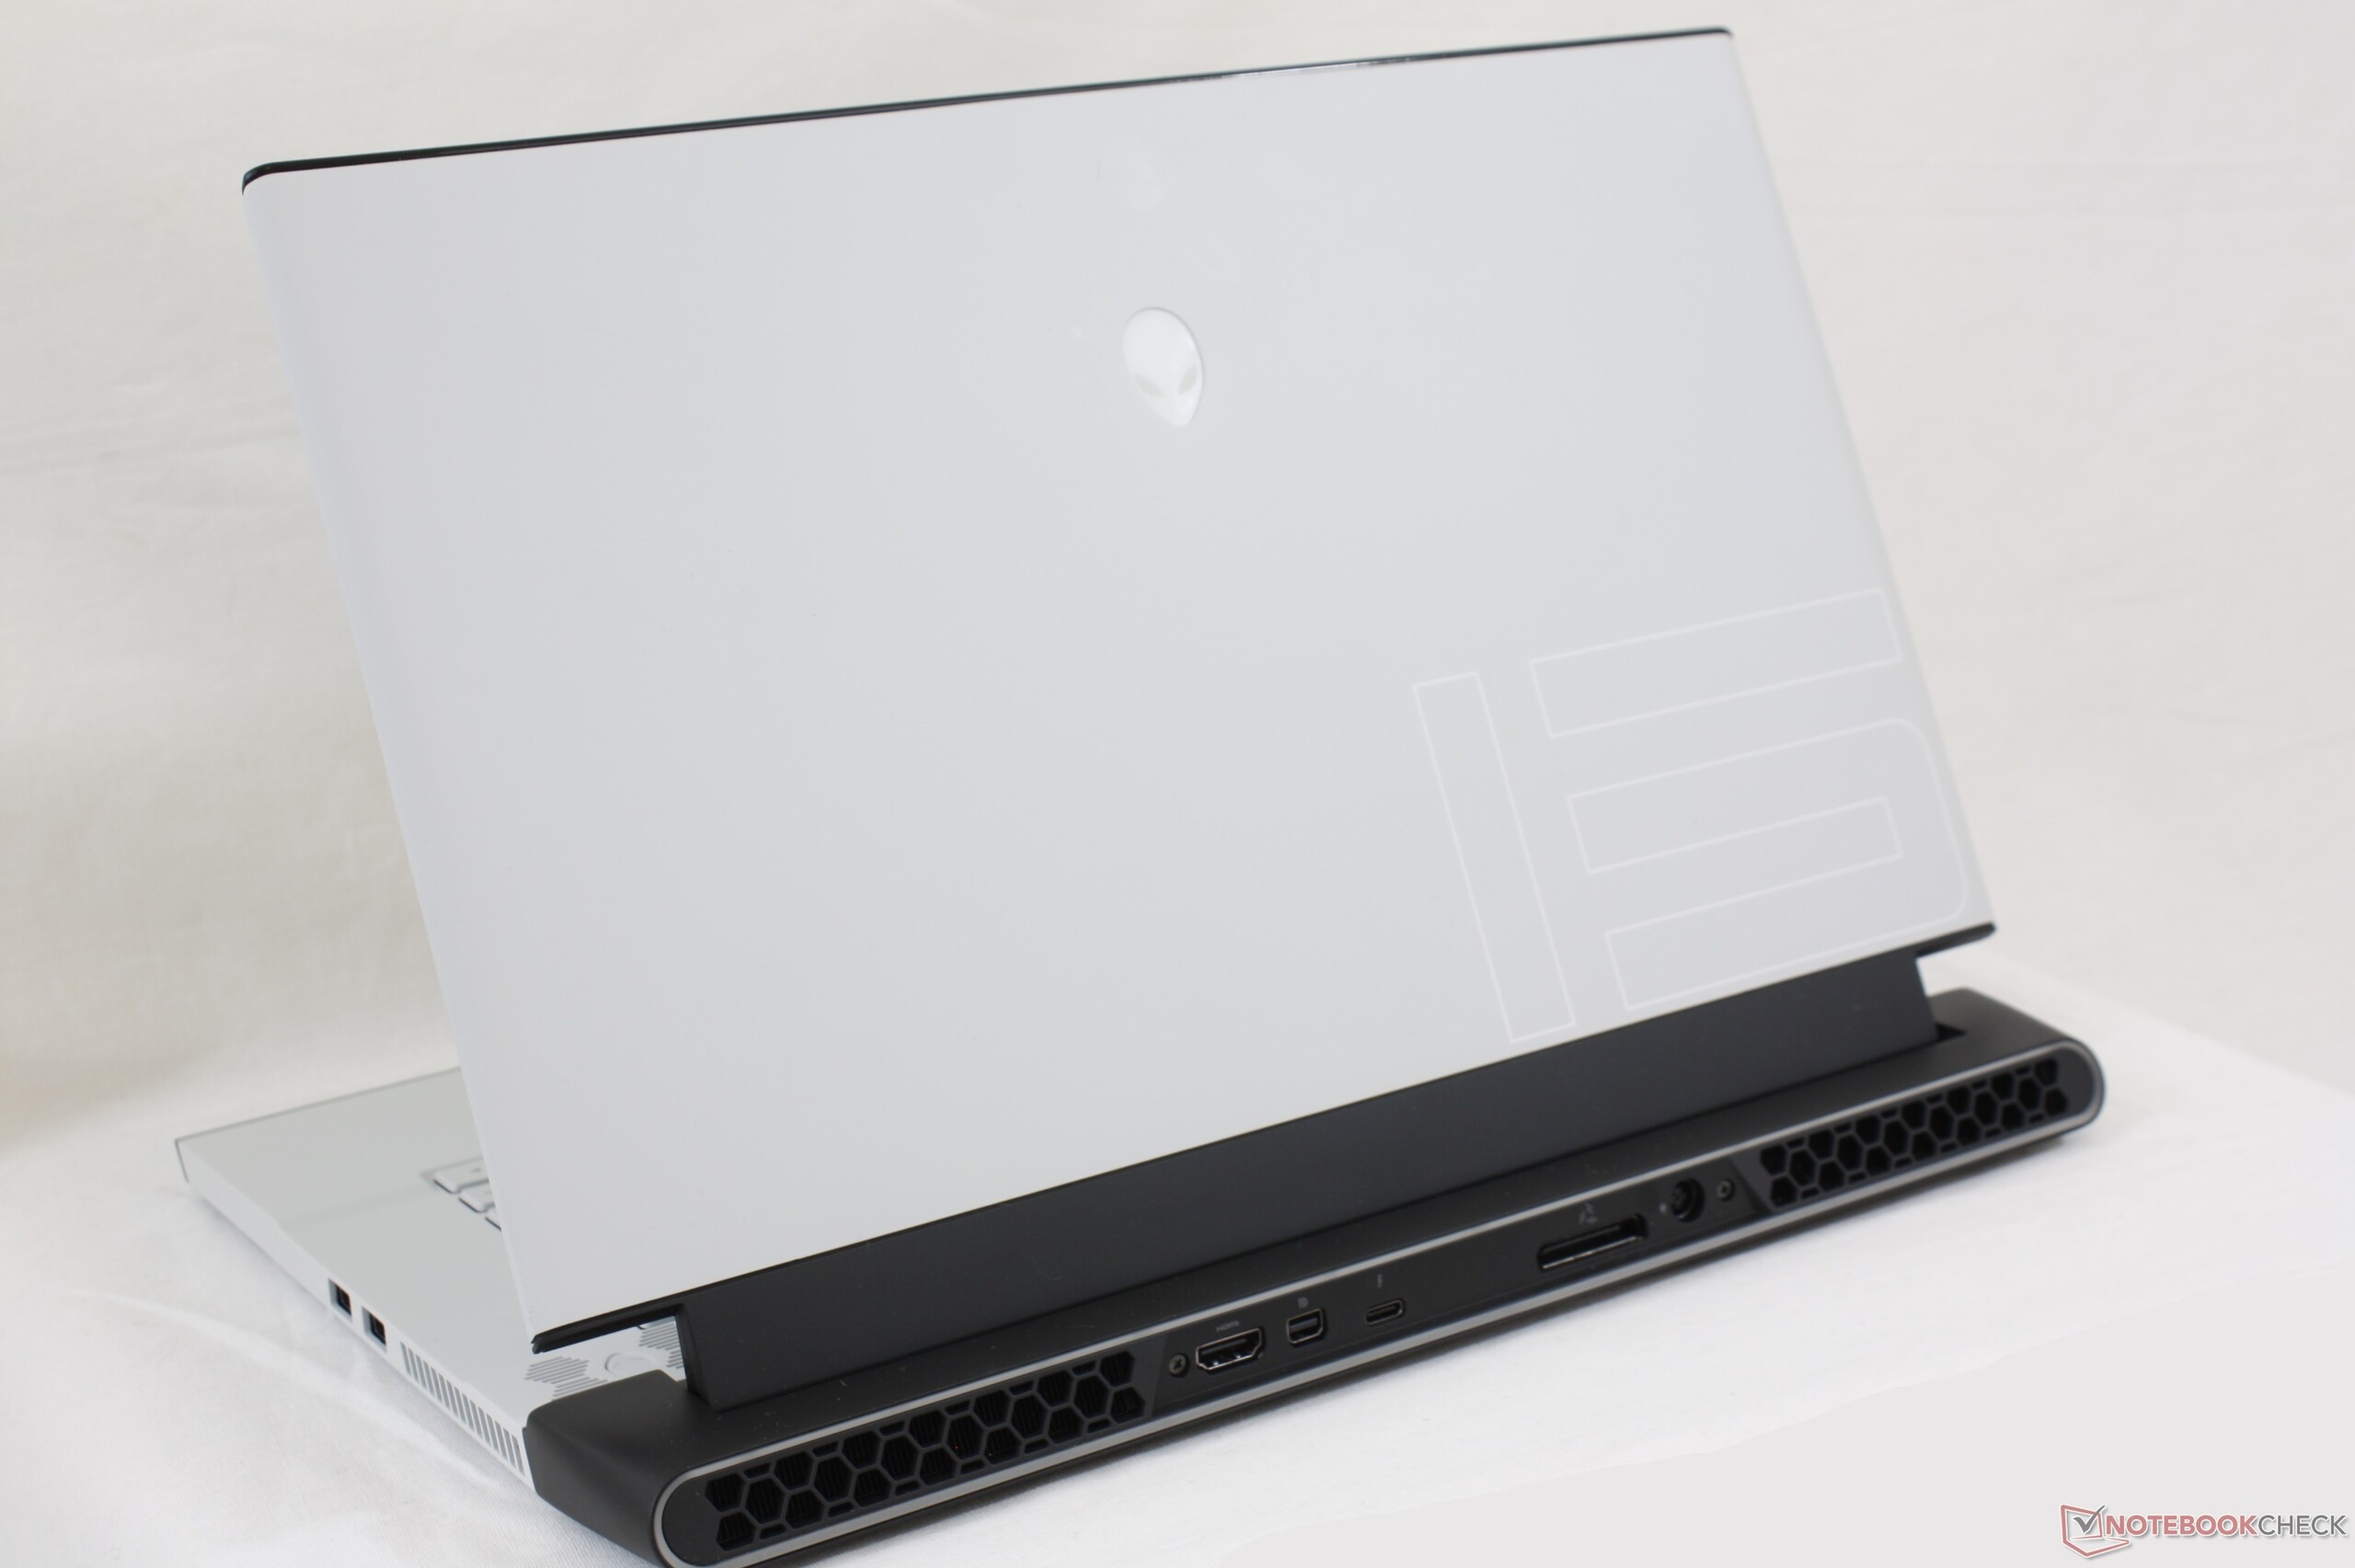
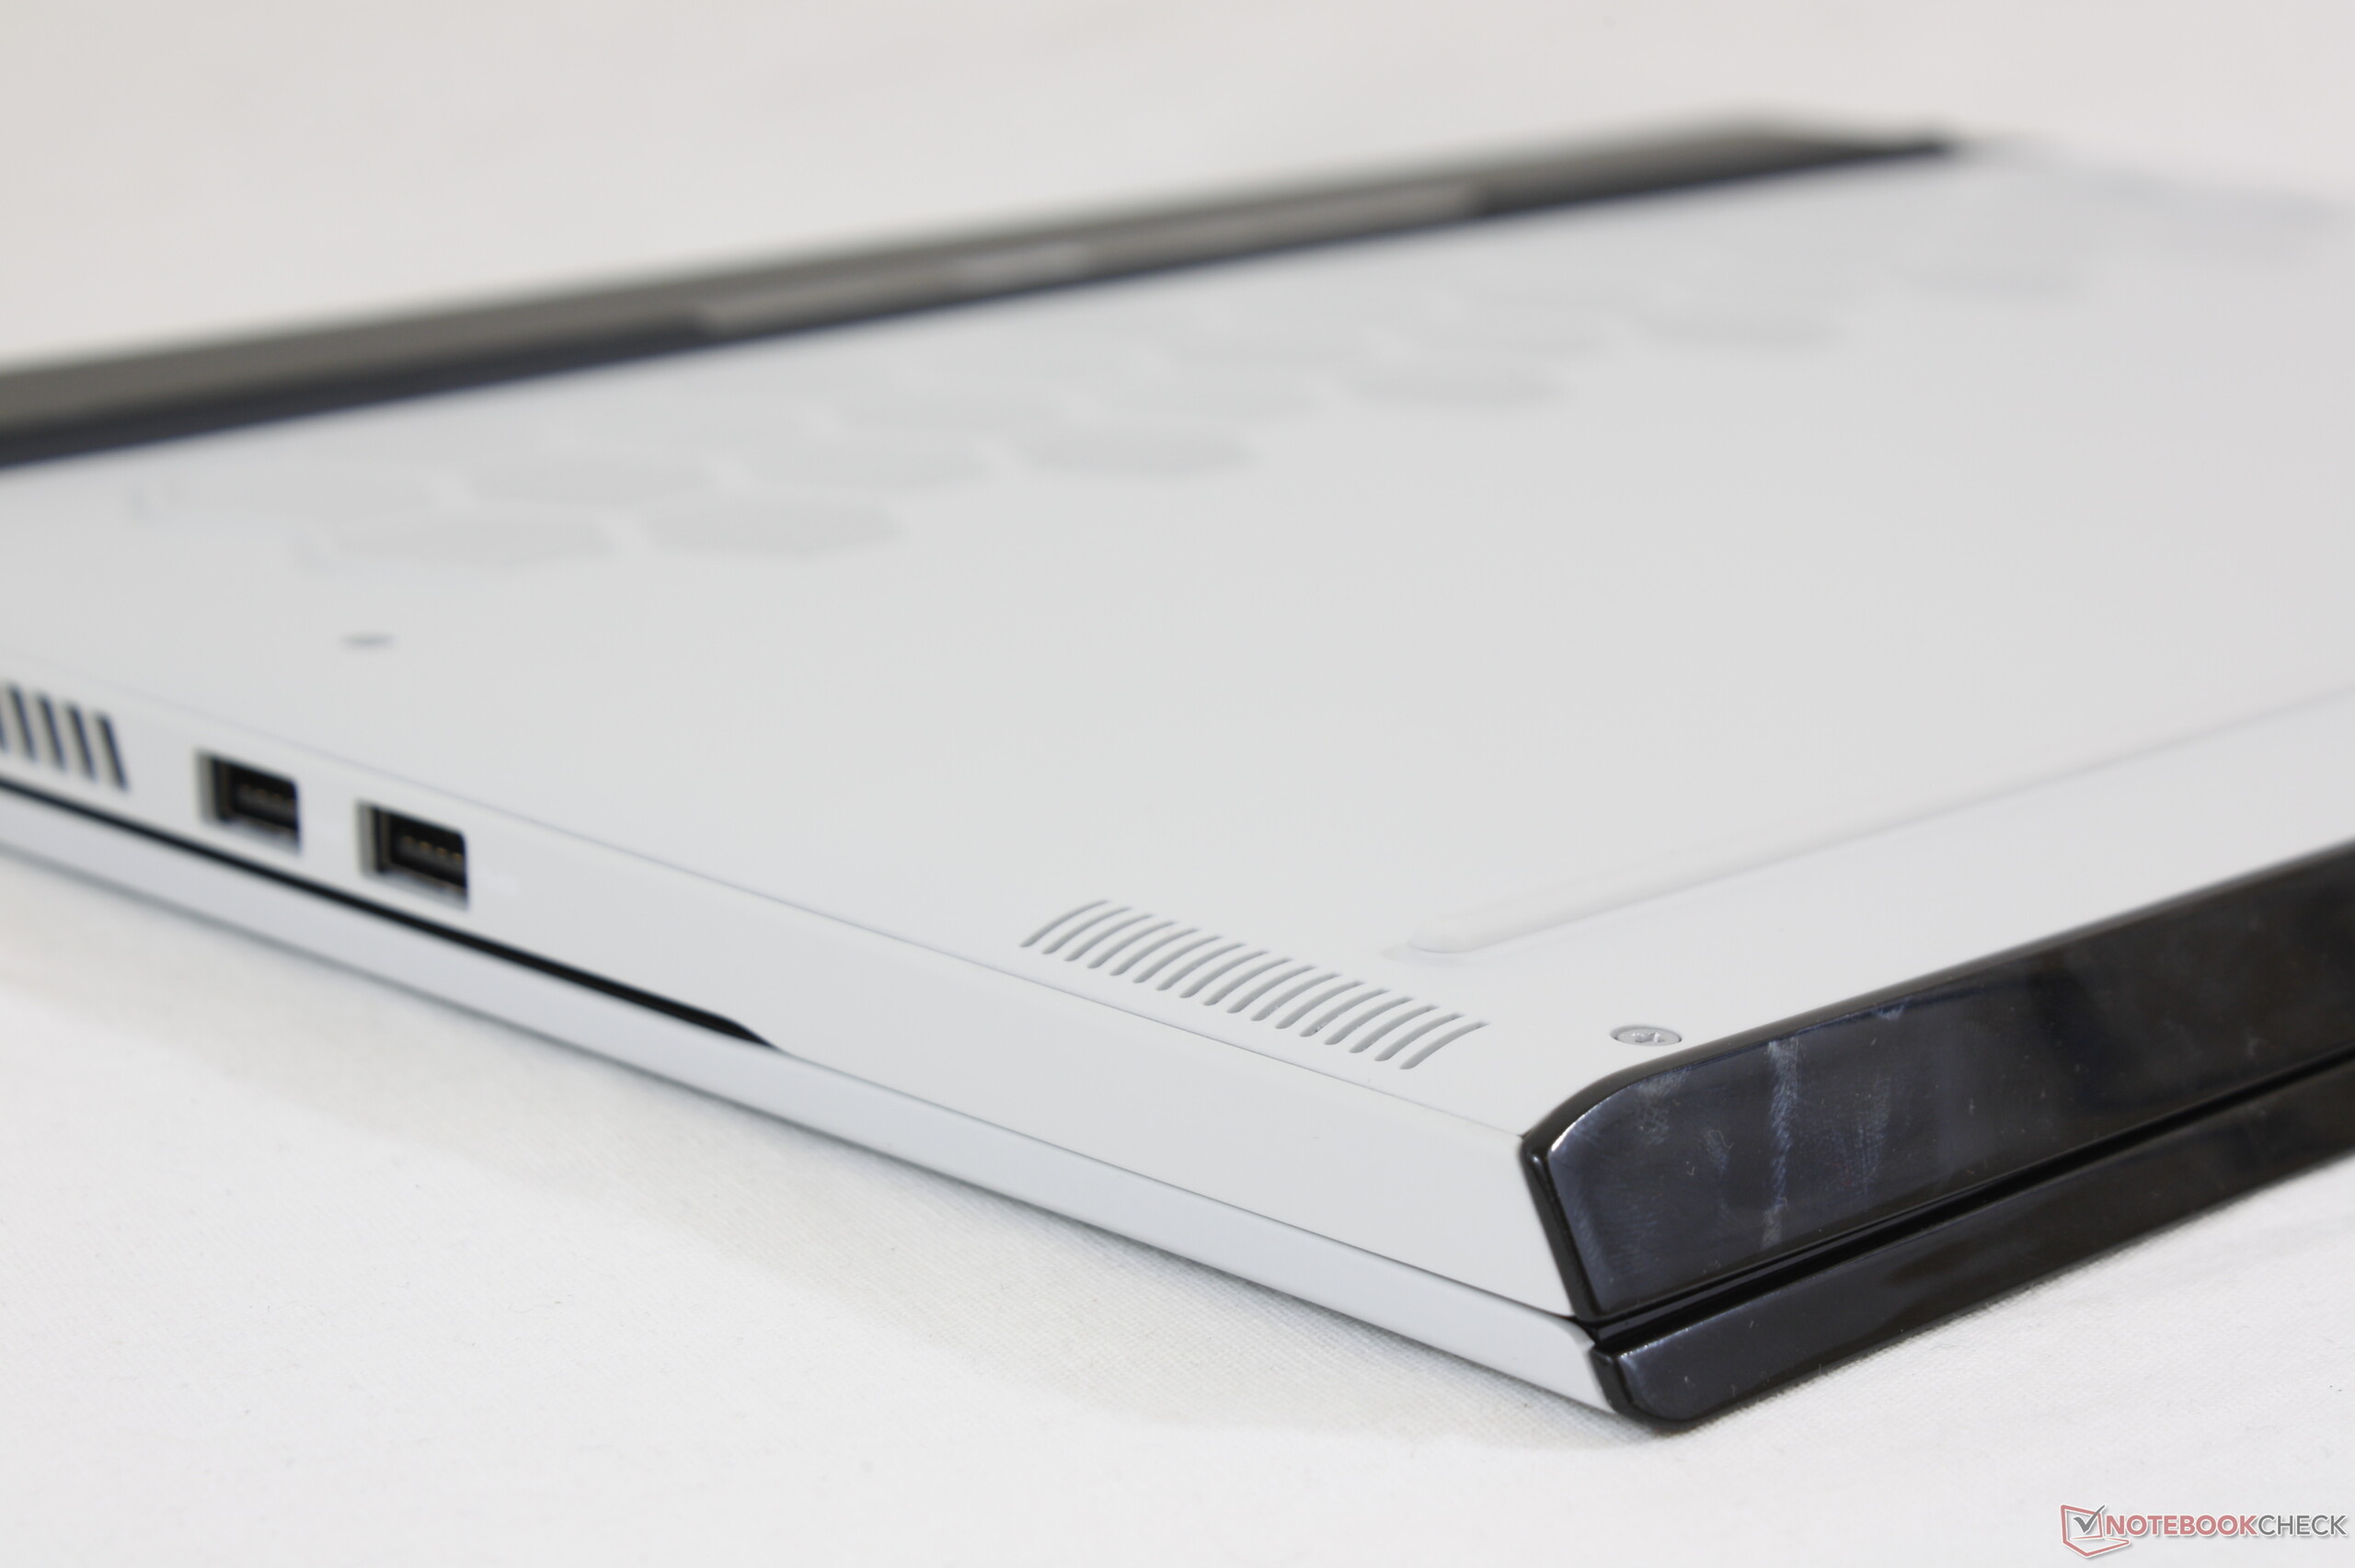
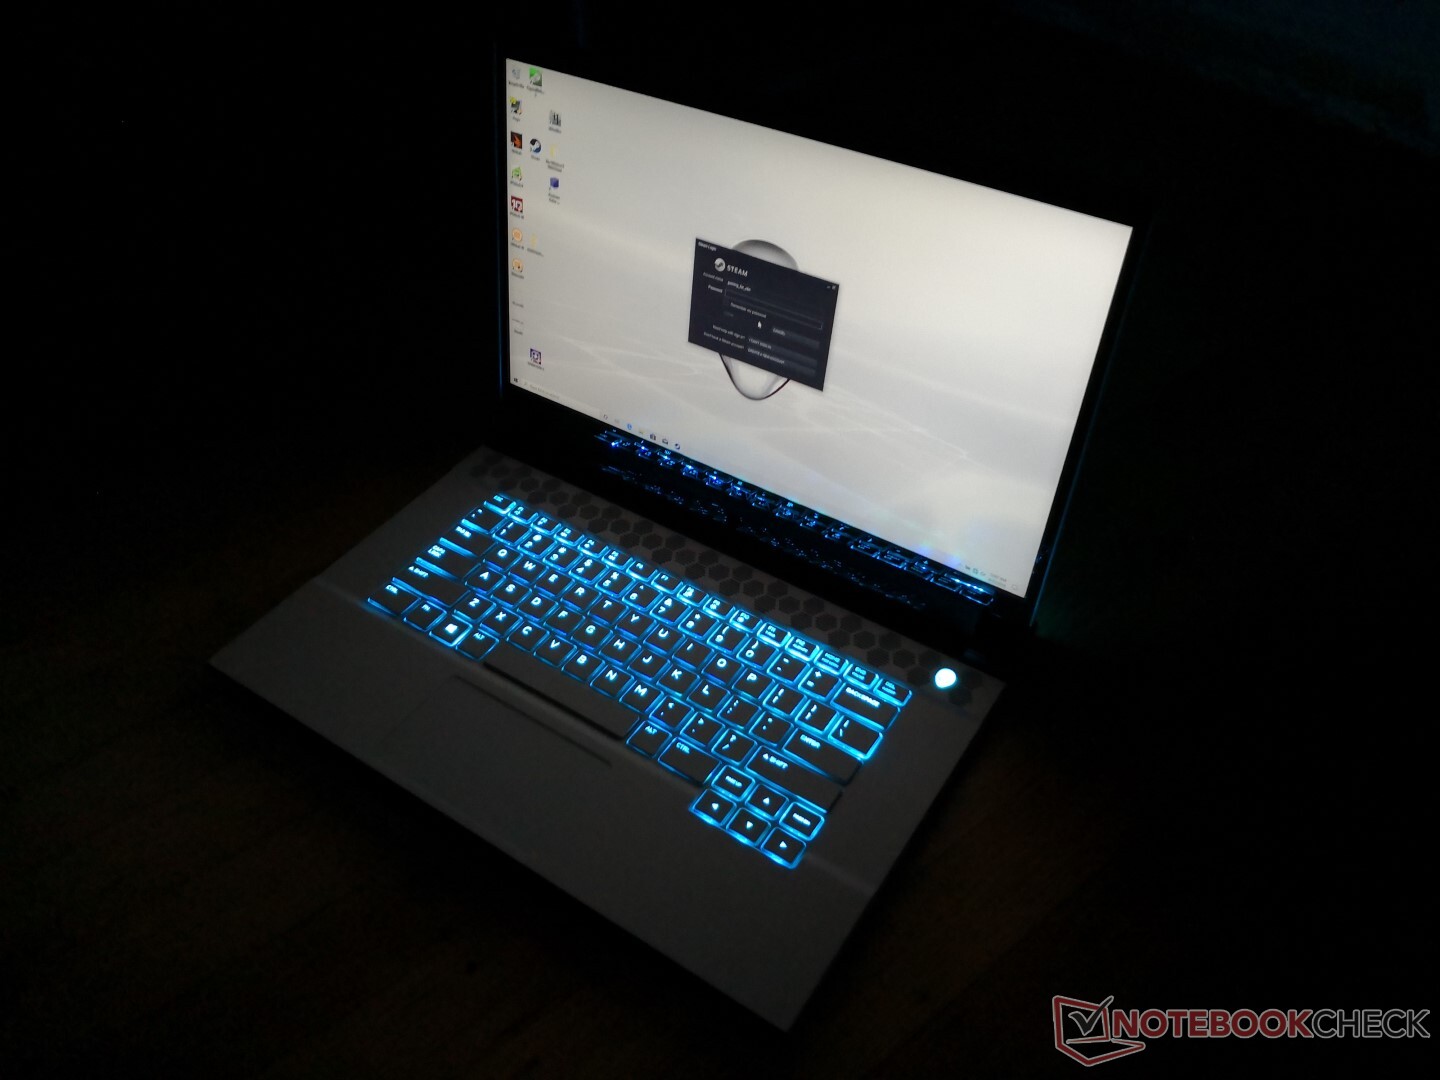
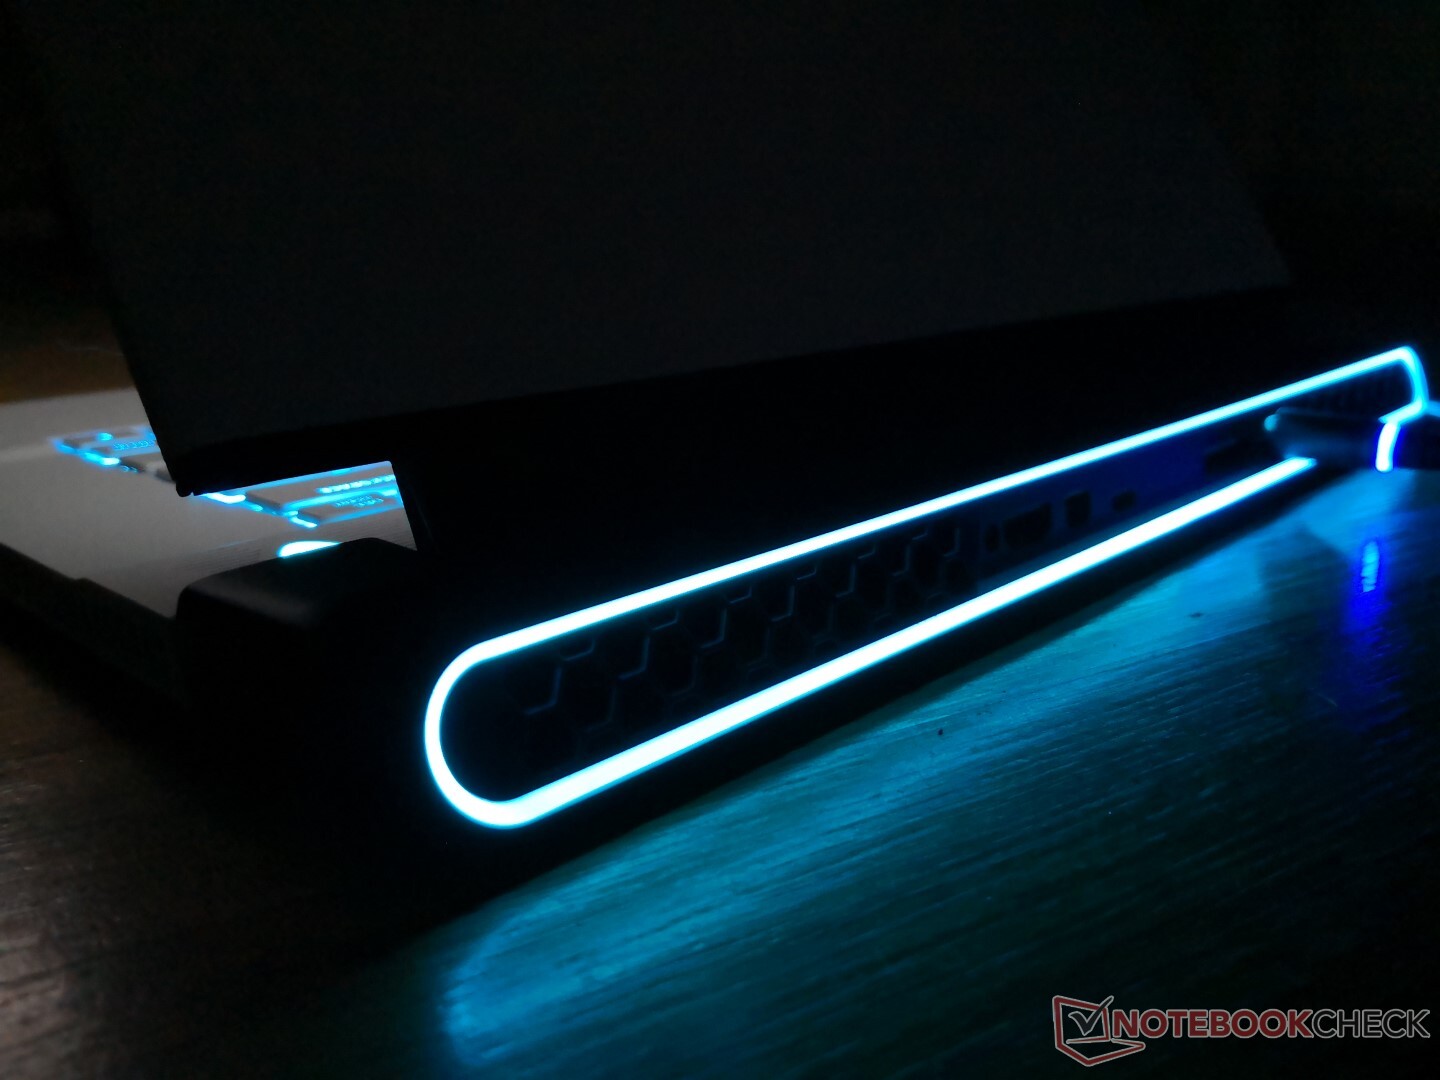
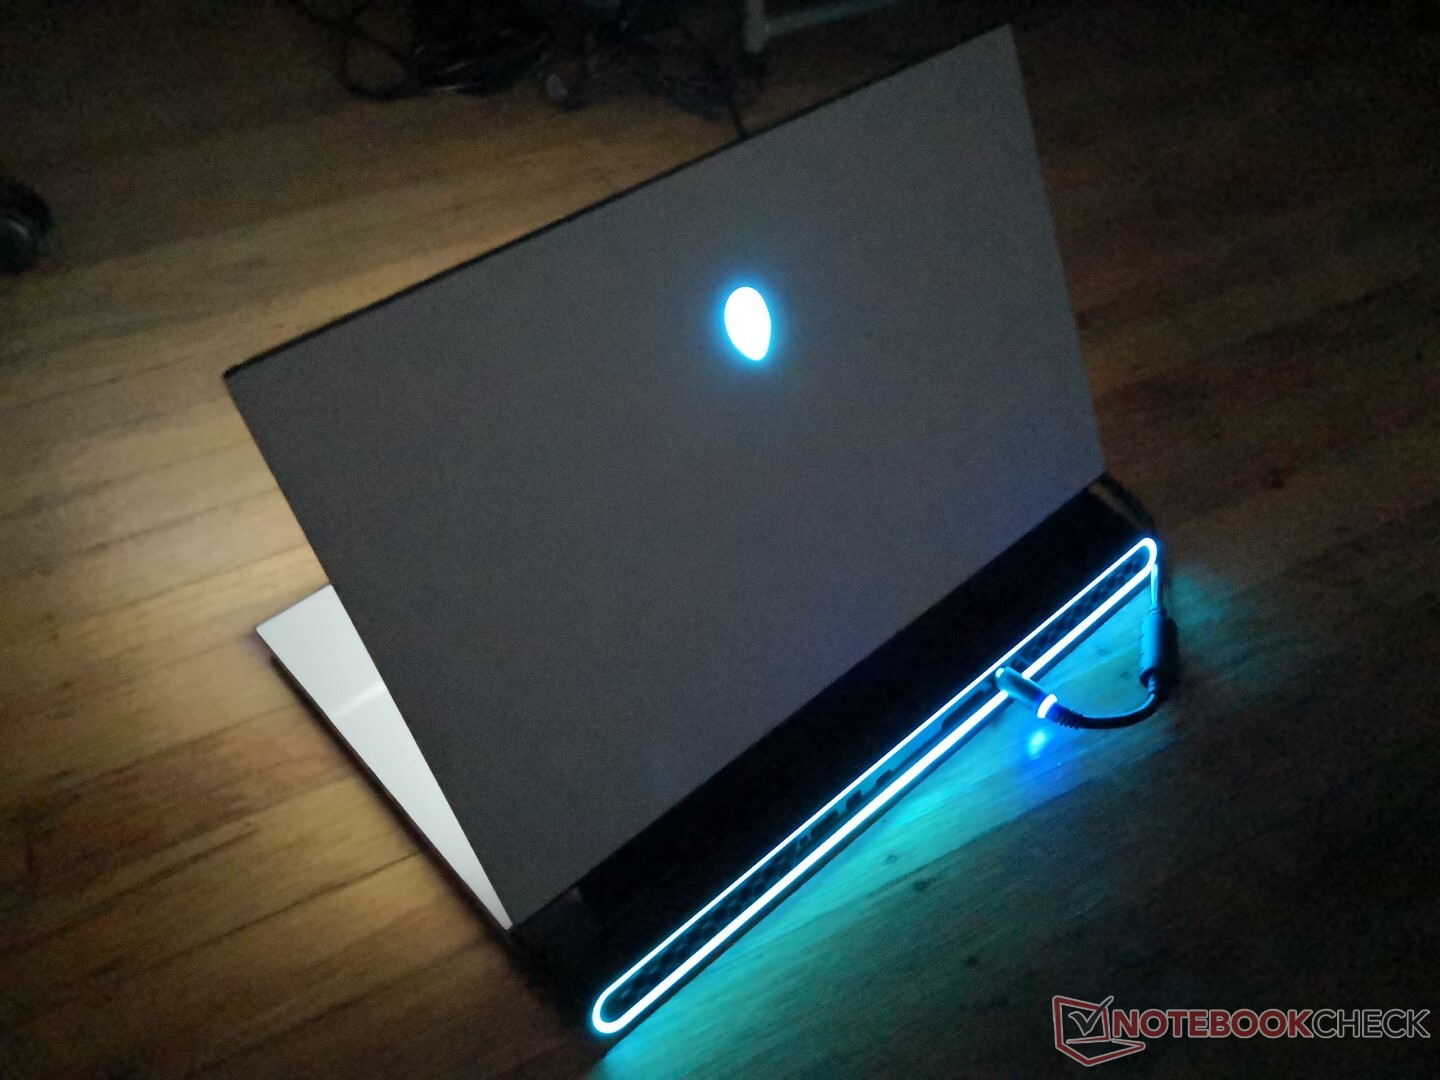
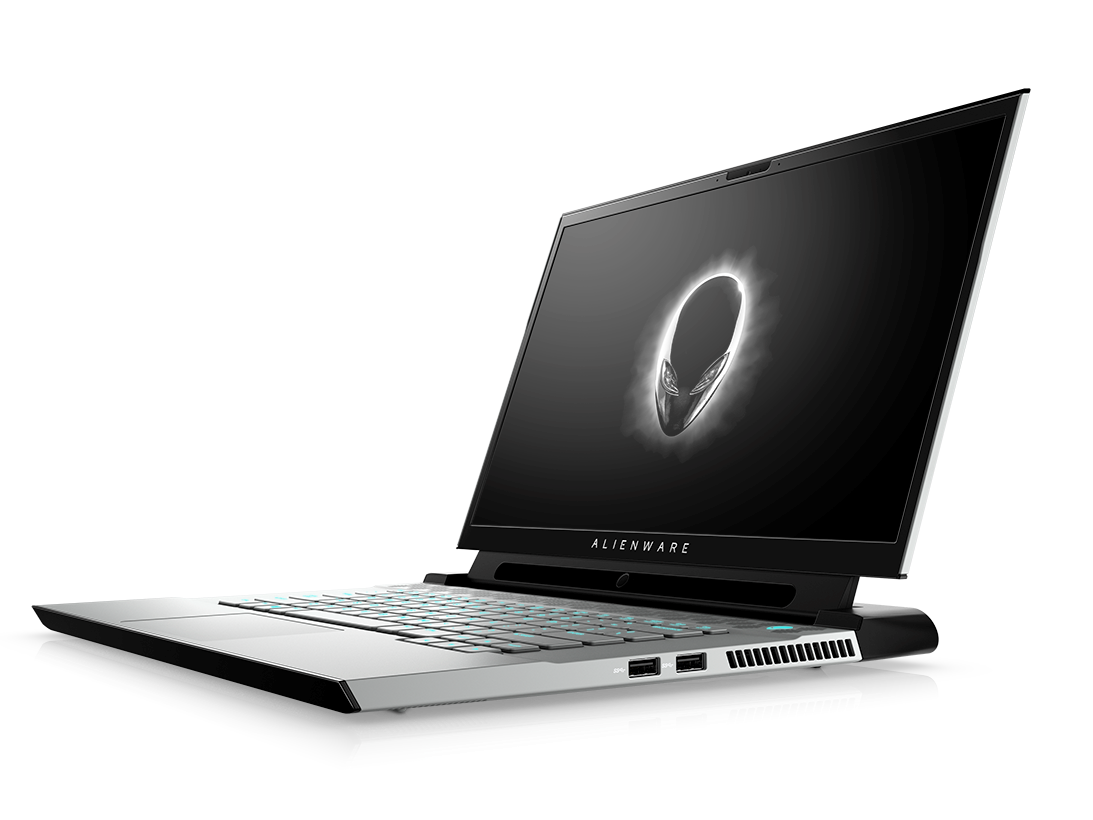
I egenskap av att vara en modell från andra generationen av den här serien hade vi förväntat oss att Alienware m15 R2 skulle vara objektivt sett bättre på alla sätt än första generationens Alienware m15 R1. Det är inte ens säkert att så är fallet på papperet; både RAM och WLAN är nu fastlödda samtidigt som batteriet den här gången är mindre. I gengäld får man 2.5 Gbit Ethernet, ett tangentbord med bättre återkoppling, WiFi 6 som tillval, tangentspecifik RGB-belysning och ett (diskuterbart) bättre utseende som varken känns svagare eller starkare än den utgående designen den ersätter.
Om du tittar närmare på m15 R2 börjar bristerna visa sig. I synnerhet är CPU-temperaturerna för höga och ligger nästan på 100 C när man spelar trots att fläktarna är inställda på maximum. De höga temperaturerna hade varit okej om de hade inneburit tystare fläktar eller snabbare prestanda än hos konkurrenterna, men så är inte fallet. Om alternativ som Asus Zephyrus S GX531, HP Omen 15, Razer Blade 15 eller MSI GS65 kan hålla sig 20 C svalare finns det ingen anledning till att Alienware m15 R2 inte också skulle kunna göra det. Tyvärr noterade vi samma sak på den äldre modellen Alienware m15 R1, vilket antyder att chassit på m15 R2 fortfarande inte löser en av de största anledningarna till kritik vi haft mot den relativt nya Alienware m15-serien.
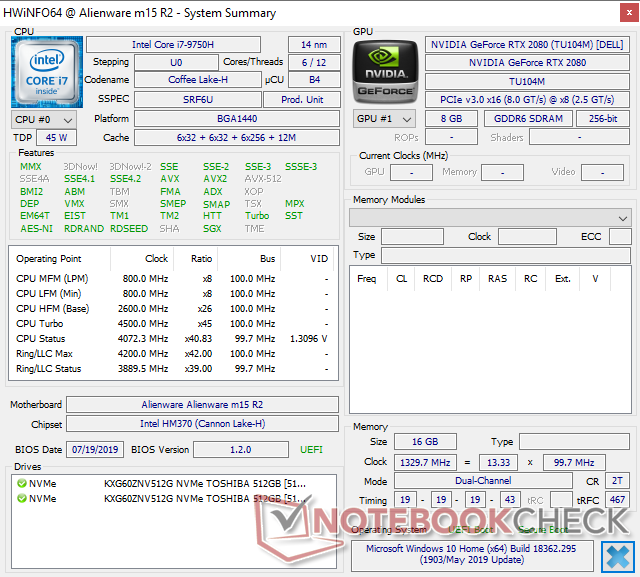
Kanske som ett resultat av de höga CPU-temperaturerna presterar Core i7-9750H processorn i m15 R2 en aning långsammare än genomsnittet för i7-9750H i vår databas och den presterar till och med långsammare än den Core i7-8750H som satt i Alienware m15 R1. Processorns klockfrekvenser varierade mer än vi hade förväntat oss och bilduppdateringen i spel är som ett resultat av detta en aning lägre när processorn är kraftigt belastad.
Om du letar efter en Alienware-laptop kan du lika gärna välja den äldare Alienware m15 R1 då m15 R2 känns som ett steg i sidled i fråga om generell prestanda, uppgraderingsmöjligheter och funktionalitet. Vi rekommenderar att du investerar i en skärm med snabb bilduppdatering och undviker konfigurationerna med Core i9 och 8 GB RAM.
Nyheterna jämfört med förra generationens Alienware m15 R1 sitter i huvudsak på ytan. Även om Alienware m15 R2 ser tjusigare ut med tangentspecifik RGB-belysning så har interna attribut som ljudnivån och den riktigt höga CPU-temperaturen inte riktigt förändrats.
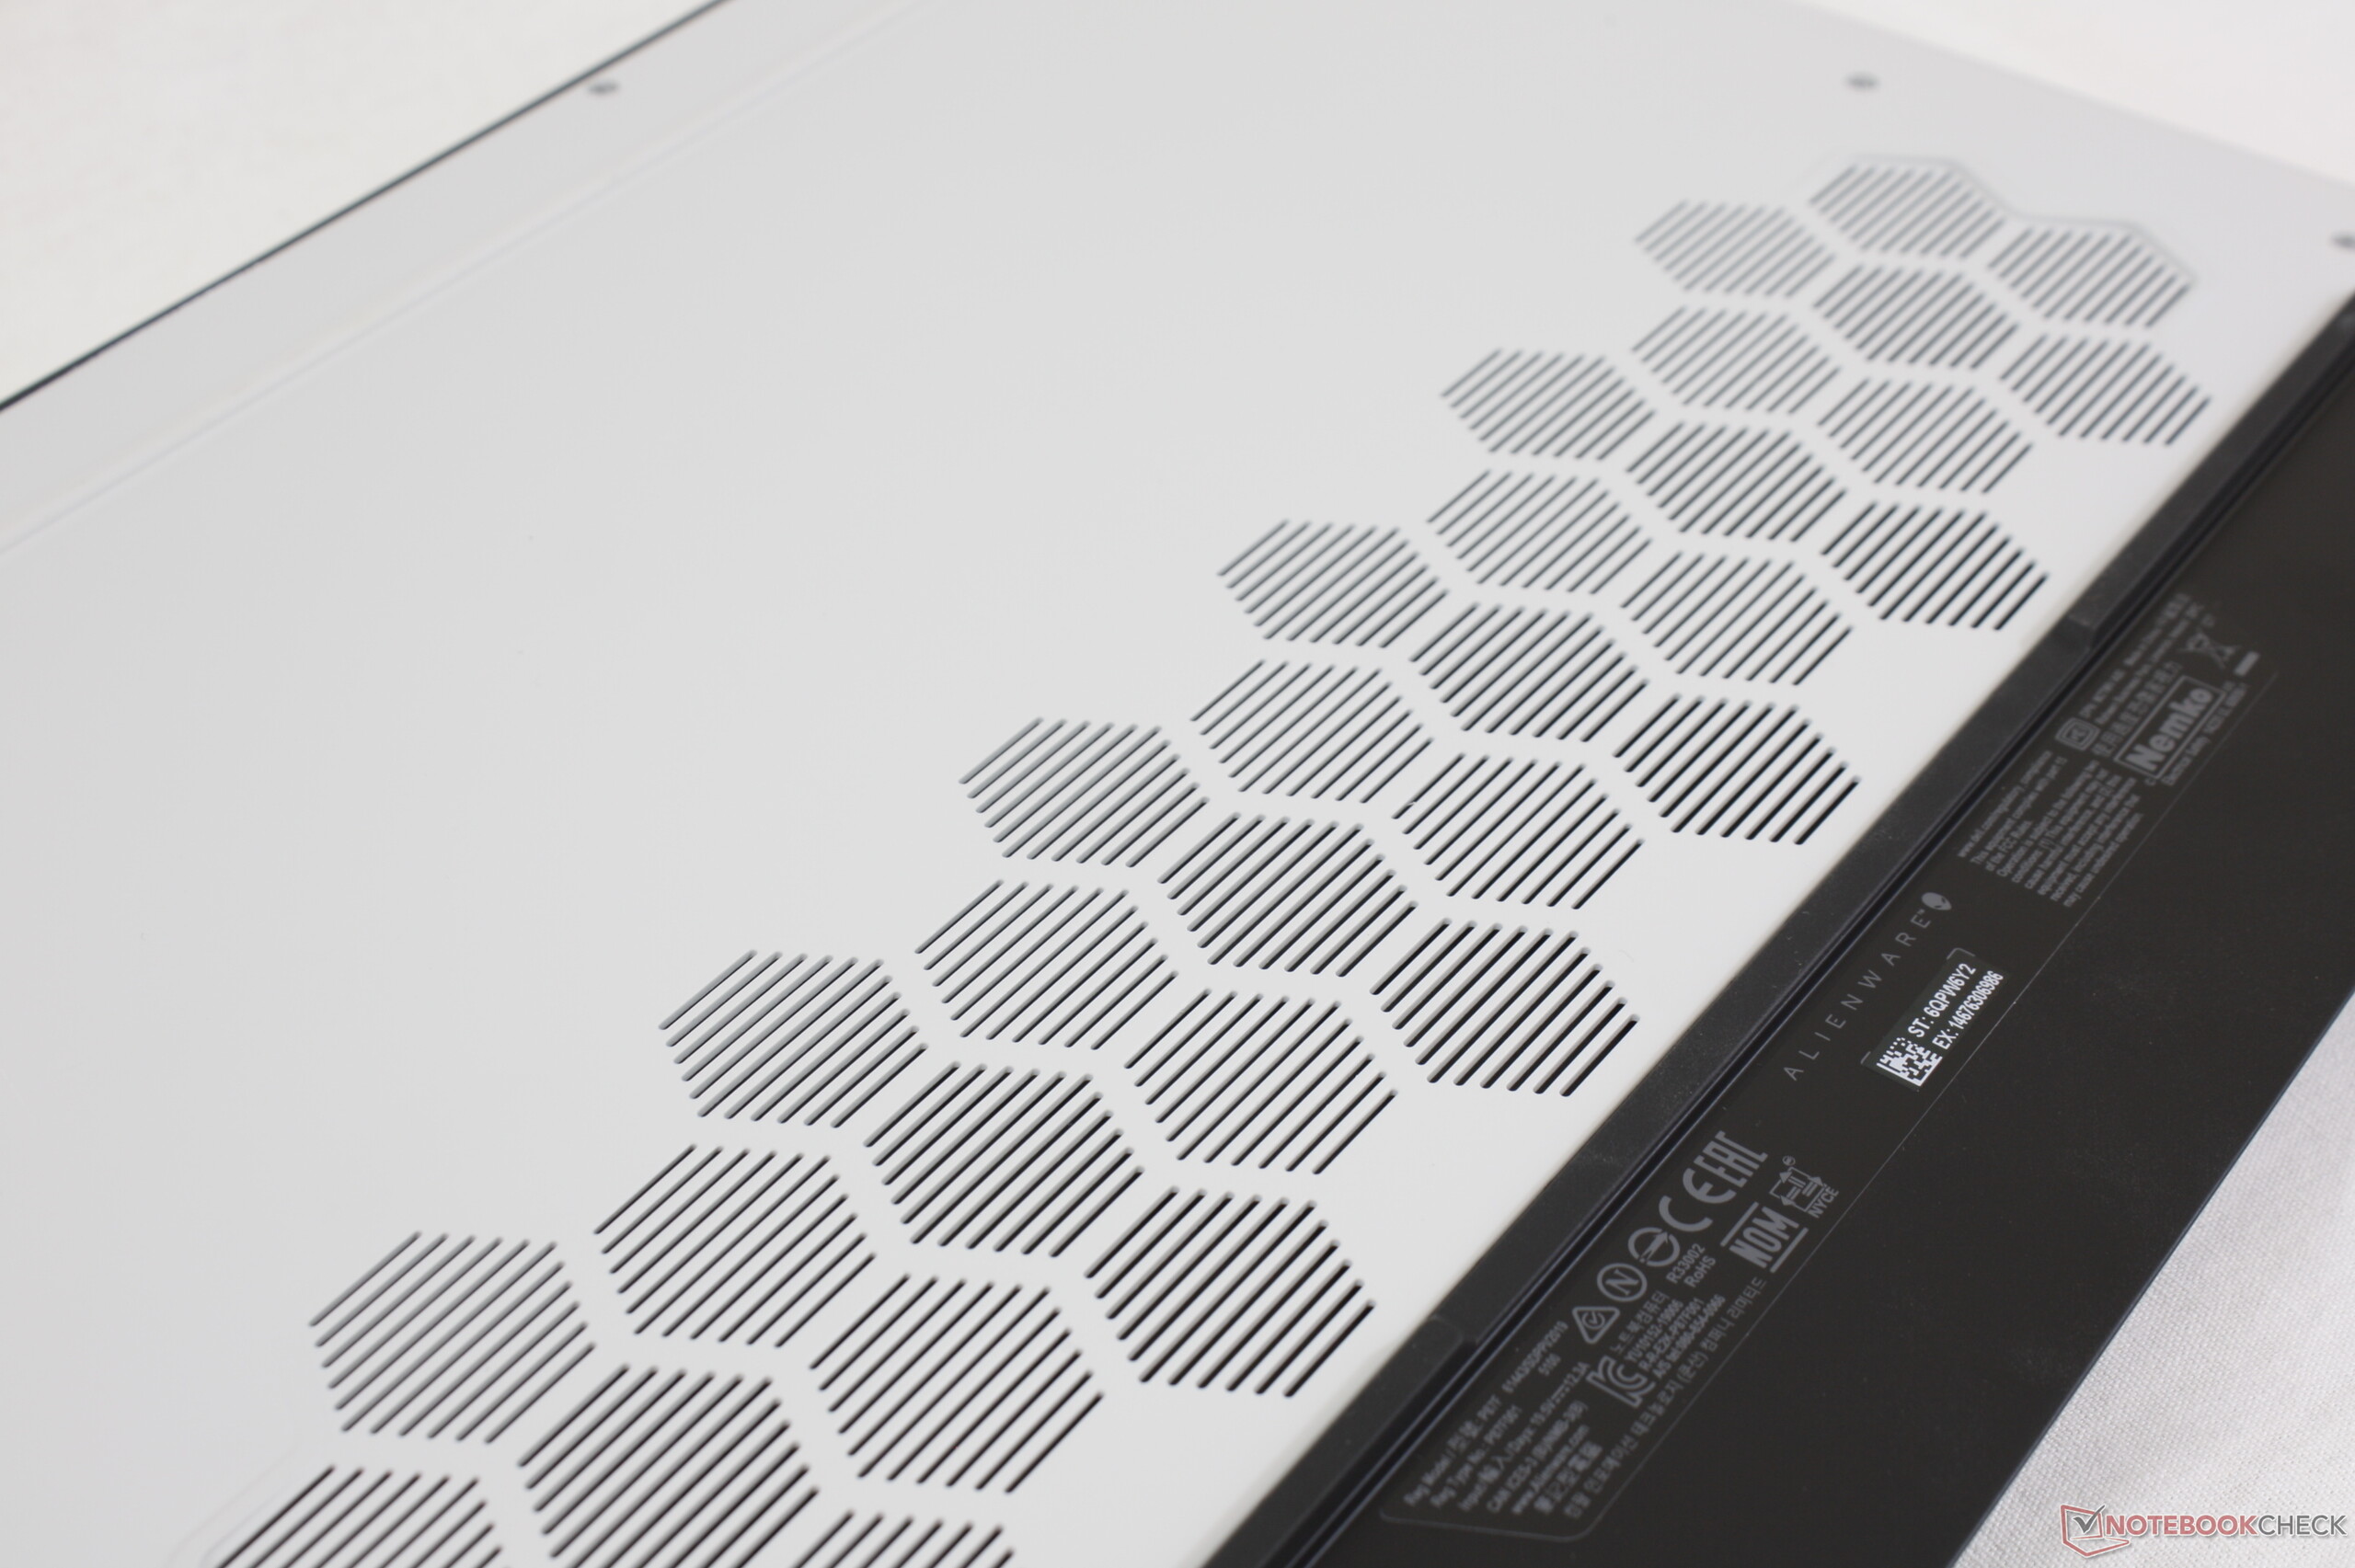
Alienware m15 R2 P87F
- 09/05/2019 v7 (old)
Allen Ngo
Price comparison
