Test: Alienware m15 (i7-8750H, GTX 1070 Max-Q) Laptop (Sammanfattning)

| |||||||||||||||||||||||||
Distribution av ljusstyrkan: 86 %
Mitt på batteriet: 353.6 cd/m²
Kontrast: 1179:1 (Svärta: 0.3 cd/m²)
ΔE ColorChecker Calman: 4.55 | ∀{0.5-29.43 Ø4.71}
calibrated: 3.37
ΔE Greyscale Calman: 4.1 | ∀{0.09-98 Ø4.96}
88.9% sRGB (Argyll 1.6.3 3D)
57.9% AdobeRGB 1998 (Argyll 1.6.3 3D)
64.5% AdobeRGB 1998 (Argyll 3D)
89.4% sRGB (Argyll 3D)
63.5% Display P3 (Argyll 3D)
Gamma: 2.27
CCT: 7434 K
| Alienware m15 GTX 1070 Max-Q AU Optronics B156HAN, IPS, 15.6", 1920x1080 | Razer Blade 15 2018 LGD05C0, IPS, 15.6", 1920x1080 | Alienware 15 R4 LG Philips LP156WF6 (LGD0540), IPS, 15.6", 1920x1080 | MSI GS65 8RF-019DE Stealth Thin AU Optronics B156HAN08.0 (AUO80ED), IPS, 15.6", 1920x1080 | Asus Zephyrus S GX531GS AU Optronics B156HAN08.2 (AUO82ED), IPS, 15.6", 1920x1080 | Gigabyte Aero 15X v8 LGD05C0, IPS, 15.6", 1920x1080 | |
|---|---|---|---|---|---|---|
| Display | 3% | -1% | 4% | 3% | 2% | |
| Display P3 Coverage (%) | 63.5 | 64.3 1% | 65.7 3% | 66.2 4% | 66.7 5% | 63.6 0% |
| sRGB Coverage (%) | 89.4 | 93.7 5% | 86.4 -3% | 92.1 3% | 91.2 2% | 93.8 5% |
| AdobeRGB 1998 Coverage (%) | 64.5 | 65.5 2% | 63.1 -2% | 67.2 4% | 66.7 3% | 64.9 1% |
| Response Times | 2% | -105% | -3% | 38% | 7% | |
| Response Time Grey 50% / Grey 80% * (ms) | 18 ? | 17.2 ? 4% | 37.6 ? -109% | 17.6 ? 2% | 7.4 ? 59% | 16.8 ? 7% |
| Response Time Black / White * (ms) | 12 ? | 12 ? -0% | 24 ? -100% | 12.8 ? -7% | 10 ? 17% | 11.2 ? 7% |
| PWM Frequency (Hz) | 20830 ? | |||||
| Screen | 10% | -7% | 16% | 13% | 18% | |
| Brightness middle (cd/m²) | 353.6 | 290 -18% | 292 -17% | 254 -28% | 294 -17% | 313 -11% |
| Brightness (cd/m²) | 346 | 281 -19% | 278 -20% | 262 -24% | 275 -21% | 300 -13% |
| Brightness Distribution (%) | 86 | 82 -5% | 88 2% | 89 3% | 84 -2% | 78 -9% |
| Black Level * (cd/m²) | 0.3 | 0.3 -0% | 0.29 3% | 0.22 27% | 0.24 20% | 0.33 -10% |
| Contrast (:1) | 1179 | 967 -18% | 1007 -15% | 1155 -2% | 1225 4% | 948 -20% |
| Colorchecker dE 2000 * | 4.55 | 2.85 37% | 4.9 -8% | 2.37 48% | 2.57 44% | 1.29 72% |
| Colorchecker dE 2000 max. * | 7.91 | 6.27 21% | 10.08 -27% | 4.71 40% | 4.88 38% | 2.04 74% |
| Colorchecker dE 2000 calibrated * | 3.37 | 1.39 59% | 2.27 33% | 1.84 45% | 2.14 36% | |
| Greyscale dE 2000 * | 4.1 | 2.4 41% | 4.89 -19% | 1.58 61% | 2.41 41% | 0.69 83% |
| Gamma | 2.27 97% | 2.34 94% | 2.36 93% | 2.48 89% | 2.5 88% | 2.43 91% |
| CCT | 7434 87% | 6718 97% | 7598 86% | 6785 96% | 6370 102% | 6550 99% |
| Color Space (Percent of AdobeRGB 1998) (%) | 57.9 | 60 4% | 56 -3% | 60 4% | 59 2% | 60 4% |
| Color Space (Percent of sRGB) (%) | 88.9 | 94 6% | 86 -3% | 92 3% | 91 2% | 94 6% |
| Totalt genomsnitt (program/inställningar) | 5% /
8% | -38% /
-18% | 6% /
11% | 18% /
15% | 9% /
13% |
* ... mindre är bättre
Visa svarstider
| ↔ Svarstid svart till vitt | ||
|---|---|---|
| 12 ms ... stiga ↗ och falla ↘ kombinerat | ↗ 6.8 ms stiga | 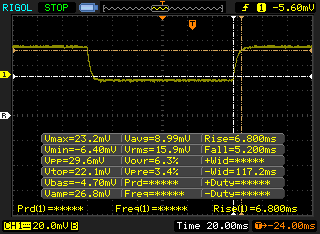 |
| ↘ 5.2 ms hösten | ||
| Skärmen visar bra svarsfrekvens i våra tester, men kan vara för långsam för konkurrenskraftiga spelare. I jämförelse sträcker sig alla testade enheter från 0.1 (minst) till 240 (maximalt) ms. » 32 % av alla enheter är bättre. Det betyder att den uppmätta svarstiden är bättre än genomsnittet av alla testade enheter (19.8 ms). | ||
| ↔ Svarstid 50 % grått till 80 % grått | ||
| 18 ms ... stiga ↗ och falla ↘ kombinerat | ↗ 9.2 ms stiga | 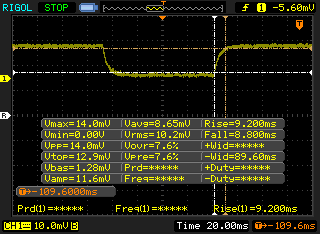 |
| ↘ 8.8 ms hösten | ||
| Skärmen visar bra svarsfrekvens i våra tester, men kan vara för långsam för konkurrenskraftiga spelare. I jämförelse sträcker sig alla testade enheter från 0.165 (minst) till 636 (maximalt) ms. » 32 % av alla enheter är bättre. Det betyder att den uppmätta svarstiden är bättre än genomsnittet av alla testade enheter (30.9 ms). | ||
Skärmflimmer / PWM (Puls-Width Modulation)
| Skärmflimmer / PWM upptäcktes inte | 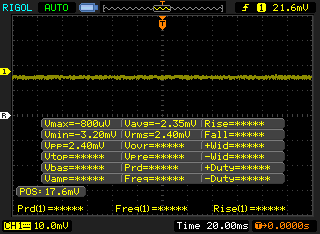 | ||
Som jämförelse: 52 % av alla testade enheter använder inte PWM för att dämpa skärmen. Om PWM upptäcktes mättes ett medelvärde av 7741 (minst: 5 - maximum: 343500) Hz. | |||
| Cinebench R10 | |
| Rendering Multiple CPUs 32Bit | |
| Schenker XMG Ultra 17 Coffee Lake Refresh | |
| Genomsnitt Intel Core i7-8750H (29664 - 35307, n=25) | |
| Dell Inspiron 15 7000 7577 4K | |
| Dell XPS 13 9370 i7 UHD | |
| Rendering Single 32Bit | |
| Schenker XMG Ultra 17 Coffee Lake Refresh | |
| Genomsnitt Intel Core i7-8750H (6236 - 6645, n=25) | |
| Dell XPS 13 9370 i7 UHD | |
| Dell Inspiron 15 7000 7577 4K | |
| wPrime 2.10 - 1024m | |
| Dell XPS 13 9370 i7 UHD | |
| Dell Inspiron 15 7000 7577 4K | |
| Genomsnitt Intel Core i7-8750H (125.5 - 180.5, n=6) | |
* ... mindre är bättre
| PCMark 8 Home Score Accelerated v2 | 4418 poäng | |
| PCMark 8 Work Score Accelerated v2 | 5407 poäng | |
| PCMark 10 Score | 5426 poäng | |
Hjälp | ||
| Alienware m15 GTX 1070 Max-Q Toshiba XG5 KXG50ZNV512G | Razer Blade 15 2018 Samsung PM961 NVMe MZVLW512HMJP | Alienware 15 R4 Toshiba XG5 KXG50ZNV256G | MSI GS65 Stealth Thin 8RE-051US Samsung SSD PM981 MZVLB256HAHQ | Asus Zephyrus S GX531GS WDC PC SN520 SDAPNUW-512G | Gigabyte Aero 15X v8 Toshiba NVMe THNSN5512GPU7 | |
|---|---|---|---|---|---|---|
| AS SSD | 42% | -24% | 0% | 21% | -0% | |
| Seq Read (MB/s) | 1967 | 2376 21% | 2441 24% | 1612 -18% | 903 -54% | 2213 13% |
| Seq Write (MB/s) | 1135 | 1521 34% | 300.4 -74% | 1475 30% | 1261 11% | 1163 2% |
| 4K Read (MB/s) | 29.17 | 46.45 59% | 32.87 13% | 43.09 48% | 40.02 37% | 23.36 -20% |
| 4K Write (MB/s) | 93.4 | 93.6 0% | 94.8 1% | 83.8 -10% | 103.6 11% | 80.4 -14% |
| 4K-64 Read (MB/s) | 995 | 1300 31% | 437.4 -56% | 611 -39% | 1030 4% | 847 -15% |
| 4K-64 Write (MB/s) | 656 | 1204 84% | 310.5 -53% | 570 -13% | 1285 96% | 742 13% |
| Access Time Read * (ms) | 0.116 | 0.051 56% | 0.116 -0% | 0.071 39% | 0.129 -11% | 0.119 -3% |
| Access Time Write * (ms) | 0.063 | 0.038 40% | 0.053 16% | 0.045 29% | 0.036 43% | 0.046 27% |
| Score Read (Points) | 1221 | 1584 30% | 714 -42% | 815 -33% | 1161 -5% | 1092 -11% |
| Score Write (Points) | 862 | 1450 68% | 435 -50% | 802 -7% | 1515 76% | 939 9% |
| Score Total (Points) | 2667 | 3806 43% | 1416 -47% | 2039 -24% | 3294 24% | 2536 -5% |
| Copy ISO MB/s (MB/s) | 642 | |||||
| Copy Program MB/s (MB/s) | 431.5 | |||||
| Copy Game MB/s (MB/s) | 706 | |||||
| CrystalDiskMark 5.2 / 6 | 49% | -10% | 49% | 36% | 36% | |
| Write 4K (MB/s) | 107.4 | 94.2 -12% | 96.8 -10% | 91.5 -15% | 98.2 -9% | 94.4 -12% |
| Read 4K (MB/s) | 42.91 | 39.23 -9% | 35.73 -17% | 40.41 -6% | 39.43 -8% | 37.65 -12% |
| Write Seq (MB/s) | 467.5 | 1483 217% | 362.3 -23% | 1528 227% | 1386 196% | 1335 186% |
| Read Seq (MB/s) | 2335 | 1371 -41% | 2110 -10% | 1235 -47% | 1100 -53% | 1404 -40% |
| Write 4K Q32T1 (MB/s) | 289.7 | 296.2 2% | 318.6 10% | 259 -11% | 270.3 -7% | 268.6 -7% |
| Read 4K Q32T1 (MB/s) | 354.4 | 342.5 -3% | 366.7 3% | 364.9 3% | 340.3 -4% | 332.8 -6% |
| Write Seq Q32T1 (MB/s) | 460.9 | 1527 231% | 351 -24% | 1529 232% | 1454 215% | 1375 198% |
| Read Seq Q32T1 (MB/s) | 3111 | 3280 5% | 2813 -10% | 3472 12% | 1681 -46% | 2627 -16% |
| Totalt genomsnitt (program/inställningar) | 46% /
45% | -17% /
-18% | 25% /
21% | 29% /
27% | 18% /
15% |
* ... mindre är bättre

| 3DMark 11 Performance | 17408 poäng | |
| 3DMark Cloud Gate Standard Score | 35886 poäng | |
| 3DMark Fire Strike Score | 14119 poäng | |
Hjälp | ||
| låg | med. | hög | ultra | |
|---|---|---|---|---|
| BioShock Infinite (2013) | 291.6 | 247.6 | 242.8 | 136.8 |
| The Witcher 3 (2015) | 254 | 173.9 | 101.6 | 54.2 |
| Rise of the Tomb Raider (2016) | 217.5 | 166 | 102.8 | 85.1 |
| Alienware m15 GTX 1070 Max-Q GeForce GTX 1070 Max-Q, i7-8750H, Toshiba XG5 KXG50ZNV512G | Razer Blade 15 2018 GeForce GTX 1070 Max-Q, i7-8750H, Samsung PM961 NVMe MZVLW512HMJP | Alienware 15 R4 GeForce GTX 1070 Mobile, i9-8950HK, Toshiba XG5 KXG50ZNV256G | MSI GS65 Stealth Thin 8RE-051US GeForce GTX 1060 Mobile, i7-8750H, Samsung SSD PM981 MZVLB256HAHQ | Asus Zephyrus S GX531GS GeForce GTX 1070 Max-Q, i7-8750H, WDC PC SN520 SDAPNUW-512G | Gigabyte Aero 15X v8 GeForce GTX 1070 Max-Q, i7-8750H, Toshiba NVMe THNSN5512GPU7 | |
|---|---|---|---|---|---|---|
| Noise | -6% | -19% | 1% | -14% | -10% | |
| av / miljö * (dB) | 28.6 | 29 -1% | 29 -1% | 28.4 1% | 29 -1% | 29 -1% |
| Idle Minimum * (dB) | 28.6 | 29 -1% | 32 -12% | 28.4 1% | 33 -15% | 30 -5% |
| Idle Average * (dB) | 28.6 | 30 -5% | 33 -15% | 28.4 1% | 34 -19% | 31 -8% |
| Idle Maximum * (dB) | 28.6 | 38 -33% | 50 -75% | 29.6 -3% | 40 -40% | 35 -22% |
| Load Average * (dB) | 40.8 | 46 -13% | 50 -23% | 43.5 -7% | 47 -15% | 49 -20% |
| Witcher 3 ultra * (dB) | 49.6 | 49 1% | 51 -3% | 45.7 8% | 51 -3% | 51 -3% |
| Load Maximum * (dB) | 49.6 | 46 7% | 51 -3% | 45.7 8% | 53 -7% | 54 -9% |
* ... mindre är bättre
Ljudnivå
| Låg belastning |
| 28.6 / 28.6 / 28.6 dB(A) |
| Hög belastning |
| 40.8 / 49.6 dB(A) |
 | ||
30 dB tyst 40 dB(A) hörbar 50 dB(A) högt ljud |
||
min: | ||
(-) Den maximala temperaturen på ovansidan är 52 °C / 126 F, jämfört med genomsnittet av 40.4 °C / 105 F , allt från 21.2 till 68.8 °C för klassen Gaming.
(-) Botten värms upp till maximalt 55.6 °C / 132 F, jämfört med genomsnittet av 43.2 °C / 110 F
(+) Vid tomgångsbruk är medeltemperaturen för ovansidan 27.6 °C / 82 F, jämfört med enhetsgenomsnittet på 33.9 °C / ### class_avg_f### F.
(-) När du spelar The Witcher 3 är medeltemperaturen för ovansidan 38.5 °C / 101 F, jämfört med enhetsgenomsnittet på 33.9 °C / ## #class_avg_f### F.
(+) Handledsstöden och pekplattan är kallare än hudtemperaturen med maximalt 30.6 °C / 87.1 F och är därför svala att ta på.
(±) Medeltemperaturen för handledsstödsområdet på liknande enheter var 28.8 °C / 83.8 F (-1.8 °C / -3.3 F).
Alienware m15 GTX 1070 Max-Q ljudanalys
(±) | högtalarljudstyrkan är genomsnittlig men bra (78.9 dB)
Bas 100 - 315 Hz
(-) | nästan ingen bas - i genomsnitt 19.7% lägre än medianen
(±) | linjäriteten för basen är genomsnittlig (10.8% delta till föregående frekvens)
Mellan 400 - 2000 Hz
(±) | högre mellan - i genomsnitt 8.5% högre än median
(±) | linjäriteten för mids är genomsnittlig (11.6% delta till föregående frekvens)
Högsta 2 - 16 kHz
(+) | balanserade toppar - endast 2.5% från medianen
(±) | linjäriteten för toppar är genomsnittlig (8.5% delta till föregående frekvens)
Totalt 100 - 16 000 Hz
(±) | linjäriteten för det totala ljudet är genomsnittlig (24.7% skillnad mot median)
Jämfört med samma klass
» 89% av alla testade enheter i den här klassen var bättre, 4% liknande, 8% sämre
» Den bästa hade ett delta på 6%, genomsnittet var 18%, sämst var 132%
Jämfört med alla testade enheter
» 75% av alla testade enheter var bättre, 5% liknande, 19% sämre
» Den bästa hade ett delta på 4%, genomsnittet var 23%, sämst var 134%
Apple MacBook 12 (Early 2016) 1.1 GHz ljudanalys
(+) | högtalare kan spela relativt högt (83.6 dB)
Bas 100 - 315 Hz
(±) | reducerad bas - i genomsnitt 11.3% lägre än medianen
(±) | linjäriteten för basen är genomsnittlig (14.2% delta till föregående frekvens)
Mellan 400 - 2000 Hz
(+) | balanserad mellan - endast 2.4% från medianen
(+) | mids är linjära (5.5% delta till föregående frekvens)
Högsta 2 - 16 kHz
(+) | balanserade toppar - endast 2% från medianen
(+) | toppar är linjära (4.5% delta till föregående frekvens)
Totalt 100 - 16 000 Hz
(+) | det totala ljudet är linjärt (10.2% skillnad mot median)
Jämfört med samma klass
» 7% av alla testade enheter i den här klassen var bättre, 2% liknande, 90% sämre
» Den bästa hade ett delta på 5%, genomsnittet var 18%, sämst var 53%
Jämfört med alla testade enheter
» 5% av alla testade enheter var bättre, 1% liknande, 94% sämre
» Den bästa hade ett delta på 4%, genomsnittet var 23%, sämst var 134%
| Av/Standby | |
| Låg belastning | |
| Hög belastning |
|
Förklaring:
min: | |
| Alienware m15 GTX 1070 Max-Q i7-8750H, GeForce GTX 1070 Max-Q, Toshiba XG5 KXG50ZNV512G, IPS, 1920x1080, 15.6" | Razer Blade 15 2018 i7-8750H, GeForce GTX 1070 Max-Q, Samsung PM961 NVMe MZVLW512HMJP, IPS, 1920x1080, 15.6" | Alienware 15 R4 i9-8950HK, GeForce GTX 1070 Mobile, Toshiba XG5 KXG50ZNV256G, IPS, 1920x1080, 15.6" | MSI GS65 Stealth Thin 8RE-051US i7-8750H, GeForce GTX 1060 Mobile, Samsung SSD PM981 MZVLB256HAHQ, IPS, 1920x1080, 15.6" | Asus Zephyrus S GX531GS i7-8750H, GeForce GTX 1070 Max-Q, WDC PC SN520 SDAPNUW-512G, IPS, 1920x1080, 15.6" | Alienware 15 R3 Max-Q i7-7820HK, GeForce GTX 1080 Max-Q, LiteOn CX2-8B256, IPS, 1920x1080, 15.6" | |
|---|---|---|---|---|---|---|
| Power Consumption | -25% | -77% | 1% | -52% | -71% | |
| Idle Minimum * (Watt) | 7.6 | 14 -84% | 23 -203% | 8.7 -14% | 17 -124% | 22 -189% |
| Idle Average * (Watt) | 13.8 | 17 -23% | 26 -88% | 13 6% | 20 -45% | 26 -88% |
| Idle Maximum * (Watt) | 14.6 | 21 -44% | 30 -105% | 14.3 2% | 29 -99% | 33 -126% |
| Load Average * (Watt) | 97.6 | 95 3% | 111 -14% | 107.4 -10% | 112 -15% | 86 12% |
| Witcher 3 ultra * (Watt) | 145.8 | 141 3% | 182 -25% | 129 12% | 152 -4% | 159 -9% |
| Load Maximum * (Watt) | 172.5 | 179 -4% | 222 -29% | 151.5 12% | 211 -22% | 215 -25% |
* ... mindre är bättre
| Alienware m15 GTX 1070 Max-Q i7-8750H, GeForce GTX 1070 Max-Q, 90 Wh | Razer Blade 15 2018 i7-8750H, GeForce GTX 1070 Max-Q, 80 Wh | Alienware 15 R4 i9-8950HK, GeForce GTX 1070 Mobile, 99 Wh | MSI GS65 Stealth Thin 8RE-051US i7-8750H, GeForce GTX 1060 Mobile, 82 Wh | Asus Zephyrus S GX531GS i7-8750H, GeForce GTX 1070 Max-Q, 50 Wh | Gigabyte Aero 15X v8 i7-8750H, GeForce GTX 1070 Max-Q, 94.24 Wh | |
|---|---|---|---|---|---|---|
| Batteridrifttid | -33% | -39% | -24% | -64% | 29% | |
| Reader / Idle (h) | 10.5 | 6.4 -39% | 6.2 -41% | 3.6 -66% | 12.7 21% | |
| WiFi v1.3 (h) | 7.7 | 5.4 -30% | 5.1 -34% | 6.2 -19% | 2.6 -66% | 8.6 12% |
| Load (h) | 1.7 | 1.2 -29% | 1 -41% | 1.2 -29% | 0.7 -59% | 2.6 53% |
För
Emot
Läs den fullständiga versionen av den här recensionen på engelska här.
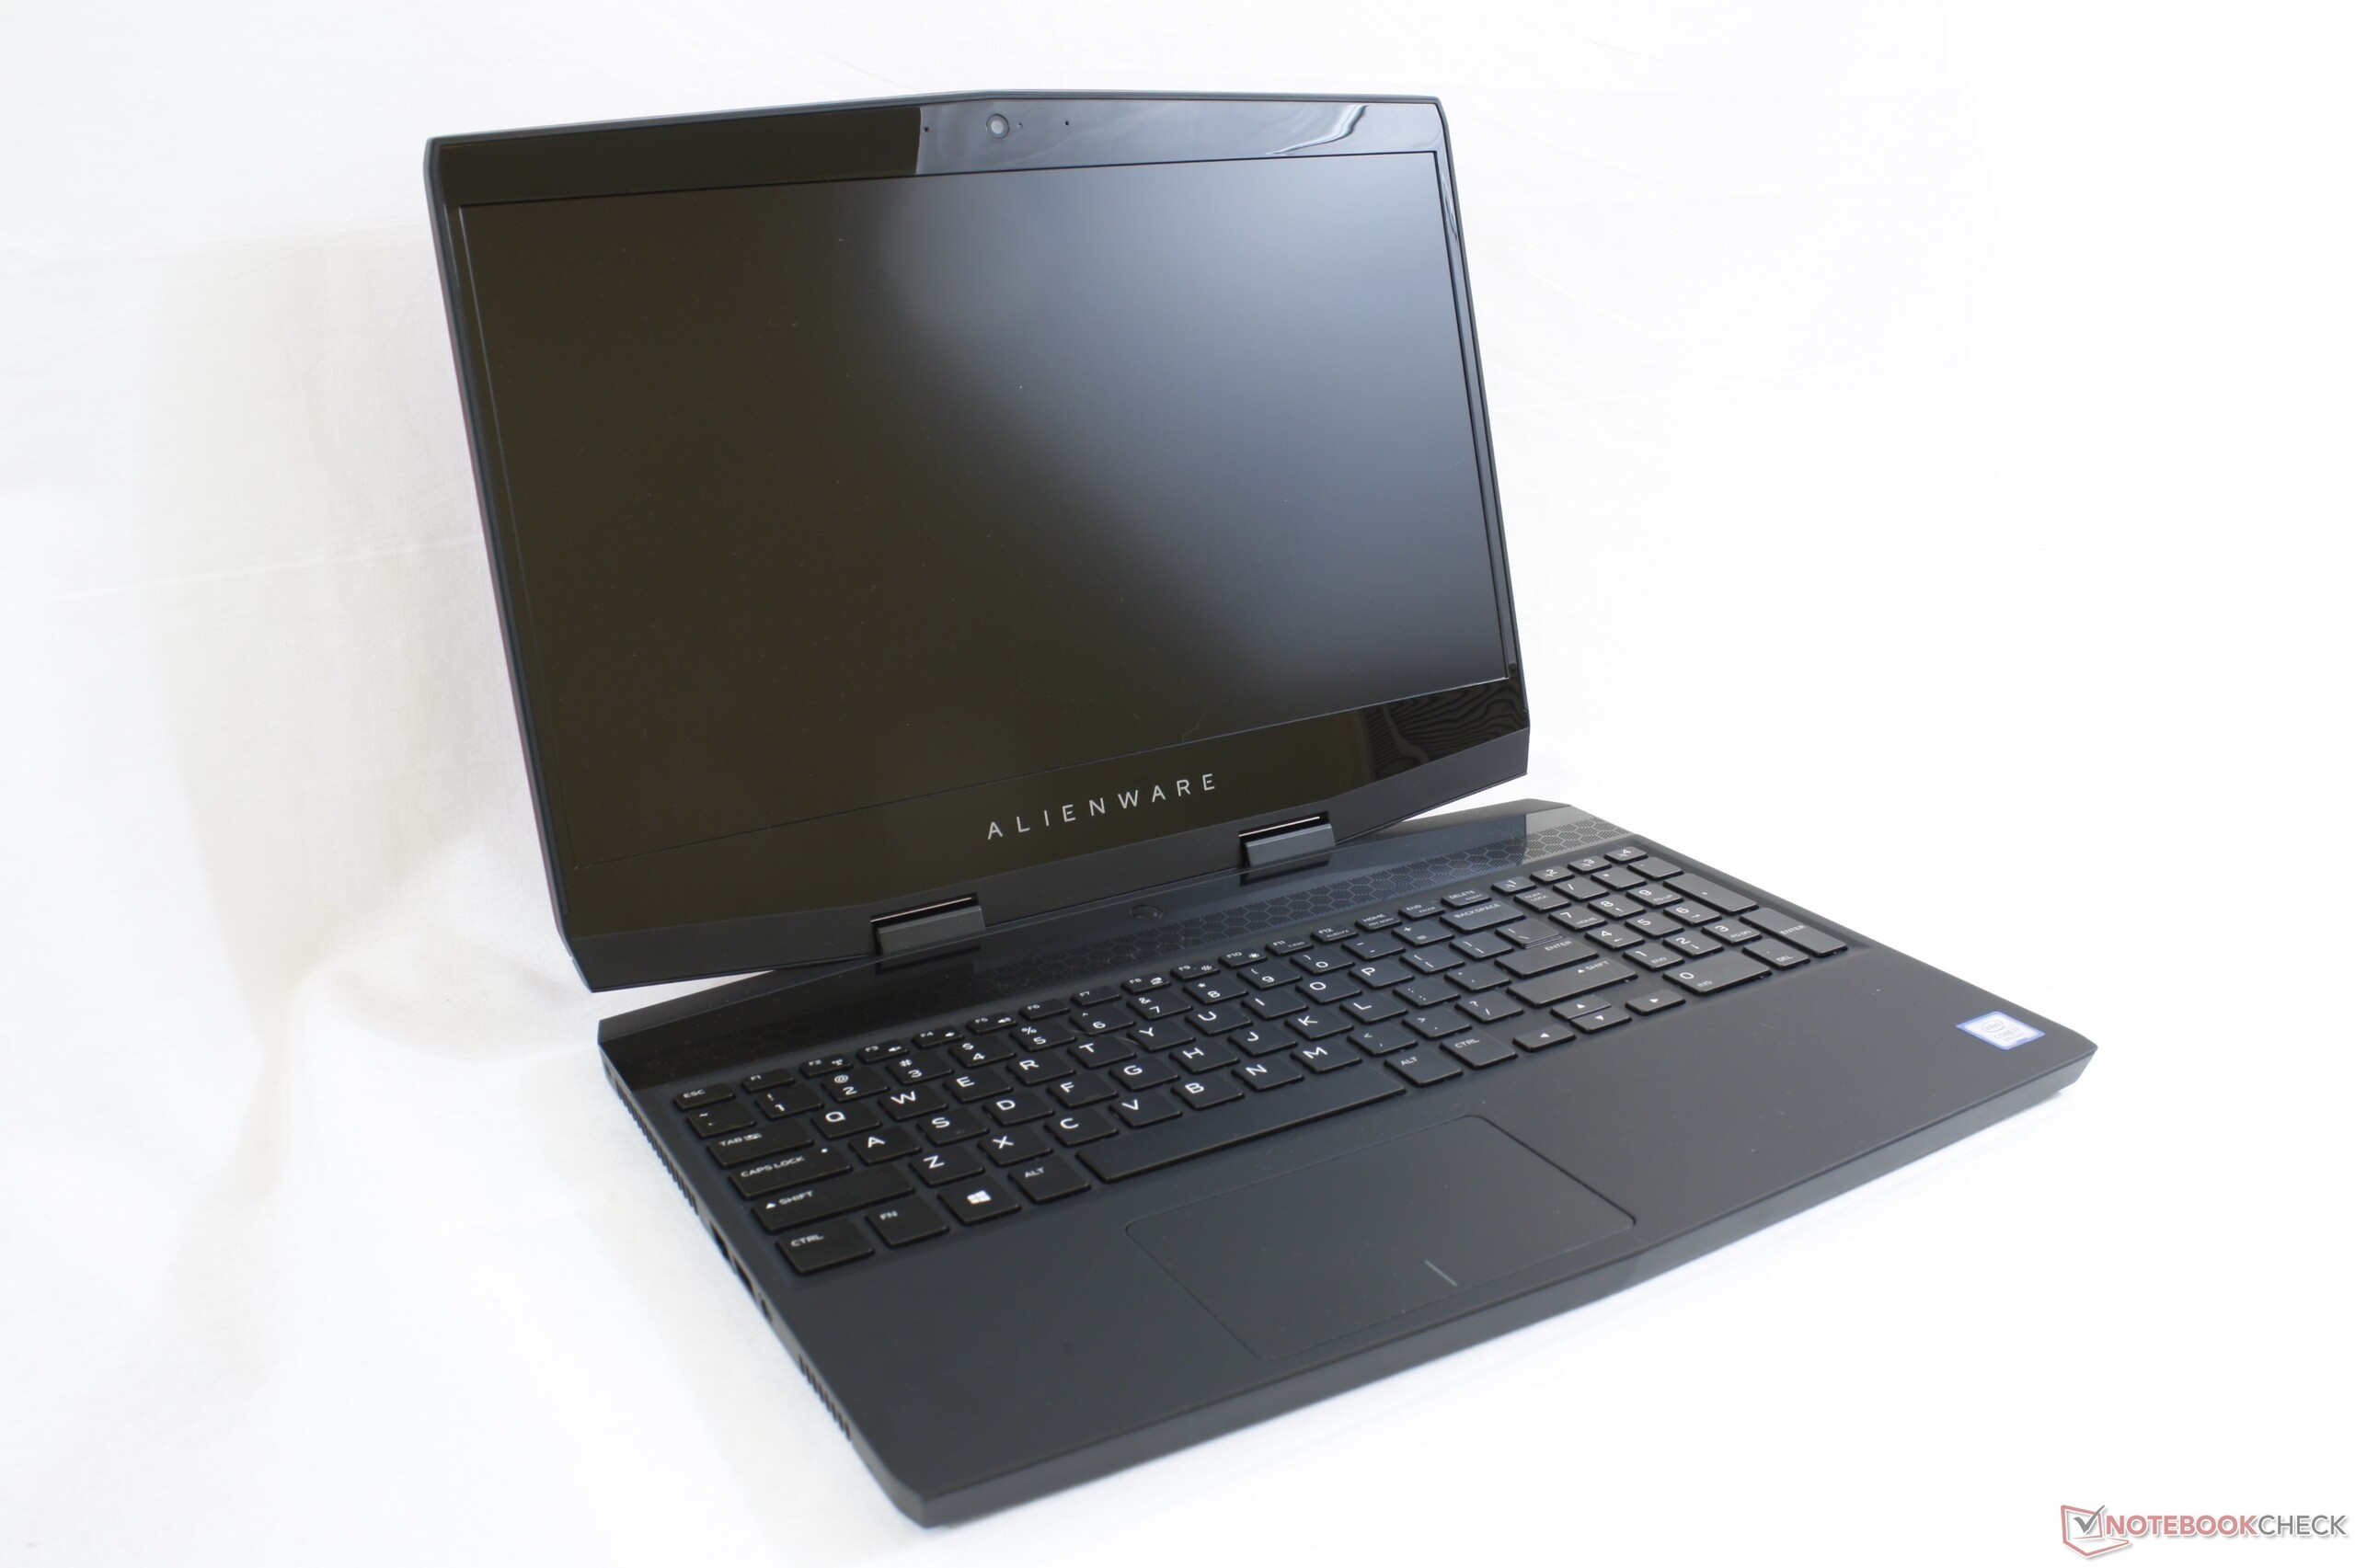
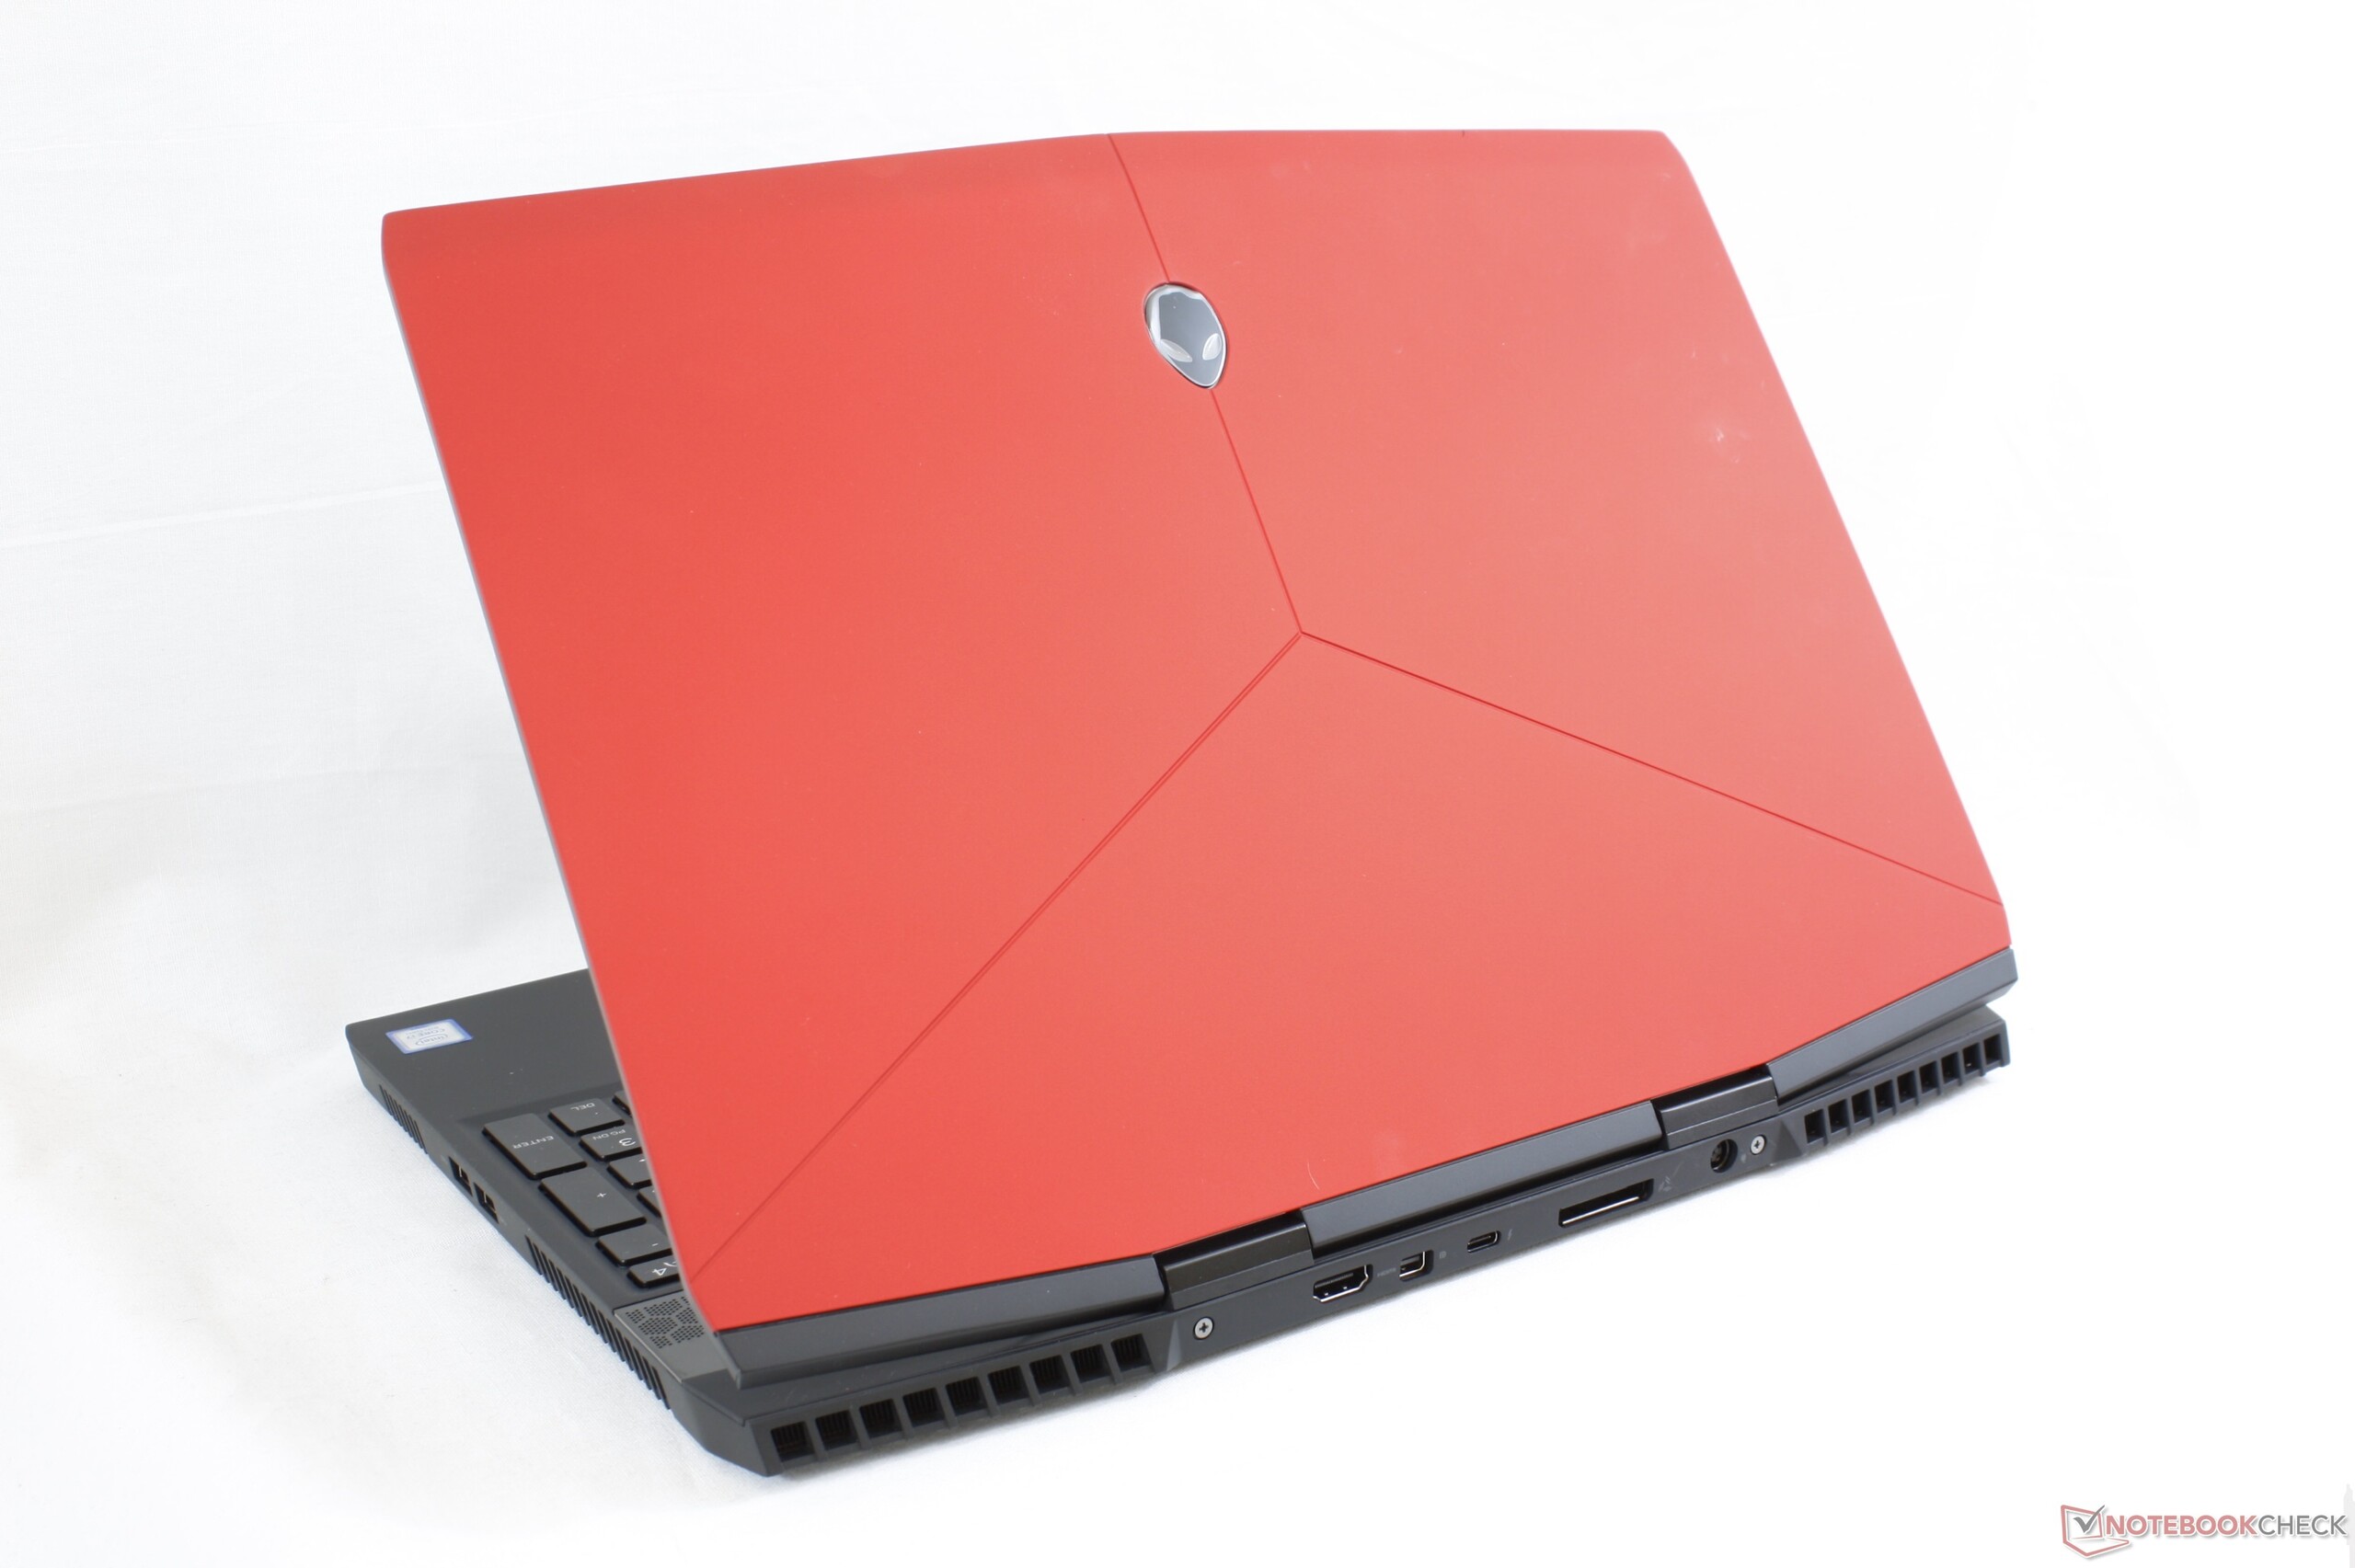
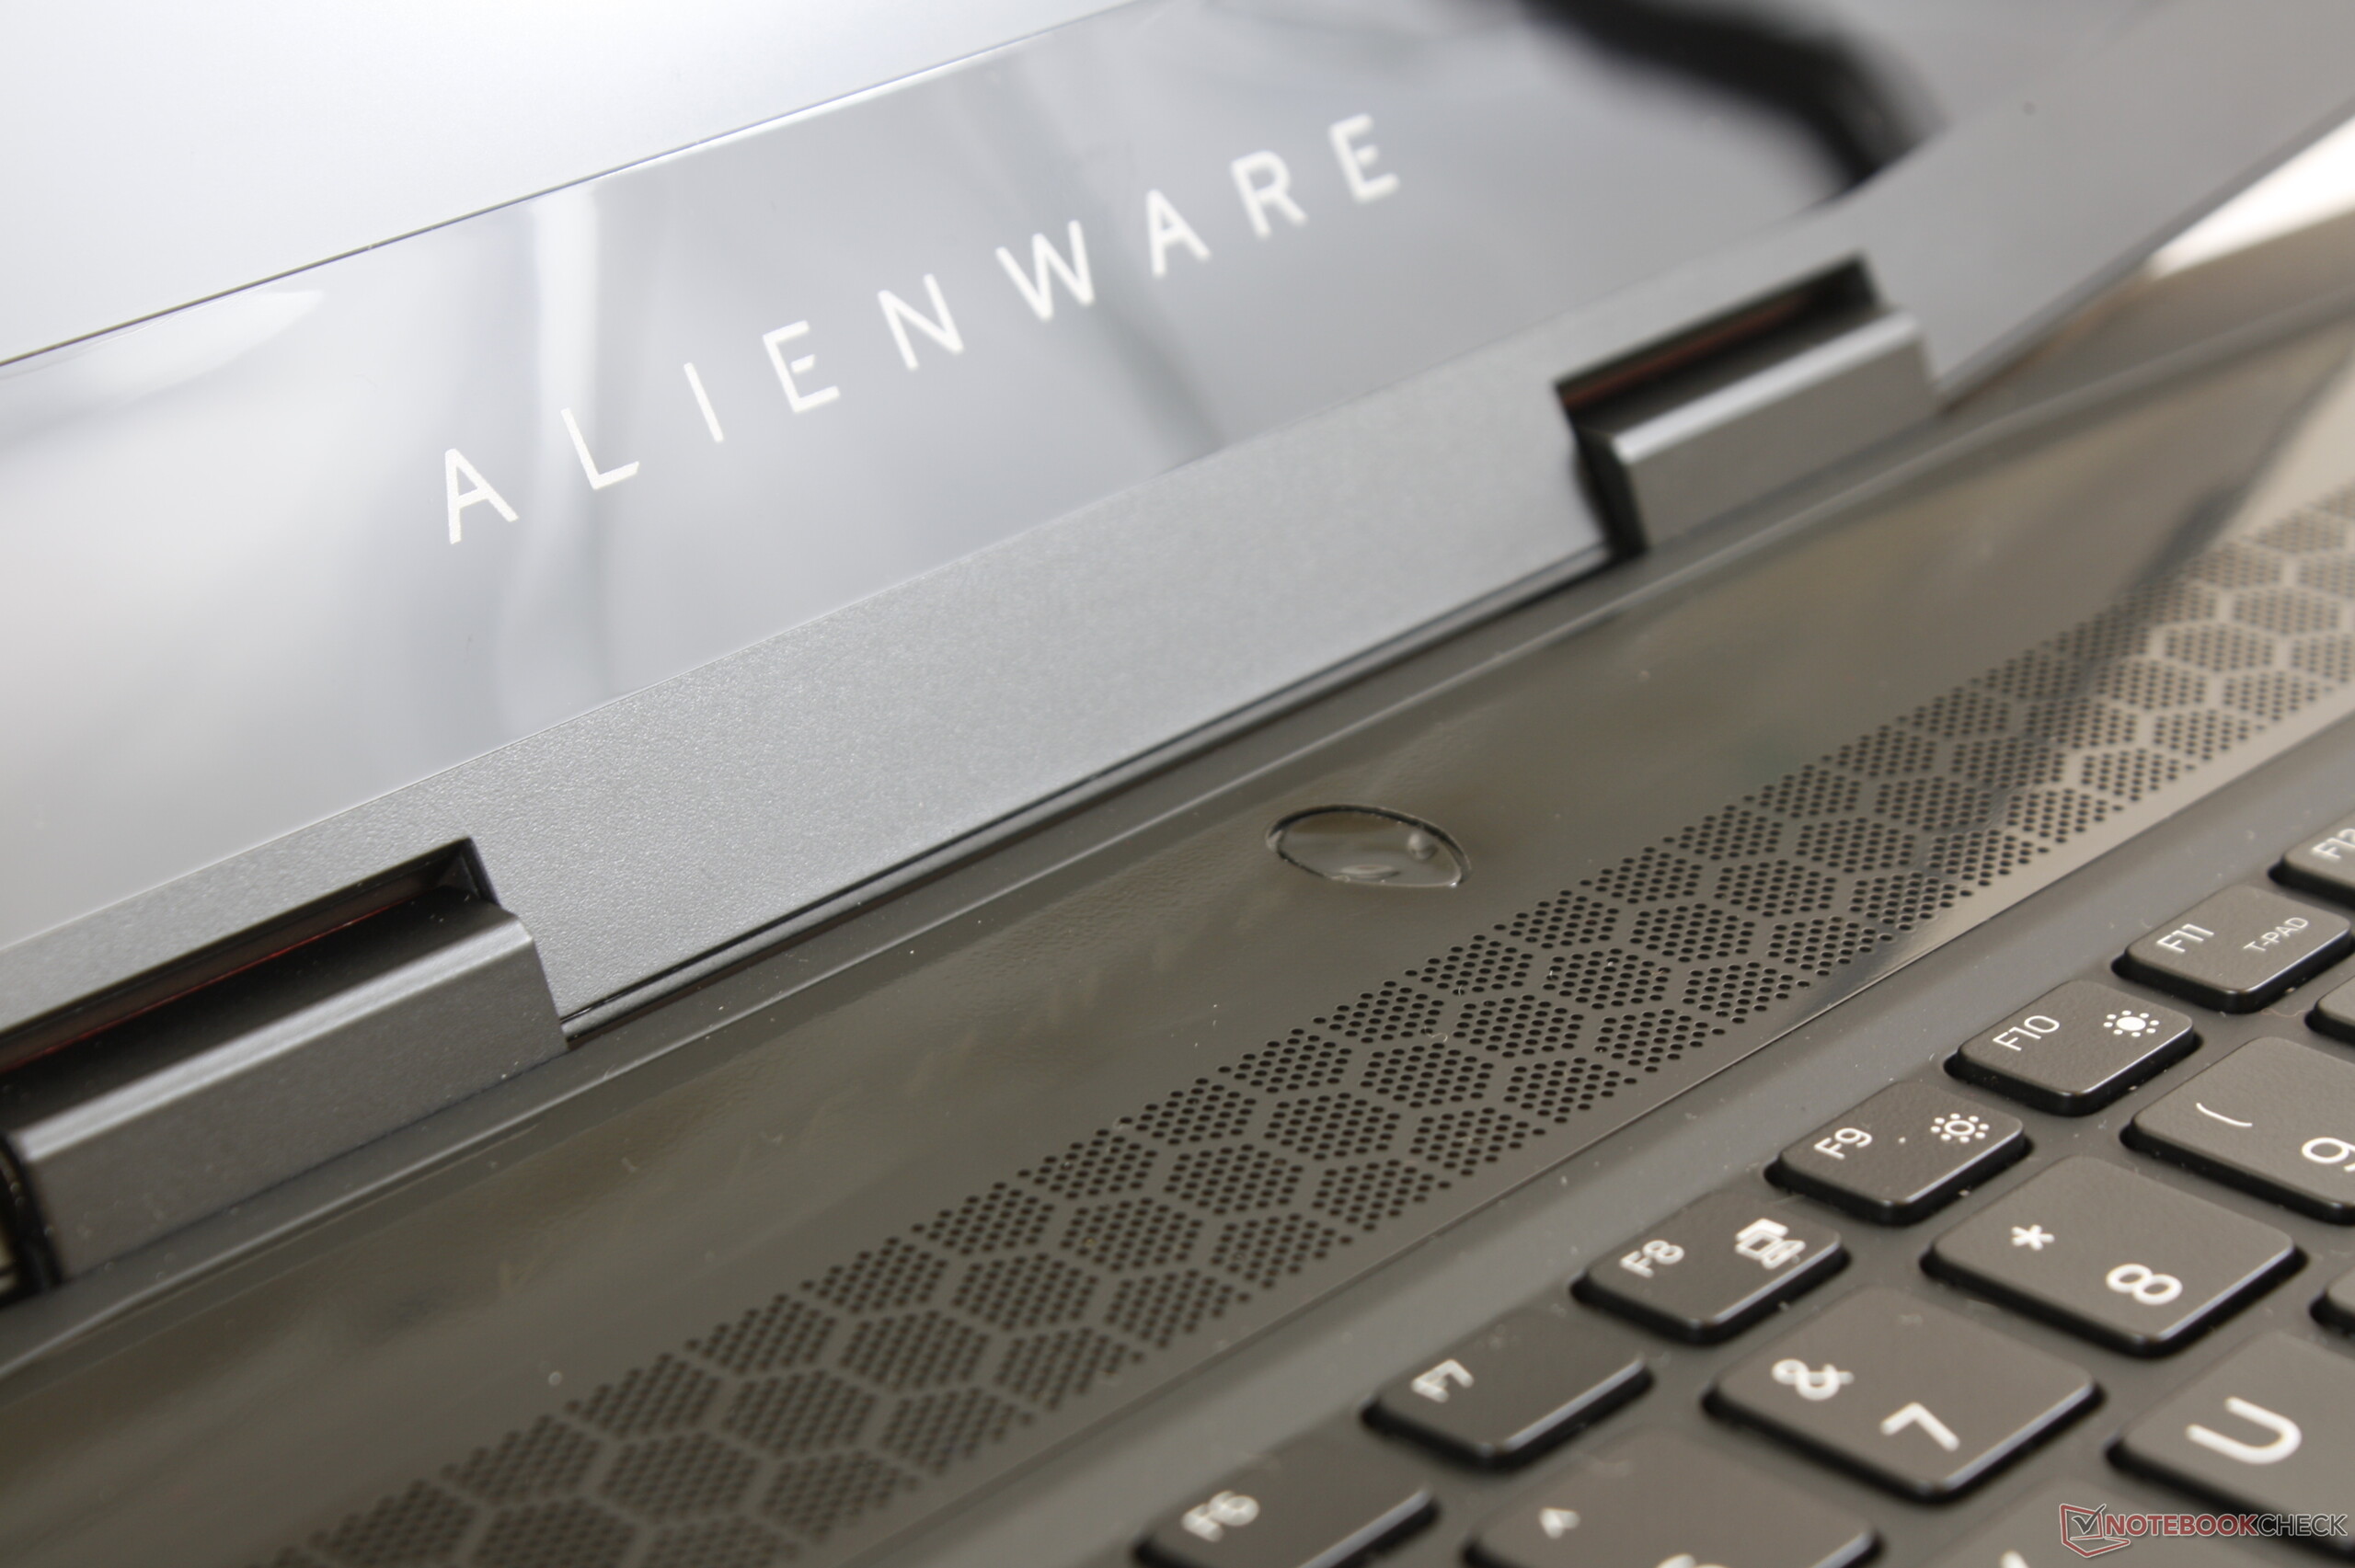
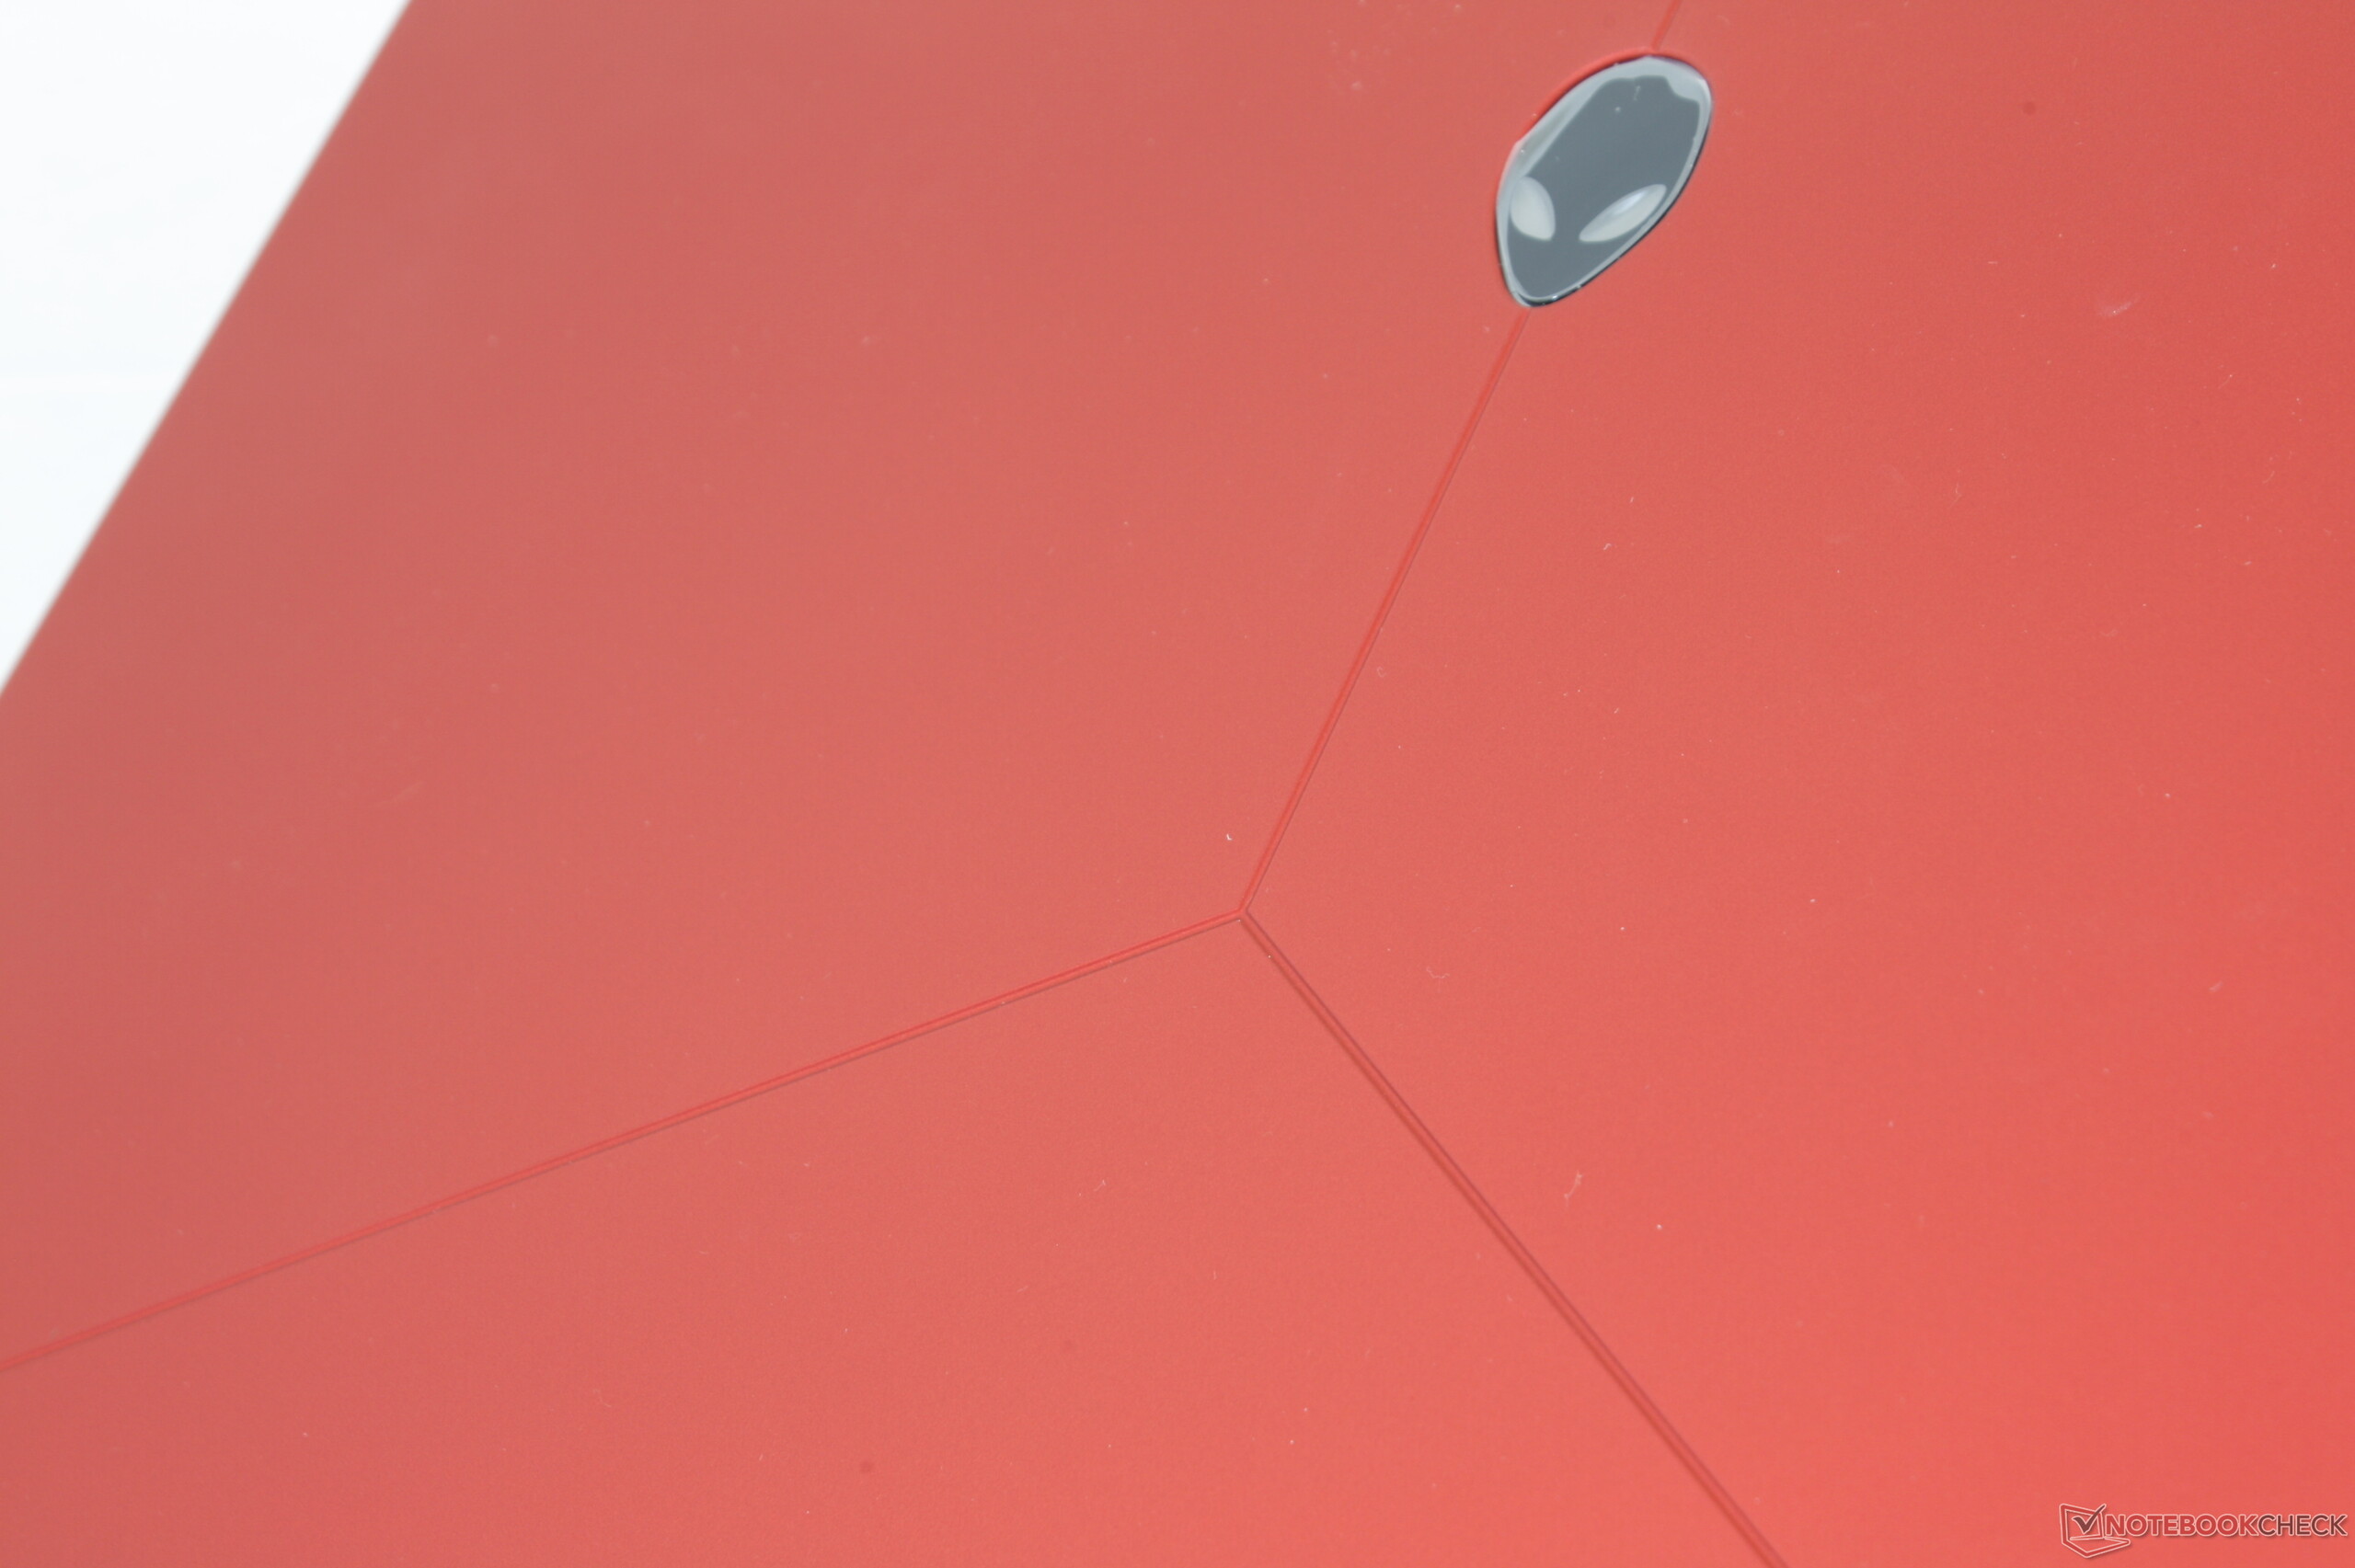
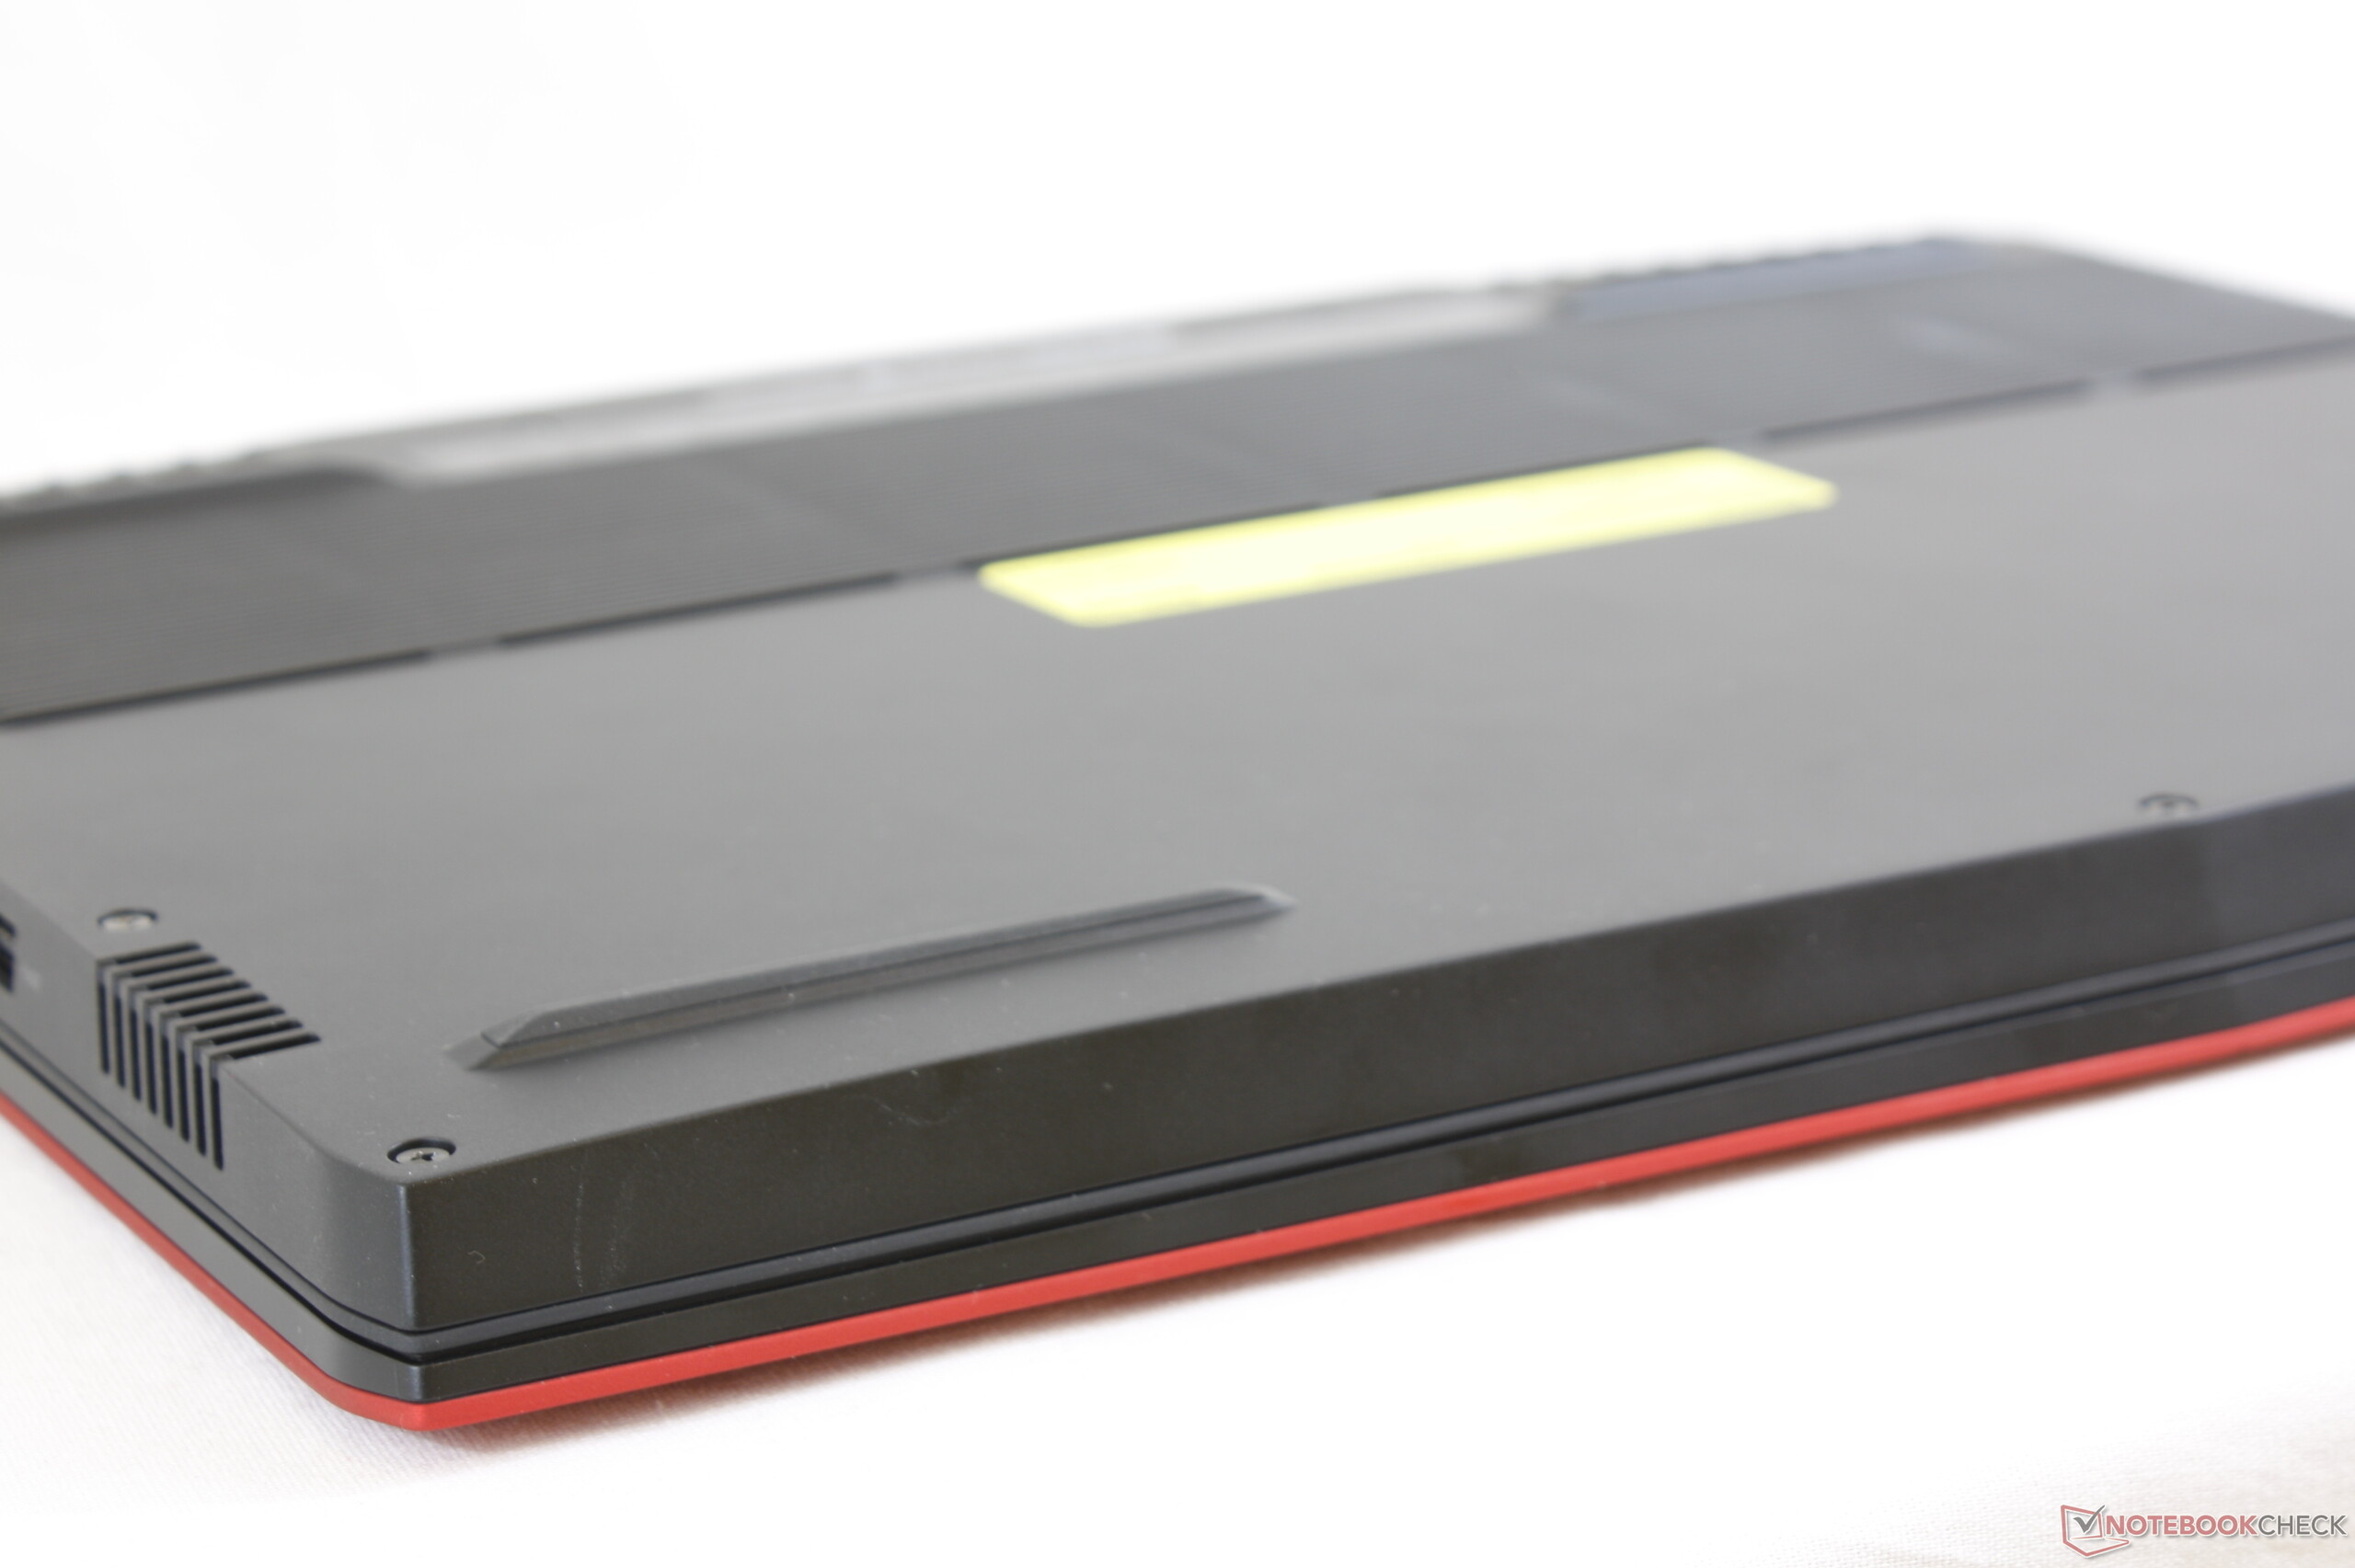
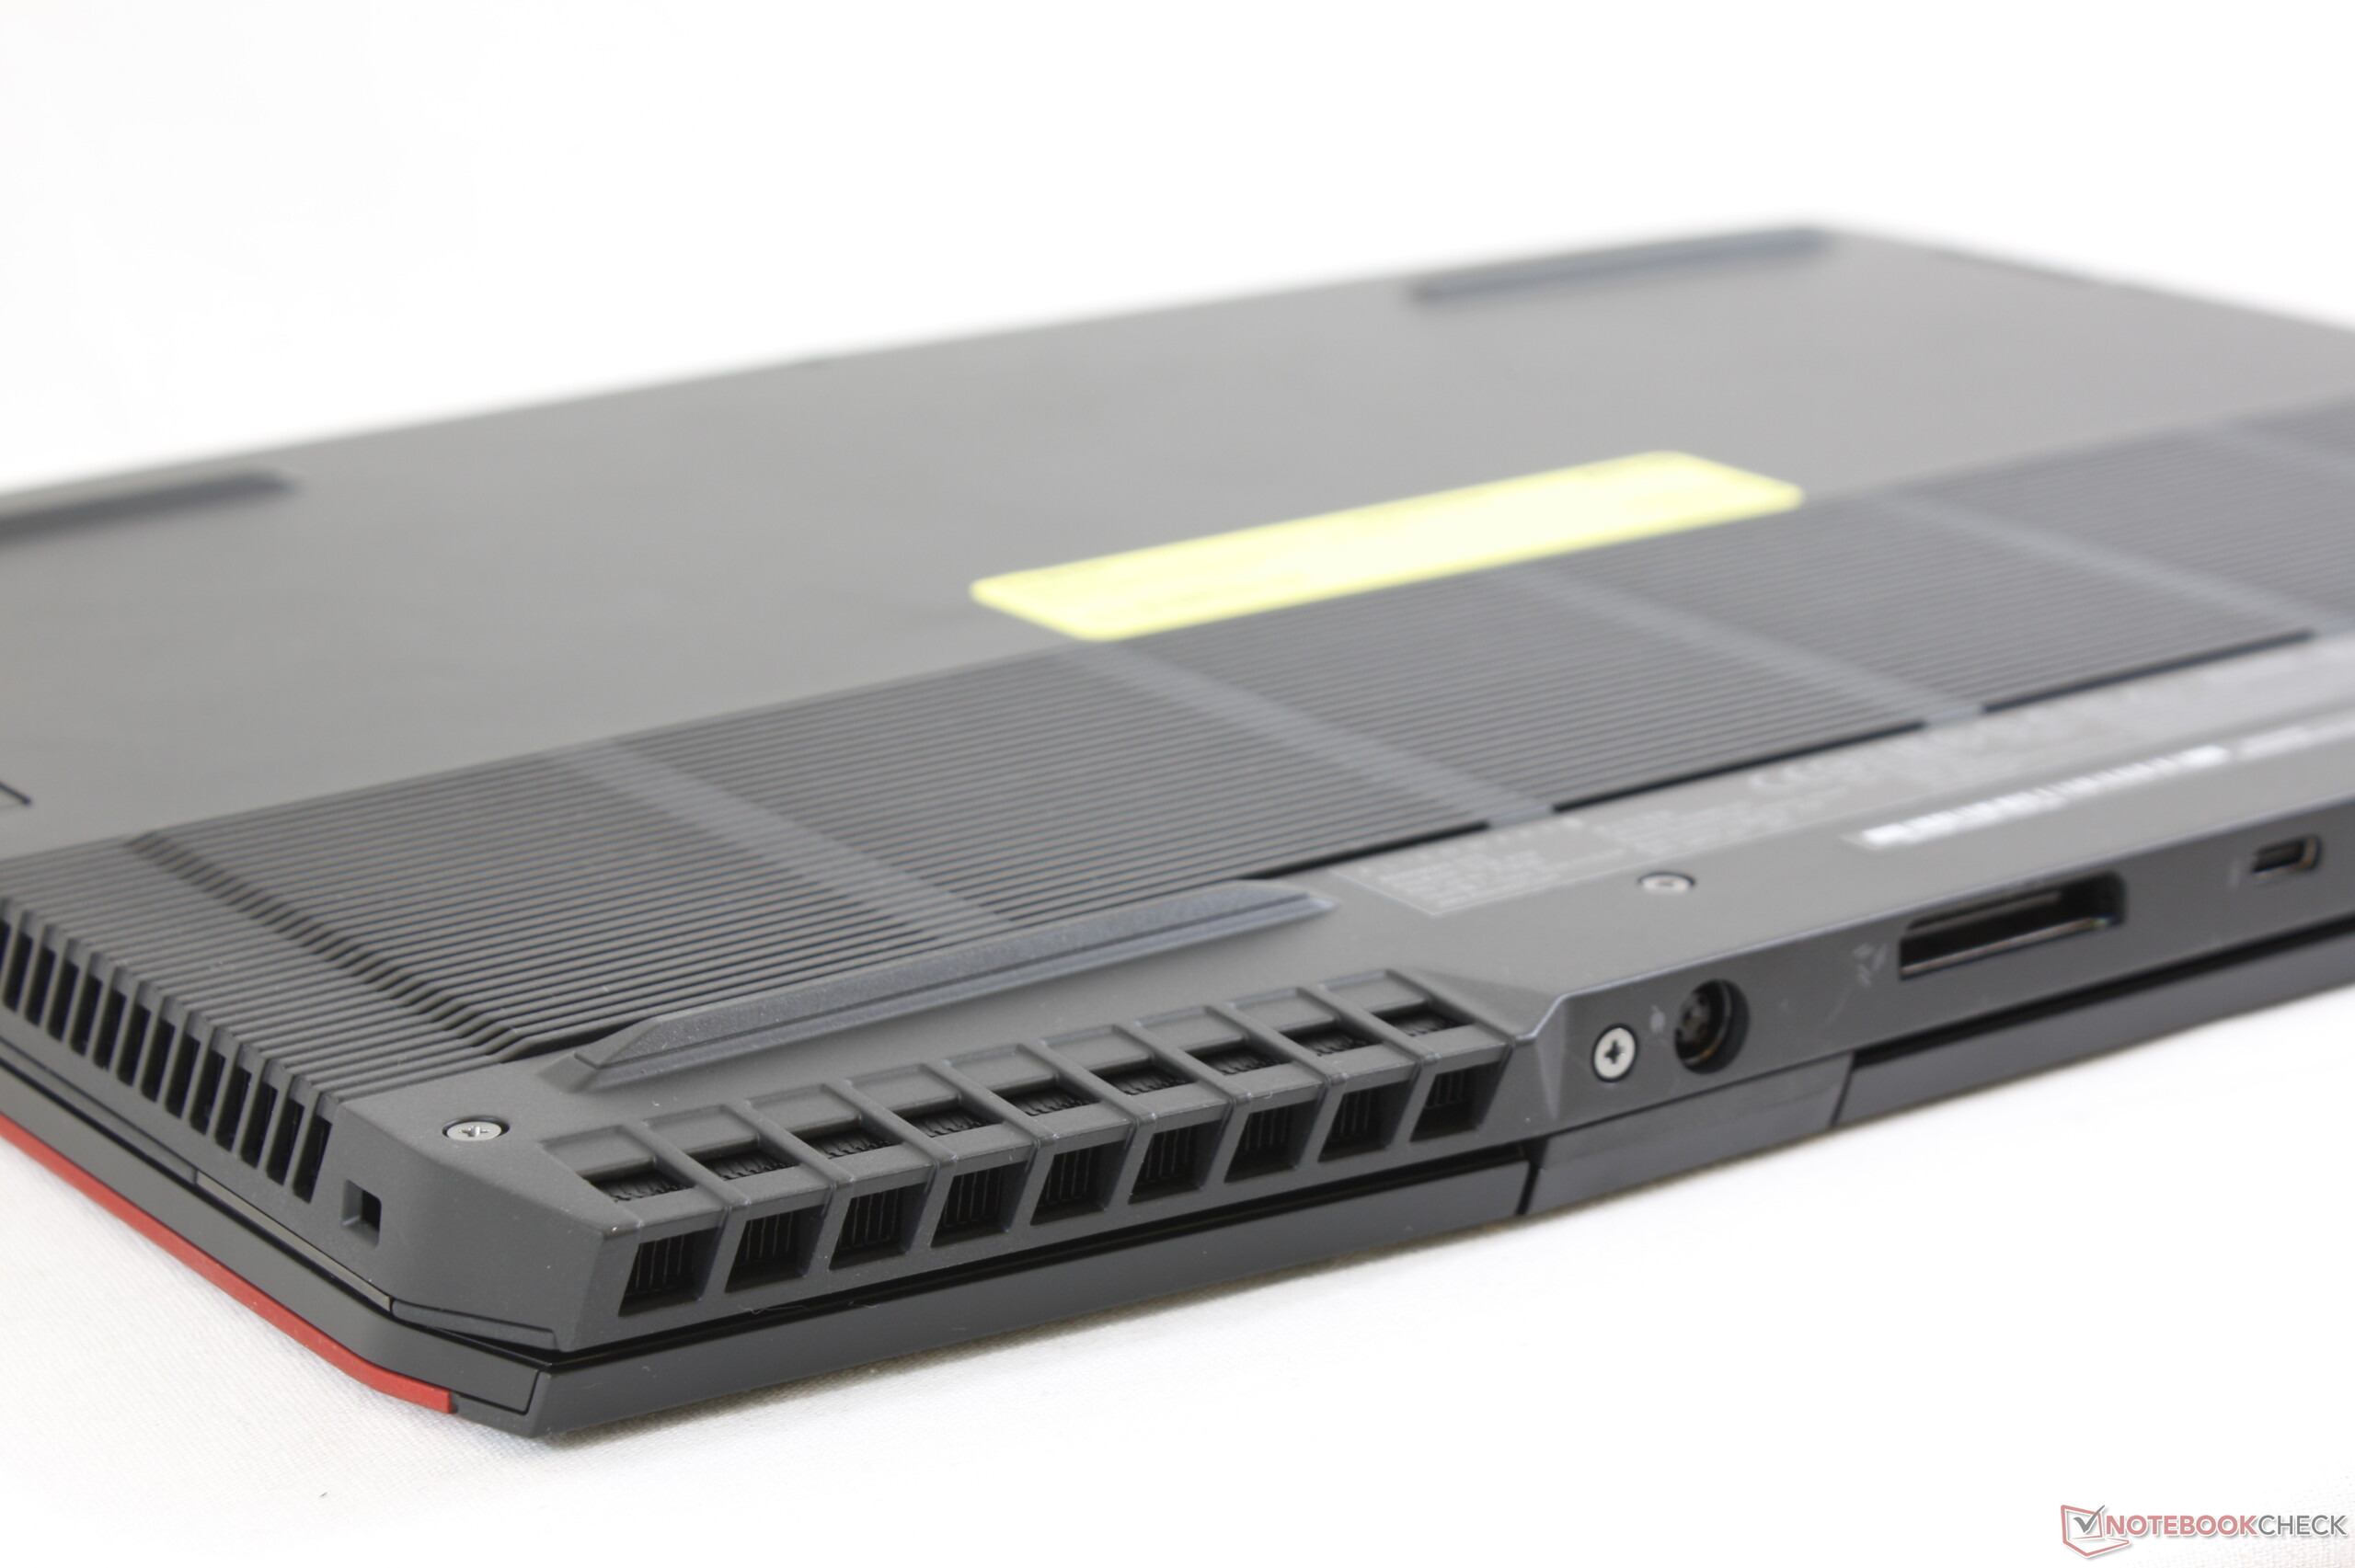
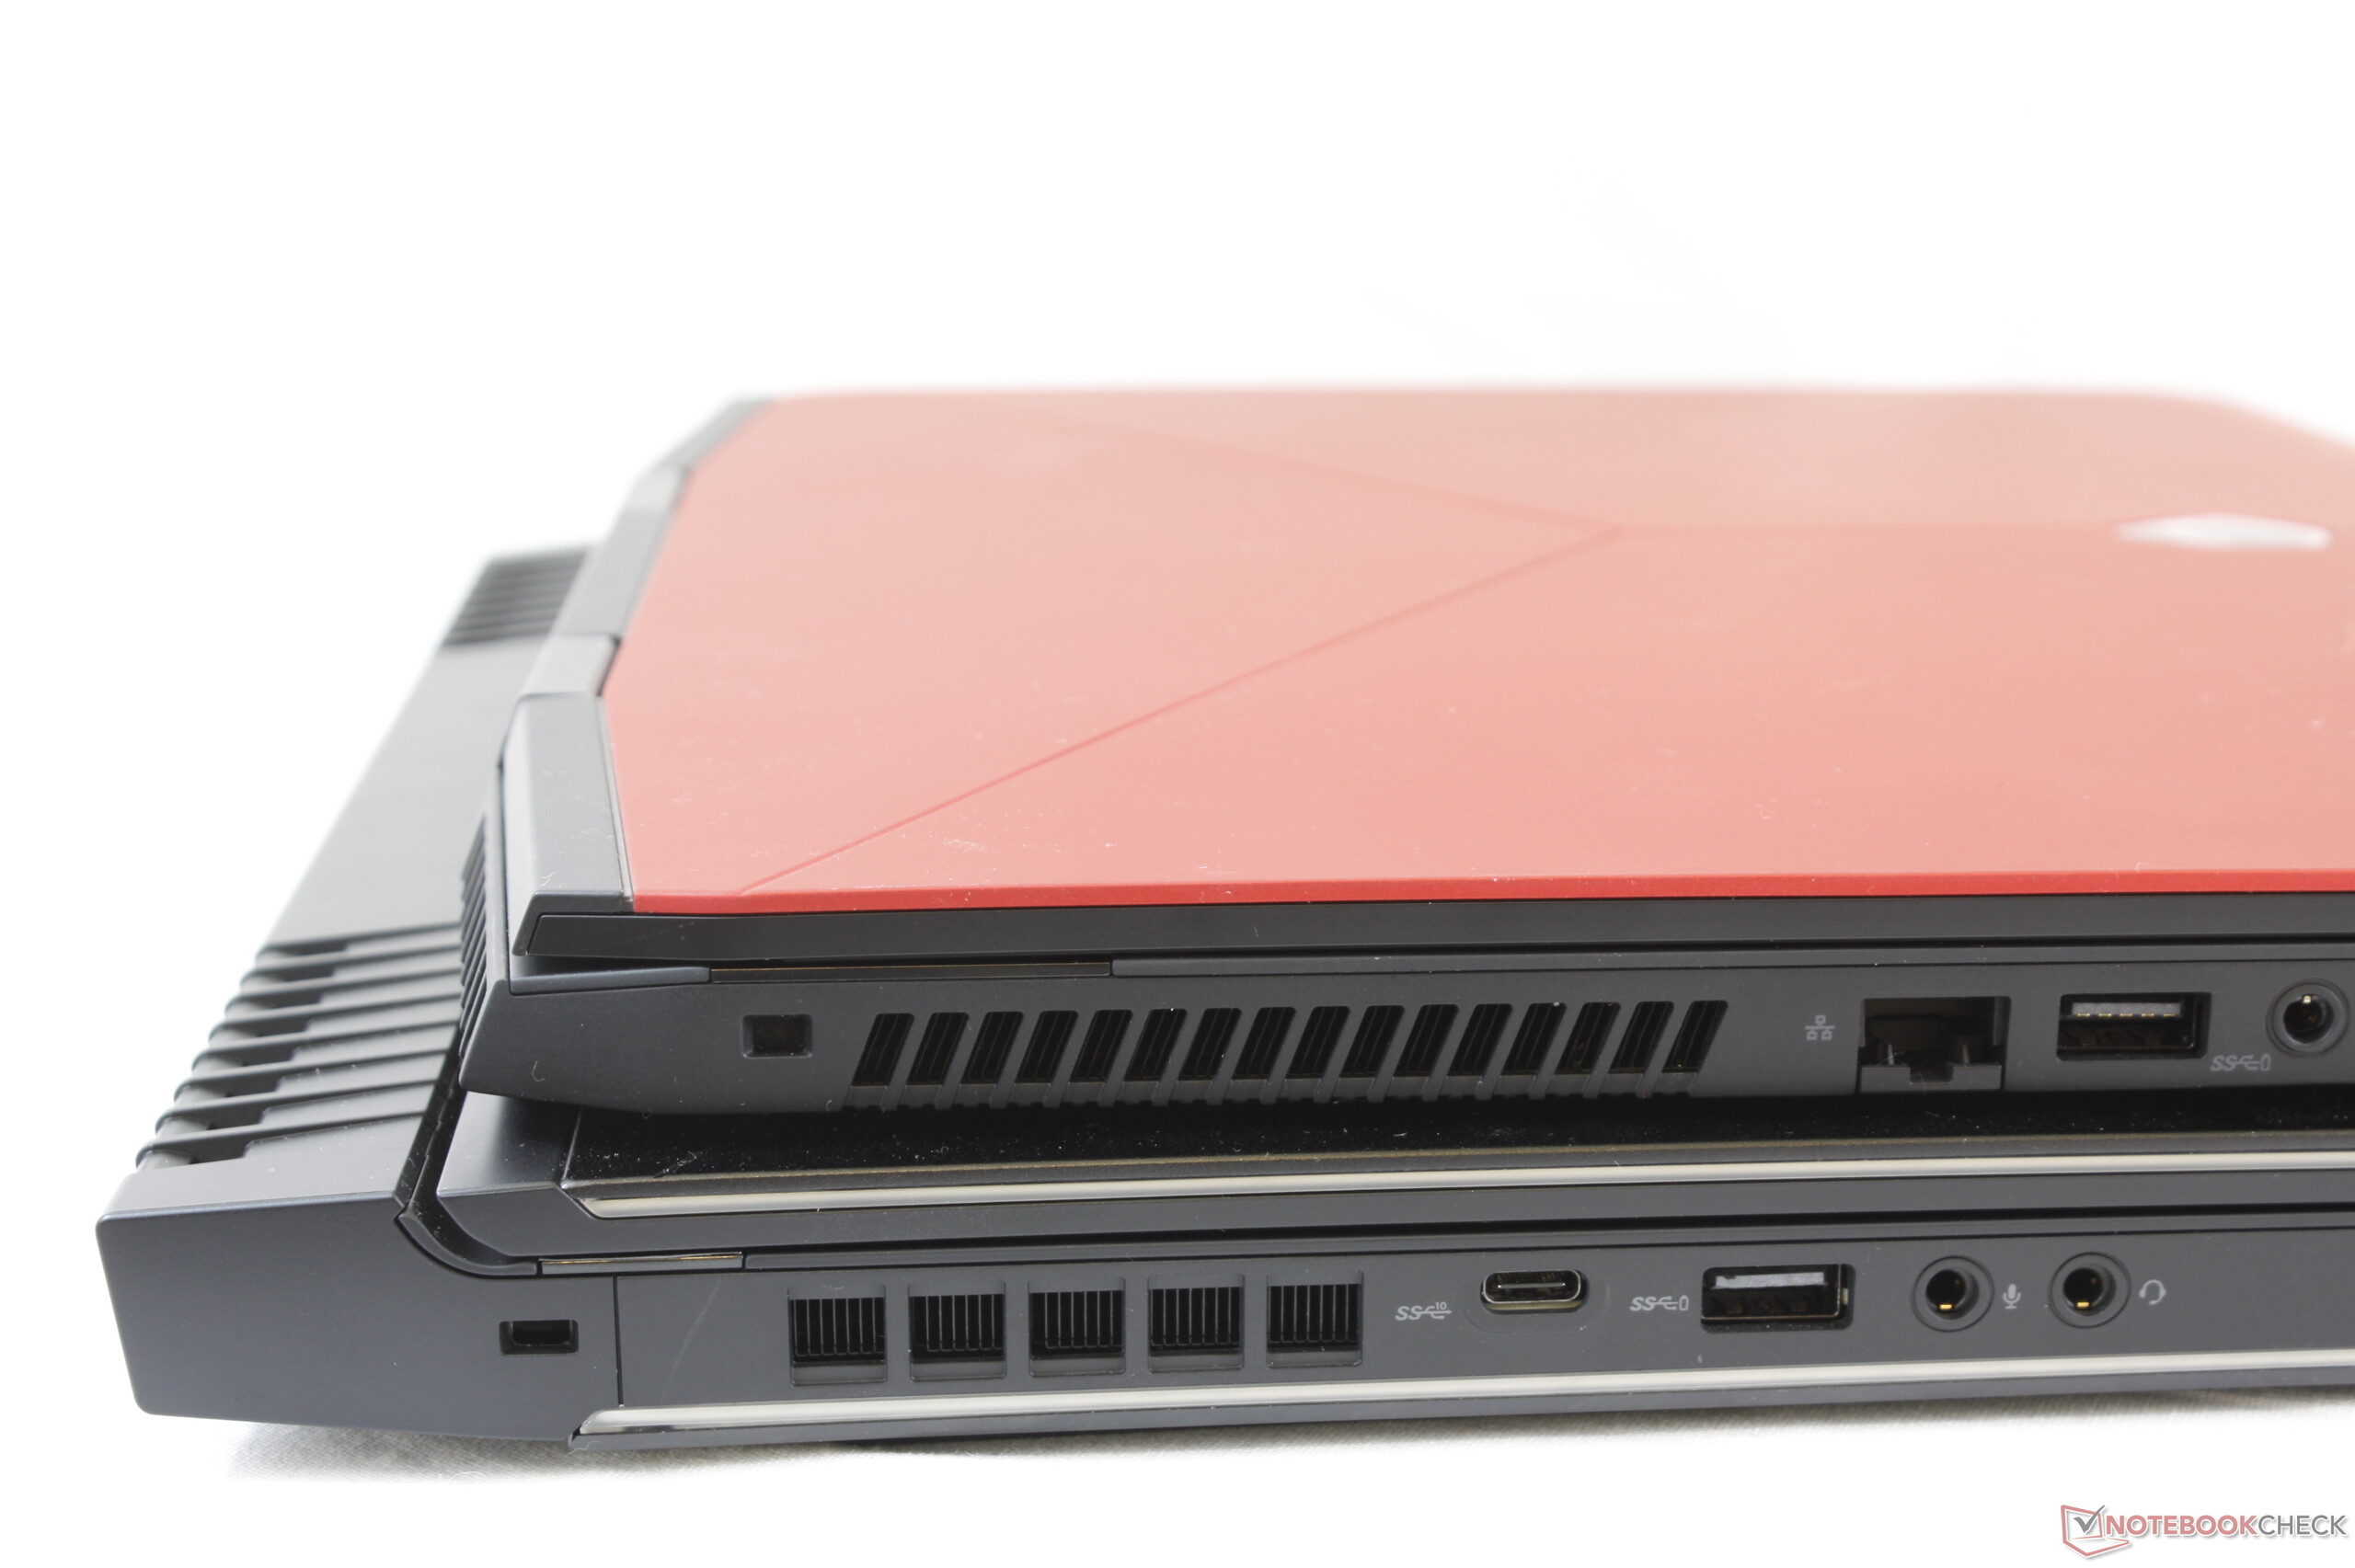
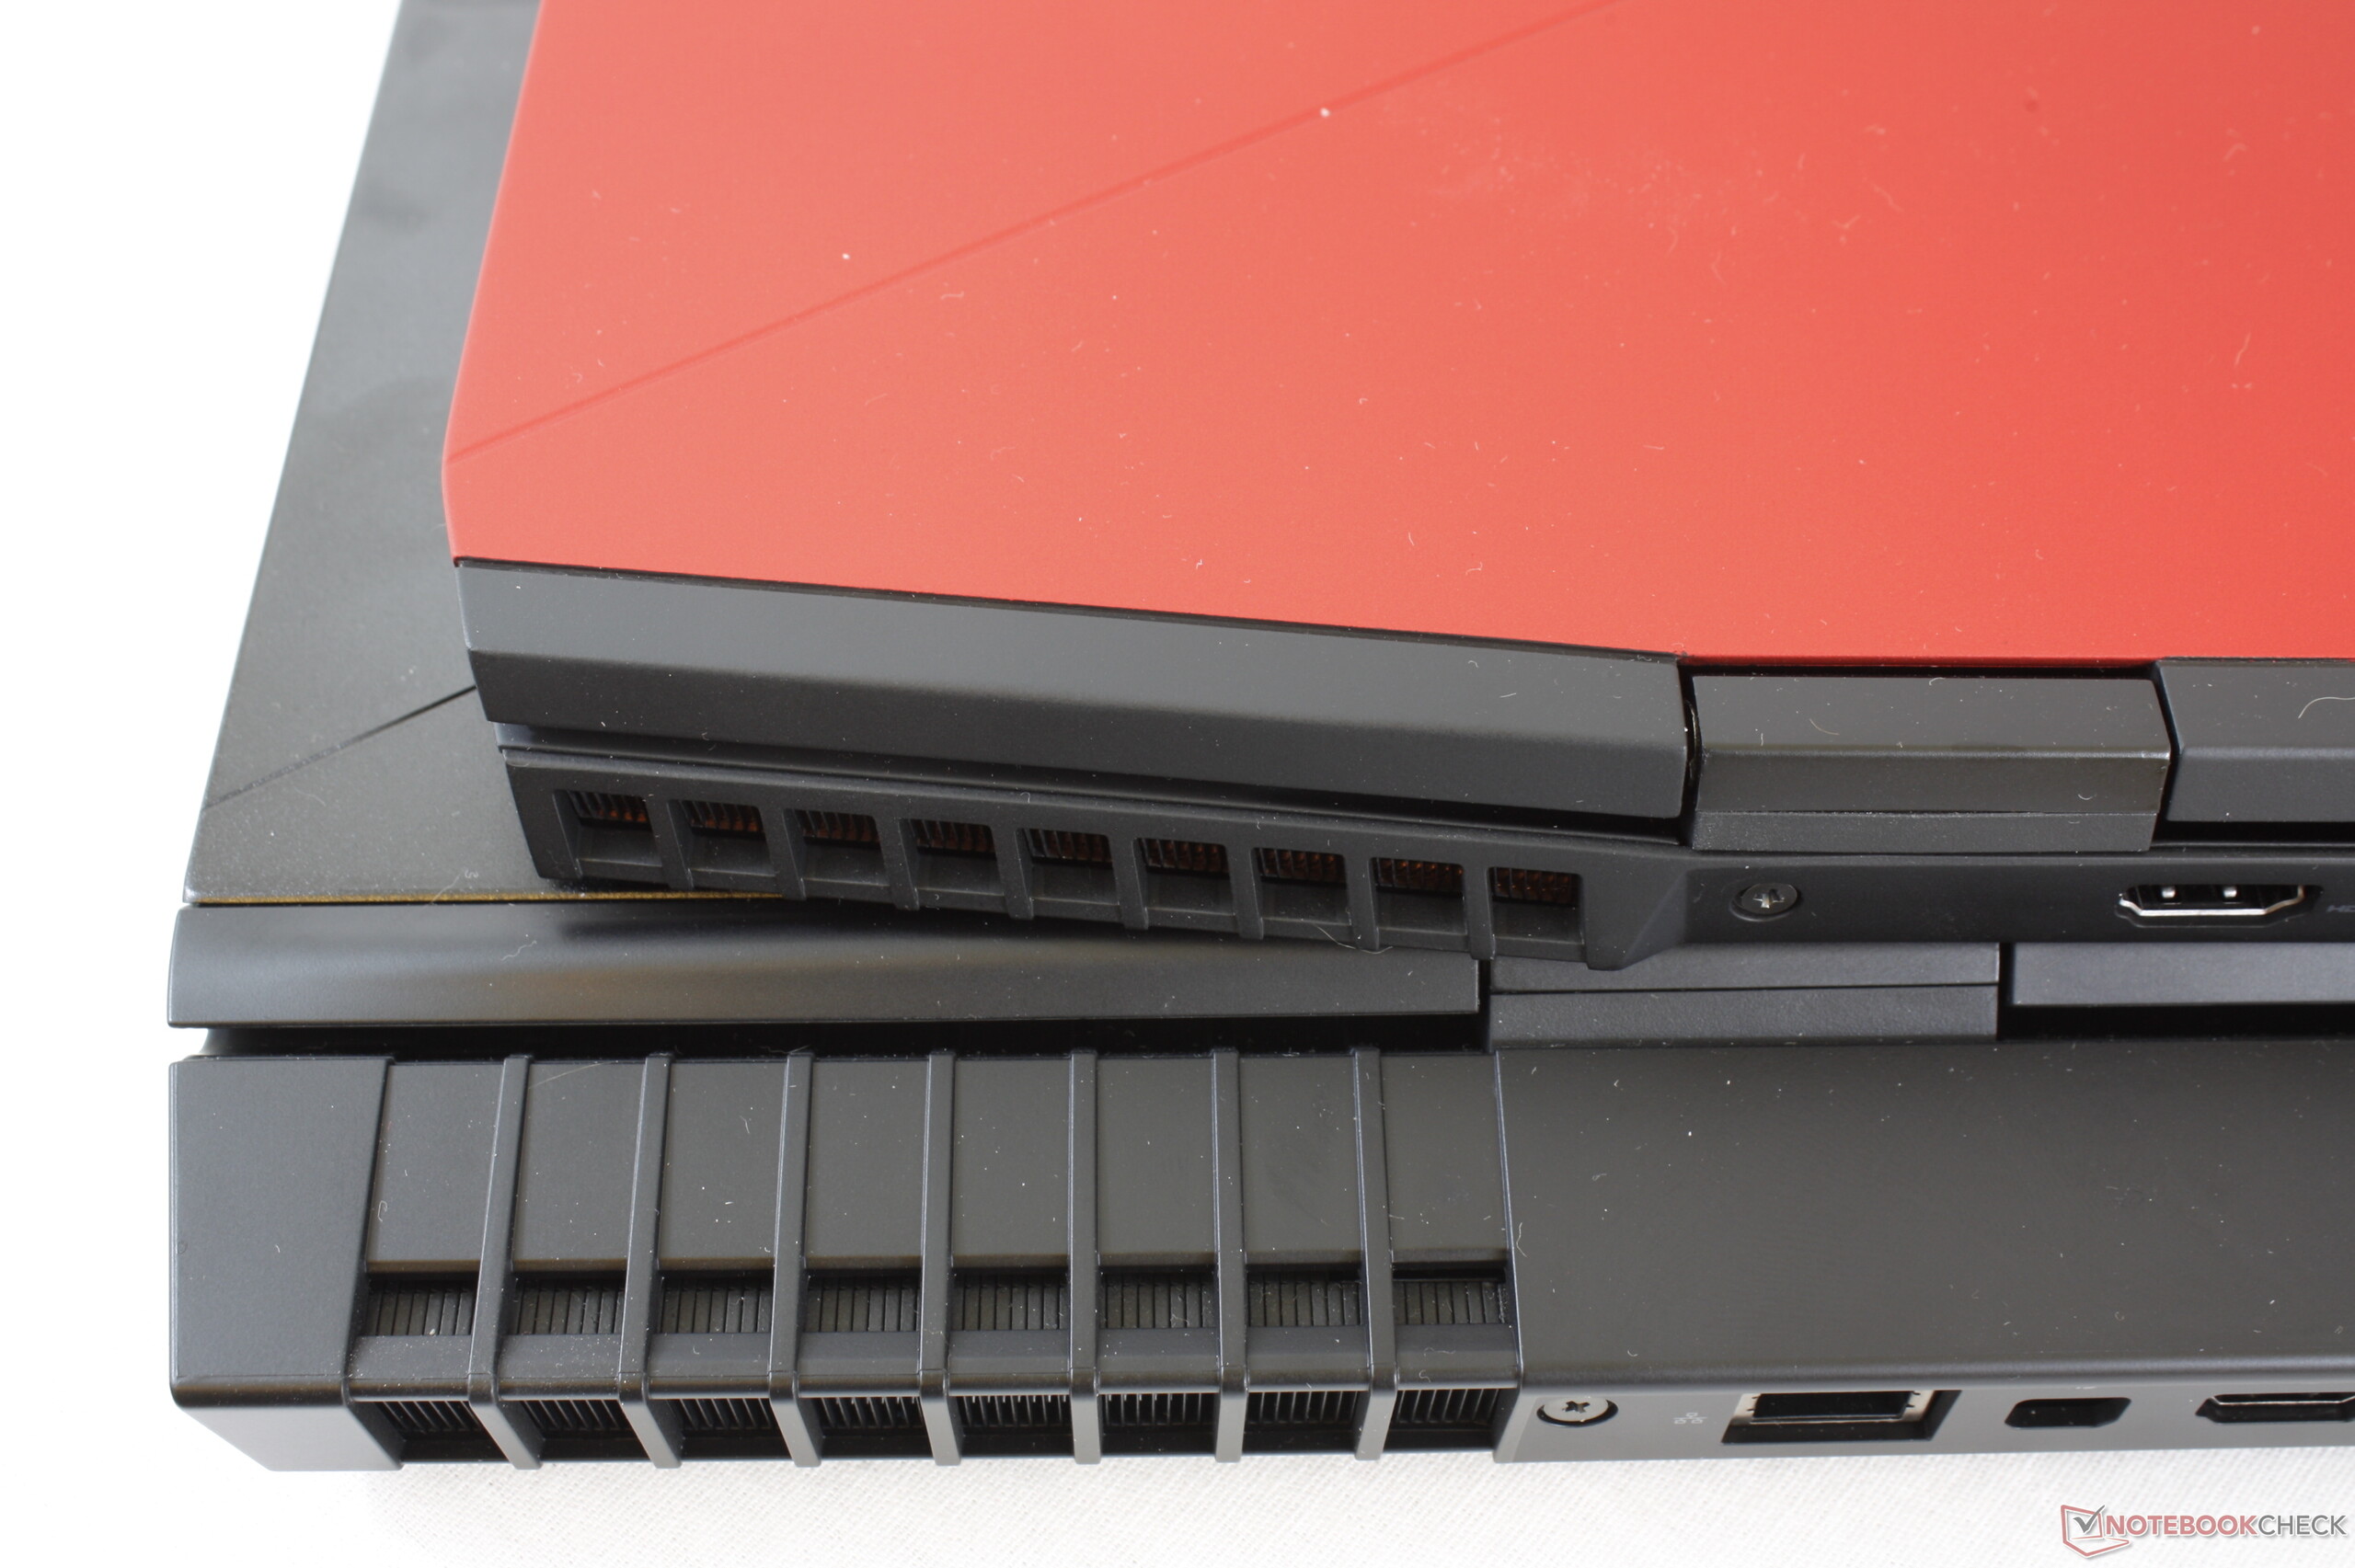
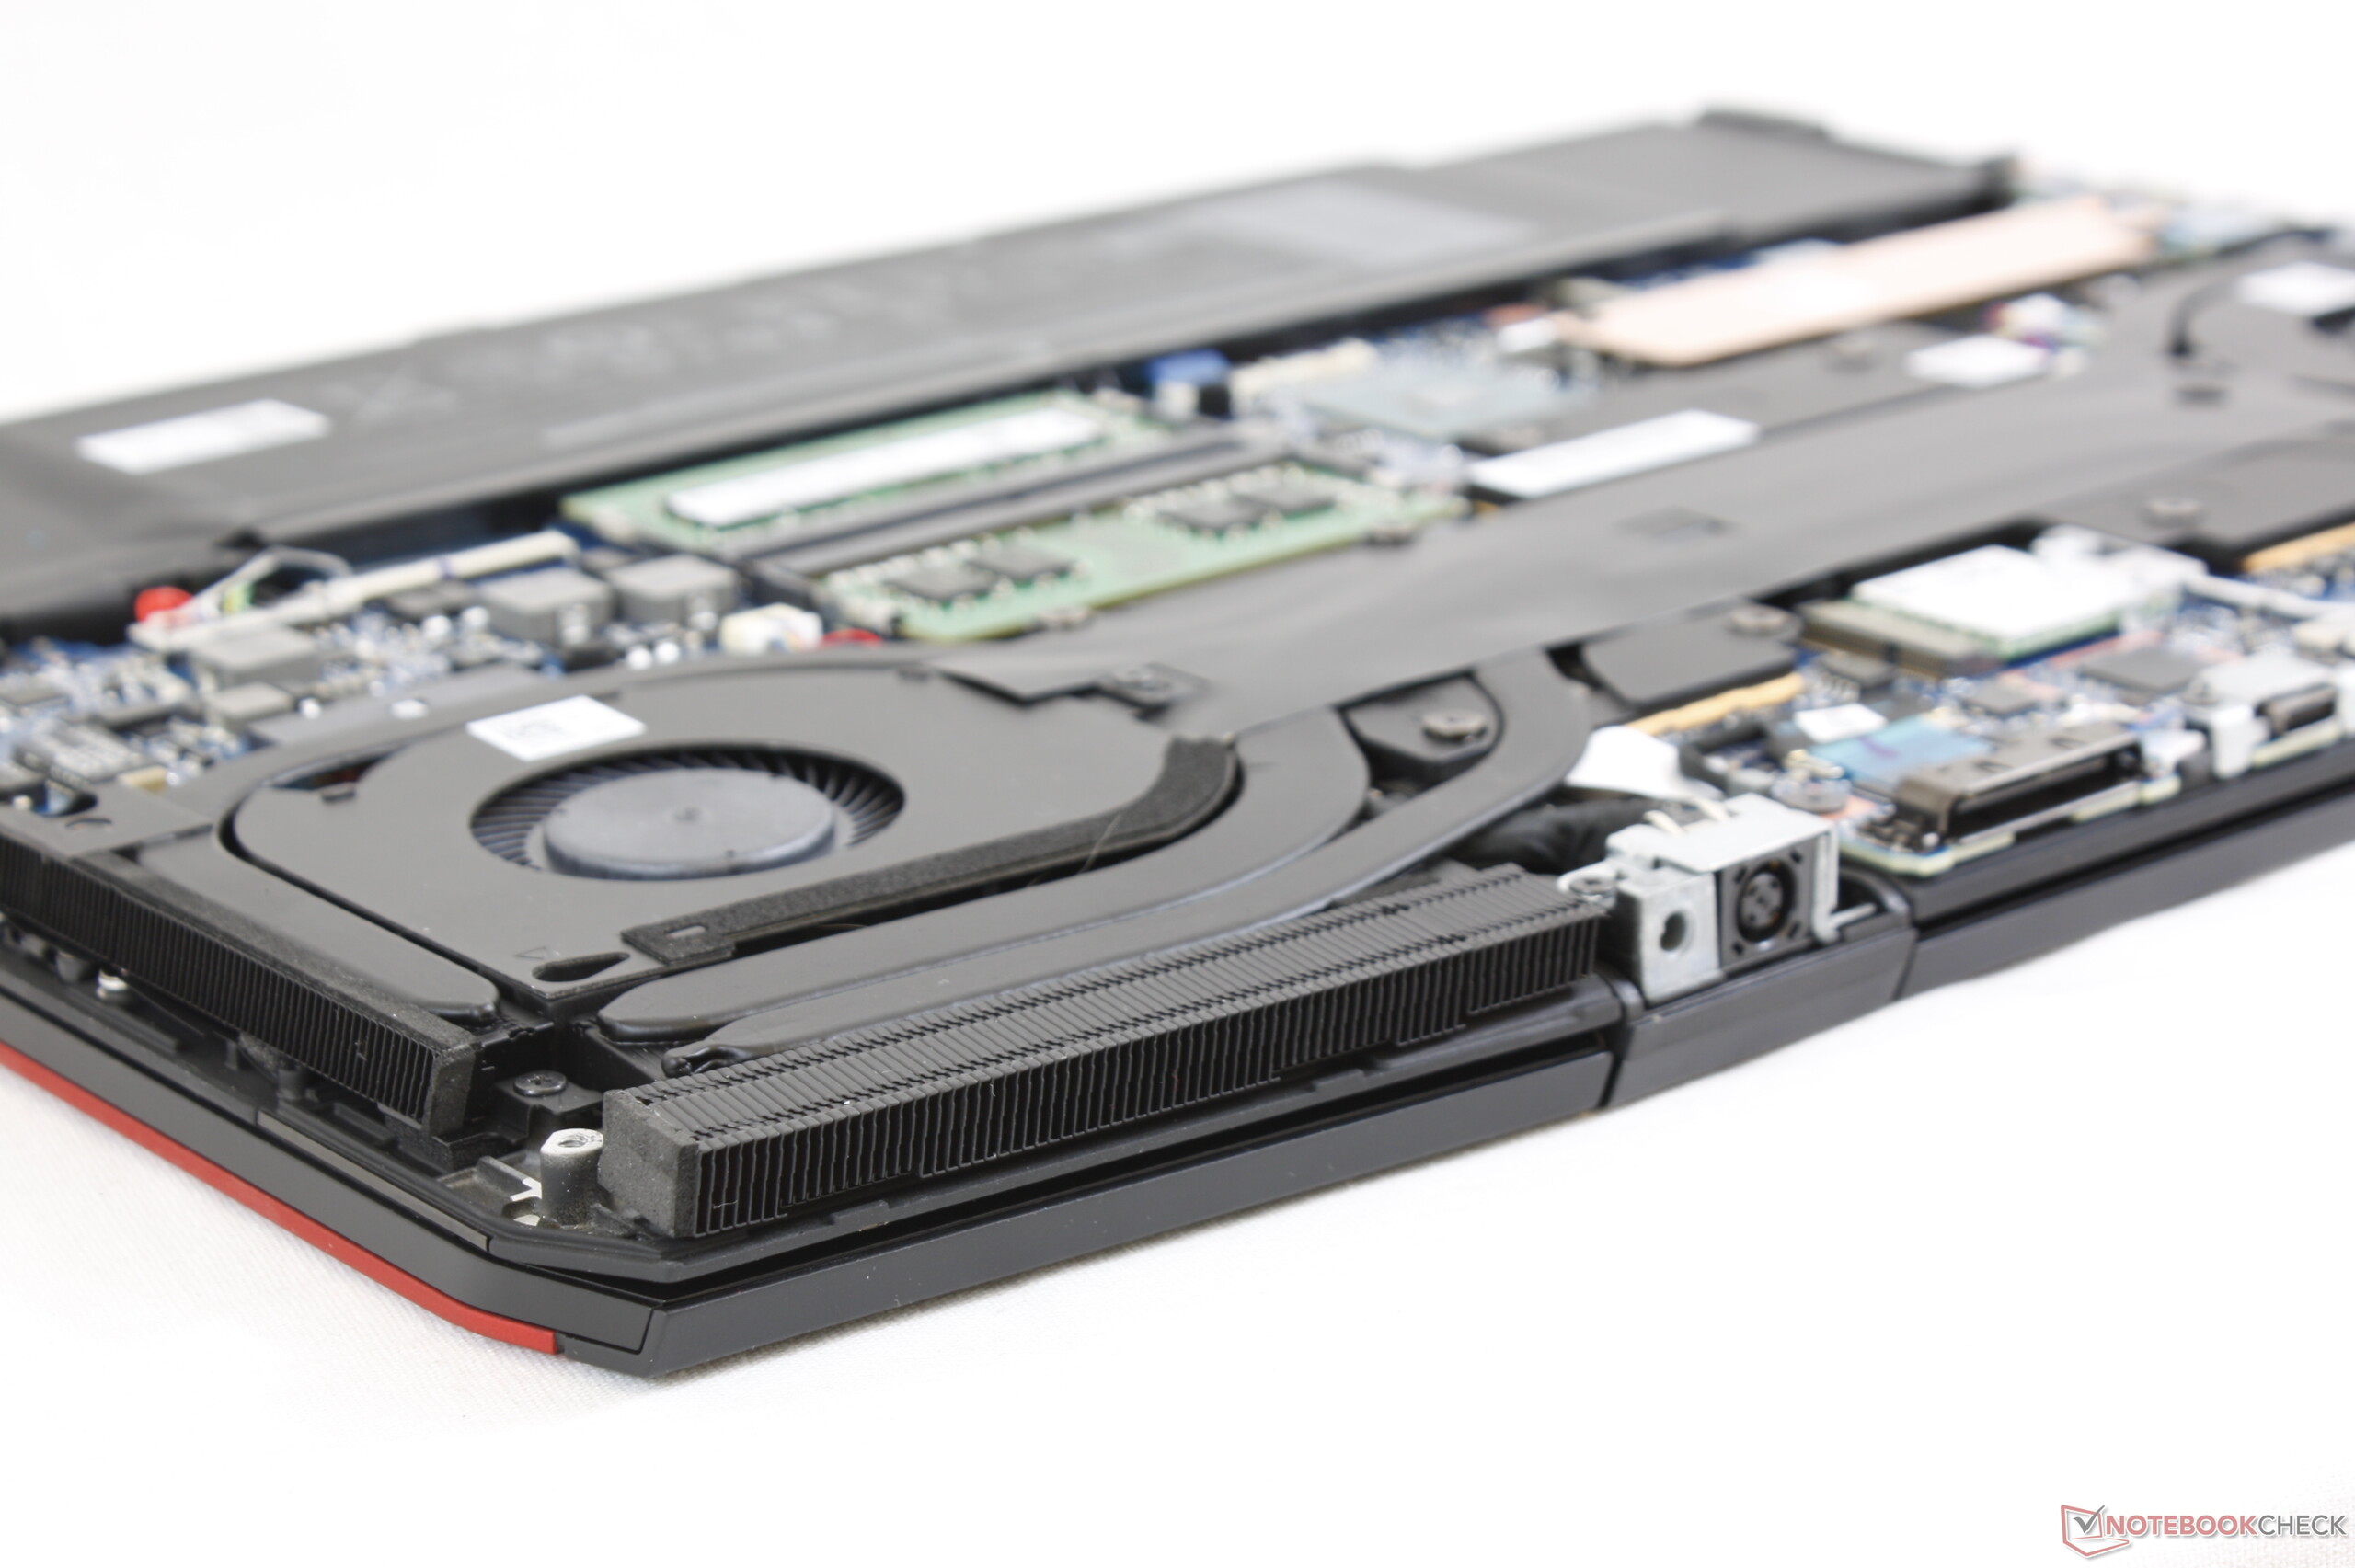
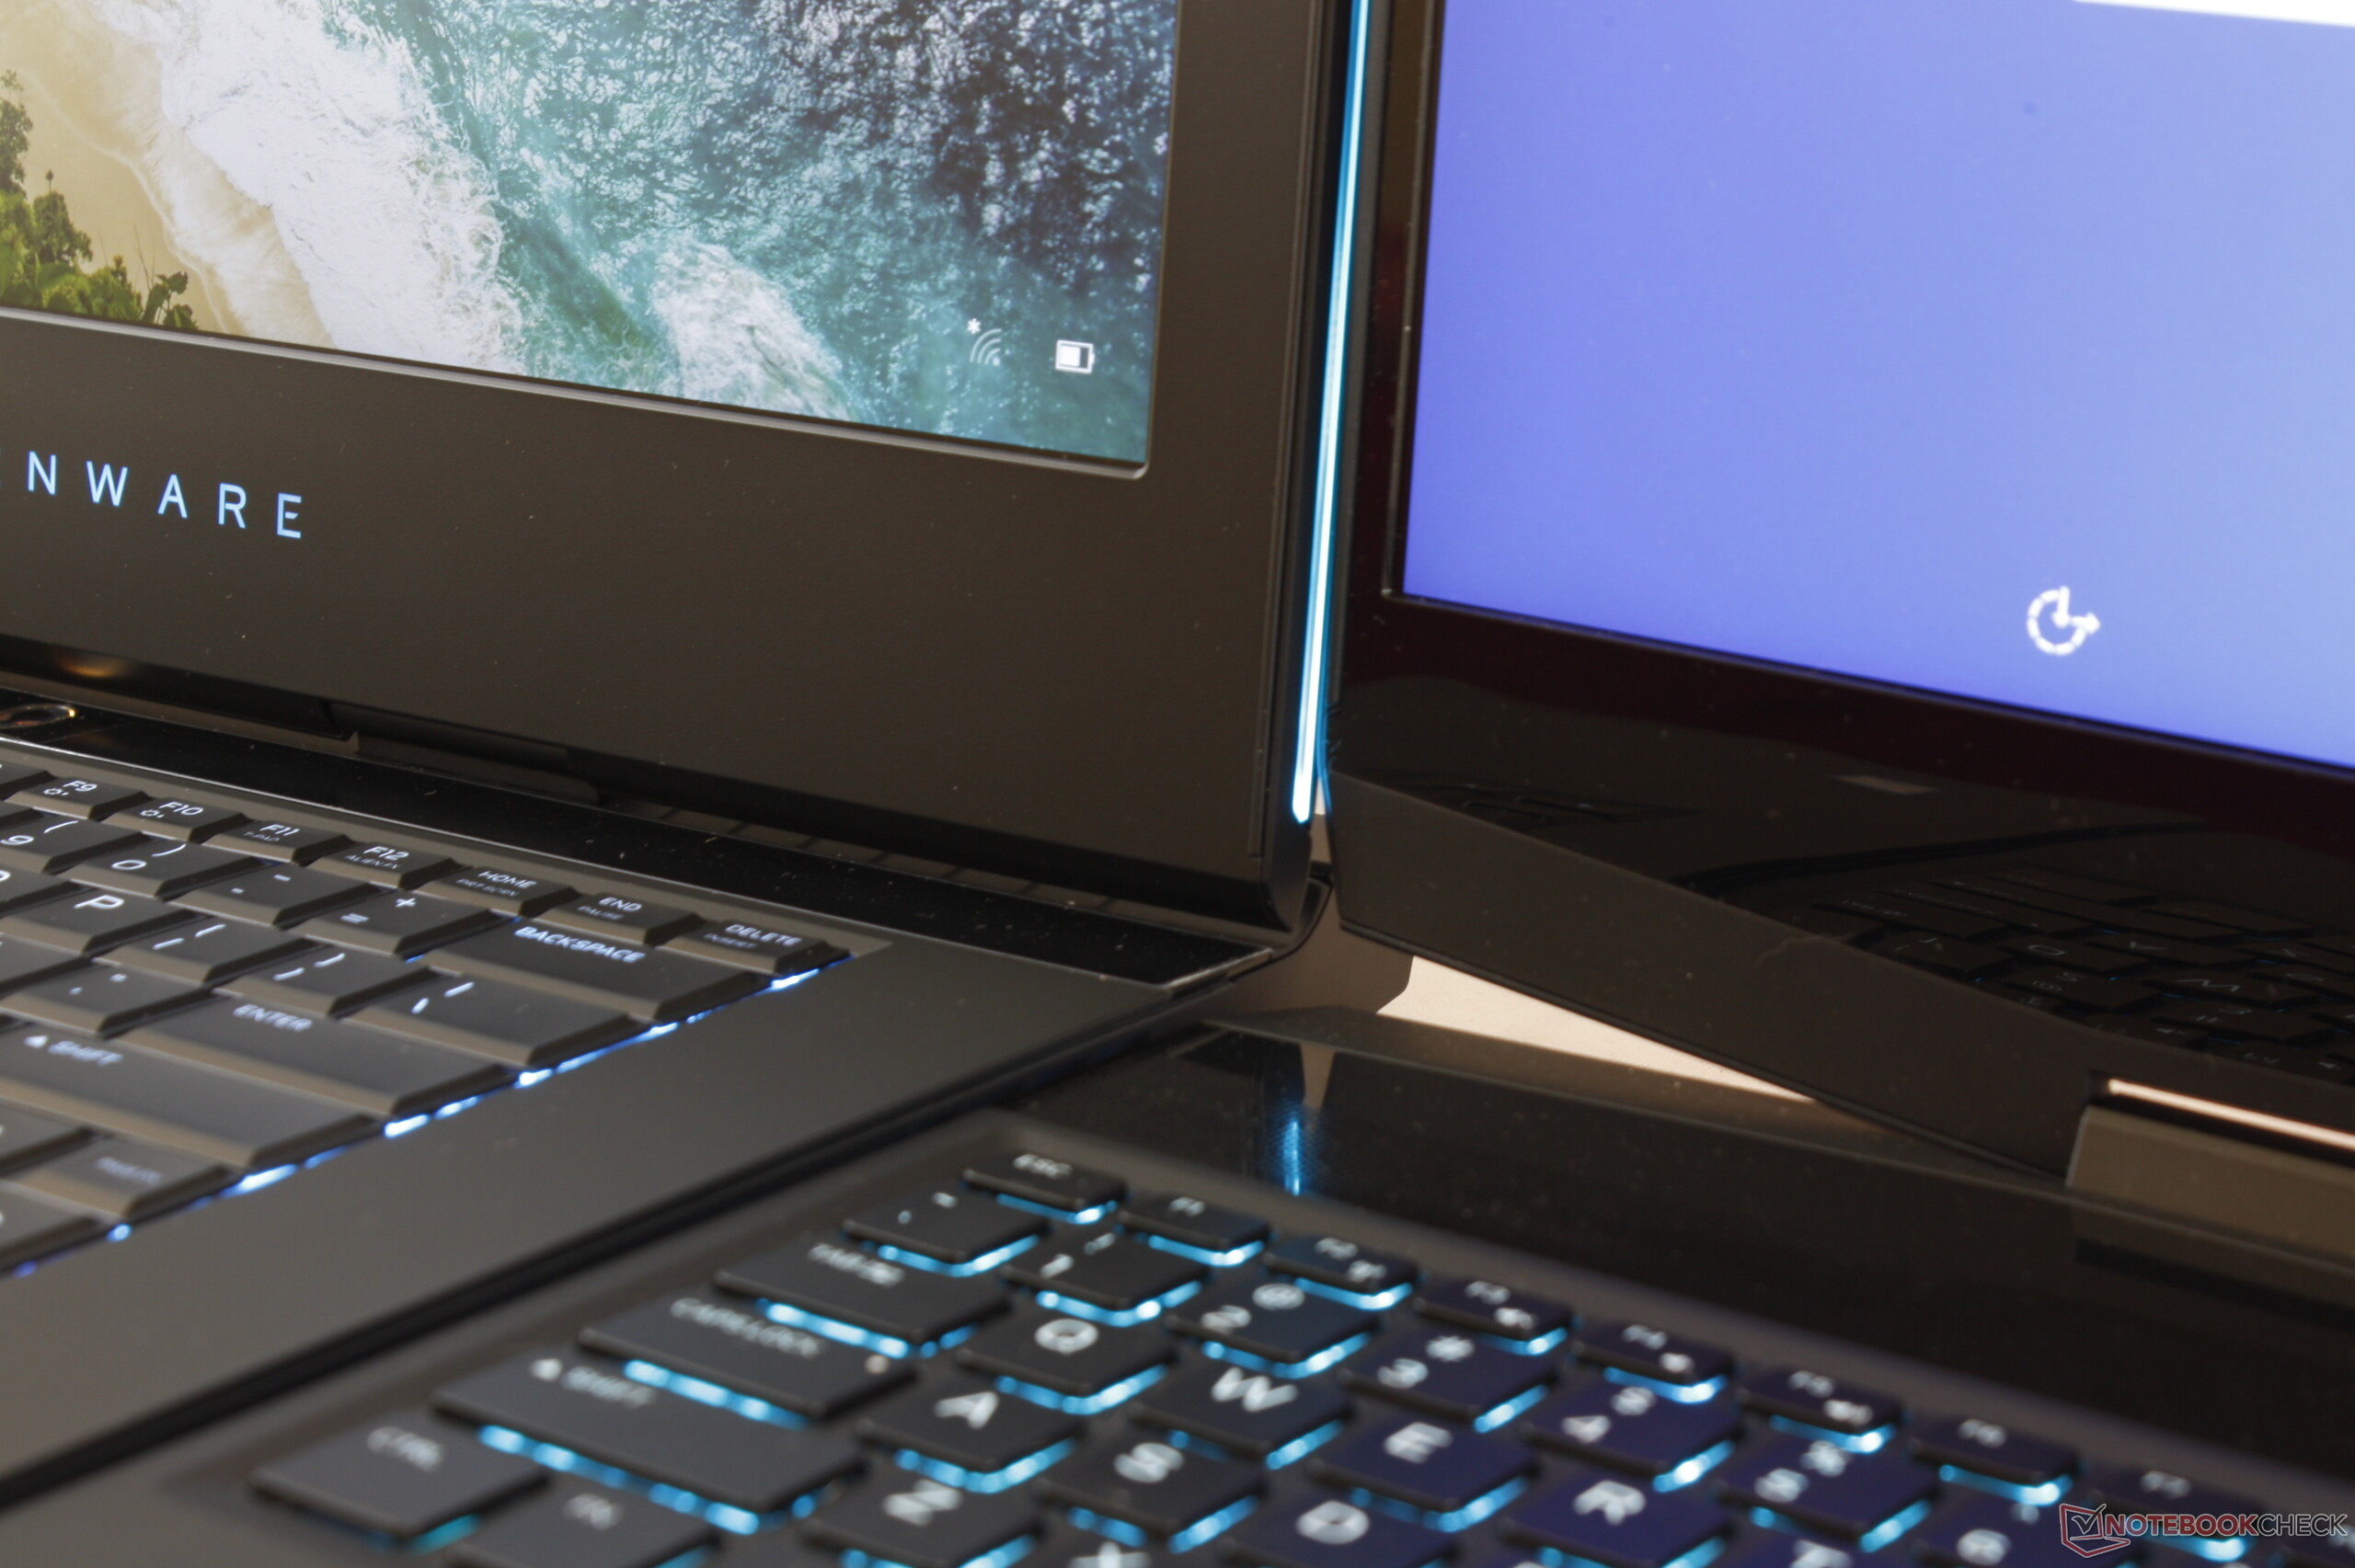
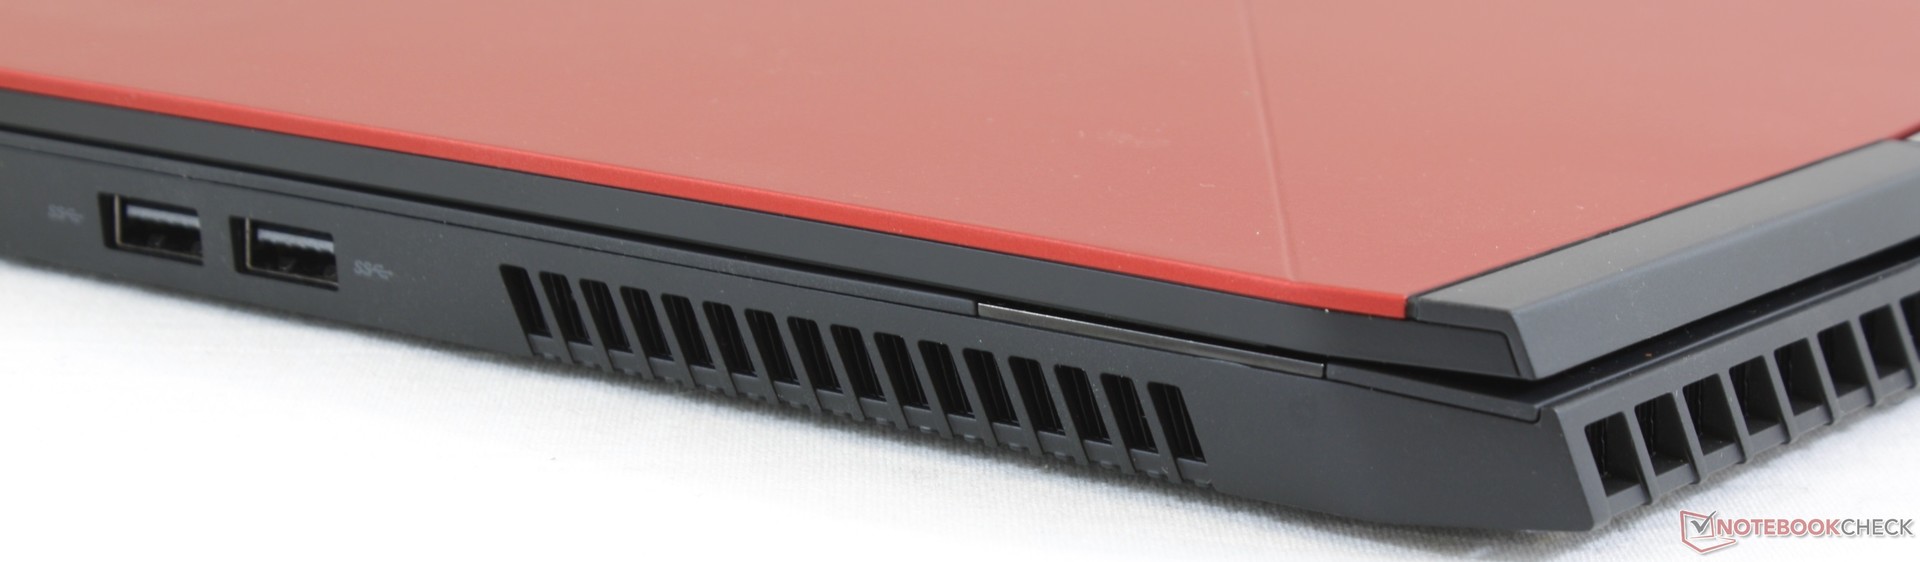
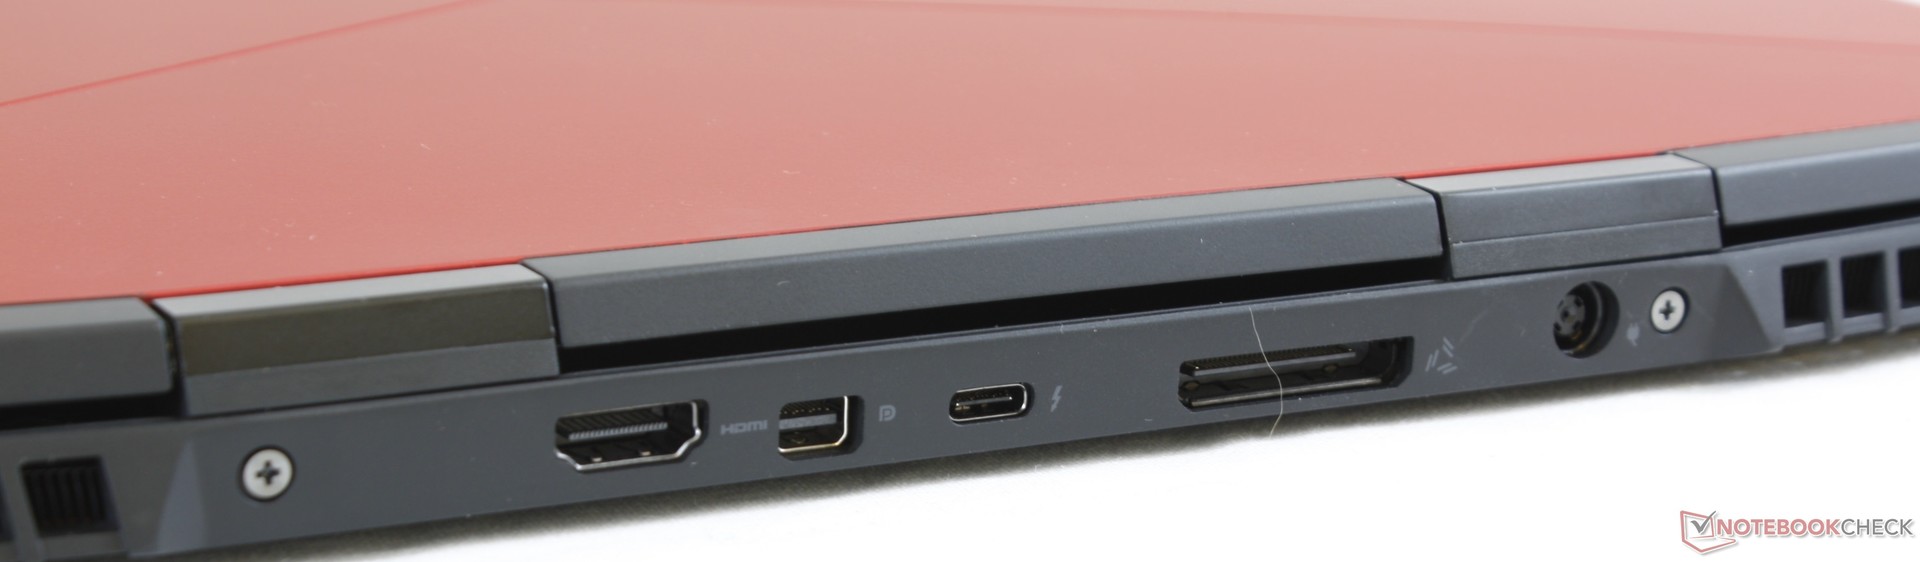
Alienwares bärbara datorer har traditionellt sett varit kända för att vara större, robustare och mer färgglada än sina konkurrenter. Alienware m15 var med tanke på detta antagligen en stor designutmaning då den behövde balansera alla tidigare nämnda egenskaper men ändå se lika tunn och liten ut som Razer Blade 15 eller MSI GS65. Det stämmer att det nya chassit är en aning svagare jämfört med den ordinarie Alienware 15 R4 och den har ett antal mindre nedskärningar när det kommer till portutbud, RGB-belysning, gångjärnens stabilitet, lagringsplatserna och batterikapaciteten. Men ett betydligt lättare paket kan för många användare mycket väl vara värt detta. Faktum är att den till och med har en del funktioner som inte finns på det större alternativet, vilket inkluderar längre batteritid och ett dedikerat numeriskt tangentbord.
Att jämföra Alienware m15 med GS65, Blade 15, Aero 15x, Zephyrus GX531 eller Predator Triton 700 hade varit ett mer rättvist test. Systemet är tjockare och tyngre än många av dessa ultratunna alternativ, men det är också kraftigare byggt än de flesta andra och har fördelar i form av längre batteritid och fler alternativ för intern lagring. Den största överraskningen är kanske processorns utmärkta förmåga att upprätthålla Turbo Boost, vilket ger den bättre CPU-prestanda än andra ultratunna modeller utrustade med samma i7-8750H processor, vilket inkluderar Blade 15.
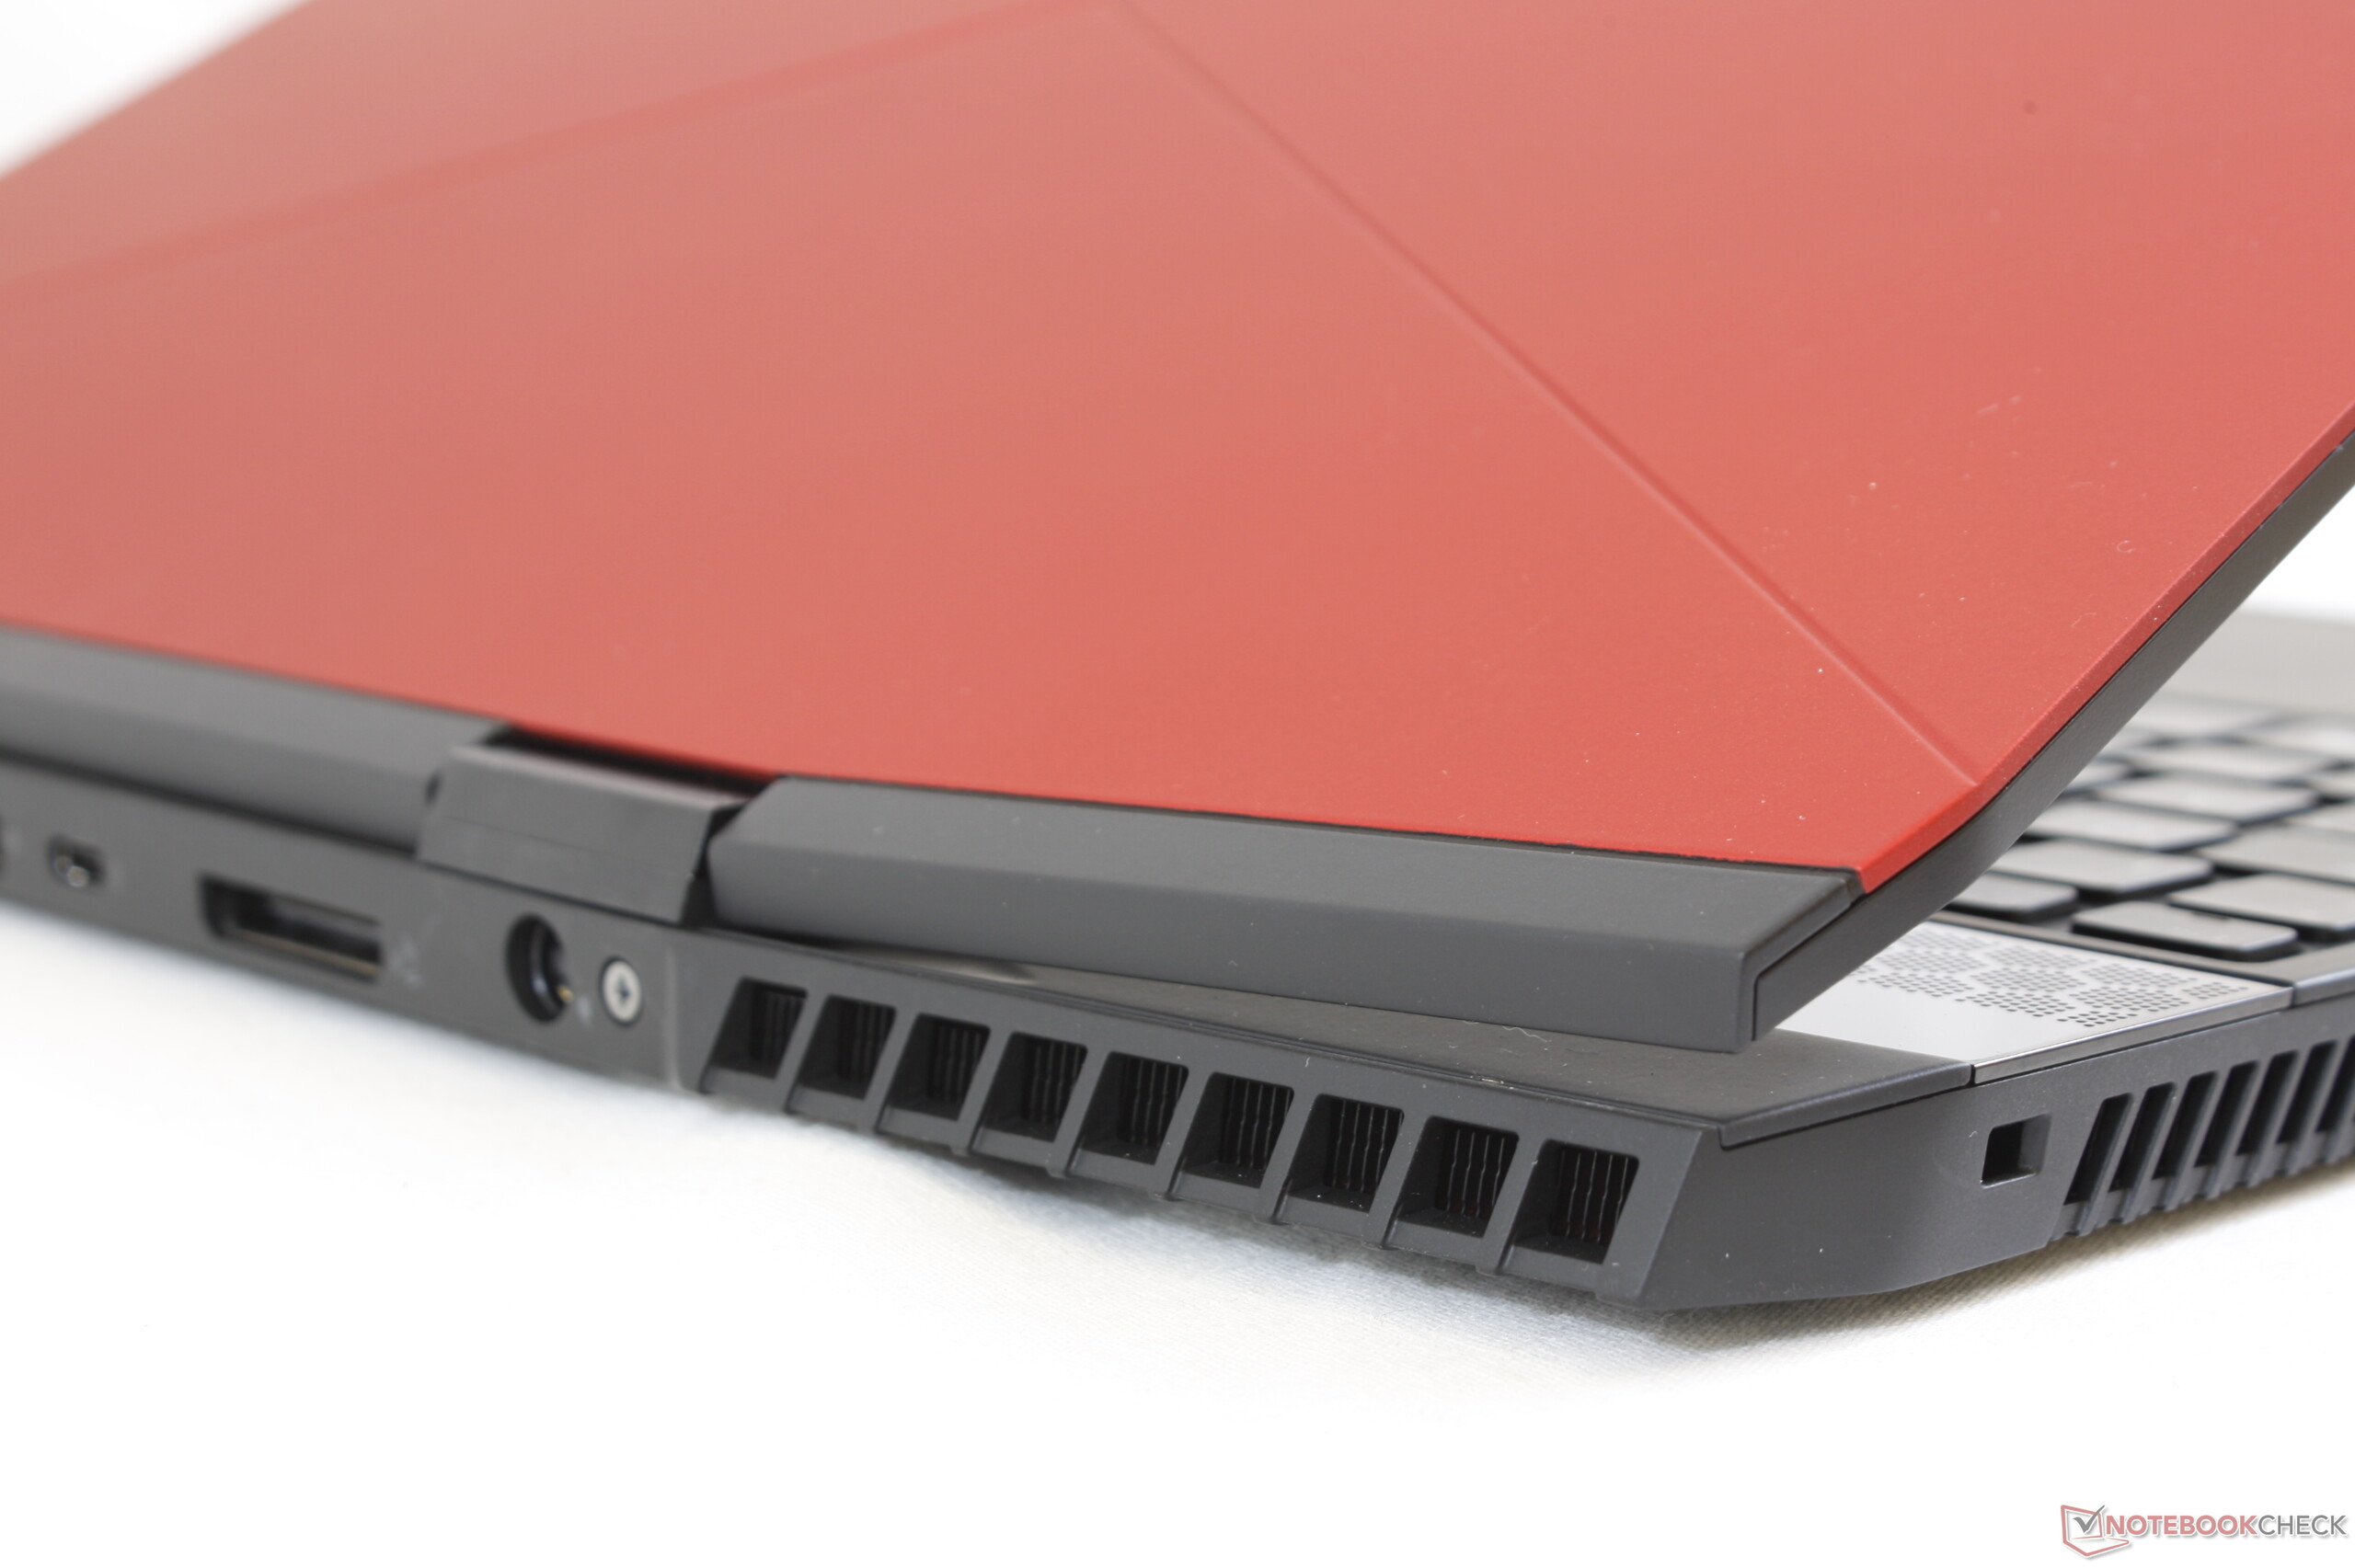
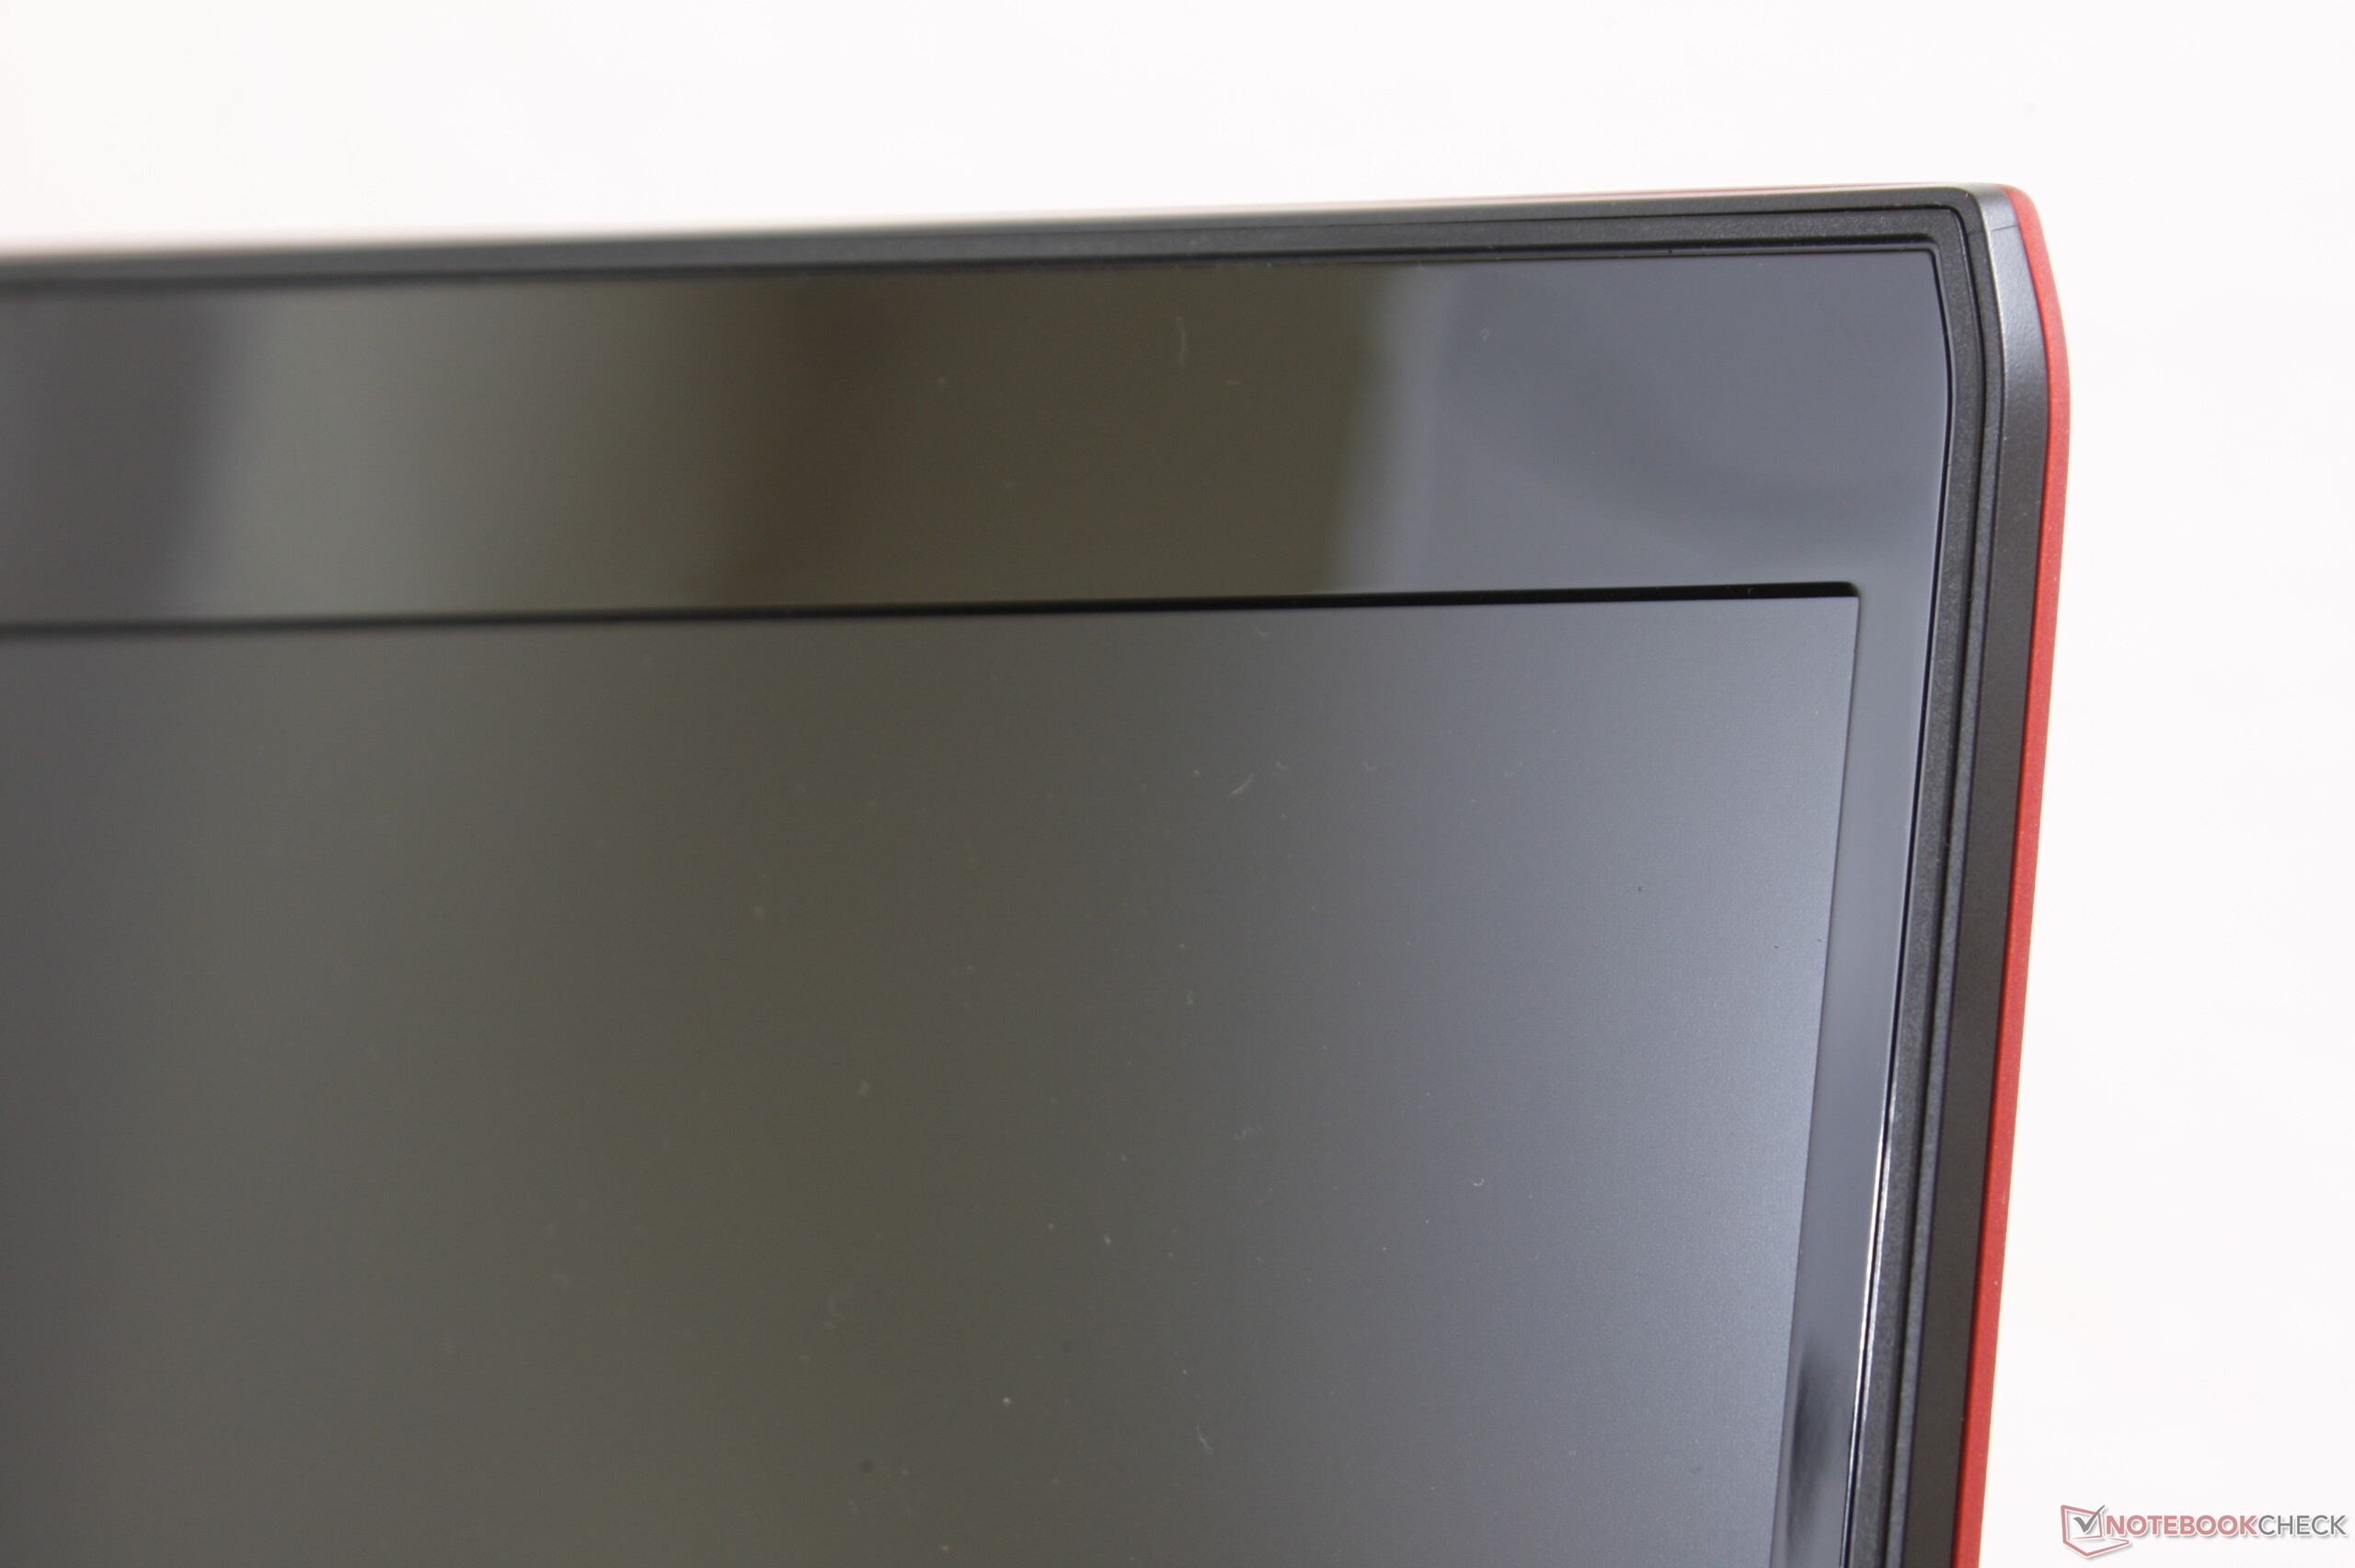
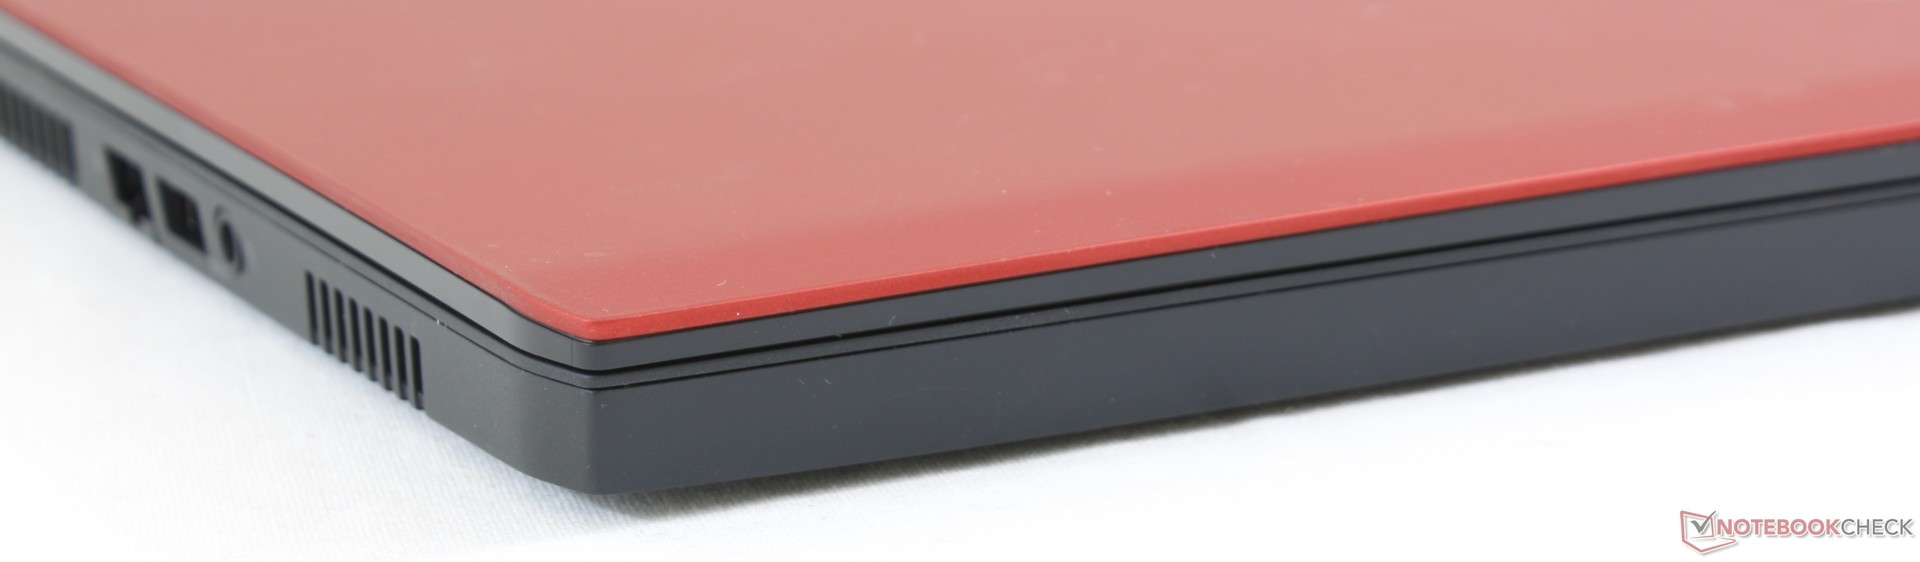
Det finns ett antal nackdelar som hindrar m15 från att vara högsta hönset i den ultratunna kategorin. Utöver dess aningen tjockare profil så är avsaknaden av tangentspecifik RGB-belysning en brist. Det är inget speciellt med tangenternas återkoppling, styrplattans återkoppling, fläktens ljudnivå eller högtalarnas kvalitet och alla dessa är genomsnittliga för den här storleksklassen. Utseendemässigt kan en del användare tänkas ogilla den blanka infattningen, det fingeravtrycksbenägna handledsstödet och de svåråtkomliga portarna. Men trots det så bör alla som funderar på Alienware 15 R4 eller en ultratunn spellaptop ta en titt på Alienware m15 då den har en del fördelar som konkurrerande modeller inte har.
Alienware m15 fungerar bra som ett gediget mittenalternativ för gamers som vill ha en supertunn design utan att behöva offra den robusthet som större alternativ har. God förmåga att upprätthålla Turbo Boost och lång batteritid är oväntade fördelar gentemot konkurrenterna med tanke på chassits ringa storlek.
Alienware m15 GTX 1070 Max-Q
- 12/11/2018 v6 (old)
Allen Ngo
Price comparison
