Test: Alienware m15 P79F (i7-8750H, RTX 2070 Max-Q, OLED) (Sammanfattning)

| Networking | |
| iperf3 transmit AX12 | |
| Razer Blade 15 RTX 2080 Max-Q | |
| Asus Zephyrus S GX502GW | |
| Alienware m15 GTX 1070 Max-Q | |
| Alienware m15 P79F | |
| iperf3 receive AX12 | |
| Alienware m15 GTX 1070 Max-Q | |
| Razer Blade 15 RTX 2080 Max-Q | |
| Asus Zephyrus S GX502GW | |
| Alienware m15 P79F | |
| |||||||||||||||||||||||||
Distribution av ljusstyrkan: 90 %
Mitt på batteriet: 452.1 cd/m²
Kontrast: ∞:1 (Svärta: 0 cd/m²)
ΔE ColorChecker Calman: 6.34 | ∀{0.5-29.43 Ø4.72}
ΔE Greyscale Calman: 2.8 | ∀{0.09-98 Ø4.97}
100% sRGB (Argyll 1.6.3 3D)
91% AdobeRGB 1998 (Argyll 1.6.3 3D)
100% AdobeRGB 1998 (Argyll 3D)
100% sRGB (Argyll 3D)
99.9% Display P3 (Argyll 3D)
Gamma: 2.21
CCT: 6114 K
| Alienware m15 P79F Samsung SDCA029, 156WR04, OLED, 15.6", 3840x2160 | Alienware m15 GTX 1070 Max-Q AU Optronics B156HAN, IPS, 15.6", 1920x1080 | Asus Zephyrus S GX502GW AU Optronics B156HAN08.2 (AUO82ED), IPS, 15.6", 1920x1080 | Aorus 15 W9 LG Philips LP156WFG-SPB2 (LGD05E8), IPS, 15.6", 1920x1080 | Dell XPS 15 9570 Core i9 UHD LQ156D1, IPS, 15.6", 3840x2160 | Lenovo Legion Y740-15ICHg LP156WFG-SPB2, IPS, 15.6", 1920x1080 | |
|---|---|---|---|---|---|---|
| Display | -27% | -26% | -25% | -14% | -26% | |
| Display P3 Coverage (%) | 99.9 | 63.5 -36% | 64.9 -35% | 64.3 -36% | 79.6 -20% | 63.5 -36% |
| sRGB Coverage (%) | 100 | 89.4 -11% | 91 -9% | 93.5 -6% | 98.4 -2% | 92.4 -8% |
| AdobeRGB 1998 Coverage (%) | 100 | 64.5 -35% | 65.9 -34% | 65.6 -34% | 79.7 -20% | 64.7 -35% |
| Response Times | -507% | -230% | -502% | -1595% | -549% | |
| Response Time Grey 50% / Grey 80% * (ms) | 2.6 ? | 18 ? -592% | 7.2 ? -177% | 16.8 ? -546% | 52.4 ? -1915% | 18.8 ? -623% |
| Response Time Black / White * (ms) | 2.3 ? | 12 ? -422% | 8.8 ? -283% | 12.8 ? -457% | 31.6 ? -1274% | 13.2 ? -474% |
| PWM Frequency (Hz) | 60.2 ? | 1000 ? | ||||
| Screen | -9% | 4% | -15% | -28% | -4% | |
| Brightness middle (cd/m²) | 452.1 | 353.6 -22% | 286 -37% | 295 -35% | 451.9 0% | 320.4 -29% |
| Brightness (cd/m²) | 452 | 346 -23% | 275 -39% | 292 -35% | 414 -8% | 298 -34% |
| Brightness Distribution (%) | 90 | 86 -4% | 90 0% | 80 -11% | 81 -10% | 85 -6% |
| Black Level * (cd/m²) | 0.3 | 0.37 | 0.34 | 0.36 | 0.42 | |
| Colorchecker dE 2000 * | 6.34 | 4.55 28% | 2.19 65% | 3.89 39% | 5.62 11% | 3.21 49% |
| Colorchecker dE 2000 max. * | 12.97 | 7.91 39% | 4.4 66% | 7.28 44% | 19.1 -47% | 5.54 57% |
| Greyscale dE 2000 * | 2.8 | 4.1 -46% | 2.2 21% | 4.98 -78% | 6.9 -146% | 3.6 -29% |
| Gamma | 2.21 100% | 2.27 97% | 2.41 91% | 2.45 90% | 2.2 100% | 2.27 97% |
| CCT | 6114 106% | 7434 87% | 6405 101% | 6407 101% | 6254 104% | 6503 100% |
| Color Space (Percent of AdobeRGB 1998) (%) | 91 | 57.9 -36% | 59 -35% | 60 -34% | 71.8 -21% | 59 -35% |
| Color Space (Percent of sRGB) (%) | 100 | 88.9 -11% | 91 -9% | 93 -7% | 98.5 -1% | 92 -8% |
| Contrast (:1) | 1179 | 773 | 868 | 1255 | 763 | |
| Colorchecker dE 2000 calibrated * | 3.37 | 2.27 | 1.44 | 2.69 | 2.36 | |
| Totalt genomsnitt (program/inställningar) | -181% /
-90% | -84% /
-39% | -181% /
-92% | -546% /
-266% | -193% /
-93% |
* ... mindre är bättre
Visa svarstider
| ↔ Svarstid svart till vitt | ||
|---|---|---|
| 2.3 ms ... stiga ↗ och falla ↘ kombinerat | ↗ 1 ms stiga | 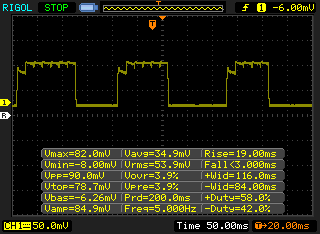 |
| ↘ 1.3 ms hösten | ||
| Skärmen visar väldigt snabba svarsfrekvenser i våra tester och borde vara mycket väl lämpad för fartfyllt spel. I jämförelse sträcker sig alla testade enheter från 0.1 (minst) till 240 (maximalt) ms. » 12 % av alla enheter är bättre. Det betyder att den uppmätta svarstiden är bättre än genomsnittet av alla testade enheter (19.8 ms). | ||
| ↔ Svarstid 50 % grått till 80 % grått | ||
| 2.6 ms ... stiga ↗ och falla ↘ kombinerat | ↗ 1.2 ms stiga | 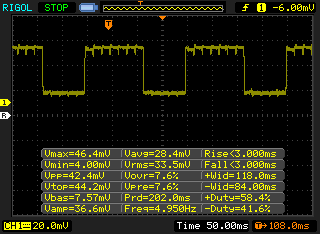 |
| ↘ 1.4 ms hösten | ||
| Skärmen visar väldigt snabba svarsfrekvenser i våra tester och borde vara mycket väl lämpad för fartfyllt spel. I jämförelse sträcker sig alla testade enheter från 0.165 (minst) till 636 (maximalt) ms. » 12 % av alla enheter är bättre. Det betyder att den uppmätta svarstiden är bättre än genomsnittet av alla testade enheter (31 ms). | ||
Skärmflimmer / PWM (Puls-Width Modulation)
| Skärmflimmer / PWM upptäckt | 60.2 Hz | ≤ 100 % ljusstyrka inställning | 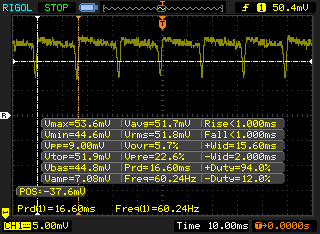 |
Displayens bakgrundsbelysning flimrar vid 60.2 Hz (i värsta fall, t.ex. med PWM) Flimrande upptäckt vid en ljusstyrkeinställning på 100 % och lägre. Det ska inte finnas något flimmer eller PWM över denna ljusstyrkeinställning. Frekvensen för 60.2 Hz är mycket låg, så flimmer kan orsaka ögon- och huvudvärk efter långvarig användning. Som jämförelse: 52 % av alla testade enheter använder inte PWM för att dämpa skärmen. Om PWM upptäcktes mättes ett medelvärde av 7781 (minst: 5 - maximum: 343500) Hz. | |||
| PCMark 8 Home Score Accelerated v2 | 3570 poäng | |
| PCMark 8 Work Score Accelerated v2 | 4465 poäng | |
| PCMark 10 Score | 5485 poäng | |
Hjälp | ||
| Alienware m15 P79F Toshiba XG5 KXG50ZNV512G | Alienware m15 GTX 1070 Max-Q Toshiba XG5 KXG50ZNV512G | Razer Blade 15 RTX 2080 Max-Q Samsung SSD PM981 MZVLB512HAJQ | Asus Zephyrus S GX502GW 2x Intel SSD 660p SSDPEKNW512G8 (RAID 0) | Aorus 15 W9 Intel SSD 760p SSDPEKKW512G8 | Dell XPS 15 9570 Core i9 UHD Samsung SSD PM981 MZVLB1T0HALR | |
|---|---|---|---|---|---|---|
| AS SSD | -24% | 36% | 8% | 21% | 31% | |
| Seq Read (MB/s) | 1937 | 1967 2% | 1832 -5% | 2506 29% | 2611 35% | 1320 -32% |
| Seq Write (MB/s) | 1066 | 1135 6% | 1864 75% | 1712 61% | 1545 45% | 1500 41% |
| 4K Read (MB/s) | 31.76 | 29.17 -8% | 52.1 64% | 48.32 52% | 55.2 74% | 30.73 -3% |
| 4K Write (MB/s) | 102.6 | 93.4 -9% | 108.3 6% | 103.6 1% | 111.9 9% | 94.4 -8% |
| 4K-64 Read (MB/s) | 1140 | 995 -13% | 1159 2% | 624 -45% | 884 -22% | 1453 27% |
| 4K-64 Write (MB/s) | 938 | 656 -30% | 1807 93% | 1253 34% | 941 0% | 1815 93% |
| Access Time Read * (ms) | 0.058 | 0.116 -100% | 0.05 14% | 0.08 -38% | 0.045 22% | 0.061 -5% |
| Access Time Write * (ms) | 0.04 | 0.063 -58% | 0.034 15% | 0.04 -0% | 0.033 17% | 0.044 -10% |
| Score Read (Points) | 1366 | 1221 -11% | 1394 2% | 923 -32% | 1200 -12% | 1616 18% |
| Score Write (Points) | 1147 | 862 -25% | 2102 83% | 1528 33% | 1207 5% | 2059 80% |
| Score Total (Points) | 3168 | 2667 -16% | 4221 33% | 2896 -9% | 2982 -6% | 4507 42% |
| Copy ISO MB/s (MB/s) | 946 | 642 -32% | 2083 120% | 2131 125% | 2577 172% | |
| Copy Program MB/s (MB/s) | 452.8 | 431.5 -5% | 496.5 10% | 407.2 -10% | 515 14% | |
| Copy Game MB/s (MB/s) | 1013 | 706 -30% | 977 -4% | 1094 8% | 1120 11% |
* ... mindre är bättre

| 3DMark 11 Performance | 19009 poäng | |
| 3DMark Cloud Gate Standard Score | 24876 poäng | |
| 3DMark Fire Strike Score | 16197 poäng | |
| 3DMark Time Spy Score | 6901 poäng | |
Hjälp | ||
| Shadow of the Tomb Raider - 1920x1080 Highest Preset AA:T | |
| MSI GE75 9SG | |
| Alienware m15 P79F | |
| Genomsnitt NVIDIA GeForce RTX 2070 Max-Q (57 - 89, n=12) | |
| Asus Zephyrus S GX502GW | |
| låg | med. | hög | ultra | 4K | |
|---|---|---|---|---|---|
| BioShock Infinite (2013) | 296.7 | 261.5 | 243.7 | 153.7 | |
| The Witcher 3 (2015) | 261.8 | 200.6 | 123.8 | 64.4 | 47.2 |
| Rise of the Tomb Raider (2016) | 204.7 | 162.3 | 125.8 | 105.7 | 45.6 |
| Shadow of the Tomb Raider (2018) | 119 | 93 | 87 | 84 | 33 |
| Alienware m15 P79F GeForce RTX 2070 Max-Q, i7-8750H, Toshiba XG5 KXG50ZNV512G | Alienware m15 GTX 1070 Max-Q GeForce GTX 1070 Max-Q, i7-8750H, Toshiba XG5 KXG50ZNV512G | Razer Blade 15 RTX 2080 Max-Q GeForce RTX 2080 Max-Q, i7-9750H, Samsung SSD PM981 MZVLB512HAJQ | Asus Zephyrus S GX502GW GeForce RTX 2070 Mobile, i7-9750H, 2x Intel SSD 660p SSDPEKNW512G8 (RAID 0) | Aorus 15 W9 GeForce RTX 2060 Mobile, i7-8750H, Intel SSD 760p SSDPEKKW512G8 | Dell XPS 15 9570 Core i9 UHD GeForce GTX 1050 Ti Max-Q, i9-8950HK, Samsung SSD PM981 MZVLB1T0HALR | |
|---|---|---|---|---|---|---|
| Noise | 13% | 17% | 1% | -1% | 15% | |
| av / miljö * (dB) | 28.2 | 28.6 -1% | 28.3 -0% | 30 -6% | 29 -3% | 28.2 -0% |
| Idle Minimum * (dB) | 30.3 | 28.6 6% | 28.8 5% | 31 -2% | 34 -12% | 28.5 6% |
| Idle Average * (dB) | 35.4 | 28.6 19% | 28.8 19% | 33 7% | 36 -2% | 28.6 19% |
| Idle Maximum * (dB) | 50.3 | 28.6 43% | 29 42% | 38 24% | 38 24% | 28.8 43% |
| Load Average * (dB) | 50.3 | 40.8 19% | 33.5 33% | 50 1% | 52 -3% | 36.2 28% |
| Witcher 3 ultra * (dB) | 50.2 | 49.6 1% | 45 10% | 53 -6% | 52 -4% | 47.6 5% |
| Load Maximum * (dB) | 50.2 | 49.6 1% | 45.2 10% | 56 -12% | 53 -6% | 47.6 5% |
* ... mindre är bättre
Ljudnivå
| Låg belastning |
| 30.3 / 35.4 / 50.3 dB(A) |
| Hög belastning |
| 50.3 / 50.2 dB(A) |
 | ||
30 dB tyst 40 dB(A) hörbar 50 dB(A) högt ljud |
||
min: | ||
(-) Den maximala temperaturen på ovansidan är 55.6 °C / 132 F, jämfört med genomsnittet av 40.4 °C / 105 F , allt från 21.2 till 68.8 °C för klassen Gaming.
(-) Botten värms upp till maximalt 62.4 °C / 144 F, jämfört med genomsnittet av 43.2 °C / 110 F
(+) Vid tomgångsbruk är medeltemperaturen för ovansidan 31.7 °C / 89 F, jämfört med enhetsgenomsnittet på 33.9 °C / ### class_avg_f### F.
(-) När du spelar The Witcher 3 är medeltemperaturen för ovansidan 43.6 °C / 110 F, jämfört med enhetsgenomsnittet på 33.9 °C / ## #class_avg_f### F.
(+) Handledsstöden och pekplattan når maximal hudtemperatur (35.2 °C / 95.4 F) och är därför inte varma.
(-) Medeltemperaturen för handledsstödsområdet på liknande enheter var 28.8 °C / 83.8 F (-6.4 °C / -11.6 F).
Alienware m15 P79F ljudanalys
(±) | högtalarljudstyrkan är genomsnittlig men bra (75 dB)
Analysis not possible as minimum curve is missing or too high
Apple MacBook 12 (Early 2016) 1.1 GHz ljudanalys
(+) | högtalare kan spela relativt högt (83.6 dB)
Bas 100 - 315 Hz
(±) | reducerad bas - i genomsnitt 11.3% lägre än medianen
(±) | linjäriteten för basen är genomsnittlig (14.2% delta till föregående frekvens)
Mellan 400 - 2000 Hz
(+) | balanserad mellan - endast 2.4% från medianen
(+) | mids är linjära (5.5% delta till föregående frekvens)
Högsta 2 - 16 kHz
(+) | balanserade toppar - endast 2% från medianen
(+) | toppar är linjära (4.5% delta till föregående frekvens)
Totalt 100 - 16 000 Hz
(+) | det totala ljudet är linjärt (10.2% skillnad mot median)
Jämfört med samma klass
» 7% av alla testade enheter i den här klassen var bättre, 2% liknande, 91% sämre
» Den bästa hade ett delta på 5%, genomsnittet var 18%, sämst var 53%
Jämfört med alla testade enheter
» 5% av alla testade enheter var bättre, 1% liknande, 94% sämre
» Den bästa hade ett delta på 4%, genomsnittet var 24%, sämst var 134%
| Av/Standby | |
| Låg belastning | |
| Hög belastning |
|
Förklaring:
min: | |
| Alienware m15 P79F i7-8750H, GeForce RTX 2070 Max-Q, Toshiba XG5 KXG50ZNV512G, OLED, 3840x2160, 15.6" | Alienware m15 GTX 1070 Max-Q i7-8750H, GeForce GTX 1070 Max-Q, Toshiba XG5 KXG50ZNV512G, IPS, 1920x1080, 15.6" | Razer Blade 15 RTX 2080 Max-Q i7-9750H, GeForce RTX 2080 Max-Q, Samsung SSD PM981 MZVLB512HAJQ, IPS, 1920x1080, 15.6" | Asus Zephyrus S GX502GW i7-9750H, GeForce RTX 2070 Mobile, 2x Intel SSD 660p SSDPEKNW512G8 (RAID 0), IPS, 1920x1080, 15.6" | Aorus 15 W9 i7-8750H, GeForce RTX 2060 Mobile, Intel SSD 760p SSDPEKKW512G8, IPS, 1920x1080, 15.6" | Dell XPS 15 9570 Core i9 UHD i9-8950HK, GeForce GTX 1050 Ti Max-Q, Samsung SSD PM981 MZVLB1T0HALR, IPS, 3840x2160, 15.6" | |
|---|---|---|---|---|---|---|
| Power Consumption | 12% | -6% | -59% | -21% | 20% | |
| Idle Minimum * (Watt) | 10.9 | 7.6 30% | 12.5 -15% | 24 -120% | 18 -65% | 7.1 35% |
| Idle Average * (Watt) | 12.3 | 13.8 -12% | 15.3 -24% | 27 -120% | 20 -63% | 13.6 -11% |
| Idle Maximum * (Watt) | 19 | 14.6 23% | 20.7 -9% | 33 -74% | 28 -47% | 14.1 26% |
| Load Average * (Watt) | 96 | 97.6 -2% | 90.2 6% | 129 -34% | 87 9% | 103.9 -8% |
| Witcher 3 ultra * (Watt) | 161.7 | 145.8 10% | 162 -0% | 176 -9% | 135 17% | 103 36% |
| Load Maximum * (Watt) | 229.1 | 172.5 25% | 209.3 9% | 216 6% | 175 24% | 130.9 43% |
* ... mindre är bättre
| Alienware m15 P79F i7-8750H, GeForce RTX 2070 Max-Q, 90 Wh | Alienware m15 GTX 1070 Max-Q i7-8750H, GeForce GTX 1070 Max-Q, 90 Wh | Razer Blade 15 RTX 2080 Max-Q i7-9750H, GeForce RTX 2080 Max-Q, 80 Wh | Asus Zephyrus S GX502GW i7-9750H, GeForce RTX 2070 Mobile, 76 Wh | Aorus 15 W9 i7-8750H, GeForce RTX 2060 Mobile, 62 Wh | Dell XPS 15 9570 Core i9 UHD i9-8950HK, GeForce GTX 1050 Ti Max-Q, 97 Wh | |
|---|---|---|---|---|---|---|
| Batteridrifttid | 48% | 27% | -29% | -54% | 65% | |
| WiFi v1.3 (h) | 5.2 | 7.7 48% | 6.6 27% | 3.7 -29% | 2.4 -54% | 8.6 65% |
| Reader / Idle (h) | 10.5 | 15.9 | 5.9 | 2.9 | 15 | |
| Load (h) | 1.7 | 1.7 | 1 | 1.4 | 1 |
För
Emot
Läs den fullständiga versionen av den här recensionen på engelska här.
Alienware m15 kan krama mer ur samma CPU och GPU än andra bärbara speldatorer. Dess Core i7-8750H och RTX 2070 Max-Q är till exempel båda 8 till 9 procent snabbare än genomsnittet för i7-8750H eller RTX 2070 Max-Q i vår databas. Om du vill ha snabbast möjliga prestanda i ett chassi med tunn design bör Alienware m15 passa perfekt.
Nackdelarna är högre kärntemperaturer och mer högljudda fläktar, vilket är ett direkt resultat av att datorn försöker krama ur varje liten MHz ur processorn. Förvänta dig CPU-temperaturer så höga som 90 C och fläktar som låter så mycket som 50 dB(A) om du vill få ut mesta möjliga ur Alienware m15.
Jokern i leken är dock OLED-skärmen med 4K UHD-upplösning. Även om den kostar två gånger så mycket som IPS-skärmarna på 1080p och 144 eller 240 Hz så vill vi vara tydliga med att den inte objektivt sett erbjuder den bästa spelupplevelsen eller automatiskt gör IPS-varianterna onödiga. En högre upplösning, djupare färger, högre ljusstyrka och snabbare svart-vita responstider ger den onekligen en fördel, men en bilduppdateringsfrekvens på 60 Hz är en nackdel i en del titlar där 144 Hz är att föredra. Overwatch, Rocket League, CS:GO och Apex Legends, till exempel, passar antagligen bättre i 144 Hz medans singelplayerspel som Shadow of the Tomb Raider eller Metro Exodus kan dra mer nytta av OLED-skärmen. Trots att den imponerar så är OLED för tillfället inte för alla, i synnerhet då IPS-alternativen har blivit mer prisvärda.
Beroende på vilka spel du spelar mest kan du vilja välja med omsorg mellan 1080p 144/240 Hz IPS eller 2160p 60 Hz OLED. Det är en utmärkt start för OLED, men det är fortfarande ett nischalternativ tills fler alternativ för upplösning och bilduppdatering blir tillgängliga och kan utmana IPS.
Alienware m15 P79F
- 06/13/2019 v6 (old)
Allen Ngo
Price comparison
