Test: Asus ROG Strix G15 G512LI - 10.000 kronor är för mycket för GeForce GTX 1650 Ti-grafik (Sammanfattning)
Gradering | Datum | Modell | Vikt | Höjd | Storlek | Upplösning | Pris |
|---|---|---|---|---|---|---|---|
| 80.8 % v7 (old) | 07/2020 | Asus ROG Strix G15 G512LI i7-10750H, GeForce GTX 1650 Ti Mobile | 2.3 kg | 25.8 mm | 15.60" | 1920x1080 | |
| 82.7 % v7 (old) | Asus TUF Gaming A15 FA506IV-HN172 R7 4800H, GeForce RTX 2060 Mobile | 2.2 kg | 24.9 mm | 15.60" | 1920x1080 | ||
| 82.1 % v7 (old) | Asus Strix Scar III G531GW-AZ062T i7-9750H, GeForce RTX 2070 Mobile | 2.4 kg | 25 mm | 15.60" | 1920x1080 | ||
| 83.2 % v7 (old) | 05/2020 | MSI GP65 10SFK-047US i7-10750H, GeForce RTX 2070 Mobile | 2.3 kg | 27.5 mm | 15.60" | 1920x1080 | |
| 83.7 % v7 (old) | 06/2020 | Dell G5 15 SE 5505 P89F R7 4800H, Radeon RX 5600M | 2.4 kg | 21.6 mm | 15.60" | 1920x1080 | |
| 81.5 % v7 (old) | HP Omen 15-dc1020ng i5-9300H, GeForce GTX 1650 Mobile | 2.3 kg | 25 mm | 15.60" | 1920x1080 |
| Networking | |
| iperf3 transmit AX12 | |
| Asus ROG Strix G15 G512LI | |
| MSI GP65 10SFK-047US | |
| Dell G5 15 SE 5505 P89F | |
| Asus TUF Gaming A15 FA506IV-HN172 | |
| iperf3 receive AX12 | |
| Dell G5 15 SE 5505 P89F | |
| MSI GP65 10SFK-047US | |
| Asus ROG Strix G15 G512LI | |
| Asus TUF Gaming A15 FA506IV-HN172 | |
| |||||||||||||||||||||||||
Distribution av ljusstyrkan: 79 %
Mitt på batteriet: 271.2 cd/m²
Kontrast: 512:1 (Svärta: 0.53 cd/m²)
ΔE ColorChecker Calman: 5.04 | ∀{0.5-29.43 Ø4.73}
calibrated: 4.26
ΔE Greyscale Calman: 3.4 | ∀{0.09-98 Ø4.97}
59.5% sRGB (Argyll 1.6.3 3D)
37.8% AdobeRGB 1998 (Argyll 1.6.3 3D)
41.06% AdobeRGB 1998 (Argyll 3D)
59.8% sRGB (Argyll 3D)
39.73% Display P3 (Argyll 3D)
Gamma: 2.09
CCT: 7079 K
| Asus ROG Strix G15 G512LI Panda LM156LF-2F01, IPS, 15.6", 1920x1080 | Asus TUF Gaming A15 FA506IV-HN172 LM156LF-2F01, IPS, 15.6", 1920x1080 | Asus Strix Scar III G531GW-AZ062T Sharp LQ156M1JW09 (SHP14D3), IPS, 15.6", 1920x1080 | MSI GP65 10SFK-047US LG Philips LP156WFG-SPB3, IPS, 15.6", 1920x1080 | Dell G5 15 SE 5505 P89F BOE NV156FH, WVA, 15.6", 1920x1080 | HP Omen 15-dc1020ng LGD05CE, IPS, 15.6", 1920x1080 | |
|---|---|---|---|---|---|---|
| Display | -2% | 65% | 59% | 55% | -3% | |
| Display P3 Coverage (%) | 39.73 | 38.92 -2% | 66.2 67% | 63.5 60% | 63 59% | 38.37 -3% |
| sRGB Coverage (%) | 59.8 | 58.5 -2% | 97.1 62% | 94.4 58% | 90.1 51% | 57.6 -4% |
| AdobeRGB 1998 Coverage (%) | 41.06 | 40.22 -2% | 67.6 65% | 65.1 59% | 64.1 56% | 39.69 -3% |
| Response Times | 6% | 61% | 63% | 50% | -13% | |
| Response Time Grey 50% / Grey 80% * (ms) | 33.6 ? | 34 ? -1% | 15 ? 55% | 10.4 ? 69% | 20.4 ? 39% | 40 ? -19% |
| Response Time Black / White * (ms) | 27.6 ? | 24 ? 13% | 9 ? 67% | 12 ? 57% | 10.8 ? 61% | 29.6 ? -7% |
| PWM Frequency (Hz) | 250 ? | 198.4 ? | ||||
| Screen | 25% | 29% | 36% | 36% | 14% | |
| Brightness middle (cd/m²) | 271.2 | 280 3% | 309 14% | 384.9 42% | 292 8% | 251 -7% |
| Brightness (cd/m²) | 252 | 254 1% | 284 13% | 358 42% | 290 15% | 232 -8% |
| Brightness Distribution (%) | 79 | 88 11% | 88 11% | 87 10% | 77 -3% | 76 -4% |
| Black Level * (cd/m²) | 0.53 | 0.15 72% | 0.42 21% | 0.67 -26% | 0.27 49% | 0.17 68% |
| Contrast (:1) | 512 | 1867 265% | 736 44% | 574 12% | 1081 111% | 1476 188% |
| Colorchecker dE 2000 * | 5.04 | 5.89 -17% | 3.99 21% | 2.43 52% | 3.99 21% | 6.2 -23% |
| Colorchecker dE 2000 max. * | 16.07 | 19 -18% | 8.3 48% | 4.58 71% | 6.11 62% | 18.6 -16% |
| Colorchecker dE 2000 calibrated * | 4.26 | 4.79 -12% | 1.12 74% | 2.03 52% | 3.02 29% | 4.8 -13% |
| Greyscale dE 2000 * | 3.4 | 4.08 -20% | 5.43 -60% | 2.6 24% | 3.3 3% | 4.2 -24% |
| Gamma | 2.09 105% | 2.33 94% | 2.57 86% | 2.2 100% | 2.25 98% | 2.32 95% |
| CCT | 7079 92% | 7303 89% | 7767 84% | 6981 93% | 7047 92% | 7454 87% |
| Color Space (Percent of AdobeRGB 1998) (%) | 37.8 | 37 -2% | 63 67% | 59.7 58% | 58.1 54% | 36.5 -3% |
| Color Space (Percent of sRGB) (%) | 59.5 | 58 -3% | 97 63% | 93.9 58% | 89.7 51% | 57.4 -4% |
| Totalt genomsnitt (program/inställningar) | 10% /
18% | 52% /
40% | 53% /
44% | 47% /
42% | -1% /
7% |
* ... mindre är bättre
Visa svarstider
| ↔ Svarstid svart till vitt | ||
|---|---|---|
| 27.6 ms ... stiga ↗ och falla ↘ kombinerat | ↗ 15.6 ms stiga | 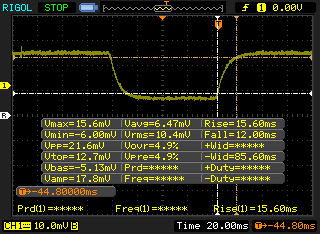 |
| ↘ 12 ms hösten | ||
| Skärmen visar relativt långsamma svarsfrekvenser i våra tester och kan vara för långsam för spelare. I jämförelse sträcker sig alla testade enheter från 0.1 (minst) till 240 (maximalt) ms. » 70 % av alla enheter är bättre. Detta innebär att den uppmätta svarstiden är sämre än genomsnittet av alla testade enheter (19.9 ms). | ||
| ↔ Svarstid 50 % grått till 80 % grått | ||
| 33.6 ms ... stiga ↗ och falla ↘ kombinerat | ↗ 18.4 ms stiga | 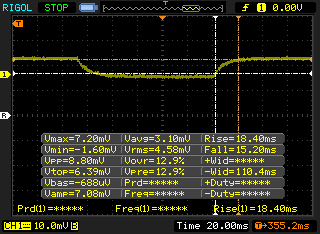 |
| ↘ 15.2 ms hösten | ||
| Skärmen visar långsamma svarsfrekvenser i våra tester och kommer att vara otillfredsställande för spelare. I jämförelse sträcker sig alla testade enheter från 0.165 (minst) till 636 (maximalt) ms. » 46 % av alla enheter är bättre. Det betyder att den uppmätta svarstiden liknar genomsnittet av alla testade enheter (31.1 ms). | ||
Skärmflimmer / PWM (Puls-Width Modulation)
| Skärmflimmer / PWM upptäcktes inte | 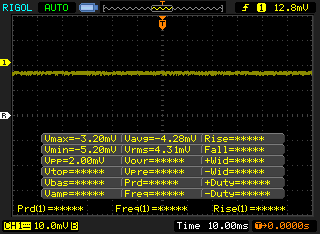 | ||
Som jämförelse: 52 % av alla testade enheter använder inte PWM för att dämpa skärmen. Om PWM upptäcktes mättes ett medelvärde av 7788 (minst: 5 - maximum: 343500) Hz. | |||
Cinebench R15: CPU Multi 64Bit | CPU Single 64Bit
Blender: v2.79 BMW27 CPU
7-Zip 18.03: 7z b 4 -mmt1 | 7z b 4
Geekbench 5.5: Single-Core | Multi-Core
HWBOT x265 Benchmark v2.2: 4k Preset
LibreOffice : 20 Documents To PDF
R Benchmark 2.5: Overall mean
| 7-Zip 18.03 / 7z b 4 -mmt1 | |
| MSI GE66 Raider 10SFS | |
| Gigabyte Aero 15 OLED XB-8DE51B0SP | |
| Genomsnitt Intel Core i7-10750H (4504 - 5470, n=43) | |
| Asus ROG Strix G15 G512LI | |
| Lenovo Legion 5 15IMH05H | |
| Dell G5 15 SE 5505 P89F | |
| Asus Zephyrus G14 GA401IV | |
| Schenker XMG Pro 15 | |
| Acer Nitro 5 AN515-44-R5FT | |
| Asus ROG Zephyrus G15 GA502DU | |
| Geekbench 5.5 / Single-Core | |
| MSI GE66 Raider 10SFS | |
| Gigabyte Aero 15 OLED XB-8DE51B0SP | |
| Genomsnitt Intel Core i7-10750H (1114 - 1333, n=43) | |
| Lenovo Legion 5 15IMH05H | |
| Asus Zephyrus G14 GA401IV | |
| Dell G5 15 SE 5505 P89F | |
| Schenker XMG Pro 15 | |
| Asus ROG Strix G15 G512LI | |
| Acer Nitro 5 AN515-44-R5FT | |
| Geekbench 5.5 / Multi-Core | |
| MSI GE66 Raider 10SFS | |
| Gigabyte Aero 15 OLED XB-8DE51B0SP | |
| Dell G5 15 SE 5505 P89F | |
| Asus Zephyrus G14 GA401IV | |
| Asus ROG Strix G15 G512LI | |
| Genomsnitt Intel Core i7-10750H (4443 - 6674, n=43) | |
| Schenker XMG Pro 15 | |
| Acer Nitro 5 AN515-44-R5FT | |
| Lenovo Legion 5 15IMH05H | |
| HWBOT x265 Benchmark v2.2 / 4k Preset | |
| Gigabyte Aero 15 OLED XB-8DE51B0SP | |
| MSI GE66 Raider 10SFS | |
| Dell G5 15 SE 5505 P89F | |
| Asus Zephyrus G14 GA401IV | |
| Asus ROG Strix G15 G512LI | |
| Genomsnitt Intel Core i7-10750H (5.54 - 11.6, n=43) | |
| Acer Nitro 5 AN515-44-R5FT | |
| Schenker XMG Pro 15 | |
| Lenovo Legion 5 15IMH05H | |
| Asus ROG Zephyrus G15 GA502DU | |
| LibreOffice / 20 Documents To PDF | |
| Dell G5 15 SE 5505 P89F | |
| Acer Nitro 5 AN515-44-R5FT | |
| MSI GE66 Raider 10SFS | |
| Genomsnitt Intel Core i7-10750H (43.1 - 99.2, n=43) | |
| Lenovo Legion 5 15IMH05H | |
| Gigabyte Aero 15 OLED XB-8DE51B0SP | |
| Asus ROG Strix G15 G512LI | |
| R Benchmark 2.5 / Overall mean | |
| Schenker XMG Pro 15 | |
| Lenovo Legion 5 15IMH05H | |
| Acer Nitro 5 AN515-44-R5FT | |
| Asus ROG Strix G15 G512LI | |
| Genomsnitt Intel Core i7-10750H (0.578 - 0.708, n=42) | |
| Dell G5 15 SE 5505 P89F | |
| MSI GE66 Raider 10SFS | |
| Gigabyte Aero 15 OLED XB-8DE51B0SP | |
* ... mindre är bättre
| PCMark 10 | |
| Score | |
| MSI GP65 10SFK-047US | |
| Dell G5 15 SE 5505 P89F | |
| Asus Strix Scar III G531GW-AZ062T | |
| Asus ROG Strix G15 G512LI | |
| Asus TUF Gaming A15 FA506IV-HN172 | |
| HP Omen 15-dc1020ng | |
| Essentials | |
| MSI GP65 10SFK-047US | |
| Dell G5 15 SE 5505 P89F | |
| Asus ROG Strix G15 G512LI | |
| Asus Strix Scar III G531GW-AZ062T | |
| Asus TUF Gaming A15 FA506IV-HN172 | |
| HP Omen 15-dc1020ng | |
| Productivity | |
| MSI GP65 10SFK-047US | |
| Asus ROG Strix G15 G512LI | |
| Asus Strix Scar III G531GW-AZ062T | |
| Dell G5 15 SE 5505 P89F | |
| HP Omen 15-dc1020ng | |
| Asus TUF Gaming A15 FA506IV-HN172 | |
| Digital Content Creation | |
| Dell G5 15 SE 5505 P89F | |
| MSI GP65 10SFK-047US | |
| Asus Strix Scar III G531GW-AZ062T | |
| Asus ROG Strix G15 G512LI | |
| Asus TUF Gaming A15 FA506IV-HN172 | |
| HP Omen 15-dc1020ng | |
| PCMark 8 | |
| Home Score Accelerated v2 | |
| Dell G5 15 SE 5505 P89F | |
| Asus Strix Scar III G531GW-AZ062T | |
| Asus TUF Gaming A15 FA506IV-HN172 | |
| MSI GP65 10SFK-047US | |
| Asus ROG Strix G15 G512LI | |
| HP Omen 15-dc1020ng | |
| Work Score Accelerated v2 | |
| MSI GP65 10SFK-047US | |
| Asus TUF Gaming A15 FA506IV-HN172 | |
| Asus Strix Scar III G531GW-AZ062T | |
| Asus ROG Strix G15 G512LI | |
| Dell G5 15 SE 5505 P89F | |
| HP Omen 15-dc1020ng | |
| PCMark 8 Home Score Accelerated v2 | 4420 poäng | |
| PCMark 8 Work Score Accelerated v2 | 5587 poäng | |
| PCMark 10 Score | 5466 poäng | |
Hjälp | ||
| DPC Latencies / LatencyMon - interrupt to process latency (max), Web, Youtube, Prime95 | |
| Dell G5 15 SE 5505 P89F | |
| Gigabyte Aero 15 OLED XB-8DE51B0SP | |
| MSI Bravo 15 A4DCR | |
| Asus ROG Strix G15 G512LI | |
| Acer Nitro 5 AN515-44-R5FT | |
| MSI GE66 Raider 10SFS | |
| Razer Blade 15 RZ09-0328 | |
| Asus TUF Gaming A15 FA506IV-HN172 | |
| Lenovo Legion 5 15IMH05H | |
| Eluktronics RP-15 | |
* ... mindre är bättre
| Asus ROG Strix G15 G512LI Intel SSD 660p SSDPEKNW512G8 | Asus TUF Gaming A15 FA506IV-HN172 Kingston OM8PCP3512F-AB | Asus Strix Scar III G531GW-AZ062T Intel SSD 660p SSDPEKNW512G8 | MSI GP65 10SFK-047US Samsung SSD PM981 MZVLB1T0HALR | Dell G5 15 SE 5505 P89F Samsung PM991 MZ9LQ512HALU | HP Omen 15-dc1020ng WDC PC SN720 SDAQNTW-512G | |
|---|---|---|---|---|---|---|
| AS SSD | 17% | -18% | 150% | 32% | 99% | |
| Seq Read (MB/s) | 1157 | 1682 45% | 1163 1% | 2066 79% | 1386 20% | 2955 155% |
| Seq Write (MB/s) | 675 | 904 34% | 919 36% | 2418 258% | 1234 83% | 2440 261% |
| 4K Read (MB/s) | 49.99 | 60.2 20% | 48.88 -2% | 54.2 8% | 41.32 -17% | 40.56 -19% |
| 4K Write (MB/s) | 114 | 164.8 45% | 90.1 -21% | 129 13% | 128 12% | 118.6 4% |
| 4K-64 Read (MB/s) | 322.2 | 472.5 47% | 323.8 0% | 1865 479% | 854 165% | 1283 298% |
| 4K-64 Write (MB/s) | 759 | 845 11% | 403.8 -47% | 1878 147% | 721 -5% | 1538 103% |
| Access Time Read * (ms) | 0.07 | 0.087 -24% | 0.24 -243% | 0.042 40% | 0.098 -40% | 0.084 -20% |
| Access Time Write * (ms) | 0.137 | 0.02 85% | 0.046 66% | 0.091 34% | 0.095 31% | 0.032 77% |
| Score Read (Points) | 488 | 701 44% | 489 0% | 2126 336% | 1034 112% | 1619 232% |
| Score Write (Points) | 940 | 1101 17% | 586 -38% | 2249 139% | 973 4% | 1901 102% |
| Score Total (Points) | 1673 | 2143 28% | 1332 -20% | 5482 228% | 2536 52% | 4323 158% |
| Copy ISO MB/s (MB/s) | 939 | 675 -28% | 1269 35% | 2927 212% | 1284 37% | 1418 51% |
| Copy Program MB/s (MB/s) | 489.9 | 248.4 -49% | 452.8 -8% | 728 49% | 401.9 -18% | 392.5 -20% |
| Copy Game MB/s (MB/s) | 895 | 535 -40% | 755 -16% | 1614 80% | 1013 13% | 907 1% |
| CrystalDiskMark 5.2 / 6 | 19% | -2% | 69% | 22% | 51% | |
| Write 4K (MB/s) | 125.4 | 219.8 75% | 133.3 6% | 145 16% | 142.1 13% | 112.1 -11% |
| Read 4K (MB/s) | 52.7 | 50.2 -5% | 55.3 5% | 46.84 -11% | 46.43 -12% | 42.01 -20% |
| Write Seq (MB/s) | 943 | 979 4% | 980 4% | 2377 152% | 1108 17% | 1964 108% |
| Read Seq (MB/s) | 1383 | 1990 44% | 1406 2% | 2185 58% | 1622 17% | 2065 49% |
| Write 4K Q32T1 (MB/s) | 437.9 | 516 18% | 286.3 -35% | 463.5 6% | 467 7% | 318.2 -27% |
| Read 4K Q32T1 (MB/s) | 334.9 | 298.3 -11% | 331.5 -1% | 527 57% | 525 57% | 406.7 21% |
| Write Seq Q32T1 (MB/s) | 960 | 982 2% | 976 2% | 2395 149% | 1203 25% | 2534 164% |
| Read Seq Q32T1 (MB/s) | 1530 | 1907 25% | 1520 -1% | 3470 127% | 2288 50% | 3438 125% |
| Write 4K Q8T8 (MB/s) | 981 | 748 | ||||
| Read 4K Q8T8 (MB/s) | 300.9 | 344.6 | ||||
| Totalt genomsnitt (program/inställningar) | 18% /
18% | -10% /
-13% | 110% /
121% | 27% /
28% | 75% /
81% |
* ... mindre är bättre

Kontinuerlig inläsning: DiskSpd Read Loop, Queue Depth 8
| 3DMark 11 | |
| 1280x720 Performance GPU | |
| MSI GE66 Raider 10SFS | |
| MSI RTX 2060 Gaming Z 6G | |
| Dell G5 15 SE 5505 P89F | |
| Razer Blade 15 RZ09-0328 | |
| Eluktronics RP-15 | |
| Maingear Vector 15 | |
| MSI GS63VR 7RG-005 | |
| MSI Bravo 15 A4DCR | |
| Asus ROG Strix G15 G512LI | |
| Genomsnitt NVIDIA GeForce GTX 1650 Ti Mobile (12865 - 14415, n=8) | |
| Asus Zephyrus S GX531GM | |
| HP Pavilion Gaming 15-cx0003ng | |
| 1280x720 Performance Combined | |
| MSI GE66 Raider 10SFS | |
| Eluktronics RP-15 | |
| MSI RTX 2060 Gaming Z 6G | |
| Dell G5 15 SE 5505 P89F | |
| Asus ROG Strix G15 G512LI | |
| Maingear Vector 15 | |
| Razer Blade 15 RZ09-0328 | |
| MSI Bravo 15 A4DCR | |
| Genomsnitt NVIDIA GeForce GTX 1650 Ti Mobile (9749 - 13027, n=8) | |
| HP Pavilion Gaming 15-cx0003ng | |
| MSI GS63VR 7RG-005 | |
| Asus Zephyrus S GX531GM | |
| 3DMark 11 Performance | 14000 poäng | |
| 3DMark Cloud Gate Standard Score | 33407 poäng | |
| 3DMark Fire Strike Score | 9710 poäng | |
| 3DMark Time Spy Score | 4131 poäng | |
Hjälp | ||
| The Witcher 3 - 1920x1080 Ultra Graphics & Postprocessing (HBAO+) | |
| Gigabyte Aero 15 OLED XB-8DE51B0SP | |
| MSI GE65 Raider 9SF-049US | |
| MSI RTX 2060 Gaming Z 6G | |
| Asus Strix Scar III G531GW-AZ062T | |
| Lenovo Legion 5 15IMH05H | |
| Dell G5 15 SE 5505 P89F | |
| Eluktronics RP-15 | |
| Razer Blade 15 RZ09-0328 | |
| Maingear Vector 15 | |
| Asus TUF Gaming A15 FA506IV-HN172 | |
| Asus Zephyrus G14 GA401IV | |
| MSI GS63VR 7RG-005 | |
| Asus ROG Zephyrus G15 GA502DU | |
| Asus ROG Strix G15 G512LI | |
| Asus Zephyrus S GX531GM | |
| Genomsnitt NVIDIA GeForce GTX 1650 Ti Mobile (34.7 - 42.3, n=8) | |
| Acer Nitro 5 AN515-44-R5FT | |
| MSI Bravo 15 A4DCR | |
| HP Omen 15-dc1020ng | |
| MSI GF63 Thin 9SC | |
| HP Pavilion Gaming 15-cx0003ng | |
| låg | med. | hög | ultra | |
|---|---|---|---|---|
| The Witcher 3 (2015) | 223.5 | 135.5 | 76.1 | 40.1 |
| Dota 2 Reborn (2015) | 148 | 132 | 122 | 115 |
| X-Plane 11.11 (2018) | 98.9 | 82.7 | 71.8 |
| Asus ROG Strix G15 G512LI GeForce GTX 1650 Ti Mobile, i7-10750H, Intel SSD 660p SSDPEKNW512G8 | Asus TUF Gaming A15 FA506IV-HN172 GeForce RTX 2060 Mobile, R7 4800H, Kingston OM8PCP3512F-AB | Asus Strix Scar III G531GW-AZ062T GeForce RTX 2070 Mobile, i7-9750H, Intel SSD 660p SSDPEKNW512G8 | MSI GP65 10SFK-047US GeForce RTX 2070 Mobile, i7-10750H, Samsung SSD PM981 MZVLB1T0HALR | Dell G5 15 SE 5505 P89F Radeon RX 5600M, R7 4800H, Samsung PM991 MZ9LQ512HALU | HP Omen 15-dc1020ng GeForce GTX 1650 Mobile, i5-9300H, WDC PC SN720 SDAQNTW-512G | |
|---|---|---|---|---|---|---|
| Noise | 6% | 4% | -2% | 13% | 16% | |
| av / miljö * (dB) | 27.7 | 30.2 -9% | 30 -8% | 29.3 -6% | 28 -1% | 28.8 -4% |
| Idle Minimum * (dB) | 34.2 | 30.2 12% | 30.6 11% | 31.9 7% | 28 18% | 28.8 16% |
| Idle Average * (dB) | 36 | 30.2 16% | 30.6 15% | 31.9 11% | 28 22% | 29.5 18% |
| Idle Maximum * (dB) | 36.6 | 30.2 17% | 37.7 -3% | 33.5 8% | 28 23% | 31.1 15% |
| Load Average * (dB) | 44.3 | 40 10% | 36.5 18% | 47 -6% | 28 37% | 35.2 21% |
| Witcher 3 ultra * (dB) | 47.9 | 49 -2% | 52.1 -9% | 53.8 -12% | 50.6 -6% | 35.2 27% |
| Load Maximum * (dB) | 49.3 | 49 1% | 48.1 2% | 56.7 -15% | 50.6 -3% | 41 17% |
* ... mindre är bättre
Ljudnivå
| Låg belastning |
| 34.2 / 36 / 36.6 dB(A) |
| Hög belastning |
| 44.3 / 49.3 dB(A) |
 | ||
30 dB tyst 40 dB(A) hörbar 50 dB(A) högt ljud |
||
min: | ||
(-) Den maximala temperaturen på ovansidan är 46.2 °C / 115 F, jämfört med genomsnittet av 40.4 °C / 105 F , allt från 21.2 till 68.8 °C för klassen Gaming.
(-) Botten värms upp till maximalt 53.6 °C / 128 F, jämfört med genomsnittet av 43.2 °C / 110 F
(+) Vid tomgångsbruk är medeltemperaturen för ovansidan 26 °C / 79 F, jämfört med enhetsgenomsnittet på 33.9 °C / ### class_avg_f### F.
(+) När du spelar The Witcher 3 är medeltemperaturen för ovansidan 31.8 °C / 89 F, jämfört med enhetsgenomsnittet på 33.9 °C / ## #class_avg_f### F.
(+) Handledsstöden och pekplattan är kallare än hudtemperaturen med maximalt 25.8 °C / 78.4 F och är därför svala att ta på.
(+) Medeltemperaturen för handledsstödsområdet på liknande enheter var 28.8 °C / 83.8 F (+3 °C / 5.4 F).
Asus ROG Strix G15 G512LI ljudanalys
(+) | högtalare kan spela relativt högt (85.8 dB)
Bas 100 - 315 Hz
(±) | reducerad bas - i genomsnitt 14.3% lägre än medianen
(±) | linjäriteten för basen är genomsnittlig (12.3% delta till föregående frekvens)
Mellan 400 - 2000 Hz
(±) | högre mellan - i genomsnitt 8.2% högre än median
(+) | mids är linjära (5.1% delta till föregående frekvens)
Högsta 2 - 16 kHz
(+) | balanserade toppar - endast 3.4% från medianen
(±) | linjäriteten för toppar är genomsnittlig (9.5% delta till föregående frekvens)
Totalt 100 - 16 000 Hz
(±) | linjäriteten för det totala ljudet är genomsnittlig (18.9% skillnad mot median)
Jämfört med samma klass
» 63% av alla testade enheter i den här klassen var bättre, 8% liknande, 29% sämre
» Den bästa hade ett delta på 6%, genomsnittet var 18%, sämst var 132%
Jämfört med alla testade enheter
» 44% av alla testade enheter var bättre, 8% liknande, 48% sämre
» Den bästa hade ett delta på 4%, genomsnittet var 24%, sämst var 134%
Apple MacBook 12 (Early 2016) 1.1 GHz ljudanalys
(+) | högtalare kan spela relativt högt (83.6 dB)
Bas 100 - 315 Hz
(±) | reducerad bas - i genomsnitt 11.3% lägre än medianen
(±) | linjäriteten för basen är genomsnittlig (14.2% delta till föregående frekvens)
Mellan 400 - 2000 Hz
(+) | balanserad mellan - endast 2.4% från medianen
(+) | mids är linjära (5.5% delta till föregående frekvens)
Högsta 2 - 16 kHz
(+) | balanserade toppar - endast 2% från medianen
(+) | toppar är linjära (4.5% delta till föregående frekvens)
Totalt 100 - 16 000 Hz
(+) | det totala ljudet är linjärt (10.2% skillnad mot median)
Jämfört med samma klass
» 7% av alla testade enheter i den här klassen var bättre, 2% liknande, 91% sämre
» Den bästa hade ett delta på 5%, genomsnittet var 18%, sämst var 53%
Jämfört med alla testade enheter
» 5% av alla testade enheter var bättre, 1% liknande, 94% sämre
» Den bästa hade ett delta på 4%, genomsnittet var 24%, sämst var 134%
| Av/Standby | |
| Låg belastning | |
| Hög belastning |
|
Förklaring:
min: | |
| Asus ROG Strix G15 G512LI i7-10750H, GeForce GTX 1650 Ti Mobile, Intel SSD 660p SSDPEKNW512G8, IPS, 1920x1080, 15.6" | Asus TUF Gaming A15 FA506IV-HN172 R7 4800H, GeForce RTX 2060 Mobile, Kingston OM8PCP3512F-AB, IPS, 1920x1080, 15.6" | MSI GP65 10SFK-047US i7-10750H, GeForce RTX 2070 Mobile, Samsung SSD PM981 MZVLB1T0HALR, IPS, 1920x1080, 15.6" | Dell G5 15 SE 5505 P89F R7 4800H, Radeon RX 5600M, Samsung PM991 MZ9LQ512HALU, WVA, 1920x1080, 15.6" | HP Omen 15-dc1020ng i5-9300H, GeForce GTX 1650 Mobile, WDC PC SN720 SDAQNTW-512G, IPS, 1920x1080, 15.6" | HP Pavilion Gaming 15-cx0003ng i7-8750H, GeForce GTX 1050 Ti Mobile, Intel Optane 16 GB MEMPEK1J016GAH + HGST HTS721010A9E630 1 TB HDD, IPS, 1920x1080, 15.6" | |
|---|---|---|---|---|---|---|
| Power Consumption | -4% | -66% | -6% | 22% | 14% | |
| Idle Minimum * (Watt) | 5.7 | 5.4 5% | 14.2 -149% | 6.5 -14% | 4.04 29% | 5.5 4% |
| Idle Average * (Watt) | 9.3 | 10 -8% | 18.8 -102% | 10.6 -14% | 7.2 23% | 8.5 9% |
| Idle Maximum * (Watt) | 20.9 | 10.5 50% | 23.9 -14% | 11 47% | 11.4 45% | 11.9 43% |
| Load Average * (Watt) | 105.1 | 135 -28% | 96.9 8% | 84.1 20% | 80.8 23% | 94 11% |
| Witcher 3 ultra * (Watt) | 94.5 | 144 -52% | 185 -96% | 152.9 -62% | 93.6 1% | 86 9% |
| Load Maximum * (Watt) | 160.8 | 147 9% | 233.4 -45% | 180.4 -12% | 144.5 10% | 144 10% |
* ... mindre är bättre
| Asus ROG Strix G15 G512LI i7-10750H, GeForce GTX 1650 Ti Mobile, 48 Wh | Asus TUF Gaming A15 FA506IV-HN172 R7 4800H, GeForce RTX 2060 Mobile, 48 Wh | Asus Strix Scar III G531GW-AZ062T i7-9750H, GeForce RTX 2070 Mobile, 66 Wh | MSI GP65 10SFK-047US i7-10750H, GeForce RTX 2070 Mobile, 51 Wh | Dell G5 15 SE 5505 P89F R7 4800H, Radeon RX 5600M, 51 Wh | HP Omen 15-dc1020ng i5-9300H, GeForce GTX 1650 Mobile, 52.5 Wh | |
|---|---|---|---|---|---|---|
| Batteridrifttid | 16% | 24% | -18% | 10% | 16% | |
| Reader / Idle (h) | 13.3 | 9.8 -26% | 11.2 -16% | 15.9 20% | ||
| WiFi v1.3 (h) | 4.5 | 6.2 38% | 5.6 24% | 3.7 -18% | 6.2 38% | 6.4 42% |
| Load (h) | 1.4 | 1.9 36% | 1.5 7% | 1.2 -14% | ||
| Witcher 3 ultra (h) | 1 |
För
Emot
Läs den fullständiga versionen av den här recensionen på engelska här.
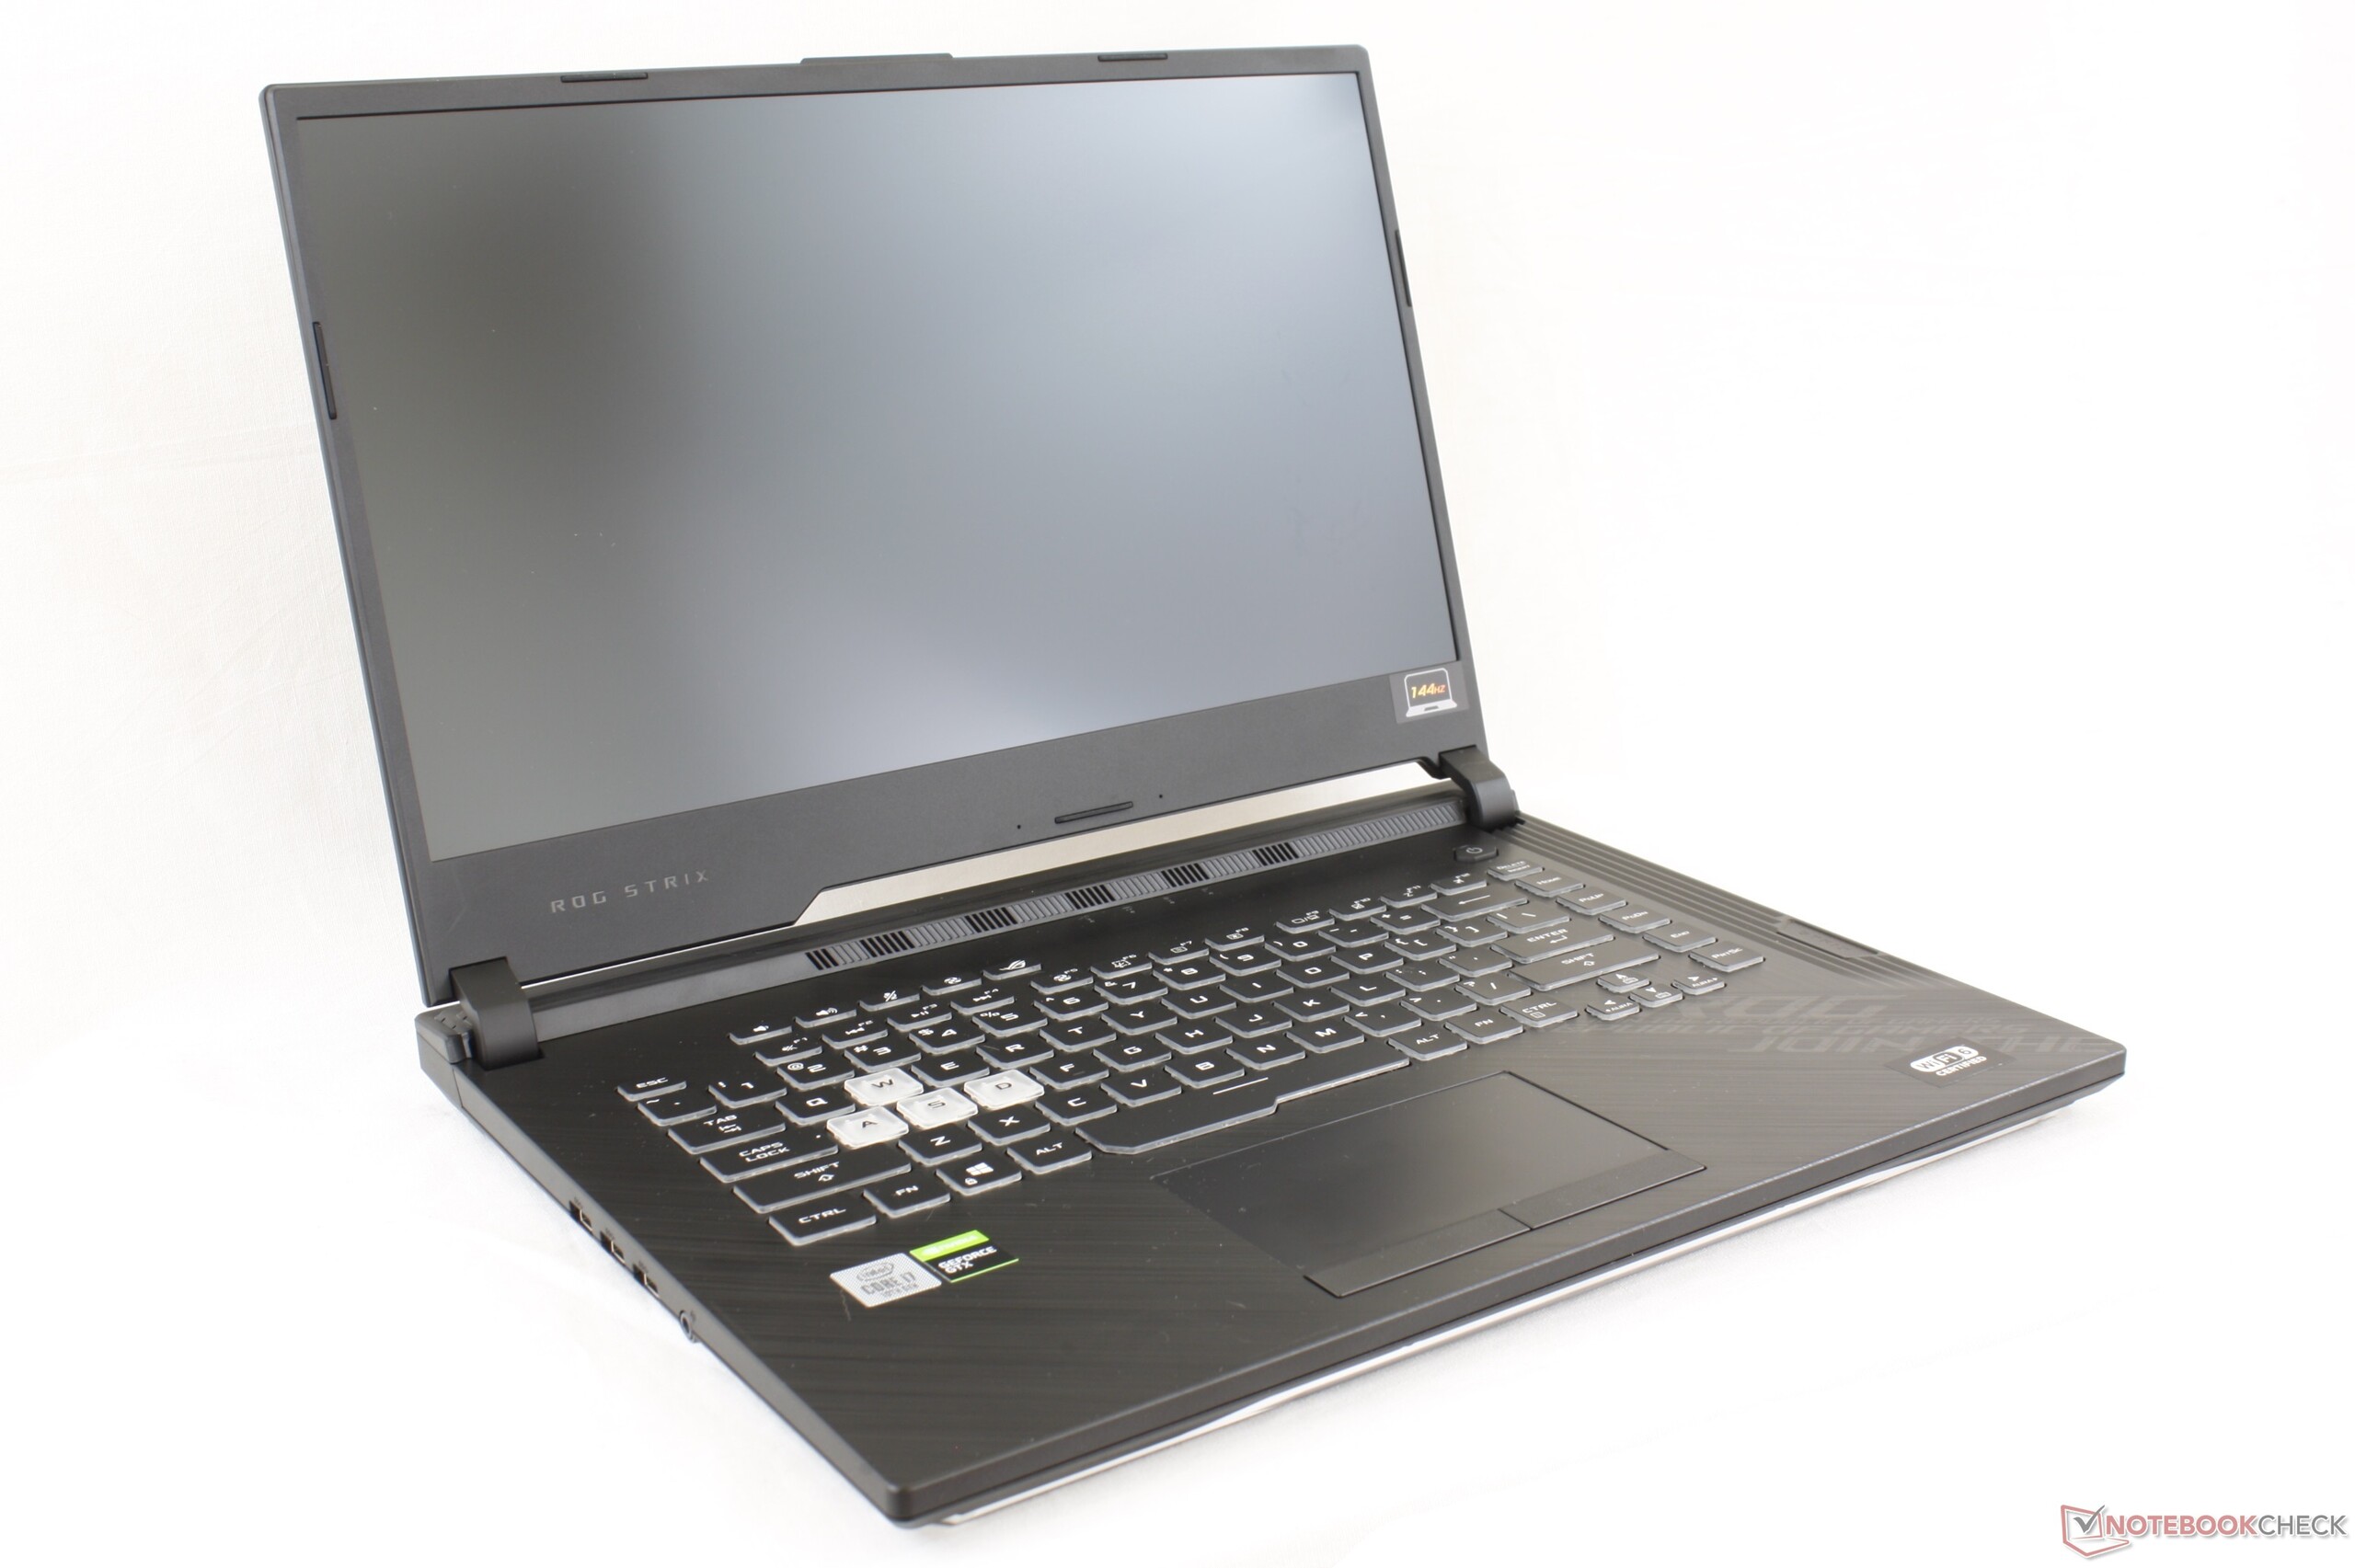
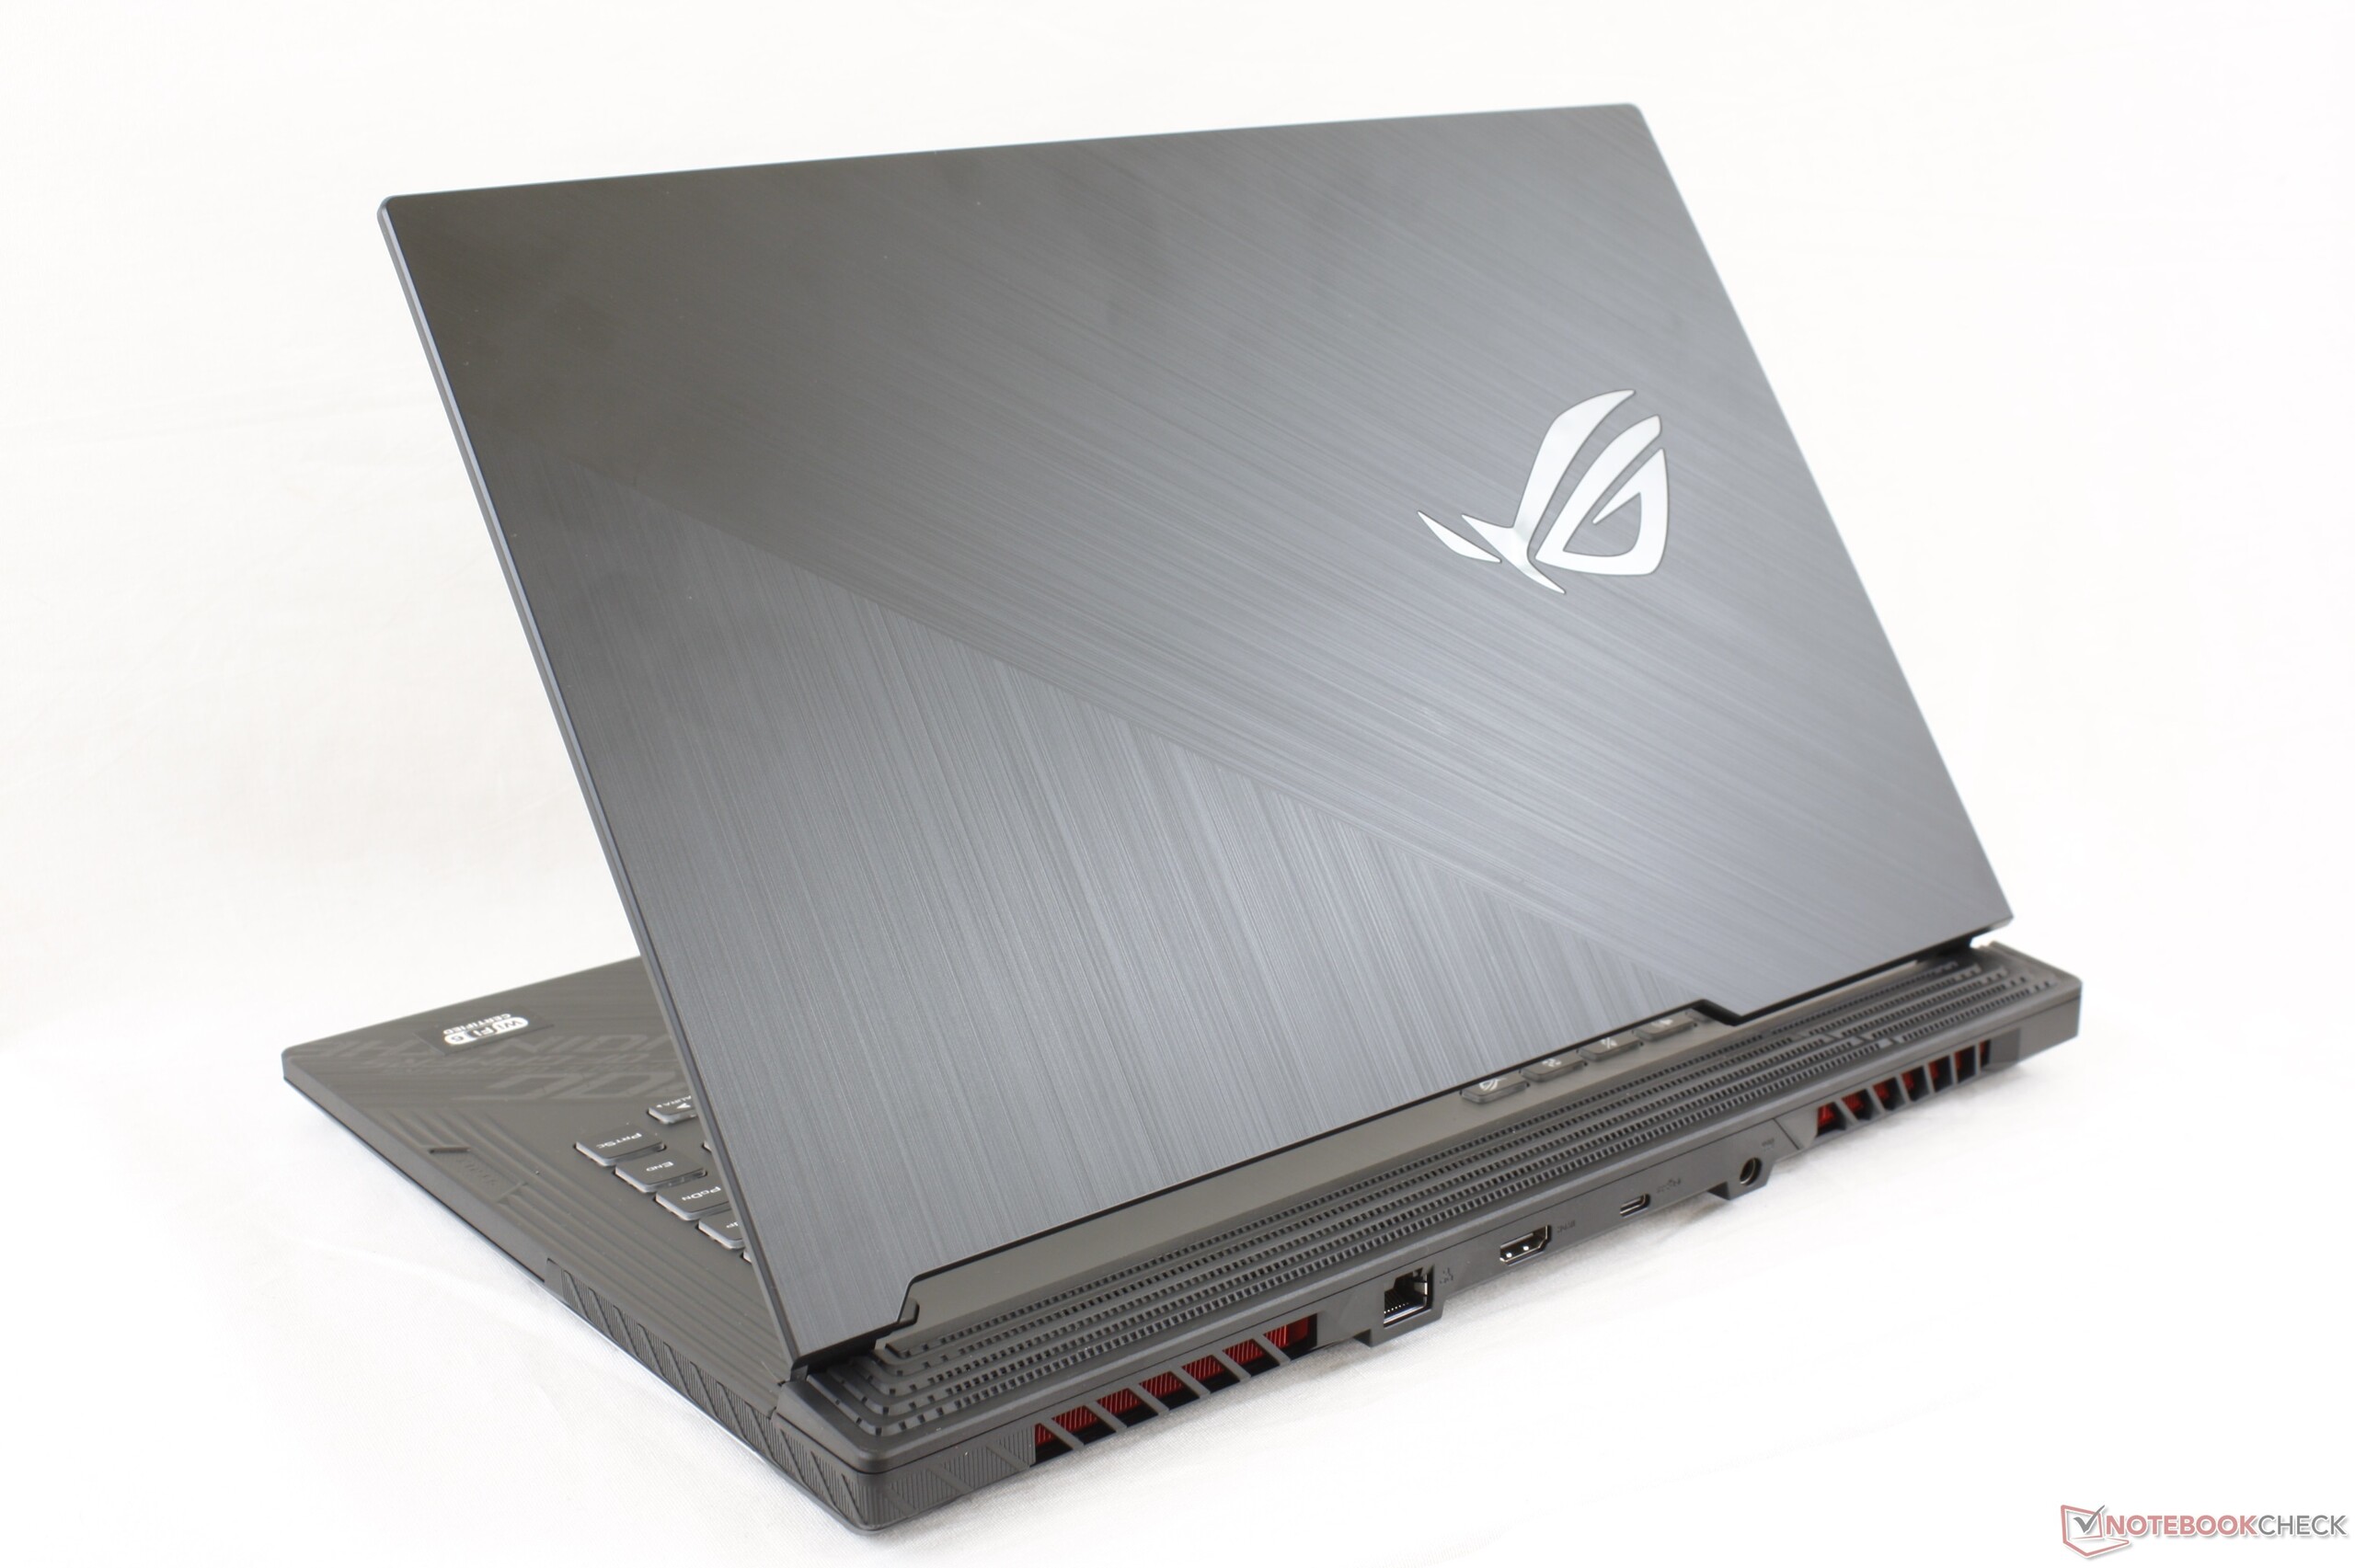
Egenskaperna som står ut mest är stöd för 3 st M.2 2280 SSD-enheter, en 144 Hz-skärm som grundalternativ och en LED-remsa runt den nedre kanten som ger en kul visuell touch till chassit. De flesta andra bärbara datorerna i den här storleksklassen rymmer bara två lagringsenheter. I övrigt är prestandan lite av en besvikelse för en spelmaskin som kostar 10.000 kronor då det går att få i princip samma grafikprestanda från en äldre och billigare laptop med ett GTX 1650 eller nästan 50 procent högre prestanda från system med ett GTX 1660 Ti som bara kostar 1.000 - 2.000 kronor mer.
Och även om 144 Hz-skärmen låter bra på pappret kommer den här specifika Panda-panelen med en del stora brister, vilket inkluderar ett mer begränsat färgomfång, märkbar ghosting och ett lågt kontrastförhållande. Spelupplevelsen är därför inte så smidig och färgglad som den hade kunnat vara, om man inte kan tänka sig att spendera mer på 144 Hz-alternativet.
Asus ROG Strix G15 G512LI erbjuder inte en tillräckligt lockade GPU för att vara värd 10.000 kronor, särskilt inte nu när bärbara speldatorer med AMD Ryzen börjar bli populära. För ungefär samma pris blir man istället mer nöjd med prestandan från en Asus TUF-modell eller ett GTX 1660 Ti-alternativ.
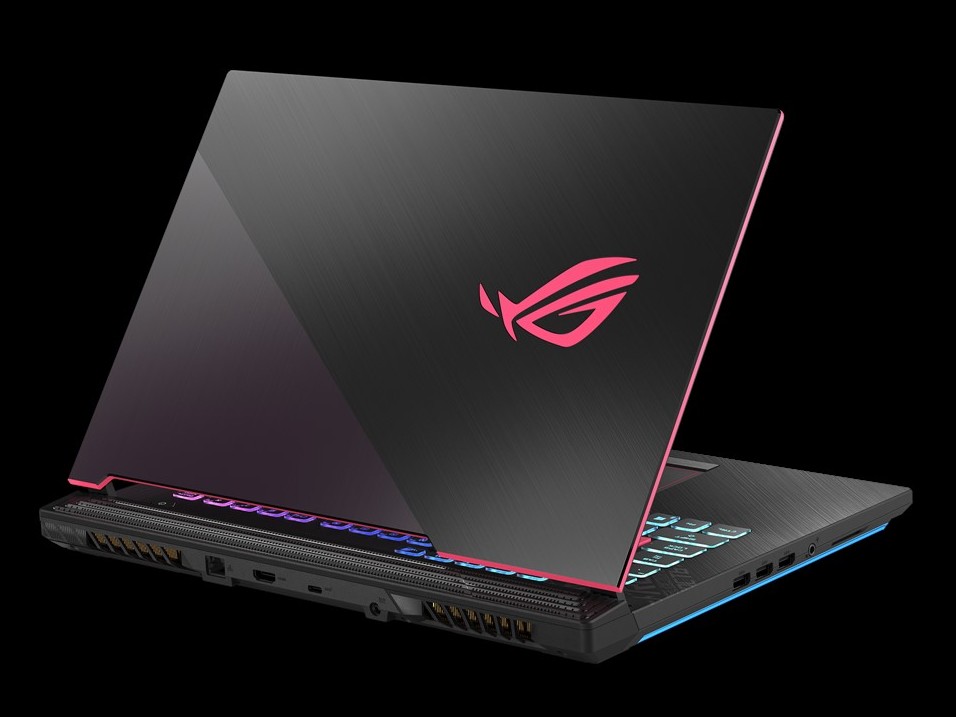
Asus ROG Strix G15 G512LI
- 11/04/2020 v7 (old)
Allen Ngo
Price comparison
