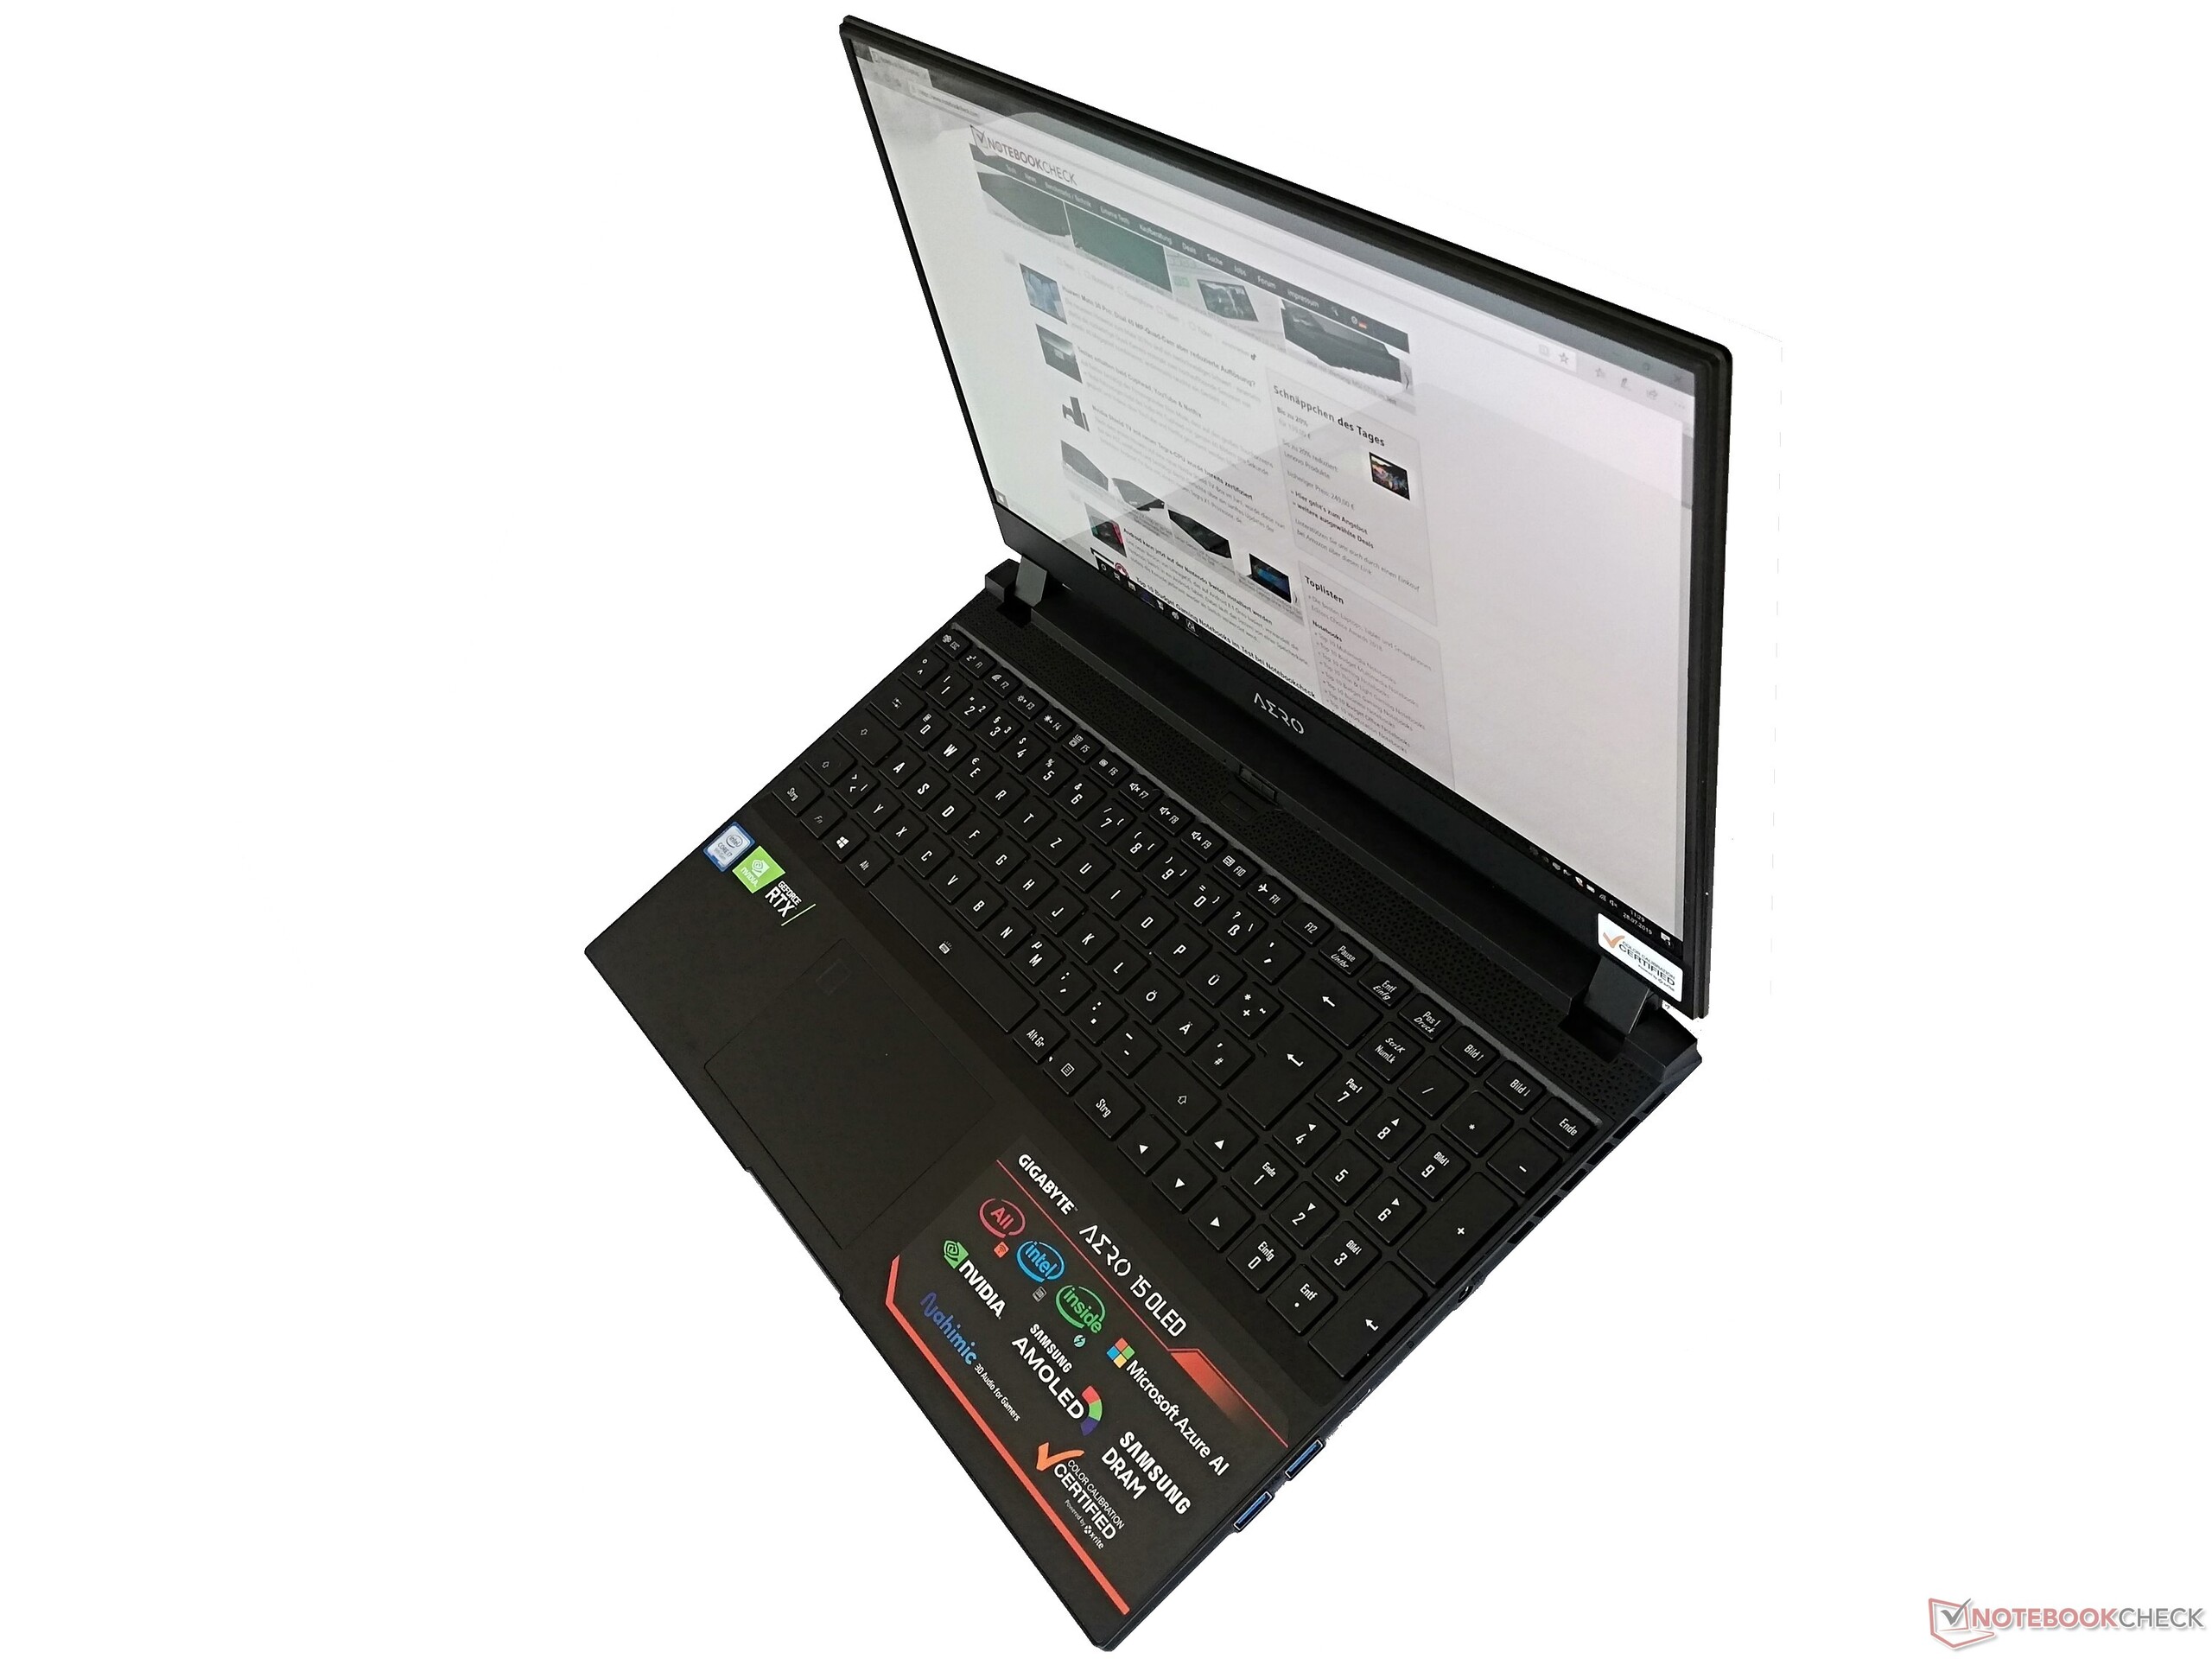
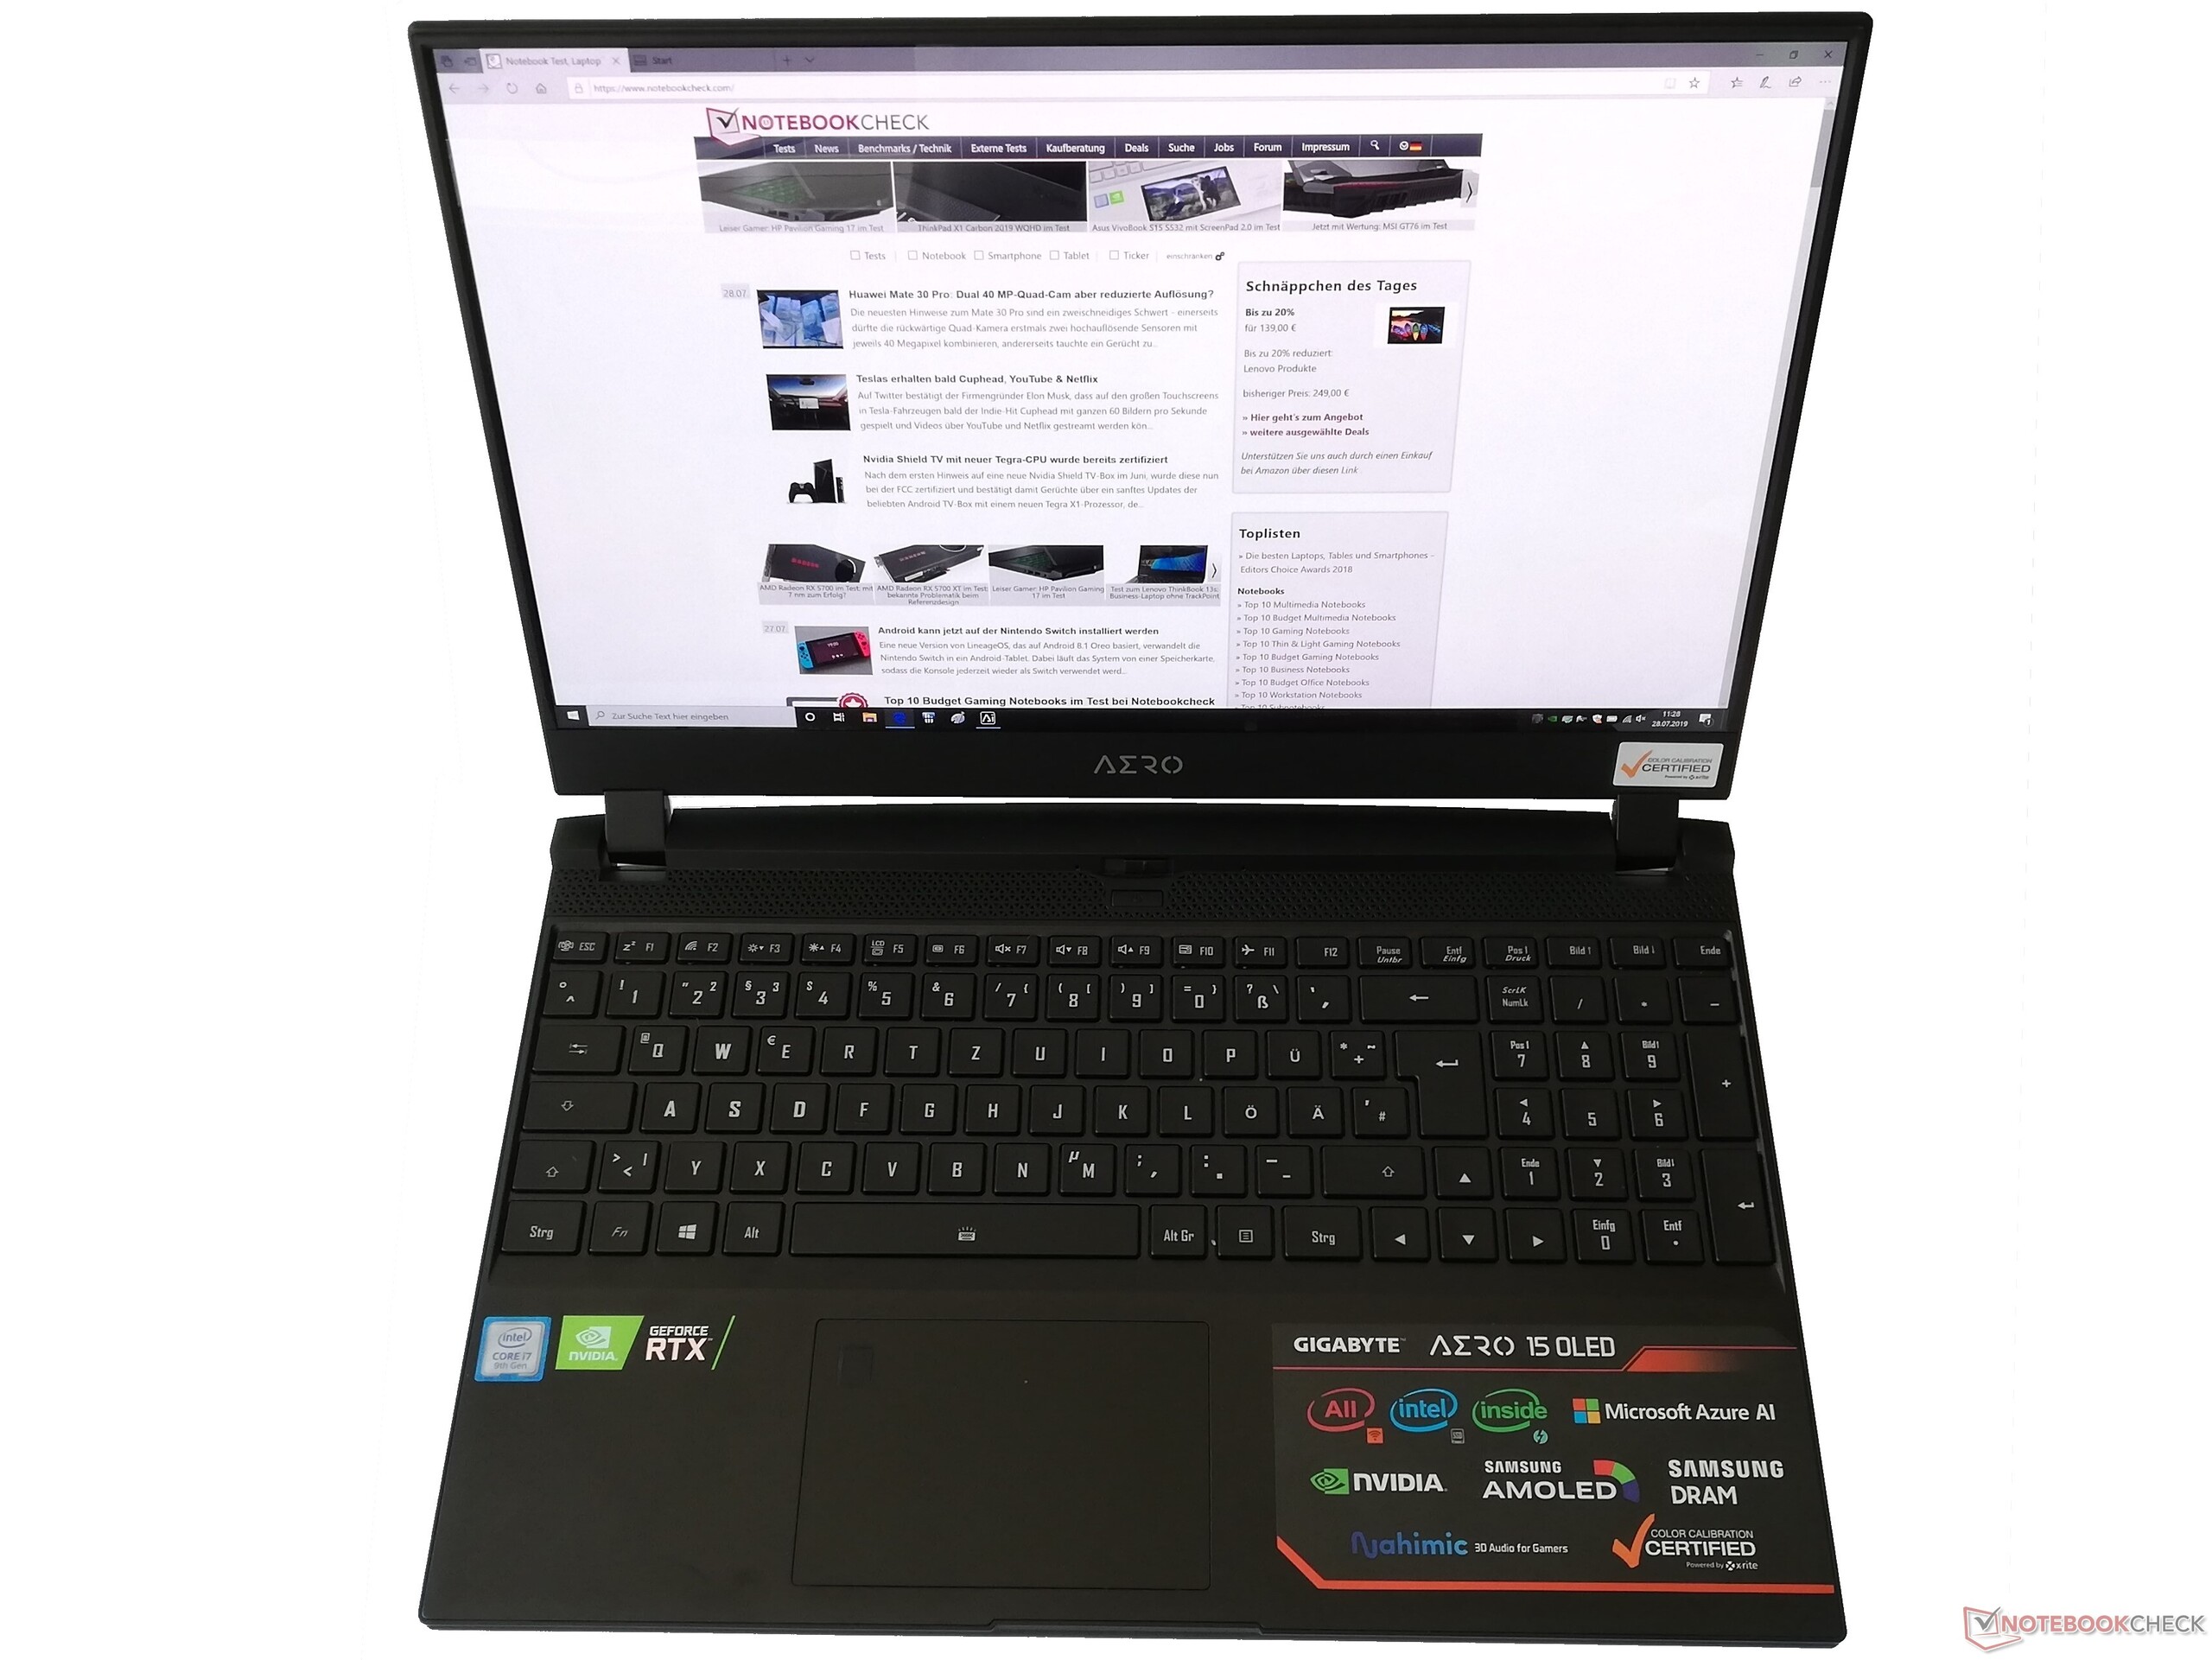
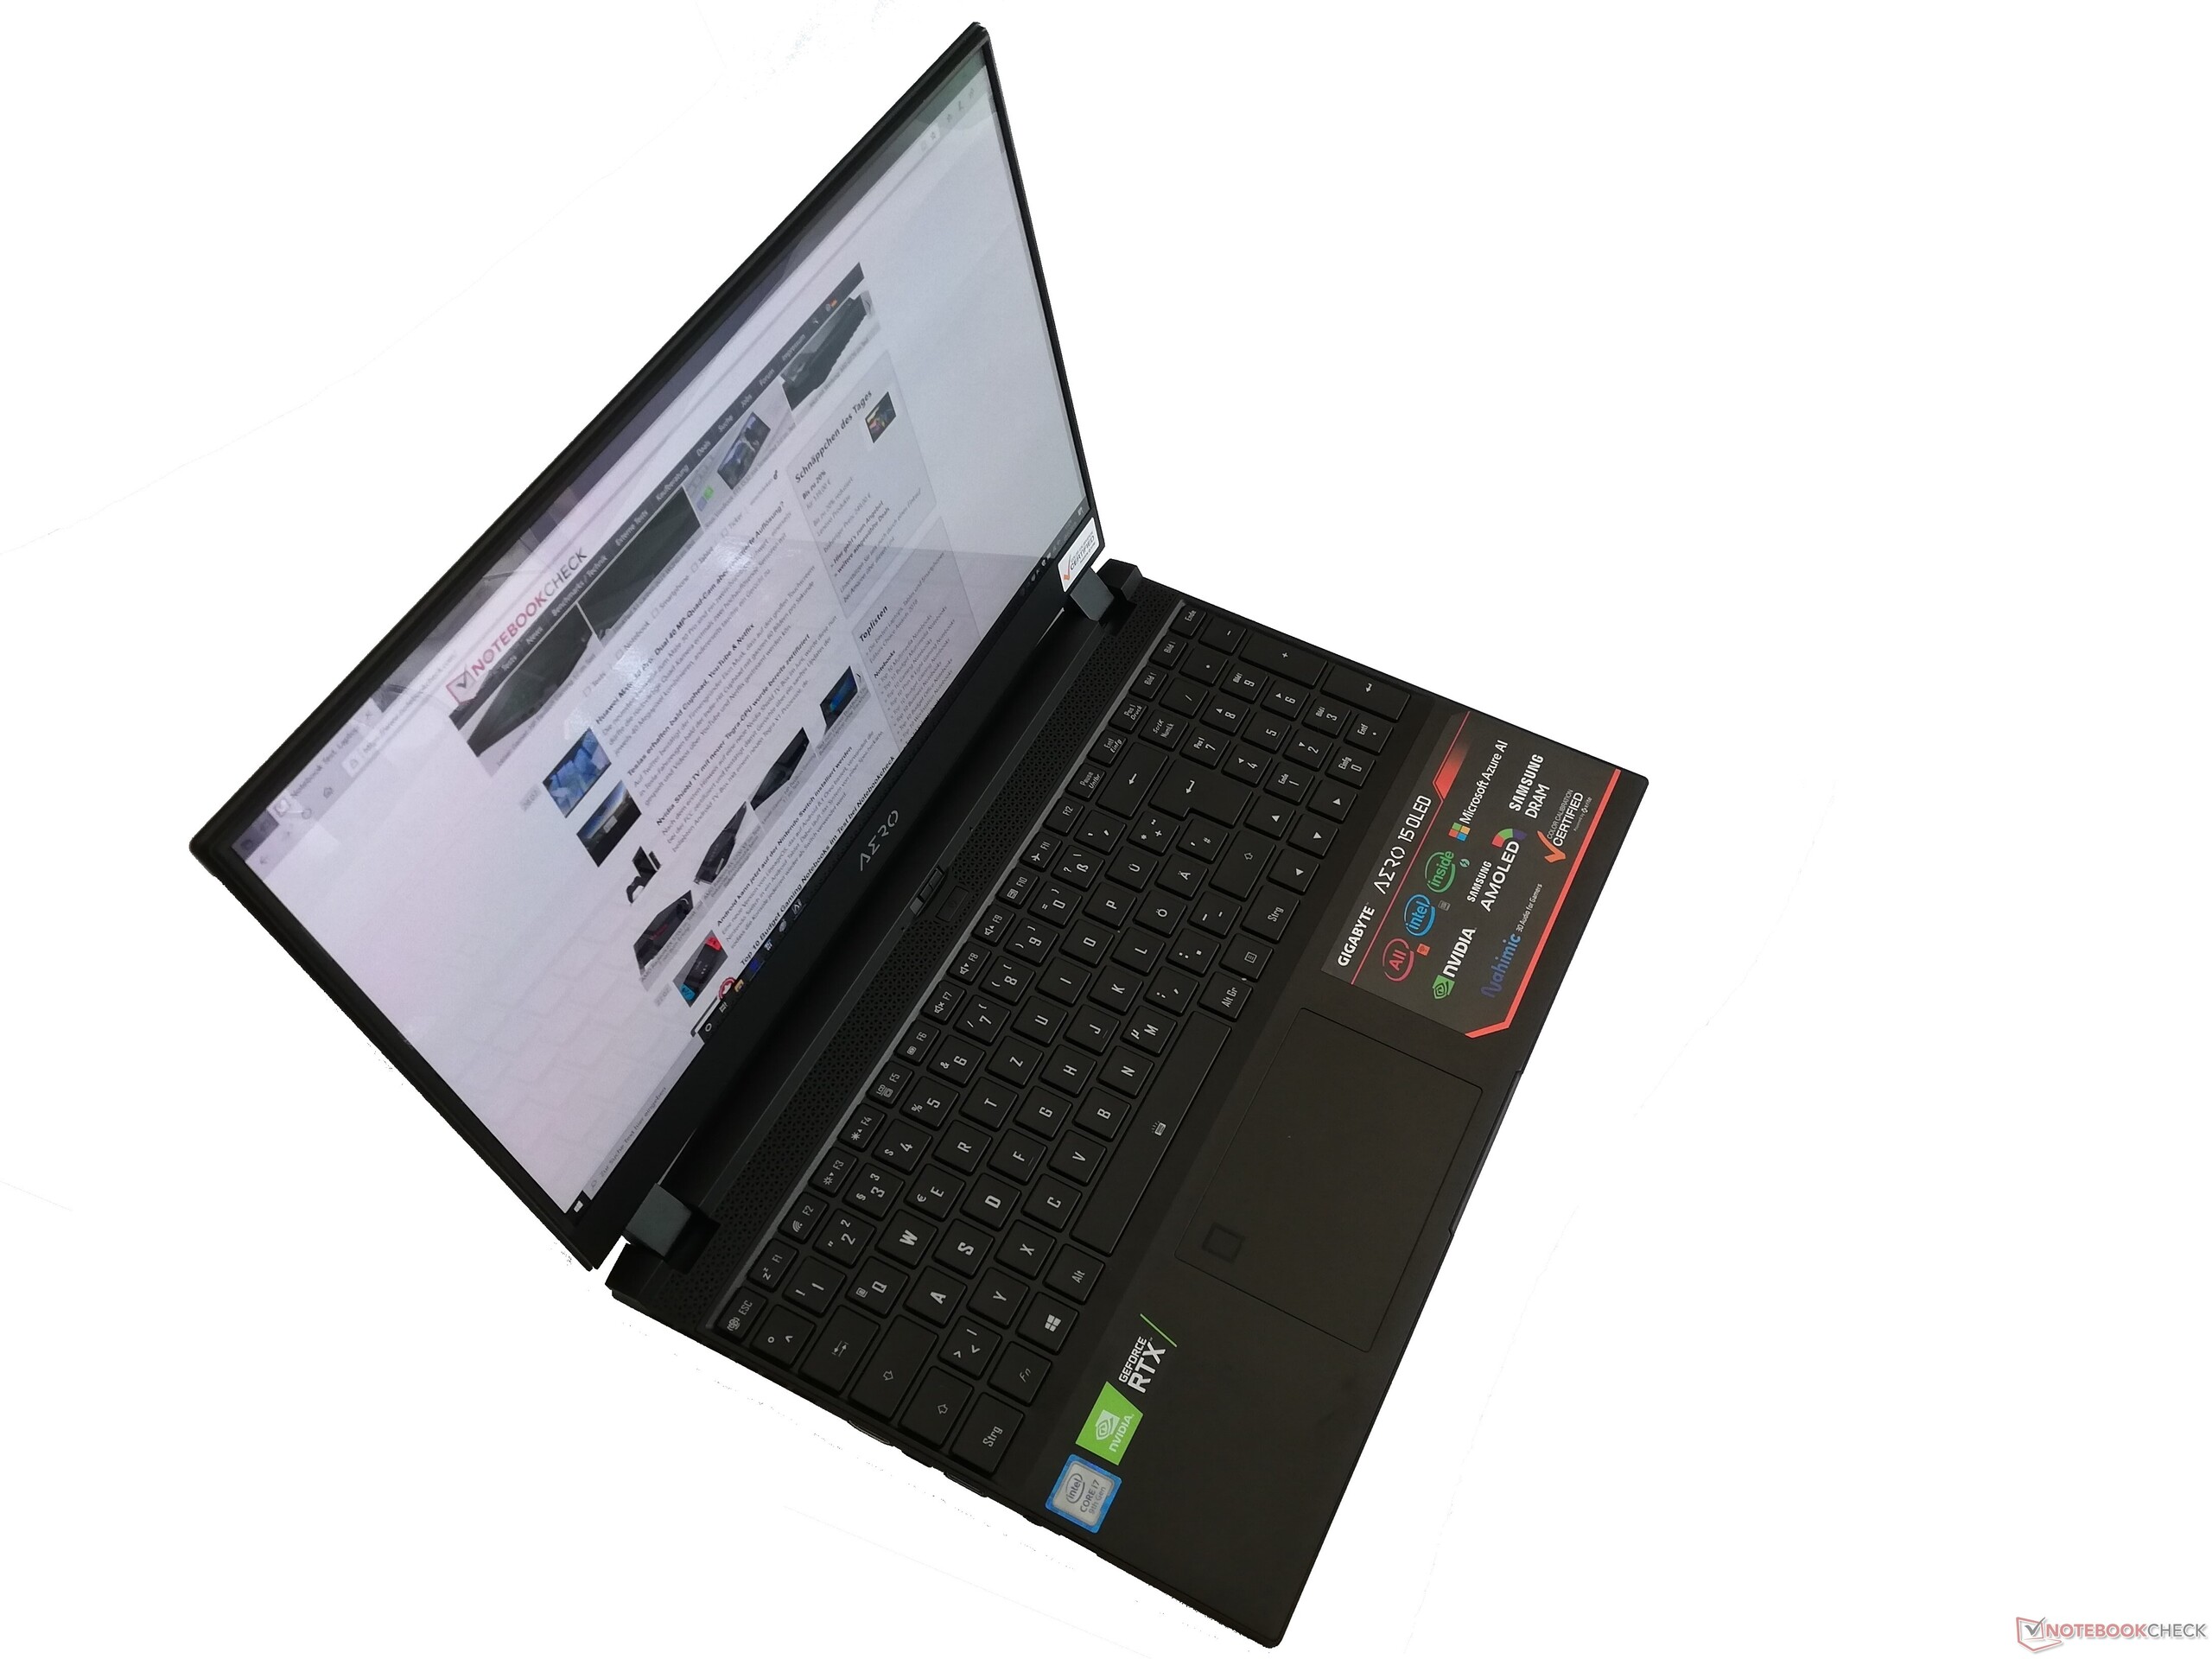
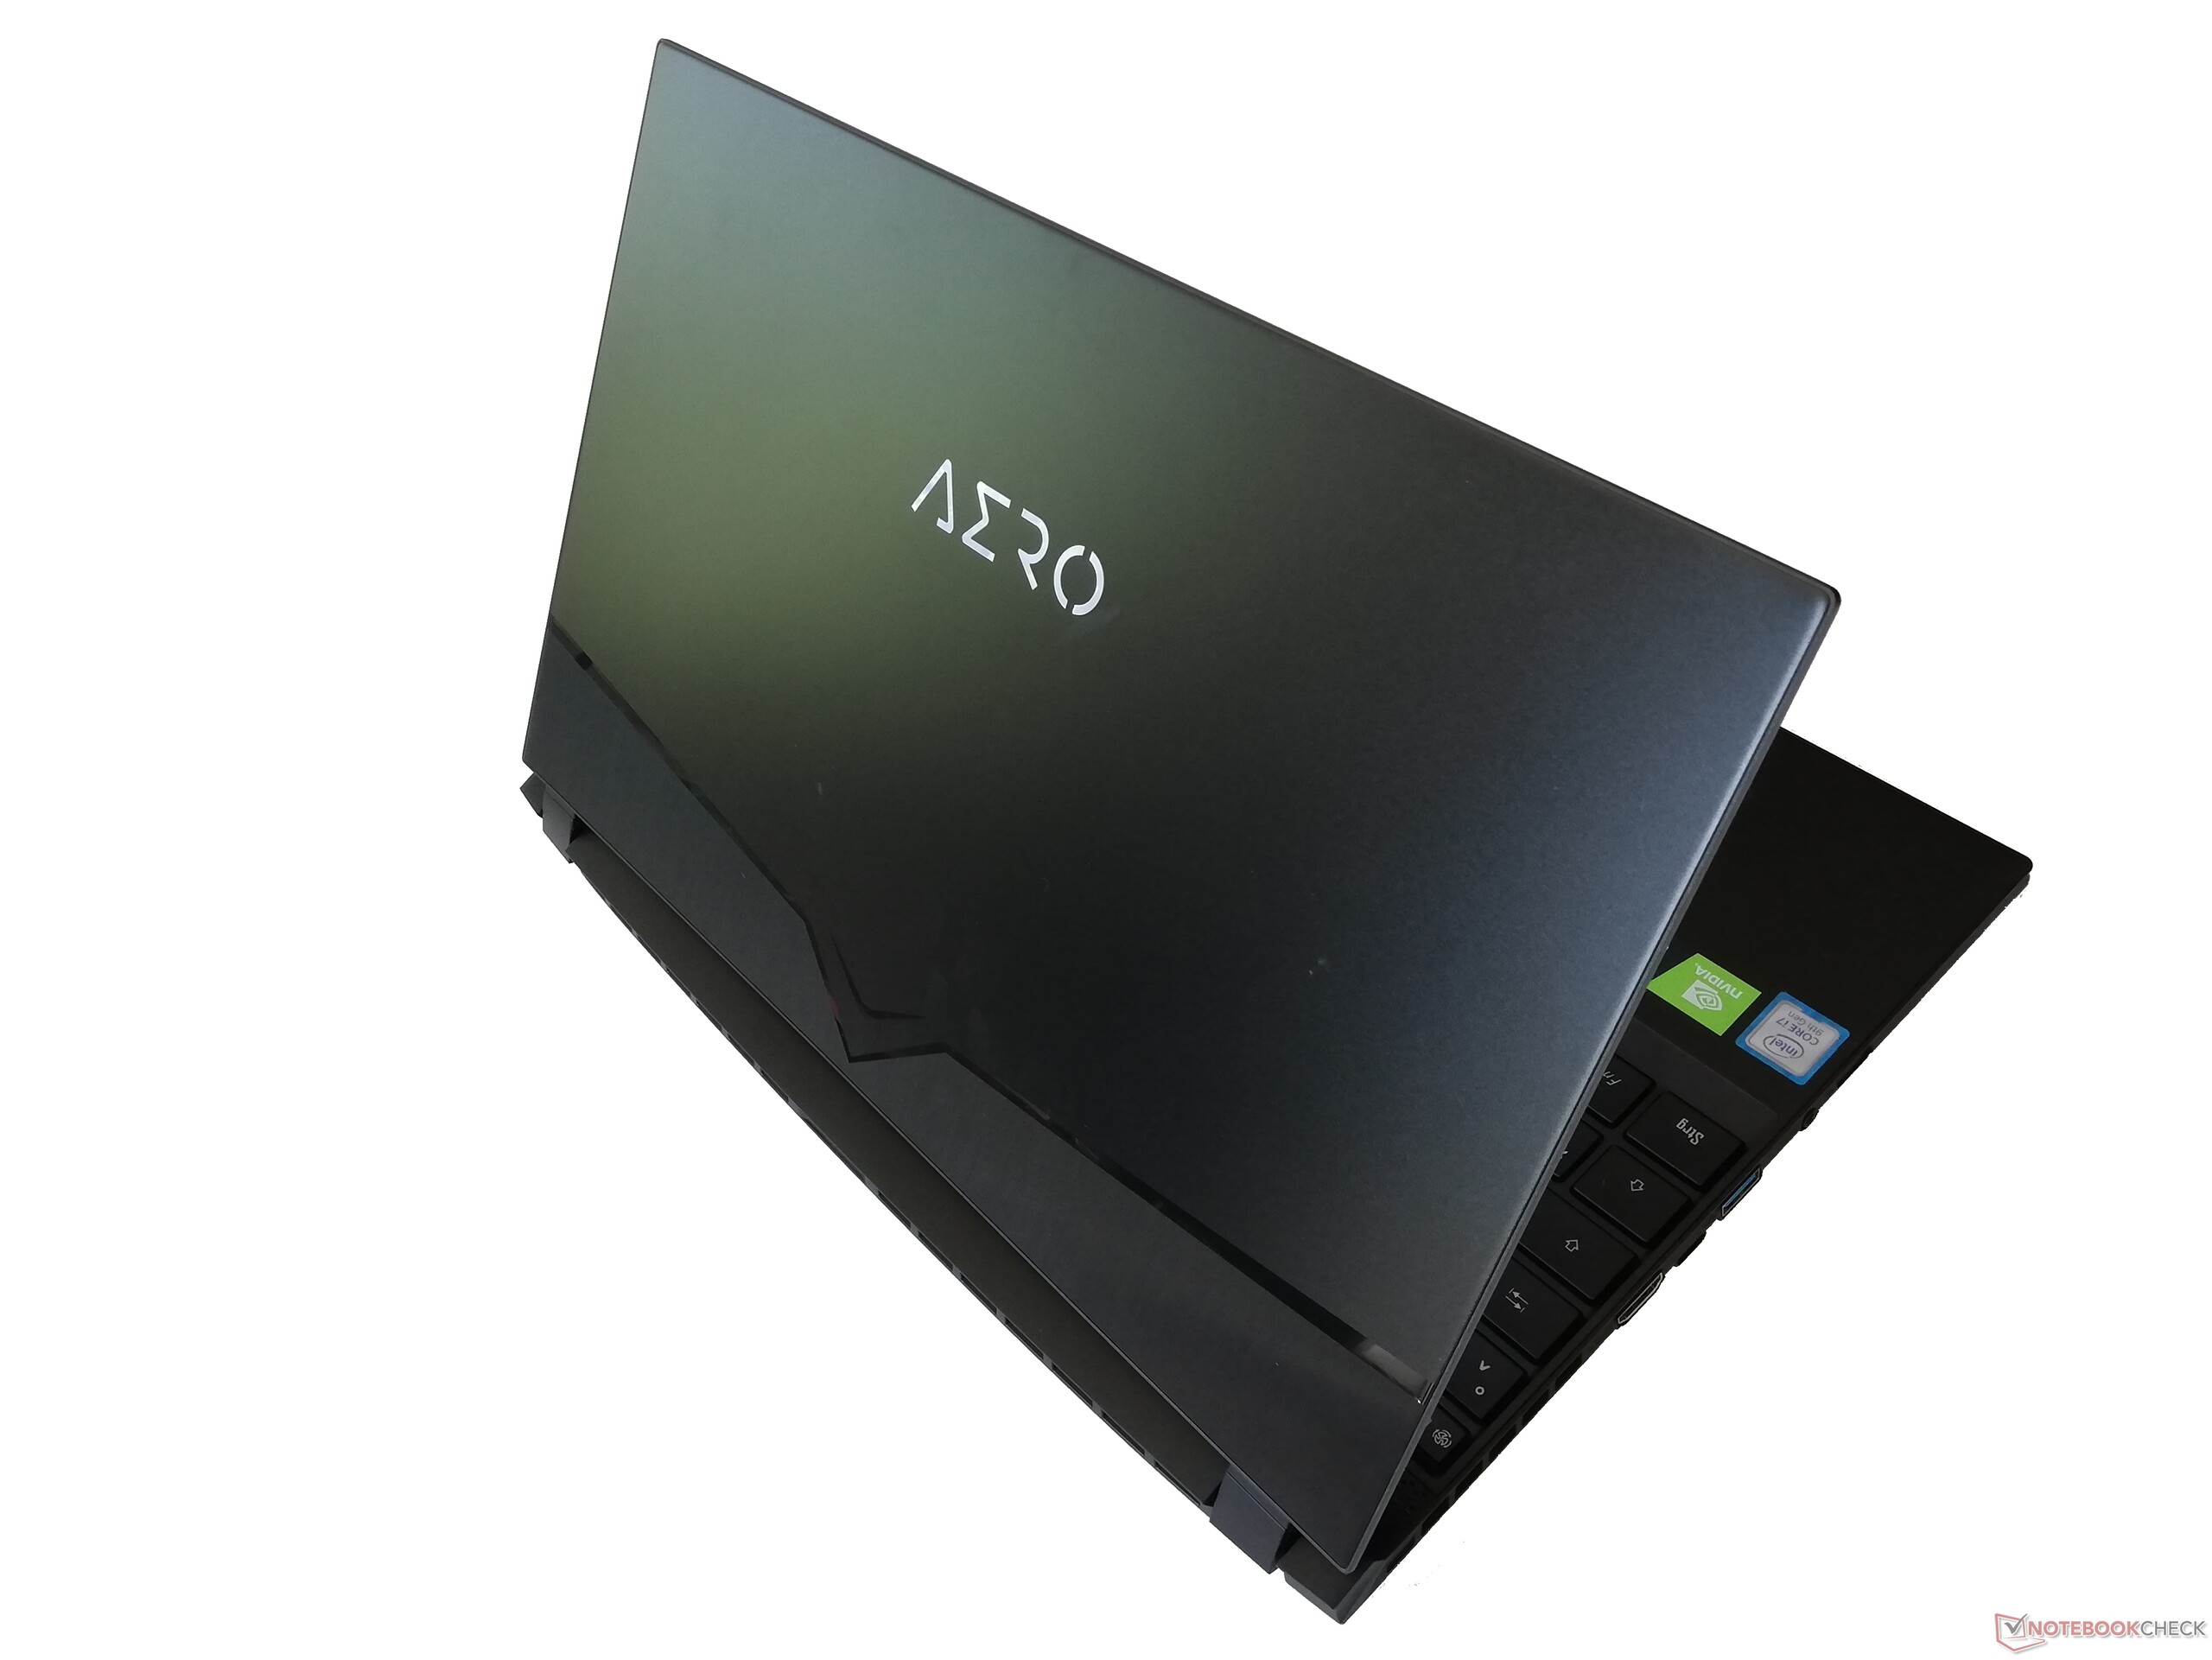
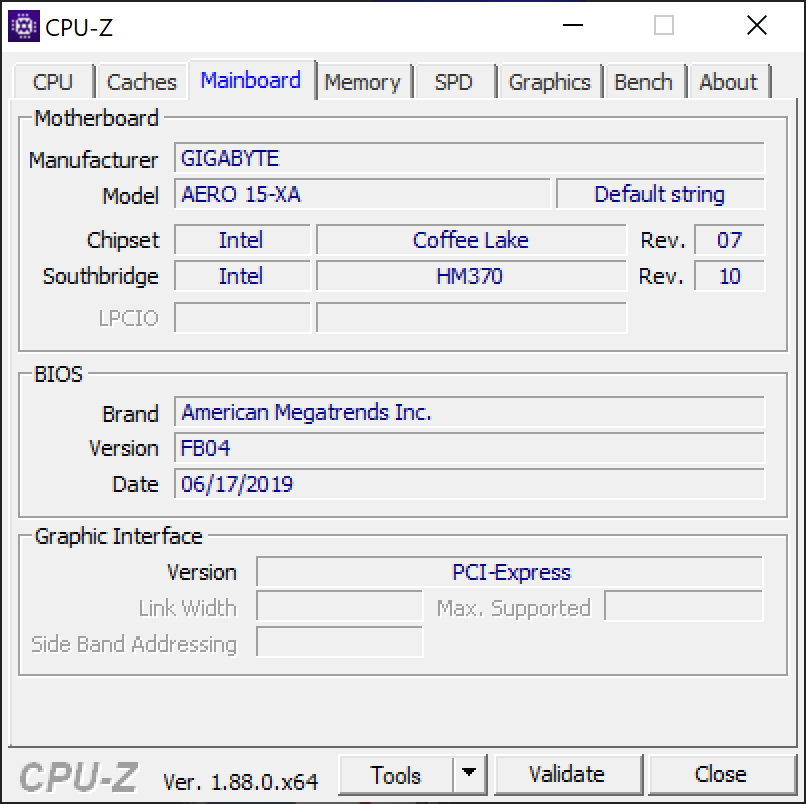
Test: Gigabyte Aero 15 XA - Ny design med OLED-skärm och 4K
| SD Card Reader | |
| average JPG Copy Test (av. of 3 runs) | |
| Gigabyte Aero 15 Classic-XA (Toshiba Exceria Pro SDXC 64 GB UHS-II) | |
| Gigabyte Aero 15 OLED XA (Toshiba Exceria Pro SDXC 64 GB UHS-II) | |
| Genomsnitt av klass Gaming (20.9 - 210, n=55, senaste 2 åren) | |
| Medion Erazer X15805 (Toshiba Exceria Pro SDXC 64 GB UHS-II) | |
| maximum AS SSD Seq Read Test (1GB) | |
| Gigabyte Aero 15 Classic-XA (Toshiba Exceria Pro SDXC 64 GB UHS-II) | |
| Gigabyte Aero 15 OLED XA (Toshiba Exceria Pro SDXC 64 GB UHS-II) | |
| Genomsnitt av klass Gaming (25.5 - 261, n=52, senaste 2 åren) | |
| Medion Erazer X15805 (Toshiba Exceria Pro SDXC 64 GB UHS-II) | |
| |||||||||||||||||||||||||
Distribution av ljusstyrkan: 93 %
Mitt på batteriet: 373 cd/m²
Kontrast: ∞:1 (Svärta: 0 cd/m²)
ΔE ColorChecker Calman: 3.98 | ∀{0.5-29.43 Ø4.71}
ΔE Greyscale Calman: 2.81 | ∀{0.09-98 Ø4.96}
97% sRGB (Argyll 1.6.3 3D)
78% AdobeRGB 1998 (Argyll 1.6.3 3D)
Gamma: 2.62
CCT: 6434 K
| Gigabyte Aero 15 OLED XA Samsung SDCA029, OLED, 3840x2160 | Medion Erazer X15805 LG Philips LP156WFG-SPB2, IPS, 1920x1080 | Gigabyte Aero 15 Classic-XA Sharp LQ156M1JW03 (SHP14C5), IGZO, 1920x1080 | Asus Zephyrus S GX502GW AU Optronics B156HAN08.2 (AUO82ED), IPS, 1920x1080 | MSI GS65 Stealth 9SG Sharp LQ156M1JW03 (SHP14C5), IPS, 1920x1080 | Aorus 15 W9 LG Philips LP156WFG-SPB2 (LGD05E8), IPS, 1920x1080 | |
|---|---|---|---|---|---|---|
| Display | ||||||
| Display P3 Coverage (%) | 61.7 | 65.3 | 64.9 | 67.6 | 64.3 | |
| sRGB Coverage (%) | 91.9 | 95.5 | 91 | 97.5 | 93.5 | |
| AdobeRGB 1998 Coverage (%) | 63 | 66.5 | 65.9 | 68.9 | 65.6 | |
| Response Times | -396% | -471% | -250% | -456% | -541% | |
| Response Time Grey 50% / Grey 80% * (ms) | 2.4 ? | 14 ? -483% | 15.2 ? -533% | 7.2 ? -200% | 13.6 ? -467% | 16.8 ? -600% |
| Response Time Black / White * (ms) | 2.2 ? | 9 ? -309% | 11.2 ? -409% | 8.8 ? -300% | 12 ? -445% | 12.8 ? -482% |
| PWM Frequency (Hz) | 60 ? | 23580 ? | 23260 ? | |||
| Screen | -24% | -10% | 2% | 13% | -22% | |
| Brightness middle (cd/m²) | 373 | 343 -8% | 266 -29% | 286 -23% | 282.3 -24% | 295 -21% |
| Brightness (cd/m²) | 375 | 290 -23% | 248 -34% | 275 -27% | 269 -28% | 292 -22% |
| Brightness Distribution (%) | 93 | 74 -20% | 89 -4% | 90 -3% | 90 -3% | 80 -14% |
| Black Level * (cd/m²) | 0.37 | 0.31 | 0.37 | 0.32 | 0.34 | |
| Colorchecker dE 2000 * | 3.98 | 4.22 -6% | 2.78 30% | 2.19 45% | 1.17 71% | 3.89 2% |
| Colorchecker dE 2000 max. * | 6.28 | 7.83 -25% | 5.96 5% | 4.4 30% | 3.29 48% | 7.28 -16% |
| Greyscale dE 2000 * | 2.81 | 5.1 -81% | 3.58 -27% | 2.2 22% | 1.3 54% | 4.98 -77% |
| Gamma | 2.62 84% | 2.2 100% | 2.46 89% | 2.41 91% | 2.2 100% | 2.45 90% |
| CCT | 6434 101% | 6970 93% | 7186 90% | 6405 101% | 6643 98% | 6407 101% |
| Color Space (Percent of AdobeRGB 1998) (%) | 78 | 58 -26% | 62 -21% | 59 -24% | 63.8 -18% | 60 -23% |
| Color Space (Percent of sRGB) (%) | 97 | 92 -5% | 96 -1% | 91 -6% | 97.5 1% | 93 -4% |
| Contrast (:1) | 927 | 858 | 773 | 882 | 868 | |
| Colorchecker dE 2000 calibrated * | 1.33 | 0.91 | 2.27 | 1.06 | 1.44 | |
| Totalt genomsnitt (program/inställningar) | -210% /
-99% | -241% /
-102% | -124% /
-49% | -222% /
-81% | -282% /
-126% |
* ... mindre är bättre
Visa svarstider
| ↔ Svarstid svart till vitt | ||
|---|---|---|
| 2.2 ms ... stiga ↗ och falla ↘ kombinerat | ↗ 1.2 ms stiga | 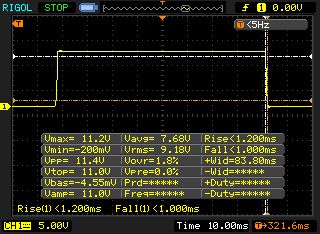 |
| ↘ 1 ms hösten | ||
| Skärmen visar väldigt snabba svarsfrekvenser i våra tester och borde vara mycket väl lämpad för fartfyllt spel. I jämförelse sträcker sig alla testade enheter från 0.1 (minst) till 240 (maximalt) ms. » 12 % av alla enheter är bättre. Det betyder att den uppmätta svarstiden är bättre än genomsnittet av alla testade enheter (19.8 ms). | ||
| ↔ Svarstid 50 % grått till 80 % grått | ||
| 2.4 ms ... stiga ↗ och falla ↘ kombinerat | ↗ 1 ms stiga | 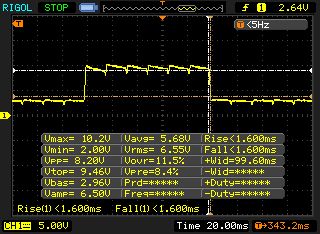 |
| ↘ 1.4 ms hösten | ||
| Skärmen visar väldigt snabba svarsfrekvenser i våra tester och borde vara mycket väl lämpad för fartfyllt spel. I jämförelse sträcker sig alla testade enheter från 0.165 (minst) till 636 (maximalt) ms. » 11 % av alla enheter är bättre. Det betyder att den uppmätta svarstiden är bättre än genomsnittet av alla testade enheter (30.9 ms). | ||
Skärmflimmer / PWM (Puls-Width Modulation)
| Skärmflimmer / PWM upptäckt | 60 Hz | ≤ 80 % ljusstyrka inställning | 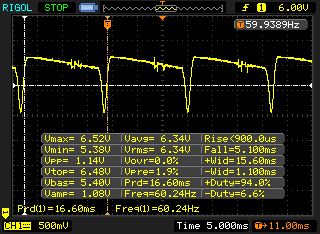 |
Displayens bakgrundsbelysning flimrar vid 60 Hz (i värsta fall, t.ex. med PWM) Flimrande upptäckt vid en ljusstyrkeinställning på 80 % och lägre. Det ska inte finnas något flimmer eller PWM över denna ljusstyrkeinställning. Frekvensen för 60 Hz är mycket låg, så flimmer kan orsaka ögon- och huvudvärk efter långvarig användning. Som jämförelse: 52 % av alla testade enheter använder inte PWM för att dämpa skärmen. Om PWM upptäcktes mättes ett medelvärde av 7748 (minst: 5 - maximum: 343500) Hz. | |||
| PCMark 8 Home Score Accelerated v2 | 3638 poäng | |
| PCMark 8 Work Score Accelerated v2 | 4520 poäng | |
| PCMark 10 Score | 5439 poäng | |
Hjälp | ||
| Gigabyte Aero 15 OLED XA Intel SSD 600p SSDPEKKW512G8L | Medion Erazer X15805 Samsung SSD PM981 MZVLB512HAJQ | Gigabyte Aero 15 Classic-XA Intel SSD 760p SSDPEKKW512G8 | Asus Zephyrus S GX502GW 2x Intel SSD 660p SSDPEKNW512G8 (RAID 0) | MSI GS65 Stealth 9SG Samsung SSD PM981 MZVLB512HAJQ | Aorus 15 W9 Intel SSD 760p SSDPEKKW512G8 | |
|---|---|---|---|---|---|---|
| CrystalDiskMark 5.2 / 6 | 2% | -4% | -6% | -6% | -14% | |
| Write 4K (MB/s) | 126.7 | 116.8 -8% | 115.5 -9% | 97 -23% | 91.3 -28% | 99.2 -22% |
| Read 4K (MB/s) | 66.1 | 41.42 -37% | 58 -12% | 49.58 -25% | 40.73 -38% | 54.1 -18% |
| Write Seq (MB/s) | 1538 | 1994 30% | 1555 1% | 1838 20% | 1915 25% | 1524 -1% |
| Read Seq (MB/s) | 2269 | 2392 5% | 2590 14% | 2421 7% | 2051 -10% | 2325 2% |
| Write 4K Q32T1 (MB/s) | 456.7 | 394.9 -14% | 369.3 -19% | 326.9 -28% | 308.3 -32% | 259.2 -43% |
| Read 4K Q32T1 (MB/s) | 554 | 438.2 -21% | 441.7 -20% | 372.9 -33% | 417.4 -25% | 328.9 -41% |
| Write Seq Q32T1 (MB/s) | 1541 | 1987 29% | 1547 0% | 1894 23% | 1922 25% | 1566 2% |
| Read Seq Q32T1 (MB/s) | 2567 | 3457 35% | 2969 16% | 2828 10% | 3395 32% | 2767 8% |

| 3DMark 11 Performance | 19110 poäng | |
| 3DMark Cloud Gate Standard Score | 29711 poäng | |
| 3DMark Fire Strike Score | 16110 poäng | |
| 3DMark Time Spy Score | 6512 poäng | |
Hjälp | ||
| The Witcher 3 - 1920x1080 Ultra Graphics & Postprocessing (HBAO+) | |
| Genomsnitt av klass Gaming (104.7 - 240, n=7, senaste 2 åren) | |
| Asus Zephyrus S GX502GW | |
| MSI GS65 Stealth 9SG | |
| Gigabyte Aero 15 Classic-XA | |
| Medion Erazer X15805 | |
| Gigabyte Aero 15 OLED XA | |
| Aorus 15 W9 | |
| BioShock Infinite - 1920x1080 Ultra Preset, DX11 (DDOF) | |
| MSI GS65 Stealth 9SG | |
| Gigabyte Aero 15 OLED XA | |
| Medion Erazer X15805 | |
| Gigabyte Aero 15 Classic-XA | |
| Aorus 15 W9 | |
| Thief - 1920x1080 Very High Preset AA:FXAA & High SS AF:8x | |
| Gigabyte Aero 15 OLED XA | |
| Rise of the Tomb Raider - 3840x2160 High Preset AA:FX AF:4x | |
| Gigabyte Aero 15 OLED XA | |
| låg | med. | hög | ultra | 4K | |
|---|---|---|---|---|---|
| BioShock Infinite (2013) | 152 | ||||
| Thief (2014) | 103 | ||||
| GTA V (2015) | 173 | 165 | 136 | 77 | 69 |
| The Witcher 3 (2015) | 63.5 | ||||
| Rise of the Tomb Raider (2016) | 43.4 | ||||
| Shadow of the Tomb Raider (2018) | 119.4 | 94.6 | 89.6 | 80.6 | 28.3 |
| Metro Exodus (2019) | 123 | 78 | 58 | 46 | 22 |
| The Division 2 (2019) | 150 | 105 | 86 | 63 | 23 |
| Anno 1800 (2019) | 36.4 | 21.6 | |||
| Control (2019) | 220 | 81 | 59.3 | 18.1 |
Ljudnivå
| Låg belastning |
| 34 / 35 / 45 dB(A) |
| Hög belastning |
| 43 / 54 dB(A) |
 | ||
30 dB tyst 40 dB(A) hörbar 50 dB(A) högt ljud |
||
min: | ||
(-) Den maximala temperaturen på ovansidan är 49 °C / 120 F, jämfört med genomsnittet av 40.4 °C / 105 F , allt från 21.2 till 68.8 °C för klassen Gaming.
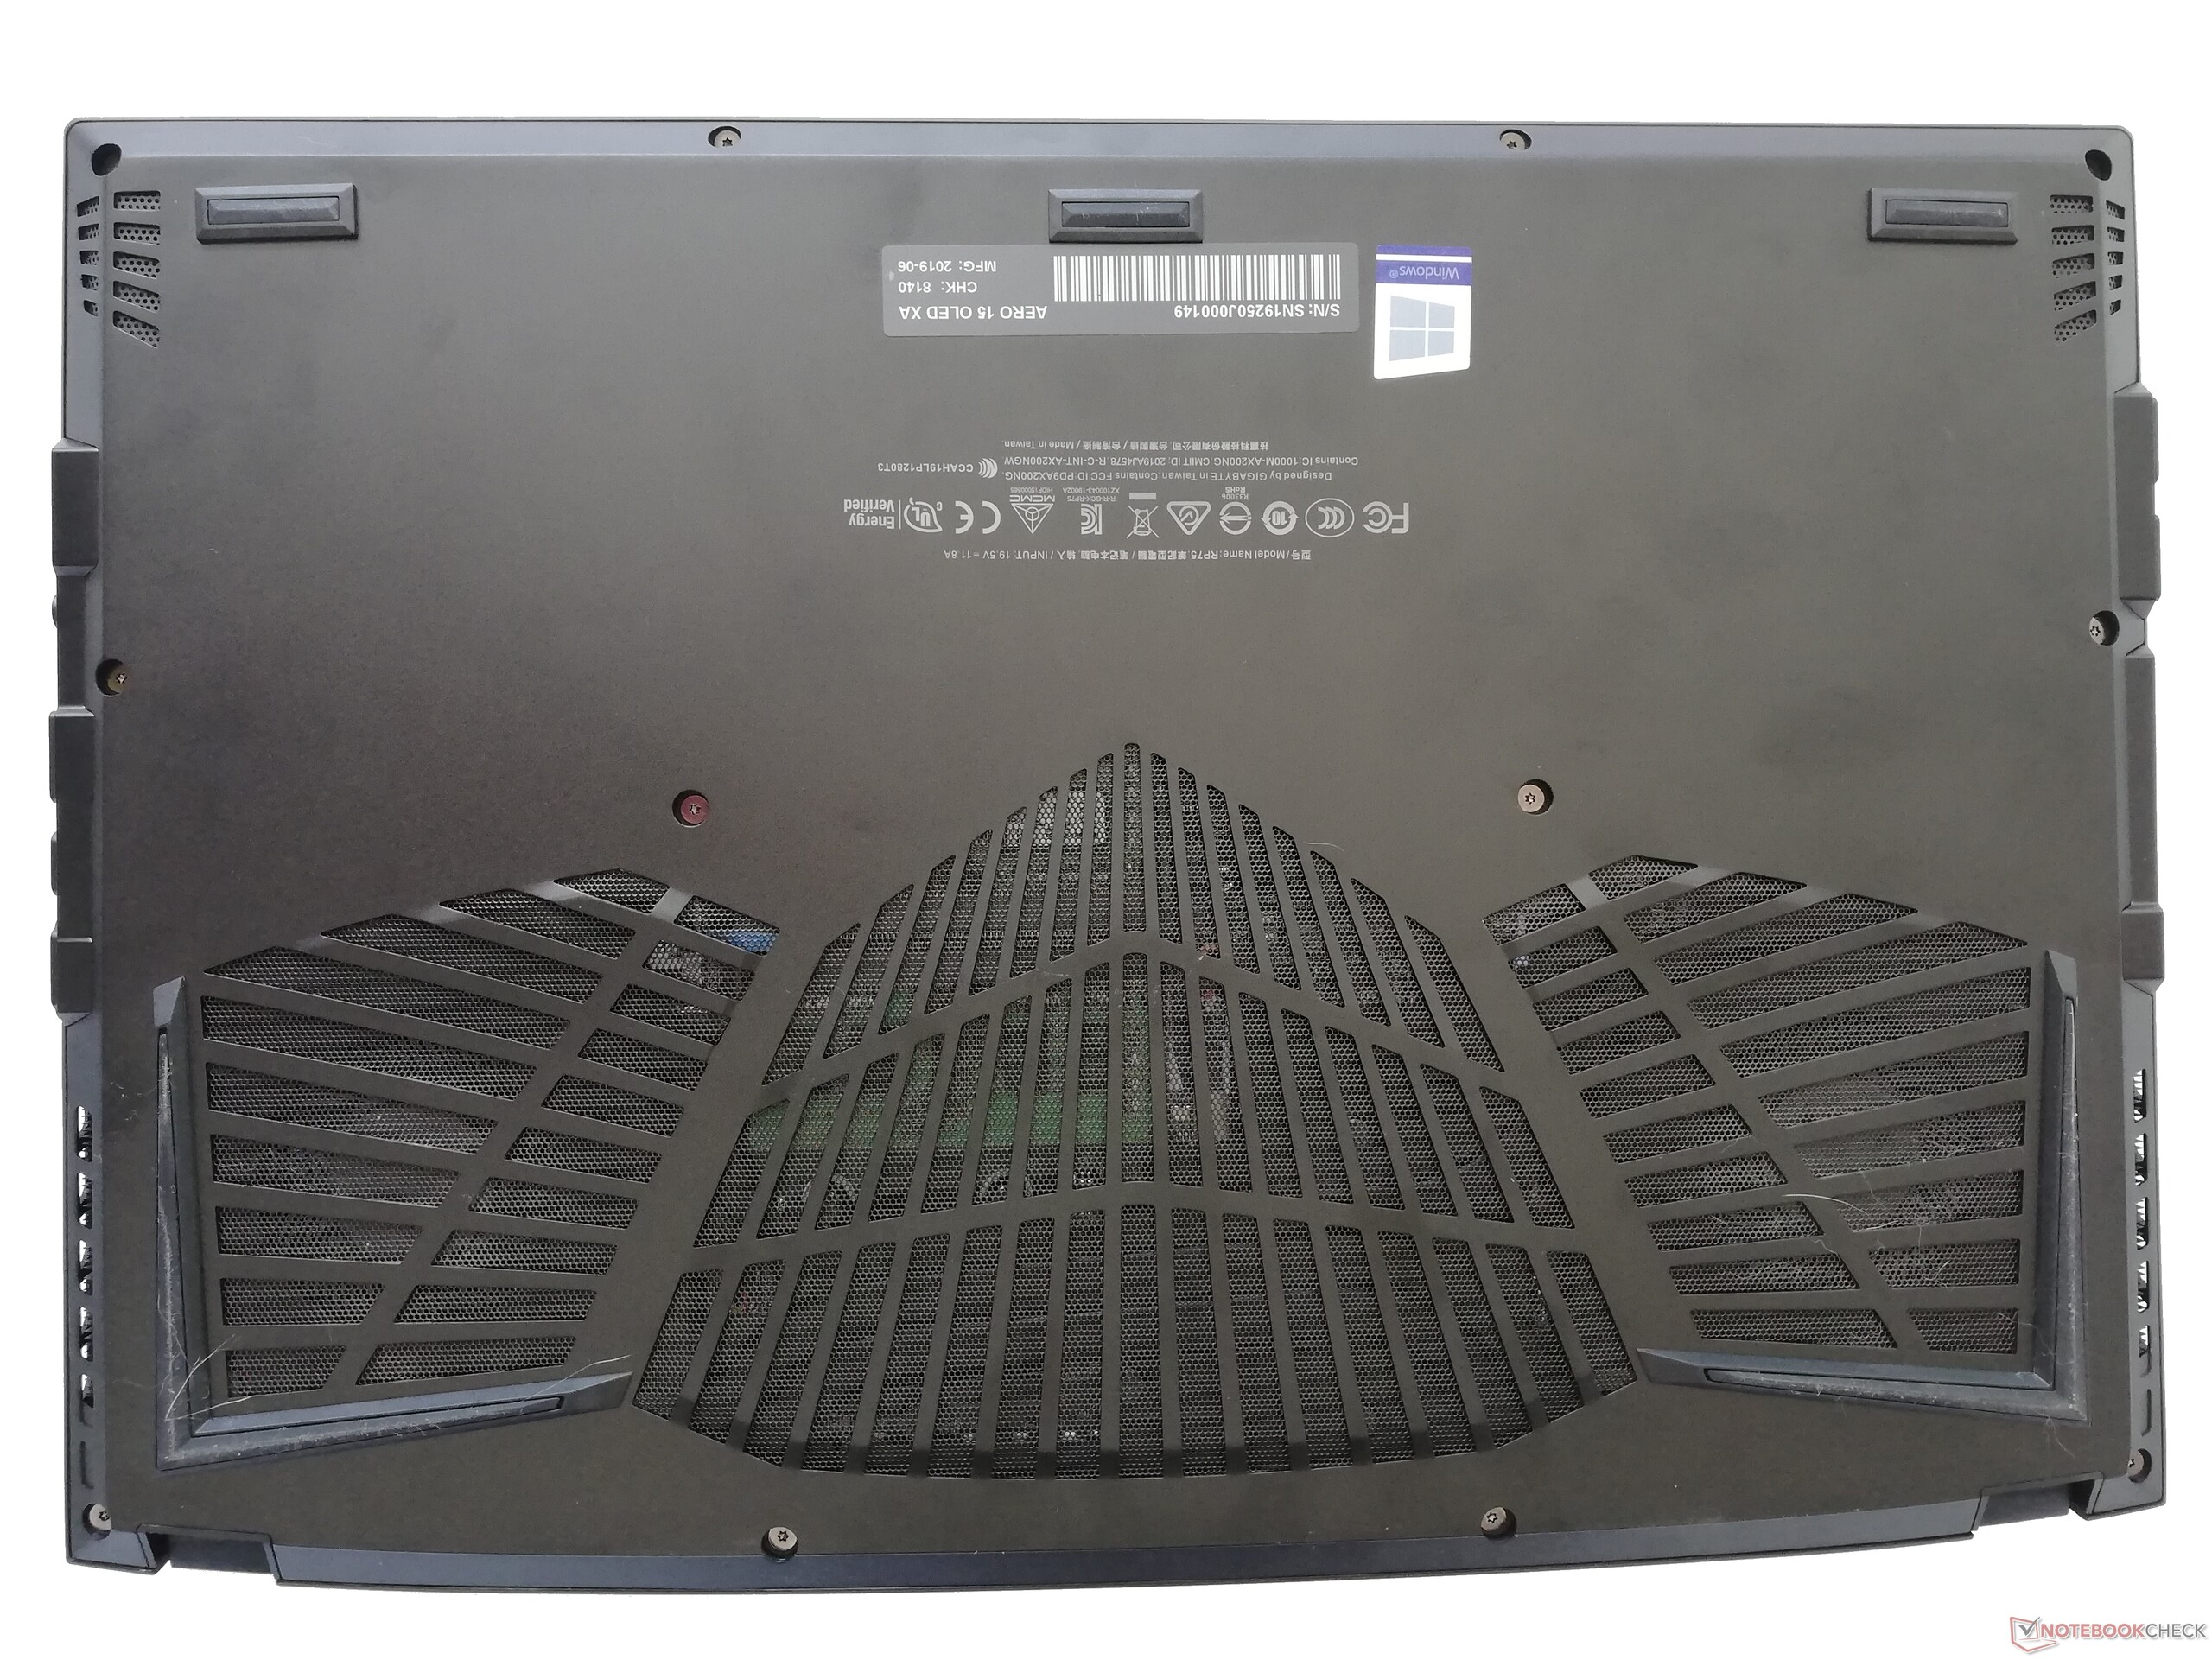
(-) Botten värms upp till maximalt 59 °C / 138 F, jämfört med genomsnittet av 43.2 °C / 110 F
(+) Vid tomgångsbruk är medeltemperaturen för ovansidan 30.6 °C / 87 F, jämfört med enhetsgenomsnittet på 33.9 °C / ### class_avg_f### F.
(-) När du spelar The Witcher 3 är medeltemperaturen för ovansidan 42.1 °C / 108 F, jämfört med enhetsgenomsnittet på 33.9 °C / ## #class_avg_f### F.
(-) Handledsstöden och pekplattan kan bli väldigt varma vid beröring med maximalt 41 °C / 105.8 F.
(-) Medeltemperaturen för handledsstödsområdet på liknande enheter var 28.8 °C / 83.8 F (-12.2 °C / -22 F).
Gigabyte Aero 15 OLED XA ljudanalys
(+) | högtalare kan spela relativt högt (84 dB)
Bas 100 - 315 Hz
(-) | nästan ingen bas - i genomsnitt 19.7% lägre än medianen
(±) | linjäriteten för basen är genomsnittlig (12.5% delta till föregående frekvens)
Mellan 400 - 2000 Hz
(±) | högre mellan - i genomsnitt 7% högre än median
(+) | mids är linjära (6.8% delta till föregående frekvens)
Högsta 2 - 16 kHz
(+) | balanserade toppar - endast 2.7% från medianen
(+) | toppar är linjära (5.7% delta till föregående frekvens)
Totalt 100 - 16 000 Hz
(±) | linjäriteten för det totala ljudet är genomsnittlig (18.8% skillnad mot median)
Jämfört med samma klass
» 62% av alla testade enheter i den här klassen var bättre, 8% liknande, 30% sämre
» Den bästa hade ett delta på 6%, genomsnittet var 18%, sämst var 132%
Jämfört med alla testade enheter
» 43% av alla testade enheter var bättre, 8% liknande, 49% sämre
» Den bästa hade ett delta på 4%, genomsnittet var 23%, sämst var 134%
Gigabyte Aero 15 Classic-XA ljudanalys
(+) | högtalare kan spela relativt högt (82 dB)
Bas 100 - 315 Hz
(-) | nästan ingen bas - i genomsnitt 17% lägre än medianen
(±) | linjäriteten för basen är genomsnittlig (10.2% delta till föregående frekvens)
Mellan 400 - 2000 Hz
(+) | balanserad mellan - endast 4.7% från medianen
(+) | mids är linjära (6.2% delta till föregående frekvens)
Högsta 2 - 16 kHz
(+) | balanserade toppar - endast 2.3% från medianen
(+) | toppar är linjära (5.5% delta till föregående frekvens)
Totalt 100 - 16 000 Hz
(±) | linjäriteten för det totala ljudet är genomsnittlig (15.5% skillnad mot median)
Jämfört med samma klass
» 35% av alla testade enheter i den här klassen var bättre, 7% liknande, 58% sämre
» Den bästa hade ett delta på 6%, genomsnittet var 18%, sämst var 132%
Jämfört med alla testade enheter
» 23% av alla testade enheter var bättre, 4% liknande, 73% sämre
» Den bästa hade ett delta på 4%, genomsnittet var 23%, sämst var 134%
| Av/Standby | |
| Låg belastning | |
| Hög belastning |
|
Förklaring:
min: | |
| Gigabyte Aero 15 OLED XA i7-9750H, GeForce RTX 2070 Max-Q | Medion Erazer X15805 i9-8950HK, GeForce RTX 2070 Max-Q | Gigabyte Aero 15 Classic-XA i7-9750H, GeForce RTX 2070 Max-Q | Asus Zephyrus S GX502GW i7-9750H, GeForce RTX 2070 Mobile | MSI GS65 Stealth 9SG i7-9750H, GeForce RTX 2080 Max-Q | Aorus 15 W9 i7-8750H, GeForce RTX 2060 Mobile | Genomsnitt av klass Gaming | |
|---|---|---|---|---|---|---|---|
| Power Consumption | 14% | 4% | -10% | 9% | 16% | 9% | |
| Idle Minimum * (Watt) | 23 | 15.1 34% | 21 9% | 24 -4% | 18.3 20% | 18 22% | 13 ? 43% |
| Idle Average * (Watt) | 25 | 19.2 23% | 23 8% | 27 -8% | 22 12% | 20 20% | 19 ? 24% |
| Idle Maximum * (Watt) | 33 | 22.9 31% | 32 3% | 33 -0% | 28.8 13% | 28 15% | 24.5 ? 26% |
| Load Average * (Watt) | 96 | 107 -11% | 97 -1% | 129 -34% | 93 3% | 87 9% | 111.1 ? -16% |
| Witcher 3 ultra * (Watt) | 168 | 148 12% | 176 -5% | 142.6 15% | 135 20% | ||
| Load Maximum * (Watt) | 197 | 213 -8% | 213 -8% | 216 -10% | 215.9 -10% | 175 11% | 260 ? -32% |
* ... mindre är bättre
| Gigabyte Aero 15 OLED XA i7-9750H, GeForce RTX 2070 Max-Q, 94.24 Wh | Medion Erazer X15805 i9-8950HK, GeForce RTX 2070 Max-Q, 46.74 Wh | Gigabyte Aero 15 Classic-XA i7-9750H, GeForce RTX 2070 Max-Q, 94.24 Wh | Asus Zephyrus S GX502GW i7-9750H, GeForce RTX 2070 Mobile, 76 Wh | MSI GS65 Stealth 9SG i7-9750H, GeForce RTX 2080 Max-Q, 82 Wh | Aorus 15 W9 i7-8750H, GeForce RTX 2060 Mobile, 62 Wh | Genomsnitt av klass Gaming | |
|---|---|---|---|---|---|---|---|
| Batteridrifttid | -46% | 12% | -45% | 5% | -58% | -10% | |
| Reader / Idle (h) | 9.9 | 9.1 -8% | 5.9 -40% | 2.9 -71% | 8.27 ? -16% | ||
| WiFi v1.3 (h) | 5.7 | 3.1 -46% | 7 23% | 3.7 -35% | 6 5% | 2.4 -58% | 7.11 ? 25% |
| Load (h) | 2.5 | 3 20% | 1 -60% | 1.4 -44% | 1.502 ? -40% |
För
Emot
Omdöme - Gigabyte förbättrar diskret Aero 15, men den ärver också några gamla svagheter
Läs den fullständiga versionen av den här recensionen på engelska här.
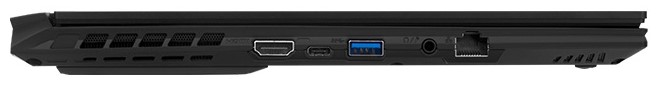
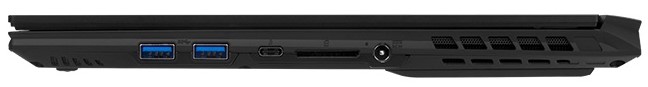
I vårt test visar sig Gigabyte Aero 15 OLED XA ha gedigen prestanda som ligger i mitten bland jämförbara enheter. Även om systemets prestanda ligger en aning efter konkurrenterna i syntetiska prestandatester finns det ingen anledning att klaga på processor-, grafik- eller lagringsprestandan. Dessutom har den bra anslutningsutrustning och en framtidssäkrad WLAN-adapter med WiFi 6 (802.11 ax). Den omarbetade designen bygger på sin föregångares styrkor men är fortfarande lika bra på att dra på sig smuts och fingeravtryck.
Gigabyte har diskret förbättrat Aero 15 och fortsätter att leverera en rekommenderbar laptop med tunn design och bra prestanda.
Höjdpunkten är förstås OLED-skärmen med 4K-upplösning. Det går inte att förneka fördelarna när det kommer till kontrast och svärta. Men en del svagheter uppenbarar sig också, som PWM som är särskilt svår för användare med känsliga ögon. Dessutom är det svårt att använda enheten utomhus på grund av den reflekterande skärmytan. Slutligen bör vi nämna att den har ett bra kylsystem och bra batteritid, så om du letar efter en tunn och kraftfull laptop är det värt att ta en titt på Gigabyte Aero 15 OLED XA.
Gigabyte Aero 15 OLED XA
- 08/31/2022 v7 (old)
Mike Wobker
Price comparison
