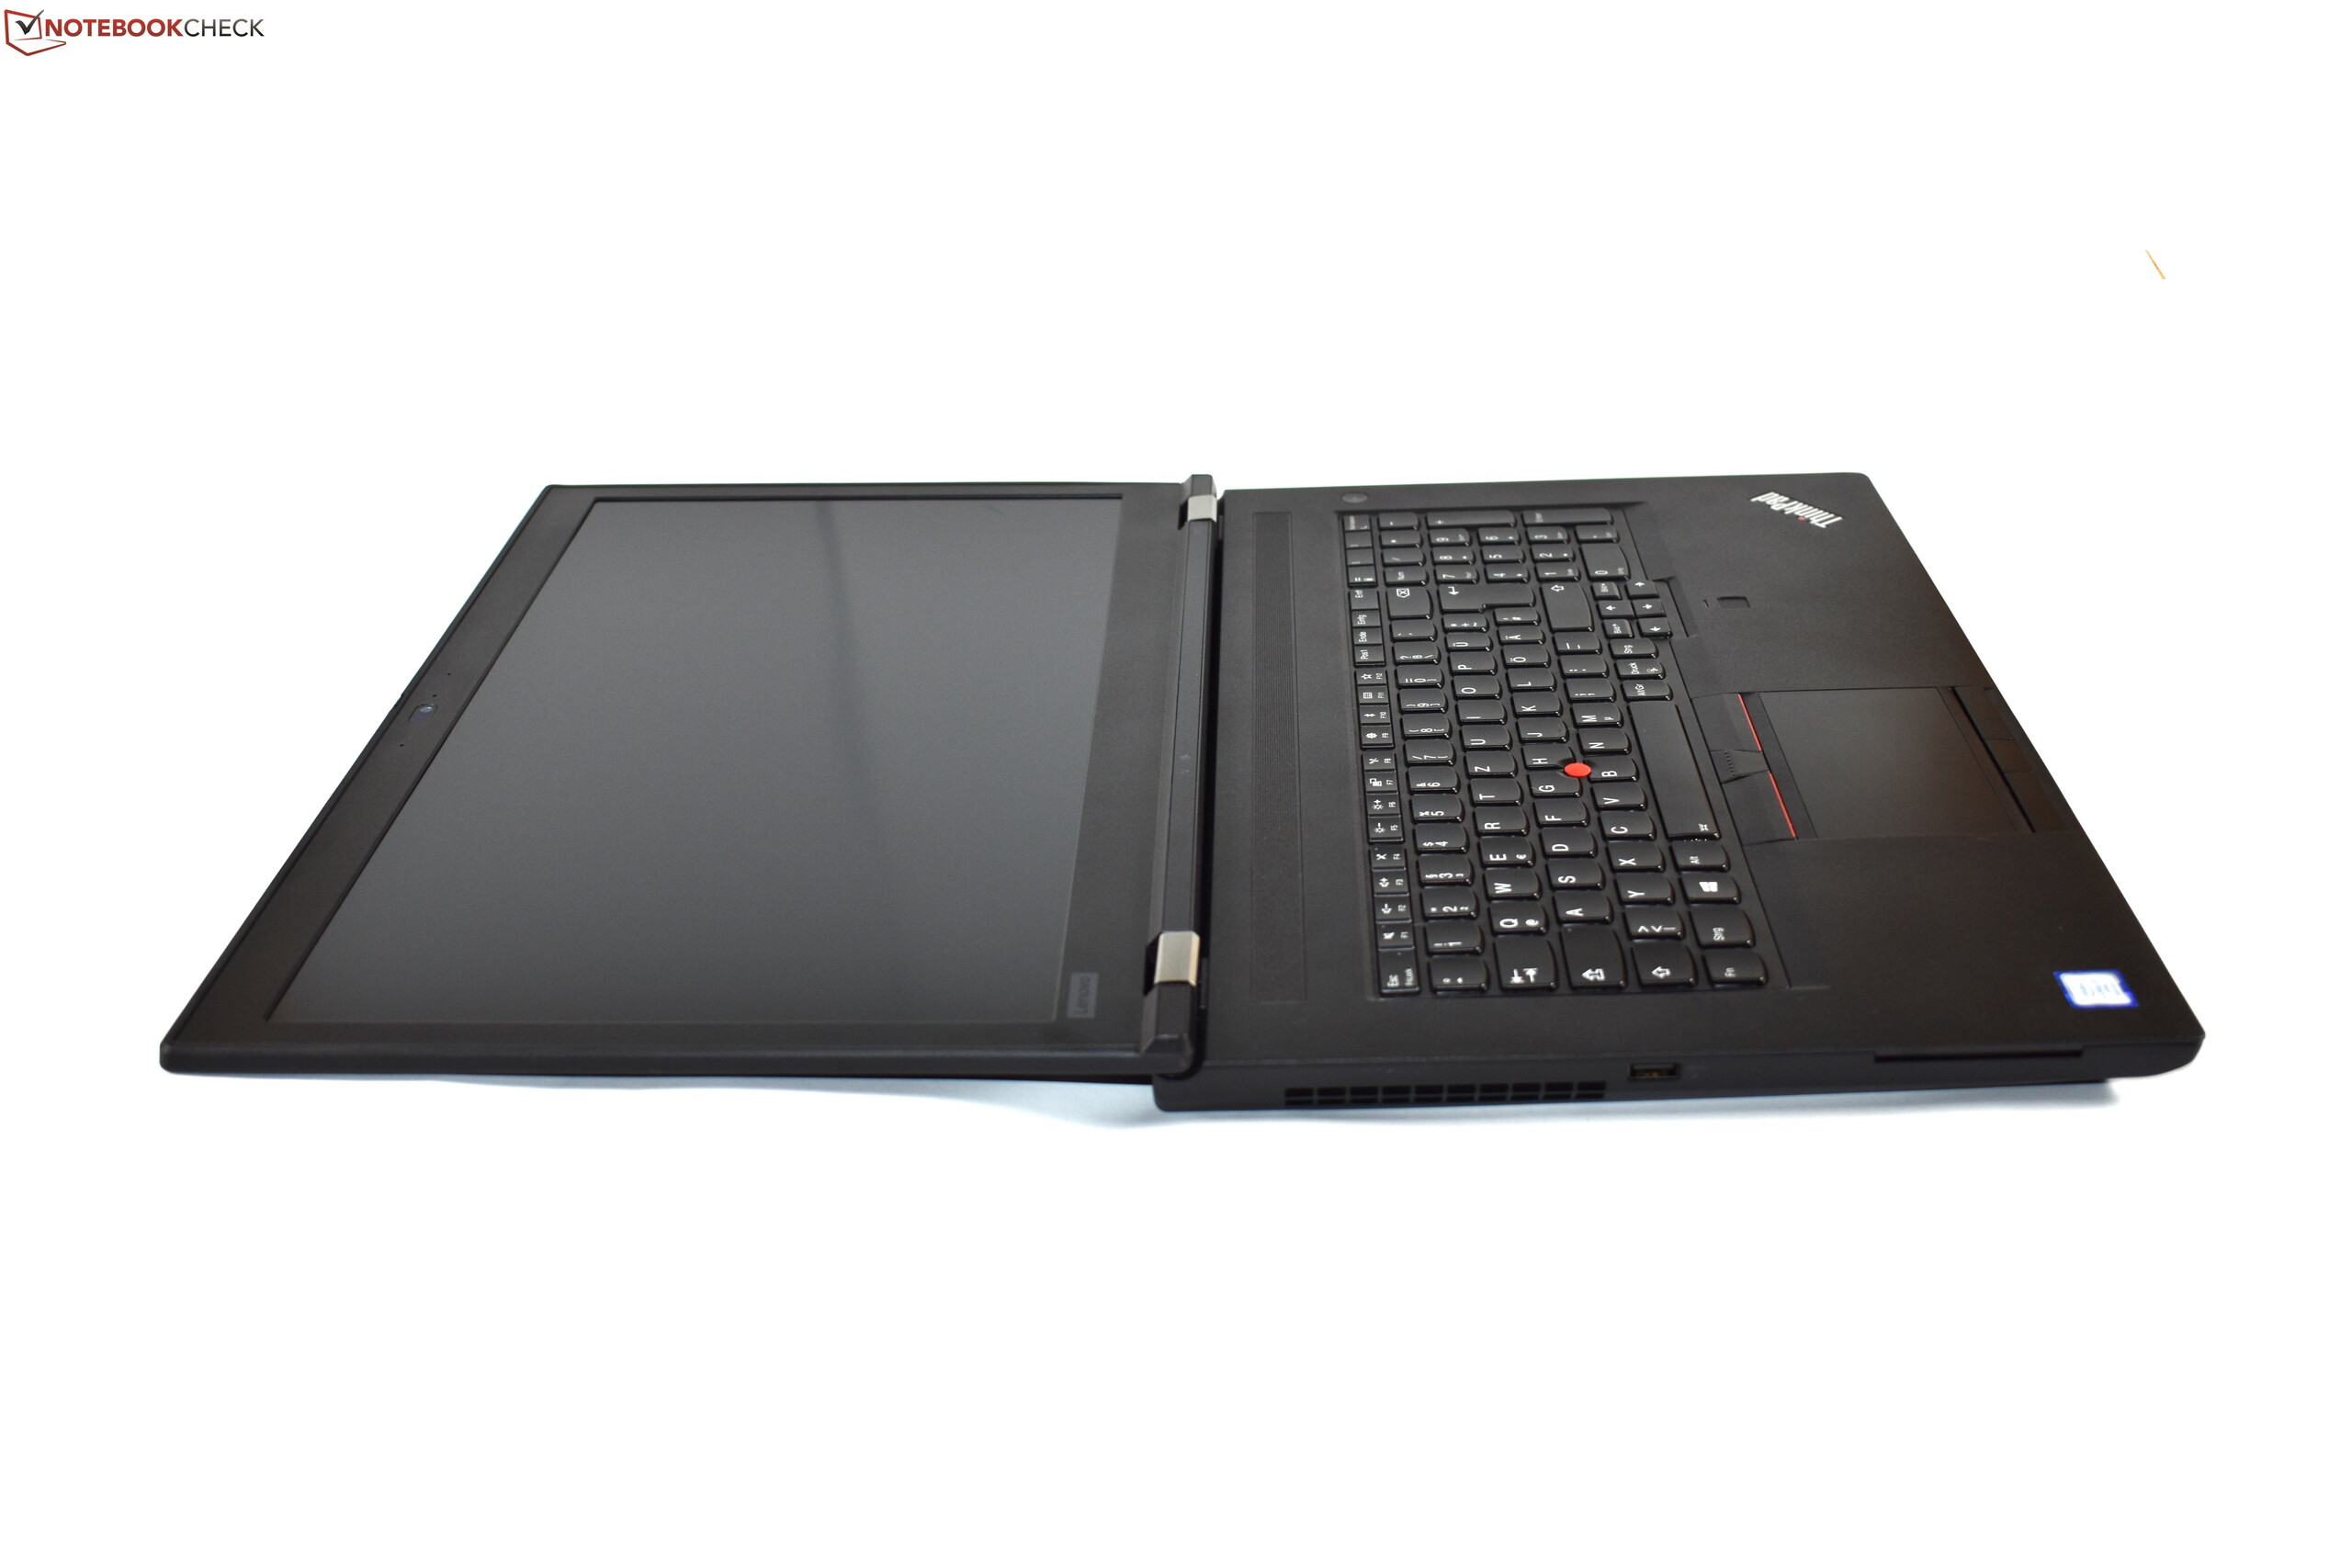
Test: Lenovo ThinkPad P73 - Stor arbetsstation som saktas ner av dålig värmehantering (Sammanfattning)
Gradering | Datum | Modell | Vikt | Höjd | Storlek | Upplösning | Pris |
|---|---|---|---|---|---|---|---|
| 86.6 % v7 (old) | 12/2019 | Lenovo ThinkPad P73-20QR002DGE i7-9850H, Quadro RTX 3000 (Laptop) | 3.5 kg | 31 mm | 17.30" | 1920x1080 | |
| 85.7 % v7 (old) | Dell Precision 7730 i7-8850H, Quadro P3200 | 3.3 kg | 30 mm | 17.30" | 1920x1080 | ||
| 84.6 % v7 (old) | Fujitsu Celsius H980 i7-8750H, Quadro P3200 | 3.5 kg | 30 mm | 17.30" | 1920x1080 | ||
| 85.2 % v7 (old) | 05/2019 | MSI WT75 8SM E-2176G, Quadro P5200 | 4.1 kg | 51 mm | 17.30" | 3840x2160 | |
v (old) | Lenovo ThinkPad P72-20MB000EGE i7-8850H, Quadro P3200 | 3.4 kg | 29.4 mm | 17.30" | 1920x1080 |

| SD Card Reader | |
| average JPG Copy Test (av. of 3 runs) | |
| Dell Precision 7730 (Toshiba Exceria Pro SDXC 64 GB UHS-II) | |
| Lenovo ThinkPad P73-20QR002DGE (Toshiba Exceria Pro SDXC 64 GB UHS-II) | |
| MSI WT75 8SM (Toshiba Exceria Pro SDXC 64 GB UHS-II) | |
| Lenovo ThinkPad P72-20MB000EGE (Toshiba Exceria Pro SDXC 64 GB UHS-II) | |
| Fujitsu Celsius H980 (Toshiba Exceria Pro SDXC 64 GB UHS-II) | |
| Genomsnitt av klass Workstation (49.6 - 681, n=14, senaste 2 åren) | |
| maximum AS SSD Seq Read Test (1GB) | |
| Genomsnitt av klass Workstation (87.6 - 1455, n=14, senaste 2 åren) | |
| Dell Precision 7730 (Toshiba Exceria Pro SDXC 64 GB UHS-II) | |
| Lenovo ThinkPad P73-20QR002DGE (Toshiba Exceria Pro SDXC 64 GB UHS-II) | |
| Lenovo ThinkPad P72-20MB000EGE (Toshiba Exceria Pro SDXC 64 GB UHS-II) | |
| MSI WT75 8SM (Toshiba Exceria Pro SDXC 64 GB UHS-II) | |
| Fujitsu Celsius H980 (Toshiba Exceria Pro SDXC 64 GB UHS-II) | |
| Networking | |
| iperf3 transmit AX12 | |
| Dell Precision 7730 | |
| Lenovo ThinkPad P73-20QR002DGE | |
| Fujitsu Celsius H980 | |
| Lenovo ThinkPad P72-20MB000EGE | |
| MSI WT75 8SM | |
| iperf3 receive AX12 | |
| Fujitsu Celsius H980 | |
| Lenovo ThinkPad P72-20MB000EGE | |
| MSI WT75 8SM | |
| Dell Precision 7730 | |
| Lenovo ThinkPad P73-20QR002DGE | |
| |||||||||||||||||||||||||
Distribution av ljusstyrkan: 83 %
Mitt på batteriet: 332 cd/m²
Kontrast: 854:1 (Svärta: 0.39 cd/m²)
ΔE ColorChecker Calman: 4.4 | ∀{0.5-29.43 Ø4.71}
calibrated: 2
ΔE Greyscale Calman: 5.1 | ∀{0.09-98 Ø4.96}
94% sRGB (Argyll 1.6.3 3D)
61.1% AdobeRGB 1998 (Argyll 1.6.3 3D)
67.8% AdobeRGB 1998 (Argyll 3D)
94.2% sRGB (Argyll 3D)
67.5% Display P3 (Argyll 3D)
Gamma: 2.39
CCT: 7061 K
| Lenovo ThinkPad P73-20QR002DGE N173HCE-E31, IPS LED, 1920x1080, 17.3" | Dell Precision 7730 B173HAN01.3, IPS LED, 1920x1080, 17.3" | Fujitsu Celsius H980 LG Philips, LP173WF4-SPF5, IPS, 1920x1080, 17.3" | MSI WT75 8SM AU Optronics B173ZAN01.0, IPS, 3840x2160, 17.3" | Lenovo ThinkPad P72-20MB000EGE LP173WF4_SPF7, IPS, 1920x1080, 17.3" | |
|---|---|---|---|---|---|
| Display | -2% | -6% | 22% | -6% | |
| Display P3 Coverage (%) | 67.5 | 65 -4% | 67.3 0% | 80.8 20% | 67.4 0% |
| sRGB Coverage (%) | 94.2 | 93.4 -1% | 85 -10% | 98.3 4% | 85 -10% |
| AdobeRGB 1998 Coverage (%) | 67.8 | 66.3 -2% | 62.2 -8% | 95.3 41% | 62.2 -8% |
| Response Times | -20% | 11% | 11% | -3% | |
| Response Time Grey 50% / Grey 80% * (ms) | 40 ? | 48.8 ? -22% | 38 ? 5% | 36 ? 10% | 40.8 ? -2% |
| Response Time Black / White * (ms) | 28 ? | 32.8 ? -17% | 23.2 ? 17% | 24.8 ? 11% | 28.8 ? -3% |
| PWM Frequency (Hz) | 25000 ? | 120500 ? | |||
| Screen | 23% | -13% | 6% | -0% | |
| Brightness middle (cd/m²) | 333 | 322 -3% | 400 20% | 327.9 -2% | 338 2% |
| Brightness (cd/m²) | 310 | 316 2% | 394 27% | 311 0% | 317 2% |
| Brightness Distribution (%) | 83 | 84 1% | 92 11% | 88 6% | 86 4% |
| Black Level * (cd/m²) | 0.39 | 0.24 38% | 0.51 -31% | 0.43 -10% | 0.28 28% |
| Contrast (:1) | 854 | 1342 57% | 784 -8% | 763 -11% | 1207 41% |
| Colorchecker dE 2000 * | 4.4 | 2.2 50% | 5.3 -20% | 4.41 -0% | 4.3 2% |
| Colorchecker dE 2000 max. * | 7.5 | 4.6 39% | 9.3 -24% | 10.07 -34% | 10.2 -36% |
| Colorchecker dE 2000 calibrated * | 2 | 1.9 5% | 3.8 -90% | 1.43 28% | 3.7 -85% |
| Greyscale dE 2000 * | 5.1 | 1.6 69% | 5.5 -8% | 2.9 43% | 2.2 57% |
| Gamma | 2.39 92% | 2.19 100% | 2.17 101% | 2.17 101% | 2.17 101% |
| CCT | 7061 92% | 6621 98% | 6686 97% | 6916 94% | 6621 98% |
| Color Space (Percent of AdobeRGB 1998) (%) | 61.1 | 60.4 -1% | 55.8 -9% | 84.2 38% | 55.8 -9% |
| Color Space (Percent of sRGB) (%) | 94 | 93.3 -1% | 84.9 -10% | 99 5% | 84.7 -10% |
| Totalt genomsnitt (program/inställningar) | 0% /
13% | -3% /
-9% | 13% /
9% | -3% /
-2% |
* ... mindre är bättre
Visa svarstider
| ↔ Svarstid svart till vitt | ||
|---|---|---|
| 28 ms ... stiga ↗ och falla ↘ kombinerat | ↗ 17.2 ms stiga | 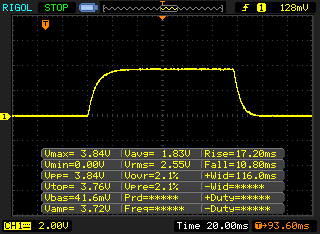 |
| ↘ 10.8 ms hösten | ||
| Skärmen visar relativt långsamma svarsfrekvenser i våra tester och kan vara för långsam för spelare. I jämförelse sträcker sig alla testade enheter från 0.1 (minst) till 240 (maximalt) ms. » 71 % av alla enheter är bättre. Detta innebär att den uppmätta svarstiden är sämre än genomsnittet av alla testade enheter (19.8 ms). | ||
| ↔ Svarstid 50 % grått till 80 % grått | ||
| 40 ms ... stiga ↗ och falla ↘ kombinerat | ↗ 20.4 ms stiga | 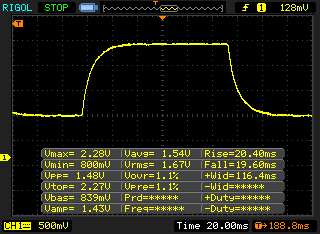 |
| ↘ 19.6 ms hösten | ||
| Skärmen visar långsamma svarsfrekvenser i våra tester och kommer att vara otillfredsställande för spelare. I jämförelse sträcker sig alla testade enheter från 0.165 (minst) till 636 (maximalt) ms. » 61 % av alla enheter är bättre. Detta innebär att den uppmätta svarstiden är sämre än genomsnittet av alla testade enheter (31 ms). | ||
Skärmflimmer / PWM (Puls-Width Modulation)
| Skärmflimmer / PWM upptäckt | 25000 Hz | ≤ 50 % ljusstyrka inställning | 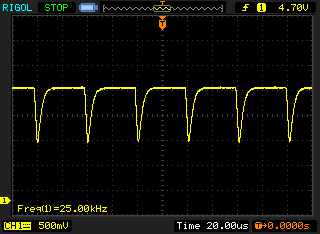 |
Displayens bakgrundsbelysning flimrar vid 25000 Hz (i värsta fall, t.ex. med PWM) Flimrande upptäckt vid en ljusstyrkeinställning på 50 % och lägre. Det ska inte finnas något flimmer eller PWM över denna ljusstyrkeinställning. Frekvensen för 25000 Hz är ganska hög, så de flesta användare som är känsliga för PWM bör inte märka något flimmer. Som jämförelse: 52 % av alla testade enheter använder inte PWM för att dämpa skärmen. Om PWM upptäcktes mättes ett medelvärde av 7754 (minst: 5 - maximum: 343500) Hz. | |||
| Cinebench R15 | |
| CPU Single 64Bit | |
| Genomsnitt av klass Workstation (191.4 - 328, n=23, senaste 2 åren) | |
| MSI WT75 8SM | |
| Genomsnitt Intel Core i7-9850H (192 - 196.5, n=3) | |
| Lenovo ThinkPad P73-20QR002DGE | |
| Lenovo ThinkPad P72-20MB000EGE | |
| Dell Precision 7730 | |
| Fujitsu Celsius H980 | |
| CPU Multi 64Bit | |
| Genomsnitt av klass Workstation (2489 - 5810, n=23, senaste 2 åren) | |
| MSI WT75 8SM | |
| Dell Precision 7730 | |
| Lenovo ThinkPad P73-20QR002DGE | |
| Lenovo ThinkPad P72-20MB000EGE | |
| Lenovo ThinkPad P72-20MB000EGE | |
| Genomsnitt Intel Core i7-9850H (1114 - 1272, n=3) | |
| Fujitsu Celsius H980 | |
| PCMark 8 | |
| Home Score Accelerated v2 | |
| MSI WT75 8SM | |
| Dell Precision 7730 | |
| Lenovo ThinkPad P72-20MB000EGE | |
| Fujitsu Celsius H980 | |
| Lenovo ThinkPad P73-20QR002DGE | |
| Genomsnitt Intel Core i7-9850H, NVIDIA Quadro RTX 3000 (Laptop) (n=1) | |
| Work Score Accelerated v2 | |
| Lenovo ThinkPad P72-20MB000EGE | |
| Dell Precision 7730 | |
| Lenovo ThinkPad P73-20QR002DGE | |
| Genomsnitt Intel Core i7-9850H, NVIDIA Quadro RTX 3000 (Laptop) (n=1) | |
| Fujitsu Celsius H980 | |
| MSI WT75 8SM | |
| PCMark 8 Home Score Accelerated v2 | 4271 poäng | |
| PCMark 8 Creative Score Accelerated v2 | 4087 poäng | |
| PCMark 8 Work Score Accelerated v2 | 5432 poäng | |
| PCMark 10 Score | 5768 poäng | |
Hjälp | ||
| Lenovo ThinkPad P73-20QR002DGE Intel SSD Pro 7600p SSDPEKKF512G8L | Dell Precision 7730 Samsung SSD PM981 MZVLB512HAJQ | Fujitsu Celsius H980 Samsung SSD PM981 MZVLB512HAJQ | MSI WT75 8SM Samsung SSD PM981 MZVLB512HAJQ | Lenovo ThinkPad P72-20MB000EGE Lenovo LENSE20256GMSP34MEAT2TA | Genomsnitt Intel SSD Pro 7600p SSDPEKKF512G8L | |
|---|---|---|---|---|---|---|
| CrystalDiskMark 5.2 / 6 | -12% | -20% | -8% | -19% | -11% | |
| Write 4K (MB/s) | 154.3 | 103.2 -33% | 111.8 -28% | 131.4 -15% | 101 -35% | 133.9 ? -13% |
| Read 4K (MB/s) | 66.4 | 41.39 -38% | 32.02 -52% | 46.15 -30% | 45.37 -32% | 59.1 ? -11% |
| Write Seq (MB/s) | 1561 | 1880 20% | 1539 -1% | 1584 1% | 1409 -10% | 1378 ? -12% |
| Read Seq (MB/s) | 2460 | 2350 -4% | 1252 -49% | 1787 -27% | 2129 -13% | 2341 ? -5% |
| Write 4K Q32T1 (MB/s) | 438 | 282.3 -36% | 355.4 -19% | 361.2 -18% | 320.3 -27% | 355 ? -19% |
| Read 4K Q32T1 (MB/s) | 568 | 314.3 -45% | 408.7 -28% | 426.1 -25% | 348.3 -39% | 429 ? -24% |
| Write Seq Q32T1 (MB/s) | 1581 | 1881 19% | 1913 21% | 1984 25% | 1529 -3% | 1514 ? -4% |
| Read Seq Q32T1 (MB/s) | 2724 | 3216 18% | 2530 -7% | 3374 24% | 2957 9% | 2677 ? -2% |

| 3DMark 11 - 1280x720 Performance GPU | |
| Genomsnitt av klass Workstation (12535 - 69594, n=23, senaste 2 åren) | |
| MSI WT75 8SM | |
| Lenovo ThinkPad P53-20QN000YGE | |
| Razer Blade Pro 17 RTX 2060 | |
| Genomsnitt NVIDIA Quadro RTX 3000 (Laptop) (17569 - 20542, n=4) | |
| Lenovo ThinkPad P73-20QR002DGE | |
| Lenovo ThinkPad P72-20MB000EGE | |
| Fujitsu Celsius H980 | |
| Dell Precision 7730 | |
| 3DMark | |
| 1280x720 Cloud Gate Standard Graphics | |
| Lenovo ThinkPad P53-20QN000YGE | |
| Genomsnitt av klass Workstation (58392 - 152418, n=14, senaste 2 åren) | |
| Razer Blade Pro 17 RTX 2060 | |
| MSI WT75 8SM | |
| Lenovo ThinkPad P73-20QR002DGE | |
| Genomsnitt NVIDIA Quadro RTX 3000 (Laptop) (62730 - 106470, n=3) | |
| Lenovo ThinkPad P72-20MB000EGE | |
| Dell Precision 7730 | |
| Fujitsu Celsius H980 | |
| 1920x1080 Fire Strike Graphics | |
| Genomsnitt av klass Workstation (8293 - 52560, n=23, senaste 2 åren) | |
| MSI WT75 8SM | |
| Lenovo ThinkPad P53-20QN000YGE | |
| Razer Blade Pro 17 RTX 2060 | |
| Genomsnitt NVIDIA Quadro RTX 3000 (Laptop) (13802 - 15881, n=2) | |
| Lenovo ThinkPad P73-20QR002DGE | |
| Dell Precision 7730 | |
| Lenovo ThinkPad P72-20MB000EGE | |
| Fujitsu Celsius H980 | |
| 2560x1440 Time Spy Graphics | |
| Genomsnitt av klass Workstation (2725 - 24806, n=23, senaste 2 åren) | |
| Lenovo ThinkPad P53-20QN000YGE | |
| Razer Blade Pro 17 RTX 2060 | |
| MSI WT75 8SM | |
| Genomsnitt NVIDIA Quadro RTX 3000 (Laptop) (5503 - 6014, n=3) | |
| Lenovo ThinkPad P73-20QR002DGE | |
| Lenovo ThinkPad P72-20MB000EGE | |
| Fujitsu Celsius H980 | |
| LuxMark v2.0 64Bit | |
| Room GPUs-only | |
| Genomsnitt av klass Workstation (2952 - 6990, n=3, senaste 2 åren) | |
| Lenovo ThinkPad P73-20QR002DGE | |
| Genomsnitt NVIDIA Quadro RTX 3000 (Laptop) (n=1) | |
| Dell Precision 7730 | |
| Fujitsu Celsius H980 | |
| Lenovo ThinkPad P53-20QN000YGE | |
| Lenovo ThinkPad P72-20MB000EGE | |
| Sala GPUs-only | |
| Genomsnitt av klass Workstation (6574 - 13967, n=3, senaste 2 åren) | |
| Lenovo ThinkPad P73-20QR002DGE | |
| Genomsnitt NVIDIA Quadro RTX 3000 (Laptop) (n=1) | |
| Lenovo ThinkPad P53-20QN000YGE | |
| Fujitsu Celsius H980 | |
| Dell Precision 7730 | |
| Lenovo ThinkPad P72-20MB000EGE | |
| 3DMark 06 Standard Score | 37304 poäng | |
| 3DMark Vantage P Result | 50309 poäng | |
| 3DMark 11 Performance | 15944 poäng | |
| 3DMark Ice Storm Standard Score | 98035 poäng | |
| 3DMark Cloud Gate Standard Score | 32163 poäng | |
| 3DMark Fire Strike Score | 12693 poäng | |
| 3DMark Time Spy Score | 5566 poäng | |
Hjälp | ||
| The Witcher 3 - 1920x1080 Ultra Graphics & Postprocessing (HBAO+) | |
| Genomsnitt av klass Workstation (n=1senaste 2 åren) | |
| Lenovo ThinkPad P53-20QN000YGE | |
| MSI WT75 8SM | |
| Razer Blade Pro 17 RTX 2060 | |
| Genomsnitt NVIDIA Quadro RTX 3000 (Laptop) (53.9 - 59, n=2) | |
| Lenovo ThinkPad P73-20QR002DGE | |
| Dell Precision 7730 | |
| Lenovo ThinkPad P72-20MB000EGE | |
| låg | med. | hög | ultra | 4K | |
|---|---|---|---|---|---|
| BioShock Infinite (2013) | 349.5 | 294.1 | 275.2 | 140.3 | |
| The Witcher 3 (2015) | 274.9 | 182.7 | 101.3 | 53.9 | |
| Dota 2 Reborn (2015) | 142 | 130 | 132 | 121 | 88 |
| Rise of the Tomb Raider (2016) | 213.9 | 174.6 | 99.4 | 83 | |
| Rocket League (2017) | 219.1 | ||||
| X-Plane 11.11 (2018) | 114 | 102 | 86 | ||
| Assassin´s Creed Odyssey (2018) | 96 | 77 | 62 | 39 | |
| Far Cry New Dawn (2019) | 114 | 91 | 86 | 77 | |
| Total War: Three Kingdoms (2019) | 226.5 | 107.7 | 69.2 | 46 | |
| F1 2019 (2019) | 102 | 92 | 84 | 73 |
Ljudnivå
| Låg belastning |
| 29.3 / 29.3 / 29.3 dB(A) |
| Hög belastning |
| 30.2 / 33.1 dB(A) |
 | ||
30 dB tyst 40 dB(A) hörbar 50 dB(A) högt ljud |
||
min: | ||
(-) Den maximala temperaturen på ovansidan är 52.2 °C / 126 F, jämfört med genomsnittet av 38.2 °C / 101 F , allt från 22.2 till 69.8 °C för klassen Workstation.
(-) Botten värms upp till maximalt 47.8 °C / 118 F, jämfört med genomsnittet av 41.1 °C / 106 F
(+) Vid tomgångsbruk är medeltemperaturen för ovansidan 26.3 °C / 79 F, jämfört med enhetsgenomsnittet på 32 °C / ### class_avg_f### F.
(-) När du spelar The Witcher 3 är medeltemperaturen för ovansidan 43.1 °C / 110 F, jämfört med enhetsgenomsnittet på 32 °C / ## #class_avg_f### F.
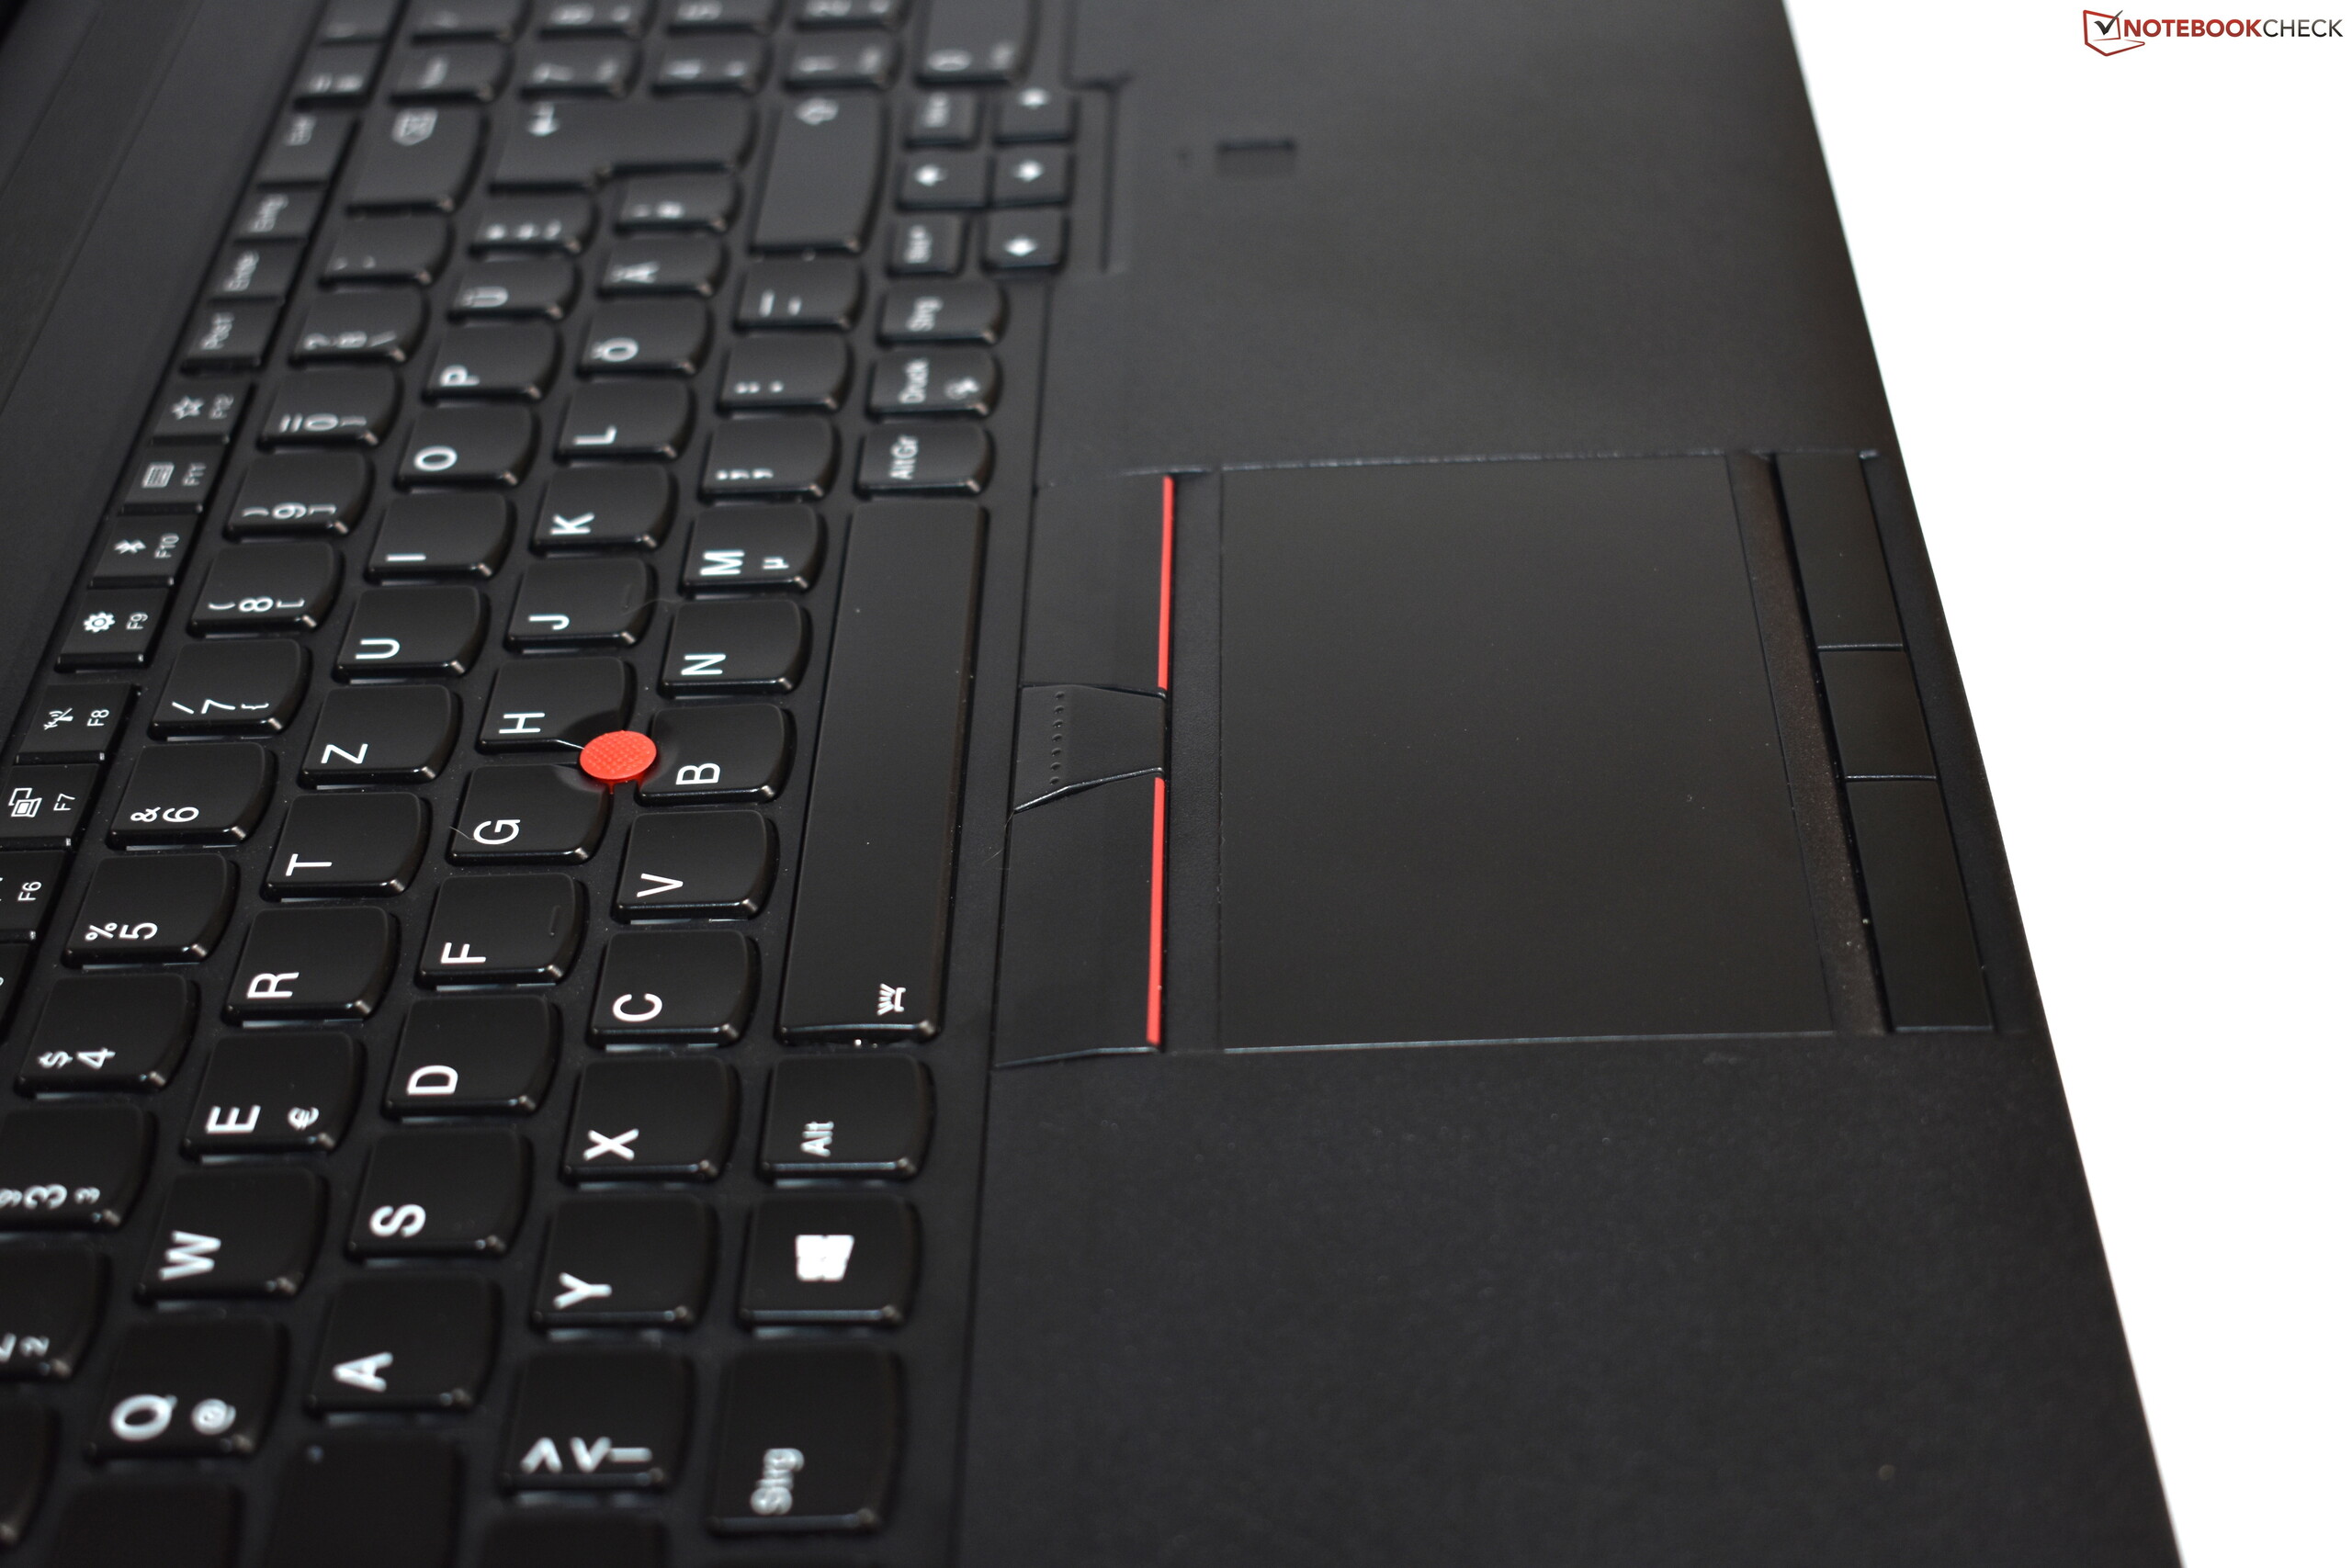
(±) Handledsstöden och pekplattan kan bli väldigt varma vid beröring med maximalt 37.6 °C / 99.7 F.
(-) Medeltemperaturen för handledsstödsområdet på liknande enheter var 27.8 °C / 82 F (-9.8 °C / -17.7 F).
Lenovo ThinkPad P73-20QR002DGE ljudanalys
(-) | inte särskilt höga högtalare (70.2 dB)
Bas 100 - 315 Hz
(±) | reducerad bas - i genomsnitt 14.5% lägre än medianen
(±) | linjäriteten för basen är genomsnittlig (14% delta till föregående frekvens)
Mellan 400 - 2000 Hz
(±) | högre mellan - i genomsnitt 7.3% högre än median
(+) | mids är linjära (5.1% delta till föregående frekvens)
Högsta 2 - 16 kHz
(±) | reducerade toppar - i genomsnitt 5.1% lägre än medianen
(±) | linjäriteten för toppar är genomsnittlig (8% delta till föregående frekvens)
Totalt 100 - 16 000 Hz
(±) | linjäriteten för det totala ljudet är genomsnittlig (29.3% skillnad mot median)
Jämfört med samma klass
» 96% av alla testade enheter i den här klassen var bättre, 1% liknande, 3% sämre
» Den bästa hade ett delta på 7%, genomsnittet var 17%, sämst var 35%
Jämfört med alla testade enheter
» 87% av alla testade enheter var bättre, 3% liknande, 10% sämre
» Den bästa hade ett delta på 4%, genomsnittet var 23%, sämst var 134%
Dell Precision 7730 ljudanalys
(±) | högtalarljudstyrkan är genomsnittlig men bra (81.1 dB)
Bas 100 - 315 Hz
(-) | nästan ingen bas - i genomsnitt 16.7% lägre än medianen
(±) | linjäriteten för basen är genomsnittlig (11.6% delta till föregående frekvens)
Mellan 400 - 2000 Hz
(±) | reducerade mids - i genomsnitt 5.4% lägre än median
(+) | mids är linjära (5.4% delta till föregående frekvens)
Högsta 2 - 16 kHz
(+) | balanserade toppar - endast 4% från medianen
(+) | toppar är linjära (5.8% delta till föregående frekvens)
Totalt 100 - 16 000 Hz
(±) | linjäriteten för det totala ljudet är genomsnittlig (17% skillnad mot median)
Jämfört med samma klass
» 49% av alla testade enheter i den här klassen var bättre, 10% liknande, 41% sämre
» Den bästa hade ett delta på 7%, genomsnittet var 17%, sämst var 35%
Jämfört med alla testade enheter
» 31% av alla testade enheter var bättre, 8% liknande, 61% sämre
» Den bästa hade ett delta på 4%, genomsnittet var 23%, sämst var 134%
| Av/Standby | |
| Låg belastning | |
| Hög belastning |
|
Förklaring:
min: | |
| Lenovo ThinkPad P73-20QR002DGE i7-9850H, Quadro RTX 3000 (Laptop), Intel SSD Pro 7600p SSDPEKKF512G8L, IPS LED, 1920x1080, 17.3" | Dell Precision 7730 i7-8850H, Quadro P3200, Samsung SSD PM981 MZVLB512HAJQ, IPS LED, 1920x1080, 17.3" | Fujitsu Celsius H980 i7-8750H, Quadro P3200, Samsung SSD PM981 MZVLB512HAJQ, IPS, 1920x1080, 17.3" | MSI WT75 8SM E-2176G, Quadro P5200, Samsung SSD PM981 MZVLB512HAJQ, IPS, 3840x2160, 17.3" | Lenovo ThinkPad P72-20MB000EGE i7-8850H, Quadro P3200, Lenovo LENSE20256GMSP34MEAT2TA, IPS, 1920x1080, 17.3" | Genomsnitt NVIDIA Quadro RTX 3000 (Laptop) | Genomsnitt av klass Workstation | |
|---|---|---|---|---|---|---|---|
| Power Consumption | -11% | -35% | -120% | 21% | -9% | -3% | |
| Idle Minimum * (Watt) | 8.9 | 10.1 -13% | 14.8 -66% | 29 -226% | 4.6 48% | 9.8 ? -10% | 9.11 ? -2% |
| Idle Average * (Watt) | 12.8 | 18 -41% | 20.4 -59% | 37.1 -190% | 12.2 5% | 15.5 ? -21% | 13.8 ? -8% |
| Idle Maximum * (Watt) | 16.4 | 19.7 -20% | 21.5 -31% | 39.5 -141% | 15.4 6% | 17.5 ? -7% | 17.9 ? -9% |
| Load Average * (Watt) | 108.4 | 89.6 17% | 98.4 9% | 133.6 -23% | 79.6 27% | 109.8 ? -1% | 96 ? 11% |
| Witcher 3 ultra * (Watt) | 153 | 134 12% | 236.3 -54% | 86 44% | |||
| Load Maximum * (Watt) | 166 | 204 -23% | 213.5 -29% | 310 -87% | 176 -6% | 179.9 ? -8% | 180.3 ? -9% |
* ... mindre är bättre
| Lenovo ThinkPad P73-20QR002DGE i7-9850H, Quadro RTX 3000 (Laptop), 99 Wh | Dell Precision 7730 i7-8850H, Quadro P3200, 92 Wh | Fujitsu Celsius H980 i7-8750H, Quadro P3200, 96 Wh | MSI WT75 8SM E-2176G, Quadro P5200, 90 Wh | Lenovo ThinkPad P72-20MB000EGE i7-8850H, Quadro P3200, 99 Wh | Genomsnitt av klass Workstation | |
|---|---|---|---|---|---|---|
| Batteridrifttid | -28% | -22% | -41% | 7% | -6% | |
| H.264 (h) | 9.8 | 5.8 -41% | 5.9 -40% | 12.3 26% | 10.1 ? 3% | |
| WiFi v1.3 (h) | 11.1 | 5.6 -50% | 8.3 -25% | 3.7 -67% | 11.2 1% | 8.55 ? -23% |
| Load (h) | 1.4 | 1.5 7% | 1.4 0% | 1.2 -14% | 1.3 -7% | 1.441 ? 3% |
| Reader / Idle (h) | 13.5 | 4 | 28.3 | 26.1 ? |
För
Emot

Läs den fullständiga versionen av den här recensionen på engelska här.
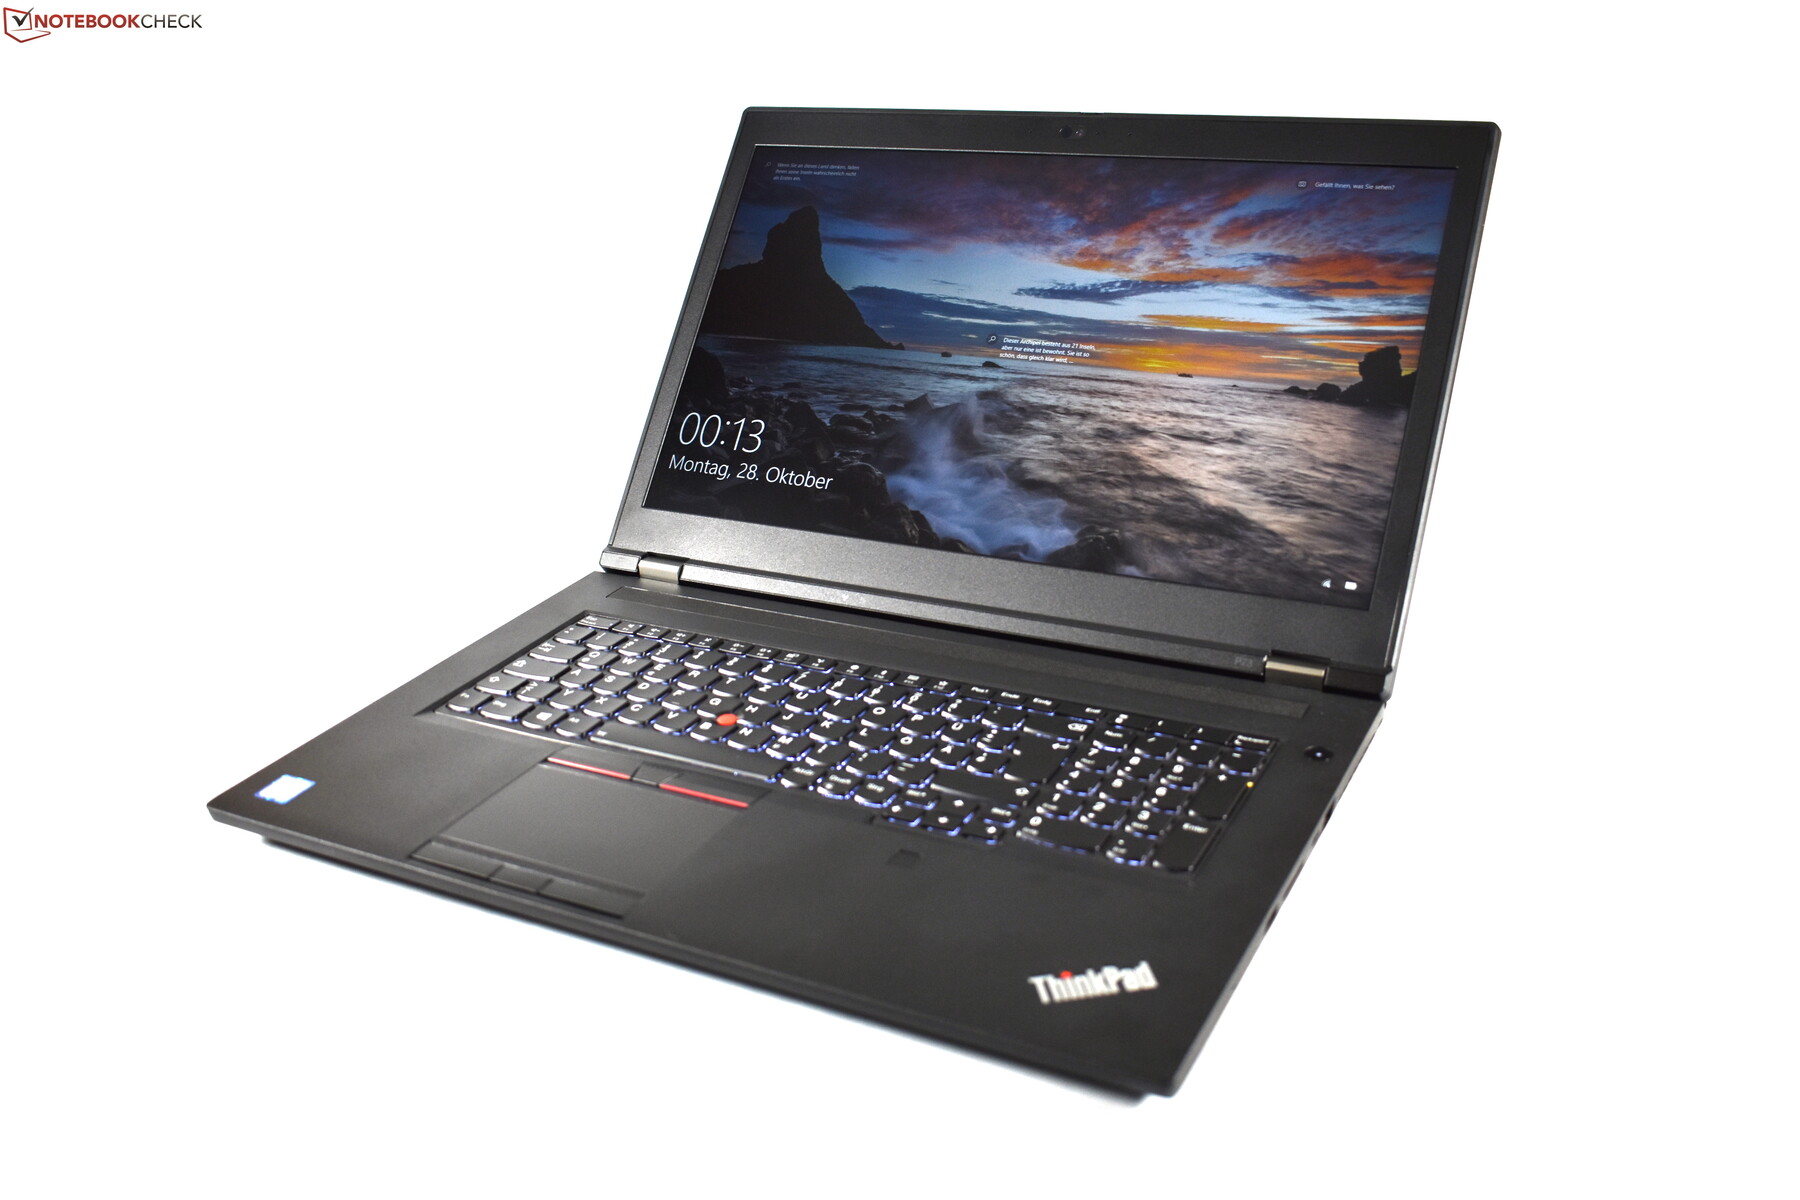
Den här konfigurationen av Lenovo ThinkPad P73 kostar över 30.000 kronor. Trots att den är riktigt dyr är denna arbetsstationslaptop inte en perfekt enhet.
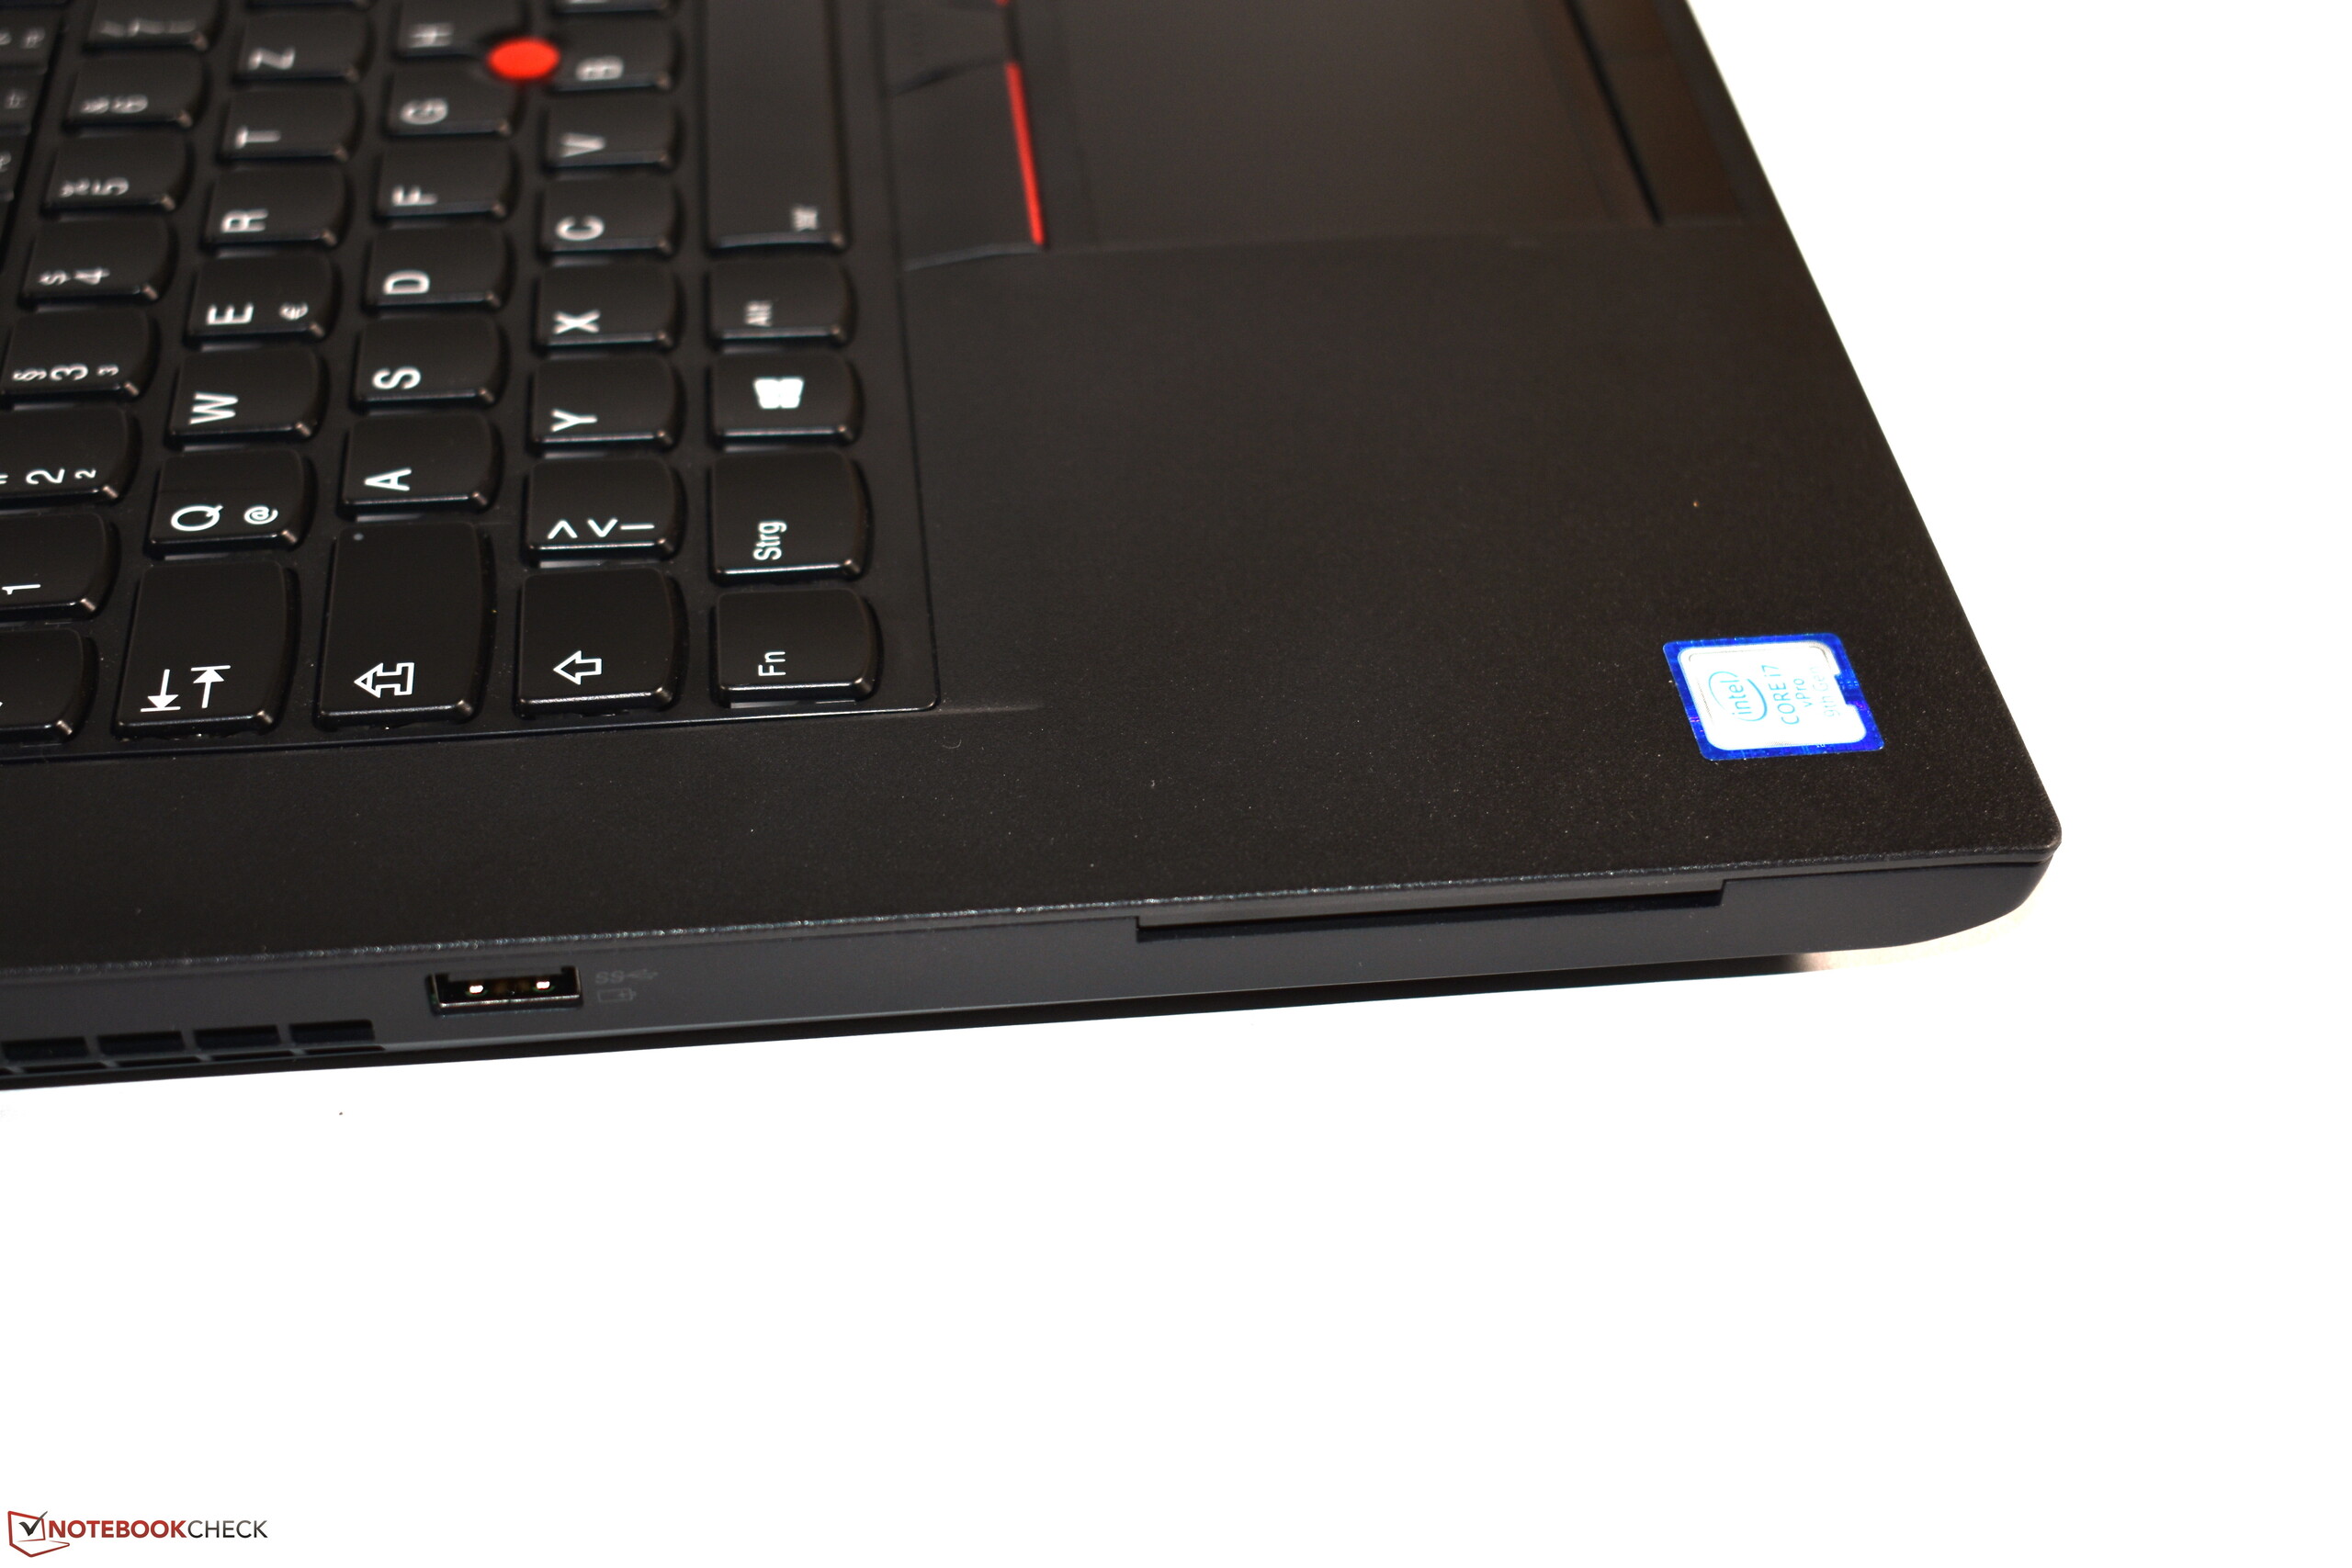
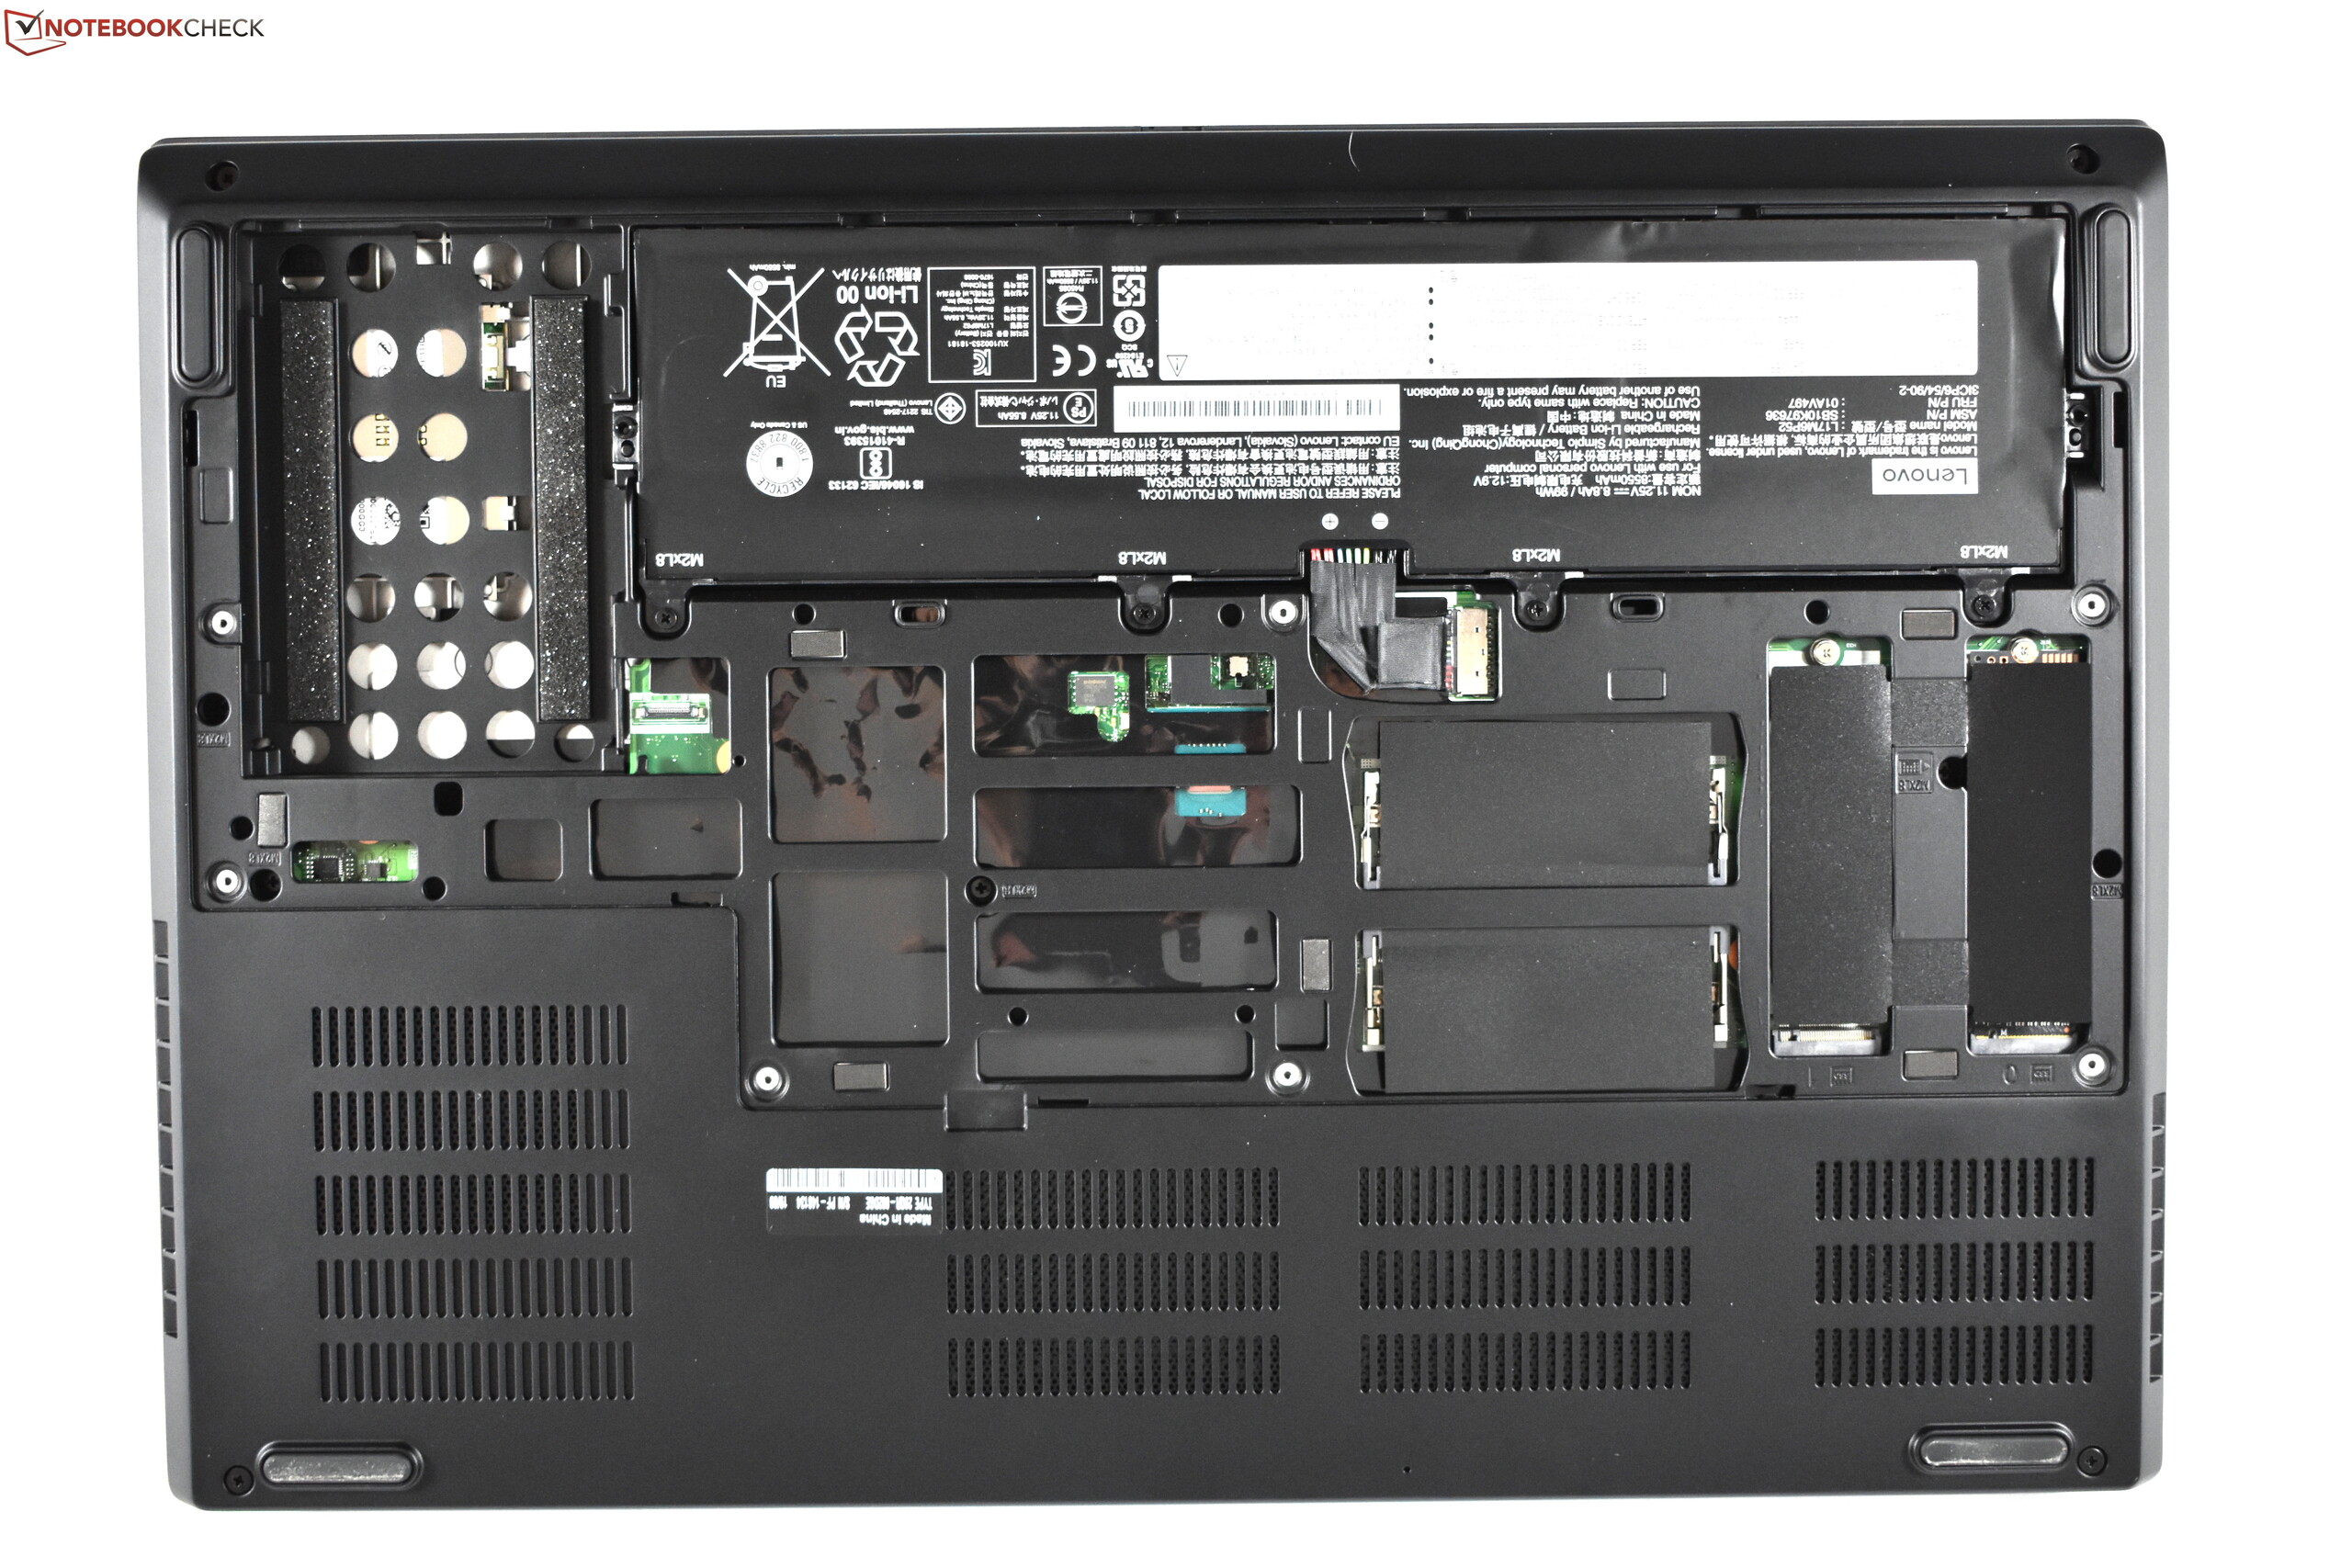
Listan över fördelar inkluderar det robusta ThinkPad-chassit, de utmärkta inmatningsenheterna samt förvånansvärt bra batteritid. Något annat som är positivt är att kylsystemet för det mesta håller sig tyst. Det hörs knappt ens vid belastning. Uppgraderingsmöjligheterna med tre lagringsplatser och fyra RAM-platser är fortfarande exemplariskt, precis som portutbudet.
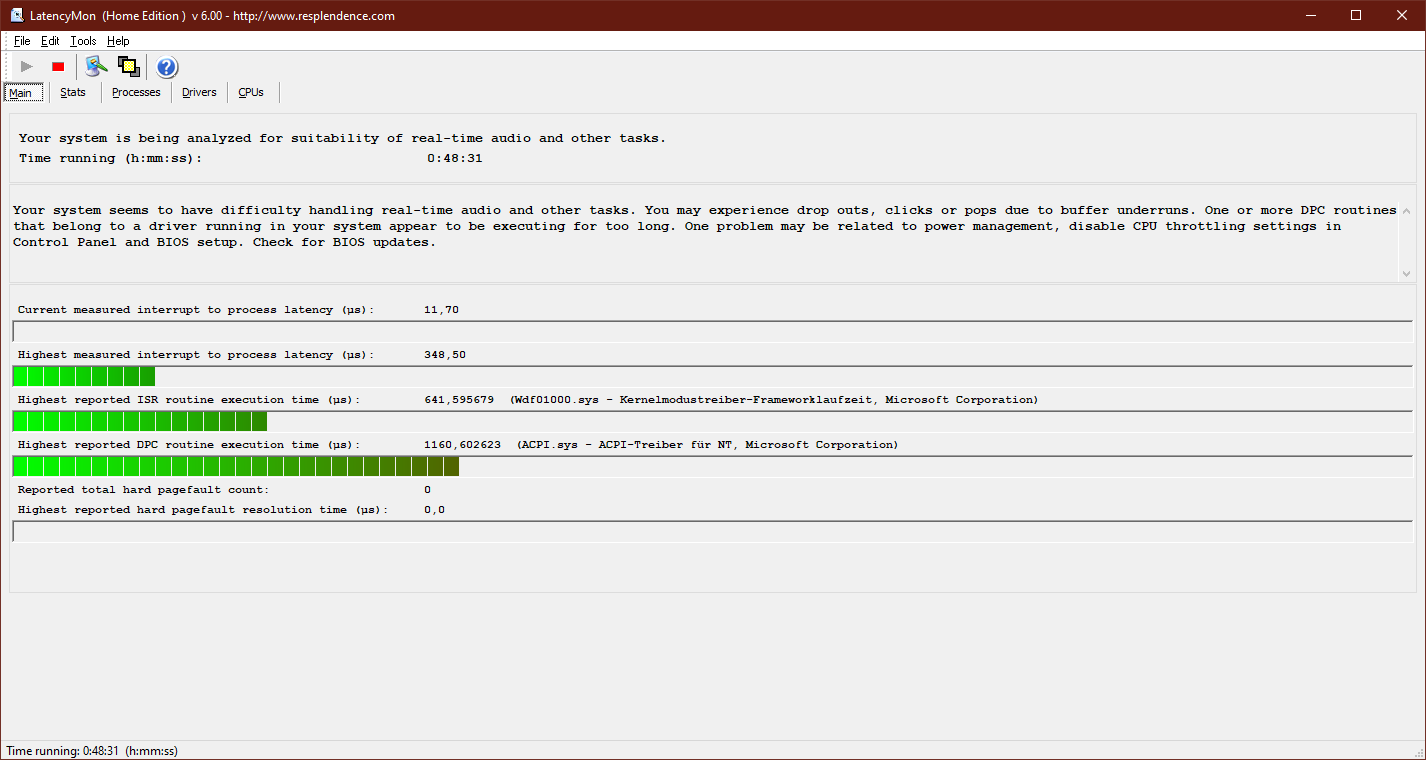
Prestandan är väldigt viktig för en arbetsstation. Lenovo ThinkPad P73 har definitivt en riktigt snabb CPU. Tyvärr gjorde GPU:n oss besvikna, då prestandan från dess Nvidia Quadro RTX 3000 minskar vid ihållande belastning. ThinkPad P73 blir dessutom ganska varm vid belastning. En temperatur på över 50 grader på chassit är för varmt. I det här fallet kanske en mer aktiv fläkt hade varit bättre. Ett annat problem är att prestandan begränsas när enheten körs på batteri.
En totalt sett stark Lenovo ThinkPad P73 hålls tillbaka av höga temperaturer med instabil GPU-prestanda som följd.
Vi kan ändå rekommendera Lenovo ThinkPad P73. Men som den är erbjuder den inga prestandafördelar jämfört med den äldre ThinkPad P72. Kanske borde Lenovo arbeta om fläktprofilen en aning för att låta fläktarna vara igång mer när maskinen är under belastning.
Lenovo ThinkPad P73-20QR002DGE
- 11/21/2019 v7 (old)
Benjamin Herzig
Price comparison
