Test: Acer Aspire Nitro 5 - En spellaptop med skaplig batteritid
| |||||||||||||||||||||||||
Distribution av ljusstyrkan: 84 %
Mitt på batteriet: 407 cd/m²
Kontrast: 1357:1 (Svärta: 0.3 cd/m²)
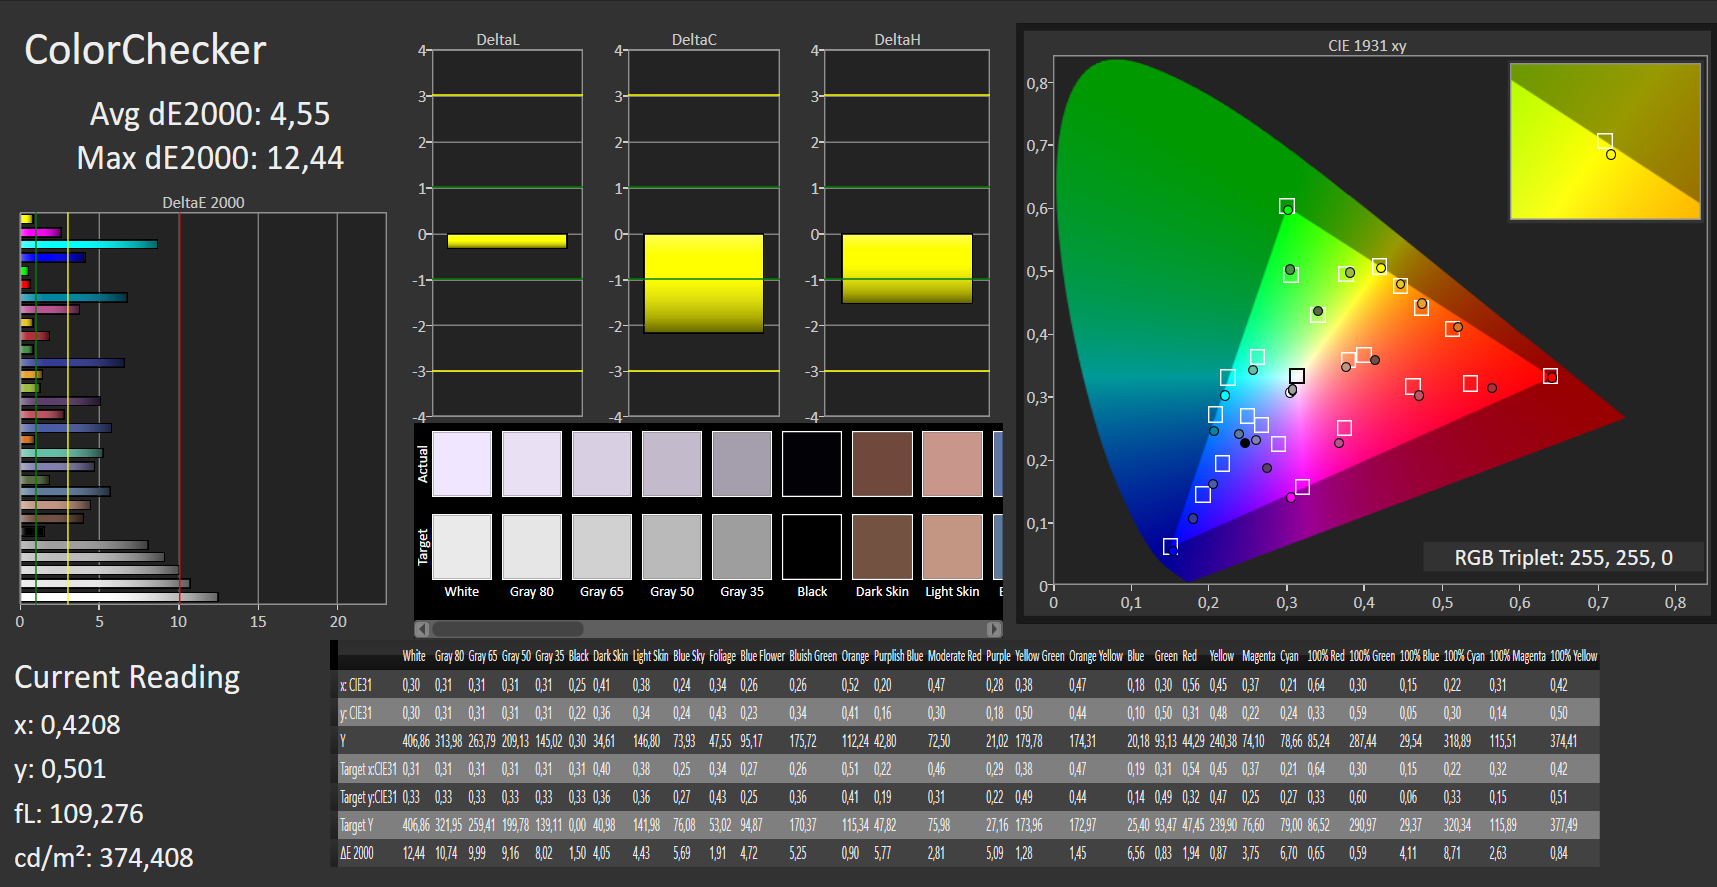
ΔE ColorChecker Calman: 4.55 | ∀{0.5-29.43 Ø4.72}
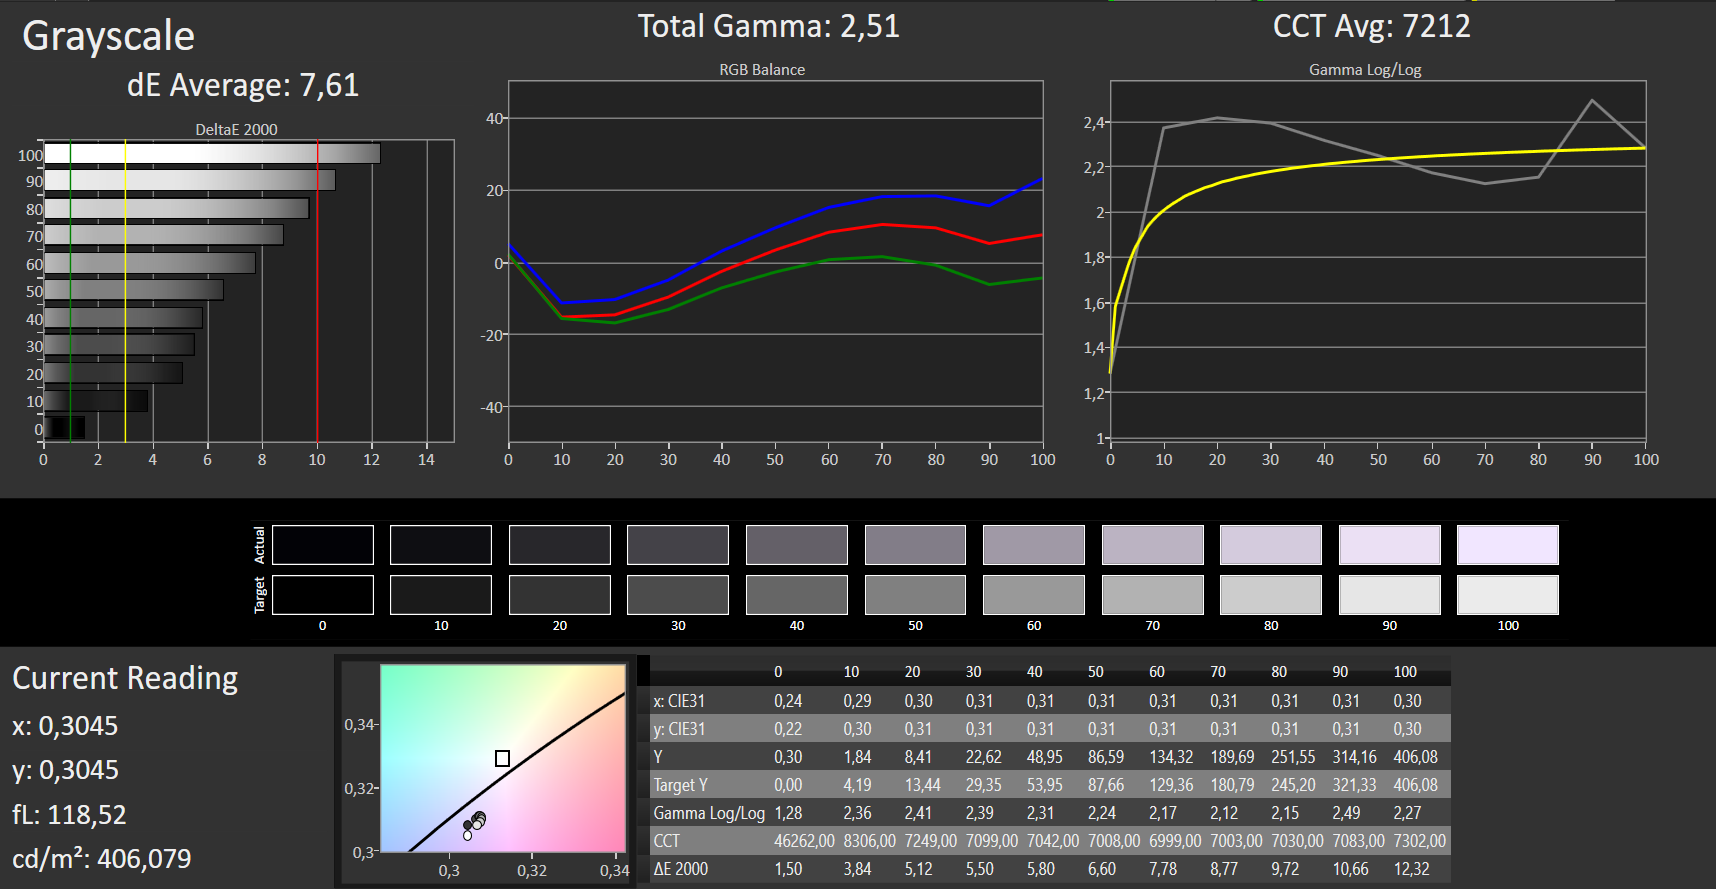
ΔE Greyscale Calman: 7.61 | ∀{0.09-98 Ø4.97}
92% sRGB (Argyll 1.6.3 3D)
59% AdobeRGB 1998 (Argyll 1.6.3 3D)
63.5% AdobeRGB 1998 (Argyll 3D)
92.5% sRGB (Argyll 3D)
62.7% Display P3 (Argyll 3D)
Gamma: 2.51
CCT: 7212 K
| Acer Aspire Nitro 5 AN517-51-7887 LP173WF5-SPB3, IPS, 1920x1080, 17.3" | Lenovo Legion Y540-17IRH AU Optronics B173HAN04.4 (AUO449D), IPS, 1920x1080, 17.3" | HP Pavilion Gaming 17-cd0085cl BOE0825, IPS, 1920x1080, 17.3" | Asus ROG Strix G GL731GU-RB74 AU Optronics B173HAN04.0, IPS, 1920x1080, 17.3" | MSI GL73 8SE-010US CMN1747, TN LED, 1920x1080, 17.3" | Asus TUF FX705GM AU Optronics B173HAN04.0 (AUO409D), IPS, 1920x1080, 17.3" | |
|---|---|---|---|---|---|---|
| Display | 9% | 0% | -1% | 29% | -1% | |
| Display P3 Coverage (%) | 62.7 | 69 10% | 63.3 1% | 61.9 -1% | 91.1 45% | 62.4 0% |
| sRGB Coverage (%) | 92.5 | 98.3 6% | 90.2 -2% | 89.4 -3% | 100 8% | 88.8 -4% |
| AdobeRGB 1998 Coverage (%) | 63.5 | 70.7 11% | 64.3 1% | 63.3 0% | 85.4 34% | 63.8 0% |
| Response Times | 51% | 20% | 70% | 67% | 71% | |
| Response Time Grey 50% / Grey 80% * (ms) | 37 ? | 18 ? 51% | 31.6 ? 15% | 6.4 ? 83% | 12.8 ? 65% | 7.4 ? 80% |
| Response Time Black / White * (ms) | 26 ? | 12.8 ? 51% | 19.6 ? 25% | 11.2 ? 57% | 8.2 ? 68% | 10 ? 62% |
| PWM Frequency (Hz) | 25770 ? | |||||
| Screen | 12% | 1% | 4% | -12% | 14% | |
| Brightness middle (cd/m²) | 407 | 286 -30% | 299.6 -26% | 294.3 -28% | 326.4 -20% | 234 -43% |
| Brightness (cd/m²) | 364 | 282 -23% | 285 -22% | 289 -21% | 317 -13% | 228 -37% |
| Brightness Distribution (%) | 84 | 87 4% | 86 2% | 89 6% | 90 7% | 85 1% |
| Black Level * (cd/m²) | 0.3 | 0.19 37% | 0.33 -10% | 0.3 -0% | 0.28 7% | 0.2 33% |
| Contrast (:1) | 1357 | 1505 11% | 908 -33% | 981 -28% | 1166 -14% | 1170 -14% |
| Colorchecker dE 2000 * | 4.55 | 3.57 22% | 3.68 19% | 3.95 13% | 7.83 -72% | 2.16 53% |
| Colorchecker dE 2000 max. * | 12.44 | 7.5 40% | 8.05 35% | 6.49 48% | 13.36 -7% | 3.39 73% |
| Greyscale dE 2000 * | 7.61 | 4.51 41% | 3.8 50% | 3.7 51% | 10.9 -43% | 2 74% |
| Gamma | 2.51 88% | 2.36 93% | 2.12 104% | 2.07 106% | 1.97 112% | 2.46 89% |
| CCT | 7212 90% | 7411 88% | 7240 90% | 7155 91% | 11056 59% | 6394 102% |
| Color Space (Percent of AdobeRGB 1998) (%) | 59 | 64 8% | 58.1 -2% | 57.7 -2% | 75.8 28% | 58 -2% |
| Color Space (Percent of sRGB) (%) | 92 | 98 7% | 89.8 -2% | 89 -3% | 100 9% | 89 -3% |
| Colorchecker dE 2000 calibrated * | 1.31 | 3.15 | 3.08 | 2.83 | 2.02 | |
| Totalt genomsnitt (program/inställningar) | 24% /
16% | 7% /
3% | 24% /
11% | 28% /
7% | 28% /
18% |
* ... mindre är bättre
Visa svarstider
| ↔ Svarstid svart till vitt | ||
|---|---|---|
| 26 ms ... stiga ↗ och falla ↘ kombinerat | ↗ 16 ms stiga | 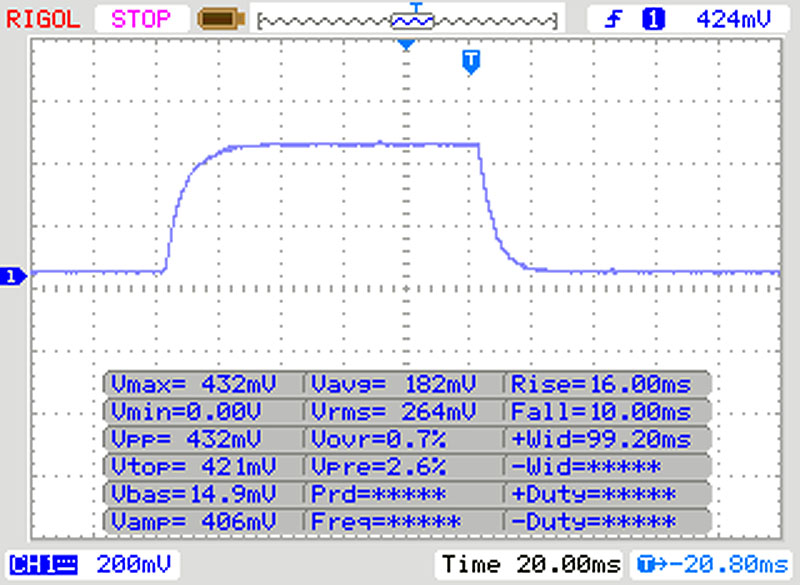 |
| ↘ 10 ms hösten | ||
| Skärmen visar relativt långsamma svarsfrekvenser i våra tester och kan vara för långsam för spelare. I jämförelse sträcker sig alla testade enheter från 0.1 (minst) till 240 (maximalt) ms. » 62 % av alla enheter är bättre. Detta innebär att den uppmätta svarstiden är sämre än genomsnittet av alla testade enheter (19.8 ms). | ||
| ↔ Svarstid 50 % grått till 80 % grått | ||
| 37 ms ... stiga ↗ och falla ↘ kombinerat | ↗ 19 ms stiga | 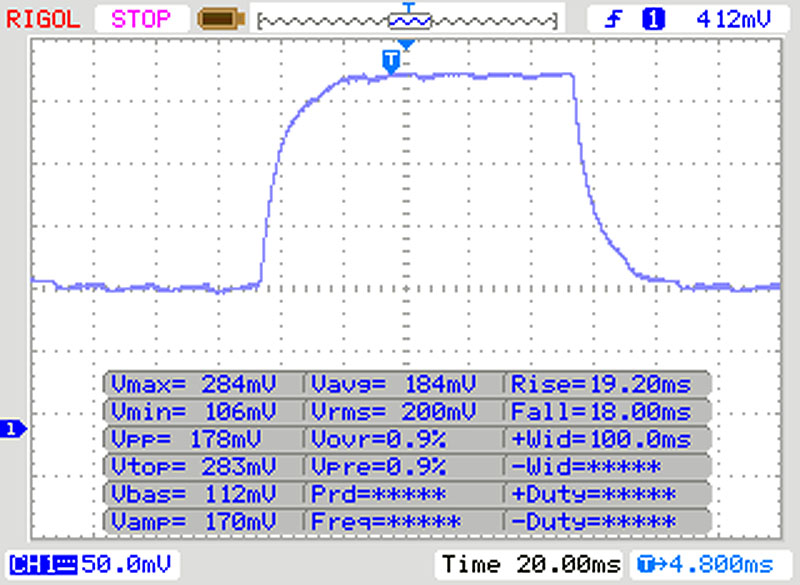 |
| ↘ 18 ms hösten | ||
| Skärmen visar långsamma svarsfrekvenser i våra tester och kommer att vara otillfredsställande för spelare. I jämförelse sträcker sig alla testade enheter från 0.165 (minst) till 636 (maximalt) ms. » 53 % av alla enheter är bättre. Detta innebär att den uppmätta svarstiden är sämre än genomsnittet av alla testade enheter (31 ms). | ||
Skärmflimmer / PWM (Puls-Width Modulation)
| Skärmflimmer / PWM upptäcktes inte |  | ||
Som jämförelse: 52 % av alla testade enheter använder inte PWM för att dämpa skärmen. Om PWM upptäcktes mättes ett medelvärde av 7769 (minst: 5 - maximum: 343500) Hz. | |||
| Performance rating - Percent | |
| Acer Aspire Nitro 5 AN517-51-7887 | |
| Asus ROG Strix G GL731GU-RB74 -9! | |
| HP Pavilion Gaming 17-cd0085cl -9! | |
| Asus TUF FX705GM -7! | |
| Lenovo Legion Y540-17IRH -5! | |
| MSI GL73 8SE-010US -9! | |
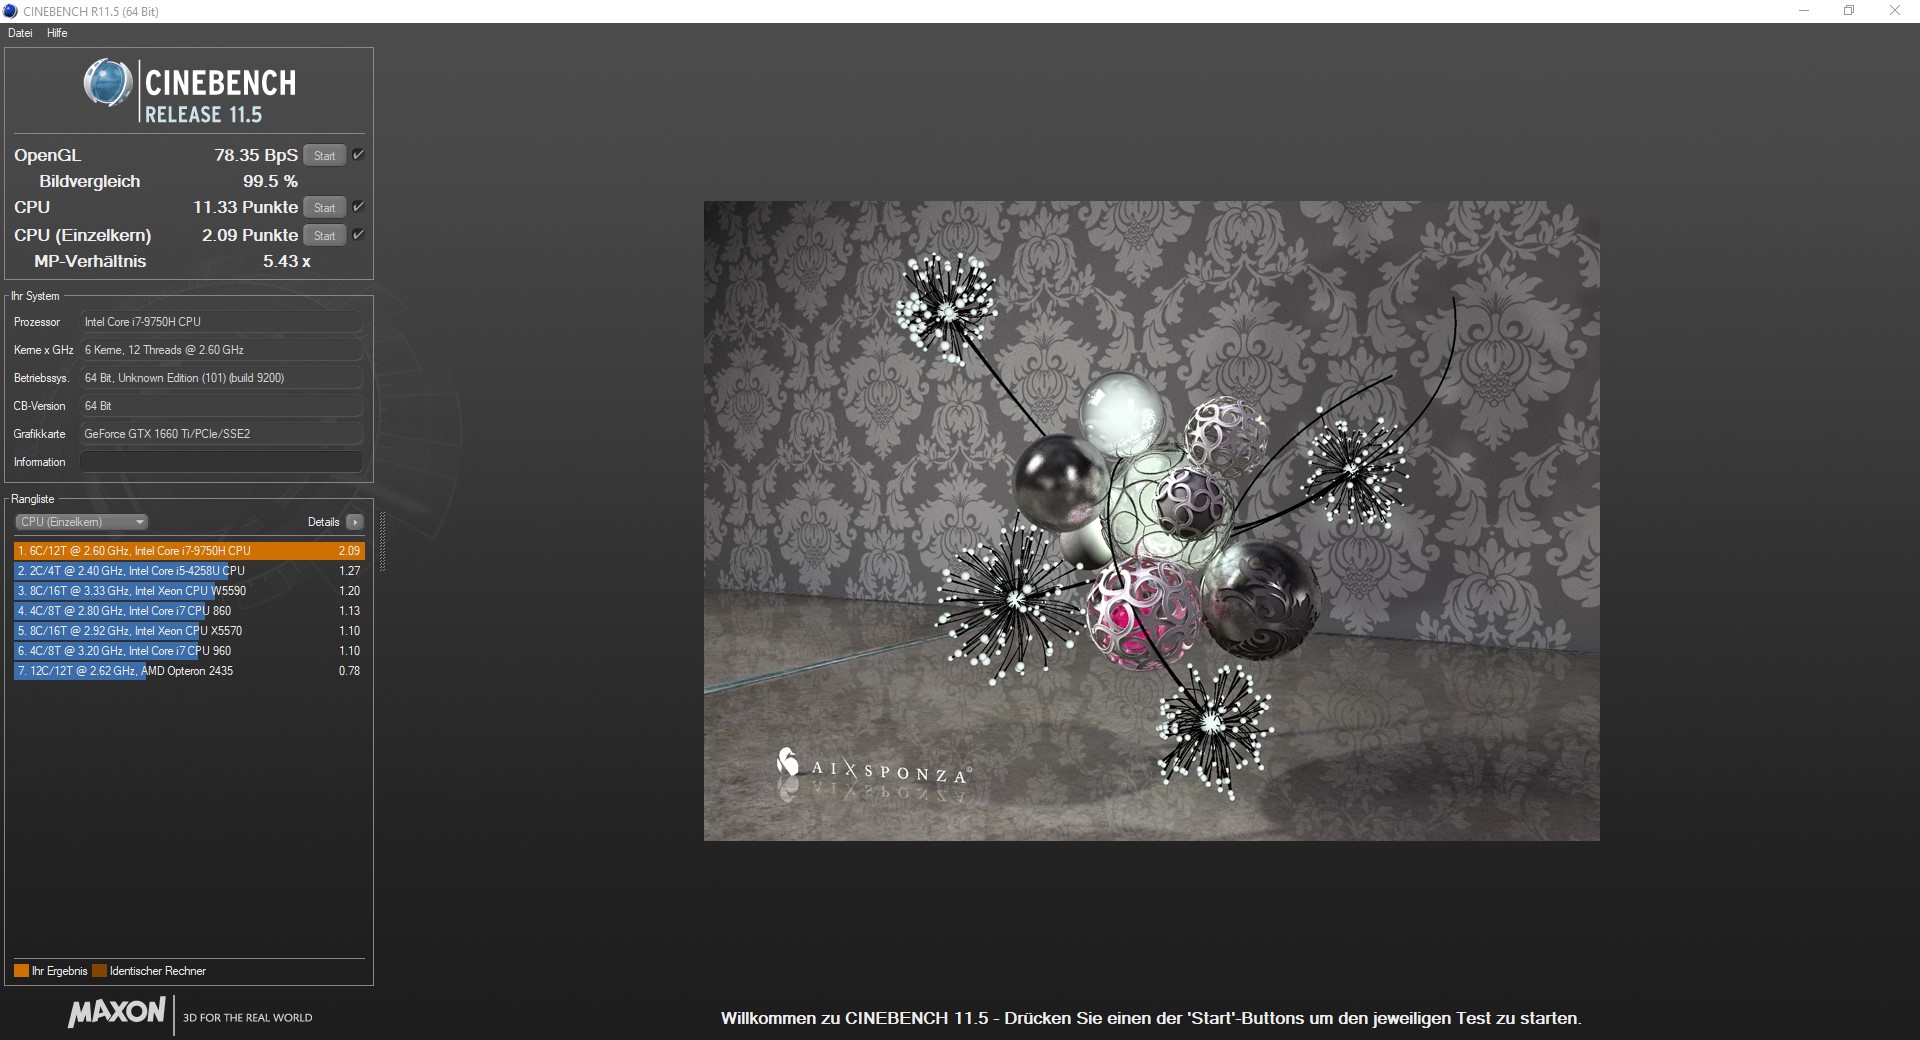
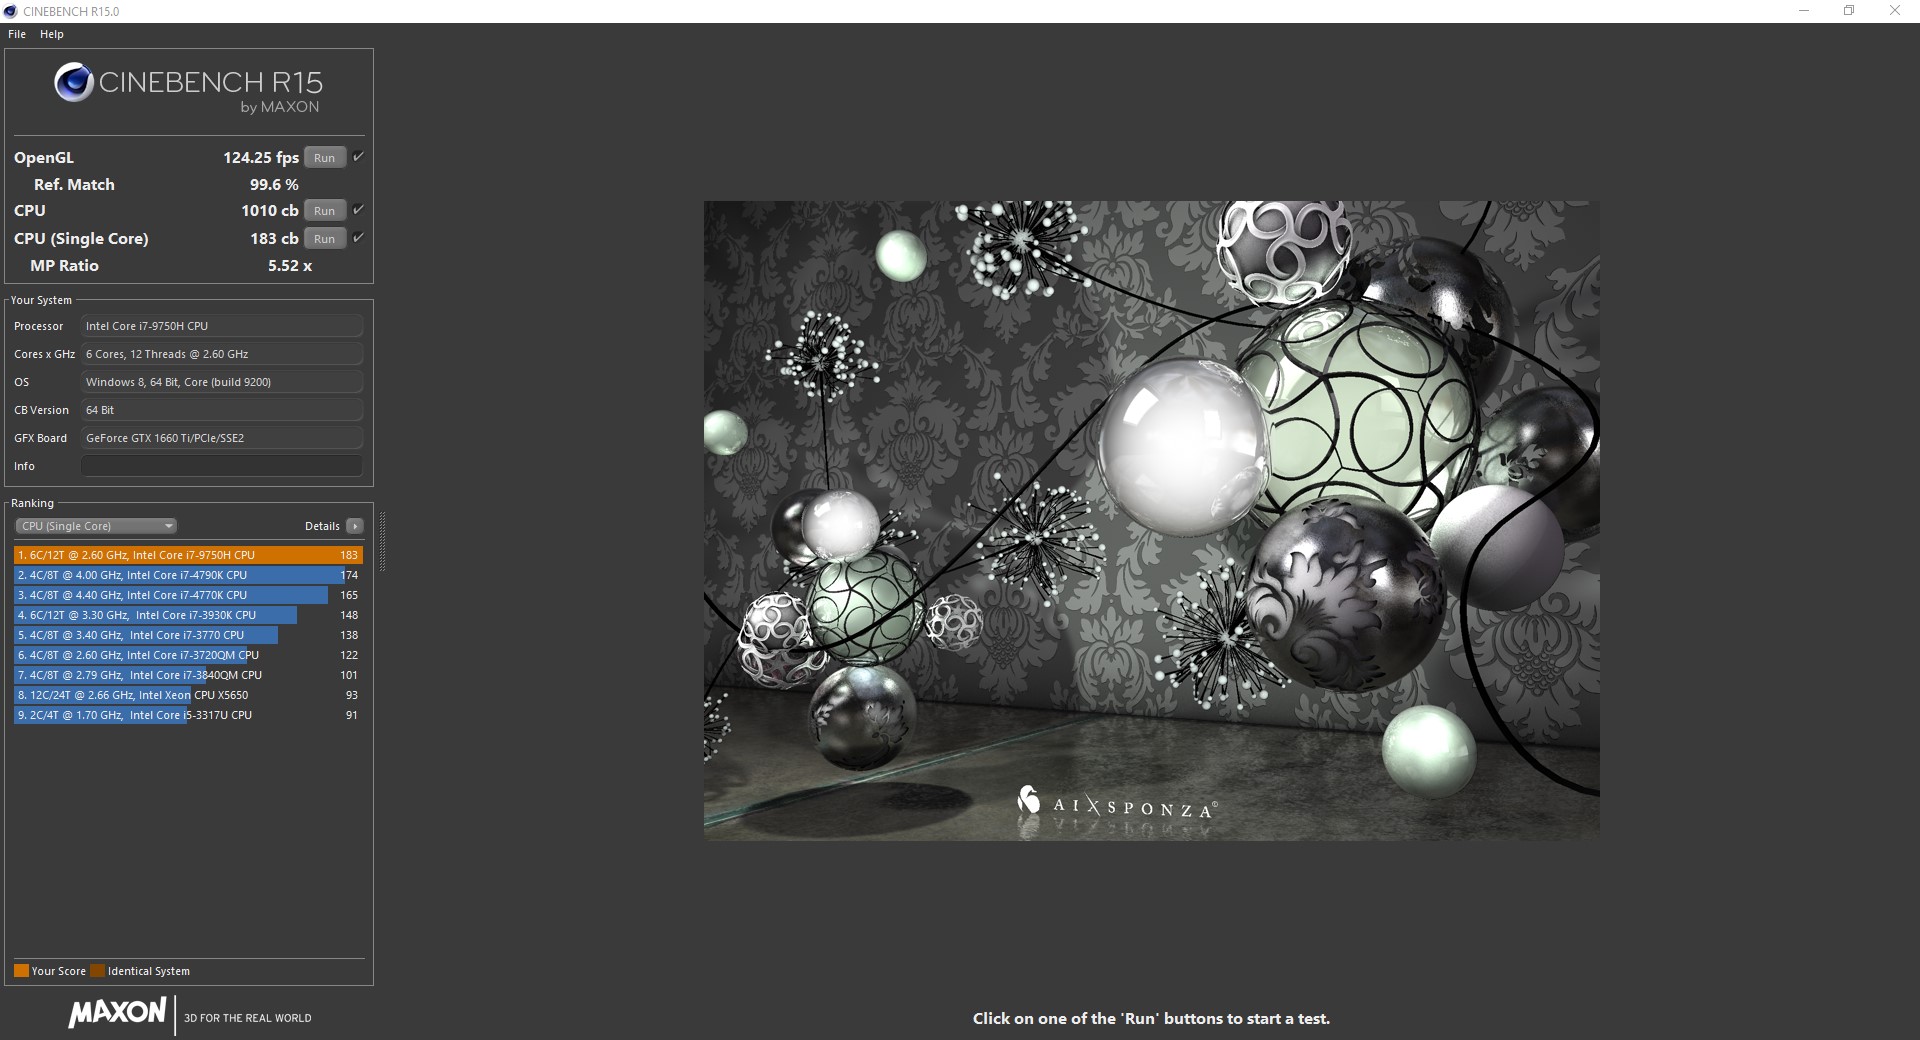
| Cinebench R11.5 | |
| CPU Single 64Bit | |
| Acer Aspire Nitro 5 AN517-51-7887 | |
| Asus TUF FX705GM | |
| CPU Multi 64Bit | |
| Asus TUF FX705GM | |
| Acer Aspire Nitro 5 AN517-51-7887 | |
| Blender - v2.79 BMW27 CPU | |
| Acer Aspire Nitro 5 AN517-51-7887 | |
| Geekbench 4.4 | |
| 64 Bit Single-Core Score | |
| Acer Aspire Nitro 5 AN517-51-7887 | |
| Lenovo Legion Y540-17IRH | |
| 64 Bit Multi-Core Score | |
| Acer Aspire Nitro 5 AN517-51-7887 | |
| Lenovo Legion Y540-17IRH | |
| 3DMark 11 - 1280x720 Performance Physics | |
| Asus ROG Strix G GL731GU-RB74 | |
| HP Pavilion Gaming 17-cd0085cl | |
| Asus TUF FX705GM | |
| Lenovo Legion Y540-17IRH | |
| Acer Aspire Nitro 5 AN517-51-7887 | |
| MSI GL73 8SE-010US | |
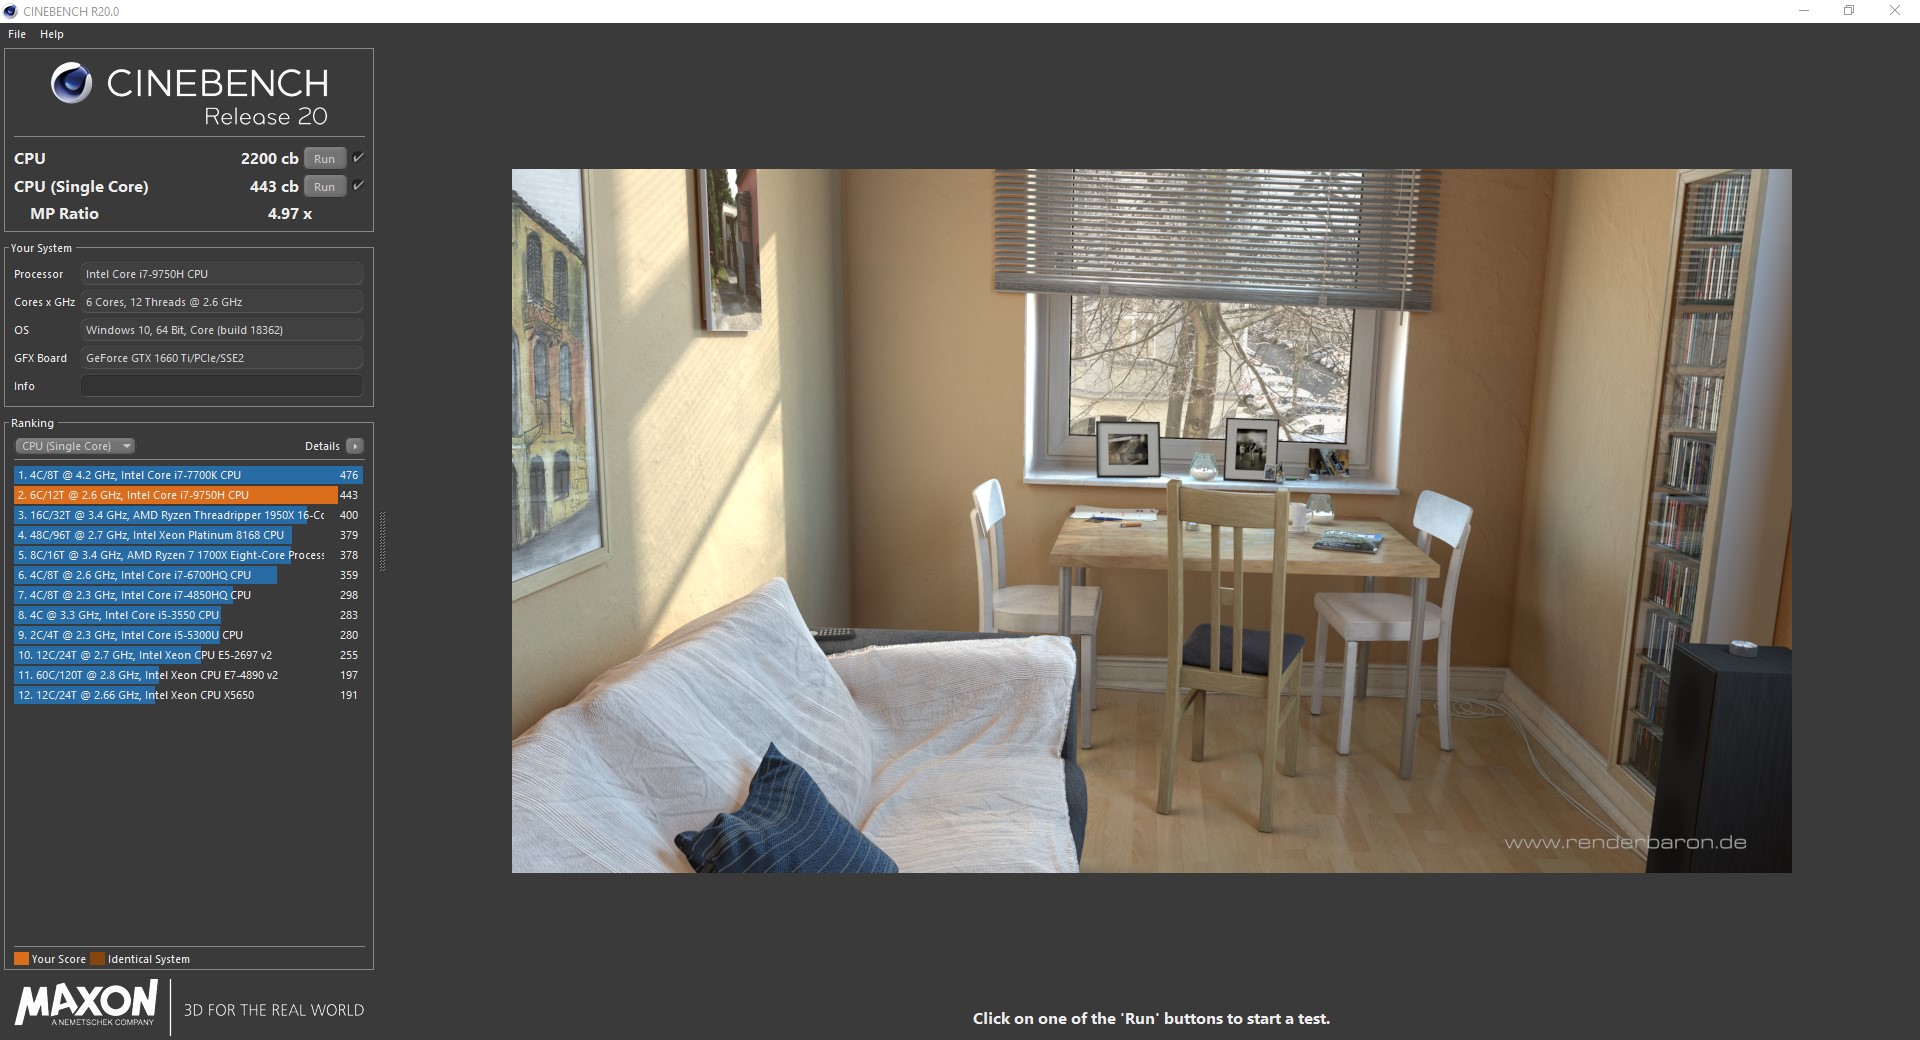
| Cinebench R20 | |
| CPU (Single Core) | |
| Acer Aspire Nitro 5 AN517-51-7887 | |
| Lenovo Legion Y540-17IRH | |
| CPU (Multi Core) | |
| Acer Aspire Nitro 5 AN517-51-7887 | |
| Lenovo Legion Y540-17IRH | |
| 7-Zip 18.03 | |
| 7z b 4 | |
| Acer Aspire Nitro 5 AN517-51-7887 | |
| 7z b 4 -mmt1 | |
| Acer Aspire Nitro 5 AN517-51-7887 | |
* ... mindre är bättre
| PCMark 8 Home Score Accelerated v2 | 4782 poäng | |
| PCMark 8 Creative Score Accelerated v2 | 7475 poäng | |
| PCMark 8 Work Score Accelerated v2 | 5361 poäng | |
| PCMark 10 Score | 5519 poäng | |
Hjälp | ||
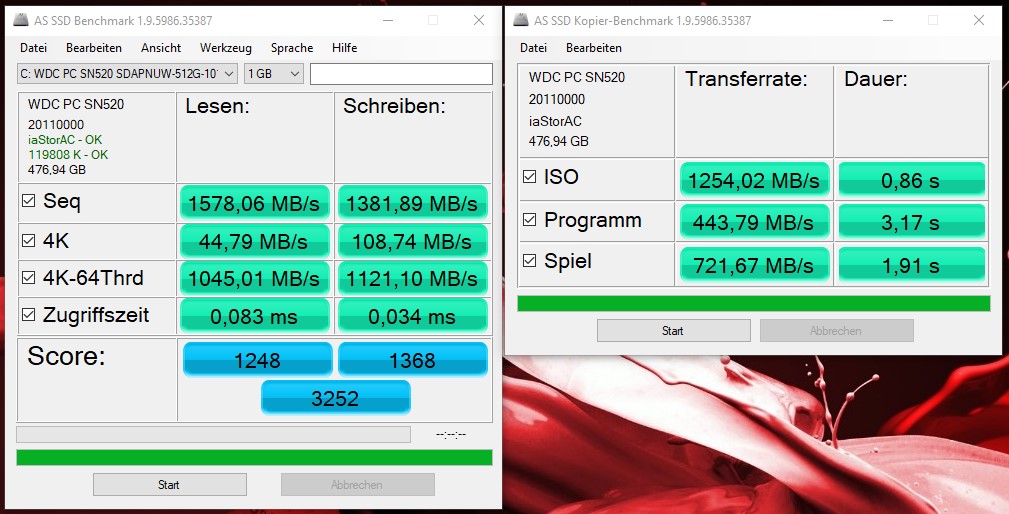
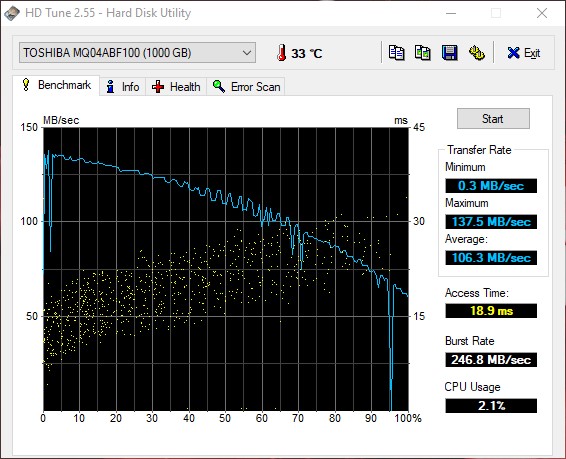
| Acer Aspire Nitro 5 AN517-51-7887 WDC PC SN520 SDAPNUW-512G | Lenovo Legion Y540-17IRH WDC PC SN520 SDAPNUW-512G | HP Pavilion Gaming 17-cd0085cl Samsung SSD PM981 MZVLB256HAHQ | Asus ROG Strix G GL731GU-RB74 Intel SSD 660p SSDPEKNW512G8 | MSI GL73 8SE-010US Kingston RBUSNS8154P3128GJ | Asus TUF FX705GM WDC PC SN520 SDAPNUW-256G | Genomsnitt WDC PC SN520 SDAPNUW-512G | |
|---|---|---|---|---|---|---|---|
| AS SSD | 1% | -2% | -50% | -83% | -17% | -4% | |
| 4K Read (MB/s) | 44.79 | 38.9 -13% | 49.73 11% | 49.43 10% | 21.91 -51% | 38.49 -14% | 40.8 ? -9% |
| 4K Write (MB/s) | 108.7 | 111.9 3% | 108.2 0% | 104.3 -4% | 56.6 -48% | 101.9 -6% | 127.3 ? 17% |
| 4K-64 Read (MB/s) | 1045 | 1028 -2% | 731 -30% | 321.9 -69% | 354.3 -66% | 720 -31% | 957 ? -8% |
| 4K-64 Write (MB/s) | 1121 | 1276 14% | 1233 10% | 774 -31% | 285.7 -75% | 856 -24% | 1081 ? -4% |
| Access Time Read * (ms) | 0.083 | 0.073 12% | 0.073 12% | 0.055 34% | 0.237 -186% | 0.106 -28% | 0.07744 ? 7% |
| Access Time Write * (ms) | 0.034 | 0.034 -0% | 0.034 -0% | 0.138 -306% | 0.09 -165% | 0.036 -6% | 0.03671 ? -8% |
| Score Read (Points) | 1248 | 1216 -3% | 951 -24% | 503 -60% | 456 -63% | 913 -27% | 1134 ? -9% |
| Score Write (Points) | 1368 | 1520 11% | 1476 8% | 971 -29% | 385 -72% | 1082 -21% | 1331 ? -3% |
| Score Total (Points) | 3252 | 3355 3% | 2909 -11% | 1731 -47% | 1061 -67% | 2458 -24% | 3046 ? -6% |
| Seq Write (MB/s) | 1381 | 1324 -4% | 1345 -3% | 930 -33% | 427.6 -69% | 1236 -10% | 1227 ? -11% |
| Seq Read (MB/s) | 1578 | 1495 -5% | 1709 8% | 1319 -16% | 794 -50% | 1571 0% | 1363 ? -14% |
* ... mindre är bättre

| 3DMark 11 Performance | 16279 poäng | |
| 3DMark Ice Storm Standard Score | 103231 poäng | |
| 3DMark Cloud Gate Standard Score | 31347 poäng | |
| 3DMark Fire Strike Score | 12738 poäng | |
| 3DMark Fire Strike Extreme Score | 6346 poäng | |
Hjälp | ||
| The Witcher 3 | |
| 1920x1080 High Graphics & Postprocessing (Nvidia HairWorks Off) | |
| Genomsnitt av klass Gaming (181 - 341, n=3, senaste 2 åren) | |
| Lenovo Legion Y540-17IRH | |
| Genomsnitt NVIDIA GeForce GTX 1660 Ti Mobile (93 - 120.4, n=17) | |
| MSI GL73 8SE-010US | |
| Acer Aspire Nitro 5 AN517-51-7887 | |
| Asus ROG Strix G GL731GU-RB74 | |
| HP Pavilion Gaming 17-cd0085cl | |
| Asus TUF FX705GM | |
| 1920x1080 Ultra Graphics & Postprocessing (HBAO+) | |
| Genomsnitt av klass Gaming (95 - 240, n=8, senaste 2 åren) | |
| Genomsnitt NVIDIA GeForce GTX 1660 Ti Mobile (51.6 - 65.1, n=21) | |
| Acer Aspire Nitro 5 AN517-51-7887 | |
| MSI GL73 8SE-010US | |
| Lenovo Legion Y540-17IRH | |
| Asus ROG Strix G GL731GU-RB74 | |
| HP Pavilion Gaming 17-cd0085cl | |
| Asus TUF FX705GM | |
| X-Plane 11.11 - 1920x1080 high (fps_test=3) | |
| Genomsnitt av klass Gaming (52.1 - 143.5, n=113, senaste 2 åren) | |
| Genomsnitt NVIDIA GeForce GTX 1660 Ti Mobile (64 - 85, n=11) | |
| Acer Aspire Nitro 5 AN517-51-7887 | |
| Lenovo Legion Y540-17IRH | |
| Far Cry New Dawn | |
| 1920x1080 Ultra Preset | |
| Genomsnitt NVIDIA GeForce GTX 1660 Ti Mobile (73 - 81, n=7) | |
| Lenovo Legion Y540-17IRH | |
| Acer Aspire Nitro 5 AN517-51-7887 | |
| 1920x1080 High Preset | |
| Genomsnitt NVIDIA GeForce GTX 1660 Ti Mobile (79 - 89, n=7) | |
| Lenovo Legion Y540-17IRH | |
| Acer Aspire Nitro 5 AN517-51-7887 | |
| Dota 2 Reborn | |
| 1920x1080 ultra (3/3) best looking | |
| Genomsnitt av klass Gaming (84.8 - 248, n=110, senaste 2 åren) | |
| Genomsnitt NVIDIA GeForce GTX 1660 Ti Mobile (94.6 - 125, n=11) | |
| Acer Aspire Nitro 5 AN517-51-7887 | |
| 1920x1080 high (2/3) | |
| Genomsnitt av klass Gaming (82.8 - 275, n=109, senaste 2 åren) | |
| Genomsnitt NVIDIA GeForce GTX 1660 Ti Mobile (103.3 - 130, n=11) | |
| Acer Aspire Nitro 5 AN517-51-7887 | |
| BioShock Infinite - 1920x1080 Ultra Preset, DX11 (DDOF) | |
| Asus ROG Strix G GL731GU-RB74 | |
| Lenovo Legion Y540-17IRH | |
| Acer Aspire Nitro 5 AN517-51-7887 | |
| Genomsnitt NVIDIA GeForce GTX 1660 Ti Mobile (121.6 - 144.2, n=14) | |
| HP Pavilion Gaming 17-cd0085cl | |
| MSI GL73 8SE-010US | |
| Rise of the Tomb Raider - 1920x1080 Very High Preset AA:FX AF:16x | |
| Acer Aspire Nitro 5 AN517-51-7887 | |
| Genomsnitt NVIDIA GeForce GTX 1660 Ti Mobile (74 - 87.4, n=3) | |
| låg | med. | hög | ultra | QHD | 4K | |
|---|---|---|---|---|---|---|
| BioShock Infinite (2013) | 309 | 270 | 247 | 138 | ||
| The Witcher 3 (2015) | 254 | 171 | 101 | 55.3 | 32.9 | |
| Dota 2 Reborn (2015) | 143 | 123.7 | 117.6 | 110.6 | ||
| Rise of the Tomb Raider (2016) | 156 | 164 | 100 | 81 | 38 | |
| Rocket League (2017) | 248 | 247 | 221 | |||
| X-Plane 11.11 (2018) | 92 | 85 | 73 | |||
| Far Cry 5 (2018) | 107 | 92 | 90 | 87 | 60 | 31 |
| Far Cry New Dawn (2019) | 105 | 87 | 83 | 74 | 60 | 32 |
Ljudnivå
| Låg belastning |
| 30.2 / 30.2 / 31 dB(A) |
| Hårddisk |
| 31.6 dB(A) |
| Hög belastning |
| 43.4 / 45.5 dB(A) |
 | ||
30 dB tyst 40 dB(A) hörbar 50 dB(A) högt ljud |
||
min: | ||
| Acer Aspire Nitro 5 AN517-51-7887, Intel Core i7-9750H GeForce GTX 1660 Ti Mobile, i7-9750H, WDC PC SN520 SDAPNUW-512G | Lenovo Legion Y540-17IRH, Intel Core i5-9300H GeForce GTX 1660 Ti Mobile, i5-9300H, WDC PC SN520 SDAPNUW-512G | HP Pavilion Gaming 17-cd0085cl, Intel Core i7-9750H GeForce GTX 1660 Ti Max-Q, i7-9750H, Samsung SSD PM981 MZVLB256HAHQ | Asus ROG Strix G GL731GU-RB74, Intel Core i7-9750H GeForce GTX 1660 Ti Mobile, i7-9750H, Intel SSD 660p SSDPEKNW512G8 | MSI GL73 8SE-010US, Intel Core i7-8750H GeForce RTX 2060 Mobile, i7-8750H, Kingston RBUSNS8154P3128GJ | Asus TUF FX705GM, Intel Core i7-8750H GeForce GTX 1060 Mobile, i7-8750H, WDC PC SN520 SDAPNUW-256G | |
|---|---|---|---|---|---|---|
| Noise | -5% | 9% | -8% | -4% | -10% | |
| av / miljö * (dB) | 30 | 30 -0% | 28.2 6% | 28.2 6% | 28.6 5% | 29 3% |
| Idle Minimum * (dB) | 30.2 | 30 1% | 30.1 -0% | 31.8 -5% | 33.8 -12% | 32 -6% |
| Idle Average * (dB) | 30.2 | 32 -6% | 30.1 -0% | 32 -6% | 34 -13% | 33 -9% |
| Idle Maximum * (dB) | 31 | 34 -10% | 30.1 3% | 40.6 -31% | 34.1 -10% | 44 -42% |
| Load Average * (dB) | 43.4 | 44 -1% | 34.2 21% | 48 -11% | 36.5 16% | 46 -6% |
| Witcher 3 ultra * (dB) | 48.5 | 50 -3% | 34.2 29% | 48 1% | 47.8 1% | 48 1% |
| Load Maximum * (dB) | 45.5 | 52 -14% | 43.8 4% | 51.5 -13% | 52.2 -15% | 50 -10% |
* ... mindre är bättre
(-) Den maximala temperaturen på ovansidan är 51.7 °C / 125 F, jämfört med genomsnittet av 40.4 °C / 105 F , allt från 21.2 till 68.8 °C för klassen Gaming.
(-) Botten värms upp till maximalt 55.4 °C / 132 F, jämfört med genomsnittet av 43.2 °C / 110 F
(+) Vid tomgångsbruk är medeltemperaturen för ovansidan 27.5 °C / 82 F, jämfört med enhetsgenomsnittet på 33.9 °C / ### class_avg_f### F.
(-) När du spelar The Witcher 3 är medeltemperaturen för ovansidan 39.7 °C / 103 F, jämfört med enhetsgenomsnittet på 33.9 °C / ## #class_avg_f### F.
(+) Handledsstöden och pekplattan är kallare än hudtemperaturen med maximalt 31.4 °C / 88.5 F och är därför svala att ta på.
(-) Medeltemperaturen för handledsstödsområdet på liknande enheter var 28.8 °C / 83.8 F (-2.6 °C / -4.7 F).
| Acer Aspire Nitro 5 AN517-51-7887, Intel Core i7-9750H GeForce GTX 1660 Ti Mobile, i7-9750H, WDC PC SN520 SDAPNUW-512G | Lenovo Legion Y540-17IRH, Intel Core i5-9300H GeForce GTX 1660 Ti Mobile, i5-9300H, WDC PC SN520 SDAPNUW-512G | HP Pavilion Gaming 17-cd0085cl, Intel Core i7-9750H GeForce GTX 1660 Ti Max-Q, i7-9750H, Samsung SSD PM981 MZVLB256HAHQ | Asus ROG Strix G GL731GU-RB74, Intel Core i7-9750H GeForce GTX 1660 Ti Mobile, i7-9750H, Intel SSD 660p SSDPEKNW512G8 | MSI GL73 8SE-010US, Intel Core i7-8750H GeForce RTX 2060 Mobile, i7-8750H, Kingston RBUSNS8154P3128GJ | Asus TUF FX705GM, Intel Core i7-8750H GeForce GTX 1060 Mobile, i7-8750H, WDC PC SN520 SDAPNUW-256G | |
|---|---|---|---|---|---|---|
| Heat | -12% | -6% | 1% | 12% | -2% | |
| Maximum Upper Side * (°C) | 51.7 | 48 7% | 42.6 18% | 44.6 14% | 47 9% | 54 -4% |
| Maximum Bottom * (°C) | 55.4 | 56 -1% | 49 12% | 51.6 7% | 44.4 20% | 53 4% |
| Idle Upper Side * (°C) | 29.1 | 36 -24% | 34 -17% | 31.6 -9% | 24.6 15% | 30 -3% |
| Idle Bottom * (°C) | 29 | 38 -31% | 39.4 -36% | 31.4 -8% | 28 3% | 30 -3% |
* ... mindre är bättre
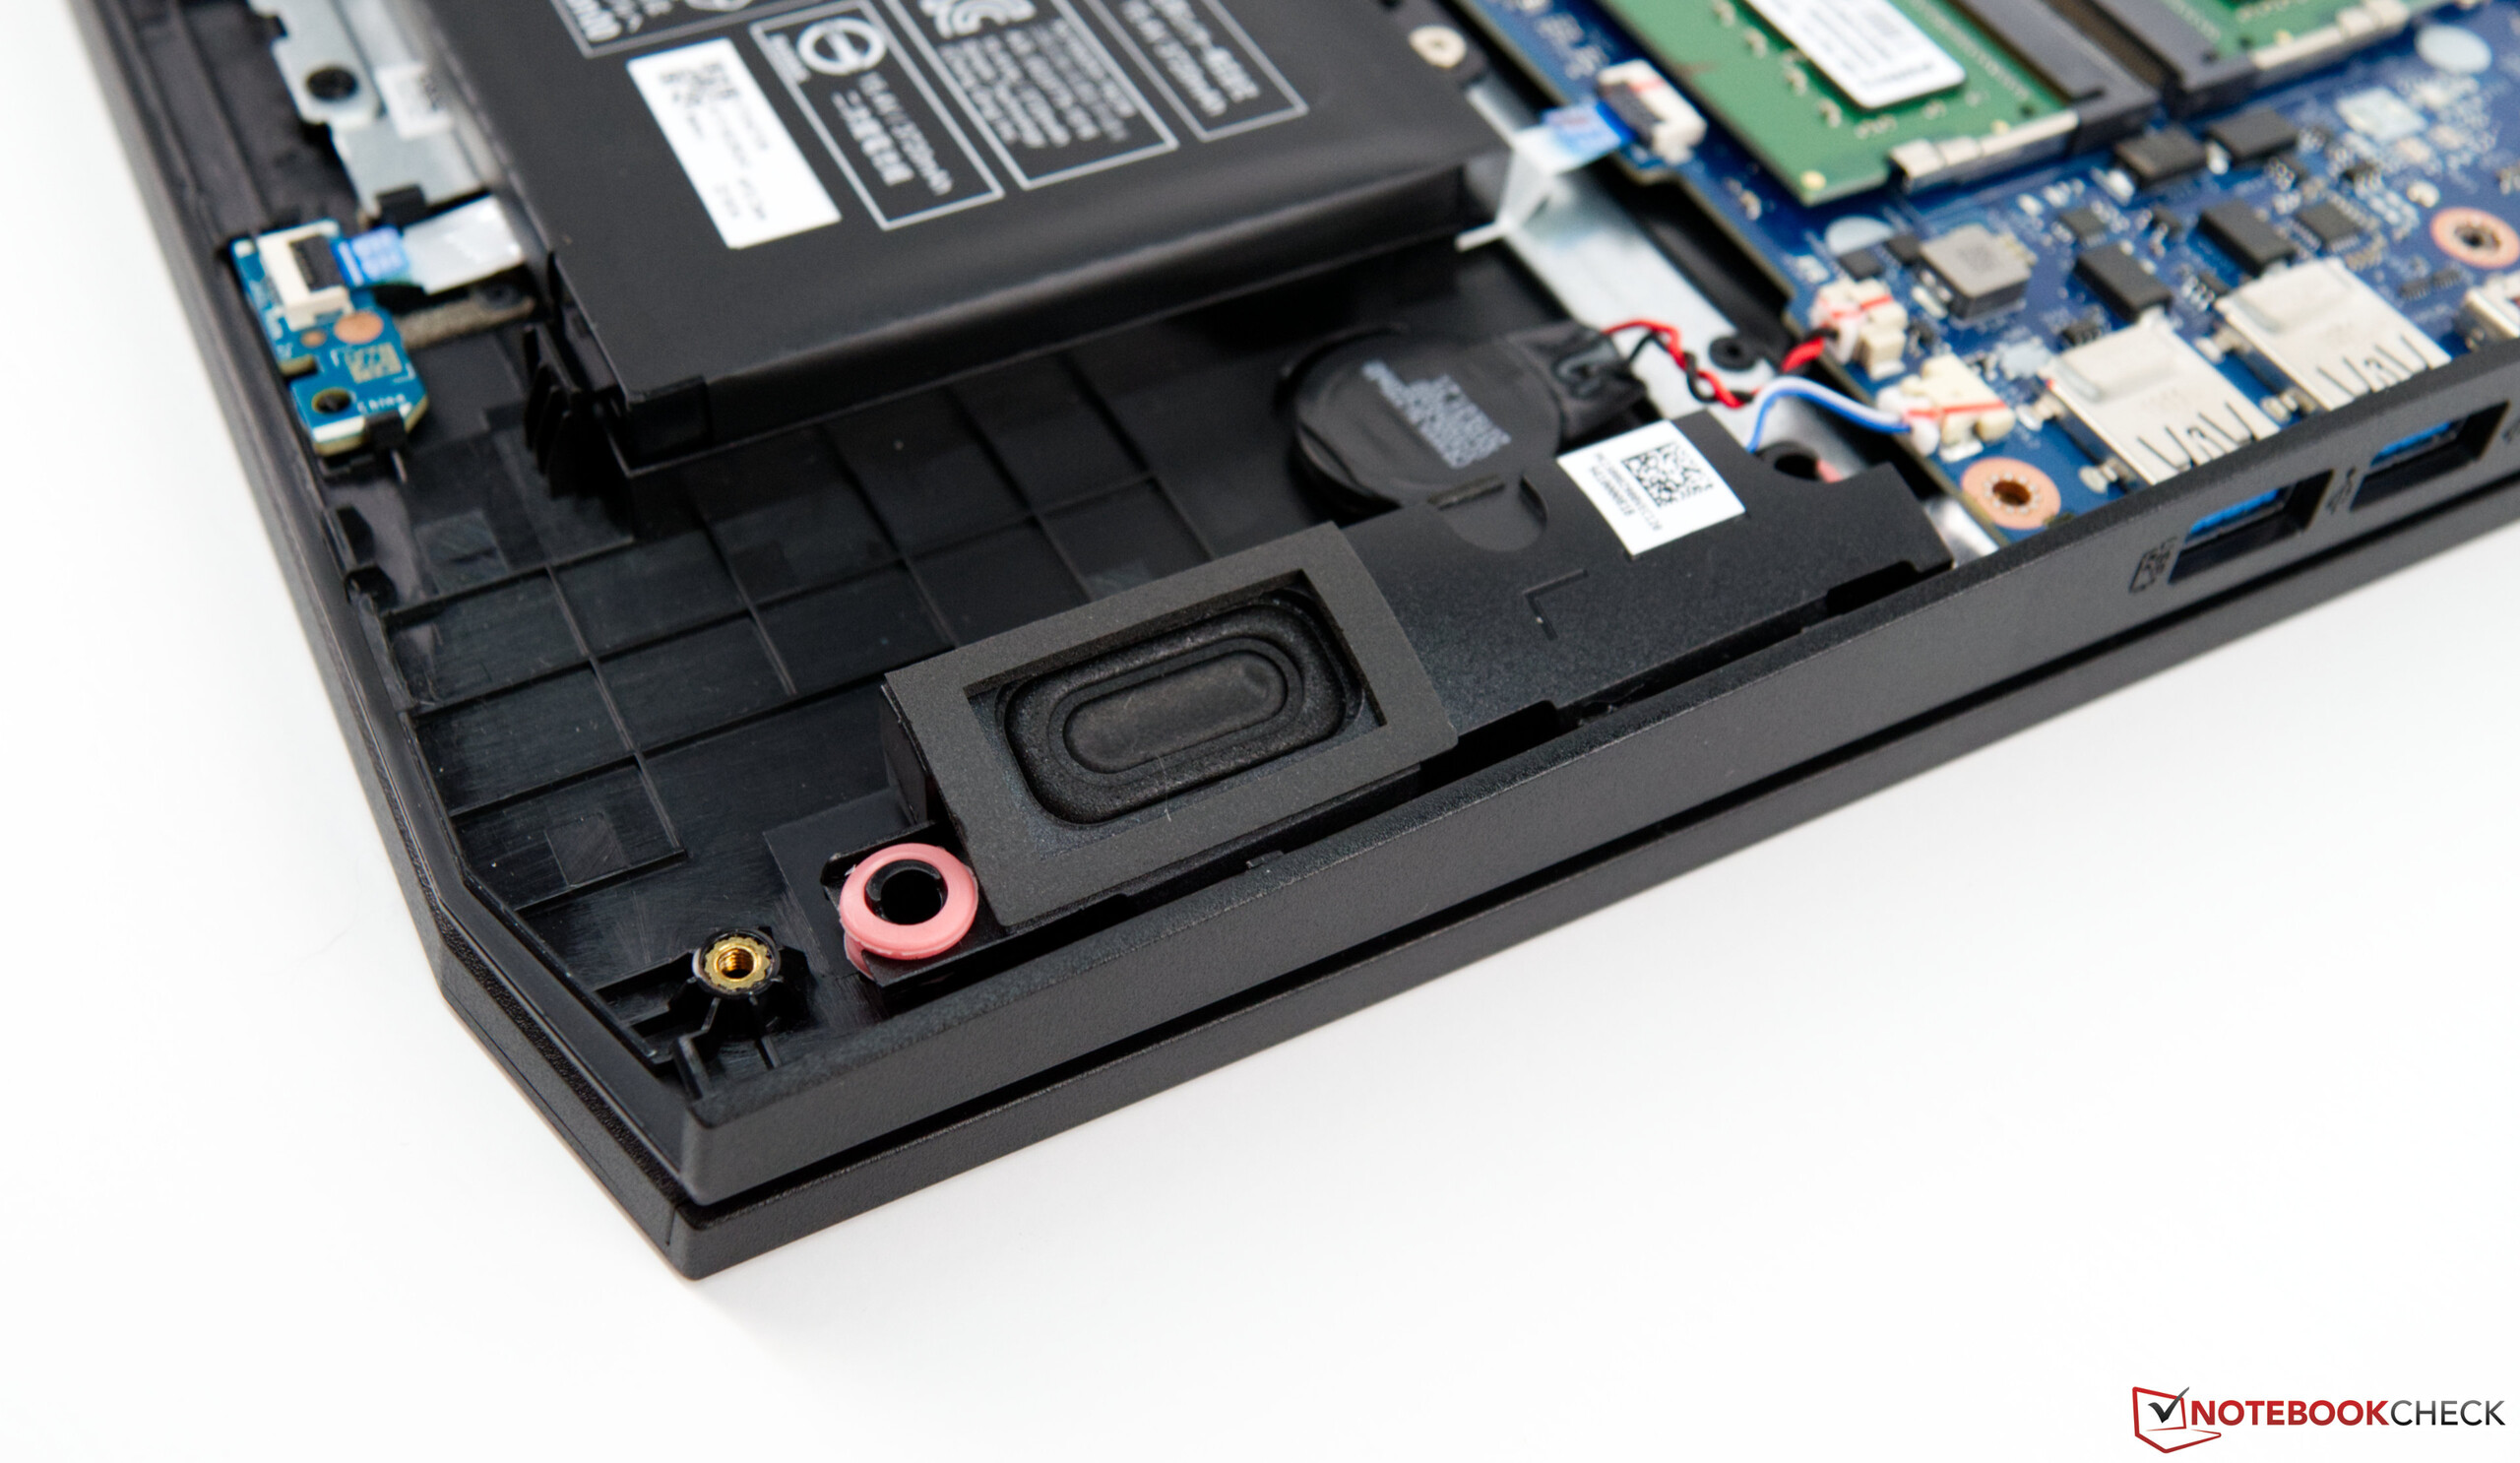
Acer Aspire Nitro 5 AN517-51-7887 ljudanalys
(-) | inte särskilt höga högtalare (68.6 dB)
Bas 100 - 315 Hz
(-) | nästan ingen bas - i genomsnitt 17.2% lägre än medianen
(±) | linjäriteten för basen är genomsnittlig (13.3% delta till föregående frekvens)
Mellan 400 - 2000 Hz
(+) | balanserad mellan - endast 4.7% från medianen
(+) | mids är linjära (6.9% delta till föregående frekvens)
Högsta 2 - 16 kHz
(+) | balanserade toppar - endast 1.9% från medianen
(+) | toppar är linjära (5.5% delta till föregående frekvens)
Totalt 100 - 16 000 Hz
(±) | linjäriteten för det totala ljudet är genomsnittlig (19.5% skillnad mot median)
Jämfört med samma klass
» 68% av alla testade enheter i den här klassen var bättre, 7% liknande, 26% sämre
» Den bästa hade ett delta på 6%, genomsnittet var 18%, sämst var 132%
Jämfört med alla testade enheter
» 48% av alla testade enheter var bättre, 7% liknande, 44% sämre
» Den bästa hade ett delta på 4%, genomsnittet var 24%, sämst var 134%
Lenovo Legion Y540-17IRH ljudanalys
(+) | högtalare kan spela relativt högt (84 dB)
Bas 100 - 315 Hz
(-) | nästan ingen bas - i genomsnitt 16.1% lägre än medianen
(±) | linjäriteten för basen är genomsnittlig (13% delta till föregående frekvens)
Mellan 400 - 2000 Hz
(±) | högre mellan - i genomsnitt 5% högre än median
(+) | mids är linjära (3.6% delta till föregående frekvens)
Högsta 2 - 16 kHz
(+) | balanserade toppar - endast 3.5% från medianen
(+) | toppar är linjära (5.9% delta till föregående frekvens)
Totalt 100 - 16 000 Hz
(±) | linjäriteten för det totala ljudet är genomsnittlig (15.7% skillnad mot median)
Jämfört med samma klass
» 36% av alla testade enheter i den här klassen var bättre, 7% liknande, 57% sämre
» Den bästa hade ett delta på 6%, genomsnittet var 18%, sämst var 132%
Jämfört med alla testade enheter
» 24% av alla testade enheter var bättre, 5% liknande, 71% sämre
» Den bästa hade ett delta på 4%, genomsnittet var 24%, sämst var 134%
| Av/Standby | |
| Låg belastning | |
| Hög belastning |
|
Förklaring:
min: | |
| Acer Aspire Nitro 5 AN517-51-7887 i7-9750H, GeForce GTX 1660 Ti Mobile, WDC PC SN520 SDAPNUW-512G, IPS, 1920x1080, 17.3" | Lenovo Legion Y540-17IRH i5-9300H, GeForce GTX 1660 Ti Mobile, WDC PC SN520 SDAPNUW-512G, IPS, 1920x1080, 17.3" | HP Pavilion Gaming 17-cd0085cl i7-9750H, GeForce GTX 1660 Ti Max-Q, Samsung SSD PM981 MZVLB256HAHQ, IPS, 1920x1080, 17.3" | Asus ROG Strix G GL731GU-RB74 i7-9750H, GeForce GTX 1660 Ti Mobile, Intel SSD 660p SSDPEKNW512G8, IPS, 1920x1080, 17.3" | MSI GL73 8SE-010US i7-8750H, GeForce RTX 2060 Mobile, Kingston RBUSNS8154P3128GJ, TN LED, 1920x1080, 17.3" | Asus TUF FX705GM i7-8750H, GeForce GTX 1060 Mobile, WDC PC SN520 SDAPNUW-256G, IPS, 1920x1080, 17.3" | Genomsnitt NVIDIA GeForce GTX 1660 Ti Mobile | Genomsnitt av klass Gaming | |
|---|---|---|---|---|---|---|---|---|
| Power Consumption | -116% | -7% | -115% | -48% | -79% | -91% | -107% | |
| Idle Minimum * (Watt) | 3.9 | 19 -387% | 5.4 -38% | 13.6 -249% | 8.8 -126% | 13 -233% | 12.4 ? -218% | 13.2 ? -238% |
| Idle Average * (Watt) | 8.9 | 22 -147% | 9.2 -3% | 26.2 -194% | 16.2 -82% | 17 -91% | 18 ? -102% | 18.9 ? -112% |
| Idle Maximum * (Watt) | 12.2 | 30 -146% | 13 -7% | 35 -187% | 18.3 -50% | 24 -97% | 25.3 ? -107% | 24.5 ? -101% |
| Load Average * (Watt) | 83 | 79 5% | 85.9 -3% | 113.6 -37% | 86.1 -4% | 106 -28% | 93.5 ? -13% | 108.8 ? -31% |
| Witcher 3 ultra * (Watt) | 130 | 134 -3% | 107.9 17% | 134.1 -3% | 146.7 -13% | 151 -16% | ||
| Load Maximum * (Watt) | 168 | 201 -20% | 182.2 -8% | 200.2 -19% | 186.4 -11% | 179 -7% | 191.9 ? -14% | 254 ? -51% |
* ... mindre är bättre

| Acer Aspire Nitro 5 AN517-51-7887 i7-9750H, GeForce GTX 1660 Ti Mobile, 57 Wh | Lenovo Legion Y540-17IRH i5-9300H, GeForce GTX 1660 Ti Mobile, 57 Wh | HP Pavilion Gaming 17-cd0085cl i7-9750H, GeForce GTX 1660 Ti Max-Q, 52.5 Wh | Asus ROG Strix G GL731GU-RB74 i7-9750H, GeForce GTX 1660 Ti Mobile, 66 Wh | MSI GL73 8SE-010US i7-8750H, GeForce RTX 2060 Mobile, 41 Wh | Asus TUF FX705GM i7-8750H, GeForce GTX 1060 Mobile, 64 Wh | Genomsnitt av klass Gaming | |
|---|---|---|---|---|---|---|---|
| Batteridrifttid | -46% | -21% | -21% | -57% | -30% | -2% | |
| Reader / Idle (h) | 13.4 | 5.2 -61% | 11.6 -13% | 8.6 -36% | 6.5 -51% | 6.3 -53% | 8.71 ? -35% |
| H.264 (h) | 6.3 | 3.4 -46% | 4.3 -32% | 8.28 ? 31% | |||
| WiFi v1.3 (h) | 6.2 | 3.7 -40% | 5.7 -8% | 4.9 -21% | 2.8 -55% | 4.5 -27% | 6.96 ? 12% |
| Load (h) | 1.7 | 1.1 -35% | 1 -41% | 1.6 -6% | 0.6 -65% | 1.6 -6% | 1.47 ? -14% |
För
Emot

Läs den fullständiga versionen av den här recensionen på engelska här.
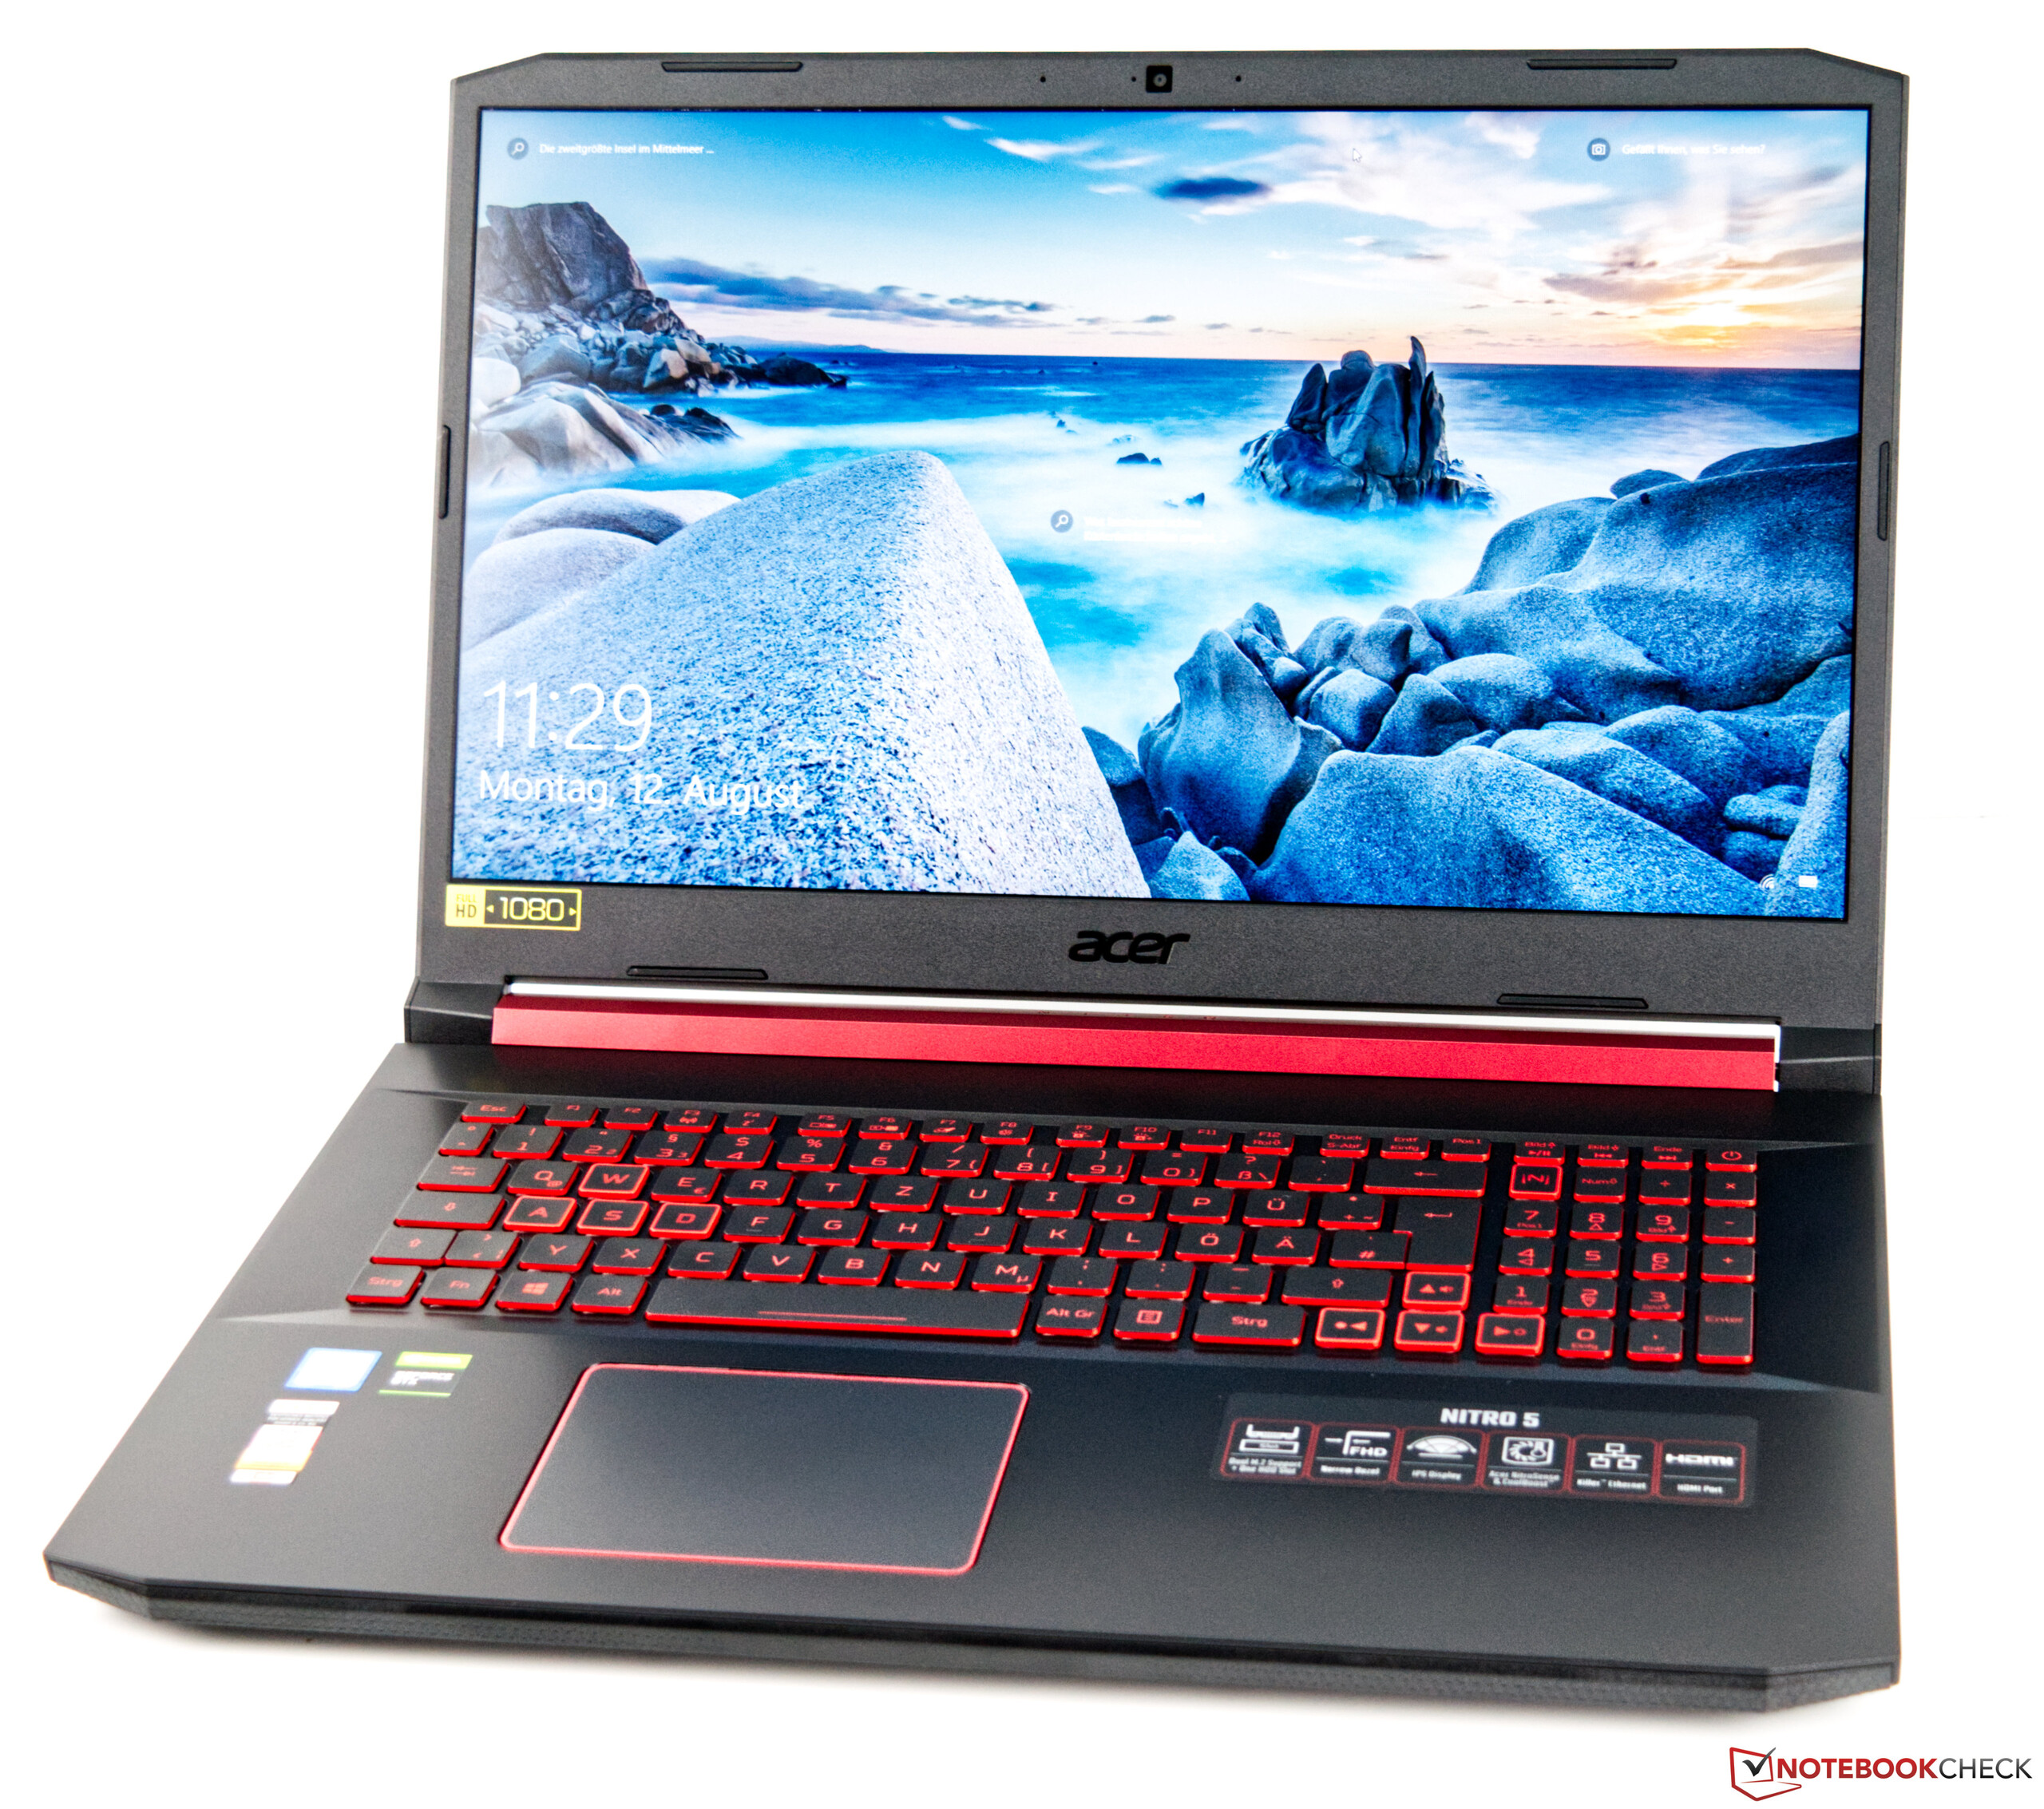
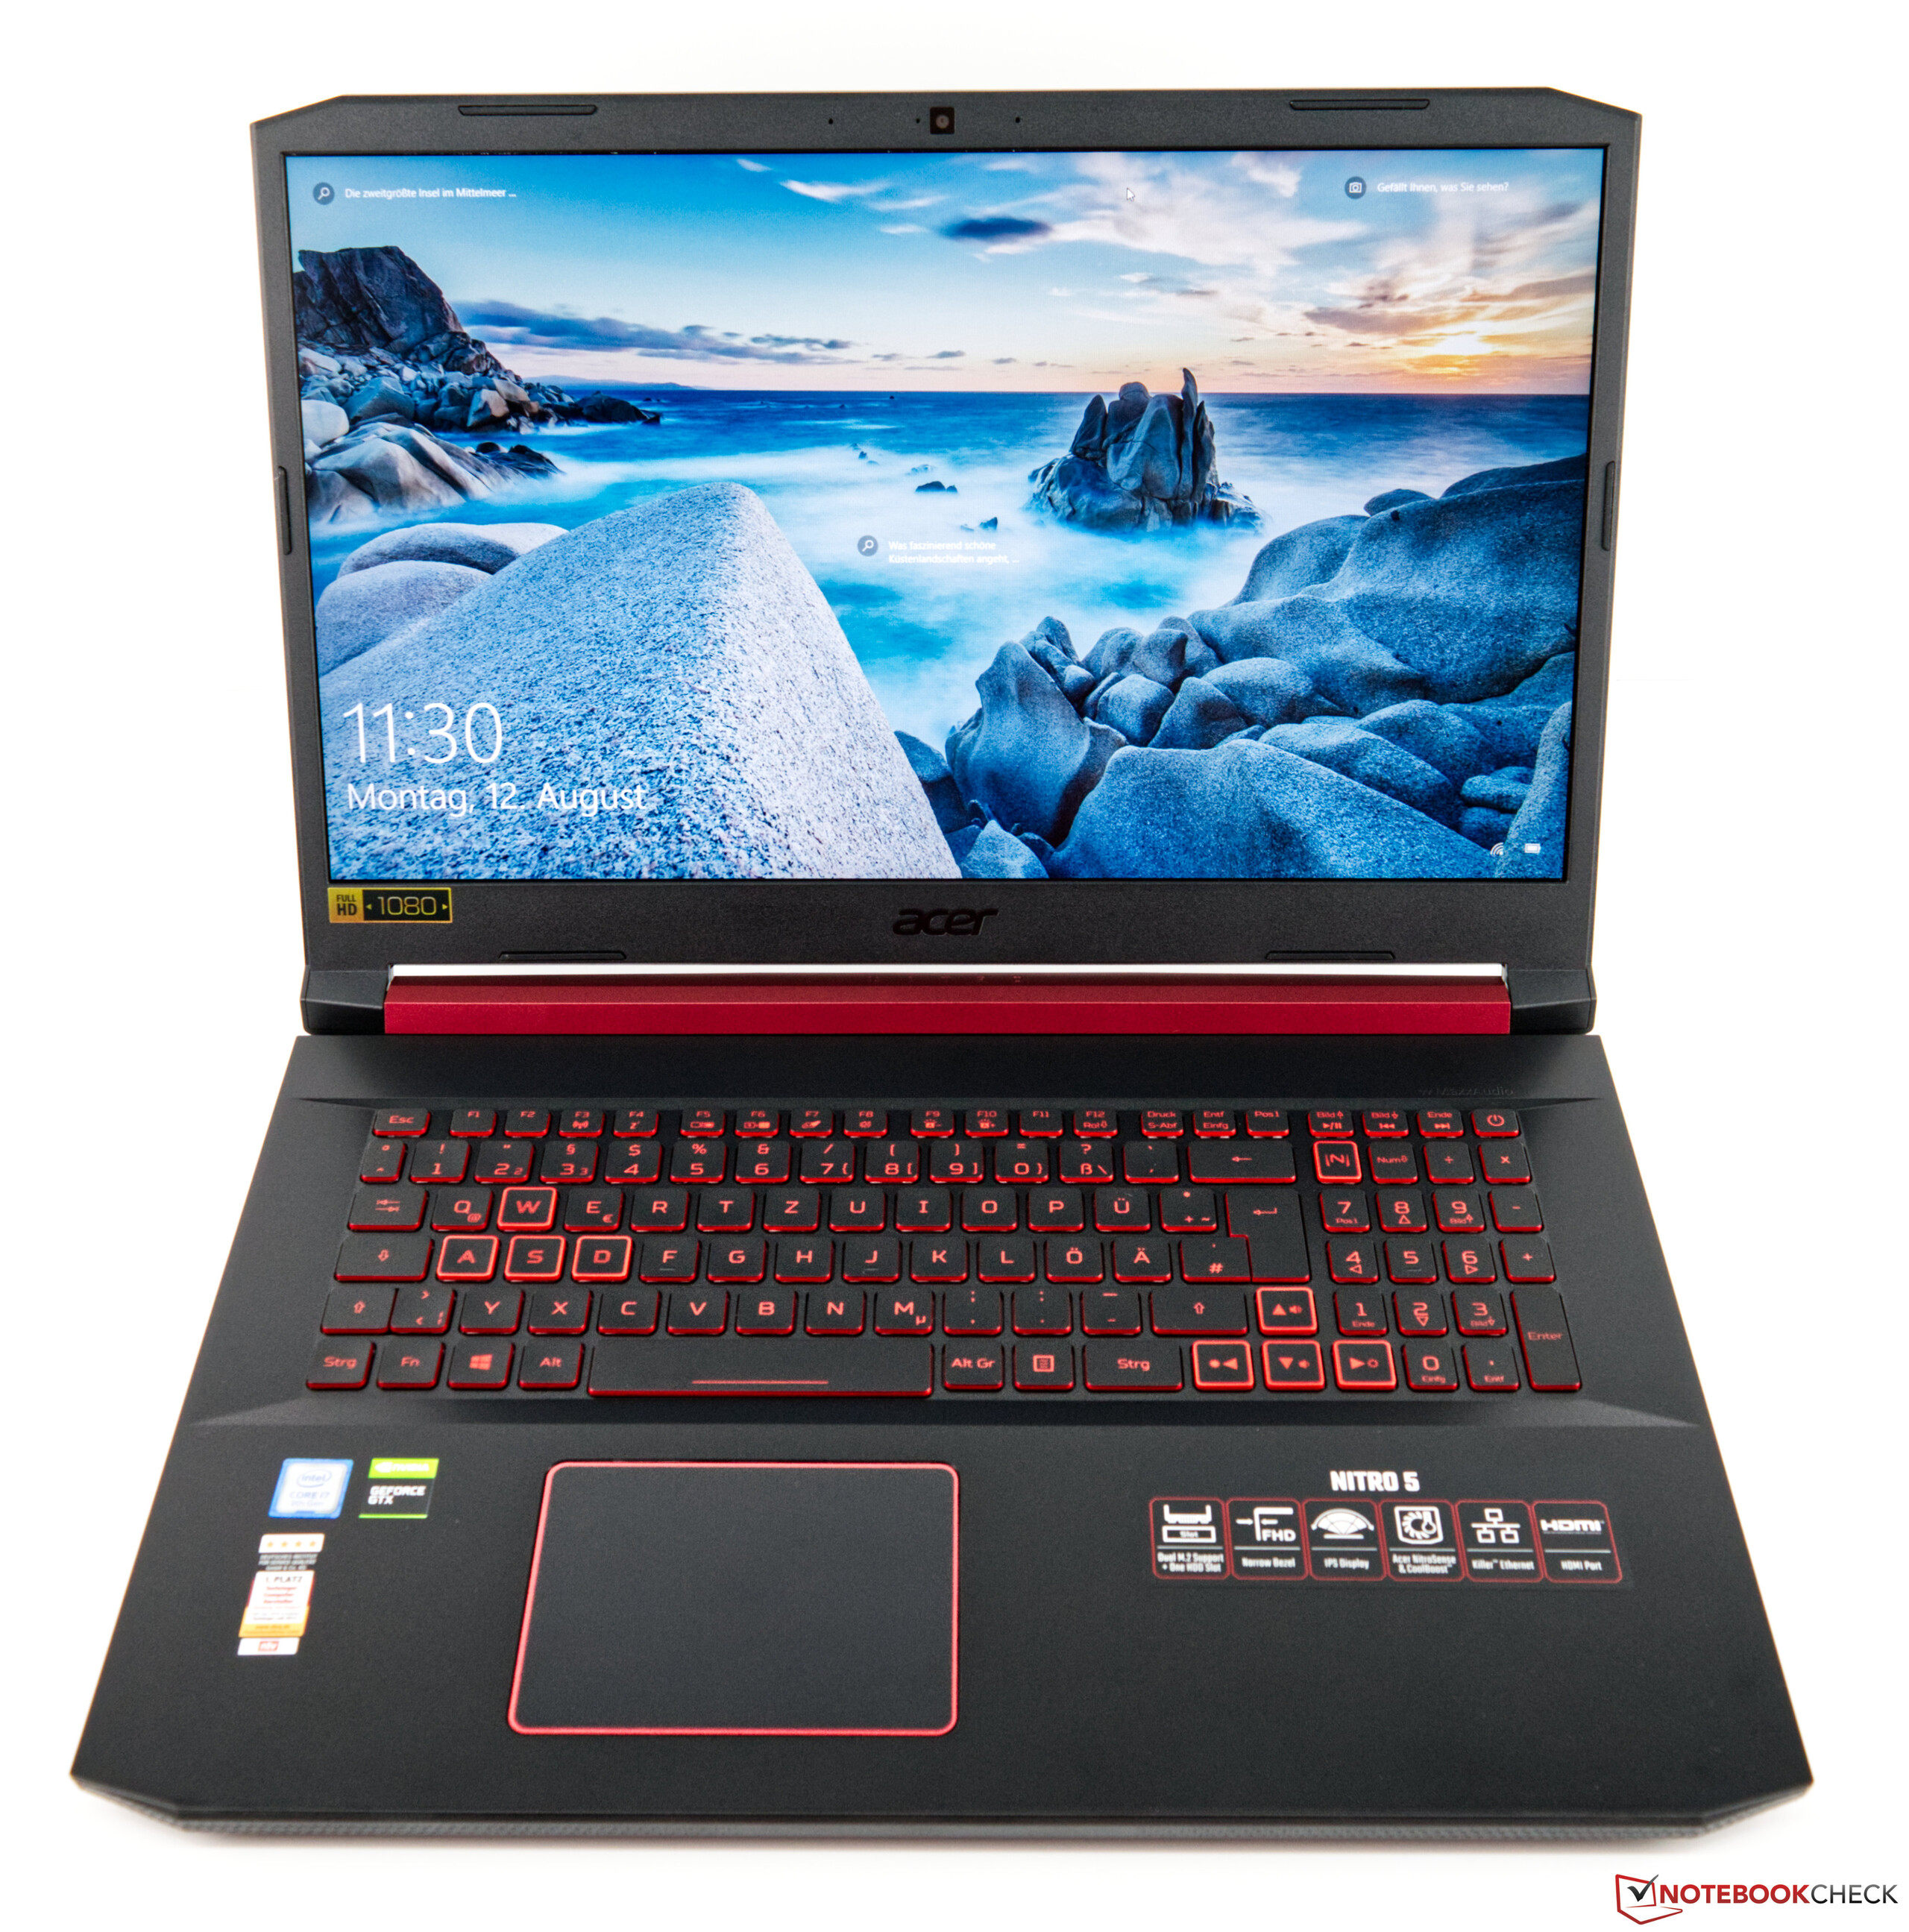
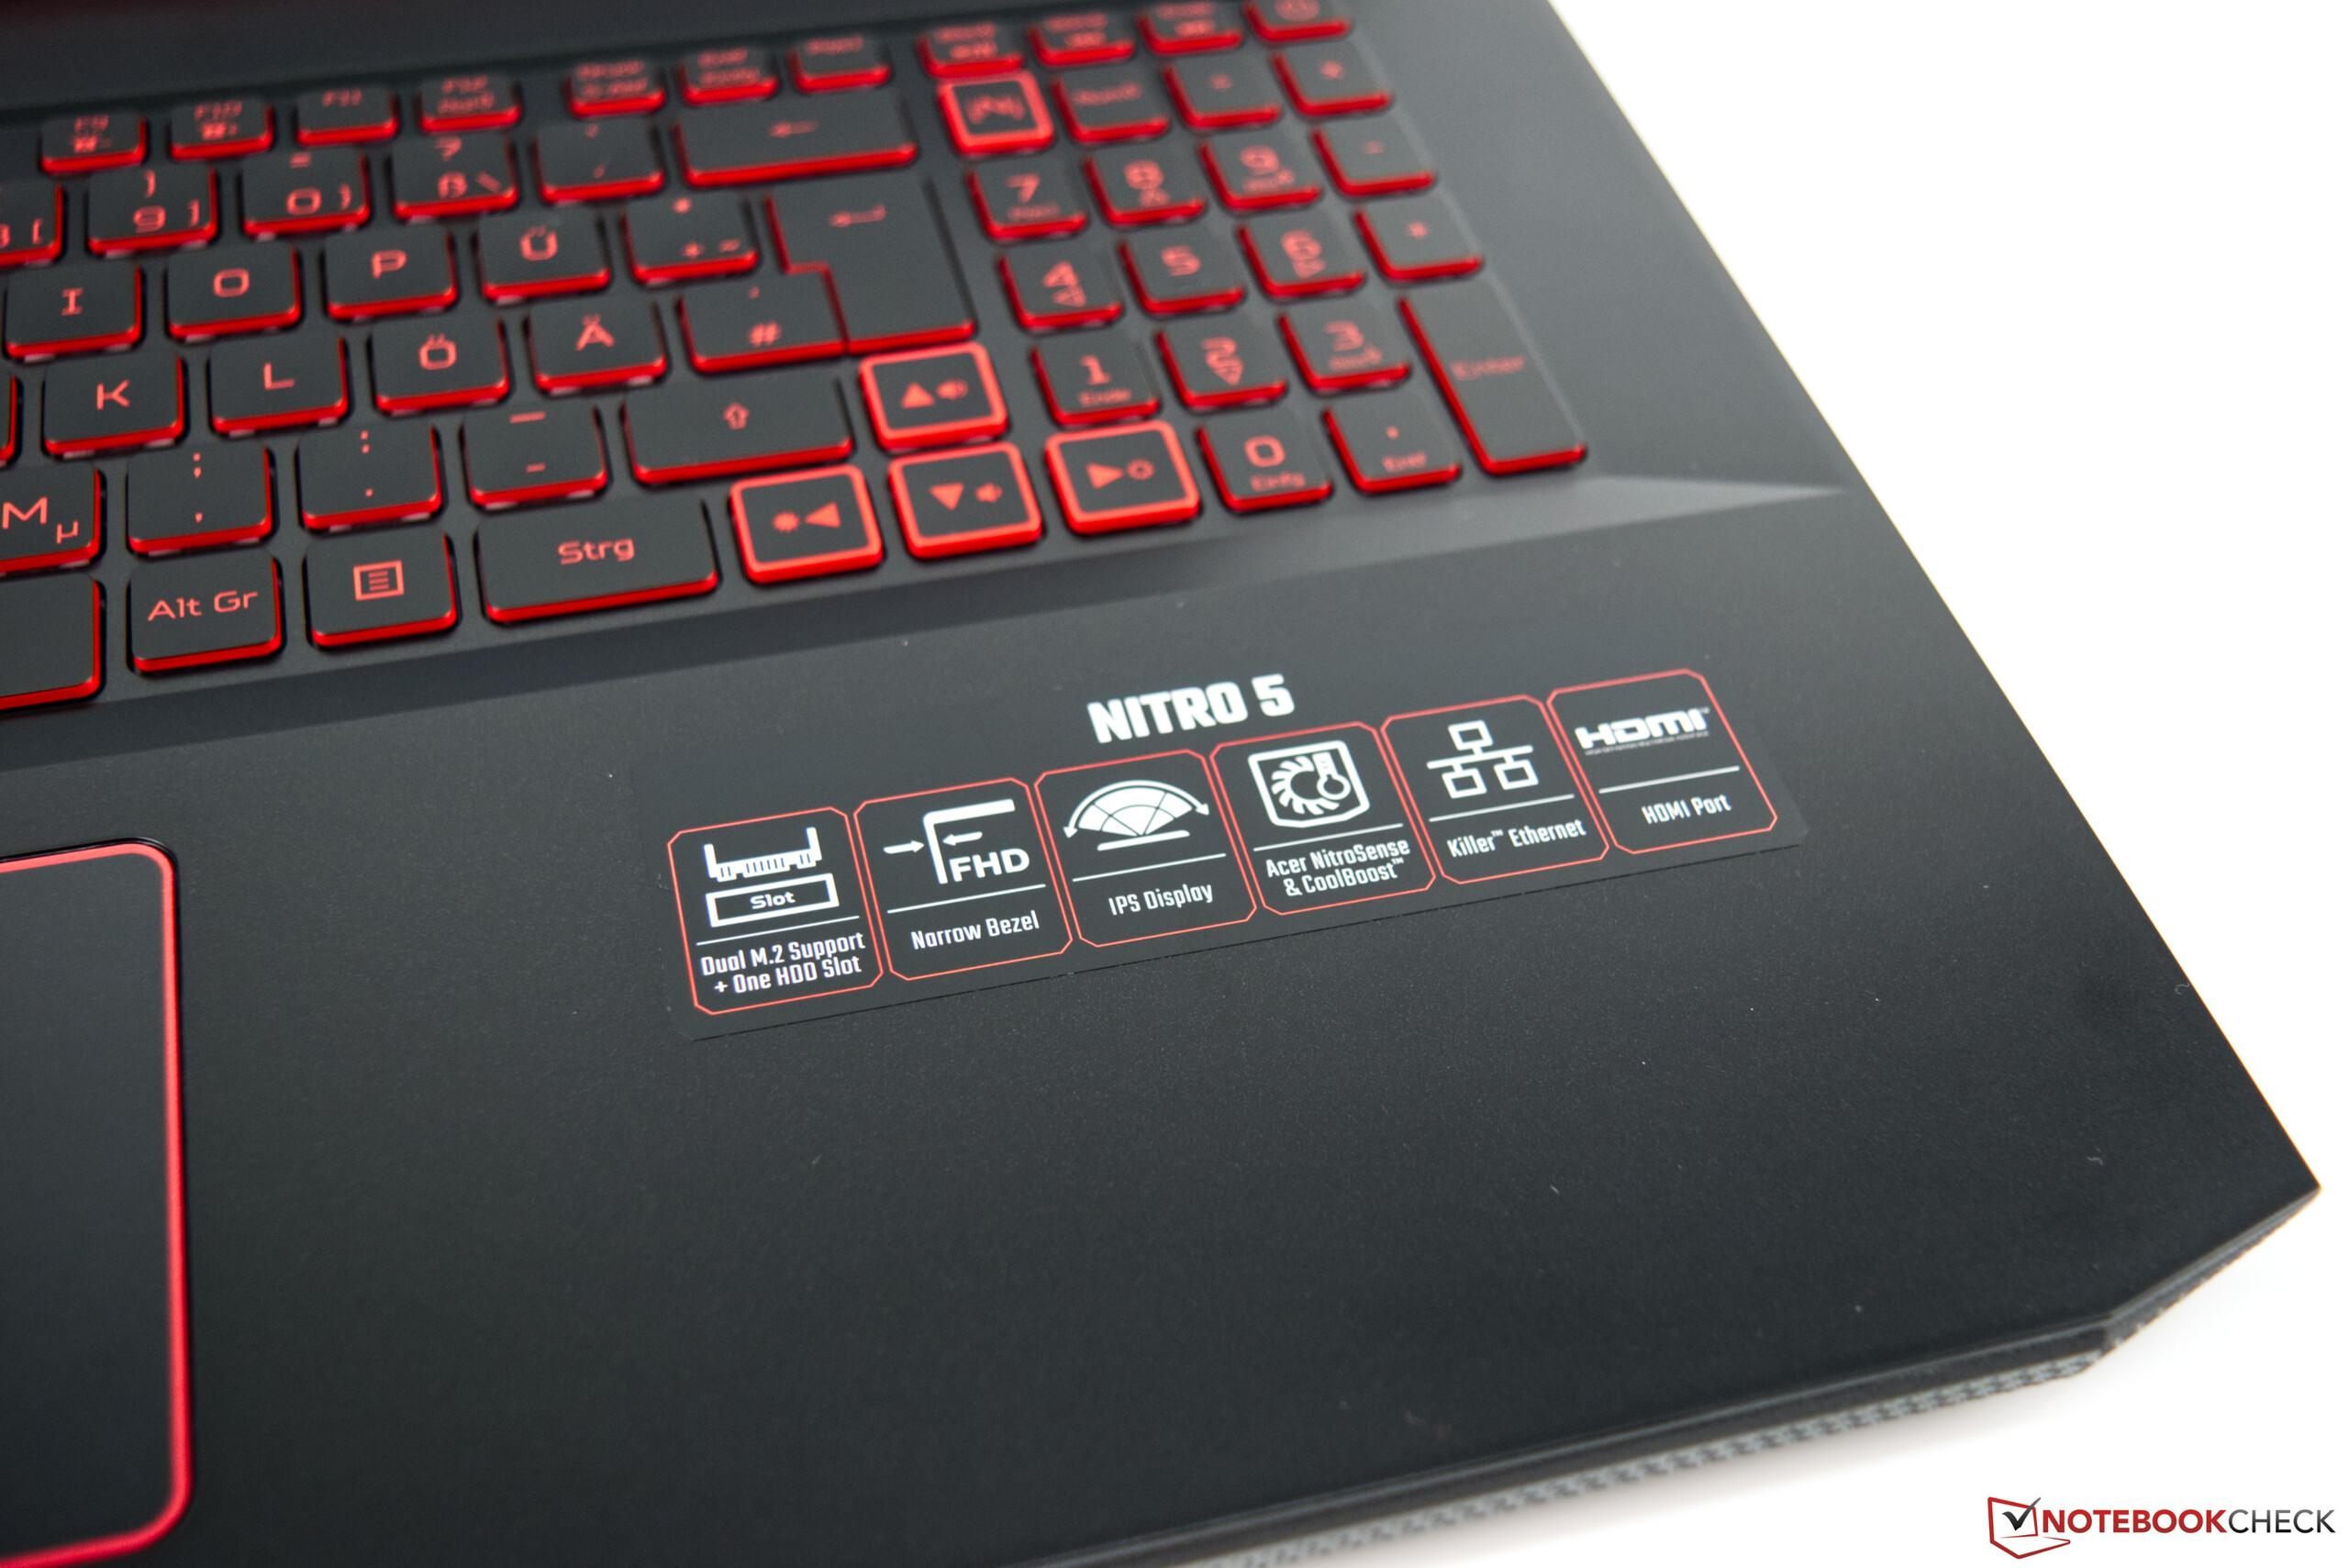
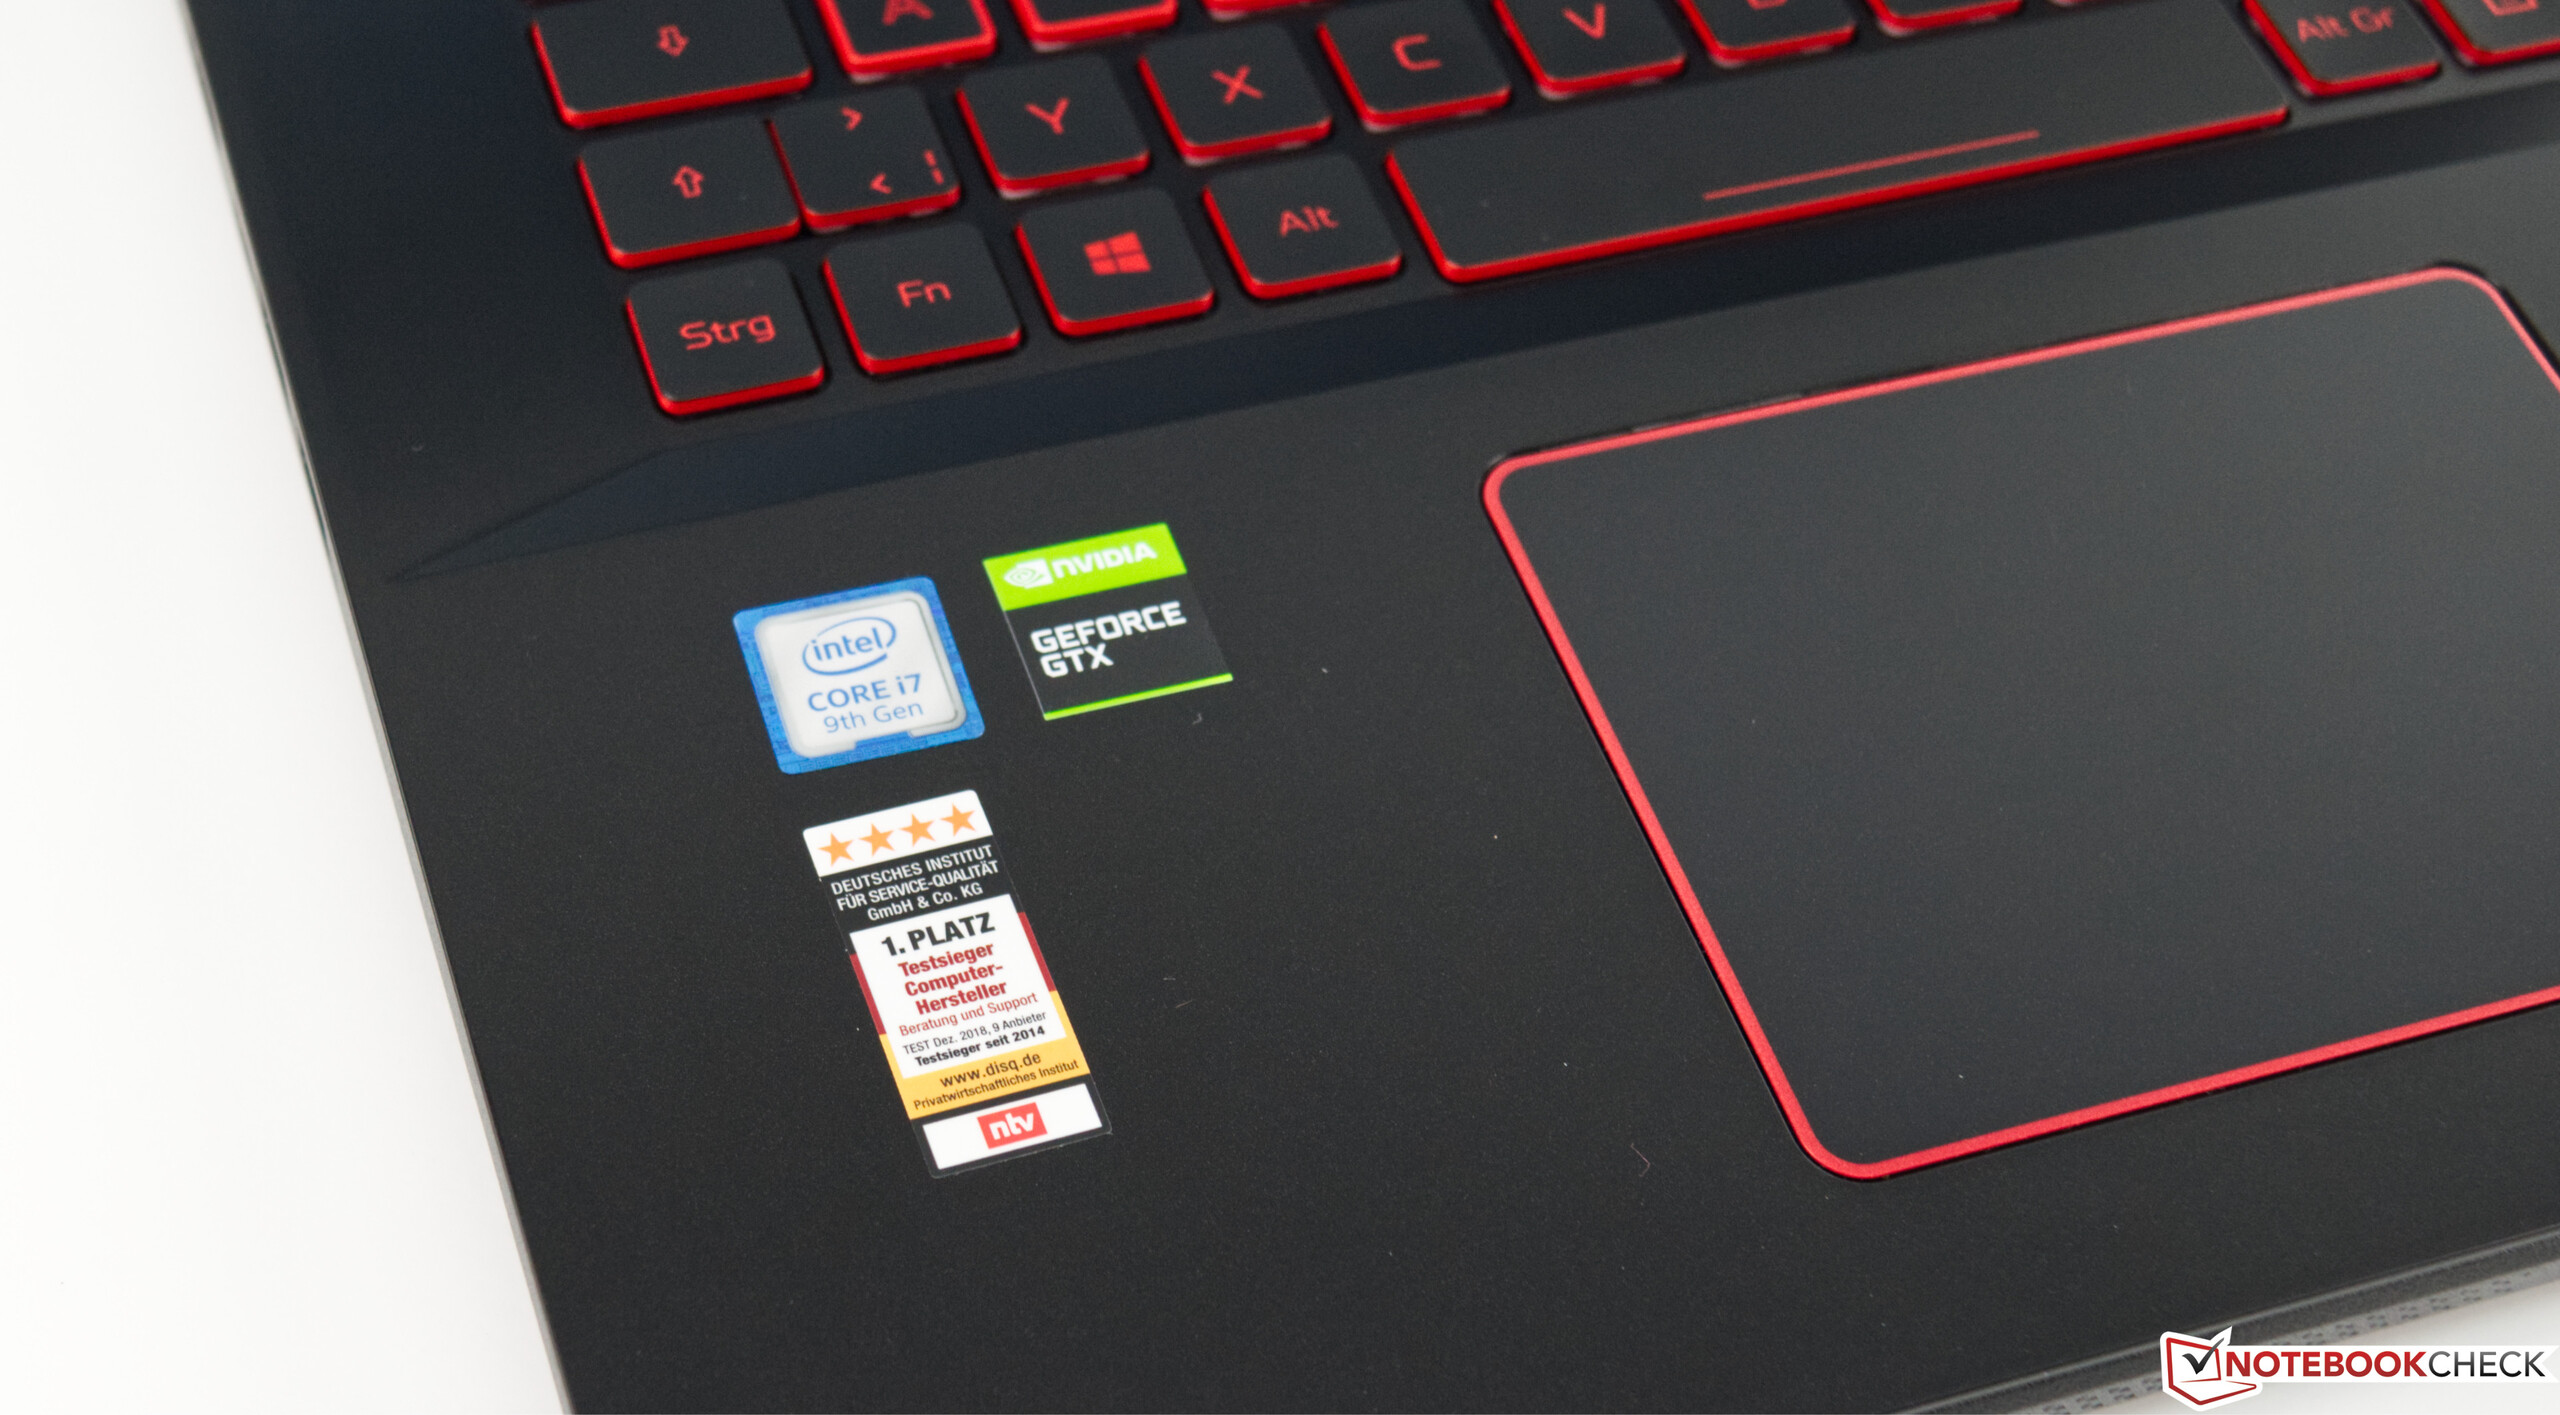
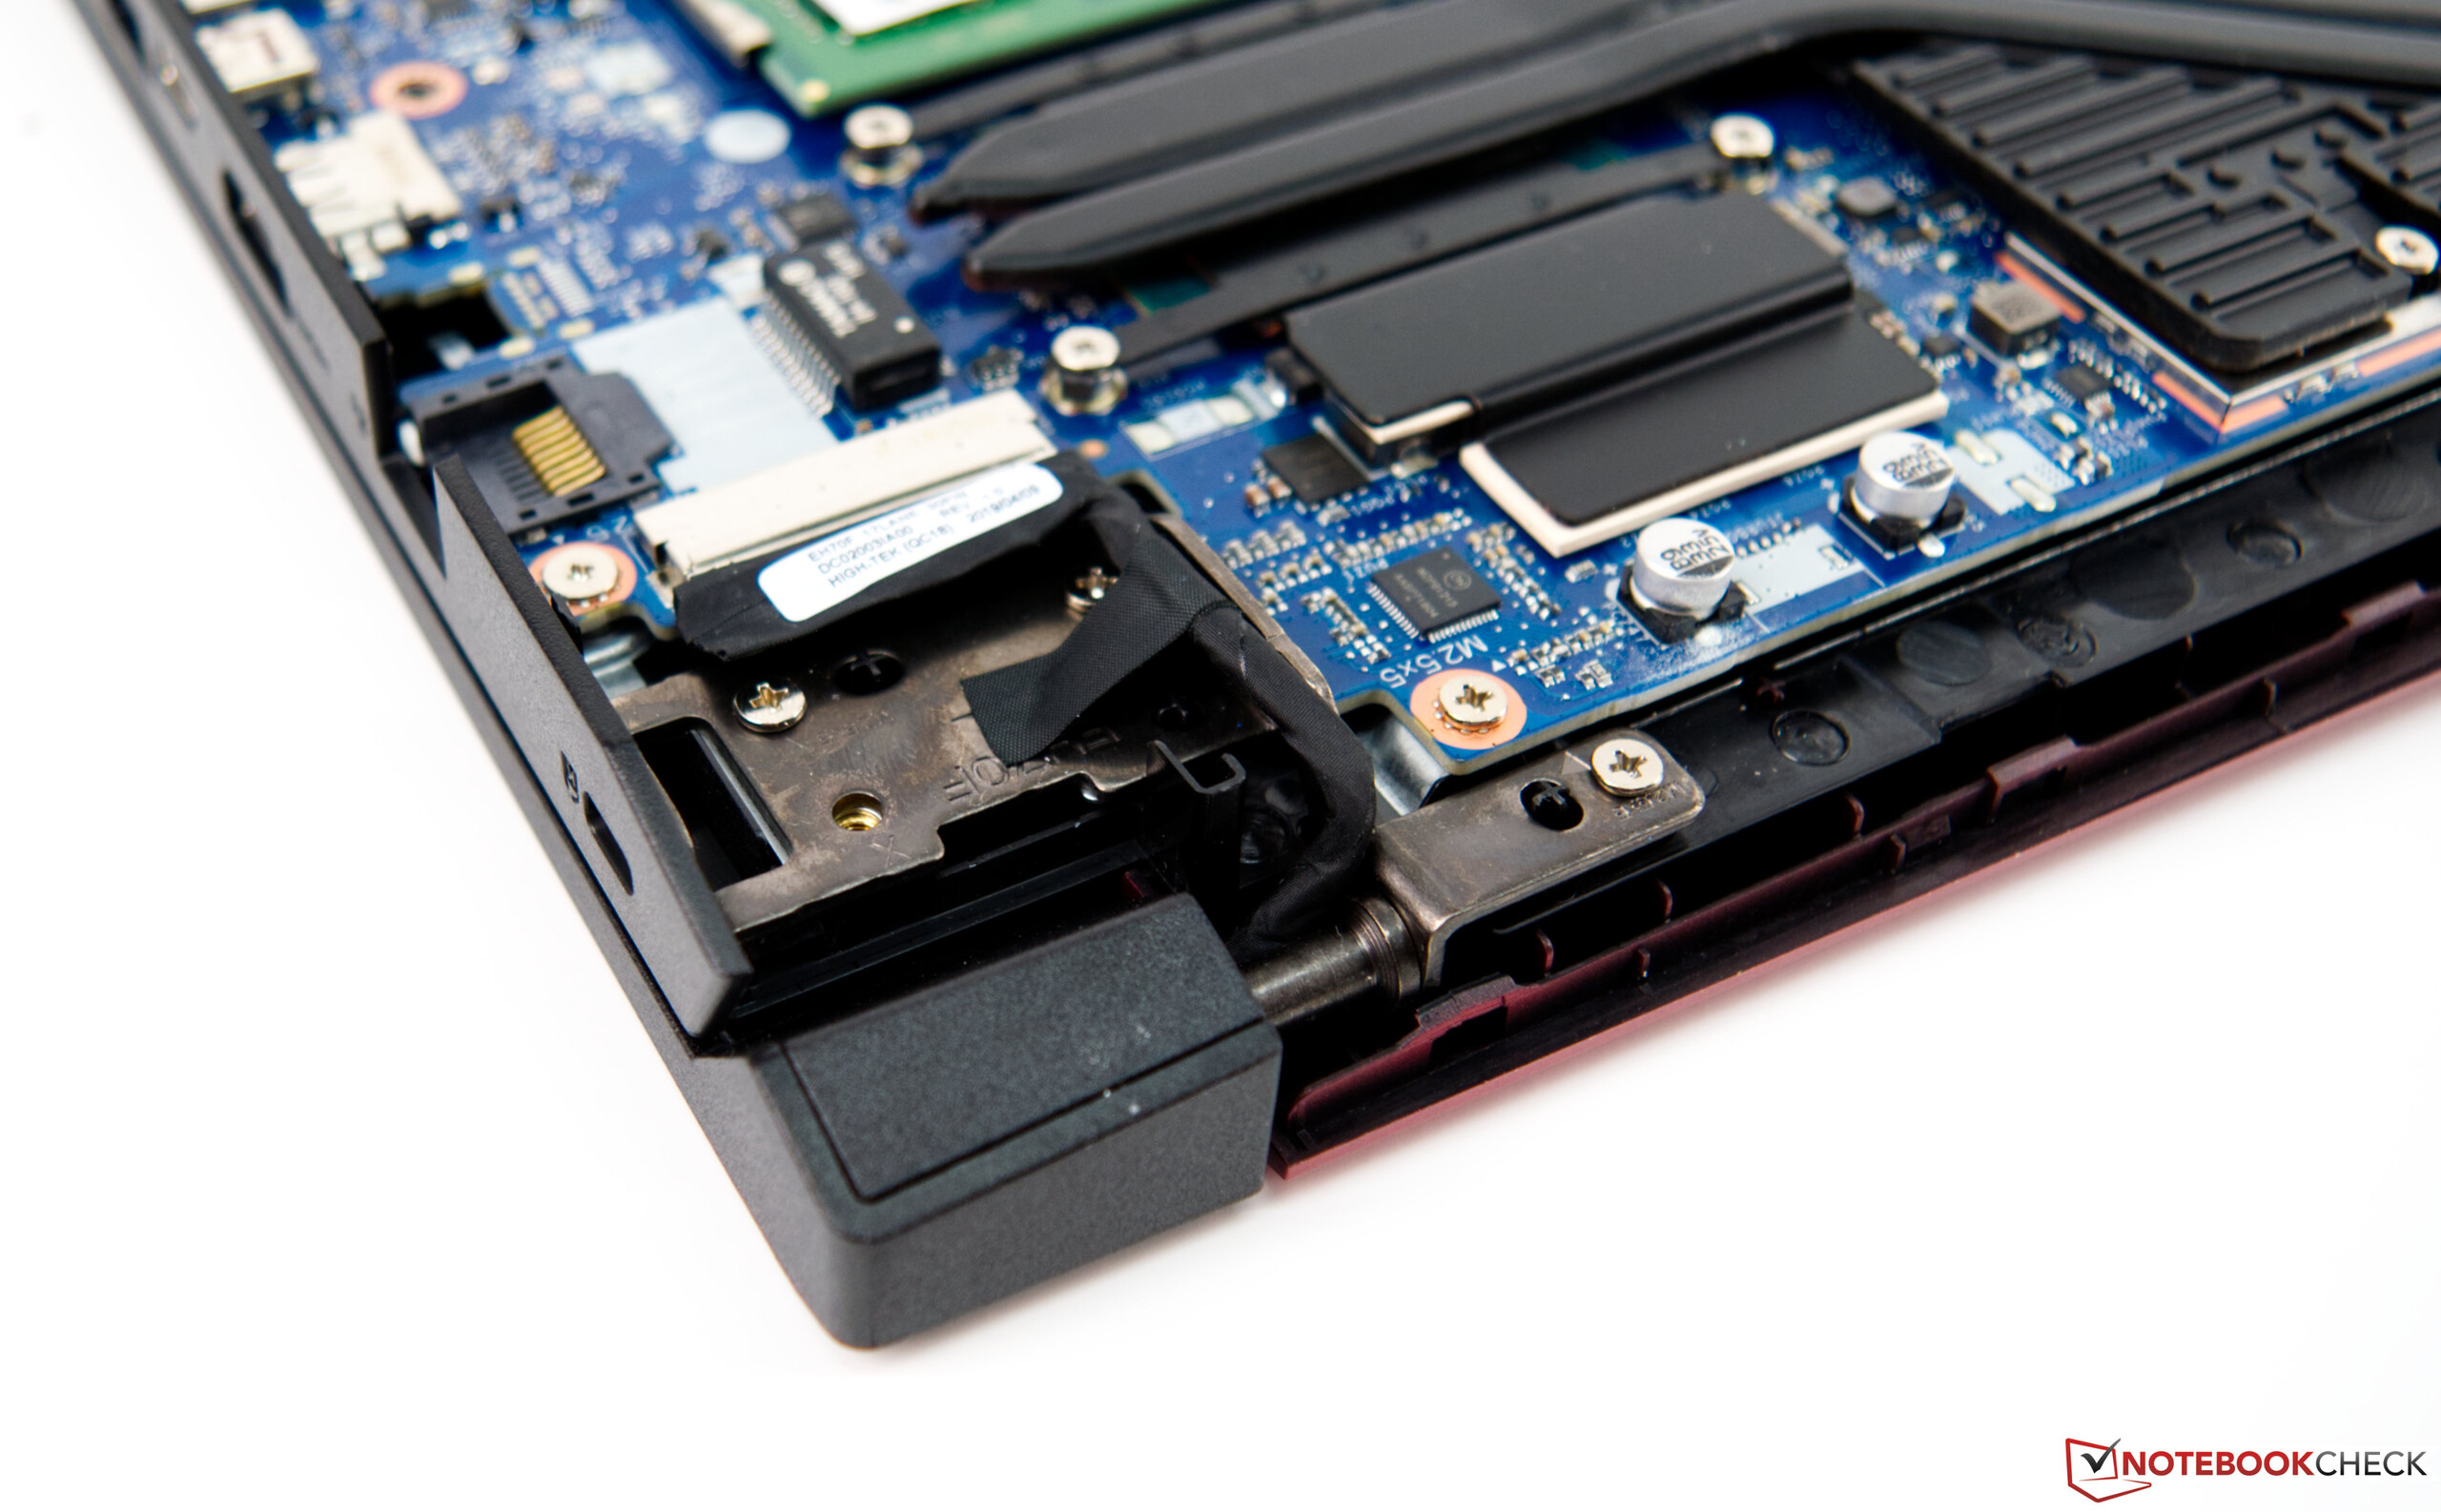
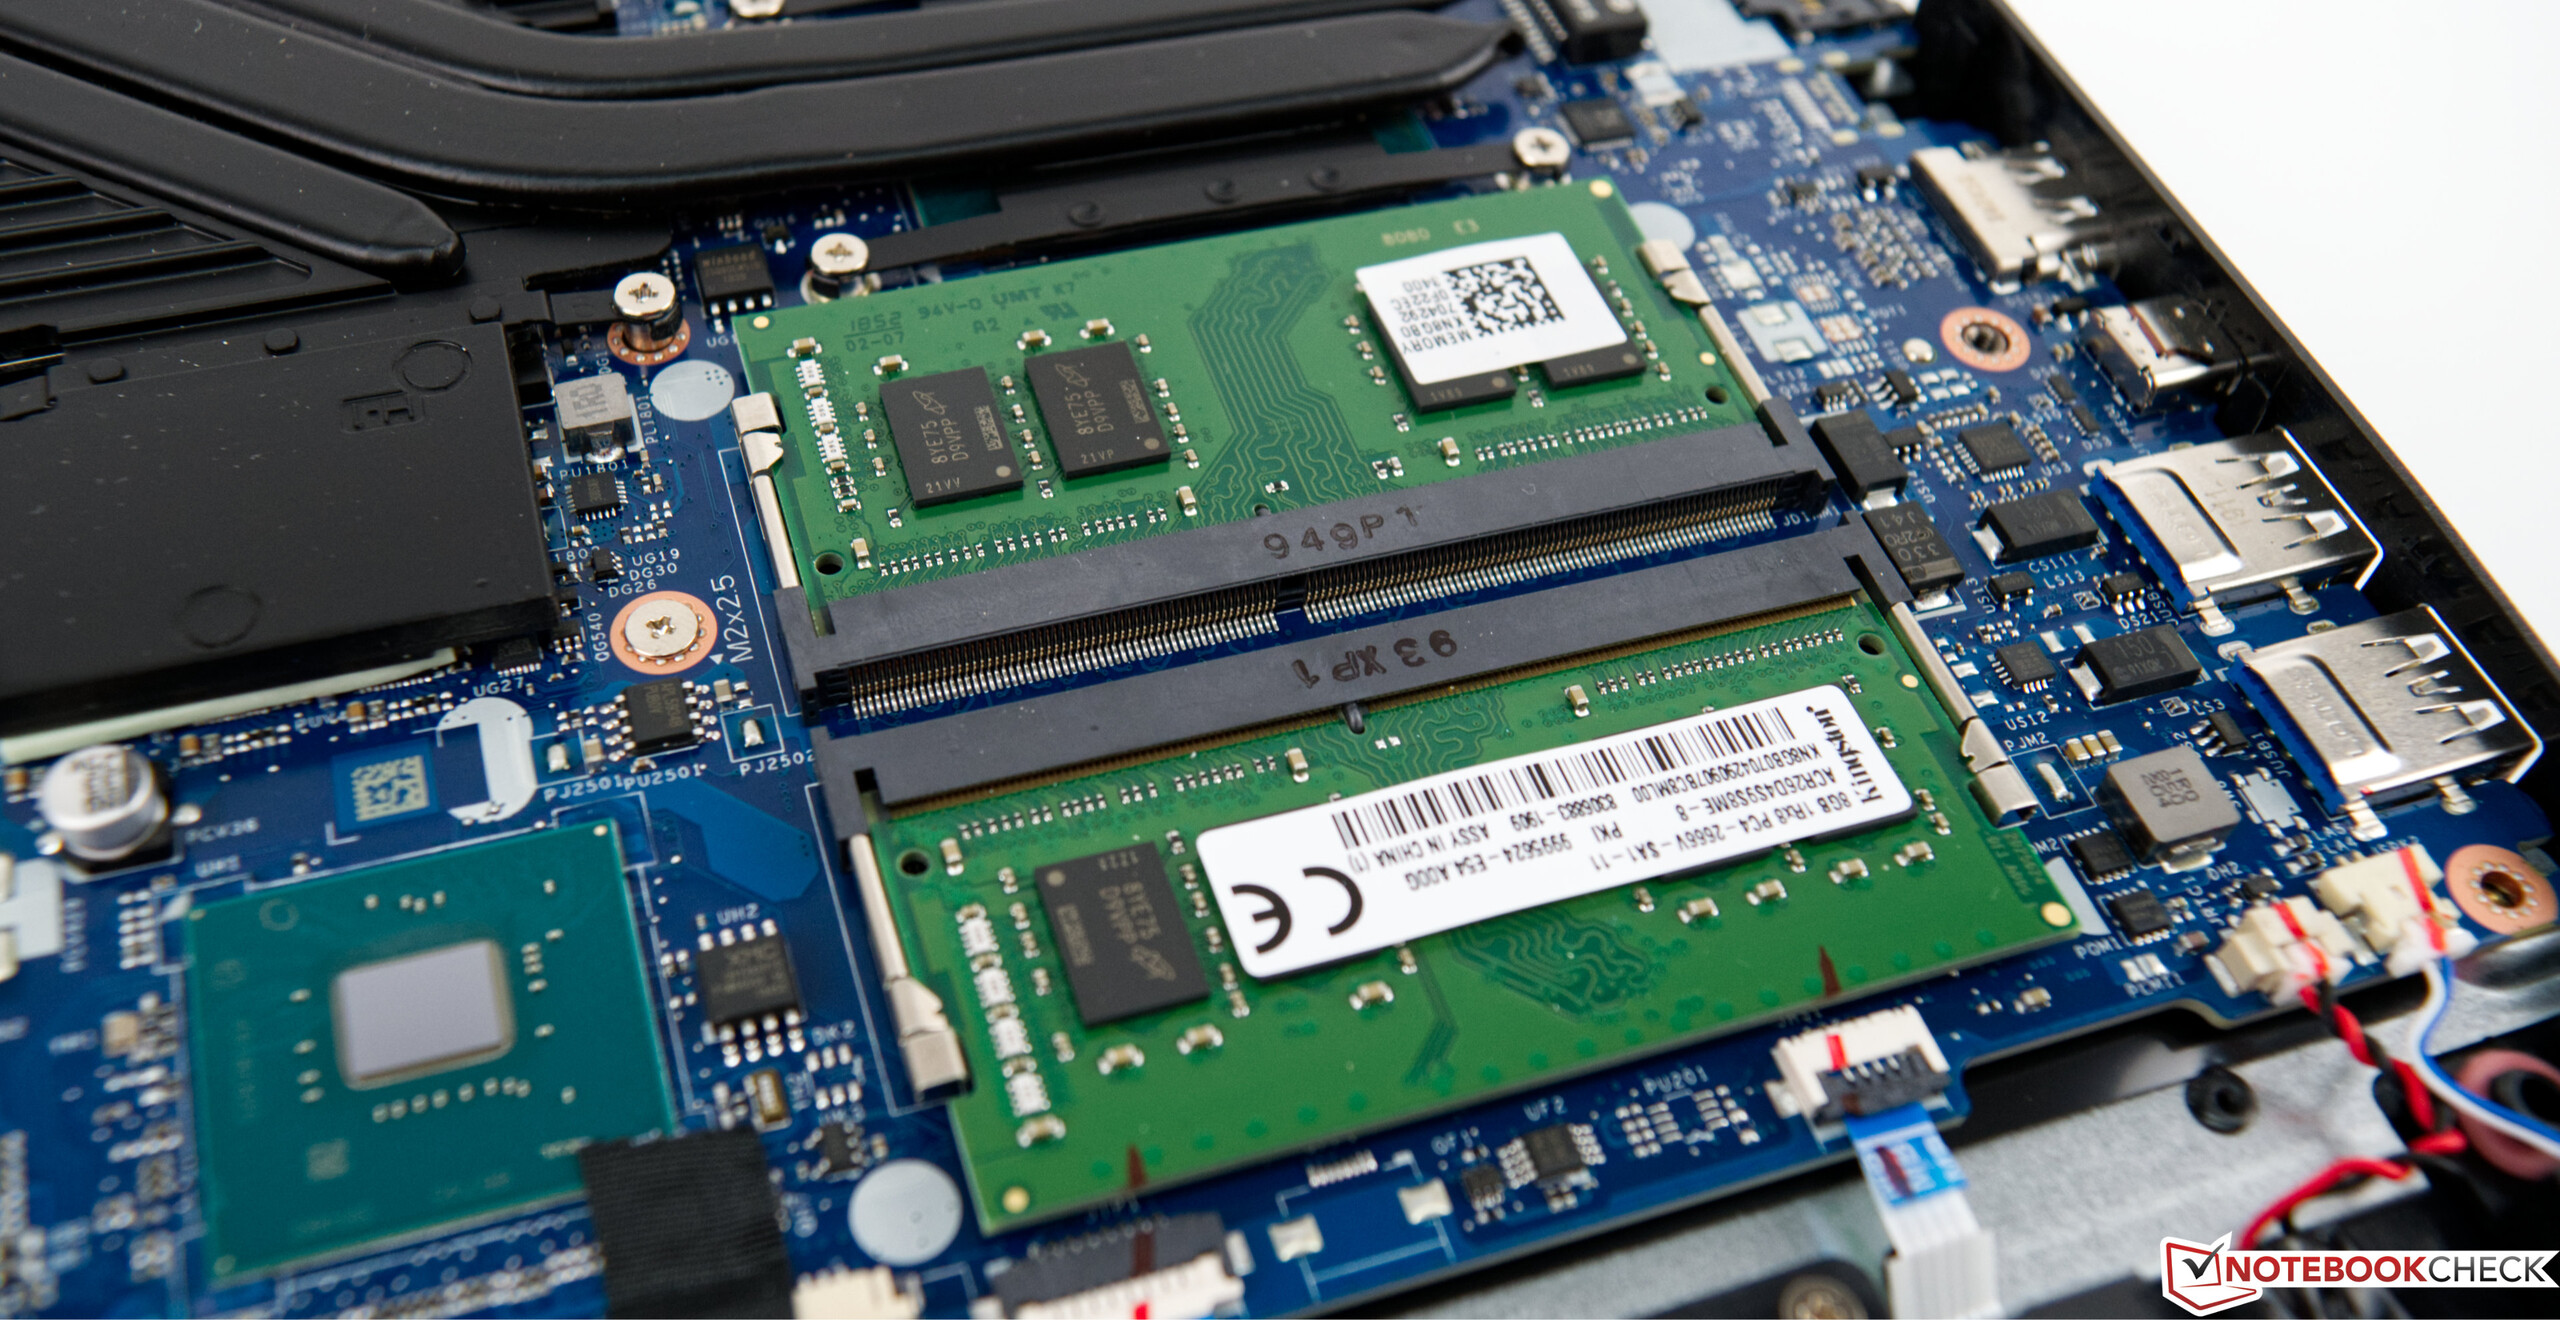
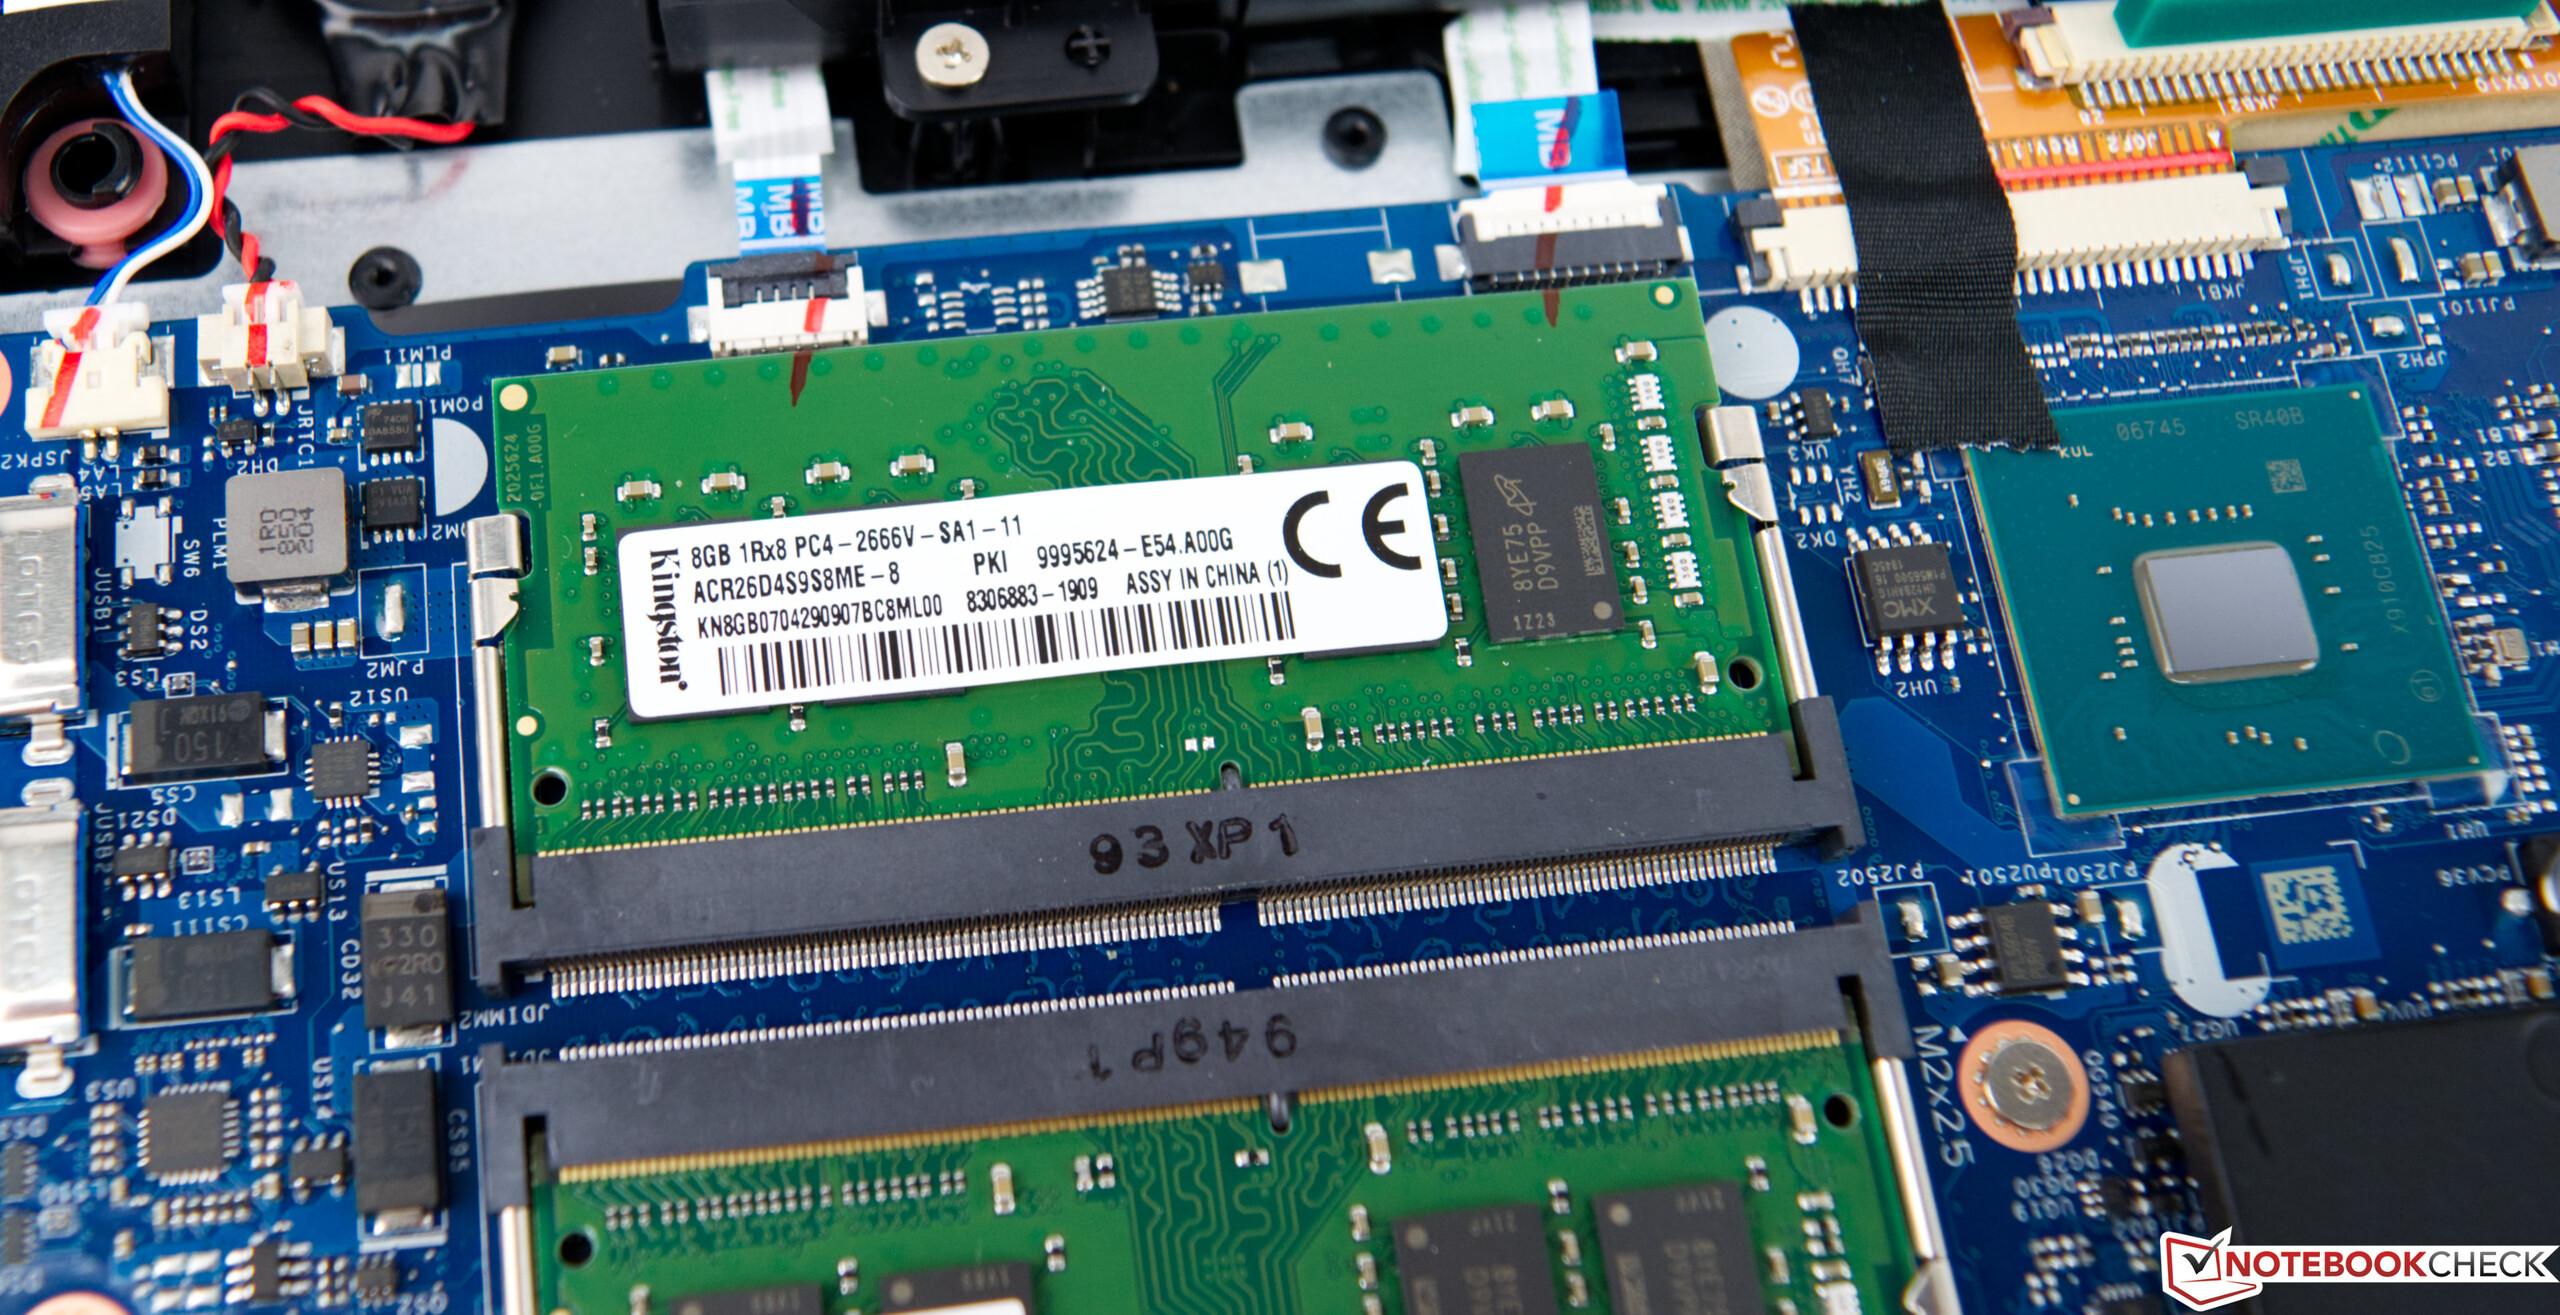
Acer Aspire Nitro 5 AN517 är en robust spellaptop på 17.3 tum. I teorin borde en Core i7-9750H och ett GeForce GTX 1660 Ti resultera i ett kraftfull system, särskilt med tanke på att det finns 16 GB DDR4 RAM med dubbla kanaler och 1.5 TB kombinerad lagring som kan säkra att systemet körs smidigt. Men tyvärr är 1080p-skärmen inte särskilt lämpad för en spellaptop: responstiderna och DeltaE-avvikelserna gjorde oss besvikna i våra tester.
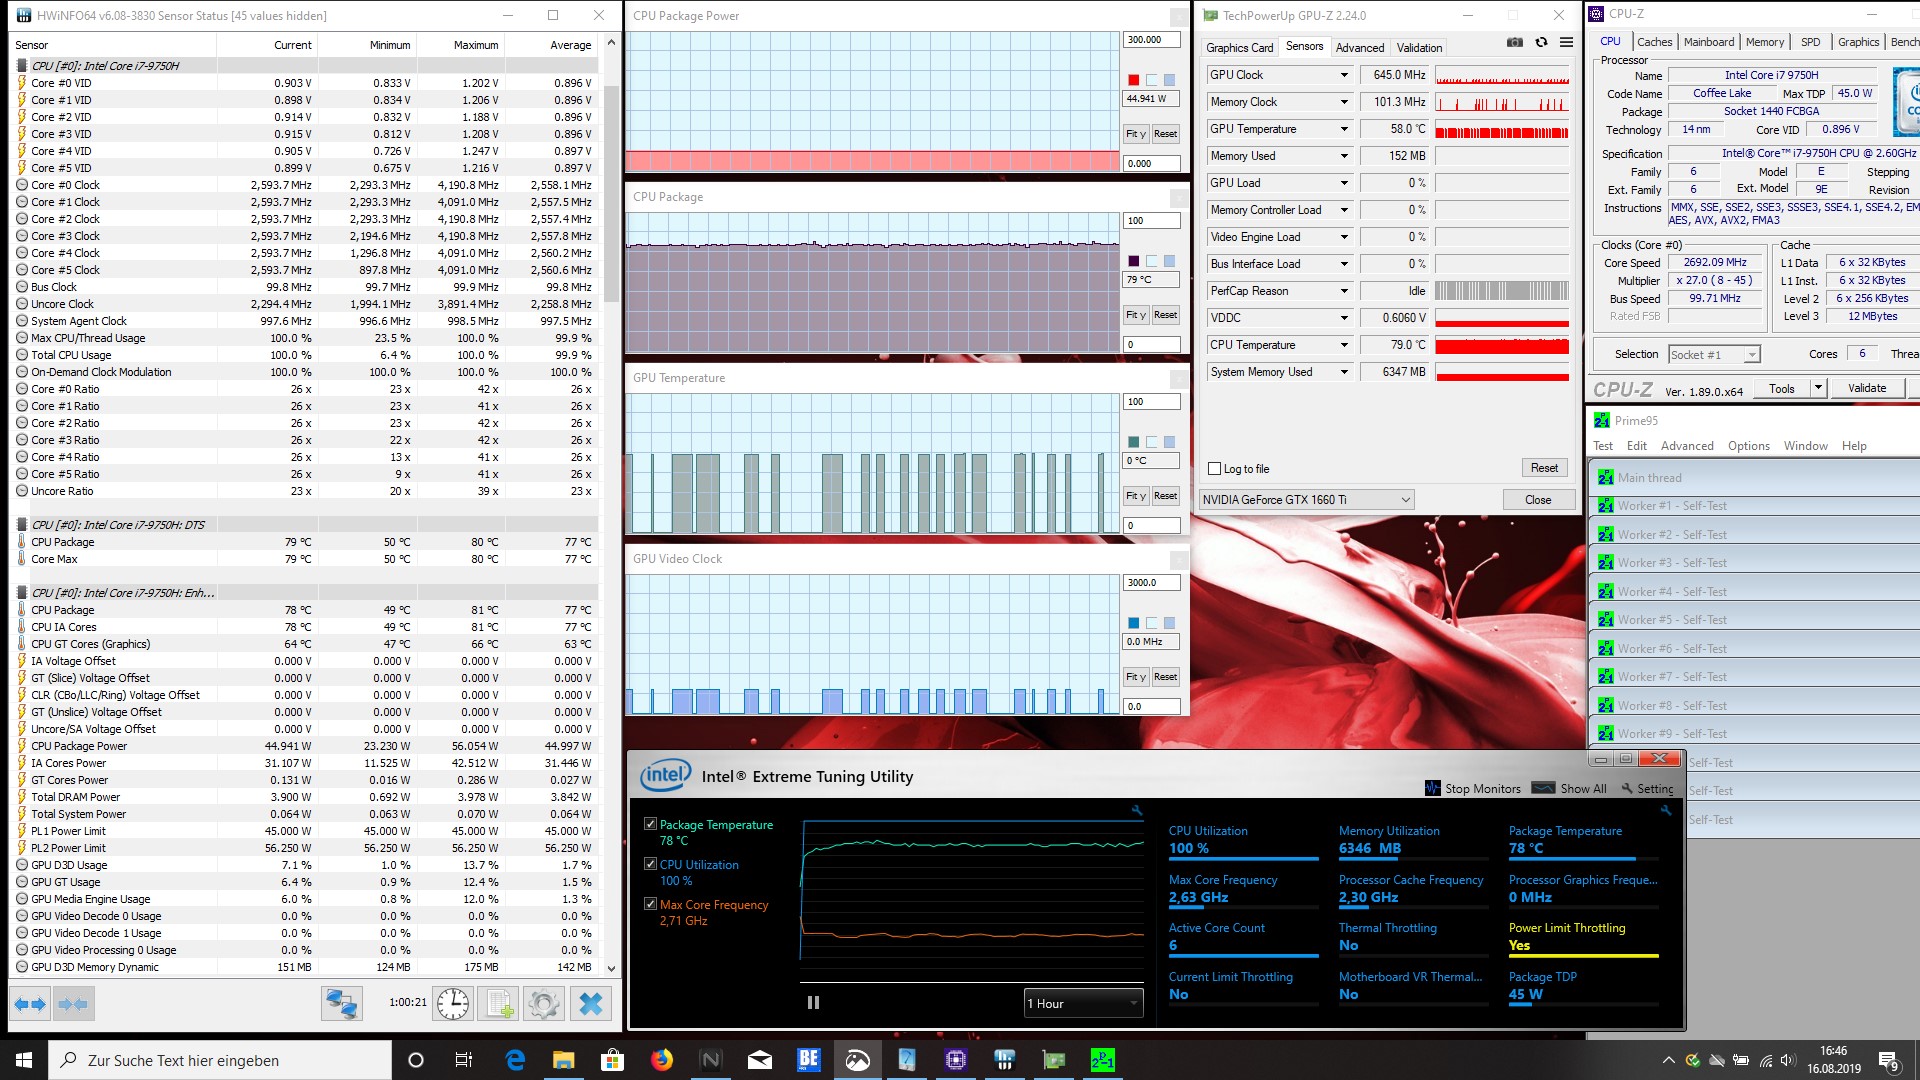
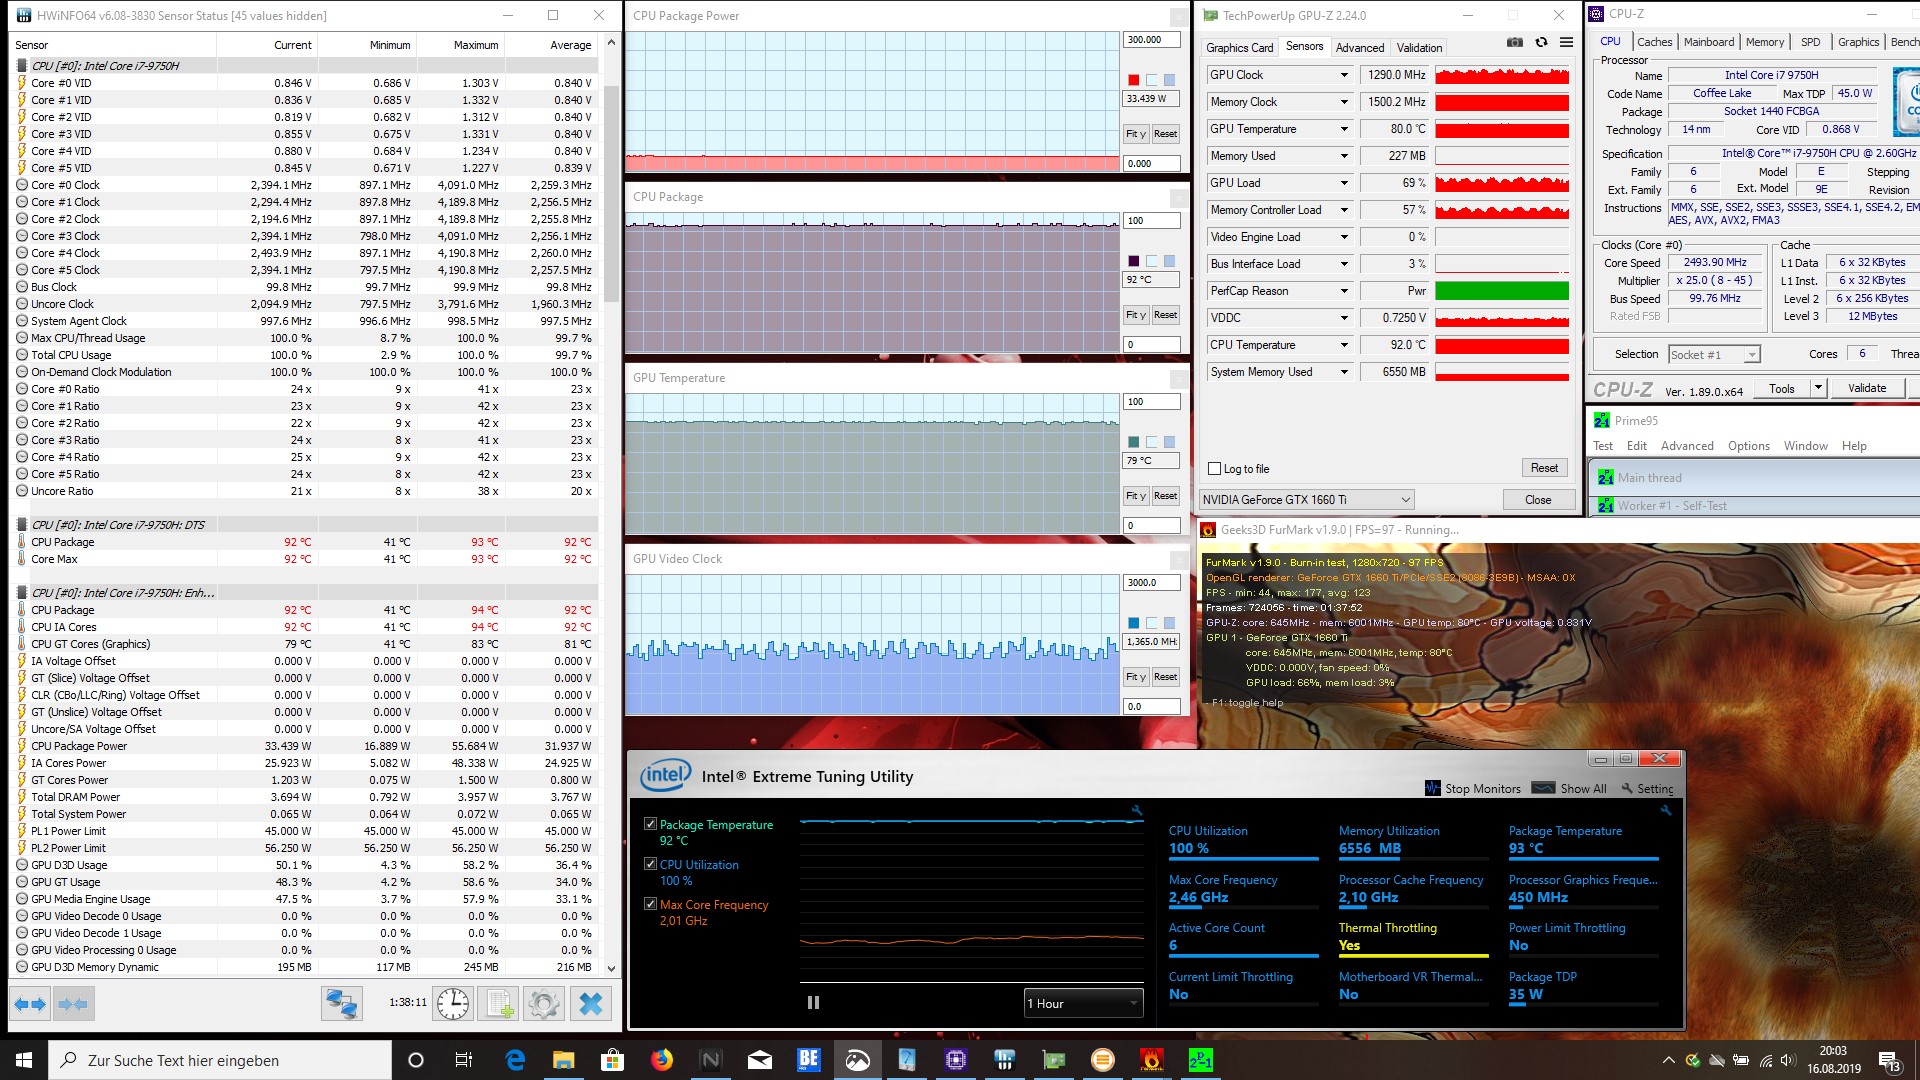
Som vi hade väntat oss är Nitro 5 tillräckligt kraftfull för att kunna köra alla moderna AAA-spel. Men det gäller bara om enheten är ansluten till elnätet, för både CPU:n och GPU:n stryps kraftigt när datorn körs på batteri. Nitro 5 blir i praktiken en kontorsenhet när den körs på batteri, men det gäller förvisso de flesta moderna bärbara speldatorer.
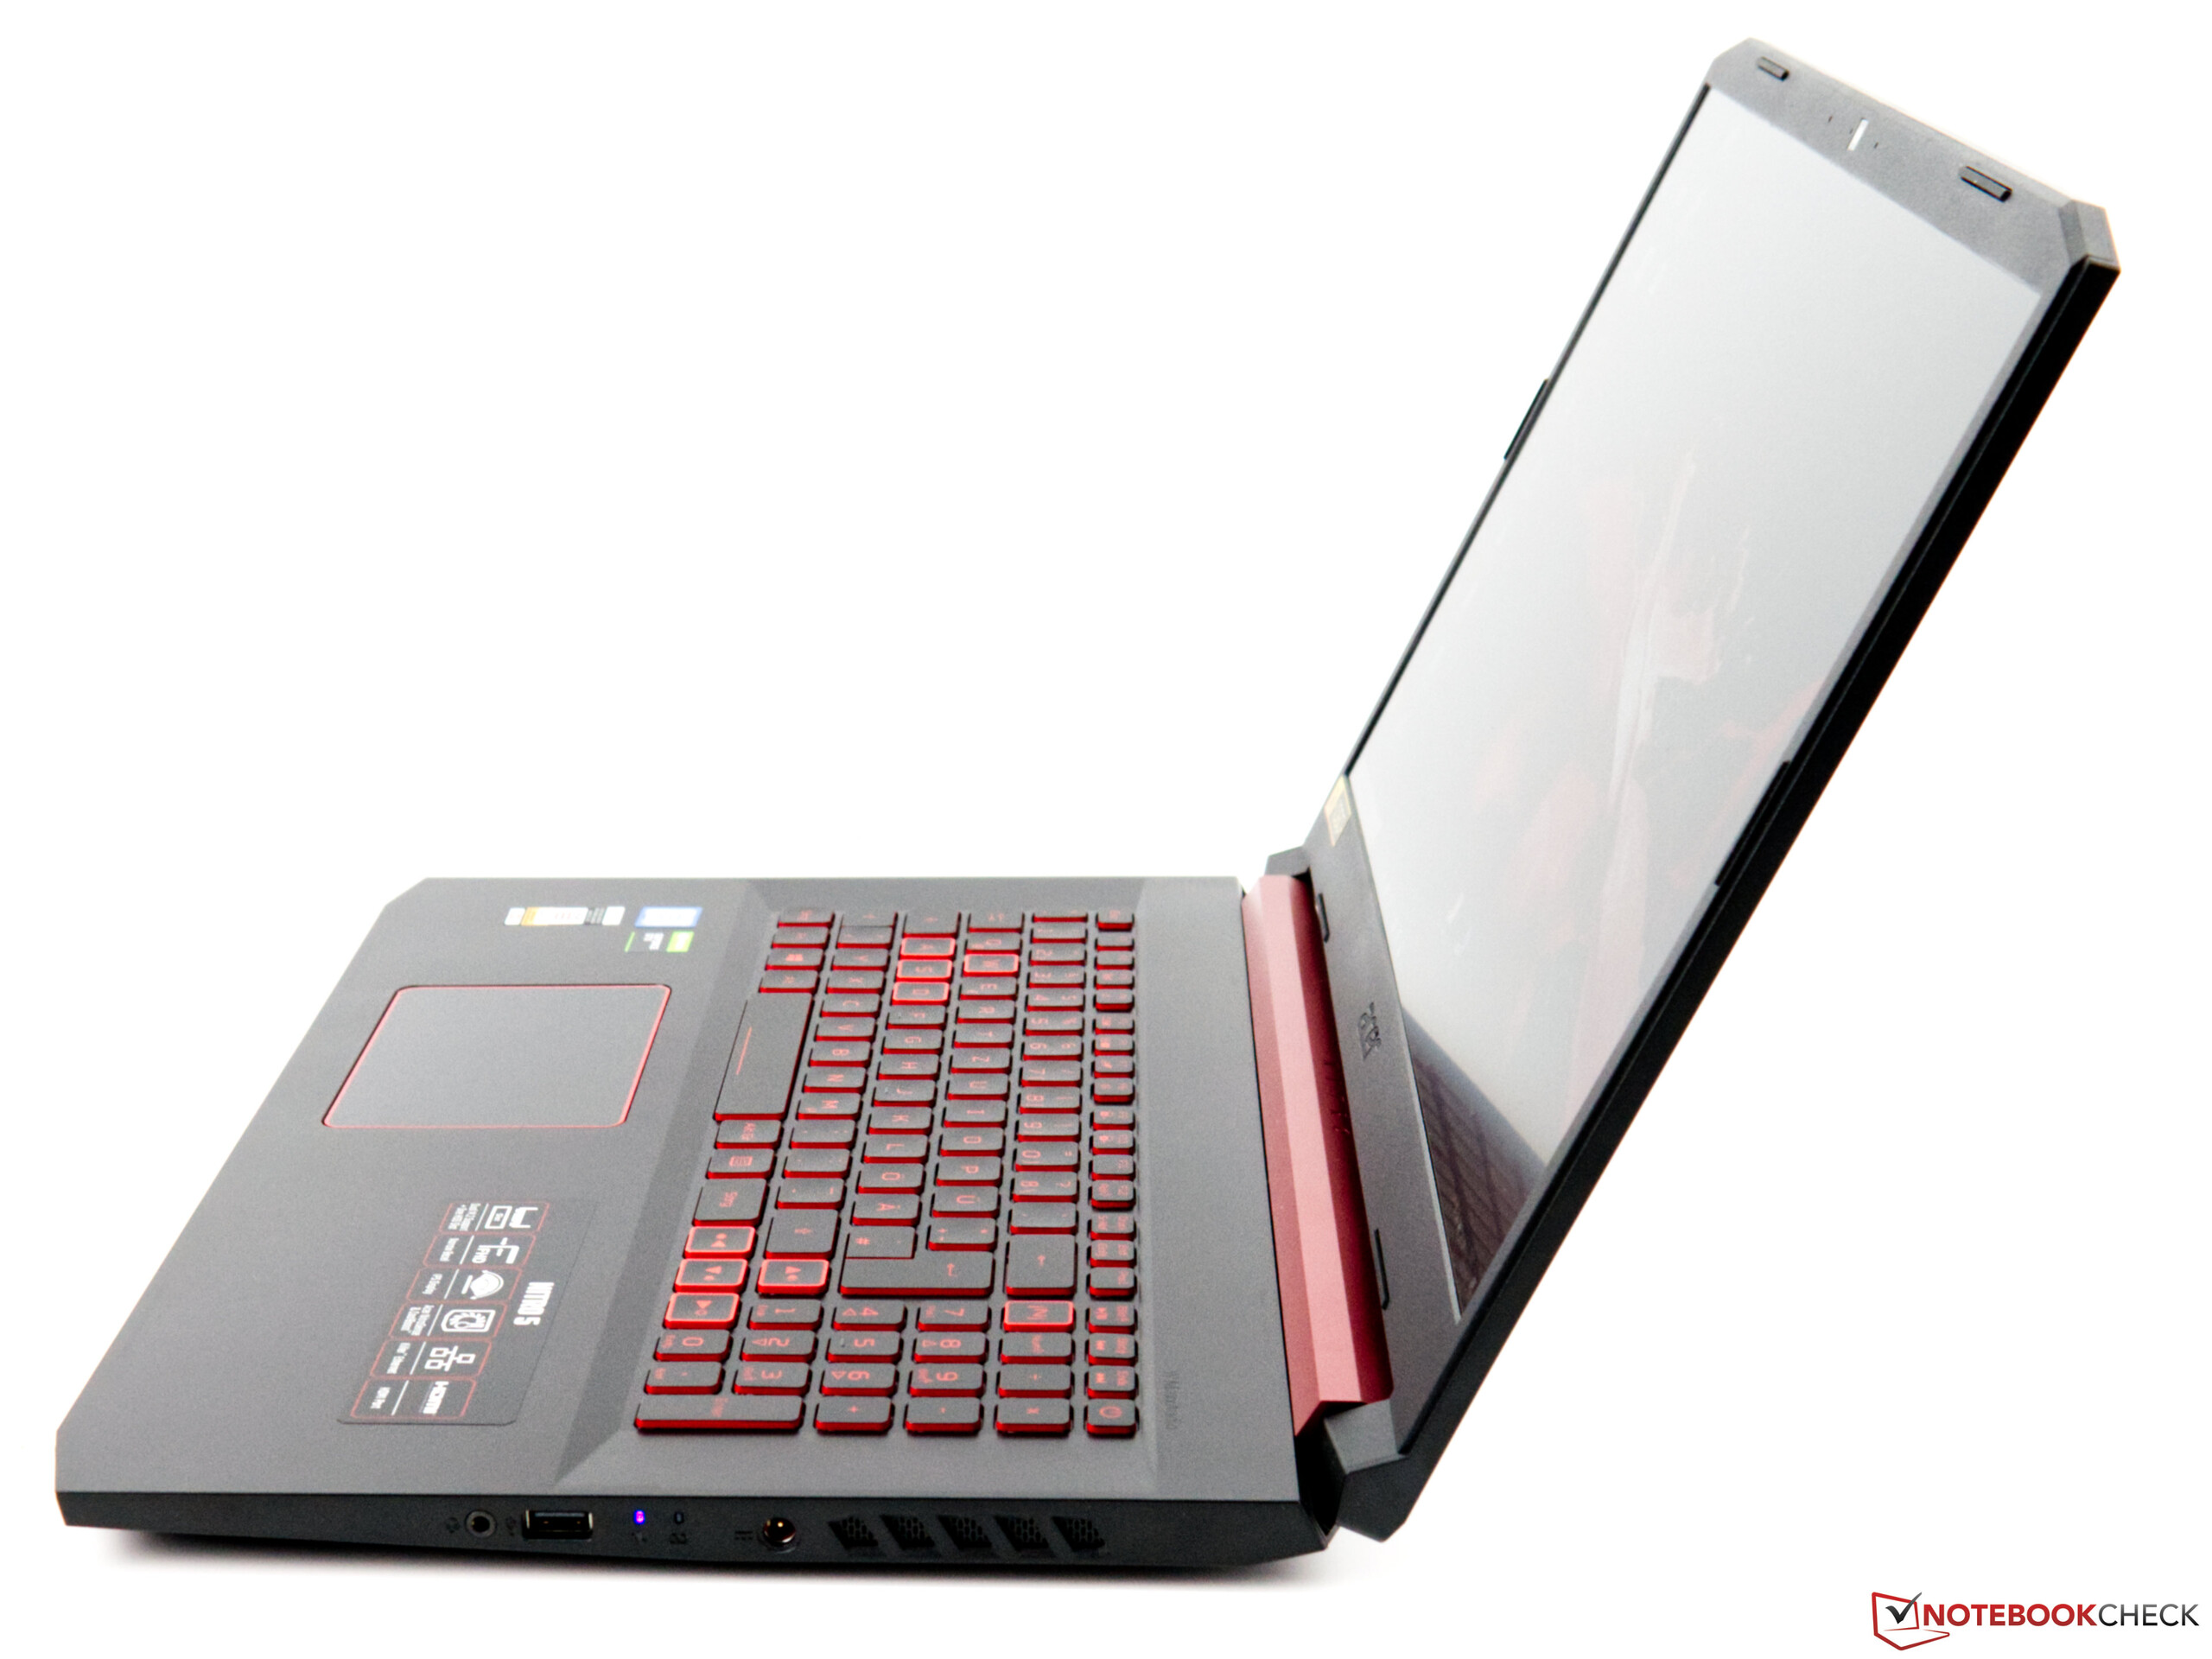
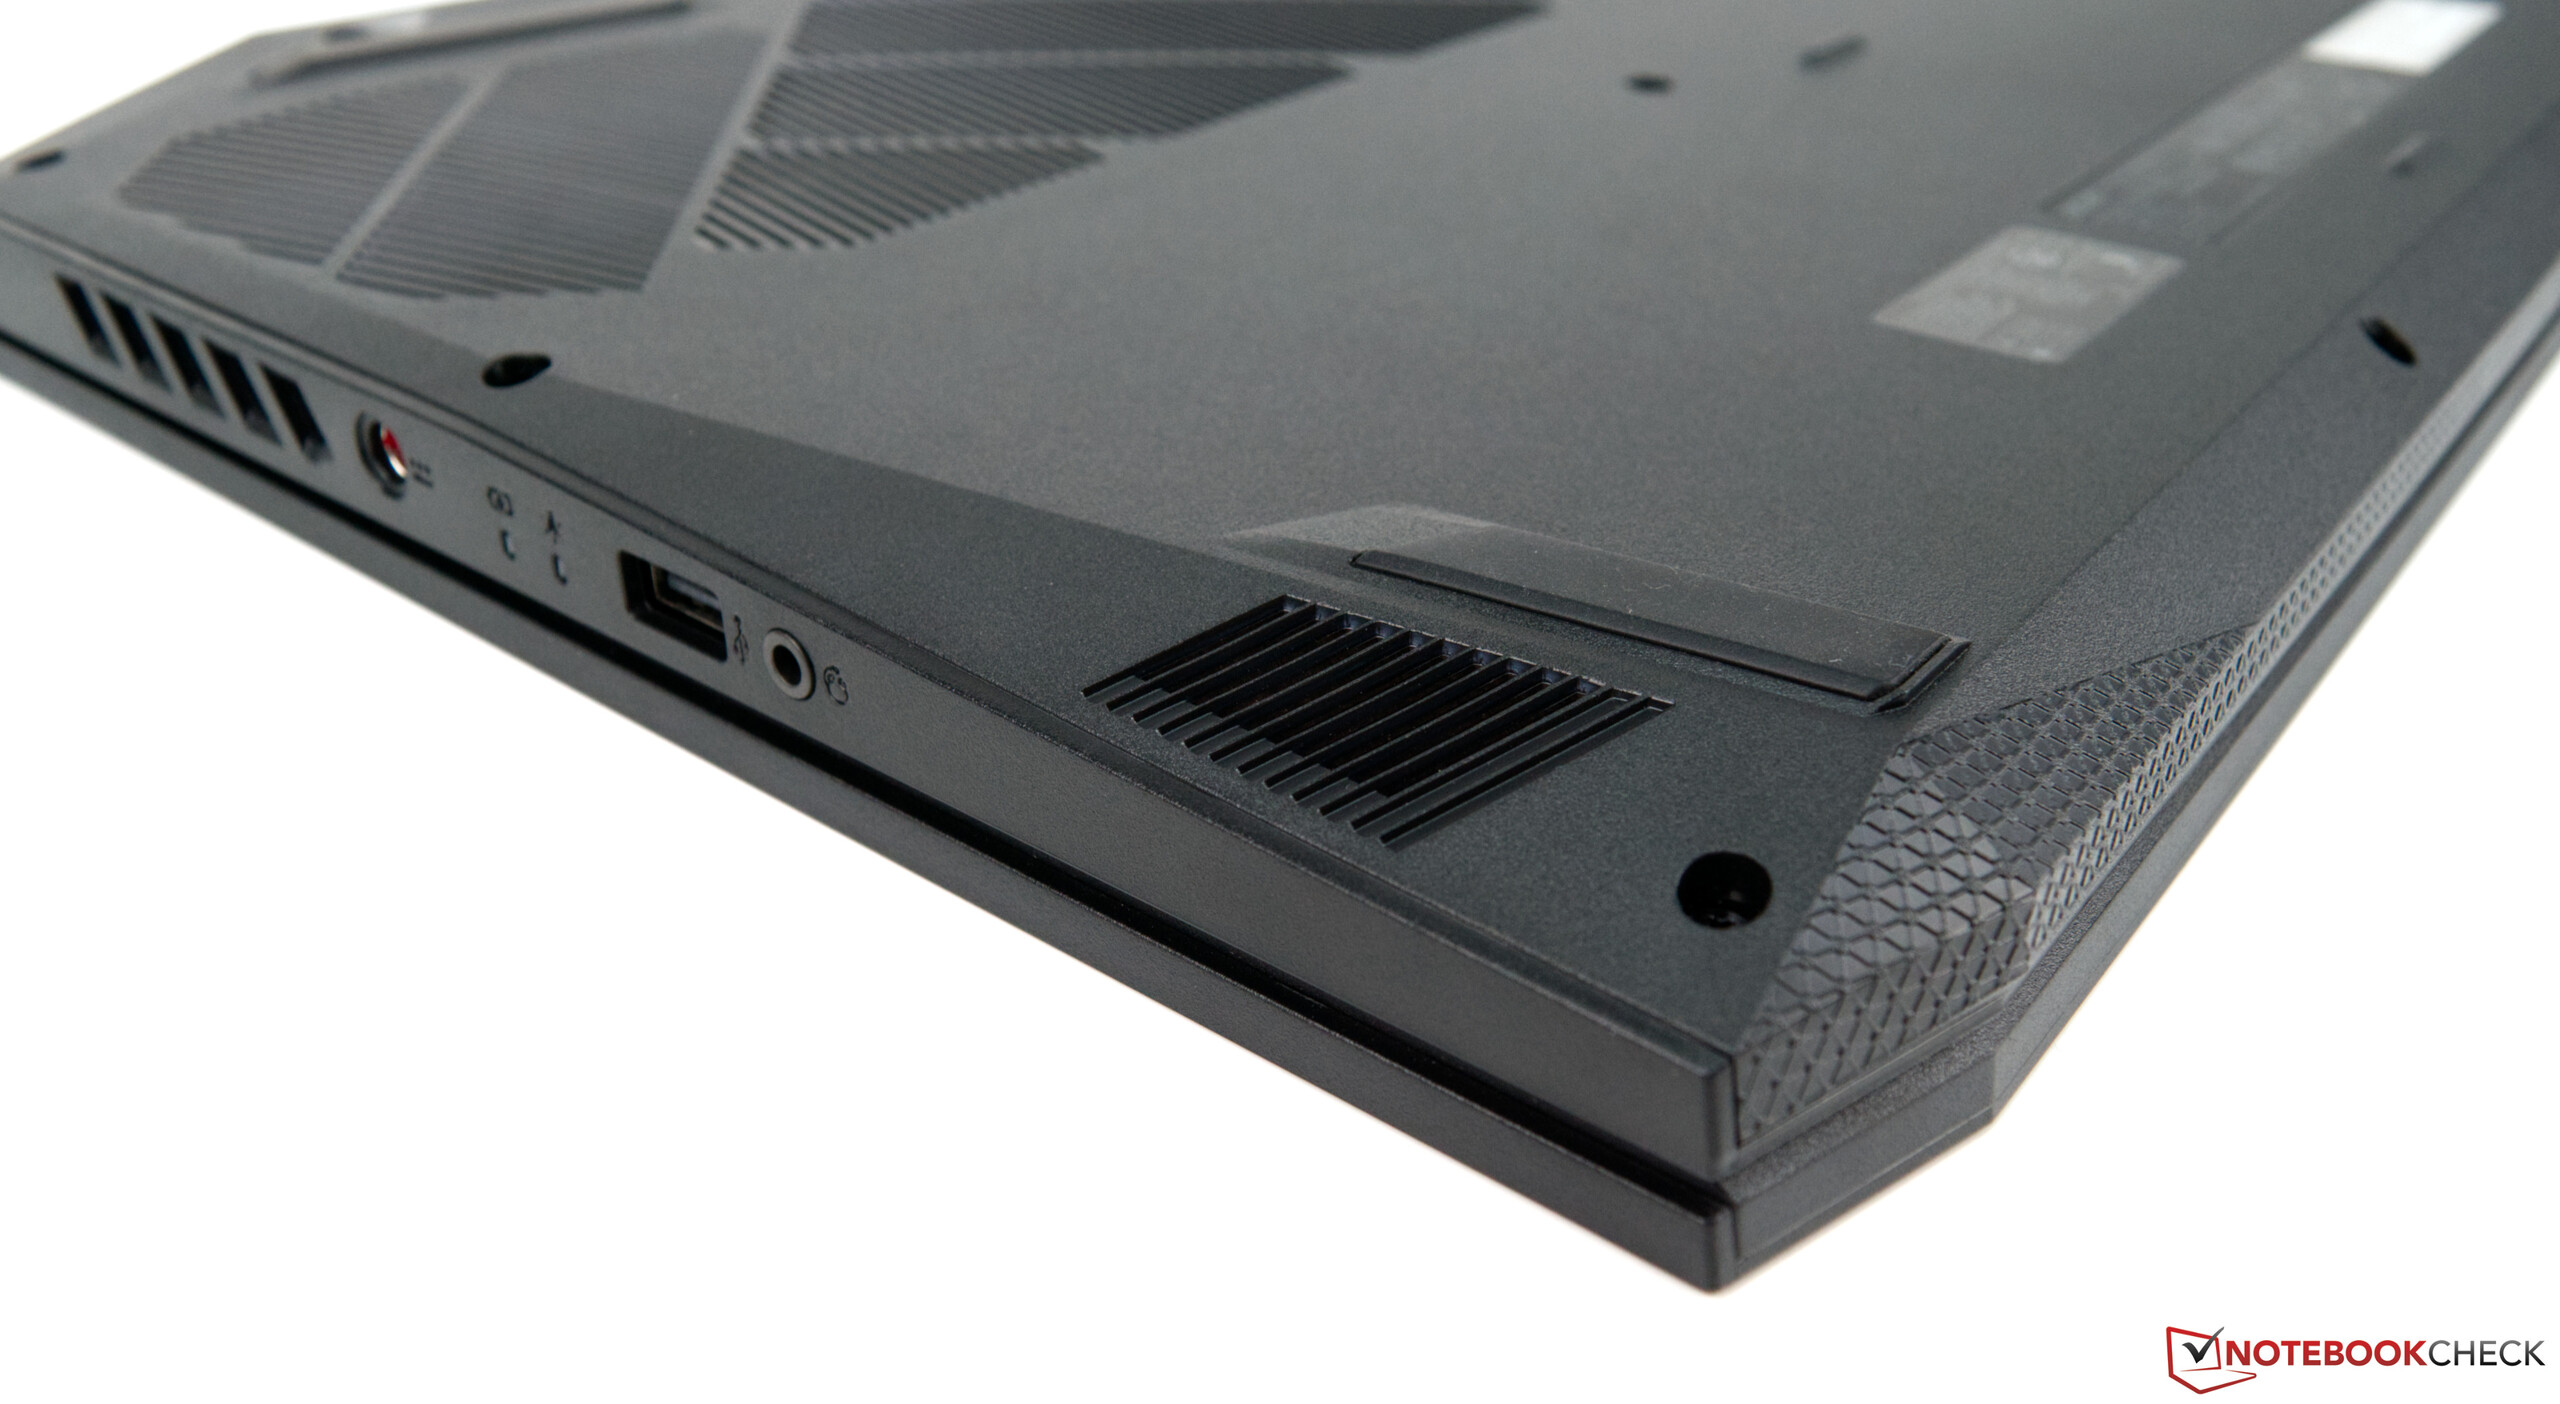
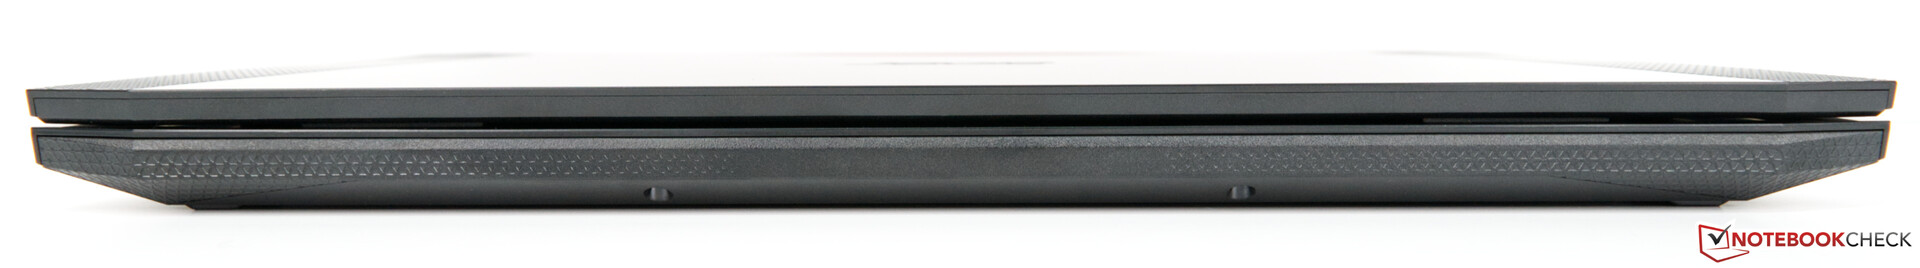
Designen, som i huvudsak är gjord i plast, kommer resultera i delade åsikter trots att datorn är robust och välbyggd. Nitro 5 ser helt enkel billigare ut än sina konkurrenter med höljen i metall. Men en plastdesign kan vara värd att kompromissa med i utbyte mot skaplig spelprestanda.
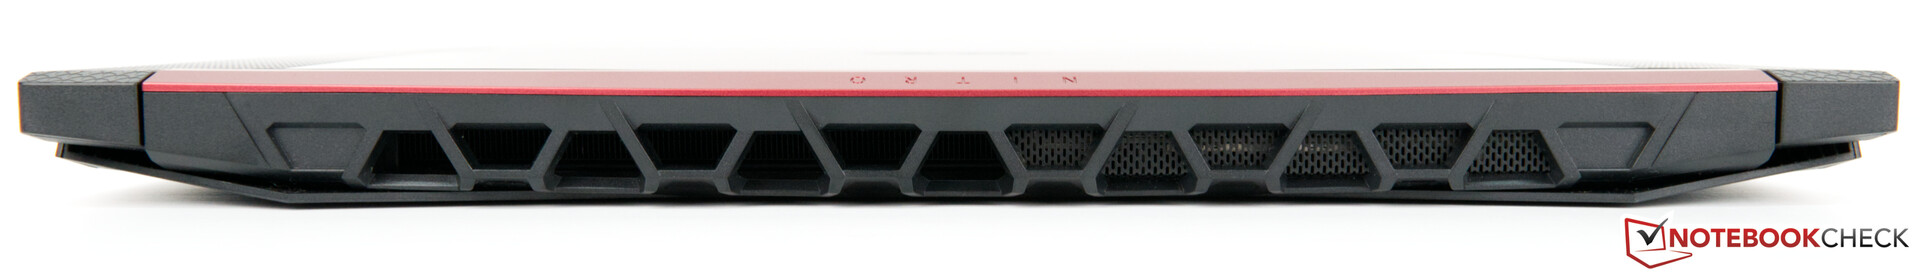
Något som får Nitro 5 att stå ut från mängden är dess imponerande låga energiförbrukning, då den vid tomgång snarare drar ström som en ultrabook än som en spellaptop. På grund av det får vår recensionsenhet också ut utmärkt batteritid ur sitt batteri på 57 Wh, vilket få jämförbara enheter kommer nära.
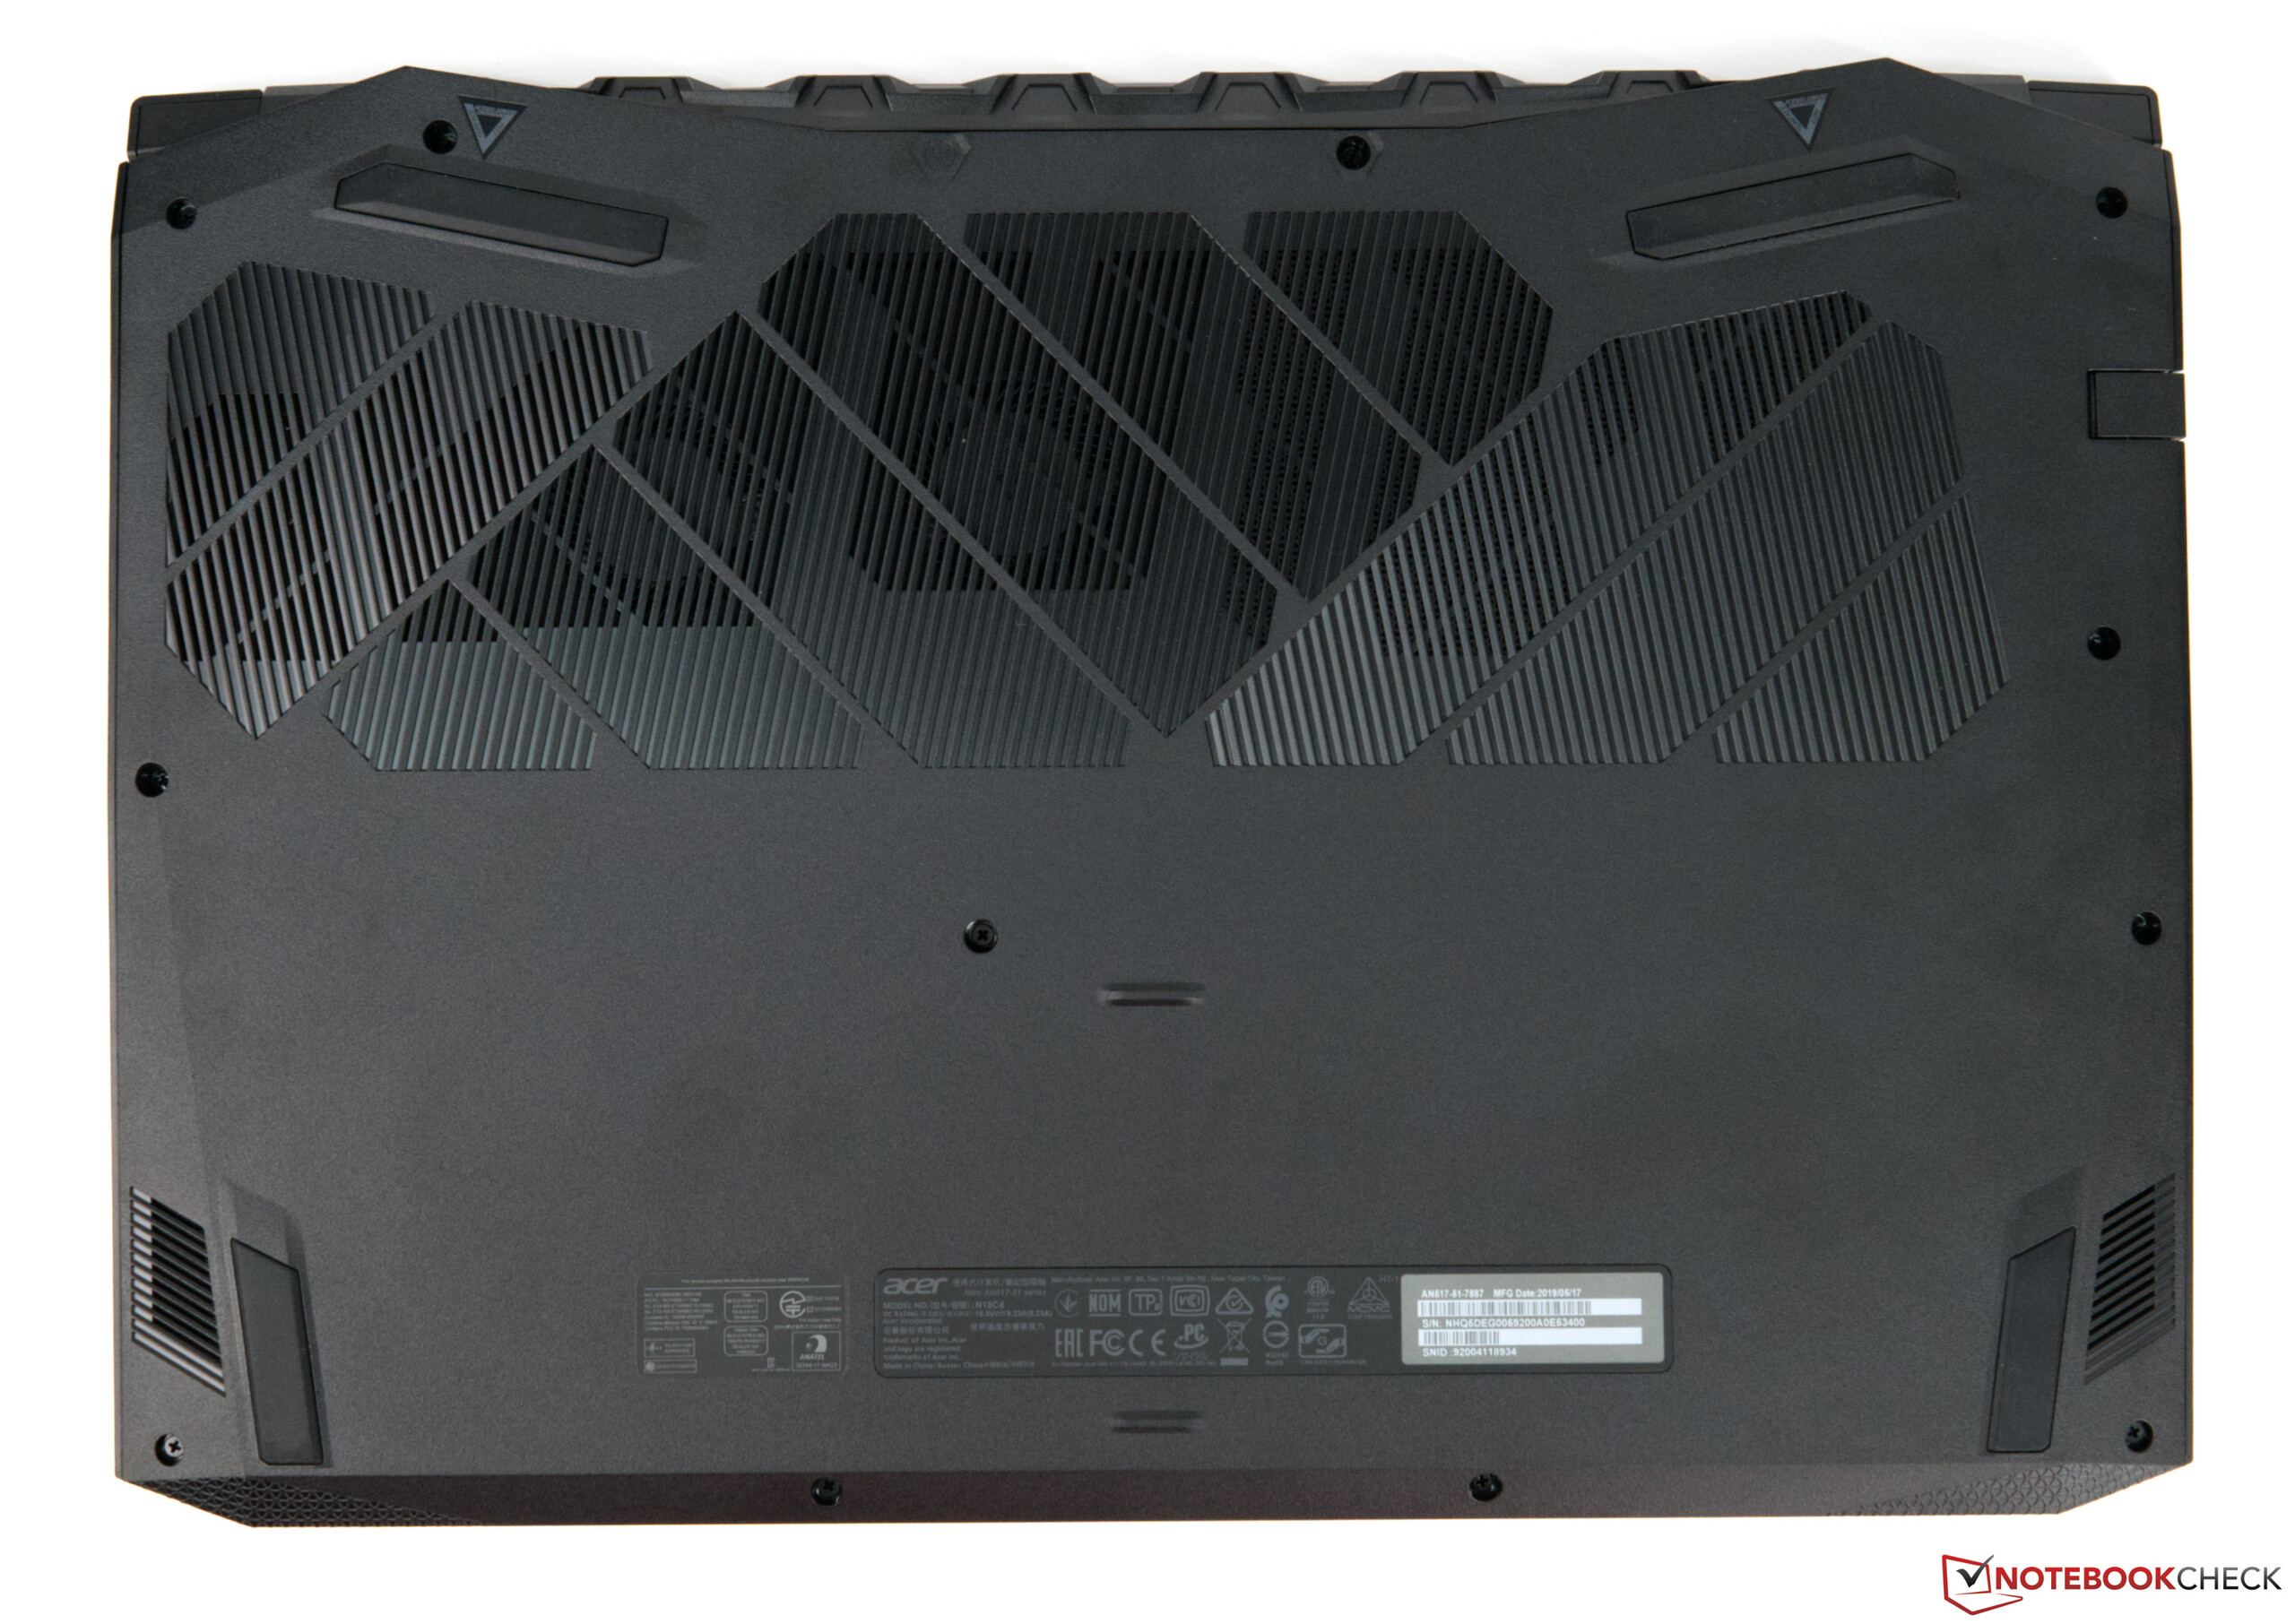
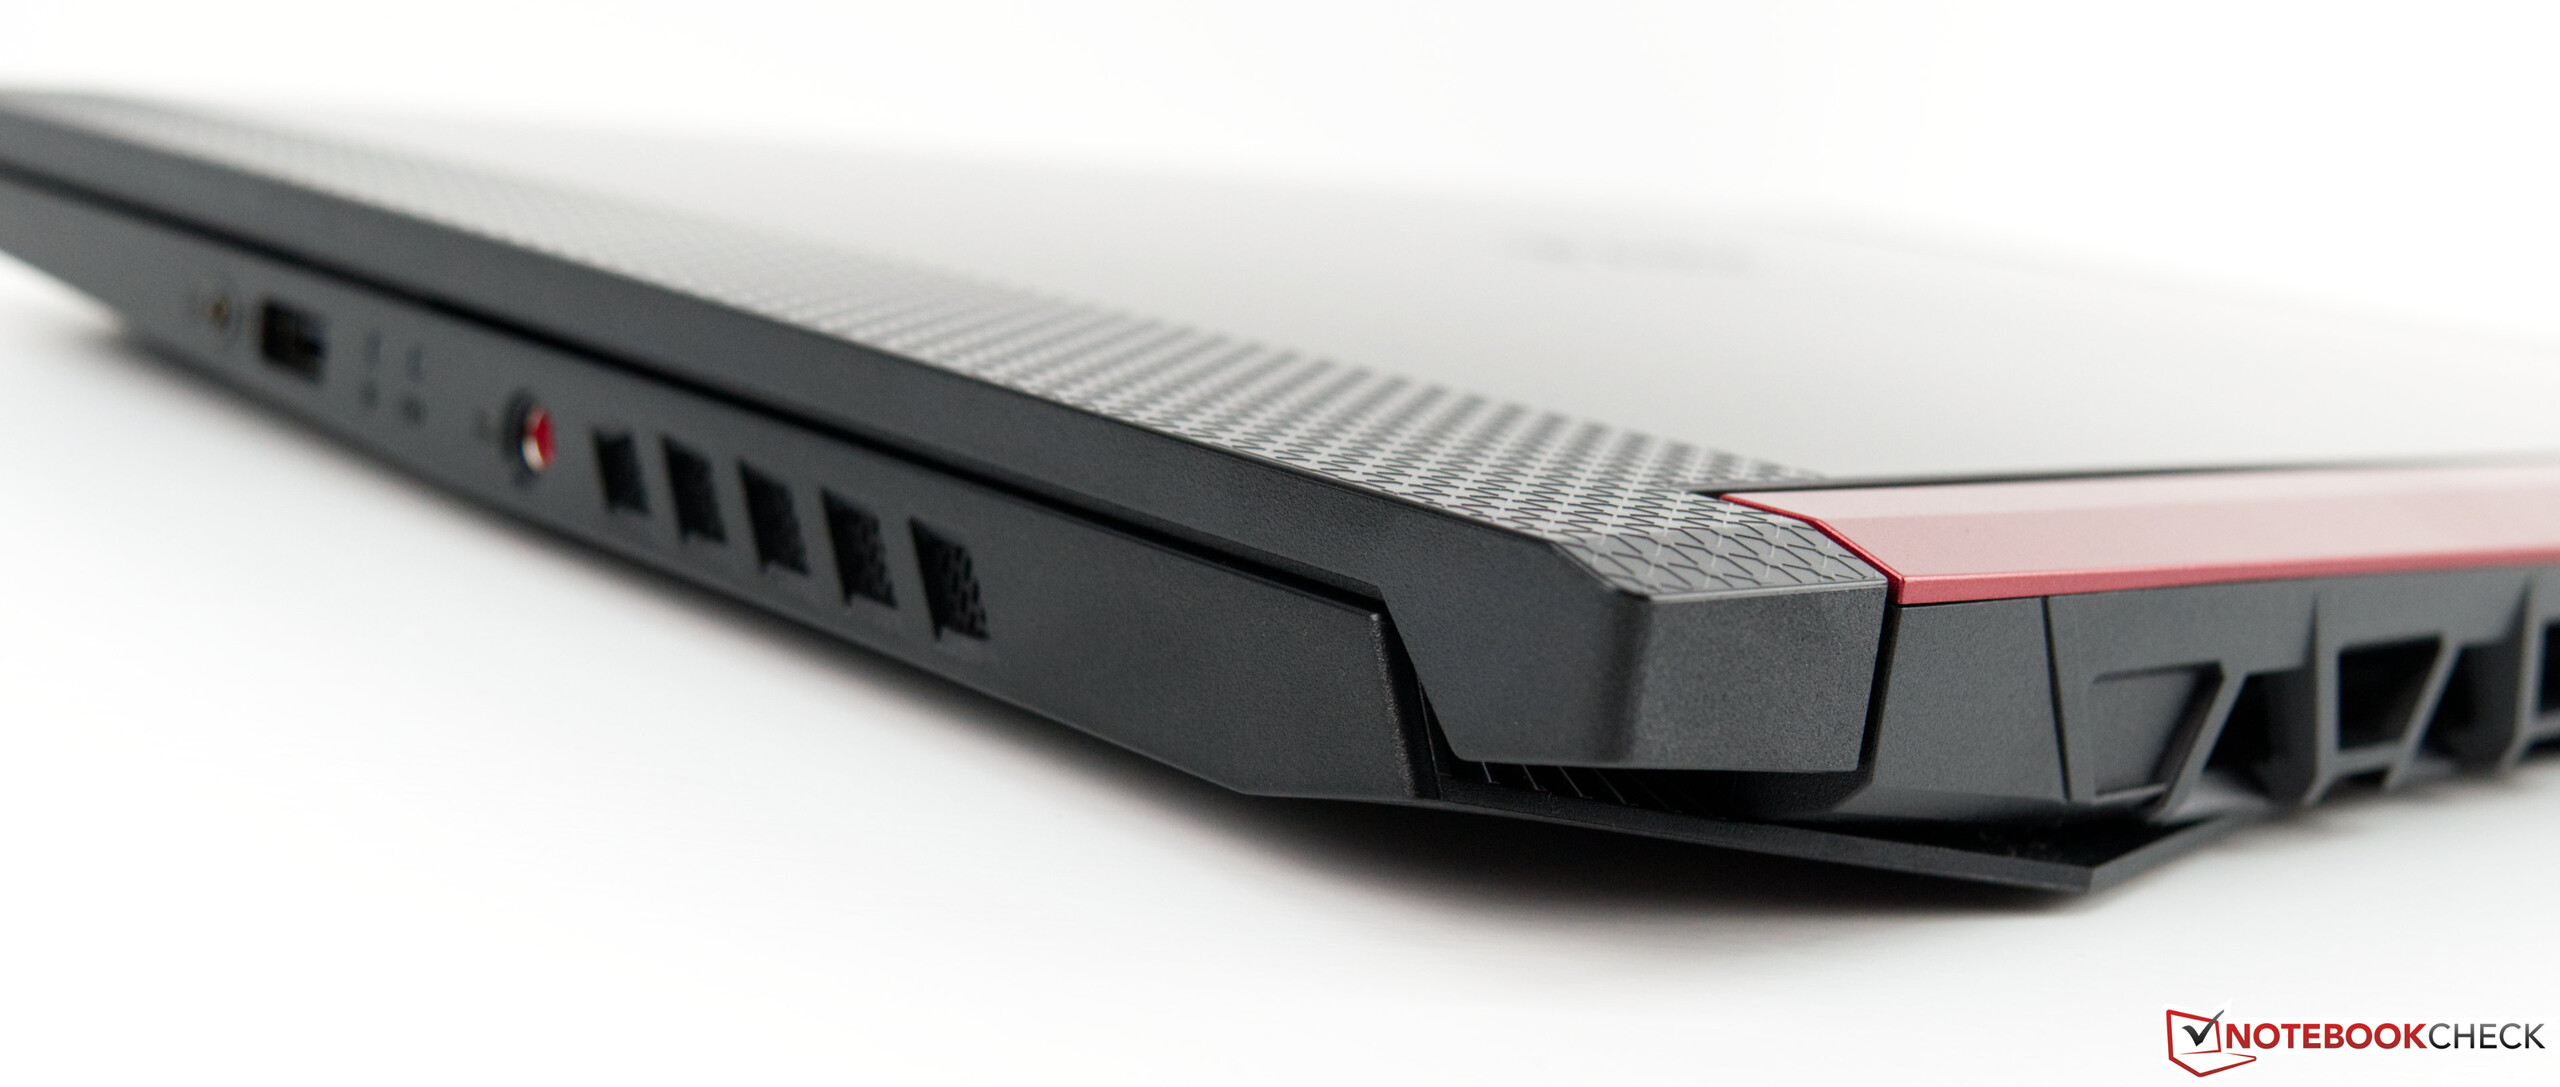
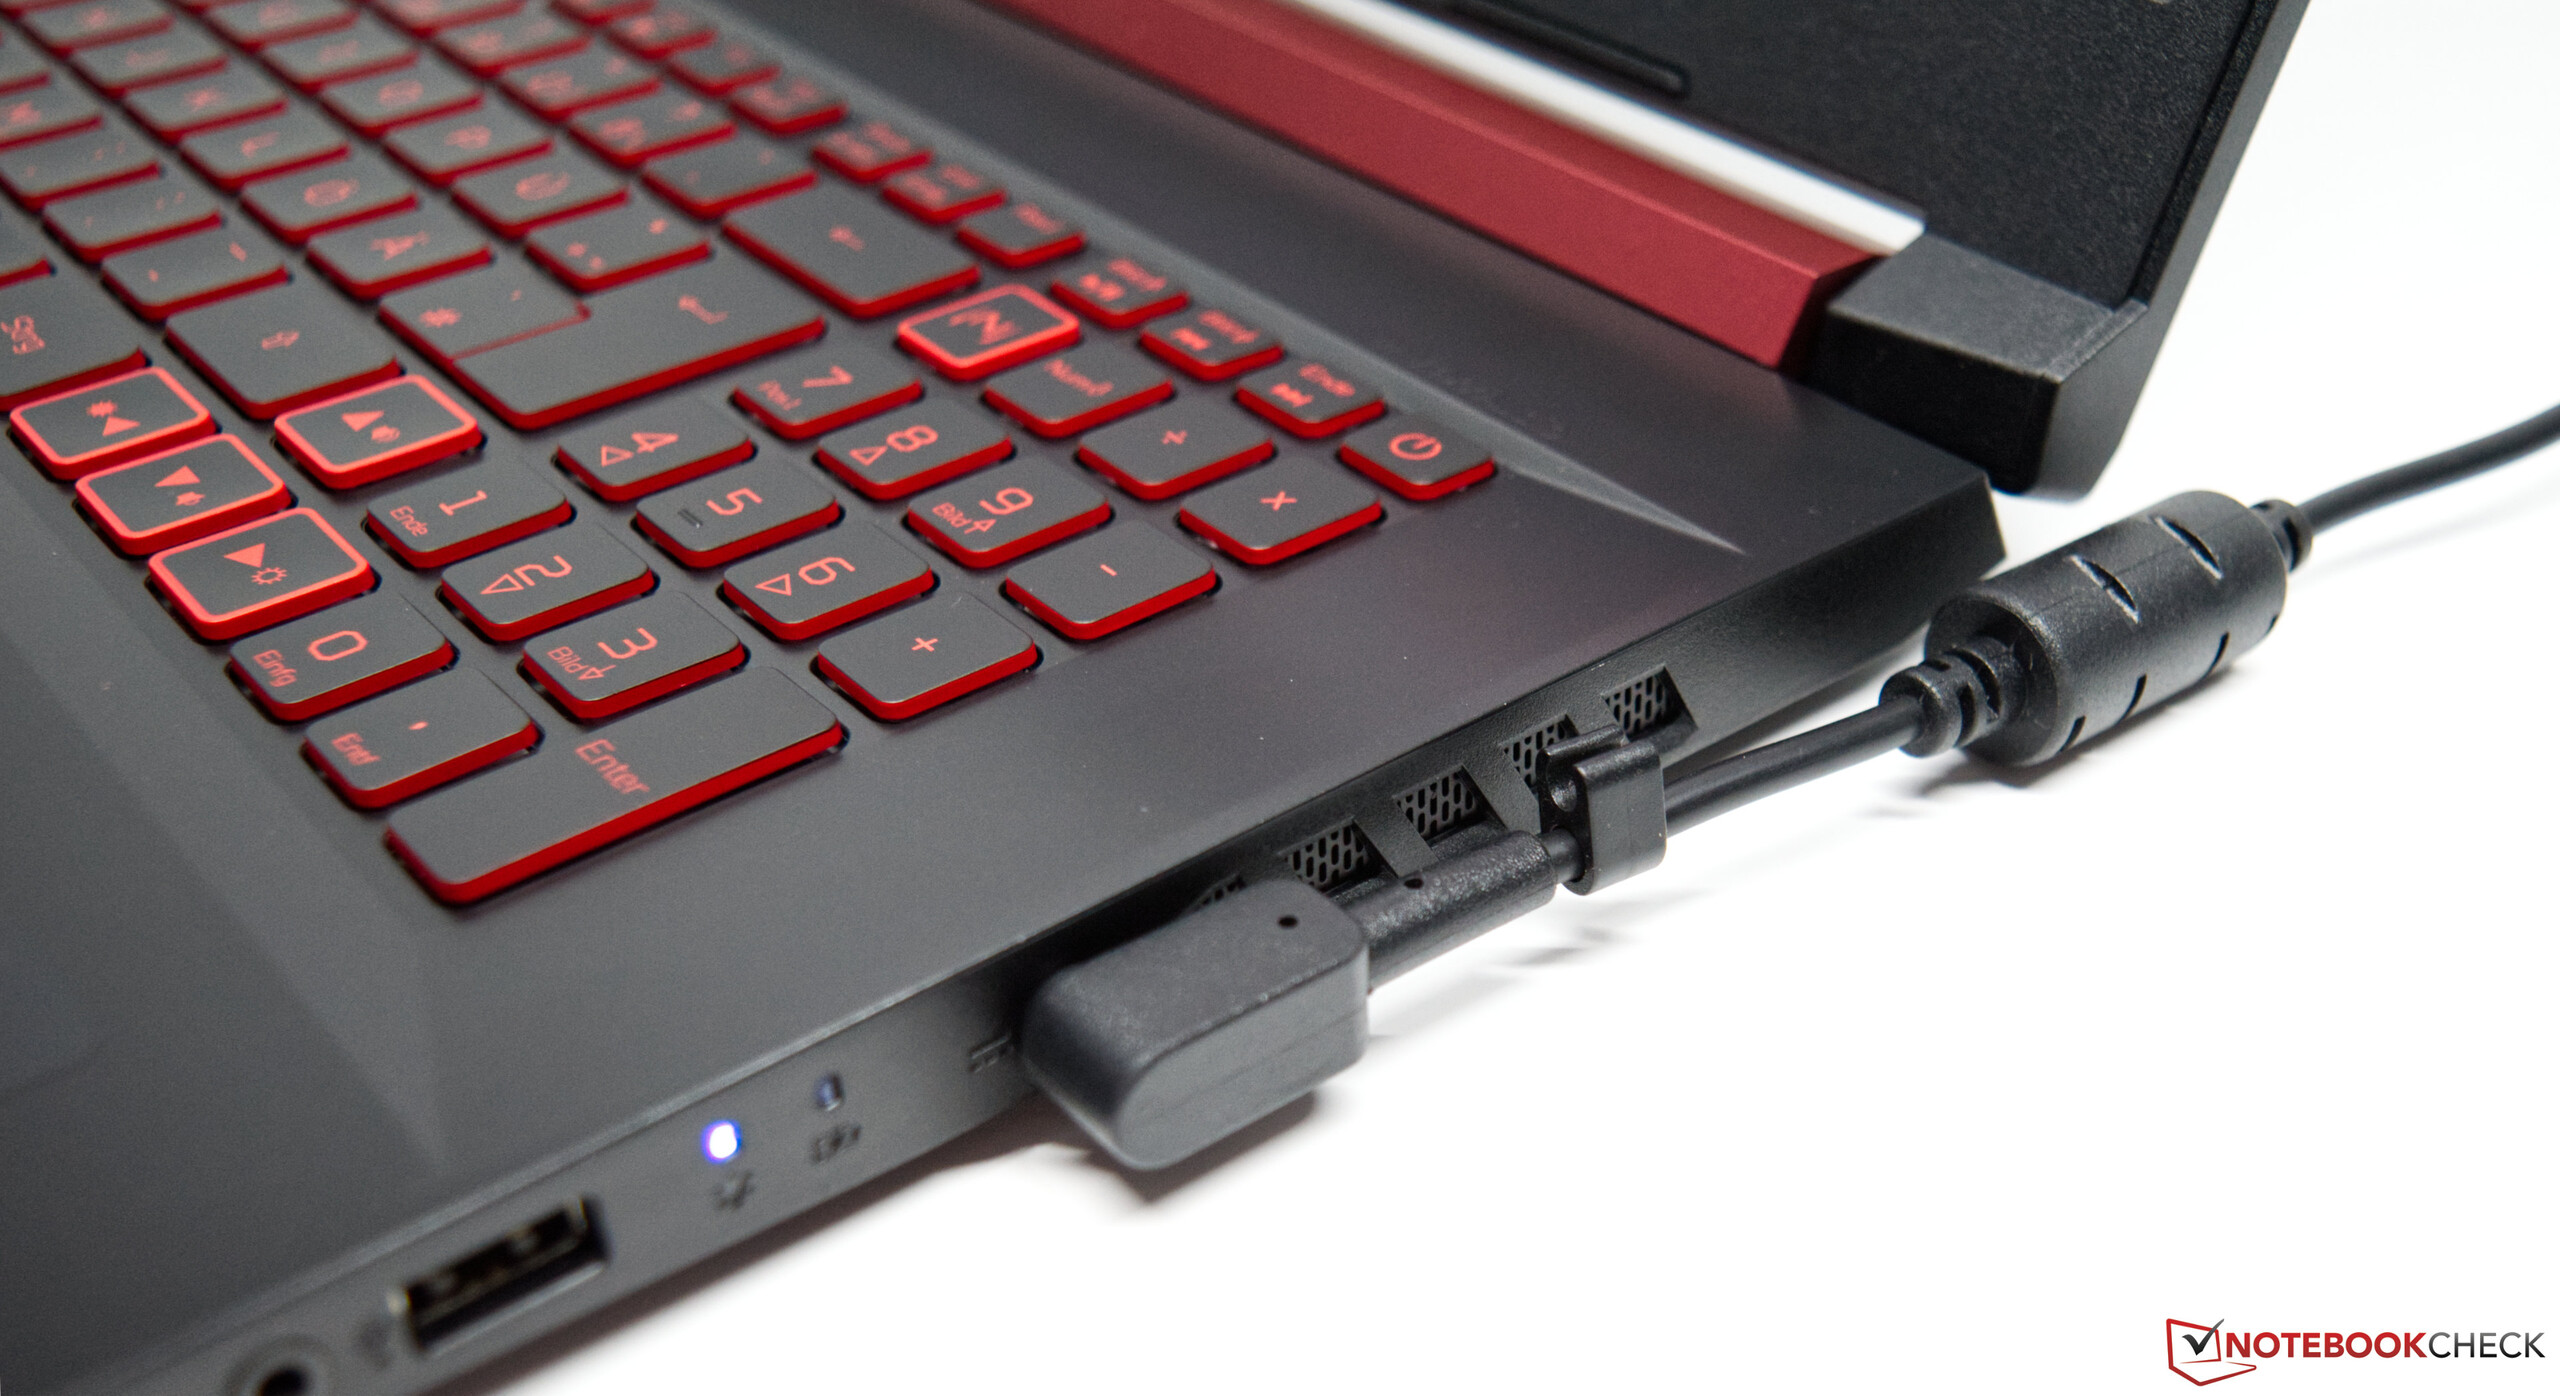
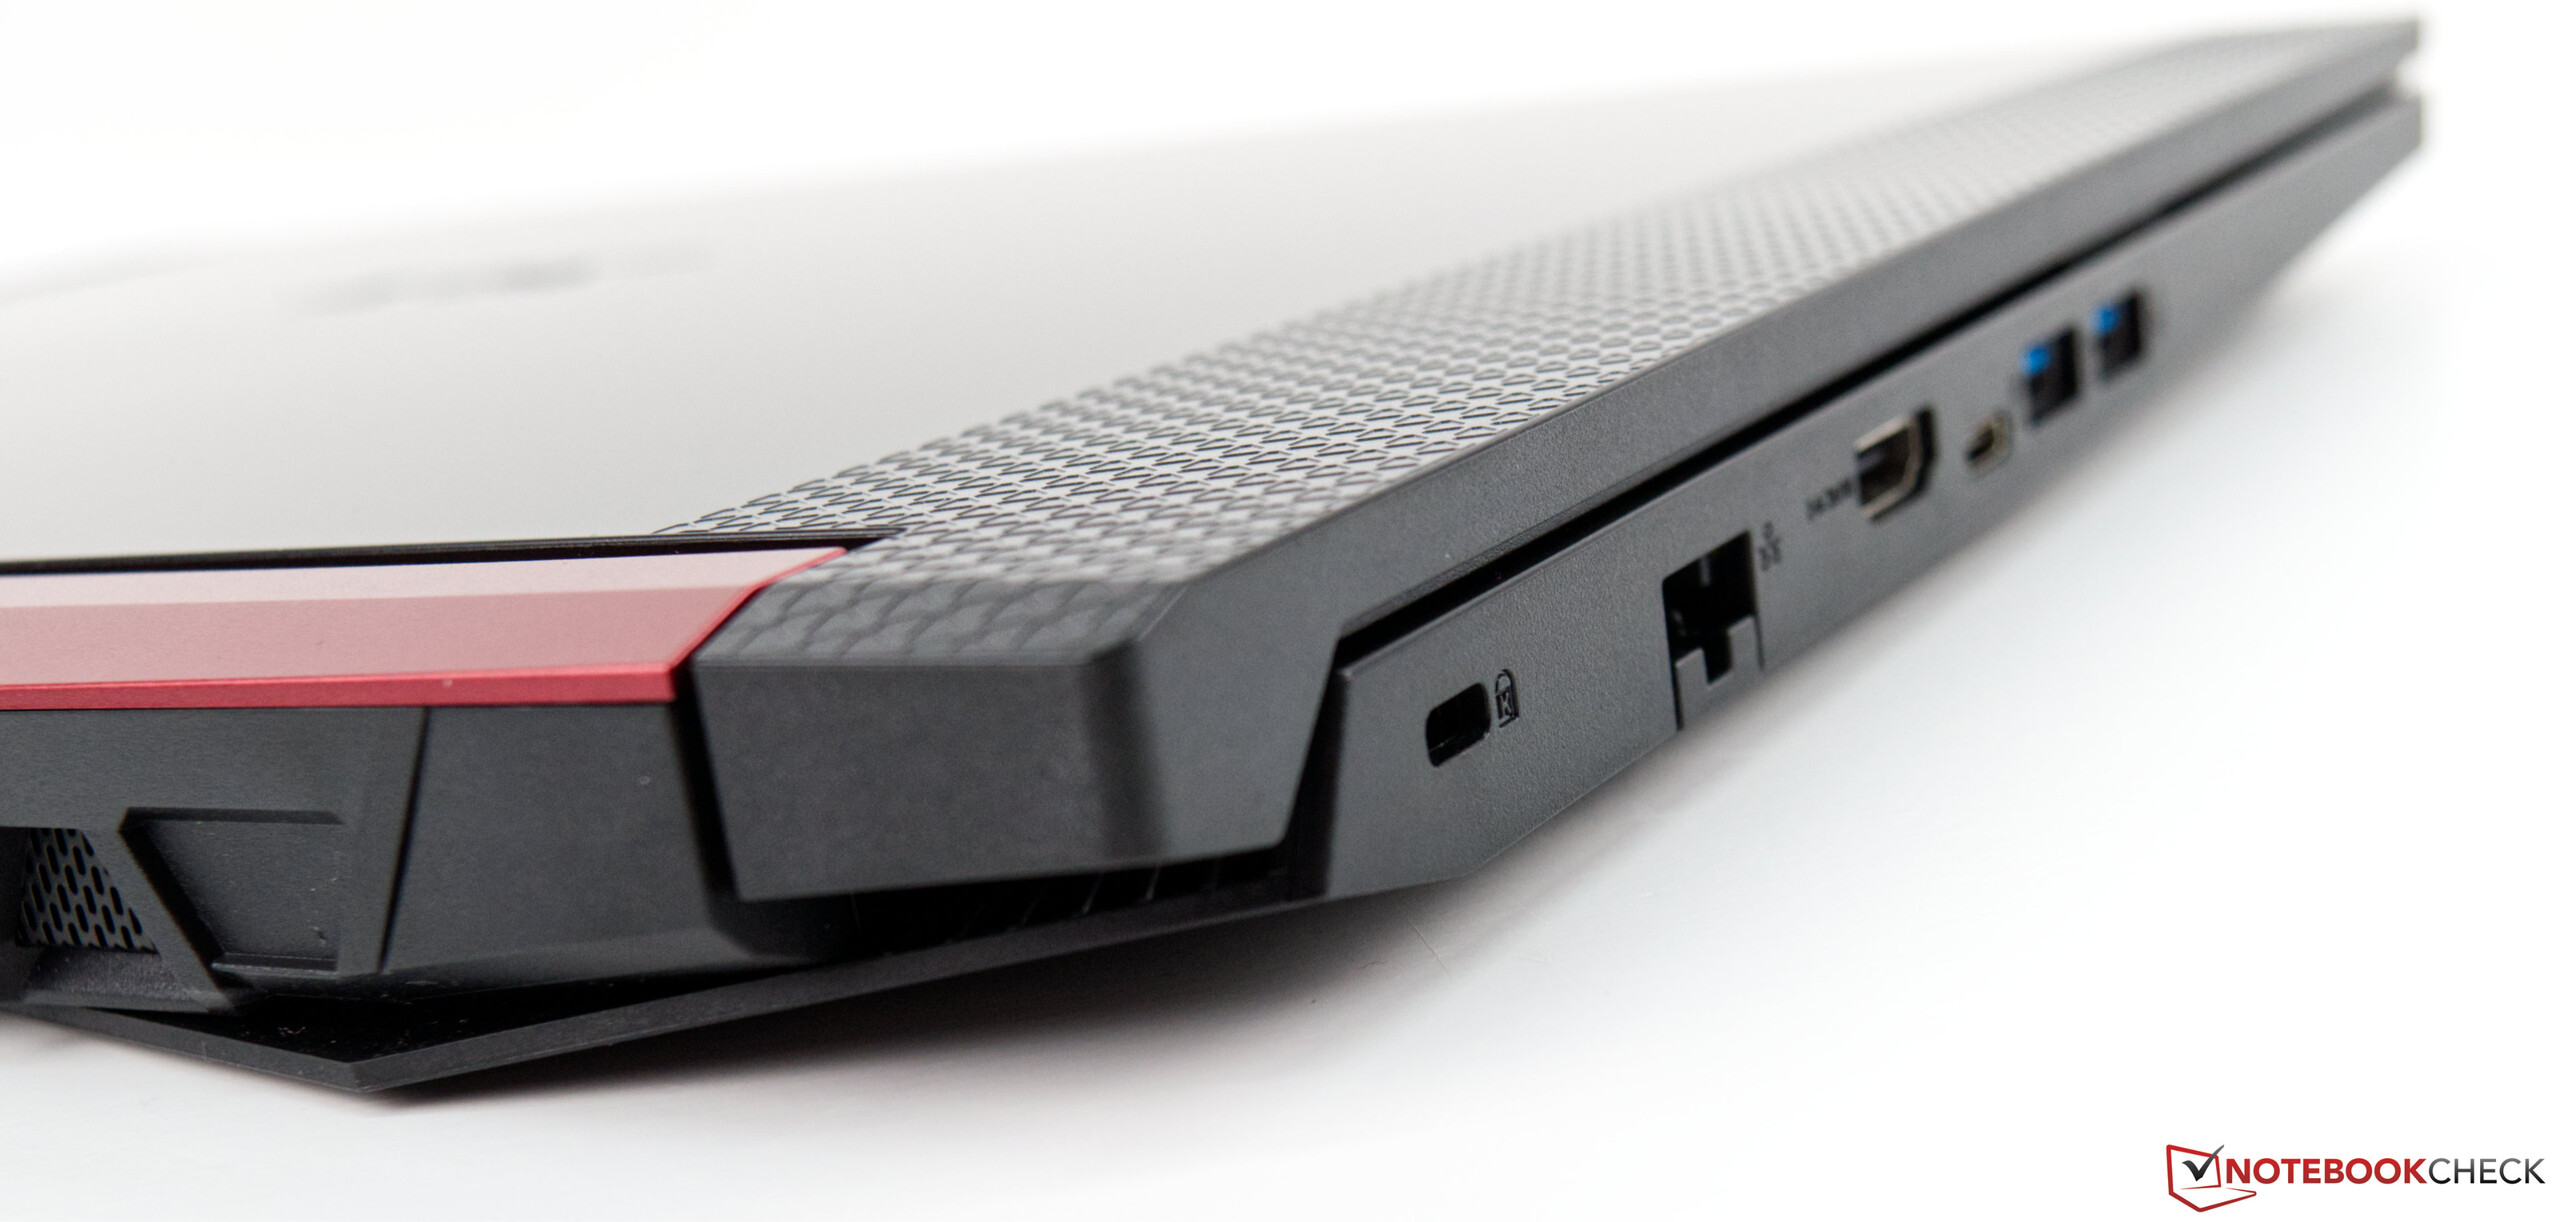
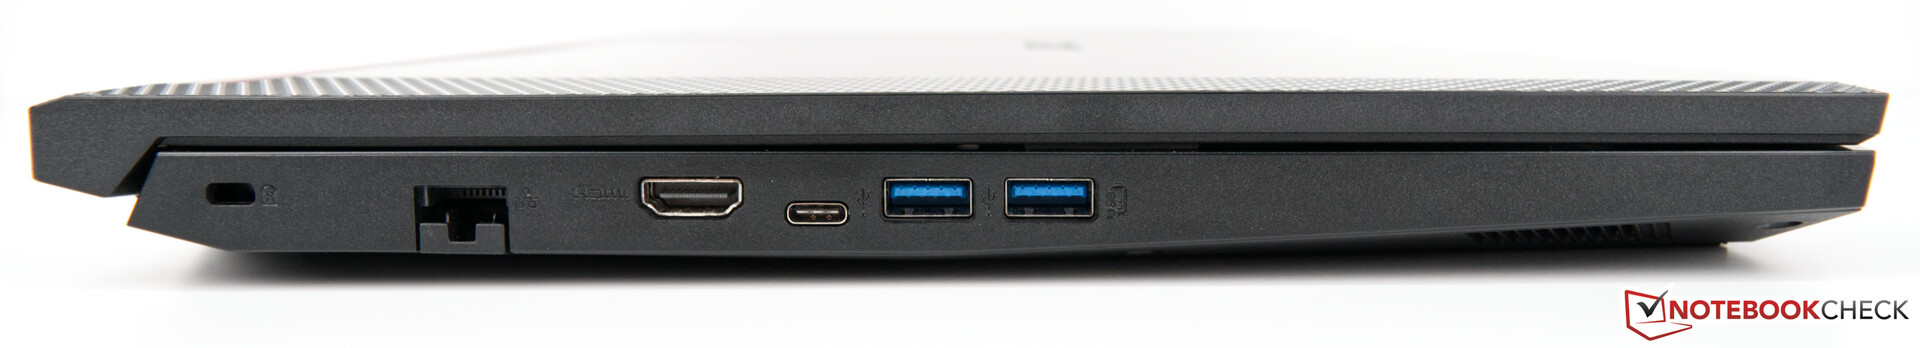
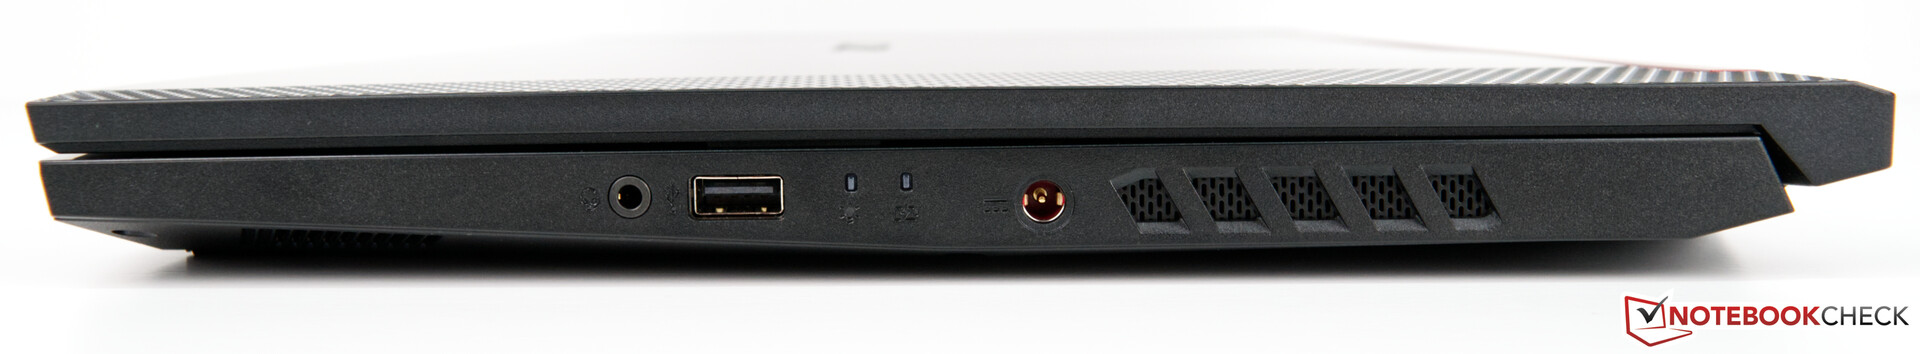
Tyvärr visade sig också värmestrypning vara ett problem och Nitro 5 begränsade sin CPU när vi pressade den och GPU:n till det yttersta i våra stresstester. Acer har också valt att utrusta Nitro 5 med en minimal mängd portar, vilket är synd. DisplayPort och en SD-kortläsare hade varit trevligt, särskilt med tanke på hur mycket tom yta det för tillfället finns mellan portarna. Än värre är att inte ens Typ C-porten hade stöd för DisplayPort, så det går helt enkelt inte går att ansluta Nitro 5 till en extern skärm på det sättet.
Acer Aspire Nitro 5 AN517 är en gedigen budgetlaptop som gör rätt på många sätt, särskilt när det kommer till batteritiden, som ligger över genomsnittet, och den jämförelsevis låga energiförbrukningen. Den överaktiva och högfrekventa fläkten, skärmens långsamma responstider och plastdesignen kan dock få intresserade köpare att leta på annat håll.
Totalt sett har Acer skapat en kompetent och billig spellaptop på 17.3 tum som kommer med aktuell hårdvara. Även om det inte går att uppgradera varken CPU eller GPU kommer Core i7-9750H och GTX 1660 Ti vara tillräckligt kraftfulla för åtminstone några års AAA-spelande.
Acer Aspire Nitro 5 AN517-51-7887
- 08/21/2019 v6 (old)
Sebastian Bade
Price comparison
