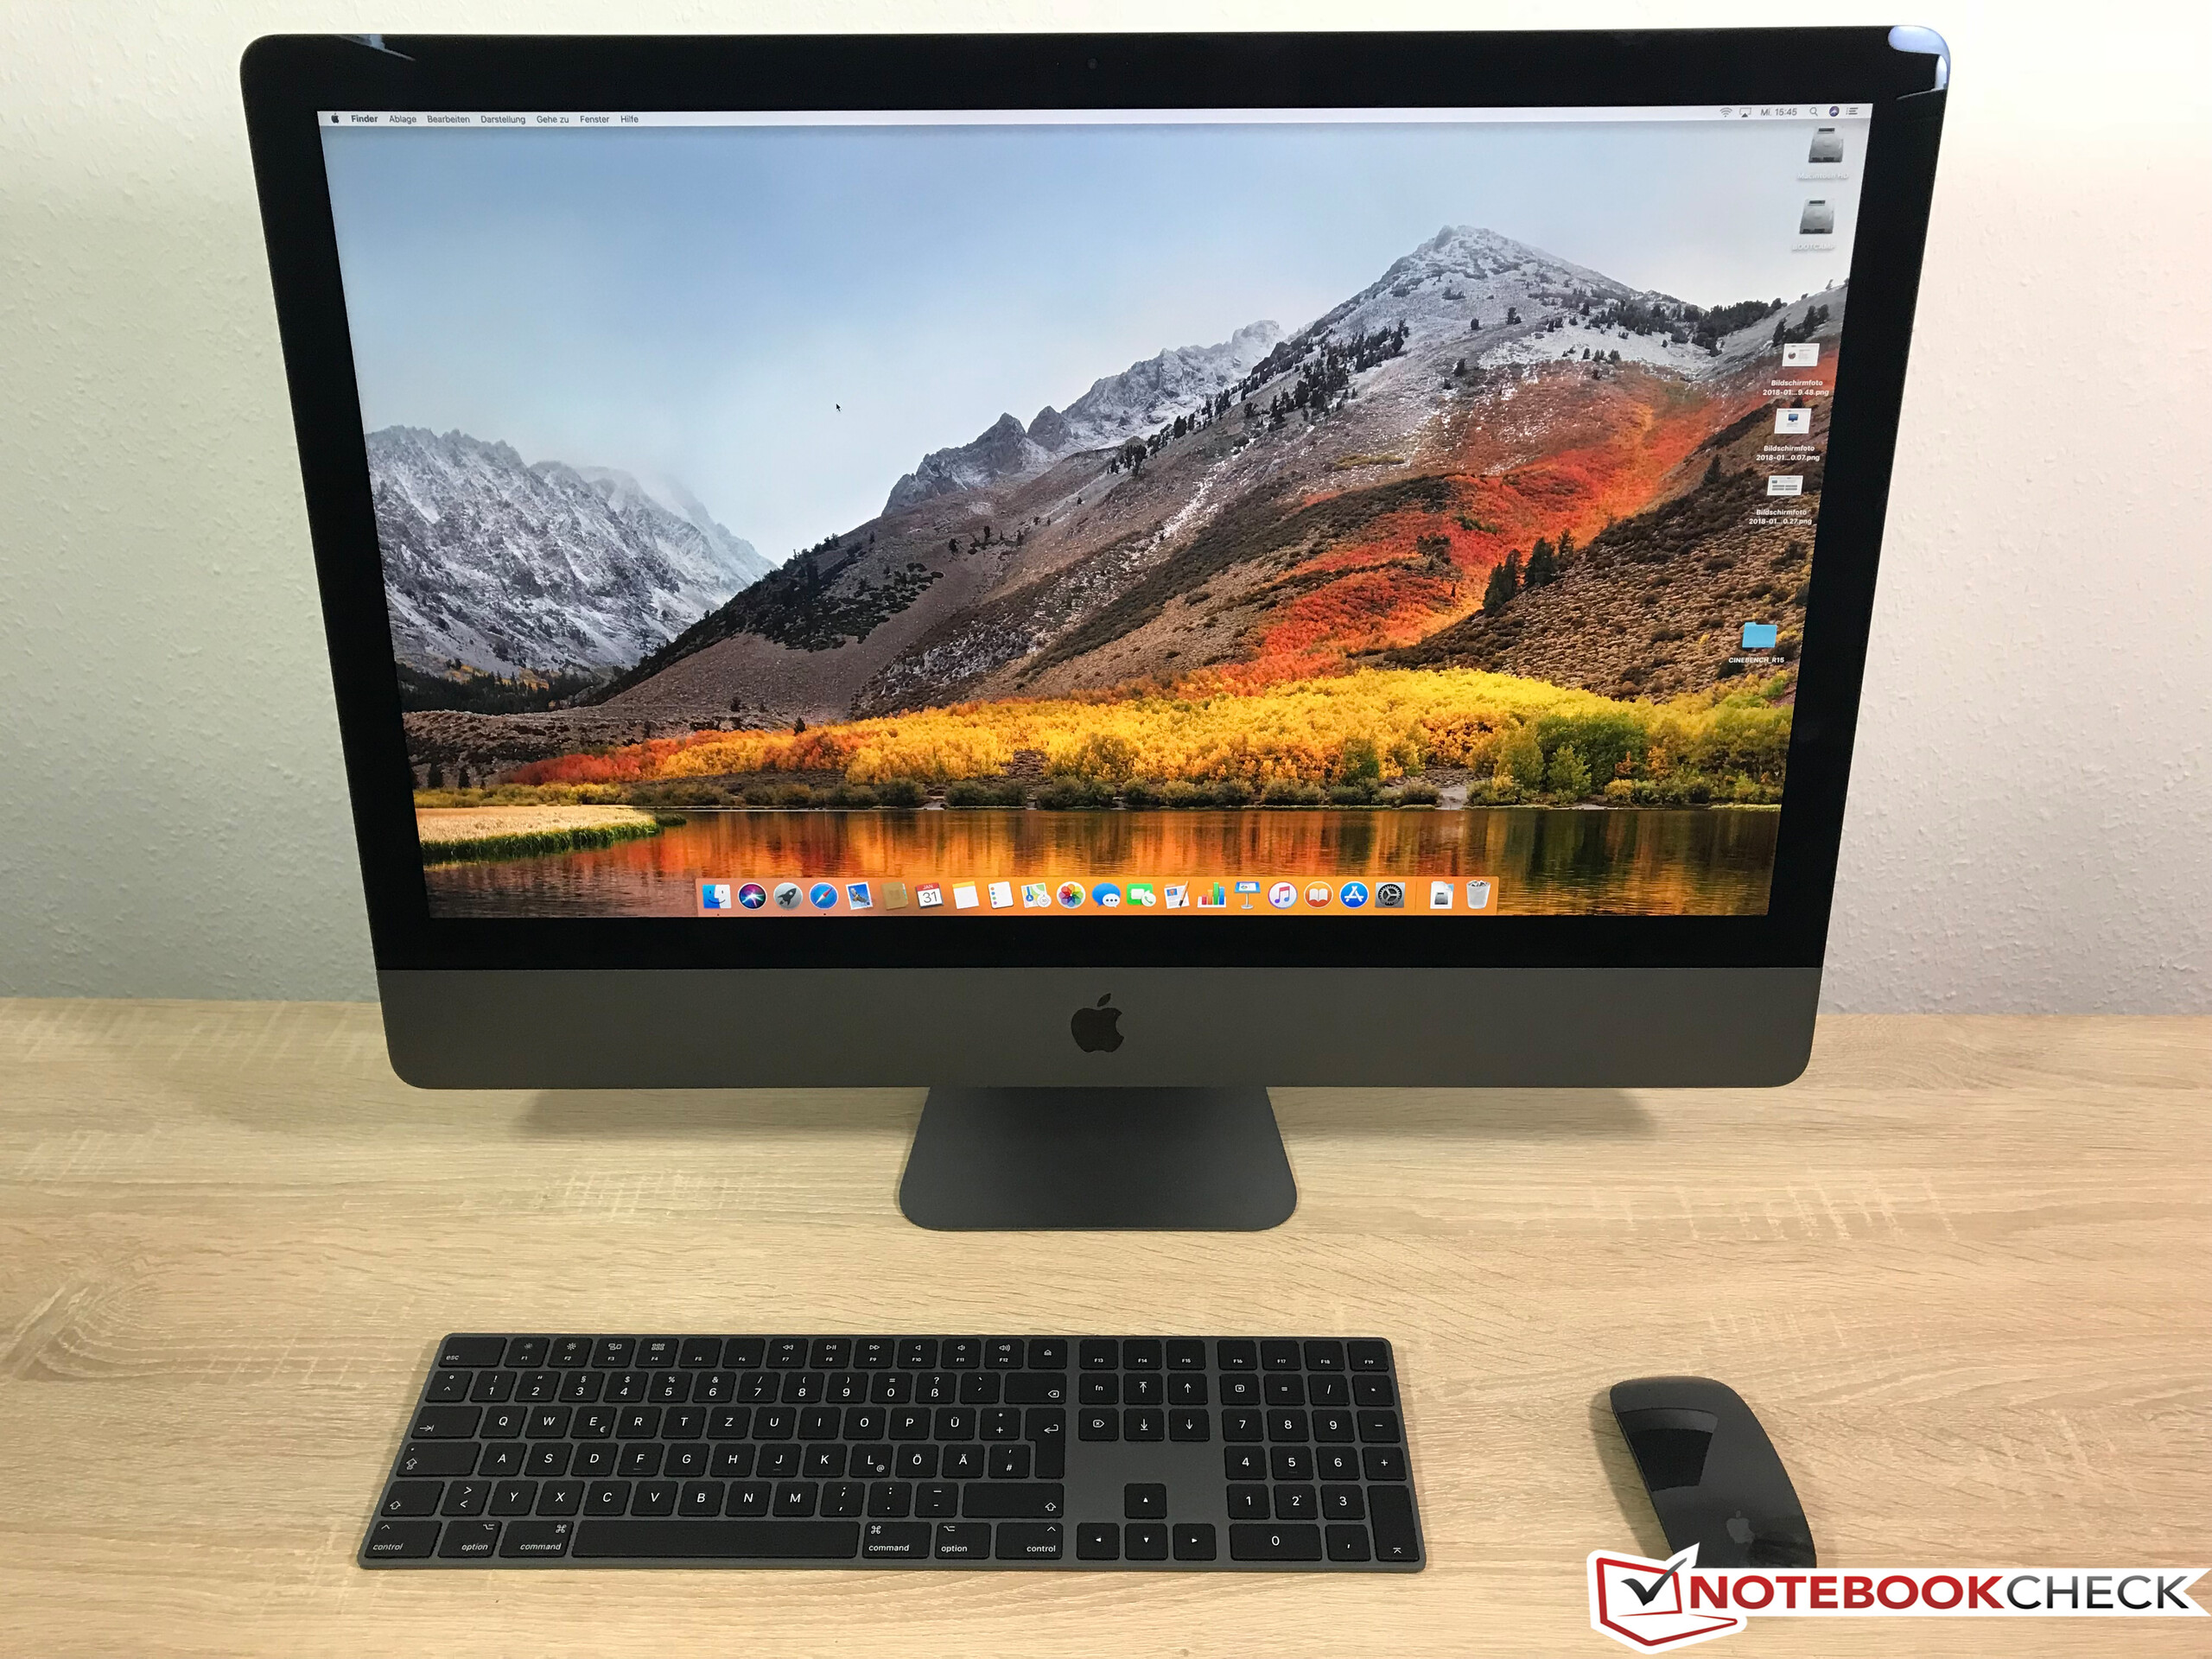
Test: Apple iMac Pro (Xeon W-2140B, Radeon Pro Vega 56) (Sammanfattning)
| SD Card Reader | |
| average JPG Copy Test (av. of 3 runs) | |
| Dell Precision 5520 UHD (Toshiba Exceria Pro SDXC 64 GB UHS-II) | |
| Lenovo ThinkPad P71-20HK0004GE | |
| Apple iMac Pro (Toshiba Exceria Pro SDXC 64 GB UHS-II) | |
| maximum AS SSD Seq Read Test (1GB) | |
| Dell Precision 5520 UHD (Toshiba Exceria Pro SDXC 64 GB UHS-II) | |
| Lenovo ThinkPad P71-20HK0004GE | |
| Apple iMac Pro (Toshiba Exceria Pro SDXC 64 GB UHS-II) | |
| |||||||||||||||||||||||||
Distribution av ljusstyrkan: 87 %
Kontrast: 919:1 (Svärta: 0.54 cd/m²)
ΔE ColorChecker Calman: 3 | ∀{0.5-29.43 Ø4.72}
calibrated: 0.9
ΔE Greyscale Calman: 2.5 | ∀{0.09-98 Ø4.97}
100% sRGB (Argyll 1.6.3 3D)
79.4% AdobeRGB 1998 (Argyll 1.6.3 3D)
88.8% AdobeRGB 1998 (Argyll 3D)
100% sRGB (Argyll 3D)
99% Display P3 (Argyll 3D)
Gamma: 2.22
CCT: 6824 K
| Apple iMac Pro APPAE1E, , 5120x2880, 27" | Apple iMac Retina 5K 27 Late 2015 3.2 GHz M390 MK472D/A 5120x2880, 27" | Apple MacBook Pro 15 2017 (2.8 GHz, 555) APPA031, , 2880x1800, 15.4" | Lenovo ThinkPad P71-20HK0004GE LEN4123, VVX17P051J00, , 3840x2160, 17.3" | Dell Precision 5520 UHD SHP1476, , 3840x2160, 15.6" | Dell Precision 7720 SHP1446 (LQ173D1), , 3840x2160, 17.3" | HP ZBook 17 G4-Y3J82AV Sharp SHP144C, , 3840x2160, 17.3" | |
|---|---|---|---|---|---|---|---|
| Display | -0% | -1% | -18% | 0% | 0% | ||
| Display P3 Coverage (%) | 99 | 99.3 0% | 97.9 -1% | 67.4 -32% | 87.6 -12% | 88 -11% | |
| sRGB Coverage (%) | 100 | 100 0% | 99.9 0% | 98.5 -1% | 100 0% | 100 0% | |
| AdobeRGB 1998 Coverage (%) | 88.8 | 88.2 -1% | 85.9 -3% | 68.9 -22% | 99.2 12% | 99.6 12% | |
| Response Times | -6% | -69% | -26% | -108% | -122% | -96% | |
| Response Time Grey 50% / Grey 80% * (ms) | 30.4 ? | 30.4 ? -0% | 48 ? -58% | 39.2 ? -29% | 59.2 ? -95% | 60 ? -97% | 56.8 ? -87% |
| Response Time Black / White * (ms) | 18.8 ? | 20.8 ? -11% | 33.8 ? -80% | 23.2 ? -23% | 41.6 ? -121% | 46.4 ? -147% | 38.4 ? -104% |
| PWM Frequency (Hz) | 208.3 ? | 119000 ? | 1412 ? | 1020 ? | 1020 ? | ||
| Screen | -1% | 23% | 9% | -10% | -5% | 17% | |
| Brightness middle (cd/m²) | 496 | 429 -14% | 545 10% | 358 -28% | 372.4 -25% | 464 -6% | 391 -21% |
| Brightness (cd/m²) | 468 | 424 -9% | 523 12% | 338 -28% | 368 -21% | 441 -6% | 360 -23% |
| Brightness Distribution (%) | 87 | 95 9% | 86 -1% | 83 -5% | 90 3% | 89 2% | 87 0% |
| Black Level * (cd/m²) | 0.54 | 0.58 -7% | 0.44 19% | 0.31 43% | 0.48 11% | 0.45 17% | 0.35 35% |
| Contrast (:1) | 919 | 740 -19% | 1239 35% | 1155 26% | 776 -16% | 1031 12% | 1117 22% |
| Colorchecker dE 2000 * | 3 | 2.8 7% | 1.6 47% | 2.1 30% | 2.6 13% | 3.2 -7% | 1.3 57% |
| Colorchecker dE 2000 max. * | 5.8 | 3.8 34% | 3.6 38% | 5.6 3% | 6.1 -5% | 2.5 57% | |
| Colorchecker dE 2000 calibrated * | 0.9 | ||||||
| Greyscale dE 2000 * | 2.5 | 1.97 21% | 1.9 24% | 2 20% | 3.7 -48% | 4.2 -68% | 1.8 28% |
| Gamma | 2.22 99% | 2.13 103% | 2.26 97% | 2.16 102% | 2.14 103% | 2.01 109% | 2.11 104% |
| CCT | 6824 95% | 6889 94% | 6834 95% | 6216 105% | 7096 92% | 6736 96% | 6461 101% |
| Color Space (Percent of AdobeRGB 1998) (%) | 79.4 | 79 -1% | 77 -3% | 63 -21% | 88.1 11% | 87.9 11% | |
| Color Space (Percent of sRGB) (%) | 100 | 99.97 0% | 99.97 0% | 99 -1% | 100 0% | 100 0% | |
| Totalt genomsnitt (program/inställningar) | -2% /
-2% | -16% /
3% | -9% /
3% | -45% /
-25% | -42% /
-20% | -26% /
-2% |
* ... mindre är bättre
Visa svarstider
| ↔ Svarstid svart till vitt | ||
|---|---|---|
| 18.8 ms ... stiga ↗ och falla ↘ kombinerat | ↗ 11.2 ms stiga | 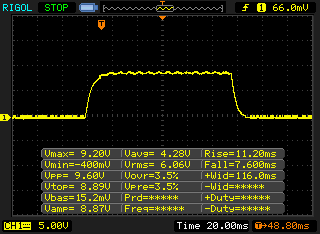 |
| ↘ 7.6 ms hösten | ||
| Skärmen visar bra svarsfrekvens i våra tester, men kan vara för långsam för konkurrenskraftiga spelare. I jämförelse sträcker sig alla testade enheter från 0.1 (minst) till 240 (maximalt) ms. » 42 % av alla enheter är bättre. Det betyder att den uppmätta svarstiden liknar genomsnittet av alla testade enheter (19.8 ms). | ||
| ↔ Svarstid 50 % grått till 80 % grått | ||
| 30.4 ms ... stiga ↗ och falla ↘ kombinerat | ↗ 14 ms stiga | 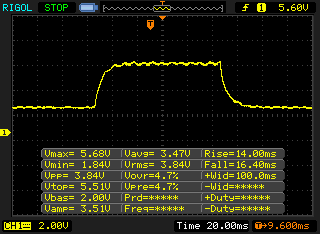 |
| ↘ 16.4 ms hösten | ||
| Skärmen visar långsamma svarsfrekvenser i våra tester och kommer att vara otillfredsställande för spelare. I jämförelse sträcker sig alla testade enheter från 0.165 (minst) till 636 (maximalt) ms. » 41 % av alla enheter är bättre. Det betyder att den uppmätta svarstiden liknar genomsnittet av alla testade enheter (31 ms). | ||
Skärmflimmer / PWM (Puls-Width Modulation)
| Skärmflimmer / PWM upptäckt | 208.3 Hz | ≤ 50 % ljusstyrka inställning | 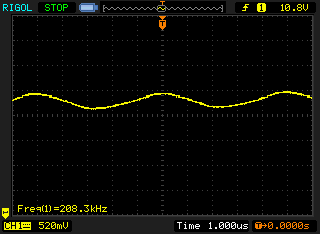 |
Displayens bakgrundsbelysning flimrar vid 208.3 Hz (i värsta fall, t.ex. med PWM) Flimrande upptäckt vid en ljusstyrkeinställning på 50 % och lägre. Det ska inte finnas något flimmer eller PWM över denna ljusstyrkeinställning. Frekvensen för 208.3 Hz är relativt låg, så känsliga användare kommer sannolikt att märka flimmer och uppleva ansträngda ögon vid den angivna ljusstyrkeinställningen och nedan. Som jämförelse: 52 % av alla testade enheter använder inte PWM för att dämpa skärmen. Om PWM upptäcktes mättes ett medelvärde av 7763 (minst: 5 - maximum: 343500) Hz. | |||
| PCMark 8 Home Score Accelerated v2 | 4327 poäng | |
| PCMark 8 Creative Score Accelerated v2 | 7689 poäng | |
| PCMark 8 Work Score Accelerated v2 | 4614 poäng | |
| PCMark 10 Score | 6050 poäng | |
Hjälp | ||

| LuxMark v2.0 64Bit | |
| Room GPUs-only | |
| Aorus GTX 1080 Gaming Box (XPS 15 9575) | |
| Nvidia GeForce GTX 1070 Founders Edition | |
| Dell Precision 7720 | |
| Eurocom Tornado F5W | |
| HP ZBook 17 G4-Y3J82AV | |
| Apple iMac Pro | |
| Fujitsu Celsius H970 | |
| Lenovo ThinkPad P71-20HK0004GE | |
| Dell Precision 5520 UHD | |
| Apple MacBook Pro 15 2017 (2.8 GHz, 555) | |
| Lenovo ThinkPad T480s-20L8S02E00 | |
| Apple MacBook Pro 13 2017 Touchbar i5 | |
| Sala GPUs-only | |
| Aorus GTX 1080 Gaming Box (XPS 15 9575) | |
| Nvidia GeForce GTX 1070 Founders Edition | |
| Dell Precision 7720 | |
| Eurocom Tornado F5W | |
| HP ZBook 17 G4-Y3J82AV | |
| Apple iMac Pro | |
| Fujitsu Celsius H970 | |
| Lenovo ThinkPad P71-20HK0004GE | |
| Dell Precision 5520 UHD | |
| Apple MacBook Pro 15 2017 (2.8 GHz, 555) | |
| Apple MacBook Pro 13 2017 Touchbar i5 | |
| Lenovo ThinkPad T480s-20L8S02E00 | |
| SPECviewperf 11 | |
| 1920x1080 Siemens NX | |
| Apple iMac Pro | |
| HP ZBook 17 G4-Y3J82AV | |
| Dell Precision 7720 | |
| Fujitsu Celsius H970 | |
| Lenovo ThinkPad P71-20HK0004GE | |
| 1920x1080 Tcvis | |
| HP ZBook 17 G4-Y3J82AV | |
| Dell Precision 7720 | |
| Lenovo ThinkPad P71-20HK0004GE | |
| Fujitsu Celsius H970 | |
| Apple iMac Pro | |
| 1920x1080 SolidWorks | |
| Apple iMac Pro | |
| HP ZBook 17 G4-Y3J82AV | |
| Dell Precision 7720 | |
| Lenovo ThinkPad P71-20HK0004GE | |
| Fujitsu Celsius H970 | |
| 1920x1080 Pro/ENGINEER | |
| HP ZBook 17 G4-Y3J82AV | |
| Dell Precision 7720 | |
| Fujitsu Celsius H970 | |
| Lenovo ThinkPad P71-20HK0004GE | |
| Apple iMac Pro | |
| 1920x1080 Maya | |
| Apple iMac Pro | |
| Dell Precision 7720 | |
| HP ZBook 17 G4-Y3J82AV | |
| Fujitsu Celsius H970 | |
| Lenovo ThinkPad P71-20HK0004GE | |
| 1920x1080 Lightwave | |
| Apple iMac Pro | |
| HP ZBook 17 G4-Y3J82AV | |
| Dell Precision 7720 | |
| Lenovo ThinkPad P71-20HK0004GE | |
| Fujitsu Celsius H970 | |
| 1920x1080 Ensight | |
| Apple iMac Pro | |
| Lenovo ThinkPad P71-20HK0004GE | |
| Dell Precision 7720 | |
| HP ZBook 17 G4-Y3J82AV | |
| Fujitsu Celsius H970 | |
| 1920x1080 Catia | |
| Apple iMac Pro | |
| HP ZBook 17 G4-Y3J82AV | |
| Dell Precision 7720 | |
| Lenovo ThinkPad P71-20HK0004GE | |
| Fujitsu Celsius H970 | |
| Unigine Valley 1.0 | |
| 1920x1080 Extreme HD DirectX AA:x8 | |
| Nvidia GeForce GTX 1070 Founders Edition | |
| HP ZBook 17 G4-Y3J82AV | |
| Dell Precision 7720 | |
| Apple iMac Pro | |
| Lenovo ThinkPad P71-20HK0004GE | |
| Apple MacBook Pro 15 2017 (2.8 GHz, 555) | |
| 1920x1080 Extreme HD Preset OpenGL AA:x8 | |
| HP ZBook 17 G4-Y3J82AV | |
| Apple iMac Pro | |
| Apple iMac Pro | |
| Dell Precision 7720 | |
| Lenovo ThinkPad P71-20HK0004GE | |
| Apple iMac Retina 5K 27 Late 2015 3.2 GHz M390 MK472D/A | |
| Apple MacBook Pro 15 2017 (2.8 GHz, 555) | |
| Apple MacBook Pro 13 2017 Touchbar i5 | |
| SiSoft Sandra 2016 | |
| Image Processing | |
| Apple iMac Pro | |
| Dell Precision 7720 | |
| HP ZBook 17 G4-Y3J82AV | |
| Lenovo ThinkPad P71-20HK0004GE | |
| GP Cryptography (Higher Security AES256+SHA2-512) | |
| Apple iMac Pro | |
| HP ZBook 17 G4-Y3J82AV | |
| Dell Precision 7720 | |
| Lenovo ThinkPad P71-20HK0004GE | |
| GP Financial Analysis (FP High/Double Precision) | |
| Dell Precision 7720 | |
| HP ZBook 17 G4-Y3J82AV | |
| Apple iMac Pro | |
| Lenovo ThinkPad P71-20HK0004GE | |
| 3DMark 11 - 1280x720 Performance GPU | |
| Genomsnitt av klass Desktop (3175 - 130697, n=34, senaste 2 åren) | |
| MSI GT75 8RG-090 Titan | |
| Test: Ryzen 5 2600 och Ryzen 7 2700 (Sammanfattning) | |
| Apple iMac Pro | |
| Genomsnitt AMD Radeon Pro Vega 56 (n=1) | |
| Nvidia GeForce GTX 1070 Founders Edition | |
| MSI GE73 8RF-008 Raider RGB | |
| Eurocom Tornado F5W | |
| Aorus GTX 1080 Gaming Box (XPS 15 9575) | |
| Fujitsu Celsius H970 | |
| Asus ROG Strix GL702ZC-GC204T | |
| Asus Strix GL703GM-DS74 | |
| Lenovo ThinkPad P71-20HK0004GE | |
| 3DMark 06 Standard Score | 35787 poäng | |
| 3DMark 11 Performance | 20785 poäng | |
| 3DMark Fire Strike Score | 15302 poäng | |
| 3DMark Time Spy Score | 5831 poäng | |
Hjälp | ||
| låg | med. | hög | ultra | 4K | |
|---|---|---|---|---|---|
| The Witcher 3 (2015) | 115.7 | 63.9 | 41.6 | ||
| Dota 2 Reborn (2015) | 112 | 107.4 | 102.3 | 95.8 | |
| Rainbow Six Siege (2015) | 198.7 | 135.7 | 70.2 | ||
| Rise of the Tomb Raider (2016) | 94 | 74.8 | 39.3 | ||
| For Honor (2017) | 142.6 | 134.9 | 105.6 | 43.6 | |
| Ghost Recon Wildlands (2017) | 81.7 | 76 | 45.1 | 34.7 | |
| Assassin´s Creed Origins (2017) | 70 | 65 | 57 | 33 |
Ljudnivå
| Låg belastning |
| 29.8 / 29.8 / 29.8 dB(A) |
| Hög belastning |
| 39.7 / 47.9 dB(A) |
 | ||
30 dB tyst 40 dB(A) hörbar 50 dB(A) högt ljud |
||
min: | ||
(+) Den maximala temperaturen på ovansidan är 31.2 °C / 88 F, jämfört med genomsnittet av 33.9 °C / 93 F , allt från 25 till 47 °C för klassen Desktop.
(-) Botten värms upp till maximalt 46.1 °C / 115 F, jämfört med genomsnittet av 33.6 °C / 92 F
(+) Vid tomgångsbruk är medeltemperaturen för ovansidan 24.2 °C / 76 F, jämfört med enhetsgenomsnittet på 29.5 °C / ### class_avg_f### F.
Apple iMac Pro ljudanalys
(+) | högtalare kan spela relativt högt (86.1 dB)
Bas 100 - 315 Hz
(+) | bra bas - bara 3.5% från medianen
(±) | linjäriteten för basen är genomsnittlig (7.6% delta till föregående frekvens)
Mellan 400 - 2000 Hz
(+) | balanserad mellan - endast 1.7% från medianen
(+) | mids är linjära (4.1% delta till föregående frekvens)
Högsta 2 - 16 kHz
(±) | reducerade toppar - i genomsnitt 8.2% lägre än medianen
(+) | toppar är linjära (4.8% delta till föregående frekvens)
Totalt 100 - 16 000 Hz
(+) | det totala ljudet är linjärt (9.2% skillnad mot median)
Jämfört med samma klass
» 33% av alla testade enheter i den här klassen var bättre, 11% liknande, 56% sämre
» Den bästa hade ett delta på 6%, genomsnittet var 16%, sämst var 46%
Jämfört med alla testade enheter
» 3% av alla testade enheter var bättre, 1% liknande, 96% sämre
» Den bästa hade ett delta på 4%, genomsnittet var 23%, sämst var 134%
Apple MacBook 12 (Early 2016) 1.1 GHz ljudanalys
(+) | högtalare kan spela relativt högt (83.6 dB)
Bas 100 - 315 Hz
(±) | reducerad bas - i genomsnitt 11.3% lägre än medianen
(±) | linjäriteten för basen är genomsnittlig (14.2% delta till föregående frekvens)
Mellan 400 - 2000 Hz
(+) | balanserad mellan - endast 2.4% från medianen
(+) | mids är linjära (5.5% delta till föregående frekvens)
Högsta 2 - 16 kHz
(+) | balanserade toppar - endast 2% från medianen
(+) | toppar är linjära (4.5% delta till föregående frekvens)
Totalt 100 - 16 000 Hz
(+) | det totala ljudet är linjärt (10.2% skillnad mot median)
Jämfört med samma klass
» 7% av alla testade enheter i den här klassen var bättre, 2% liknande, 91% sämre
» Den bästa hade ett delta på 5%, genomsnittet var 18%, sämst var 53%
Jämfört med alla testade enheter
» 5% av alla testade enheter var bättre, 1% liknande, 94% sämre
» Den bästa hade ett delta på 4%, genomsnittet var 23%, sämst var 134%
| Av/Standby | |
| Låg belastning | |
| Hög belastning |
|
Förklaring:
min: | |
För
Emot
Läs den fullständiga versionen av den här recensionen på engelska här.
Behöver du verkligen en iMac Pro eller räcker det med en vanlig iMac? Om du ställer dig den frågan behöver du troligen inte Pro-versionen, för proffskomponenterna är för en speciell användargrupp. Xeon-processorns extra kärnor måste utnyttjas fullt ut, annars är den inte snabbare. Samma sak gäller grafikkortet. Om så inte är fallet kan du få en vanlig iMac 5K, som är mycket billigare och har samma skärm.
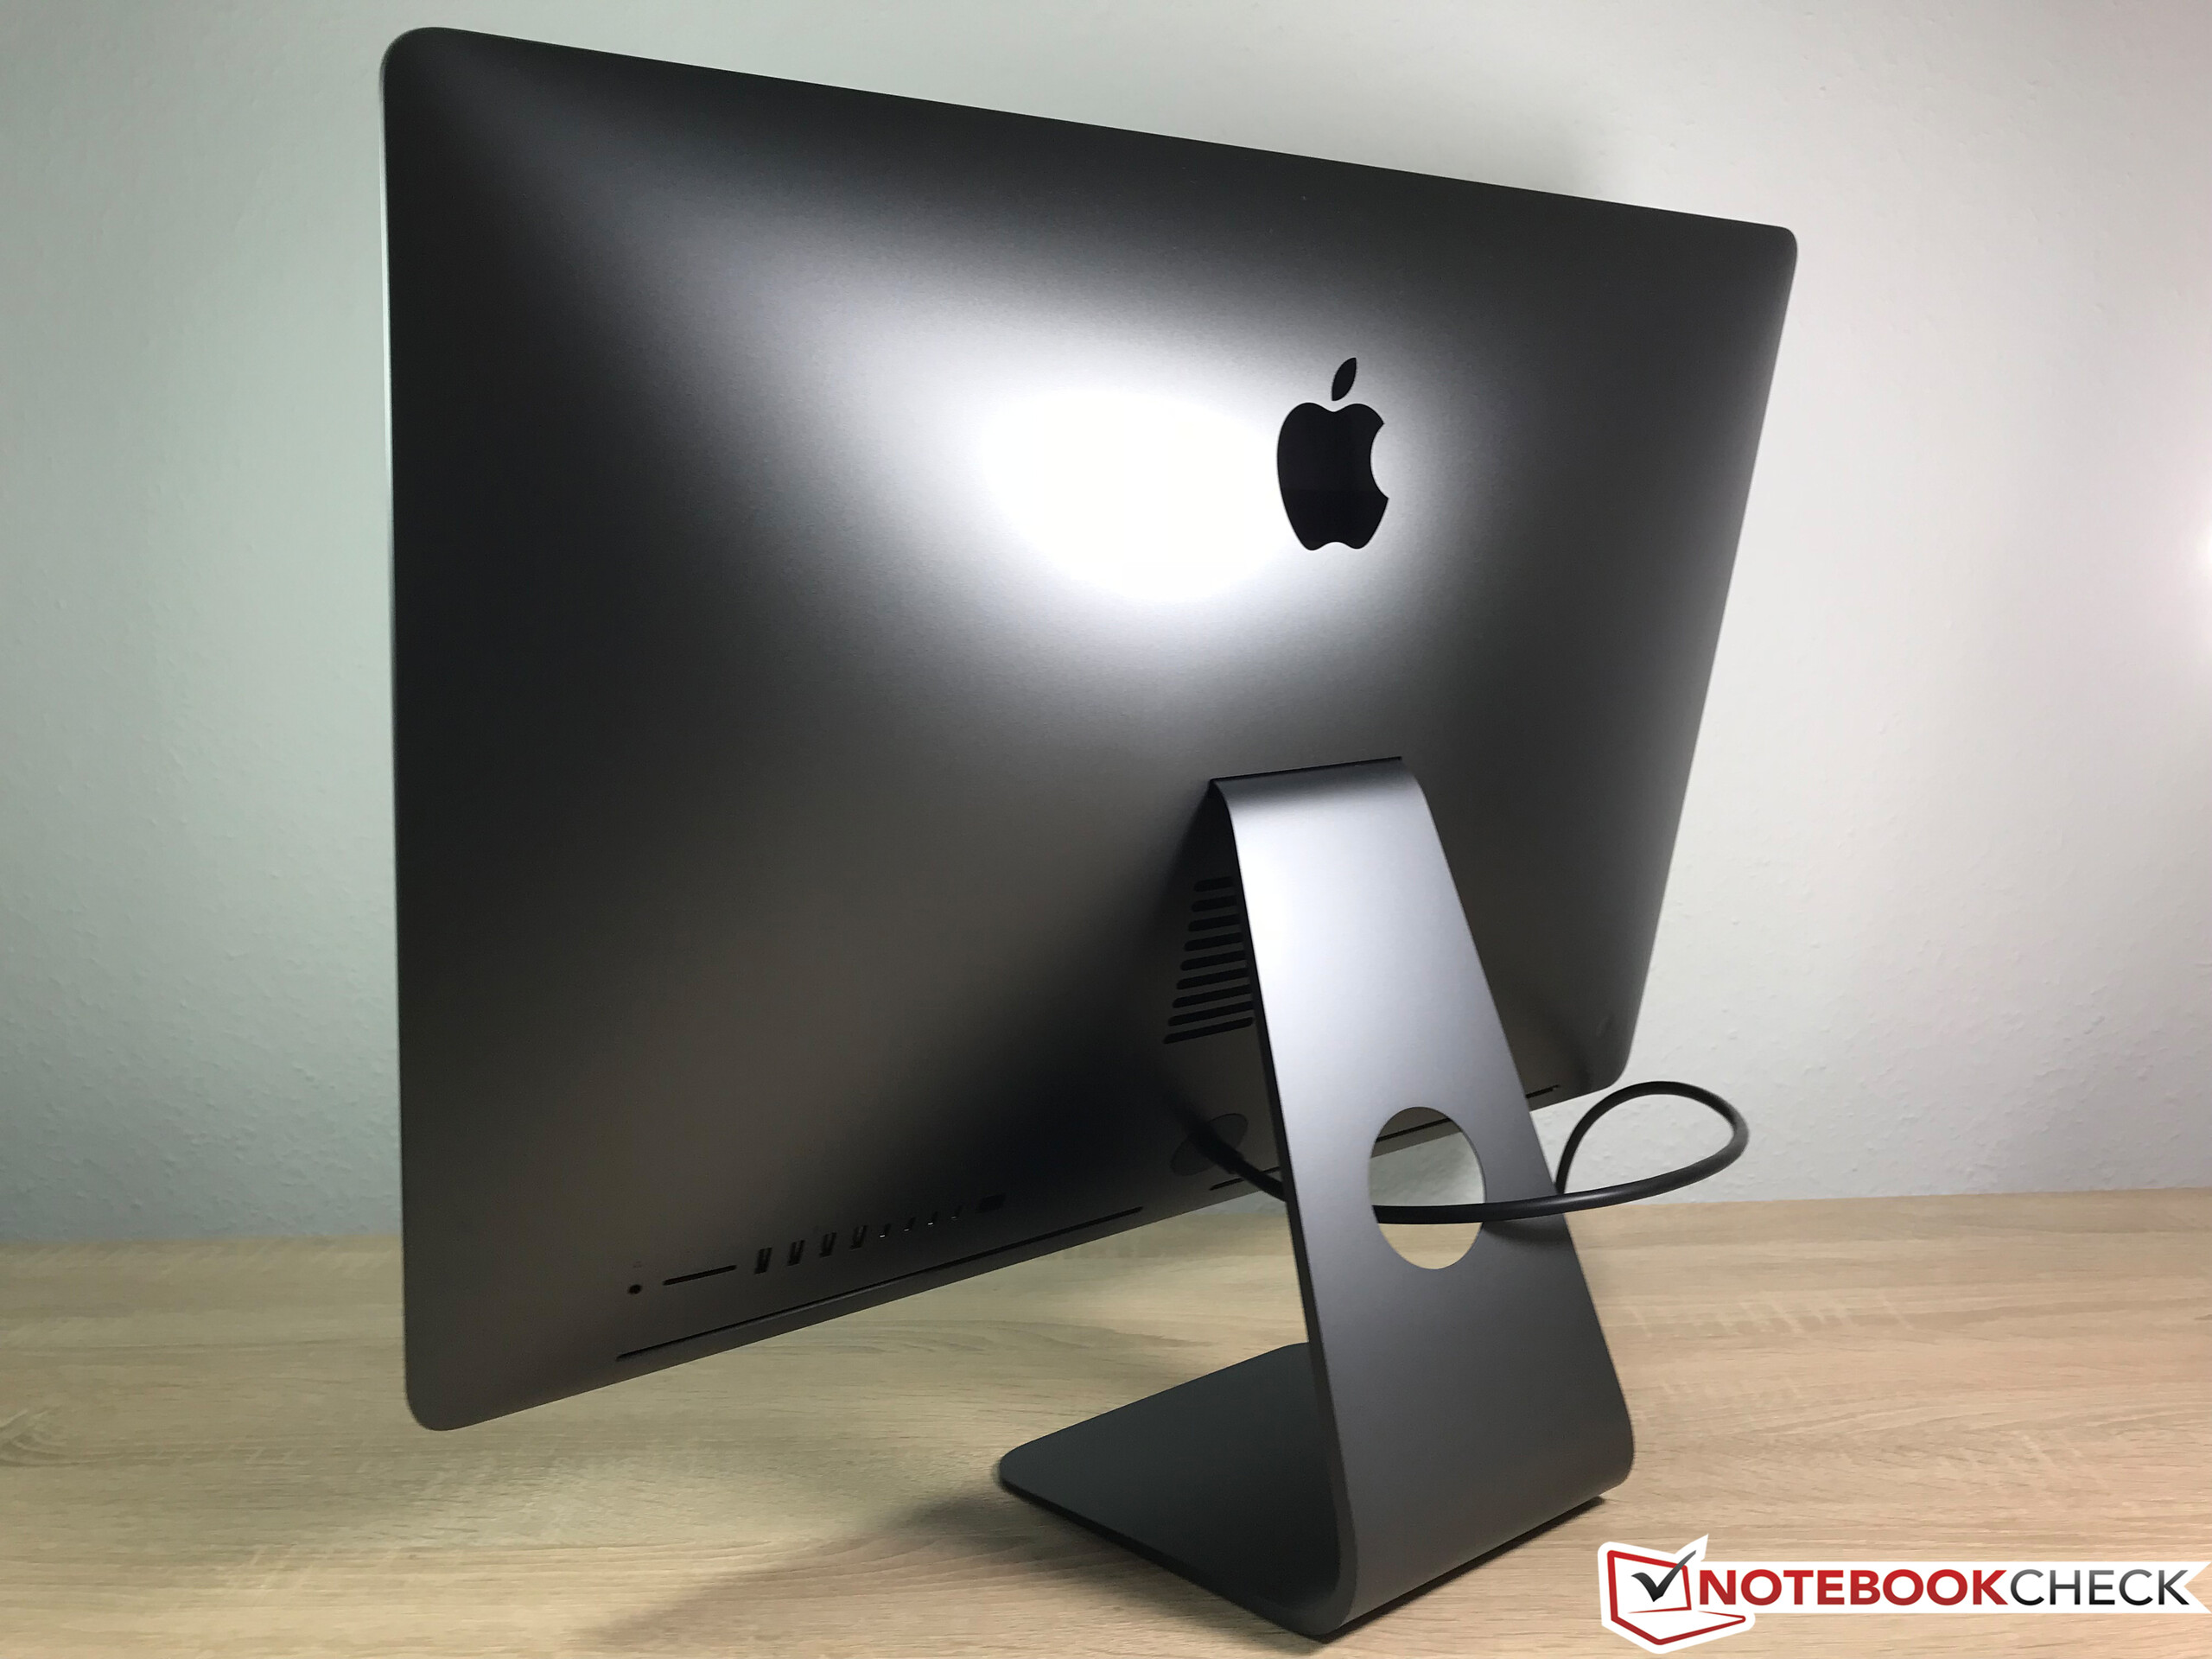
Men iMac Pro är ändå inte en särskilt övertygande arbetsstation. Prestandan är förvisso bra, men kyllösningen har problem redan med instegskomponenterna vid maximal belastning. Skärmen kunde ha varit bättre kalibrerad efter leverans och du kommer behöva en extern skärm för grafikarbete som använder AdobeRGB-färgrymden. Andra nackdelar med detta proffssystem inkluderar de begränsade och komplicerade servicemöjligheterna. Om du förlitar dig på systemet för arbete kommer du troligen behöva köpa till extra stöd såsom reparation på plats. Andra tillverkare som Dell, HP och Lenovo har ett tydligt övertag i detta hänseende.
Instegspriset är högt, men inte helt överprissatt med tanke på komponenterna. Bara Intel Xeon-processorn kostar mer än 11.000 kronor, men vi förstår inte dom massiva priserna för extra RAM och lagring. iMac Pro har definitivt en viss dragningskraft och presterar bra, men det är inte rätt val för alla proffsanvändare.
Apple iMac Pro
- 06/27/2018 v6 (old)
Andreas Osthoff
Price comparison
