Test: HP Omen 17 - Toppskiktsgaming med några mindre begränsningar (Sammanfattning)
| SD Card Reader | |
| average JPG Copy Test (av. of 3 runs) | |
| Schenker XMG Ultra 17 Turing (Toshiba Exceria Pro SDXC 64 GB UHS-II) | |
| Genomsnitt av klass Gaming (20.9 - 210, n=54, senaste 2 åren) | |
| HP Omen 17-cb0020ng (Toshiba Exceria Pro SDXC 64 GB UHS-II) | |
| MSI GE75 9SG (Toshiba Exceria Pro SDXC 64 GB UHS-II) | |
| maximum AS SSD Seq Read Test (1GB) | |
| Schenker XMG Ultra 17 Turing (Toshiba Exceria Pro SDXC 64 GB UHS-II) | |
| Genomsnitt av klass Gaming (25.5 - 261, n=51, senaste 2 åren) | |
| HP Omen 17-cb0020ng (Toshiba Exceria Pro SDXC 64 GB UHS-II) | |
| MSI GE75 9SG (Toshiba Exceria Pro SDXC 64 GB UHS-II) | |
| |||||||||||||||||||||||||
Distribution av ljusstyrkan: 91 %
Mitt på batteriet: 360 cd/m²
Kontrast: 1385:1 (Svärta: 0.26 cd/m²)
ΔE ColorChecker Calman: 1.91 | ∀{0.5-29.43 Ø4.73}
calibrated: 0.78
ΔE Greyscale Calman: 2.72 | ∀{0.09-98 Ø4.97}
96% sRGB (Argyll 1.6.3 3D)
60% AdobeRGB 1998 (Argyll 1.6.3 3D)
65.8% AdobeRGB 1998 (Argyll 3D)
96% sRGB (Argyll 3D)
63.7% Display P3 (Argyll 3D)
Gamma: 2.37
CCT: 6692 K
| HP Omen 17-cb0020ng CMN175D, IPS, 1920x1080 | MSI GE75 9SG Chi Mei N173HCE-G33, AHVA, 1920x1080 | MSI GT76 Titan DT 9SG Chi Mei N173HCE-G33 (CMN175C), IPS, 1920x1080 | Schenker XMG Ultra 17 Turing AU Optronics B173ZAN01.0 (AUO109B), IPS, 3840x2160 | Alienware Area-51m i9-9900K RTX 2080 LG Philips 173WFG, IPS, 1920x1080 | |
|---|---|---|---|---|---|
| Display | -3% | -2% | 30% | 2% | |
| Display P3 Coverage (%) | 63.7 | 61.5 -3% | 62.3 -2% | 86.3 35% | 66.3 4% |
| sRGB Coverage (%) | 96 | 92 -4% | 93.4 -3% | 100 4% | 96.9 1% |
| AdobeRGB 1998 Coverage (%) | 65.8 | 63.5 -3% | 64.3 -2% | 99.1 51% | 66.5 1% |
| Response Times | 50% | 33% | -115% | 15% | |
| Response Time Grey 50% / Grey 80% * (ms) | 17.6 ? | 7.2 ? 59% | 8 ? 55% | 41.6 ? -136% | 13.2 ? 25% |
| Response Time Black / White * (ms) | 11.2 ? | 6.6 ? 41% | 10 ? 11% | 21.6 ? -93% | 10.8 ? 4% |
| PWM Frequency (Hz) | 25510 ? | 26040 ? | 26040 ? | ||
| Screen | -2% | -3% | -37% | -36% | |
| Brightness middle (cd/m²) | 360 | 400.7 11% | 396 10% | 343 -5% | 335.2 -7% |
| Brightness (cd/m²) | 342 | 372 9% | 373 9% | 328 -4% | 297 -13% |
| Brightness Distribution (%) | 91 | 89 -2% | 89 -2% | 82 -10% | 82 -10% |
| Black Level * (cd/m²) | 0.26 | 0.34 -31% | 0.33 -27% | 0.31 -19% | 0.66 -154% |
| Contrast (:1) | 1385 | 1179 -15% | 1200 -13% | 1106 -20% | 508 -63% |
| Colorchecker dE 2000 * | 1.91 | 1.33 30% | 2.04 -7% | 5.03 -163% | 2.02 -6% |
| Colorchecker dE 2000 max. * | 4.08 | 3.51 14% | 3.85 6% | 7.91 -94% | 7.23 -77% |
| Colorchecker dE 2000 calibrated * | 0.78 | 1.39 -78% | 0.82 -5% | 0.86 -10% | 1.17 -50% |
| Greyscale dE 2000 * | 2.72 | 1.3 52% | 2.83 -4% | 6.29 -131% | 3.2 -18% |
| Gamma | 2.37 93% | 2.24 98% | 2.49 88% | 2.38 92% | 2.16 102% |
| CCT | 6692 97% | 6735 97% | 7113 91% | 6389 102% | 6746 96% |
| Color Space (Percent of AdobeRGB 1998) (%) | 60 | 58.2 -3% | 59 -2% | 88 47% | 61.3 2% |
| Color Space (Percent of sRGB) (%) | 96 | 92.1 -4% | 94 -2% | 100 4% | 96.9 1% |
| Totalt genomsnitt (program/inställningar) | 15% /
5% | 9% /
1% | -41% /
-34% | -6% /
-23% |
* ... mindre är bättre
Visa svarstider
| ↔ Svarstid svart till vitt | ||
|---|---|---|
| 11.2 ms ... stiga ↗ och falla ↘ kombinerat | ↗ 6 ms stiga | 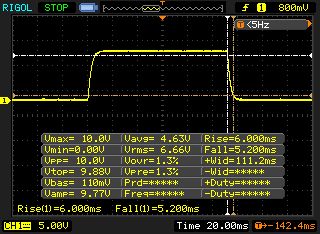 |
| ↘ 5.2 ms hösten | ||
| Skärmen visar bra svarsfrekvens i våra tester, men kan vara för långsam för konkurrenskraftiga spelare. I jämförelse sträcker sig alla testade enheter från 0.1 (minst) till 240 (maximalt) ms. » 30 % av alla enheter är bättre. Det betyder att den uppmätta svarstiden är bättre än genomsnittet av alla testade enheter (19.9 ms). | ||
| ↔ Svarstid 50 % grått till 80 % grått | ||
| 17.6 ms ... stiga ↗ och falla ↘ kombinerat | ↗ 8.4 ms stiga | 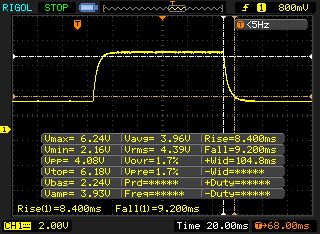 |
| ↘ 9.2 ms hösten | ||
| Skärmen visar bra svarsfrekvens i våra tester, men kan vara för långsam för konkurrenskraftiga spelare. I jämförelse sträcker sig alla testade enheter från 0.165 (minst) till 636 (maximalt) ms. » 31 % av alla enheter är bättre. Det betyder att den uppmätta svarstiden är bättre än genomsnittet av alla testade enheter (31.1 ms). | ||
Skärmflimmer / PWM (Puls-Width Modulation)
| Skärmflimmer / PWM upptäckt | 25510 Hz | ≤ 44 % ljusstyrka inställning | 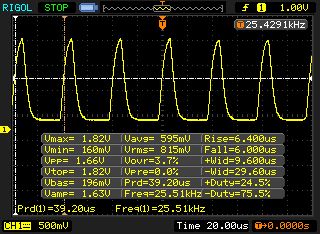 |
Displayens bakgrundsbelysning flimrar vid 25510 Hz (i värsta fall, t.ex. med PWM) Flimrande upptäckt vid en ljusstyrkeinställning på 44 % och lägre. Det ska inte finnas något flimmer eller PWM över denna ljusstyrkeinställning. Frekvensen för 25510 Hz är ganska hög, så de flesta användare som är känsliga för PWM bör inte märka något flimmer. Som jämförelse: 52 % av alla testade enheter använder inte PWM för att dämpa skärmen. Om PWM upptäcktes mättes ett medelvärde av 7784 (minst: 5 - maximum: 343500) Hz. | |||
| HP Omen 17-cb0020ng 2x Samsung SSD PM981 MZVLB512HAJQ (RAID 0) | MSI GE75 9SG Samsung SSD PM981 MZVLB1T0HALR | MSI GT76 Titan DT 9SG 2x Samsung PM961 MZVLW256HEHP (RAID 0) | Schenker XMG Ultra 17 Turing Samsung SSD 970 EVO Plus 500GB | Alienware Area-51m i9-9900K RTX 2080 2x SK Hynix PC400 512GB (RAID 0) | |
|---|---|---|---|---|---|
| CrystalDiskMark 5.2 / 6 | -13% | -11% | 11% | 5% | |
| Write 4K (MB/s) | 103.8 | 116.1 12% | 101.4 -2% | 183.2 76% | 111.1 7% |
| Read 4K (MB/s) | 41.67 | 44.98 8% | 40.57 -3% | 52.4 26% | 45.47 9% |
| Write Seq (MB/s) | 2639 | 2370 -10% | 2229 -16% | 1790 -32% | 2454 -7% |
| Read Seq (MB/s) | 2702 | 1465 -46% | 2528 -6% | 1743 -35% | 2212 -18% |
| Write 4K Q32T1 (MB/s) | 487.3 | 337.5 -31% | 379.6 -22% | 550 13% | 622 28% |
| Read 4K Q32T1 (MB/s) | 555 | 453.6 -18% | 421.9 -24% | 648 17% | 695 25% |
| Write Seq Q32T1 (MB/s) | 2967 | 2399 -19% | 2439 -18% | 3236 9% | 2675 -10% |
| Read Seq Q32T1 (MB/s) | 3102 | 3087 0% | 3199 3% | 3538 14% | 3184 3% |

| 3DMark 11 Performance | 25017 poäng | |
| 3DMark Cloud Gate Standard Score | 44234 poäng | |
| 3DMark Fire Strike Score | 19351 poäng | |
| 3DMark Time Spy Score | 9177 poäng | |
Hjälp | ||
| The Witcher 3 - 1920x1080 Ultra Graphics & Postprocessing (HBAO+) | |
| Genomsnitt av klass Gaming (95 - 240, n=8, senaste 2 åren) | |
| Alienware Area-51m i9-9900K RTX 2080 | |
| MSI GT76 Titan DT 9SG | |
| Genomsnitt NVIDIA GeForce RTX 2080 Mobile (82.2 - 105, n=16) | |
| MSI GE75 9SG | |
| Schenker XMG Ultra 17 Turing | |
| HP Omen 17-cb0020ng | |
| låg | med. | hög | ultra | |
|---|---|---|---|---|
| The Witcher 3 (2015) | 173 | 91.7 | ||
| Hitman 2 (2018) | 81.2 | 78.5 | ||
| Farming Simulator 19 (2018) | 153 | 140 | ||
| Just Cause 4 (2018) | 117 | 100 | ||
| Apex Legends (2019) | 144 | 144 | ||
| Far Cry New Dawn (2019) | 105 | 93 | ||
| Metro Exodus (2019) | 81.9 | 67.7 | ||
| Anthem (2019) | 102 | 96 | ||
| Dirt Rally 2.0 (2019) | 167 | 98.3 | ||
| The Division 2 (2019) | 125 | 95 | ||
| Anno 1800 (2019) | 78.8 | 45.3 | ||
| Rage 2 (2019) | 118 | 117 | ||
| F1 2019 (2019) | 153 | 142 |
Ljudnivå
| Låg belastning |
| 34 / 35 / 36 dB(A) |
| Hårddisk |
| 33 dB(A) |
| Hög belastning |
| 51 / 51 dB(A) |
 | ||
30 dB tyst 40 dB(A) hörbar 50 dB(A) högt ljud |
||
min: | ||
| HP Omen 17-cb0020ng i9-9880H, GeForce RTX 2080 Mobile | MSI GE75 9SG i9-9880H, GeForce RTX 2080 Mobile | MSI GT76 Titan DT 9SG i9-9900K, GeForce RTX 2080 Mobile | Schenker XMG Ultra 17 Turing i9-9900K, GeForce RTX 2080 Mobile | Alienware Area-51m i9-9900K RTX 2080 i9-9900K, GeForce RTX 2080 Mobile | Genomsnitt av klass Gaming | |
|---|---|---|---|---|---|---|
| Noise | 5% | -5% | 1% | -1% | 16% | |
| av / miljö * (dB) | 30 | 28.2 6% | 30 -0% | 30 -0% | 28.1 6% | 24.1 ? 20% |
| Idle Minimum * (dB) | 34 | 30.4 11% | 33 3% | 30 12% | 28.1 17% | 25.8 ? 24% |
| Idle Average * (dB) | 35 | 30.4 13% | 34 3% | 33 6% | 28.6 18% | 27.4 ? 22% |
| Idle Maximum * (dB) | 36 | 33.4 7% | 44 -22% | 35 3% | 51 -42% | 29.9 ? 17% |
| Load Average * (dB) | 51 | 37.1 27% | 47 8% | 44 14% | 51 -0% | 43 ? 16% |
| Witcher 3 ultra * (dB) | 47 | 54.2 -15% | 53 -13% | 55 -17% | 51 -9% | |
| Load Maximum * (dB) | 51 | 56.4 -11% | 59 -16% | 58 -14% | 51 -0% | 54 ? -6% |
* ... mindre är bättre
(-) Den maximala temperaturen på ovansidan är 47 °C / 117 F, jämfört med genomsnittet av 40.4 °C / 105 F , allt från 21.2 till 68.8 °C för klassen Gaming.
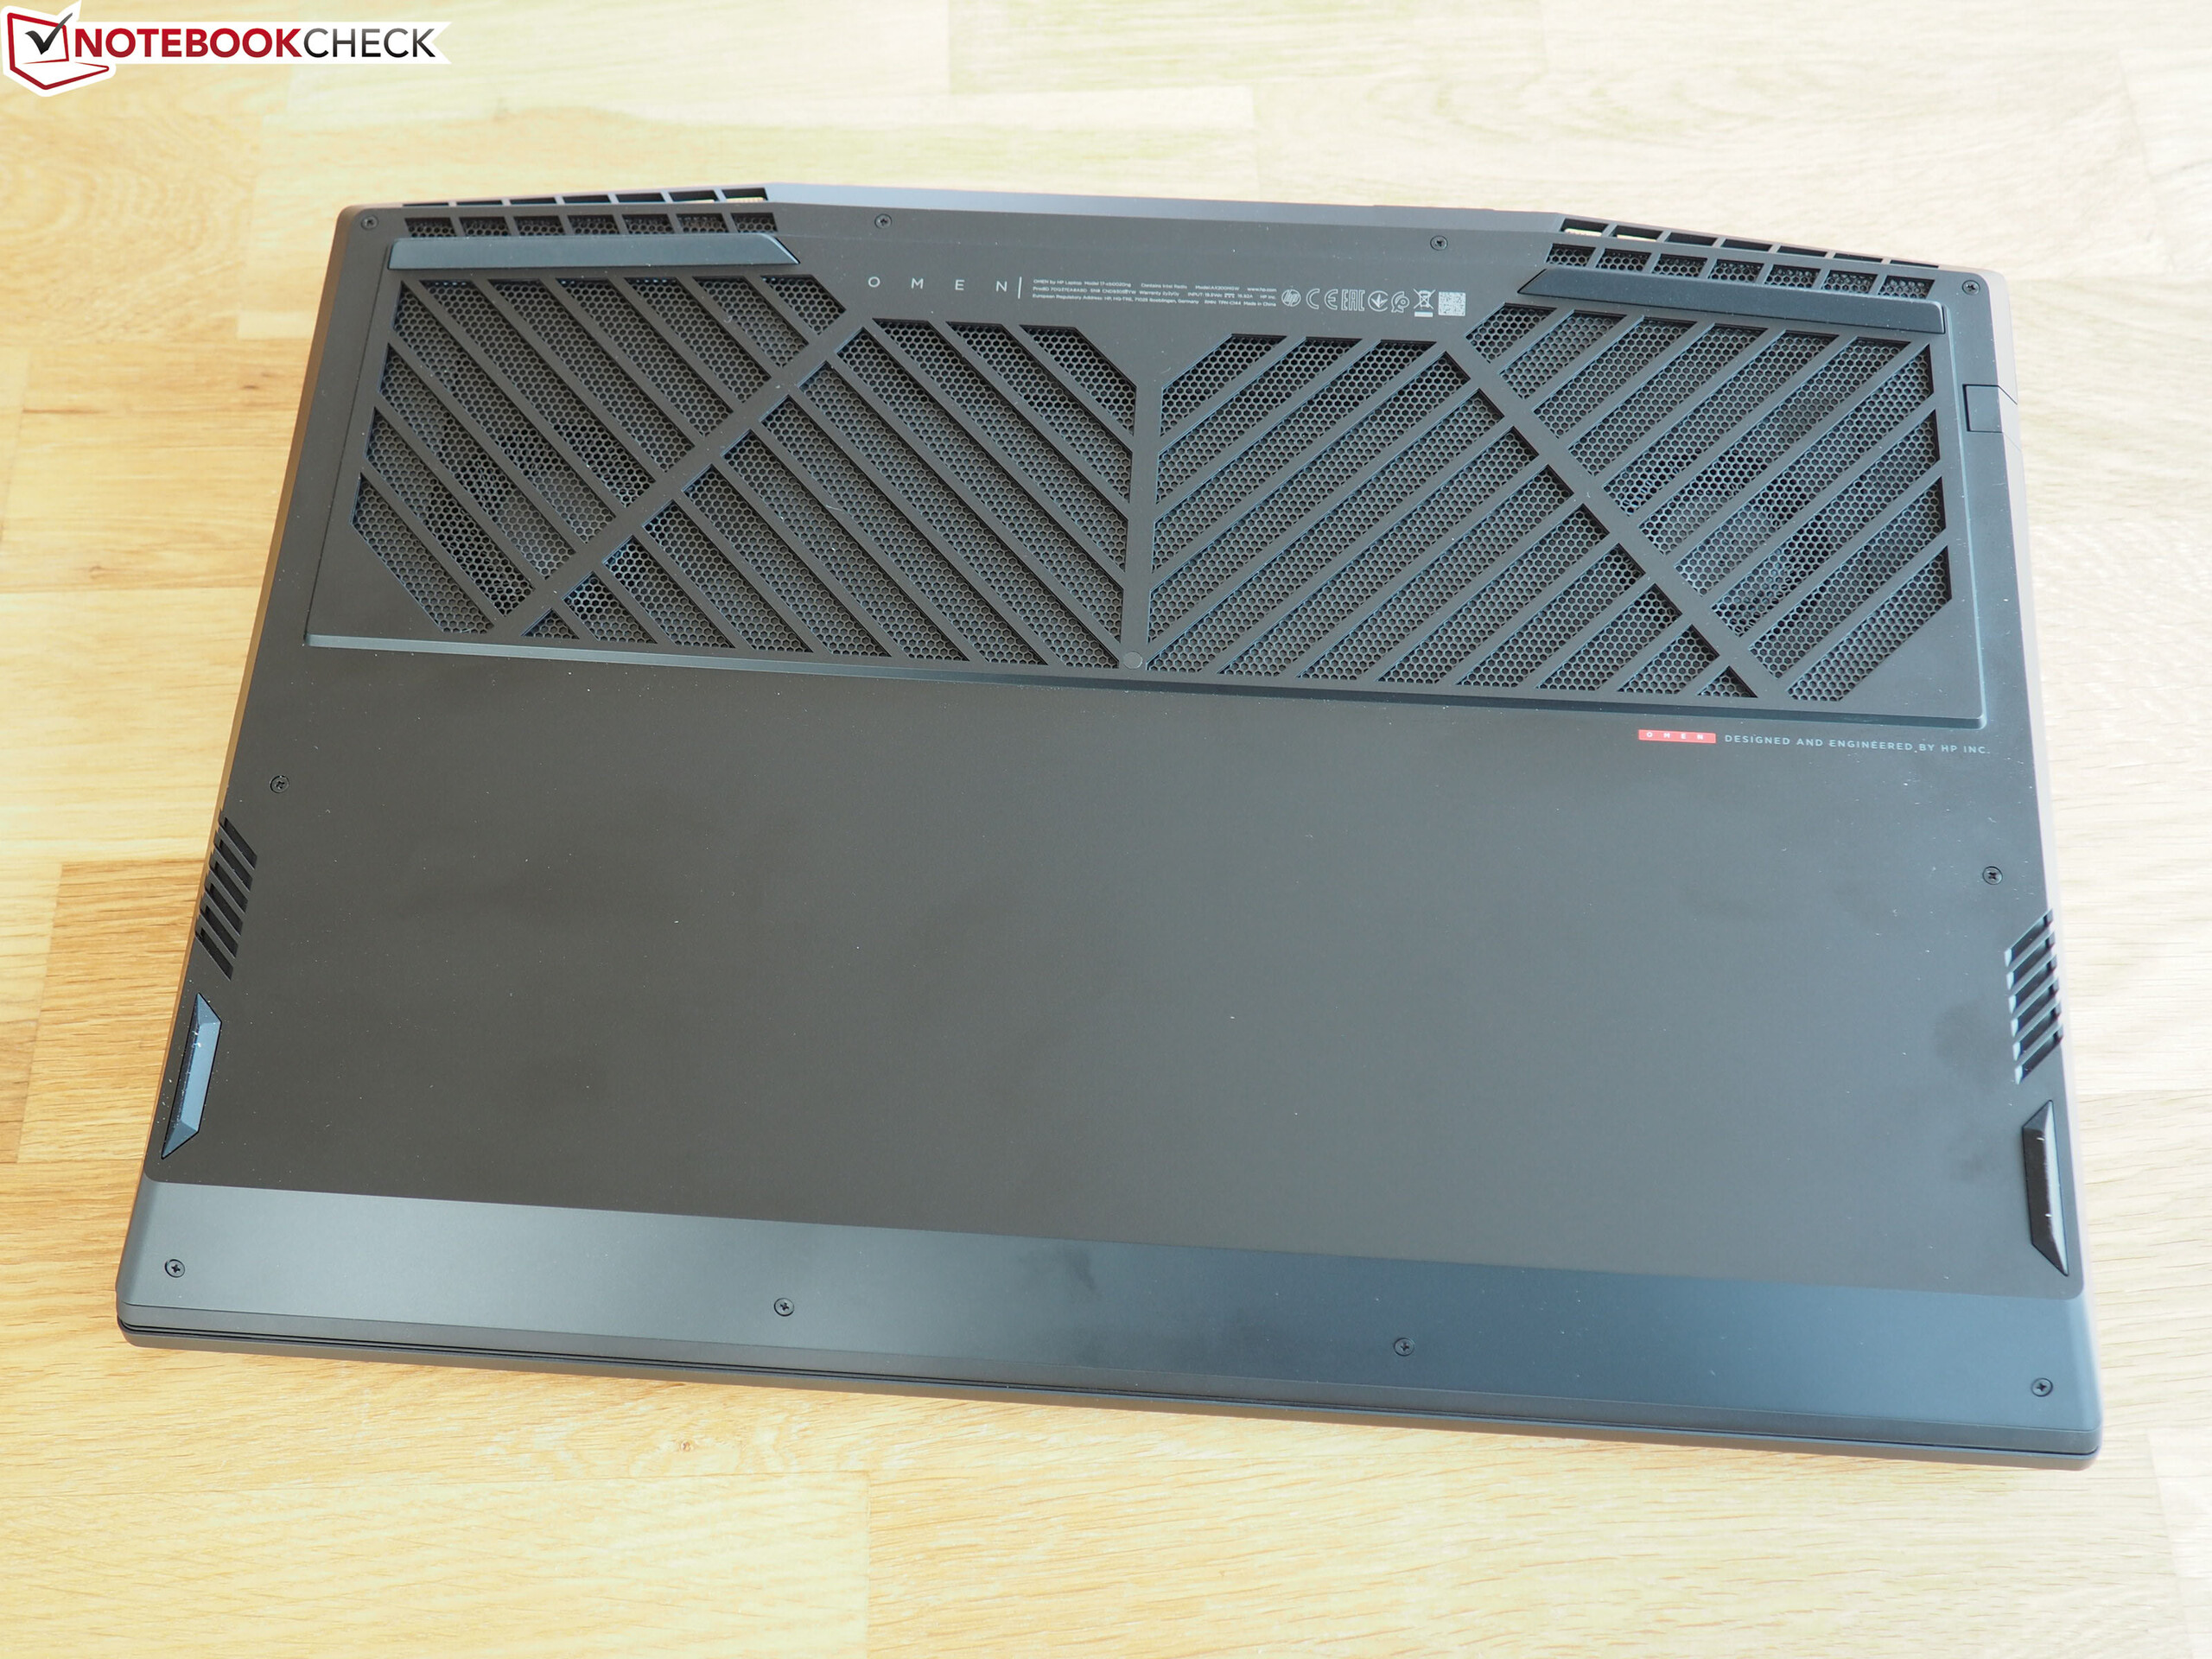
(-) Botten värms upp till maximalt 54 °C / 129 F, jämfört med genomsnittet av 43.2 °C / 110 F
(+) Vid tomgångsbruk är medeltemperaturen för ovansidan 29.2 °C / 85 F, jämfört med enhetsgenomsnittet på 33.9 °C / ### class_avg_f### F.
(-) När du spelar The Witcher 3 är medeltemperaturen för ovansidan 42.6 °C / 109 F, jämfört med enhetsgenomsnittet på 33.9 °C / ## #class_avg_f### F.
(±) Handledsstöden och pekplattan kan bli väldigt varma vid beröring med maximalt 38 °C / 100.4 F.
(-) Medeltemperaturen för handledsstödsområdet på liknande enheter var 28.8 °C / 83.8 F (-9.2 °C / -16.6 F).
| HP Omen 17-cb0020ng i9-9880H, GeForce RTX 2080 Mobile | MSI GE75 9SG i9-9880H, GeForce RTX 2080 Mobile | MSI GT76 Titan DT 9SG i9-9900K, GeForce RTX 2080 Mobile | Schenker XMG Ultra 17 Turing i9-9900K, GeForce RTX 2080 Mobile | Alienware Area-51m i9-9900K RTX 2080 i9-9900K, GeForce RTX 2080 Mobile | Genomsnitt av klass Gaming | |
|---|---|---|---|---|---|---|
| Heat | -15% | 3% | -1% | -6% | 1% | |
| Maximum Upper Side * (°C) | 47 | 48.8 -4% | 51 -9% | 45 4% | 47 -0% | 45.2 ? 4% |
| Maximum Bottom * (°C) | 54 | 52 4% | 57 -6% | 45 17% | 58.8 -9% | 47.9 ? 11% |
| Idle Upper Side * (°C) | 32 | 36.2 -13% | 26 19% | 36 -13% | 31 3% | 31.1 ? 3% |
| Idle Bottom * (°C) | 30 | 44.4 -48% | 28 7% | 33 -10% | 35 -17% | 34.2 ? -14% |
* ... mindre är bättre
HP Omen 17-cb0020ng ljudanalys
(±) | högtalarljudstyrkan är genomsnittlig men bra (78 dB)
Bas 100 - 315 Hz
(±) | reducerad bas - i genomsnitt 13.7% lägre än medianen
(±) | linjäriteten för basen är genomsnittlig (10.5% delta till föregående frekvens)
Mellan 400 - 2000 Hz
(+) | balanserad mellan - endast 2% från medianen
(+) | mids är linjära (5.2% delta till föregående frekvens)
Högsta 2 - 16 kHz
(+) | balanserade toppar - endast 4.8% från medianen
(±) | linjäriteten för toppar är genomsnittlig (10.1% delta till föregående frekvens)
Totalt 100 - 16 000 Hz
(±) | linjäriteten för det totala ljudet är genomsnittlig (15.1% skillnad mot median)
Jämfört med samma klass
» 32% av alla testade enheter i den här klassen var bättre, 6% liknande, 62% sämre
» Den bästa hade ett delta på 6%, genomsnittet var 18%, sämst var 132%
Jämfört med alla testade enheter
» 21% av alla testade enheter var bättre, 4% liknande, 75% sämre
» Den bästa hade ett delta på 4%, genomsnittet var 24%, sämst var 134%
MSI GE75 9SG ljudanalys
(+) | högtalare kan spela relativt högt (92.8 dB)
Bas 100 - 315 Hz
(±) | reducerad bas - i genomsnitt 12.2% lägre än medianen
(±) | linjäriteten för basen är genomsnittlig (8.7% delta till föregående frekvens)
Mellan 400 - 2000 Hz
(±) | högre mellan - i genomsnitt 6.7% högre än median
(±) | linjäriteten för mids är genomsnittlig (11.5% delta till föregående frekvens)
Högsta 2 - 16 kHz
(+) | balanserade toppar - endast 2.9% från medianen
(±) | linjäriteten för toppar är genomsnittlig (7.6% delta till föregående frekvens)
Totalt 100 - 16 000 Hz
(±) | linjäriteten för det totala ljudet är genomsnittlig (16.5% skillnad mot median)
Jämfört med samma klass
» 42% av alla testade enheter i den här klassen var bättre, 7% liknande, 51% sämre
» Den bästa hade ett delta på 6%, genomsnittet var 18%, sämst var 132%
Jämfört med alla testade enheter
» 28% av alla testade enheter var bättre, 6% liknande, 66% sämre
» Den bästa hade ett delta på 4%, genomsnittet var 24%, sämst var 134%
| Av/Standby | |
| Låg belastning | |
| Hög belastning |
|
Förklaring:
min: | |
| HP Omen 17-cb0020ng i9-9880H, GeForce RTX 2080 Mobile | MSI GE75 9SG i9-9880H, GeForce RTX 2080 Mobile | MSI GT76 Titan DT 9SG i9-9900K, GeForce RTX 2080 Mobile | Schenker XMG Ultra 17 Turing i9-9900K, GeForce RTX 2080 Mobile | Alienware Area-51m i9-9900K RTX 2080 i9-9900K, GeForce RTX 2080 Mobile | Genomsnitt av klass Gaming | |
|---|---|---|---|---|---|---|
| Power Consumption | 19% | 6% | -33% | -22% | 26% | |
| Idle Minimum * (Watt) | 26 | 13.9 47% | 14 46% | 39 -50% | 23.3 10% | 13.2 ? 49% |
| Idle Average * (Watt) | 29 | 18.8 35% | 18 38% | 45 -55% | 33.5 -16% | 18.9 ? 35% |
| Idle Maximum * (Watt) | 38 | 23.1 39% | 23 39% | 55 -45% | 38.4 -1% | 24.3 ? 36% |
| Load Average * (Watt) | 106 | 112.3 -6% | 114 -8% | 122 -15% | 114.1 -8% | 108.3 ? -2% |
| Witcher 3 ultra * (Watt) | 228 | 231 -1% | 283 -24% | 259 -14% | 339.5 -49% | |
| Load Maximum * (Watt) | 287 | 291.5 -2% | 443 -54% | 346 -21% | 485.1 -69% | 254 ? 11% |
* ... mindre är bättre
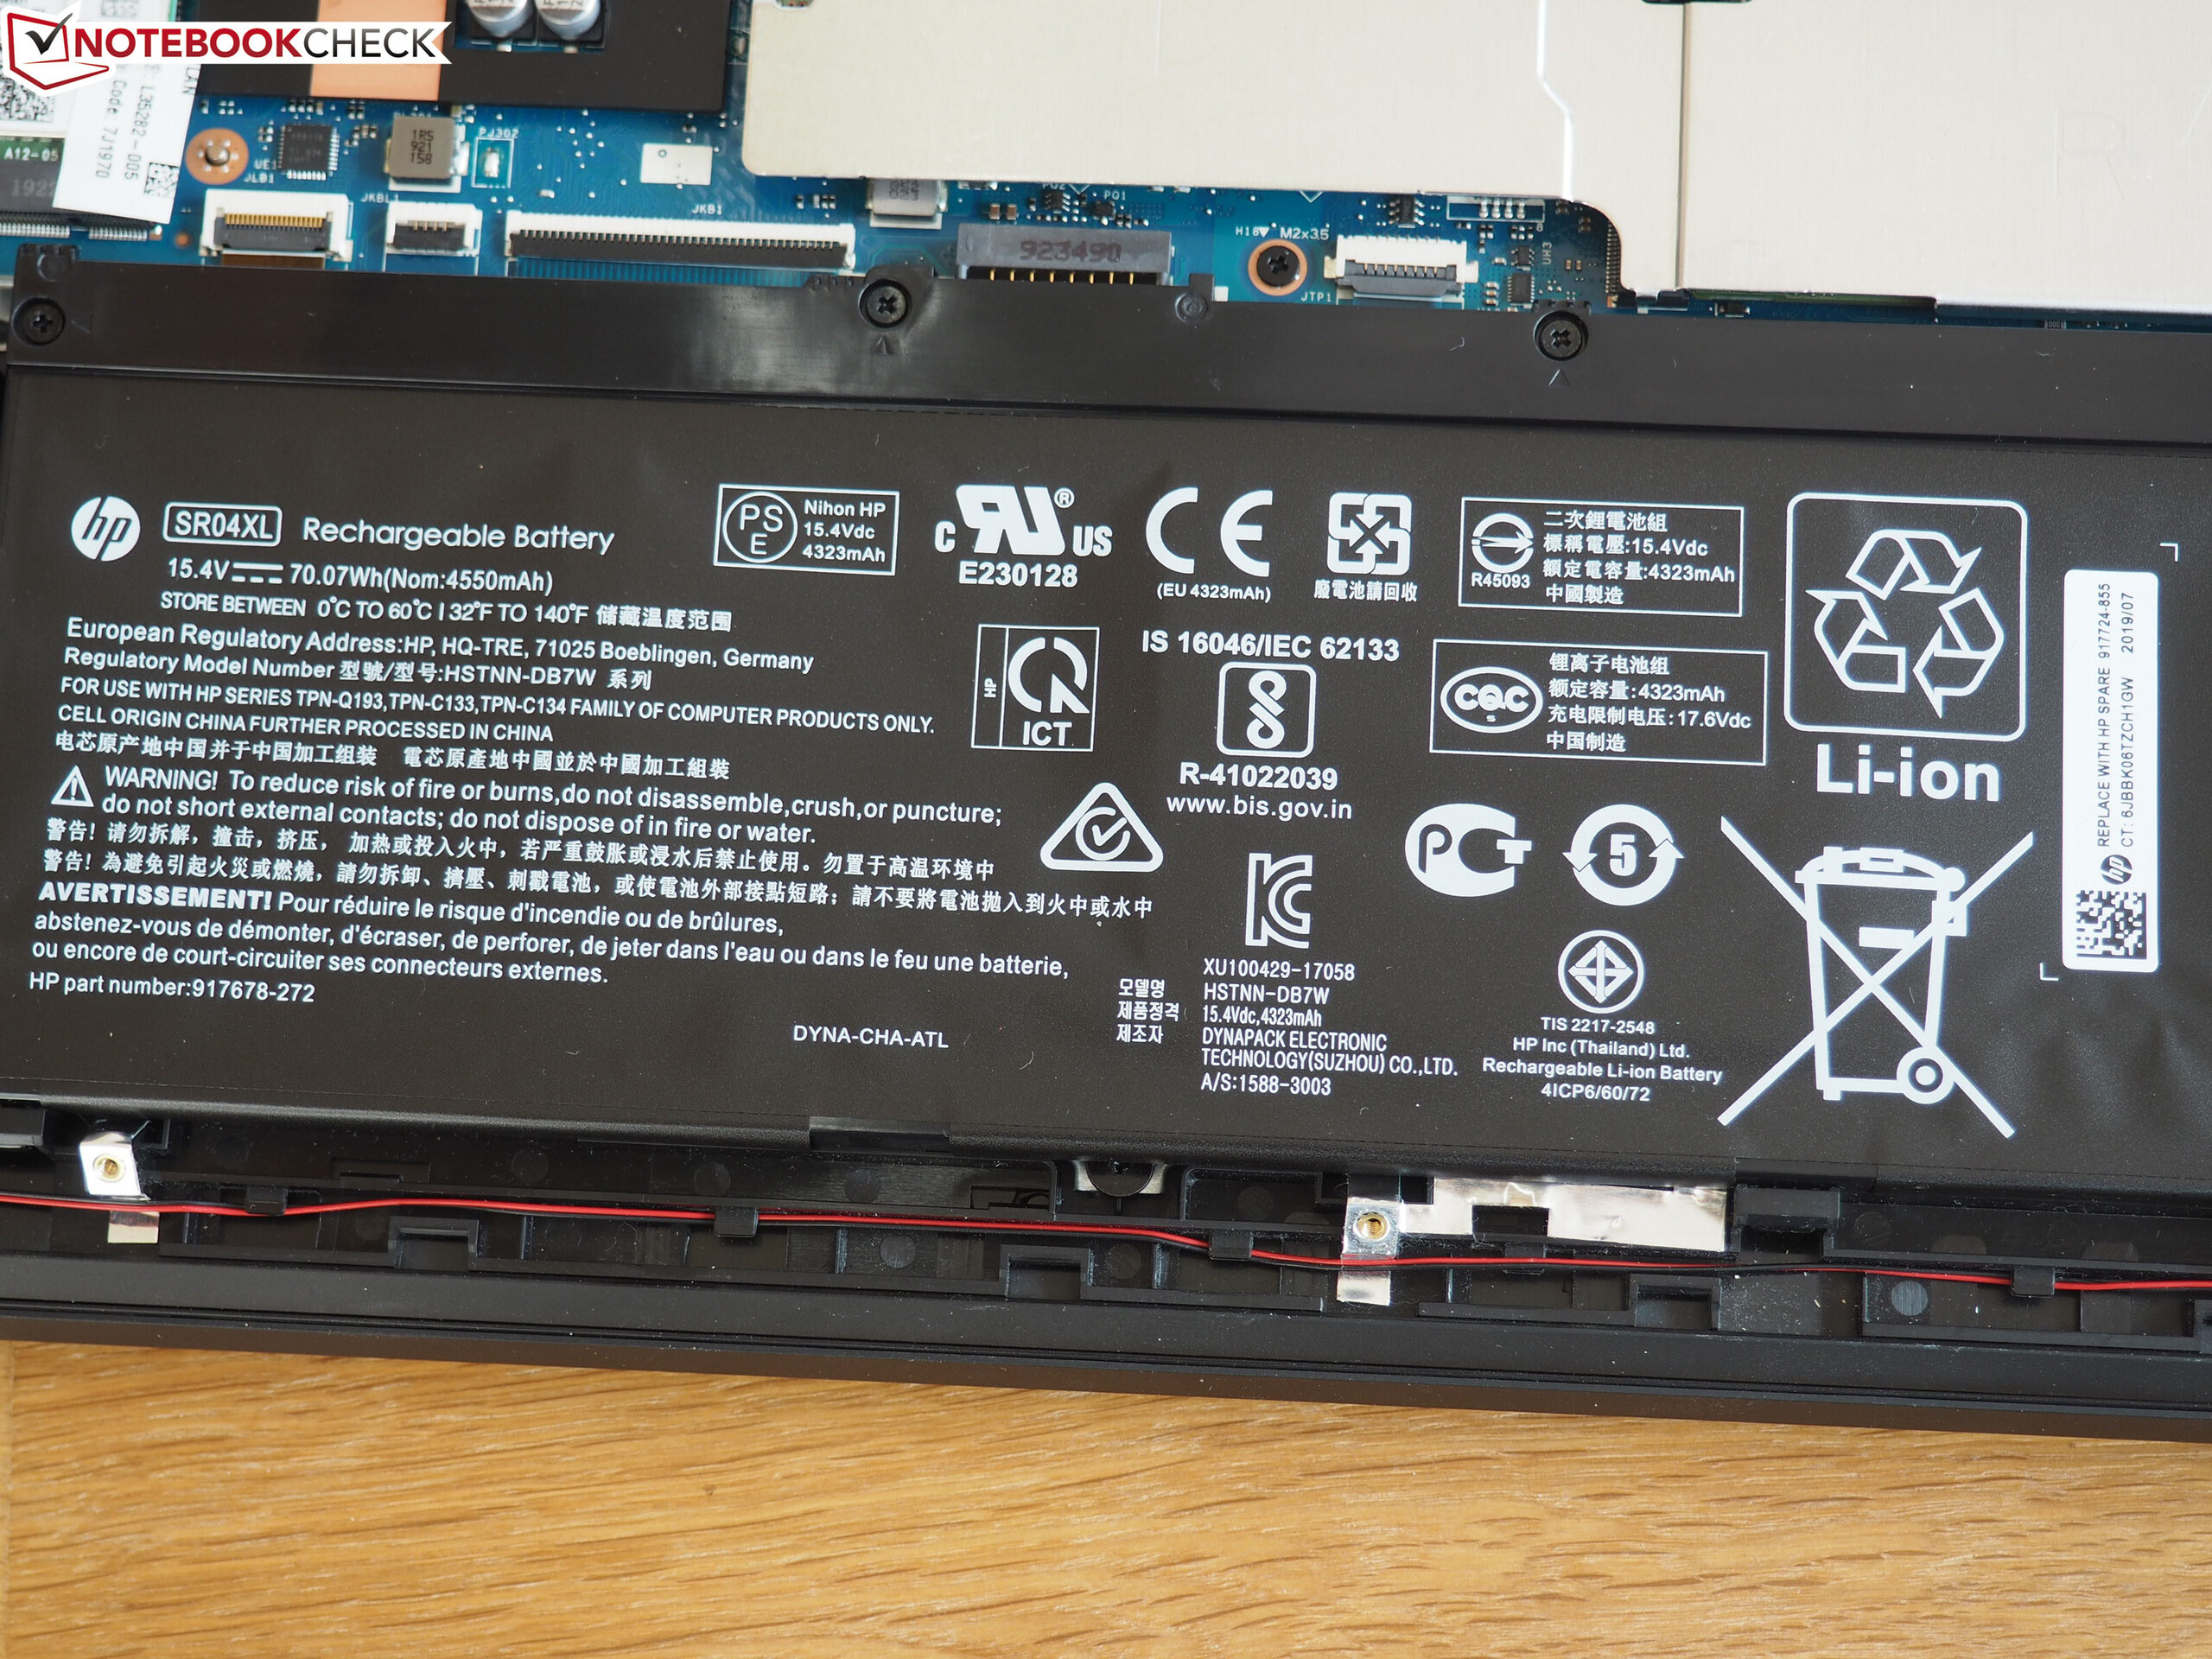
| HP Omen 17-cb0020ng i9-9880H, GeForce RTX 2080 Mobile, 70 Wh | MSI GE75 9SG i9-9880H, GeForce RTX 2080 Mobile, 65 Wh | MSI GT76 Titan DT 9SG i9-9900K, GeForce RTX 2080 Mobile, 90 Wh | Schenker XMG Ultra 17 Turing i9-9900K, GeForce RTX 2080 Mobile, 82 Wh | Alienware Area-51m i9-9900K RTX 2080 i9-9900K, GeForce RTX 2080 Mobile, 90 Wh | Genomsnitt av klass Gaming | |
|---|---|---|---|---|---|---|
| Batteridrifttid | 48% | 32% | -21% | -25% | 85% | |
| Reader / Idle (h) | 4.2 | 6.8 62% | 2.8 -33% | 2.6 -38% | 8.71 ? 107% | |
| WiFi v1.3 (h) | 3.3 | 4.9 48% | 5 52% | 2.3 -30% | 2.1 -36% | 7.04 ? 113% |
| Load (h) | 1.1 | 0.9 -18% | 1.1 0% | 1.1 0% | 1.47 ? 34% | |
| H.264 (h) | 2.3 | 8.26 ? |
För
Emot
Läs den fullständiga versionen av den här recensionen på engelska här.
I slutändan lyckas HP Omen 17-cb0020ng få toppbetyg.
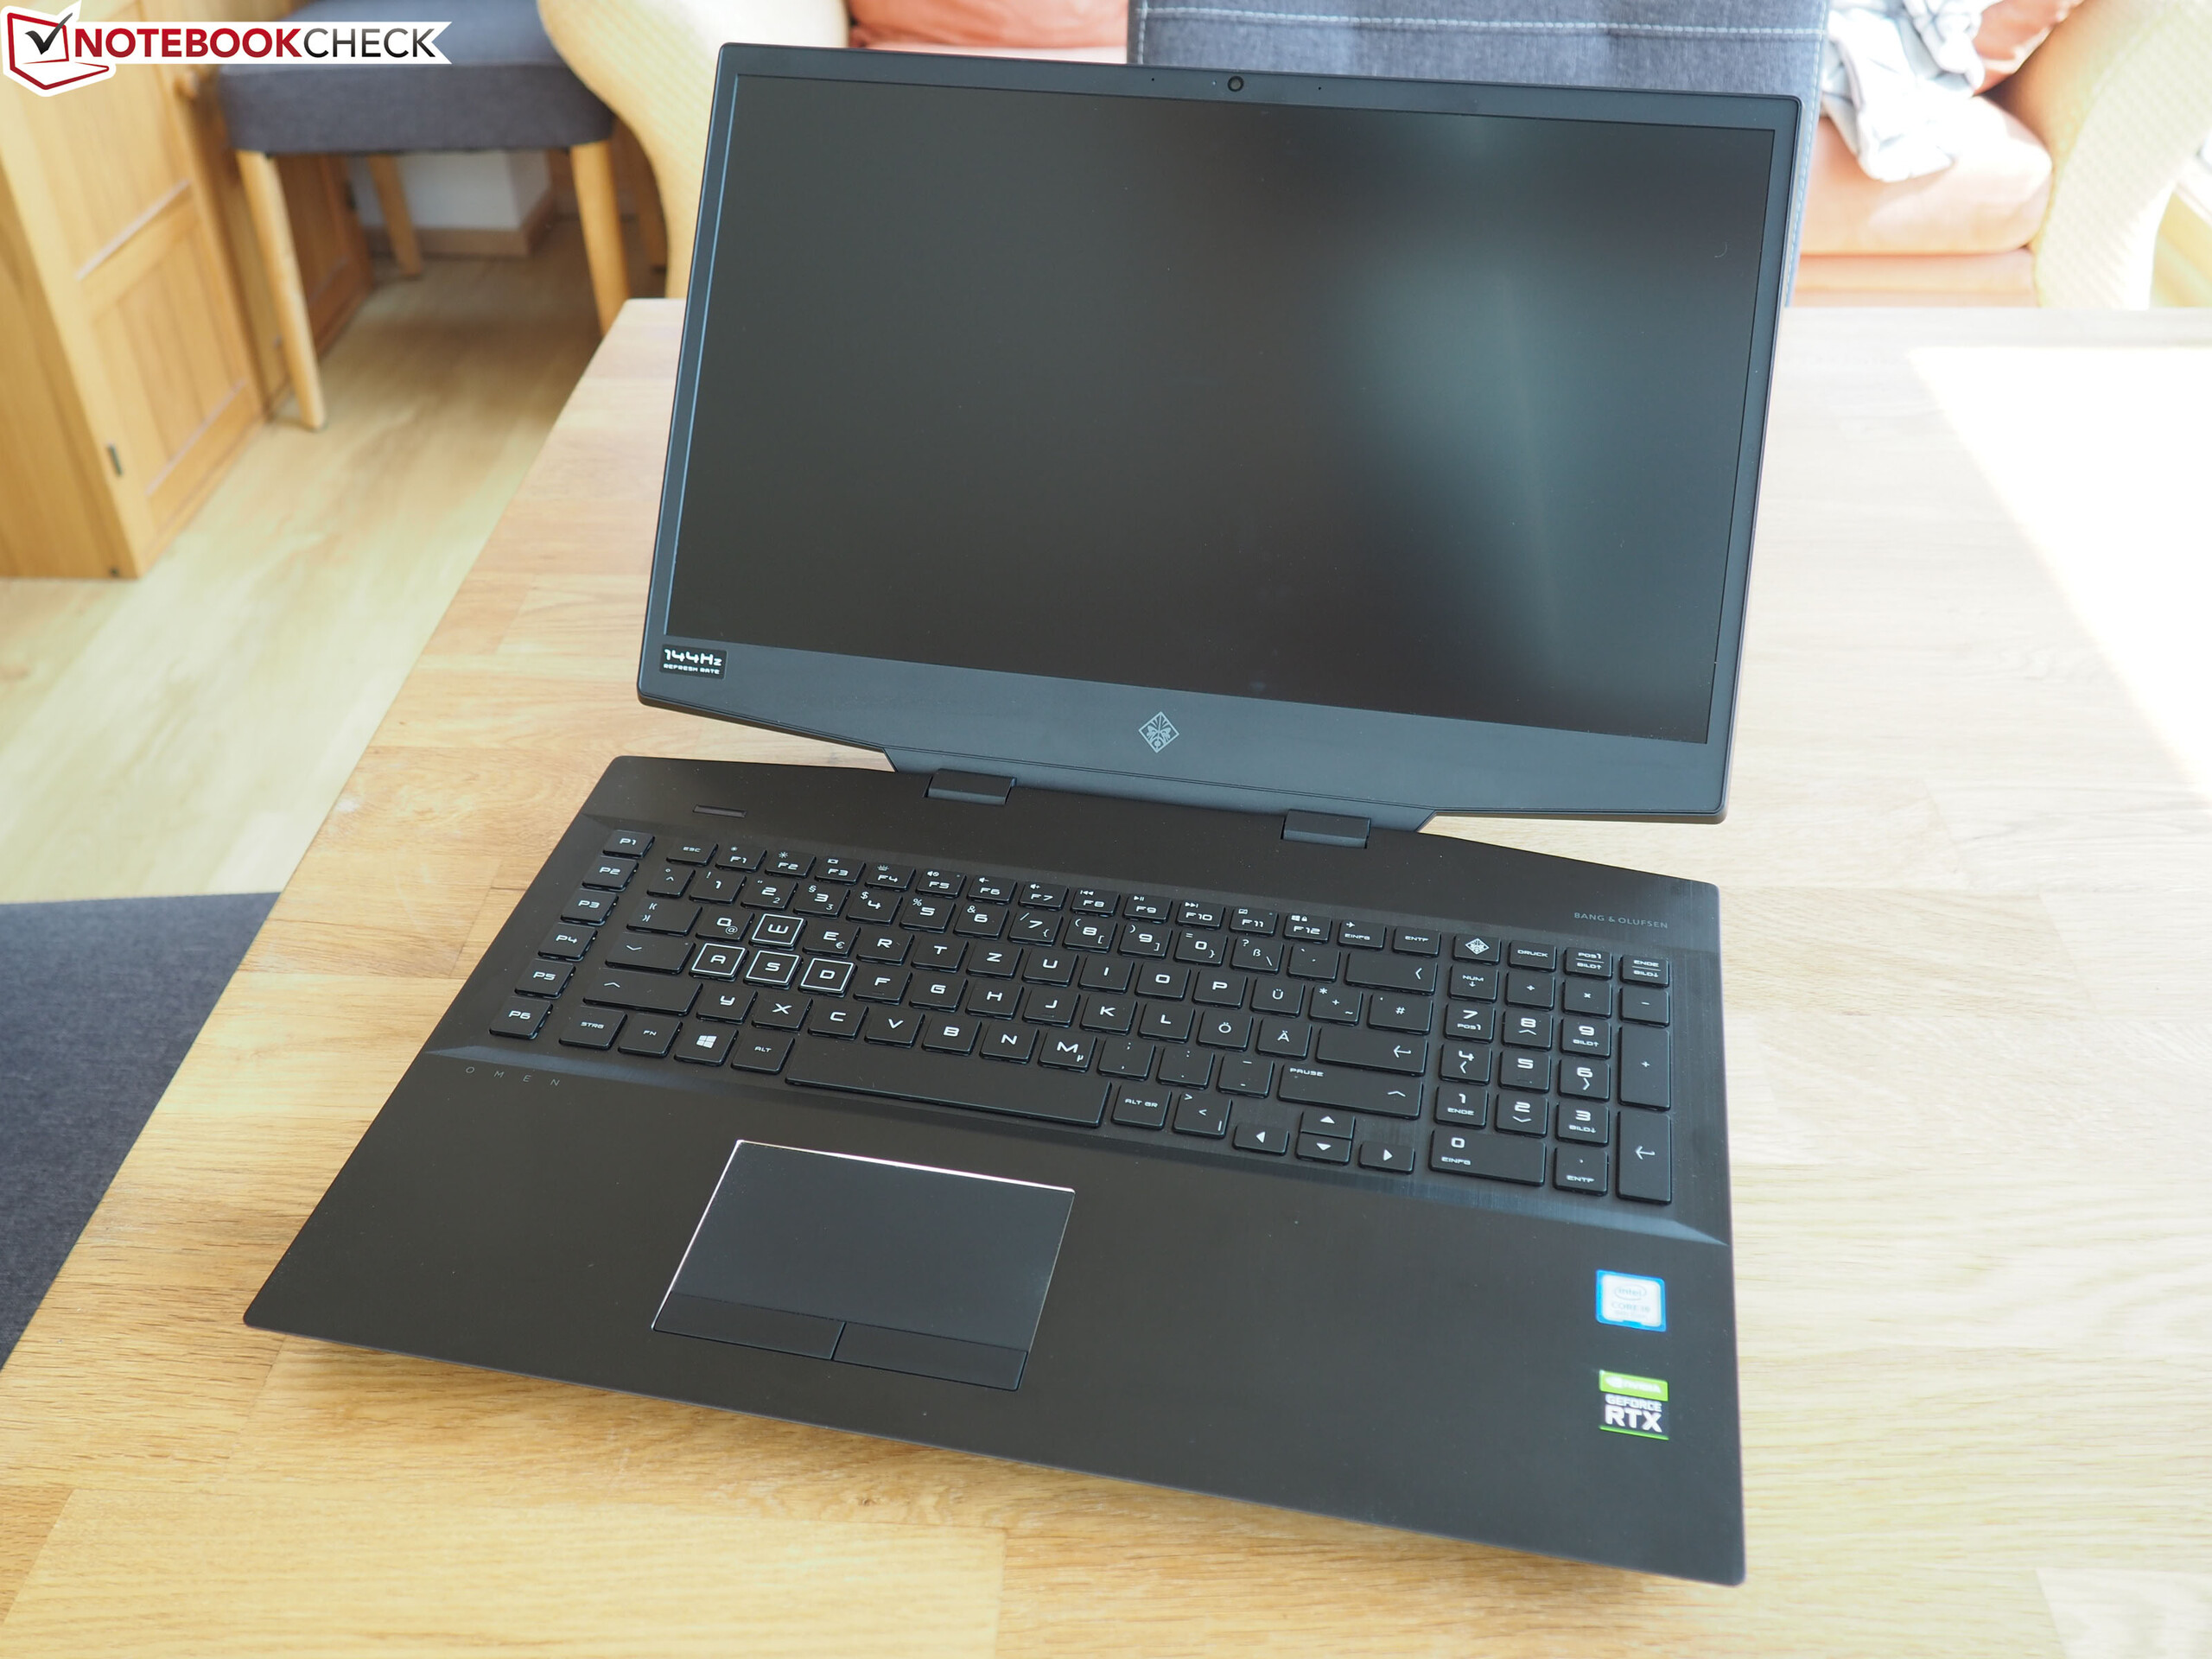
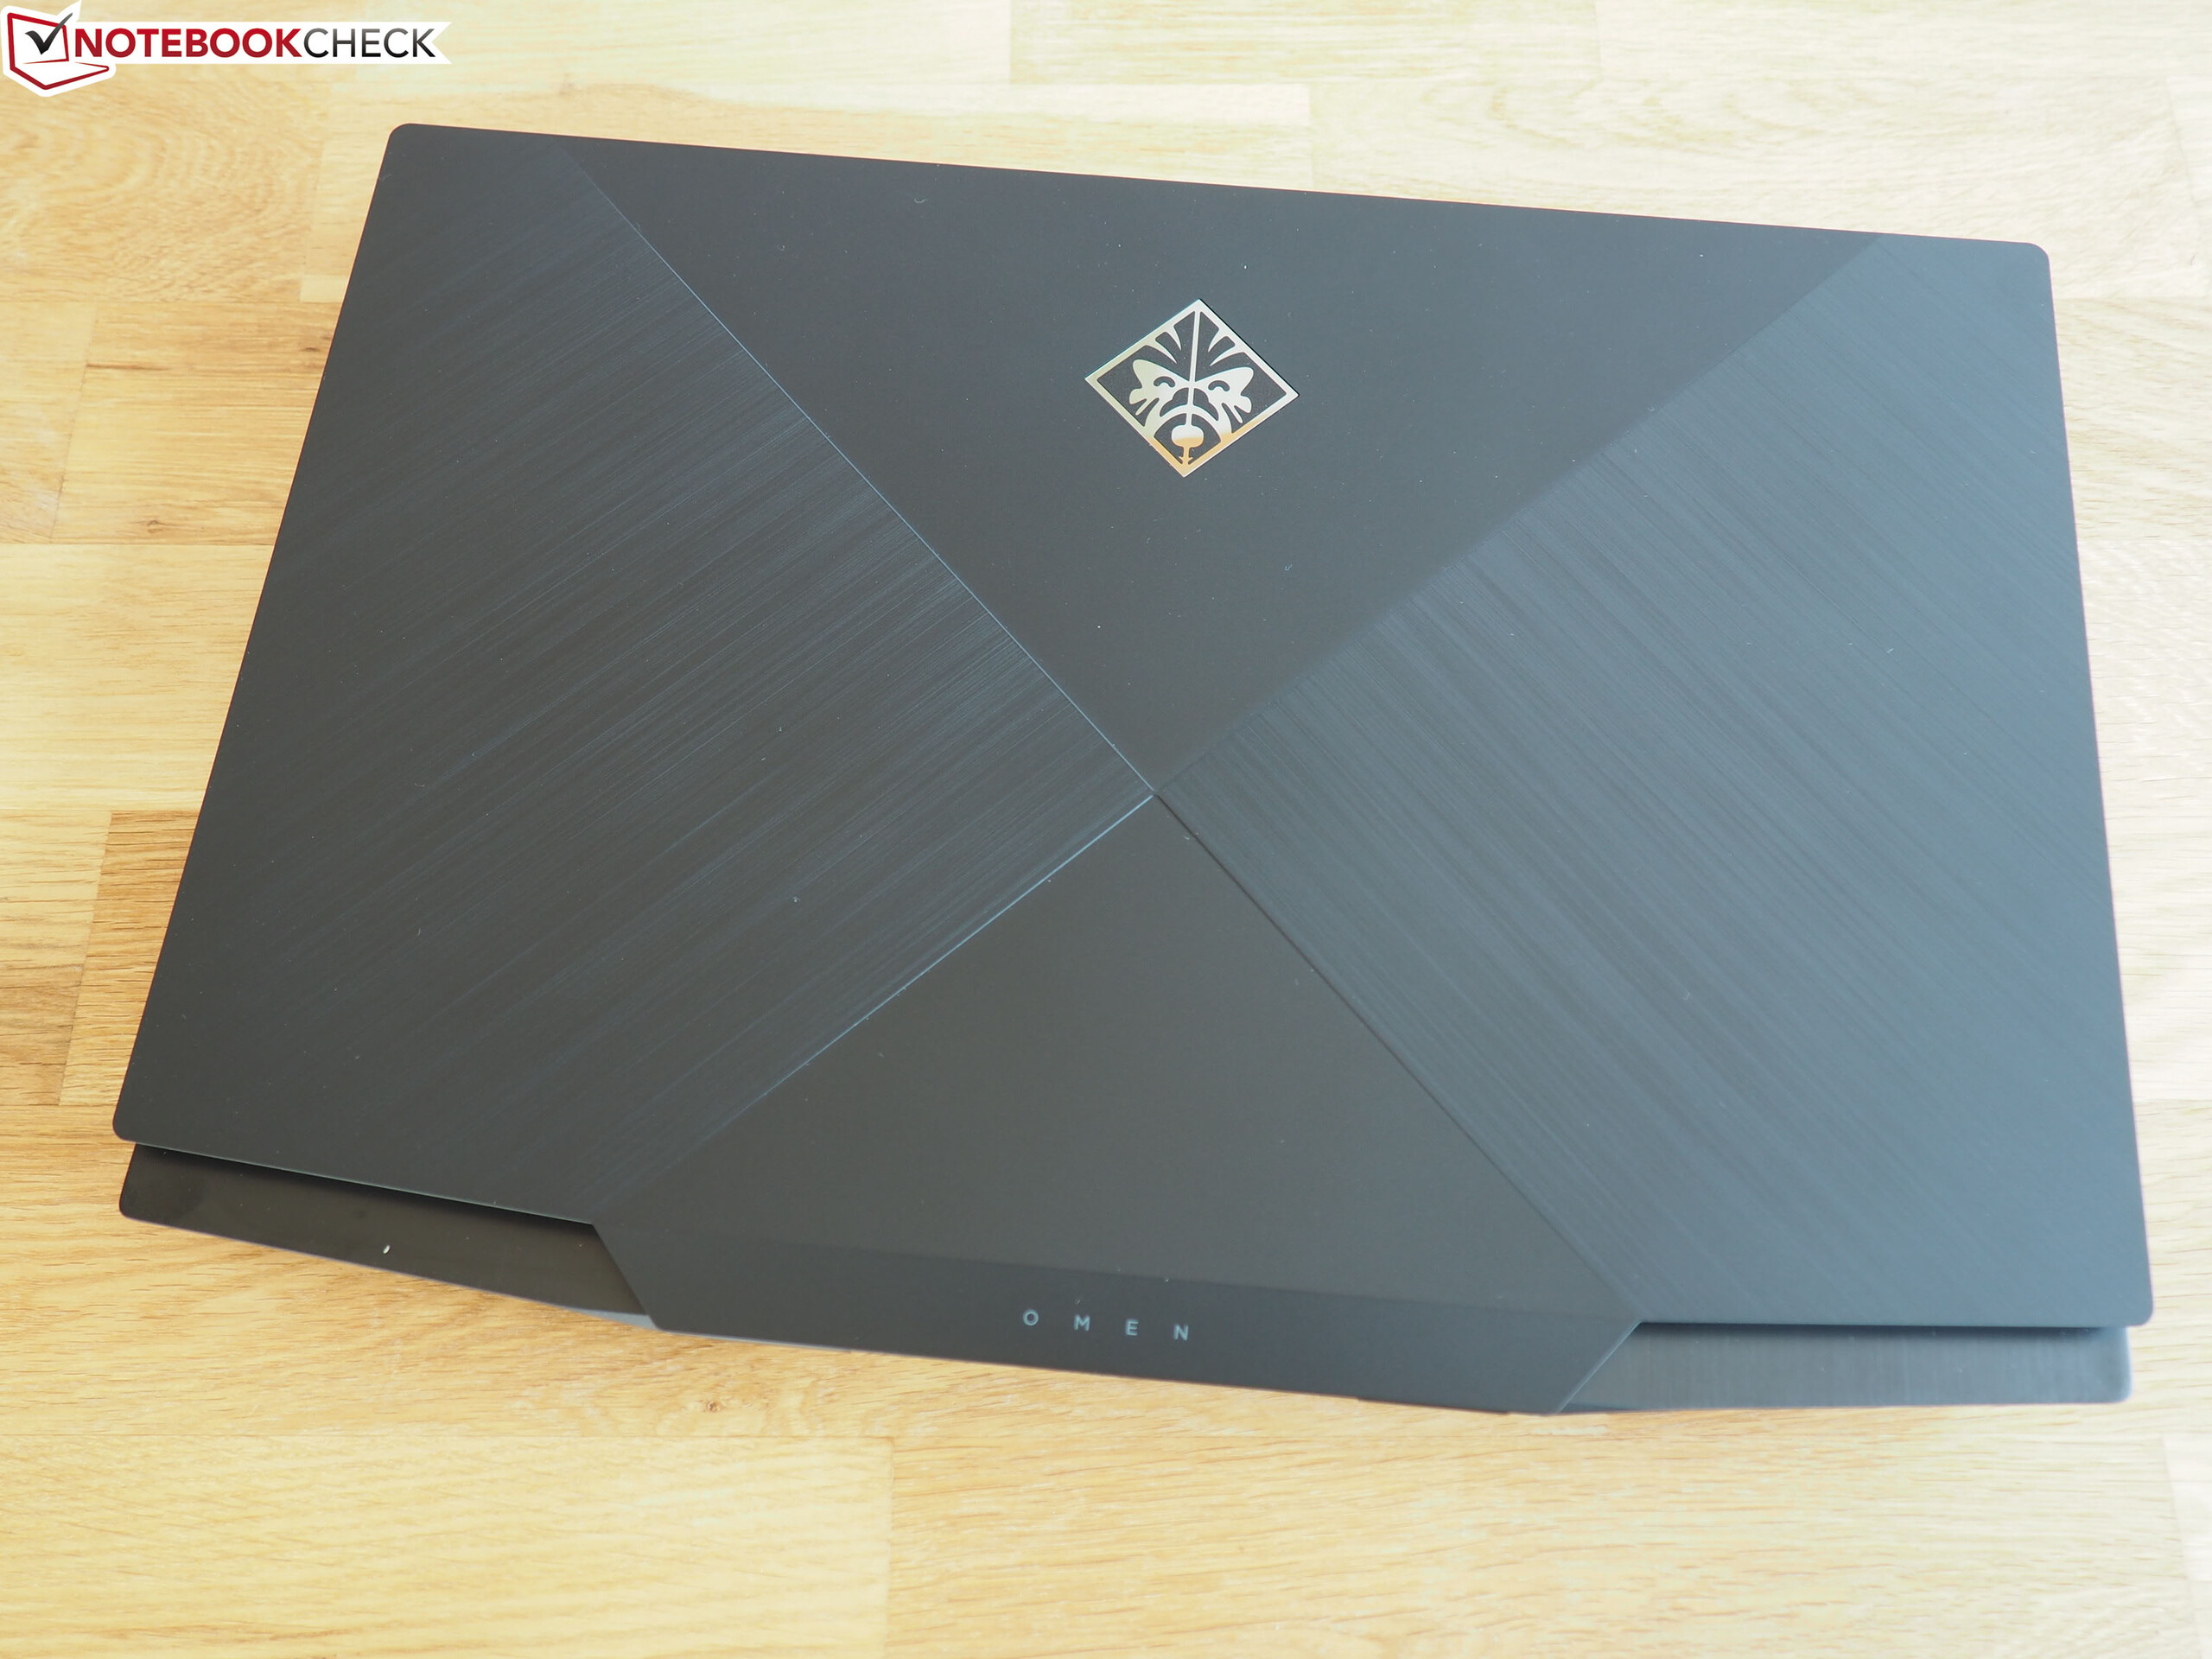
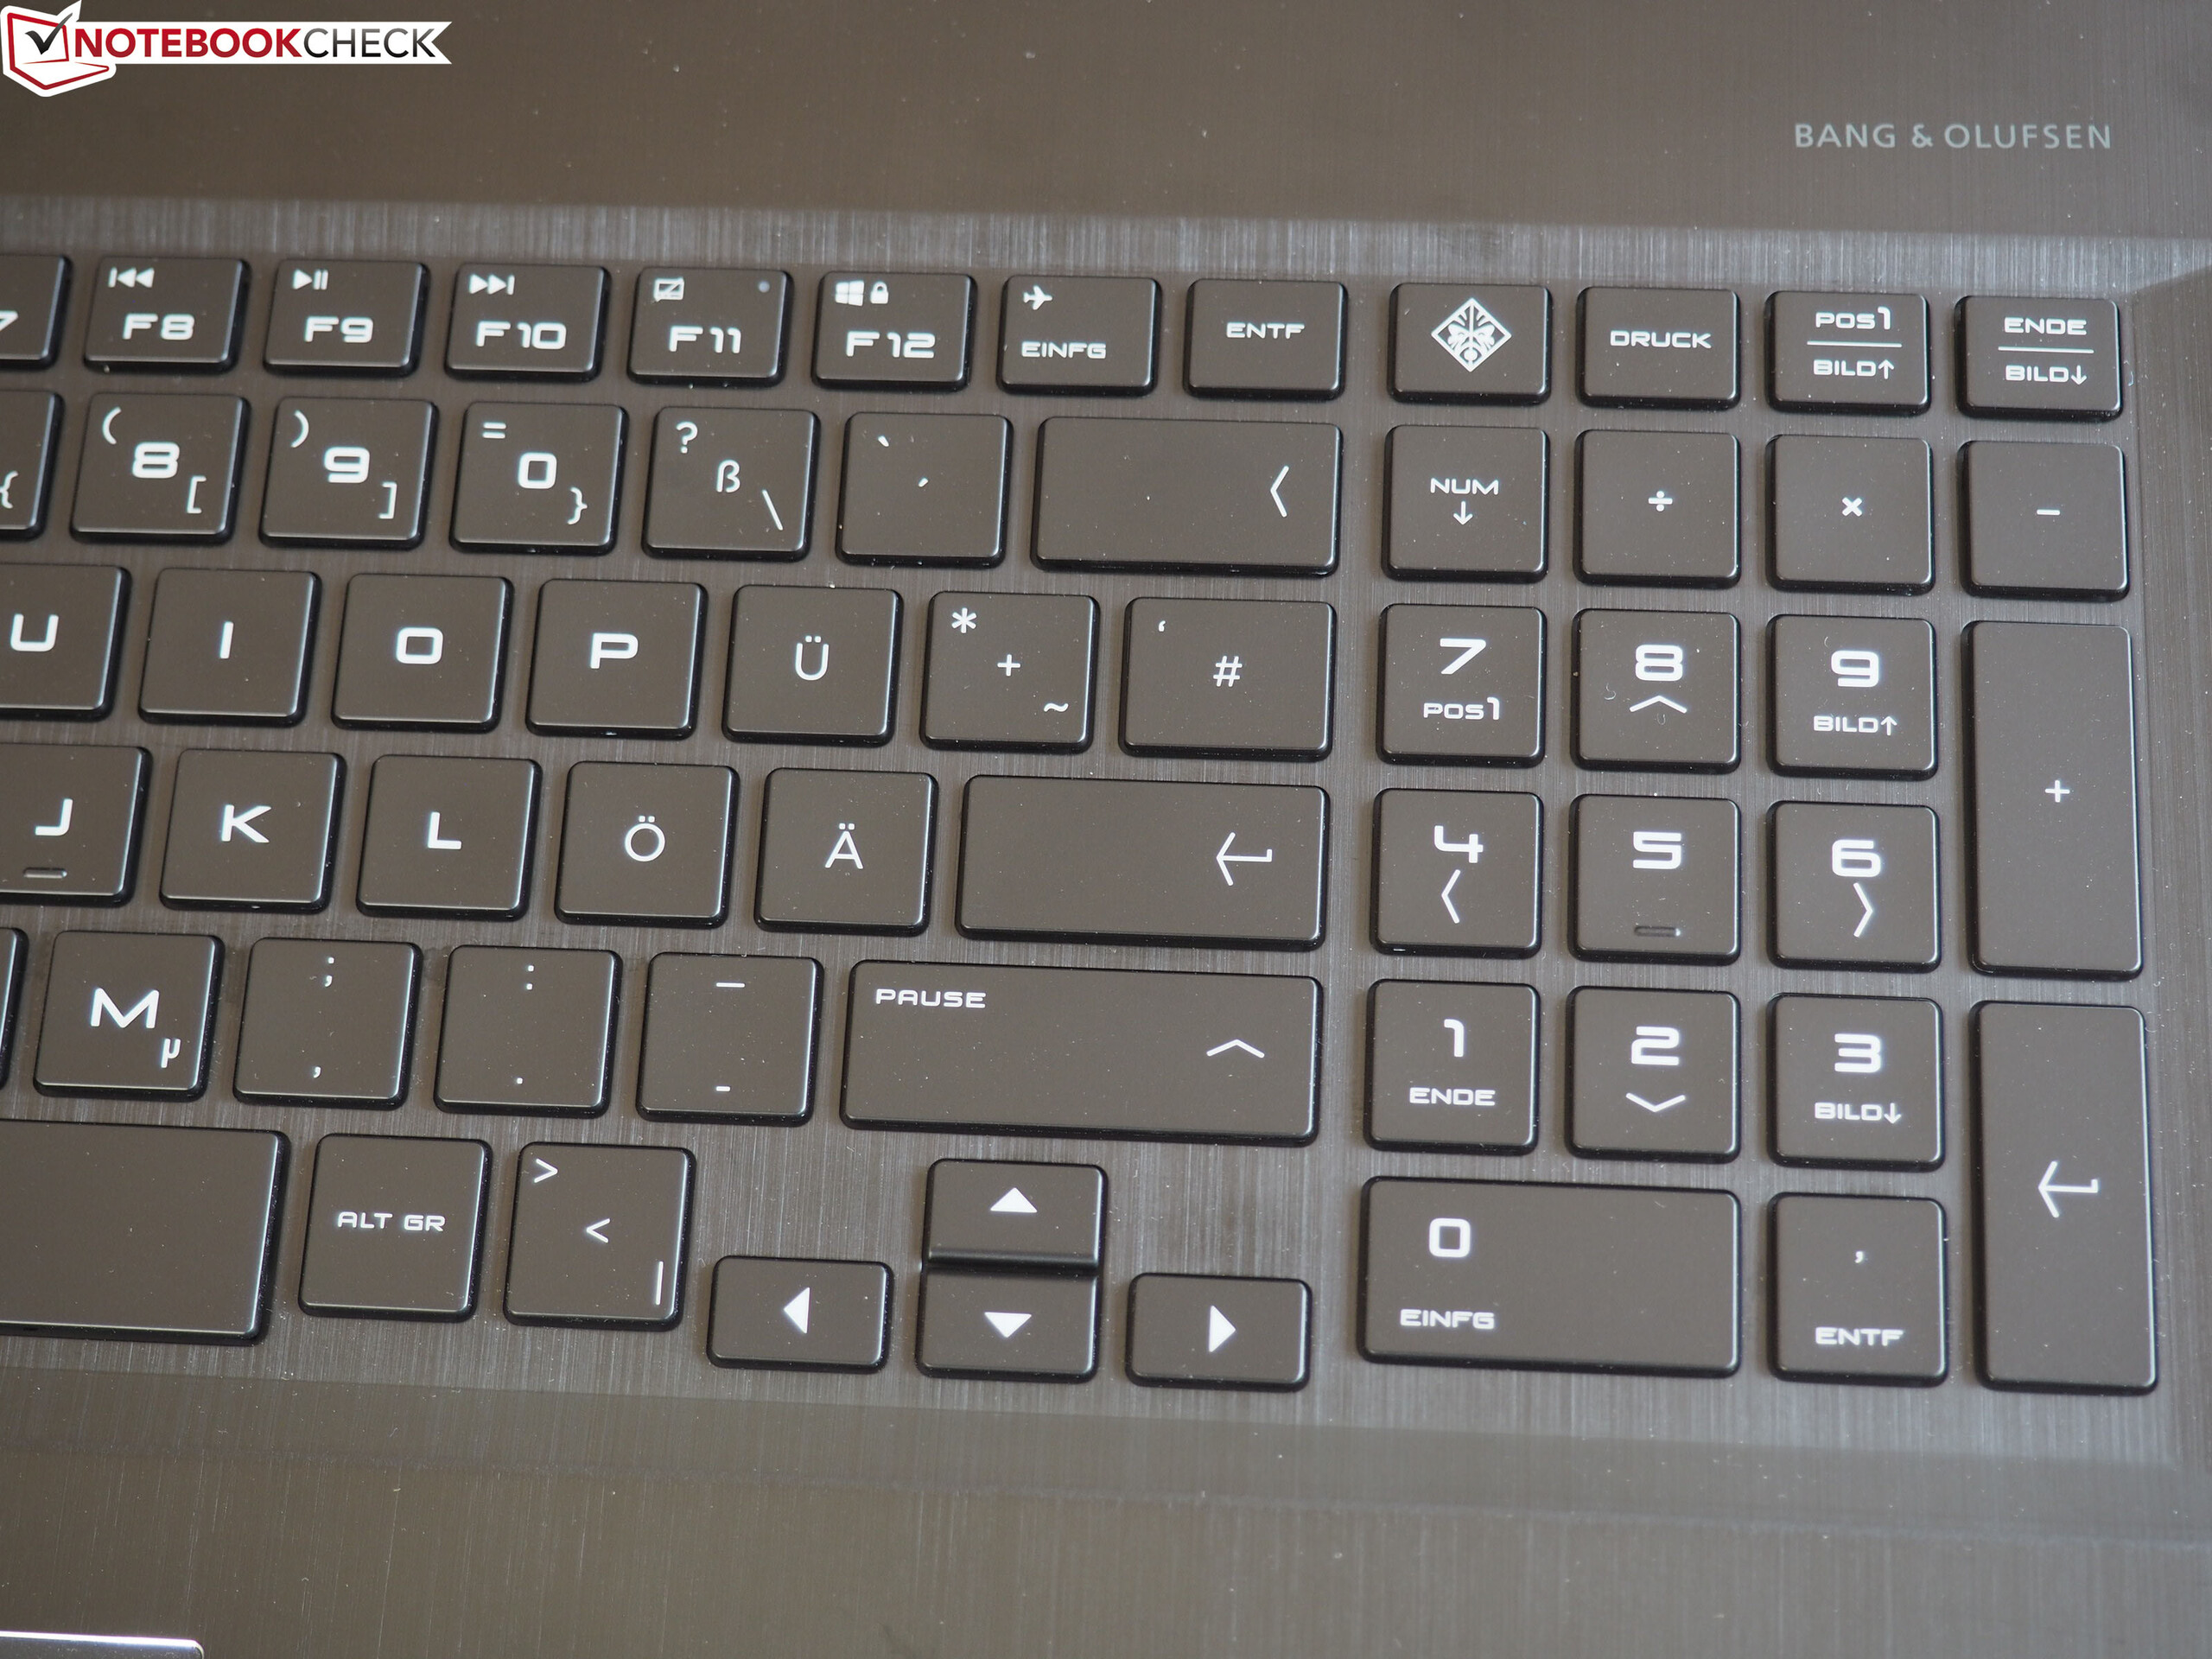
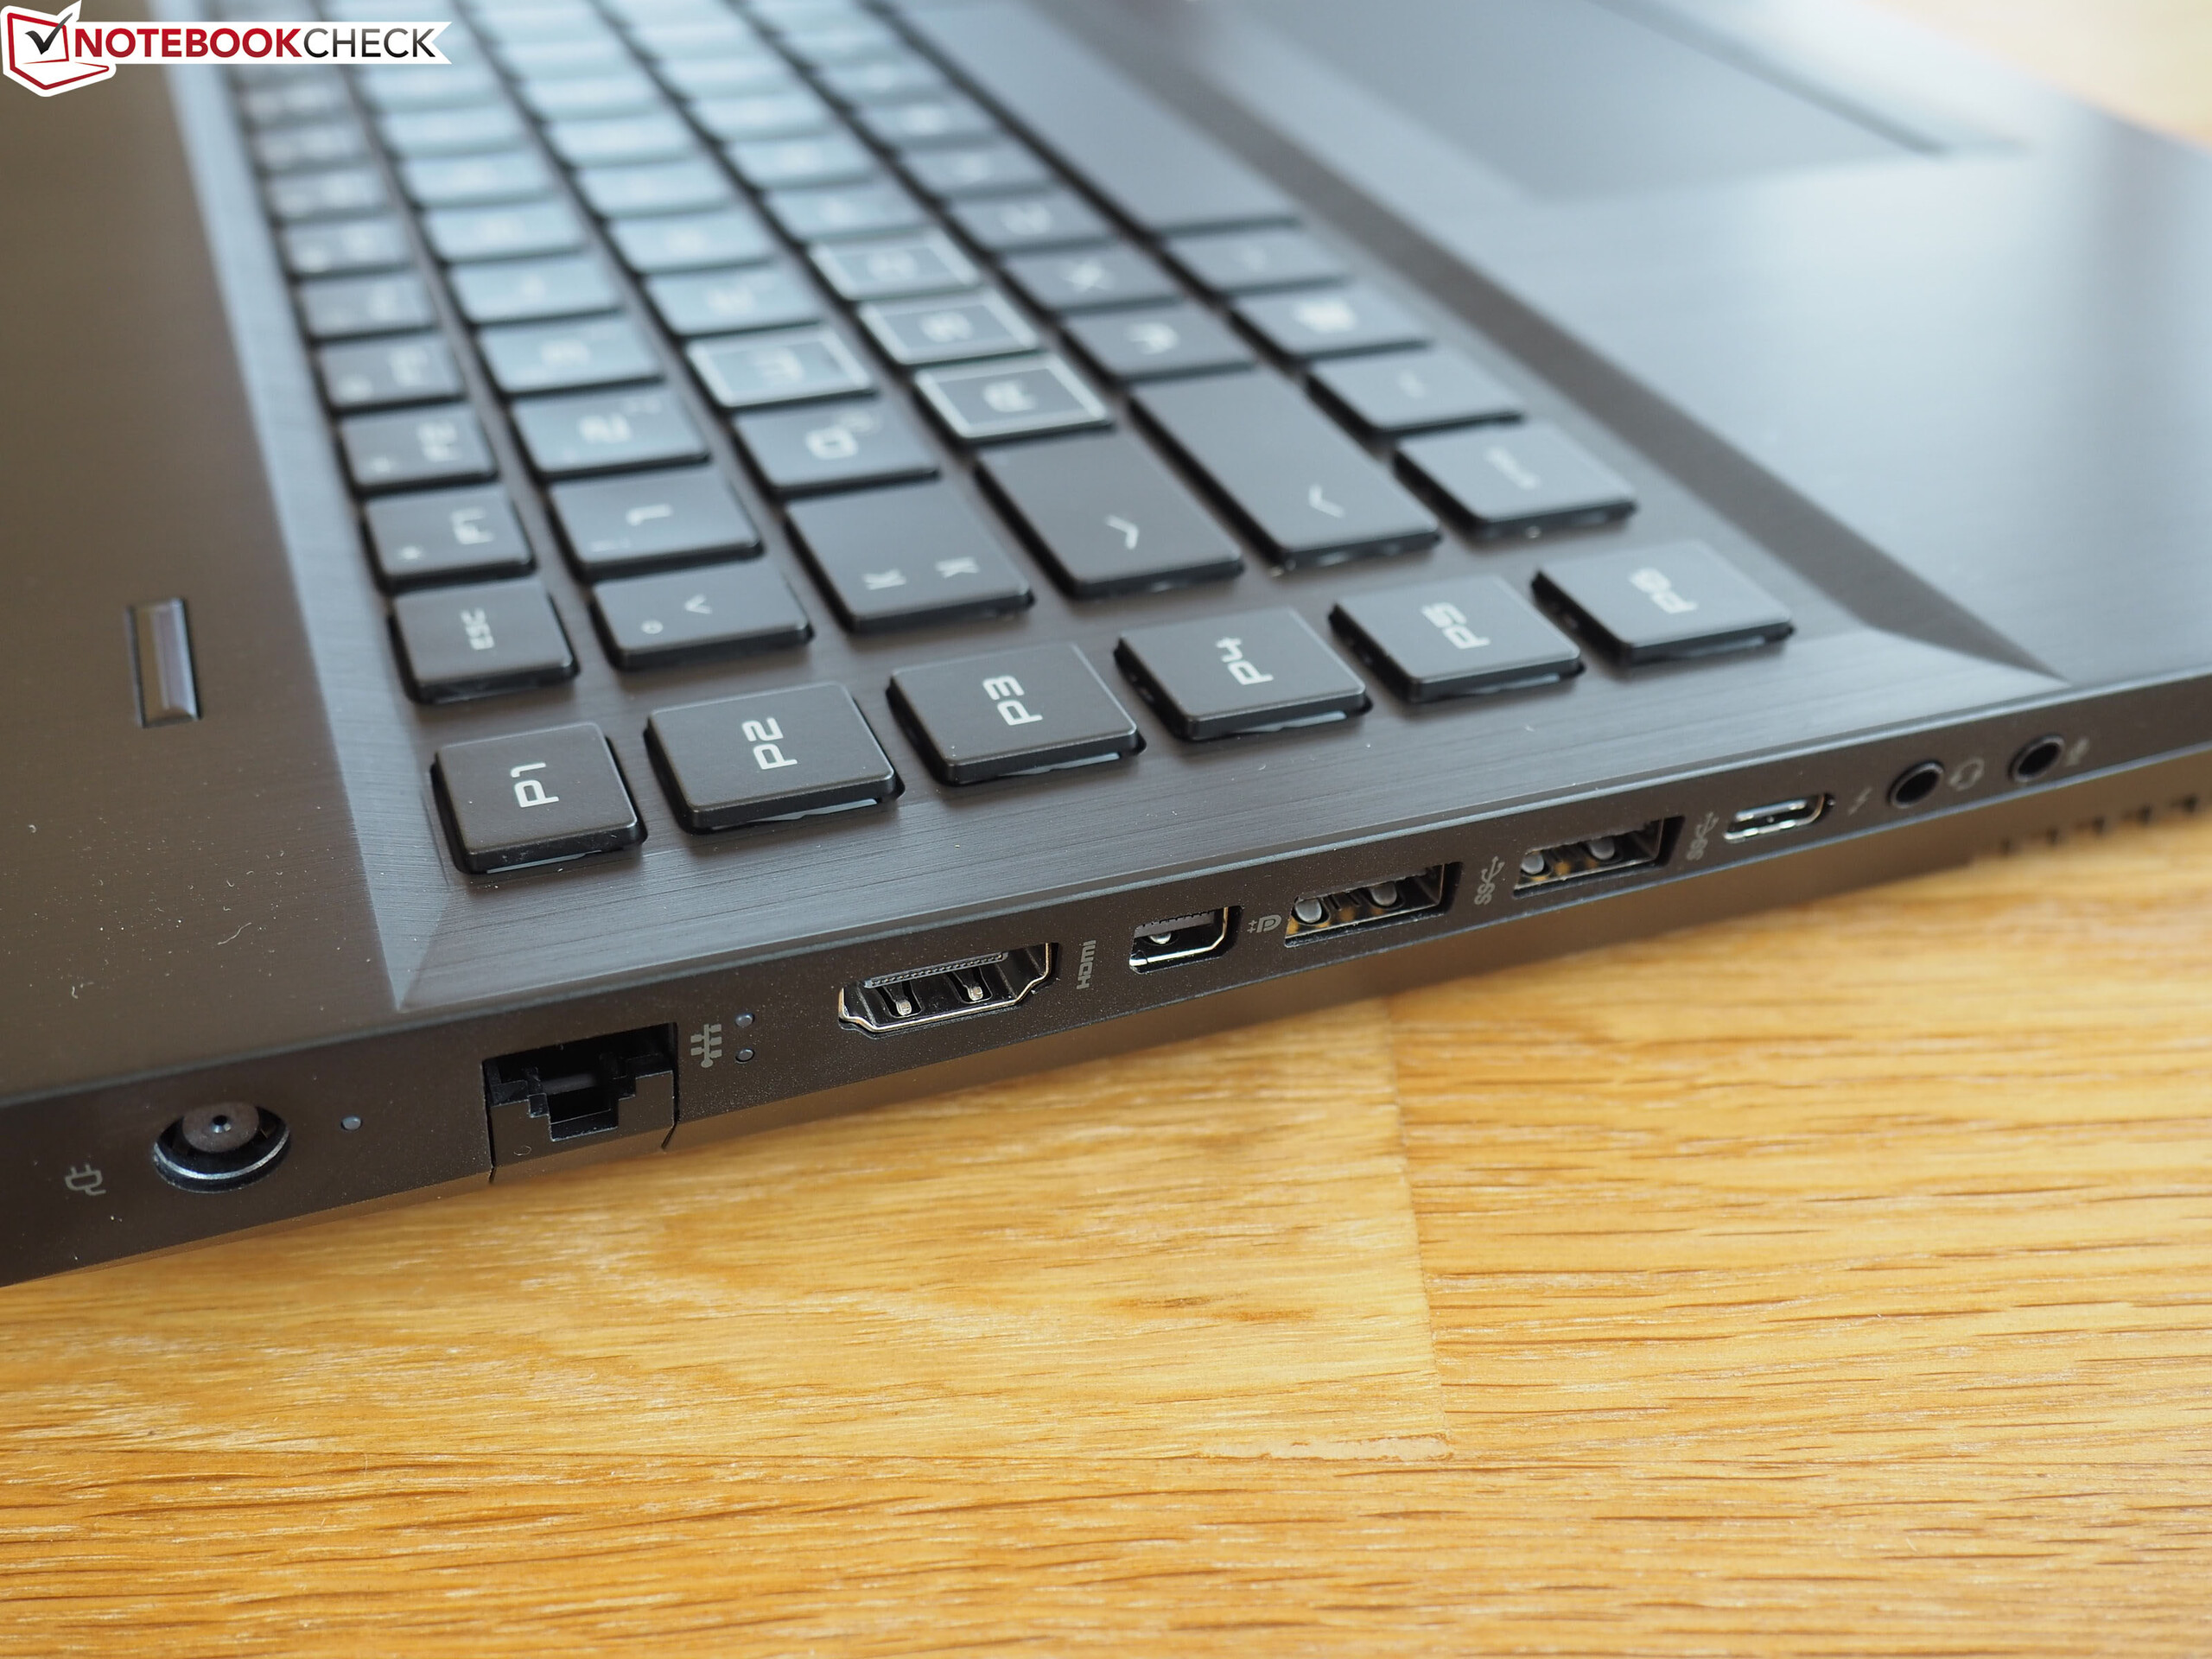
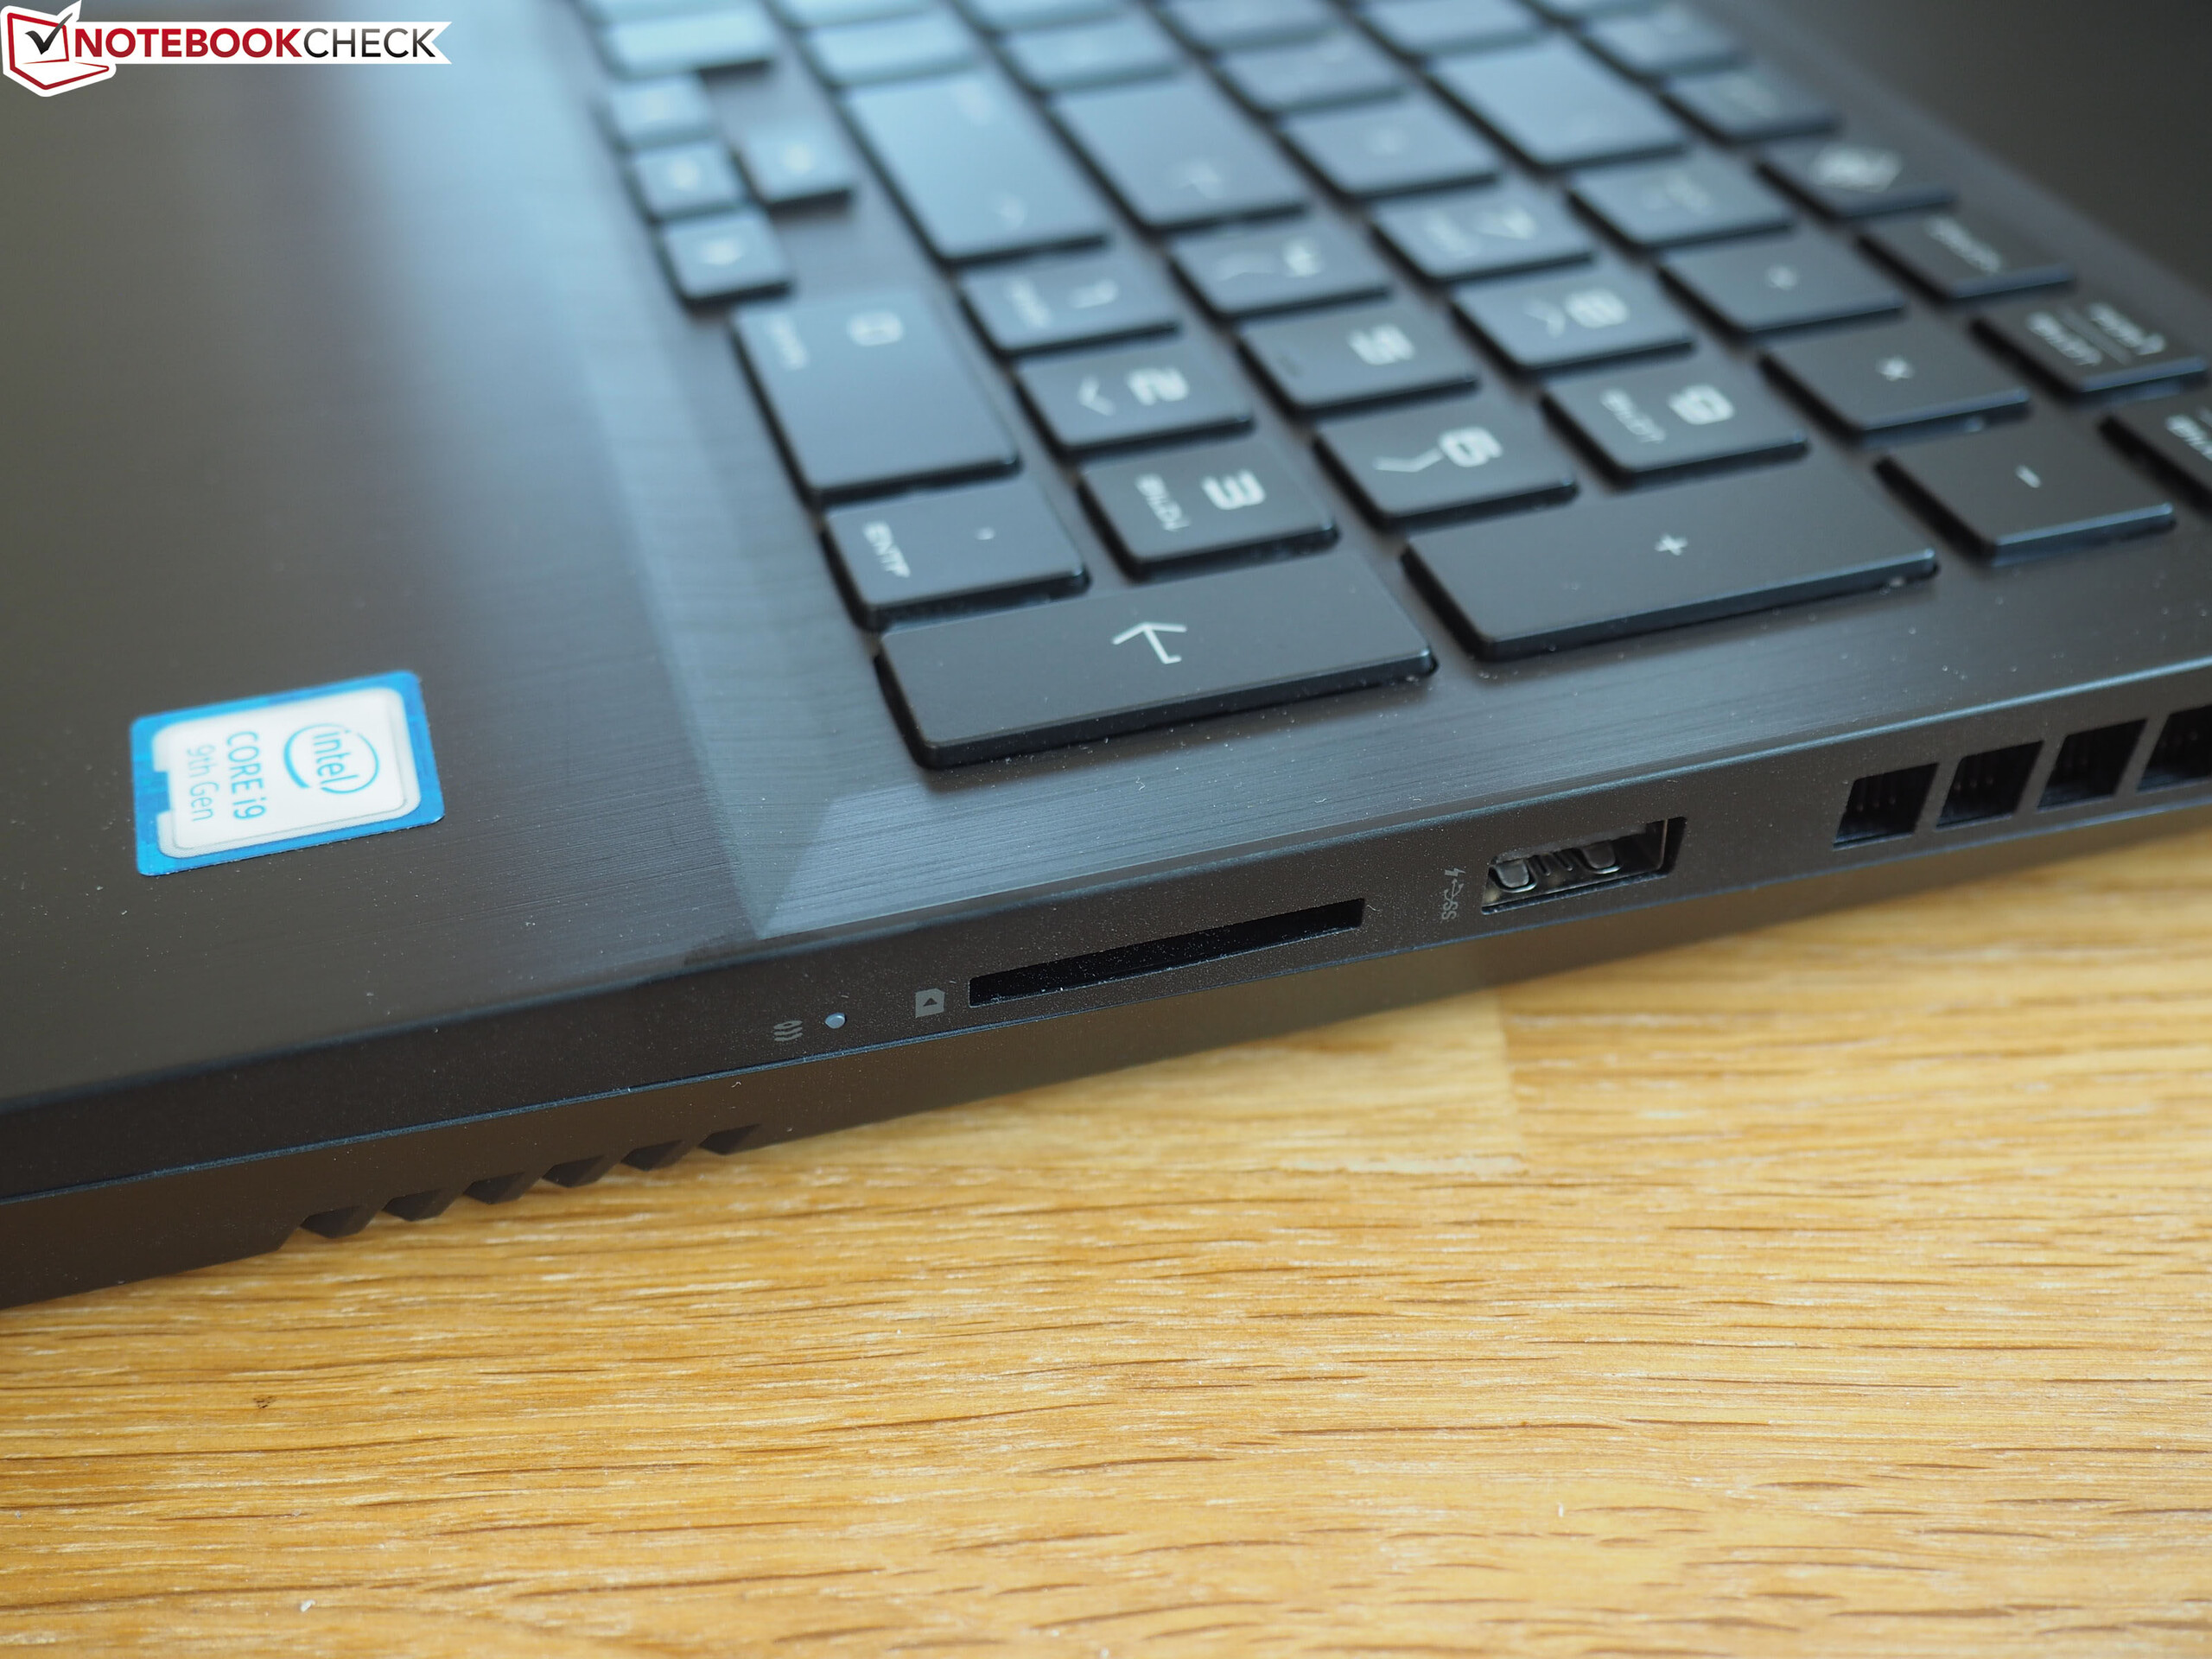
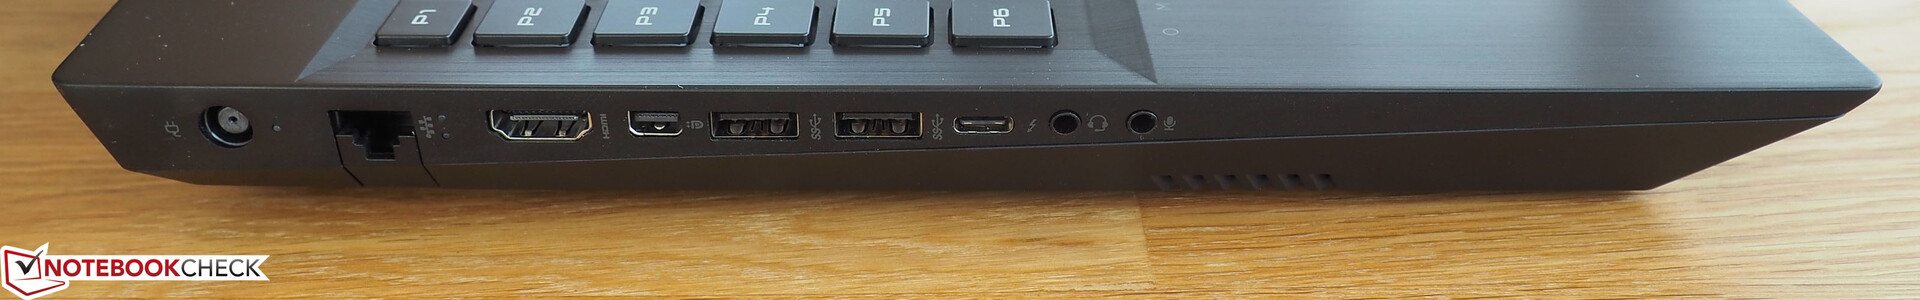
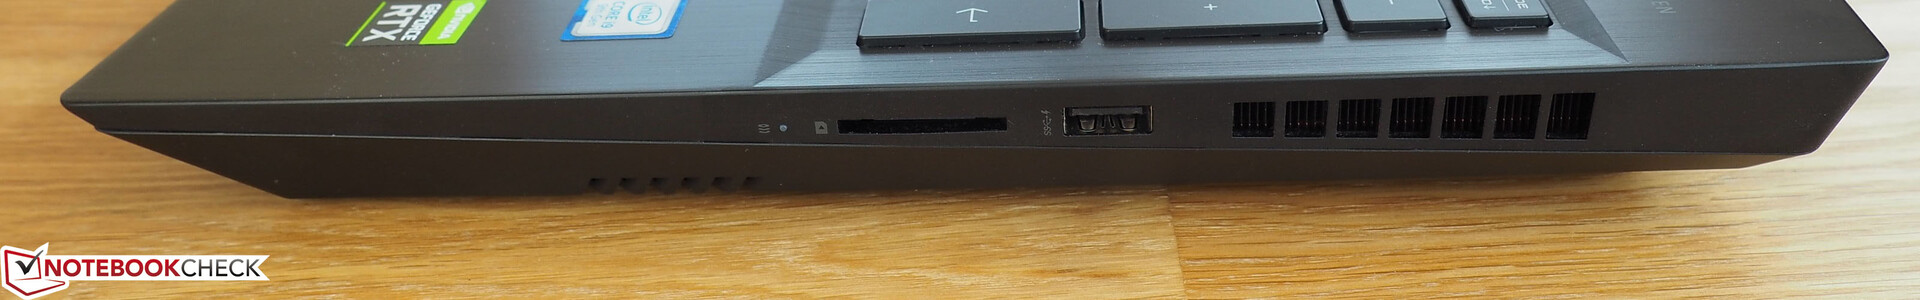
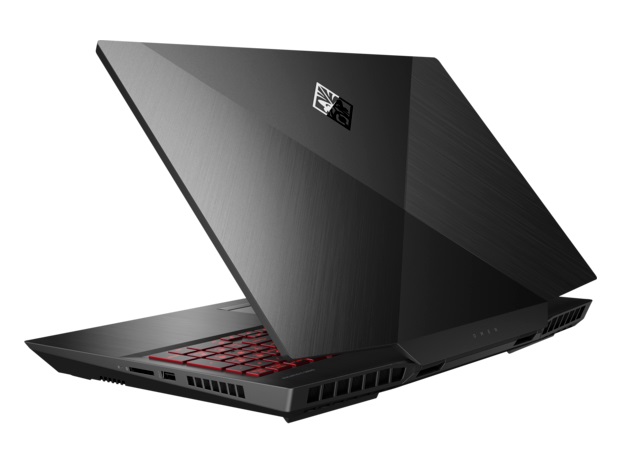
Låt oss börja med det positiva. Utöver relativt bra prestanda i förhållande till priset jämfört med andra modeller utrustade med RTX 2080 (denna laptop på 17 tum är förvisso ändå ganska dyr) så imponerades vi också av höljets design. Ljudet och portutbudet (Thunderbolt 3) samt den utmärkta 144 Hz-skärmen med stöd för G-Sync hjälper alla till med att göra detta till en bra laptop.
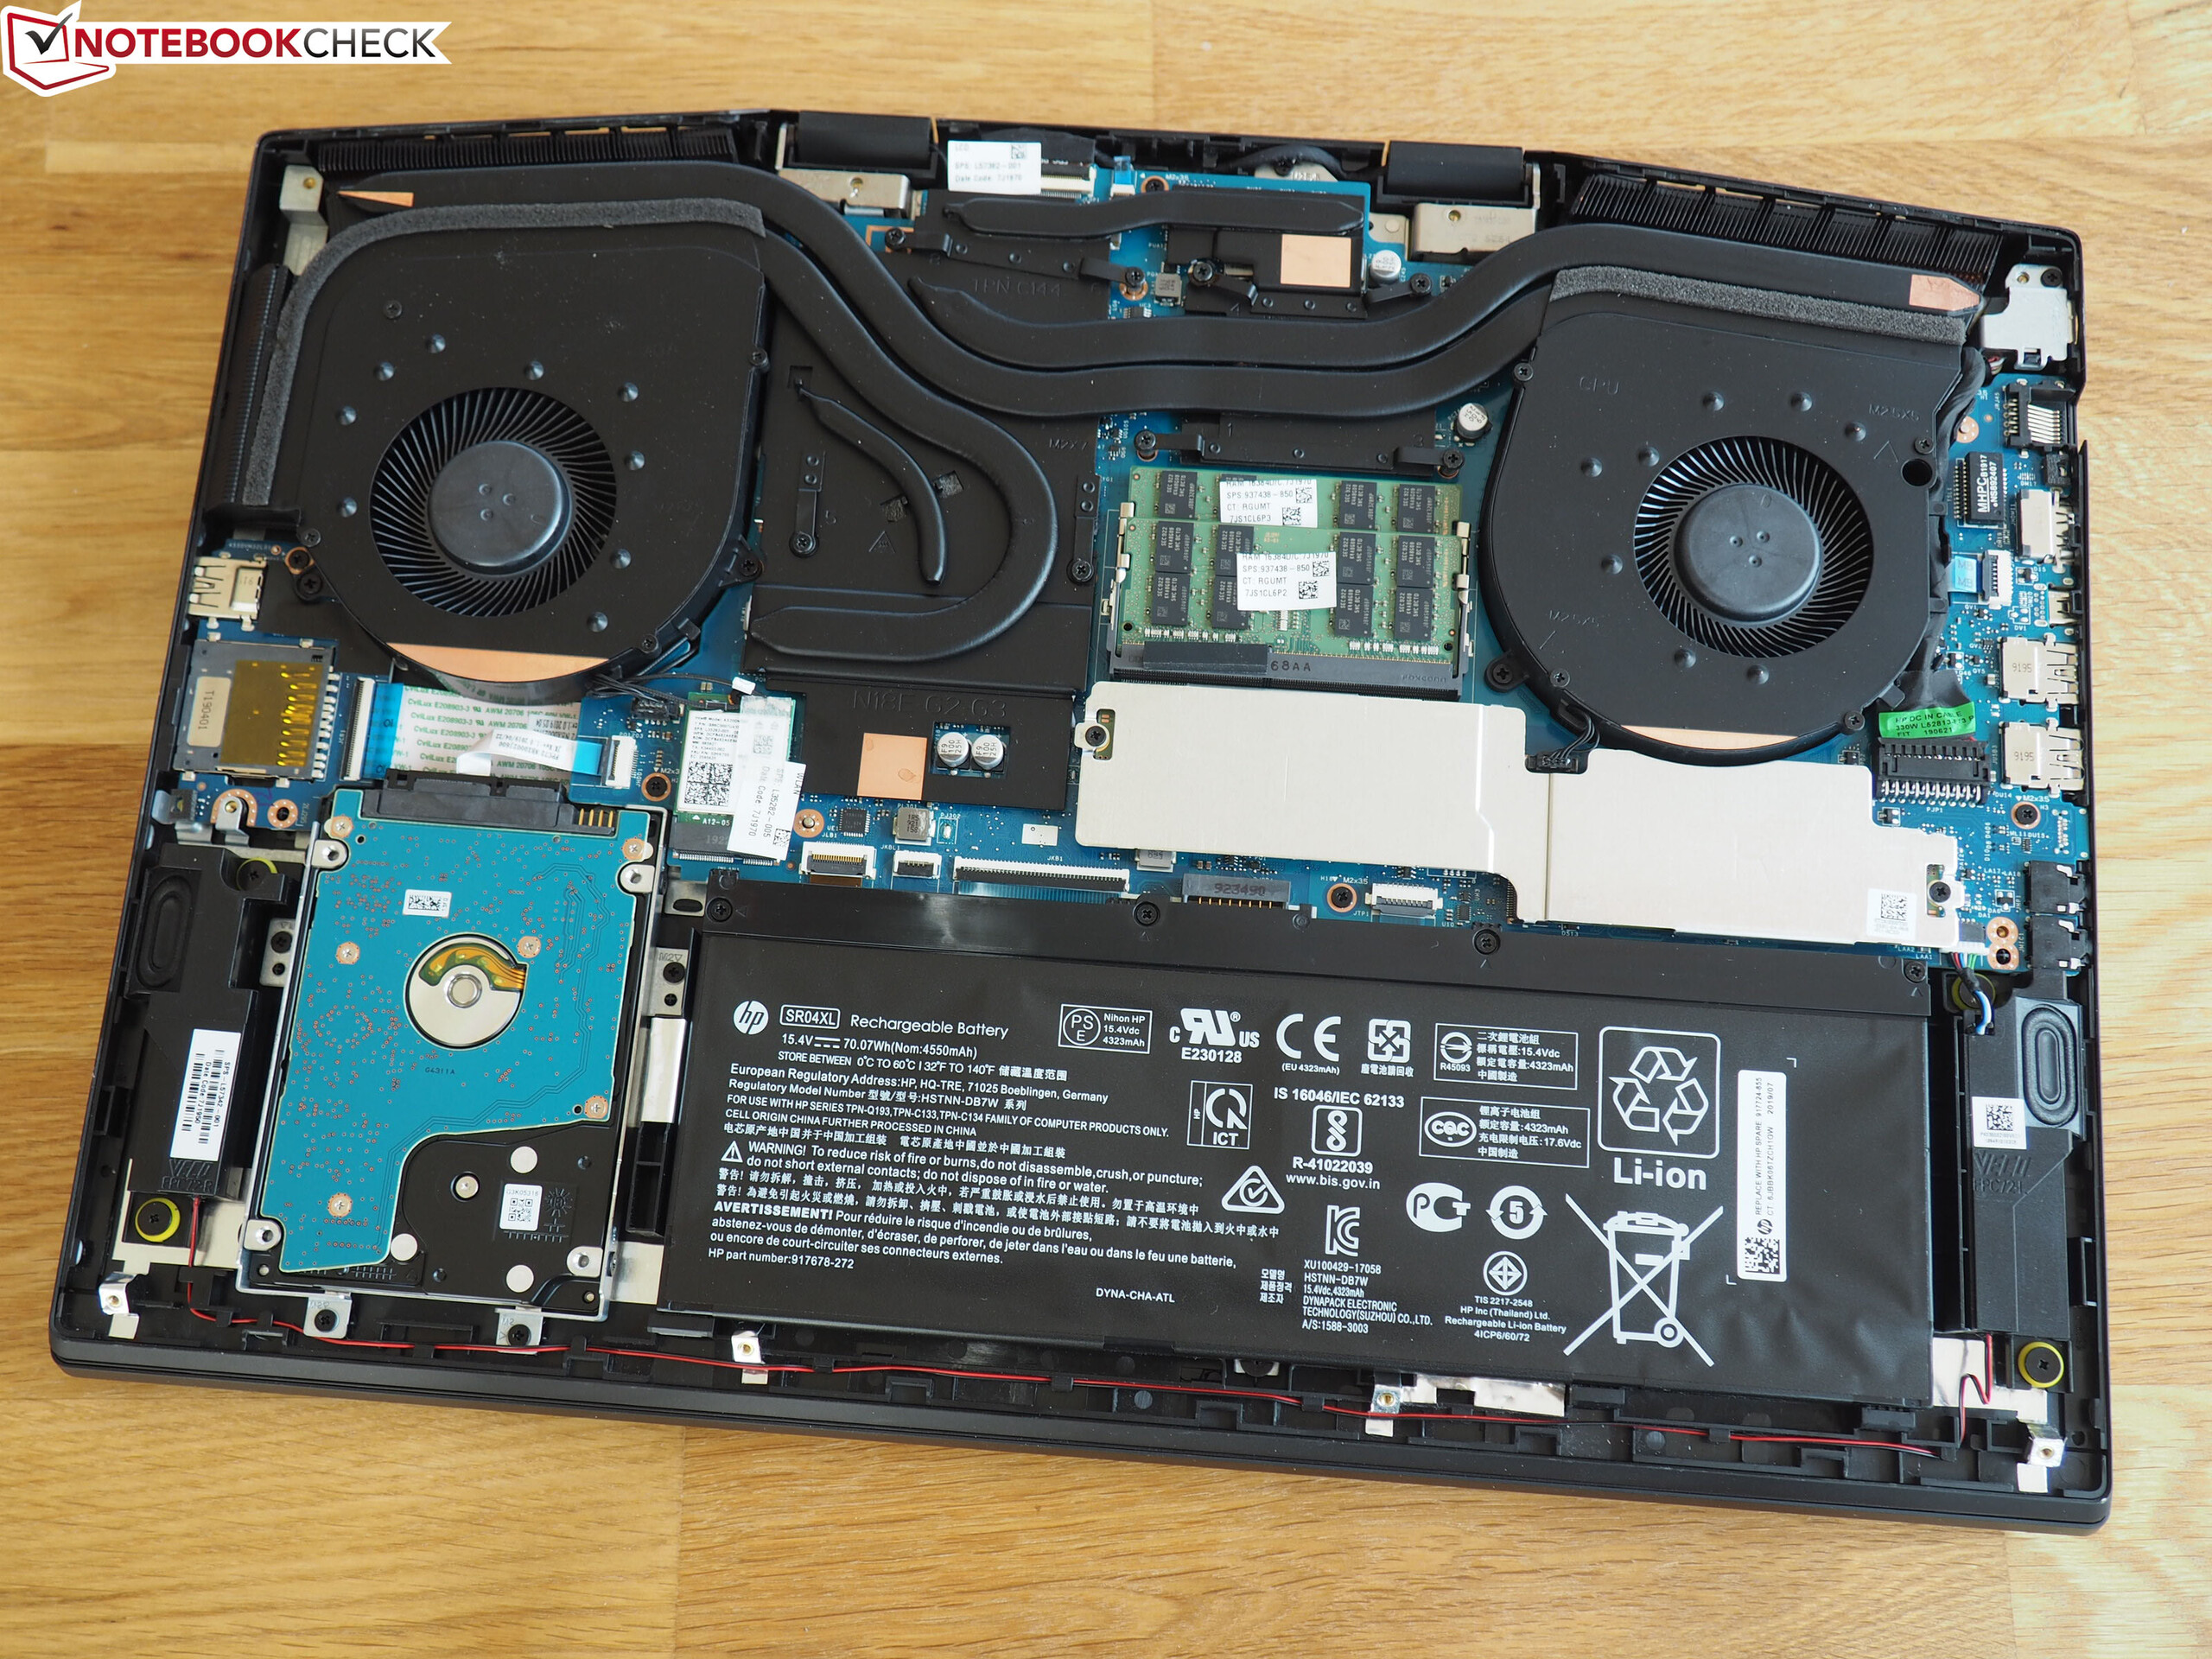
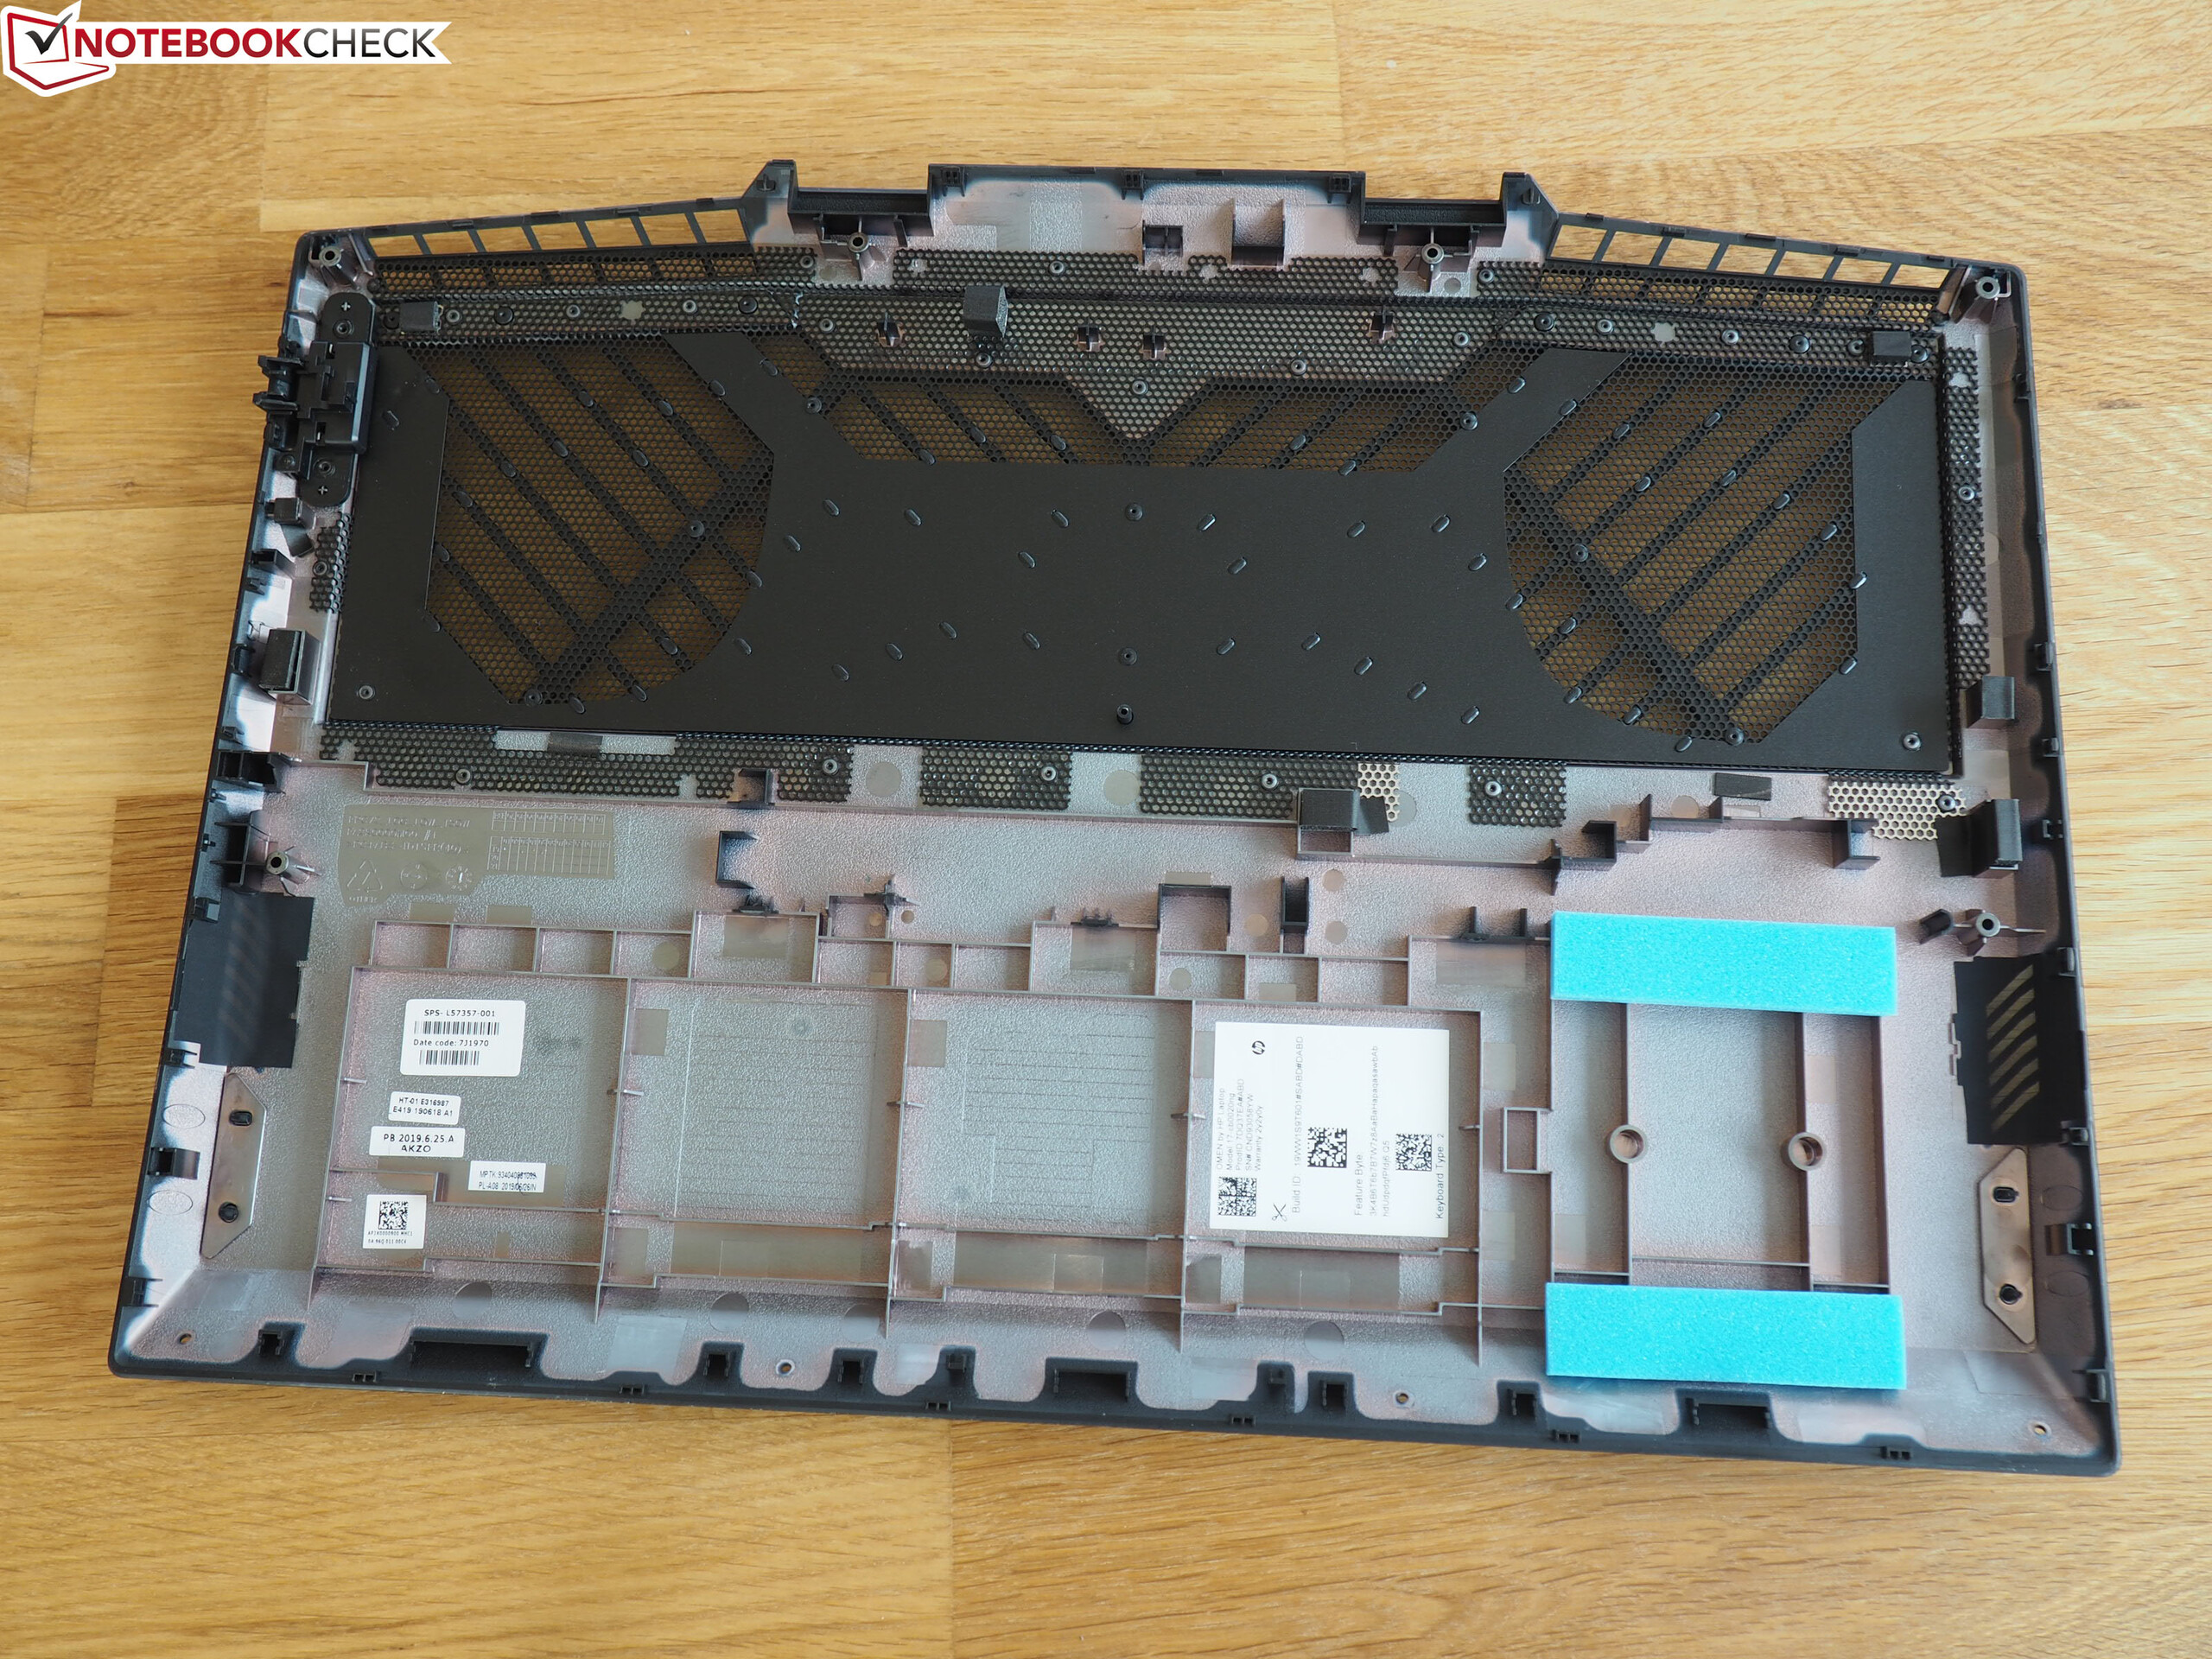
Vi var inte lika imponerade av systemets höga ljudnivå i 3D-applikationer, de undermåliga servicemöjligheterna och processorns blygsamma klockfrekvens vid flerkärnig belastning. Begränsad batteritid rundar av listan över saker som gjorde oss besvikna.
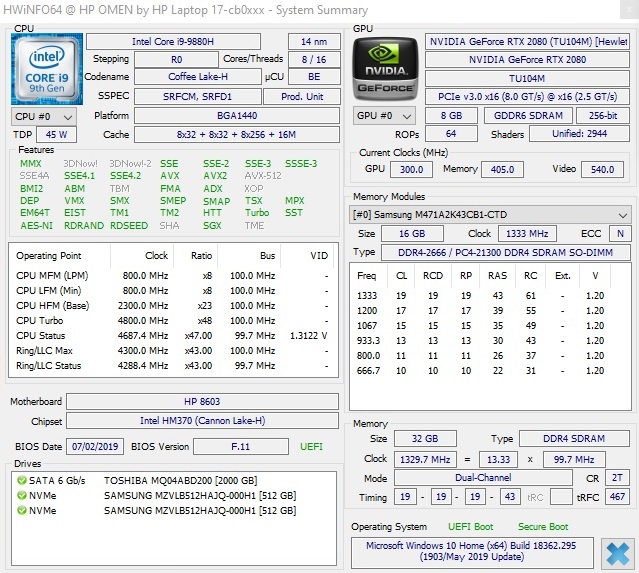
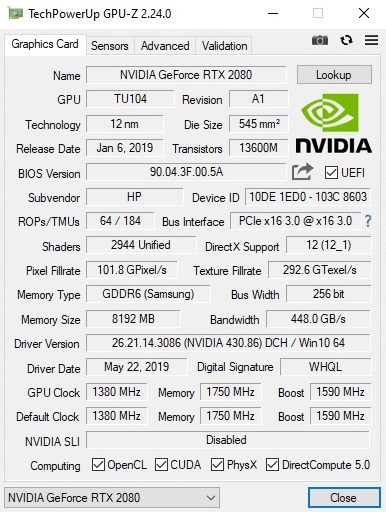
HP Omen 17-cb0020ng
- 05/14/2020 v7 (old)
Florian Glaser
Price comparison