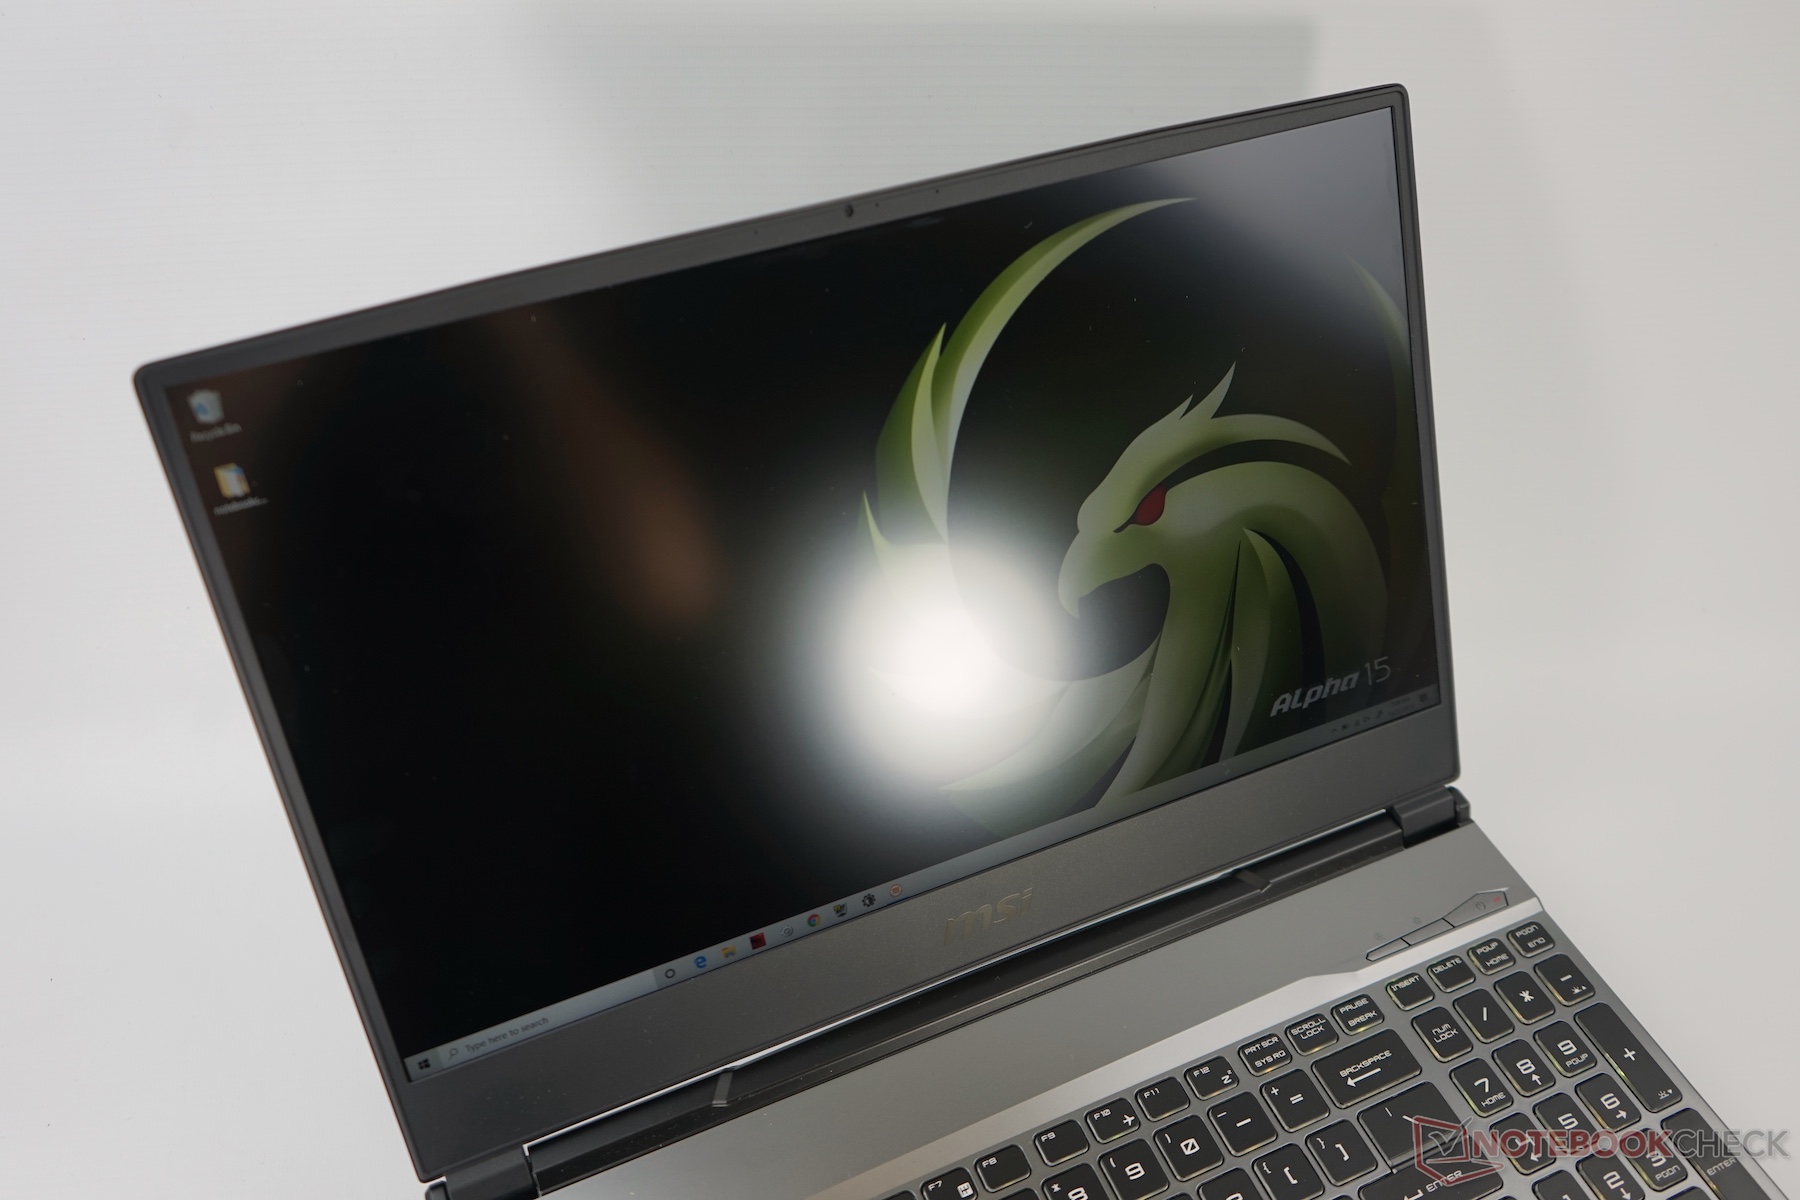
MSI Alpha 15 - Hands On-test: Ryzen och Navi istället för Intel och NVIDIA (Sammanfattning)
Enhetsöversikt
Gradering | Datum | Modell | Vikt | Höjd | Storlek | Upplösning | Pris |
|---|---|---|---|---|---|---|---|
v (old) | 11/2019 | MSI Alpha 15 A3DDK R7 3750H, Radeon RX 5500M | 2.3 kg | 27.5 mm | 15.60" | 1920x1080 | |
| 80.4 % v6 (old) | 07/2019 | Asus TUF FX505DT-EB73 R7 3750H, GeForce GTX 1650 Mobile | 2.2 kg | 26.8 mm | 15.60" | 1920x1080 | |
| 79.3 % v7 (old) | 10/2019 | Dell G3 3590 i5-9300H, GeForce GTX 1650 Mobile | 2.5 kg | 21.6 mm | 15.60" | 1920x1080 | |
| 77 % v7 (old) | 10/2019 | Lenovo IdeaPad L340-15IRH 81LK00BMGE i5-9300H, GeForce GTX 1650 Mobile | 2.1 kg | 23.9 mm | 15.60" | 1920x1080 | |
| 81.5 % v7 (old) | HP Omen 15-dc1020ng i5-9300H, GeForce GTX 1650 Mobile | 2.3 kg | 25 mm | 15.60" | 1920x1080 | ||
| 82.5 % v6 (old) | 05/2019 | Acer Aspire Nitro 5 AN515-54-53Z2 i5-9300H, GeForce GTX 1650 Mobile | 2.2 kg | 27 mm | 15.60" | 1920x1080 | |
| 82.3 % v7 (old) | 08/2019 | Lenovo Legion Y540-15IRH-81SX00B2GE i7-9750H, GeForce GTX 1660 Ti Mobile | 2.2 kg | 26 mm | 15.60" | 1920x1080 | |
| 83.9 % v7 (old) | 08/2019 | HP Gaming Pavilion 15-dk0009ng i7-9750H, GeForce GTX 1660 Ti Max-Q | 2.4 kg | 23.4 mm | 15.60" | 1920x1080 | |
| 83.3 % v6 (old) | 06/2019 | Asus ROG Zephyrus G15 GA502DU R7 3750H, GeForce GTX 1660 Ti Max-Q | 2.1 kg | 20.4 mm | 15.60" | 1920x1080 |
| |||||||||||||||||||||||||
Distribution av ljusstyrkan: 91 %
Mitt på batteriet: 266 cd/m²
Kontrast: 1506:1 (Svärta: 0.18 cd/m²)
ΔE ColorChecker Calman: 4.38 | ∀{0.5-29.43 Ø4.72}
calibrated: 4.29
ΔE Greyscale Calman: 2.1 | ∀{0.09-98 Ø4.97}
36.74% AdobeRGB 1998 (Argyll 3D)
53.5% sRGB (Argyll 3D)
35.56% Display P3 (Argyll 3D)
Gamma: 2.15
CCT: 6867 K
| MSI Alpha 15 A3DDK AU Optronics B156HAN13.0 (AUOD0ED), IPS, 1920x1080, 15.6" | Asus TUF FX505DT-EB73 Panda LM156LF-GL, IPS, 1920x1080, 15.6" | Dell G3 3590 BOE NV15N3D, IPS, 1920x1080, 15.6" | Lenovo IdeaPad L340-15IRH 81LK00BMGE CMN 156HCA-EAB, IPS, 1920x1080, 15.6" | Lenovo Legion Y540-15IRH-81SX00B2GE BOE 084D, IPS, 1920x1080, 15.6" | HP Gaming Pavilion 15-dk0009ng LG Philips LGD05FE, IPS, 1920x1080, 15.6" | |
|---|---|---|---|---|---|---|
| Display | 11% | 13% | 20% | 76% | 79% | |
| Display P3 Coverage (%) | 35.56 | 39.56 11% | 40.13 13% | 42.81 20% | 63.6 79% | 64.2 81% |
| sRGB Coverage (%) | 53.5 | 59.5 11% | 59.8 12% | 63.8 19% | 91.7 71% | 95.1 78% |
| AdobeRGB 1998 Coverage (%) | 36.74 | 40.91 11% | 41.47 13% | 44.31 21% | 65.2 77% | 65.8 79% |
| Response Times | 6% | -25% | -22% | 66% | 58% | |
| Response Time Grey 50% / Grey 80% * (ms) | 36.1 | 30.4 ? 16% | 46 ? -27% | 45.6 ? -26% | 8.8 ? 76% | 16.4 ? 55% |
| Response Time Black / White * (ms) | 26.4 | 27.6 ? -5% | 32.4 ? -23% | 30.8 ? -17% | 12 ? 55% | 10.4 ? 61% |
| PWM Frequency (Hz) | 200 ? | 25910 ? | ||||
| Screen | -34% | -20% | -15% | -5% | 15% | |
| Brightness middle (cd/m²) | 271 | 286.2 6% | 276.2 2% | 275 1% | 299 10% | 345 27% |
| Brightness (cd/m²) | 266 | 267 0% | 261 -2% | 253 -5% | 290 9% | 324 22% |
| Brightness Distribution (%) | 91 | 84 -8% | 86 -5% | 83 -9% | 89 -2% | 86 -5% |
| Black Level * (cd/m²) | 0.18 | 0.33 -83% | 0.24 -33% | 0.18 -0% | 0.29 -61% | 0.42 -133% |
| Contrast (:1) | 1506 | 867 -42% | 1151 -24% | 1528 1% | 1031 -32% | 821 -45% |
| Colorchecker dE 2000 * | 4.38 | 5.45 -24% | 5.56 -27% | 5.4 -23% | 3.7 16% | 1.3 70% |
| Colorchecker dE 2000 max. * | 17.6 | 18.08 -3% | 23.45 -33% | 21.3 -21% | 7 60% | 2.8 84% |
| Colorchecker dE 2000 calibrated * | 4.29 | 4.47 -4% | 5.23 -22% | 4.4 -3% | 2 53% | 1.1 74% |
| Greyscale dE 2000 * | 2.1 | 5.3 -152% | 2.8 -33% | 3.7 -76% | 4.1 -95% | 1.2 43% |
| Gamma | 2.15 102% | 2.1 105% | 2.37 93% | 2.12 104% | 2.19 100% | 2.31 95% |
| CCT | 6867 95% | 7679 85% | 6710 97% | 6376 102% | 7166 91% | 6476 100% |
| Color Space (Percent of AdobeRGB 1998) (%) | 37.6 | 37.8 | 40.8 | 59.3 | 60.5 | |
| Color Space (Percent of sRGB) (%) | 59.1 | 59 | 63.6 | 91.5 | 94.9 | |
| Totalt genomsnitt (program/inställningar) | -6% /
-19% | -11% /
-14% | -6% /
-8% | 46% /
23% | 51% /
35% |
* ... mindre är bättre
Visa svarstider
| ↔ Svarstid svart till vitt | ||
|---|---|---|
| 26.4 ms ... stiga ↗ och falla ↘ kombinerat | ↗ ms stiga | 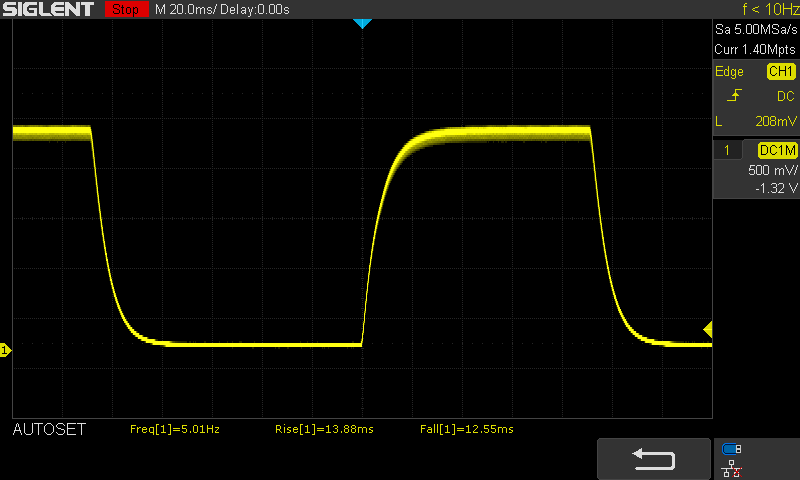 |
| ↘ ms hösten | ||
| Skärmen visar relativt långsamma svarsfrekvenser i våra tester och kan vara för långsam för spelare. I jämförelse sträcker sig alla testade enheter från 0.1 (minst) till 240 (maximalt) ms. » 66 % av alla enheter är bättre. Detta innebär att den uppmätta svarstiden är sämre än genomsnittet av alla testade enheter (19.9 ms). | ||
| ↔ Svarstid 50 % grått till 80 % grått | ||
| 36.1 ms ... stiga ↗ och falla ↘ kombinerat | ↗ ms stiga | 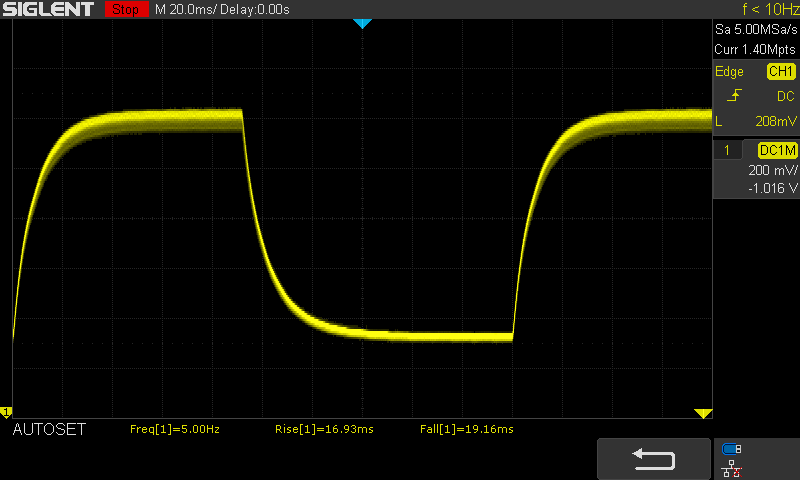 |
| ↘ ms hösten | ||
| Skärmen visar långsamma svarsfrekvenser i våra tester och kommer att vara otillfredsställande för spelare. I jämförelse sträcker sig alla testade enheter från 0.165 (minst) till 636 (maximalt) ms. » 52 % av alla enheter är bättre. Detta innebär att den uppmätta svarstiden är sämre än genomsnittet av alla testade enheter (31.1 ms). | ||
Skärmflimmer / PWM (Puls-Width Modulation)
| Skärmflimmer / PWM upptäcktes inte | 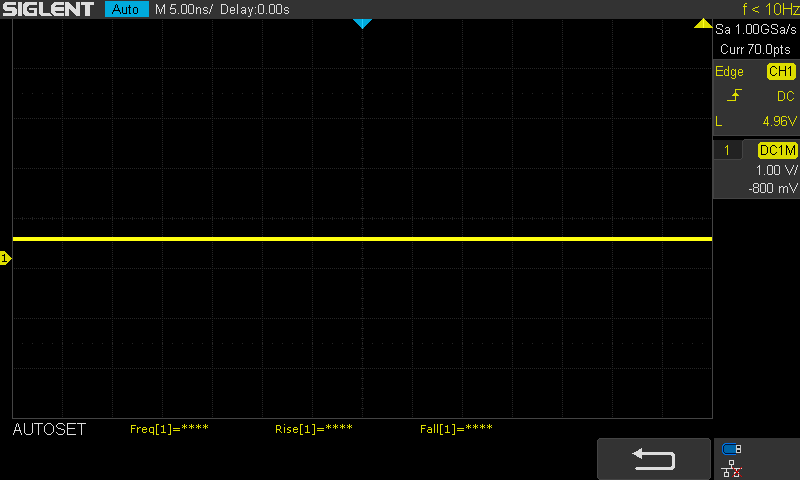 | ||
Som jämförelse: 52 % av alla testade enheter använder inte PWM för att dämpa skärmen. Om PWM upptäcktes mättes ett medelvärde av 7784 (minst: 5 - maximum: 343500) Hz. | |||
| PCMark 8 Home Score Accelerated v2 | 4800 poäng | |
| PCMark 8 Creative Score Accelerated v2 | 6613 poäng | |
| PCMark 8 Work Score Accelerated v2 | 5167 poäng | |
| PCMark 10 Score | 4733 poäng | |
Hjälp | ||
| 3DMark 06 Standard Score | 26559 poäng | |
| 3DMark 11 Performance | 13344 poäng | |
| 3DMark Cloud Gate Standard Score | 22627 poäng | |
| 3DMark Fire Strike Score | 10080 poäng | |
| 3DMark Time Spy Score | 4024 poäng | |
Hjälp | ||
| Dota 2 Reborn - 1920x1080 ultra (3/3) best looking | |
| Lenovo Legion Y540-15IRH-81SX00B2GE | |
| Lenovo Legion Y540-15IRH-81SX00B2GE | |
| Genomsnitt NVIDIA GeForce GTX 1660 Ti Mobile (94.6 - 125, n=11) | |
| Genomsnitt NVIDIA GeForce GTX 1650 Mobile (58.5 - 119, n=20) | |
| HP Omen 15-dc1020ng | |
| Genomsnitt NVIDIA GeForce GTX 1660 Ti Max-Q (75.7 - 103, n=3) | |
| HP Omen 15-dc1020ng | |
| HP Pavilion Gaming 15-ec0017ng | |
| Lenovo IdeaPad L340-15IRH 81LK00BMGE | |
| MSI Alpha 15 A3DDK | |
| F1 2019 - 1920x1080 Ultra High Preset AA:T AF:16x | |
| Genomsnitt NVIDIA GeForce GTX 1660 Ti Mobile (91 - 99, n=4) | |
| HP Pavilion Gaming 15-ec0017ng | |
| Genomsnitt NVIDIA GeForce GTX 1660 Ti Max-Q (71 - 77, n=2) | |
| HP Gaming Pavilion 15-dk0009ng | |
| MSI Alpha 15 A3DDK | |
| HP Omen 15-dc1020ng | |
| Genomsnitt NVIDIA GeForce GTX 1650 Mobile (59 - 65, n=5) | |
| HP Omen 15-dc1020ng | |
| Dell G5 15 5590-PCNJJ | |
| Rage 2 - 1920x1080 Ultra Preset (Resolution Scale Off) | |
| Genomsnitt NVIDIA GeForce GTX 1660 Ti Mobile (67.9 - 68.8, n=2) | |
| HP Pavilion Gaming 15-ec0017ng | |
| Genomsnitt NVIDIA GeForce GTX 1660 Ti Max-Q (58.2 - 64.8, n=2) | |
| HP Omen 15-dc1020ng | |
| HP Gaming Pavilion 15-dk0009ng | |
| MSI Alpha 15 A3DDK | |
| Genomsnitt NVIDIA GeForce GTX 1650 Mobile (45.1 - 60, n=3) | |
| HP Omen 15-dc1020ng | |
| Dell G5 15 5590-PCNJJ | |
| Ghost Recon Breakpoint - 1920x1080 Ultra Preset AA:T | |
| Genomsnitt NVIDIA GeForce GTX 1660 Ti Mobile (51 - 55, n=2) | |
| Genomsnitt NVIDIA GeForce GTX 1660 Ti Max-Q (48 - 51, n=2) | |
| HP Pavilion Gaming 15-ec0017ng | |
| Genomsnitt NVIDIA GeForce GTX 1650 Mobile (30 - 37, n=2) | |
| Dell G5 15 5590-PCNJJ | |
| MSI Alpha 15 A3DDK | |
| Borderlands 3 - 1920x1080 Badass Overall Quality (DX11) | |
| Genomsnitt NVIDIA GeForce GTX 1660 Ti Mobile (46.6 - 48.6, n=3) | |
| Genomsnitt NVIDIA GeForce GTX 1660 Ti Max-Q (41.5 - 42.3, n=2) | |
| HP Pavilion Gaming 15-ec0017ng | |
| MSI Alpha 15 A3DDK | |
| Genomsnitt NVIDIA GeForce GTX 1650 Mobile (29 - 34.6, n=5) | |
| Dell G5 15 5590-PCNJJ | |
| Total War: Three Kingdoms - 1920x1080 Ultra (incl textures) | |
| Genomsnitt NVIDIA GeForce GTX 1660 Ti Mobile (n=1) | |
| HP Gaming Pavilion 15-dk0009ng | |
| Genomsnitt NVIDIA GeForce GTX 1660 Ti Max-Q (41.1 - 41.6, n=2) | |
| HP Pavilion Gaming 15-ec0017ng | |
| MSI Alpha 15 A3DDK | |
| Genomsnitt NVIDIA GeForce GTX 1650 Mobile (24.4 - 26.9, n=4) | |
| Dell G5 15 5590-PCNJJ | |
| låg | med. | hög | ultra | QHD | 4K | |
|---|---|---|---|---|---|---|
| Counter-Strike: GO (2012) | 191 | 137 | 76.3 | |||
| BioShock Infinite (2013) | 201 | 169 | 123 | |||
| GTA V (2015) | 93 | 48.6 | 20.2 | |||
| The Witcher 3 (2015) | 165 | 72 | 43.6 | |||
| Dota 2 Reborn (2015) | 93 | 86 | 81 | 72 | 53 | |
| World of Warships (2015) | 93 | 54.9 | ||||
| Rainbow Six Siege (2015) | 151 | 143 | 59.6 | |||
| Overwatch (2016) | 124 | 109 | 74 | |||
| Rocket League (2017) | 175 | 175 | 72 | |||
| Playerunknown's Battlegrounds (PUBG) (2017) | 59.4 | |||||
| Middle-earth: Shadow of War (2017) | 70 | 24 | ||||
| Assassin´s Creed Origins (2017) | 41 | 35 | ||||
| Fortnite (2018) | 65 | |||||
| Far Cry 5 (2018) | 62 | 59 | 48 | |||
| Shadow of the Tomb Raider (2018) | 59 | 53 | 32 | 15 | ||
| Assassin´s Creed Odyssey (2018) | 48 | 43 | 40 | 31 | ||
| Call of Duty Black Ops 4 (2018) | 67.5 | 53.9 | 28.8 | |||
| Battlefield V (2018) | 61 | 43.7 | 16.2 | |||
| Farming Simulator 19 (2018) | 70 | 49.1 | 32.8 | |||
| Apex Legends (2019) | 72 | 51.7 | 28.4 | |||
| Far Cry New Dawn (2019) | 51 | 47 | 25 | |||
| Metro Exodus (2019) | 92.3 | 45.4 | 38.1 | 32.2 | 25 | |
| Anthem (2019) | 48 (stuttering) | 47 (stuttering) | 44 (stuttering) | 32 (stuttering) | ||
| Dirt Rally 2.0 (2019) | 58.4 | 38.1 | 22.8 | |||
| The Division 2 (2019) | 51 | 42 | ||||
| Anno 1800 (2019) | 60 | 46.3 | 23.9 | |||
| Rage 2 (2019) | 67 | 55.7 | 53.4 | 15.4 | ||
| Total War: Three Kingdoms (2019) | 134 | 69.1 | 48.7 | 35.8 | 19.4 | 6.9 |
| F1 2019 (2019) | 79 | 74 | 64 | 64 | 49.1 | 33.3 |
| Control (2019) | 119 | 47.5 | 34.2 | |||
| Borderlands 3 (2019) | 76 | 66 | 47.2 | 35.6 | 23.9 | 6.7 |
| FIFA 20 (2019) | 122 | 122 | 96 | |||
| Ghost Recon Breakpoint (2019) | 58 | 53 | 48 | 26 | ||
| GRID 2019 (2019) | 81 | 67 | 36.7 | 29.9 | 15.2 | |
| Call of Duty Modern Warfare 2019 (2019) | 112 | 94 | 81 | 64 | 35.4 | 20.1 |
| Need for Speed Heat (2019) | 63 | 57.7 | 52.3 | 45.8 | 41 | 14.1 |
| Star Wars Jedi Fallen Order (2019) | 58.6 | 40.1 | 19.8 | |||
| Red Dead Redemption 2 (2019) | 92 | 63 | 40.5 | 23.8 | ||
| God of War (2022) | 36.1 | 36 | 33 | 9.06 | ||
| Rainbow Six Extraction (2022) | 95 | 78 | 76 | 36 | ||
| GRID Legends (2022) | 81 | 71.8 | 71.1 | 59.2 | ||
| Elden Ring (2022) | 37 | 35.8 | 35.2 | 35.2 | ||
| Cyberpunk 2077 1.6 (2022) | 55.9 | 44.9 | 34.4 | 27.7 | ||
| Elex 2 (2022) | 20.1 | 19.3 | 19.4 | 18.8 | ||
| Ghostwire Tokyo (2022) | 56 | 56 | 55.7 | 54.9 | ||
| Tiny Tina's Wonderlands (2022) | 88.5 | 71.2 | 38.6 | 28.3 | ||
| Vampire Bloodhunt (2022) | 93.8 | 82.1 | 78.7 | 77.3 | ||
| F1 22 (2022) | 95 | 92 | 78 | 66 | ||
| The Quarry (2022) | 65.5 | 47 | 40.3 | 23.8 | ||
| FIFA 23 (2022) | 46.6 | 38.4 | 33.3 | 33.2 | ||
| A Plague Tale Requiem (2022) | 47.2 | 36.9 | 26.9 | 20.7 | ||
| Uncharted Legacy of Thieves Collection (2022) | 36.6 | 32.3 | 20.6 | 18.6 | ||
| Call of Duty Modern Warfare 2 2022 (2022) | 70 | 66 | 56 | 43 | ||
| Spider-Man Miles Morales (2022) | 48 | 43.3 | 30.6 | 26 | ||
| The Callisto Protocol (2022) | 57.7 | 47.4 | 29.8 | 28.6 | ||
| Need for Speed Unbound (2022) | 43.2 | 41 | 34.7 | 27.3 |
Ljudnivå
| Låg belastning |
| 31.1 / 34.8 / 35.5 dB(A) |
| Hög belastning |
| 43 / 53.6 dB(A) |
 | ||
30 dB tyst 40 dB(A) hörbar 50 dB(A) högt ljud |
||
min: | ||
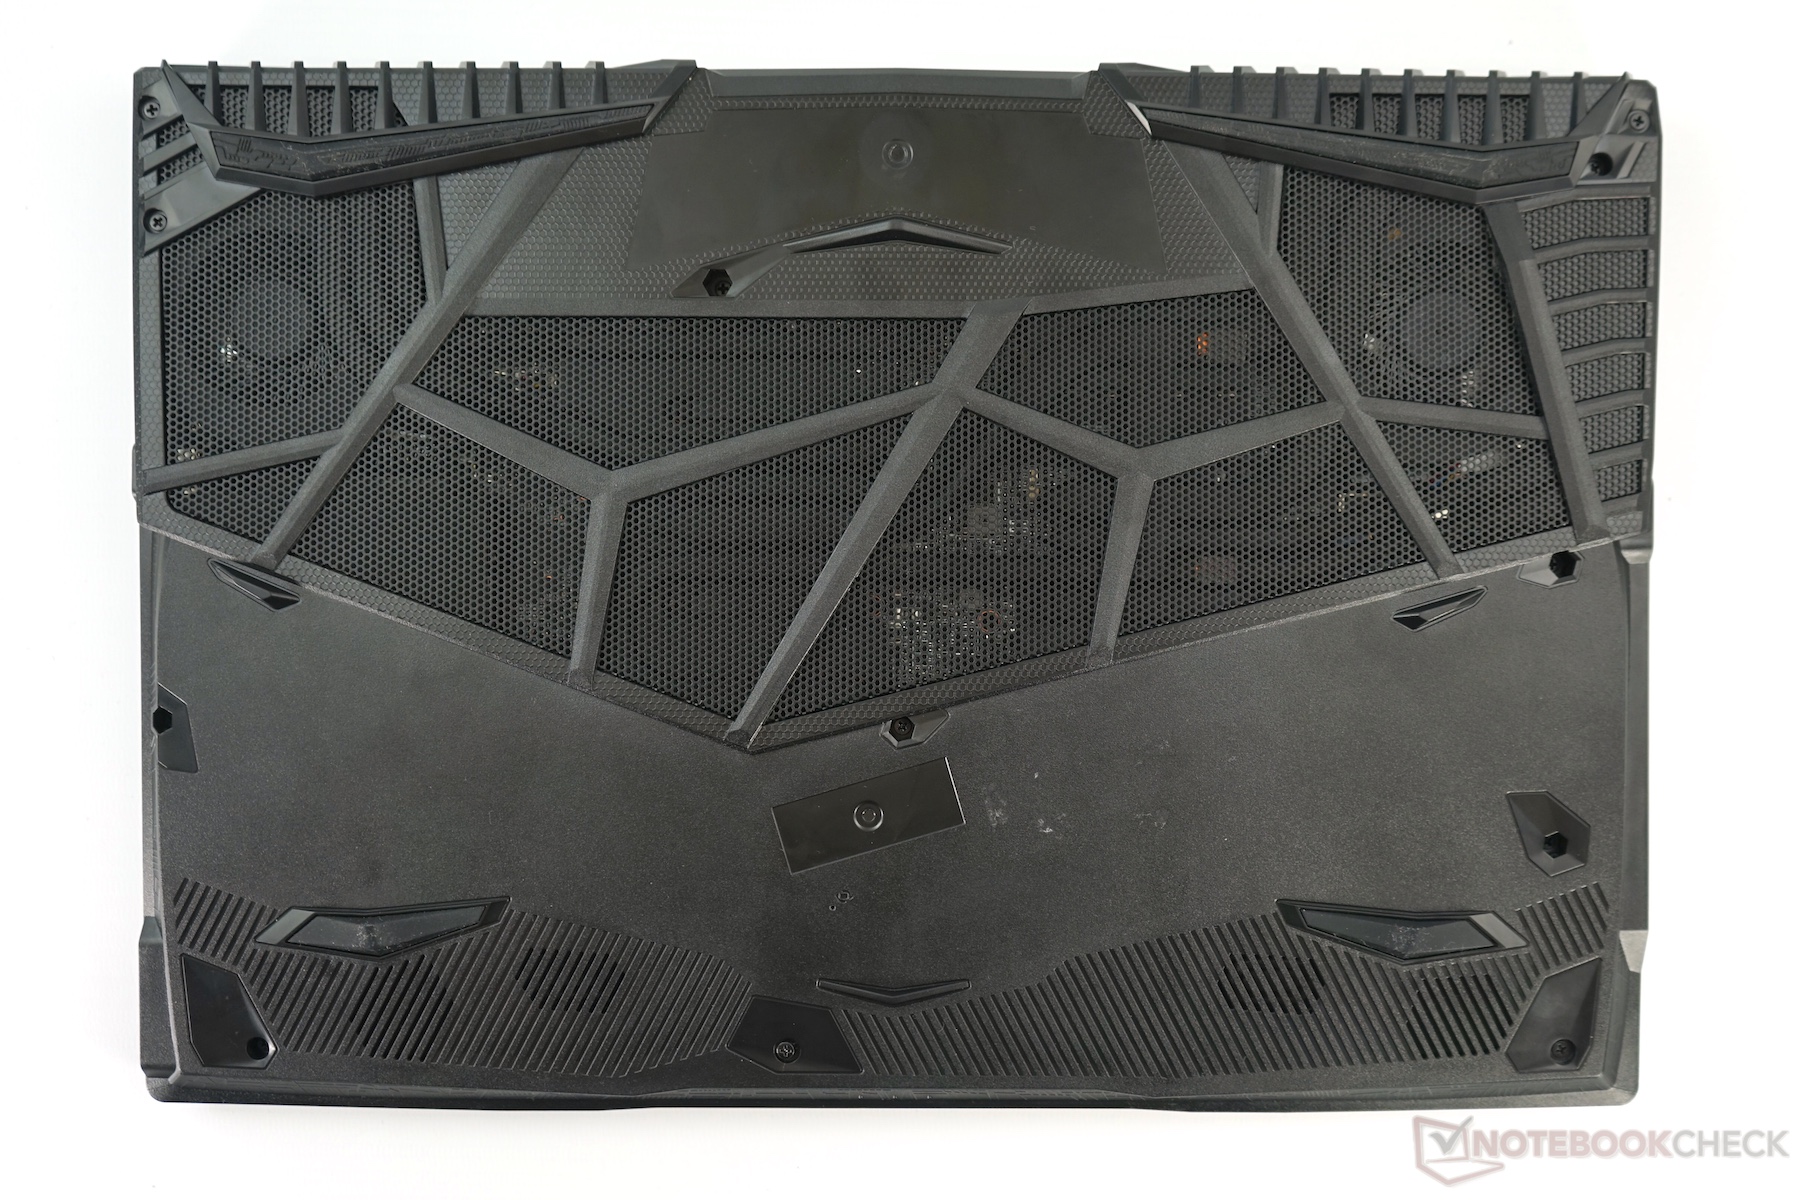
(±) Den maximala temperaturen på ovansidan är 42 °C / 108 F, jämfört med genomsnittet av 40.4 °C / 105 F , allt från 21.2 till 68.8 °C för klassen Gaming.
(±) Botten värms upp till maximalt 45 °C / 113 F, jämfört med genomsnittet av 43.2 °C / 110 F
(+) Vid tomgångsbruk är medeltemperaturen för ovansidan 29.1 °C / 84 F, jämfört med enhetsgenomsnittet på 33.9 °C / ### class_avg_f### F.
(+) När du spelar The Witcher 3 är medeltemperaturen för ovansidan 31.3 °C / 88 F, jämfört med enhetsgenomsnittet på 33.9 °C / ## #class_avg_f### F.
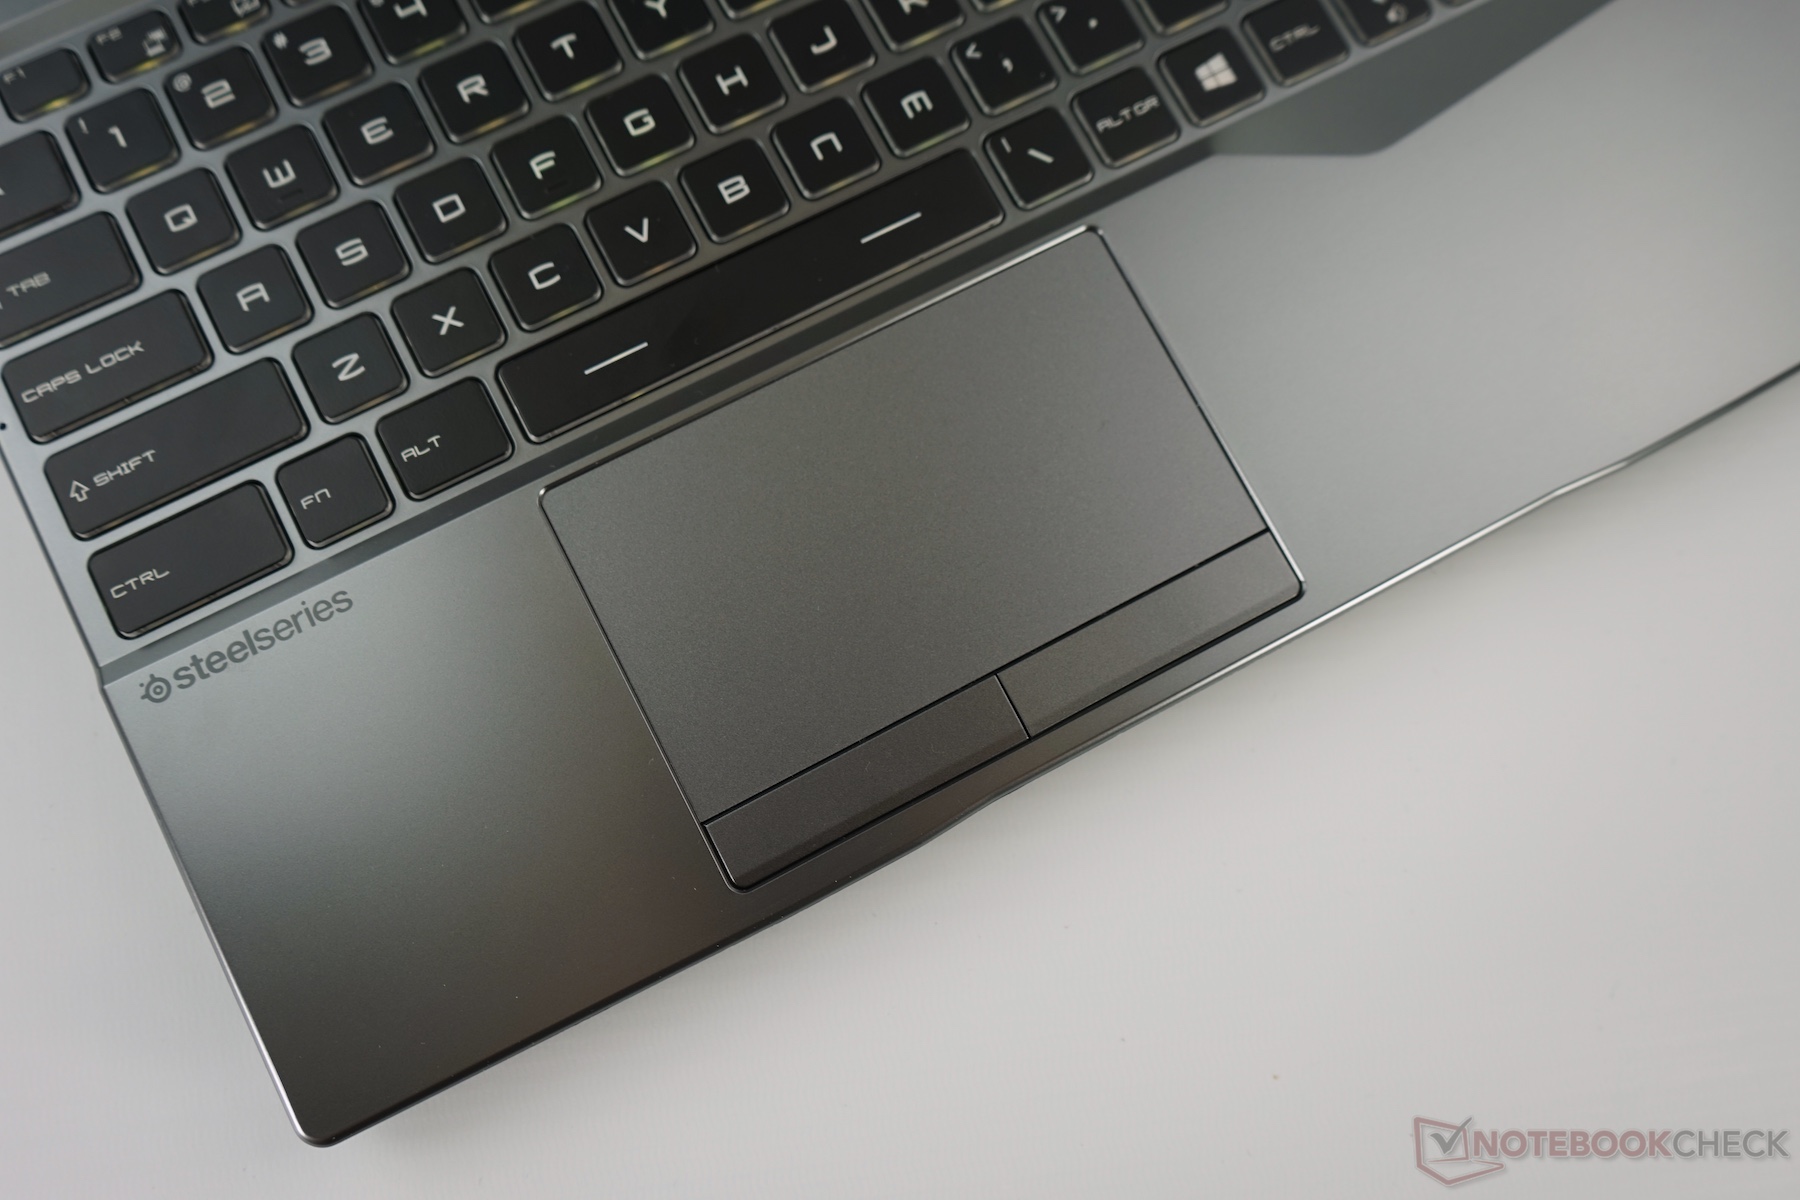
(+) Handledsstöden och pekplattan når maximal hudtemperatur (32 °C / 89.6 F) och är därför inte varma.
(-) Medeltemperaturen för handledsstödsområdet på liknande enheter var 28.8 °C / 83.8 F (-3.2 °C / -5.8 F).
MSI Alpha 15 A3DDK ljudanalys
(+) | högtalare kan spela relativt högt (90.6 dB)
Bas 100 - 315 Hz
(-) | nästan ingen bas - i genomsnitt 26.4% lägre än medianen
(±) | linjäriteten för basen är genomsnittlig (7.3% delta till föregående frekvens)
Mellan 400 - 2000 Hz
(±) | högre mellan - i genomsnitt 6.9% högre än median
(±) | linjäriteten för mids är genomsnittlig (7.6% delta till föregående frekvens)
Högsta 2 - 16 kHz
(+) | balanserade toppar - endast 2% från medianen
(+) | toppar är linjära (6.2% delta till föregående frekvens)
Totalt 100 - 16 000 Hz
(±) | linjäriteten för det totala ljudet är genomsnittlig (17.7% skillnad mot median)
Jämfört med samma klass
» 52% av alla testade enheter i den här klassen var bättre, 10% liknande, 38% sämre
» Den bästa hade ett delta på 6%, genomsnittet var 18%, sämst var 132%
Jämfört med alla testade enheter
» 35% av alla testade enheter var bättre, 8% liknande, 57% sämre
» Den bästa hade ett delta på 4%, genomsnittet var 24%, sämst var 134%
Apple MacBook 12 (Early 2016) 1.1 GHz ljudanalys
(+) | högtalare kan spela relativt högt (83.6 dB)
Bas 100 - 315 Hz
(±) | reducerad bas - i genomsnitt 11.3% lägre än medianen
(±) | linjäriteten för basen är genomsnittlig (14.2% delta till föregående frekvens)
Mellan 400 - 2000 Hz
(+) | balanserad mellan - endast 2.4% från medianen
(+) | mids är linjära (5.5% delta till föregående frekvens)
Högsta 2 - 16 kHz
(+) | balanserade toppar - endast 2% från medianen
(+) | toppar är linjära (4.5% delta till föregående frekvens)
Totalt 100 - 16 000 Hz
(+) | det totala ljudet är linjärt (10.2% skillnad mot median)
Jämfört med samma klass
» 7% av alla testade enheter i den här klassen var bättre, 2% liknande, 91% sämre
» Den bästa hade ett delta på 5%, genomsnittet var 18%, sämst var 53%
Jämfört med alla testade enheter
» 5% av alla testade enheter var bättre, 1% liknande, 94% sämre
» Den bästa hade ett delta på 4%, genomsnittet var 24%, sämst var 134%
| Av/Standby | |
| Låg belastning | |
| Hög belastning |
|
Förklaring:
min: | |
| MSI Alpha 15 A3DDK R7 3750H, Radeon RX 5500M, Toshiba KBG30ZMV256G, IPS, 1920x1080, 15.6" | Asus TUF FX505DT-EB73 R7 3750H, GeForce GTX 1650 Mobile, Intel SSD 660p SSDPEKNW512G8, IPS, 1920x1080, 15.6" | Dell G3 3590 i5-9300H, GeForce GTX 1650 Mobile, Toshiba BG4 KBG40ZNS128G, IPS, 1920x1080, 15.6" | Acer Aspire Nitro 5 AN515-54-53Z2 i5-9300H, GeForce GTX 1650 Mobile, WDC PC SN520 SDAPNUW-512G, IPS, 1920x1080, 15.6" | Asus ROG Zephyrus G15 GA502DU R7 3750H, GeForce GTX 1660 Ti Max-Q, Intel SSD 660p SSDPEKNW512G8, IPS, 1920x1080, 15.6" | Lenovo IdeaPad L340-15IRH 81LK00BMGE i5-9300H, GeForce GTX 1650 Mobile, WDC PC SN520 SDAPMUW-512, IPS, 1920x1080, 15.6" | HP Omen 15-dc1020ng i5-9300H, GeForce GTX 1650 Mobile, WDC PC SN720 SDAQNTW-512G, IPS, 1920x1080, 15.6" | Dell G5 15 5590-PCNJJ i5-9300H, GeForce GTX 1650 Mobile, KBG30ZMS128G, IPS, 1920x1080, 15.6" | HP Pavilion Gaming 15-ec0017ng R7 3750H, GeForce GTX 1660 Ti Max-Q, WDC PC SN720 SDAPNTW-256G, IPS, 1920x1080, 15.6" | |
|---|---|---|---|---|---|---|---|---|---|
| Power Consumption | 32% | 18% | 35% | 11% | 43% | 36% | 34% | 38% | |
| Idle Minimum * (Watt) | 11.7 | 7 40% | 6.2 47% | 5 57% | 7.4 37% | 3.8 68% | 4.04 65% | 4 66% | 3.4 71% |
| Idle Average * (Watt) | 15.7 | 9.9 37% | 8.4 46% | 7 55% | 8.6 45% | 6.6 58% | 7.2 54% | 7 55% | 7.6 52% |
| Idle Maximum * (Watt) | 22.4 | 12 46% | 27.7 -24% | 11 51% | 39.1 -75% | 8.9 60% | 11.4 49% | 12 46% | 10.2 54% |
| Load Average * (Watt) | 70.7 | 68.4 3% | 91 -29% | 89 -26% | 65.9 7% | 78.4 -11% | 80.8 -14% | 95 -34% | 73 -3% |
| Witcher 3 ultra * (Watt) | 148 | 94.9 36% | 94.4 36% | 90 39% | 106.9 28% | 82 45% | 93.6 37% | 86 42% | 107 28% |
| Load Maximum * (Watt) | 191 | 130.9 31% | 131.5 31% | 132 31% | 141.3 26% | 124 35% | 144.5 24% | 135 29% | 140.5 26% |
* ... mindre är bättre
Ett första omdöme
Läs den fullständiga versionen av den här recensionen på engelska här.
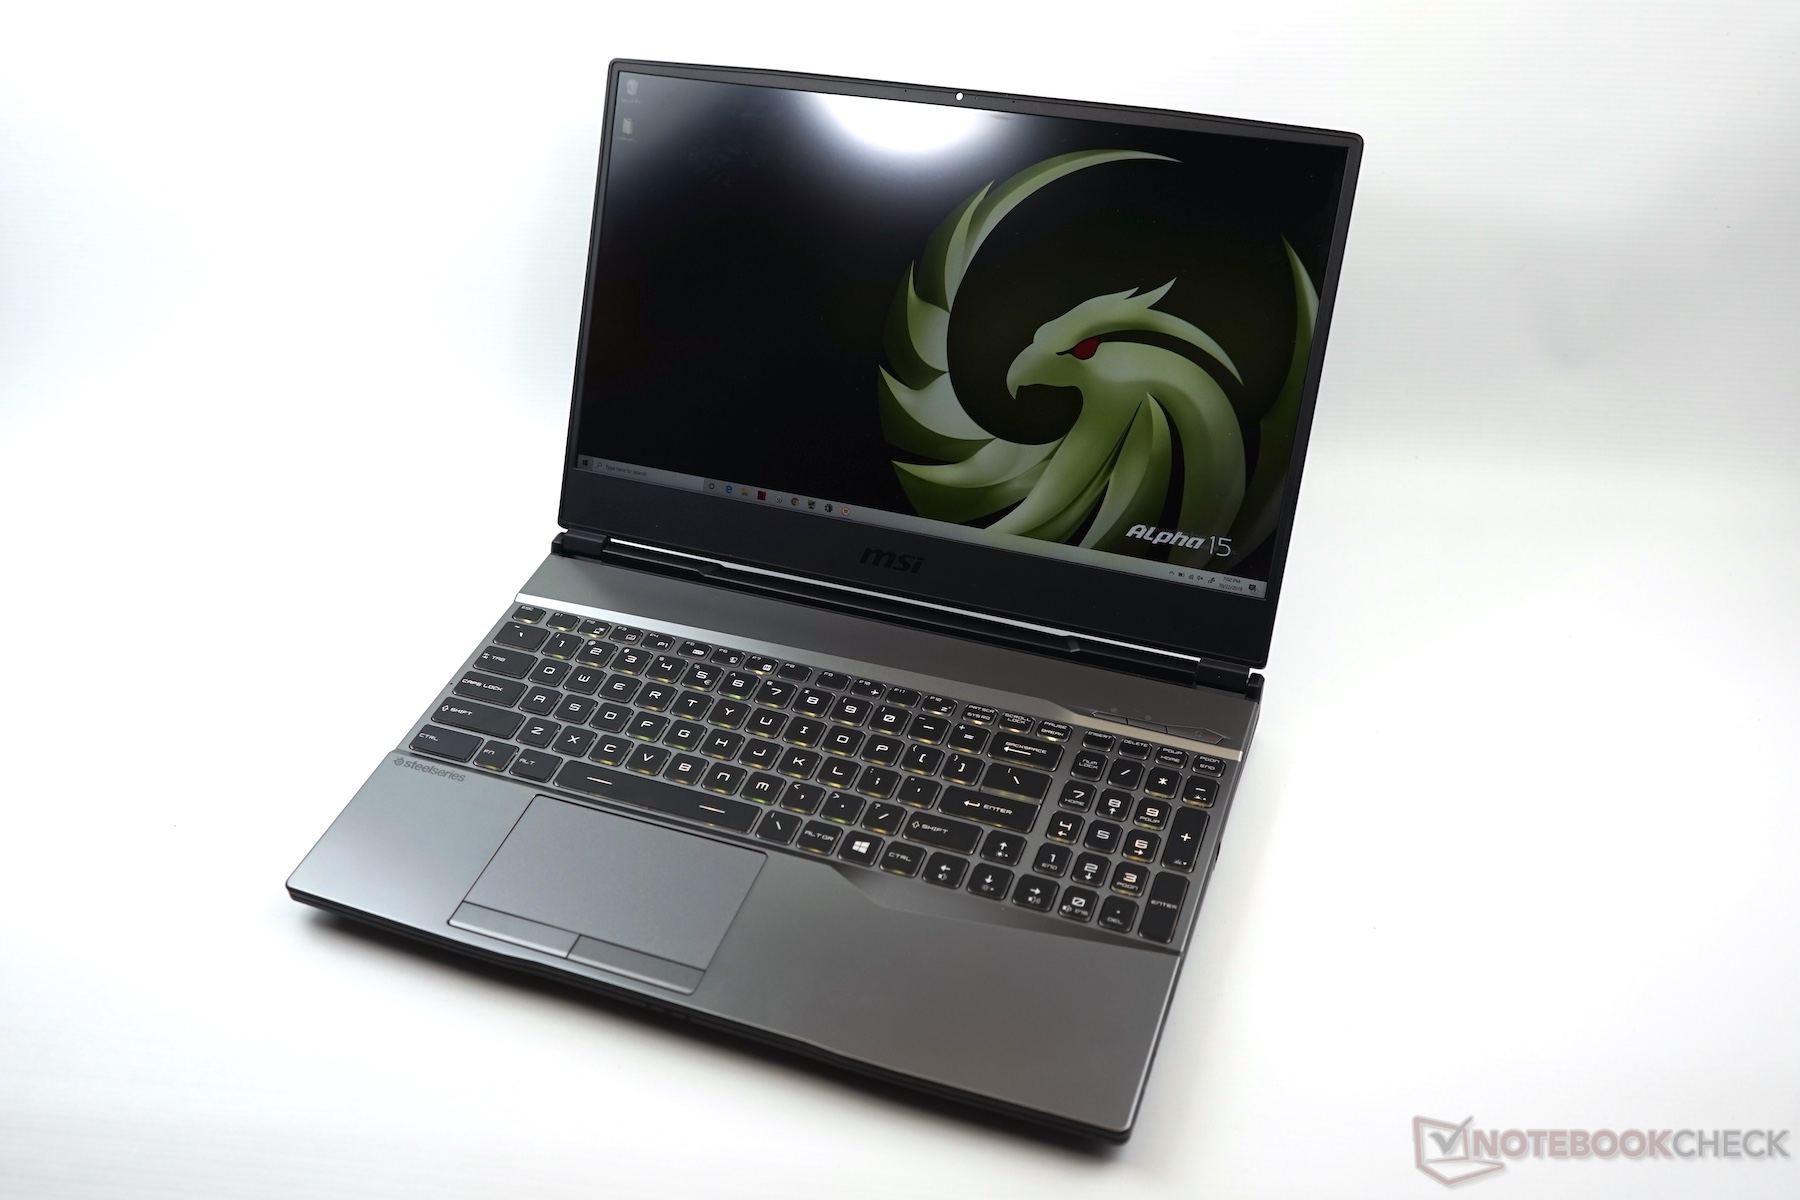
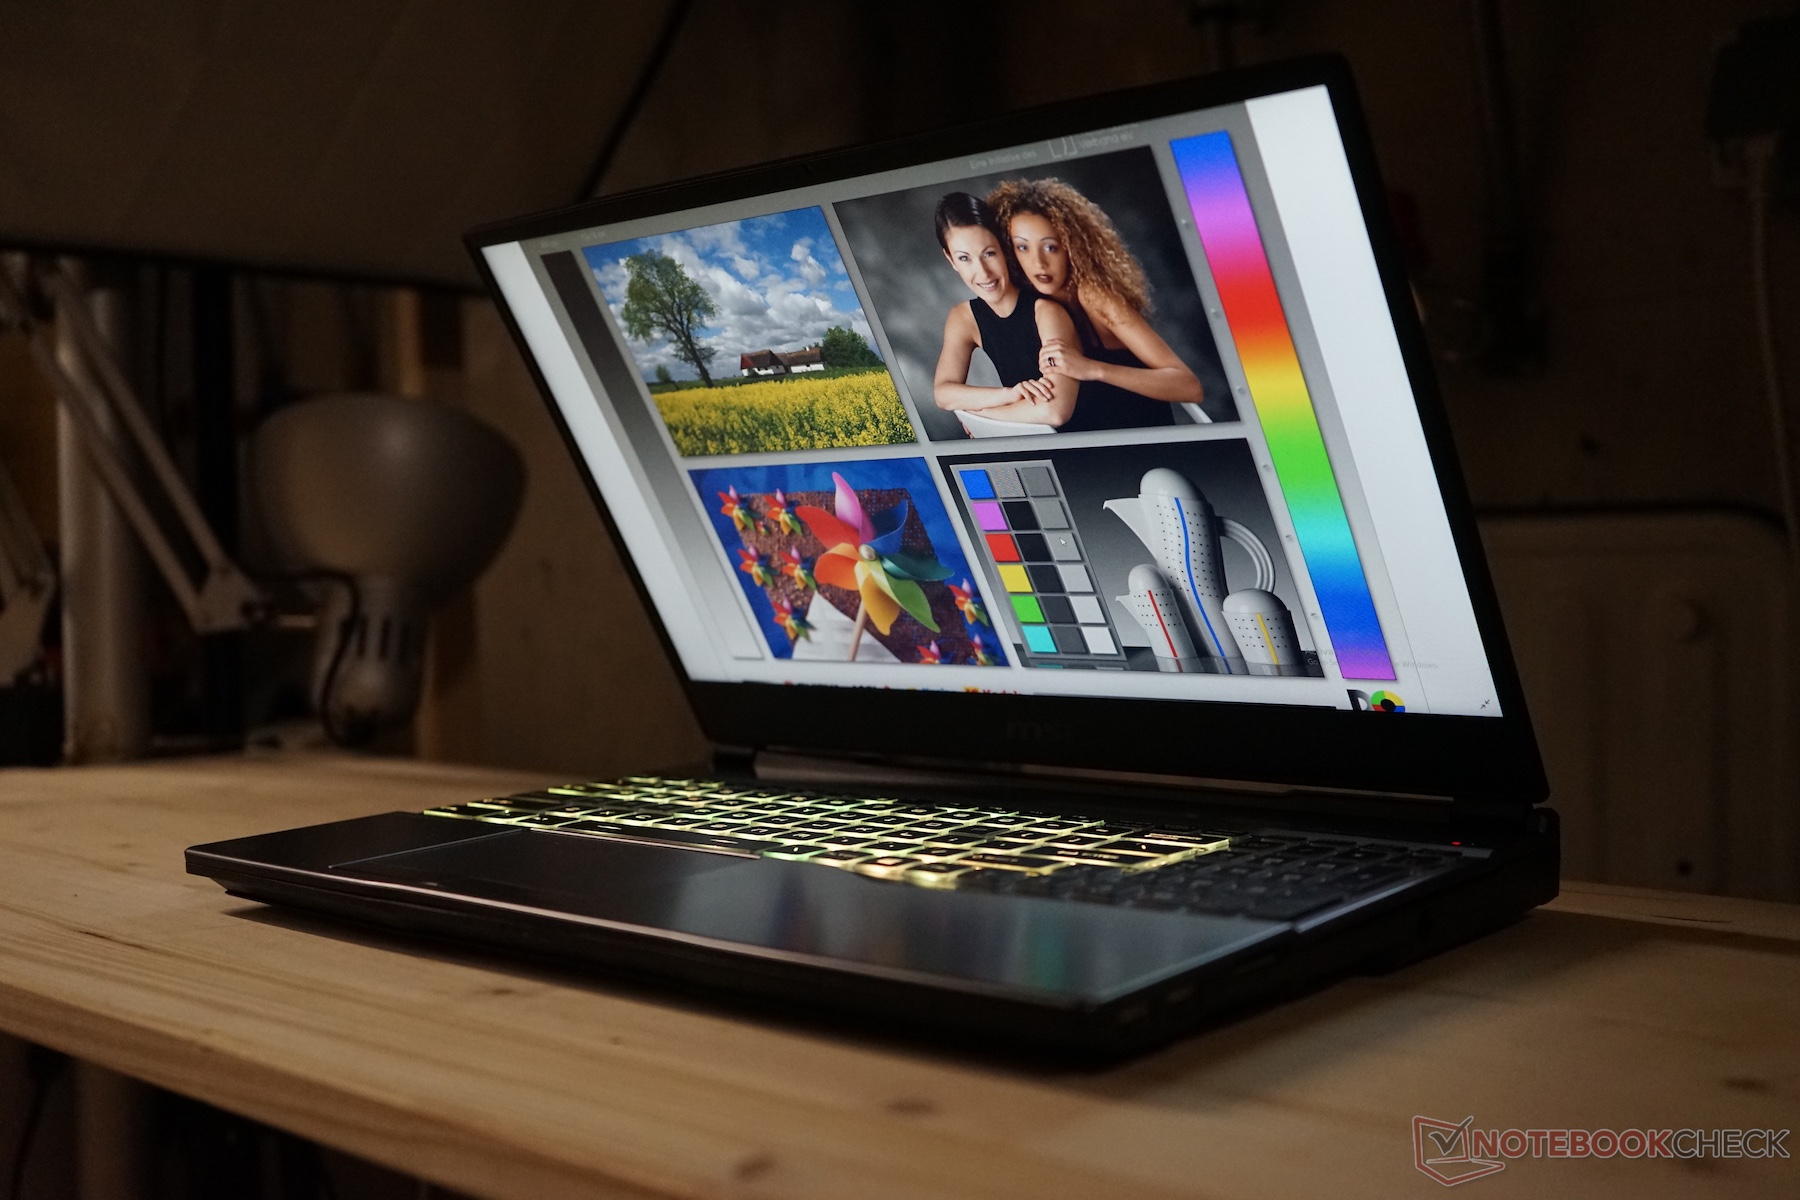
Även om MSI inte har försökt besegra klassens bästa med sin Alpha 15 har de tagit fram ett paket som på ett diskret sätt utmanar den mittenskiktsmarknad som Intel och NVIDIA hittills har dominerat. I korthet står Alpha 15 för ett första steg in på en marknad där AMD kan tänkas få fäste.
Den viktigaste egenskapen hos Alpha 15 är Raden RX 5500M GPU:n som är baserad på AMD:s Navi-arkitektur. GPU:n, som tillverkats i en 7 nm-process, hamnar på papperet mellan GeForce GTX 1650 och GTX 1660 Ti Max-Q, vilket våra tester med förhandsmodellen bekräftar. Men det bör nämnas att spannet över möjliga resultat för tillfället är stort. Som exempel, i en del spel presterar inte RX 5500M bättre än GTX 1650 samtidigt som den når samma nivåer som GTX 1660 Ti Max-Q i andra. Totalt sett hamnar den någonstans mellan dessa.
Med en Ryzen 7 3750H processor och en ny Radeon RX 5500M GPU kan MSI Alpha 15 för vissa spel tävla med bärbara speldatorer som innehåller en Core i5-9300H och en GeForce 1660 Ti Max-Q.
Om enheten blir en framgång för AMD och MSI beror på vad Alpha 15 kommer att kosta när den släpps. Tidig information antyder att den kommer kostar runt 10.000 kronor och 11.000 kronor för modeller med 120 Hz respektive 144 Hz, ett pris som placerar Alpha 15 över modeller med Core i5-9300H och GTX 1650, som oftast kostar en bra bit under 10.000 kronor. Men laptops med GTX 1660 Ti Max-Q kostar oftast mer än 10.000 kronor, vilket sätter RX 5500M i en bättre situation. Vi misstänker att valet mellan de tre grafikchippen också kommer bero på vilka funktioner datorn de placeras i har.
Totalt sett har Alpha 15 gett oss ett positivt intryck av hur Radeon RX 5500M och RDNA-arkitekturen fungerar i en laptop. Det verkar som att det återigen kommer bli ett reellt val att välja mellan AMD och NVIDIA, även om det återstår att se hur långt AMD kan ta sig på marknaden för toppskiktsmaskiner. Ett som är säkert är att mer kraftfulla bärbara grafikchip än RX 5500M nog är på väg.
Price comparison
