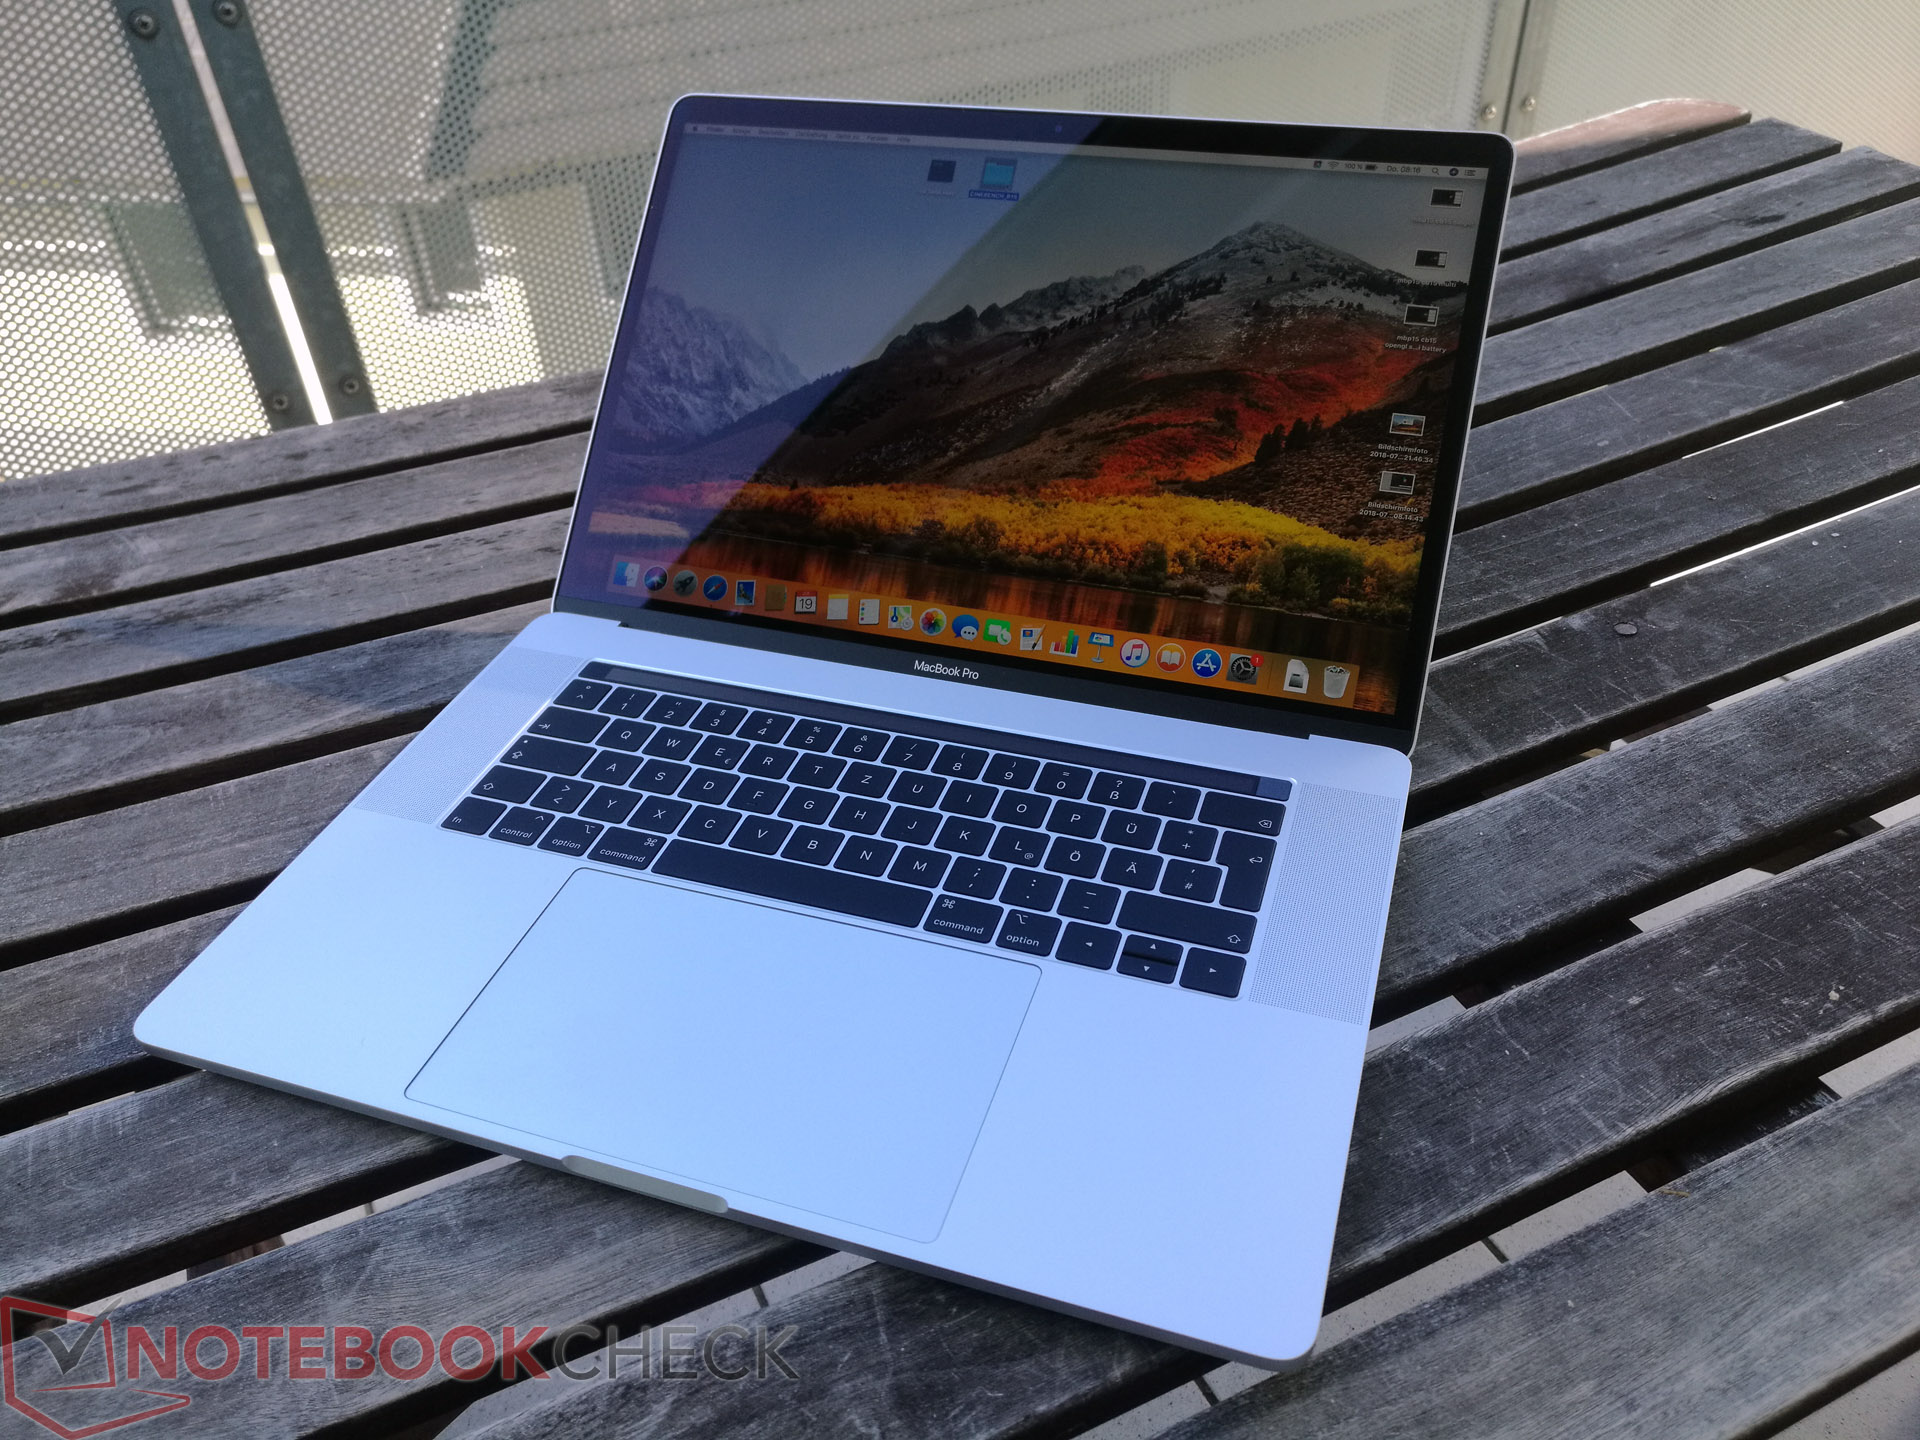
Test: Apple MacBook Pro 15 2018 (2.6 GHz, 560X) Laptop (Sammanfattning)
| |||||||||||||||||||||||||
Distribution av ljusstyrkan: 88 %
Mitt på batteriet: 524 cd/m²
Kontrast: 1333:1 (Svärta: 0.39 cd/m²)
ΔE ColorChecker Calman: 1.2 | ∀{0.5-29.43 Ø4.71}
ΔE Greyscale Calman: 1.3 | ∀{0.09-98 Ø4.96}
86.6% AdobeRGB 1998 (Argyll 3D)
99.9% sRGB (Argyll 3D)
98.7% Display P3 (Argyll 3D)
Gamma: 2.18
CCT: 6738 K
| Apple MacBook Pro 15 2018 (2.6 GHz, 560X) APPA040, , 2880x1800, 15.4" | Apple MacBook Pro 15 2017 (2.8 GHz, 555) APPA031, , 2880x1800, 15.4" | Dell XPS 15 9570 i7 UHD LQ156D1, , 3840x2160, 15.6" | Gigabyte Aero 15X v8 LGD05C0, , 1920x1080, 15.6" | Razer Blade 15 GTX 1060 LGD05C0, , 1920x1080, 15.6" | Asus ZenBook Pro 15 UX580GE AU Optronics B156ZAN03.1, , 3840x2160, 15.6" | |
|---|---|---|---|---|---|---|
| Display | -1% | -10% | -22% | -22% | 0% | |
| Display P3 Coverage (%) | 98.7 | 97.9 -1% | 79.1 -20% | 63.6 -36% | 64.4 -35% | 85.9 -13% |
| sRGB Coverage (%) | 99.9 | 99.9 0% | 98.8 -1% | 93.8 -6% | 93.4 -7% | 100 0% |
| AdobeRGB 1998 Coverage (%) | 86.6 | 85.9 -1% | 79.2 -9% | 64.9 -25% | 65.5 -24% | 99.1 14% |
| Response Times | -10% | -5% | 63% | 66% | 13% | |
| Response Time Grey 50% / Grey 80% * (ms) | 43.2 ? | 48 ? -11% | 46.4 ? -7% | 16.8 ? 61% | 13.6 ? 69% | 44 ? -2% |
| Response Time Black / White * (ms) | 31.2 ? | 33.8 ? -8% | 32 ? -3% | 11.2 ? 64% | 12 ? 62% | 22.8 ? 27% |
| PWM Frequency (Hz) | 117000 ? | 119000 ? | 980 ? | |||
| Screen | -19% | -137% | -7% | -28% | -86% | |
| Brightness middle (cd/m²) | 520 | 545 5% | 494 -5% | 313 -40% | 304.3 -41% | 357.6 -31% |
| Brightness (cd/m²) | 492 | 523 6% | 457 -7% | 300 -39% | 293 -40% | 350 -29% |
| Brightness Distribution (%) | 88 | 86 -2% | 88 0% | 78 -11% | 80 -9% | 85 -3% |
| Black Level * (cd/m²) | 0.39 | 0.44 -13% | 0.34 13% | 0.33 15% | 0.38 3% | 0.35 10% |
| Contrast (:1) | 1333 | 1239 -7% | 1453 9% | 948 -29% | 801 -40% | 1022 -23% |
| Colorchecker dE 2000 * | 1.2 | 1.6 -33% | 5.2 -333% | 1.29 -8% | 1.79 -49% | 4.12 -243% |
| Colorchecker dE 2000 max. * | 2.3 | 3.8 -65% | 17.5 -661% | 2.04 11% | 3.69 -60% | 9.91 -331% |
| Greyscale dE 2000 * | 1.3 | 1.9 -46% | 2.7 -108% | 0.69 47% | 1.1 15% | 1.8 -38% |
| Gamma | 2.18 101% | 2.26 97% | 2.1 105% | 2.43 91% | 2.27 97% | 2.17 101% |
| CCT | 6738 96% | 6834 95% | 7038 92% | 6550 99% | 6665 98% | 6613 98% |
| Color Space (Percent of AdobeRGB 1998) (%) | 71.2 | 60 | 59.8 | 87.5 | ||
| Color Space (Percent of sRGB) (%) | 98.8 | 94 | 92.8 | 100 | ||
| Colorchecker dE 2000 calibrated * | 4.23 | |||||
| Totalt genomsnitt (program/inställningar) | -10% /
-14% | -51% /
-87% | 11% /
0% | 5% /
-12% | -24% /
-51% |
* ... mindre är bättre
Visa svarstider
| ↔ Svarstid svart till vitt | ||
|---|---|---|
| 31.2 ms ... stiga ↗ och falla ↘ kombinerat | ↗ 16.4 ms stiga | 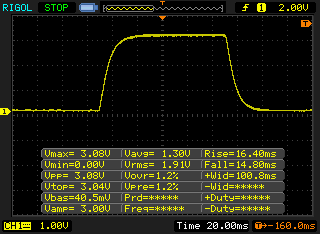 |
| ↘ 14.8 ms hösten | ||
| Skärmen visar långsamma svarsfrekvenser i våra tester och kommer att vara otillfredsställande för spelare. I jämförelse sträcker sig alla testade enheter från 0.1 (minst) till 240 (maximalt) ms. » 84 % av alla enheter är bättre. Detta innebär att den uppmätta svarstiden är sämre än genomsnittet av alla testade enheter (19.8 ms). | ||
| ↔ Svarstid 50 % grått till 80 % grått | ||
| 43.2 ms ... stiga ↗ och falla ↘ kombinerat | ↗ 20.4 ms stiga | 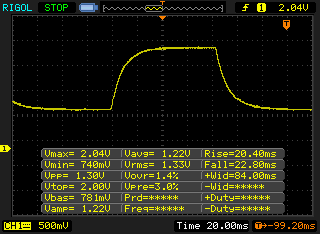 |
| ↘ 22.8 ms hösten | ||
| Skärmen visar långsamma svarsfrekvenser i våra tester och kommer att vara otillfredsställande för spelare. I jämförelse sträcker sig alla testade enheter från 0.165 (minst) till 636 (maximalt) ms. » 72 % av alla enheter är bättre. Detta innebär att den uppmätta svarstiden är sämre än genomsnittet av alla testade enheter (31 ms). | ||
| PCMark 8 Home Score Accelerated v2 | 3735 poäng | |
| PCMark 8 Creative Score Accelerated v2 | 3836 poäng | |
| PCMark 8 Work Score Accelerated v2 | 4575 poäng | |
| PCMark 10 Score | 4805 poäng | |
Hjälp | ||

| 3DMark 11 Performance | 7910 poäng | |
| 3DMark Cloud Gate Standard Score | 18251 poäng | |
| 3DMark Fire Strike Score | 4961 poäng | |
| 3DMark Time Spy Score | 1775 poäng | |
Hjälp | ||
| The Witcher 3 - 1920x1080 Ultra Graphics & Postprocessing (HBAO+) | |
| Schenker XMG Neo 15 | |
| Razer Blade 15 GTX 1060 | |
| Dell XPS 15 9570 i7 UHD | |
| Apple MacBook Pro 15 2018 (2.6 GHz, 560X) | |
| Apple MacBook Pro 15 2017 (2.8 GHz, 555) | |
| låg | med. | hög | ultra | QHD | 4K | |
|---|---|---|---|---|---|---|
| Counter-Strike: GO (2012) | 79 | 51 | 27.6 | |||
| BioShock Infinite (2013) | 48.8 | |||||
| GTA V (2015) | 157 | 44.9 | 22 | 13.3 | ||
| The Witcher 3 (2015) | 96 | 55.1 | 34 | 19.7 | ||
| Dota 2 Reborn (2015) | 85.3 | 94.6 | 71 | 68.7 | ||
| World of Warships (2015) | 67.3 | 22 | ||||
| Rainbow Six Siege (2015) | 180 | 76.4 | 62.9 | 17.4 | ||
| Rise of the Tomb Raider (2016) | 30.5 | 24.3 | ||||
| The Division (2016) | 33.7 | |||||
| Overwatch (2016) | 235 | 165 | 91 | 45.1 | ||
| Deus Ex Mankind Divided (2016) | 61.8 | 27.9 | 13.1 | |||
| Battlefield 1 (2016) | 134 | 39.2 | 35.6 | 15.2 | ||
| Civilization 6 (2016) | 39.4 | 29.4 | ||||
| Farming Simulator 17 (2016) | 26.9 | |||||
| Call of Duty Infinite Warfare (2016) | 48.3 | |||||
| For Honor (2017) | 114 | 72 | 41.4 | 31.2 | ||
| Ghost Recon Wildlands (2017) | 69 | 32.5 | 29.7 | 13.3 | ||
| Rocket League (2017) | 69.8 | 25.9 | ||||
| Team Fortress 2 (2017) | 171 | 175 | 165 | 139 | 47.3 | |
| Playerunknown's Battlegrounds (PUBG) (2017) | 40 | |||||
| Middle-earth: Shadow of War (2017) | 98 | 41 | 29 | 21 | 9 | |
| Need for Speed Payback (2017) | 38.8 | |||||
| Star Wars Battlefront 2 (2017) | 112 | 42 | 37.7 | 30.3 | 3.4 | |
| Fortnite (2018) | 149 | 66 | 40 | 31.9 | ||
| Final Fantasy XV Benchmark (2018) | 44.4 | 23.6 | 14.3 | 5.8 | ||
| Kingdom Come: Deliverance (2018) | 81 | 27.6 | 25.5 | 19 | ||
| X-Plane 11.11 (2018) | 63.7 | 47.7 | 42.1 | 21.4 | ||
| World of Tanks enCore (2018) | 453 | 108 | 37.4 | 23.8 | 11.6 | |
| Far Cry 5 (2018) | 74 | 37 | 33 | 31 | 10 | |
| The Crew 2 (2018) | 59.9 | 38.8 | 38.3 | 35 | 10.3 | |
| Monster Hunter World (2018) | 78 | 30 | 27.8 | 19.6 | ||
| F1 2018 (2018) | 99 | 57 | 47 | 30 | 12 | |
| Shadow of the Tomb Raider (2018) | 81 | 31 | 27 | 23 | 6 | |
| FIFA 19 (2018) | 119 | 38.8 | ||||
| Forza Horizon 4 (2018) | 102 | 53 | 50 | 36 | ||
| Assassin´s Creed Odyssey (2018) | 50 | 31 | 25 | 14 | ||
| Call of Duty Black Ops 4 (2018) | 48.7 | 43.5 | 40.4 | |||
| Hitman 2 (2018) | 34.4 | 30.9 | 9.2 | |||
| Fallout 76 (2018) | 33.1 | 31.4 | ||||
| Battlefield V (2018) | 95 | 43.3 | 36.2 | 32.5 | ||
| Farming Simulator 19 (2018) | 47.7 | 23.5 | ||||
| Darksiders III (2018) | 144 | 39 | 29.8 | 25.4 | 7.8 | |
| Just Cause 4 (2018) | 37.8 | 28.9 | 27.3 | |||
| Apex Legends (2019) | 97 | 40.8 | 33.9 | 32.8 | ||
| Far Cry New Dawn (2019) | 71 | 36 | 31 | 27 | 9 | |
| Metro Exodus (2019) | 50.5 | 26.2 | 17 | 14.2 | 11 | 6.5 |
| Anthem (2019) | 60 | 34.8 | 28.8 | 26.6 | ||
| Dirt Rally 2.0 (2019) | 135 | 53.5 | 44.9 | 23.2 | ||
| The Division 2 (2019) | 104 | 41 | 30 | |||
| Anno 1800 (2019) | 92 | 39 | 20.8 | 10.7 | ||
| Rage 2 (2019) | 65.4 | 18.8 | ||||
| Total War: Three Kingdoms (2019) | 105 | 30.2 | 19.1 | 13.6 | ||
| League of Legends (2019) | 209 | 202 | 179 | 174 | 152 | |
| F1 2019 (2019) | 120 | 55.5 | 50.7 | 30.8 | 22.4 | |
| Control (2019) | 56.5 | 21.6 | 15.2 | |||
| Borderlands 3 (2019) | 78 | 33.6 | 20.8 | 15.8 | 10.8 | 3.1 |
| FIFA 20 (2019) | 99 | 77 | 45.3 | |||
| Ghost Recon Breakpoint (2019) | 51 | 29 | 25 | 18 | ||
| GRID 2019 (2019) | 94 | 43.4 | 33.5 | 20.5 | ||
| Call of Duty Modern Warfare 2019 (2019) | 61 | 39 | 30.1 | 22.1 | ||
| Need for Speed Heat (2019) | 62 | 33.5 | 29.1 | 23.4 | 15.9 | |
| Star Wars Jedi Fallen Order (2019) | 35.5 | 28.5 | 24.7 | 15.5 | ||
| Red Dead Redemption 2 (2019) | 61 | 30.4 | 19 | 0 | ||
| Hearthstone (2020) | 58.3 | |||||
| Escape from Tarkov (2020) | 87.8 | 37.2 | 33.5 | 16.3 | ||
| Hunt Showdown (2020) | 71 | 23.7 | 20.6 | |||
| Doom Eternal (2020) | 90.4 | 46.1 | 29.4 | 25.9 | 18.6 |
Ljudnivå
| Låg belastning |
| 30.1 / 30.1 / 30.1 dB(A) |
| Hårddisk |
| 30.1 dB(A) |
| Hög belastning |
| 46.8 / 46.8 dB(A) |
 | ||
30 dB tyst 40 dB(A) hörbar 50 dB(A) högt ljud |
||
min: | ||
(-) Den maximala temperaturen på ovansidan är 45.7 °C / 114 F, jämfört med genomsnittet av 36.8 °C / 98 F , allt från 21 till 71 °C för klassen Multimedia.
(±) Botten värms upp till maximalt 41.7 °C / 107 F, jämfört med genomsnittet av 39.1 °C / 102 F
(+) Vid tomgångsbruk är medeltemperaturen för ovansidan 25.7 °C / 78 F, jämfört med enhetsgenomsnittet på 31.3 °C / ### class_avg_f### F.
(±) När du spelar The Witcher 3 är medeltemperaturen för ovansidan 37.7 °C / 100 F, jämfört med enhetsgenomsnittet på 31.3 °C / ## #class_avg_f### F.
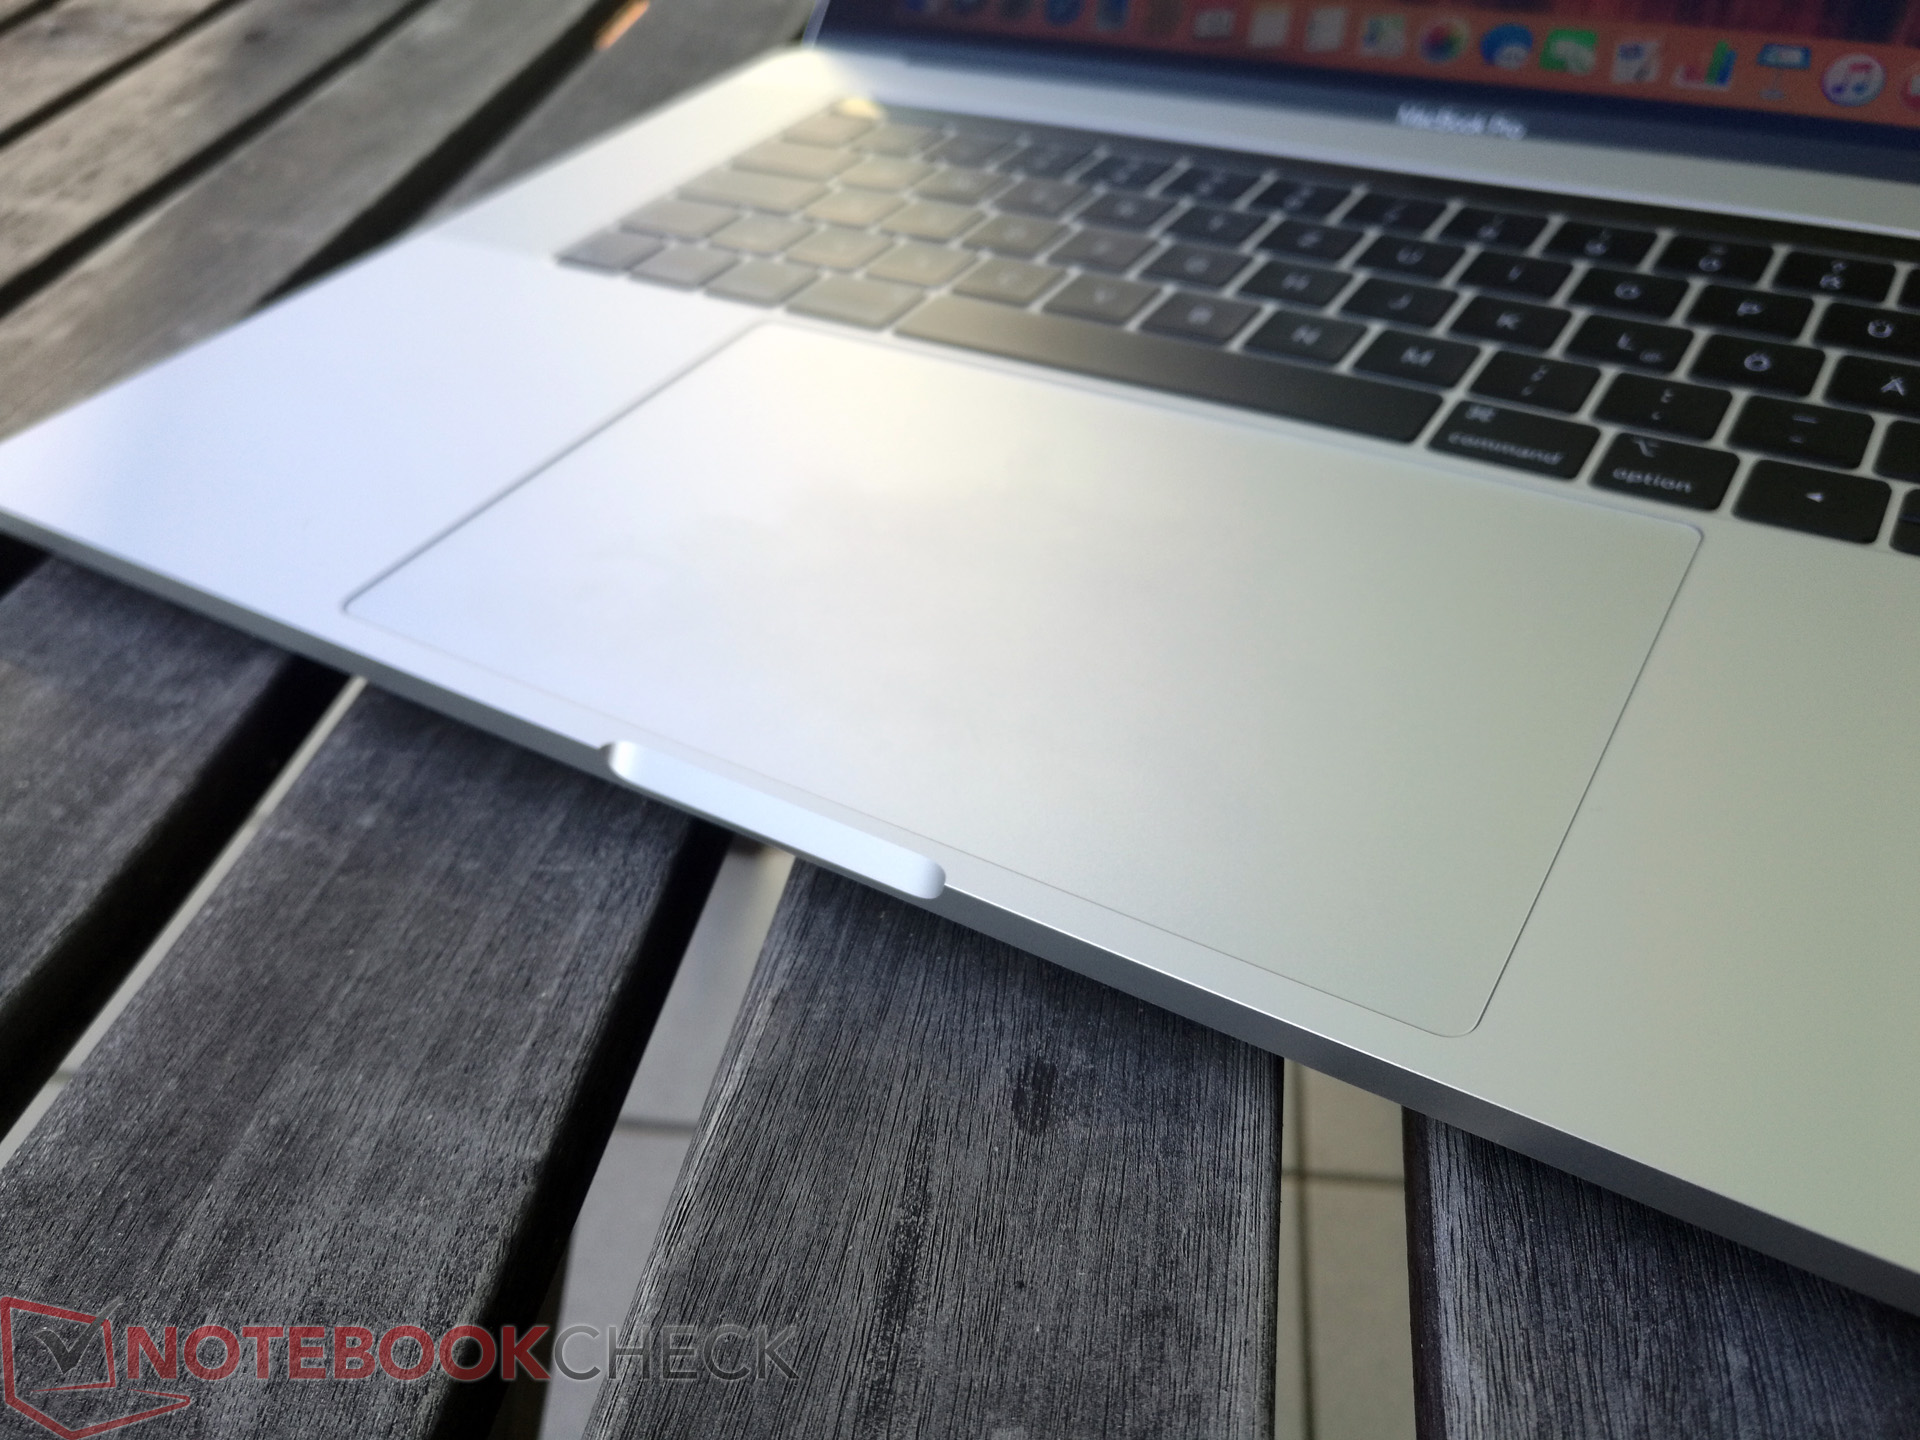
(+) Handledsstöden och pekplattan når maximal hudtemperatur (32.7 °C / 90.9 F) och är därför inte varma.
(-) Medeltemperaturen för handledsstödsområdet på liknande enheter var 28.7 °C / 83.7 F (-4 °C / -7.2 F).
Apple MacBook Pro 15 2018 (2.6 GHz, 560X) ljudanalys
(+) | högtalare kan spela relativt högt (85 dB)
Bas 100 - 315 Hz
(+) | bra bas - bara 4.7% från medianen
(±) | linjäriteten för basen är genomsnittlig (8.3% delta till föregående frekvens)
Mellan 400 - 2000 Hz
(+) | balanserad mellan - endast 1.8% från medianen
(+) | mids är linjära (3.5% delta till föregående frekvens)
Högsta 2 - 16 kHz
(+) | balanserade toppar - endast 2.6% från medianen
(+) | toppar är linjära (5.7% delta till föregående frekvens)
Totalt 100 - 16 000 Hz
(+) | det totala ljudet är linjärt (6.4% skillnad mot median)
Jämfört med samma klass
» 4% av alla testade enheter i den här klassen var bättre, 1% liknande, 95% sämre
» Den bästa hade ett delta på 5%, genomsnittet var 17%, sämst var 45%
Jämfört med alla testade enheter
» 1% av alla testade enheter var bättre, 0% liknande, 99% sämre
» Den bästa hade ett delta på 4%, genomsnittet var 23%, sämst var 134%
Apple MacBook Pro 15 2017 (2.8 GHz, 555) ljudanalys
(+) | högtalare kan spela relativt högt (87 dB)
Bas 100 - 315 Hz
(±) | reducerad bas - i genomsnitt 8.7% lägre än medianen
(±) | linjäriteten för basen är genomsnittlig (11.1% delta till föregående frekvens)
Mellan 400 - 2000 Hz
(+) | balanserad mellan - endast 2.5% från medianen
(±) | linjäriteten för mids är genomsnittlig (7.5% delta till föregående frekvens)
Högsta 2 - 16 kHz
(+) | balanserade toppar - endast 1.7% från medianen
(+) | toppar är linjära (5% delta till föregående frekvens)
Totalt 100 - 16 000 Hz
(+) | det totala ljudet är linjärt (7.9% skillnad mot median)
Jämfört med samma klass
» 7% av alla testade enheter i den här klassen var bättre, 2% liknande, 91% sämre
» Den bästa hade ett delta på 5%, genomsnittet var 17%, sämst var 45%
Jämfört med alla testade enheter
» 2% av alla testade enheter var bättre, 1% liknande, 98% sämre
» Den bästa hade ett delta på 4%, genomsnittet var 23%, sämst var 134%
| Av/Standby | |
| Låg belastning | |
| Hög belastning |
|
Förklaring:
min: | |
| Apple MacBook Pro 15 2018 (2.6 GHz, 560X) i7-8850H, Radeon Pro 560X, Apple SSD AP0512, IPS, 2880x1800, 15.4" | Apple MacBook Pro 13 2018 Touchbar i5 i5-8259U, Iris Plus Graphics 655, , IPS, 2560x1600, 13.3" | Apple MacBook Pro 15 2017 (2.9 GHz, 560) i7-7820HQ, Radeon Pro 560, , , 2880x1800, 15.4" | Apple MacBook Pro 15 2017 (2.8 GHz, 555) i7-7700HQ, Radeon Pro 555, Apple SSD SM0256L, IPS, 2880x1800, 15.4" | Dell XPS 15 9570 i7 UHD i7-8750H, GeForce GTX 1050 Ti Max-Q, Toshiba XG5 KXG50ZNV512G, IPS, 3840x2160, 15.6" | Genomsnitt av klass Multimedia | |
|---|---|---|---|---|---|---|
| Power Consumption | 27% | -10% | -6% | -60% | -10% | |
| Idle Minimum * (Watt) | 3.4 | 2.3 32% | 3.7 -9% | 3.4 -0% | 9.48 -179% | 5.66 ? -66% |
| Idle Average * (Watt) | 11 | 8.7 21% | 16.2 -47% | 13.9 -26% | 16.1 -46% | 10.2 ? 7% |
| Idle Maximum * (Watt) | 14.9 | 12.2 18% | 18 -21% | 17.6 -18% | 16.9 -13% | 12.5 ? 16% |
| Load Average * (Watt) | 78.9 | 53.3 32% | 58.4 26% | 71.1 10% | 90.8 -15% | 65.2 ? 17% |
| Load Maximum * (Watt) | 91.2 | 64 30% | 89.6 2% | 88.5 3% | 134.4 -47% | 113.5 ? -24% |
| Witcher 3 ultra * (Watt) | 57.9 |
* ... mindre är bättre
| Apple MacBook Pro 15 2018 (2.6 GHz, 560X) i7-8850H, Radeon Pro 560X, 83 Wh | Apple MacBook Pro 15 2017 (2.8 GHz, 555) i7-7700HQ, Radeon Pro 555, 76 Wh | Dell XPS 15 9570 i7 UHD i7-8750H, GeForce GTX 1050 Ti Max-Q, 97 Wh | Dell XPS 15 2018 i5 FHD 97Wh i5-8300H, GeForce GTX 1050 Mobile, 97 Wh | Gigabyte Aero 15X v8 i7-8750H, GeForce GTX 1070 Max-Q, 94.24 Wh | Asus ZenBook Pro 15 UX580GE i9-8950HK, GeForce GTX 1050 Ti Mobile, 71 Wh | Genomsnitt av klass Multimedia | |
|---|---|---|---|---|---|---|---|
| Batteridrifttid | -7% | -11% | 11% | -22% | -38% | 33% | |
| H.264 (h) | 11.7 | 8.5 -27% | 12.3 5% | 8.4 -28% | 17.1 ? 46% | ||
| WiFi v1.3 (h) | 10.2 | 10.7 5% | 9.6 -6% | 15.7 54% | 8.6 -16% | 6.3 -38% | 12.2 ? 20% |
| Witcher 3 ultra (h) | 1.5 | 1.5 0% | 1 -33% | 1 -33% |
För
Emot
Läs den fullständiga versionen av den här recensionen på engelska här.
I likhet med MacBook Pro 13 2018 så tog det två utförliga systemuppdateringar för att fixa en del av de problem som fanns med när datorn släpptes. Utöver allmänna förbättringar, inklusive bättre batteritid, så låg fokus på de nya processorernas dåliga prestandautnyttjande. CPU-prestandan förbättrades efter den första uppdateringen och kunde jämföras med konkurrenten Dell XPS 15, åtminstone ett tag. Kyllösningen räckte inte riktigt i längden. Detta ändrades dock efter den andra större CPU-uppdateringen och efter den är prestandan stabil även efter längre perioder. Men datorn kan ändå inte använda den fulla potentialen hos en Core i7, så det finns ingen anledning att välja alternativet med Core i9.
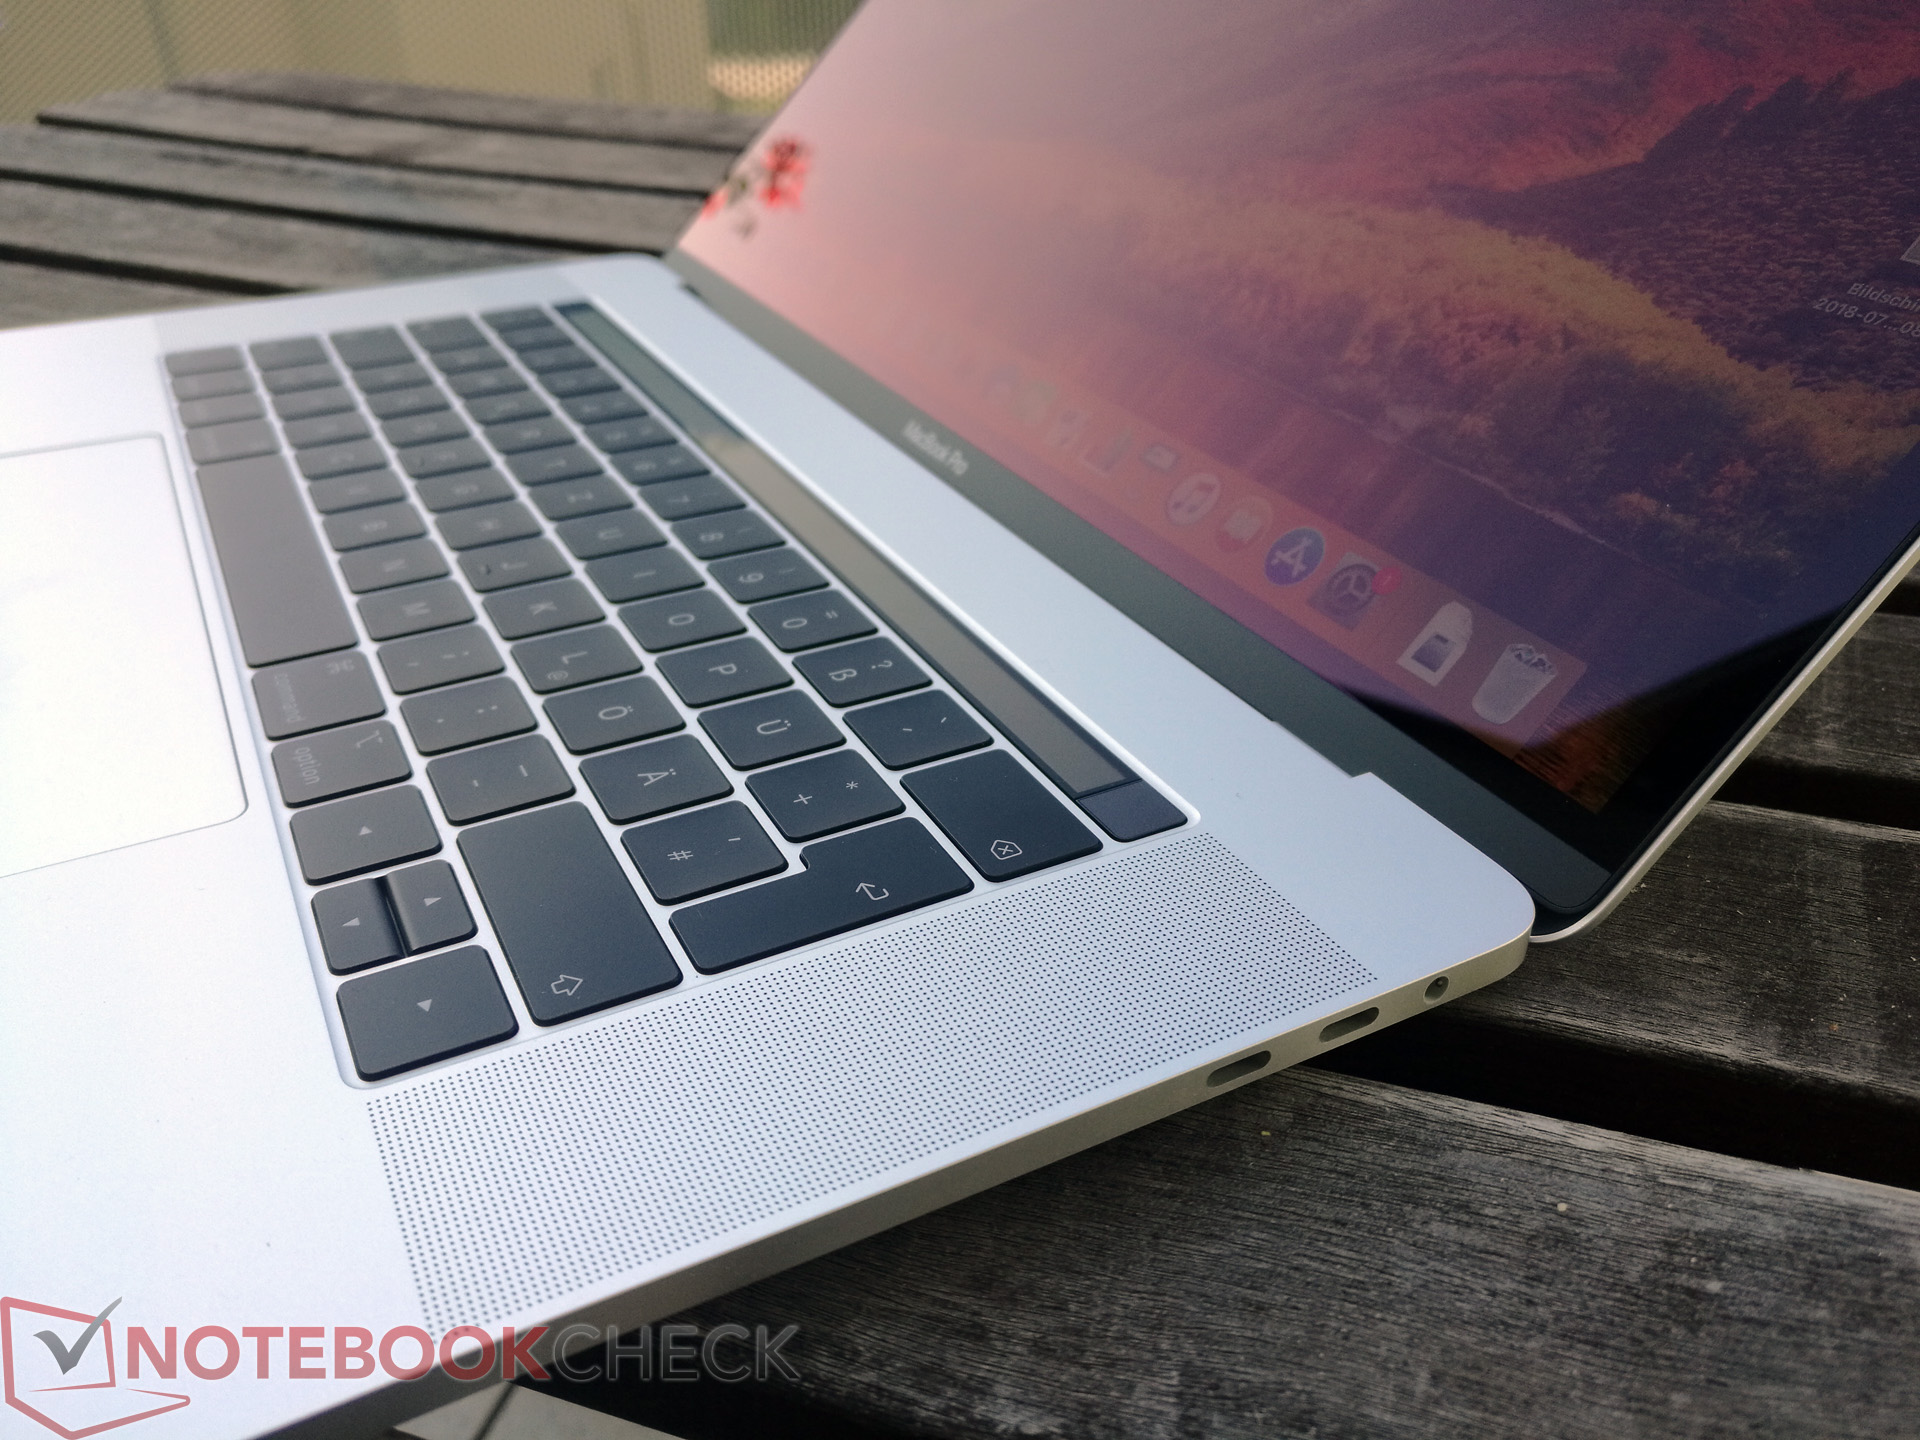
Nätadaptern på 87 W är ett annat problem, då den begränsar prestandan. Vi uppmätte högre energiförbrukning än så vid belastning och batteriet laddades faktiskt ur en aning under stresstestet. Vi förstår bara inte varför Apple fortsätter att använda en gammal nätadapter till en så dyr maskin. I kombination med kylningsproblemen undrar man huruvida den nya modellen verkligen förjänar tillägget "Pro".
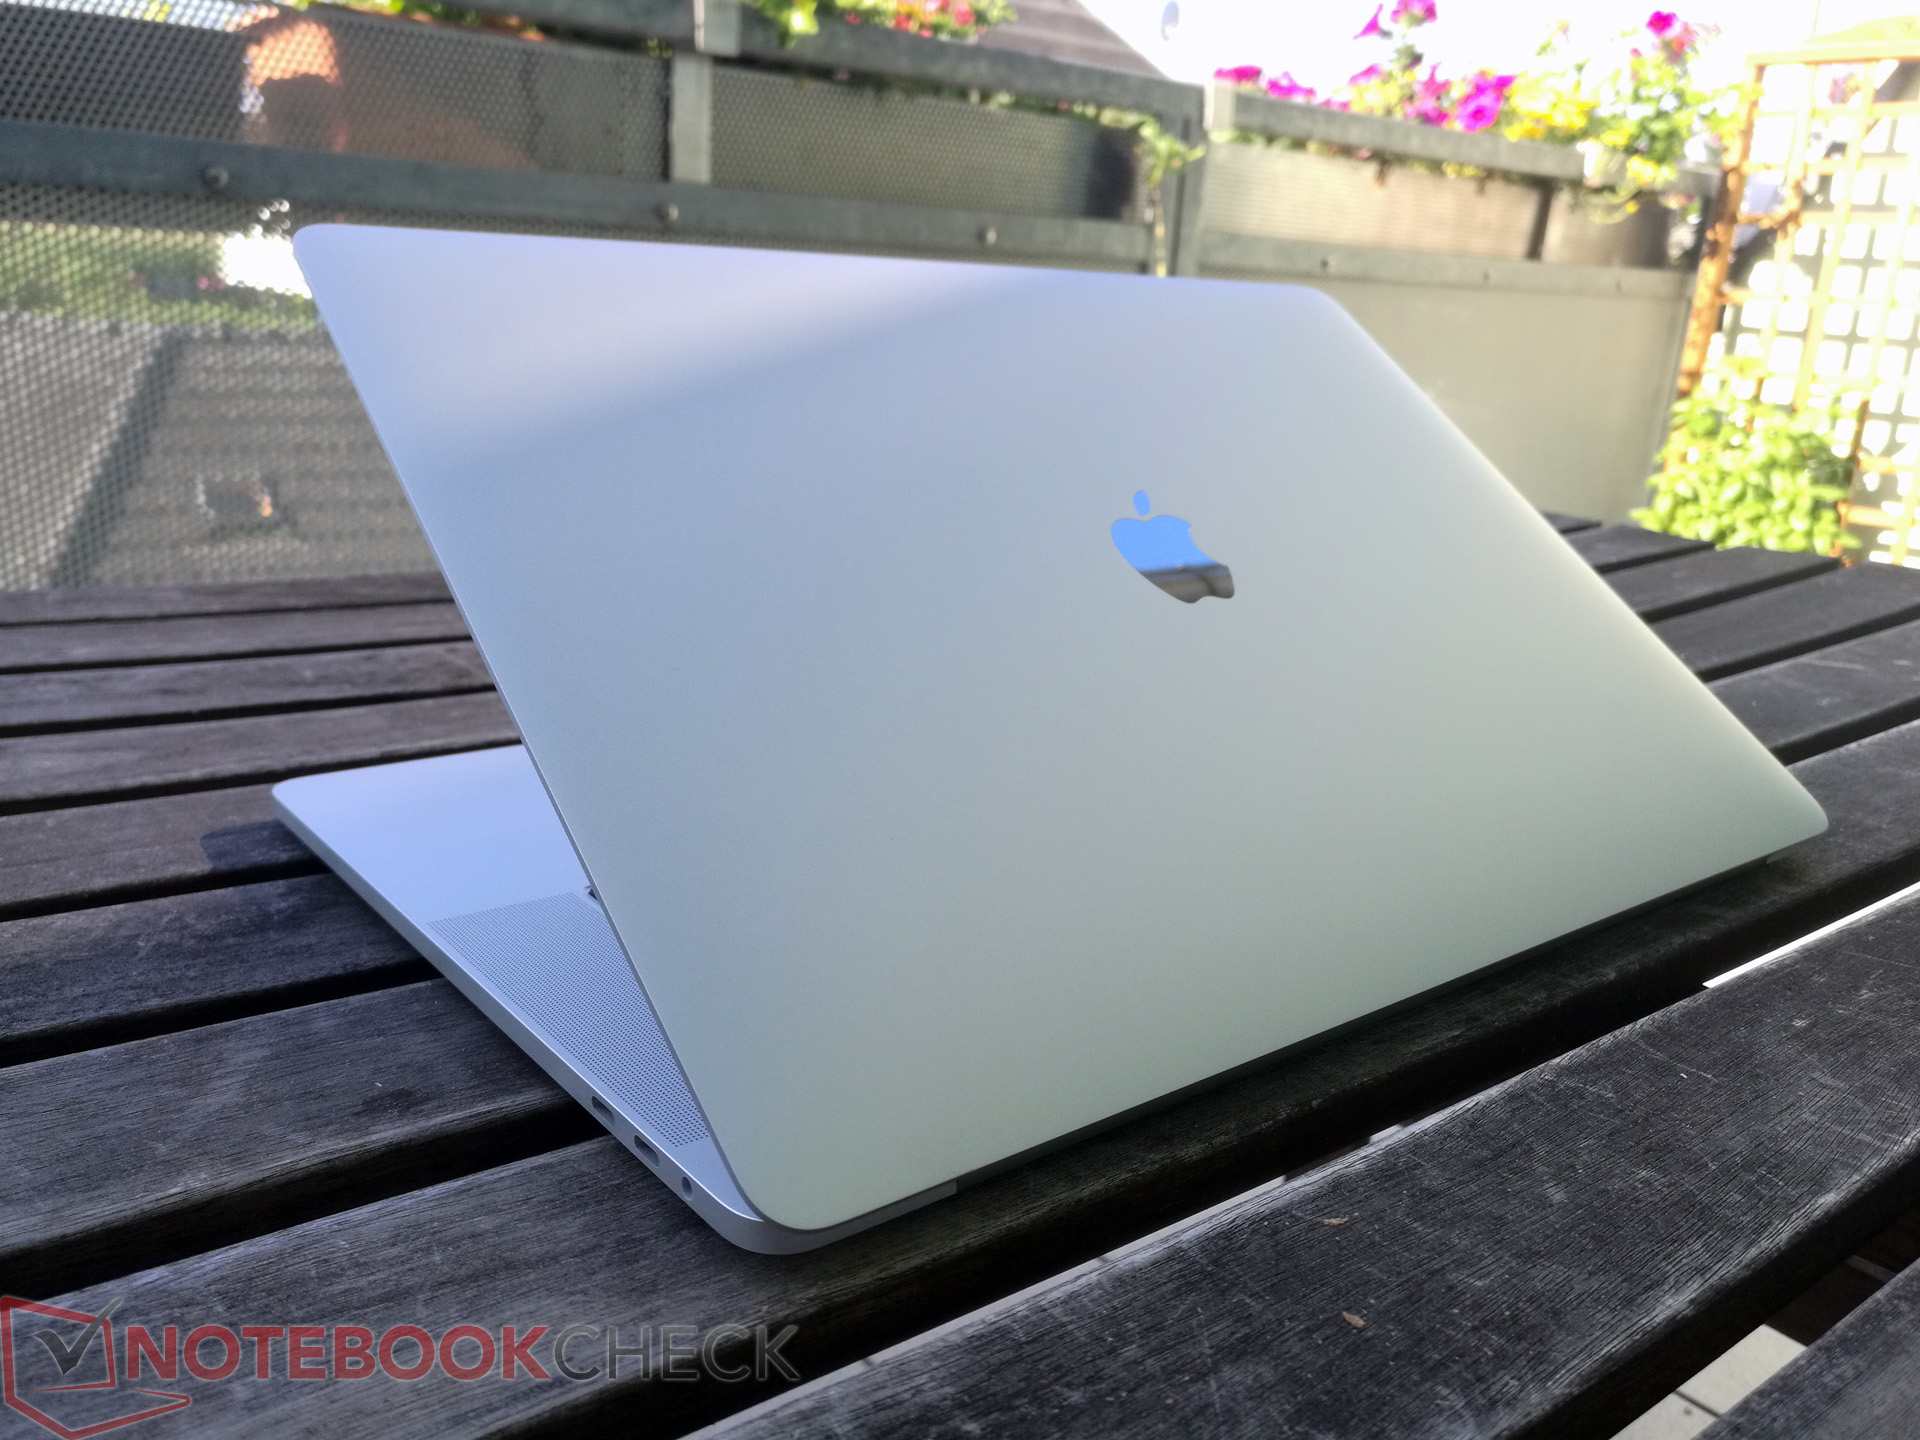
2018 års version av Apple MacBook Pro 15 är en utmärkt multimedialaptop, men den är troligen inte det bästa valet för professionella användare på grund av problemen med prestanda och kylning.
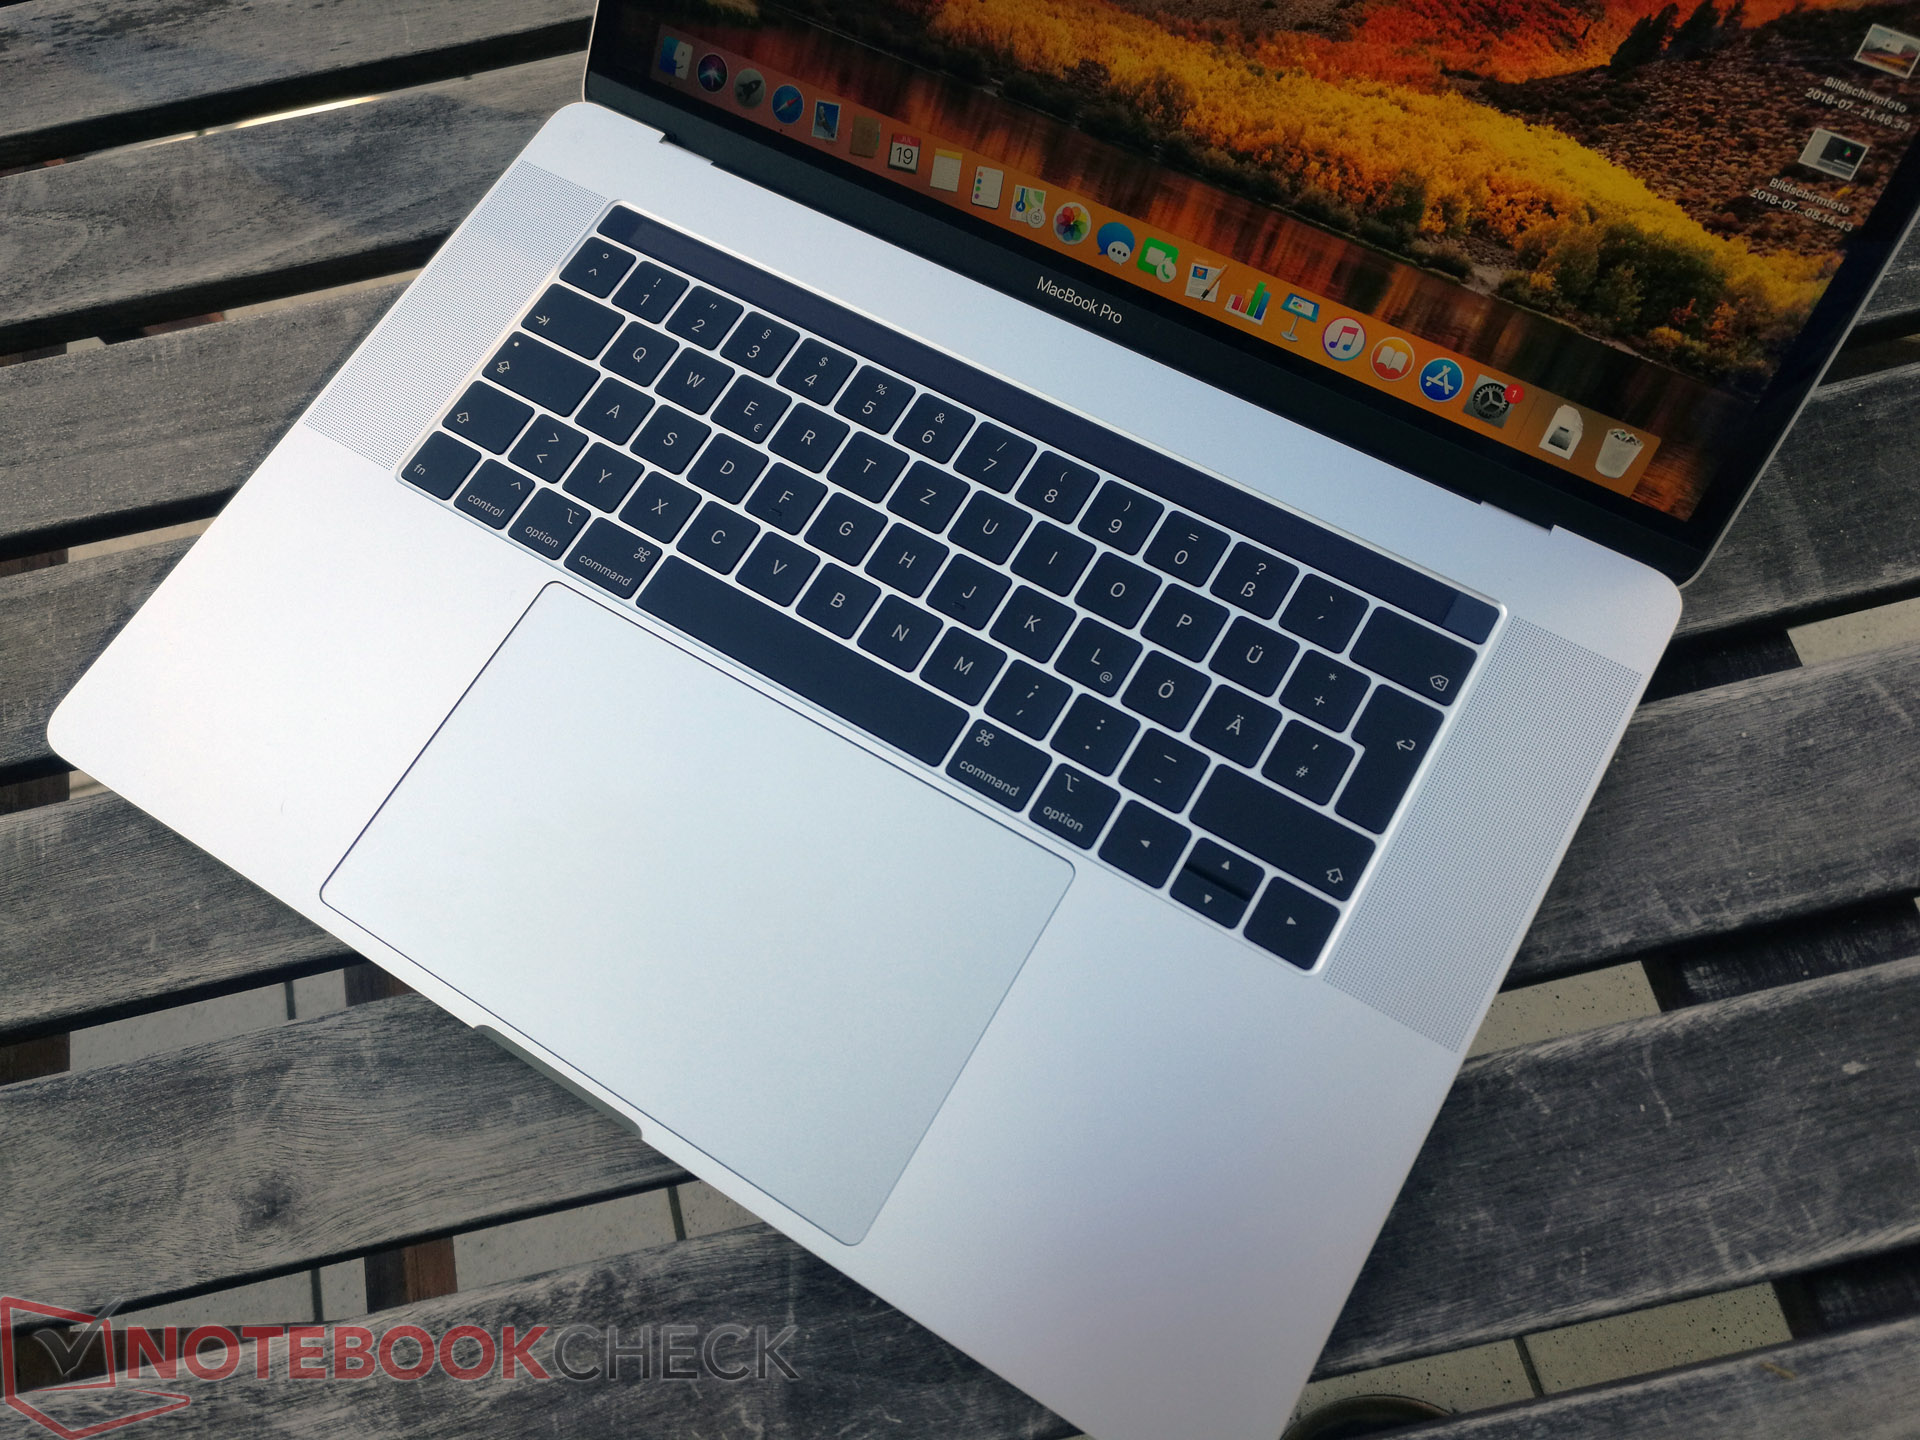
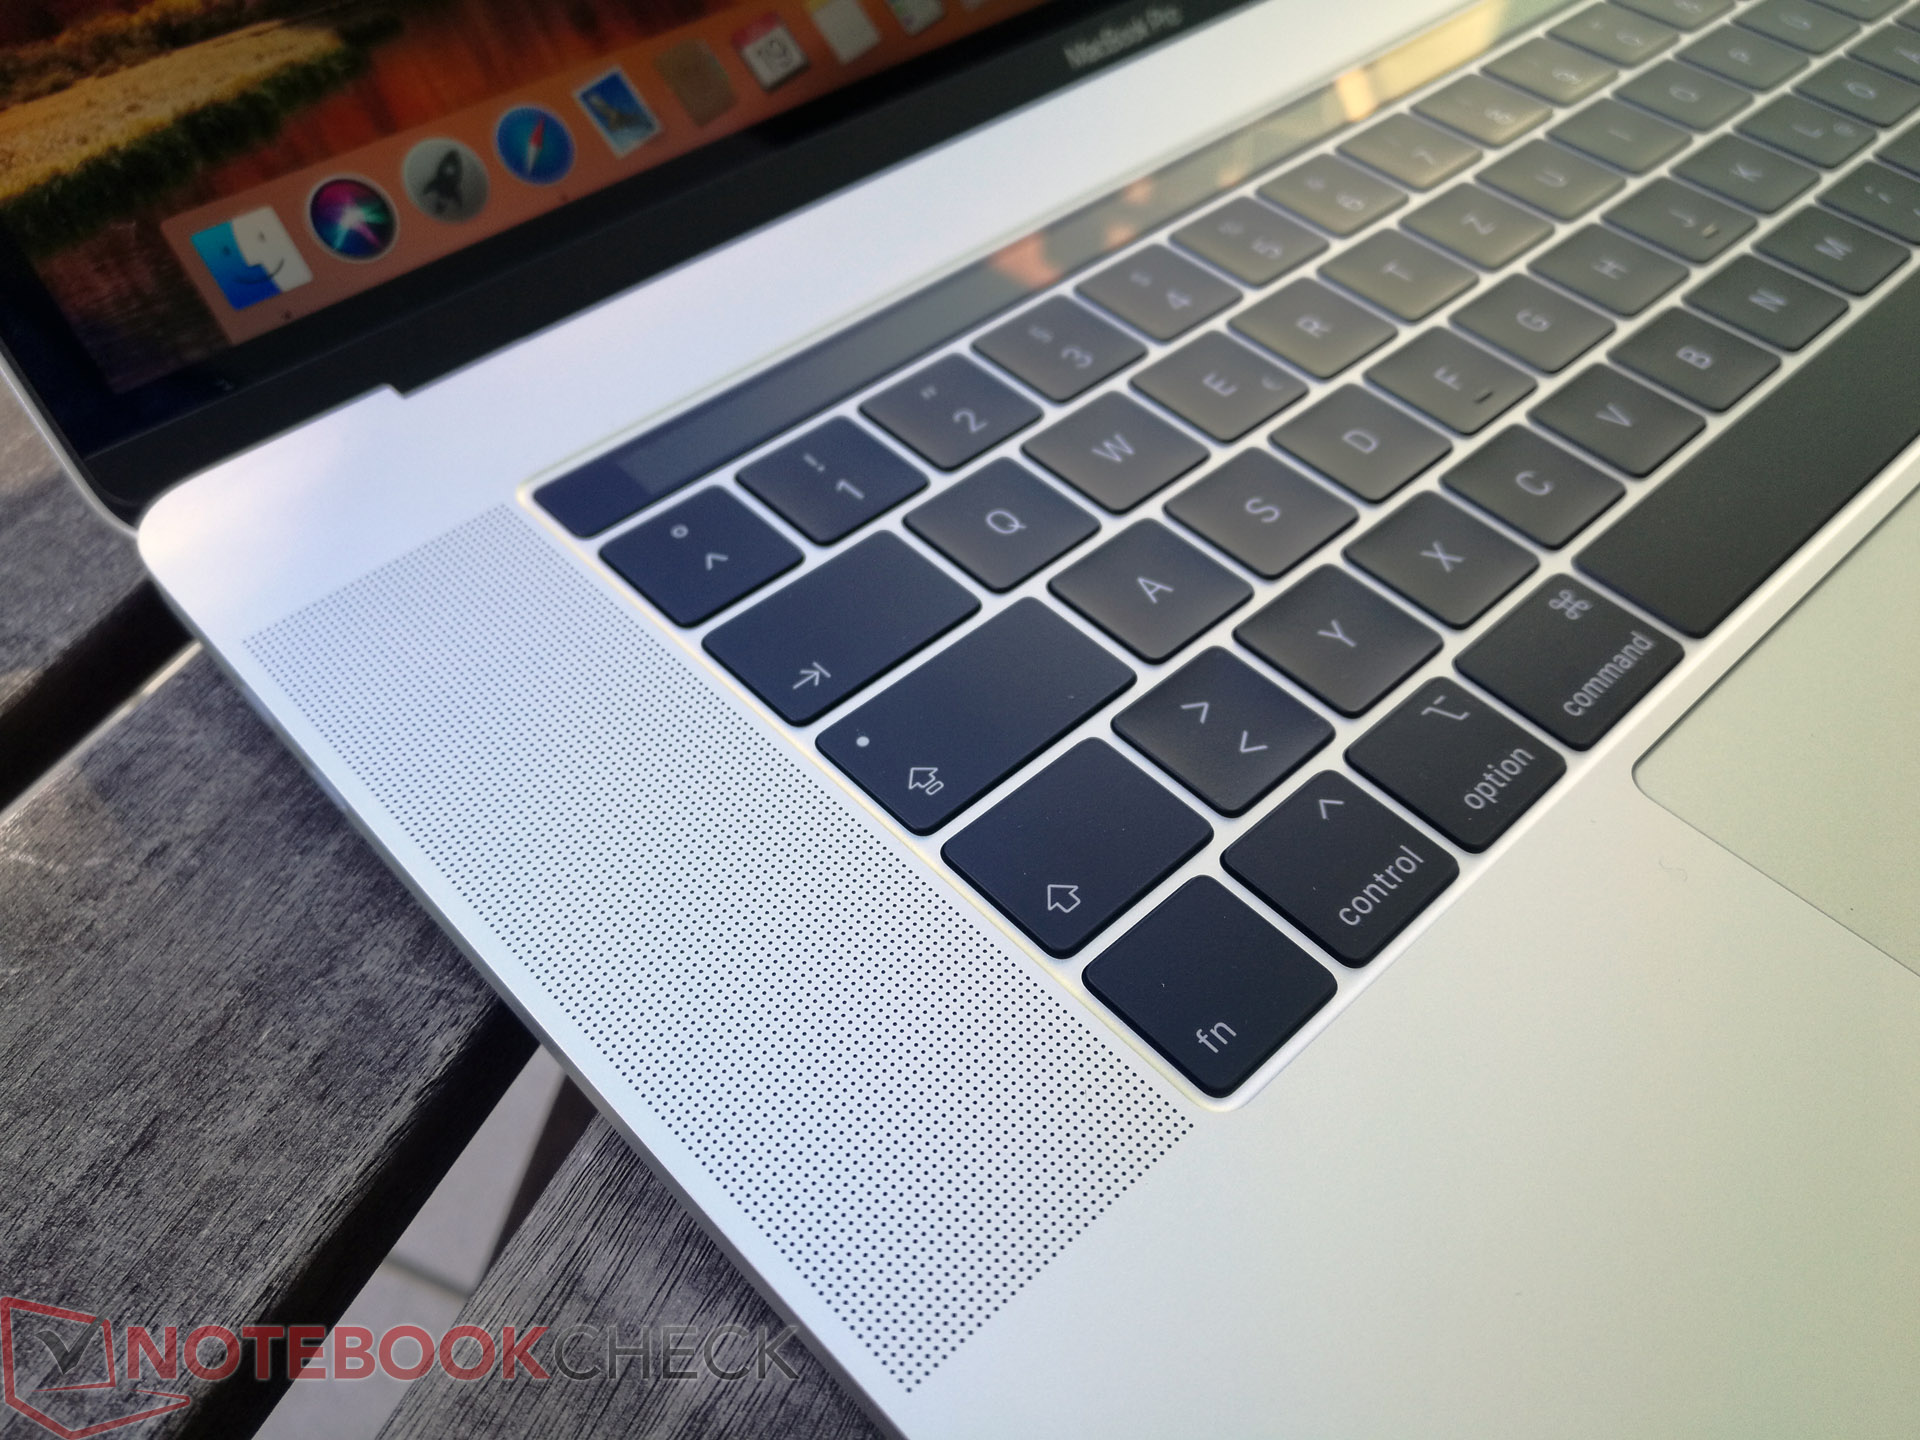
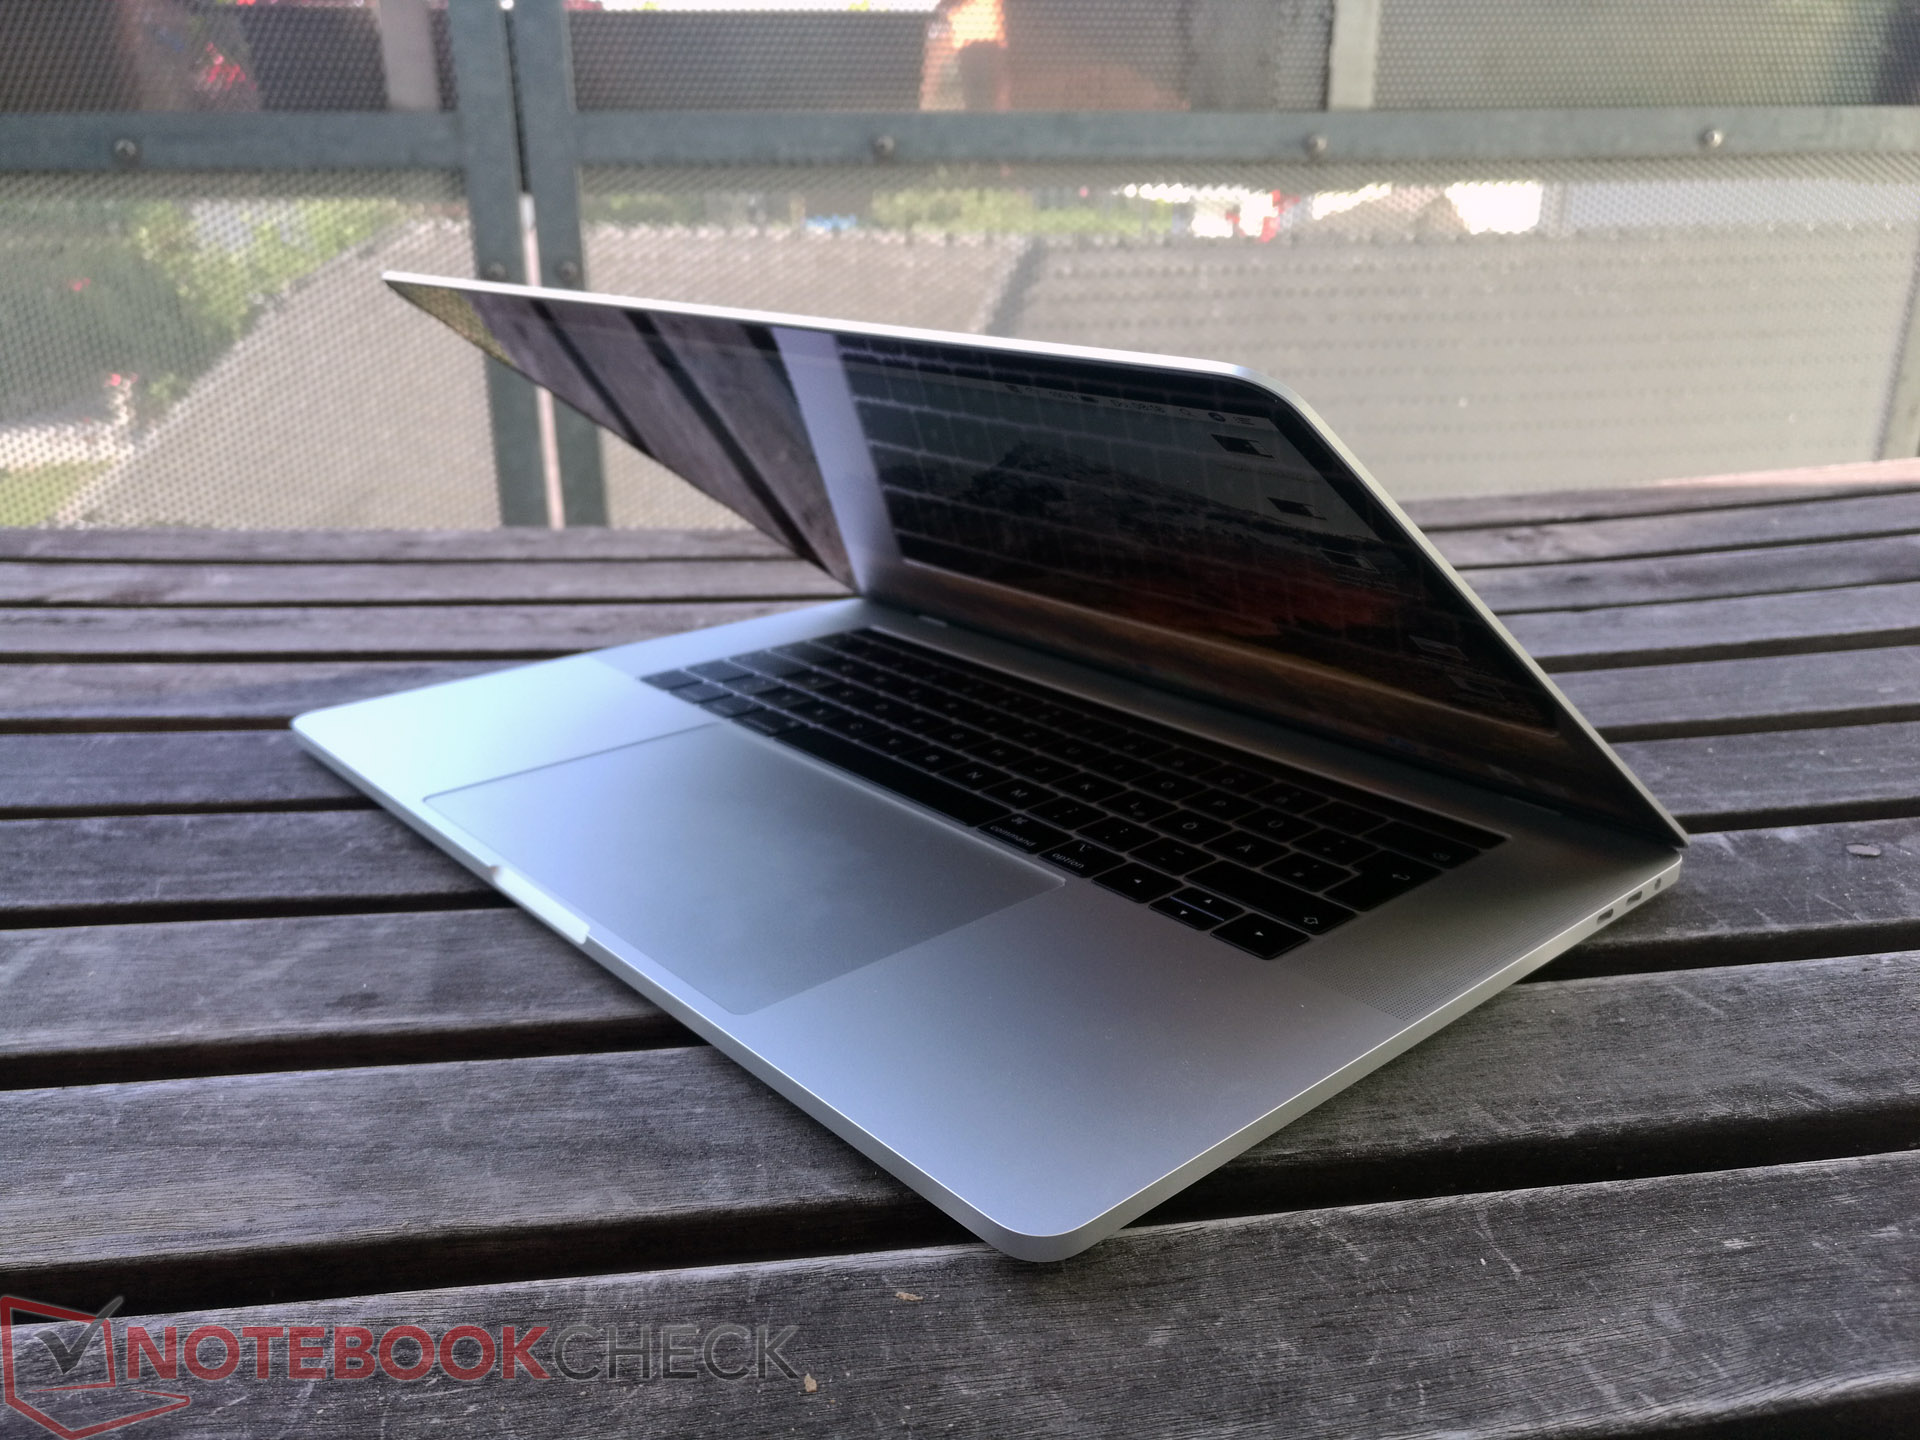
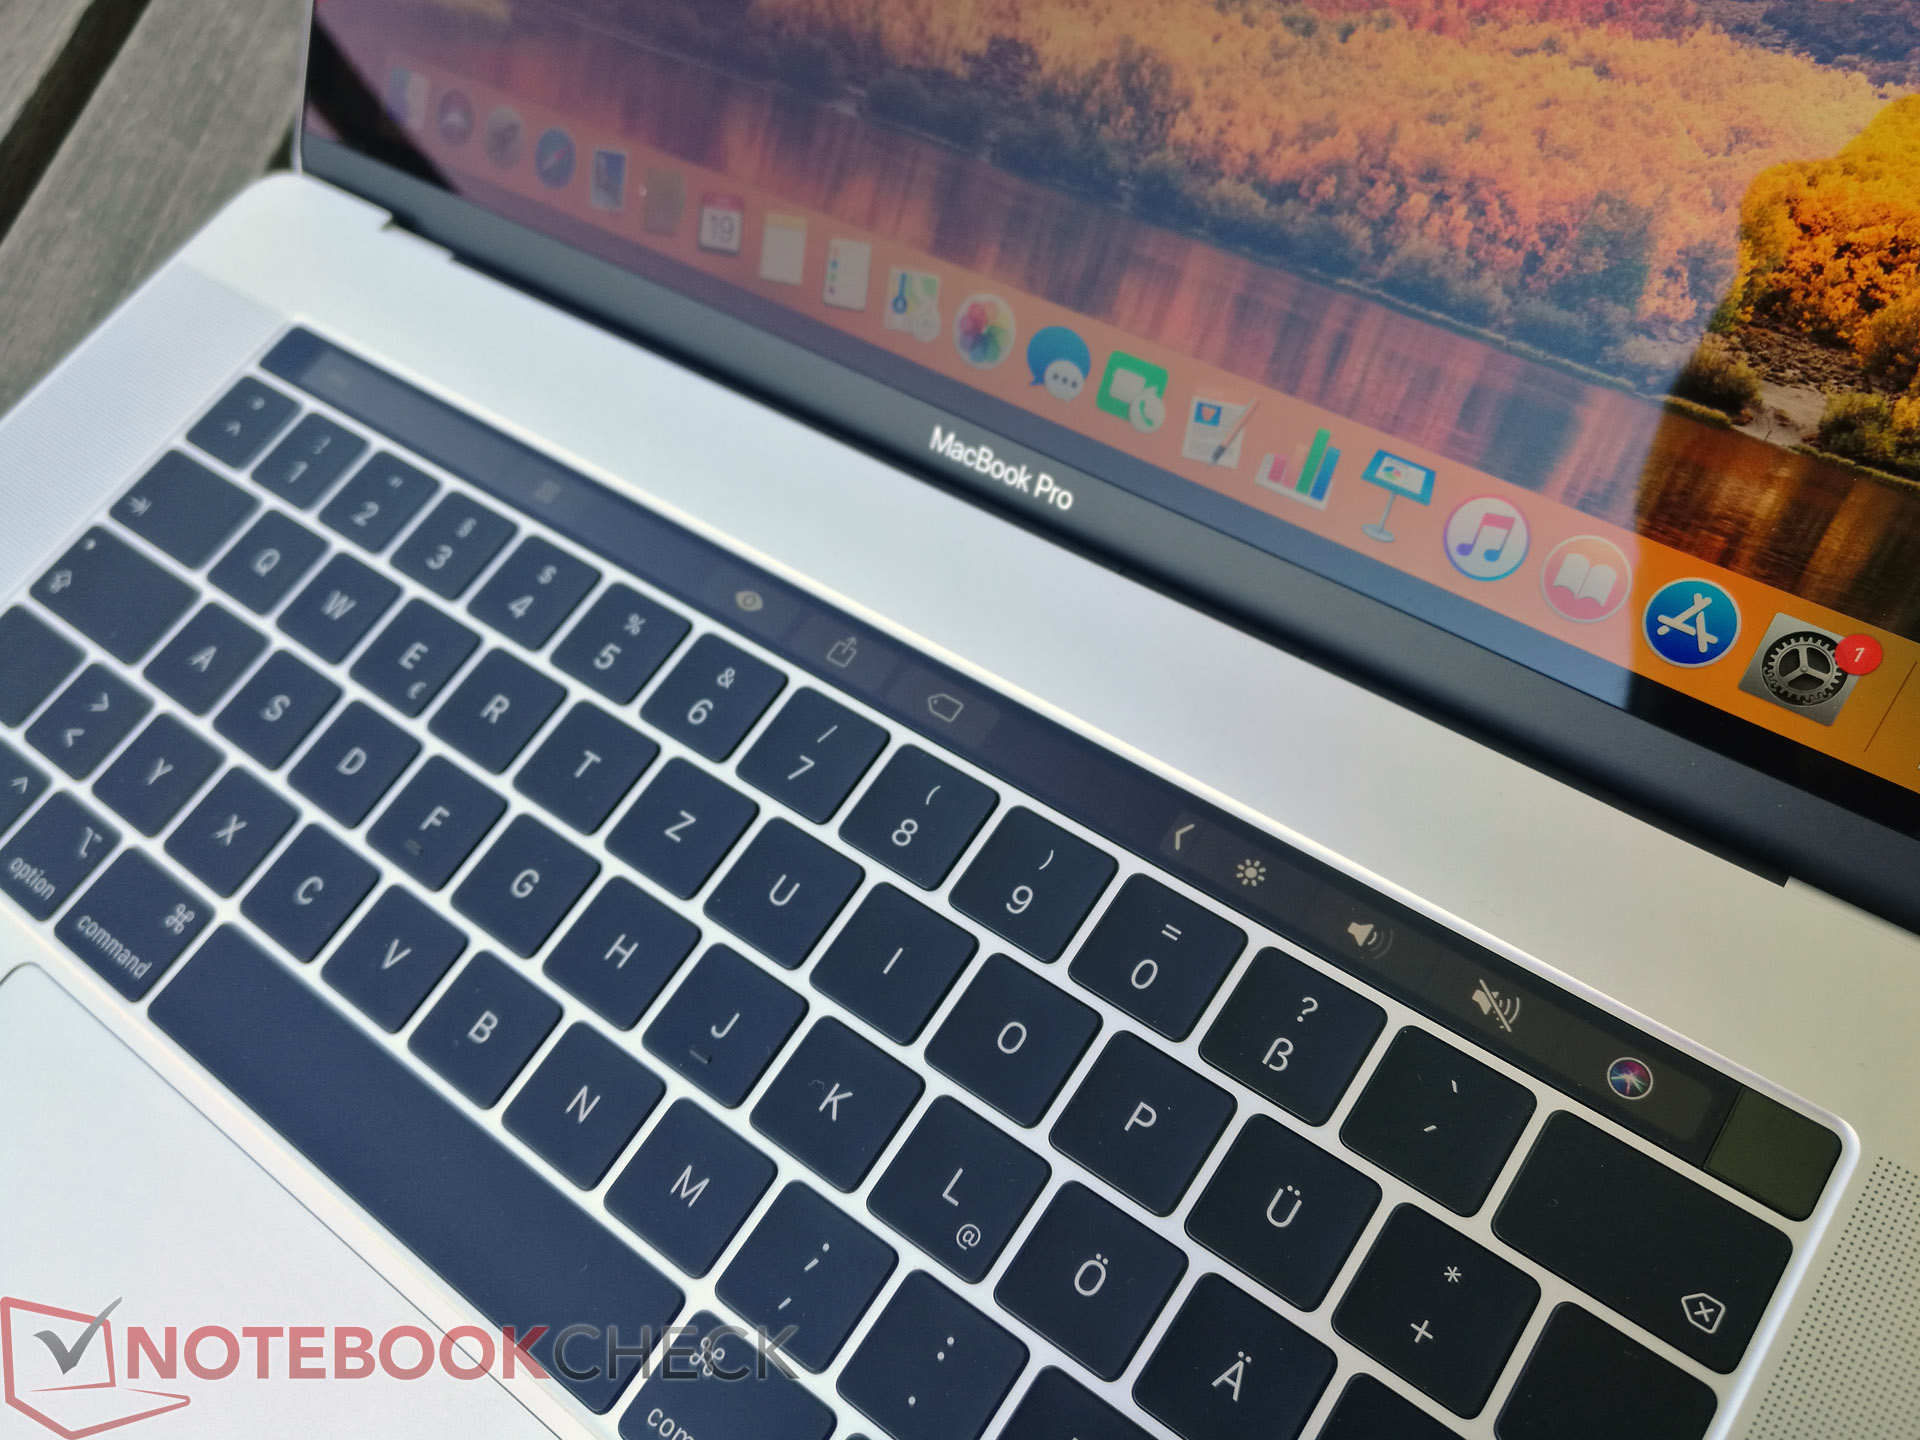
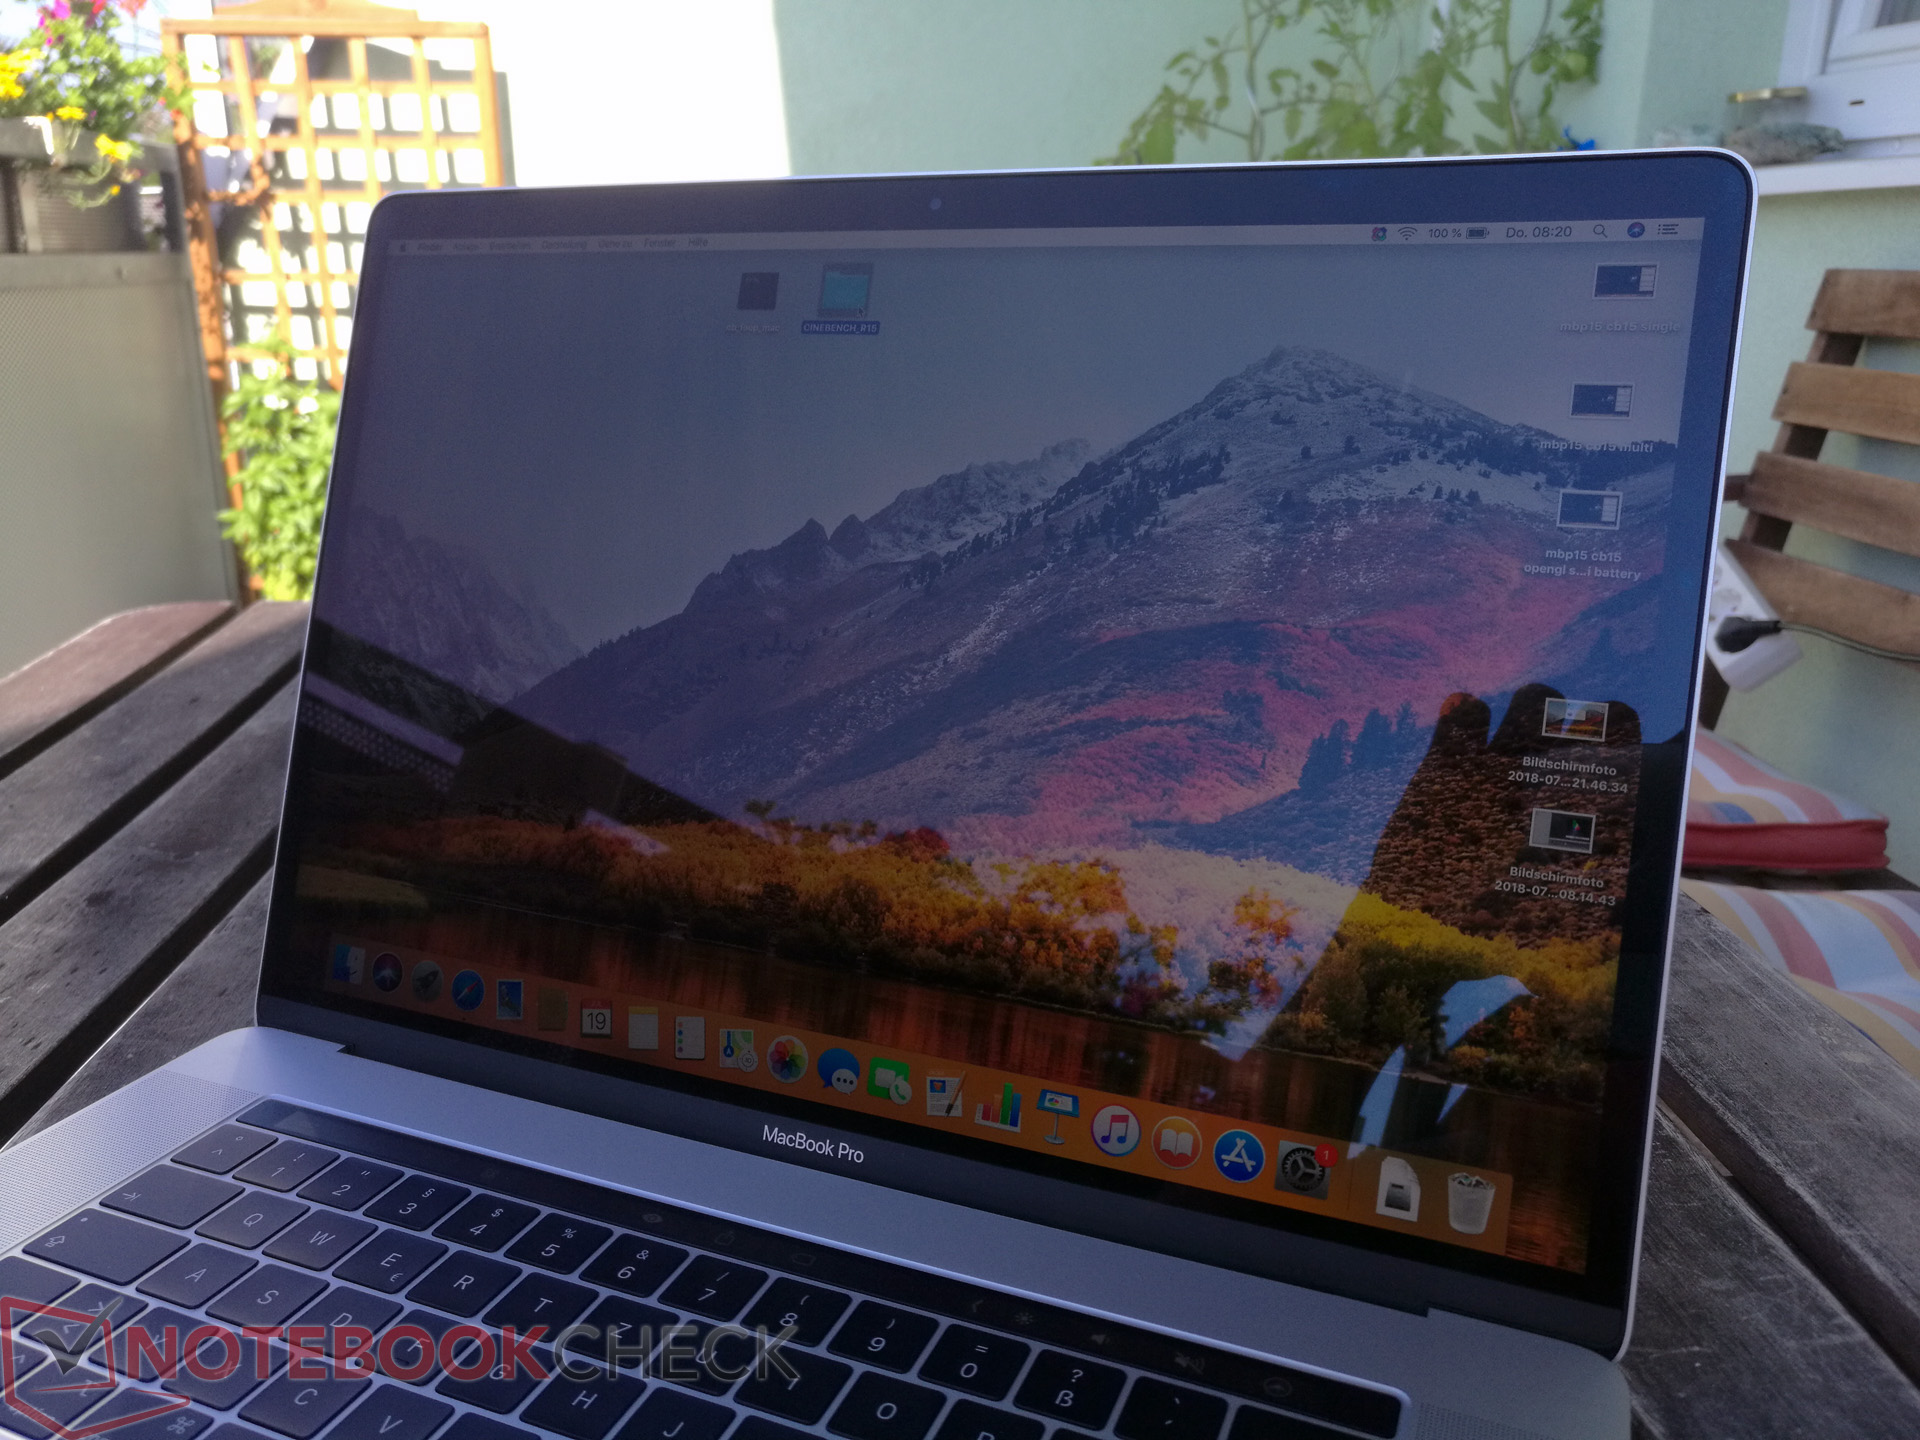
Utöver dessa problem är 2018 års modell av MacBook Pro 15 återigen en övertygande produkt. Ja, tangentbordet är fortfarande en fråga om smak, även efter uppgraderingen, men du får ett utmärkt chassi, en bra 16:10-skärm och lång batteritid. Du bör inte råka på några problem om du inte behöver utnyttja prestandan fullt ut och kan i så fall istället njuta av en tyst enhet. Vi noterade inga problem med avbruten WLAN-anslutning den här gången, så inga poängavdrag har gjorts för detta.
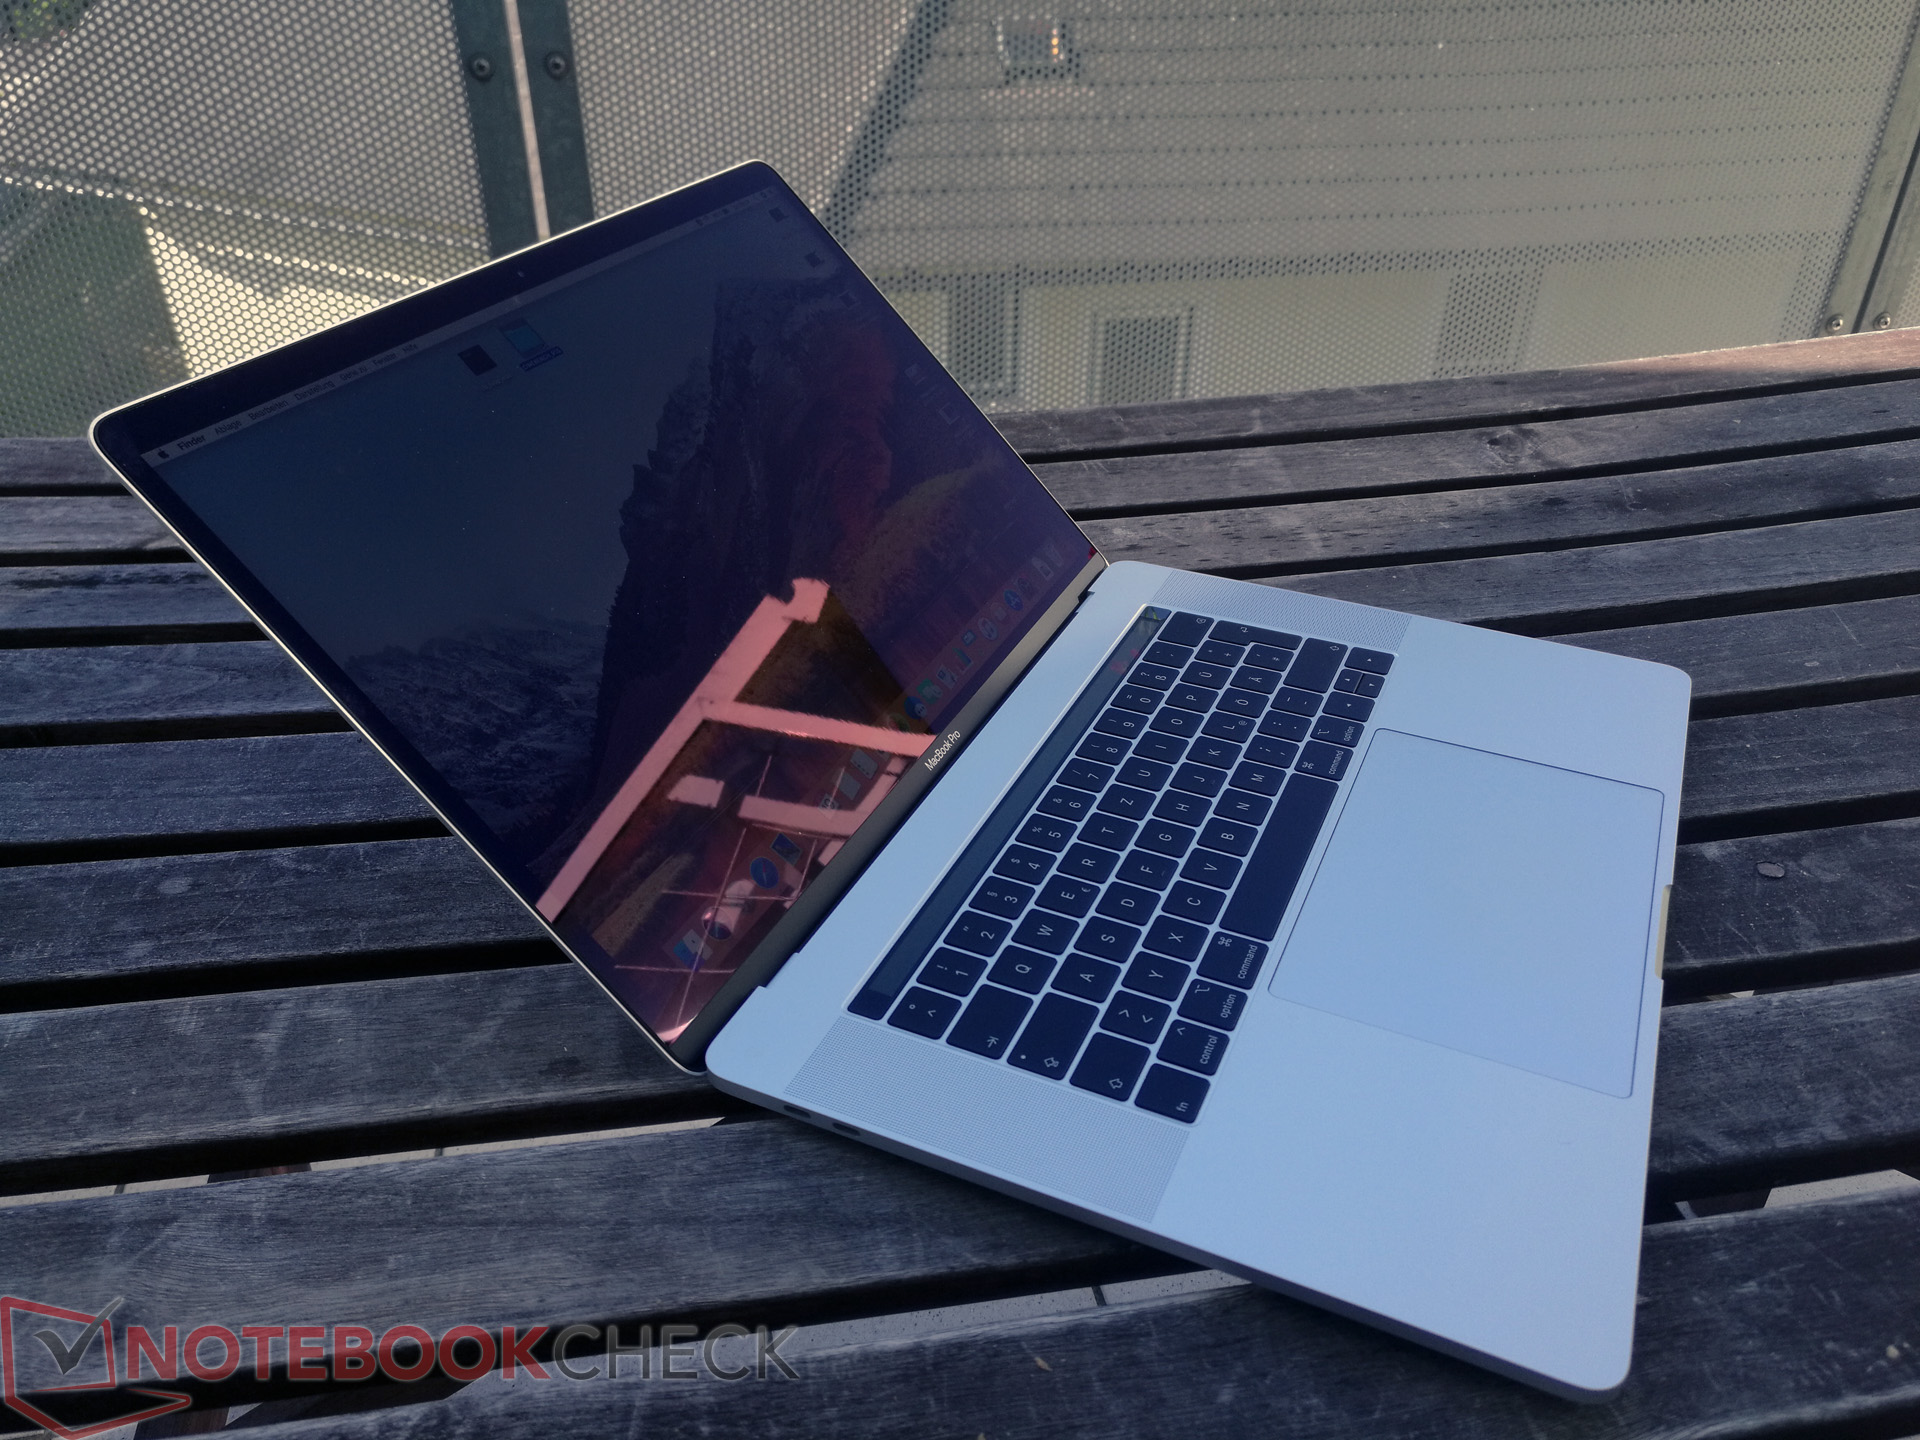
Apple bör nog ordentligt överväga en större omdesign, för tillverkare som Dell erbjuder mer prestanda, både för processor och grafikkort. Lenovos nya ThinkPad X1 Extreme riktar sig också åt samma målgrupp i segmentet tunna laptops på 15 tum.
Apple MacBook Pro 15 2018 (2.6 GHz, 560X)
- 12/05/2019 v7 (old)
Andreas Osthoff, J. Simon Leitner
Price comparison
