Test: Apple MacBook Pro 15 (2016, 2.7 GHz, Radeon Pro 455) (sammanfattning)


| |||||||||||||||||||||||||
Distribution av ljusstyrkan: 83 %
Mitt på batteriet: 568 cd/m²
Kontrast: 1912:1 (Svärta: 0.297 cd/m²)
ΔE ColorChecker Calman: 1.4 | ∀{0.5-29.43 Ø4.71}
ΔE Greyscale Calman: 2.3 | ∀{0.09-98 Ø4.96}
99.9% sRGB (Argyll 1.6.3 3D)
77.4% AdobeRGB 1998 (Argyll 1.6.3 3D)
86.4% AdobeRGB 1998 (Argyll 3D)
99.9% sRGB (Argyll 3D)
98.5% Display P3 (Argyll 3D)
Gamma: 2.29
CCT: 7165 K
| Apple MacBook Pro 15 2016 (2.7 GHz, 455) APPA031, , 2880x1800, 15.4" | Apple MacBook Pro 15 2016 (2.9 GHz, 460) Apple APPA030, , 2880x1800, 15.4" | Apple MacBook Pro 15 2016 (2.6 GHz, 450) 2880x1800, 15.4" | Apple MacBook Pro Retina 15 inch 2015-05 APPA02E, , 2880x1800, 15.4" | Dell XPS 15-9550 i7 SHARP LQ156D1JX01 Dell PN: 7PHPT, , 3840x2160, 15.6" | Dell XPS 15 2017 9560 (7300HQ, Full-HD) Sharp SHP1453 LQ156M1, , 1920x1080, 15.6" | |
|---|---|---|---|---|---|---|
| Display | 1% | -25% | 1% | -16% | ||
| Display P3 Coverage (%) | 98.5 | 99 1% | 61.4 -38% | 87.8 -11% | 68.9 -30% | |
| sRGB Coverage (%) | 99.9 | 100 0% | 90.8 -9% | 100 0% | 98.9 -1% | |
| AdobeRGB 1998 Coverage (%) | 86.4 | 87.3 1% | 62.9 -27% | 99.4 15% | 70.9 -18% | |
| Response Times | -21% | 9% | -7% | -25% | ||
| Response Time Grey 50% / Grey 80% * (ms) | 46.4 ? | 46 ? 1% | 47.3 ? -2% | 58 ? -25% | 54 ? -16% | |
| Response Time Black / White * (ms) | 39.2 ? | 56 ? -43% | 31.2 ? 20% | 35 ? 11% | 52.4 ? -34% | |
| PWM Frequency (Hz) | 119000 ? | 117000 ? | ||||
| Screen | -32% | -3% | -23% | -57% | -85% | |
| Brightness middle (cd/m²) | 568 | 420 -26% | 483 -15% | 341 -40% | 361 -36% | 400 -30% |
| Brightness (cd/m²) | 532 | 401 -25% | 465 -13% | 315 -41% | 344 -35% | 392 -26% |
| Brightness Distribution (%) | 83 | 90 8% | 92 11% | 82 -1% | 90 8% | 89 7% |
| Black Level * (cd/m²) | 0.297 | 0.3 -1% | 0.33 -11% | 0.34 -14% | 0.38 -28% | 0.26 12% |
| Contrast (:1) | 1912 | 1400 -27% | 1464 -23% | 1003 -48% | 950 -50% | 1538 -20% |
| Colorchecker dE 2000 * | 1.4 | 3.33 -138% | 1.4 -0% | 2.07 -48% | 5.34 -281% | 4.9 -250% |
| Colorchecker dE 2000 max. * | 2.7 | 5.11 -89% | 3 -11% | 3.27 -21% | 11 -307% | |
| Greyscale dE 2000 * | 2.3 | 2.73 -19% | 1.5 35% | 1.9 17% | 4.84 -110% | 7.2 -213% |
| Gamma | 2.29 96% | 2.48 89% | 2.34 94% | 2.62 84% | 2.21 100% | 2.11 104% |
| CCT | 7165 91% | 6457 101% | 6650 98% | 6514 100% | 7395 88% | 6911 94% |
| Color Space (Percent of AdobeRGB 1998) (%) | 77.4 | 78.09 1% | 58 -25% | 89 15% | 64.2 -17% | |
| Color Space (Percent of sRGB) (%) | 99.9 | 99.97 0% | 91 -9% | 100 0% | 98.9 -1% | |
| Totalt genomsnitt (program/inställningar) | -17% /
-24% | 3% /
-1% | -24% /
-23% | -21% /
-38% | -42% /
-63% |
* ... mindre är bättre
Visa svarstider
| ↔ Svarstid svart till vitt | ||
|---|---|---|
| 39.2 ms ... stiga ↗ och falla ↘ kombinerat | ↗ 7.6 ms stiga | 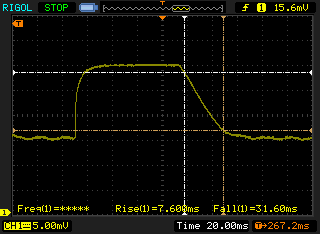 |
| ↘ 31.6 ms hösten | ||
| Skärmen visar långsamma svarsfrekvenser i våra tester och kommer att vara otillfredsställande för spelare. I jämförelse sträcker sig alla testade enheter från 0.1 (minst) till 240 (maximalt) ms. » 97 % av alla enheter är bättre. Detta innebär att den uppmätta svarstiden är sämre än genomsnittet av alla testade enheter (19.8 ms). | ||
| ↔ Svarstid 50 % grått till 80 % grått | ||
| 46.4 ms ... stiga ↗ och falla ↘ kombinerat | ↗ 18.8 ms stiga | 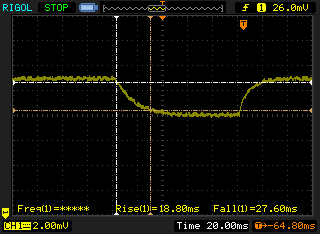 |
| ↘ 27.6 ms hösten | ||
| Skärmen visar långsamma svarsfrekvenser i våra tester och kommer att vara otillfredsställande för spelare. I jämförelse sträcker sig alla testade enheter från 0.165 (minst) till 636 (maximalt) ms. » 80 % av alla enheter är bättre. Detta innebär att den uppmätta svarstiden är sämre än genomsnittet av alla testade enheter (31 ms). | ||
Skärmflimmer / PWM (Puls-Width Modulation)
| Skärmflimmer / PWM upptäcktes inte | ||
Som jämförelse: 52 % av alla testade enheter använder inte PWM för att dämpa skärmen. Om PWM upptäcktes mättes ett medelvärde av 7757 (minst: 5 - maximum: 343500) Hz. | ||
| PCMark 8 Home Score Accelerated v2 | 3728 poäng | |
| PCMark 8 Creative Score Accelerated v2 | 4569 poäng | |
| PCMark 8 Work Score Accelerated v2 | 4522 poäng | |
Hjälp | ||

| 3DMark 11 - 1280x720 Performance GPU | |
| Schenker XMG P507 PRO | |
| Acer Aspire VX5-591G-D0DD | |
| Dell XPS 15 2017 9560 (7300HQ, Full-HD) | |
| Apple MacBook Pro 15 2016 (2.9 GHz, 460) | |
| Apple MacBook Pro 15 2016 (2.7 GHz, 455) | |
| Dell XPS 15-9550 i7 | |
| Lenovo ThinkPad P50 20ENV509PB | |
| Apple MacBook Pro 15 2016 (2.6 GHz, 450) | |
| HP ZBook Studio G3 | |
| Apple MacBook Pro Retina 15 inch 2015-05 | |
| Apple MacBook Pro 13 2016 (2.9 GHz) | |
| Lenovo ThinkPad P40 Yoga 20GQ-0004GE | |
| 3DMark - 1920x1080 Fire Strike Graphics | |
| Schenker XMG P507 PRO | |
| Acer Aspire VX5-591G-D0DD | |
| Dell XPS 15 2017 9560 (7300HQ, Full-HD) | |
| Apple MacBook Pro 15 2016 (2.9 GHz, 460) | |
| Dell XPS 15-9550 i7 | |
| Lenovo ThinkPad P50 20ENV509PB | |
| Apple MacBook Pro 15 2016 (2.7 GHz, 455) | |
| HP ZBook Studio G3 | |
| Apple MacBook Pro 15 2016 (2.6 GHz, 450) | |
| Apple MacBook Pro Retina 15 inch 2015-05 | |
| Apple MacBook Pro 13 2016 (2.9 GHz) | |
| Lenovo ThinkPad P40 Yoga 20GQ-0004GE | |
| 3DMark 06 Standard Score | 25873 poäng | |
| 3DMark Vantage P Result | 16522 poäng | |
| 3DMark 11 Performance | 5774 poäng | |
| 3DMark Cloud Gate Standard Score | 15766 poäng | |
| 3DMark Fire Strike Score | 3463 poäng | |
| 3DMark Time Spy Score | 1254 poäng | |
Hjälp | ||
| Rise of the Tomb Raider - 1920x1080 High Preset AA:FX AF:4x | |
| Acer Aspire VX5-591G-D0DD | |
| HP Omen 15-ax007ng | |
| Asus Strix GL753VD-GC045T | |
| HP Pavilion 17 FHD V3A33AV | |
| Apple MacBook Pro 15 2016 (2.9 GHz, 460) | |
| Apple MacBook Pro 15 2016 (2.7 GHz, 455) | |
| Apple MacBook Pro 15 2016 (2.6 GHz, 450) | |
| Apple MacBook Pro 15 2016 (2.6 GHz, 450) | |
| The Witcher 3 - 1920x1080 High Graphics & Postprocessing (Nvidia HairWorks Off) | |
| Acer Aspire VX5-591G-D0DD | |
| Dell XPS 15 2017 9560 (7300HQ, Full-HD) | |
| Asus Strix GL753VD-GC045T | |
| Apple MacBook Pro 15 2016 (2.9 GHz, 460) | |
| Apple MacBook Pro 15 2016 (2.7 GHz, 455) | |
| Apple MacBook Pro 15 2016 (2.6 GHz, 450) | |
| Apple MacBook Pro Retina 15 inch 2015-05 | |
| Anno 2205 - 1920x1080 High Preset AA:4x | |
| Asus Strix GL753VD-GC045T | |
| Apple MacBook Pro 15 2016 (2.9 GHz, 460) | |
| Apple MacBook Pro 15 2016 (2.6 GHz, 450) | |
| Apple MacBook Pro 15 2016 (2.7 GHz, 455) | |
| Call of Duty Infinite Warfare - 1920x1080 High / On AA:FX | |
| Schenker XMG P507 PRO | |
| Asus Strix GL753VD-GC045T | |
| Apple MacBook Pro 15 2016 (2.9 GHz, 460) | |
| Apple MacBook Pro 15 2016 (2.7 GHz, 455) | |
| Apple MacBook Pro 15 2016 (2.6 GHz, 450) | |
| låg | med. | hög | ultra | 4K | |
|---|---|---|---|---|---|
| Counter-Strike: GO (2012) | 145 | ||||
| BioShock Infinite (2013) | 230 | 37.8 | |||
| Sims 4 (2014) | 50.6 | ||||
| GTA V (2015) | 37.1 | 11.1 | |||
| The Witcher 3 (2015) | 69.5 | 24.6 | 14.2 | ||
| Dota 2 Reborn (2015) | 67.2 | 61.5 | 22.8 | ||
| World of Warships (2015) | 188 | 70.7 | 53 | ||
| Anno 2205 (2015) | 86 | 17.5 | 7.7 | ||
| Fallout 4 (2015) | 27.8 | ||||
| Rainbow Six Siege (2015) | 162 | 52.7 | 33.7 | ||
| Rise of the Tomb Raider (2016) | 84 | 24.9 | 18.3 | ||
| XCOM 2 (2016) | 70 | 27.2 | 17.9 | 5.9 | |
| Far Cry Primal (2016) | 70 | 32 | 30 | 20 | |
| The Division (2016) | 88 | 25.2 | 18.5 | ||
| Hitman 2016 (2016) | 75 | 20.4 | |||
| Ashes of the Singularity (2016) | 33.8 | 21.3 | 19.3 | ||
| Doom (2016) | 53.1 | 19.8 | |||
| Overwatch (2016) | 178 | 65.8 | 30.1 | 18.7 | |
| Deus Ex Mankind Divided (2016) | 59.5 | 21.5 | 8.9 | ||
| FIFA 17 (2016) | 107 | ||||
| Mafia 3 (2016) | 32.8 | 15.1 | |||
| Battlefield 1 (2016) | 109 | 28.9 | 25.3 | ||
| Civilization 6 (2016) | 69 | 28.8 | 21.6 | ||
| Farming Simulator 17 (2016) | 71.7 | 25.8 | 22.8 | ||
| Titanfall 2 (2016) | 33.1 | 28.8 | |||
| Call of Duty Infinite Warfare (2016) | 40.2 | 34.4 | |||
| Dishonored 2 (2016) | 44.1 | 20.6 | |||
| Watch Dogs 2 (2016) | 54.4 | 20.7 | |||
| Resident Evil 7 (2017) | 146 | 59.4 | 34.6 | 19.7 |
Ljudnivå
| Låg belastning |
| 30.8 / 30.8 / 30.8 dB(A) |
| Hårddisk |
| 30.8 dB(A) |
| Hög belastning |
| 38.7 / 48.8 dB(A) |
 | ||
30 dB tyst 40 dB(A) hörbar 50 dB(A) högt ljud |
||
min: | ||
| 6820HQ, Radeon Pro 455 Radeon Pro 455, 6820HQ, Apple SSD SM0512L | 6920HQ, Radeon Pro 460 Radeon Pro 460, 6920HQ, Apple SSD SM1024L | 6700HQ, Radeon Pro 450 Radeon Pro 450, 6700HQ, Apple SSD SM0256L | 4870HQ, Radeon R9 M370X Radeon R9 M370X, 4870HQ, Apple SSD SM0512G | 6700HQ, GeForce GTX 960M GeForce GTX 960M, 6700HQ, Samsung PM951 NVMe 512 GB | i5-7300HQ, GeForce GTX 1050 Mobile GeForce GTX 1050 Mobile, i5-7300HQ, WDC WD10SPCX-75KHST0 + SanDisk Z400s M.2 2242 32 GB Cache | |
|---|---|---|---|---|---|---|
| Noise | 4% | 3% | 1% | -6% | -6% | |
| av / miljö * (dB) | 30.4 | 29 5% | 30.4 -0% | 30.3 -0% | ||
| Idle Minimum * (dB) | 30.8 | 30.3 2% | 30.6 1% | 28.9 6% | 31.4 -2% | 31.6 -3% |
| Idle Average * (dB) | 30.8 | 30.3 2% | 30.6 1% | 28.9 6% | 32.5 -6% | 31.6 -3% |
| Idle Maximum * (dB) | 30.8 | 30.3 2% | 30.6 1% | 28.9 6% | 33.6 -9% | 33.4 -8% |
| Load Average * (dB) | 38.7 | 35.1 9% | 34.7 10% | 46 -19% | 45.2 -17% | 47.8 -24% |
| Load Maximum * (dB) | 48.8 | 46 6% | 46.3 5% | 46 6% | 46 6% | 47.8 2% |
* ... mindre är bättre
(-) Den maximala temperaturen på ovansidan är 46 °C / 115 F, jämfört med genomsnittet av 36.8 °C / 98 F , allt från 21 till 71 °C för klassen Multimedia.
(+) Botten värms upp till maximalt 39 °C / 102 F, jämfört med genomsnittet av 39.1 °C / 102 F
(+) Handledsstöden och pekplattan är kallare än hudtemperaturen med maximalt 29 °C / 84.2 F och är därför svala att ta på.
(±) Medeltemperaturen för handledsstödsområdet på liknande enheter var 28.7 °C / 83.7 F (-0.3 °C / -0.5 F).
| Apple MacBook Pro 15 2016 (2.7 GHz, 455) 6820HQ, Radeon Pro 455 | Apple MacBook Pro 15 2016 (2.9 GHz, 460) 6920HQ, Radeon Pro 460 | Apple MacBook Pro 15 2016 (2.6 GHz, 450) 6700HQ, Radeon Pro 450 | Apple MacBook Pro Retina 15 inch 2015-05 4870HQ, Radeon R9 M370X | Dell XPS 15-9550 i7 6700HQ, GeForce GTX 960M | Dell XPS 15 2017 9560 (7300HQ, Full-HD) i5-7300HQ, GeForce GTX 1050 Mobile | |
|---|---|---|---|---|---|---|
| Heat | -2% | 2% | 3% | -25% | -6% | |
| Maximum Upper Side * (°C) | 46 | 44.2 4% | 43 7% | 43.2 6% | 55.9 -22% | 47.6 -3% |
| Maximum Bottom * (°C) | 39 | 41.6 -7% | 40 -3% | 39 -0% | 50 -28% | 42.1 -8% |
| Idle Upper Side * (°C) | 33.6 | 26 | 30 | 28.1 | 29.9 | |
| Idle Bottom * (°C) | 31.1 | 25 | 29.3 | 27.9 | 29.8 |
* ... mindre är bättre
| Låg belastning | |
| Hög belastning |
|
Förklaring:
min: | |
| Apple MacBook Pro 15 2016 (2.7 GHz, 455) 6820HQ, Radeon Pro 455 | Apple MacBook Pro 15 2016 (2.9 GHz, 460) 6920HQ, Radeon Pro 460 | Apple MacBook Pro 15 2016 (2.6 GHz, 450) 6700HQ, Radeon Pro 450 | Apple MacBook Pro Retina 15 inch 2015-05 4870HQ, Radeon R9 M370X | Dell XPS 15-9550 i7 6700HQ, GeForce GTX 960M | Dell XPS 15 2017 9560 (7300HQ, Full-HD) i5-7300HQ, GeForce GTX 1050 Mobile | |
|---|---|---|---|---|---|---|
| Power Consumption | 1% | 8% | -25% | -97% | -23% | |
| Idle Minimum * (Watt) | 4 | 3 25% | 2.9 27% | 6 -50% | 12.5 -213% | 6.6 -65% |
| Idle Average * (Watt) | 10.9 | 9.9 9% | 9.7 11% | 12.8 -17% | 19.6 -80% | 9 17% |
| Idle Maximum * (Watt) | 10.9 | 12.5 -15% | 10.1 7% | 13.3 -22% | 22.8 -109% | 10.7 2% |
| Load Average * (Watt) | 64.6 | 70.6 -9% | 65 -1% | 82.4 -28% | 102 -58% | 77.5 -20% |
| Load Maximum * (Watt) | 86.7 | 90.8 -5% | 89.5 -3% | 91.8 -6% | 107 -23% | 130 -50% |
* ... mindre är bättre
| Apple MacBook Pro 15 2016 (2.7 GHz, 455) 6820HQ, Radeon Pro 455, 76 Wh | Apple MacBook Pro 15 2016 (2.9 GHz, 460) 6920HQ, Radeon Pro 460, 76 Wh | Apple MacBook Pro 15 2016 (2.6 GHz, 450) 6700HQ, Radeon Pro 450, 76 Wh | Apple MacBook Pro Retina 15 inch 2015-05 4870HQ, Radeon R9 M370X, 100 Wh | Dell XPS 15-9550 i7 6700HQ, GeForce GTX 960M, 84 Wh | Dell XPS 15 2017 9560 (7300HQ, Full-HD) i5-7300HQ, GeForce GTX 1050 Mobile, 56 Wh | |
|---|---|---|---|---|---|---|
| Batteridrifttid | -2% | -3% | 34% | 41% | 5% | |
| WiFi v1.3 (h) | 10.6 | 10.3 -3% | 10 -6% | 7.2 -32% | 5.2 -51% | 5.6 -47% |
| Load (h) | 0.9 | 0.9 0% | 0.9 0% | 1.8 100% | 2.1 133% | 1.4 56% |
| H.264 (h) | 9.1 | 8.6 | 6.9 | 5.3 | ||
| Reader / Idle (h) | 17.3 | 8.8 | 9.4 |
För
Emot
Läs originaltestet på engelska här.
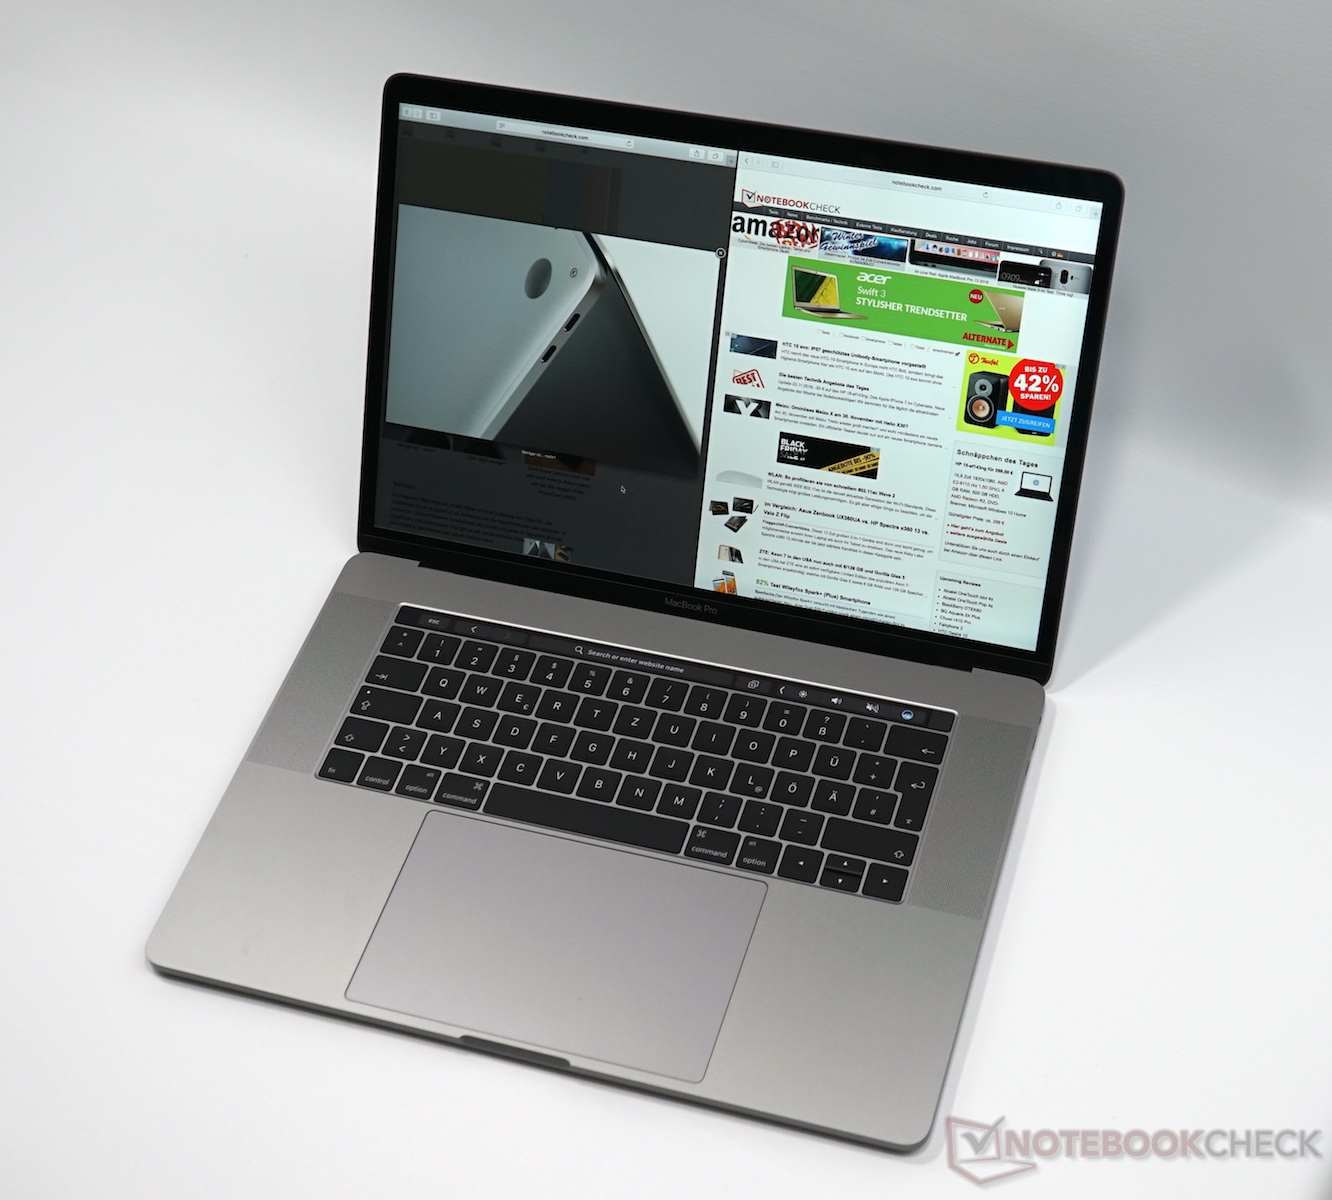
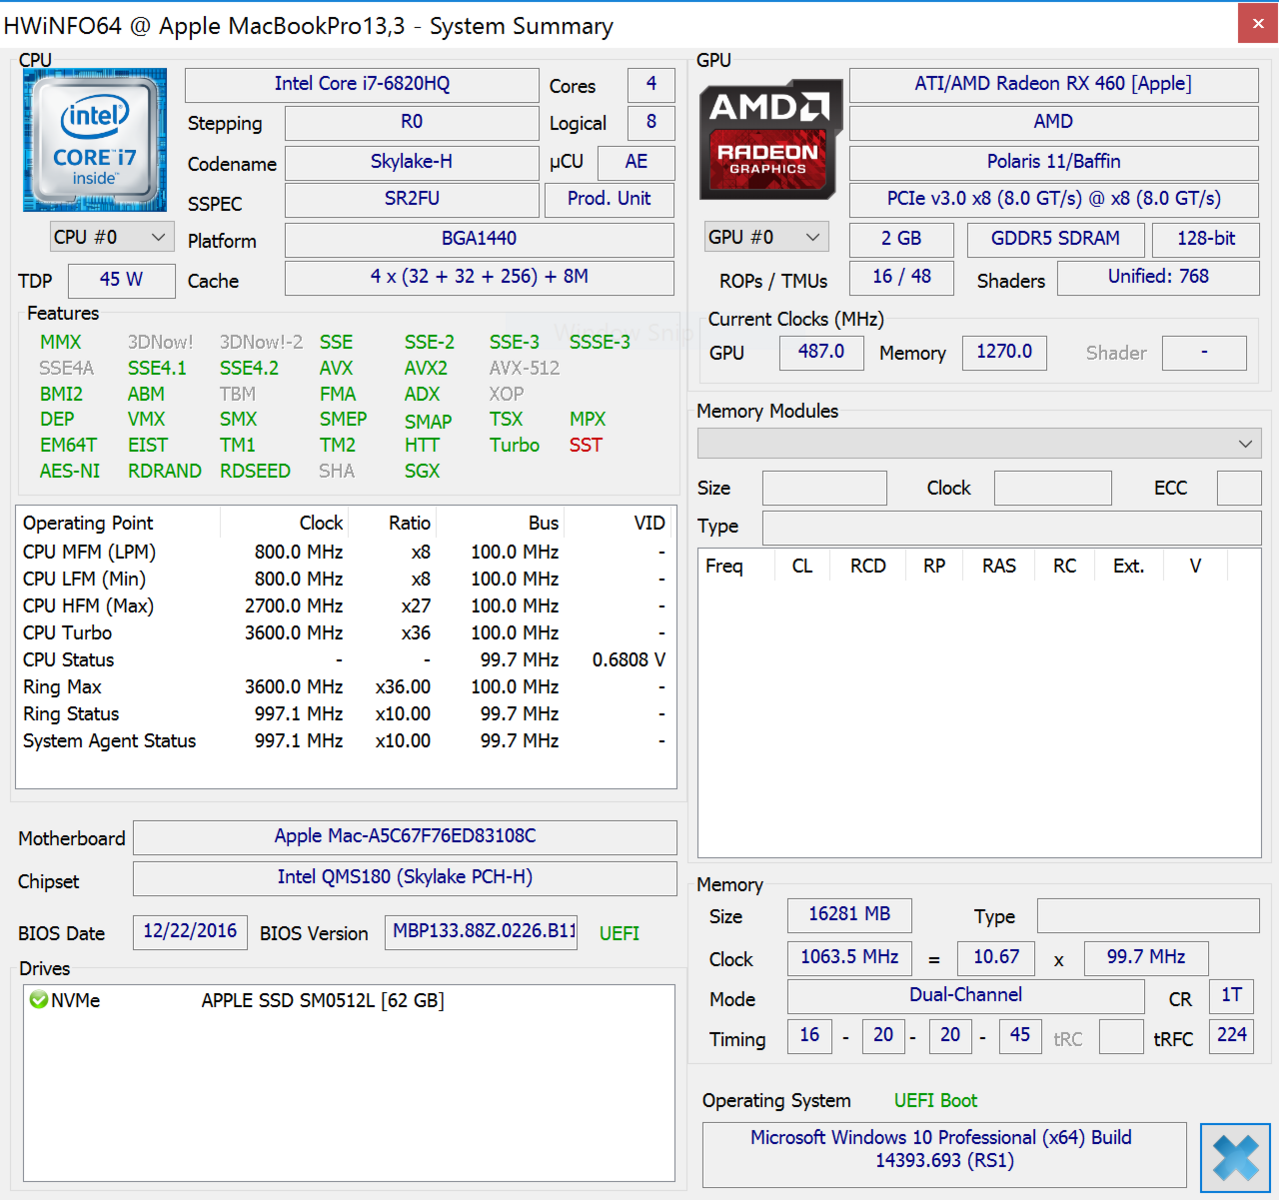
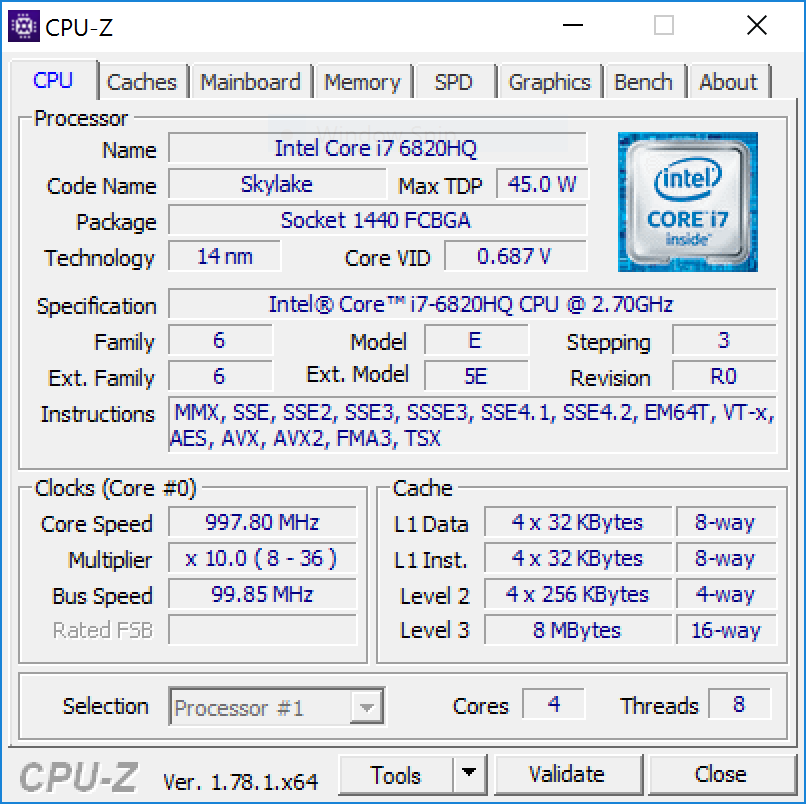
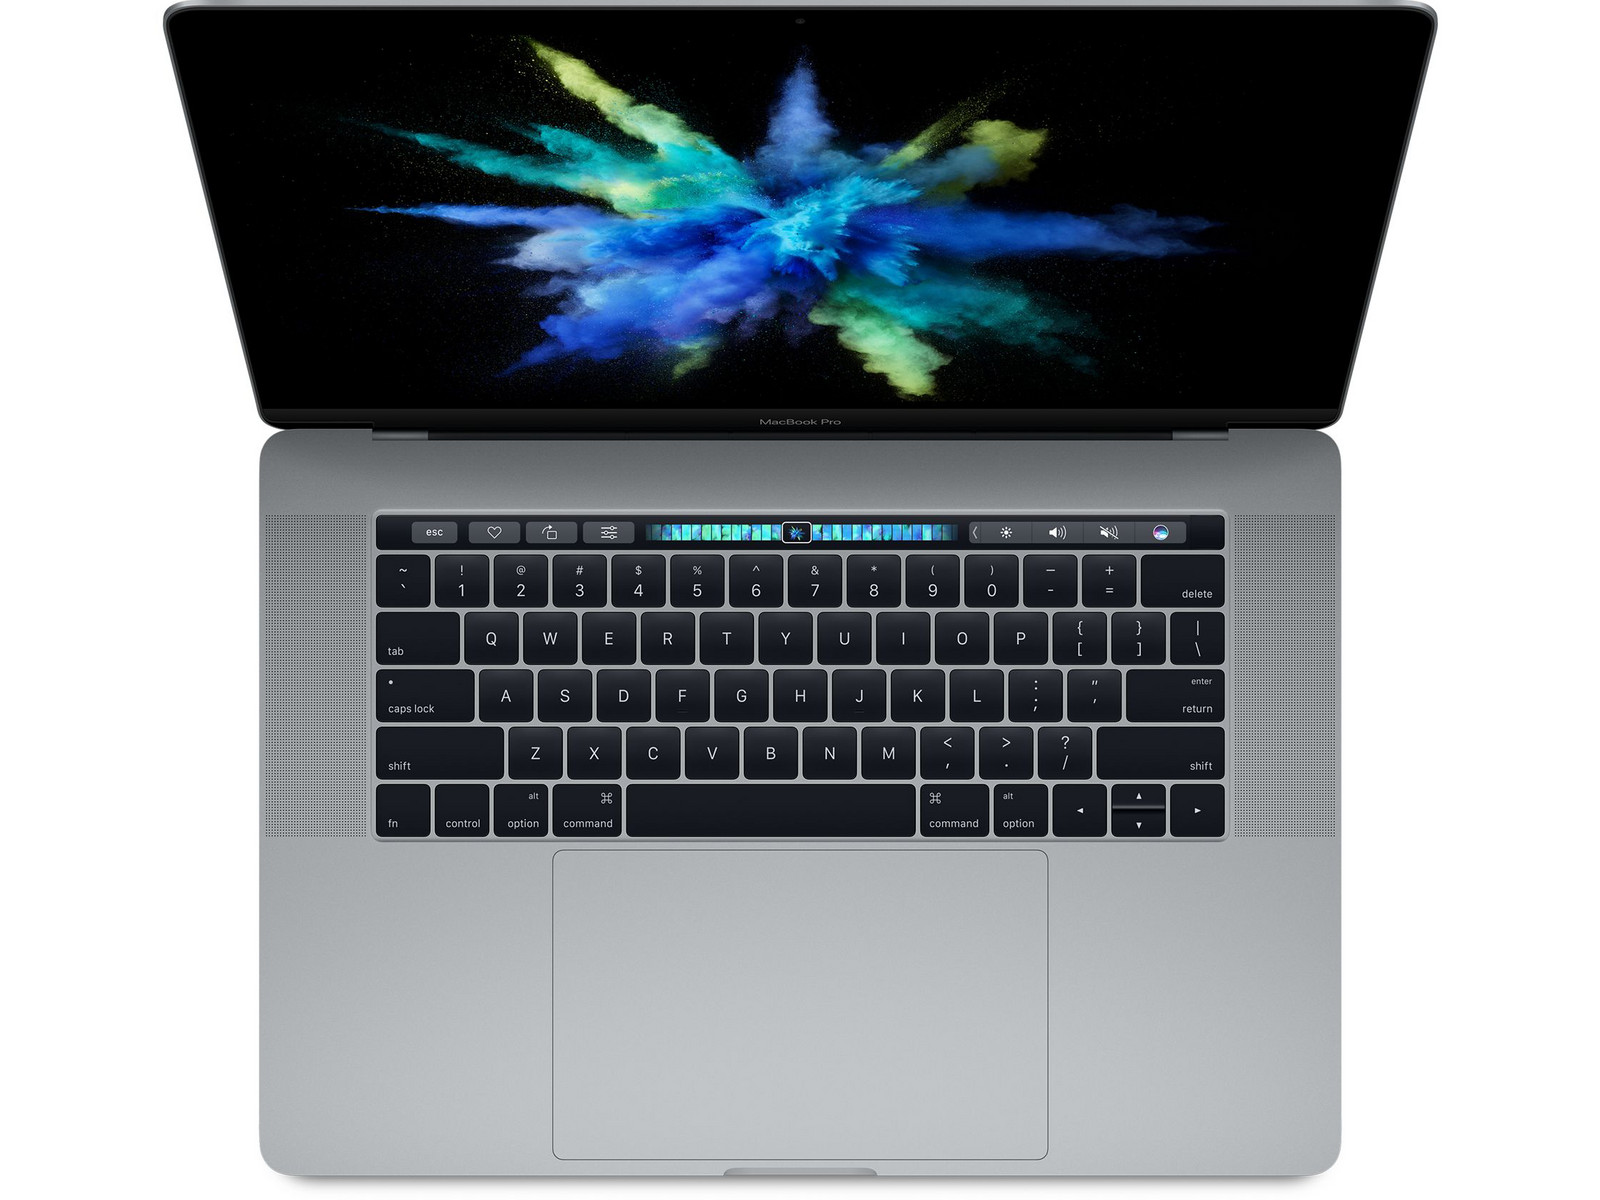
Det här är den tredje konfigurationen av Apple MacBook Pro 15 som vi testar. Vissa detaljer är faktiskt överraskande, men då syftar vi inte på de två snabbare huvudkomponenterna. Processorn är 100 MHz snabbare än basmodellen, vilket resulterar i en marginell fördel i prestandatester, men det är inget du kommer att märka i praktiken.
Grafikkortet AMD Radeon Pro 455 är som namnet antyder ett mellanting mellan 450 och 460 – inte heller någon överraskning. Men det är närmare till instegsmodellen Radeon Pro 450 på grund av den lilla mängden grafikminne (2 GB GDDR5). Om du inte är nöjd med Radeon Pro 450 är det bättre att satsa på det mer kraftfulla 460 med 4 GB GDDR5.
Den stora överraskningen är skärmen, som har en annan beteckning (APPA031) och högre ljusstyrka. Det är inget som påverkar svärtan, vilket resulterar i att kontrasten är bättre också. Det verkar vara ren tur just nu vilken panel du får. Båda de andra modellerna vi testat hade den något mörkare panelen.
Så till huvudfrågan om uppgraderingarna ger valuta för pengarna. Svaret är att det beror på. Processorn är knappast snabbare och det går ändå att uppgradera till Core i7-6920HQ, vilket också gäller grafikkortet. Men i uppgraderingen ingår även en större SSD på 512 GB och förkonfigurerade modeller är ofta billigare i butik, så modellen kan möjligen vara intressant även om du bara vill ha extra lagringskapacitet. De allmänna fördelarna och nackdelarna med Apple MacBook Pro 15 gäller även här, så vi kan återigen vill hänvisa till våra tester av instegsmodellen respektive den ännu dyrare varianten.
Apple MacBook Pro 15 2016 (2.7 GHz, 455)
- 02/13/2017 v6 (old)
Klaus A. Hinum, Andreas Osthoff
Price comparison
