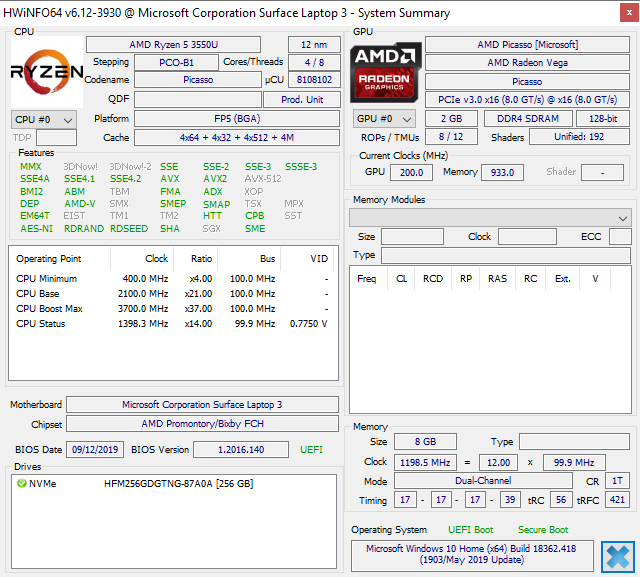
Test: Surface Laptop 3 15 Ryzen 5 - Microsoft kan bättre (Sammanfattning)
Gradering | Datum | Modell | Vikt | Höjd | Storlek | Upplösning | Pris |
|---|---|---|---|---|---|---|---|
| 82.9 % v7 (old) | 11/2019 | Microsoft Surface Laptop 3 15 Ryzen 5 3580U R5 3580U, Vega 9 | 1.5 kg | 14.7 mm | 15.00" | 2496x1664 | |
| 86.3 % v7 (old) | 10/2019 | Dell XPS 15 7590 i5 iGPU FHD i5-9300H, UHD Graphics 630 | 1.9 kg | 17 mm | 15.60" | 1920x1080 | |
| 87.9 % v7 (old) | 11/2018 | Apple MacBook Pro 15 2018 (2.6 GHz, 560X) i7-8850H, Radeon Pro 560X | 1.8 kg | 15.5 mm | 15.40" | 2880x1800 | |
| 83.9 % v7 (old) | 03/2019 | HP Spectre x360 15-df0126ng i7-8750H, GeForce GTX 1050 Ti Max-Q | 2.2 kg | 19.3 mm | 15.60" | 3840x2160 | |
| 90 % v6 (old) | 01/2019 | Lenovo ThinkPad X1 Carbon 2018-20KGS5DU00 i5-8550U, UHD Graphics 620 | 1.1 kg | 15.95 mm | 14.00" | 2560x1440 |
| |||||||||||||||||||||||||
Distribution av ljusstyrkan: 86 %
Mitt på batteriet: 403.4 cd/m²
Kontrast: 1042:1 (Svärta: 0.4 cd/m²)
ΔE ColorChecker Calman: 2.75 | ∀{0.5-29.43 Ø4.72}
calibrated: 0.71
ΔE Greyscale Calman: 1.8 | ∀{0.09-98 Ø4.97}
99.4% sRGB (Argyll 1.6.3 3D)
63.4% AdobeRGB 1998 (Argyll 1.6.3 3D)
63.7% AdobeRGB 1998 (Argyll 3D)
99.3% sRGB (Argyll 3D)
66.9% Display P3 (Argyll 3D)
Gamma: 2.09
CCT: 6646 K
| Microsoft Surface Laptop 3 15 Ryzen 5 3580U Sharp LQ150P1JX51, IPS, 15", 2496x1664 | Microsoft Surface Laptop 2-LQN-00004 VVX14T092N00, IPS, 13.5", 2256x1504 | Microsoft Surface Laptop i5 ID: MEI96A2, Name: Panasonic VVX14T092N00, IPS, 13.5", 2256x1504 | Dell XPS 15 7590 i5 iGPU FHD LQ156M1, IPS, 15.6", 1920x1080 | HP Spectre x360 15-df0126ng AU Optronics AUO30EB, IPS, 15.6", 3840x2160 | Apple MacBook Pro 15 2018 (2.6 GHz, 560X) APPA040, IPS, 15.4", 2880x1800 | |
|---|---|---|---|---|---|---|
| Display | 2% | 2% | 2% | 1% | 28% | |
| Display P3 Coverage (%) | 66.9 | 68 2% | 67.8 1% | 66.5 -1% | 68.1 2% | 98.7 48% |
| sRGB Coverage (%) | 99.3 | 94.7 -5% | 94.3 -5% | 98 -1% | 94.2 -5% | 99.9 1% |
| AdobeRGB 1998 Coverage (%) | 63.7 | 69.2 9% | 69.5 9% | 68.4 7% | 68.4 7% | 86.6 36% |
| Response Times | -37% | -5% | 1% | -3% | 12% | |
| Response Time Grey 50% / Grey 80% * (ms) | 47.2 ? | 69.2 ? -47% | 50.8 ? -8% | 52.8 ? -12% | 57 ? -21% | 43.2 ? 8% |
| Response Time Black / White * (ms) | 36.8 ? | 46.4 ? -26% | 37.2 ? -1% | 32 ? 13% | 31 ? 16% | 31.2 ? 15% |
| PWM Frequency (Hz) | 21370 ? | 1020 ? | 117000 ? | |||
| Screen | -15% | 11% | 1% | -39% | 29% | |
| Brightness middle (cd/m²) | 416.9 | 392 -6% | 384.2 -8% | 588 41% | 330 -21% | 520 25% |
| Brightness (cd/m²) | 389 | 390 0% | 378 -3% | 555 43% | 310 -20% | 492 26% |
| Brightness Distribution (%) | 86 | 89 3% | 90 5% | 89 3% | 87 1% | 88 2% |
| Black Level * (cd/m²) | 0.4 | 0.24 40% | 0.36 10% | 0.4 -0% | 0.37 7% | 0.39 2% |
| Contrast (:1) | 1042 | 1633 57% | 1067 2% | 1470 41% | 892 -14% | 1333 28% |
| Colorchecker dE 2000 * | 2.75 | 3.2 -16% | 1.8 35% | 2.5 9% | 4.03 -47% | 1.2 56% |
| Colorchecker dE 2000 max. * | 6.64 | 6.3 5% | 4.2 37% | 6.3 5% | 6.74 -2% | 2.3 65% |
| Colorchecker dE 2000 calibrated * | 0.71 | 1.4 -97% | 0.6 15% | 1.96 -176% | ||
| Greyscale dE 2000 * | 1.8 | 4.5 -150% | 1.2 33% | 4.5 -150% | 4.49 -149% | 1.3 28% |
| Gamma | 2.09 105% | 2.2 100% | 2.21 100% | 2.2 100% | 2.57 86% | 2.18 101% |
| CCT | 6646 98% | 7556 86% | 6708 97% | 6836 95% | 6744 96% | 6738 96% |
| Color Space (Percent of AdobeRGB 1998) (%) | 63.4 | 63.9 1% | 63.7 0% | 63.2 0% | 61 -4% | |
| Color Space (Percent of sRGB) (%) | 99.4 | 95 -4% | 94.2 -5% | 98 -1% | 94 -5% | |
| Totalt genomsnitt (program/inställningar) | -17% /
-15% | 3% /
7% | 1% /
1% | -14% /
-27% | 23% /
26% |
* ... mindre är bättre
Visa svarstider
| ↔ Svarstid svart till vitt | ||
|---|---|---|
| 36.8 ms ... stiga ↗ och falla ↘ kombinerat | ↗ 20.4 ms stiga | 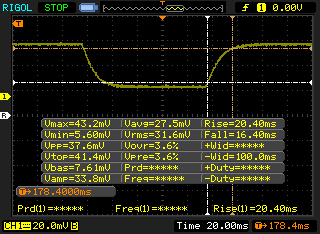 |
| ↘ 16.4 ms hösten | ||
| Skärmen visar långsamma svarsfrekvenser i våra tester och kommer att vara otillfredsställande för spelare. I jämförelse sträcker sig alla testade enheter från 0.1 (minst) till 240 (maximalt) ms. » 95 % av alla enheter är bättre. Detta innebär att den uppmätta svarstiden är sämre än genomsnittet av alla testade enheter (19.8 ms). | ||
| ↔ Svarstid 50 % grått till 80 % grått | ||
| 47.2 ms ... stiga ↗ och falla ↘ kombinerat | ↗ 23.2 ms stiga | 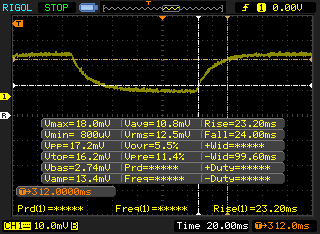 |
| ↘ 24 ms hösten | ||
| Skärmen visar långsamma svarsfrekvenser i våra tester och kommer att vara otillfredsställande för spelare. I jämförelse sträcker sig alla testade enheter från 0.165 (minst) till 636 (maximalt) ms. » 82 % av alla enheter är bättre. Detta innebär att den uppmätta svarstiden är sämre än genomsnittet av alla testade enheter (31 ms). | ||
Skärmflimmer / PWM (Puls-Width Modulation)
| Skärmflimmer / PWM upptäckt | 21370 Hz | ≤ 51 % ljusstyrka inställning | 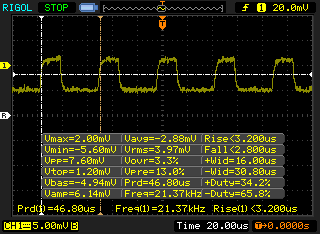 |
Displayens bakgrundsbelysning flimrar vid 21370 Hz (i värsta fall, t.ex. med PWM) Flimrande upptäckt vid en ljusstyrkeinställning på 51 % och lägre. Det ska inte finnas något flimmer eller PWM över denna ljusstyrkeinställning. Frekvensen för 21370 Hz är ganska hög, så de flesta användare som är känsliga för PWM bör inte märka något flimmer. Som jämförelse: 52 % av alla testade enheter använder inte PWM för att dämpa skärmen. Om PWM upptäcktes mättes ett medelvärde av 7778 (minst: 5 - maximum: 343500) Hz. | |||
| PCMark 8 Home Score Accelerated v2 | 3348 poäng | |
| PCMark 8 Work Score Accelerated v2 | 4246 poäng | |
| PCMark 10 Score | 4056 poäng | |
Hjälp | ||
| Microsoft Surface Laptop 3 15 Ryzen 5 3580U SK hynix BC501 HFM256GDGTNG | Microsoft Surface Laptop 2-LQN-00004 SK Hynix BC501 NVMe 256 GB | Microsoft Surface Laptop i5 Toshiba THNSN0128GTYA | Dell XPS 15 7590 i5 iGPU FHD Toshiba XG6 KXG60ZNV512G | Apple MacBook Pro 15 2018 (2.6 GHz, 560X) Apple SSD AP0512 | HP Spectre x360 15-df0126ng Toshiba XG5-P KXG50PNV2T04 | |
|---|---|---|---|---|---|---|
| AS SSD | 10% | -89% | 133% | 2% | 55% | |
| Seq Read (MB/s) | 1122 | 826 -26% | 561 -50% | 2357 110% | 2239 100% | 2018 80% |
| Seq Write (MB/s) | 514 | 555 8% | 117.2 -77% | 1235 140% | 1644 220% | 773 50% |
| 4K Read (MB/s) | 34.98 | 33.39 -5% | 20.15 -42% | 43.29 24% | 9.46 -73% | 24.62 -30% |
| 4K Write (MB/s) | 96.8 | 95.3 -2% | 39.07 -60% | 99.7 3% | 18.78 -81% | 92.8 -4% |
| 4K-64 Read (MB/s) | 492 | 447 -9% | 80.4 -84% | 1020 107% | 965 96% | 845 72% |
| 4K-64 Write (MB/s) | 339.9 | 370.4 9% | 35.48 -90% | 1502 342% | 163.5 -52% | 957 182% |
| Access Time Read * (ms) | 0.056 | 0.048 14% | 0.128 -129% | 0.07 -25% | 0.225 -302% | 0.147 -163% |
| Access Time Write * (ms) | 0.11 | 0.048 56% | 0.369 -235% | 0.039 65% | 0.057 48% | |
| Score Read (Points) | 639 | 563 -12% | 157 -75% | 1299 103% | 1199 88% | 1071 68% |
| Score Write (Points) | 488 | 521 7% | 86 -82% | 1726 254% | 347 -29% | 1127 131% |
| Score Total (Points) | 1434 | 1369 -5% | 309 -78% | 3640 154% | 2119 48% | 2684 87% |
| Copy ISO MB/s (MB/s) | 828 | 755 -9% | 87.1 -89% | 2145 159% | 1652 100% | |
| Copy Program MB/s (MB/s) | 200.5 | 325.1 62% | 62.7 -69% | 565 182% | 328.5 64% | |
| Copy Game MB/s (MB/s) | 387.4 | 577 49% | 80.5 -79% | 1320 241% | 700 81% |
* ... mindre är bättre

| 3DMark 11 | |
| 1280x720 Performance GPU | |
| Microsoft Surface Book 2 15 | |
| Dell G3 3590 | |
| Microsoft Surface Book 2 | |
| MSI PL62 MX150 7700HQ | |
| Acer Aspire 5 A515-52G-723L | |
| Dell XPS 13 7390 2-in-1 Core i7 | |
| Microsoft Surface Laptop 3 15 Ryzen 5 3580U | |
| Dell Inspiron 15 5000 5585 | |
| Lenovo Yoga 530-14ARR-81H9000VGE | |
| Lenovo Ideapad L340-17API-81LY0004GE | |
| Lenovo ThinkPad A285-20MX0002GE | |
| Microsoft Surface Laptop i7 | |
| Microsoft Surface Laptop i7 | |
| Dell Latitude 7400-8N6DH | |
| Dell XPS 15 7590 i5 iGPU FHD | |
| 1280x720 Performance Combined | |
| Dell G3 3590 | |
| Microsoft Surface Book 2 15 | |
| Microsoft Surface Book 2 | |
| Acer Aspire 5 A515-52G-723L | |
| MSI PL62 MX150 7700HQ | |
| Dell XPS 13 7390 2-in-1 Core i7 | |
| Dell Inspiron 15 5000 5585 | |
| Microsoft Surface Laptop 3 15 Ryzen 5 3580U | |
| Lenovo Yoga 530-14ARR-81H9000VGE | |
| Lenovo Ideapad L340-17API-81LY0004GE | |
| Lenovo ThinkPad A285-20MX0002GE | |
| Microsoft Surface Laptop i7 | |
| Microsoft Surface Laptop i7 | |
| Dell XPS 15 7590 i5 iGPU FHD | |
| Dell Latitude 7400-8N6DH | |
| 3DMark 06 Standard Score | 13365 poäng | |
| 3DMark Vantage P Result | 12628 poäng | |
| 3DMark 11 Performance | 4424 poäng | |
| 3DMark Ice Storm Standard Score | 77533 poäng | |
| 3DMark Cloud Gate Standard Score | 13582 poäng | |
| 3DMark Fire Strike Score | 2524 poäng | |
| 3DMark Time Spy Score | 974 poäng | |
Hjälp | ||
| Rocket League | |
| 1280x720 Performance | |
| HP Spectre x360 15-df0126ng | |
| Dell G3 3590 | |
| Apple MacBook Pro 15 2018 (2.9 GHz, Vega 20) | |
| Asus ROG Zephyrus G15 GA502DU | |
| Acer Aspire 5 A515-52G-723L | |
| MSI PL62 MX150 7700HQ | |
| Dell Inspiron 15 5000 5585 | |
| Dell XPS 13 7390 2-in-1 Core i7 | |
| Microsoft Surface Laptop 3 15 Ryzen 5 3580U | |
| Microsoft Surface Laptop i7 | |
| Microsoft Surface Laptop 2-LQN-00004 | |
| Razer Blade Stealth i7-1065G7 Iris Plus | |
| Lenovo ThinkPad A285-20MX0002GE | |
| 1920x1080 Quality AA:Medium FX | |
| Apple MacBook Pro 15 2018 (2.9 GHz, Vega 20) | |
| Dell G3 3590 | |
| HP Spectre x360 15-df0126ng | |
| Asus ROG Zephyrus G15 GA502DU | |
| MSI PS63 Modern 8SC | |
| Acer Aspire 5 A515-52G-723L | |
| Razer Blade Stealth i7-1065G7 Iris Plus | |
| MSI PL62 MX150 7700HQ | |
| Dell XPS 13 7390 2-in-1 Core i7 | |
| Dell Inspiron 15 5000 5585 | |
| Microsoft Surface Laptop 3 15 Ryzen 5 3580U | |
| Microsoft Surface Laptop 2-LQN-00004 | |
| Microsoft Surface Laptop i7 | |
| Shadow of the Tomb Raider - 1280x720 Lowest Preset | |
| Apple MacBook Pro 15 2018 (2.9 GHz, Vega 20) | |
| Dell G3 3590 | |
| Apple MacBook Pro 15 2018 (2.6 GHz, 560X) | |
| Asus ROG Zephyrus G15 GA502DU | |
| Acer Aspire 5 A515-52G-723L | |
| Dell Inspiron 15 5000 5585 | |
| Razer Blade Stealth i7-1065G7 Iris Plus | |
| Microsoft Surface Laptop 3 15 Ryzen 5 3580U | |
| Dell XPS 13 7390 2-in-1 Core i7 | |
| Microsoft Surface Pro 6, Core i7, 512 GB | |
| Fortnite | |
| 1280x720 Low Preset | |
| Apple MacBook Pro 15 2018 (2.6 GHz, 560X) | |
| Asus ROG Zephyrus G15 GA502DU | |
| Razer Blade Stealth i7-1065G7 Iris Plus | |
| Honor Magicbook | |
| Microsoft Surface Laptop 3 15 Ryzen 5 3580U | |
| 1920x1080 Medium Preset | |
| MSI PS63 Modern 8SC | |
| Asus ROG Zephyrus G15 GA502DU | |
| Apple MacBook Pro 15 2018 (2.6 GHz, 560X) | |
| Razer Blade Stealth i7-1065G7 Iris Plus | |
| Honor Magicbook | |
| Microsoft Surface Laptop 3 15 Ryzen 5 3580U | |
| låg | med. | hög | ultra | |
|---|---|---|---|---|
| BioShock Infinite (2013) | 117.9 | 20.5 | ||
| The Witcher 3 (2015) | 41.9 | 13.3 | 8.1 | |
| Overwatch (2016) | 92.3 | 36.3 | 19.3 | |
| Rocket League (2017) | 100.7 | 46.2 | 30.4 | |
| Fortnite (2018) | 48 | 22.3 | 15.7 | 9.1 |
| Shadow of the Tomb Raider (2018) | 29 | 8 | ||
| Apex Legends (2019) | 60.7 | 20.9 | 18 | 14.5 |
| F1 2019 (2019) | 51 | 21 | 18 | 12 |
| Borderlands 3 (2019) | 28.3 | 13.5 | 7.8 |
| Microsoft Surface Laptop 3 15 Ryzen 5 3580U Vega 9, R5 3580U, SK hynix BC501 HFM256GDGTNG | Microsoft Surface Laptop 2-LQN-00004 UHD Graphics 620, i5-8250U, SK Hynix BC501 NVMe 256 GB | Microsoft Surface Laptop i5 HD Graphics 620, i5-7200U, Toshiba THNSN0128GTYA | Dell XPS 15 7590 i5 iGPU FHD UHD Graphics 630, i5-9300H, Toshiba XG6 KXG60ZNV512G | Apple MacBook Pro 15 2018 (2.6 GHz, 560X) Radeon Pro 560X, i7-8850H, Apple SSD AP0512 | HP Spectre x360 15-df0126ng GeForce GTX 1050 Ti Max-Q, i7-8750H, Toshiba XG5-P KXG50PNV2T04 | |
|---|---|---|---|---|---|---|
| Noise | 2% | -1% | -4% | -14% | -14% | |
| av / miljö * (dB) | 28 | 28.7 -2% | 28.2 -1% | 29.3 -5% | 29.6 -6% | 30.4 -9% |
| Idle Minimum * (dB) | 28 | 28.7 -2% | 28.2 -1% | 29.3 -5% | 30.1 -8% | 30.4 -9% |
| Idle Average * (dB) | 28 | 28.7 -2% | 28.2 -1% | 29.3 -5% | 30.1 -8% | 30.4 -9% |
| Idle Maximum * (dB) | 28 | 28.7 -2% | 29 -4% | 29.8 -6% | 30.1 -8% | 31.6 -13% |
| Load Average * (dB) | 29.2 | 30 -3% | 30.3 -4% | 32.4 -11% | 46.8 -60% | 43.2 -48% |
| Witcher 3 ultra * (dB) | 39 | 36 8% | ||||
| Load Maximum * (dB) | 41.4 | 32.9 21% | 39.3 5% | 37.2 10% | 46.8 -13% | 38.3 7% |
* ... mindre är bättre
Ljudnivå
| Låg belastning |
| 28 / 28 / 28 dB(A) |
| Hög belastning |
| 29.2 / 41.4 dB(A) |
 | ||
30 dB tyst 40 dB(A) hörbar 50 dB(A) högt ljud |
||
min: | ||
(±) Den maximala temperaturen på ovansidan är 43.6 °C / 110 F, jämfört med genomsnittet av 34.3 °C / 94 F , allt från 21.2 till 62.5 °C för klassen Office.
(-) Botten värms upp till maximalt 49.4 °C / 121 F, jämfört med genomsnittet av 36.8 °C / 98 F
(+) Vid tomgångsbruk är medeltemperaturen för ovansidan 26.6 °C / 80 F, jämfört med enhetsgenomsnittet på 29.5 °C / ### class_avg_f### F.
(±) När du spelar The Witcher 3 är medeltemperaturen för ovansidan 37.6 °C / 100 F, jämfört med enhetsgenomsnittet på 29.5 °C / ## #class_avg_f### F.
(+) Handledsstöden och pekplattan når maximal hudtemperatur (35.8 °C / 96.4 F) och är därför inte varma.
(-) Medeltemperaturen för handledsstödsområdet på liknande enheter var 27.5 °C / 81.5 F (-8.3 °C / -14.9 F).
Microsoft Surface Laptop 3 15 Ryzen 5 3580U ljudanalys
(±) | högtalarljudstyrkan är genomsnittlig men bra (79.9 dB)
Bas 100 - 315 Hz
(+) | bra bas - bara 4.8% från medianen
(±) | linjäriteten för basen är genomsnittlig (8.2% delta till föregående frekvens)
Mellan 400 - 2000 Hz
(+) | balanserad mellan - endast 4% från medianen
(±) | linjäriteten för mids är genomsnittlig (8.5% delta till föregående frekvens)
Högsta 2 - 16 kHz
(+) | balanserade toppar - endast 3.5% från medianen
(±) | linjäriteten för toppar är genomsnittlig (9.1% delta till föregående frekvens)
Totalt 100 - 16 000 Hz
(+) | det totala ljudet är linjärt (14.7% skillnad mot median)
Jämfört med samma klass
» 12% av alla testade enheter i den här klassen var bättre, 4% liknande, 84% sämre
» Den bästa hade ett delta på 7%, genomsnittet var 21%, sämst var 53%
Jämfört med alla testade enheter
» 19% av alla testade enheter var bättre, 4% liknande, 77% sämre
» Den bästa hade ett delta på 4%, genomsnittet var 24%, sämst var 134%
Apple MacBook 12 (Early 2016) 1.1 GHz ljudanalys
(+) | högtalare kan spela relativt högt (83.6 dB)
Bas 100 - 315 Hz
(±) | reducerad bas - i genomsnitt 11.3% lägre än medianen
(±) | linjäriteten för basen är genomsnittlig (14.2% delta till föregående frekvens)
Mellan 400 - 2000 Hz
(+) | balanserad mellan - endast 2.4% från medianen
(+) | mids är linjära (5.5% delta till föregående frekvens)
Högsta 2 - 16 kHz
(+) | balanserade toppar - endast 2% från medianen
(+) | toppar är linjära (4.5% delta till föregående frekvens)
Totalt 100 - 16 000 Hz
(+) | det totala ljudet är linjärt (10.2% skillnad mot median)
Jämfört med samma klass
» 7% av alla testade enheter i den här klassen var bättre, 2% liknande, 91% sämre
» Den bästa hade ett delta på 5%, genomsnittet var 18%, sämst var 53%
Jämfört med alla testade enheter
» 5% av alla testade enheter var bättre, 1% liknande, 94% sämre
» Den bästa hade ett delta på 4%, genomsnittet var 24%, sämst var 134%
| Av/Standby | |
| Låg belastning | |
| Hög belastning |
|
Förklaring:
min: | |
| Microsoft Surface Laptop 3 15 Ryzen 5 3580U R5 3580U, Vega 9, SK hynix BC501 HFM256GDGTNG, IPS, 2496x1664, 15" | Microsoft Surface Laptop 2-LQN-00004 i5-8250U, UHD Graphics 620, SK Hynix BC501 NVMe 256 GB, IPS, 2256x1504, 13.5" | Dell XPS 15 7590 i5 iGPU FHD i5-9300H, UHD Graphics 630, Toshiba XG6 KXG60ZNV512G, IPS, 1920x1080, 15.6" | Asus VivoBook S15 S530UN-BQ097T i5-8550U, GeForce MX150, SanDisk SD9SN8W256G1027, IPS LED, 1920x1080, 15.6" | Dell Inspiron 15 5000 5585 R7 3700U, Vega 10, WDC PC SN520 SDAPNUW-512G, IPS, 1920x1080, 15.6" | HP EliteBook 755 G5 3UN79EA R7 2700U, Vega 10, Toshiba XG5 KXG50ZNV512G, IPS, 1920x1080, 15.6" | |
|---|---|---|---|---|---|---|
| Power Consumption | 7% | -36% | -8% | 5% | -32% | |
| Idle Minimum * (Watt) | 3.3 | 3 9% | 3.79 -15% | 3.1 6% | 4.2 -27% | 5 -52% |
| Idle Average * (Watt) | 7.1 | 6.8 4% | 6.9 3% | 6.3 11% | 6.8 4% | 10.6 -49% |
| Idle Maximum * (Watt) | 7.2 | 8.76 -22% | 9.2 -28% | 8.6 -19% | 7 3% | 12.9 -79% |
| Load Average * (Watt) | 44.8 | 35.1 22% | 62 -38% | 56.4 -26% | 36.5 19% | 40.6 9% |
| Witcher 3 ultra * (Watt) | 45.1 | 45 -0% | 37.9 16% | |||
| Load Maximum * (Watt) | 53 | 42.6 20% | 108 -104% | 62.7 -18% | 44 17% | 46.6 12% |
* ... mindre är bättre
| Microsoft Surface Laptop 3 15 Ryzen 5 3580U R5 3580U, Vega 9, 45 Wh | Microsoft Surface Laptop 2-LQN-00004 i5-8250U, UHD Graphics 620, 45 Wh | Microsoft Surface Laptop i5 i5-7200U, HD Graphics 620, 45 Wh | Dell XPS 15 7590 i5 iGPU FHD i5-9300H, UHD Graphics 630, 97 Wh | Apple MacBook Pro 15 2018 (2.6 GHz, 560X) i7-8850H, Radeon Pro 560X, 83 Wh | HP Spectre x360 15-df0126ng i7-8750H, GeForce GTX 1050 Ti Max-Q, 84 Wh | |
|---|---|---|---|---|---|---|
| Batteridrifttid | 2% | 18% | 28% | 12% | 11% | |
| Reader / Idle (h) | 18.7 | 20.8 11% | 22.5 20% | 18.8 1% | ||
| WiFi v1.3 (h) | 9.1 | 9.1 0% | 10 10% | 14.1 55% | 10.2 12% | 8.8 -3% |
| Load (h) | 1.7 | 1.6 -6% | 2.1 24% | 1.7 0% | 2.3 35% | |
| Witcher 3 ultra (h) | 1.5 |
För
Emot
Läs den fullständiga versionen av den här recensionen på engelska här.
Surface Laptop 3 15 har en del höjdpunkter. För det första når den billigare Ryzen 5 3580U nästan fram till den dyrare Core i7-1065G7 när det kommer till CPU-prestanda, vilket är bra jobbat av AMD. Faktorer som batteritid och fläktljud har knappt ändrats alls sen Surface Laptop 2, vilket innebär att den AMD-drivna varianten av Surface Laptop 3 kan erbjuda högre prestanda än förra årets modell utan de vanliga problemen. Kom ihåg att även om vi inte har testat Core i7-varianten av Surface Laptop 3 15 ännu så behöver den verkligen vara imponerande med tanke på att den kostar 5.000 kronor (!) mer än AMD Ryzen 5-versionen.
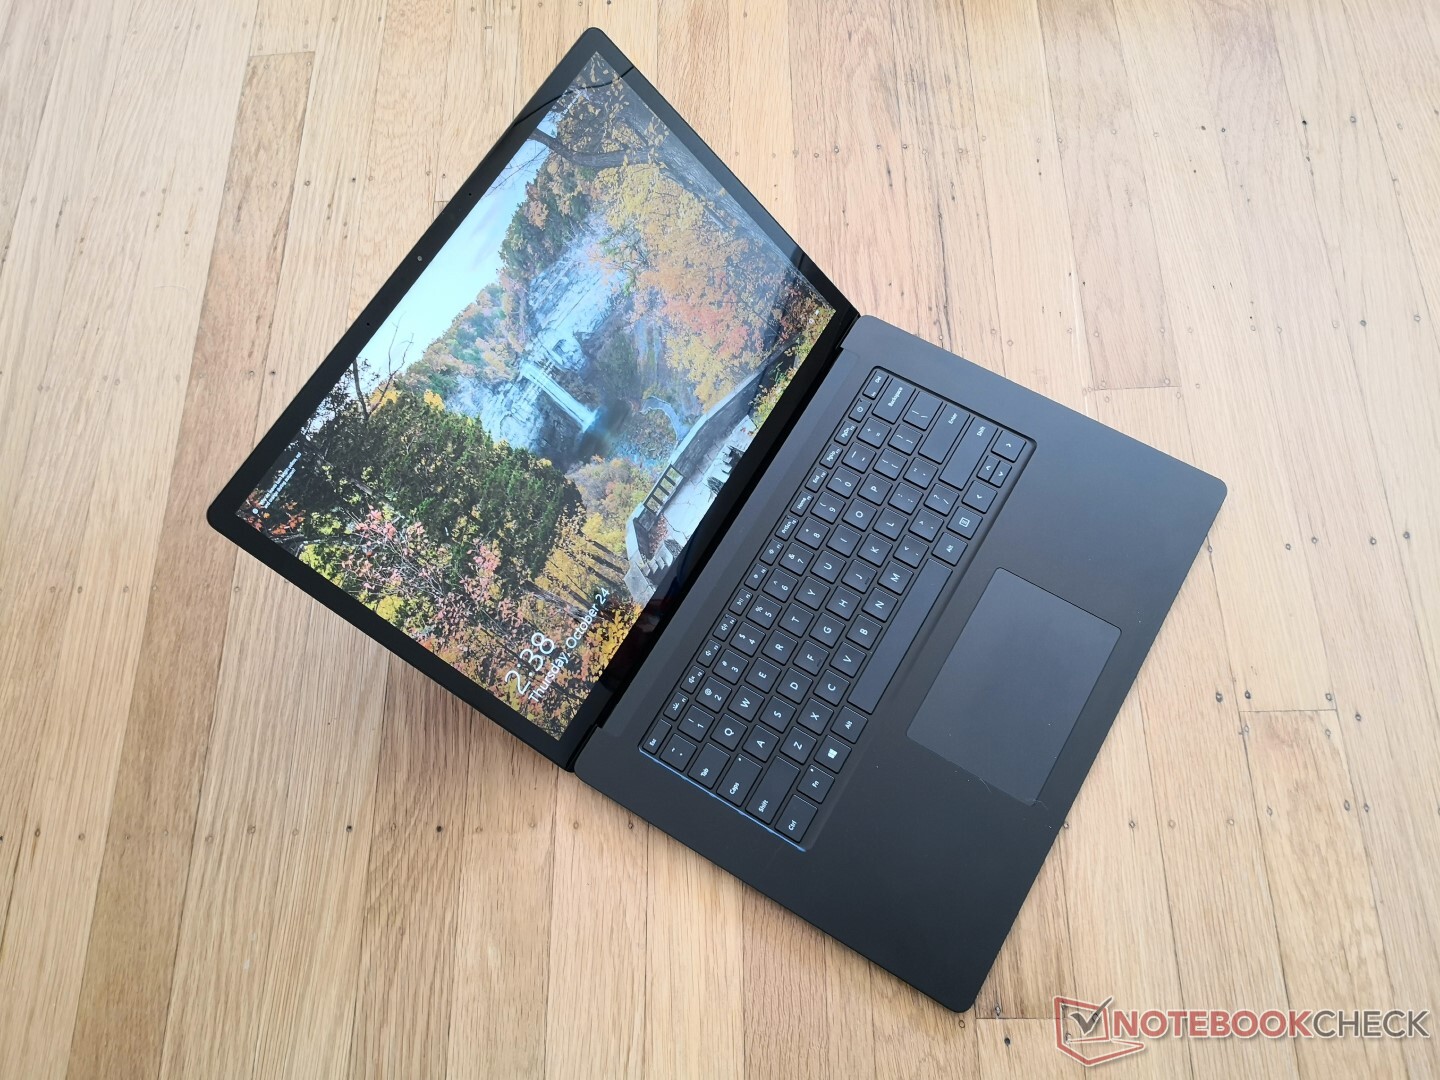
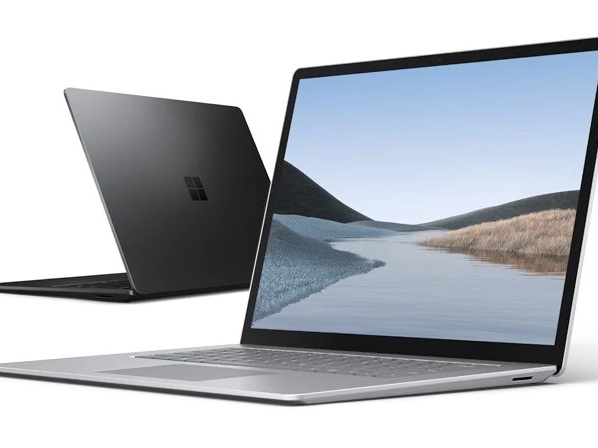
Den andra höjdpunkten är den ovanliga tryckkänsliga 3:2-skärmen. Den är skarp och relativt ljusstark med fullständig sRGB-täckning. Tyvärr erbjuder inte Microsoft något alternativ för fabrikskalibrering i stil med Gigabyte Aero 15 eller Razer Blade, så man får själv kalibrera skärmen om man vill få ut mesta möjliga ur den.
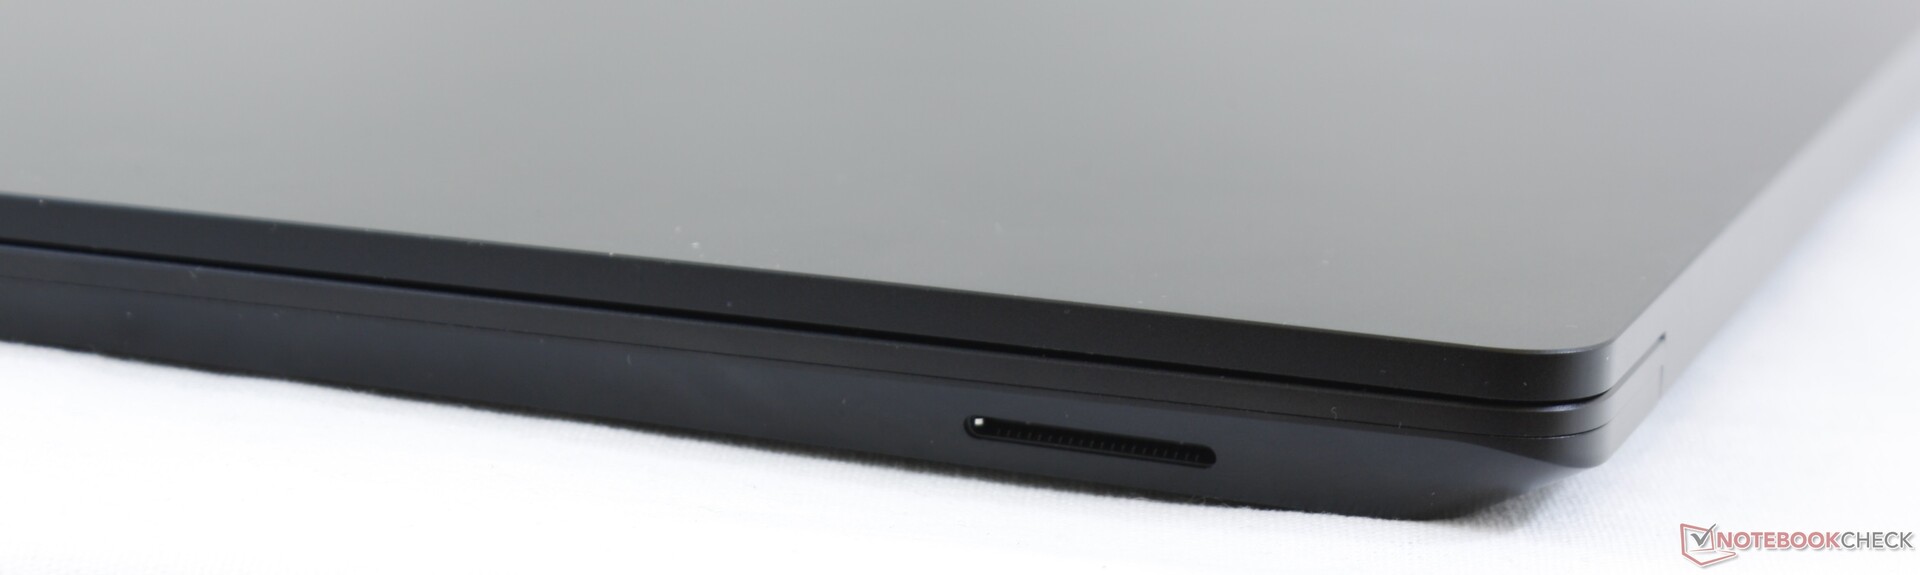
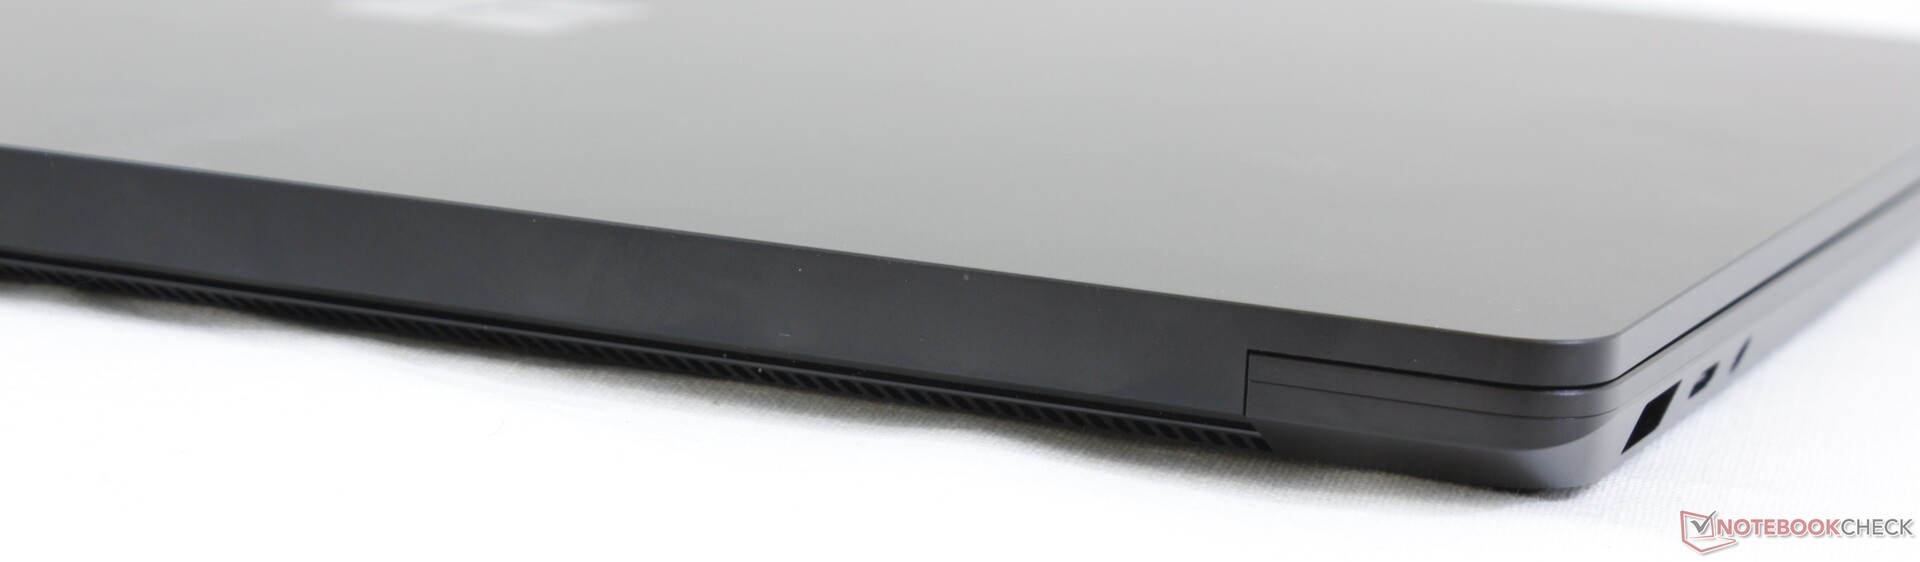
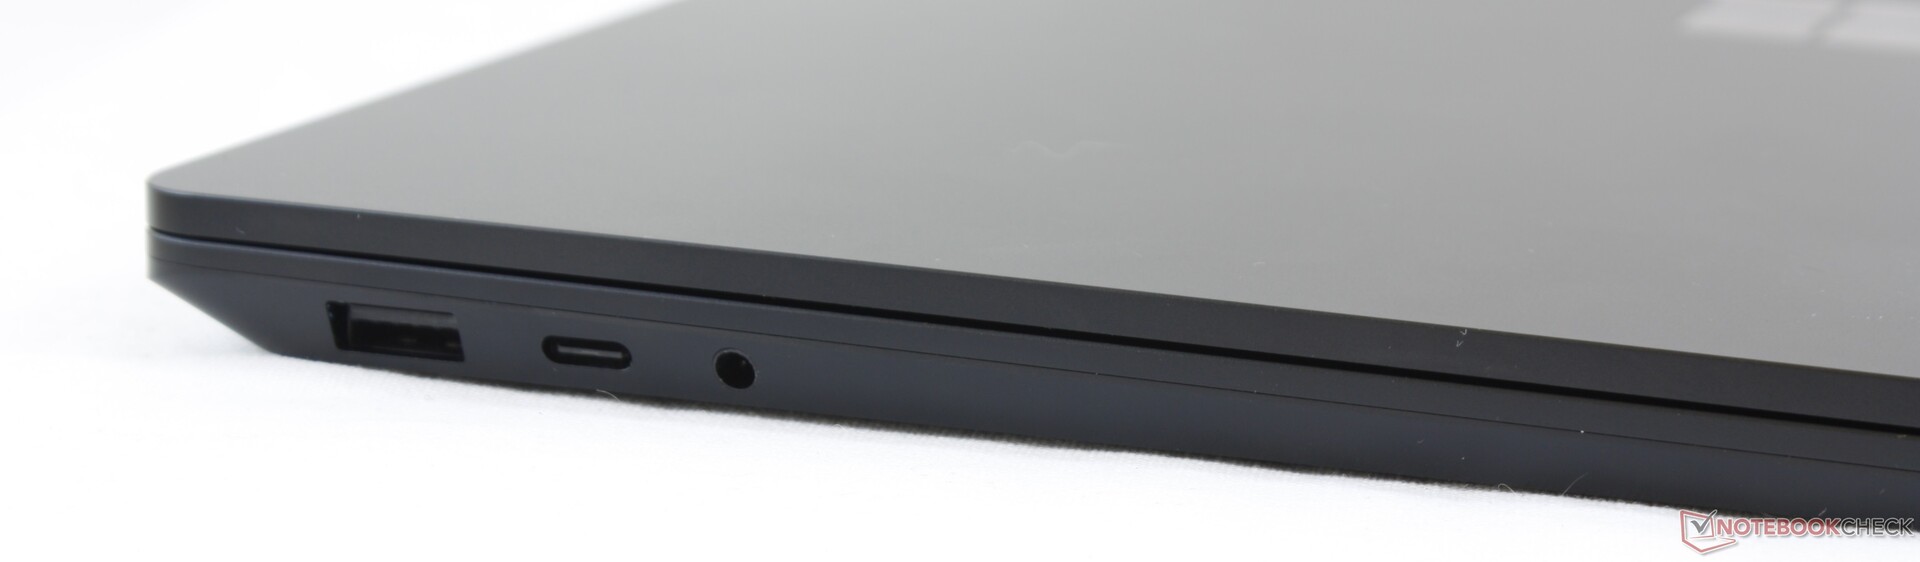
Nästan allt annat med Surface Laptop 3 är medelmåttigt eller en besvikelse med tanke på det höga priset. Den större 15-tumsmodellen av Surface Laptop var Microsofts chans att åtgärda de dåliga anslutningsmöjligheterna som 13.5-tumsversionen av Surface Laptop led av, men inget har egentligen blivit bättre. Den saknar nu en mini DisplayPort, vilket tvingar köparen att investera i en separat Surface Dock för 2.000 kronor. USB Typ C-porten saknar både Thunderbolt 3 och Power Delivery, vilket gör att du får bära med dig en propretiär AC-adapter vart du än går. Till Dell XPS 13, XPS 15, Huawei MateBook X Pro, HP Spectre x360 13, smarta telefoner eller surfplattor går det att använda en och samma USB Typ C-laddare, vilket är mycket smidigare. (Uppdatering: USB Typ C-laddning fungerar efter att vi uppdaterat vår Surface Laptop 3-enhet.)
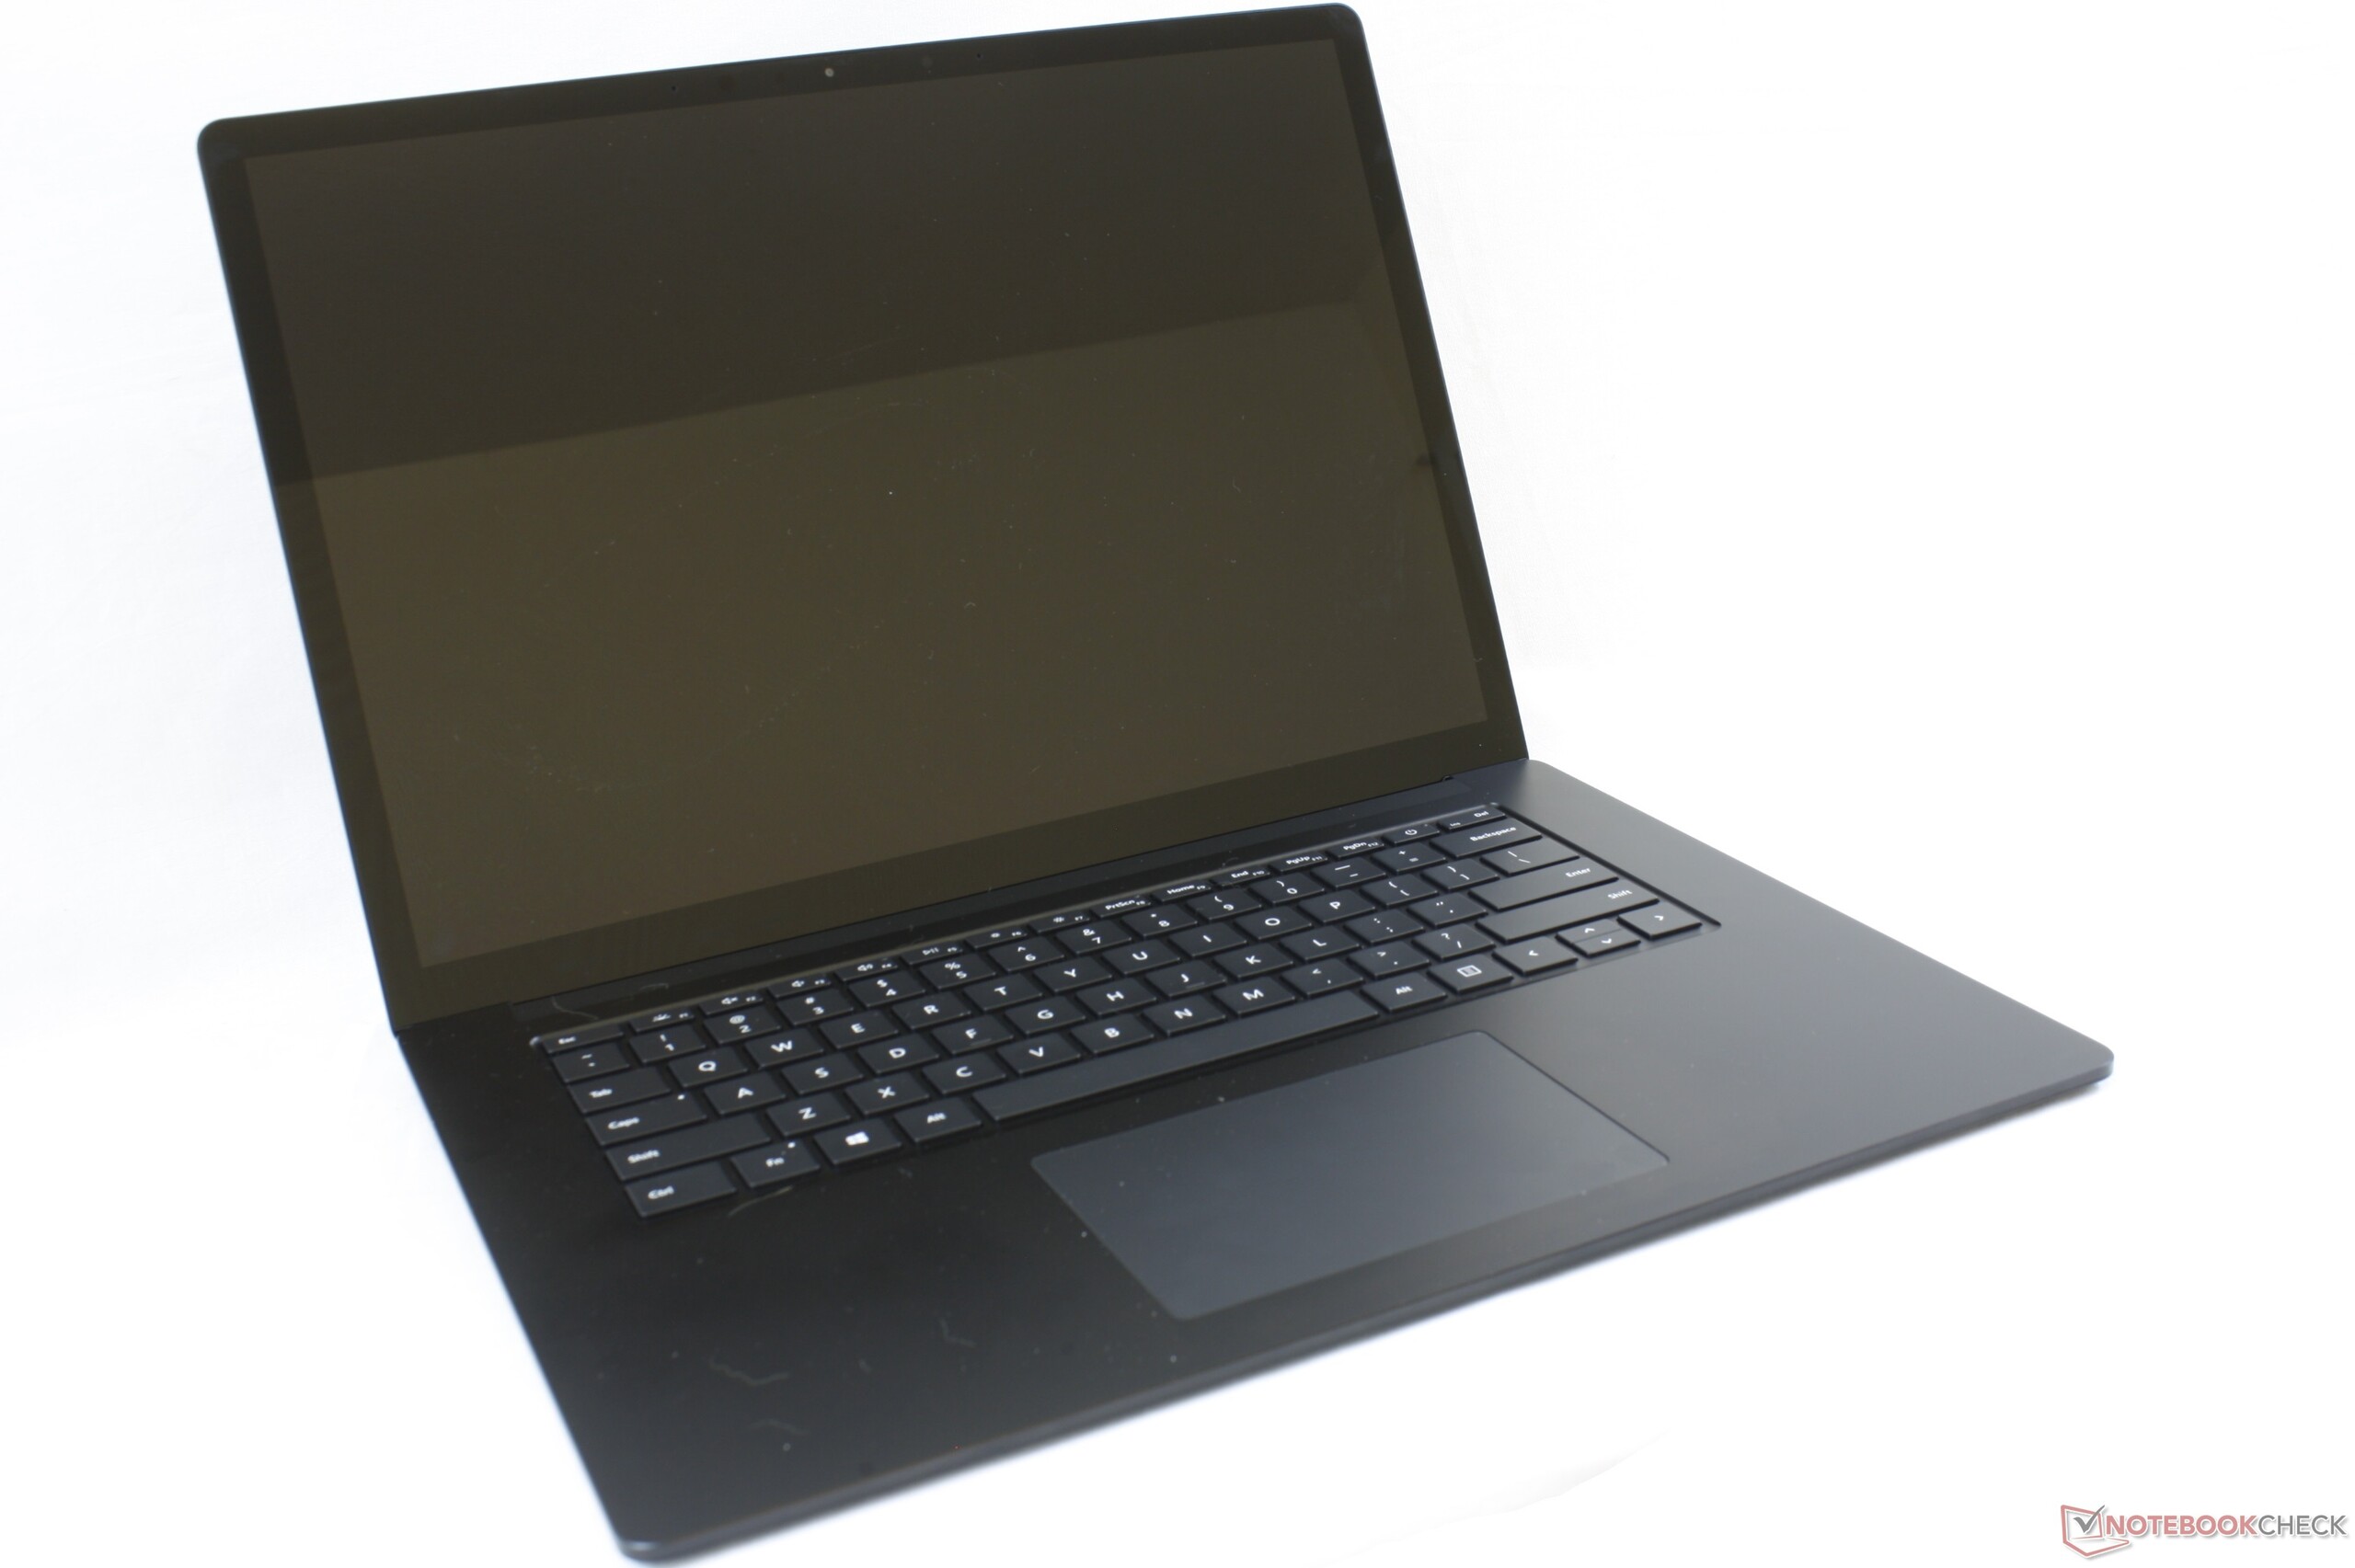
Tjock infattning, långsam NVMe SSD, långsamma svart-vita responstider samt att den saknar WiFi 6, LTE, fingeravtrycksläsare och integritetsskydd på webbkameran bidrar vidare till att detta sparsmakade flaggskepp känns utdaterat trots utmärkt skärm- och processorprestanda. Surface Laptop 3 15 kan eventuellt passa om du värdesätter den superlätta 3:2-formfaktorn och inte har något mot de begränsade anslutningsmöjligheterna, men du kan få en mycket bättre maskin för 15.000 kronor.
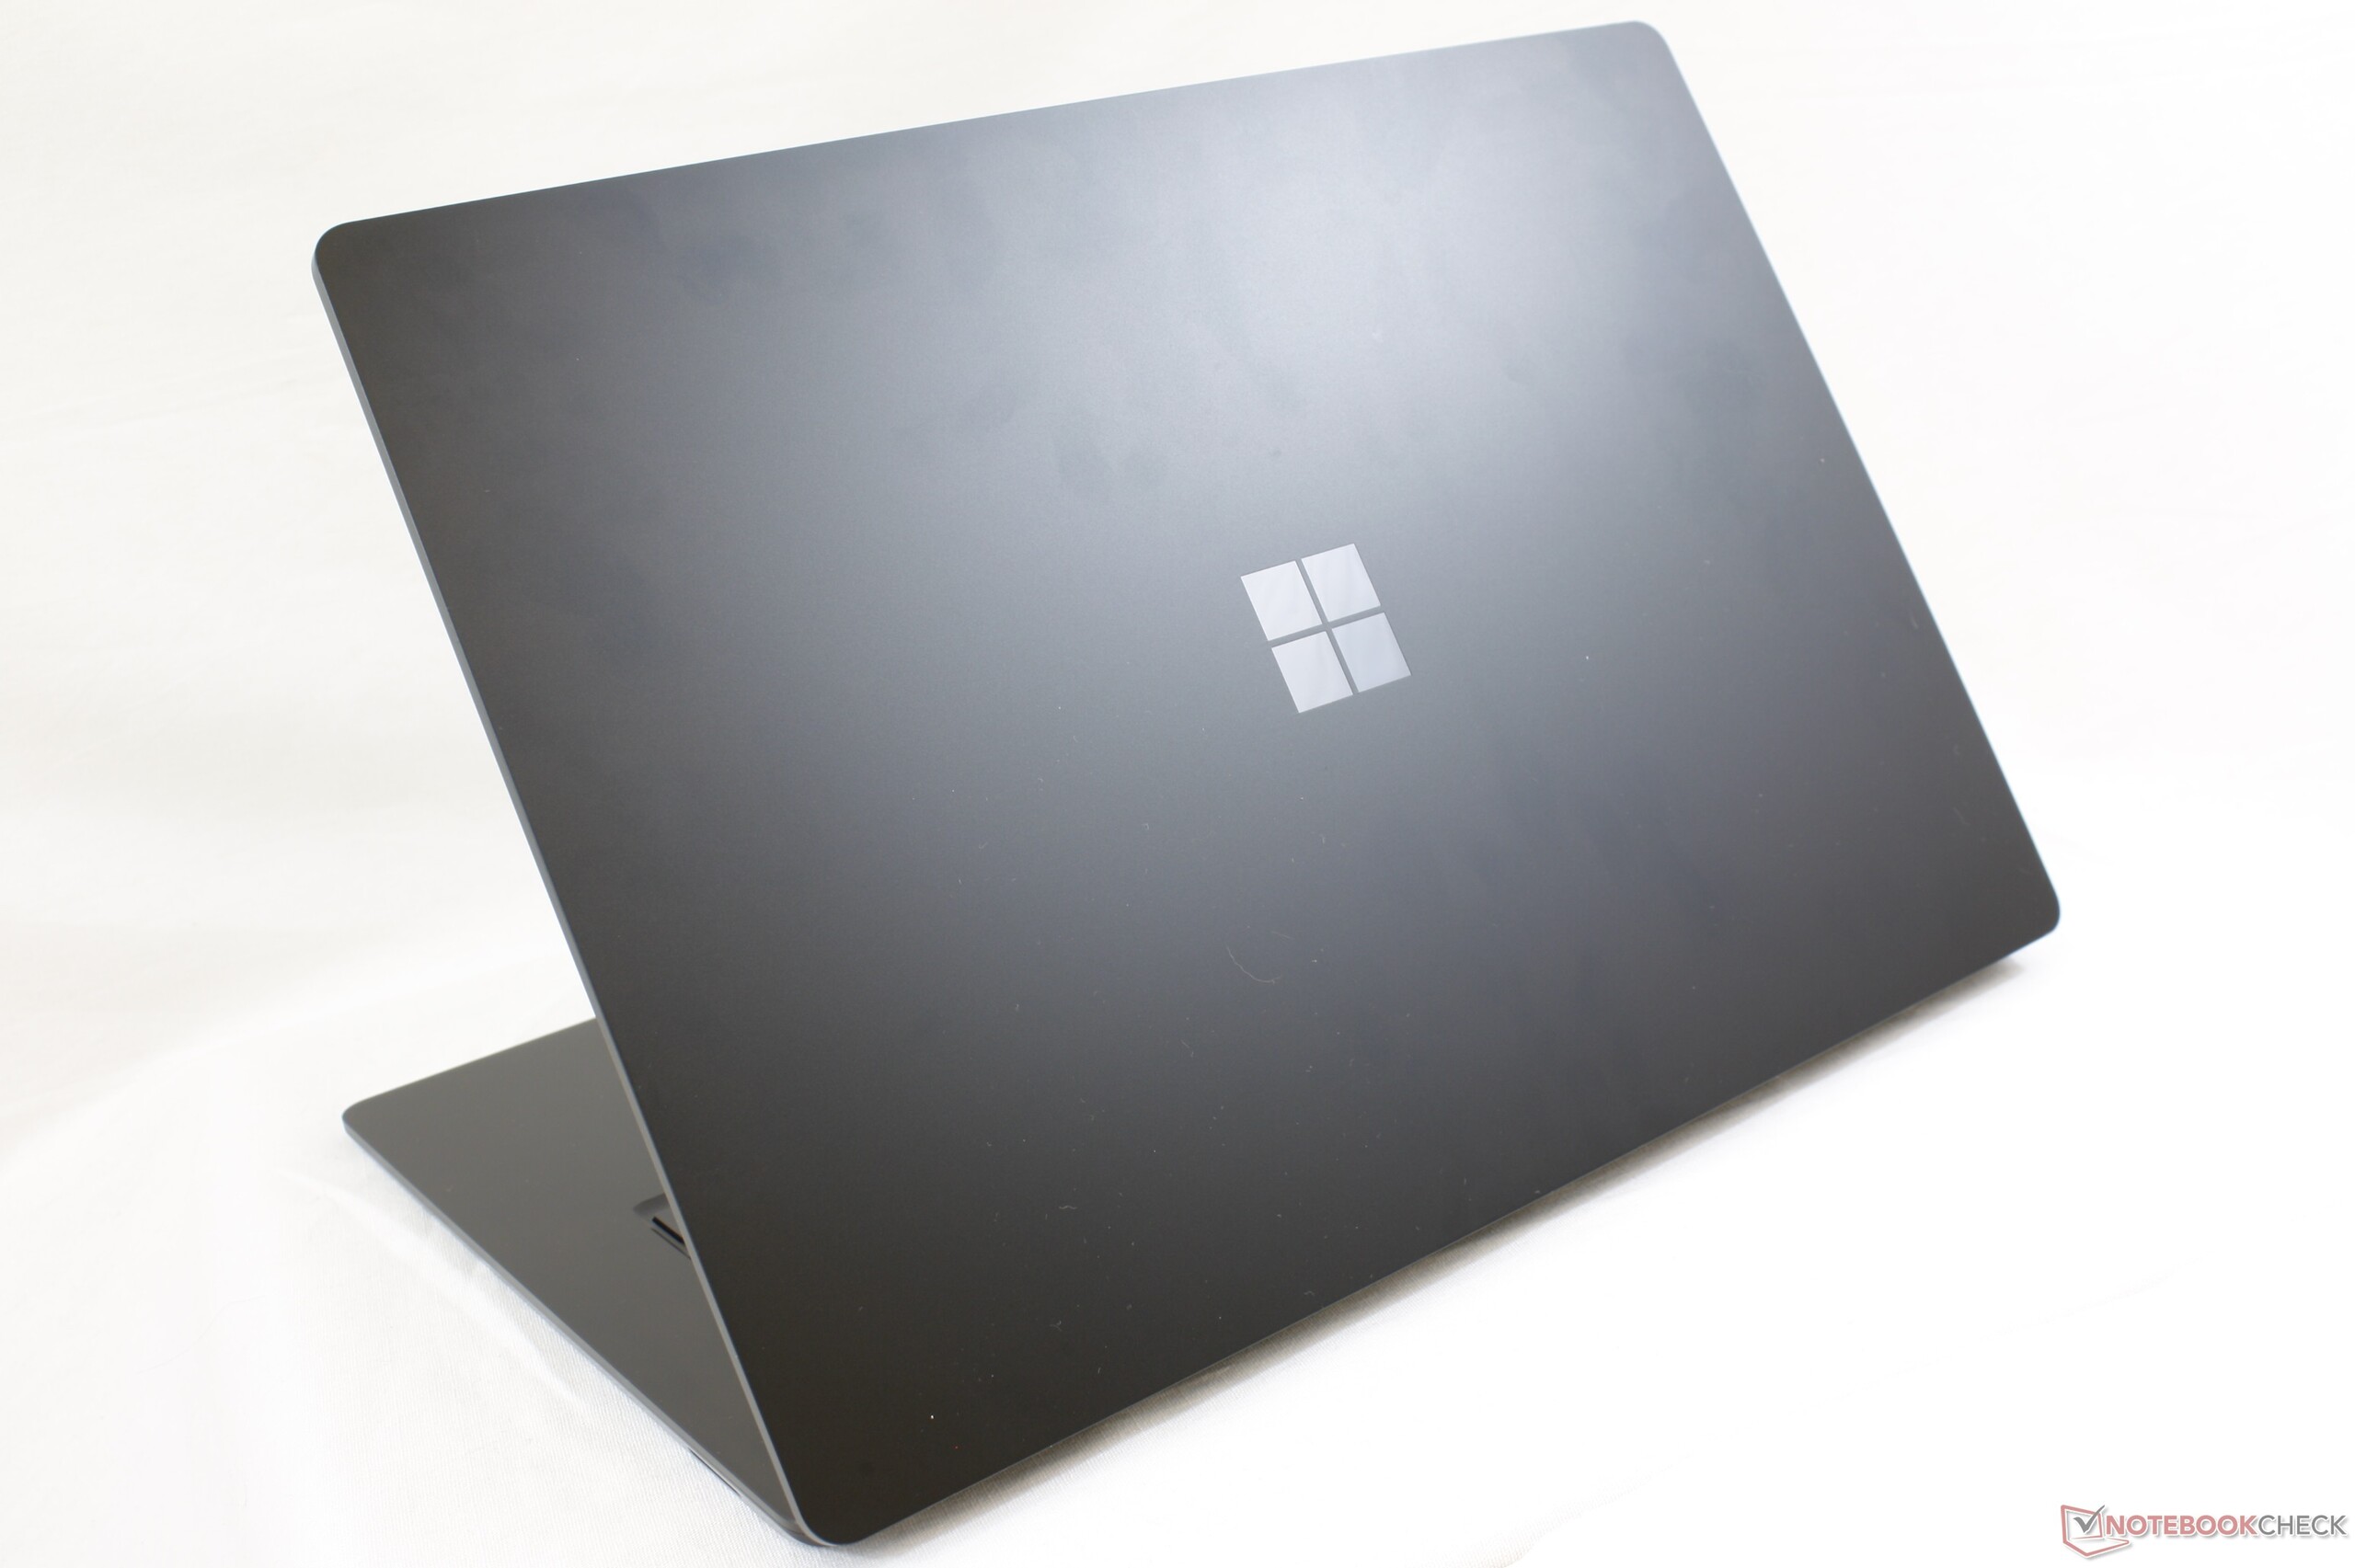
Den är snygg och presterar riktigt bra, till och med för att vara den billigaste AMD-varianten, men det blir snart uppenbart att den saknar en del funktioner och portar. Mer traditionella Ultrabook-flaggskepp har mycket mer att erbjuda i det här prisskiktet när det kommer till prestanda och anslutbarhet.
Microsoft Surface Laptop 3 15 Ryzen 5 3580U
- 10/27/2019 v7 (old)
Allen Ngo
Price comparison
